Embed Size (px)
Citation preview

26901 Malibu Hills RoadCalabasas Hills, CA 91301
www.thecheesecakefactory.com
th
e c
he
ese
ca
ke
fac
to
ry
inc
or
po
ra
te
d2
018
an
nu
al
re
po
rt
2 0 1 8 a n n u a l r e p o r t
David OvertonChairman of the Board and Chief Executive OfficerThe Cheesecake Factory Incorporated
Edie A. AmesChief Executive OfficerThe Pie Hole Los Angeles
Alexander L. CappelloChairman and Chief Executive OfficerCappello Global, LLC
Jerome I. KransdorfPresident EmeritusJaK Direct
Laurence B. MindelManaging PartnerPoggio Trattoria,Copita Tequileria Y Comida and Convivo
David B. PittawayVice Chairman, Senior Managing Director, Senior Vice President and SecretaryCastle Harlan, Inc.
Herbert SimonChairman EmeritusSimon Property Group, Inc.
Executive Officers
David OvertonChairman of the Board and Chief Executive Officer
David M. GordonPresident
Matthew E. ClarkExecutive Vice President and Chief Financial Officer
Scarlett MayExecutive Vice President, General Counsel and Secretary
Keith T. CarangoPresident – Bakery Division
Operating and Staff Officers
Donald C. Moore Executive Vice President and Chief Culinary Officer
Spero G. AlexSenior Vice President – Operations, The Cheesecake Factory Restaurants
Dina R. Barmasse-GraySenior Vice President –Human Resources
Donald C. EvansSenior Vice President and Chief Marketing Officer
Independent Accountants
KPMG LLPLos Angeles, California
Transfer Agent, Registrar and Dividend Payments
Computershare Shareholder ServicesP.O. Box 30170College Station, TX 77845(800) 962-4284
Inquiries
Communications regarding lost certificates, and name and address changes should be directed to our Transfer Agent. Other investor inquiries should be directed to:
Stacy J. FeitVice President, Investor RelationsThe Cheesecake Factory Incorporated26901 Malibu Hills RoadCalabasas Hills, CA 91301(818) 871-3000
Common Stock Trading
Our stock began trading on The NASDAQ Stock Market on September 18, 1992 under the symbol CAKE at the initial public offering price of $2.63 (adjusted for five three-for-two stock splits in March 1994, April 1998, June 2000, June 2001 and December 2004). We completed follow-on public offerings of common stock in January 1994 and November 1997. The market price of our common stock has not closed below $2.63 and has closed as high as $67.14 through January 1, 2019, our last fiscal year-end.
Website
To learn more about our Company, please visit www.thecheesecakefactory.com and our related websites at www.grandluxcafe.com, www.rocksugarkitchen.com and www.socialmonk.com. To learn about our sustainability initiatives, please visit www.thecheesecakefactory.com/corporate- social-responsibility/sustainability.
Stan D. HarveySenior Vice President – Purchasing
Marina LubinskySenior Vice President and Chief Information Officer
Brian MacKellarSenior Vice President – Development
Lisa A. McDowellSenior Vice President – Global Development
Cheryl M. SlomannSenior Vice President, Controller and Chief Accounting Officer
Charles G. WensingSenior Vice President – Operations Services, Performance Development and New Restaurant Operations
Jack K. BelkSenior Regional Vice President – Restaurant Operations
Jeffrey NemetRegional Vice President – Restaurant Operations
Joseph T. PhillipsRegional Vice President – Restaurant Operations
Steve M. PolceRegional Vice President – Restaurant Operations
Michael PereiraDivisional Vice President – Restaurant Operations, Grand Lux Cafe
Atallah A. Baroudi, Ph.D.Vice President – Food Safety and Quality Assurance
Heather M. BerryVice President –Beverage and Bakery Operations
Megan L. BloomerVice President – Sustainability
Linda J. CandiotyVice President – Guest Experience
Mervin DeguzmanVice President – Corporate Systems
Stacy J. FeitVice President – Investor Relations
Richard J. FringsVice President – Compensation and Benefits
directors and officers shareholder information
Sidney M. GreathouseVice President and Senior Counsel – Legal Services
Anthony R. Gressak, Jr.Vice President – Bakery Distributor Sales
Ashley W. HanscomVice President – Assistant Controller
Ronald IsackVice President –Bakery Supply Chain
Laurie A. Lambert-GaffneyVice President – Staff Relations
Kurt E. LeisureVice President – Risk Services
Etienne MarcusVice President –Strategy and Finance
Philip MardirossianVice President – Bakery Marketing
Kix McGinnis NystromVice President – Kitchen Operations
Robert OkuraVice President – Culinary Development and Corporate Executive Chef
Alan B. PhillipsVice President – Internal Audit
Chris M. RadovanVice President – Bakery Research and Development
J. Suzanne ReedVice President –Bakery Sales and Marketing
John ScottVice President – Bakery Food Safety and Quality Assurance
Joel E. ShaferVice President and Senior Counsel– Contracts
Jeff SteplerVice President – Talent Selection and Organizational Engagement
Roman L. WasylynVice President – Tax
Robert T. WestVice President – Information Technology
Lori R. WilliamsVice President – Bakery Controller
Board of Directors
F I N A N C I A L H I G H L I G H T S
(1) The Cheesecake Factory restaurants. (2) Operating income margin in fiscal 2018, 2017, 2016, 2015 and 2014 excludes $17,861, $10,343, $114, $6,011 and $696, respectively (in thousands), related to a number of items that we do not consider indicative of our ongoing operations. Please refer to the section entitled “Non-GAAP Measures” included in Item 7, “Management’s Discussion and Analysis of Financial Condition and Results of Operations,” of the Form 10-K in this Annual Report and in Item 6, “Selected Financial Data,” of the Form 10-K in the 2015 Annual Report for more information on these items. (3) Diluted net income per share in fiscal 2018, 2017, 2015 and 2014 excludes $0.29, ($0.67), $0.07 and $0.01, respectively, related to a number of items that we do not consider indicative of our ongoing operations. Impairment charge recorded in fiscal 2016 did not impact diluted net income per share. Please refer to the section entitled “Non-GAAP Measures” included in Item 7, “Management’s Discussion and Analysis of Financial Condition and Results of Operations,” of the Form 10-K in this Annual Report and in Item 6, “Selected Financial Data,” of the Form 10-K in the 2015 Annual Report for more information on these items.
(4) The Cheesecake Factory restaurants, Grand Lux Cafe and RockSugar Southeast Asian Kitchen.
Revenues (in millions)
$2,332 $2,261 $2,276 $2,101 $1,977 2018 2017 2016 2015 2014
Comparable restaurant sales (1)
1.7% (0.8)% 1.2% 2.6% 1.5% 2018 2017 2016 2015 2014
Adjusted operating income margin (2)
5.9% 7.3% 8.8% 8.2% 7.3% 2018 2017 2016 2015 2014
Adjusted diluted net income per share (3) $2.43 $2.60 $2.83 $2.37 $1.97 2018 2017 2016 2015 2014
Cash flow from operations (in millions)
$291 $239 $316 $248 $249 2018 2017 2016 2015 2014
Restaurants open at fiscal year-end (4)
217 214 208 200 189 2018 2017 2016 2015 2014
The Cheesecake Factory marked 40 delicious, memorable years with a number of achievements. We opened our 200th Cheesecake Factory restaurant, served over 100 million guests across our concepts and were recently recognized on FORTUNE magazine’s 100 Best Companies to Work For ® list for
the sixth consecutive year, as well as FORTUNE’s Best Workplaces for Women, Best Workplaces for Diversity and Best Workplaces for Millennials.
P e o p l e - O u r G r e a t e s t R e s o u r c eThis recognition is meaningful, not just because of the accolades, but as an acknowledgement of the resources and time we invest in engagement, development and benefits for our staff members and managers. We couldn’t do what we do without them. We believe our culture of excellence, opportunity and trust, reinforced by distinctions likes these, will help us continue to attract and retain the best talent in the industry, which is key to our continued success.
2 0 1 8 I n R e v i e wReflecting on 2018, we opened four new Cheesecake Factory restaurants, as well as one Grand Lux Cafe. Internationally, our licensee partners opened two new Cheesecake Factory restaurants. Demand for the brand continues to be very strong, positioning us well for continued global expansion.
We also completed an infrastructure upgrade of our West Coast bakery. The new facility features additional automation, as well as state-of-the-art baking and refrigeration technology, which enables us to more efficiently serve our domestic and international restaurant base, as well as third-party customers.
T O O U R S H A R E H O L D E R S 1
Asian Nachos
Production at the new facility began during the summer, just in time to support the launch of our two newest cheesecakes, Very Cherry Ghirardelli® Chocolate and Cinnabon® Cinnamon Swirl, in celebration of National Cheesecake Day. Continuous menu innovation has fueled our success for 40 years and these great partnerships underscore the continued power of The Cheesecake Factory brand.
Our cheesecakes are a key differentiator for both in-restaurant dining and off-premise occasions, driving our industry-leading dessert sales of approximately 16%, and even higher contribution on delivery and to-go orders. As convenience continues to be a priority for many consumers, we augmented our to-go offering with the launch of online ordering at all of our restaurants. We also transitioned to an exclusive national delivery agreement. With our shared focus on quality and operational excellence, this relationship is enhancing the guest experience, while enabling us to maximize profits from our growing delivery business. This agreement also increases our collaborative marketing opportunities, such as our Day of 40,000 slices offer, which generated tremendous consumer response and publicity, further demonstrating the strong affinity for the brand and our cheesecakes.
We also continue to innovate operationally to further support our off-premise business. During 2018, we piloted our newly designed to-go packaging, which is launching across our restaurants this year. The new containers maintain the appropriate food temperature for longer periods of time, while enhancing the visual presentation of our menu items. Equally as important, the new packaging is more sustainable. In fact, over 100 million water bottles are being recycled into the new lids and cheesecake slice containers, translating to less waste going to landfills. We are committed as a company, out of a deep respect for our planet, our communities and each other, to act responsibly for a more sustainable future, and this is just one way we are living that commitment. We will continue to evaluate all aspects of our business in an effort to identify and implement meaningful change to further increase our sustainability going forward.
T H E C H E E S E C A K E F A C T O R Y I N C O R P O R A T E D
Breakfast Tacos
2
Financially, we posted solid revenue results during 2018, including comparable restaurant sales growth within our long-term target range. Core operating performance was strong; however, continued labor cost pressure, as well as legal and medical insurance expenses, impacted earnings per share results.
We continued to generate a substantial amount of free cash flow, which supported a 14% increase to our dividend. Together with our share repurchases, we returned over $165 million in cash to our shareholders in 2018.
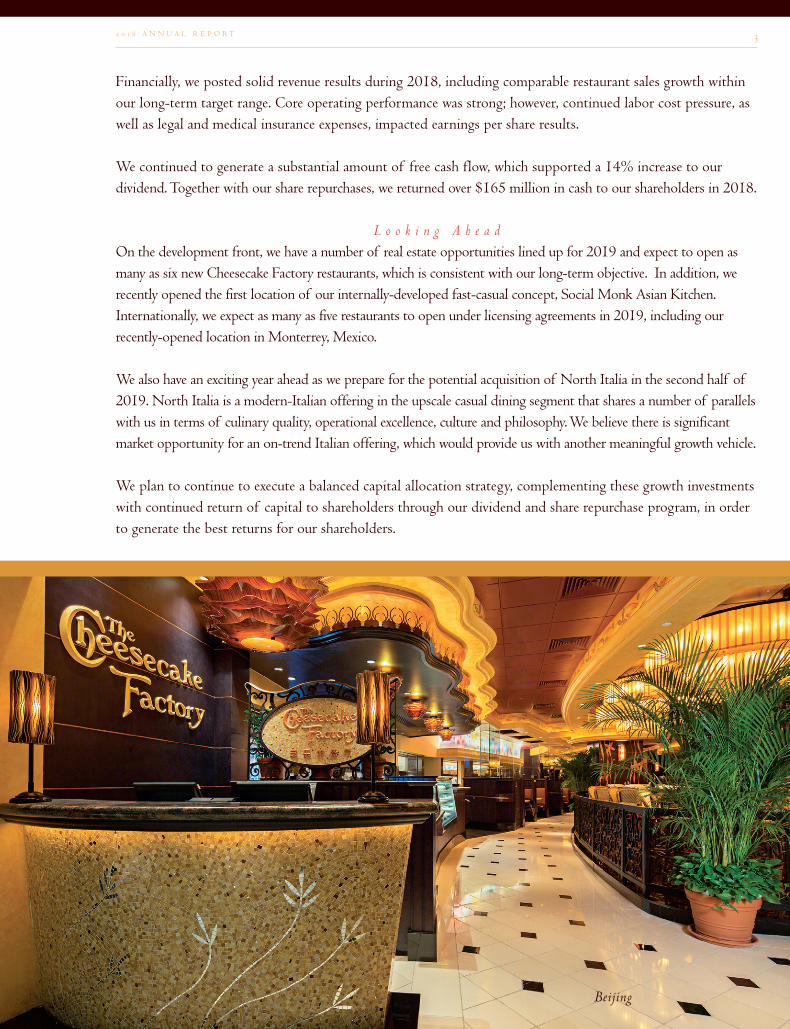
L o o k i n g A h e a dOn the development front, we have a number of real estate opportunities lined up for 2019 and expect to open as many as six new Cheesecake Factory restaurants, which is consistent with our long-term objective. In addition, we recently opened the first location of our internally-developed fast-casual concept, Social Monk Asian Kitchen. Internationally, we expect as many as five restaurants to open under licensing agreements in 2019, including our recently-opened location in Monterrey, Mexico.
We also have an exciting year ahead as we prepare for the potential acquisition of North Italia in the second half of 2019. North Italia is a modern-Italian offering in the upscale casual dining segment that shares a number of parallels with us in terms of culinary quality, operational excellence, culture and philosophy. We believe there is significant market opportunity for an on-trend Italian offering, which would provide us with another meaningful growth vehicle.
We plan to continue to execute a balanced capital allocation strategy, complementing these growth investments with continued return of capital to shareholders through our dividend and share repurchase program, in order to generate the best returns for our shareholders.
2 0 1 8 A N N U A L R E P O R T
Beijing
3
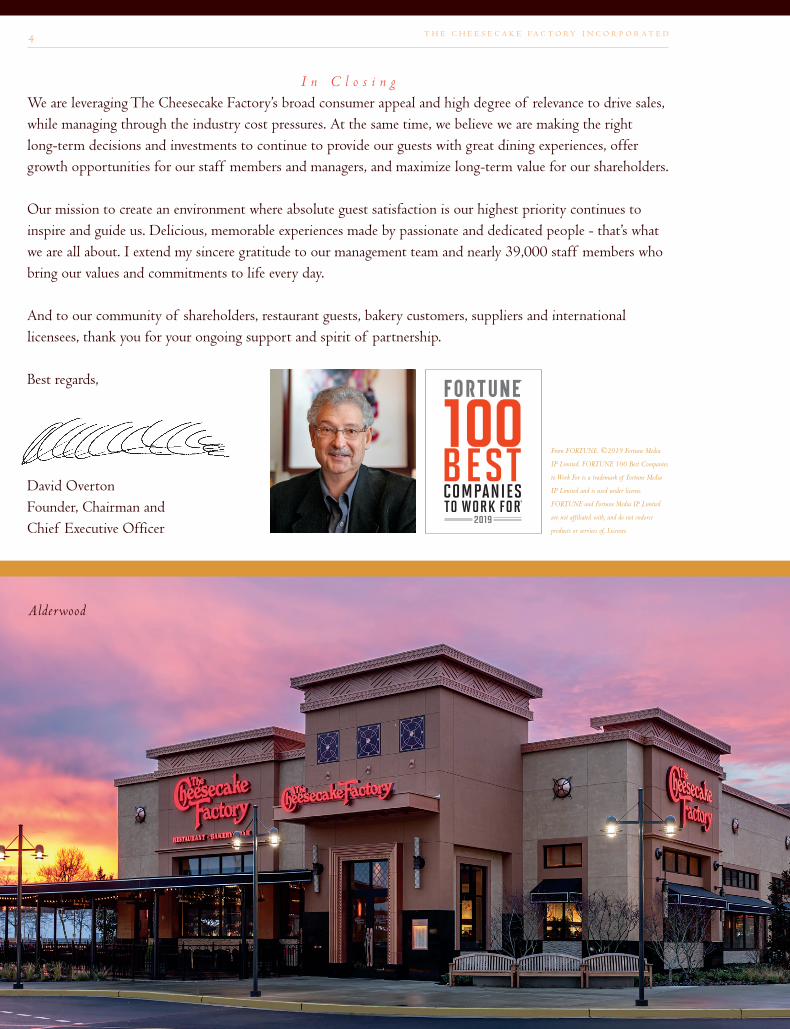
I n C l o s i n gWe are leveraging The Cheesecake Factory’s broad consumer appeal and high degree of relevance to drive sales, while managing through the industry cost pressures. At the same time, we believe we are making the right long-term decisions and investments to continue to provide our guests with great dining experiences, offer growth opportunities for our staff members and managers, and maximize long-term value for our shareholders.
Our mission to create an environment where absolute guest satisfaction is our highest priority continues to inspire and guide us. Delicious, memorable experiences made by passionate and dedicated people - that’s what we are all about. I extend my sincere gratitude to our management team and nearly 39,000 staff members who bring our values and commitments to life every day.
And to our community of shareholders, restaurant guests, bakery customers, suppliers and international licensees, thank you for your ongoing support and spirit of partnership.
Best regards,
David OvertonFounder, Chairman and Chief Executive Officer
T H E C H E E S E C A K E F A C T O R Y I N C O R P O R A T E D4
Alderwood
From FORTUNE. ©2019 Fortune Media
IP Limited. FORTUNE 100 Best Companies
to Work For is a trademark of Fortune Media
IP Limited and is used under license.
FORTUNE and Fortune Media IP Limited
are not affiliated with, and do not endorse
products or services of, Licensee.
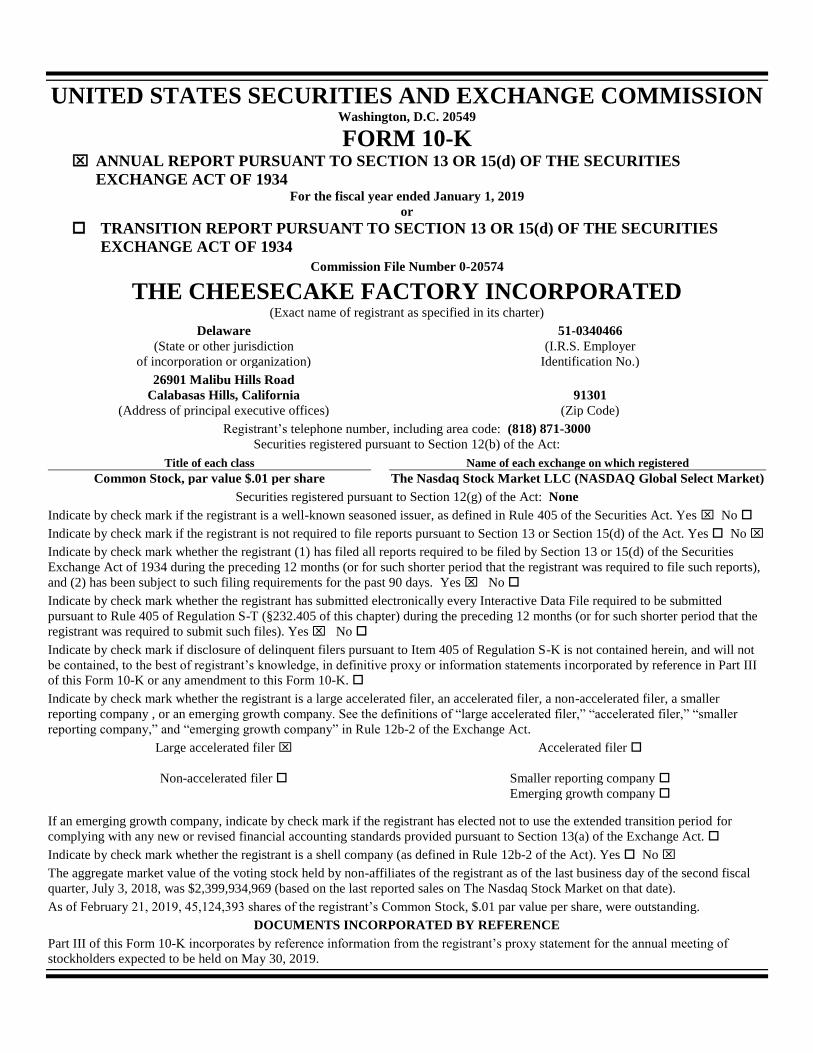
UNITED STATES SECURITIES AND EXCHANGE COMMISSION Washington, D.C. 20549
FORM 10-K ANNUAL REPORT PURSUANT TO SECTION 13 OR 15(d) OF THE SECURITIES
EXCHANGE ACT OF 1934 For the fiscal year ended January 1, 2019
or
TRANSITION REPORT PURSUANT TO SECTION 13 OR 15(d) OF THE SECURITIES
EXCHANGE ACT OF 1934
Commission File Number 0-20574
THE CHEESECAKE FACTORY INCORPORATED (Exact name of registrant as specified in its charter)
Delaware 51-0340466
(State or other jurisdiction (I.R.S. Employer
of incorporation or organization) Identification No.)
26901 Malibu Hills Road
Calabasas Hills, California 91301
(Address of principal executive offices) (Zip Code)
Registrant’s telephone number, including area code: (818) 871-3000
Securities registered pursuant to Section 12(b) of the Act:
Title of each class Name of each exchange on which registered
Common Stock, par value $.01 per share The Nasdaq Stock Market LLC (NASDAQ Global Select Market)
Securities registered pursuant to Section 12(g) of the Act: None
Indicate by check mark if the registrant is a well-known seasoned issuer, as defined in Rule 405 of the Securities Act. Yes No
Indicate by check mark if the registrant is not required to file reports pursuant to Section 13 or Section 15(d) of the Act. Yes No
Indicate by check mark whether the registrant (1) has filed all reports required to be filed by Section 13 or 15(d) of the Securities
Exchange Act of 1934 during the preceding 12 months (or for such shorter period that the registrant was required to file such reports),
and (2) has been subject to such filing requirements for the past 90 days. Yes No
Indicate by check mark whether the registrant has submitted electronically every Interactive Data File required to be submitted
pursuant to Rule 405 of Regulation S-T (§232.405 of this chapter) during the preceding 12 months (or for such shorter period that the
registrant was required to submit such files). Yes No
Indicate by check mark if disclosure of delinquent filers pursuant to Item 405 of Regulation S-K is not contained herein, and will not
be contained, to the best of registrant’s knowledge, in definitive proxy or information statements incorporated by reference in Part III
of this Form 10-K or any amendment to this Form 10-K.
Indicate by check mark whether the registrant is a large accelerated filer, an accelerated filer, a non-accelerated filer, a smaller
reporting company , or an emerging growth company. See the definitions of “large accelerated filer,” “accelerated filer,” “smaller
reporting company,” and “emerging growth company” in Rule 12b-2 of the Exchange Act.
Large accelerated filer Accelerated filer
Non-accelerated filer Smaller reporting company
Emerging growth company
If an emerging growth company, indicate by check mark if the registrant has elected not to use the extended transition period for
complying with any new or revised financial accounting standards provided pursuant to Section 13(a) of the Exchange Act.
Indicate by check mark whether the registrant is a shell company (as defined in Rule 12b-2 of the Act). Yes No
The aggregate market value of the voting stock held by non-affiliates of the registrant as of the last business day of the second fiscal
quarter, July 3, 2018, was $2,399,934,969 (based on the last reported sales on The Nasdaq Stock Market on that date).
As of February 21, 2019, 45,124,393 shares of the registrant’s Common Stock, $.01 par value per share, were outstanding.
DOCUMENTS INCORPORATED BY REFERENCE
Part III of this Form 10-K incorporates by reference information from the registrant’s proxy statement for the annual meeting of
stockholders expected to be held on May 30, 2019.
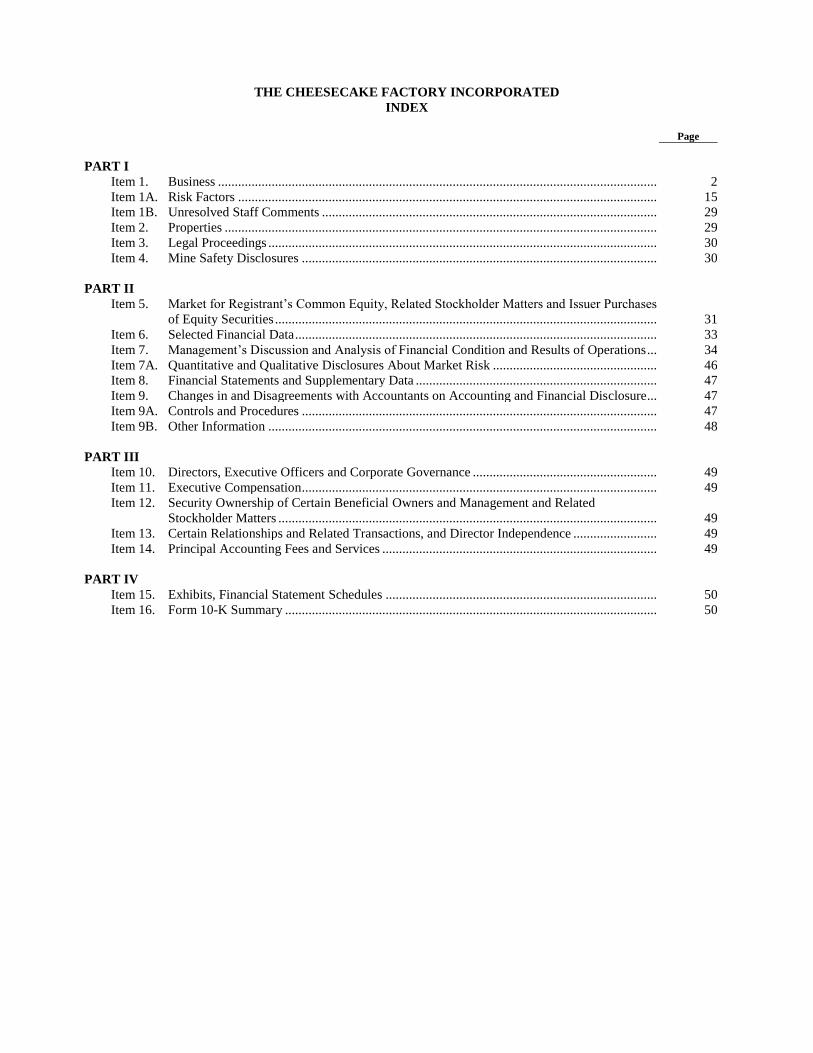
THE CHEESECAKE FACTORY INCORPORATED
INDEX
Page
PART I
Item 1. Business ................................................................................................................................... 2
Item 1A. Risk Factors ............................................................................................................................. 15
Item 1B. Unresolved Staff Comments .................................................................................................... 29
Item 2. Properties ................................................................................................................................. 29
Item 3. Legal Proceedings .................................................................................................................... 30
Item 4. Mine Safety Disclosures .......................................................................................................... 30
PART II
Item 5. Market for Registrant’s Common Equity, Related Stockholder Matters and Issuer Purchases
of Equity Securities .................................................................................................................. 31
Item 6. Selected Financial Data ............................................................................................................ 33
Item 7. Management’s Discussion and Analysis of Financial Condition and Results of Operations ... 34
Item 7A. Quantitative and Qualitative Disclosures About Market Risk ................................................. 46
Item 8. Financial Statements and Supplementary Data ........................................................................ 47
Item 9. Changes in and Disagreements with Accountants on Accounting and Financial Disclosure ... 47
Item 9A. Controls and Procedures .......................................................................................................... 47
Item 9B. Other Information .................................................................................................................... 48
PART III
Item 10. Directors, Executive Officers and Corporate Governance ....................................................... 49
Item 11. Executive Compensation .......................................................................................................... 49
Item 12. Security Ownership of Certain Beneficial Owners and Management and Related
Stockholder Matters ................................................................................................................. 49
Item 13. Certain Relationships and Related Transactions, and Director Independence ......................... 49
Item 14. Principal Accounting Fees and Services .................................................................................. 49
PART IV
Item 15. Exhibits, Financial Statement Schedules ................................................................................. 50
Item 16. Form 10-K Summary ............................................................................................................... 50
1
PART I
Forward-Looking Statements
Certain information included in this Form 10-K and other materials filed or to be filed by us with the Securities
and Exchange Commission (“SEC”), as well as information included in oral or written statements made by us or on our
behalf, may contain forward-looking statements about our current and presently expected performance trends, growth
plans, business goals and other matters.
These statements may be contained in our filings with the SEC, in our press releases, in other written
communications, and in oral statements made by or with the approval of one of our authorized officers. These statements
are forward-looking statements within the meaning of the Private Securities Litigation Reform Act of 1995, as codified
in Section 27A of the Securities Act of 1933, as amended (the “Securities Act”), and Section 21E of the Securities
Exchange Act of 1934, as amended (the “Exchange Act” and, together with the Securities Act, the “Acts”). This
includes, without limitation, financial guidance and projections and statements with respect to expectations of our future
financial condition, results of operations, cash flows, plans, targets, goals, objectives, performance, growth potential,
competitive position and business; our ability to: leverage our competitive strengths, including investing in or acquiring
new restaurant concepts and expanding The Cheesecake Factory® brand to other retail opportunities; deliver comparable
sales growth; provide a differentiated experience to customers; outperform the casual dining industry and increase our
market share; leverage sales increases and manage flow through; manage cost pressures, including increasing wage rates,
group medical insurance costs and legal expenses, and stabilize margins; grow earnings; remain relevant to consumers;
attract and retain qualified management and other staff; manage risks associated with the magnitude and complexity of
regulations in the jurisdictions where our restaurants are located; increase shareholder value; find suitable sites and
manage increasing construction costs; profitably expand our concepts domestically and in Canada, and work with our
licensees to expand our concept internationally; support the growth of North Italia and Flower Child restaurants; operate
Social Monk Asian Kitchen; expand consumer packaged goods licensing revenue; and utilize our capital effectively and
continue to increase cash dividends and repurchase our shares. These forward-looking statements also may be affected
by factors outside of our control including: economic and political conditions that impact consumer confidence and
spending; impact of recently enacted tax reform; acceptance and success of The Cheesecake Factory in international
markets; acceptance and success of the North Italia, Flower Child and Social Monk Asian Kitchen concepts; the risks of
doing business abroad through Company-owned restaurants and/or licensees; foreign exchange rates, tariffs and cross
border taxation; changes in unemployment rates; the economic health of our landlords and other tenants in retail centers
in which our restaurants are located; the economic health of suppliers, licensees, vendors and other third parties
providing goods or services to us; adverse weather conditions in regions in which our restaurants are located; factors that
are under the control of government agencies, landlords and other third parties; and the risk, costs and uncertainties
associated with opening new restaurants. Such forward-looking statements include all other statements that are not
historical facts, as well as statements that are preceded by, followed by or that include words or phrases such as
“believe,” “plan,” “will likely result,” “expect,” “intend,” “will continue,” “is anticipated,” “estimate,” “project,” “may,”
“could,” “would,” “should” and similar expressions. These statements are based on our current expectations and involve
risks and uncertainties which may cause results to differ materially from those set forth in such statements.
In connection with the “safe harbor” provisions of the Acts, we have identified and are disclosing important
factors, risks and uncertainties that could cause our actual results to differ materially from those projected in forward-
looking statements made by us, or on our behalf. (See Item 1A — Risk Factors.) These cautionary statements are to be
used as a reference in connection with any forward-looking statements. The factors, risks and uncertainties identified in
these cautionary statements are in addition to those contained in any other cautionary statements, written or oral, which
may be made or otherwise addressed in connection with a forward-looking statement or contained in any of our
subsequent filings with the SEC. Because of these factors, risks and uncertainties, we caution against placing undue
reliance on forward-looking statements. Although we believe that the assumptions underlying forward-looking
statements are currently reasonable, any of the assumptions could be incorrect or incomplete, and there can be no
assurance that forward-looking statements will prove to be accurate. Forward-looking statements speak only as of the
date on which they are made. Except as may be required by law, we do not undertake any obligation to modify or revise
any forward-looking statement to take into account or otherwise reflect subsequent events, corrections in underlying
assumptions, or changes in circumstances arising after the date that the forward-looking statement was made.
2
ITEM 1. BUSINESS
General
Our business originated in 1972 when Oscar and Evelyn Overton founded a small bakery in the Los Angeles
area. In 1978, their son, David Overton, our Chairman of the Board and Chief Executive Officer, led the creation and
opening of the first The Cheesecake Factory restaurant in Beverly Hills, California. In 1992, the Company was
incorporated in Delaware as The Cheesecake Factory Incorporated (referred to herein as the “Company” or as “we,”
“us” and “our”) to consolidate the restaurant and bakery businesses of its predecessors operating under The Cheesecake
Factory® mark. Our executive offices are located at 26901 Malibu Hills Road, Calabasas Hills, California 91301, and our
telephone number is (818) 871-3000.
As of March 4, 2019, we operated 218 Company-owned restaurants: 201 under The Cheesecake Factory® mark,
14 under the Grand Lux Cafe® mark, two under the RockSugar Southeast Asian Kitchen® mark and one under the Social
Monk Asian KitchenTM mark. In addition, 21 The Cheesecake Factory branded restaurants in the Middle East, Mexico,
the Chinese Mainland and Special Administrative Region of Hong Kong were operated by third parties under licensing
agreements. We also operated two bakery production facilities that produce desserts for our restaurants, international
licensees and third-party bakery customers. We are selectively pursuing other means to leverage our competitive
strengths, including investing in or acquiring new restaurant concepts (such as North Italia® and Flower Child®),
expanding The Cheesecake Factory® brand to other retail opportunities through The Cheesecake Factory At Home®
consumer packaged goods and evaluating the future potential of Social Monk Asian Kitchen, our new fast casual
concept.
In contrast to many restaurant chains, substantially all of our menu items, except those desserts produced at our
bakery facilities, are prepared from scratch at our restaurants with high-quality, fresh ingredients using innovative and
proprietary recipes. One of our competitive strengths is our ability to anticipate customer preferences and adapt our
expansive menu to the latest trends. We regularly update our ingredients and cooking methods, as well as create new
menu items, to improve the variety, quality and consistency of our food and keep our menu relevant to customers. All
new menu items are selected based on anticipated sales popularity and profitability.
We place significant emphasis on the contemporary interior design and decor of our restaurants, which create a
high-energy ambiance in a casual setting and contribute to the distinctive dining experience enjoyed by our customers.
Our restaurants feature large, open dining areas, and where feasible, both exterior and interior patios. These features
require a higher investment per square foot than is typical for the casual dining industry. However, our restaurants have
historically generated annual sales per square foot that are also typically higher than our competitors. Historical results
are not necessarily indicative of results for future periods.
We maintain a general website at www.thecheesecakefactory.com, as well as websites for our bakery and other
subsidiaries. Our annual reports on Form 10-K, quarterly reports on Form 10-Q, current reports on Form 8-K, all
amendments to those reports and our proxy statements are available on our general website at no charge, as soon as
reasonably practicable after these materials are filed with or furnished to the SEC. Our filings are also available on the
SEC’s website at www.sec.gov. The content of our website is not incorporated by reference into this Form 10-K.
We utilize a 52/53-week fiscal year ending on the Tuesday closest to December 31 for financial reporting
purposes. Fiscal years 2018 and 2017 each consisted of 52 weeks, while fiscal year 2016 consisted of 53 weeks. Fiscal
year 2019 will consist of 52 weeks. All discussion throughout this report, unless otherwise noted, relates to Company-
owned The Cheesecake Factory restaurants.
The Cheesecake Factory
The Cheesecake Factory restaurants strive to provide a distinctive, high-quality dining experience at moderate
prices by offering an extensive, innovative and evolving menu in an upscale casual, high-energy setting with attentive,
efficient and friendly service. As a result, The Cheesecake Factory restaurants appeal to a diverse customer base across a
broad demographic range. Our extensive menu and strategic selection of locations enable us to compete for substantially
all dining preferences and occasions, from the key lunch and dinner day parts to the mid-afternoon and late-night day
parts, which are traditionally weaker times for most casual dining restaurants, as well as special occasion dining. The
Cheesecake Factory restaurants are generally open seven days a week for lunch and dinner, and we offer additional
3
menu items for weekend brunch. Most of our locations are closed on Thanksgiving and Christmas. All items on our
menu, except alcoholic beverages, are available for off-premise consumption, which represented approximately 14% of
our restaurant sales for fiscal year 2018. We work with a third party to provide delivery service, which is now available
at nearly all of our restaurants. In addition, we offer online ordering for to-go sales at all of our domestic locations. All of
our restaurants offer a full-service bar where our entire menu is served. Our alcoholic beverage sales represented
approximately 12% of The Cheesecake Factory restaurant sales for fiscal year 2018.
The Cheesecake Factory menu features approximately 250 items, including items presented on supplemental
menus, such as our SkinnyLicious® menu that offers innovative items at 590 calories or less. Our core menu offerings
include appetizers, pizza, seafood, steaks, chicken, burgers, small plates, pastas, salads, sandwiches and omelettes,
including “Super” food choices and a selection of gluten-free items. Examples of menu offerings include Chicken
Madeira, Cajun Jambalaya Pasta, Thai Lettuce Wraps, Avocado Eggrolls, California Guacamole Salad and our Bacon-
Bacon Cheeseburger.
Our ability to create, promote and attractively display our unique line of desserts is also important to the
competitive positioning and financial success of our restaurants. We offer approximately 50 varieties of proprietary
cheesecake and other desserts in our restaurants. Our brand identity and reputation for offering premium desserts results
in a significant level of dessert sales, representing approximately 16% of The Cheesecake Factory restaurant sales for
fiscal year 2018.
Competitive Positioning
The restaurant industry is comprised of multiple segments, including fine dining, casual dining, fast casual and
quick-service. Our restaurants operate in the upscale casual dining segment, which is differentiated by freshly prepared
and innovative food, flavorful recipes with creative presentations, unique restaurant layouts, eye-catching design
elements and more personalized service. Upscale casual dining is positioned above core casual dining, with standards
that are closer to fine dining. We believe that we are a leader in upscale casual dining given the historically high average
sales per square foot of our restaurants as compared to others in this segment.
The restaurant industry is highly competitive with respect to menu and food quality, service, access to qualified
operations personnel, location, decor and value. We compete directly and indirectly for customer traffic with national
and regional casual dining restaurant chains, as well as independently-owned restaurants. In addition, we face
competition for customer traffic from fast casual and quick-service restaurants, home delivery services, mobile food
service, grocery stores and meal kits that are increasing the quality and variety of their food products in response to
customer demand. This increased competition, coupled with an oversupply of restaurants, has driven casual dining
industry comparable traffic declines in recent years. This backdrop has made it even more challenging to improve
customer traffic. We also compete with other restaurants and retail establishments for quality sites and qualified staff and
managers to operate our restaurants. (See Item 1A — Risk Factors — “Our inability to grow comparable restaurant sales
could materially adversely affect our financial performance.”)
The key elements that drive our total customer experience and help position us from a competitive standpoint
include the following:
Extensive and Innovative Menu. Our restaurants offer one of the broadest menus in casual dining and feature a
wide array of flavors with portions designed for sharing. Substantially all of our menu items, except desserts produced at
our bakery facilities, are prepared daily at each restaurant using high-quality, fresh ingredients based on innovative and
proprietary recipes. We continue to innovate new menu items and new categories of food offerings at our restaurants,
such as our SkinnyLicious® menu, “Super” food selections and gluten-free choices, further enhancing the variety and
price points offered to our customers. We regularly introduce new and innovative cheesecakes and other baked desserts.
In 2018, we launched two new cheesecakes, Very Cherry Ghiradelli® Chocolate and Cinnabon® Cinnamon Swirl, in
conjunction with National Cheesecake Day.
We generally update our menus twice each year to respond to evolving customer dining preferences and food
trends, as well as to update pricing. Our philosophy is to use price increases to help offset key operating cost increases in
a manner that balances protecting both our margins and customer traffic levels. We plan to target menu price increases
of approximately 2% to 3% annually going forward, utilizing a market-based strategy to help mitigate cost pressure in
higher-wage geographies, and expect near-term increases to be at the higher end of this range.
4
Value Proposition. We believe our restaurants are recognized by customers for offering value with a large variety
of freshly prepared menu items across a broad array of price points and generous portions at moderate prices. The
average check for each customer, including beverages and desserts, was approximately $22.60, $21.85 and $21.40 for
fiscal 2018, 2017 and 2016, respectively.
Commitment to Excellent Service and Hospitality through the Selection, Training and Retention of High-quality
Staff Members. Our mission is to “create an environment where absolute guest satisfaction is our highest priority.” We
strive to consistently exceed the expectations of our customers in all aspects of their experiences in our restaurants. One
of the most important aspects of delivering a consistent and dependable level of service is having a team of experienced
managers who can successfully operate our high-volume, complex restaurants. Our recruitment, selection, training,
retention and internal promotion programs are among the most comprehensive in the restaurant industry, helping us to
attract and retain qualified staff members who are motivated to consistently provide excellence in restauranteuring and
customer hospitality. By providing extensive training, our goal is to encourage our staff members to develop a sense of
personal commitment to our core values and culture of excellence. (See “Restaurant Operations, Management and
Staffing” below.) Our commitment to people-focused programs and creating a great workplace for all of our staff and
managers contributed to The Cheesecake Factory being named in February 2019, for the sixth year in a row, to Fortune
magazine’s list of “100 Best Companies to Work For®.”
High-quality, High-Profile Restaurant Locations and Flexible Site Layouts. We target restaurant sites in high-
quality, high-profile locations with a balanced mix of retail shopping, entertainment, residences, tourism and businesses.
We have the flexibility to design our restaurants to accommodate a wide array of urban and suburban site layouts,
including multi-level locations. Our restaurants feature large, open dining areas, high ceilings where available and a
contemporary kitchen design. The layouts are flexible, permitting tables and seats to be easily rearranged to
accommodate small and large parties, thus permitting more effective utilization of seating capacity. Interior and exterior
patio seating, either or both of which are available at approximately 95% of our restaurants, allow for additional
customer capacity at a comparatively low occupancy cost per seat. Exterior patio seating is generally available as
weather permits. (See “New Restaurant Site Selection and Development” below.)
Distinctive Restaurant Design and Decor. Our restaurants’ distinctive contemporary design and decor create a
high-energy, upscale ambiance in a casual setting. We have evolved our restaurants’ design over time to remain current
while retaining a similar look and feel to our earlier restaurants. We apply high standards to the maintenance of our
restaurants to keep them in “like new” condition.
Integration of our Bakery Operations. The primary role of our bakery operations is to produce innovative, high-
quality cheesecakes and other baked desserts for sale at our restaurants and those of our international licensees, which is
important to our competitive positioning. Integration of this vital part of our brand gives us control over the creativity
and quality of our desserts and is also more profitable than buying from a third party.
New Restaurant Site Selection and Development
The Cheesecake Factory concept has demonstrated success in a variety of layouts (e.g., single or multi-level and
varying interior square feet), site locations (e.g., urban or suburban shopping malls, lifestyle centers, retail strip centers,
office complexes, entertainment centers and urban street locations — either freestanding or in-line) and trade areas.
Accordingly, we intend to continue developing The Cheesecake Factory restaurants in high-quality, high-profile
locations that meet our rigorous site standards. We regularly negotiate leases for potential future locations and plan to
open as many locations in any given year as there are sites available that meet our site selection criteria. It is difficult for
us to precisely predict the timing of our new restaurant openings due to many factors that are outside of our control. (See
Item 1A — Risk Factors — “Our inability to secure an adequate number of high-quality sites for future restaurant
openings could adversely affect our ability to grow our business.”) We have the flexibility in our restaurant designs to
penetrate a wide variety of markets across varying population densities in both existing and new markets. We continue to
target approximately 300 Company-owned and operated restaurants domestically over time, as well as the potential for
an additional eight to ten locations in Canada depending upon our ability to ultimately achieve the targeted profitability
of our initial location.
The locations of our restaurants are critical to our long-term success, and we devote significant time and
resources to analyzing each prospective site. We consider many factors when assessing the suitability of a site, including
the demographics of the trade area such as average household income, and historical and anticipated population growth.
5
Since our restaurants can be successfully executed within a variety of site locations and layouts, we are highly flexible in
choosing suitable locations. While there are common decor elements within each of our restaurant sites, the designs are
customized for the specifics of each location, including the building type, square footage and layout of available space.
Our existing restaurants range from 5,000 to 21,000 interior square feet, and we expect the majority of our new
restaurants to vary between 7,500 and 10,000 interior square feet, generally with additional exterior and/or interior patio
seating, selected appropriately for each market and specific site.
The relatively high sales productivity of our restaurants provides opportunities to obtain competitive leasing
terms from landlords. Due to the flexible and customized nature of our restaurant operations and the complex design,
construction and preopening processes for each new location, our lease negotiation and restaurant development time
frames vary. The development and opening process usually ranges from six to eighteen months, depending largely on the
availability of the leased space we intend to occupy, and can be subject to delays either due to factors outside of our
control or to our selective timing of restaurant openings.
Unit Economics
The operation of high-quality restaurants in premier locations fitting our criteria contributes to the continuing
customer appeal of The Cheesecake Factory. This popularity is reflected in our average sales per restaurant and per
square foot, which are among the highest of any publicly-held restaurant company.
Average sales per location for The Cheesecake Factory restaurants open for the full year on a 52-week basis were
approximately $10.7 million, $10.6 million and $10.7 million for fiscal 2018, 2017 and 2016, respectively. Since each of
our restaurants has a customized layout and differs in size, an effective method to measure the unit economics of our
sites is by square foot. Average sales per productive square foot (defined as all interior square footage plus seasonally
adjusted exterior patio square footage) for restaurants open for the full year on a 52-week basis were approximately
$978, $962 and $971 for fiscal 2018, 2017 and 2016, respectively. Fluctuations in both average sales per location and
average sales per productive square foot generally track with comparable restaurant sales trends. (See Part II, Item 7,
Management’s Discussion and Analysis of Financial Condition and Results of Operations for further discussion on
comparable restaurant sales.)
We currently lease all of our restaurant locations and utilize capital for leasehold improvements and furnishings,
fixtures and equipment (“FF&E”) to build out our restaurant premises. Total costs are targeted at approximately $900 to
$1,000 per interior square foot for The Cheesecake Factory restaurants. The construction costs to build our restaurant
premises vary depending on a number of factors, including geography, the complexity of our build-out, site
characteristics, governmental fees and permits, labor and material conditions in the local market, weather and the
amount, if any, of construction contributions obtained from our landlords for structural additions and other leasehold
improvements. These costs have trended higher over the past several years due primarily to wage inflation and the
availability of trade labor in certain geographies.
In selecting sites for our restaurants, an important objective is to earn an appropriate return on investment. We
measure returns using a cash-on-cash return on investment calculated by dividing restaurant-level EBITDA (earnings
before interest, taxes, depreciation and amortization and preopening costs) by our cash investment. With restaurant-level
EBITDA targeted at 18% on average after entering our comparable sales base, our goal is to achieve an average cash-on-
cash return of approximately 20% to 25% for new restaurants. Investing in new restaurant development that meets our
return on investment criteria supports achieving a Company-level return on invested capital (“ROIC”) of approximately
15%. There are no guarantees that targeted returns will be achieved.
Our new restaurants typically open with initial sales volumes well in excess of their future run-rate levels. This
initial “honeymoon” effect usually results from grand opening publicity and other customer awareness activities that
generate higher than usual customer traffic, particularly in new markets. During the three to six months following the
opening of new restaurants, customer traffic generally settles into its normal pattern, resulting in sales volumes that
gradually adjust downward to their post-opening run-rate level. Additionally, our new restaurants usually require a
period of time after reaching normal traffic levels to achieve their targeted restaurant-level operating margins due to cost
of sales and labor inefficiencies commonly associated with new, highly complex casual dining restaurants such as ours.
6
Restaurant Operations, Management and Staffing
Our ability to consistently execute a complex menu offering items prepared daily with high-quality, fresh
ingredients in an upscale casual, high-volume dining environment is critical to our overall success. We employ detailed
operating procedures, standards, controls, food line management systems and cooking methods and processes to
accommodate our extensive menu and to drive sales productivity. However, the successful day-to-day operation of our
restaurants remains critically dependent on the ability, dedication and engagement of our General Managers (“GMs”),
Executive Kitchen Managers (“EKMs”) and all other management and hourly staff members working at our restaurants.
Competition among restaurant companies for qualified management and staff remains very high. (See Item 1A — Risk
Factors — “If we are unable to successfully recruit and retain qualified restaurant management and operating personnel
in an increasingly competitive market, we may be unable to effectively operate and grow our business and revenues,
which could materially adversely affect our financial performance.”)
We believe that the high average sales volumes and popularity of our restaurants allow us to attract and retain
high-quality, experienced restaurant-level management and other operational personnel. Each restaurant is generally
staffed with one GM, one EKM and an average of six to ten additional kitchen and front-of-the-house managers,
depending on the size and sales volume of each restaurant. Our GMs and EKMs possess an average of more than ten
years of experience with the Company. This tenure and knowledge drives our high productivity and contributes to our
ability to deliver an exceptional customer experience. All newly-recruited restaurant managers complete an extensive
training program during which they receive both classroom and on-the-job instruction in areas such as food quality and
safety, customer service, financial management, staff relations and safely serving alcohol. Managers continue their
development by participating in and completing a variety of training and development activities to assess and further
develop their skills and knowledge necessary for upward progression through our management levels. Our GMs
regularly meet to receive hands-on training, share best practices and celebrate Company successes, all of which help to
foster the unique culture of our brand.
Each restaurant GM reports to an Area Director of Operations (“ADO”) who supervises the operations of seven
to nine restaurants within a geographic area. In turn, each ADO reports to one of four Regional Vice Presidents of
Restaurant Operations. Our EKMs report to their GMs, but are also supervised by an Area Kitchen Operations Manager
responsible for between eight and ten restaurants. Our restaurant field supervision organization also includes our Senior
Vice President of Operations, Chief Culinary Officer, an operations services team and our performance development
department who are collectively responsible for day-to-day operations, managing new restaurant openings and training
for all operational managers and staff.
To enable us to more effectively compete for, and retain, the highest quality restaurant management personnel,
we offer an innovative and comprehensive compensation program for our restaurant GMs and EKMs. Each participant
receives a competitive base salary and has the opportunity to earn a cash bonus based on quantitative restaurant
performance metrics. GMs are also eligible to use a Company-leased vehicle. In addition, we provide a longer-term,
equity incentive program to our GMs and EKMs based on their extended service with us in their respective positions and
their achievement of certain performance objectives. We believe that these awards encourage our GMs and EKMs to
think and act as business owners, assist in retention of restaurant management and align our managers’ interests with
those of our stockholders.
Our restaurant GMs are responsible for selecting and training hourly staff members for their respective
restaurants. Each restaurant is staffed, on average, with approximately 170 hourly staff members. We require each
hourly staff member to participate in a formal training program for his or her respective position in the restaurant, under
the supervision of other experienced staff members and restaurant management. We strive to foster enthusiasm and
commitment in our staff members, and respect for one another, through daily staff meetings and dedicated time for
training. We solicit suggestions concerning restaurant operations and other aspects of our business through an annual
engagement survey, GM and workgroup meetings, a website dedicated to receiving staff member input and other means,
fostering a highly-engaged workforce.
Our commitment to people-focused programs and creating a great workplace for all of our staff and managers
contributed to The Cheesecake Factory being named in February 2019, for the sixth year in a row, to Fortune magazine’s
list of the “100 Best Companies to Work For®,” which is published annually based on a culture review and surveys of
current staff members to identify and recognize companies that create positive work environments with high employee
morale and fulfillment. In 2018, we were also named to the Fortune “100 Best Workplaces for Women®,” “100 Best
7
Workplaces for Diversity®,” and “100 Best Workplaces for Millennials®.” In addition, for the fourth year in a row,
Transforming Data into Knowledge (TDn2K)/People Report awarded us the Global Best Practices Award in
January 2018, recognizing best overall performance based on restaurant management retention, hourly employee
retention, composite diversity, year-over-year improvement and community involvement.
Preopening Costs for New Restaurants
Due to the highly customized and operationally complex nature of our upscale, high-volume concept and the
investment we make in properly training our staff to operate our restaurants, our preopening process is more extensive,
time consuming and costly than that of many restaurant chains. Preopening costs for a typical restaurant in an established
market average approximately $1.7 million to $2.0 million and include all costs to relocate and compensate restaurant
management staff members during the preopening period, costs to recruit and train hourly restaurant staff members, and
wages, travel and lodging costs for our opening training team and other support staff members. Also included are
planned management growth expenses for maintaining a roster of trained managers for pending openings, the associated
temporary housing and other costs necessary to relocate managers in alignment with future restaurant opening and
operating needs, and corporate travel and support activities.
Preopening costs can fluctuate significantly from period to period, based on the number and timing of restaurant
openings and the specific preopening costs incurred for each restaurant. Preopening costs vary by location depending on
a number of factors, including the proximity of our existing restaurants, the size and physical layout of each location, the
number of management and hourly staff members required to operate each restaurant, the availability of qualified
restaurant staff members, the cost of travel and lodging for different metropolitan areas, the timing of the restaurant
opening and the extent of unexpected delays, if any, in obtaining final licenses and permits to open the restaurant, which
may also depend on our landlords obtaining their licenses and permits and completing their construction activities.
Preopening costs are generally higher for larger restaurants and initial entry into new markets and lower when we
relocate a restaurant within its local market. We usually incur the most significant portion of preopening costs within the
two months immediately preceding and the month of a restaurant’s opening. Preopening costs per restaurant will also
depend on our ability to leverage planned management growth expenses.
Expansion of Licensed Locations
We currently have licensing agreements with three restaurant operators to develop and operate The Cheesecake
Factory® brand restaurants in selected international markets. Our licensees invest their capital to build and operate the
restaurants, and we receive initial development fees, site and design fees and ongoing royalties based on our licensees’
restaurant sales. In addition, these licensees purchase bakery products branded under The Cheesecake Factory® mark
from us. We project each international licensed location to contribute approximately $0.01 in annual earnings per share
(“EPS”), on average, once the location has been in operation for a full year. As of March 4, 2019, our international
licensees operated the following The Cheesecake Factory restaurants:
Licensee Location Restaurant Location # of Restaurants
Kuwait (1) .................................................................... Bahrain 1
Kingdom of Saudi Arabia 2
Kuwait 3
Lebanon 1
Qatar 3
United Arab Emirates 5
Mexico (2) ................................................................... Mexico 3
Special Administrative Region of Hong Kong (3)........ Chinese Mainland 2
Special Administrative Region of Hong Kong 1
Total ........................................................................ 21
(1) This licensee, or its affiliates, also has the right to develop restaurants in Egypt, with the opportunity to expand the
agreement to include Algeria, Hungary, Iraq, Libya, Morocco, Poland, Russia, Slovakia, The Czech Republic,
Tunisia, Turkey and Ukraine.
(2) This licensee, or its affiliates, also has the right to develop restaurants in Chile, with the opportunity to expand the
agreement to include Argentina, Brazil, Colombia and Peru.
(3) This licensee, or its affiliates, also has the right to develop restaurants in Macao and Taiwan, with the opportunity to
expand the agreement to include Japan, South Korea, Malaysia, Singapore and Thailand.
8
Our corporate infrastructure includes a dedicated global development team that works with our international
licensees and coordinates the initial training, ongoing quality control, product specifications and brand oversight at our
licensed locations. Our internal audit department also performs periodic reviews of our international licensees’
compliance with our licensing agreements.
As we evaluate other international markets, we will consider opportunities to directly operate certain locations
and/or enter into licensing, joint venture or partnership arrangements with established third-party companies. We are
selective in our assessment of potential partners and licensees, focusing on well-capitalized companies that have
established business infrastructures, expertise in multiple countries, experience in operating upscale casual dining
restaurants and sound governance practices. We look to associate with companies who will protect The Cheesecake
Factory® brand and operate the concept in a high-quality, consistent manner.
Due to the complexities of opening The Cheesecake Factory restaurants in other countries, including, but not
limited to, the selection and design of appropriate sites, construction of our complex restaurant designs, training of
licensees’ staff members, approval of supply sources and exportation of our bakery products to new countries, the
number and timing of new openings in foreign countries may vary from expectations. (See Item 1A — Risk Factors —
“We face a variety of risks and challenges related to our international operations and global brand development efforts
that could materially adversely affect our financial performance.”)
Bakery Operations
We own and operate two bakery production facilities, one in Calabasas Hills, California, and one in Rocky
Mount, North Carolina. Our facility in California accommodates both production operations and corporate support
personnel, while our facility in North Carolina houses production operations and a distribution center. In fiscal 2018,
we completed an infrastructure modernization of our California facility.
We produce approximately 70 varieties of proprietary cheesecakes and other baked desserts using high-quality
ingredients for The Cheesecake Factory and Grand Lux Cafe restaurants, and for international licensees and third-party
customers. Some of our most popular cheesecakes include the Original Cheesecake, Ultimate Red Velvet Cake
CheesecakeTM, Godiva® Chocolate Cheesecake, Oreo® Dream Extreme Cheesecake and Salted Caramel. Other popular
baked desserts include Chocolate Tower Truffle CakeTM, Carrot Cake, Black-Out Cake and Lemoncello Cream Torte.
The primary role of our bakery operations is to produce innovative, high-quality cheesecakes and other baked
desserts for sale at our restaurants and those of our international licensees. Integration of this vital part of our brand gives
us control over the creativity and quality of our desserts and is also more profitable than buying from a third party.
We also leverage The Cheesecake Factory brand identity and utilize our bakery production capacity by selling
cheesecakes and other baked products to external foodservice operators, retailers and distributors. Current large-account
customers include leading national warehouse club operators, foodservice distributors, supermarkets and other
restaurants, a national retail bookstore cafe and foodservice operators. We also currently sell a selection of our cakes
online and in catalogs domestically through an agreement with an upscale retailer. Items produced for outside accounts
are marketed under The Cheesecake Factory Bakery® and The Cheesecake Factory At Home® marks and other private
labels and were previously marketed under The Cheesecake Factory® and The Dream Factory® marks.
We also sell baked goods internationally under The Cheesecake Factory Bakery®, The Cheesecake Factory At
Home®, The Cheesecake Factory® and The Dream Factory® marks and have entered over 30 countries with our brands.
Offering our cheesecakes and other baked desserts internationally is important to our branding, creating awareness and
driving demand, not only for bakery products but for the international expansion of our restaurants.
Incremental Growth Opportunities
We are pursuing a number of incremental growth opportunities that would complement the continued domestic
and international expansion of The Cheesecake Factory concept.
9
Investments in North Italia and Flower Child
During fiscal 2016, we entered into a strategic relationship with Fox Restaurant Concepts LLC (“FRC”) with
respect to two of its brands, North Italia and Flower Child, that share a number of parallels with us in terms of culture
and philosophy:
• North Italia is a modern interpretation of Italian cooking in the upscale casual dining segment. All dishes are
handmade from scratch daily. We see a number of synergistic attributes, including operations and real estate
development, as well as significant market opportunity for an on-trend Italian offering.
• Flower Child is a fast casual concept offering a customizable menu, made fresh from scratch, featuring
locally-sourced, all-natural and organic ingredients in salads, plates, bowls and wraps. This is a potential
opportunity for us to diversify our portfolio in a strong and growing niche.
FRC, or its affiliates, continues to own the intellectual property, manage day-to-day operations and provide
infrastructure support to facilitate the near-term growth of both of these concepts.
We made initial minority equity investments in these concepts during fiscal 2016 and invested additional growth
capital during fiscal 2018 and 2017. We plan to make additional growth capital contributions to North Italia and Flower
Child in fiscal 2019.We have the right, and an obligation if certain financial, legal and operational conditions are met, to
acquire the remaining interest in North Italia in fiscal 2019 and Flower Child in fiscal 2021. Based on North Italia’s
current performance, we are likely to acquire the remaining interest in the concept at the end of the third quarter of 2019
and are evaluating financing alternatives. (See Item 1A — Risk Factors — “Our strategic relationship with FRC might
not yield the anticipated benefits, and we may lose some or all of our investment, which could materially adversely
affect our financial performance.”)
Consumer Packaged Goods
Given the strong affinity for The Cheesecake Factory® brand, in 2017 we began leveraging opportunities in the
consumer packaged goods channel. We now partner with third-party manufacturers to offer a variety of products
marketed under The Cheesecake Factory At Home® mark in retail stores. These offerings include our Famous “Brown
Bread,” coffee creamer, baking mixes, confections and refrigerated puddings. We are actively evaluating other
synergistic, on-brand licensing opportunities to add incremental revenue streams to our business.
Internal Development of Social Monk Asian Kitchen, a Fast Casual Concept
In February 2019, we opened the first location of our internally developed fast casual concept, Social Monk
Asian Kitchen. Social Monk Asian Kitchen is a fast casual Asian concept with a modern urban feel. The menu features
the cuisines of Thailand, Vietnam, Malaysia, Singapore, China, Indonesia and India in made-to-order starters, salads,
soups, sandwiches, rice and noodle bowls, classic entrees, vegetables and sides and house-made frozen custard. The
restaurant also offers beer and wine. Examples of menu offerings include Crisp Vegetable Spring Rolls, Thai Beef
Noodle Salad, Bahn Mi, Crispy Princess Chicken and Dan Dan Noodles. This initial site will allow us to test the concept
and evaluate its future potential. (See Item 1A — Risk Factors — “We are selectively pursuing and continue to evaluate
developing, investing in or acquiring new restaurant concepts, expansion of The Cheesecake Factory At Home® brand to
other retail opportunities and other initiatives which may create risks to our business that could materially adversely
affect our financial performance.”)
Other Concepts
In addition to The Cheesecake Factory, we also operate Grand Lux Cafe and RockSugar Southeast Asian
Kitchen. At present, we have no plans to open additional locations.
Grand Lux Cafe
Grand Lux Cafe is an upscale casual dining concept that offers globally-inspired cuisine with an ambiance of
modern sophistication. Using fresh ingredients, the menu of approximately 175 items at Grand Lux Cafe offers classic
American dishes and international favorites, including appetizers, pasta, seafood, steaks, chicken, burgers, salads,
specialty items and desserts. Examples of menu offerings include our Cedar Planked B.B.Q Salmon, Buffalo Chicken
10
Rolls and Shrimp Scampi. Each Grand Lux Cafe features an on-site bakery which produces a selection of signature
desserts, and a full-service bar.
RockSugar Southeast Asian Kitchen
RockSugar Southeast Asian Kitchen features a Southeast Asian menu and design elements in an upscale casual
dining setting. RockSugar Southeast Asian Kitchen showcases the cuisines of Thailand, Vietnam, Malaysia,
Singapore, Indonesia and India with approximately 75 dishes served “family-style” to create an atmosphere that
encourages sharing and conversation. Examples of menu offerings include Shaking Beef, Thai Basil Cashew Chicken,
Ginger Fried Rice and Crispy Samosas. RockSugar Southeast Asian Kitchen also features a full-service bar with an
extensive wine list and exotic cocktails and offers freshly-made desserts that infuse traditional French flair into nearly a
dozen Asian-influenced items.
Purchasing and Distribution
We strive to obtain quality menu ingredients, bakery raw materials and other supplies and services for our
operations from reliable sources at competitive prices and consistent with our sustainability goals. We continually
research and evaluate various ingredients and products in an effort to maintain high quality, be responsive to changing
consumer tastes and manage costs.
In order to maximize purchasing efficiencies and to provide the freshest ingredients for our menu items while
obtaining competitive prices for the required quality and consistency, each restaurant’s management determines the
quantities of food and supplies required for their restaurant and orders the items from local, regional and national
suppliers based upon specifications established by our corporate office and on terms negotiated by our central
purchasing staff. We strive to maintain restaurant-level inventories at a minimum dollar level in relation to sales due to
the high concentration and relatively rapid turnover of the perishable produce, poultry, meat, fish and dairy commodities
that we use in our operations, coupled with the limited storage space at our restaurants. Independent foodservice
distributors, including the largest foodservice distributor in North America, deliver most items multiple times per week
to our restaurants.
We purchase food and other commodities for use in our operations, based on market prices established with our
suppliers. Many of the commodities purchased by us can be subject to volatility due to market supply and demand
factors outside of our control. We seek to mitigate the risk of supply shortages and obtain competitive prices by utilizing
multiple qualified suppliers for substantially all of our ingredients and supplies.
We negotiate short-term and long-term agreements for some of our principal commodity, supply and equipment
requirements, such as certain dairy products and poultry, depending on market conditions and expected demand. We
continue to evaluate the possibility of entering into similar arrangements for other commodities and also periodically
evaluate hedging vehicles, such as direct financial instruments, to assist us in managing risk and variability associated
with such commodities. As of the end of fiscal 2018, we had no hedging contracts in place. We may or may not have the
ability to increase menu prices, or vary menu items, in response to food commodity price increases. (See Item 1A —
Risk Factors — “Our inability to anticipate and react effectively to changes in the costs of key operating resources may
increase our cost of doing business, which may materially adversely affect our financial performance.”)
Information Technology
Our technology-enabled business solutions are designed to provide effective financial controls, cost management,
improved efficiencies and enhanced customer experience. Our business intelligence solution and data warehouse
architecture provide corporate and restaurant management with information and insights into key operational metrics and
performance indicators. This framework delivers enterprise reporting, dashboards and analytics, and allows access to
metrics such as quote and wait time accuracy, staff member retention trends, and restaurant quality and service analyses.
Our restaurant point of sale and back-office systems provide information regarding daily sales, cash receipts,
inventory, food and beverage costs, labor costs and other controllable operating expenses. We offer online ordering for
to-go sales in all of our The Cheesecake Factory restaurants, and our point of sale system is integrated with our delivery
provider to drive efficiencies in the restaurants and enhance the customer delivery experience. We offer a mobile
payment application, CakePay®, which provides convenience to our customers, enabling them to complete the payment
11
process at any time during their dining experience using their mobile device. We utilize a customer satisfaction
measurement platform that leverages the “Net Promoter Score” methodology at all of our restaurants. The data and
analytics provided by this software provide us with actionable insights to better understand what customer experience
opportunities should be addressed, while reinforcing positive staff behaviors.
Our kitchen management system provides automated routing and cook line balancing, and synchronizes order
completion, ticket time and cook time data, promoting more efficient levels of labor and productivity without sacrificing
quality. We leverage our recipe viewer system to ensure timely and accurate recipe updates, and to provide instructional
media content and detailed procedures enabling our staff to consistently prepare our highly-complex, diverse menu
across all locations. We utilize a web-based labor scheduling solution to enhance scheduling precision and staff
satisfaction. We also employ a web-based notification and tracking solution to contact our restaurants and monitor
progress in the event of a needed product withdrawal or recall.
Restaurant hardware and software support for all of our concepts is provided by both our internal support
services team at our corporate center as well as third-party vendors for remote and on-site restaurant support. Each
restaurant has a private high-speed wide area connection to send and receive critical business data as well as to access
web-based applications securely. We implemented a failover capability whereby a secondary public circuit is used to
automatically establish a secure connection to our private network if the primary connection becomes unavailable. We
employ modern restaurant switching and routing technology that allows us to leverage and support contemporary
security standards and practices and employ wireless capability for a variety of mobile uses. All of our core and critical
applications are housed in an external tier 3 data center. To mitigate business interruptions, we utilize a disk-based data
backup and replication infrastructure between our onsite and external data centers so all data is replicated nightly
between the two sites.
We employ a multi-discipline security incident response plan to recognize, manage and resolve cybersecurity
threats, and require cybersecurity awareness training for all staff members who have access to our cyber systems. We
also maintain cyber risk insurance coverage to further reduce our risk profile. Security of our financial data and other
sensitive information remains a high priority for us, led by our information technology department in conjunction with
an interdepartmental information security council representing all of our key functional areas. We utilize a private key
infrastructure ensuring only trusted devices can access our network and require secure sockets layer (SSL) certificates
for access to sites outside of our network. Also, in an effort to further secure our customers’ credit card information, we
employ a robust encryption and tokenization platform for all credit card transactions in our restaurants, ensuring that no
credit card data is stored in our internal systems. This includes equipment that can also process smart payment cards,
commonly referred to as EMV (Europay, Mastercard, Visa). (See Item 1A — Risk Factors — “Information technology
system failures or breaches of our network security could interrupt our operations and subject us to increased operating
costs, as well as to litigation and other liabilities, any of which could materially adversely affect our financial
performance.”)
Marketing and Advertising
We rely on our reputation, as well as our high-profile locations, media exposure and positive “word of mouth,”
to maintain and grow market share rather than focusing on traditional paid advertising through television, radio or print,
or using significant discounting. We utilize a social media and digital marketing strategy that allows us to engage
regularly with our customers outside of our restaurants, including communication on Facebook®, Twitter®, Pinterest®,
Instagram® and other social media platforms, Google search advertising and direct email to customers. (See Item 1A —
Risk Factors — “Any inability to effectively use and manage social media could harm our marketing efforts as well as
our reputation, which could materially adversely affect our financial performance.”)
Public relations is another important aspect of our marketing approach, and we frequently appear on local and
national television in connection with a variety of promotional opportunities, such as National Cheesecake Day, to
perform cooking demonstrations and other brand-building exposure. We generated approximately four billion media
impressions in fiscal 2018 at minimal cost to us. We partner with several premiere third-party gift card distributors,
contributing to our brand awareness and gift card sales. We also attempt to build awareness and relationships with
retailers located in the same developments, shopping center operators, local hotel concierges, neighborhood groups and
others in the community. For restaurants opening in new markets, we strive to obtain local television, radio station and
newspaper coverage in order to benefit from publicity at low or no cost. At times, we also engage in marketing and
12
advertising opportunities in selective local markets. In addition, we partner with our third-party delivery provider and
consumer packaged goods licensees on co-branded marketing campaigns.
Our international licensees are committed to opening each new restaurant with marketing that can be comprised
of a mix of elements including print, billboards, digital and radio. We maintain final approval of our licensees’
marketing campaigns and social media posts to promote consistency in the look and feel of marketing efforts including
our brand, domestically and abroad.
Seasonality and Quarterly Results
While seasonal fluctuations generally do not have a material impact on our quarterly results, year-over-year
comparison of our quarterly results can be significantly impacted by the number and timing of new restaurant openings
and associated preopening costs, the calendar days of the week on which holidays occur, the impact from inclement
weather and other climatic conditions, the additional week in a 53-week fiscal year and other variations in revenues and
expenses. Because of these and other factors, our financial results for any quarter are not necessarily indicative of the
results that may be achieved for the full fiscal year.
Food Safety and Quality Assurance
Our food safety processes and systems are designed to mitigate the risk of contamination and illness and to
ensure compliance with regulatory requirements as well as industry standards. We continuously seek to improve our
food safety and sanitation policies and procedures. Our work and management processes are verified by routine internal
and third-party health inspection audits and regulatory agency inspections. In addition, our bakery facilities are Safe
Quality Food (SQF) certified in alignment with the Global Food Safety Initiative’s Global Markets Program.
In selecting suppliers, we look for key performance indicators relating to sanitation, operations and facility
management, good manufacturing and agricultural practices, product protection, recovery and food security. In addition
to measuring and testing food safety and security practices, we strive to ensure that all our food suppliers have annual
food safety and quality system audits. Our restaurants and bakery facilities also follow regulatory guidelines required for
conducting and managing ingredient and product traceability. We utilize a web-based notification and tracking solution
to efficiently contact our restaurants and monitor our progress in the event of a product withdrawal or recall. (See Item
1A — Risk Factors — “Concerns relating to food safety, food-borne illness, pandemics and other diseases could reduce
customer traffic to our restaurants, or cause us to be the target of litigation, which could materially adversely affect our
financial performance.”)
Government Regulation
We are subject to numerous federal, state, local and foreign laws affecting our business. Each of our restaurants
is subject to licensing and regulation by a number of government authorities, which may include alcoholic beverage
control, health, sanitation, environmental, labor, immigration, zoning and public safety agencies. We are also subject to
various environmental regulations, including water usage, sanitation disposal and transportation mitigation.
Our international business exposes us to additional regulations, including antitrust and tax requirements, anti-
boycott legislation, import/export and customs regulations and other international trade regulations, privacy laws, the
USA Patriot Act and the Foreign Corrupt Practices Act.
As a provider of food products, we are subject to a comprehensive regulatory framework that governs the
manufacture (including composition and ingredients), labeling, packaging and safety of food in the United States
(“U.S”), including the Federal Food, Drug and Cosmetic Act, the Public Health Security and Bioterrorism Preparedness
Response Act of 2002, the Federal Food Safety Modernization Act and regulations concerning nutritional labeling under
the Patient Protection and Affordable Care Act of 2010. (See Item 1A — Risk Factors — “Our inability to respond
appropriately to changes in consumer health and disclosure regulations, and to adapt to evolving consumer dining
preferences could negatively impact our operations and competitive position, which could materially adversely affect our
financial performance.”)
In order to serve alcoholic beverages in our restaurants, we must comply with alcoholic beverage control
regulations which require each of our restaurants to apply to a state or other governmental alcoholic beverage control
authority for licenses and permits to sell alcoholic beverages on the premises. In addition, we are subject to dram shop
statutes in most of the jurisdictions in which we operate, which generally provide a person injured by an intoxicated
13
person the right to recover damages from an establishment that wrongfully served alcoholic beverages to the intoxicated
person. To help mitigate this risk, we carry liquor liability coverage as part of our existing comprehensive general
liability insurance.
Various federal, state, local and foreign laws govern our operations and our relationships with our staff members,
including such matters as minimum wages, breaks, scheduling, exempt classifications, equal pay, overtime, tip credits,
fringe benefits, leaves, safety, working conditions, provision of health insurance and citizenship or work authorization
requirements. In California, we are subject to the Private Attorneys General Act (“PAGA”) which authorizes employees
to file lawsuits to recover civil penalties on behalf of themselves, other employees and the State of California for labor
code violations. We must also comply with local, state and federal laws protecting the right to equal employment
opportunities and prohibiting discrimination and harassment in the work place. We have enhanced our training and
awareness programs in these areas and plan to further expand this training curriculum in fiscal 2019. We are also subject
to the regulations of the Department of Homeland Security, the U.S. Citizenship and Immigration Services and U.S.
Immigration and Customs Enforcement.
Our facilities must comply with applicable requirements of the Americans with Disabilities Act of 1990 (“ADA”)
and related federal, state and foreign statutes which prohibit discrimination on the basis of disability with respect to
public accommodations and employment. Under the ADA and related state and local laws, we take steps to make our
new or significantly remodeled restaurants, our corporate and bakery facilities and our websites readily accessible to
disabled persons. We make reasonable accommodations for the employment of disabled persons as required by
applicable laws.
A significant number of our hourly restaurant staff members receive income from gratuities. In the United States,
we participate voluntarily in a Tip Reporting Alternative Commitment (“TRAC”) agreement with the Internal Revenue
Service (“IRS”). By complying with the educational and other requirements of the TRAC agreement, we reduce the
likelihood of potential employer-only FICA tax assessments for unreported or underreported tips.
We are subject to laws relating to information security, privacy, cashless payments and consumer credit,
protection and fraud. An increasing number of governments and industry groups worldwide have established data
privacy laws and standards for the protection of personal information (including social security numbers), financial
information (including credit card numbers) and health information.
(See Item 1A — Risk Factors — “Changes in, or any failure to comply with, applicable laws or regulations could
materially adversely affect our ability to operate our restaurants and/or increase our cost to do so, which could materially
adversely affect our financial performance.”)
Trade Names, Trademarks and Other Intellectual Property
We own various types of intellectual property and have applied to register trade names, logos, service marks,
trademarks and copyrights (collectively, “Intellectual Property”) in the United States, Canada and in additional countries
throughout the world in various categories, including without limitation, restaurant services and bakery goods. We
regard our Intellectual Property, including without limitation “The Cheesecake Factory,” “Grand Lux Cafe,”
“RockSugar Southeast Asian Kitchen,” “Social Monk Asian Kitchen,” “The Cheesecake Factory Bakery,” and “The
Cheesecake Factory At Home”, as well as our trade dress, as having substantial value and as being important to our
marketing efforts. Our policy is to pursue registration of our important Intellectual Property whenever commercially
feasible and to vigorously oppose infringements of our Intellectual Property. The duration of Intellectual Property
registrations varies from country to country, and we have not registered all of our trademarks in every country in which
we now or in the future may do business. However, registrations of Intellectual Property are generally valid and may be
renewed indefinitely as long as they are in use and/or their registrations are properly maintained. We have also registered
various internet domain names, including, without limitation, “www.thecheesecakefactory.com,”
“www.grandluxcafe.com,” “www.rocksugarkitchen.com,” “www.socialmonk.com” and
“www.thecheesecakefactorybakery.com,” as well as derivations of these and other domain names to include
international country codes. (See Item 1A — Risk Factors — “Our failure to adequately protect our intellectual property
could materially adversely affect our financial performance.”)
14
Charitable Giving
The Cheesecake Factory Oscar and Evelyn Overton Charitable Foundation (“Foundation”) was created as a
means to give back to the communities that our restaurants serve, as well as to unite our staff members in charitable
causes. Since the inception of its annual Invitational Charity Golf Tournament, the Foundation has raised $3.4 million,
including $0.3 million in fiscal 2018, for the City of Hope Comprehensive Cancer Center, a leading research and
treatment center for cancer, diabetes and other life-threatening diseases in Southern California.
In fiscal 2018, over 3,000 of our staff members volunteered their time to the Foundation to serve holiday meals to
low-income individuals and families in 13 Salvation Army centers across the United States at our annual Thanksgiving
Day Feast. Additionally, the Foundation provides sponsorships for teams of our staff members who work directly with
non-profit organizations in their communities supporting a variety of local and national initiatives.
In addition to the efforts of the Foundation, the Company directly participates in a variety of charitable
endeavors. Through the nationwide Harvest Food Donation Program, we regularly donate surplus food from our
restaurants to local food rescue operations for distribution to soup kitchens and shelters. Since the program’s inception in
2007, we have donated more than 4.7 million pounds of food, including approximately 445,000 pounds in fiscal 2018.
We also contribute to Feeding America®, the nation’s largest domestic hunger-relief organization, through
specially-designated cheesecake sales, periodic meal donation campaigns in conjunction with our delivery provider and
participation in Feeding America’s annual campaign to bring awareness to and help fight domestic hunger by donating
peanut butter to local food banks. In fiscal 2018, we donated $0.2 million to Feeding America through sales of our Very
Cherry Ghirardelli® cheesecake, bringing our total contributions to $4.6 million over the past eleven years. Nationwide
in fiscal 2018, our staff members collected approximately 267,000 pounds of peanut butter for donation to Feeding
America’s annual campaign.
Additionally, we partner with the California Community Foundation to provide a method for our staff members
to assist other staff members in need through our The Cheesecake Factory “HELP” fund.
Sustainability
We strive to achieve excellence and quality in everything we do. As a part of this commitment, we continue to
develop a sustainability program that is aligned with our culture and values, is operationally feasible given the
complexity of our restaurants and is financially responsible. We regularly examine all aspects of our business in an effort
to identify, create and implement meaningful and sustained change.
For more information, please visit the “Sustainability” and “Sustainable Sourcing” pages on our website at
www.thecheesecakefactory.com. The contents of our website are not incorporated by reference into this Form 10-K.
Employees
As of January 1, 2019, we employed approximately 38,700 staff members, of which approximately 37,600
worked in our restaurants, approximately 650 worked in our bakery operations and approximately 450 worked in our
corporate center and restaurant field supervision organization. Our staff members are not covered by any collective
bargaining agreements, and we consider our relations with our staff members to be favorable. Our commitment to
people-focused programs and creating a great workplace for all of our staff and managers contributed to The Cheesecake
Factory being named in February 2019, for the sixth year in a row, to Fortune magazine’s list of “100 Best Companies to
Work For®,” among other human resources awards.
Executive Officers of the Registrant
David Overton, age 72, serves as our Chairman of the Board and Chief Executive Officer. Mr. Overton co-
founded our predecessor company in 1972 with his parents, Oscar and Evelyn Overton. He is also a founding member
and director of our Foundation.
David M. Gordon, age 54, was appointed President of the Company in February 2013. Mr. Gordon joined our
Company in 1993 as a Manager and held operational positions, including General Manager, Area Director of Operations,
15
Regional Vice President and Chief Operating Officer prior to his appointment as President. He is also a director of our
Foundation.
Matthew E. Clark, age 49, was appointed Executive Vice President and Chief Financial Officer in 2017. Mr.
Clark joined our Company in 2006 as Vice President of Strategic Planning and most recently oversaw the strategy,
financial planning, treasury and risk management functions as Senior Vice President, Finance and Strategy. Earlier in his
career, Mr. Clark held a number of finance positions of increasing responsibility at Groupe Danone, Kinko’s and The
Walt Disney Company. He is also an advisory director of our Foundation.
Keith T. Carango, age 57, serves as President of The Cheesecake Factory Bakery Incorporated, our bakery
subsidiary. Mr. Carango joined our bakery operations in 1996 to lead manufacturing, and provide continuous
improvement to the bakery operation. In his most recent role of Senior Vice President and Chief Operating Officer, he
oversaw strategic planning, supply chain, manufacturing, distribution, human resources, quality assurance and finance.
Prior to joining the Company, he held manufacturing and finance roles at Frito-Lay, Inc. and Prince Foods.
Scarlett May, age 52, serves as our Executive Vice President, General Counsel and Secretary. Ms. May joined
our Company in 2018, from Brinker International, Inc., where she served as Senior Vice President, General Counsel and
Secretary. Prior to that, she was Senior Vice President, Chief Legal Officer and Secretary for Ruby Tuesday, Inc.
following her earlier career in private practice.
ITEM 1A. RISK FACTORS
An investment in our common stock involves risks and uncertainties. In addition to the information contained
elsewhere in this Annual Report on Form 10-K and other filings that we make with the SEC, you should carefully read
and consider the risks described below before making an investment decision. The occurrence of any of the following
risks could materially harm our business, operating results, earnings per share, financial position, cash flows and/or the
trading price of our common stock (individually and collectively referred to as our “financial performance.”) In addition,
our actual financial performance could vary materially from any results expressed or implied by forward-looking
statements contained in this report, in any of our other filings with the SEC and other communications by us, both
written and oral, depending on a variety of factors, including the risks and uncertainties described below. It is not
possible for us to predict all possible risk factors or the impact these factors could have on us or the extent to which any
one factor, or combination of factors, may materially adversely affect our financial performance.
Risks Related to Our Financial Performance
The impact global and domestic economic conditions have on consumer discretionary spending could negatively
impact our financial performance.
Dining out is a discretionary expenditure that historically has been influenced by domestic and global economic
conditions. These conditions include, but may not be limited to: unemployment, general and industry-specific inflation,
consumer confidence, consumer purchasing and saving habits, credit conditions, stock market performance, home
values, population growth, wage rates and tax policy. Material changes to governmental policy related to domestic and
international fiscal concerns, and/or changes in central bank policies with respect to monetary policy, also could affect
consumer discretionary spending. Any factor affecting consumer discretionary spending may influence customer traffic
in our restaurants and average check, thus potentially having a material impact on our financial performance.
Our inability to grow comparable restaurant sales could materially adversely affect our financial performance.
We strive to increase comparable restaurant sales by improving customer traffic trends and growing average
check. Changes in customer traffic and average check may be impacted by a variety of factors, including, without
limitation: macroeconomic conditions that impact consumer discretionary spending; perception of our concepts’
offerings in terms of quality, price, value and service; increased competition; changes in consumer eating habits; the
evolving retail landscape, which is becoming increasingly influenced by technology and a growing consumer preference
for convenience, value and experience; adverse weather conditions; demographic, economic and other adverse changes
in the trade areas in which our restaurants are located and changes in the regulatory environment.
16
We compete directly and indirectly for customer traffic with national and regional casual dining restaurant
chains, as well as independently-owned restaurants. In addition, we face competition for customer traffic from fast
casual and quick-service restaurants, home delivery services, mobile food service, grocery stores and meal kits that are
increasing the quality and variety of their food products in response to customer demand. This increased competition,
coupled with an oversupply of restaurants, has driven casual dining industry comparable traffic declines in recent years.
This backdrop has made it even more challenging to improve customer traffic. We believe that many consumers remain
focused on value and if our competitors, many of whom have significantly greater resources to market aggressively to
customers, are able to promote and deliver a higher degree of perceived value, our customer traffic could suffer.
We utilize menu price increases to help offset inflation of key operating costs. However, our menu price
increases may be insufficient to entirely absorb or offset increased costs and, if not accepted by customers, menu price
increases could result in reduced customer traffic.
Our menu mix could be materially adversely affected if our customers purchase fewer menu items or lower cost
menu items in order to reduce their check spend. Unfavorable menu mix shifts could reduce average check, negatively
impacting our ability to grow comparable restaurant sales.
If our efforts to grow comparable restaurant sales are not successful, the effect, over time, would be to spread
costs across a lower level of sales, which could materially adversely affect our financial performance.
If we are unable to protect our reputation, the value of our brands and sales at our restaurants may be negatively
impacted, which may materially adversely affect our financial performance.
Our greatest asset is the value of our brands, which is directly linked to our reputation. We must protect our
reputation in order to continue to be successful and to grow the value of our brands domestically and internationally.
Negative publicity directed at any of our brands, regardless of factual basis, such as, relating to food quality,
restaurant facilities, customer complaints or litigation alleging injury or food-borne illnesses, food tampering or
contamination or poor health inspection scores, sanitary or other issues with respect to food processing by us or our
suppliers, the condition of our restaurants, labor relations, any failure to comply with applicable regulations or standards,
allegations of harassment, politically motivated accusations or other negative publicity, could damage our reputation.
These concerns are exacerbated by the speed with which negative information may now be disseminated through social
media. (See Item 1A — Risk Factors — “Any inability to effectively use and manage social media, could harm our
marketing efforts as well as our reputation, which could materially adversely affect our financial performance.”)
Negative publicity about us could harm our reputation and damage the value of our brands, which could materially and
adversely affect our financial performance.
We are experiencing significant labor cost inflation. If we are unable to offset higher labor costs, our cost of doing
business will materially adversely impact our financial performance.
Increases in minimum wages and minimum tip credit wages, extensions of personal and other leave policies,
other governmental regulations affecting labor costs and a diminishing pool of potential staff members when the
unemployment rate falls and legal immigration is restricted, especially in certain localities, could significantly increase
our labor costs and make it more difficult to fully staff our restaurants, either of which could materially adversely affect
our financial performance.
We operate in many jurisdictions where the minimum wage, other mandated benefits and labor, wage and hour
laws, require significantly more from employers than what is required under United States federal requirements. Some
jurisdictions allow tipped staff members to be paid a lower tip credit wage that is supplemented by gratuities paid by
customers. Many jurisdictions, including the United States federal and state governments, either have or plan to
significantly increase their minimum wage, tip credit wage and other benefits requirements. In addition to increasing the
overall wages paid to our minimum wage and tip credit wage earners, these increases create pressure to increase wages
and other benefits paid to other staff members who, in recognition of their tenure, performance, job responsibilities and
other similar considerations, historically received a rate of pay exceeding the applicable minimum wage or minimum tip
credit wage. Because we employ a large workforce, minimum wage and tip credit wage increases, as well as expanding
benefits mandates, have a particularly significant impact on our labor costs. Our vendors, contractors and business
partners are similarly impacted by wage and benefit cost inflation, and many have or will increase their price for goods,
17
construction and services in order to offset their increasing labor costs. We expect these trends will continue as minimum
wages and minimum tip credit wages continue to rise and other benefits are mandated.
Our labor expenses include a significant amount of costs related to our self-insured health, pharmacy and dental
benefit plans. Health care costs continue to rise and are especially difficult to project, as well as very expensive new
specialty pharmaceutical products. Material increases in costs associated with medical claims, or an increase in the
severity or frequency of such claims, may cause health care costs to vary substantially from quarter-to-quarter and year-
over-year. We offer a variety of health plans to our staff members, including lower cost high deductible health plans,
with an option for participants to contribute to a personal health savings account. However, given the unpredictable
nature of actual health care claims trends, including the severity or frequency of claims, in any given year our health care
costs could significantly exceed our estimates, which could materially adversely affect our financial performance.
A great deal of uncertainty exists with respect to the future of the Patient Protection and Affordable Care Act as
amended by the Health Care and Education Affordability Reconciliation Act of 2010 (the “PPACA”) and such
uncertainty makes planning difficult year over year. Any significant changes to the healthcare insurance system,
including a further dismantling of the PPACA in whole or in part and/or implementation of a supplementary and/or
replacement healthcare insurance system, could impact our healthcare costs. Material increases in healthcare costs could
materially adversely affect our financial performance.
While we try to offset labor cost increases through price increases, more efficient purchasing practices,
productivity improvements and greater economies of scale, there can be no assurance that these efforts will be
successful. If we are unable to effectively anticipate and respond to increased labor costs, our financial performance
could be materially adversely affected.
Our inability to anticipate and react effectively to changes in the costs of key operating resources may increase
our cost of doing business, which may materially adversely affect our financial performance.
We negotiate short-term and long-term agreements for some of our principal commodity, supply and equipment
requirements, such as certain dairy products and poultry, depending on market conditions and expected demand. We
continue to evaluate the possibility of entering into similar arrangements for other commodities and also periodically
evaluate hedging vehicles, such as direct financial instruments, to assist us in managing risk and variability associated
with such commodities. Although these vehicles may be available to us, as of the end of fiscal 2018, we had chosen not
to enter into any hedging contracts due to pricing volatility, excessive risk premiums, hedge inefficiencies or other
factors. Commodities for which we have not entered into contracts can be subject to unforeseen supply and cost
fluctuations, which at times may be significant. Additionally, the cost of commodities subject to governmental
regulation, such as dairy and corn, can be especially susceptible to price fluctuation. Commodities we purchase on the
international market may be subject to even greater fluctuations in cost and availability, which could result from a
variety of factors, including the value of the U.S. dollar relative to other currencies, international trade disputes, tariffs
and varying global demand.
While we strive to engage in a competitive bidding process for our principal commodity, supply, service and
equipment requirements, because certain of these products and services may only be available from a few vendors or
service providers, we may not always be able to do so. Because of this lack of competition, we may be vulnerable to
excessive price demands, especially as they relate to the cost of products or services that are critical to our operations or
profitability.
Certain products and ingredients commonly used in food preparation have recently come under scrutiny for
possibly posing social and environmental risks, such as from an animal welfare and sustainability perspective. We have
identified some of these products and ingredients in our supply chain and have adopted a comprehensive Sustainable
Sourcing Policy under which we commit to a buying preference in our supply by 2025, or sooner where practicable, for
products and ingredients that are sustainably grown and harvested and which do not have negative social impact, and for
products from animals that are humanely raised and processed (“sustainable products”). While we are committed to
implementing these changes in as timely and commercially feasible manner as possible, there is a risk that some of our
products or ingredients may become the subject of adverse media attention before we are able to do so, regardless of
factual basis. Additionally, while we make significant efforts to ensure we will have a sufficient ongoing supply of
sustainable products at a reasonable cost, since there is currently a smaller market for certain of these products, they may
18
be especially susceptible to cost volatility and supply fluctuations. We cannot be certain that our supply and cost
mitigation efforts or commitment to purchase sustainable products will be successful.
Our international licensees are also subject to commodity price fluctuations. While they too employ strategies to
mitigate the impact these fluctuations have on their business, neither we nor they can be assured such strategies will be
successful. Commodity price fluctuations could impede our international licensees’ profitability and hamper their ability
to grow, which could negatively impact our ability to expand our brand internationally.
For all of these reasons, our financial performance could be materially adversely affected if we are unable to
anticipate and effectively respond to increases in our operating costs.
Our financial performance could be materially adversely affected if we fail to retain, or effectively respond to a
loss of, key executives.
The success of our business continues to depend in critical respects on the contributions of David Overton, our
founder, Chairman of the Board and Chief Executive Officer, and other senior executives of the Company. The
departure of Mr. Overton or other senior executives for any reason could have a material adverse effect on our business
and long-term strategic plan. We have a succession plan that includes short-term and long-term planning elements
intended to allow us to successfully continue operations should any of our senior management become unavailable to
serve in their respective roles. However, there is a risk that we may not be able to implement the succession plan
successfully or in a timely manner or that the succession plan will not result in the same financial performance we
currently achieve under the guidance of our existing executive team.
If we are unable to successfully recruit and retain qualified restaurant management and operating personnel in
an increasingly competitive market, we may be unable to effectively operate and grow our business and revenues,
which could materially adversely affect our financial performance.
We must continue to attract, retain and motivate a sufficient number of qualified management and operating
personnel to maintain consistency in the quality of our restaurants, both domestically and internationally. Qualified
management and operating personnel are currently in high demand. If we are unable to attract and retain qualified
people, our restaurants could be short staffed, we may be forced to incur overtime expenses, and our ability to operate
and expand our concepts effectively could be limited, any of which could materially adversely affect our financial
performance.
Concerns relating to food safety, food-borne illness, pandemics and other diseases could reduce customer traffic
to our restaurants, or cause us to be the target of litigation, which could materially adversely affect our financial
performance.
We face food safety risks, including the risk of food-borne illness and food contamination (including allergen
cross contamination), which are common both in the restaurant industry and the food supply chain. While we dedicate
substantial resources and provide training to ensure the safety and quality of the food we serve, these risks cannot be
completely eliminated. Additionally, we rely on our network of suppliers to properly handle, store and transport our
ingredients for delivery to our restaurants. Any failure by our suppliers, or their suppliers, could cause our ingredients to
be contaminated, which could be difficult to detect and put the safety of our food in jeopardy. We freshly prepare our
menu items at our restaurants, which may put us at greater risk for food-borne illness and food contamination outbreaks
than some of our competitors who use processed foods or commissaries to prepare their food. The risk of food-borne
illness also may increase whenever our menu items are served outside of our control, such as by third-party food
delivery services, customer take out or at catered events.
Adverse publicity or news reports, regardless of accuracy, regarding food quality or safety issues, illness, injury,
recalls, health concerns, government or industry findings concerning food products served by us or our licensees, or
issues stemming from the operation of our restaurants or bakeries, restaurants operated by our licensees, third parties
with whom we may co-brand products or who sell or distribute our products, or third parties we may use to procure
materials used in our business, or generally in the food supply chain, could be damaging to the restaurant industry
overall and specifically harm our brand and reputation, which in turn could materially adversely affect our financial
performance.
19
If a pathogen, such as Ebola, “mad cow disease,” “SARS,” “swine flu,” avian influenza, norovirus or other virus
or bacteria, such as salmonella or E.coli, or if parasites or other toxins infect the food supply (or are believed to have
infected the food supply), the demand for and availability and price of certain food items may be adversely impacted.
Additionally, if our customers or staff members become infected with a pathogen which was actually or claimed to be
contracted at our restaurants, customers may avoid our restaurants and/or it may become difficult to adequately staff our
restaurants. Any adverse food safety occurrence may result in litigation against us. Although we carry liability and other
insurance coverage to mitigate costs we may incur as a result of these risks, not all risks of this nature are fully insurable
and, even if insured, the negative publicity associated with such an event could damage our reputation and materially
adversely affect our financial performance.
In addition to selling products throughout the world through various distribution channels, including, without
limitation, supermarkets, mass market retailers, club stores and various other food service and retail channels, our two
bakery facilities are the only sources of most of our baked desserts to our restaurants. If any of our bakery products
becomes subject to a product recall or market withdrawal, whether voluntary or involuntary, our costs to conduct such
recall or market withdrawal could be significant, restaurant sales as well as third-party sales of bakery product could be
negatively impacted and our reputation could be damaged, any of which could materially adversely affect our financial
performance.
In addition, any adverse food safety event could result in mandatory or voluntary product withdrawals or recalls,
regulatory and other investigations, and/or criminal fines and penalties, any of which could disrupt our operations,
increase our costs, require us to respond to findings from regulatory agencies that may divert resources and assets, and
result in potential civil fines and penalties as well as other legal action, any of which could materially adversely affect
our financial performance.
Information technology system failures or breaches of our network security could interrupt our operations and
subject us to increased operating costs, as well as to litigation and other liabilities, any of which could materially
adversely affect our financial performance.
We rely heavily on our in-restaurant and enterprise-wide computer systems and network infrastructure across our
operations (“Cyber Environment”), which could be vulnerable to various risks. The efficient management of our
operations depends upon our ability to protect our Cyber Environment against damage from physical theft, casualties
such as fire, power loss, telecommunications failure or other catastrophic events, as well as from internal and external
security breaches, denial of service attacks, viruses, worms, malware, breaches of the algorithms we and our third-party
service providers use to encrypt and protect data, including customer transaction and credit card data, and other
malicious or disruptive events (collectively, “security incidents”). We employ both internal resources and external
consultants to conduct auditing and testing for weaknesses in our Cyber Environment to reduce the likelihood of any
security incident. In addition, we developed a multi-discipline security incident response plan to help ensure that our
executives are fully and accurately informed and manage, with the help of content experts, the discovery, investigation
and auditing of, and recovery from any security incidents. However, we can provide no assurance that these measures
will be successful in preventing losses in the event of a security incident.
Our international licensees have access to certain elements of our intellectual property within their Cyber
Environment and may not have developed adequate processes to secure their Cyber Environments against a security
incident and may not maintain robust discovery, investigation, auditing or recovery protocols, or have the ability to
promptly and effectively respond to a security incident. Available cyber-risk insurance coverage and policy limits may
not adequately cover or compensate us in the event of a security incident. Our financial performance may be materially
adversely affected if our operations are interrupted by a security incident from which we are not able to promptly and
fully recover, if any cyber-risk insurance is unable to fully address our losses and/or if we become subjected to litigation
or regulatory action because of such an incident.
Our inability to maintain a secure environment for customers’ and staff members’ personal data could harm our
reputation and result in litigation against us, which could materially adversely affect our financial performance.
We receive and maintain certain personal information about our customers and staff members. For example, we
transmit confidential credit card information in connection with credit card transactions, and we are required to collect
and maintain certain personal information in connection with our employment practices, including the administration of
our benefit plans. Our collection and use of this information may be regulated by U.S. federal, state and local and foreign
20
laws and regulations. If a security incident were to occur involving loss of or inappropriate access to or dissemination of
such personal information, we may become liable under applicable law for damages (including statutory damages) and
incur penalties and other costs to remedy such an incident. Depending on the facts and circumstances of such an
incident, these damages, penalties and costs could be significant and may not be covered by insurance or could exceed
our applicable insurance coverage limits. Such an event also could harm our reputation and result in litigation against us.
Any of these results could materially adversely affect our financial performance.
Our ability to accept credit cards as a form of payment depends on us remaining compliant with standards set by
the PCI Security Standards Council (PCI). These standards require certain levels of Cyber Environment security and
procedures to protect our customers’ credit card and other personal information. We continue to evaluate additional
security enhancements and have implemented end-to-end encryption and tokenization technology, public key
infrastructure that only permits known computing assets access to our network and Intrusion Detection and Intrusion
Prevention (IDS/IPS) that scans data in transit detecting and preventing the execution of harmful code. However, we can
provide no assurance that our security measures will be successful in the event of an attempted or actual security
incident. If these security measures are not successful, we may become subject to litigation or the imposition of
regulatory penalties, which could result in negative publicity and significantly harm our reputation, either of which could
materially adversely affect our financial performance.
If any of our third-party vendors experiences a failure that affects a significant aspect of our business, we may be
subject to certain risks and may experience data loss, increased costs or other harm, any of which could
materially adversely affect our financial performance.
In order to leverage our internal resources and information technology infrastructure, and to support our business
continuity and disaster recovery planning efforts in the event of a physical loss or damage to our corporate facilities, we
utilize third-party vendors to assist us with some of our essential business processes. For example, we rely on a network
of third-party distribution warehouses to deliver ingredients and other materials to our restaurants. In some instances,
these processes rely on technology and may be outsourced to the vendor in their entirety and in other instances we utilize
these vendors’ externally-hosted business applications.
We also utilize third parties to provide gift card distribution and transaction processing services and to perform
food delivery services. We derive substantial revenue from these aspects of our business, which could suffer in the event
of any factor that adversely impacts our vendors’ ability to provide such services. Such factors may include, without
limitation, loss of, or significant change in contractual terms of, key vendor contracts, vendor or processor failures,
technology failures, damage to the reputation of any key vendor or other similar occurrences.
We continue to review options to expand the use of third-party providers in other areas. Our practice is to work
with service providers that are leading performers in their industries and with technology vendors that employ up to date
and appropriate data security practices and internal control practices. However, we cannot guarantee that failures will not
occur. The failure of third-party vendors to provide adequate services, including protection of sensitive data, could
significantly harm our operations and reputation, which could materially adversely affect our financial performance.
We may incur additional costs if we are unable to renew our restaurant leases on similar terms and conditions, or
at all, or to relocate our restaurants in certain trade areas, which could materially adversely affect our financial
performance.
We currently lease all of our restaurant premises and, although we may consider other arrangements, we
currently plan to continue to lease our restaurant locations in the future. Some of our leases have terms that will expire in
the next few years and beyond. Many of these leases include renewal options; some do not. While lease expirations
allow us to opportunistically evaluate the possibility of relocating certain restaurants to higher quality sites and trade
areas over time, doing so may involve additional costs, such as increased rent and other expenses related to renegotiating
the terms of occupancy of an existing lease, and the costs to relocate and develop a replacement restaurant if we choose
not to renew a lease, or are unable to do so, on favorable terms in a desirable location. In addition, we may elect to
terminate certain leases prior to their expiration dates, and we may be unable to negotiate favorable terms for such early
terminations. Additional costs related to expiring restaurant lease terms, our inability to terminate certain restaurant
leases under favorable terms or the unavailability of suitable replacement locations could materially adversely affect our
financial performance.
21
Any inability to effectively use and manage social media could harm our marketing efforts as well as our
reputation, which could materially adversely affect our financial performance.
Social media provides a powerful medium for consumers, staff members and others to communicate their
approval of or displeasure with a business. This aspect of social media is especially challenging because it allows any
individual to reach a broad audience with an ability to respond or react, in near real time, with comments that are often
not filtered or checked for accuracy. If we are unable to quickly and effectively respond, any negative publicity could
“go viral” causing nearly immediate and potentially significant harm to our brand and reputation, whether or not
factually accurate.
Our marketing strategy includes an emphasis on social media. As social media continues to grow in popularity,
many of our competitors have expanded and improved their use of social media, making it more difficult for us to
differentiate our social media messaging. As a result, we need to continuously innovate and develop our social media
strategies.
If we do not appropriately use and manage our social media strategies, our marketing efforts in this area may not
be successful, and any failure to effectively respond to negative or potentially damaging social media, whether accurate
or not, could damage our reputation, which could materially adversely affect our financial performance.
Our failure to adequately protect our intellectual property could materially adversely affect our financial
performance.
We own and have applied to register trade names, logos, service marks, trademarks, copyrights and other
intellectual property (collectively, “Intellectual Property”), including The Cheesecake Factory®, The Cheesecake Factory
Bakery®, The Cheesecake Factory At Home® Grand Lux Cafe®, Rock Sugar Pan Asian Kitchen®, RockSugar Southeast
Asian Kitchen®, and Social Monk Asian KitchenTM in the United States and in additional countries throughout the world.
Our Intellectual Property is valuable to our business and requires continuous monitoring to protect. We regularly and
systemically search for misappropriations of our Intellectual Property and seek to enforce our rights whenever
appropriate to do so; however, we cannot be assured of success in every case and cannot possibly find all infringing uses
of our Intellectual Property. Furthermore, we have not registered all of our Intellectual Property throughout the world, as
doing so may not be feasible because of associated costs, various foreign trademark law prohibitions or registrations by
others. Our failure or inability to protect our Intellectual Property worldwide could limit our ability to globally expand
our brand.
Our inability to effectively protect our Intellectual Property domestically or internationally could cause our
customers to believe lesser quality products or services are ours, may reduce the capacity of our Intellectual Property to
uniquely identify our products and services and/or may limit our ability to globally expand our brand, any of which
could materially adversely affect our financial performance.
We face a variety of risks and challenges related to our international operations and global brand development
efforts that could materially adversely affect our financial performance.
International operations have a unique set of risks and challenges that differ from country to country, and can
include, among other risks, political instability, governmental corruption, social, religious and ethnic unrest, anti-
American sentiment, delayed and potentially less effective ability to respond to a crisis occurring internationally,
changes in global economic conditions (such as currency valuation, disposable income, climate change, unemployment
levels and increases in the prices of commodities and labor), the regulatory environment, immigration, labor and pension
laws, income and other taxes, consumer preferences and practices, as well as changes in the laws and regulations
governing foreign investment, joint ventures or licensing arrangements in countries where our restaurants or licensees
are located and local import controls.
Operations at our international Company-owned and licensed restaurants may be negatively affected by factors
outside of our control, including, but not limited to:
• difficulties in achieving the consistency of product quality and service as compared to restaurants we operate in
the United States;
• changes to our recipes required by cultural norms;
22
• inability to obtain, at a reasonable cost, adequate and reliable supplies of ingredients and products necessary to
execute our diverse menu;
• availability of experienced management to operate international restaurants according to our domestic standards;
• changes in economic conditions of our licensees, whether or not related to the operation of our restaurants;
• differences, changes or uncertainties in economic, regulatory, legal, immigration, social, climatic, and political
conditions, including the possibility of terrorism, social unrest, trade embargos and/or trade restrictions, which
may result in periodic or permanent closure of foreign restaurants, affect our ability to supply our international
restaurants with necessary supplies and ingredients and affect international perception of our brand;
• foreign currency exchange rate fluctuations; and
• currency fluctuations, trade restrictions, taxes or tariffs adversely affecting our or our licensees’ ability to import
goods from the United States and other parts of the world that are required for operating our branded restaurants,
including our cakes which are wholly manufactured in the United States.
Our international licensees are authorized to operate The Cheesecake Factory® restaurant concept in licensed
trade areas using certain of our Intellectual Property, including our proprietary systems. We provide extensive and
detailed training to our licensees so their staff members may be able to effectively execute our operating processes and
procedures and periodically audit their performance and adherence to our requirements. However, because we do not
operate these restaurants directly, we can provide no assurance that our licensees will adhere to our operating standards
to the same extent as we would.
If we or our licensees fail to effectively operate our international restaurants, or if we or they fail to receive an
adequate return on investment, and these difficulties are attributed to us or our brand, our reputation and brand value
could be harmed, our revenues from these restaurants could be diminished and our international growth may be slowed,
any of which could materially adversely affect our financial performance.
In order to support our international expansion, our bakeries supply certain of our bakery products to our branded
international restaurants. In order to supply bakery products to restaurants in other countries, we may be required to
adapt certain recipes to eliminate locally prohibited ingredients, comply with labeling requirements that differ from those
in the United States and maintain certifications required to export to such countries. In addition, unexpected events
outside of our control, such as, without limitation, trade restrictions, import and export embargos, governmental
shutdowns and disruptions in shipping, may affect our ability to transport adequate levels of our bakery products to our
or our licensee’s international restaurants, for which we are the sole source of supply. A failure to adequately supply
bakery products to our or our licensee’s international restaurants could affect the customer experience at those
restaurants, resulting in decreased sales, and could, depending upon the reason for the failure, trigger contractual defaults
on our part, any of which could materially adversely affect our financial performance.
As we continue to expand our brand internationally, we must comply with regulations and legal requirements,
including those related to immigration and the protection of our Intellectual Property. Additionally, we must comply
with domestic laws affecting U.S. businesses that operate internationally, including the Foreign Corrupt Practices Act
and anti-boycott laws, and with foreign laws in the countries in which we expand our restaurants. (See Item 1A — Risk
Factors —“Changes in, or any failure to comply with, applicable laws or regulations could materially adversely affect
our ability to operate our restaurants and/or increase our cost to do so, which could materially adversely affect our
financial performance.”) We may incur considerable liability in the event we or our licensees fail to comply with foreign
or domestic laws relating to our or their operation of any international restaurant and can provide no assurance that our
insurance programs or contractual indemnification rights would be effective to protect against such liabilities.
Our strategic relationship with FRC might not yield the anticipated benefits, and we may lose some or all of our
investment, which could materially adversely affect our financial performance.
During fiscal 2016, we entered into a strategic relationship with FRC with respect to two of its brands, North
Italia and Flower Child. Under the terms of the applicable agreements, we made initial minority equity investments in,
and have and will continue to provide additional growth capital for, these concepts. We have the right, and an obligation
if certain financial, legal and operational conditions are met, to acquire the remaining interest in North Italia in fiscal
2019 and Flower Child in fiscal 2021. Based on North Italia’s current performance, we are likely to acquire the
remaining interest in the concept at the end of the third quarter of 2019. We currently do not anticipate having the right
or obligation to acquire the remaining interest in Flower Child until the end of the third quarter of fiscal 2021.
23
We will incur significant cost to acquire either or both of North Italia and/or Flower Child. Funding such an
acquisition could affect our capital allocation strategy, potentially impacting our decisions with respect to growth capital
allocations and how aggressively we pursue our share repurchase program and debt payments.
Inherent in our investment is a risk that either or both concepts will not be successful or will fail to perform as
we projected. In any such event, we may not realize return on investment at least equal to that which we would have
realized through other opportunities and we risk losing some or all of our investment. There can be no assurance that we
will acquire either majority or full ownership of either concept. If we do eventually acquire either or both concepts, we
may be unable to successfully integrate the business(es) into our operations, and there can be no assurance that we will
realize the benefits we anticipate in connection with such an acquisition. If we lose some or all of our investment in one
or both of these concepts, our financial performance could be materially adversely affected.
We are selectively pursuing and continue to evaluate developing, investing in or acquiring new restaurant
concepts, expansion of The Cheesecake Factory At Home® brand to other retail opportunities and other
initiatives which may create risks to our business that could materially adversely affect our financial
performance.
We are selectively pursuing and continue to evaluate other means to leverage our competitive strengths,
including developing, investing in or acquiring new restaurant concepts, expansion of our brands to other retail
opportunities and/or other initiatives. Many risks are inherent in any such development, investment arrangement,
acquisition, expansion of our brand or other initiative, including, without limitation:
• damaging our reputation if retail products bearing our brand are not of the same value and quality that our
customers associate with our brand;
• dilution of the goodwill associated with our brand as it becomes more common and increasingly accessible;
• inaccurate assessment of value, growth potential, weaknesses, liabilities, contingent or otherwise, and expected
profitability of such ventures;
• inability to achieve any anticipated operating synergies or economies of scale;
• potential loss of key personnel of any acquired business;
• challenges in successfully integrating, operating and managing an acquired business or venture and its
workforce;
• difficulties in aligning enterprise management systems, compensation and benefit plans and policies and
procedures;
• unforeseen changes in the market and economic conditions affecting the acquired business or venture;
• possibility of impairment charges if an acquired business or venture does not meet the performance
expectations upon which the acquisition price was based; and
• diversion of management’s attention and focus from existing operations to the integration of the acquired or
merged business and its personnel or to the expansion of the brand to non-restaurant items.
If we do not appropriately scale our infrastructure in a timely manner we may be unable to respond to and
support our domestic or international opportunities for growth, which could materially adversely affect our
financial performance.
We continually evaluate the appropriate level of infrastructure necessary to support our operational and
development plans, including our domestic and international expansion. If market conditions improve and we are able to
identify enough high-quality sites to significantly increase the planned number of new restaurant openings in the future,
we may be unable to scale or manage the growth of our corporate and field supervision infrastructure in the short term to
appropriately support our expansion. Likewise, if sales decline, we may be unable to reduce our infrastructure quickly
enough to prevent sales deleveraging. Either circumstance could materially adversely affect our financial performance.
Our international license agreements require us to provide training and support to our licensees for their
development and operation of The Cheesecake Factory restaurants. We have dedicated certain corporate personnel to
international development and continue to utilize the talents of existing management, as we grow our international
licensing and operations infrastructure. In addition, one of the most important aspects of our restaurant operations is our
ability to deliver dependable, quality service by experienced staff members who can execute our concepts according to
our high standards. This may require training our licensees’ management in the United States and our licensees’ staff
members in the licensed territories, as well as providing support in the selection and development of restaurant sites,
24
product sourcing logistics, technological systems, menu modification and other areas. If, for any reason, we are unable to
provide the appropriate level of infrastructure support to our international licensees, our licensee’s operations could
suffer, which could make it more difficult for us to grow our brand internationally and materially adversely affect our
financial performance.
We may be required to record impairment charges, be unable to fully recoup landlord improvement allowances
and/or decide to discontinue operations at certain restaurants, any of which could materially adversely affect our
financial performance.
We assess the potential impairment of our long-lived assets on an annual basis or whenever events or changes in
circumstances indicate the carrying value of the assets or asset group may not be recoverable. Factors considered
include, but are not limited to, negative cash flow, significant underperformance relative to historical or projected future
operating results, significant changes in the manner in which an asset is being used, an expectation that an asset will be
disposed of significantly before the end of its previously estimated useful life and significant negative industry or
economic trends. At any given time, we may be monitoring certain locations, and future impairment charges and/or
closures may occur if individual restaurant performance does not improve, which could materially adversely affect our
financial performance.
A portion of our tenant allowances at certain premises may be subject to recoupment against percentage rent
otherwise payable for such sites. When we are unable to achieve sales in a sufficient amount to generate percentage rent
obligations, we are not able to fully recoup available allowances at affected sites, which also could materially adversely
affect our financial performance.
Our inability to secure an adequate number of high-quality sites for future restaurant openings could adversely
affect our ability to grow our business.
Our ability to grow our business depends on the availability and selection of high-quality sites that meet our
criteria. The number and timing of new restaurants opened during any given period, and their associated contribution to
the growth of our business, will depend on a number of factors including, but not limited to:
• unforeseen delays due to market conditions;
• the identification and availability of high-quality locations;
• an increase in competition for available premier locations;
• the influence of consumer shopping trends on the availability of sites in traditional locations, such as premier
shopping centers;
• acceptable lease terms and the lease negotiation process;
• the availability of suitable financing for our landlords;
• the financial viability of our landlords;
• timing of the delivery of the leased premises to us from our landlords in order to perform build-out construction
activities;
• the ability of our landlords and us to obtain all necessary governmental licenses and permits, and consents of
third parties, on a timely basis to construct and operate our restaurants;
• our ability to successfully manage the complex design, construction and preopening processes for our highly
customized restaurants;
• the availability and/or cost of raw materials and labor used in construction;
• the availability of qualified tradespeople in the local market;
• any unforeseen engineering or environmental problems with the leased premises; and
• adverse weather or other delays during the construction period.
Our failure to effectively operate Grand Lux Cafe or RockSugar Southeast Asian Kitchen could materially
adversely affect our financial performance.
In addition to our The Cheesecake Factory concept, we have developed and currently operate restaurants under
the Grand Lux Cafe® and RockSugar Southeast Asian Kitchen® brands. While all of our restaurants are subject to risks
and uncertainties, there is an enhanced level of risk and uncertainty associated with less established brands, which could
25
result in loss of investment and operating losses, either of which could materially adversely affect our financial
performance.
Changes in, or any failure to comply with, applicable laws or regulations could materially adversely affect our
ability to operate our restaurants and/or increase our cost to do so, which could materially adversely affect our
financial performance.
We are required to comply with various federal, state and local and foreign laws and regulations, including,
without limitation, those relating to alcoholic beverage control, public health and safety, access and use by the disabled,
environmental hazards, labor and employment, such as, equal wage laws and exempt versus non-exempt employee
classifications, data security and food safety and labeling. Changes to these laws or regulations may create challenges for
us. While we subscribe to certain services and have established procedures to identify legal and regulatory changes, we
cannot be absolutely certain to identify and comply with every change on a timely basis. We may incur penalties and
other costs, sanctions and adverse publicity by failing to comply with applicable laws, any of which could materially
adversely affect our financial performance.
Our failure to obtain and/or retain licenses, permits or other regulatory approvals required to operate our business
could delay or prevent the opening and/or continued operation of any of our restaurants or bakeries, materially adversely
affecting that facility’s operations and profitability and our ability to obtain similar licenses, permits or approvals
elsewhere, any of which could materially adversely affect our financial performance.
In certain jurisdictions, we may be subject to “dram shop” statutes that generally allow a person injured by an
intoxicated person the right to recover damages from an establishment that wrongfully served alcoholic beverages to the
intoxicated person. Dram shop litigation may result in significant judgments, including punitive damages. A settlement
or judgment against us under a dram shop statute in excess of our general liability insurance coverage could materially
adversely affect our financial performance.
Significant increases in minimum wages, including the tip credit wage in certain states, paid or unpaid leaves of
absence, equal wage legislation, mandatory sick pay and paid time off regulations in a growing number of jurisdictions,
mandated health and/or COBRA benefits, or increased tax reporting, assessment or payment requirements related to our
staff members who receive gratuities, or changes in interpretations of existing employment law, including with respect to
classification of exempt versus non-exempt employees, could significantly increase our labor costs, which would
materially adversely affect our financial performance.
We are subject to federal and state laws that prohibit discrimination in the workplace and that set standards for
the design, accessibility and operation of public facilities, such as the Americans with Disabilities Act. Compliance with
these laws and regulations can be costly and failure to comply could create exposure to government proceedings and
litigation. Even a perceived failure to comply could result in negative publicity that could damage our reputation and
materially adversely affect our financial performance. In addition, various federal, state and local and foreign labor laws
and regulations govern our operations and relationships with our staff members, including, but not limited to, minimum
wages, breaks, overtime, deductions, certain benefits (including health care benefits), safety, working conditions and
citizenship and legal residency requirements. These requirements also extend to independent third-party service
providers we engage to perform certain services at our restaurants. While we take precautions to ensure that our third-
party service providers comply with applicable laws and to maintain an independent contractor relationship, we cannot
be assured such efforts will be successful, and we may incur liability vicariously as a joint employer for failures by our
independent third-party service providers to comply with applicable laws. Changes in, or any failure to comply with,
these laws and regulations could subject us to fines or other legal actions, which could materially adversely affect our
financial performance.
Despite our efforts to maintain compliance with legal requirements, including implementation of electronic
verification of legal work status, some of our staff members may not meet legal citizenship or residency requirements. In
addition, immigration-related employment regulations may make it more difficult for us to identify and hire qualified
staff members. Our inability to maintain an experienced and qualified work force comprised of individuals who meet all
legal citizenship or residency requirements could result in a disruption in our work force, sanctions against us and
adverse publicity, any of which could materially adversely affect our financial performance.
26
Changes in tax laws and resulting regulations could result in changes to our tax provisions and expose us to
additional tax liabilities that could materially adversely affect our financial performance.
We are subject to income and other taxes in the U.S. and foreign jurisdictions. Changes in applicable U.S. or
foreign tax laws and regulations, such as the December 2017 enactment of Federal legislation commonly referred to as
the Tax Cuts and Jobs Act (the “Tax Act”), or their interpretation and application, including the possibility of retroactive
effect and changes to state tax laws that may occur in response to the Tax Act, could affect our tax expense and
profitability. In addition, the final determination of any tax audits or related litigation could be materially different from
our historical income tax provisions and accruals. Changes in our tax provision or an increase in our tax liabilities,
whether due to changes in applicable laws and regulations, the interpretation or application thereof, or a final
determination of tax audits or litigation, could materially adversely affect our financial performance.
Our inability to respond appropriately to changes in consumer health and disclosure regulations, and to adapt to
evolving consumer dining preferences could negatively impact our operations and competitive position, which
could materially adversely affect our financial performance.
The PPACA requires restaurant operators with twenty or more locations to make certain nutritional information
available to customers. Additionally, some state, local and foreign governments also have enacted legislation regulating
or prohibiting the sale of or mandating disclosures relating to certain types and/or levels of ingredients in food served in
restaurants, such as trans fats, sodium, genetically modified organisms (GMOs) and gluten, and are taxing or considering
taxing and/or otherwise regulating high fat, high sugar and high sodium foods. While it remains unclear if and to what
extent consumers may reconsider dining preferences in response to such requirements, it is clear that consumer dining
preferences continue to evolve and these preferences may evolve more rapidly in light of these new requirements. We
must be able to quickly and effectively adapt to any significant shift in consumer dining preference. Our failure or
inability to do so could cause our or our licensee’s restaurants to lose market share, which could materially adversely
affect our financial performance.
Labor organizing could harm our operations and competitive position in the restaurant industry, which could
materially adversely affect our financial performance.
Our staff members and others may attempt to unionize our workforce, establish boycotts or picket lines or
interrupt our supply chains which could limit our ability to manage our workforce effectively and cause disruptions to
our operations, which could materially adversely affect our financial performance. Our labor costs may significantly
increase if we become unable to effectively manage our workforce and the compensation and benefits we offer to our
staff members, which also could materially adversely affect our financial performance.
If we are unable to manage risks related to our business, costs associated with litigation and insurance could
increase, which could materially adversely affect our financial performance.
We are subject to lawsuits, administrative proceedings and claims that arise in the ordinary course of business.
These matters typically involve claims by customers, staff members and others regarding issues such as food-borne
illness, food safety, premises liability, dram shop liability, compliance with wage and hour requirements, work-related
injuries, discrimination, harassment, disability and other operational issues common to the foodservice industry. We
could be materially adversely affected by negative publicity and litigation costs resulting from these claims, regardless of
their validity. Employment-related litigation, particularly with respect to claims styled as class action lawsuits, are
especially costly to defend. Also, some employment-related claims in the area of wage and hour disputes are not
insurable risks and many employment-related disputes involve uncertainty in judicial interpretation from state to state
and from federal to state court with respect to the effectiveness of arbitration agreements with our staff members,
particularly those which provide for class waivers. We have experienced an increase in wage and hour litigation, in
particular in California, where we have seen an increase in claims filed under California’s Private Attorneys General Act
(“PAGA”). PAGA allows an aggrieved staff member to bring a lawsuit on behalf of other current and former staff
members for labor code violations, including certain technical violations. PAGA claims are not subject to arbitration and
may result in exposure to additional penalties, which can be assessed separately from recovery of attorneys’ fees.
Significant legal fees and costs in complex class action litigation or an adverse judgment or settlement that are not
insured or are in excess of insurance coverage can materially and adversely affect our financial performance.
27
We retain financial responsibility for a significant portion of our risks and associated liabilities with respect to
workers’ compensation, general liability, employment practices, staff health benefits and certain other insurable risks. A
number of factors may significantly increase our self-insurance costs, such as conditions of the insurance market, the
availability of insurance, or changes in applicable regulations. The accrued liabilities associated with these programs are
based on our estimate of the ultimate costs to settle known claims as well as claims incurred but not yet reported to us
(“IBNR”) as of each balance sheet date. Significant judgment is required to estimate IBNR amounts, as parties have yet
to assert such claims. Our financial performance may be materially adversely affected if our actual claims costs
significantly exceed our estimates.
Our inability or failure to execute on comprehensive business continuity and disaster recovery plans following a
major disaster could interfere with our business operations, which could materially adversely affect our financial
performance.
All of our core and critical applications are housed in an external tier 3 data center, which is a location with
redundant and dual-powered servers, storage, network links and other IT components. To mitigate business
interruptions, we employ a disk-based data backup and replication infrastructure between our onsite and external data
centers. We provide support for our restaurant operations, with the exception of design and construction, from our
corporate headquarters in Calabasas, California, an area that is prone to natural disasters such as earthquakes and
wildfires. Corporate support for our bakery operations is also performed from this centralized location. If we are unable
to execute our disaster recovery procedures in whole or in part, we may experience delays in recovery and losses of data,
inability to perform vital corporate functions, tardiness in required reporting and compliance, failures to adequately
support field operations and other breakdowns in normal operating procedures that could expose us to administrative and
other legal claims, any of which could materially adversely affect our financial performance.
A closure of or material damage to one or both of our bakery facilities could impede our ability to supply bakery
products to our own and our international licensees’ restaurants as well as to other bakery customers. Such an incident
could also result in the loss of critical data regarding our bakery operations. Any of these events could materially
adversely affect our financial performance.
Adverse weather conditions, seasonal fluctuations, natural disasters and effects of climate change could
unfavorably impact our restaurant sales, which could materially adversely affect our financial performance.
Adverse weather conditions and natural disasters can impact customer traffic at our restaurants, cause the
temporary underutilization of outdoor patio seating, make it more difficult to fully staff our restaurants and, in more
severe cases, such as hurricanes, earthquakes, tornadoes, blizzards or other natural disasters, cause a temporary inability
to obtain supplies, increase commodity costs and cause closures of our affected restaurants, sometimes for prolonged
periods of time, any of which could materially adversely affect our financial performance. The increasing frequency and
unpredictability of adverse weather conditions may result in decreased customer traffic, less accurate year-to-year
comparisons in sales and other factors affecting financial performance. Our cash flows may be negatively impacted by
delay in the receipt of proceeds under any insurance policies or programs we maintain against certain of these risks or
the proceeds may not fully offset any such losses. Any or all of these situations could materially adversely affect our
financial performance.
Acts of violence at or threatened against our restaurants or the centers in which they are located, including active
shooter situations and terrorism, could unfavorably impact our restaurant sales, which could materially
adversely affect our financial performance.
Any act of violence at or threatened against our restaurants or the centers in which they are located, including
active shooter situations and terrorist activities, may result in restricted access to our restaurants and/or restaurant
closures in the short-term and, in the long-term, may cause our customers and staff to avoid our restaurants. Any such
situation could adversely impact customer traffic and make it more difficult to fully staff our restaurants, which could
materially adversely affect our financial performance.
28
New restaurant openings may negatively impact sales at our existing restaurants, which could materially
adversely affect our financial performance.
The opening of a new restaurant could negatively impact sales at one or more of our existing nearby restaurants,
which could materially adversely affect our financial performance. It is not our intention to open new restaurants that
materially cannibalize existing restaurant sales. However, there can be no assurance that such sales impact will not occur
or become more significant in the future as we increase our presence in existing markets to maximize our competitive
position and financial performance in each market.
Our failure to establish, maintain and apply adequate internal control over our financial reporting and comply
with changes in financial accounting standards or interpretations of existing standards could limit our ability to
report our financial results accurately and timely or to detect and prevent fraud, any of which could materially
adversely affect our financial performance.
We are subject to the ongoing internal control provisions of Section 404 of the Sarbanes-Oxley Act of 2002.
These provisions provide for the identification of material weaknesses in internal control over financial reporting — a
process to provide reasonable assurance regarding the reliability of financial reporting for external purposes in
accordance with accounting principles generally accepted in the United States. There can be no assurance that we will be
able to timely remediate material weakness in internal controls (if any) or maintain all of the controls necessary to
remain in compliance. Any failure to maintain an effective system of internal control over financial reporting could limit
our ability to report our financial results accurately and timely or to detect and prevent fraud, any of which could
materially adversely affect our financial performance. Additionally, changes in accounting standards or new accounting
pronouncements and interpretations could materially adversely affect our previously reported or future financial results,
which could materially adversely affect our financial performance.
Failure to satisfy financial covenants and/or repayment requirements under our credit facility could harm our
financial condition, which could materially adversely affect our financial performance.
We have an unsecured revolving credit facility (the “Facility”) with an available borrowing commitment of $200
million and with a commitment increase feature that could provide for an additional $100 million in available credit,
subject to the lenders’ electing to increase their commitments or by means of the addition of new lenders. At January 1,
2019, we were in compliance with the covenants contained in the Facility and had $10 million outstanding under the
Facility. However, any failure to maintain these debt covenants or have sufficient liquidity to either repay or refinance
the then outstanding balance at expiration of the Facility, or upon violation of the covenants, could materially adversely
affect our financial performance. (See Note 9 of Notes to Consolidated Financial Statements in Part IV, Item 15 for
additional information concerning our long-term debt.)
Risks Related to Owning Our Stock
The market price of our common stock is subject to volatility.
During fiscal 2018, the price of our common stock fluctuated between $41.63 and $60.19 per share. The market
price of our common stock may be significantly affected by a number of factors, including, but not limited to, actual or
anticipated variations in our operating results or those of our competitors as compared to analyst expectations, changes
in financial estimates by research analysts with respect to us or others in the restaurant industry, and announcements of
significant transactions (including mergers or acquisitions, divestitures, joint ventures or other strategic initiatives) by us
or others in the restaurant industry. In addition, the equity markets have experienced price and volume fluctuations that
affect the stock price of companies in ways that have been unrelated to an individual company’s operating performance.
The price of our common stock may continue to be volatile, based on factors specific to our company and industry, as
well as factors related to the equity markets overall.
Our stock price could be adversely affected if our performance falls short of our financial guidance and/or
market expectations.
Our failure to achieve performance consistent with our financial guidance and/or market expectations could
adversely affect the price of our stock. Factors such as comparable restaurant sales that are below our target, slowing
growth of our concepts domestically, our inability to successfully execute other growth opportunities, a decline in
29
growth of our international business, any event that causes our operating costs to substantially increase, including,
without limitation, any of the events described elsewhere in these Risk Factors, or our failure to repurchase stock as
expected or pay or increase our dividend over time, could cause our performance to fall short of our financial guidance
and/or market expectations.
If we are unable to continue to pay, or if we are unable to increase, dividends, our stock price may be harmed.
Our ability to pay and increase our dividends over time will depend on our ability to generate sufficient cash
flows from operations and capacity to borrow funds, which may be subject to economic, financial, competitive and other
factors that are beyond our control. Our Facility limits cash distributions with respect to our equity interests, such as cash
dividends and share repurchases, based on a defined ratio. (See Note 9 of Notes to Consolidated Financial Statements in
Part IV, Item 15 of this report for further discussion of our long-term debt.) Any failure to pay or increase our dividends
over time may negatively impact investor confidence in us, and may negatively impact our stock price.
There may be future sales or other dilution of our equity that may materially adversely affect the market price of
our common stock.
We are not restricted from issuing additional common stock or preferred stock, including any securities that are
convertible into or exchangeable for, or that represent the right to receive, common stock or preferred stock or any
substantially similar securities. Our Board of Directors is authorized to issue additional shares of common stock and
additional classes or series of preferred stock without any action on the part of the stockholders. The Board of Directors
also has the discretion, without stockholder approval, to set the terms of any such classes or series of preferred stock that
may be issued, including voting rights, dividend rights and preferences over the common stock with respect to dividends
or upon the liquidation or winding up of our business and other terms. If we issue preferred shares that have a preference
over our common stock with respect to the payment of dividends or upon liquidation, dissolution or winding up, or if we
issue preferred shares with voting rights that dilute the voting power of our common stock, the rights of our common
stockholders or the market price of our common stock could be materially adversely affected.
Actions of activist investors could negatively impact our business and the value of our stock price.
Publicly-traded companies have increasingly become subject to activist investor campaigns. Responding to
actions of an activist investor may be a significant distraction for our management and staff, and could require us to
expend significant time and resources, including legal fees and potential proxy solicitation expenses. Any of these
conditions could materially adversely affect our financial performance.
ITEM 1B. UNRESOLVED STAFF COMMENTS
Not applicable.
ITEM 2. PROPERTIES
Our corporate support center and one of our bakery production facilities are located in Calabasas Hills,
California. The corporate support center consists of an 88,000 square foot main facility and a 19,000 square foot training
facility on an approximately five acre parcel of land. The bakery production facility is a 60,000 square foot facility on an
approximately three acre parcel of land. Our second bakery facility located in Rocky Mount, North Carolina is a 100,000
square foot facility on an approximately 31 acre parcel of land. Our development and design department is in a 29,000
square foot facility on approximately one acre of land in Irvine, California. All of these properties are owned by the
Company.
As of March 4, 2019, we operated 218 Company-owned restaurants: 201 under The Cheesecake Factory® mark
in 39 states, the District of Columbia, Puerto Rico and Ontario, Canada; 14 under the Grand Lux Cafe® mark in eight
states; two under the RockSugar Southeast Asian Kitchen® mark in California and Illinois; and one under the Social
Monk Asian KitchenTM mark in California. All of our Company-owned restaurants are located on leased properties, and
although may consider fee ownership, we have no current plans to own the real estate underlying our restaurants.
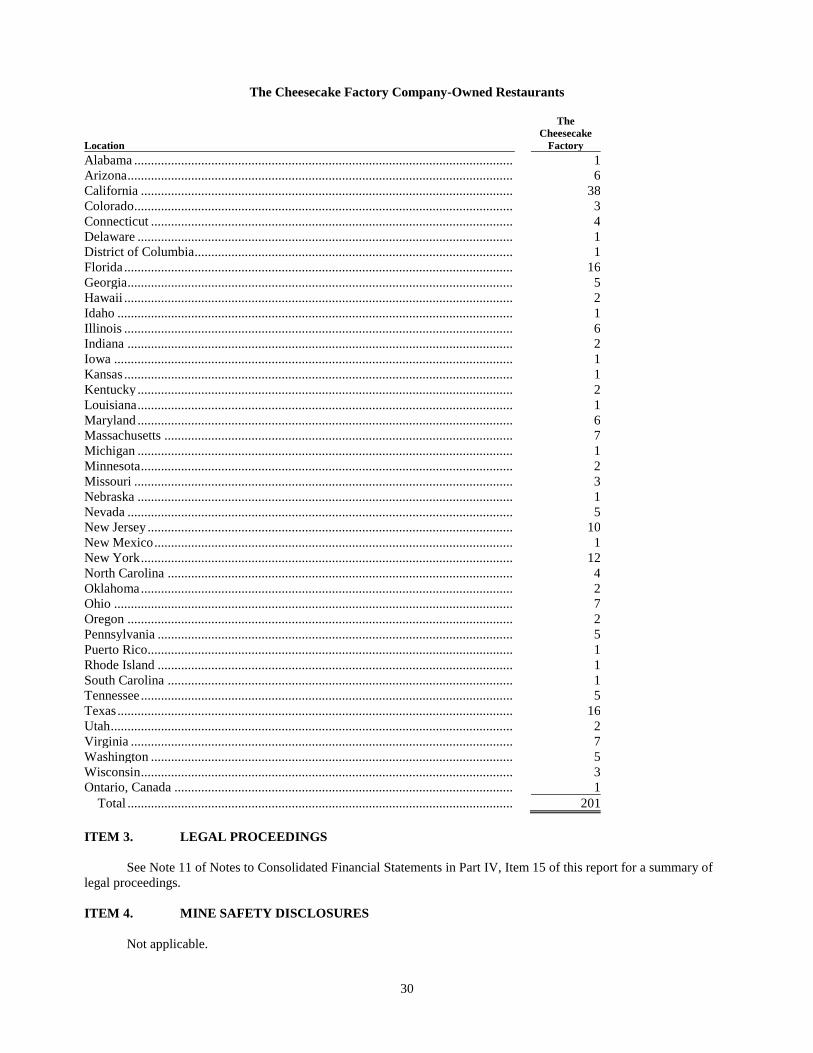
30
The Cheesecake Factory Company-Owned Restaurants
Location
The
Cheesecake
Factory
Alabama ................................................................................................................. 1
Arizona ................................................................................................................... 6
California ............................................................................................................... 38
Colorado ................................................................................................................. 3
Connecticut ............................................................................................................ 4
Delaware ................................................................................................................ 1
District of Columbia............................................................................................... 1
Florida .................................................................................................................... 16
Georgia ................................................................................................................... 5
Hawaii .................................................................................................................... 2
Idaho ...................................................................................................................... 1
Illinois .................................................................................................................... 6
Indiana ................................................................................................................... 2
Iowa ....................................................................................................................... 1
Kansas .................................................................................................................... 1
Kentucky ................................................................................................................ 2
Louisiana ................................................................................................................ 1
Maryland ................................................................................................................ 6
Massachusetts ........................................................................................................ 7
Michigan ................................................................................................................ 1
Minnesota ............................................................................................................... 2
Missouri ................................................................................................................. 3
Nebraska ................................................................................................................ 1
Nevada ................................................................................................................... 5
New Jersey ............................................................................................................. 10
New Mexico ........................................................................................................... 1
New York ............................................................................................................... 12
North Carolina ....................................................................................................... 4
Oklahoma ............................................................................................................... 2
Ohio ....................................................................................................................... 7
Oregon ................................................................................................................... 2
Pennsylvania .......................................................................................................... 5
Puerto Rico............................................................................................................. 1
Rhode Island .......................................................................................................... 1
South Carolina ....................................................................................................... 1
Tennessee ............................................................................................................... 5
Texas ...................................................................................................................... 16
Utah ........................................................................................................................ 2
Virginia .................................................................................................................. 7
Washington ............................................................................................................ 5
Wisconsin ............................................................................................................... 3
Ontario, Canada ..................................................................................................... 1
Total ................................................................................................................... 201
ITEM 3. LEGAL PROCEEDINGS
See Note 11 of Notes to Consolidated Financial Statements in Part IV, Item 15 of this report for a summary of
legal proceedings.
ITEM 4. MINE SAFETY DISCLOSURES
Not applicable.
31
PART II
ITEM 5. MARKET FOR REGISTRANT’S COMMON EQUITY, RELATED STOCKHOLDER MATTERS
AND ISSUER PURCHASES OF EQUITY SECURITIES
Our common stock is traded on the NASDAQ Global Select Market under the symbol CAKE. There were
approximately 1,000 holders of record of our common stock at February 21, 2019, and we estimate there were
approximately 48,000 beneficial stockholders on that date.
Future decisions to pay or to increase or decrease dividends are at the discretion of the Board and will be
dependent on our operating performance, financial condition, capital expenditure requirements, limitations on cash
distributions pursuant to the terms and conditions of our Facility and applicable law, and such other factors that the
Board considers relevant. (See Note 9 and 12 of Notes to Consolidated Financial Statements in Part IV, Item 15 of this
report for further discussion of our long-term debt and stockholders’ equity, respectively and see Item 1A — Risk
Factors — If we are unable to continue to pay, or if we are unable to increase, dividends, our stock price may be
harmed.)
The following table presents our purchases of our common stock during the thirteen weeks ended January 1,
2019 (in thousands, except per share data):
Period
Total
Number
of Shares
Purchased (1)
Average
Price Paid
per Share
Total Number of Shares
Purchased as Part of
Publicly Announced
Plans or Programs
Maximum Number of
Shares that May Yet
Be Purchased Under the
Plans or Programs
October 3 — November 6, 2018 ................... 293 $ 50.36 292 4,936
November 7 — December 4, 2018 ............... 243 49.47 234 4,693
December 5, 2018 — January 1, 2019 .......... 488 44.24 479 4,204
Total .......................................................... 1,024 1,005
(1) The total number of shares purchased includes 18,292 shares withheld upon vesting of restricted share awards
to satisfy tax withholding obligations.
On July 21, 2016, our Board increased the authorization to repurchase our common stock by 7.5 million shares
to 56.0 million shares. Under this and all previous authorizations, we have cumulatively repurchased 51.8 million shares
at a total cost of $1,642.1 million through January 1, 2019, including 1.0 million shares at a cost of $48.4 million during
the fourth quarter of fiscal 2018. Our share repurchase authorization does not have an expiration date, does not require us
to purchase a specific number of shares and may be modified, suspended or terminated at any time. (See Note 12 of
Notes to Consolidated Financial Statements in Part IV, Item 15 of this report for further discussion of our repurchase
authorization and methods.)
Our Facility limits cash distributions with respect to our equity interests, such as cash dividends and share
repurchases, based on a defined ratio. (See Note 9 of Notes to Consolidated Financial Statements in Part IV, Item 15 of
this report for further discussion of our long-term debt.)
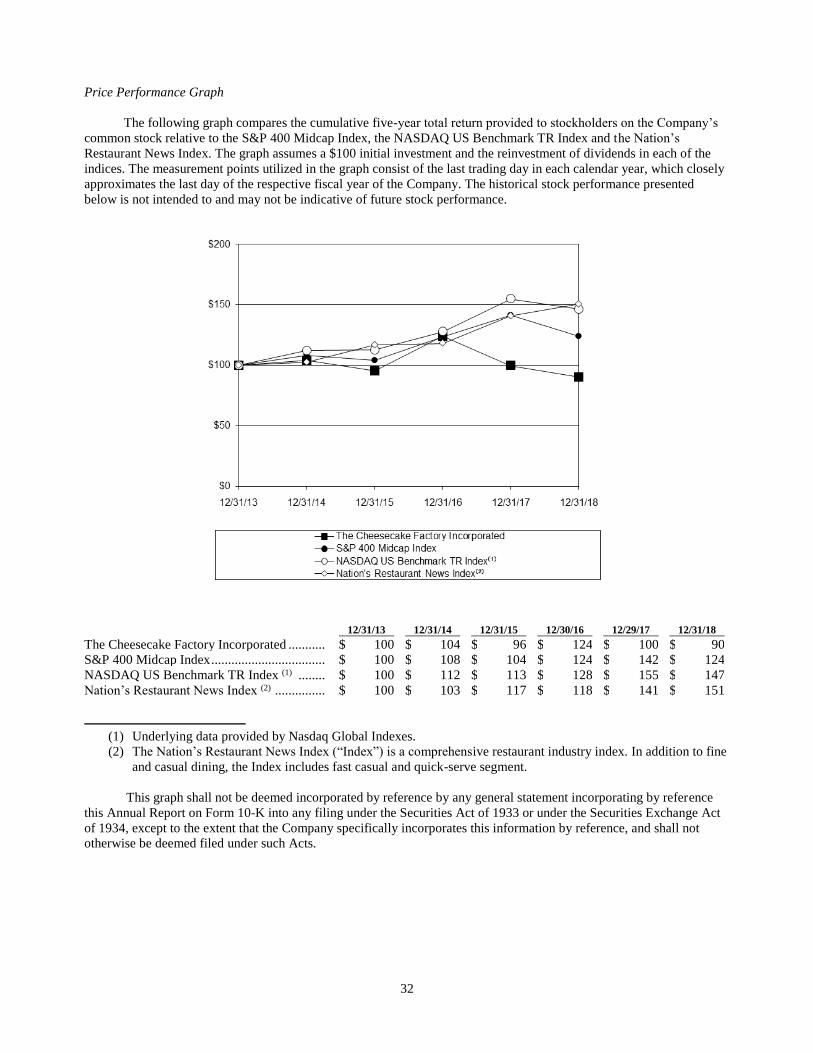
32
Price Performance Graph
The following graph compares the cumulative five-year total return provided to stockholders on the Company’s
common stock relative to the S&P 400 Midcap Index, the NASDAQ US Benchmark TR Index and the Nation’s
Restaurant News Index. The graph assumes a $100 initial investment and the reinvestment of dividends in each of the
indices. The measurement points utilized in the graph consist of the last trading day in each calendar year, which closely
approximates the last day of the respective fiscal year of the Company. The historical stock performance presented
below is not intended to and may not be indicative of future stock performance.
12/31/13 12/31/14 12/31/15 12/30/16 12/29/17 12/31/18
The Cheesecake Factory Incorporated ........... $ 100 $ 104 $ 96 $ 124 $ 100 $ 90
S&P 400 Midcap Index .................................. $ 100 $ 108 $ 104 $ 124 $ 142 $ 124
NASDAQ US Benchmark TR Index (1) ........ $ 100 $ 112 $ 113 $ 128 $ 155 $ 147
Nation’s Restaurant News Index (2) ............... $ 100 $ 103 $ 117 $ 118 $ 141 $ 151
(1) Underlying data provided by Nasdaq Global Indexes.
(2) The Nation’s Restaurant News Index (“Index”) is a comprehensive restaurant industry index. In addition to fine
and casual dining, the Index includes fast casual and quick-serve segment.
This graph shall not be deemed incorporated by reference by any general statement incorporating by reference
this Annual Report on Form 10-K into any filing under the Securities Act of 1933 or under the Securities Exchange Act
of 1934, except to the extent that the Company specifically incorporates this information by reference, and shall not
otherwise be deemed filed under such Acts.
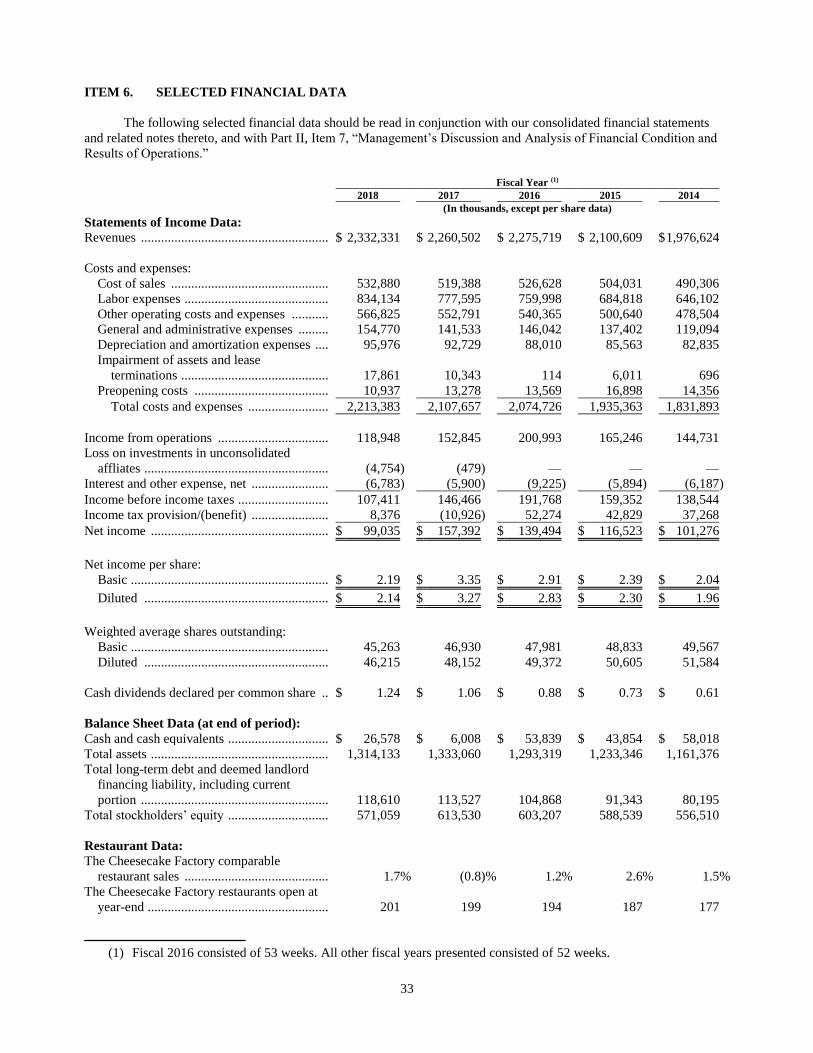
33
ITEM 6. SELECTED FINANCIAL DATA
The following selected financial data should be read in conjunction with our consolidated financial statements
and related notes thereto, and with Part II, Item 7, “Management’s Discussion and Analysis of Financial Condition and
Results of Operations.”
Fiscal Year (1)
2018 2017 2016 2015 2014
(In thousands, except per share data)
Statements of Income Data:
Revenues ........................................................ $ 2,332,331 $ 2,260,502 $ 2,275,719 $ 2,100,609 $ 1,976,624
Costs and expenses:
Cost of sales ............................................... 532,880 519,388 526,628 504,031 490,306
Labor expenses ........................................... 834,134 777,595 759,998 684,818 646,102
Other operating costs and expenses ........... 566,825 552,791 540,365 500,640 478,504
General and administrative expenses ......... 154,770 141,533 146,042 137,402 119,094
Depreciation and amortization expenses .... 95,976 92,729 88,010 85,563 82,835
Impairment of assets and lease
terminations ............................................ 17,861 10,343 114 6,011 696
Preopening costs ........................................ 10,937 13,278 13,569 16,898 14,356
Total costs and expenses ........................ 2,213,383 2,107,657 2,074,726 1,935,363 1,831,893
Income from operations ................................. 118,948 152,845 200,993 165,246 144,731
Loss on investments in unconsolidated
affliates ....................................................... (4,754 ) (479 ) — — —
Interest and other expense, net ....................... (6,783 ) (5,900 ) (9,225 ) (5,894 ) (6,187 )
Income before income taxes ........................... 107,411 146,466 191,768 159,352 138,544
Income tax provision/(benefit) ....................... 8,376 (10,926 ) 52,274 42,829 37,268
Net income ..................................................... $ 99,035 $ 157,392 $ 139,494 $ 116,523 $ 101,276
Net income per share:
Basic ........................................................... $ 2.19 $ 3.35 $ 2.91 $ 2.39 $ 2.04
Diluted ....................................................... $ 2.14 $ 3.27 $ 2.83 $ 2.30 $ 1.96
Weighted average shares outstanding:
Basic ........................................................... 45,263 46,930 47,981 48,833 49,567
Diluted ....................................................... 46,215 48,152 49,372 50,605 51,584
Cash dividends declared per common share .. $ 1.24 $ 1.06 $ 0.88 $ 0.73 $ 0.61
Balance Sheet Data (at end of period):
Cash and cash equivalents .............................. $ 26,578 $ 6,008 $ 53,839 $ 43,854 $ 58,018
Total assets ..................................................... 1,314,133 1,333,060 1,293,319 1,233,346 1,161,376
Total long-term debt and deemed landlord
financing liability, including current
portion ........................................................ 118,610 113,527 104,868 91,343 80,195
Total stockholders’ equity .............................. 571,059 613,530 603,207 588,539 556,510
Restaurant Data:
The Cheesecake Factory comparable
restaurant sales ........................................... 1.7 % (0.8 )% 1.2 % 2.6 % 1.5 %
The Cheesecake Factory restaurants open at
year-end ...................................................... 201 199 194 187 177
(1) Fiscal 2016 consisted of 53 weeks. All other fiscal years presented consisted of 52 weeks.
34
ITEM 7. MANAGEMENT’S DISCUSSION AND ANALYSIS OF FINANCIAL CONDITION AND
RESULTS OF OPERATIONS
General
This discussion and analysis, which contains forward-looking statements, should be read in conjunction with our
audited consolidated financial statements and related notes in Part IV, Item 15 of this report, the “Risk Factors” included
in Part I, Item 1A of this report and the cautionary statements included throughout this report. The inclusion of
supplementary analytical and related information herein may require us to make estimates and assumptions to enable us
to fairly present, in all material respects, our analysis of trends and expectations with respect to our results of operations
and financial position.
We utilize a 52/53-week fiscal year ending on the Tuesday closest to December 31 for financial reporting
purposes. Fiscal years 2018 and 2017 each consisted of 52 weeks, while fiscal year 2016 consisted of 53 weeks. The
estimated impact of the 53rd week in fiscal 2016 was an increase in revenues and diluted net income per share of
approximately $54.7 million and $0.07, respectively.
As of March 4, 2019, we operated 218 Company-owned restaurants: 201 under The Cheesecake Factory® mark,
14 under the Grand Lux Cafe® mark, two under the RockSugar Southeast Asian Kitchen® mark and one under the Social
Monk Asian KitchenTM mark. In addition, 21 The Cheesecake Factory branded restaurants in the Middle East, Mexico,
the Chinese Mainland and Special Administrative Region of Hong Kong were operated by third parties under licensing
agreements. We also operated two bakery production facilities that produce desserts for our restaurants, international
licensees and third-party bakery customers. We are selectively pursuing other means to leverage our competitive
strengths, including investing in or acquiring new restaurant concepts (such as North Italia® and Flower Child®),
expanding The Cheesecake Factory® brand to other retail opportunities through The Cheesecake Factory At Home®
consumer packaged goods and evaluating the future potential of Social Monk Asian Kitchen, our new fast casual
concept.
Overview
Our strategy is driven by our commitment to customer satisfaction and is focused primarily on menu innovation,
service and operational execution to continue to differentiate ourselves from other restaurant concepts, as well as to drive
competitively strong performance that is sustainable. Financially, we are focused on prudently managing expenses at our
restaurants, bakery facilities and corporate support center, and leveraging our size to make the best use of our purchasing
power.
Investing in new Company-owned restaurant development is our top capital allocation priority, with a focus on
opening our concepts in premier locations within both new and existing markets in the United States and Canada. We
target an average cash-on-cash return on investment of approximately 20% to 25% at the unit level. Returns are affected
by the cost to build restaurants, the level of revenues that each restaurant can deliver and our ability to maximize the
profitability of restaurants. Investing in new restaurant development that meets our return on investment criteria is
expected to support achieving mid-teens Company-level return on invested capital.
Our domestic revenue growth (comprised of our annual unit growth and comparable sales growth), combined
with international expansion, contribution from our incremental growth opportunities, stabilization and expansion of our
operating margins, a robust share repurchase program and our dividend provide a framework with high visibility and one
that supports our long-term financial objective of 13% to 14% total return to shareholders, on average. We define our
total return as earnings per share growth plus our dividend yield. The following are the key performance levers that we
believe will contribute to achieving our goals:
• Grow Overall Revenues. Our overall revenue growth is primarily driven by revenues from new restaurant
openings, increases in comparable restaurant sales, and royalties and bakery sales from additional licensed
international locations. Changes in comparable restaurant sales come from variations in customer traffic, as well
as in average check.
Our strategy is to increase comparable restaurant sales by growing average check and stabilizing customer traffic
through (1) continuing to offer innovative, high-quality menu items that offer customers a wide range of options
35
in terms of flavor, price and value (2) focusing on service and hospitality with the goal of delivering an
exceptional customer experience and (3) continuing to provide our customers with convenient options for off-
premise consumption. We are continuing our efforts on a number of initiatives, including a greater focus on
increasing customer throughput in our restaurants, leveraging the success of our gift card program, working with
a third party to provide delivery services for our restaurants, increasing customer awareness of our online
ordering capabilities, enhancing our training programs and leveraging our customer satisfaction measurement
platform.
Average check is driven by menu price increases and/or changes in menu mix. We generally update and reprint
our menus twice a year, and our philosophy is to use price increases to help offset key operating cost increases in
a manner that balances protecting both our margins and customer traffic levels. We plan to target menu price
increases of approximately 2% to 3% annually going forward, utilizing a market-based strategy to help mitigate
cost pressure in higher-wage geographies, and expect near-term increases to be at the higher end of this range.
In addition, we are selectively pursuing a number of incremental growth opportunities. These include: our
investments in North Italia and Flower Child; consumer packaged goods opportunities, including The
Cheesecake Factory At Home®-branded Famous “Brown Bread,” coffee creamer, baking mixes, confections and
refrigerated puddings; and the opening of the first location of Social Monk Asian Kitchen, which will allow us to
test the concept and evaluate its future potential.
• Stabilize and Expand Operating Margins (Income from Operations Expressed as a Percentage of Revenues).
Operating margins are subject to fluctuations in commodity costs, labor, restaurant-level occupancy expenses,
general and administrative expenses (“G&A”) and preopening expenses. Our objective is to stabilize our
operating margins, and longer-term to drive margin expansion by maintaining flat restaurant-level margins,
leveraging our bakery operations, international and consumer packaged goods royalty revenue streams and G&A
over time, and optimizing our restaurant portfolio.
• Return Capital to Shareholders. We have historically generated a significant amount of free cash flow, which we
define as cash provided by operating activities less net capital expenditures and our growth capital contributions
to North Italia and Flower Child. We plan to balance these growth investments with continued return of capital
to shareholders via our dividend and share repurchase program, the latter of which offsets dilution from our
equity compensation program and supports our earnings per share growth. Our ability to declare dividends and
repurchase shares is subject to financial covenants under our Facility.
(See Item 1A — Risk Factors — “Our stock price could be adversely affected if our performance falls short of
our financial guidance and/or market expectations.”)
36
Results of Operations
The following table presents, for the periods indicated, information from our consolidated statements of income
expressed as percentages of revenues.
Fiscal Year
2018 2017 2016
Revenues ................................................................ 100.0 % 100.0 % 100.0 %
Costs and expenses:
Cost of sales ....................................................... 22.8 23.0 23.2
Labor expenses ................................................... 35.8 34.4 33.4
Other operating costs and expenses ................... 24.3 24.4 23.7
General and administrative expenses ................. 6.6 6.2 6.4
Depreciation and amortization expenses ............ 4.1 4.1 3.9
Impairment of assets and lease terminations ...... 0.8 0.5 —
Preopening costs ................................................ 0.5 0.6 0.6
Total costs and expenses ................................ 94.9 93.2 91.2
Income from operations ......................................... 5.1 6.8 8.8
Loss on investments in unconsolidated affiliates ... (0.3 ) (0.0 ) —
Interest and other expense, net ............................... (0.2 ) (0.3 ) (0.4 )
Income before income taxes................................... 4.6 6.5 8.4
Income tax provision/(benefit) ............................... 0.4 (0.5 ) 2.3
Net income ............................................................. 4.2 % 7.0 % 6.1 %
Fiscal 2018 Compared to Fiscal 2017
Revenues
Revenues increased 3.2% to $2,332.3 million for fiscal 2018 compared to $2,260.5 million for fiscal 2017,
primarily due to new restaurant openings and positive comparable restaurant sales. In fiscal 2018, we began classifying
complimentary meals as contra revenue versus other operating expense in the amount of $23.3 million, as described in
Note 1 of Notes to Consolidated Financial Statements in Part IV, Item 15 of this report.
Comparable sales at The Cheesecake Factory restaurants increased by 1.7%, or $35.2 million, from fiscal 2017 as
adjusted for the reclassification. This compares to the casual dining industry which experienced a comparable sales
increase of 1.3%, as measured by Knapp Track. Our comparable sales growth was driven by average check growth of
3.3% (based on an increase of 2.8% in menu pricing and a 0.5% positive change in mix), partially offset by a decline in
customer traffic of 1.6%. We implemented effective menu price increases of approximately 1.5% in both the first and
third quarters of fiscal 2018. The Cheesecake Factory average sales per restaurant operating week increased 1.9% to
$205,660 in fiscal 2018 from $201,767 in fiscal 2017 as adjusted for the reclassification. Total operating weeks at The
Cheesecake Factory restaurants increased 2.4% to 10,344 in fiscal 2018 compared to 10,102 in the prior year.
Restaurants become eligible to enter our comparable sales base in their 19th month of operation. At January 1,
2019, there were ten The Cheesecake Factory restaurants, one Grand Lux Cafe and one RockSugar Southeast Asian
Kitchen not yet in our comparable sales base. International licensed locations and restaurants that are no longer in
operation, including those which we have relocated, are excluded from our comparable sales calculations.
External bakery sales were $54.4 million for fiscal 2018 compared to $55.1 million in fiscal 2017.
Cost of Sales
Cost of sales consists of food, beverage, retail and bakery production supply costs incurred in conjunction with
our restaurant and bakery revenues, and excludes depreciation, which is captured separately in depreciation and
amortization expenses. As a percentage of revenues, cost of sales was 22.8% for fiscal 2018 compared to 23.0% for
fiscal 2017, primarily driven by lower seafood costs.
37
The Cheesecake Factory restaurant menus are among the most diversified in the foodservice industry and,
accordingly, are not overly dependent on a few select commodities. Changes in costs for one commodity sometimes can
be offset by cost changes in other commodity categories. The principal commodity categories for our restaurants include
general grocery items, dairy, produce, seafood, poultry, meat and bread. (See the discussion of our contracting activities
in Part II, Item 7A — “Quantitative and Qualitative Disclosures About Market Risk.”)
As has been our past practice, we will carefully consider opportunities to introduce new menu items and
implement selected menu price increases to help offset any expected cost increases for key commodities and other goods
and services. For new restaurants, cost of sales will typically be higher for a period of time after opening while our
management team becomes more accustomed to predicting, managing and servicing the sales volumes at these
restaurants.
Labor Expenses
As a percentage of revenues, labor expenses, which include restaurant-level labor costs and bakery direct
production labor, including associated fringe benefits, were 35.8% and 34.4% in fiscal 2018 and fiscal 2017,
respectively. This variance was driven primarily by increased hourly labor costs, including higher wage rates and
overtime, as well as higher group medical costs due to higher frequency and severity of claims.
For new restaurants, labor expenses will typically be higher for a period of time after opening while our
management team becomes more accustomed to predicting and managing the sales volumes at the new restaurants.
Other Operating Costs and Expenses
Other operating costs and expenses consist of restaurant-level occupancy expenses (rent, common area expenses,
insurance, licenses, taxes and utilities), other operating expenses (excluding food costs and labor expenses, which are
reported separately) and bakery production overhead and distribution expenses. As a percentage of revenues, other
operating costs and expenses decreased to 24.3% for fiscal 2018 from 24.4% for fiscal 2017. This decrease was
primarily driven by the reclassification of complimentary meals, partially offset by higher marketing costs.
General and Administrative Expenses
General and administrative (“G&A”) expenses consist of the restaurant management recruiting and training
program, restaurant field supervision, corporate support and bakery administrative organizations, as well as gift card
commissions to third-party distributors. As a percentage of revenues, G&A expenses increased to 6.6% for fiscal 2018
versus 6.2% for fiscal 2017. This increase was primarily due to a higher corporate bonus accrual and stock-based
compensation expense.
Depreciation and Amortization Expenses
As a percentage of revenues, depreciation and amortization expenses were 4.1% in both fiscal 2018 and fiscal
2017.
Impairment of Assets and Lease Terminations
In fiscal 2018, we recorded $17.9 million of lease termination and impairment expense related to three The
Cheesecake Factory restaurants, including two closures, one Grand Lux Cafe and one RockSugar Southeast Asian
Kitchen. In fiscal 2017, we recorded $10.3 million of accelerated depreciation and impairment expense related to three
The Cheesecake Factory restaurants, including one relocation and one lease expiration, and one Grand Lux Cafe.
Preopening Costs
Preopening costs were $10.9 million for fiscal 2018 compared to $13.3 million in fiscal 2017. We opened four
The Cheesecake Factory restaurants and one Grand Lux Cafe in fiscal 2018 compared to seven The Cheesecake Factory
restaurants and one RockSugar Southeast Asian Kitchen in fiscal 2017. Preopening costs include all costs to relocate and
compensate restaurant management staff members during the preopening period, costs to recruit and train hourly
restaurant staff members, and wages, travel and lodging costs for our opening training team and other support staff
38
members. Also included are expenses for maintaining a roster of trained managers for pending openings, the associated
temporary housing and other costs necessary to relocate managers in alignment with future restaurant opening and
operating needs, and corporate travel and support activities. Preopening costs can fluctuate significantly from period to
period based on the number and timing of restaurant openings and the specific preopening costs incurred for each
restaurant.
Loss on investments in unconsolidated affiliates
Loss on investments in unconsolidated affiliates, which represents our share of losses incurred by North Italia
and Flower Child, was $4.8 million in fiscal 2018 compared to $0.5 million in fiscal 2017. This increase was primarily
driven by preopening costs associated with new unit development.
Interest and Other Expense, Net
Interest and other expense, net was $6.8 million in fiscal 2018 compared to $5.9 million in fiscal 2017. Interest
expense associated with landlord construction allowances deemed to be financings in accordance with accounting
guidance was $6.7 million in fiscal 2018 compared to $5.8 million in fiscal 2017.
Income Tax Provision/(Benefit)
Our effective income tax rate was 7.8% in fiscal 2018 compared to (7.5)% in fiscal 2017. This increase is
primarily due to the favorable impacts in fiscal 2017 of the Tax Act on our deferred taxes and the implementation of new
accounting guidance that requires the tax impact of exercised stock options and vested restricted stock to be recorded in
the income tax provision instead of in additional paid-in capital. In addition, we experienced non-taxable gains in fiscal
2017 compared to non-deductible losses in fiscal 2018 on our investments in variable life insurance contracts used to
support our Executive Savings Plan (“ESP”), a non-qualified deferred compensation plan. These increases to our
effective income tax rate were partially offset by the reduction in the statutory U.S. corporate tax rate from 35% to 21%
and a higher proportion of FICA tip credit in relation to pre-tax income. (See Note 15 of Notes to Consolidated Financial
Statements in Part IV, Item 15 of this report for further information on our income tax provision/(benefit).)
Fiscal 2017 Compared to Fiscal 2016
Revenues
Revenues decreased 0.7% to $2,260.5 million for fiscal 2017 compared to $2,275.7 million for fiscal 2016.
Excluding the impact of the 53rd week in fiscal 2016, revenues increased 1.8%. This increase was primarily due to new
restaurant openings, partially offset by negative comparable restaurant sales.
Comparable sales at The Cheesecake Factory restaurants decreased by 0.8%, or $16.5 million, from fiscal 2016
on a 52-week basis, in line with the casual dining industry which also experienced a comparable sales decline of 0.8%,
as measured by Knapp Track. Our comparable sales decline was driven by a decrease in customer traffic of 2.9%,
partially offset by average check growth of 2.1% (based on an increase of 2.4% in menu pricing and a 0.3% negative
change in mix). We implemented effective menu price increases of approximately 1.1% and 1.4% during the first and
third quarters of fiscal 2017, respectively. The Cheesecake Factory average sales per restaurant operating week
decreased 1.6% to $203,947 in fiscal 2017 compared to $207,166 in fiscal 2016. Total operating weeks at The
Cheesecake Factory restaurants increased 0.7% to 10,102 in fiscal 2017 compared to 10,031 in the prior year. Excluding
the impact of the 53rd week in fiscal 2016, total operating weeks increased 2.7%.
External bakery sales were $55.1 million for fiscal 2017 compared to $53.6 million in fiscal 2016.
Cost of Sales
As a percentage of revenues, cost of sales was 23.0% for fiscal 2017 compared to 23.2% for fiscal 2016,
primarily driven by marginal favorability across several categories.
39
Labor Expenses
As a percentage of revenues, labor expenses were 34.4% and 33.4% in fiscal 2017 and fiscal 2016, respectively.
This variance was driven primarily by higher wage rates and sales deleverage, partially offset by lower group medical
costs due to lower large claims activity.
Other Operating Costs and Expenses
As a percentage of revenues, other operating costs and expenses increased to 24.4% for fiscal 2017 from 23.7%
for fiscal 2016. This variance was primarily related to higher repairs and maintenance, marketing and utilities costs, as
well as increased general liability insurance expense due to higher frequency and larger claims relative to fiscal 2016.
General and Administrative Expenses
As a percentage of revenues, G&A expenses decreased to 6.2% for fiscal 2017 versus 6.4% for fiscal 2016. This
decrease was primarily due to a lower corporate bonus accrual and reduced stock-based compensation expense, partially
offset by an increase in legal costs and sales deleverage.
Depreciation and Amortization Expenses
As a percentage of revenues, depreciation and amortization expenses were 4.1% and 3.9% in fiscal 2017 and
fiscal 2016, respectively. This increase was primarily due to loss on asset disposals and sales deleverage.
Impairment of Assets and Lease Terminations
In fiscal 2017, we recorded $10.3 million of accelerated depreciation and impairment expense related to three
The Cheesecake Factory restaurants, including one relocation and one lease expiration, and one Grand Lux Cafe. In
fiscal 2016, we recorded $0.1 million of accelerated depreciation expense related to the planned relocation of one The
Cheesecake Factory restaurant, which subsequently took place in fiscal 2017.
Preopening Costs
Preopening costs were $13.3 million for fiscal 2017 compared to $13.6 million in fiscal 2016. We opened seven
The Cheesecake Factory restaurants and one RockSugar Southeast Asian Kitchen in fiscal 2017 compared to seven The
Cheesecake Factory restaurants and one Grand Lux Cafe in fiscal 2016.
Interest and Other Expense, Net
Interest and other expense, net was $5.9 million in fiscal 2017 compared to $9.2 million in fiscal 2016. Interest
expense associated with landlord construction allowances deemed to be financings in accordance with accounting
guidance was $5.8 million in fiscal 2017 compared to $5.6 million in fiscal 2016.
Income Tax Provision/(Benefit)
Our effective income tax rate was (7.5%) in fiscal 2017 compared to 27.3% in fiscal 2016. This decrease is
primarily due to the favorable impact of the Tax Act on our deferred taxes and the implementation of new accounting
guidance that requires the tax impact of exercised stock options and vested restricted stock to be recorded in the income
tax provision instead of additional paid-in capital, as well as a higher proportion of credit for FICA taxes on reported tips
in relation to pre-tax income and higher non-taxable gains on our investments in variable life insurance contracts used to
support our ESP. See “Recent Accounting Pronouncements” in Note 1 of Notes to Consolidated Financial Statements in
Part IV, Item 15 of this report for further discussion of the accounting change. See Note 15 of Notes to Consolidated
Financial Statements in Part IV, Item 15 of this report for further information on our income tax provision/(benefit).)
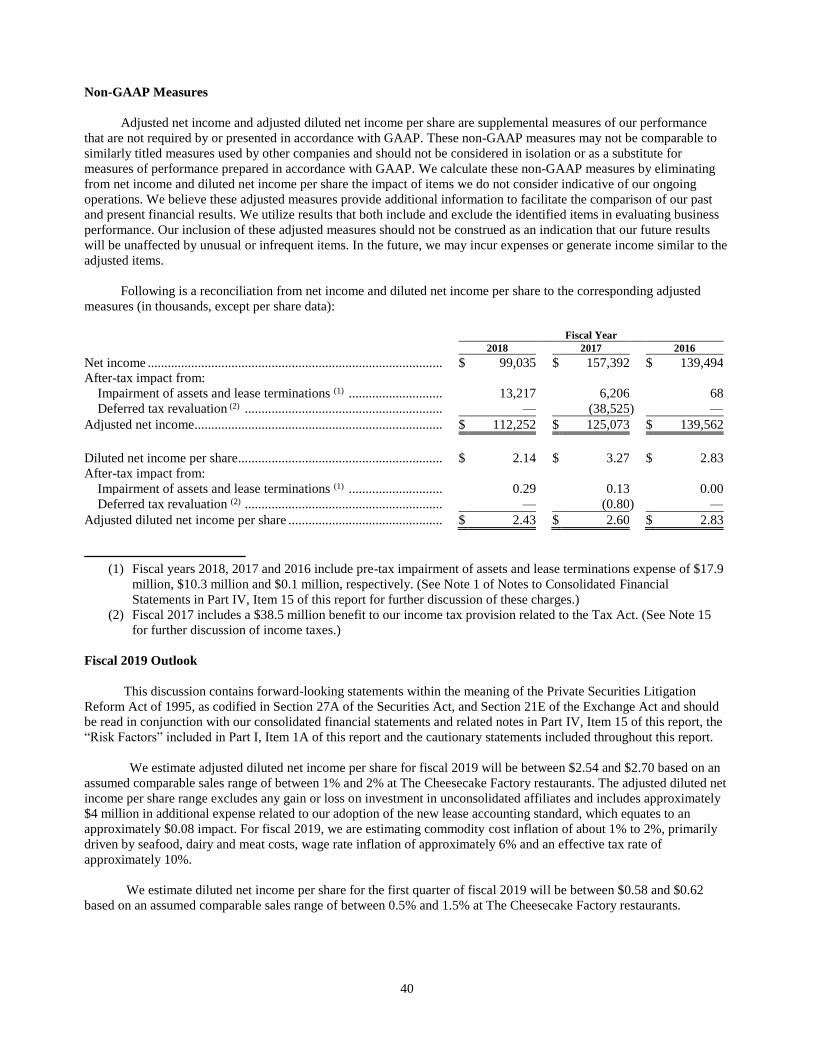
40
Non-GAAP Measures
Adjusted net income and adjusted diluted net income per share are supplemental measures of our performance
that are not required by or presented in accordance with GAAP. These non-GAAP measures may not be comparable to
similarly titled measures used by other companies and should not be considered in isolation or as a substitute for
measures of performance prepared in accordance with GAAP. We calculate these non-GAAP measures by eliminating
from net income and diluted net income per share the impact of items we do not consider indicative of our ongoing
operations. We believe these adjusted measures provide additional information to facilitate the comparison of our past
and present financial results. We utilize results that both include and exclude the identified items in evaluating business
performance. Our inclusion of these adjusted measures should not be construed as an indication that our future results
will be unaffected by unusual or infrequent items. In the future, we may incur expenses or generate income similar to the
adjusted items.
Following is a reconciliation from net income and diluted net income per share to the corresponding adjusted
measures (in thousands, except per share data):
Fiscal Year
2018 2017 2016
Net income ........................................................................................ $ 99,035 $ 157,392 $ 139,494
After-tax impact from:
Impairment of assets and lease terminations (1) ............................ 13,217 6,206 68
Deferred tax revaluation (2) ........................................................... — (38,525 ) —
Adjusted net income.......................................................................... $ 112,252 $ 125,073 $ 139,562
Diluted net income per share............................................................. $ 2.14 $ 3.27 $ 2.83
After-tax impact from:
Impairment of assets and lease terminations (1) ............................ 0.29 0.13 0.00
Deferred tax revaluation (2) ........................................................... — (0.80 ) —
Adjusted diluted net income per share .............................................. $ 2.43 $ 2.60 $ 2.83
(1) Fiscal years 2018, 2017 and 2016 include pre-tax impairment of assets and lease terminations expense of $17.9
million, $10.3 million and $0.1 million, respectively. (See Note 1 of Notes to Consolidated Financial
Statements in Part IV, Item 15 of this report for further discussion of these charges.)
(2) Fiscal 2017 includes a $38.5 million benefit to our income tax provision related to the Tax Act. (See Note 15
for further discussion of income taxes.)
Fiscal 2019 Outlook
This discussion contains forward-looking statements within the meaning of the Private Securities Litigation
Reform Act of 1995, as codified in Section 27A of the Securities Act, and Section 21E of the Exchange Act and should
be read in conjunction with our consolidated financial statements and related notes in Part IV, Item 15 of this report, the
“Risk Factors” included in Part I, Item 1A of this report and the cautionary statements included throughout this report.
We estimate adjusted diluted net income per share for fiscal 2019 will be between $2.54 and $2.70 based on an
assumed comparable sales range of between 1% and 2% at The Cheesecake Factory restaurants. The adjusted diluted net
income per share range excludes any gain or loss on investment in unconsolidated affiliates and includes approximately
$4 million in additional expense related to our adoption of the new lease accounting standard, which equates to an
approximately $0.08 impact. For fiscal 2019, we are estimating commodity cost inflation of about 1% to 2%, primarily
driven by seafood, dairy and meat costs, wage rate inflation of approximately 6% and an effective tax rate of
approximately 10%.
We estimate diluted net income per share for the first quarter of fiscal 2019 will be between $0.58 and $0.62
based on an assumed comparable sales range of between 0.5% and 1.5% at The Cheesecake Factory restaurants.
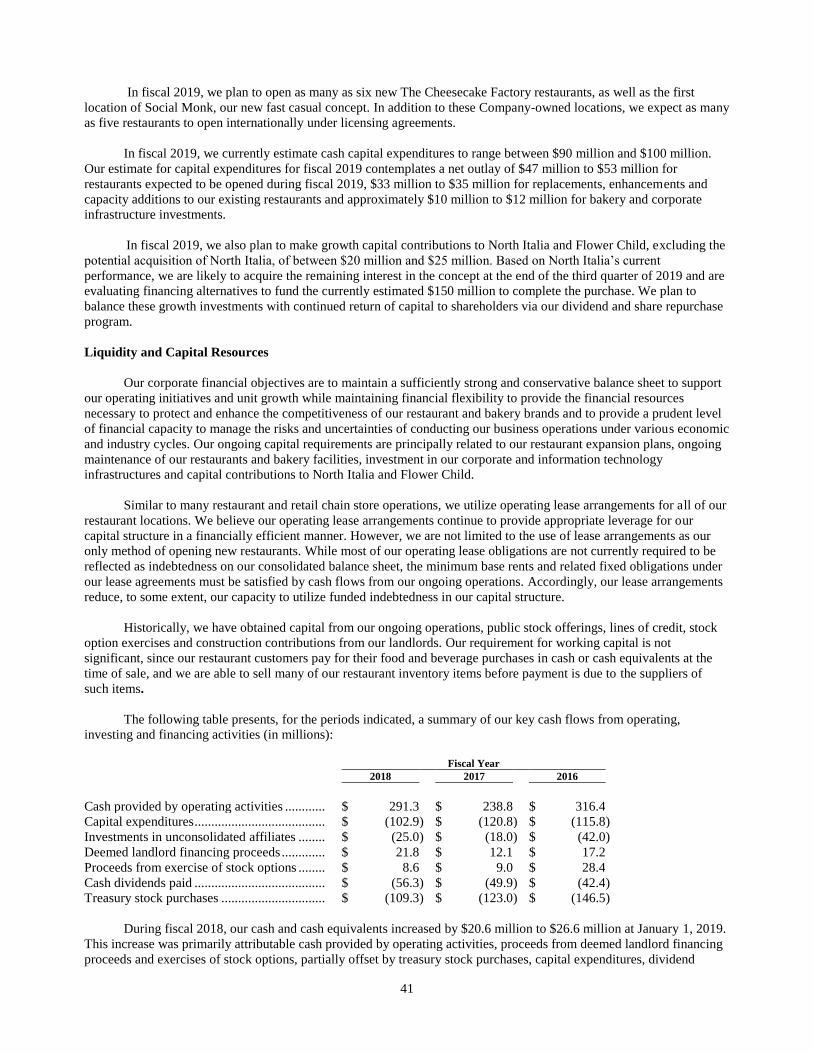
41
In fiscal 2019, we plan to open as many as six new The Cheesecake Factory restaurants, as well as the first
location of Social Monk, our new fast casual concept. In addition to these Company-owned locations, we expect as many
as five restaurants to open internationally under licensing agreements.
In fiscal 2019, we currently estimate cash capital expenditures to range between $90 million and $100 million.
Our estimate for capital expenditures for fiscal 2019 contemplates a net outlay of $47 million to $53 million for
restaurants expected to be opened during fiscal 2019, $33 million to $35 million for replacements, enhancements and
capacity additions to our existing restaurants and approximately $10 million to $12 million for bakery and corporate
infrastructure investments.
In fiscal 2019, we also plan to make growth capital contributions to North Italia and Flower Child, excluding the
potential acquisition of North Italia, of between $20 million and $25 million. Based on North Italia’s current
performance, we are likely to acquire the remaining interest in the concept at the end of the third quarter of 2019 and are
evaluating financing alternatives to fund the currently estimated $150 million to complete the purchase. We plan to
balance these growth investments with continued return of capital to shareholders via our dividend and share repurchase
program.
Liquidity and Capital Resources
Our corporate financial objectives are to maintain a sufficiently strong and conservative balance sheet to support
our operating initiatives and unit growth while maintaining financial flexibility to provide the financial resources
necessary to protect and enhance the competitiveness of our restaurant and bakery brands and to provide a prudent level
of financial capacity to manage the risks and uncertainties of conducting our business operations under various economic
and industry cycles. Our ongoing capital requirements are principally related to our restaurant expansion plans, ongoing
maintenance of our restaurants and bakery facilities, investment in our corporate and information technology
infrastructures and capital contributions to North Italia and Flower Child.
Similar to many restaurant and retail chain store operations, we utilize operating lease arrangements for all of our
restaurant locations. We believe our operating lease arrangements continue to provide appropriate leverage for our
capital structure in a financially efficient manner. However, we are not limited to the use of lease arrangements as our
only method of opening new restaurants. While most of our operating lease obligations are not currently required to be
reflected as indebtedness on our consolidated balance sheet, the minimum base rents and related fixed obligations under
our lease agreements must be satisfied by cash flows from our ongoing operations. Accordingly, our lease arrangements
reduce, to some extent, our capacity to utilize funded indebtedness in our capital structure.
Historically, we have obtained capital from our ongoing operations, public stock offerings, lines of credit, stock
option exercises and construction contributions from our landlords. Our requirement for working capital is not
significant, since our restaurant customers pay for their food and beverage purchases in cash or cash equivalents at the
time of sale, and we are able to sell many of our restaurant inventory items before payment is due to the suppliers of
such items.
The following table presents, for the periods indicated, a summary of our key cash flows from operating,
investing and financing activities (in millions):
Fiscal Year
2018 2017 2016
Cash provided by operating activities ............ $ 291.3 $ 238.8 $ 316.4
Capital expenditures ....................................... $ (102.9 ) $ (120.8 ) $ (115.8 )
Investments in unconsolidated affiliates ........ $ (25.0 ) $ (18.0 ) $ (42.0 )
Deemed landlord financing proceeds ............. $ 21.8 $ 12.1 $ 17.2
Proceeds from exercise of stock options ........ $ 8.6 $ 9.0 $ 28.4
Cash dividends paid ....................................... $ (56.3 ) $ (49.9 ) $ (42.4 )
Treasury stock purchases ............................... $ (109.3 ) $ (123.0 ) $ (146.5 )
During fiscal 2018, our cash and cash equivalents increased by $20.6 million to $26.6 million at January 1, 2019.
This increase was primarily attributable cash provided by operating activities, proceeds from deemed landlord financing
proceeds and exercises of stock options, partially offset by treasury stock purchases, capital expenditures, dividend
42
payments and investments in North Italia and Flower Child. Cash flow from operations increased by $52.5 million from
fiscal 2017 to fiscal 2018, primarily due to timing of income tax payments and changes in working capital accounts,
partially offset by lower pretax income. Cash flow from operations decreased by $77.6 million from fiscal 2016 to fiscal
2017, primarily due to lower pretax income and timing of income tax payments.
Capital expenditures for new restaurants, including locations under development as of each fiscal year-end, were
$58.6 million, $76.5 million and $84.4 million for fiscal 2018, 2017 and 2016, respectively. Capital expenditures also
included $26.9 million, $36.5 million and $26.8 million for our existing restaurants and $17.4 million, $7.8 million and
$4.6 million for bakery and corporate capacity and infrastructure investments in fiscal 2018, 2017 and 2016,
respectively, including an infrastructure upgrade of our California bakery in 2018.
We have a strategic relationship with FRC with respect to two of its brands, North Italia and Flower Child, that
share a number of parallels with us in terms of culture and philosophy. FRC, or its affiliates, continues to own the
intellectual property, manage day-to-day operations and provide infrastructure support to facilitate the near-term growth
of both of these concepts. We made initial minority equity investments of $42 million in these concepts during fiscal
2016 and invested additional capital in the amount of $25 million and $18 million during fiscal 2018 and 2017,
respectively. We have the right, and an obligation if certain financial, legal and operational conditions are met, to acquire
the remaining interest in North Italia in fiscal 2019 and in Flower Child in fiscal 2021. We plan to make growth capital
contributions to North Italia and Flower Child, excluding the potential acquisition of North Italia, of between $20 million
and $25 million in fiscal 2019. Based on North Italia’s current performance, we are likely to acquire the remaining
interest in the concept at the end of the third quarter of 2019 and are evaluating financing alternatives to fund the
currently estimated $150 million to complete the purchase.
We maintain a $200 million unsecured revolving credit facility (the “Facility”), $50 million of which may be
used for issuances of letters of credit. Availability under the Facility is reduced by outstanding letters of credit, which are
used to support our self-insurance programs. The Facility, which matures on December 22, 2020, contains a commitment
increase feature that could provide for an additional $100 million in available credit upon our request and subject to the
participating lenders electing to increase their commitments or new lenders being added to the Facility. Certain of our
significant subsidiaries guarantee our obligations under the Facility. During fiscal years 2018, 2017 and 2016, we
utilized the Facility to fund a portion of our stock repurchases. At January 1, 2019, we had net availability for
borrowings of $169.3 million, based on a $10.0 million outstanding debt balance and $20.7 million in standby letters of
credit. The Facility limits cash distributions with respect to our equity interests, such as cash dividends and share
repurchases, based on a defined ratio. As of January 1, 2019, we were in compliance with the covenants set forth in the
Facility. (See Note 9 of Notes to Consolidated Financial Statements in Part IV, Item 15 of this report for further
discussion of our long-term debt .)
In fiscal 2012, our Board approved the initiation of a cash dividend to our stockholders, which is subject to
quarterly Board approval. Cash dividends have been declared every quarter since initiation. Future decisions to pay or to
increase or decrease dividends are at the discretion of the Board and will be dependent on our operating performance,
financial condition, capital expenditure requirements, limitations on cash distributions pursuant to the terms and
conditions of our Facility and applicable law, and other such factors that the Board considers relevant.
On July 21, 2016, our Board increased the authorization to repurchase our common stock by 7.5 million shares to
56.0 million shares. Under this and all previous authorizations, we have cumulatively repurchased 51.8 million shares at
a total cost of $1,642.1 million through January 1, 2019. During fiscal 2018, 2017 and 2016, we repurchased 2.3 million,
2.6 million and 2.9 million shares of our common stock at a cost of $109.3 million, $123.0 million and $146.5 million,
respectively. Our share repurchase authorization does not have an expiration date, does not require us to purchase a
specific number of shares and may be modified, suspended or terminated at any time. We make the determination to
repurchase shares based on several factors, including an evaluation of current and future capital needs associated with
new restaurant development, current and forecasted cash flows, including dividend payments and growth capital
contributions to North Italia and Flower Child, a review of our capital structure and cost of capital, our share price and
current market conditions. The timing and number of shares repurchased are also subject to legal constraints and
financial covenants under our Facility that limit share repurchases based on a defined ratio. (See Note 9 of Notes to
Consolidated Financial Statements in Part IV, Item 15 of this report for further discussion of our long-term debt.) Our
objectives with regard to share repurchases are to offset the dilution to our shares outstanding that results from equity
compensation grants and to supplement our earnings per share growth. (See Note 12 of Notes to Consolidated Financial
Statements in Part IV, Item 15 of this report for further discussion of our repurchase authorization and methods.)
43
Based on our current expansion objectives, we believe that during the upcoming 12 months our cash and cash
equivalents, combined with expected cash flows provided by operations, available borrowings under our Facility and its
potential accordian feature and expected landlord construction contributions should be sufficient in the aggregate to
finance our capital allocation strategy, including capital expenditures, share repurchases, cash dividends, growth capital
contributions to North Italia and Flower Child and the potential acquistion of North Italia. We plan to continue to return
substantially all of our free cash flow plus proceeds received from stock option exercises to stockholders in the form of
dividends and share repurchases.
As of January 1, 2019, we had no financing transactions, arrangements or other relationships with any
unconsolidated entities or related parties other than our arrangement with FRC. Additionally, we had no financing
arrangements involving synthetic leases or trading activities involving commodity contracts.
Contractual Obligations and Commercial Commitments
The following table summarizes our contractual obligations and commercial commitments as of January 1, 2019
(amounts in millions):
Payment Due by Period
Total
Less than
1 Year 1-3 Years 4-5 Years
More than
5 Years
Contractual obligations
Leases (1) ....................................................... $ 938.4 $ 93.8 $ 180.6 $ 168.9 $ 495.1
Long-term debt ............................................. 10.0 — 10.0 — —
Purchase obligations (2) ................................ 154.1 118.2 25.9 10.0 —
Uncertain tax positions (3) ............................. 0.8 — 0.8 — —
Total ............................................................. $ 1,103.3 $ 212.0 $ 217.3 $ 178.9 $ 495.1
Other commercial commitments
Standby letters of credit ............................... $ 20.7 $ 20.7 $ — $ — $ —
(1) Represents aggregate minimum lease payments for our restaurant operations, automobiles and certain
equipment, including amounts characterized as deemed landlord financing payments in accordance with
accounting guidance. (See Note 1 in Notes to Consolidated Financial Statements in Part IV, Item 15 of this
report.) Most of our leases also require contingent rent in addition to the minimum base rent based on a
percentage of revenues ranging from 2.5% to 10% and require various expenses incidental to the use of the
property.
(2) Purchase obligations represent commitments for the purchase of goods and estimated construction
commitments, net of up-front landlord construction contributions. Amounts exclude agreements that are
cancelable without significant penalty.
(3) Represents liability for uncertain tax positions. (See Note 15 of Notes to Consolidated Financial Statements in
Part IV, Item 15 of this report for further discussion of income taxes.)
As of January 1, 2019, we were obligated to provide up to an additional $3 million in growth capital to Flower
Child. We have the right to acquire the remaining interest in Flower Child in fiscal 2021. However, we could be
obligated to do so if certain financial, legal and operational conditions are met and FRC elects to exercise its put option
prior to this date. Based on North Italia’s current performance, we are likely to acquire the remaining interest in the
concept at the end of the third quarter for an estimated $150 million. However, we could be obligated to do so if certain
financial, legal and operational conditions are met and FRC elects to exercise its put option prior to this date.
We expect to fund our contractual obligations, other than the potential acquisitions of these two concepts,
primarily with operating cash flows generated in the normal course of business. We are currently evaluating financing
alternatives for the probable North Italia acquisition.
44
Critical Accounting Policies
Critical accounting policies are those we believe are most important to portraying our financial condition and
results of operations and also require the greatest amount of subjective or complex judgments by management.
Judgments and uncertainties regarding the application of these policies may result in materially different amounts being
reported under various conditions or using different assumptions. We consider the following policies to be the most
critical in understanding the judgment that is involved in preparing our consolidated financial statements.
Property and Equipment
We record property and equipment at cost less accumulated depreciation. Improvements are capitalized while
repairs and maintenance costs are expensed as incurred. The useful life of property and equipment and the determination
as to what constitutes a capitalized cost versus a repair and maintenance expense involve judgment by management,
which may produce materially different amounts of repairs and maintenance or depreciation expense than if different
assumptions were used.
Impairment of Long-Lived Assets
We assess the potential impairment of our long-lived assets on an annual basis or whenever events or changes in
circumstances indicate that the carrying value of the assets or asset group may not be recoverable. Factors considered
include, but are not limited to, negative cash flow, significant underperformance relative to historical or projected future
operating results, significant changes in the manner in which an asset is being used, an expectation that an asset will be
disposed of significantly before the end of its previously estimated useful life and significant negative industry or
economic trends.
Assessing whether impairment testing is warranted and, if so, determining the amount of expense require the use
of estimates and assumptions regarding future cash flows and estimated useful lives, which are subject to a significant
degree of judgment based on our experience and knowledge. These estimates can be significantly impacted by changes
in the economic environment, real estate market conditions and capital spending decisions.
Revenue Recognition
We recognize a liability upon the sale of our gift cards and recognize revenue when these gift cards are redeemed
in our restaurants. Based on our historical redemption patterns, we can reasonably estimate the amount of gift cards for
which redemption is remote, which is referred to as “breakage.” Utilizing this method, we estimate both the amount of
breakage and the time period of redemption. Breakage is recognized over a three-year period in proportion to historical
redemption trends and is classified as revenues in our consolidated statements of income. If actual redemption amounts
or patterns vary from our estimates, actual gift card breakage income may differ from the amounts recorded.
Leases
We currently lease all of our restaurant locations. We evaluate each lease to determine its appropriate
classification as an operating or capital lease for financial reporting purposes. All of our restaurant leases are classified
as operating leases. Minimum base rent, which generally escalates over the term of the lease, is recorded on a straight-
line basis over the lease term. The lease term includes the build-out period for our leases, where no rent payments are
typically due under the terms of the lease. Contingent rent expense, which is based on a percentage of revenues, is
recorded as incurred to the extent it exceeds minimum base rent per the lease agreement.
We expend cash for leasehold improvements and FF&E to build out and equip our leased premises. We may also
expend cash for structural additions that we make to leased premises. Generally a portion of the leasehold improvements
and building costs are reimbursed to us by our landlords as construction contributions. If obtained, landlord construction
contributions usually take the form of up-front cash, full or partial credits against our future minimum or percentage
rents, or a combination thereof. Depending on the specifics of the leased space and the lease agreement, amounts paid
for structural components are recorded during the construction period as either prepaid rent or property and equipment
and the landlord construction contributions are recorded as either an offset to prepaid rent or as a deemed landlord
financing liability.
45
For those leases for which we are deemed the owner of the property during construction, upon completion, we
perform an analysis to determine if they qualify for sale-leaseback treatment. For those qualifying leases, the deemed
landlord financing liability and the associated property and equipment are removed and the difference is reclassified to
either prepaid or deferred rent and amortized over the lease term as an increase or decrease to rent expense. If the lease
does not qualify for sale-leaseback treatment, the deemed landlord financing liability is amortized over the lease term
based on the rent payments designated in the lease agreement.
The probable term for each restaurant property and the discount rate used require judgment by management and
can impact the classification and accounting for a lease as capital or operating and the rent escalations that are taken into
consideration when calculating straight-line rent. These judgments may produce materially different amounts of
depreciation, amortization and rent expense than would be reported if different assumptions were used.
Self-Insurance Liabilities
We retain the financial responsibility for a significant portion of our risks and associated liabilities with respect to
workers’ compensation, general liability, staff member health benefits, employment practices and other insurable risks.
The accrued liabilities associated with our self-insured programs are based on our estimate of the ultimate costs to settle
known claims, as well as claims incurred but not yet reported to us (“IBNR”) as of the balance sheet date. Our estimated
liabilities are based on information provided by our insurance brokers and insurers, combined with our judgment
regarding a number of assumptions and factors, including the frequency and severity of claims, claims development
history, case jurisdiction, applicable legislation and our claims settlement practices. Significant judgment is required to
estimate IBNR amounts, as parties have yet to assert such claims. If actual claims trends, including the severity or
frequency of claims, differ from our estimates, our financial results could be impacted.
Stock-Based Compensation
We apply the Black-Scholes valuation model in determining the fair value of stock option grants, which requires
the use of assumptions, including the volatility of our common stock price and the length of time staff members will
retain their vested stock options prior to exercise. Additionally, we estimate the expected forfeiture rate related to stock
options, restricted shares and restricted share units in determining the amount of stock-based compensation expense for
each period. For restricted share units with performance-based vesting conditions, we estimate the level of expected
performance. Significant judgment is required in determining the valuation factors and forfeiture rate estimates. Changes
in these assumptions or differences between our estimates and actual results could materially affect our results of
operations.
Income Taxes
We compute income taxes based on estimates of our federal, state and foreign tax liabilities. Our estimates
include, but are not limited to, effective state and local income tax rates, allowable tax credits, depreciation expense
allowable for tax purposes and applicable valuation allowances on deferred tax assets. Our estimates are made based on
the best available information at the time we prepare our consolidated financial statements. In making our estimates, we
consider the impact of legislative and judicial developments. As these developments evolve, we update our estimates,
which, in turn, may result in adjustments to our effective tax rate. We generally file our income tax returns within ten
months after our fiscal year-end. All tax returns are subject to audit by the applicable taxing authorities, usually years
after the returns are filed, and could be subject to differing interpretations of the tax laws.
We account for uncertain tax positions under Financial Accounting Standards Board guidance, which requires
that a position taken or expected to be taken in a tax return be recognized (or derecognized) in the financial statements
when it is more likely than not (i.e., a likelihood of more than 50%) that the position would be sustained on its technical
merits upon examination by tax authorities, taking into account available administrative remedies and litigation. A
recognized tax position is then measured at the largest amount of benefit that is greater than 50% likely of being realized
upon ultimate resolution. Assessment of uncertain tax positions requires significant judgments relating to the amounts,
timing and likelihood of resolution. Our actual results could differ materially from these estimates.
46
Recent Accounting Pronouncements
See Note 1 of Notes to Consolidated Financial Statements in Part IV, Item 15 of this report for a summary of new
accounting standards.
Impact of Inflation
The impact of inflation on food costs, labor, and other supplies and services can adversely impact our financial
results. While we attempt to at least partially offset increases in the costs of key operating resources by gradually raising
prices for our menu items and bakery products and employing more efficient purchasing practices, productivity
improvements and greater economies of scale, there can be no assurance that we will be effective in doing so.
ITEM 7A. QUANTITATIVE AND QUALITATIVE DISCLOSURES ABOUT MARKET RISK
The following discussion of market risks contains forward-looking statements within the meaning of the Private
Securities Litigation Reform Act of 1995, as codified in Section 27A of the Securities Act, and Section 21E of the
Exchange Act and should be read in conjunction with our consolidated financial statements and related notes in
Part IV, Item 15 of this report, the “Risk Factors” included in Part I, Item 1A of this report and the cautionary statements
included throughout this report. Actual results may differ materially from the following discussion based on general
conditions in the commodity and financial markets.
We purchase food and other commodities for use in our operations, based on market prices established with our
suppliers. Many of the commodities purchased by us can be subject to volatility due to market supply and demand
factors outside of our control. We mitigate the risk of supply shortages and obtain competitive prices by utilizing
multiple qualified suppliers for substantially all of our ingredients and supplies. We negotiate short-term and long-term
agreements for some of our principal commodity, supply and equipment requirements, such as certain dairy products and
poultry, depending on market conditions and expected demand. We continue to evaluate the possibility of entering into
similar arrangements for other commodities and also periodically evaluate hedging vehicles, such as direct financial
instruments, to assist us in managing risk and variability associated with such commodities. Although these vehicles may
be available to us, as of the end of our 2018 fiscal year, we had chosen not to enter into any hedging contracts due to
pricing volatility, excessive risk premiums, hedge inefficiencies or other factors. Commodities for which we have not
entered into contracts can be subject to unforeseen supply and cost fluctuations, which at times may be significant.
Additionally, the cost of commodities subject to governmental regulation, such as dairy and corn, can be especially
susceptible to price fluctuation. Commodities we purchase on the international market may be subject to even greater
fluctuations in cost and availability, which could result from a variety of factors, including the value of the U.S. dollar
relative to other currencies, international trade disputes, tariffs and varying global demand. We may or may not have the
ability to increase menu prices, or vary menu items, in response to food commodity price increases. For fiscal years 2018
and 2017, a hypothetical increase of 1% in commodities costs would have had a negative impact of $5.4 million and $5.2
million, respectively, on cost of sales. (See Item 1A — Risk Factors — “Our inability to anticipate and react effectively
to changes in the costs of key operating resources may increase our cost of doing business, which may materially
adversely affect our financial performance.”)
We are exposed to market risk from interest rate changes on our funded debt. This exposure relates to the
component of the interest rate on the Facility that is indexed to market rates. Based on outstanding borrowings at
January 1, 2019 and January 2, 2018, a hypothetical 1% rise in interest rates would increase interest expense by
$100,000 on an annual basis. (See Note 9 of Notes to Consolidated Financial Statements in Part IV, Item 15 of this
report for further discussion of our long-term debt.)
We are also subject to market risk related to our investments in variable life insurance contracts used to support
our ESP to the extent these investments are not equivalent to the related liability. In addition, because changes in these
investments are not taxable, gains and losses result in tax benefit and tax expense, respectively, and directly affect net
income through the income tax provision. Based on balances at January 1, 2019 and January 2, 2018, a hypothetical 10%
decline in the market value of our deferred compensation asset and related liability would not have impacted income
before income taxes. However, under such scenario, net income would have declined by $1.5 million at January 1, 2019
and $2.5 million at January 2, 2018.
47
ITEM 8. FINANCIAL STATEMENTS AND SUPPLEMENTARY DATA
The consolidated financial statements required to be filed hereunder are set forth in Part IV, Item 15 of this
report.
ITEM 9. CHANGES IN AND DISAGREEMENTS WITH ACCOUNTANTS ON ACCOUNTING AND
FINANCIAL DISCLOSURE
The information required by this Item 9 was previously reported in the Company’s Current Report on Form 8-K
that was filed with the SEC on March 7, 2018.
ITEM 9A. CONTROLS AND PROCEDURES
Evaluation of Disclosure Controls and Procedures
We have established and maintain disclosure controls and procedures that are designed to ensure that information
required to be disclosed by us in the reports that we file or submit under the Securities Exchange Act of 1934 is
recorded, processed, summarized, and reported within the time periods specified in the SEC’s rules and forms, and that
such information is accumulated and communicated to our management, including our Chief Executive Officer and
Chief Financial Officer, as appropriate to allow timely decisions regarding required disclosure. In designing and
evaluating the disclosure controls and procedures, management recognized that any controls and procedures, no matter
how well designed and operated, can provide only a reasonable assurance of achieving the desired control objectives,
and management was necessarily required to apply its judgment in evaluating the cost-benefit relationship of possible
controls and procedures. We carried out an evaluation, under the supervision and with the participation of our
management, including our Chief Executive Officer and Chief Financial Officer, of the effectiveness of the design and
operation of our disclosure controls and procedures as of the end of the period covered by this report. Based on that
evaluation, the Chief Executive Officer and Chief Financial Officer concluded that our disclosure controls and
procedures were effective at the reasonable assurance level as of January 1, 2019.
Management’s Report on Internal Control over Financial Reporting
Our management is responsible for establishing and maintaining adequate internal control over financial
reporting. As defined in Exchange Act Rule 13a-15(f), internal control over financial reporting is a process designed by,
or under the supervision of, our principal executive and principal financial officers and effected by our Board of
Directors, management and other personnel, to provide reasonable assurance regarding the reliability of financial
reporting and the preparation of financial statements for external purposes in accordance with accounting principles
generally accepted in the United States (“GAAP”) and includes those policies and procedures that (i) pertain to the
maintenance of records that in reasonable detail accurately and fairly reflect the transactions and dispositions of the
assets of the company; (ii) provide reasonable assurance that transactions are recorded as necessary to permit preparation
of financial statements in accordance with GAAP, and that receipts and expenditures of the Company are being made
only in accordance with authorizations of management and directors of the Company; and (iii) provide reasonable
assurance regarding prevention or timely detection of unauthorized acquisition, use or disposition of the Company’s
assets that could have a material effect on the financial statements. Because of its inherent limitations, internal control
over financial reporting may not prevent or detect misstatements.
Under the supervision and with the participation of our management, including our Chief Executive Officer and
Chief Financial Officer, we carried out an evaluation of the effectiveness of our internal control over financial reporting
as of January 1, 2019 on the criteria in “Internal Control - Integrated Framework (2013)” issued by the Committee of
Sponsoring Organizations of the Treadway Commission (“COSO”). Based on this evaluation, our management
concluded that our internal control over financial reporting was effective as of January 1, 2019.
The effectiveness of our internal control over financial reporting as of January 1, 2019 has been audited by
KPMG LLP, an independent registered public accounting firm, as stated in their report which appears in Part IV, Item 15
of this report.

48
Changes in Internal Control over Financial Reporting
There have been no changes in our internal control over financial reporting (as defined in Rules 13a-15(f) and
15d-15(f) under the Securities Exchange Act of 1934) during our fourth fiscal quarter ended January 1, 2019 that have
materially affected, or are reasonably likely to materially affect, our internal control over financial reporting.
ITEM 9B. OTHER INFORMATION
None.
49
PART III
ITEM 10. DIRECTORS, EXECUTIVE OFFICERS AND CORPORATE GOVERNANCE
We have adopted a code of ethics which applies to our Chief Executive Officer, Chief Financial Officer and
Chief Accounting Officer, who are the Company’s principal executive, financial and accounting officers, respectively,
and the Company’s other executive officers and members of the Board of Directors, entitled “Code of Ethics for
Executive Officers, Senior Financial Officers and Directors.” We have also adopted a code of ethics which applies to
other employees entitled “Code of Ethics and Code of Business Conduct.” The codes of ethics are available on our
corporate website at www.thecheesecakefactory.com in the “Governance” section of our “Investors” page. The contents
of our website are not incorporated by reference into this report. We intend to satisfy disclosure requirements under Item
5.05 of Form 8-K regarding an amendment to, or waiver from, a provision of the Code of Ethics for Executive Officers,
Senior Financial Officers and Directors by posting such information on our website, at the address and location specified
above, or as otherwise required by the NASDAQ Global Market.
Information with respect to our executive officers is included in Part I, Item 1 of this report. Other information
required by this item is hereby incorporated by reference from the sections entitled “Election of Directors,” “The Board
and Corporate Governance,” “Designation of Audit Committee Financial Experts,” “Committees of the Board,” and
“Section 16(a) Beneficial Ownership Reporting Compliance” in our definitive proxy statement for the annual meeting of
stockholders to be held on May 30, 2019 (the “Proxy Statement”).
ITEM 11. EXECUTIVE COMPENSATION
The information required by this item is hereby incorporated by reference to the sections entitled “Directors
Compensation,” “Executive Compensation” and “Compensation Committee Interlocks and Insider Participation” in the
Proxy Statement.
ITEM 12. SECURITY OWNERSHIP OF CERTAIN BENEFICIAL OWNERS AND MANAGEMENT AND
RELATED STOCKHOLDER MATTERS
The information required by this item is hereby incorporated by reference to the section entitled “Beneficial
Ownership of Principal Stockholders and Management” and “Equity Compensation Plan Information” in the Proxy
Statement.
ITEM 13. CERTAIN RELATIONSHIPS AND RELATED TRANSACTIONS, AND DIRECTOR
INDEPENDENCE
The information required by this item is hereby incorporated by reference to the sections entitled “Policies
Regarding Review, Approval or Ratification of Transactions with Related Persons” and “The Board and Corporate
Governance” in the Proxy Statement.
ITEM 14. PRINCIPAL ACCOUNTING FEES AND SERVICES
The information required by this item is hereby incorporated by reference to the section entitled “Independent
Registered Public Accounting Firm Fees and Services” (in the proposal entitled “Ratification of Selection of
Independent Registered Public Accounting Firm”) in the Proxy Statement.
50
PART IV
ITEM 15. EXHIBITS, FINANCIAL STATEMENT SCHEDULES
The following documents are filed as a part of this Report:
(a) 1. Financial statements:
The consolidated financial statements required to be filed hereunder are listed in the
Index to Consolidated Financial Statements on page 51 of this report.
2. Financial statement schedules:
All schedules have been omitted because they are not applicable, not required or the
information has been otherwise supplied in the financial statements or notes to the
financial statements.
3. Exhibits:
The Exhibits required to be filed hereunder are listed in the exhibit index included
herein at page 80.
ITEM 16. FORM 10-K SUMMARY
None.
51
INDEX TO CONSOLIDATED FINANCIAL STATEMENTS
Page
Report of Independent Registered Public Accounting Firm ................................................................................. 52
Consolidated Balance Sheets ................................................................................................................................ 55
Consolidated Statements of Income ...................................................................................................................... 56
Consolidated Statements of Comprehensive Income ............................................................................................ 57
Consolidated Statements of Stockholders’ Equity ................................................................................................ 58
Consolidated Statements of Cash Flows ............................................................................................................... 59
Notes to Consolidated Financial Statements ......................................................................................................... 60
52
Report of Independent Registered Public Accounting Firm
To the Stockholders and Board of Directors
The Cheesecake Factory Incorporated:
Opinion on the Consolidated Financial Statements and Internal Control Over Financial Reporting
We have audited the accompanying consolidated balance sheet of The Cheesecake Factory Incorporated and subsidiaries
(the Company) as of January 1, 2019, the related consolidated statements of income, comprehensive income,
stockholders’ equity, and cash flows for the year then ended, and the related notes (collectively, the consolidated
financial statements). We also have audited the Company’s internal control over financial reporting as of January 1,
2019, based on criteria established in Internal Control — Integrated Framework (2013) issued by the Committee of
Sponsoring Organizations of the Treadway Commission.
In our opinion, the consolidated financial statements referred to above present fairly, in all material respects, the
financial position of the Company as of January 1, 2019, and the results of its operations and its cash flows for the year
then ended, in conformity with U.S. generally accepted accounting principles. Also in our opinion, the Company
maintained, in all material respects, effective internal control over financial reporting as of January 1, 2019 based on
criteria established in Internal Control — Integrated Framework (2013) issued by the Committee of Sponsoring
Organizations of the Treadway Commission.
Change in Accounting Principle
As discussed in Note 1 to the consolidated financial statements, the Company has changed its method of accounting for
revenue from contracts with customers in 2018 due to the adoption of Accounting Standards Codification Topic 606,
Revenue from Contracts with Customers.
Basis for Opinion
The Company’s management is responsible for these consolidated financial statements, for maintaining effective internal
control over financial reporting, and for its assessment of the effectiveness of internal control over financial reporting,
included in the accompanying Management’s Report on Internal Control over Financial Reporting. Our responsibility is
to express an opinion on the Company’s consolidated financial statements and an opinion on the Company’s internal
control over financial reporting based on our audit. We are a public accounting firm registered with the Public Company
Accounting Oversight Board (United States) (PCAOB) and are required to be independent with respect to the Company
in accordance with the U.S. federal securities laws and the applicable rules and regulations of the Securities and
Exchange Commission and the PCAOB.
We conducted our audit in accordance with the standards of the PCAOB. Those standards require that we plan and
perform the audit to obtain reasonable assurance about whether the consolidated financial statements are free of material
misstatement, whether due to error or fraud, and whether effective internal control over financial reporting was
maintained in all material respects.
Our audit of the consolidated financial statements included performing procedures to assess the risks of material
misstatement of the consolidated financial statements, whether due to error or fraud, and performing procedures that
respond to those risks. Such procedures included examining, on a test basis, evidence regarding the amounts and
disclosures in the consolidated financial statements. Our audit also included evaluating the accounting principles used
and significant estimates made by management, as well as evaluating the overall presentation of the consolidated
financial statements. Our audit of internal control over financial reporting included obtaining an understanding of
internal control over financial reporting, assessing the risk that a material weakness exists, and testing and evaluating the
design and operating effectiveness of internal control based on the assessed risk. Our audit also included performing
such other procedures as we considered necessary in the circumstances. We believe that our audit provides a reasonable
basis for our opinion.
Definition and Limitations of Internal Control Over Financial Reporting
A company’s internal control over financial reporting is a process designed to provide reasonable assurance regarding
the reliability of financial reporting and the preparation of financial statements for external purposes in accordance with
generally accepted accounting principles. A company’s internal control over financial reporting includes those policies
and procedures that (1) pertain to the maintenance of records that, in reasonable detail, accurately and fairly reflect the
53
transactions and dispositions of the assets of the company; (2) provide reasonable assurance that transactions are
recorded as necessary to permit preparation of financial statements in accordance with generally accepted accounting
principles, and that receipts and expenditures of the company are being made only in accordance with authorizations of
management and directors of the company; and (3) provide reasonable assurance regarding prevention or timely
detection of unauthorized acquisition, use, or disposition of the company’s assets that could have a material effect on the
financial statements.
Because of its inherent limitations, internal control over financial reporting may not prevent or detect misstatements.
Also, projections of any evaluation of effectiveness to future periods are subject to the risk that controls may become
inadequate because of changes in conditions, or that the degree of compliance with the policies or procedures may
deteriorate.
/s/ KPMG LLP
We have served as the Company’s auditor since 2018.
Los Angeles, California
March 4, 2019
54
Report of Independent Registered Public Accounting Firm
To the Board of Directors and Stockholders of The Cheesecake Factory Incorporated
Opinion on the Financial Statements
We have audited the accompanying consolidated balance sheet of The Cheesecake Factory Incorporated and its
subsidiaries (the “Company”) as of January 2, 2018, and the related consolidated statements of income, comprehensive
income, stockholders’ equity and cash flows for each of the two years in the period ended January 2, 2018, including the
related notes (collectively referred to as the “consolidated financial statements”). In our opinion, the consolidated
financial statements present fairly, in all material respects, the financial position of the Company as of January 2, 2018,
and the results of its operations and its cash flows for each of the two years in the period ended January 2, 2018 in
conformity with accounting principles generally accepted in the United States of America.
Basis for Opinion
These consolidated financial statements are the responsibility of the Company’s management. Our responsibility is to
express an opinion on the Company’s consolidated financial statements based on our audits. We are a public accounting
firm registered with the Public Company Accounting Oversight Board (United States) (PCAOB) and are required to be
independent with respect to the Company in accordance with the U.S. federal securities laws and the applicable rules and
regulations of the Securities and Exchange Commission and the PCAOB.
We conducted our audits of these consolidated financial statements in accordance with the standards of the PCAOB.
Those standards require that we plan and perform the audit to obtain reasonable assurance about whether the
consolidated financial statements are free of material misstatement, whether due to error or fraud.
Our audits included performing procedures to assess the risks of material misstatement of the consolidated financial
statements, whether due to error or fraud, and performing procedures that respond to those risks. Such procedures
included examining, on a test basis, evidence regarding the amounts and disclosures in the consolidated financial
statements. Our audits also included evaluating the accounting principles used and significant estimates made by
management, as well as evaluating the overall presentation of the consolidated financial statements. We believe that
our audits provide a reasonable basis for our opinion.
/s/ PricewaterhouseCoopers LLP
Los Angeles, California
February 28, 2018
We served as the Company’s auditor from at least 1992 to 2018. We have not been able to determine the specific year
we began serving as auditor of the Company.
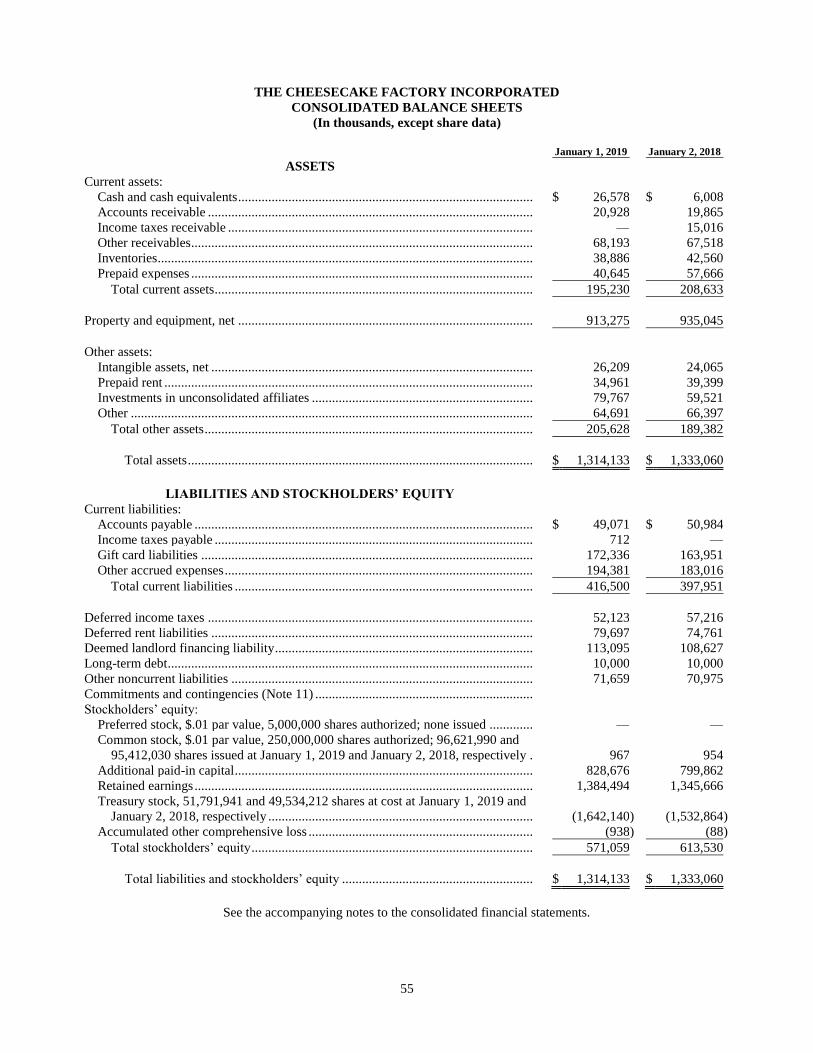
55
THE CHEESECAKE FACTORY INCORPORATED
CONSOLIDATED BALANCE SHEETS
(In thousands, except share data)
January 1, 2019 January 2, 2018
ASSETS
Current assets:
Cash and cash equivalents ........................................................................................ $ 26,578 $ 6,008
Accounts receivable ................................................................................................. 20,928 19,865
Income taxes receivable ........................................................................................... — 15,016
Other receivables ...................................................................................................... 68,193 67,518
Inventories ................................................................................................................ 38,886 42,560
Prepaid expenses ...................................................................................................... 40,645 57,666
Total current assets ............................................................................................... 195,230 208,633
Property and equipment, net ........................................................................................ 913,275 935,045
Other assets:
Intangible assets, net ................................................................................................ 26,209 24,065
Prepaid rent .............................................................................................................. 34,961 39,399
Investments in unconsolidated affiliates .................................................................. 79,767 59,521
Other ........................................................................................................................ 64,691 66,397
Total other assets .................................................................................................. 205,628 189,382
Total assets ....................................................................................................... $ 1,314,133 $ 1,333,060
LIABILITIES AND STOCKHOLDERS’ EQUITY
Current liabilities:
Accounts payable ..................................................................................................... $ 49,071 $ 50,984
Income taxes payable ............................................................................................... 712 —
Gift card liabilities ................................................................................................... 172,336 163,951
Other accrued expenses ............................................................................................ 194,381 183,016
Total current liabilities ......................................................................................... 416,500 397,951
Deferred income taxes ................................................................................................. 52,123 57,216
Deferred rent liabilities ................................................................................................ 79,697 74,761
Deemed landlord financing liability ............................................................................. 113,095 108,627
Long-term debt ............................................................................................................. 10,000 10,000
Other noncurrent liabilities .......................................................................................... 71,659 70,975
Commitments and contingencies (Note 11) .................................................................
Stockholders’ equity:
Preferred stock, $.01 par value, 5,000,000 shares authorized; none issued ............. — —
Common stock, $.01 par value, 250,000,000 shares authorized; 96,621,990 and
95,412,030 shares issued at January 1, 2019 and January 2, 2018, respectively . 967 954
Additional paid-in capital ......................................................................................... 828,676 799,862
Retained earnings ..................................................................................................... 1,384,494 1,345,666
Treasury stock, 51,791,941 and 49,534,212 shares at cost at January 1, 2019 and
January 2, 2018, respectively ............................................................................... (1,642,140 ) (1,532,864 )
Accumulated other comprehensive loss ................................................................... (938 ) (88 )
Total stockholders’ equity .................................................................................... 571,059 613,530
Total liabilities and stockholders’ equity ......................................................... $ 1,314,133 $ 1,333,060
See the accompanying notes to the consolidated financial statements.
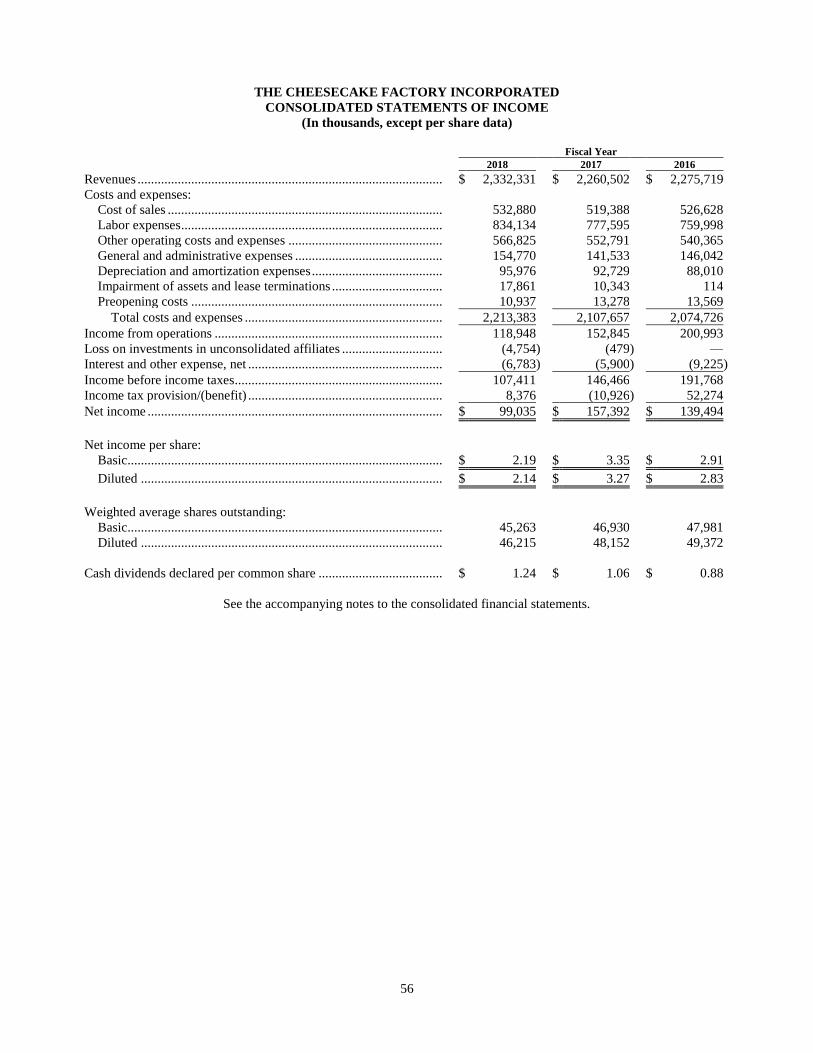
56
THE CHEESECAKE FACTORY INCORPORATED
CONSOLIDATED STATEMENTS OF INCOME
(In thousands, except per share data)
Fiscal Year
2018 2017 2016
Revenues ........................................................................................... $ 2,332,331 $ 2,260,502 $ 2,275,719
Costs and expenses:
Cost of sales .................................................................................. 532,880 519,388 526,628
Labor expenses .............................................................................. 834,134 777,595 759,998
Other operating costs and expenses .............................................. 566,825 552,791 540,365
General and administrative expenses ............................................ 154,770 141,533 146,042
Depreciation and amortization expenses ....................................... 95,976 92,729 88,010
Impairment of assets and lease terminations ................................. 17,861 10,343 114
Preopening costs ........................................................................... 10,937 13,278 13,569
Total costs and expenses ........................................................... 2,213,383 2,107,657 2,074,726
Income from operations .................................................................... 118,948 152,845 200,993
Loss on investments in unconsolidated affiliates .............................. (4,754 ) (479 ) —
Interest and other expense, net .......................................................... (6,783 ) (5,900 ) (9,225 )
Income before income taxes.............................................................. 107,411 146,466 191,768
Income tax provision/(benefit) .......................................................... 8,376 (10,926 ) 52,274
Net income ........................................................................................ $ 99,035 $ 157,392 $ 139,494
Net income per share:
Basic .............................................................................................. $ 2.19 $ 3.35 $ 2.91
Diluted .......................................................................................... $ 2.14 $ 3.27 $ 2.83
Weighted average shares outstanding:
Basic .............................................................................................. 45,263 46,930 47,981
Diluted .......................................................................................... 46,215 48,152 49,372
Cash dividends declared per common share ..................................... $ 1.24 $ 1.06 $ 0.88
See the accompanying notes to the consolidated financial statements.
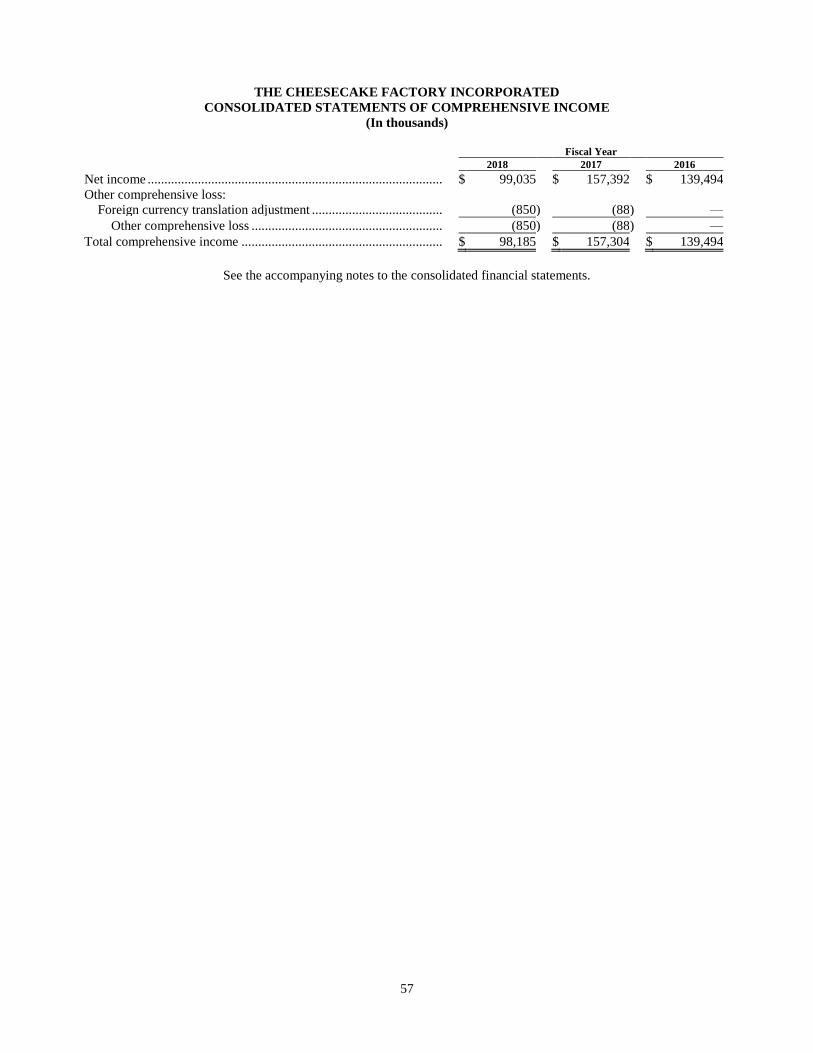
57
THE CHEESECAKE FACTORY INCORPORATED
CONSOLIDATED STATEMENTS OF COMPREHENSIVE INCOME
(In thousands)
Fiscal Year
2018 2017 2016
Net income ........................................................................................ $ 99,035 $ 157,392 $ 139,494
Other comprehensive loss:
Foreign currency translation adjustment ....................................... (850 ) (88 ) —
Other comprehensive loss ......................................................... (850 ) (88 ) —
Total comprehensive income ............................................................ $ 98,185 $ 157,304 $ 139,494
See the accompanying notes to the consolidated financial statements.
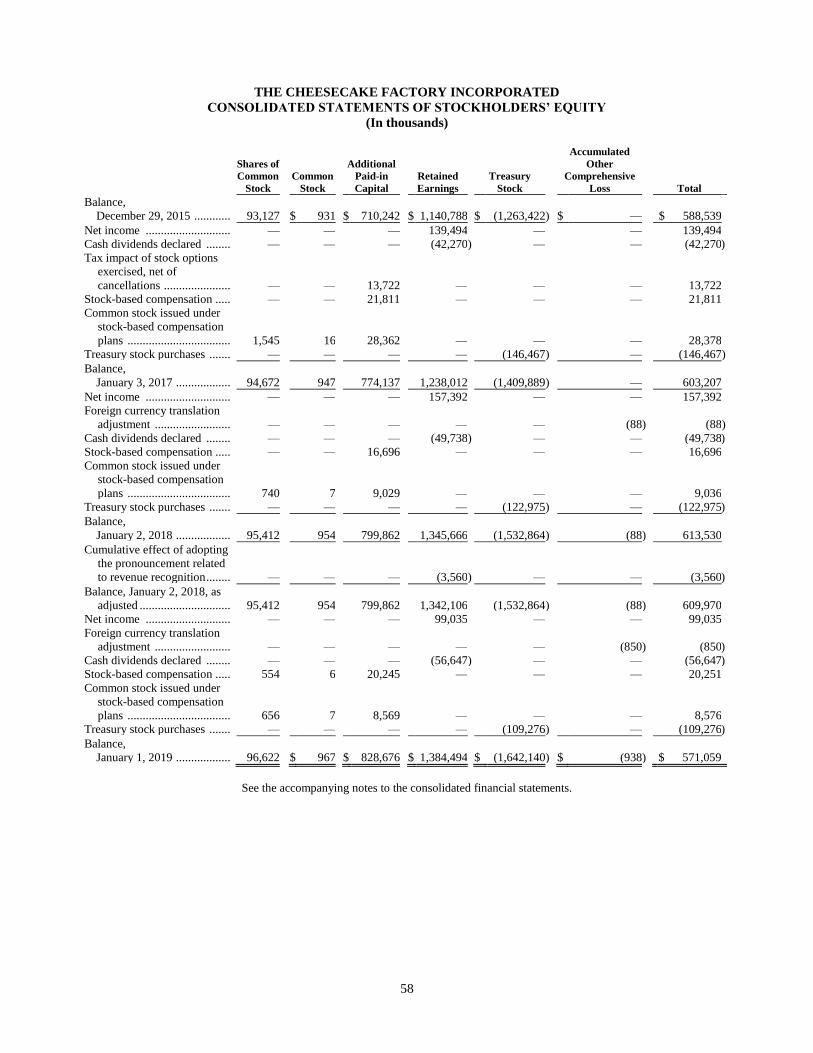
58
THE CHEESECAKE FACTORY INCORPORATED
CONSOLIDATED STATEMENTS OF STOCKHOLDERS’ EQUITY
(In thousands)
Shares of
Common
Stock
Common
Stock
Additional
Paid-in
Capital
Retained
Earnings
Treasury
Stock
Accumulated
Other
Comprehensive
Loss Total
Balance,
December 29, 2015 ............ 93,127 $ 931 $ 710,242 $ 1,140,788 $ (1,263,422 ) $ — $ 588,539
Net income ............................ — — — 139,494 — — 139,494
Cash dividends declared ........ — — — (42,270 ) — — (42,270 )
Tax impact of stock options
exercised, net of
cancellations ...................... — — 13,722 — — — 13,722
Stock-based compensation ..... — — 21,811 — — — 21,811
Common stock issued under
stock-based compensation
plans .................................. 1,545 16 28,362 — — — 28,378
Treasury stock purchases ....... — — — — (146,467 ) — (146,467 )
Balance,
January 3, 2017 .................. 94,672 947 774,137 1,238,012 (1,409,889 ) — 603,207
Net income ............................ — — — 157,392 — — 157,392
Foreign currency translation
adjustment ......................... — — — — — (88 ) (88 )
Cash dividends declared ........ — — — (49,738 ) — — (49,738 )
Stock-based compensation ..... — — 16,696 — — — 16,696
Common stock issued under
stock-based compensation
plans .................................. 740 7 9,029 — — — 9,036
Treasury stock purchases ....... — — — — (122,975 ) — (122,975 )
Balance,
January 2, 2018 .................. 95,412 954 799,862 1,345,666 (1,532,864 ) (88 ) 613,530
Cumulative effect of adopting
the pronouncement related
to revenue recognition ........ — — — (3,560 ) — — (3,560 )
Balance, January 2, 2018, as
adjusted .............................. 95,412 954 799,862 1,342,106 (1,532,864 ) (88 ) 609,970
Net income ............................ — — — 99,035 — — 99,035
Foreign currency translation
adjustment ......................... — — — — — (850 ) (850 )
Cash dividends declared ........ — — — (56,647 ) — — (56,647 )
Stock-based compensation ..... 554 6 20,245 — — — 20,251
Common stock issued under
stock-based compensation
plans .................................. 656 7 8,569 — — — 8,576
Treasury stock purchases ....... — — — — (109,276 ) — (109,276 )
Balance,
January 1, 2019 .................. 96,622 $ 967 $ 828,676 $ 1,384,494 $ (1,642,140 ) $ (938 ) $ 571,059
See the accompanying notes to the consolidated financial statements.
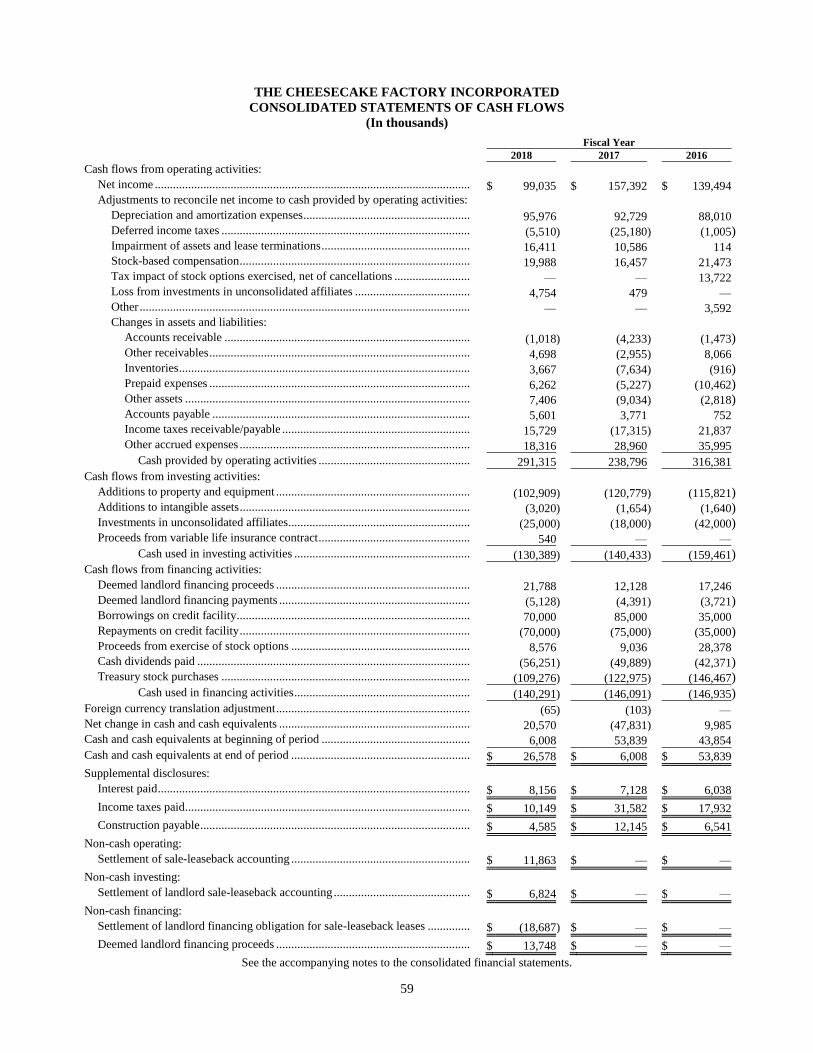
59
THE CHEESECAKE FACTORY INCORPORATED
CONSOLIDATED STATEMENTS OF CASH FLOWS
(In thousands)
Fiscal Year
2018 2017 2016
Cash flows from operating activities: Net income ........................................................................................................ $ 99,035 $ 157,392 $ 139,494 Adjustments to reconcile net income to cash provided by operating activities:
Depreciation and amortization expenses ....................................................... 95,976 92,729 88,010 Deferred income taxes .................................................................................. (5,510 ) (25,180 ) (1,005 ) Impairment of assets and lease terminations ................................................. 16,411 10,586 114 Stock-based compensation ............................................................................ 19,988 16,457 21,473 Tax impact of stock options exercised, net of cancellations ......................... — — 13,722 Loss from investments in unconsolidated affiliates ...................................... 4,754 479 — Other ............................................................................................................. — — 3,592 Changes in assets and liabilities:
Accounts receivable ................................................................................. (1,018 ) (4,233 ) (1,473 ) Other receivables ...................................................................................... 4,698 (2,955 ) 8,066 Inventories ................................................................................................ 3,667 (7,634 ) (916 ) Prepaid expenses ...................................................................................... 6,262 (5,227 ) (10,462 ) Other assets .............................................................................................. 7,406 (9,034 ) (2,818 ) Accounts payable ..................................................................................... 5,601 3,771 752 Income taxes receivable/payable .............................................................. 15,729 (17,315 ) 21,837 Other accrued expenses ............................................................................ 18,316 28,960 35,995
Cash provided by operating activities .................................................. 291,315 238,796 316,381 Cash flows from investing activities:
Additions to property and equipment ................................................................ (102,909 ) (120,779 ) (115,821 ) Additions to intangible assets ............................................................................ (3,020 ) (1,654 ) (1,640 ) Investments in unconsolidated affiliates............................................................ (25,000 ) (18,000 ) (42,000 ) Proceeds from variable life insurance contract .................................................. 540 — —
Cash used in investing activities .......................................................... (130,389 ) (140,433 ) (159,461 ) Cash flows from financing activities:
Deemed landlord financing proceeds ................................................................ 21,788 12,128 17,246 Deemed landlord financing payments ............................................................... (5,128 ) (4,391 ) (3,721 ) Borrowings on credit facility ............................................................................. 70,000 85,000 35,000 Repayments on credit facility ............................................................................ (70,000 ) (75,000 ) (35,000 ) Proceeds from exercise of stock options ........................................................... 8,576 9,036 28,378 Cash dividends paid .......................................................................................... (56,251 ) (49,889 ) (42,371 ) Treasury stock purchases .................................................................................. (109,276 ) (122,975 ) (146,467 )
Cash used in financing activities .......................................................... (140,291 ) (146,091 ) (146,935 ) Foreign currency translation adjustment ................................................................ (65 ) (103 ) — Net change in cash and cash equivalents ............................................................... 20,570 (47,831 ) 9,985 Cash and cash equivalents at beginning of period ................................................. 6,008 53,839 43,854 Cash and cash equivalents at end of period ........................................................... $ 26,578 $ 6,008 $ 53,839
Supplemental disclosures: Interest paid ....................................................................................................... $ 8,156 $ 7,128 $ 6,038
Income taxes paid .............................................................................................. $ 10,149 $ 31,582 $ 17,932
Construction payable ......................................................................................... $ 4,585 $ 12,145 $ 6,541
Non-cash operating: Settlement of sale-leaseback accounting ........................................................... $ 11,863 $ — $ —
Non-cash investing: Settlement of landlord sale-leaseback accounting ............................................. $ 6,824 $ — $ —
Non-cash financing: Settlement of landlord financing obligation for sale-leaseback leases .............. $ (18,687 ) $ — $ —
Deemed landlord financing proceeds ................................................................ $ 13,748 $ — $ —
See the accompanying notes to the consolidated financial statements.
60
THE CHEESECAKE FACTORY INCORPORATED
NOTES TO CONSOLIDATED FINANCIAL STATEMENTS
1. Summary of Significant Accounting Policies
Description of Business
As of March 4, 2019, The Cheesecake Factory Incorporated operated 218 Company-owned restaurants under
The Cheesecake Factory®, Grand Lux Cafe®, RockSugar Southeast Asian Kitchen® marks and one under the Social
Monk Asian KitchenTM mark. In addition, 21 The Cheesecake Factory branded restaurants in the Middle East, Mexico,
the Chinese Mainland and Special Administrative Region of Hong Kong were operated by third parties under licensing
agreements. We also operated two bakery production facilities that produce desserts for our restaurants, international
licensees and third-party bakery customers. We are selectively pursuing other means to leverage our competitive
strengths, including investing in or acquiring new restaurant concepts (such as North Italia® and Flower Child®),
expanding The Cheesecake Factory® brand to other retail opportunities through The Cheesecake Factory At Home®
consumer packaged goods, and evaluating the future potential of Social Monk Asian Kitchen, our new fast casual
concept.
Basis of Presentation
The accompanying consolidated financial statements include the accounts of The Cheesecake Factory
Incorporated and its wholly owned subsidiaries (referred to herein as the “Company,” “we,” “us” and “our”) prepared in
accordance with accounting principles generally accepted in the United States (“GAAP”). All intercompany accounts
and transactions for the periods presented have been eliminated in consolidation.
We utilize a 52/53-week fiscal year ending on the Tuesday closest to December 31 for financial reporting
purposes. Fiscal years 2018 and 2017 each consisted of 52 weeks, while fiscal year 2016 consisted of 53 weeks.
In fiscal 2018, we separately disclosed our investments in unconsolidated affiliates on the consolidated balance
sheet and our related share of losses on the consolidated statement of income and statement of cash flow. Corresponding
prior year balances were reclassified to conform to the current year presentation.
In the fourth quarter of fiscal 2018, it was determined that complimentary meals had not been appropriately
presented in our consolidated statements of income, resulting in an overstatement of our revenue and operating expenses.
The Company corrected the error related to prior interim periods during 2018 by reclassifying complimentary meals out
of revenue and other operating expenses in the amount of $23.3 million for fiscal 2018. Further, the associated cost of
complimentary meals was reclassified as other operating expenses versus cost of sales and labor in the amount of $5.8
million and $4.4 million, respectively. The reclassifications had no impact on previously reported income from
operations, net income, or net income per share. The Company did not correct the 2017 and 2016 annual financial
statements as the Company does not consider the impact of the prior period error to be material to the 2017 and 2016
consolidated financial statements.
Use of Estimates
The preparation of financial statements in conformity with GAAP requires us to make estimates and assumptions
for the reporting periods covered by the financial statements. These estimates and assumptions affect the reported
amounts of assets, liabilities, revenues and expenses, and the disclosure of contingent liabilities. Actual results could
differ from these estimates.
Cash and Cash Equivalents
Amounts receivable from credit card processors, totaling $17.3 million and $13.8 million at January 1, 2019 and
January 2, 2018, respectively, are considered cash equivalents because they are both short-term and highly liquid in
nature and are typically converted to cash within three days of the sales transaction. Our cash management system
provides for the funding of all major bank disbursement accounts on a daily basis as checks are presented for payment.
Under this system, outstanding checks are in excess of the cash balances at certain banks, which creates book overdrafts.
Book overdrafts are presented as a current liability in other accrued expenses on our consolidated balance sheet.
61
Accounts and Other Receivables
Our accounts receivable principally result from credit sales to bakery customers. Other receivables consist
primarily of amounts due from our gift card distributors and landlords.
Concentration of Credit Risk
Financial instruments that potentially subject us to a concentration of credit risk are cash and cash equivalents
and receivables. We maintain our day-to-day operating cash balances in non-interest-bearing transaction accounts, which
are insured by the Federal Deposit Insurance Corporation (“FDIC”) up to $250,000. We invest our excess cash in a
money market deposit account, which is insured by the FDIC up to $250,000. Although we maintain balances that
exceed the federally insured limit, we have not experienced any losses related to this balance, and we believe credit risk
to be minimal.
We consider the concentration of credit risk for accounts receivable to be minimal due to the payment histories
and general financial condition of our larger bakery customers. Concentration of credit risk related to other receivables is
limited as this balance is comprised primarily of amounts due from our gift card distributors and landlords.
Fair Value of Financial Instruments
For cash equivalents, the carrying amount approximates fair value because of the short maturity of these
instruments. The fair value of deemed landlord financing liabilities is determined using current applicable rates for
similar instruments as of the balance sheet date in accordance with Level 2 of a three-level hierarchy established by
accounting standards. Level 2 inputs are observable for the asset or liability, either directly or indirectly, including
quoted prices in active markets for similar assets or liabilities. At January 1, 2019, the fair value of our deemed landlord
financing liabilities was $117.0 million versus a carrying value of $118.6 million.
Inventories
Inventories consist of restaurant food and other supplies, bakery raw materials, and bakery finished goods and are
stated at the lower of cost or net realizable value on an average cost basis at the restaurants and on a first-in, first-out
basis at the bakeries.
Property and Equipment
We record property and equipment at cost less accumulated depreciation. Improvements are capitalized while
repairs and maintenance costs are expensed as incurred. Depreciation and amortization are calculated using the straight-
line method over the estimated useful life of the assets or the lease term, whichever is shorter. Leasehold improvements
include the cost of our internal development and construction department. Depreciation and amortization periods are as
follows:
Buildings and land improvements ............................ 25 to 30 years
Leasehold improvements ......................................... 10 to 30 years
Furnishings, fixtures and equipment ........................ 3 to 15 years
Computer software and equipment .......................... 5 years
Gains and losses related to property and equipment disposals are recorded in depreciation and amortization
expenses.
Intangible assets, net
Our leasehold acquisition assets and non-transferable alcoholic beverage licenses are amortized over the
associated lease term and are tested for impairment using the methodology discussed in impairment of long-lived assets
and lease terminations. At January 1, 2019 and January 2, 2018, the amounts included in intangibles, net for these items
were $9.1 million and $8.9 million, respectively. Amortization expenses related to these assets was $0.6 million for
fiscal 2018, 2017 and 2016.
62
Our trademarks and transferable alcoholic beverage licenses have indefinite lives and, therefore, are not subject
to amortization. At January 1, 2019 and January 2, 2018, the amounts included in intangibles, net for these items were
$17.1 million and $15.2 million, respectively. We test these assets for impairment at least annually by comparing the fair
value of each asset with its carrying amount.
Impairment of Long-Lived Assets and Lease Terminations
We assess the potential impairment of our long-lived assets on an annual basis or whenever events or changes in
circumstances indicate the carrying value of the assets or asset group may not be recoverable. Factors considered
include, but are not limited to, negative cash flow, significant underperformance relative to historical or projected future
operating results, significant changes in the manner in which an asset is being used, an expectation that an asset will be
disposed of significantly before the end of its previously estimated useful life and significant negative industry or
economic trends. At any given time, we may be monitoring a small number of locations, and future impairment charges
could be required if individual restaurant performance does not improve or we make the decision to close or relocate a
restaurant.
We have determined that our asset group for impairment testing is comprised of the assets and liabilities of each
of our individual restaurants, as this is the lowest level of identifiable cash flows. We have identified leasehold
improvements as the primary asset because it is the most significant component of our restaurant assets, it is the
principal asset from which our restaurants derive their cash flow generating capacity and it has the longest remaining
useful life. The recoverability is assessed by comparing the carrying value of the assets to the undiscounted cash flows
expected to be generated by these assets. Impairment losses are measured as the amount by which the carrying values of
the assets exceed their fair values.
In fiscal 2018, we recorded $17.9 million of lease termination costs and impairment expense in fiscal 2018
related to three The Cheesecake Factory restaurants, including two closures, one Grand Lux Cafe and one RockSugar
Southeast Asian Kitchen. In fiscal 2017, we recorded $10.3 million of accelerated depreciation and impairment expense
related to three The Cheesecake Factory restaurants, including one relocation and one lease expiration, and one Grand
Lux Cafe. In fiscal 2016, we recorded $0.1 million of accelerated depreciation expense related to the planned relocation
of one The Cheesecake Factory restaurant, which subsequently took place in fiscal 2017.
Investments in Unconsolidated Affiliates
During fiscal years 2018, 2017 and 2016, we made minority equity investments in two restaurant concepts,
North Italia and Flower Child, bringing our percentage of ownership to 49% and 46%, respectively, at January 1, 2019.
Since we hold a number of rights with regard to participation in policy-making processes, but do not control these
entities, we account for these investments under the equity method. Accordingly, we recognize our proportionate share
of the reported earnings or losses of these entities on the consolidated statements of income and as an adjustment to our
investments on the consolidated balance sheets.
We assess the potential impairment of our equity investments whenever events or changes in circumstances
indicate that a decrease in value of the investment has occurred that is other than temporary, in which case we would
recognize the decrease even though it is in excess of what would otherwise be recognized by application of the equity
method.
Revenue Recognition
Our revenues consist of sales at our Company-owned restaurants, sales from our bakery operations to our
licensees and other third-party customers, royalties from our licensees’ restaurant sales and from consumer packaged
goods sales, and licensee development and site fees. Revenues are presented net of sales taxes. Sales tax collected is
included in other accrued expenses until the taxes are remitted to the appropriate taxing authorities.
Revenues from restaurant sales are recognized when payment is tendered at the point of sale. Revenues from
bakery sales are recognized upon transfer of title and risk to customers. Royalty revenues are recognized in the period
the related sales occur, utilizing the sale-based royalty exception available under current accounting guidance. Our
consumer packaged goods minimum guarantees do not require distinct performance obligations. Therefore, related
revenue is recognized on a straight-line basis over the life of the applicable agreements, ranging from one to three years.
63
As our development and site fee agreements do not contain distinct performance obligations, related revenue is
recognized on a straight-line basis over the life of the applicable agreements, ranging from eight to 30 years.
In fiscal 2018, we deferred revenue of $0.9 million for new minimum guarantees for consumer packaged goods
and recognized minimum guarantee revenue of $0.8 million. In fiscal 2018, we deferred revenue of $0.2 million for new
site and development agreements and recognized revenue of $0.4 million. Prior to the adoption of the new revenue
recognition standard, we recognized revenue for development fees upon execution of new development agreements and
for site fees upon our approval of new restaurant sites. Under previous guidance, we would have recognized site and
development fee revenue of $0.2 million during fiscal 2018.
We recognize a liability upon the sale of our gift cards and recognize revenue when these gift cards are
redeemed in our restaurants. Based on our historical redemption patterns, we can reasonably estimate the amount of gift
cards for which redemption is remote, which is referred to as “breakage.” Breakage is recognized over a three-year
period in proportion to historical redemption trends and is classified as revenues in our consolidated statements of
income. We recognized $8.0 million, $7.9 million and $7.6 million of gift card breakage in fiscal years 2018, 2017 and
2016, respectively. Incremental direct costs related to gift card sales, including commissions and credit card fees, are
deferred and recognized in earnings in the same pattern as the related gift card revenue. There were no changes to our
accounting for gift card revenue and related costs upon adoption of the new revenue recognition standard.
Certain of our promotional programs include multiple element arrangements that incorporate various
performance obligations. We allocate revenue using the relative selling price of each performance obligation considering
the likelihood of redemption and recognize revenue upon satisfaction of each performance obligation. During fiscal
2018, we deferred revenue of $7.0 million related to promotional programs and recognized $5.9 million of previously
deferred revenue related to promotional programs.
(See Recent Accounting Pronouncements for further discussion of our adoption of the new revenue recognition
accounting guidance.)
Leases
We currently lease all of our restaurant locations. We evaluate each lease to determine its appropriate
classification as an operating or capital lease for financial reporting purposes. All of our restaurant leases are classified
as operating leases. Minimum base rent, which generally escalates over the term of the lease, is recorded on a straight-
line basis over the lease term. The lease term includes the build-out period for our leases, where no rent payments are
typically due under the terms of the lease. Contingent rent expense, which is based on a percentage of revenues, is
recorded as incurred to the extent it exceeds minimum base rent per the lease agreement.
We expend cash for leasehold improvements and furnishings, fixtures and equipment to build out and equip our
leased premises. We may also expend cash for structural additions that we make to leased premises. Generally a portion
of the leasehold improvements and building costs are reimbursed to us by our landlords as construction contributions. If
obtained, landlord construction contributions usually take the form of up-front cash, full or partial credits against our
future minimum or percentage rents, or a combination thereof. Depending on the specifics of the leased space and the
lease agreement, amounts paid for structural components are recorded during the construction period as either prepaid
rent or property and equipment and the landlord construction contributions are recorded as either an offset to prepaid
rent or as a deemed landlord financing liability.
For those leases for which we are deemed the owner of the property during construction, upon completion, we
perform an analysis to determine if they qualify for sale-leaseback treatment. For those qualifying leases, the deemed
landlord financing liability and the associated property and equipment are removed and the difference is reclassified to
either prepaid or deferred rent and amortized over the lease term as an increase or decrease to rent expense. If the lease
does not qualify for sale-leaseback treatment, the deemed landlord financing liability is amortized over the lease term
based on the rent payments designated in the lease agreement.
64
Self-Insurance Liabilities
We retain the financial responsibility for a significant portion of our risks and associated liabilities with respect to
workers’ compensation, general liability, staff member health benefits, employment practices and other insurable risks.
The accrued liabilities associated with our self-insured programs are based on our estimate of the ultimate costs to settle
known claims, as well as claims incurred but not yet reported to us (“IBNR”) as of the balance sheet date and are
recorded in other accrued expenses. Our estimated liabilities, which are not discounted, are based on information
provided by our insurance brokers and insurers, combined with our judgment regarding a number of assumptions and
factors, including the frequency and severity of claims, claims development history, case jurisdiction, applicable
legislation and our claims settlement practices.
Stock-Based Compensation
We maintain stock-based incentive plans under which equity awards may be granted to staff members and
consultants. We account for the awards based on fair value measurement guidance and amortize to expense over the
vesting period using a straight-line or graded-vesting schedule, as applicable. (See Note 13 for further discussion of our
stock-based compensation.)
Advertising Costs
We expense advertising production costs at the time the advertising first takes place. All other advertising costs
are expensed as incurred. Most of our advertising costs are included in other operating costs and expenses and were $6.1
million, $6.1 million and $7.4 million in fiscal 2018, 2017 and 2016, respectively.
Preopening Costs
Preopening costs include all costs to relocate and compensate restaurant management staff members during the
preopening period, costs to recruit and train hourly restaurant staff members, and wages, travel and lodging costs for our
opening training team and other support staff members. Also included are expenses for maintaining a roster of trained
managers for pending openings, the associated temporary housing and other costs necessary to relocate managers in
alignment with future restaurant opening and operating needs, and corporate travel and support activities. We expense
preopening costs as incurred.
Income Taxes
We provide for federal, state and foreign income taxes currently payable and for deferred taxes that result from
differences between financial accounting rules and tax laws governing the timing of recognition of various income and
expense items. We recognize deferred income tax assets and liabilities for the future tax effects of such temporary
differences based on the difference between the financial statement and tax bases of existing assets and liabilities using
the statutory rates expected in the years in which the differences are expected to reverse. The effect on deferred taxes of
any enacted change in tax rates is recognized in income in the period that includes the enactment date. Income tax credits
are recorded as a reduction of tax expense.
We account for uncertain tax positions under Financial Accounting Standards Board (“FASB”) guidance, which
requires that a position taken or expected to be taken in a tax return be recognized (or derecognized) in the financial
statements when it is more likely than not (i.e., a likelihood of more than 50%) that the position would be sustained on
its technical merits upon examination by tax authorities, taking into account available administrative remedies and
litigation. A recognized tax position is then measured at the largest amount of benefit that is greater than 50% likely of
being realized upon ultimate resolution. We recognize interest related to uncertain tax positions in income tax expense.
Penalties related to uncertain tax positions are recorded in general and administrative expenses.
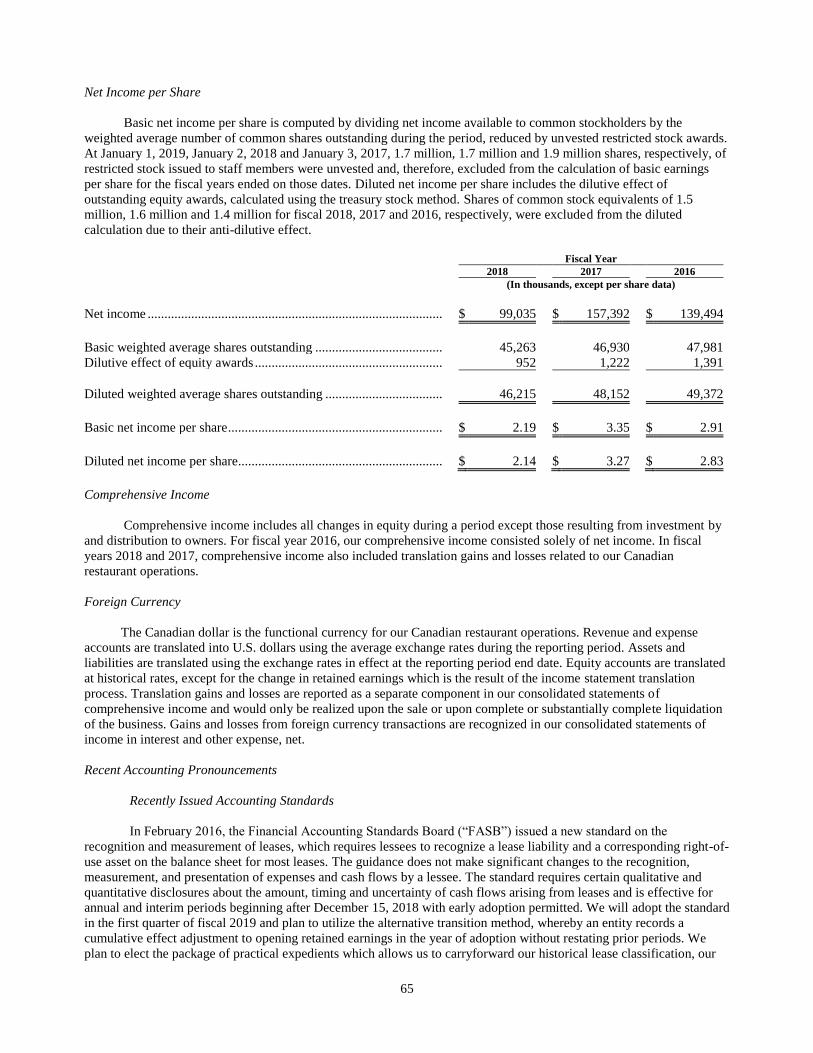
65
Net Income per Share
Basic net income per share is computed by dividing net income available to common stockholders by the
weighted average number of common shares outstanding during the period, reduced by unvested restricted stock awards.
At January 1, 2019, January 2, 2018 and January 3, 2017, 1.7 million, 1.7 million and 1.9 million shares, respectively, of
restricted stock issued to staff members were unvested and, therefore, excluded from the calculation of basic earnings
per share for the fiscal years ended on those dates. Diluted net income per share includes the dilutive effect of
outstanding equity awards, calculated using the treasury stock method. Shares of common stock equivalents of 1.5
million, 1.6 million and 1.4 million for fiscal 2018, 2017 and 2016, respectively, were excluded from the diluted
calculation due to their anti-dilutive effect.
Fiscal Year
2018 2017 2016
(In thousands, except per share data)
Net income ........................................................................................ $ 99,035 $ 157,392 $ 139,494
Basic weighted average shares outstanding ...................................... 45,263 46,930 47,981
Dilutive effect of equity awards ........................................................ 952 1,222 1,391
Diluted weighted average shares outstanding ................................... 46,215 48,152 49,372
Basic net income per share ................................................................ $ 2.19 $ 3.35 $ 2.91
Diluted net income per share............................................................. $ 2.14 $ 3.27 $ 2.83
Comprehensive Income
Comprehensive income includes all changes in equity during a period except those resulting from investment by
and distribution to owners. For fiscal year 2016, our comprehensive income consisted solely of net income. In fiscal
years 2018 and 2017, comprehensive income also included translation gains and losses related to our Canadian
restaurant operations.
Foreign Currency
The Canadian dollar is the functional currency for our Canadian restaurant operations. Revenue and expense
accounts are translated into U.S. dollars using the average exchange rates during the reporting period. Assets and
liabilities are translated using the exchange rates in effect at the reporting period end date. Equity accounts are translated
at historical rates, except for the change in retained earnings which is the result of the income statement translation
process. Translation gains and losses are reported as a separate component in our consolidated statements of
comprehensive income and would only be realized upon the sale or upon complete or substantially complete liquidation
of the business. Gains and losses from foreign currency transactions are recognized in our consolidated statements of
income in interest and other expense, net.
Recent Accounting Pronouncements
Recently Issued Accounting Standards
In February 2016, the Financial Accounting Standards Board (“FASB”) issued a new standard on the
recognition and measurement of leases, which requires lessees to recognize a lease liability and a corresponding right-of-
use asset on the balance sheet for most leases. The guidance does not make significant changes to the recognition,
measurement, and presentation of expenses and cash flows by a lessee. The standard requires certain qualitative and
quantitative disclosures about the amount, timing and uncertainty of cash flows arising from leases and is effective for
annual and interim periods beginning after December 15, 2018 with early adoption permitted. We will adopt the standard
in the first quarter of fiscal 2019 and plan to utilize the alternative transition method, whereby an entity records a
cumulative effect adjustment to opening retained earnings in the year of adoption without restating prior periods. We
plan to elect the package of practical expedients which allows us to carryforward our historical lease classification, our
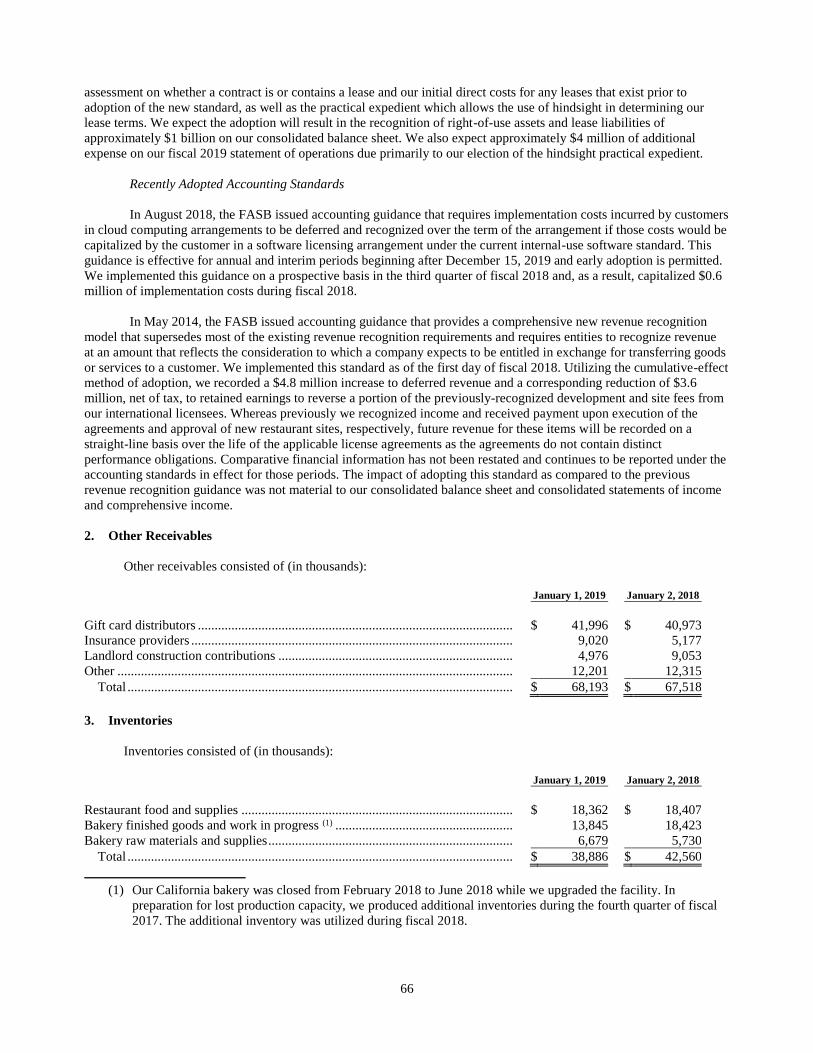
66
assessment on whether a contract is or contains a lease and our initial direct costs for any leases that exist prior to
adoption of the new standard, as well as the practical expedient which allows the use of hindsight in determining our
lease terms. We expect the adoption will result in the recognition of right-of-use assets and lease liabilities of
approximately $1 billion on our consolidated balance sheet. We also expect approximately $4 million of additional
expense on our fiscal 2019 statement of operations due primarily to our election of the hindsight practical expedient.
Recently Adopted Accounting Standards
In August 2018, the FASB issued accounting guidance that requires implementation costs incurred by customers
in cloud computing arrangements to be deferred and recognized over the term of the arrangement if those costs would be
capitalized by the customer in a software licensing arrangement under the current internal-use software standard. This
guidance is effective for annual and interim periods beginning after December 15, 2019 and early adoption is permitted.
We implemented this guidance on a prospective basis in the third quarter of fiscal 2018 and, as a result, capitalized $0.6
million of implementation costs during fiscal 2018.
In May 2014, the FASB issued accounting guidance that provides a comprehensive new revenue recognition
model that supersedes most of the existing revenue recognition requirements and requires entities to recognize revenue
at an amount that reflects the consideration to which a company expects to be entitled in exchange for transferring goods
or services to a customer. We implemented this standard as of the first day of fiscal 2018. Utilizing the cumulative-effect
method of adoption, we recorded a $4.8 million increase to deferred revenue and a corresponding reduction of $3.6
million, net of tax, to retained earnings to reverse a portion of the previously-recognized development and site fees from
our international licensees. Whereas previously we recognized income and received payment upon execution of the
agreements and approval of new restaurant sites, respectively, future revenue for these items will be recorded on a
straight-line basis over the life of the applicable license agreements as the agreements do not contain distinct
performance obligations. Comparative financial information has not been restated and continues to be reported under the
accounting standards in effect for those periods. The impact of adopting this standard as compared to the previous
revenue recognition guidance was not material to our consolidated balance sheet and consolidated statements of income
and comprehensive income.
2. Other Receivables
Other receivables consisted of (in thousands):
January 1, 2019 January 2, 2018
Gift card distributors .............................................................................................. $ 41,996 $ 40,973
Insurance providers ................................................................................................ 9,020 5,177
Landlord construction contributions ...................................................................... 4,976 9,053
Other ...................................................................................................................... 12,201 12,315
Total ................................................................................................................... $ 68,193 $ 67,518
3. Inventories
Inventories consisted of (in thousands):
January 1, 2019 January 2, 2018
Restaurant food and supplies ................................................................................. $ 18,362 $ 18,407
Bakery finished goods and work in progress (1) ..................................................... 13,845 18,423
Bakery raw materials and supplies ......................................................................... 6,679 5,730
Total ................................................................................................................... $ 38,886 $ 42,560
(1) Our California bakery was closed from February 2018 to June 2018 while we upgraded the facility. In
preparation for lost production capacity, we produced additional inventories during the fourth quarter of fiscal
2017. The additional inventory was utilized during fiscal 2018.
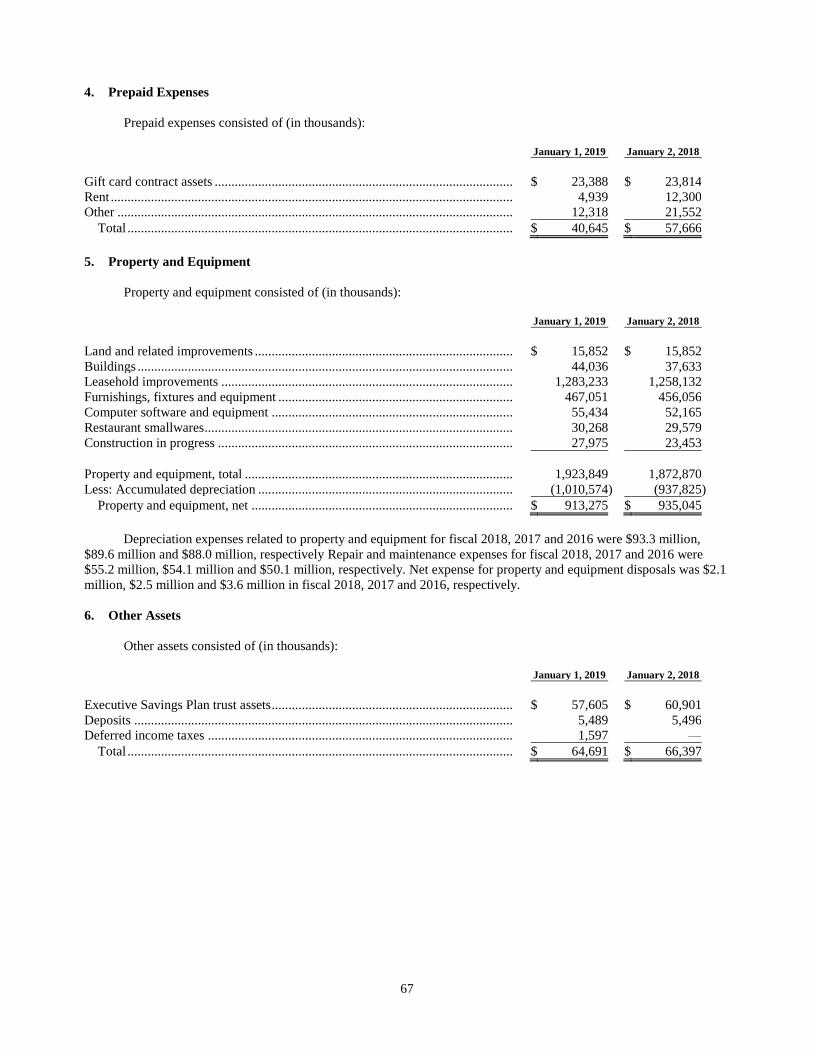
67
4. Prepaid Expenses
Prepaid expenses consisted of (in thousands):
January 1, 2019 January 2, 2018
Gift card contract assets ......................................................................................... $ 23,388 $ 23,814
Rent ........................................................................................................................ 4,939 12,300
Other ...................................................................................................................... 12,318 21,552
Total ................................................................................................................... $ 40,645 $ 57,666
5. Property and Equipment
Property and equipment consisted of (in thousands):
January 1, 2019 January 2, 2018
Land and related improvements ............................................................................. $ 15,852 $ 15,852
Buildings ................................................................................................................ 44,036 37,633
Leasehold improvements ....................................................................................... 1,283,233 1,258,132
Furnishings, fixtures and equipment ...................................................................... 467,051 456,056
Computer software and equipment ........................................................................ 55,434 52,165
Restaurant smallwares ............................................................................................ 30,268 29,579
Construction in progress ........................................................................................ 27,975 23,453
Property and equipment, total ................................................................................ 1,923,849 1,872,870
Less: Accumulated depreciation ............................................................................ (1,010,574 ) (937,825 )
Property and equipment, net .............................................................................. $ 913,275 $ 935,045
Depreciation expenses related to property and equipment for fiscal 2018, 2017 and 2016 were $93.3 million,
$89.6 million and $88.0 million, respectively Repair and maintenance expenses for fiscal 2018, 2017 and 2016 were
$55.2 million, $54.1 million and $50.1 million, respectively. Net expense for property and equipment disposals was $2.1
million, $2.5 million and $3.6 million in fiscal 2018, 2017 and 2016, respectively.
6. Other Assets
Other assets consisted of (in thousands):
January 1, 2019 January 2, 2018
Executive Savings Plan trust assets ........................................................................ $ 57,605 $ 60,901
Deposits ................................................................................................................. 5,489 5,496
Deferred income taxes ........................................................................................... 1,597 —
Total ................................................................................................................... $ 64,691 $ 66,397
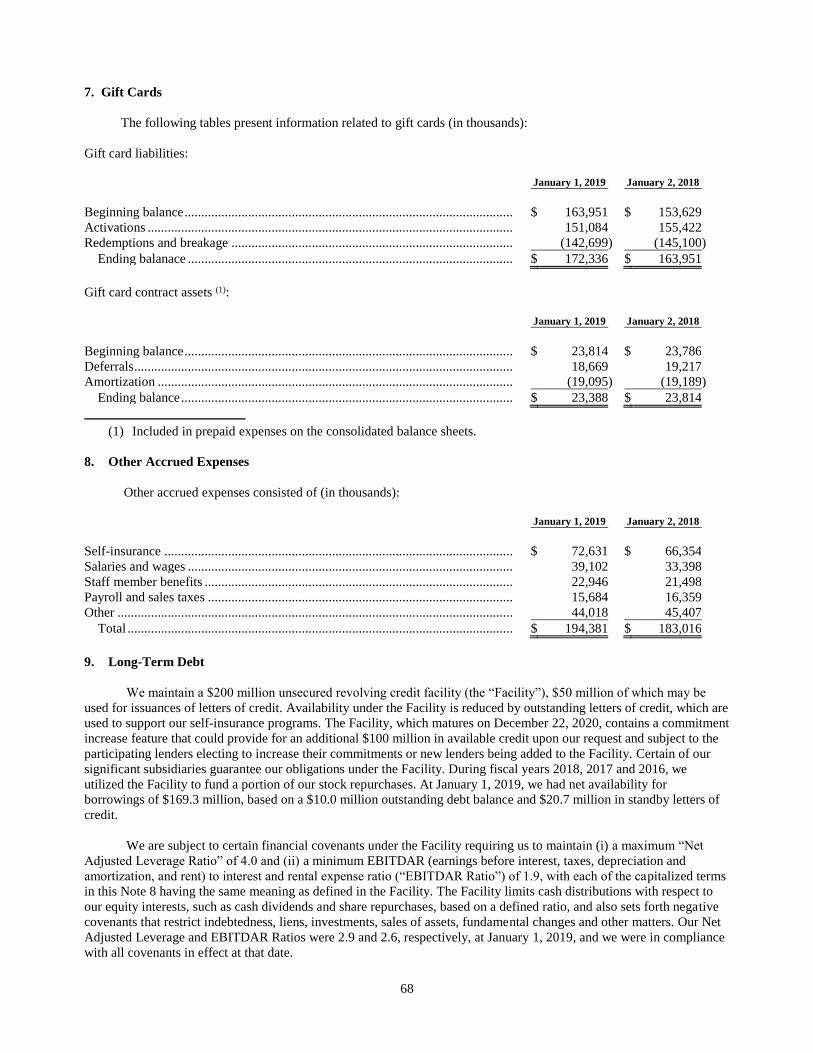
68
7. Gift Cards
The following tables present information related to gift cards (in thousands):
Gift card liabilities:
January 1, 2019 January 2, 2018
Beginning balance .................................................................................................. $ 163,951 $ 153,629
Activations ............................................................................................................. 151,084 155,422
Redemptions and breakage .................................................................................... (142,699 ) (145,100 )
Ending balanace ................................................................................................. $ 172,336 $ 163,951
Gift card contract assets (1):
January 1, 2019 January 2, 2018
Beginning balance .................................................................................................. $ 23,814 $ 23,786
Deferrals ................................................................................................................. 18,669 19,217
Amortization .......................................................................................................... (19,095 ) (19,189 )
Ending balance ................................................................................................... $ 23,388 $ 23,814
(1) Included in prepaid expenses on the consolidated balance sheets.
8. Other Accrued Expenses
Other accrued expenses consisted of (in thousands):
January 1, 2019 January 2, 2018
Self-insurance ........................................................................................................ $ 72,631 $ 66,354
Salaries and wages ................................................................................................. 39,102 33,398
Staff member benefits ............................................................................................ 22,946 21,498
Payroll and sales taxes ........................................................................................... 15,684 16,359
Other ...................................................................................................................... 44,018 45,407
Total ................................................................................................................... $ 194,381 $ 183,016
9. Long-Term Debt
We maintain a $200 million unsecured revolving credit facility (the “Facility”), $50 million of which may be
used for issuances of letters of credit. Availability under the Facility is reduced by outstanding letters of credit, which are
used to support our self-insurance programs. The Facility, which matures on December 22, 2020, contains a commitment
increase feature that could provide for an additional $100 million in available credit upon our request and subject to the
participating lenders electing to increase their commitments or new lenders being added to the Facility. Certain of our
significant subsidiaries guarantee our obligations under the Facility. During fiscal years 2018, 2017 and 2016, we
utilized the Facility to fund a portion of our stock repurchases. At January 1, 2019, we had net availability for
borrowings of $169.3 million, based on a $10.0 million outstanding debt balance and $20.7 million in standby letters of
credit.
We are subject to certain financial covenants under the Facility requiring us to maintain (i) a maximum “Net
Adjusted Leverage Ratio” of 4.0 and (ii) a minimum EBITDAR (earnings before interest, taxes, depreciation and
amortization, and rent) to interest and rental expense ratio (“EBITDAR Ratio”) of 1.9, with each of the capitalized terms
in this Note 8 having the same meaning as defined in the Facility. The Facility limits cash distributions with respect to
our equity interests, such as cash dividends and share repurchases, based on a defined ratio, and also sets forth negative
covenants that restrict indebtedness, liens, investments, sales of assets, fundamental changes and other matters. Our Net
Adjusted Leverage and EBITDAR Ratios were 2.9 and 2.6, respectively, at January 1, 2019, and we were in compliance
with all covenants in effect at that date.
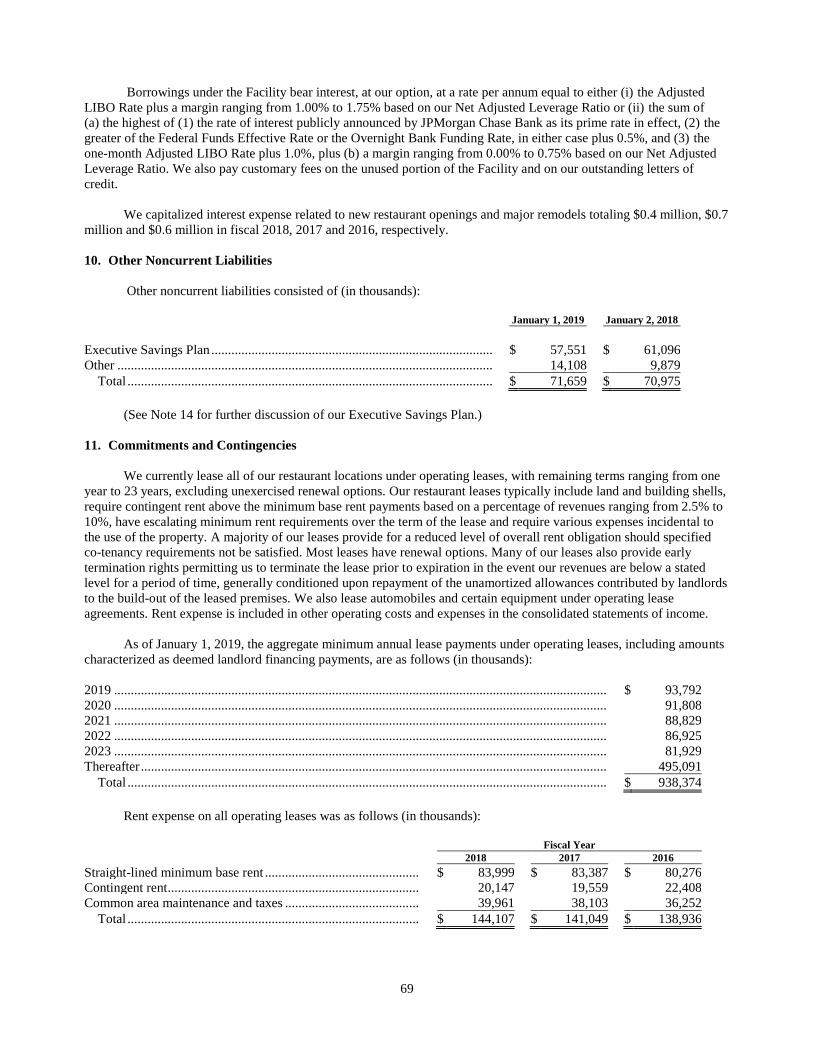
69
Borrowings under the Facility bear interest, at our option, at a rate per annum equal to either (i) the Adjusted
LIBO Rate plus a margin ranging from 1.00% to 1.75% based on our Net Adjusted Leverage Ratio or (ii) the sum of
(a) the highest of (1) the rate of interest publicly announced by JPMorgan Chase Bank as its prime rate in effect, (2) the
greater of the Federal Funds Effective Rate or the Overnight Bank Funding Rate, in either case plus 0.5%, and (3) the
one-month Adjusted LIBO Rate plus 1.0%, plus (b) a margin ranging from 0.00% to 0.75% based on our Net Adjusted
Leverage Ratio. We also pay customary fees on the unused portion of the Facility and on our outstanding letters of
credit.
We capitalized interest expense related to new restaurant openings and major remodels totaling $0.4 million, $0.7
million and $0.6 million in fiscal 2018, 2017 and 2016, respectively.
10. Other Noncurrent Liabilities
Other noncurrent liabilities consisted of (in thousands):
January 1, 2019 January 2, 2018
Executive Savings Plan .................................................................................... $ 57,551 $ 61,096
Other ................................................................................................................ 14,108 9,879
Total ............................................................................................................. $ 71,659 $ 70,975
(See Note 14 for further discussion of our Executive Savings Plan.)
11. Commitments and Contingencies
We currently lease all of our restaurant locations under operating leases, with remaining terms ranging from one
year to 23 years, excluding unexercised renewal options. Our restaurant leases typically include land and building shells,
require contingent rent above the minimum base rent payments based on a percentage of revenues ranging from 2.5% to
10%, have escalating minimum rent requirements over the term of the lease and require various expenses incidental to
the use of the property. A majority of our leases provide for a reduced level of overall rent obligation should specified
co-tenancy requirements not be satisfied. Most leases have renewal options. Many of our leases also provide early
termination rights permitting us to terminate the lease prior to expiration in the event our revenues are below a stated
level for a period of time, generally conditioned upon repayment of the unamortized allowances contributed by landlords
to the build-out of the leased premises. We also lease automobiles and certain equipment under operating lease
agreements. Rent expense is included in other operating costs and expenses in the consolidated statements of income.
As of January 1, 2019, the aggregate minimum annual lease payments under operating leases, including amounts
characterized as deemed landlord financing payments, are as follows (in thousands):
2019 ................................................................................................................................................... $ 93,792
2020 ................................................................................................................................................... 91,808
2021 ................................................................................................................................................... 88,829
2022 ................................................................................................................................................... 86,925
2023 ................................................................................................................................................... 81,929
Thereafter ........................................................................................................................................... 495,091
Total ............................................................................................................................................... $ 938,374
Rent expense on all operating leases was as follows (in thousands):
Fiscal Year
2018 2017 2016
Straight-lined minimum base rent .............................................. $ 83,999 $ 83,387 $ 80,276
Contingent rent ........................................................................... 20,147 19,559 22,408
Common area maintenance and taxes ........................................ 39,961 38,103 36,252
Total ....................................................................................... $ 144,107 $ 141,049 $ 138,936
70
We enter into various obligations for the purchase of goods and for the construction of restaurants. At January 1,
2019, these obligations approximated $154.1 million, $118.2 million of which is due in fiscal 2019.
Based on North Italia’s current performance, we are likely to acquire the remaining interest in the concept at the
end of the third quarter of 2019 for an estimated $150 million. However, we could be obligated to do so if certain
financial, legal and operational conditions are met and Fox Restaurant Concepts LLC (“FRC”) elects to exercise its put
option prior to this date.
As of January 1, 2019, we were obligated to provide up to an additional $3 million in growth capital to Flower
Child. We have the right to acquire the remaining interest in Flower Child in fiscal 2021. However, we could be
obligated to do so if certain financial, legal and operational conditions are met and FRC elects to exercise its put option
prior to this date.
As credit guarantees to insurers, we have $20.7 million in standby letters of credit related to our self-insurance
liabilities. All standby letters of credit are renewable annually.
We retain the financial responsibility for a significant portion of our risks and associated liabilities with respect to
workers’ compensation, general liability, staff member health benefits, employment practices and other insurable risks.
The accrued liabilities associated with these programs are based on our estimate of the ultimate costs to settle known
claims, as well as claims incurred but not yet reported to us (“IBNR”) as of the balance sheet date. Our estimated
liabilities are based on information provided by our insurance brokers and insurers, combined with our judgment
regarding a number of assumptions and factors, including the frequency and severity of claims, claims development
history, case jurisdiction, applicable legislation and our claims settlement practices. At January 1, 2019, the total accrued
liability for our self-insured plans was $72.2 million.
On November 26, 2014, a former hourly restaurant employee filed a class action lawsuit in the San Diego
County Superior Court, alleging that the Company violated the California Labor Code and California Business and
Professions Code, by failing to pay overtime, to permit required rest breaks and to provide accurate wage statements,
among other claims (Masters v. The Cheesecake Factory Restaurants, Inc., et al.; Case No 37-2014-00040278). The
lawsuit seeks unspecified penalties under California Private Attorneys’ General Act (“PAGA”) in addition to other
monetary payments. By stipulation, the parties agreed to transfer Case No. 37-2014-00040278 to the Orange County
Superior Court. On March 2, 2015, Case No. 37-2014-00040278 was officially transferred and assigned a new Case
No. 30-2015-00775529 in the Orange County Superior Court. On June 27, 2016, we gave notice to the court that Case
Nos. CIV1504091 and BC603620 described below may be related. On February 13, 2018, the parties reached a
settlement in Case No. 30-2015-00775529. On October 5, 2018, the judge signed the order granting preliminary
approval of the class action settlement. Based upon the current status of this matter, we have reserved an immaterial
amount.
On May 21, 2018, a lawsuit was filed in the Los Angeles County Superior Court, alleging similar claims to Case
No. 30-2015-00775529 (Silva v. The Cheesecake Factory Restaurants, Inc., et al.; Case No. BC706365). On July 5,
2018, we notified the court that Case No. BC706365 and Case No. 30-2015-00775529 may be related. The plaintiff in
Case No. BC70365 seeks unspecified penalties under PAGA in addition to other monetary payments. We intend to
vigorously defend this action. However, it is not possible at this time to reasonably estimate the outcome of or any
potential liability from this matter and, accordingly, we have not reserved for any potential future payments.
On May 28, 2015, a group of current and former hourly restaurant employees filed a class action lawsuit in the
U.S. District Court for the Eastern District of New York, alleging that the Company violated the Fair Labor Standards
Act and New York Labor Code, by requiring employees to purchase uniforms for work and violated the State of New
York’s minimum wage and overtime provisions (Guglielmo v. The Cheesecake Factory Restaurants, Inc., et al; Case
No. 2:15-CV-03117). On September 8, 2015, we filed a response to the complaint, requesting the court to compel
arbitration against opt-in plaintiffs with valid arbitration agreements. On July 21, 2016, the court issued an order
confirming the agreement of the parties to dismiss all class claims with prejudice and to allow the case to proceed as a
collective action covering a limited number of our restaurants in the State of New York. On February 21, 2018, the
parties reached a tentative settlement subject to documentation and court approval. Based upon the current status of this
matter, we have reserved an immaterial amount.
71
On December 10, 2015, a former restaurant management employee filed a class action lawsuit in the Los
Angeles County Superior Court, alleging that the Company improperly classified its managerial employees, failed to pay
overtime, and failed to provide accurate wage statements, in addition to other claims. The lawsuit seeks unspecified
penalties under PAGA in addition to other monetary payments (Tagalogon v. The Cheesecake Factory Restaurants, Inc.;
Case No. BC603620). On March 23, 2016, the parties issued their joint status conference statement at which time we
gave notice to the court that Case Nos. 30-2015-00775529 and CIV1504091 may be related. On April 29, 2016, we filed
a response to the complaint. We intend to vigorously defend this action. However, it is not possible at this time to
reasonably estimate the outcome of or any potential liability from this matter and, accordingly, we have not reserved for
any potential future payments.
On July 12, 2017, a lawsuit was filed in the Los Angeles County Superior Court alleging that the Company
violated California’s unfair business practices statute by improperly calculating suggested gratuity amounts on split
payment transactions (Goldman v. The Cheesecake Factory Incorporated; Case No. BC668334). On December 1, 2017,
we filed a demurrer to the plaintiff’s complaint. The plaintiff filed his opposition on December 26, 2017. On March 27,
2018, the Court sustained the demurrer without leave to amend as to six of the seven causes of action in the complaint.
On January 25, 2019, the parties reached a tentative settlement for an immaterial amount covering all claims.
On June 22, 2018, the Internal Revenue Service issued a Notice of Deficiency in which they disallowed $8.0
million of our §199 Domestic Production Activities Deduction for tax years 2010, 2011 and 2012. On September 11,
2018 we petitioned the United States Tax Court for a redetermination of the deficiency. The tax court has assigned
docket number 18150-18 to our case. We intend to vigorously defend our position in litigation and based on our analysis
of the law, regulations and relevant facts, we have not reserved for any potential future payments.
On February 3, 2017, a class action lawsuit was filed in the U.S. District Court for the Southern District of
Florida, alleging that the Company violated the Fair and Accurate Credit Transaction Act, by failing to properly censor
consumer credit or debit card information (Muransky v. The Cheesecake Factory Incorporated; Case No. 0:17-cv-60229-
JEM). On February 21, 2017 and February 28, 2017, two additional lawsuits were filed in California and New York,
respectively, alleging similar claims to Case No. 0:17-cv-60229-JEM (Tibbits v. The Cheesecake Factory Incorporated;
Case No. 1:17-cv-00968 ( E.D.N.Y.); Zhang v. The Cheesecake Factory Incorporated; Case No 8:17-cv-00357 (C.D.
Cal.)). We filed a motion to transfer and dismiss Case No. 0:17-cv-60229-JEM on March 24, 2017 and similarly filed a
motion to transfer and dismiss Case No. 1:17-cv-00968 on April 7, 2017. On October 16, 2017, the Florida court granted
our motion to transfer Case No. 0:17-cv-60229JEM to California to be consolidated with Case No. 8:17-cv-00357. The
plaintiff in Case No. 1:17-cv-00968 agreed to transfer its case to California and such matter was subsequently
consolidated with Case No 8:17-cv-00357. On May 25, 2018, the parties reached a tentative settlement which covers the
three consolidated cases. The final settlement agreement is subject to documentation and court approval and will be
covered by our insurance provider.
On February 3, 2017, five present and former hourly restaurant employees filed a class action lawsuit in the San
Diego County Superior Court, alleging that the Company violated the California Labor Code and California Business
and Professions Code, by failing to permit required meal and rest breaks, and failing to provide accurate wage
statements, among other claims (Abdelaziz v. The Cheesecake Factory Restaurants, Inc., et al.; Case No 37-2016-
00039775-CU-OE-CTL). On February 22, 2017, a lawsuit was filed in the San Diego County Superior Court, alleging
similar claims to Case No. 37-2016-00039775-CU-OE-CTL (Rodriguez v. The Cheesecake Factory Restaurants, Inc., et
al.; Case No. 37-2017-00006571-CU-OE-CTL). The San Diego County Superior Court consolidated Case Nos. 37-2016-
00039775-CU-OR-CTL and 37-2017-00006571-CU-OE-CTL. The lawsuits seek unspecified penalties under PAGA in
addition to other monetary payments. On July 24, 2018, the parties reached a tentative settlement which covers the
consolidated cases. On October 5, 2018, the court signed an order approving the settlement agreement. We have reserved
an immaterial amount.
On June 1, 2018, a former hourly restaurant employee filed a class action lawsuit in the U.S. District Court for
the Eastern District of New York, alleging that the Company violated minimum wage and overtime provisions of the
Fair Labor Standards Act and New York Labor Code (Orellana v. Grand Lux Cafe, LLC, et al; Case No. 18-cv-02739).
The plaintiff seeks unspecified amounts of fees, penalties and other monetary payments on behalf of the plaintiff and
other purported class members. On August 31, 2018, the court signed an order staying Case No. 18-cv-02739 in favor of
individual arbitration of plaintiff’s claims. We intend to vigorously defend this action. However, it is not possible at this
time to reasonably estimate the outcome of or any potential liability from this matter and, accordingly, we have not
reserved for any potential future payments.
72
On June 7, 2018, the California Department of Industrial Relations issued a $4.2 million wage citation jointly
against the Company and its vendor that provides janitorial services to eight of our Southern California restaurants,
alleging that the janitorial vendor or its subcontractor failed to comply with various provisions of the California Labor
Code (Wage Citation Case No. 35-CM-188798-16). The wage citation seeks to recover penalties and other monetary
payments on behalf of the employees that worked for this vendor or its subcontractor. On June 28, 2018, we filed an
appeal of the wage citation. We intend to vigorously defend this action. However, it is not possible at this time to
reasonably estimate the outcome of or any potential liability from this matter and, accordingly, we have not reserved for
any potential future payments.
Within the ordinary course of our business, we are subject to private lawsuits, government audits, administrative
proceedings and other claims. These matters typically involve claims from customers, staff members and others related
to operational and employment issues common to the foodservice industry. A number of these claims may exist at any
given time, and some of the claims may be pled as class actions. From time to time, we are also involved in lawsuits
with respect to infringements of, or challenges to, our registered trademarks and other intellectual property, both
domestically and abroad. We could be affected by adverse publicity and litigation costs resulting from such allegations,
regardless of whether they are valid or whether we are legally determined to be liable.
At this time, we believe that the amount of reasonably possible losses resulting from final disposition of any
pending lawsuits, audits, proceedings and claims will not have a material adverse effect individually or in the aggregate
on our financial position, results of operations or liquidity. It is possible, however, that our future results of operations
for a particular quarter or fiscal year could be impacted by changes in circumstances relating to lawsuits, audits,
proceedings or claims. Legal costs related to such claims are expensed as incurred.
We have employment agreements with certain of our executive officers that provide for payments to those
officers in the event of an actual or constructive termination of their employment, including in the event of a termination
without cause, an acquirer failure to assume or continue equity awards following a change in control of the Company or,
otherwise, in the event of death or disability as defined in those agreements. Aggregate payments totaling approximately
$1.8 million, excluding accrued potential bonuses of $1.8 million, which are subject to approval by the Compensation
Committee, would have been required by those agreements had all such officers terminated their employment for
reasons requiring such payments as of January 1, 2019. In addition, the employment agreement with our Chief Executive
Officer specifies an annual founder’s retirement benefit of $650,000 for ten years, commencing six months after
termination of his full-time employment.
12. Stockholders’ Equity
Cash dividends of $1.24, $1.06 and $0.88 were declared during fiscal 2018, 2017 and 2016, respectively. Future
decisions to pay or to increase or decrease dividends are at the discretion of the Board and will be dependent on our
operating performance, financial condition, capital expenditure requirements, limitations on cash distributions pursuant
to the terms and conditions of our Facility and applicable law, and such other factors that the Board considers relevant.
(See Note 9 for further discussion of our Facility.)
On July 21, 2016, our Board increased the authorization to repurchase our common stock by 7.5 million shares
to 56.0 million shares. Under this and all previous authorizations, we have cumulatively repurchased 51.8 million shares
at a total cost of $1,642.1 million through January 1, 2019. During fiscal 2018, 2017 and 2016, we repurchased 2.3
million, 2.6 million and 2.9 million shares of our common stock at a cost of $109.3 million, $123.0 million and $146.5
million, respectively. Repurchased common stock is reflected as a reduction of stockholders’ equity in treasury stock.
Share repurchases have been executed under stock repurchase plans adopted from time to time by our Board in
furtherance of its repurchase authorization and are intended to qualify for safe harbor protection in accordance with
Rule 10b5-1 and Rule 10b-18 of the Securities Act of 1934.
Repurchases made during fiscal 2018 were made pursuant to the following stock repurchase plans adopted by
our Board:
Adoption Date Effective Dates
October 26, 2017 ................. December 1, 2017 through April 30, 2018
February 15, 2018 ................ May 1, 2018 through July 31, 2018
July 26, 2018 ........................ August 3, 2018 through August 17, 2018
July 26, 2018 ........................ August 31, 2018 through February 1, 2019
73
Our share repurchase authorization does not have an expiration date, does not require us to purchase a specific
number of shares and may be modified, suspended or terminated at any time. Shares may be repurchased in the open
market or through privately negotiated transactions at times and prices considered appropriate by us. All purchases in the
open market are made in compliance with Rule 10b-18. We make the determination to repurchase shares based on
several factors, including an evaluation of current and future capital needs associated with new restaurant development,
current and forecasted cash flows, including dividend payments and growth capital contributions to North Italia and
Flower Child, a review of our capital structure and cost of capital, our share price and current market conditions. The
timing and number of shares repurchased are also subject to legal constraints and financial covenants under our Facility
that limit share repurchases based on a defined ratio. (See Note 9 for further discussion of our long-term debt.) Our
objectives with regard to share repurchases are to offset the dilution to our shares outstanding that results from equity
compensation grants and to supplement our earnings per share growth.
13. Stock-Based Compensation
We maintain stock-based incentive plans under which incentive stock options, non-qualified stock options, stock
appreciation rights, restricted shares and restricted share units may be granted to staff members and consultants. Our
current practice is to issue new shares, rather than treasury shares, upon stock option exercises, for restricted share grants
and upon vesting of restricted share units. To date, we have only granted non-qualified stock options, restricted shares
and restricted share units of common stock under these plans. Non-employee directors have received only non-qualified
stock options under a non-employee director equity plan, which expired in May 2007. Currently, we do not have a plan
under which non-employee directors may be granted stock options or other equity interests in the Company.
On April 5, 2017, our Board approved an amendment to our 2010 Stock Incentive Plan to increase the number of
shares of common stock reserved for grant under the plan to 12.7 million shares from 9.2 million shares. This
amendment was approved by our stockholders at our annual meeting held on June 8, 2017. This is our only active stock-
based incentive plan, and approximately 2.9 million of these shares were available for grant as of January 1, 2019.
Stock options generally vest at 20% per year and expire eight years from the date of grant. Restricted shares and
restricted share units generally vest between three to five years from the date of grant and require that the staff member
remains employed in good standing with the Company as of the vesting date. Certain restricted share units granted to
executive officers contain performance-based vesting conditions. Performance goals are determined by the Board of
Directors. The quantity of units that will vest ranges from 0% to 150% based on the level of achievement of the
performance conditions. Equity awards for certain executive officers may vest earlier in the event of a change of control
in which the acquirer fails to assume or continue such awards, as defined in the plan, or under certain circumstances
described in such executive officers’ respective employment agreements. Compensation expense is recognized only for
those options, restricted shares and restricted share units expected to vest, with forfeitures estimated based on our
historical experience and future expectations.
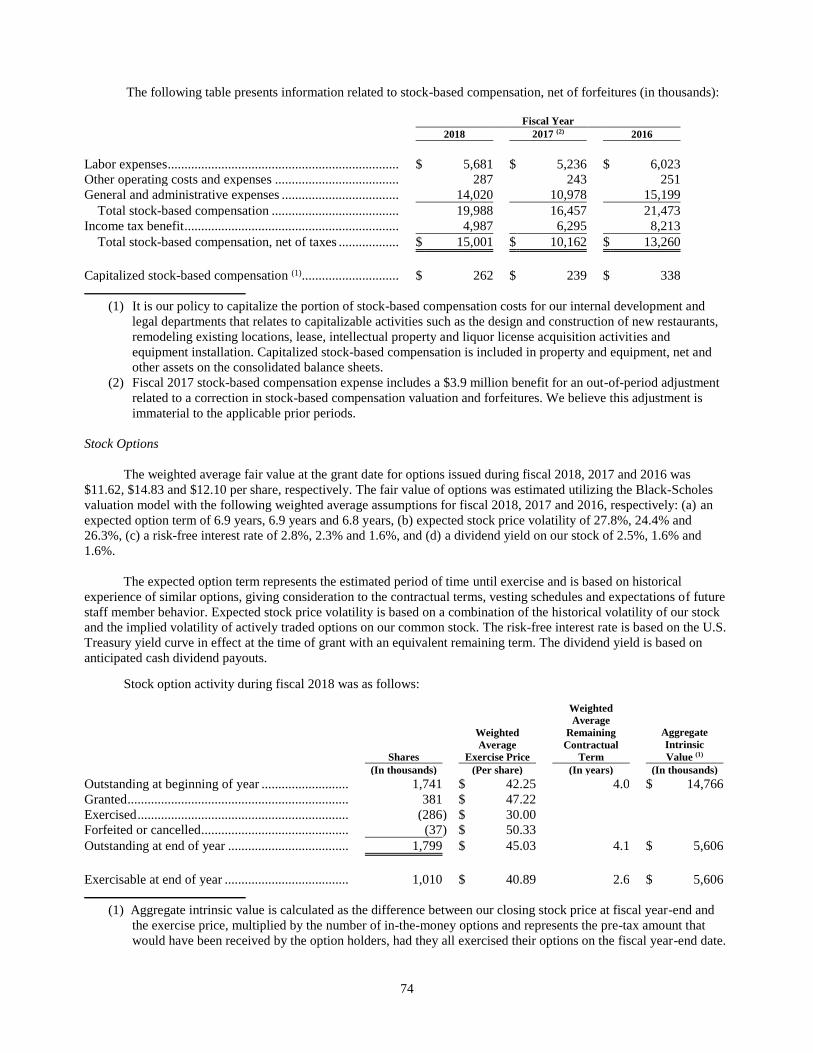
74
The following table presents information related to stock-based compensation, net of forfeitures (in thousands):
Fiscal Year
2018 2017 (2) 2016
Labor expenses ..................................................................... $ 5,681 $ 5,236 $ 6,023
Other operating costs and expenses ..................................... 287 243 251
General and administrative expenses ................................... 14,020 10,978 15,199
Total stock-based compensation ...................................... 19,988 16,457 21,473
Income tax benefit ................................................................ 4,987 6,295 8,213
Total stock-based compensation, net of taxes .................. $ 15,001 $ 10,162 $ 13,260
Capitalized stock-based compensation (1)............................. $ 262 $ 239 $ 338
(1) It is our policy to capitalize the portion of stock-based compensation costs for our internal development and
legal departments that relates to capitalizable activities such as the design and construction of new restaurants,
remodeling existing locations, lease, intellectual property and liquor license acquisition activities and
equipment installation. Capitalized stock-based compensation is included in property and equipment, net and
other assets on the consolidated balance sheets.
(2) Fiscal 2017 stock-based compensation expense includes a $3.9 million benefit for an out-of-period adjustment
related to a correction in stock-based compensation valuation and forfeitures. We believe this adjustment is
immaterial to the applicable prior periods.
Stock Options
The weighted average fair value at the grant date for options issued during fiscal 2018, 2017 and 2016 was
$11.62, $14.83 and $12.10 per share, respectively. The fair value of options was estimated utilizing the Black-Scholes
valuation model with the following weighted average assumptions for fiscal 2018, 2017 and 2016, respectively: (a) an
expected option term of 6.9 years, 6.9 years and 6.8 years, (b) expected stock price volatility of 27.8%, 24.4% and
26.3%, (c) a risk-free interest rate of 2.8%, 2.3% and 1.6%, and (d) a dividend yield on our stock of 2.5%, 1.6% and
1.6%.
The expected option term represents the estimated period of time until exercise and is based on historical
experience of similar options, giving consideration to the contractual terms, vesting schedules and expectations of future
staff member behavior. Expected stock price volatility is based on a combination of the historical volatility of our stock
and the implied volatility of actively traded options on our common stock. The risk-free interest rate is based on the U.S.
Treasury yield curve in effect at the time of grant with an equivalent remaining term. The dividend yield is based on
anticipated cash dividend payouts.
Stock option activity during fiscal 2018 was as follows:
Shares
Weighted
Average
Exercise Price
Weighted
Average
Remaining
Contractual
Term
Aggregate
Intrinsic
Value (1)
(In thousands) (Per share) (In years) (In thousands)
Outstanding at beginning of year .......................... 1,741 $ 42.25 4.0 $ 14,766
Granted .................................................................. 381 $ 47.22
Exercised ............................................................... (286 ) $ 30.00
Forfeited or cancelled ............................................ (37 ) $ 50.33
Outstanding at end of year .................................... 1,799 $ 45.03 4.1 $ 5,606
Exercisable at end of year ..................................... 1,010 $ 40.89 2.6 $ 5,606
(1) Aggregate intrinsic value is calculated as the difference between our closing stock price at fiscal year-end and
the exercise price, multiplied by the number of in-the-money options and represents the pre-tax amount that
would have been received by the option holders, had they all exercised their options on the fiscal year-end date.
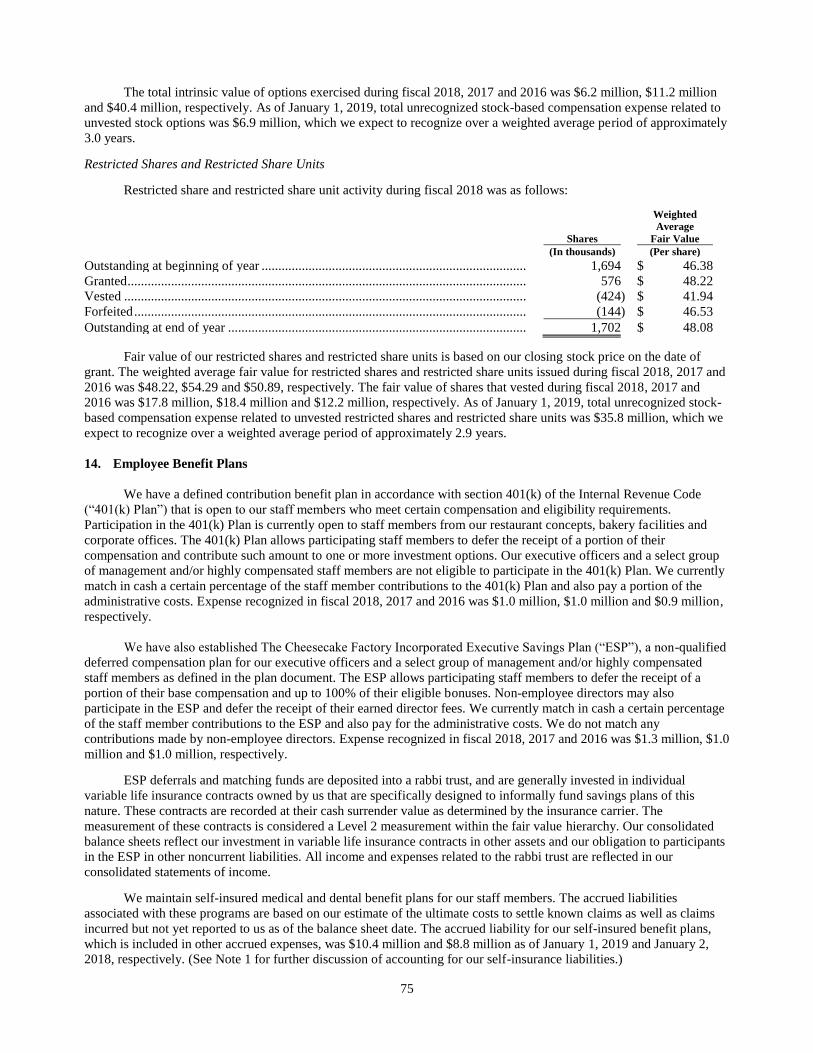
75
The total intrinsic value of options exercised during fiscal 2018, 2017 and 2016 was $6.2 million, $11.2 million
and $40.4 million, respectively. As of January 1, 2019, total unrecognized stock-based compensation expense related to
unvested stock options was $6.9 million, which we expect to recognize over a weighted average period of approximately
3.0 years.
Restricted Shares and Restricted Share Units
Restricted share and restricted share unit activity during fiscal 2018 was as follows:
Shares
Weighted
Average
Fair Value
(In thousands) (Per share)
Outstanding at beginning of year ............................................................................... 1,694 $ 46.38
Granted ....................................................................................................................... 576 $ 48.22
Vested ........................................................................................................................ (424 ) $ 41.94
Forfeited ..................................................................................................................... (144 ) $ 46.53
Outstanding at end of year ......................................................................................... 1,702 $ 48.08
Fair value of our restricted shares and restricted share units is based on our closing stock price on the date of
grant. The weighted average fair value for restricted shares and restricted share units issued during fiscal 2018, 2017 and
2016 was $48.22, $54.29 and $50.89, respectively. The fair value of shares that vested during fiscal 2018, 2017 and
2016 was $17.8 million, $18.4 million and $12.2 million, respectively. As of January 1, 2019, total unrecognized stock-
based compensation expense related to unvested restricted shares and restricted share units was $35.8 million, which we
expect to recognize over a weighted average period of approximately 2.9 years.
14. Employee Benefit Plans
We have a defined contribution benefit plan in accordance with section 401(k) of the Internal Revenue Code
(“401(k) Plan”) that is open to our staff members who meet certain compensation and eligibility requirements.
Participation in the 401(k) Plan is currently open to staff members from our restaurant concepts, bakery facilities and
corporate offices. The 401(k) Plan allows participating staff members to defer the receipt of a portion of their
compensation and contribute such amount to one or more investment options. Our executive officers and a select group
of management and/or highly compensated staff members are not eligible to participate in the 401(k) Plan. We currently
match in cash a certain percentage of the staff member contributions to the 401(k) Plan and also pay a portion of the
administrative costs. Expense recognized in fiscal 2018, 2017 and 2016 was $1.0 million, $1.0 million and $0.9 million,
respectively.
We have also established The Cheesecake Factory Incorporated Executive Savings Plan (“ESP”), a non-qualified
deferred compensation plan for our executive officers and a select group of management and/or highly compensated
staff members as defined in the plan document. The ESP allows participating staff members to defer the receipt of a
portion of their base compensation and up to 100% of their eligible bonuses. Non-employee directors may also
participate in the ESP and defer the receipt of their earned director fees. We currently match in cash a certain percentage
of the staff member contributions to the ESP and also pay for the administrative costs. We do not match any
contributions made by non-employee directors. Expense recognized in fiscal 2018, 2017 and 2016 was $1.3 million, $1.0
million and $1.0 million, respectively.
ESP deferrals and matching funds are deposited into a rabbi trust, and are generally invested in individual
variable life insurance contracts owned by us that are specifically designed to informally fund savings plans of this
nature. These contracts are recorded at their cash surrender value as determined by the insurance carrier. The
measurement of these contracts is considered a Level 2 measurement within the fair value hierarchy. Our consolidated
balance sheets reflect our investment in variable life insurance contracts in other assets and our obligation to participants
in the ESP in other noncurrent liabilities. All income and expenses related to the rabbi trust are reflected in our
consolidated statements of income.
We maintain self-insured medical and dental benefit plans for our staff members. The accrued liabilities
associated with these programs are based on our estimate of the ultimate costs to settle known claims as well as claims
incurred but not yet reported to us as of the balance sheet date. The accrued liability for our self-insured benefit plans,
which is included in other accrued expenses, was $10.4 million and $8.8 million as of January 1, 2019 and January 2,
2018, respectively. (See Note 1 for further discussion of accounting for our self-insurance liabilities.)
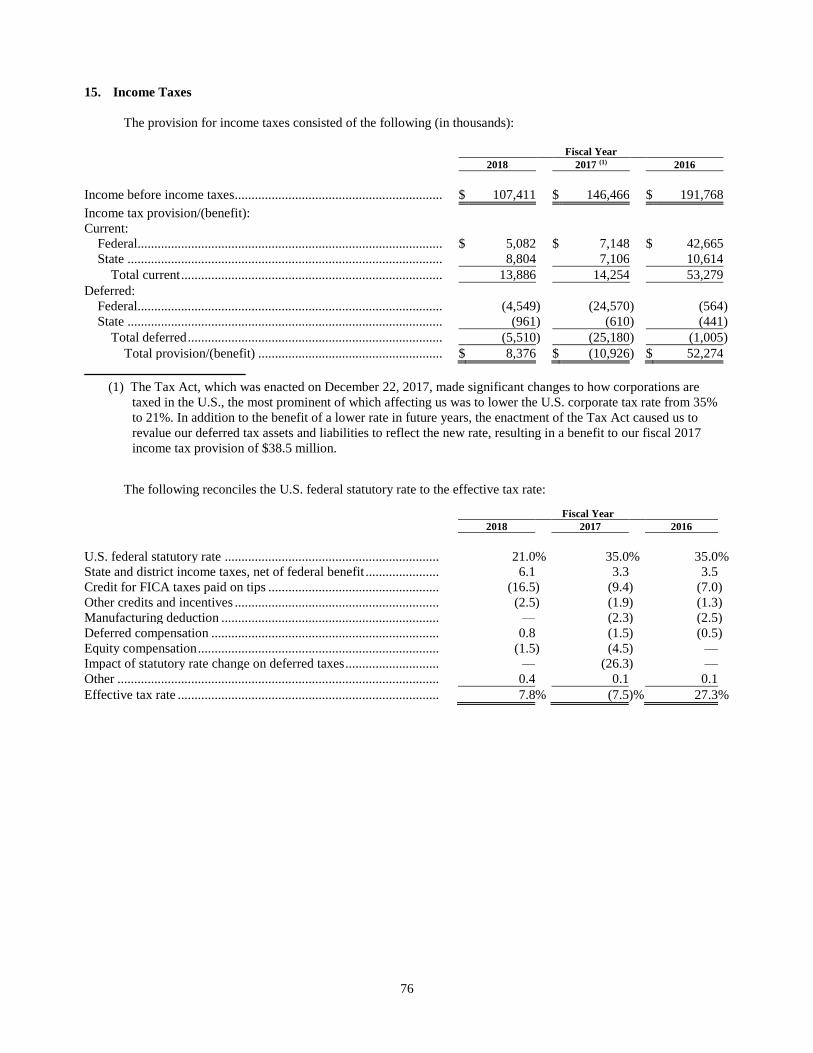
76
15. Income Taxes
The provision for income taxes consisted of the following (in thousands):
Fiscal Year
2018 2017 (1) 2016
Income before income taxes.............................................................. $ 107,411 $ 146,466 $ 191,768
Income tax provision/(benefit):
Current:
Federal........................................................................................... $ 5,082 $ 7,148 $ 42,665
State .............................................................................................. 8,804 7,106 10,614
Total current .............................................................................. 13,886 14,254 53,279
Deferred:
Federal........................................................................................... (4,549 ) (24,570 ) (564 )
State .............................................................................................. (961 ) (610 ) (441 )
Total deferred ............................................................................ (5,510 ) (25,180 ) (1,005 )
Total provision/(benefit) ....................................................... $ 8,376 $ (10,926 ) $ 52,274
(1) The Tax Act, which was enacted on December 22, 2017, made significant changes to how corporations are
taxed in the U.S., the most prominent of which affecting us was to lower the U.S. corporate tax rate from 35%
to 21%. In addition to the benefit of a lower rate in future years, the enactment of the Tax Act caused us to
revalue our deferred tax assets and liabilities to reflect the new rate, resulting in a benefit to our fiscal 2017
income tax provision of $38.5 million.
The following reconciles the U.S. federal statutory rate to the effective tax rate:
Fiscal Year
2018 2017 2016
U.S. federal statutory rate ................................................................ 21.0 % 35.0 % 35.0 %
State and district income taxes, net of federal benefit ...................... 6.1 3.3 3.5
Credit for FICA taxes paid on tips ................................................... (16.5 ) (9.4 ) (7.0 )
Other credits and incentives ............................................................. (2.5 ) (1.9 ) (1.3 )
Manufacturing deduction ................................................................. — (2.3 ) (2.5 )
Deferred compensation .................................................................... 0.8 (1.5 ) (0.5 )
Equity compensation ........................................................................ (1.5 ) (4.5 ) —
Impact of statutory rate change on deferred taxes ............................ — (26.3 ) —
Other ................................................................................................ 0.4 0.1 0.1
Effective tax rate .............................................................................. 7.8 % (7.5 )% 27.3 %
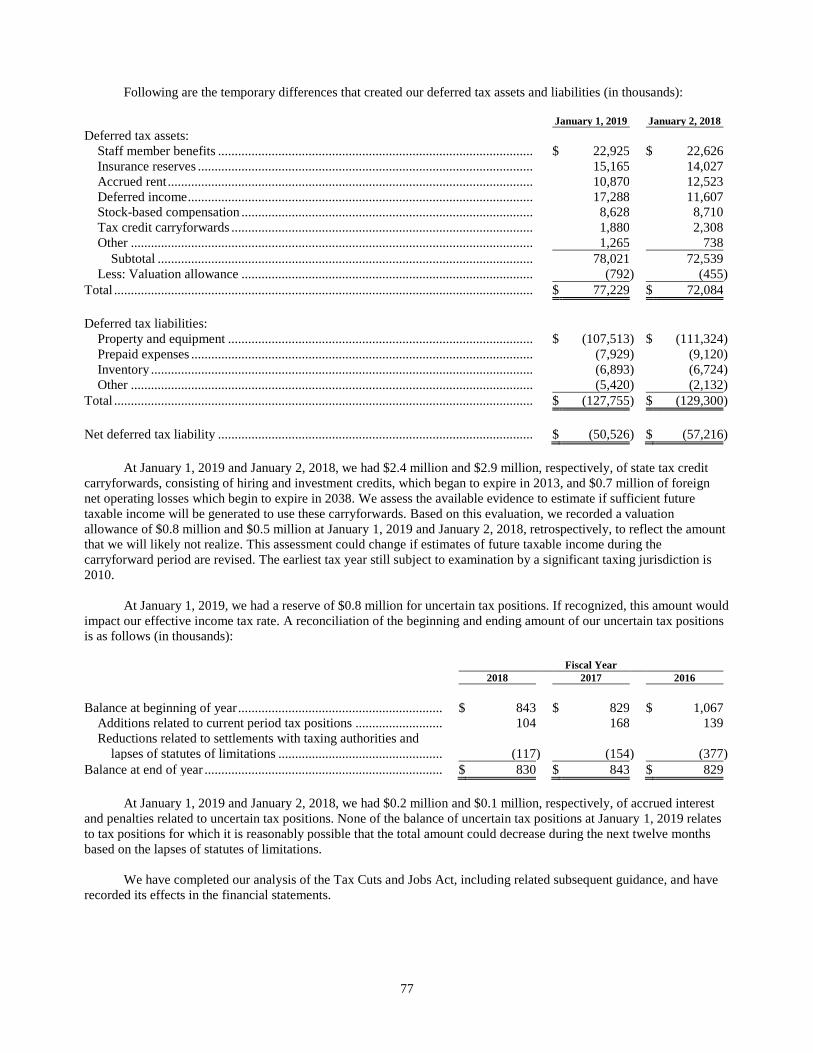
77
Following are the temporary differences that created our deferred tax assets and liabilities (in thousands):
January 1, 2019 January 2, 2018
Deferred tax assets:
Staff member benefits .............................................................................................. $ 22,925 $ 22,626
Insurance reserves .................................................................................................... 15,165 14,027
Accrued rent ............................................................................................................. 10,870 12,523
Deferred income ....................................................................................................... 17,288 11,607
Stock-based compensation ....................................................................................... 8,628 8,710
Tax credit carryforwards .......................................................................................... 1,880 2,308
Other ........................................................................................................................ 1,265 738
Subtotal ................................................................................................................ 78,021 72,539
Less: Valuation allowance ....................................................................................... (792 ) (455 )
Total ............................................................................................................................. $ 77,229 $ 72,084
Deferred tax liabilities:
Property and equipment ........................................................................................... $ (107,513 ) $ (111,324 )
Prepaid expenses ...................................................................................................... (7,929 ) (9,120 )
Inventory .................................................................................................................. (6,893 ) (6,724 )
Other ........................................................................................................................ (5,420 ) (2,132 )
Total ............................................................................................................................. $ (127,755 ) $ (129,300 )
Net deferred tax liability .............................................................................................. $ (50,526 ) $ (57,216 )
At January 1, 2019 and January 2, 2018, we had $2.4 million and $2.9 million, respectively, of state tax credit
carryforwards, consisting of hiring and investment credits, which began to expire in 2013, and $0.7 million of foreign
net operating losses which begin to expire in 2038. We assess the available evidence to estimate if sufficient future
taxable income will be generated to use these carryforwards. Based on this evaluation, we recorded a valuation
allowance of $0.8 million and $0.5 million at January 1, 2019 and January 2, 2018, retrospectively, to reflect the amount
that we will likely not realize. This assessment could change if estimates of future taxable income during the
carryforward period are revised. The earliest tax year still subject to examination by a significant taxing jurisdiction is
2010.
At January 1, 2019, we had a reserve of $0.8 million for uncertain tax positions. If recognized, this amount would
impact our effective income tax rate. A reconciliation of the beginning and ending amount of our uncertain tax positions
is as follows (in thousands):
Fiscal Year
2018 2017 2016
Balance at beginning of year ............................................................. $ 843 $ 829 $ 1,067
Additions related to current period tax positions .......................... 104 168 139
Reductions related to settlements with taxing authorities and
lapses of statutes of limitations ................................................. (117 ) (154 ) (377 )
Balance at end of year ....................................................................... $ 830 $ 843 $ 829
At January 1, 2019 and January 2, 2018, we had $0.2 million and $0.1 million, respectively, of accrued interest
and penalties related to uncertain tax positions. None of the balance of uncertain tax positions at January 1, 2019 relates
to tax positions for which it is reasonably possible that the total amount could decrease during the next twelve months
based on the lapses of statutes of limitations.
We have completed our analysis of the Tax Cuts and Jobs Act, including related subsequent guidance, and have
recorded its effects in the financial statements.
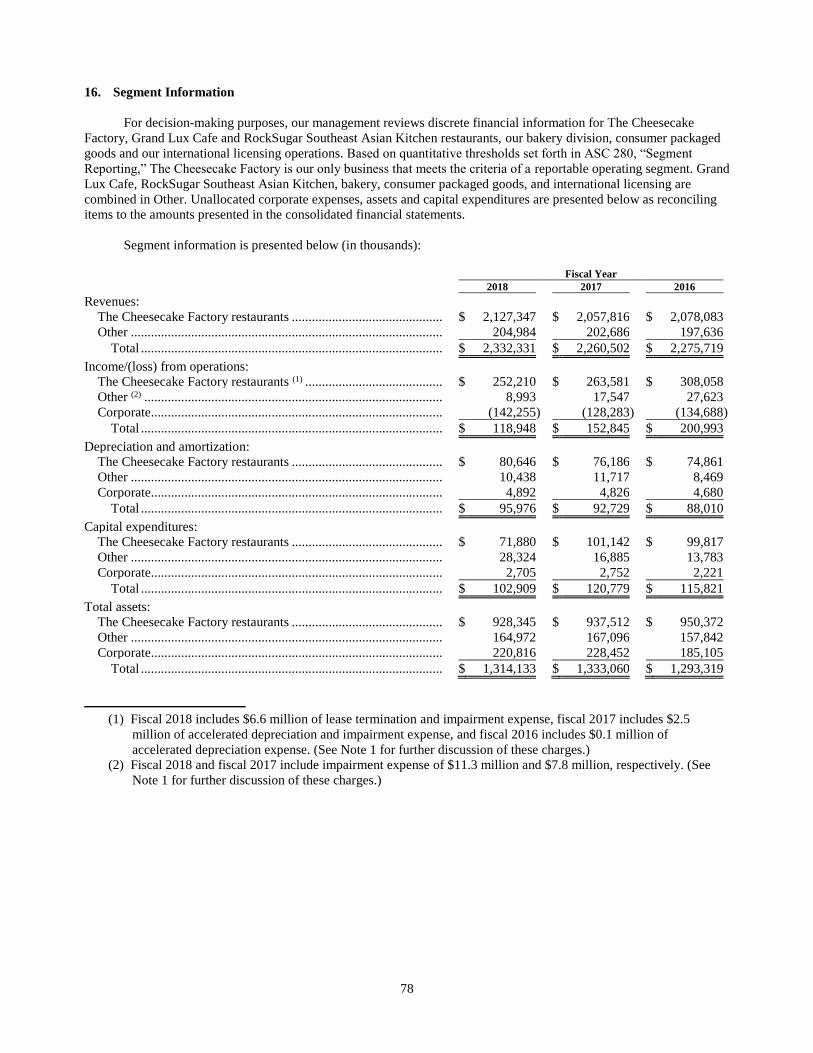
78
16. Segment Information
For decision-making purposes, our management reviews discrete financial information for The Cheesecake
Factory, Grand Lux Cafe and RockSugar Southeast Asian Kitchen restaurants, our bakery division, consumer packaged
goods and our international licensing operations. Based on quantitative thresholds set forth in ASC 280, “Segment
Reporting,” The Cheesecake Factory is our only business that meets the criteria of a reportable operating segment. Grand
Lux Cafe, RockSugar Southeast Asian Kitchen, bakery, consumer packaged goods, and international licensing are
combined in Other. Unallocated corporate expenses, assets and capital expenditures are presented below as reconciling
items to the amounts presented in the consolidated financial statements.
Segment information is presented below (in thousands):
Fiscal Year
2018 2017 2016
Revenues:
The Cheesecake Factory restaurants ............................................. $ 2,127,347 $ 2,057,816 $ 2,078,083
Other ............................................................................................. 204,984 202,686 197,636
Total .......................................................................................... $ 2,332,331 $ 2,260,502 $ 2,275,719
Income/(loss) from operations:
The Cheesecake Factory restaurants (1) ......................................... $ 252,210 $ 263,581 $ 308,058
Other (2) ......................................................................................... 8,993 17,547 27,623
Corporate ....................................................................................... (142,255 ) (128,283 ) (134,688 )
Total .......................................................................................... $ 118,948 $ 152,845 $ 200,993
Depreciation and amortization:
The Cheesecake Factory restaurants ............................................. $ 80,646 $ 76,186 $ 74,861
Other ............................................................................................. 10,438 11,717 8,469
Corporate ....................................................................................... 4,892 4,826 4,680
Total .......................................................................................... $ 95,976 $ 92,729 $ 88,010
Capital expenditures:
The Cheesecake Factory restaurants ............................................. $ 71,880 $ 101,142 $ 99,817
Other ............................................................................................. 28,324 16,885 13,783
Corporate ....................................................................................... 2,705 2,752 2,221
Total .......................................................................................... $ 102,909 $ 120,779 $ 115,821
Total assets:
The Cheesecake Factory restaurants ............................................. $ 928,345 $ 937,512 $ 950,372
Other ............................................................................................. 164,972 167,096 157,842
Corporate ....................................................................................... 220,816 228,452 185,105
Total .......................................................................................... $ 1,314,133 $ 1,333,060 $ 1,293,319
(1) Fiscal 2018 includes $6.6 million of lease termination and impairment expense, fiscal 2017 includes $2.5
million of accelerated depreciation and impairment expense, and fiscal 2016 includes $0.1 million of
accelerated depreciation expense. (See Note 1 for further discussion of these charges.)
(2) Fiscal 2018 and fiscal 2017 include impairment expense of $11.3 million and $7.8 million, respectively. (See
Note 1 for further discussion of these charges.)
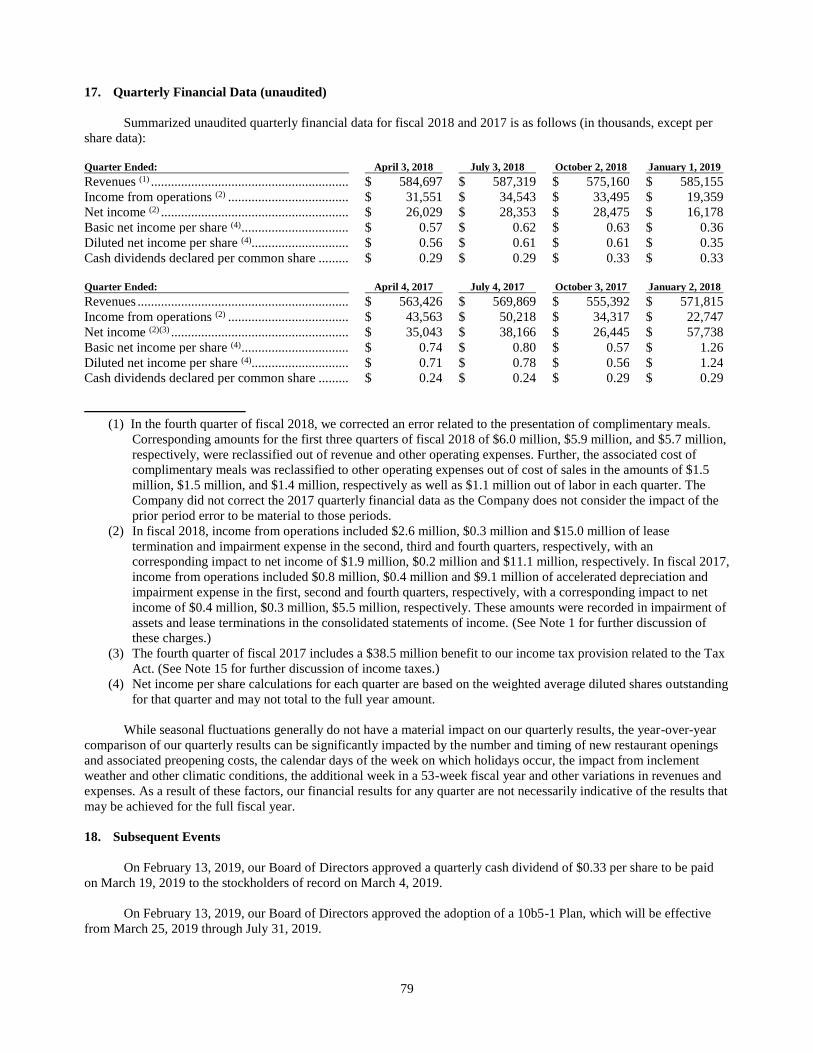
79
17. Quarterly Financial Data (unaudited)
Summarized unaudited quarterly financial data for fiscal 2018 and 2017 is as follows (in thousands, except per
share data):
Quarter Ended: April 3, 2018 July 3, 2018 October 2, 2018 January 1, 2019
Revenues (1) ........................................................... $ 584,697 $ 587,319 $ 575,160 $ 585,155
Income from operations (2) .................................... $ 31,551 $ 34,543 $ 33,495 $ 19,359
Net income (2) ........................................................ $ 26,029 $ 28,353 $ 28,475 $ 16,178
Basic net income per share (4) ................................ $ 0.57 $ 0.62 $ 0.63 $ 0.36
Diluted net income per share (4)............................. $ 0.56 $ 0.61 $ 0.61 $ 0.35
Cash dividends declared per common share ......... $ 0.29 $ 0.29 $ 0.33 $ 0.33
Quarter Ended: April 4, 2017 July 4, 2017 October 3, 2017 January 2, 2018
Revenues ............................................................... $ 563,426 $ 569,869 $ 555,392 $ 571,815
Income from operations (2) .................................... $ 43,563 $ 50,218 $ 34,317 $ 22,747
Net income (2)(3) ..................................................... $ 35,043 $ 38,166 $ 26,445 $ 57,738
Basic net income per share (4) ................................ $ 0.74 $ 0.80 $ 0.57 $ 1.26
Diluted net income per share (4)............................. $ 0.71 $ 0.78 $ 0.56 $ 1.24
Cash dividends declared per common share ......... $ 0.24 $ 0.24 $ 0.29 $ 0.29
(1) In the fourth quarter of fiscal 2018, we corrected an error related to the presentation of complimentary meals.
Corresponding amounts for the first three quarters of fiscal 2018 of $6.0 million, $5.9 million, and $5.7 million,
respectively, were reclassified out of revenue and other operating expenses. Further, the associated cost of
complimentary meals was reclassified to other operating expenses out of cost of sales in the amounts of $1.5
million, $1.5 million, and $1.4 million, respectively as well as $1.1 million out of labor in each quarter. The
Company did not correct the 2017 quarterly financial data as the Company does not consider the impact of the
prior period error to be material to those periods.
(2) In fiscal 2018, income from operations included $2.6 million, $0.3 million and $15.0 million of lease
termination and impairment expense in the second, third and fourth quarters, respectively, with an
corresponding impact to net income of $1.9 million, $0.2 million and $11.1 million, respectively. In fiscal 2017,
income from operations included $0.8 million, $0.4 million and $9.1 million of accelerated depreciation and
impairment expense in the first, second and fourth quarters, respectively, with a corresponding impact to net
income of $0.4 million, $0.3 million, $5.5 million, respectively. These amounts were recorded in impairment of
assets and lease terminations in the consolidated statements of income. (See Note 1 for further discussion of
these charges.)
(3) The fourth quarter of fiscal 2017 includes a $38.5 million benefit to our income tax provision related to the Tax
Act. (See Note 15 for further discussion of income taxes.)
(4) Net income per share calculations for each quarter are based on the weighted average diluted shares outstanding
for that quarter and may not total to the full year amount.
While seasonal fluctuations generally do not have a material impact on our quarterly results, the year-over-year
comparison of our quarterly results can be significantly impacted by the number and timing of new restaurant openings
and associated preopening costs, the calendar days of the week on which holidays occur, the impact from inclement
weather and other climatic conditions, the additional week in a 53-week fiscal year and other variations in revenues and
expenses. As a result of these factors, our financial results for any quarter are not necessarily indicative of the results that
may be achieved for the full fiscal year.
18. Subsequent Events
On February 13, 2019, our Board of Directors approved a quarterly cash dividend of $0.33 per share to be paid
on March 19, 2019 to the stockholders of record on March 4, 2019.
On February 13, 2019, our Board of Directors approved the adoption of a 10b5-1 Plan, which will be effective
from March 25, 2019 through July 31, 2019.
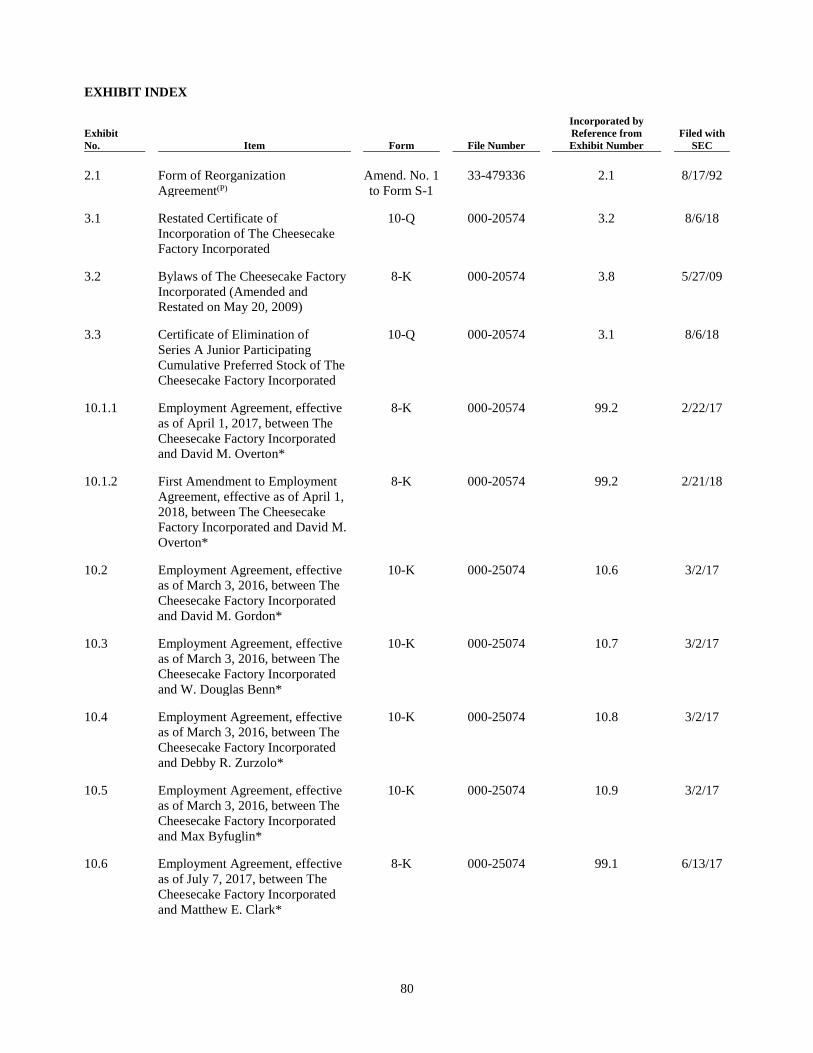
80
EXHIBIT INDEX
Exhibit
No. Item Form File Number
Incorporated by
Reference from
Exhibit Number
Filed with
SEC
2.1 Form of Reorganization
Agreement(P)
Amend. No. 1
to Form S-1
33-479336 2.1 8/17/92
3.1 Restated Certificate of
Incorporation of The Cheesecake
Factory Incorporated
10-Q 000-20574 3.2 8/6/18
3.2 Bylaws of The Cheesecake Factory
Incorporated (Amended and
Restated on May 20, 2009)
8-K 000-20574 3.8 5/27/09
3.3 Certificate of Elimination of
Series A Junior Participating
Cumulative Preferred Stock of The
Cheesecake Factory Incorporated
10-Q 000-20574 3.1 8/6/18
10.1.1 Employment Agreement, effective
as of April 1, 2017, between The
Cheesecake Factory Incorporated
and David M. Overton*
8-K 000-20574 99.2 2/22/17
10.1.2 First Amendment to Employment
Agreement, effective as of April 1,
2018, between The Cheesecake
Factory Incorporated and David M.
Overton*
8-K 000-20574 99.2 2/21/18
10.2 Employment Agreement, effective
as of March 3, 2016, between The
Cheesecake Factory Incorporated
and David M. Gordon*
10-K 000-25074 10.6 3/2/17
10.3 Employment Agreement, effective
as of March 3, 2016, between The
Cheesecake Factory Incorporated
and W. Douglas Benn*
10-K 000-25074 10.7 3/2/17
10.4 Employment Agreement, effective
as of March 3, 2016, between The
Cheesecake Factory Incorporated
and Debby R. Zurzolo*
10-K 000-25074 10.8 3/2/17
10.5 Employment Agreement, effective
as of March 3, 2016, between The
Cheesecake Factory Incorporated
and Max Byfuglin*
10-K 000-25074 10.9 3/2/17
10.6 Employment Agreement, effective
as of July 7, 2017, between The
Cheesecake Factory Incorporated
and Matthew E. Clark*
8-K 000-25074 99.1 6/13/17
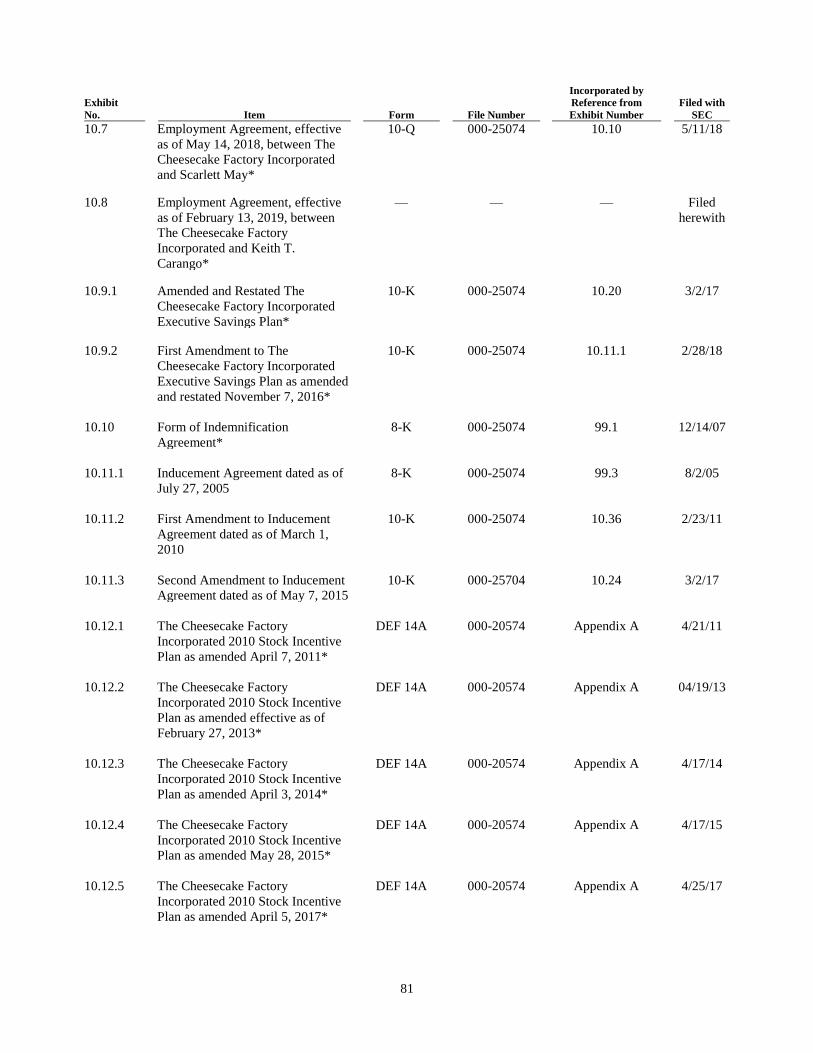
81
Exhibit
No. Item Form File Number
Incorporated by
Reference from
Exhibit Number
Filed with
SEC
10.7 Employment Agreement, effective
as of May 14, 2018, between The
Cheesecake Factory Incorporated
and Scarlett May*
10-Q 000-25074 10.10 5/11/18
10.8 Employment Agreement, effective
as of February 13, 2019, between
The Cheesecake Factory
Incorporated and Keith T.
Carango*
— — — Filed
herewith
10.9.1 Amended and Restated The
Cheesecake Factory Incorporated
Executive Savings Plan*
10-K 000-25074 10.20 3/2/17
10.9.2 First Amendment to The
Cheesecake Factory Incorporated
Executive Savings Plan as amended
and restated November 7, 2016*
10-K 000-25074 10.11.1 2/28/18
10.10 Form of Indemnification
Agreement*
8-K 000-25074 99.1 12/14/07
10.11.1 Inducement Agreement dated as of
July 27, 2005
8-K 000-25074 99.3 8/2/05
10.11.2 First Amendment to Inducement
Agreement dated as of March 1,
2010
10-K 000-25074 10.36 2/23/11
10.11.3 Second Amendment to Inducement
Agreement dated as of May 7, 2015
10-K 000-25704 10.24 3/2/17
10.12.1 The Cheesecake Factory
Incorporated 2010 Stock Incentive
Plan as amended April 7, 2011*
DEF 14A 000-20574 Appendix A 4/21/11
10.12.2 The Cheesecake Factory
Incorporated 2010 Stock Incentive
Plan as amended effective as of
February 27, 2013*
DEF 14A 000-20574 Appendix A 04/19/13
10.12.3 The Cheesecake Factory
Incorporated 2010 Stock Incentive
Plan as amended April 3, 2014*
DEF 14A 000-20574 Appendix A 4/17/14
10.12.4 The Cheesecake Factory
Incorporated 2010 Stock Incentive
Plan as amended May 28, 2015*
DEF 14A 000-20574 Appendix A 4/17/15
10.12.5 The Cheesecake Factory
Incorporated 2010 Stock Incentive
Plan as amended April 5, 2017*
DEF 14A 000-20574 Appendix A 4/25/17
82
Exhibit
No. Item Form File Number
Incorporated by
Reference from
Exhibit Number
Filed with
SEC
10.13 Form of Grant Agreement for
Executive Officers under 2010
Stock Incentive Plan*
10-Q 000-20574 10.1 11/4/10
10.14 Form of Grant Agreement for
Executive Officers under the 2010
Stock Incentive Plan, for equity
grants made after August 2, 2012*
10-Q 000-20574 10.1 8/10/12
10.15 Form of Notice of Stock Option
Grant and Agreement and/or
Restricted Stock Grant Agreement
for Executive Officers under the
2010 Stock Incentive Plan, for
equity grants made after March 6,
2014*
8-K 000-20574 99.1 3/7/14
10.16 Form of Notice of Grant and Stock
Option Agreement and/or Stock
Unit Agreement under the 2010
Stock Incentive Plan, for equity
grants made after March 3, 2016*
8-K 000-20574 99.2 3/4/16
10.17.1 Form of Notice of Grant and Stock
Option Agreement and/or
Restricted Share Agreement for
MEP I under the 2010 Stock
Incentive Plan, for equity grants
made after February 15, 2018*
10-K 000-25074 10.24.1 2/28/18
10.17.2 Form of Notice of Grant and Stock
Option Agreement and/or
Restricted Share Agreement for
MEP II under the 2010 Stock
Incentive Plan, for equity grants
made after February 15, 2018*
10-K 000-25074 10.24.2 2/28/18
10.17.3 Form of Notice of Grant and Stock
Option Agreement and/or
Restricted Share Agreement for
MEP III under the 2010 Stock
Incentive Plan, for equity grants
made after February 15, 2018*
10-K 000-25074 10.24.3 2/28/18
10.17.4 Form of Notice of Grant and Stock
Option Agreement and/or
Restricted Share Agreement for
MEP IV under the 2010 Stock
Incentive Plan, for equity grants
made after February 15, 2018*
10-K 000-25074 10.24.4 2/28/18
83
Exhibit
No. Item Form File Number
Incorporated by
Reference from
Exhibit Number
Filed with
SEC
10.17.5 Form of Notice of Grant and Stock
Option Agreement and/or
Restricted Share Agreement for
MEP V under the 2010 Stock
Incentive Plan, for equity grants
made after February 15, 2018*
10-K 000-25074 10.24.5 2/28/18
10.17.6 Form of Standard Notice of Grant
and Restricted Share Agreement I
under the 2010 Stock Incentive
Plan, for equity grants made after
February 15, 2018*
10-K 000-25074 10.24.6 2/28/18
10.17.7 Form of Notice of Grant and Stock
Option Agreement and/or
Restricted Share Agreement for
Senior Executive under the 2010
Stock Incentive Plan, for equity
grants made after February 15,
2018*
8-K 000-20574 99.3 2/21/2018
10.18 2015 Amended and Restated
Annual Performance Incentive
Plan, as amended and restated
May 28, 2015*
DEF 14A 000-20574 Appendix B 4/17/15
10.19 Second Amended and Restated
Loan Agreement with JPMorgan
Chase Bank, National Association
dated as of December 22, 2015
8-K 000-20574 99.1 12/24/15
10.20 Amendment No. 1 dated as of
November 10, 2016 to Second
Amended and Restated Loan
Agreement dated as of
December 22, 2015
8-K 000-20574 99.1 11/14/16
10.21 Joinder to Guaranty dated
November 10, 2016 by TCF
California Holding Company of
Second Amended and Restated
Loan Agreement dated as of
December 22, 2015
8-K 000-20574 99.2 11/14/16
21.1 List of Subsidiaries — — — Filed
herewith
23.1 Consent of Independent Registered
Public Accounting Firm — KPMG
LLP
— — — Filed
herewith
23.2 Consent of Independent Registered
Public Accounting Firm —
PricewaterhouseCoopers LLP
— — — Filed
herewith
84
Exhibit
No. Item Form File Number
Incorporated by
Reference from
Exhibit Number
Filed with
SEC
31.1 Rule 13a-14(a)/15d-
14(a) Certification of the Principal
Executive Officer
— — — Filed
herewith
31.2 Rule 13a-14(a)/15d-
14(a) Certification of the Principal
Financial Officer
— — — Filed
herewith
32.1 Certification Pursuant to 18 U.S.C.
Section 1350, as Adopted Pursuant
to Section 906 of the Sarbanes-
Oxley Act of 2002 for Principal
Executive Officer
— — — Filed
herewith
32.2 Certification Pursuant to 18 U.S.C.
Section 1350, as Adopted Pursuant
to Section 906 of the Sarbanes-
Oxley Act of 2002 for Principal
Financial Officer
— — — Filed
herewith
101.1 XBRL (Extensible Business
Reporting Language) The following
materials from The Cheesecake
Factory Incorporated’s Annual
Report on Form 10-K for the year
ended January 1, 2019, formatted in
Extensive Business Reporting
Language (XBRL): (i) consolidated
balance sheets, (ii) consolidated
statements of operations,
(iii) consolidated statement of
stockholders’ equity,
(iv) consolidated statements of cash
flows, and (v) the notes to the
consolidated financial statements.
— — — Filed
herewith
* Management contract or compensatory plan or arrangement required to be filed as an exhibit. (P) This exhibit has been paper filed and is not subject to the hyperlinking requirements of Item 601 of Regulation S-K.
85
SIGNATURES
Pursuant to the requirements of Section 13 or 15(d) of the Securities Exchange Act of 1934, the registrant has
duly caused this report to be signed on its behalf by the undersigned, thereunto duly authorized on the 4th day of
March 2019.
THE CHEESECAKE FACTORY INCORPORATED
/s/ DAVID OVERTON
By: David Overton
Chairman of the Board and Chief Executive Officer
(Principal Executive Officer)
86
POWER OF ATTORNEY
KNOW ALL PERSONS BY THESE PRESENTS, that each person whose signature appears below constitutes
and appoints David Overton and Matthew E. Clark, and each of them, as his or her true and lawful attorneys-in-fact and
agents, each with full power of substitution and resubstitution, for him or her and in his or her name, place and stead, in
any and all capacities, to sign any and all amendments to this Annual Report on Form 10-K, and to file the same, with all
exhibits thereto, and other documents in connection therewith, with the Securities and Exchange Commission, granting
unto said attorneys-in-fact and agents full power and authority to do and perform each and every act and thing requisite
and necessary to be done in connection therewith, as fully to all intents and purposes as he or she might or could do in
person, hereby ratifying and confirming all that said attorney-in-fact and agent, or his substitute or substitutes, may
lawfully do or cause to be done by virtue hereof.
SIGNATURES
Pursuant to the requirements of the Securities Exchange Act of 1934, this report has been signed below by the
following persons on behalf of the Registrant in the capacities and on the dates indicated.
Name Title Date
/s/ DAVID OVERTON Chairman of the Board and March 4, 2019
David Overton Chief Executive Officer
(Principal Executive Officer)
/s/ MATTHEW E. CLARK Executive Vice President and March 4, 2019
Matthew E. Clark Chief Financial Officer
(Principal Financial Officer)
/s/ CHERYL M. SLOMANN Senior Vice President, Controller and March 4, 2019
Cheryl M. Slomann Chief Accounting Officer
(Principal Accounting Officer)
/s/ EDIE A. AMES Director March 4, 2019
Edie A. Ames
/s/ ALEXANDER L. CAPPELLO Director March 4, 2019
Alexander L. Cappello
/s/ JEROME I. KRANSDORF Director March 4, 2019
Jerome I. Kransdorf
/s/ LAURENCE B. MINDEL Director March 4, 2019
Laurence B. Mindel
/s/ DAVID B. PITTAWAY Director March 4, 2019
David B. Pittaway
/s/ HERBERT SIMON Director March 4, 2019
Herbert Simon
87
EXHIBIT 21.1
LIST OF SUBSIDIARIES
The Cheesecake Factory Restaurants, Inc., a California corporation
The Cheesecake Factory Bakery Incorporated, a California corporation
TCF Co. LLC, a Nevada limited liability company
The Houston Cheesecake Factory Corporation, a Texas corporation
Cheesecake Factory Restaurants of Kansas LLC, a Kansas limited liability company
Grand Lux Cafe LLC, a Nevada limited liability company
Hawaii Cheesecake Factory Restaurants Inc., a Hawaii corporation
Rock Sugar Incorporated, a California corporation
Cherry Hill One, LLC, a New Jersey limited liability company
The Cheesecake Factory of Howard County LLC, a Maryland limited liability company
Middle East T.C.F. Corporation, a California corporation
Middle East IP Corporation, a California corporation
C.F.I. Promotions CA Co. LLC, a California limited liability company
CCF Latin America Corporation, a California corporation
CCF Latin America IP Corporation, a California corporation
CCF China Operating Corporation, a California corporation
CCF Asia Operating Corporation, a California corporation
CCF Asia IP Corporation, a California corporation
TCF California Holding Company, a California corporation
CCF Mexico LLC, a Nevada limited liability company
Social Monk Incorporated, a California corporation
TCF Canada, Inc., a Canadian corporation
CCF International LLC, a California limited liability company
88
EXHIBIT 23.1
CONSENT OF INDEPENDENT REGISTERED PUBLIC ACCOUNTING FIRM
The Board of Directors
The Cheesecake Factory Incorporated:
We consent to the incorporation by reference in the registration statements on Form S-8 (Nos. 333-118757, 333-167298,
333-176115, 333-190110, 333-198042, 333-206278 and 333-219789) of The Cheesecake Factory Incorporated of our
report dated March 1, 2019, with respect to the consolidated balance sheet of The Cheesecake Factory Incorporated and
subsidiaries as of January 1, 2019, and the related consolidated statements of income, comprehensive income,
stockholders’ equity and cash flows for the year then ended, and the related notes (collectively, the consolidated
financial statements), and the effectiveness of internal control over financial reporting as of January 1, 2019, which
report appears in the January 1, 2019 Annual Report on Form 10-K of The Cheesecake Factory Incorporated.
Our report refers to a change in the method of accounting for revenue from contracts with customers in 2018 due to the
adoption of Accounting Standards Codification Topic 606, Revenue from Contracts with Customers.
/s/ KPMG LLP
Los Angeles, California
March 4, 2019
89
EXHIBIT 23.2
CONSENT OF INDEPENDENT REGISTERED PUBLIC ACCOUNTING FIRM
We hereby consent to the incorporation by reference in the Registration Statements on Form S-8 (Nos. 333-118757, 333-
167298, 333-176115, 333-190110, 333-198042, 333-206278 and 333-219789) of The Cheesecake Factory Incorporated
of our report dated February 28, 2018 relating to the financial statements which appears in this Form 10-K.
/s/ PricewaterhouseCoopers LLP
Los Angeles, California
March 4, 2019
90
EXHIBIT 31.1
THE CHEESECAKE FACTORY INCORPORATED
CERTIFICATION OF PRINCIPAL EXECUTIVE OFFICER
I, David Overton, certify that:
1. I have reviewed this annual report on Form 10-K of The Cheesecake Factory Incorporated;
2. Based on my knowledge, this report does not contain any untrue statement of a material fact or omit to state a
material fact necessary to make the statements made, in light of the circumstances under which such statements
were made, not misleading with respect to the period covered by this report;
3. Based on my knowledge, the financial statements, and other financial information included in this report, fairly
present in all material respects the financial condition, results of operations and cash flows of the registrant as
of, and for, the periods presented in this report;
4. The registrant’s other certifying officer(s) and I are responsible for establishing and maintaining disclosure
controls and procedures (as defined in Exchange Act Rules 13a-15(e) and 15d-15(e)) and internal control over
financial reporting (as defined in Exchange Act Rules 13a-15(f) and 15d-15(f)) for the registrant and have:
(a) designed such disclosure controls and procedures, or caused such disclosure controls and procedures
to be designed under our supervision, to ensure that material information relating to the registrant,
including its consolidated subsidiaries, is made known to us by others within those entities,
particularly during the period in which this report is being prepared;
(b) designed such internal control over financial reporting, or caused such internal control over financial
reporting to be designed under our supervision, to provide reasonable assurance regarding the
reliability of financial reporting and the preparation of financial statements for external purposes in
accordance with generally accepted accounting principles;
(c) evaluated the effectiveness of the registrant’s disclosure controls and procedures and presented in
this report our conclusions about the effectiveness of the disclosure controls and procedures, as of
the end of the period covered by this report based on such evaluation; and
(d) disclosed in this report any change in the registrant’s internal control over financial reporting that
occurred during the registrant’s most recent fiscal quarter (the registrant’s fourth fiscal quarter in the
case of an annual report) that has materially affected, or is reasonably likely to materially affect, the
registrant’s internal control over financial reporting; and
5. The registrant’s other certifying officer(s) and I have disclosed, based on our most recent evaluation of internal
control over financial reporting, to the registrant’s auditors and the audit committee of the registrant’s board of
directors (or persons performing the equivalent functions):
(a) All significant deficiencies and material weaknesses in the design or operation of internal control
over financial reporting which are reasonably likely to adversely affect the registrant’s ability to
record, process, summarize and report financial information; and
(b) Any fraud, whether or not material, that involves management or other employees who have a
significant role in the registrant’s internal control over financial reporting.
March 4, 2019
/s/ DAVID OVERTON
David Overton
Chairman of the Board and Chief Executive Officer
(Principal Executive Officer)
91
EXHIBIT 31.2
THE CHEESECAKE FACTORY INCORPORATED
CERTIFICATION OF PRINCIPAL FINANCIAL OFFICER
I, Matthew E. Clark, certify that:
1. I have reviewed this annual report on Form 10-K of The Cheesecake Factory Incorporated;
2. Based on my knowledge, this report does not contain any untrue statement of a material fact or omit to state a
material fact necessary to make the statements made, in light of the circumstances under which such statements
were made, not misleading with respect to the period covered by this report;
3. Based on my knowledge, the financial statements, and other financial information included in this report, fairly
present in all material respects the financial condition, results of operations and cash flows of the registrant as
of, and for, the periods presented in this report;
4. The registrant’s other certifying officer(s) and I are responsible for establishing and maintaining disclosure
controls and procedures (as defined in Exchange Act Rules 13a-15(e) and 15d-15(e)) and internal control over
financial reporting (as defined in Exchange Act Rules 13a-15(f) and 15d-15(f)) for the registrant and have:
(a) designed such disclosure controls and procedures, or caused such disclosure controls and procedures
to be designed under our supervision, to ensure that material information relating to the registrant,
including its consolidated subsidiaries, is made known to us by others within those entities,
particularly during the period in which this report is being prepared;
(b) designed such internal control over financial reporting, or caused such internal control over financial
reporting to be designed under our supervision, to provide reasonable assurance regarding the
reliability of financial reporting and the preparation of financial statements for external purposes in
accordance with generally accepted accounting principles;
(c) evaluated the effectiveness of the registrant’s disclosure controls and procedures and presented in this
report our conclusions about the effectiveness of the disclosure controls and procedures, as of the end
of the period covered by this report based on such evaluation; and
(d) disclosed in this report any change in the registrant’s internal control over financial reporting that
occurred during the registrant’s most recent fiscal quarter (the registrant’s fourth fiscal quarter in the
case of an annual report) that has materially affected, or is reasonably likely to materially affect, the
registrant’s internal control over financial reporting; and
5. The registrant’s other certifying officer(s) and I have disclosed, based on our most recent evaluation of internal
control over financial reporting, to the registrant’s auditors and the audit committee of the registrant’s board of
directors (or persons performing the equivalent functions):
(a) All significant deficiencies and material weaknesses in the design or operation of internal control
over financial reporting which are reasonably likely to adversely affect the registrant’s ability to
record, process, summarize and report financial information; and
(b) Any fraud, whether or not material, that involves management or other employees who have a
significant role in the registrant’s internal control over financial reporting.
March 4, 2019
/s/ MATTHEW E. CLARK
Matthew E. Clark
Executive Vice President and Chief Financial Officer
(Principal Financial Officer)
92
EXHIBIT 32.1
THE CHEESECAKE FACTORY INCORPORATED
CERTIFICATION PURSUANT TO
18 U.S.C. SECTION 1350,
AS ADOPTED PURSUANT TO
SECTION 906 OF THE SARBANES-OXLEY ACT OF 2002
In connection with the Annual Report of The Cheesecake Factory Incorporated (the “Company”) on Form 10-K
for the period ended January 1, 2019 as filed with the Securities and Exchange Commission on the date hereof (the
“Report”), I, David Overton, Chairman of the Board and Chief Executive Officer of the Company, certify, pursuant to 18
U.S.C. § 1350, as adopted pursuant to § 906 of the Sarbanes-Oxley Act of 2002, that:
(1) The Report fully complies with the requirements of Section 13(a) or 15(d) of the Securities Exchange
Act of 1934; and
(2) The information contained in the Report fairly presents, in all material respects, the financial condition
and results of operations of the Company.
March 4, 2019
/s/ DAVID OVERTON
David Overton
Chairman of the Board and Chief Executive Officer
93
EXHIBIT 32.2
THE CHEESECAKE FACTORY INCORPORATED
CERTIFICATION PURSUANT TO
18 U.S.C. SECTION 1350,
AS ADOPTED PURSUANT TO
SECTION 906 OF THE SARBANES-OXLEY ACT OF 2002
In connection with the Annual Report of The Cheesecake Factory Incorporated (the “Company”) on Form 10-K
for the period ended January 1, 2019 as filed with the Securities and Exchange Commission on the date hereof (the
“Report”), I, Matthew E. Clark, Executive Vice President and Chief Financial Officer of the Company, certify, pursuant
to 18 U.S.C. § 1350, as adopted pursuant to § 906 of the Sarbanes-Oxley Act of 2002, that:
(1) The Report fully complies with the requirements of Section 13(a) or 15(d) of the Securities Exchange Act
of 1934; and
(2) The information contained in the Report fairly presents, in all material respects, the financial condition and
results of operations of the Company.
March 4, 2019
/s/ MATTHEW E. CLARK
Matthew E. Clark
Executive Vice President and Chief Financial Officer
David OvertonChairman of the Board and Chief Executive OfficerThe Cheesecake Factory Incorporated
Edie A. AmesChief Executive OfficerThe Pie Hole Los Angeles
Alexander L. CappelloChairman and Chief Executive OfficerCappello Global, LLC
Jerome I. KransdorfPresident EmeritusJaK Direct
Laurence B. MindelManaging PartnerPoggio Trattoria,Copita Tequileria Y Comida and Convivo
David B. PittawayVice Chairman, Senior Managing Director, Senior Vice President and SecretaryCastle Harlan, Inc.
Herbert SimonChairman EmeritusSimon Property Group, Inc.
Executive Officers
David OvertonChairman of the Board and Chief Executive Officer
David M. GordonPresident
Matthew E. ClarkExecutive Vice President and Chief Financial Officer
Scarlett MayExecutive Vice President, General Counsel and Secretary
Keith T. CarangoPresident – Bakery Division
Operating and Staff Officers
Donald C. Moore Executive Vice President and Chief Culinary Officer
Spero G. AlexSenior Vice President – Operations, The Cheesecake Factory Restaurants
Dina R. Barmasse-GraySenior Vice President –Human Resources
Donald C. EvansSenior Vice President and Chief Marketing Officer
Independent Accountants
KPMG LLPLos Angeles, California
Transfer Agent, Registrar and Dividend Payments
Computershare Shareholder ServicesP.O. Box 30170College Station, TX 77845(800) 962-4284
Inquiries
Communications regarding lost certificates, and name and address changes should be directed to our Transfer Agent. Other investor inquiries should be directed to:
Stacy J. FeitVice President, Investor RelationsThe Cheesecake Factory Incorporated26901 Malibu Hills RoadCalabasas Hills, CA 91301(818) 871-3000
Common Stock Trading
Our stock began trading on The NASDAQ Stock Market on September 18, 1992 under the symbol CAKE at the initial public offering price of $2.63 (adjusted for five three-for-two stock splits in March 1994, April 1998, June 2000, June 2001 and December 2004). We completed follow-on public offerings of common stock in January 1994 and November 1997. The market price of our common stock has not closed below $2.63 and has closed as high as $67.14 through January 1, 2019, our last fiscal year-end.
Website
To learn more about our Company, please visit www.thecheesecakefactory.com and our related websites at www.grandluxcafe.com, www.rocksugarkitchen.com and www.socialmonk.com. To learn about our sustainability initiatives, please visit www.thecheesecakefactory.com/corporate- social-responsibility/sustainability.
Stan D. HarveySenior Vice President – Purchasing
Marina LubinskySenior Vice President and Chief Information Officer
Brian MacKellarSenior Vice President – Development
Lisa A. McDowellSenior Vice President – Global Development
Cheryl M. SlomannSenior Vice President, Controller and Chief Accounting Officer
Charles G. WensingSenior Vice President – Operations Services, Performance Development and New Restaurant Operations
Jack K. BelkSenior Regional Vice President – Restaurant Operations
Jeffrey NemetRegional Vice President – Restaurant Operations
Joseph T. PhillipsRegional Vice President – Restaurant Operations
Steve M. PolceRegional Vice President – Restaurant Operations
Michael PereiraDivisional Vice President – Restaurant Operations, Grand Lux Cafe
Atallah A. Baroudi, Ph.D.Vice President – Food Safety and Quality Assurance
Heather M. BerryVice President –Beverage and Bakery Operations
Megan L. BloomerVice President – Sustainability
Linda J. CandiotyVice President – Guest Experience
Mervin DeguzmanVice President – Corporate Systems
Stacy J. FeitVice President – Investor Relations
Richard J. FringsVice President – Compensation and Benefits
directors and officers shareholder information
Sidney M. GreathouseVice President and Senior Counsel – Legal Services
Anthony R. Gressak, Jr.Vice President – Bakery Distributor Sales
Ashley W. HanscomVice President – Assistant Controller
Ronald IsackVice President –Bakery Supply Chain
Laurie A. Lambert-GaffneyVice President – Staff Relations
Kurt E. LeisureVice President – Risk Services
Etienne MarcusVice President –Strategy and Finance
Philip MardirossianVice President – Bakery Marketing
Kix McGinnis NystromVice President – Kitchen Operations
Robert OkuraVice President – Culinary Development and Corporate Executive Chef
Alan B. PhillipsVice President – Internal Audit
Chris M. RadovanVice President – Bakery Research and Development
J. Suzanne ReedVice President –Bakery Sales and Marketing
John ScottVice President – Bakery Food Safety and Quality Assurance
Joel E. ShaferVice President and Senior Counsel– Contracts
Jeff SteplerVice President – Talent Selection and Organizational Engagement
Roman L. WasylynVice President – Tax
Robert T. WestVice President – Information Technology
Lori R. WilliamsVice President – Bakery Controller
Board of Directors
F I N A N C I A L H I G H L I G H T S
(1) The Cheesecake Factory restaurants. (2) Operating income margin in fiscal 2018, 2017, 2016, 2015 and 2014 excludes $17,861, $10,343, $114, $6,011 and $696, respectively (in thousands), related to a number of items that we do not consider indicative of our ongoing operations. Please refer to the section entitled “Non-GAAP Measures” included in Item 7, “Management’s Discussion and Analysis of Financial Condition and Results of Operations,” of the Form 10-K in this Annual Report and in Item 6, “Selected Financial Data,” of the Form 10-K in the 2015 Annual Report for more information on these items. (3) Diluted net income per share in fiscal 2018, 2017, 2015 and 2014 excludes $0.29, ($0.67), $0.07 and $0.01, respectively, related to a number of items that we do not consider indicative of our ongoing operations. Impairment charge recorded in fiscal 2016 did not impact diluted net income per share. Please refer to the section entitled “Non-GAAP Measures” included in Item 7, “Management’s Discussion and Analysis of Financial Condition and Results of Operations,” of the Form 10-K in this Annual Report and in Item 6, “Selected Financial Data,” of the Form 10-K in the 2015 Annual Report for more information on these items.
(4) The Cheesecake Factory restaurants, Grand Lux Cafe and RockSugar Southeast Asian Kitchen.
Revenues (in millions)
$2,332 $2,261 $2,276 $2,101 $1,977 2018 2017 2016 2015 2014
Comparable restaurant sales (1)
1.7% (0.8)% 1.2% 2.6% 1.5% 2018 2017 2016 2015 2014
Adjusted operating income margin (2)
5.9% 7.3% 8.8% 8.2% 7.3% 2018 2017 2016 2015 2014
Adjusted diluted net income per share (3) $2.43 $2.60 $2.83 $2.37 $1.97 2018 2017 2016 2015 2014
Cash flow from operations (in millions)
$291 $239 $316 $248 $249 2018 2017 2016 2015 2014
Restaurants open at fiscal year-end (4)
217 214 208 200 189 2018 2017 2016 2015 2014
26901 Malibu Hills RoadCalabasas Hills, CA 91301
www.thecheesecakefactory.com
th
e c
he
ese
ca
ke
fac
to
ry
inc
or
po
ra
te
d2
018
an
nu
al
re
po
rt
2 0 1 8 a n n u a l r e p o r t