Embed Size (px)
Citation preview

2018 ANNUAL REGIONAL PARK-AND-RIDE SYSTEM REPORTJANUARY 2019
Prepared for:
Metropolitan Council
Metro Transit
Minnesota Valley Transit Authority
SouthWest Transit
Maple Grove Transit
Plymouth Metrolink
Northstar Link
Minnesota Department of Transportation
Wisconsin Department of Transportation
Prepared by:
Emma Pickett Metro Transit Engineering and Facilities, Planning and Urban Design
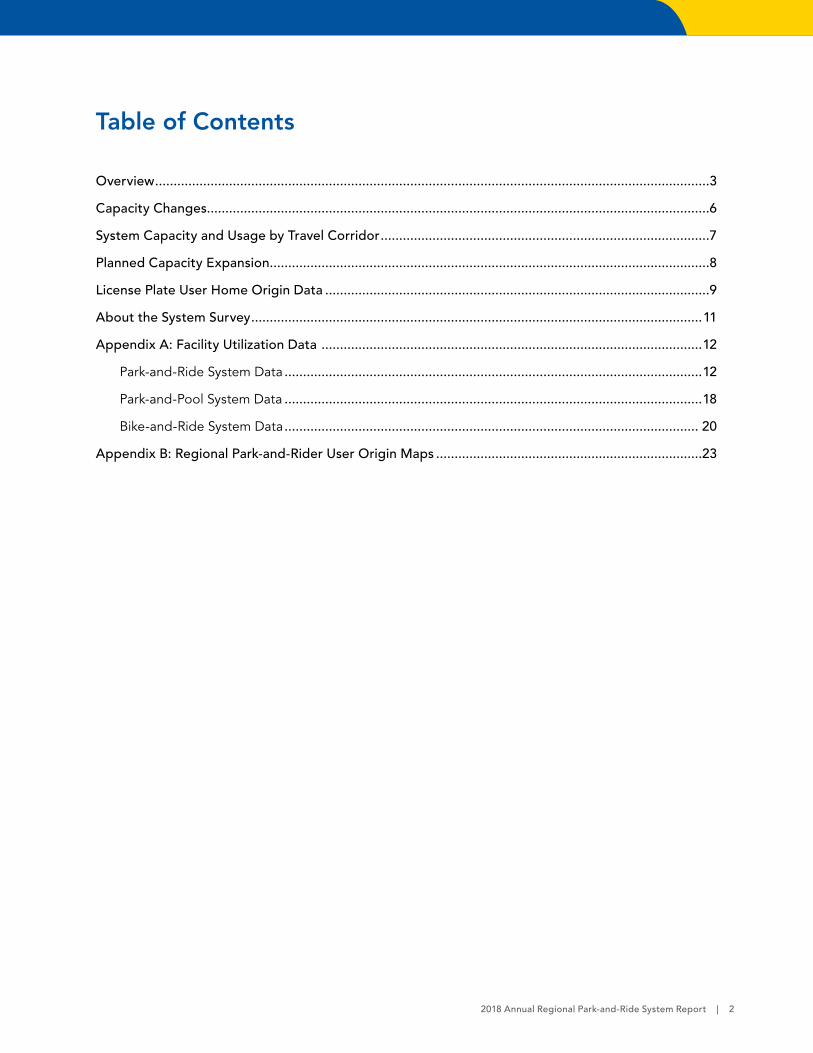
Table of Contents
Overview ......................................................................................................................................................3
Capacity Changes........................................................................................................................................6
System Capacity and Usage by Travel Corridor .........................................................................................7
Planned Capacity Expansion .......................................................................................................................8
License Plate User Home Origin Data ........................................................................................................9
About the System Survey ..........................................................................................................................11
Appendix A: Facility Utilization Data .......................................................................................................12
Park-and-Ride System Data .................................................................................................................12
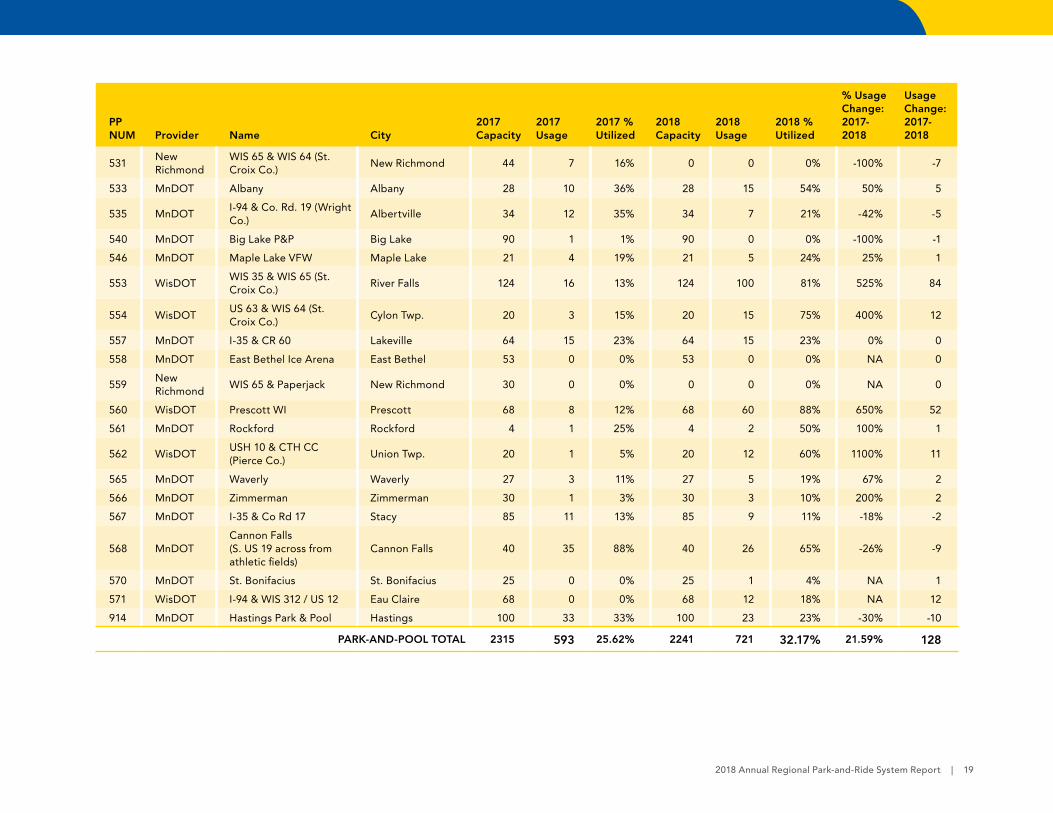
Park-and-Pool System Data .................................................................................................................18
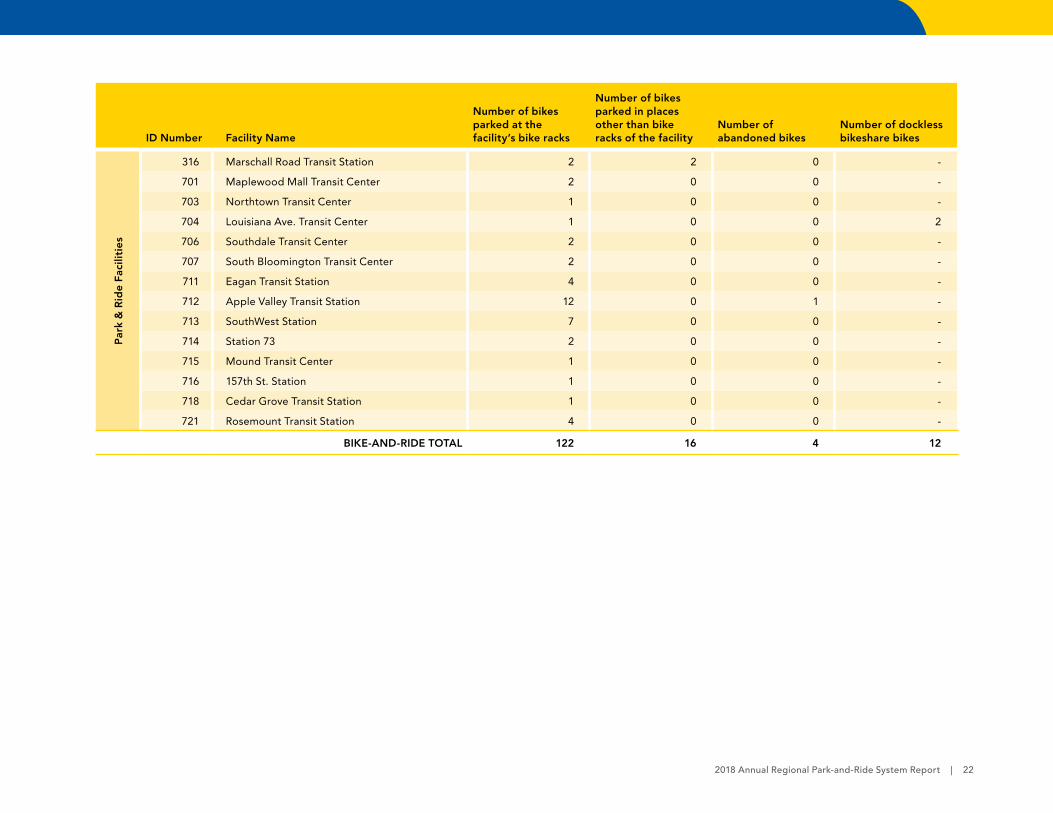
Bike-and-Ride System Data ................................................................................................................ 20
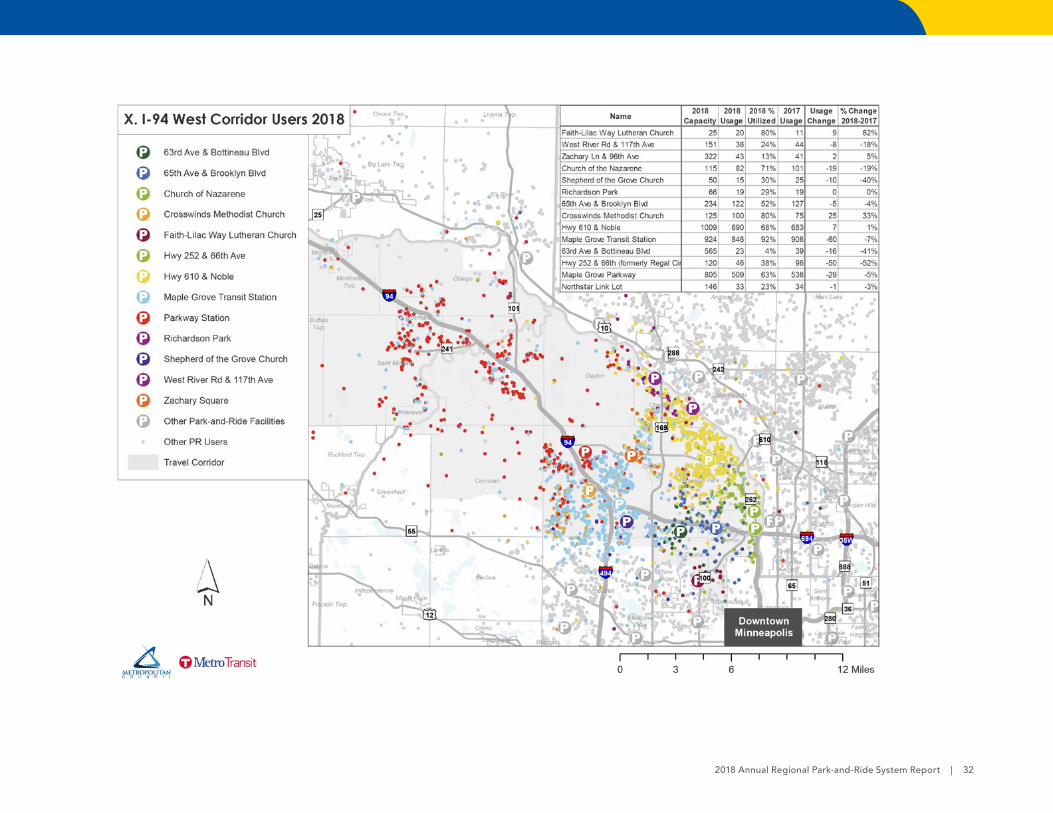
Appendix B: Regional Park-and-Rider User Origin Maps ........................................................................23
2018 Annual Regional Park-and-Ride System Report | 2

OverviewThe 2018 Annual Regional Park-and-Ride System Report provides a summary of current trends in the Twin Cities regional park-and-ride system. This document is a system performance update that complements other Metropolitan Council long-term planning documents, including the 2040 Transportation Policy Plan and Thrive MSP 2040. A survey of the system was conducted in late September and early October 2018, which included vehicle and bicycle counts for every facility as well as recording of license plates for analyzing user origins.
As of October 2018, the regional park-and-ride system consisted of 104 active park-and-ride facilities throughout the Twin Cities metropolitan area. In addition to park-and-ride facilities, there are 40 park-and-pool facilities. Park-and-ride facilities are defined as parking facilities that are served by transit (i.e. they have a bus route or rail line serving them), whereas park-and-pool facilities are designated parking areas that provide individuals a gathering point from which they can carpool to a common destination. Both types of facilities have been surveyed by regional and state transportation agencies since 1999. This report focuses primarily on park-and-ride facilities.
Six transit providers operate the region’s park-and-ride facilities and associated transit service: Minnesota Valley Transit Authority (MVTA), Maple Grove Transit, Metro Transit, Northstar Link, Plymouth Metrolink and SouthWest Transit. The region’s park-and-pools are provided by the Minnesota Department of Transportation (MnDOT) and Wisconsin Department of Transportation (WisDOT). The annual system survey is a collaborative effort conducted by the region’s providers.
The 2018 survey counted 18,442 regional park-and-ride users, a decrease of approximately 6 percent from 19,610 users in 2017. The overall capacity of the system is currently 33,740, and the utilization rate is 54.7 percent. While strong growth in usage occurred between 2004 and 2008, utilization rates have since leveled off and remain steadily within a range of 18,000 to 19,000 users over the past decade. Yearly changes in total capacity and usage of the park-and-ride system can be seen in Figure 1. The locations of all active park-and-ride facilities is shown in Figure 2.
This year, all providers saw a slight decrease in park-and-ride usage except Plymouth. Metro Transit’s usage showed a notable decline in parking utilization at 28th Ave. Station; however, this reflects a return to normal after conclusion of a short-term lease for local parking needs. Capacity and usage changes by service provider may be found in Table 1.
The regional system has available capacity for more metro residents to use park-and-rides. The Hwy. 169 South, I-35W South Upper, I-35E North/Hwy. 36 East, Hwy. 61 South and I-35W North corridors have the greatest available capacity with utilization rates of less than 50 percent. Only one corridor, I-94 East, experiences a utilization rate over 80 percent, and a new park-and-ride at I-94 and Manning Avenue in Lake Elmo is scheduled to open in late 2019.
Several municipalities throughout the Twin Cities Metropolitan Area have reached an agreement with the Council to implement the Transit Capital Levy. Consequently, all taxable properties are assessed for transit and paratransit capital within these communities. The data from this year’s survey show that 79 percent of all park-and-ride users reside within communities that are part of the Transit Capital Levy District.
2018 Annual Regional Park-and-Ride System Report | 3
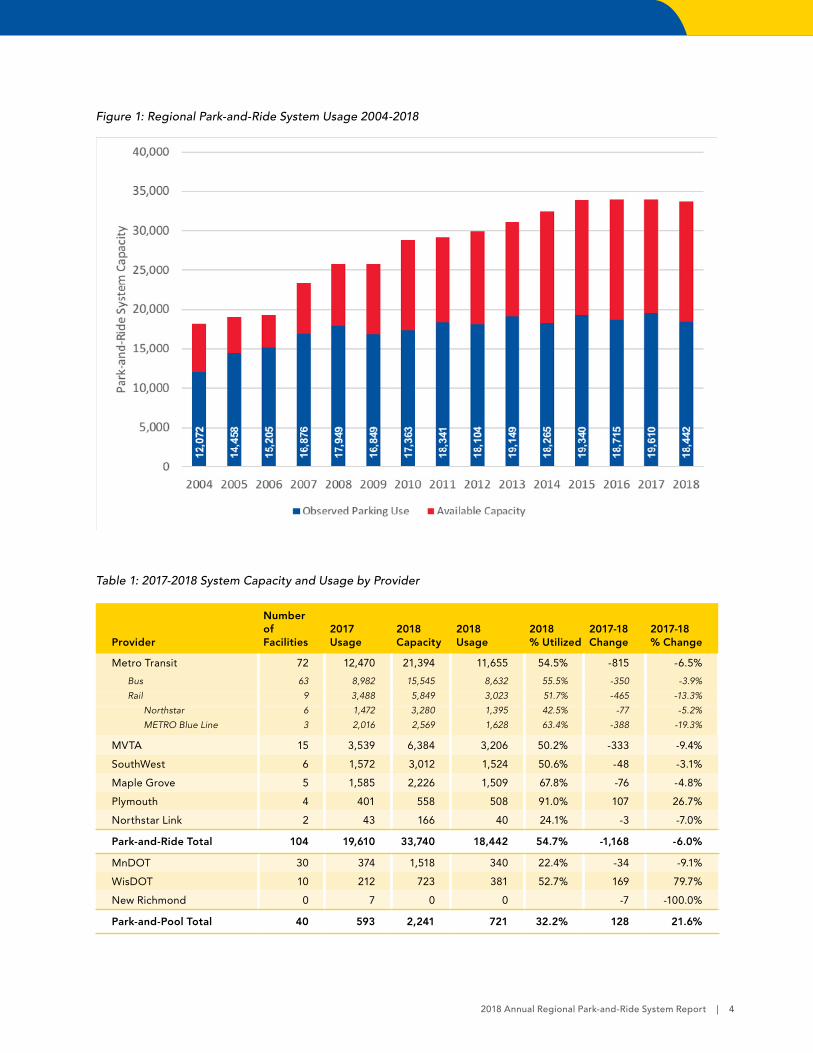
Figure 1: Regional Park-and-Ride System Usage 2004-2018
Table 1: 2017-2018 System Capacity and Usage by Provider
Provider
Number of Facilities
2017 Usage
2018 Capacity
2018 Usage
2018 % Utilized
2017-18 Change
2017-18 % Change
Metro Transit 72 12,470 21,394 11,655 54.5% -815 -6.5%
Bus 63 8,982 15,545 8,632 55.5% -350 -3.9%
Rail 9 3,488 5,849 3,023 51.7% -465 -13.3%
Northstar 6 1,472 3,280 1,395 42.5% -77 -5.2%
METRO Blue Line 3 2,016 2,569 1,628 63.4% -388 -19.3%
MVTA 15 3,539 6,384 3,206 50.2% -333 -9.4%
SouthWest 6 1,572 3,012 1,524 50.6% -48 -3.1%
Maple Grove 5 1,585 2,226 1,509 67.8% -76 -4.8%
Plymouth 4 401 558 508 91.0% 107 26.7%
Northstar Link 2 43 166 40 24.1% -3 -7.0%
Park-and-Ride Total 104 19,610 33,740 18,442 54.7% -1,168 -6.0%
MnDOT 30 374 1,518 340 22.4% -34 -9.1%
WisDOT 10 212 723 381 52.7% 169 79.7%
New Richmond 0 7 0 0 -7 -100.0%
Park-and-Pool Total 40 593 2,241 721 32.2% 128 21.6%
2018 Annual Regional Park-and-Ride System Report | 4

Figure 2: 2018 Regional Park-And-Ride System by Provider
2018 Annual Regional Park-and-Ride System Report | 5

Capacity ChangesSince the October 2017 park-and-ride system survey, 32 spaces have been added and 300 spaces have been removed from the regional park-and-ride system capacity total for a net loss of 268 spaces. Two facilities closed: Mermaid Supper Club and Preserve Village Mall. At both of these facilities, the leases were discontinued by their owners.
Several facilities’ capacities were adjusted given recent construction projects and data validation. Fort Snelling South’s capacity was corrected from 675 spaces to 586. This new total excludes Fort Snelling Club parking spaces that were initially included in the facility’s overall capacity but are no longer available to Metro Transit park-and-ride customers. Capacities at 65th Ave. & Brooklyn Blvd. Park & Ride, Plymouth Road Park & Ride, Wayzata and Barry Ave. and Park Place & I-394 changed due to ADA site improvements to the lots. Skating Center’s capacity was adjusted from 50 to 51 based on a recount of spaces during the 2017 system survey. Southdale Transit Center saw a capacity adjustment of 14 spaces due to construction and a change in the location of the overflow parking lot. All 2018 capacity changes and corrections can be seen in Table 2.
Table 2: Capacity Changes and Corrections
Park and Ride Facility2017 Capacity
2018 Capacity
Capacity Change Reason
65th Ave. & Brooklyn Blvd. Park & Ride 239 242 3 Site Improvement -Capacity Change
Plymouth Road Park & Ride 111 113 2 Site Improvement -Capacity Change
Wayzata Blvd & Barry Ave. 102 101 -1 Site Improvement -Capacity Change
Park Place & I-394 55 67 12 Site Improvement -Capacity Change
Fort Snelling South 675 586 -89 Corrected capacity
Mermaid Supper Club 80 0 -80 Facility closure
Hwy. 252 & 66th (formerly Regal Cinemas)
200 120 -80 Construction/Reduced spaces
Skating Center 50 51 1 Corrected capacity
Southdale Transit Center 147 161 14 Change in overflow parking location and capacity
Preserve Village Mall 50 0 -50 Facility closure
Spaces Lost 300
Spaces Gained 32
Net Capacity Change -268
2018 Annual Regional Park-and-Ride System Report | 6
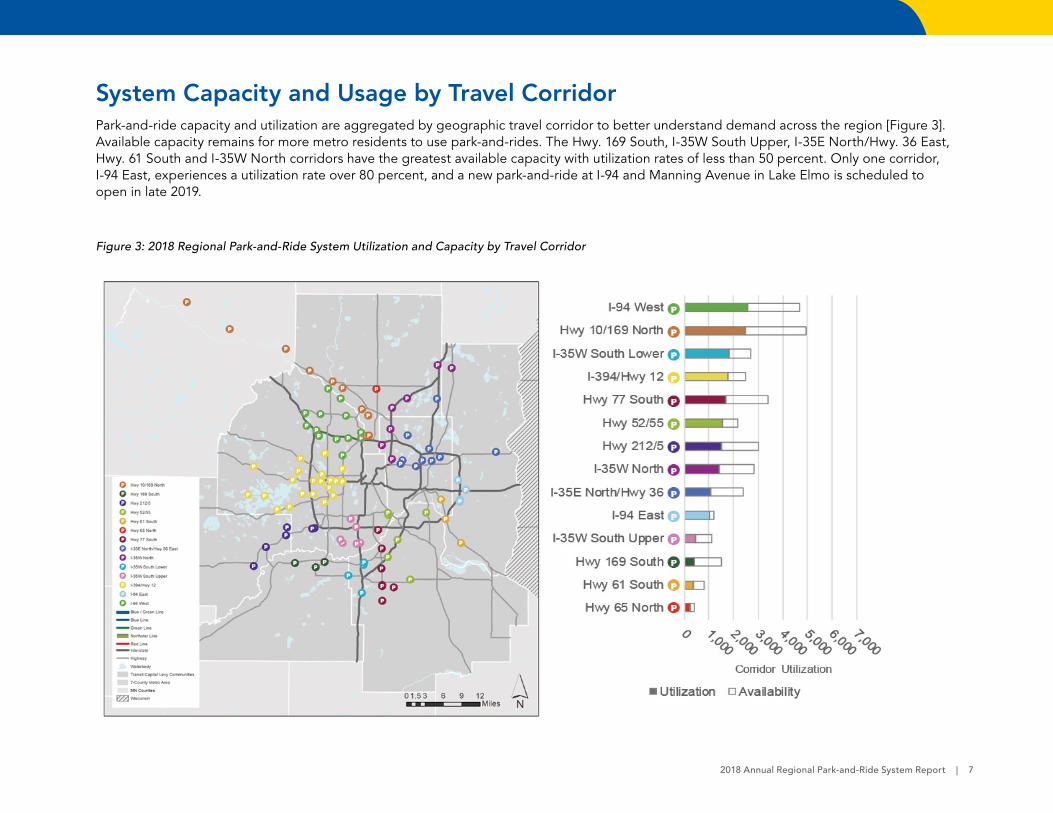
System Capacity and Usage by Travel CorridorPark-and-ride capacity and utilization are aggregated by geographic travel corridor to better understand demand across the region [Figure 3]. Available capacity remains for more metro residents to use park-and-rides. The Hwy. 169 South, I-35W South Upper, I-35E North/Hwy. 36 East, Hwy. 61 South and I-35W North corridors have the greatest available capacity with utilization rates of less than 50 percent. Only one corridor, I-94 East, experiences a utilization rate over 80 percent, and a new park-and-ride at I-94 and Manning Avenue in Lake Elmo is scheduled to open in late 2019.
Figure 3: 2018 Regional Park-and-Ride System Utilization and Capacity by Travel Corridor
2018 Annual Regional Park-and-Ride System Report | 7
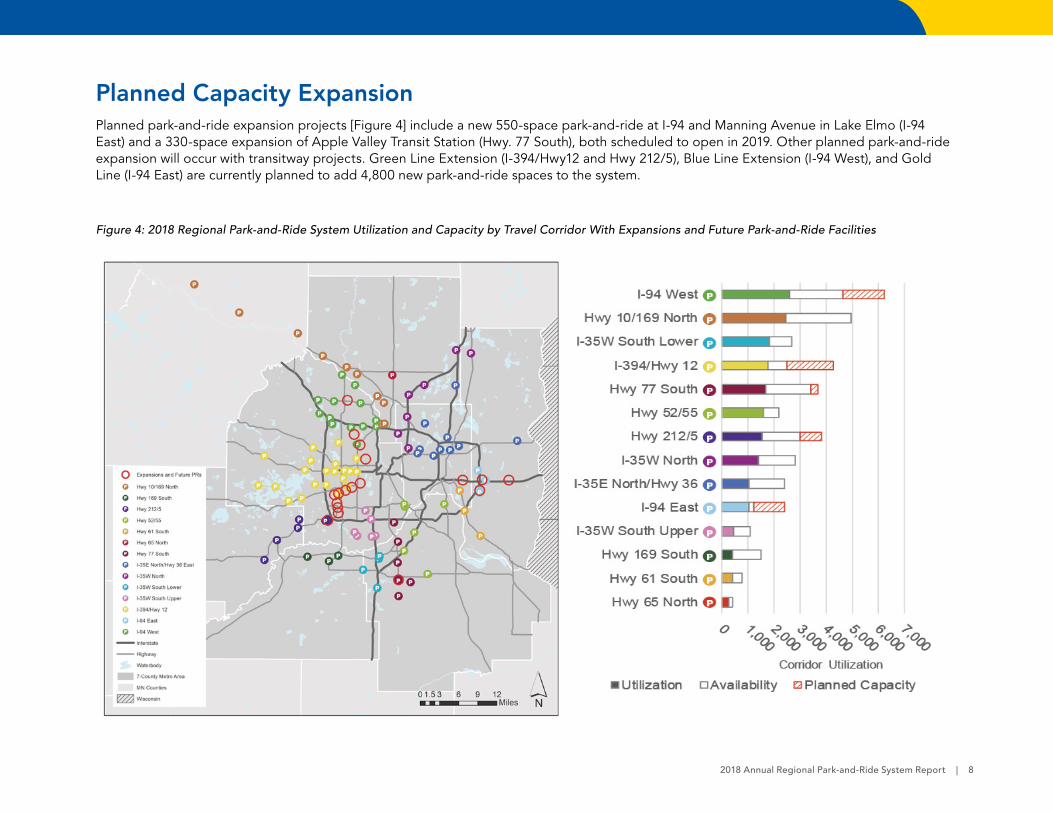
Planned Capacity ExpansionPlanned park-and-ride expansion projects [Figure 4] include a new 550-space park-and-ride at I-94 and Manning Avenue in Lake Elmo (I-94 East) and a 330-space expansion of Apple Valley Transit Station (Hwy. 77 South), both scheduled to open in 2019. Other planned park-and-ride expansion will occur with transitway projects. Green Line Extension (I-394/Hwy12 and Hwy 212/5), Blue Line Extension (I-94 West), and Gold Line (I-94 East) are currently planned to add 4,800 new park-and-ride spaces to the system.
Figure 4: 2018 Regional Park-and-Ride System Utilization and Capacity by Travel Corridor With Expansions and Future Park-and-Ride Facilities
2018 Annual Regional Park-and-Ride System Report | 8

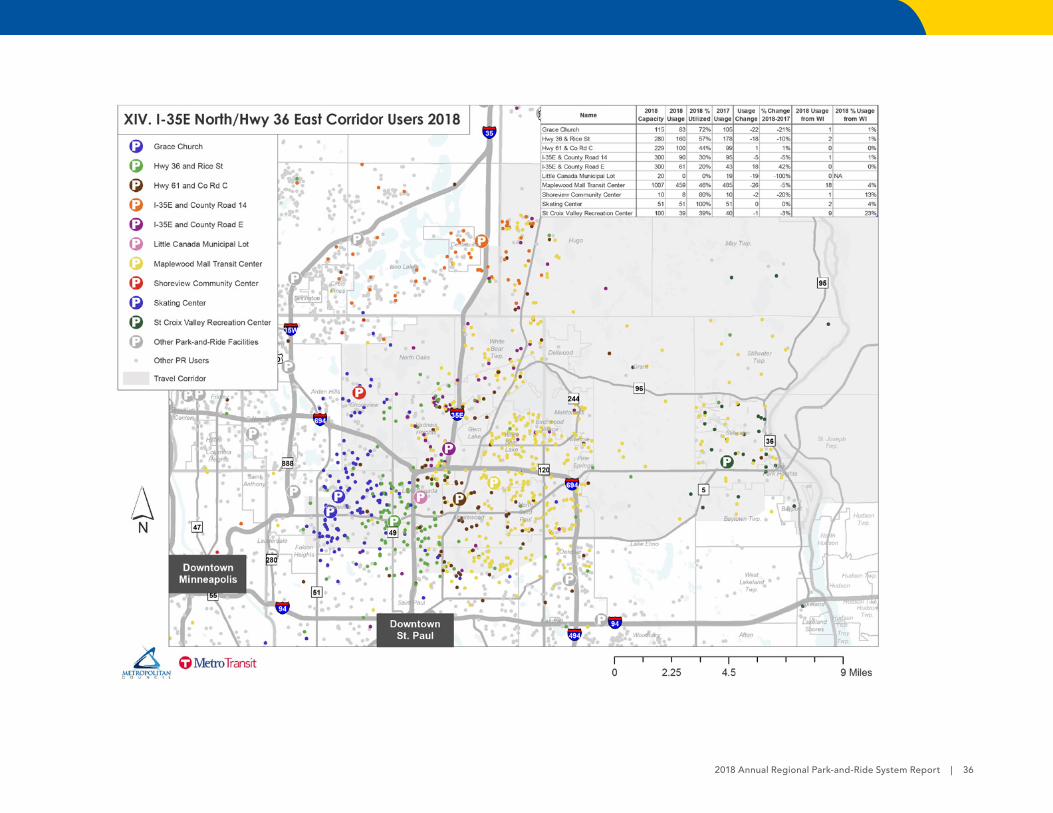
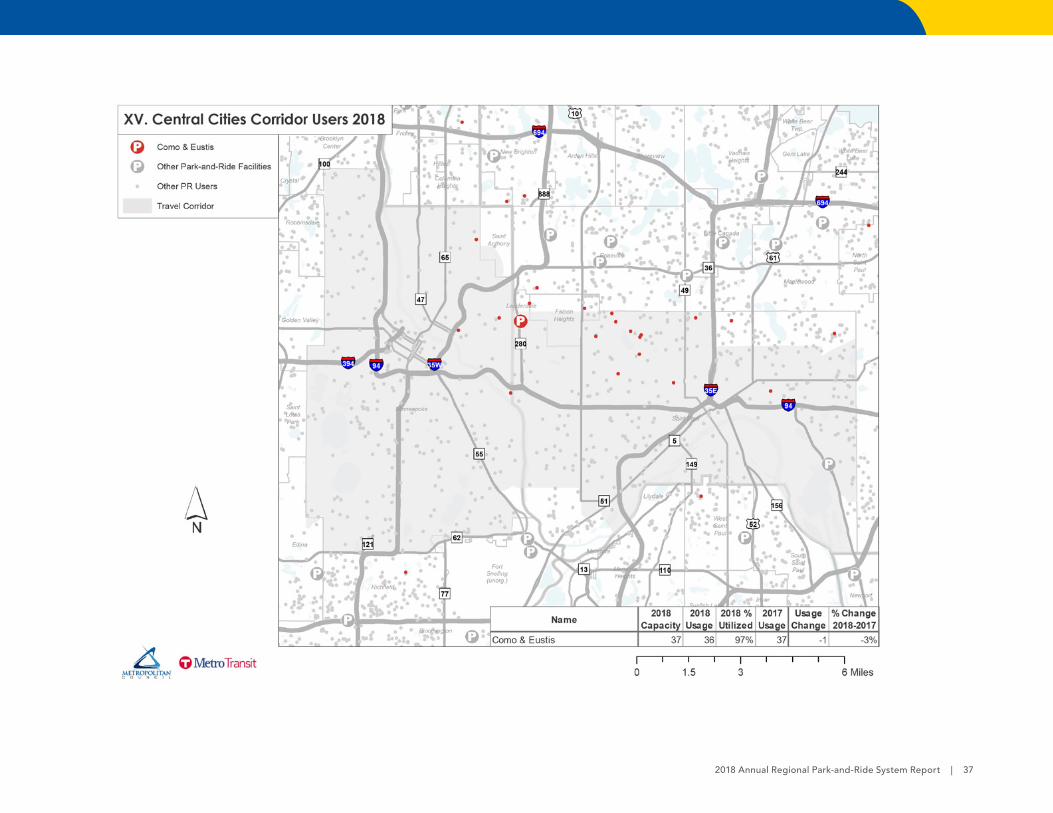
License Plate User Home Origin DataMetro Transit obtained Minnesota user origin data from the Driver and Vehicle Services (DVS) Division of the Minnesota Department of Public Safety. Geocoding user origin data makes it possible to show generalized customer origins while protecting individual user privacy. User data, including home addresses, are kept private and secure in accordance with a data practices agreement between DVS and the Metropolitan Council. Metro Transit has not been able to obtain Wisconsin user home address information since the 2014 survey. The tables on the Regional Park-and-Rider User Origin Maps (in Appendix B) contain counts of Wisconsin license plate users at each facility.
Maps of customer origins provide information about user travel patterns and allows Metro Transit and other transit providers to plan accordingly. Plans are developed to meet demand partially through analysis of user home origins. This data also provides insights for transitway ridership forecasting. Specific driver data is kept private in conformance with state data privacy laws. Park-and-ride users’ home origins from Minnesota license plates and counts by geographic area are shown in Figure 5 and Table 4.
Figure 5: 2018 Park-and-Ride User Home Origins from Minnesota License Plates
2018 Annual Regional Park-and-Ride System Report | 9
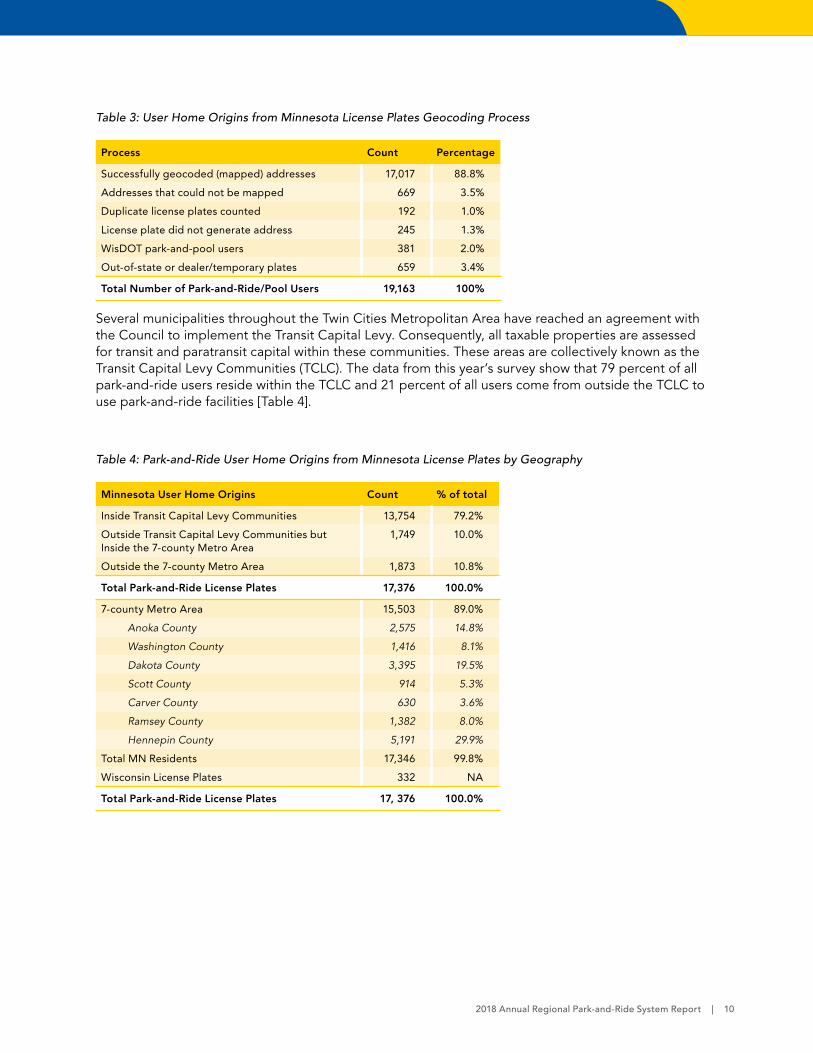
Table 3: User Home Origins from Minnesota License Plates Geocoding Process
Process Count Percentage
Successfully geocoded (mapped) addresses 17,017 88.8%
Addresses that could not be mapped 669 3.5%
Duplicate license plates counted 192 1.0%
License plate did not generate address 245 1.3%
WisDOT park-and-pool users 381 2.0%
Out-of-state or dealer/temporary plates 659 3.4%
Total Number of Park-and-Ride/Pool Users 19,163 100%
Several municipalities throughout the Twin Cities Metropolitan Area have reached an agreement with the Council to implement the Transit Capital Levy. Consequently, all taxable properties are assessed for transit and paratransit capital within these communities. These areas are collectively known as the Transit Capital Levy Communities (TCLC). The data from this year’s survey show that 79 percent of all park-and-ride users reside within the TCLC and 21 percent of all users come from outside the TCLC to use park-and-ride facilities [Table 4].
Table 4: Park-and-Ride User Home Origins from Minnesota License Plates by Geography
Minnesota User Home Origins Count % of total
Inside Transit Capital Levy Communities 13,754 79.2%
Outside Transit Capital Levy Communities but Inside the 7-county Metro Area
1,749 10.0%
Outside the 7-county Metro Area 1,873 10.8%
Total Park-and-Ride License Plates 17,376 100.0%
7-county Metro Area 15,503 89.0%
Anoka County 2,575 14.8%
Washington County 1,416 8.1%
Dakota County 3,395 19.5%
Scott County 914 5.3%
Carver County 630 3.6%
Ramsey County 1,382 8.0%
Hennepin County 5,191 29.9%
Total MN Residents 17,346 99.8%
Wisconsin License Plates 332 NA
Total Park-and-Ride License Plates 17, 376 100.0%
2018 Annual Regional Park-and-Ride System Report | 10
About the System SurveyThe park-and-ride system has been surveyed annually since 1999, providing the region with valuable information about this critical transportation system component. System-wide license plate surveys are conducted biennially as part of the system survey process and were last collected in 2016. In a collaborative effort, staff from state, county and regional agencies collected data for vehicles parked at each park-and-ride and park-and-pool facility. Data collection dates were held in late September and early October. The survey is conducted during this time to gain accurate data on the typical use of each facility, as Fall is not a prime vacation time and schools are back in session. The 2018 data was collected once for each park-and-ride facility, generally between 9 a.m. and 3 p.m. and within the following dates: Tuesday, Sept. 25 – Thursday, Sept. 27; and Tuesday, Oct. 2 – Thursday, Oct. 4.
2018 Annual Regional Park-and-Ride System Report | 11
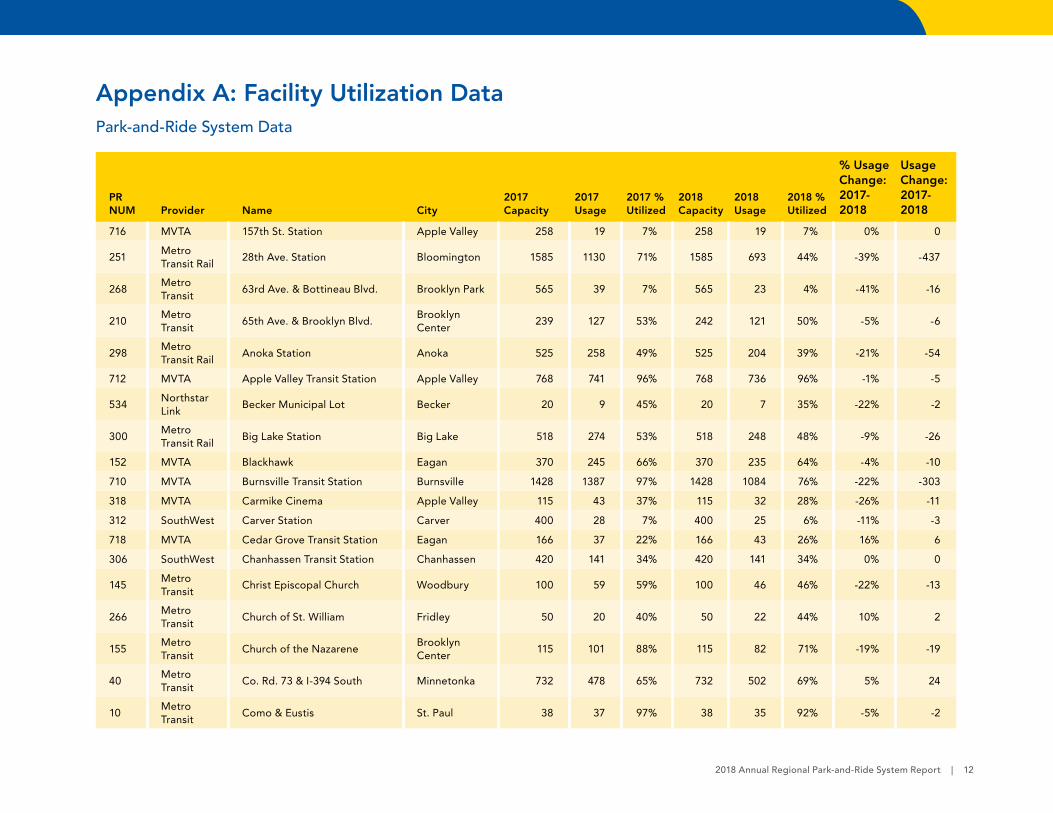
Appendix A: Facility Utilization Data Park-and-Ride System Data
PR NUM Provider Name City
2017 Capacity
2017 Usage
2017 % Utilized
2018 Capacity
2018 Usage
2018 % Utilized
% Usage Change: 2017-2018
Usage Change: 2017-2018
716 MVTA 157th St. Station Apple Valley 258 19 7% 258 19 7% 0% 0
251Metro Transit Rail
28th Ave. Station Bloomington 1585 1130 71% 1585 693 44% -39% -437
268Metro Transit
63rd Ave. & Bottineau Blvd. Brooklyn Park 565 39 7% 565 23 4% -41% -16
210Metro Transit
65th Ave. & Brooklyn Blvd.Brooklyn Center
239 127 53% 242 121 50% -5% -6
298Metro Transit Rail
Anoka Station Anoka 525 258 49% 525 204 39% -21% -54
712 MVTA Apple Valley Transit Station Apple Valley 768 741 96% 768 736 96% -1% -5
534Northstar Link
Becker Municipal Lot Becker 20 9 45% 20 7 35% -22% -2
300Metro Transit Rail
Big Lake Station Big Lake 518 274 53% 518 248 48% -9% -26
152 MVTA Blackhawk Eagan 370 245 66% 370 235 64% -4% -10
710 MVTA Burnsville Transit Station Burnsville 1428 1387 97% 1428 1084 76% -22% -303
318 MVTA Carmike Cinema Apple Valley 115 43 37% 115 32 28% -26% -11
312 SouthWest Carver Station Carver 400 28 7% 400 25 6% -11% -3
718 MVTA Cedar Grove Transit Station Eagan 166 37 22% 166 43 26% 16% 6
306 SouthWest Chanhassen Transit Station Chanhassen 420 141 34% 420 141 34% 0% 0
145Metro Transit
Christ Episcopal Church Woodbury 100 59 59% 100 46 46% -22% -13
266Metro Transit
Church of St. William Fridley 50 20 40% 50 22 44% 10% 2
155Metro Transit
Church of the NazareneBrooklyn Center
115 101 88% 115 82 71% -19% -19
40Metro Transit
Co. Rd. 73 & I-394 South Minnetonka 732 478 65% 732 502 69% 5% 24
10Metro Transit
Como & Eustis St. Paul 38 37 97% 38 35 92% -5% -2
2018 Annual Regional Park-and-Ride System Report | 12

PR NUM Provider Name City
2017 Capacity
2017 Usage
2017 % Utilized
2018 Capacity
2018 Usage
2018 % Utilized
% Usage Change: 2017-2018
Usage Change: 2017-2018
231Metro Transit Rail
Coon Rapids/Riverdale Station Coon Rapids 455 329 72% 455 257 56% -22% -72
245Metro Transit
Cottage Grove Cottage Grove 525 278 53% 525 247 47% -11% -31
215Maple Grove
Crosswinds Methodist Church Maple Grove 125 75 60% 125 100 80% 33% 25
317 Plymouth Dunkirk Park & Ride Plymouth 50 39 78% 50 81 162% 108% 42
711 MVTA Eagan Transit Station Eagan 626 297 47% 626 279 45% -6% -18
722 MVTA Eagle Creek Transit Station Shakopee 563 38 7% 563 36 6% -5% -2
297 SouthWest East Creek Station Chaska 675 283 42% 675 259 38% -8% -24
244Metro Transit Rail
Elk River Station (171st Ave. & Tyler St.)
Elk River 754 327 43% 754 322 43% -2% -5
57Metro Transit
Excelsior City Hall Excelsior 20 9 45% 20 7 35% -22% -2
110Metro Transit
Faith-Lilac Way Lutheran Church
Robbinsdale 25 11 44% 25 20 80% 82% 9
204Metro Transit
Foley Blvd. Coon Rapids 1243 837 67% 1243 889 72% 6% 52
294Metro Transit
Forest Lake Transit Center Forest Lake 308 114 37% 308 99 32% -13% -15
253Metro Transit Rail
Fort Snelling South Fort Snelling 675 579 86% 586 571 97% -1% -8
252Metro Transit Rail
Fort Snelling Station North Fort Snelling 398 307 77% 398 364 91% 19% 57
299Metro Transit Rail
Fridley Station Fridley 668 85 13% 668 78 12% -8% -7
180Metro Transit
General Mills Blvd. & I-394 Golden Valley 123 91 74% 123 64 52% -30% -27
271Metro Transit
Grace Church Roseville 115 105 91% 115 83 72% -21% -22
262Metro Transit
Guardian Angels Catholic Church
Oakdale 415 336 81% 415 377 91% 12% 41
258 MVTA Heart of the City Burnsville 343 58 17% 343 66 19% 14% 8
2018 Annual Regional Park-and-Ride System Report | 13

PR NUM Provider Name City
2017 Capacity
2017 Usage
2017 % Utilized
2018 Capacity
2018 Usage
2018 % Utilized
% Usage Change: 2017-2018
Usage Change: 2017-2018
309Metro Transit
Hopkins Hopkins 52 27 52% 52 38 73% 41% 11
256Metro Transit
Hwy. 100 & Duluth Golden Valley 50 186 372% 50 131 262% -30% -55
269Metro Transit
Hwy. 252 & 66th (formerly Regal Cinemas 20)
Brooklyn Center
200 96 48% 120 46 38% -52% -50
302Metro Transit
Hwy. 36 & Rice St. Little Canada 280 178 64% 280 160 57% -10% -18
205Metro Transit
Hwy. 61 & Co. Rd. C Maplewood 229 99 43% 229 100 44% 1% 1
173Metro Transit
Hwy. 61 & Lower Afton Rd. St. Paul 114 140 123% 114 116 102% -17% -24
228Metro Transit
Hwy. 610 & Noble Brooklyn Park 1,009 683 68% 1,009 690 68% 1% 7
158Metro Transit
Hwy. 7 & Texas Ave. St. Louis Park 10 0 0% 10 2 20% NA 2
209Metro Transit
Hwy. 7 & Vinehill Rd. Shorewood 27 2 7% 27 2 7% 0% 0
287Metro Transit
I-35 & Kenrick Ave. Lakeville 750 625 83% 750 608 81% -3% -17
304Metro Transit
I-35E & Co. Rd. 14 Lino Lakes 300 95 32% 300 90 30% -5% -5
305Metro Transit
I-35E & Co. Rd. EVadnais Heights
300 43 14% 300 61 20% 42% 18
217Metro Transit
I35W & 95th Ave. Blaine 1,482 811 55% 1,482 687 46% -15% -124
290Metro Transit
I-35W & Co. Rd. C Roseville 460 206 45% 460 188 41% -9% -18
161Metro Transit
I-35W & Co. Rd. H Mounds View 211 122 58% 211 189 90% 55% 67
261Metro Transit
Knox Ave. at Best Buy Richfield 525 165 31% 525 182 35% 10% 17
719 MVTA Lakeville Cedar Lakeville 190 4 2% 190 3 2% -25% -1
82Metro Transit
Little Canada Municipal Lot Little Canada 20 19 95% 20 0 0% -100% -19
2018 Annual Regional Park-and-Ride System Report | 14

PR NUM Provider Name City
2017 Capacity
2017 Usage
2017 % Utilized
2018 Capacity
2018 Usage
2018 % Utilized
% Usage Change: 2017-2018
Usage Change: 2017-2018
704Metro Transit
Louisiana Ave. Transit Center St. Louis Park 330 287 87% 330 286 87% 0% -1
301Maple Grove
Maple Grove Parkway Maple Grove 805 538 67% 805 509 63% -5% -29
247Maple Grove
Maple Grove Transit Station Maple Grove 924 906 98% 924 845 91% -7% -61
303Metro Transit
Maple Plain Maple Plain 150 1 1% 150 2 1% 100% 1
701Metro Transit
Maplewood Mall Transit Center
Maplewood 1,007 485 48% 1,007 459 46% -5% -26
316 MVTA Marschall Road Transit Station Shakopee 442 120 27% 442 152 34% 27% 32
140Metro Transit
Mermaid Supper Club Mounds View 80 82 103% 0 0 0% -100% -82
42Metro Transit
Minnetonka Blvd & Baker Rd. Minnetonka 16 9 56% 16 13 81% 44% 4
43Metro Transit
Minnetonka Blvd. & Steele St. Minnetonka 25 6 24% 25 9 36% 50% 3
715Metro Transit
Mound Transit Center Mound 50 2 4% 50 5 10% 150% 3
291 Plymouth Nathan Lane Plymouth 120 93 78% 120 88 73% -5% -5
114Metro Transit
Navarre Center Orono 25 2 8% 25 4 16% 100% 2
313Metro Transit
Newport Transit Station Newport 150 29 19% 150 22 15% -24% -7
28Metro Transit
Normandale Village Bloomington 25 8 32% 25 3 12% -63% -5
564Northstar Link
Northstar Link Lot St. Cloud 146 34 23% 146 33 23% -3% -1
703Metro Transit
Northtown Transit Center Blaine 366 148 40% 366 155 42% 5% 7
198 MVTA Palomino Hills Apple Valley 318 213 67% 318 173 54% -19% -40
195Metro Transit
Park Place & I-394 St. Louis Park 55 56 102% 67 65 97% 16% 9
315Metro Transit
Paul Pkwy. Blaine 411 265 64% 411 253 62% -5% -12
2018 Annual Regional Park-and-Ride System Report | 15

PR NUM Provider Name City
2017 Capacity
2017 Usage
2017 % Utilized
2018 Capacity
2018 Usage
2018 % Utilized
% Usage Change: 2017-2018
Usage Change: 2017-2018
705Metro Transit
Plymouth Road Park & Ride Minnetonka 111 46 41% 113 51 45% 11% 5
230 SouthWest Preserve Village Mall Eden Prairie 50 7 14% 0 0 0% -100% -7
284Metro Transit Rail
Ramsey Station Ramsey 360 199 55% 360 286 79% 44% 87
201Metro Transit
Richardson Park Champlin 66 19 29% 66 19 29% 0% 0
721 MVTA Rosemount Transit Station Rosemount 102 79 77% 102 81 79% 3% 2
293Metro Transit
Running Aces Columbus 300 246 82% 300 203 68% -17% -43
98Metro Transit
Salem Covenant Church New Brighton 70 34 49% 70 35 50% 3% 1
232 MVTA Savage Park & Ride Savage 182 71 39% 182 63 35% -11% -8
177Maple Grove
Shepherd of the Grove Church Maple Grove 50 25 50% 50 15 30% -40% -10
191Metro Transit
Shoreview Community Center Shoreview 10 10 100% 10 8 80% -20% -2
272Metro Transit
Skating Center Roseville 50 51 102% 51 51 100% 0% 0
707Metro Transit
South Bloomington Transit Center
Bloomington 195 175 90% 195 192 98% 10% 17
278 MVTA Southbridge Crossing Shakopee 513 187 36% 513 204 40% 9% 17
706Metro Transit
Southdale Transit Center Edina 147 75 51% 161 57 35% -24% -18
713 SouthWest SouthWest Station Eden Prairie 924 854 92% 924 854 92% 0% 0
292 SouthWest SouthWest Village Chanhassen 511 248 49% 511 237 46% -4% -11
223Metro Transit
St Croix Valley Recreation Center
Stillwater 100 40 40% 100 39 39% -3% -1
285 SouthWestSt. Andrews’s Church (overflow from SW Station)
Eden Prairie 82 11 13% 82 8 10% -27% -3
32Metro Transit
St. Edward’s Catholic Church Bloomington 100 12 12% 100 9 9% -25% -3
187Metro Transit
St. Joseph’s Church Lino Lakes 12 7 58% 12 8 67% 14% 1
2018 Annual Regional Park-and-Ride System Report | 16

PR NUM Provider Name City
2017 Capacity
2017 Usage
2017 % Utilized
2018 Capacity
2018 Usage
2018 % Utilized
% Usage Change: 2017-2018
Usage Change: 2017-2018
199Metro Transit
St. Luke’s Lutheran Church Bloomington 100 34 34% 100 25 25% -26% -9
242 Plymouth St. Philip Park & Ride Plymouth 100 79 79% 100 91 91% 15% 12
714 Plymouth Station 73 Plymouth 288 190 66% 288 248 86% 31% 58
248Metro Transit
Walton Park Oakdale 58 29 50% 58 18 31% -38% -11
130Metro Transit
Wayzata Blvd. & Barry Ave. Wayzata 102 63 62% 101 60 59% -5% -3
142Metro Transit
West River Rd. & 117th Ave. Champlin 151 44 29% 151 36 24% -18% -8
219Metro Transit
West St. Paul Sports Complex West St. Paul 100 53 53% 100 41 41% -23% -12
81Metro Transit
Westwood Lutheran Church St. Louis Park 40 5 13% 40 14 35% 180% 9
222Metro Transit
Woodbury Lutheran Church Woodbury 90 87 97% 90 84 93% -3% -3
229Metro Transit
Woodbury Theatre Woodbury 550 433 79% 550 499 91% 15% 66
143Maple Grove
Zachary Lane & 96th Ave. Maple Grove 322 41 13% 322 40 12% -2% -1
PARK-AND-RIDE TOTAL 34,008 19,610 57.7% 33,740 18,442 54.7% -6.0% -1168
2018 Annual Regional Park-and-Ride System Report | 17

Park-and-Pool System Data
PP NUM Provider Name City
2017 Capacity
2017 Usage
2017 % Utilized
2018 Capacity
2018 Usage
2018 % Utilized
% Usage Change: 2017-2018
Usage Change: 2017-2018
237 MnDOT City Hall - Belle Plaine Belle Plaine 20 3 15% 20 0 0% -100% -3
238 MnDOT Lions Park Jordan 15 3 20% 15 1 7% -67% -2
500 WisDOTI-94 & US 63 (St. Croix Co.)
Baldwin 36 29 81% 36 17 47% -41% -12
502 WisDOT I-94 & US 12 (Dunn Co.) Elk Mound 33 12 36% 33 17 52% 42% 5
503 MnDOT Elk River P&P Elk River 60 8 13% 60 4 7% -50% -4
505 MnDOT 36 & ManningGrant Twp./Stillwater
15 1 7% 15 1 7% 0% 0
506 MnDOTHwy. 52/Hwy. 56/Hwy. 50
Hampton 42 41 98% 42 47 112% 15% 6
508 WisDOT Old WIS 35 & Hanley Rd. Hudson 74 8 11% 74 18 24% 125% 10
510 MnDOT I-94 & Hwy. 95 Lakeland 79 17 22% 79 15 19% -12% -2
511 MnDOT I-35 & Co. Rd. 70 Lakeville 80 12 15% 80 14 18% 17% 2
512 MnDOTMontgomery Twp-MN13 & MN 99
Montgomery Twp. 3 0 0% 3 2 67% NA 2
514 MnDOT Hwy. 25 & School Blvd. Monticello 187 22 12% 187 15 8% -32% -7
516 MnDOT I-35 & Co. Rd. 19Webster Twp./Northfield
30 31 103% 30 24 80% -23% -7
517 MnDOT Hwy. 169 & 179th St. NW Princeton 26 10 38% 26 7 27% -30% -3
518 WisDOTI-94 & WIS 65 (St. Croix Co.)
Warren 112 40 36% 112 31 28% -23% -9
519 MnDOTI-94 & Hwy. 101 (Hennepin Co.)
Rogers 27 10 37% 27 12 44% 20% 2
522 MnDOT Wyoming Wyoming 88 31 35% 88 25 28% -19% -6
524 MnDOTHwy. 65 & Co. Rd. 24 (Anoka Co.)
East Bethel 41 15 37% 41 9 22% -40% -6
525 WisDOTI-94 & Carmichael Rd. (St. Croix Co.)
Hudson 168 95 57% 168 99 59% 4% 4
526 MnDOT Taylors Falls Taylors Falls 10 6 60% 10 2 20% -67% -4
527 MnDOTHwy. 65 & CR 43 & 313th Ave.
Cambridge 60 1 2% 60 4 7% 300% 3
529 MnDOT St. Joseph St. Joseph 134 37 28% 134 47 35% 27% 10
2018 Annual Regional Park-and-Ride System Report | 18
PP NUM Provider Name City
2017 Capacity
2017 Usage
2017 % Utilized
2018 Capacity
2018 Usage
2018 % Utilized
% Usage Change: 2017-2018
Usage Change: 2017-2018
531New Richmond
WIS 65 & WIS 64 (St. Croix Co.)
New Richmond 44 7 16% 0 0 0% -100% -7
533 MnDOT Albany Albany 28 10 36% 28 15 54% 50% 5
535 MnDOTI-94 & Co. Rd. 19 (Wright Co.)
Albertville 34 12 35% 34 7 21% -42% -5
540 MnDOT Big Lake P&P Big Lake 90 1 1% 90 0 0% -100% -1
546 MnDOT Maple Lake VFW Maple Lake 21 4 19% 21 5 24% 25% 1
553 WisDOTWIS 35 & WIS 65 (St. Croix Co.)
River Falls 124 16 13% 124 100 81% 525% 84
554 WisDOTUS 63 & WIS 64 (St. Croix Co.)
Cylon Twp. 20 3 15% 20 15 75% 400% 12
557 MnDOT I-35 & CR 60 Lakeville 64 15 23% 64 15 23% 0% 0
558 MnDOT East Bethel Ice Arena East Bethel 53 0 0% 53 0 0% NA 0
559New Richmond
WIS 65 & Paperjack New Richmond 30 0 0% 0 0 0% NA 0
560 WisDOT Prescott WI Prescott 68 8 12% 68 60 88% 650% 52
561 MnDOT Rockford Rockford 4 1 25% 4 2 50% 100% 1
562 WisDOTUSH 10 & CTH CC (Pierce Co.)
Union Twp. 20 1 5% 20 12 60% 1100% 11
565 MnDOT Waverly Waverly 27 3 11% 27 5 19% 67% 2
566 MnDOT Zimmerman Zimmerman 30 1 3% 30 3 10% 200% 2
567 MnDOT I-35 & Co Rd 17 Stacy 85 11 13% 85 9 11% -18% -2
568 MnDOTCannon Falls (S. US 19 across from athletic fields)
Cannon Falls 40 35 88% 40 26 65% -26% -9
570 MnDOT St. Bonifacius St. Bonifacius 25 0 0% 25 1 4% NA 1
571 WisDOT I-94 & WIS 312 / US 12 Eau Claire 68 0 0% 68 12 18% NA 12
914 MnDOT Hastings Park & Pool Hastings 100 33 33% 100 23 23% -30% -10
PARK-AND-POOL TOTAL 2315 593 25.62% 2241 721 32.17% 21.59% 128
2018 Annual Regional Park-and-Ride System Report | 19

Bike-and-Ride System Data
Counts of parked bicycles were collected at all transit facilities. Facilities where no bikes were observed are not listed below. Dockless bikeshare bike count data was collected at A Line, Blue Line and Green Line stations as well as Ramp B/5th Street Transit Center, Uptown Transit Center, Ramp A/7th Street Transit Center, Chicago Lake Transit Center and Rosedale Transit Center. Cells with a dash (-) indicate that the facility was not surveyed for dockless bikeshare bikes.
ID Number Facility Name
Number of bikes parked at the facility’s bike racks
Number of bikes parked in places other than bike racks of the facility
Number of abandoned bikes
Number of dockless bikeshare bikes
Blu
e Li
ne a
nd G
ree
n Li
ne L
RT
T816 Mall of America Station 3 0 0 0
T810 VA Medical Center Station 2 0 0 0
T809 50th Street-Minnehaha Falls Station 1 0 0 0
T808 46th Street Station 4 0 0 0
T807 38th Street Station 7 0 0 0
T806 Lake Street-Midtown Station 0 0 1 0
T802 Govt Plaza Station 3 0 0 0
T842 West Bank Station 2 0 0 0
T840 Stadium Village Station 10 0 0 1
T839 Prospect Park Station 2 0 0 0
T837 Raymond Avenue Station 1 0 0 0
T832 Victoria Street Station 1 0 0 0
A L
ine
BR
T B005 Snelling & Hewitt Station SB 0 0 0 1
B011 Snelling & Randolph Station SB 0 0 0 2
B012 Snelling & Highland Station SB 1 0 0 0
B018 46th St & Minnehaha Station SB 1 0 0 0
Co
mm
ute
r R
ail S
tati
on
s 298 Anoka Station 3 1 0 -
299 Fridley Station 1 0 0 -
231 Coon Rapids/Riverdale Station 2 0 0 -
2018 Annual Regional Park-and-Ride System Report | 20

ID Number Facility Name
Number of bikes parked at the facility’s bike racks
Number of bikes parked in places other than bike racks of the facility
Number of abandoned bikes
Number of dockless bikeshare bikes
Tran
sit
Ce
nte
rs (S
tand
-al
one
)
129 Ramp B/5th Street Transit Center 0 0 0 5
105 Columbia Heights Transit Center 1 0 0 -
113 Uptown Transit Center 2 0 0 0
102 Robbinsdale Transit Center 1 0 0 -
128 Ramp A/7th Street Transit Center 0 0 0 1
115 Chicago Lake Transit Center 2 0 2 0
106 Rosedale Transit Center 1 0 0 0
Par
k &
Rid
e Fa
cilit
ies
57 Excelsior City Hall 1 0 0 -
81 Westwood Lutheran Church 1 0 0 -
152 Blackhawk 1 0 0 -
161 I-35W & Co. Rd. H 1 0 0 -
198 Palomino Hills 1 1 0 -
209 Hwy. 7 & Vinehill Rd. 1 0 0 -
222 Woodbury Lutheran Church 1 0 0 -
228 Hwy. 610 & Noble 3 0 0 -
229 Woodbury Theatre 0 1 0 -
245 Cottage Grove 2 0 0 -
247 Maple Grove Transit Station 4 0 0 -
251 28th Avenue Station 1 0 0 -
284 Ramsey Station 1 10 0 -
287 I-35 & Kenrick Ave. 4 0 0 -
290 I-35W & Co. Rd. C 3 0 0 -
292 SouthWest Village 1 0 0 -
293 Running Aces 0 1 0 -
294 Forest Lake Transit Center 1 0 0 -
302 Hwy. 36 & Rice St. 1 0 0 -
315 Paul Pkwy. 1 0 0 -
2018 Annual Regional Park-and-Ride System Report | 21
ID Number Facility Name
Number of bikes parked at the facility’s bike racks
Number of bikes parked in places other than bike racks of the facility
Number of abandoned bikes
Number of dockless bikeshare bikes
Par
k &
Rid
e Fa
cilit
ies
316 Marschall Road Transit Station 2 2 0 -
701 Maplewood Mall Transit Center 2 0 0 -
703 Northtown Transit Center 1 0 0 -
704 Louisiana Ave. Transit Center 1 0 0 2
706 Southdale Transit Center 2 0 0 -
707 South Bloomington Transit Center 2 0 0 -
711 Eagan Transit Station 4 0 0 -
712 Apple Valley Transit Station 12 0 1 -
713 SouthWest Station 7 0 0 -
714 Station 73 2 0 0 -
715 Mound Transit Center 1 0 0 -
716 157th St. Station 1 0 0 -
718 Cedar Grove Transit Station 1 0 0 -
721 Rosemount Transit Station 4 0 0 -
BIKE-AND-RIDE TOTAL 122 16 4 12
2018 Annual Regional Park-and-Ride System Report | 22

Appendix B: Regional Park-and-Rider User Origin Maps
2018 Annual Regional Park-and-Ride System Report | 23

2018 Annual Regional Park-and-Ride System Report | 24

2018 Annual Regional Park-and-Ride System Report | 25

2018 Annual Regional Park-and-Ride System Report | 26

2018 Annual Regional Park-and-Ride System Report | 27

2018 Annual Regional Park-and-Ride System Report | 28

2018 Annual Regional Park-and-Ride System Report | 29

2018 Annual Regional Park-and-Ride System Report | 30

2018 Annual Regional Park-and-Ride System Report | 31
2018 Annual Regional Park-and-Ride System Report | 32

2018 Annual Regional Park-and-Ride System Report | 33
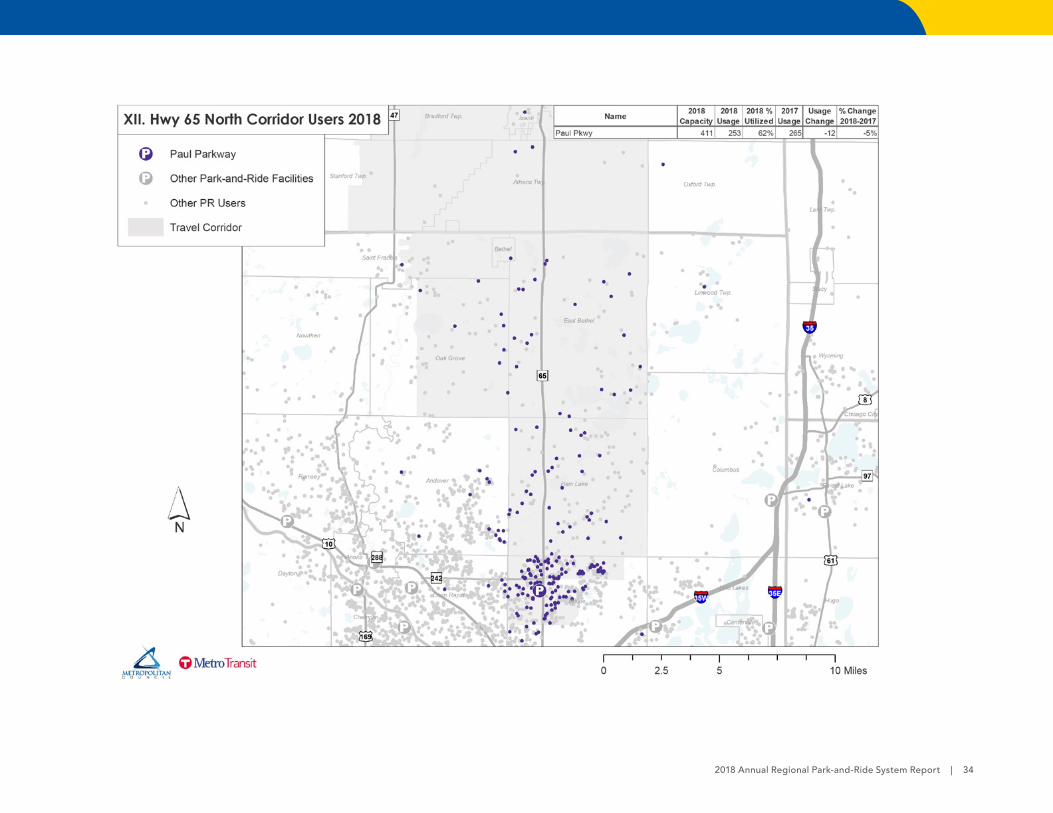
2018 Annual Regional Park-and-Ride System Report | 34

2018 Annual Regional Park-and-Ride System Report | 35
2018 Annual Regional Park-and-Ride System Report | 36
2018 Annual Regional Park-and-Ride System Report | 37
![ODOT REGION 4 PARK AND RIDE LOT PLAN · PDF file1 AASHTO Guide for Park and Ride Facilities, 2004. p. 3 [ODOT Region 4 Park and Ride Lot Plan] 8 Regional Context ... [ODOT Region 4](https://img.pdfslide.us/doc/110x75/5a79cc867f8b9a9b4d8d31ed/odot-region-4-park-and-ride-lot-plan-aashto-guide-for-park-and-ride-facilities.jpg)