Embed Size (px)
Citation preview
2018
Annual General Meeting
CEO Presentation
Magnus Welander
April 25, 2018
Malmö, Sweden
Active Life, Simplified.
April 25, 2018 Thule Group AB – AGM 2018Slide 2
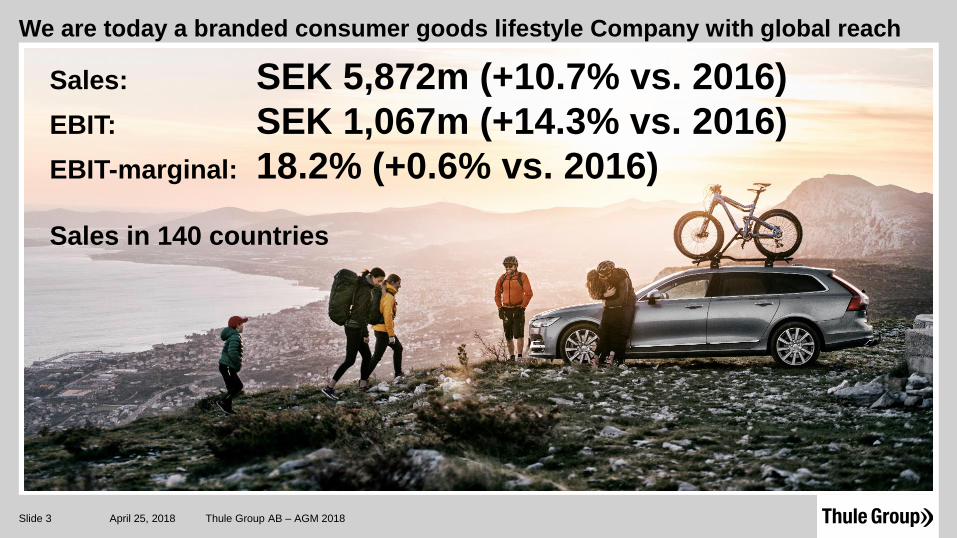
We are today a branded consumer goods lifestyle Company with global reach
April 25, 2018 Thule Group AB – AGM 2018Slide 3
Sales: SEK 5,872m (+10.7% vs. 2016)
EBIT: SEK 1,067m (+14.3% vs. 2016)
EBIT-marginal: 18.2% (+0.6% vs. 2016)
Sales in 140 countries
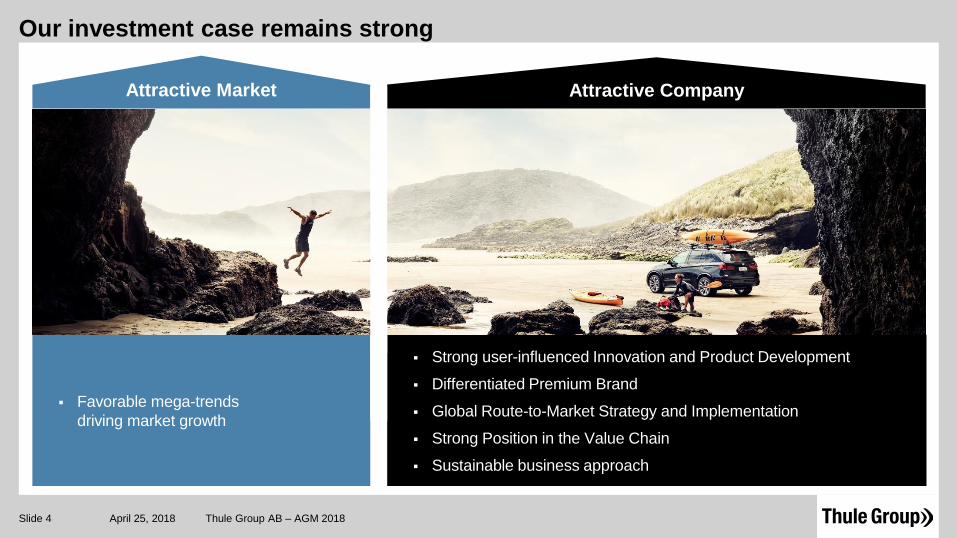
Our investment case remains strong
April 25, 2018 Thule Group AB – AGM 2018Slide 4
Attractive CompanyAttractive Market
▪ Strong user-influenced Innovation and Product Development
▪ Differentiated Premium Brand
▪ Global Route-to-Market Strategy and Implementation
▪ Strong Position in the Value Chain
▪ Sustainable business approach
▪ Favorable mega-trends
driving market growth
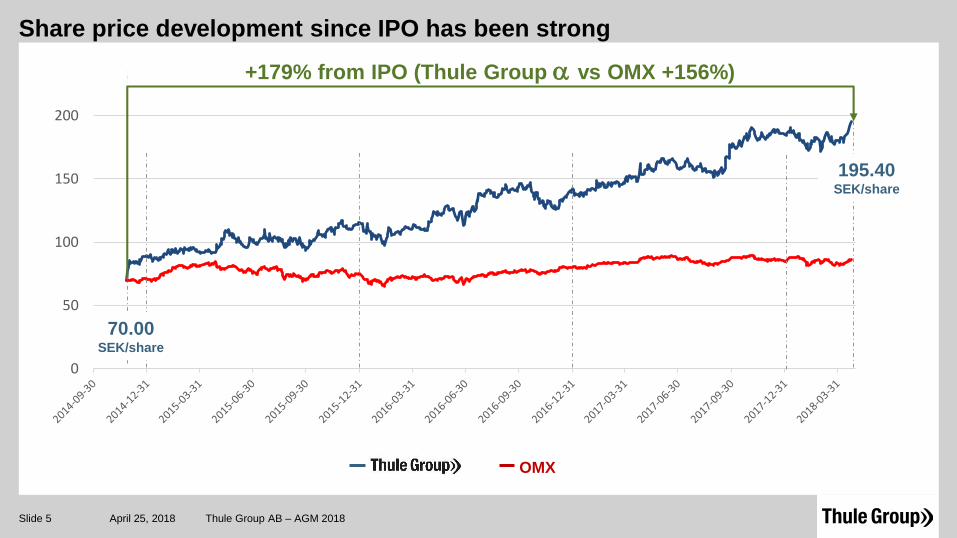
Share price development since IPO has been strong
April 25, 2018 Thule Group AB – AGM 2018Slide 5
OMX
0
50
100
150
200
70.00SEK/share
195.40SEK/share
+179% from IPO (Thule Group vs OMX +156%)
Sustainable Approach
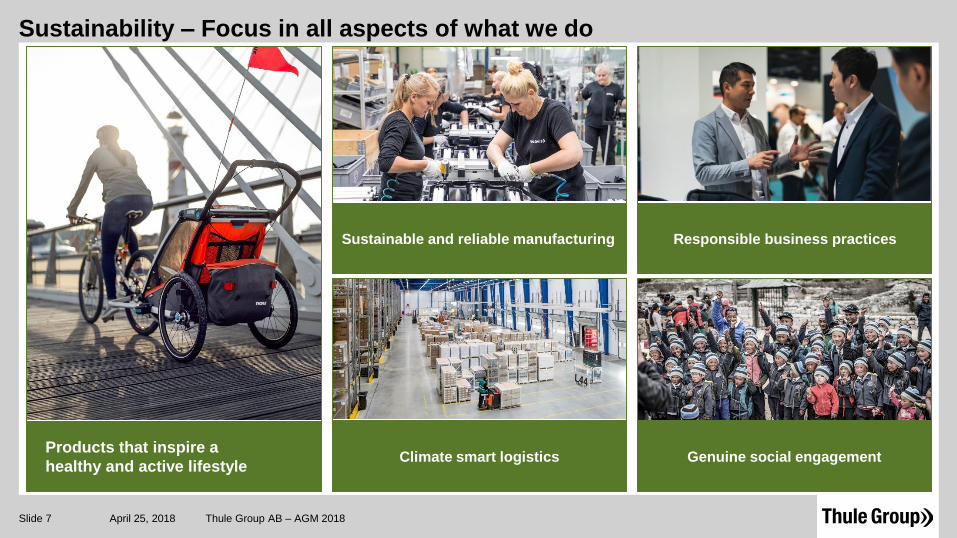
Sustainability – Focus in all aspects of what we do
April 25, 2018 Thule Group AB – AGM 2018Slide 7
Products that inspire a
healthy and active lifestyleClimate smart logistics Genuine social engagement
Sustainable and reliable manufacturing Responsible business practices

Environmental Focus is moving us closer to our ambitious 2020 targets
April 25, 2018 Thule Group AB – AGM 2018Slide 8
GWh Share
Share of electricity usage from renewable sources (%)
Energy consumption electricity from renewable sources(GWh)
- 55%Reduction CO2 emissions
at Thule Group sites
(as compared with Base Year 2014)
0%
25%
50%
75%
100%
0
5
10
15
20
2013 2014 2015 2016 2017
Energy consumption electricity from non-renewable sources (GWh)
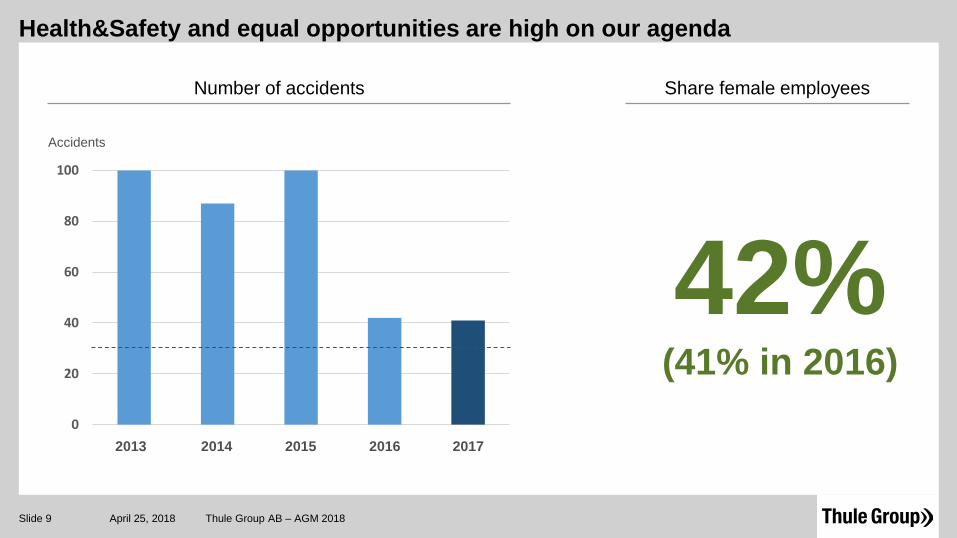
Health&Safety and equal opportunities are high on our agenda
April 25, 2018 Thule Group AB – AGM 2018Slide 9
Accidents
2013 20172014 2015 2016
42%(41% in 2016)
0
20
40
60
80
100
Number of accidents Share female employees
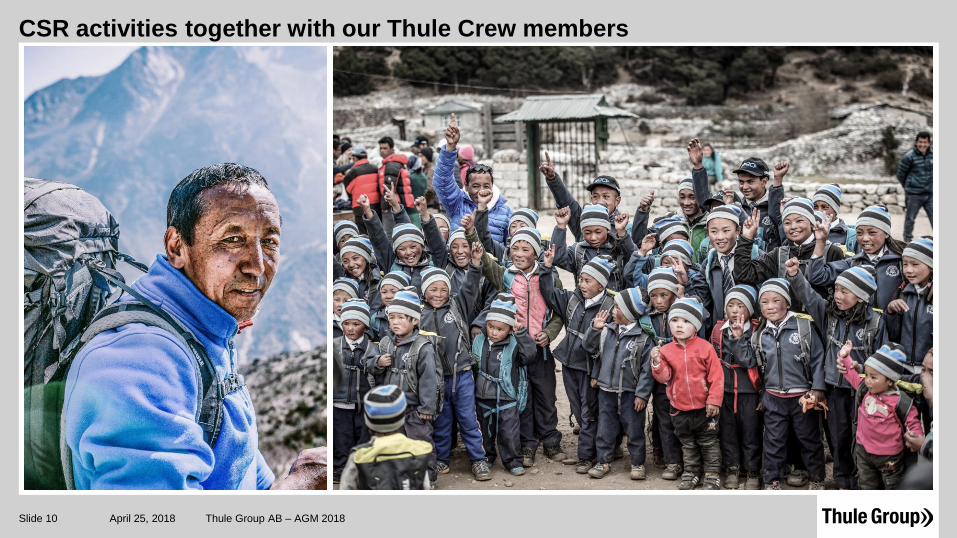
CSR activities together with our Thule Crew members
April 25, 2018 Thule Group AB – AGM 2018Slide 10
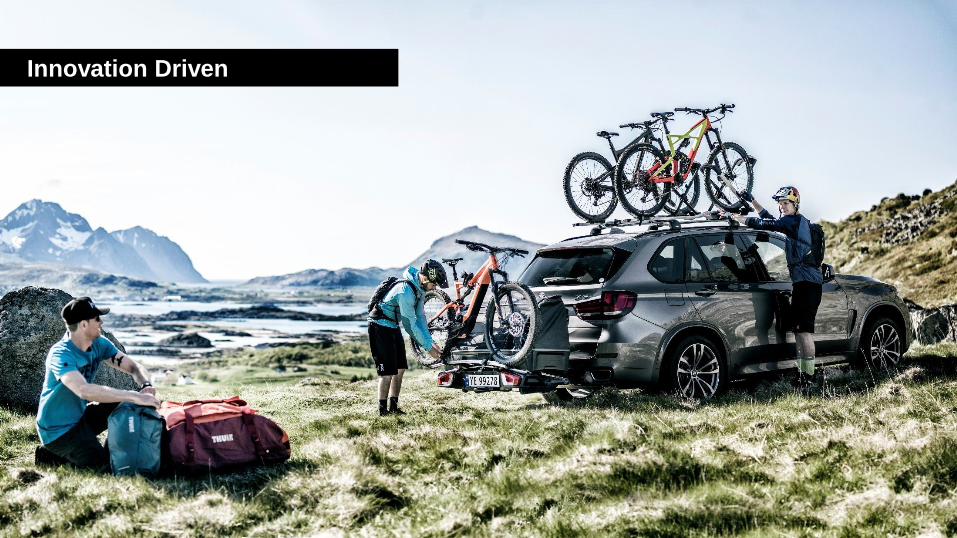
Innovation Driven
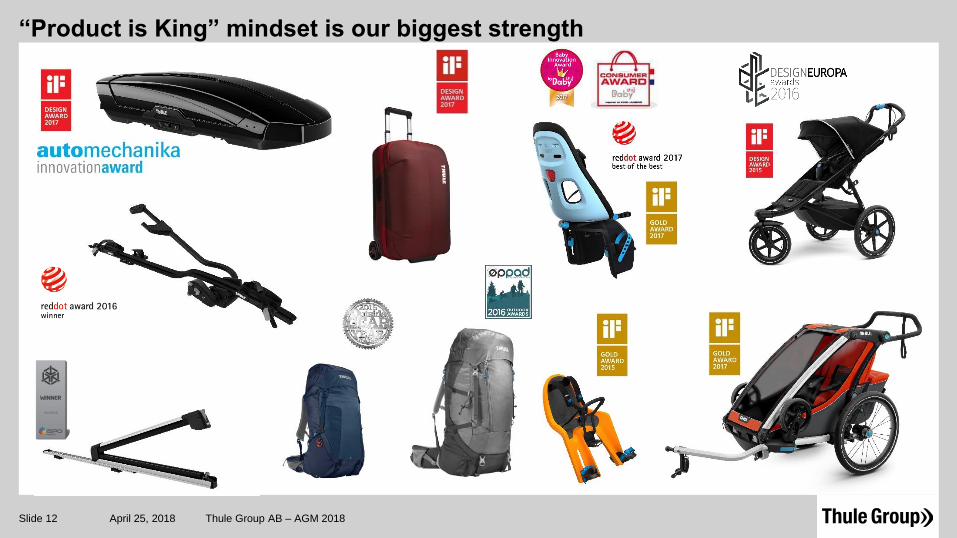
“Product is King” mindset is our biggest strength
April 25, 2018 Thule Group AB – AGM 2018Slide 12

Sport&Cargo Carriers: Thule EasyFold XT and Thule Motion XT
April 25, 2018 Thule Group AB – AGM 2018Slide 13

RV Products: Van concept for the modern younger RV buyer
April 25, 2018 Thule Group AB – AGM 2018Slide 14

Active with Kids: New Thule Chariot collection a hit in the market
April 25, 2018 Thule Group AB – AGM 2018Slide 15
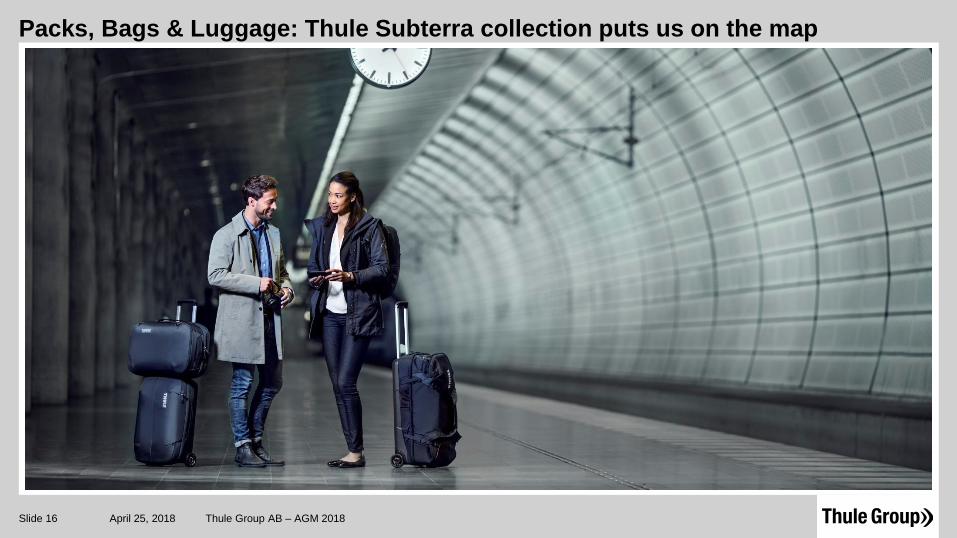
Packs, Bags & Luggage: Thule Subterra collection puts us on the map
April 25, 2018 Thule Group AB – AGM 2018Slide 16

Premium Brand

The Thule brand stands for 79% of sales
April 25, 2018 Thule Group AB – AGM 2018Slide 18
79%Share of sales
Thule brand
89%Share of Sales
Thule Group brands
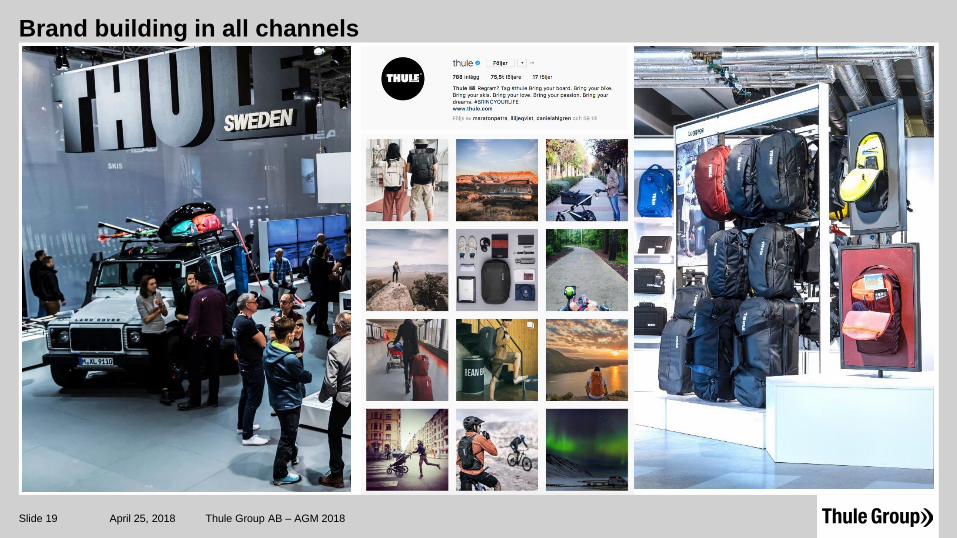
Brand building in all channels
April 25, 2018 Thule Group AB – AGM 2018Slide 19

Our Investment Case
April 25, 2018 Thule Group AB – AGM 2018Slide 20
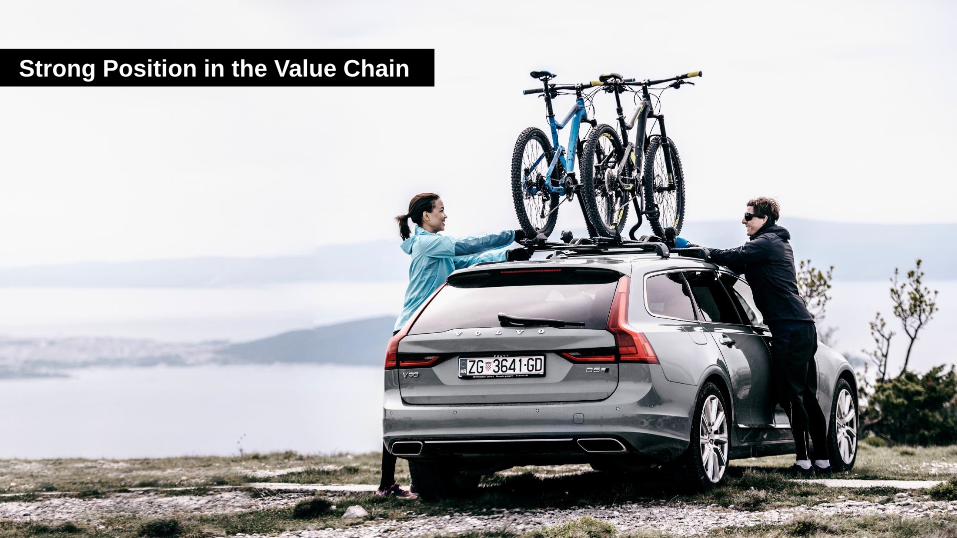
Strong Position in the Value Chain

In 2017 we opened our new assembly plant in Pila, Poland
April 25, 2018 Thule Group AB – AGM 2018Slide 22
▪ A top-modern assembly plant
▪ Flexible set-up for future assembly lines
▪ In line with Thule Group environmental focus
▪ Health&Safety focused concept
▪ Focus at plant will be
▪ Selected bike carrier models
▪ Child Bike Seats
▪ Thule Sleek stroller
▪ Thule Revolve hard-sided luggage
▪ Currently employing 120 people at plant

Focus on cost efficient Supply Chain that meets increased customer demands
April 25, 2018 Thule Group AB – AGM 2018Slide 23
▪ Retail customers expecting more from brands
▪ Less and less inventory in retail
▪ Later cut-off times for orders
▪ Simplified ordering processes
▪ More flexible pick&pack approach
▪ Economies of scale as majority of product
portfolio has become global
▪ Flexible own plants and supplier structure
▪ Efficiency gains via improved and modernized
structure in Distribution Centres
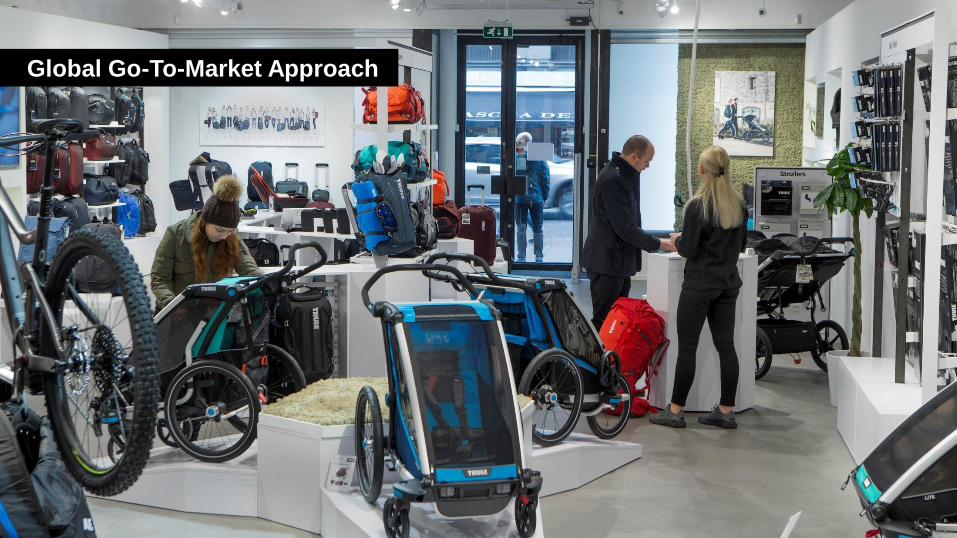
Global Go-To-Market Approach

Focus on tools to drive sales in Brick&Mortar and On-line retail
April 25, 2018 Thule Group AB – AGM 2018Slide 25
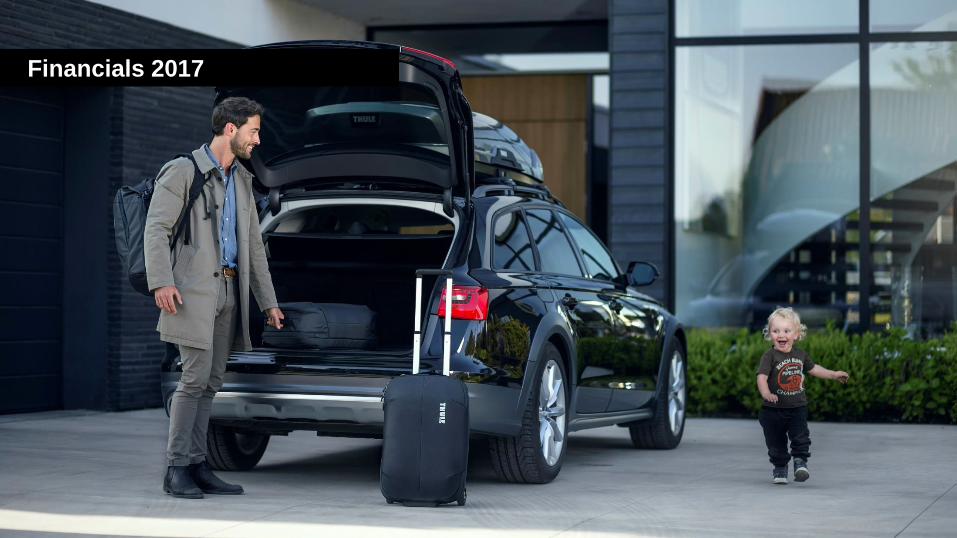
Financials 2017
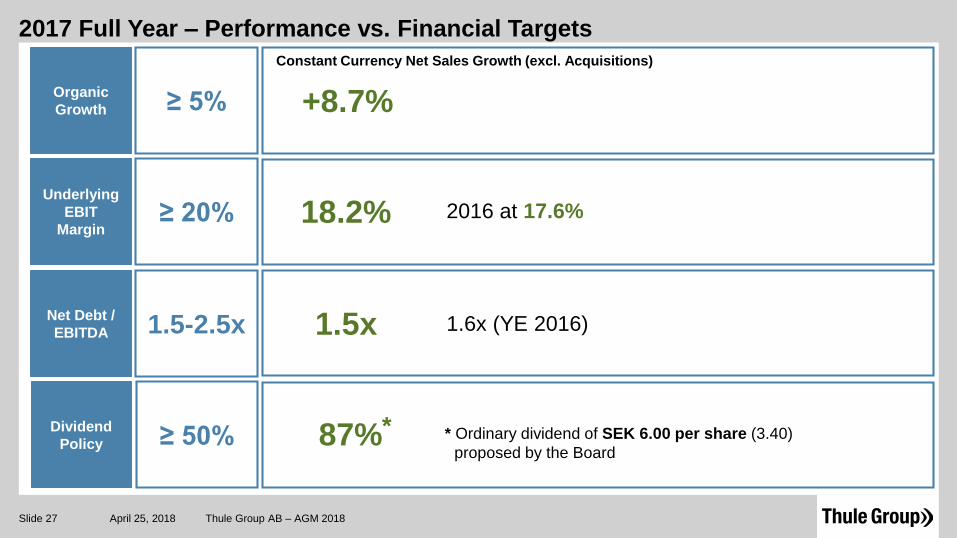
2017 Full Year – Performance vs. Financial Targets
Dividend
Policy ≥ 50%
Organic
Growth ≥ 5%
Underlying
EBIT
Margin≥ 20%
Net Debt /
EBITDA 1.5-2.5x
Constant Currency Net Sales Growth (excl. Acquisitions)
+8.7%
18.2%
1.5x 1.6x (YE 2016)
2016 at 17.6%
87%* * Ordinary dividend of SEK 6.00 per share (3.40)
proposed by the Board
Thule Group AB – AGM 2018Slide 27 April 25, 2018

2017 Full Year – Sales Development by Product Category
Thule Group AB – AGM 2018Slide 28
Sport&Cargo Carriers Packs, Bags & Luggage RV Products
BILD
Share of
Thule Group
Sales 2017
Sales Growth
2017 vs 2016
(Constant
Currency)
65% 14% 13%
+6% -3% +28%
April 25, 2018
Active with Kids
8%
+40%
2018/Q1 Update
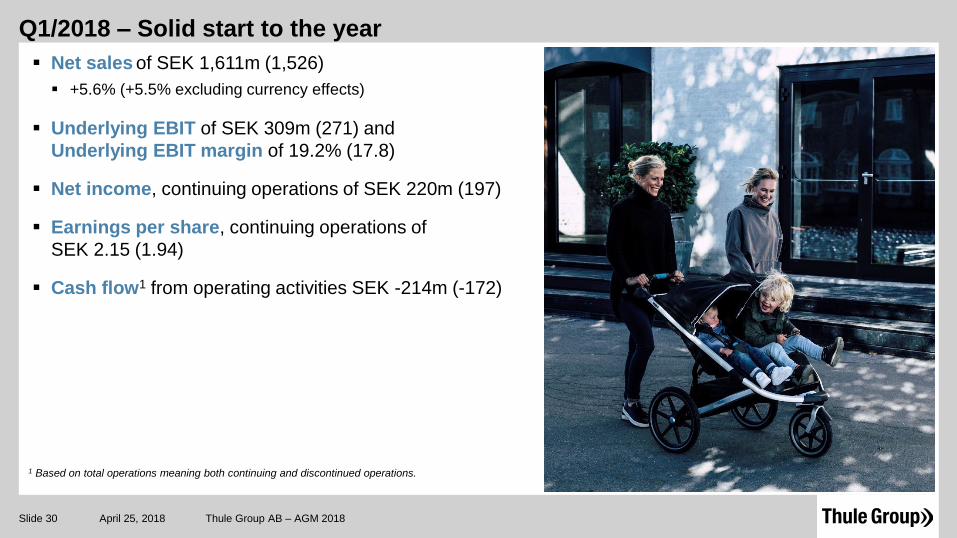
Q1/2018 – Solid start to the year
▪ Net sales of SEK 1,611m (1,526)
▪ +5.6% (+5.5% excluding currency effects)
▪ Underlying EBIT of SEK 309m (271) and
Underlying EBIT margin of 19.2% (17.8)
▪ Net income, continuing operations of SEK 220m (197)
▪ Earnings per share, continuing operations of
SEK 2.15 (1.94)
▪ Cash flow1 from operating activities SEK -214m (-172)
April 25, 2018 Thule Group AB – AGM 2018Slide 30
1 Based on total operations meaning both continuing and discontinued operations.
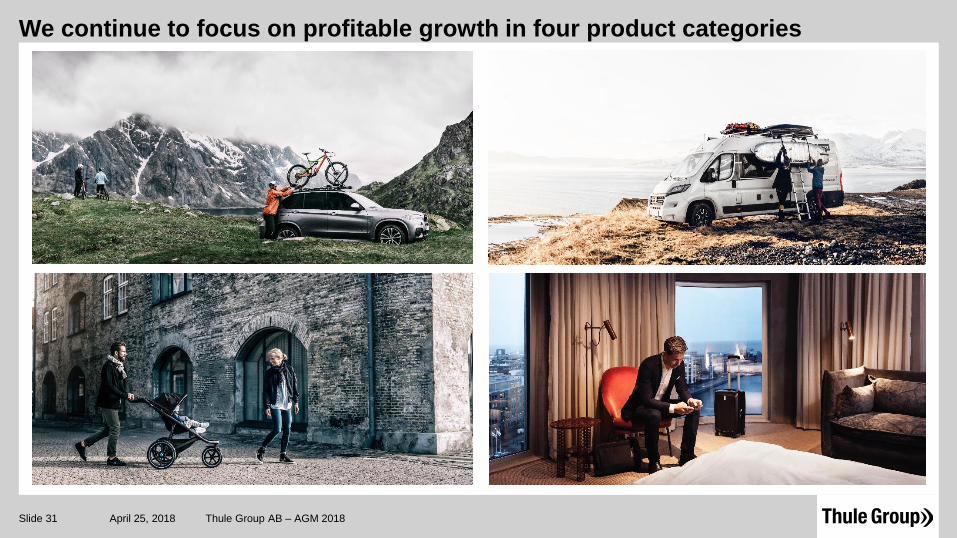
We continue to focus on profitable growth in four product categories
Slide 31 April 25, 2018 Thule Group AB – AGM 2018