Embed Size (px)
Citation preview

2018 Annual Report2018 Annual Report
POS Analysis POS Analysis

Table of Contents
POS: Key Facts
POS: Key Trends
POS:Quick Notes

Over the past 5 years, the volume of POS transactions has posteda 69% CAGR making the sector an active contributor to CBNsdrive towards a cashless Nigeria. The global POS terminals marketis expected to post a 8% CAGR over the next 5 years (Source:Technavio)*. This growth is expected to further increase thevolume of POS transactions over the same period.
On POS GrowthOn POS GrowthPOS: Quick Notes
Active sectors in the economy still remain the Retail, Wholesale andFastFood recording a growth of 86%, 134% and 67% respectively whencompared to 2017. However, we have seen a major growth in Fuel Stations with a 159%growth as POS adoption continues to increase amongst Fuel Stations
On Sector PerformanceOn Sector Performance
Mastercard remains the card brand of choice as 57% oftransactions were carried out using the brand. However, weobserved marginal gains with Verve and Visa with an additional4% and 1% respectively when compared to 2017.
Lagos State remains the top destination for POS transactions;accounting for 53% of total volume. Rivers State and FCT has alsowitnessed marginal gains when compared to 2017.
15% of POS transactions failed in 2018. While this figure is quitehigh based on regulatory requirements, it is worth noting that63% of these transactions were caused directly or indirectly bycustomer errors. This errors span from customers selecting thewrong account option to debit to insufficient funds in the chosenaccount type. 46% of the total failed transaction was caused bythe error "Not Sufficient Funds". Without these errors, theindustry failure rate would drop drastically to 5%.
On POS transactions by Location On POS transactions by Location
On Card UsageOn Card Usage
On POS failed transactionsOn POS failed transactions
*https://www.businesswire.com/news/home/20181213005644/en/Global-POS-Terminals-Market-2019-2023-Advent-HCE-Based

POS: Key FactsPOS: Key Facts
Total Volume of Successful TransactionsTotal Volume of Successful Transactions
Total Value of Successful TransactionsTotal Value of Successful Transactions
Total Unique Cards used on a POS TerminalTotal Unique Cards used on a POS Terminal
285.9M285.9M
2.3T2.3T
20.5M20.5M

Key Facts (contd.)
Number of Active MerchantsNumber of Active Merchants
Number of Active TerminalsNumber of Active Terminals
Success Rate on POSSuccess Rate on POS
122,261122,261
144,461144,461
85%85%

POS: KEY TRENDSPOS: KEY TRENDS
Success Transactionswere added in 2018as compared to 2017.
139.6M +139.6M +
Growth Rate in POStransaction volumewhen compared to 2017.
+ 95%+ 95%
2.6M9.4M
20.8M33.7M
63.7M
146.3M
285.9M
POS Volume (2012-2018)POS Volume (2012-2018)
2012 2013 2014 2015 2016 2017 20180M
50M
100M
150M
200M
250M
300M

POS: TRENDS
Growth Rate in POStransaction value whencompared to 2017.
+ 65%+ 65%
0.05T
0.2T0.3T
0.4T
0.8T
1.4T
2.3T
POS Value (2012-2018)POS Value (2012-2018)
2012 2013 2014 2015 2016 2017 20180.0T
0.2T
0.4T
0.6T
0.8T
1.0T
1.2T
1.4T
1.6T
1.8T
2.0T
2.2T
2.4T
2.6T

POS: TERMINAL STATISTICS
Active terminals wereadded between 2016and 2018
70,887 +70,887 +
Registered Vs Active Terminal 2016–2018Registered Vs Active Terminal 2016–2018
2016 2017 201850,000
100,000
150,000
200,000
250,000
300,000
Registered Terminals Active Terminals
Growth in Activeterminals between2016 and 2018.
+ 96%+ 96%

POS: What cards were used to transact?
Growth in Unique Cardsused on POS terminalsas compared to 2017.
+ 61%+ 61%
17.3%
25.3%57.5%
0.0%
Visa 17.3% Verve 25.3% Mastercard 57.5%
Others 0.0%

POS: What sectors are buzzing? (Top 10)
Growth Rate in the Retailsector when compared to2017.
+ 86%+ 86%
73.9M
67.4M
36.6M
29.6M
25.5M
9.2M
5.7M
3.5M
3.1M
2.9M
Volume by SectorVolume by Sector
Retail
Wholesale
Fuel Station
Fast Food
Unclassified
Hotels
Pharmacies
Financial Institutions
Telecom Services
Telecom Equipment
0M 10M 20M 30M 40M 50M 60M 70M 80M
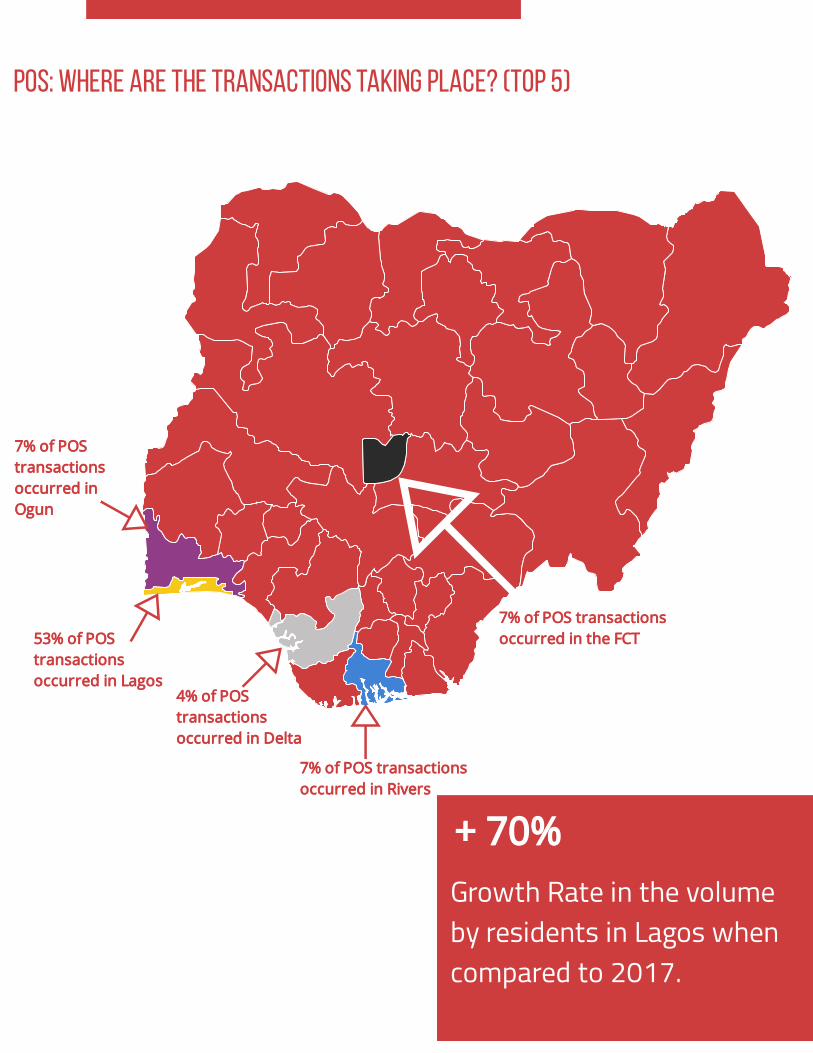
POS: Where are the transactions taking place? (Top 5)
Growth Rate in the volumeby residents in Lagos whencompared to 2017.
+ 70%+ 70%
7% of POS transactions7% of POS transactionsoccurredoccurred in the FCT in the FCT
7% of POS7% of POStransactionstransactionsoccurredoccurred in inOgunOgun
7% of POS transactions7% of POS transactionsoccurredoccurred in Rivers in Rivers
4% of POS4% of POStransactionstransactionsoccurredoccurred in Delta in Delta
53% of POS53% of POStransactionstransactionsoccurredoccurred in Lagos in Lagos

POS: Failed Transactions by Response Code (Top 10)
Of all failed transactionswere caused directly orindirectly by customer error.
+ 63%+ 63%
19.9M
6M
2.8M
2M
1.9M
1.5M
1.2M
1.1M
1.1M
1M
Volume by Response Code DescriptionVolume by Response Code Description
Insufficient Funds
Issuer Inoperative
Do Not Honor
Incorrect Pin
No Savings Account
Switch Inoperative
Transaction NotPermitted toCardholder
Refer to Card Issuer
Exceed WithdrawalLimit
Request In Progress
0M 5M 10M 15M 20M 25M

Extras: When did the most number of POS transactions occur?Extras: When did the most number of POS transactions occur?
december 2018december 2018
Total VOLUME OF TRANSACTIONSTotal VOLUME OF TRANSACTIONS
21st21st
1.3M1.3M

THANK YOU
DO YOU HAVE ANY QUESTIONS?

CONTACT US
Phone Email Website Twitter
0800ASKNIBSS [email protected] www.nibss-plc.com.ng @NIBSSPLC