Embed Size (px)
Citation preview
3 DEPARTMENT OF EDUCATION
AGENCY OUTLINEEducation is a major contributor to improving social and economic outcomes in Tasmania, including health, happiness, life expectancy and productivity.The Department of Education is responsible for the delivery of public early years and school education, adult and community education and library and archive services throughout Tasmania. The Department is responsible to the Minister for Education and Training, Hon Jeremy Rockliff MP.The Department is committed to inspiring and supporting all learners to succeed as connected, resilient, creative and curious thinkers.Implementation of the 2018-2021 Department of Education Strategic Plan, Learners First: Every Learner, Every Day, is supporting a culture of continuous improvement in learner outcomes.The Strategic Plan commits the Department to the shared values of aspiration, respect, courage and growth.The Strategic Plan focusses on four key goals that evidence demonstrates have a positive impact on education outcomes: access, participation and engagement; early learning; wellbeing; and literacy and numeracy. The Department’s efforts towards achievement of these goals are tailored to a learner’s age, ability and aspirations in the areas of: early learning; primary and secondary education; senior secondary education; and adult learning. These services are delivered across the state through 196 Government schools including early childhood intervention services, 12 child and family centres and 47 libraries. The number of students from pre-kinder to senior secondary is 60 443 full-time equivalent students.
Early LearningThe evidence is conclusive that early life experiences shape a child’s life course. The early years are a period of rapid brain growth that lay the foundation for learning and development in later life.As a child’s first educator, families play a vital role as partners in a child’s learning. High quality early learning improves outcomes in later life, particularly for children from disadvantaged backgrounds.The Department of Education early learning environments, including the Early Childhood Intervention Services, Child and Family Centres, Libraries Tasmania and
Education 61
schools, support families with young children to play, learn and grow together. The Department of Education provides children from birth to eight years with a great start to learning by: connecting people across the Tasmanian community who are committed to
supporting families with young children through the B4 Early Years Coalition; supporting families with children from birth to five years to engage with learning
through the Launching into Learning initiative and services in CFCs; continuing to refocus teaching and learning in the early years of education from
Kindergarten to Year Two, to ensure that high quality and age-appropriate pedagogies are used in all government primary schools; and
regulation and quality assurance of Early Childhood Education and Care services.Tasmania’s Strategy for Children - Pregnancy to Eight Years 2018-2021 supports the achievement of the Department’s early learning goal with partners across government, the ECEC sector and community, through a focus on quality, equity and partnerships.The 2018-19 investment in early learning will support the delivery of Early Learning Hubs and free pre-school for three year old children with the greatest need; improvements to kindergarten facilities; and provide more support for learners in Prep to Year Two to engage in play-based, inquiry-led learning.For more information on the Early Years visit the It’s A Great Start website at https://greatstart.tas.gov.au/.
Primary and Secondary EducationChildren and young people become increasingly independent learners as they progress through primary and secondary school and engage with the Australian Curriculum. Students benefit from a continued focus on literacy and numeracy alongside experiences that support the development of life-long skills for problem solving, collaboration and critical and creative thinking.Student engagement, achievement and wellbeing are intrinsically linked and especially important during periods of transition and change. The middle years (between age nine and 14) are a key developmental stage, where being genuinely engaged in learning and developing high self-esteem has a lasting impact on learning and life outcomes.The Department of Education delivers high quality teaching and learning in schools from Prep to Year 10 through: continued implementation of the Education Act 2016;
maintaining a strategic focus on improving the quality of teaching, through the Workforce Development Strategy;
providing targeted support to schools to ensure quality literacy and numeracy learning through coaches;
62 Education

supporting the inclusion and achievement of students with disability by developing a new needs based funding model for Students with Disability;
supporting students with additional needs, including those affected by trauma, through professional support staff who build the capacity of teaching staff and provide targeted assistance; and
providing flexible learning options to support the engagement and re-engagement of students.
The 2018-19 investment in school education will provide more quality teachers in government schools; expand and improve school infrastructure to support learning; further deliver on recommendations for children and young people with a disability identified by the Ministerial Taskforce; and support child and student wellbeing.
Education 63

Senior Secondary EducationThe successful transition from Year 10 to a meaningful learning pathway, leading to attainment of Year 12 (or equivalent), is vital to a young person’s ongoing engagement in further education, training or employment.In Years 11 and 12 students move to studying a Tasmanian Assessment, Standards and Certification or Vocational Education and Training course, or a combination of both. Flexible and socially inclusive education is essential to engaging a significant proportion of senior secondary learners in Tasmania.The Department of Education delivers senior secondary education in eight colleges and 38 Extension High Schools with five further extension schools to commence in 2019.The Department of Education is working to improve access to, and participation and engagement in, quality senior secondary pathways for young people with diverse learning needs, starting points and interests, through: extending government high schools to Year 11 and 12 to provide further
opportunities for young people to successfully complete senior secondary education;
increasing the school leaving age and requirements from 2020 under the Education Act;
quality delivery of VET qualifications through Trade Training Centres and Trade Skills Centres; and
school based apprenticeships and traineeships to connect school and employment through learning pathways.
The 2018-19 investment will support the extension of every Tasmanian high school to Year 12 by 2022, including continued support for innovative partnerships between urban and rural schools and colleges to provide young people with the best opportunities to be job ready.
Adult LearningLearning is a lifelong journey and adults pursue learning in Department of Education settings for a range of different reasons, including for careers and employment, personal interests, wellbeing or to support younger learners.Improved adult literacy and numeracy levels are directly related to better social and economic outcomes and the literacy levels of parents directly impact on the educational aspirations and attainment of children.Libraries Tasmania is a statewide network that gives people in Tasmania access to library services, research and information, adult literacy support, community learning, online access and archive and heritage services.
64 Education

Libraries Tasmania also supports adult learners to re-engage in learning through adult literacy services and the 26TEN network of organisations and individuals that work together to improve adult literacy and numeracy.Investment in 2018-19 will provide additional resources to Libraries Tasmania and facilitate the organisation’s name change from LINC Tasmania.This chapter provides the Department’s financial information for 2018-19 and over the Forward Estimates period (2019-20 to 2021-22). Further information on the Department is provided at www.education.tas.gov.au.
Education 65
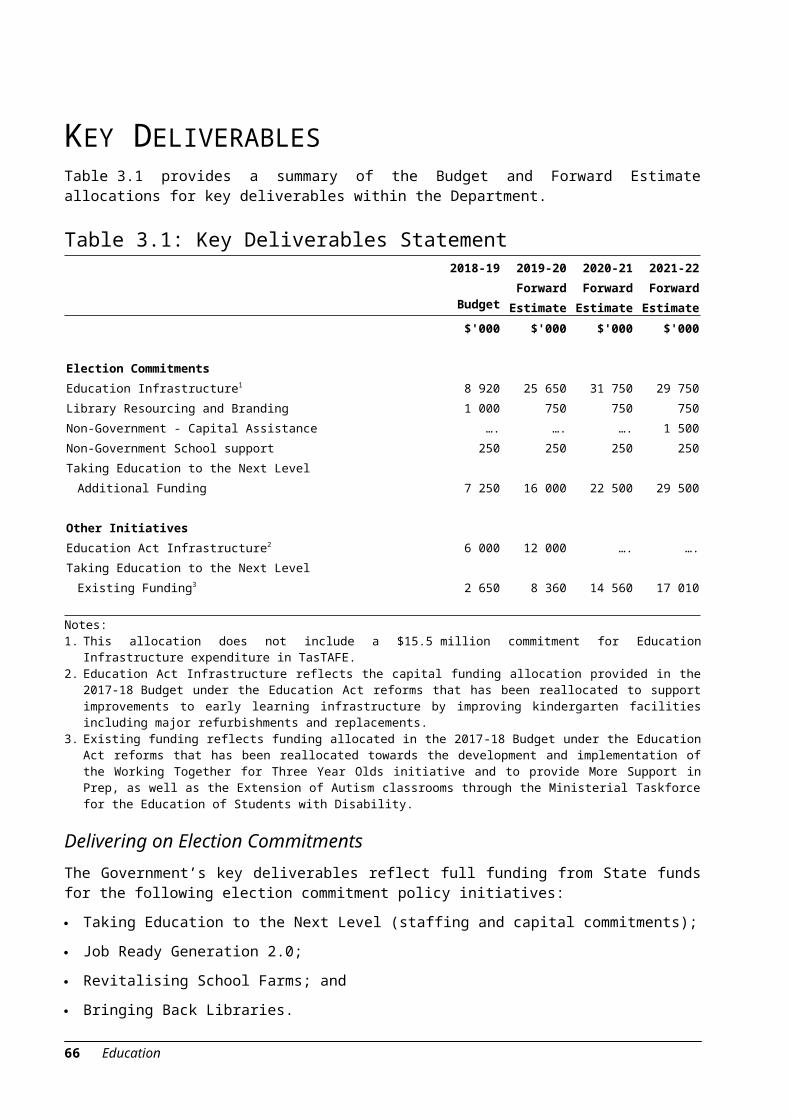
KEY DELIVERABLESTable 3.1 provides a summary of the Budget and Forward Estimate allocations for key deliverables within the Department.
Table 3.1: Key Deliverables Statement2018-19
Budget
2019-20ForwardEstimate
2020-21ForwardEstimate
2021-22ForwardEstimate
$'000 $'000 $'000 $'000
Election CommitmentsEducation Infrastructure1 8 920 25 650 31 750 29 750Library Resourcing and Branding 1 000 750 750 750Non-Government - Capital Assistance …. …. …. 1 500Non-Government School support 250 250 250 250Taking Education to the Next Level
Additional Funding 7 250 16 000 22 500 29 500
Other InitiativesEducation Act Infrastructure2 6 000 12 000 …. ….Taking Education to the Next Level
Existing Funding3 2 650 8 360 14 560 17 010
Notes:1. This allocation does not include a $15.5 million commitment for Education Infrastructure expenditure
in TasTAFE.2. Education Act Infrastructure reflects the capital funding allocation provided in the 2017-18 Budget
under the Education Act reforms that has been reallocated to support improvements to early learning infrastructure by improving kindergarten facilities including major refurbishments and replacements.
3. Existing funding reflects funding allocated in the 2017-18 Budget under the Education Act reforms that has been reallocated towards the development and implementation of the Working Together for Three Year Olds initiative and to provide More Support in Prep, as well as the Extension of Autism classrooms through the Ministerial Taskforce for the Education of Students with Disability.
Delivering on Election CommitmentsThe Government’s key deliverables reflect full funding from State funds for the following election commitment policy initiatives: Taking Education to the Next Level (staffing and capital commitments); Job Ready Generation 2.0; Revitalising School Farms; and Bringing Back Libraries.Through delivering on its election commitments the Government will invest a record $324 million over six years into education covering:
66 Education

$145 million in recurrent funding which includes funding for an additional 358 new staff including 250 new teachers; and
$179 million in education infrastructure (across Department of Education and TasTAFE facilities).
Funding previously allocated under the Education Act reforms has been reallocated to support additional prep support, free pre-school for three year olds and capital funding for improving kindergarten facilities and capacity requirements for the later leaving age.
Education InfrastructureThe Government has committed new funding of $179 million over six years for education infrastructure of which $163.5 million is for government school infrastructure and $15.5 million is for TasTAFE infrastructure. Of the new funding committed in this Budget for government school infrastructure, a total of $96.1 million has been allocated across the Forward Estimates and will provide investment in new schools, school re-builds, new Early Learning Hubs and school farm redevelopments. With the addition of existing infrastructure funding, including improvements to the Tasmanian Archives and Heritage Office, this takes the total Capital Investment Program over four years to $175.8 million.Two new schools will be built, with $20 million allocated to build a new primary school at Legana commencing in 2021-22 and $30 million towards a new Years 7-12 High School at Brighton commencing in 2020-21. Significant re-builds will be undertaken at Penguin District School ($20 million commencing in 2018-19), Sorell School (an additional $22 million on top of the existing $3.8 million allocation), Cosgrove High School ($20 million commencing in 2021-22) and Devonport High School ($10.5 million commencing in 2020-21). Funding totalling $7.3 million will be expended towards supporting a revitalised network of school farms across the State. This will include allocations towards school farm infrastructure at the Jordan River Learning Federation and Sheffield District School. Additional capital funding of $6 million is provided to support the extension of all high schools to Year 12 by 2022. This takes total capital funding for this initiative to $10.5 million over the Budget and Forward Estimates.Funding of $10.5 million, over four years ($21 million over six years), has been provided to commence construction of six new Early Learning Hubs in the communities of Sorell, Kingborough, Glenorchy, East Tamar, West Ulverstone and Waratah-Wynyard. Hubs will provide access to services for families with young children including health support and outreach and early childhood education and care facilities through partnerships with the ECEC sector. Four of these hubs will be operational by 2024, the first of which is to commence construction in 2019-20 with $3.5 million allocated.
Education 67

Education Act InfrastructureThe Government is directing the $18 million capital funding allocated under the Education Act reforms to support improvements to early learning infrastructure, by significantly improving kindergarten facilities including major refurbishments and replacements. Funding will continue to be used for meeting capacity requirements resulting from the later leaving age. It is anticipated that work will commence in 2019 at Glen Huon Primary School, Franklin Primary School, Forth Primary School, Glenora District School, Cooee Primary School, Moonah Primary School, Rosetta Primary School, Bowen Road Primary School, Bagdad Primary School and Lilydale District School.
68 Education

Library Resourcing and BrandingFunding of $1 million has been allocated in 2018-19 in the first year of a four year $3.3 million allocation to provide additional resources and to facilitate the name change of LINC Tasmania to Libraries Tasmania. These funds will be used for the purchase of contemporary library resources in a wide range of formats such as digital materials, subscriptions to online materials and books in the State Library. In 2018-19, $250 000 will be used towards rebranding Libraries Tasmania and $750 000 will be used for the purchase of new library resources.
Non-Government Capital AssistanceFunding of $1.5 million has been provided in 2021-22 to extend the additional capital contribution for non-government capital assistance, provided in the 2017-18 Budget, for one more year.
Non-Government School SupportFunding of $1 million over four years will be provided for a new grant for student support in non-government schools in low socio-economic communities. This grant will provide the schools with flexible resources to enable them to provide additional literacy and numeracy support as well access to allied health or support services such as hearing and sight checks, speech therapy, psychology or a social worker. Funding of $250 000 will be expended in 2018-19.
Taking Education to the Next LevelAdditional funding of $75.3 million over four years has been allocated to take education to the next level; providing more staff in Government schools, investment in the early years of education, supporting students with disability and continuing targeted support programs in schools. This is in addition to funding totalling $42.6 million already committed through the Education Act reforms relating to the Working Together for 3 Year Olds initiative and Prep support as well as extensions to Autism classrooms.
More staff in Government SchoolsWithin four years, 277 new staff will have been employed in the Government School system, including 192 new teachers. This investment will grow to 358 more staff including 250 additional teachers and 80 additional teacher assistants within six years. The additional teachers will include: the progressive roll-out over six years of 90 extra teachers that will support
principals to focus more on leading high quality teaching and learning in their schools, recognising that high quality teaching has the biggest impact on education outcomes;
10 new teachers for school farms to improve student learning and support a network of school farms across Tasmania, and
Education 69

35 additional Literacy and Numeracy coaches, increasing the total number of coaches to 120.5 full-time equivalents, recognising that literacy and numeracy skills provide the foundation for improving education outcomes in all other curriculum areas.
70 Education

School Farm ResourcingIn addition to staffing, funding of $800 000 over four years has been allocated to support the operation of school farms across the State. This initiative will support a network of school farms across Tasmania and provide clear education pathways and improved opportunities for learning about primary industries and the science behind food and fibre production. Funding of $200 000 has been allocated in 2018-19 for this initiative. Infrastructure funding totalling $7.3 million has been allocated toward supporting a revitalised network of school farms across the State. This will include allocations towards school farm infrastructure at the Jordan River Learning Federation and Sheffield District School.
Early Years EducationInvestment in early years, with a focus on early learning, provides the highest return on investment in terms of lifting education outcomes.Early Learning Hubs
Operational funding has been provided for the six new Early Learning Hubs with four Hubs to be operational by 2024. This funding will provide, over six years, 12 new early years staff which includes a teacher in each Hub. The Hubs will service the communities of Sorell, Kingborough, Glenorchy, East Tamar, West Ulverstone and Waratah-Wynyard. They will provide access to services for families with young children including health and education support both within the Hub and through outreach. Hubs will also include early childhood education and care services designed and delivered in partnership with the ECEC sector.
Free Pre-School for Three Year Olds
Funding of $2.3 million has been allocated in 2018-19 to support the co-design of the Working Together for 3 Year Olds initiative to be delivered as a partnership between the Department of Education and the ECEC. This is the second year of an initiative that will deliver free pre-school for three year olds across the State, supporting those children who are the most disadvantaged or vulnerable. Once implemented in 2020, this initiative will provide up to $10.5 million per annum to support free pre-school delivered by the ECEC sector. The total investment in this initiative over four years will be $31.3 million. This funding was previously allocated under the Education Act reforms.More Support in Prep
To support a play based inquiry led approach to the delivery of the Australian Curriculum in the Prep year, the Government is adding additional teacher assistant support into the Prep year. The support is equivalent to 80 full-time equivalent teacher assistants. The first stage will commence in 2020. Funding for this initiative is already reflected in the Budget, under the Education Act reforms.
Education 71
72 Education

Extend Every Tasmanian High School to Year 12 by 2022 (also Job Ready Generation 2.0)Recognising the geographic, psychological and social barriers for learners to continue to access, participate or engage in education and training, after Year 10, additional recurrent funding of $24.5 million has been allocated over four years, to continue the Government’s commitment to extend every Tasmanian High School to Year 12 by 2022. The number of schools already extended to Year 12 is 38, leaving 19 to be extended over the next four years. The extension of schools includes innovative partnerships between urban and rural schools and colleges providing students with the best opportunities to be job ready. This allocation is in addition to the significant investment already allocated towards supporting this initiative. A further $6 million has been allocated in this Budget to support infrastructure building development required for the successful implementation of this initiative (with $1.5 million commencing in 2018-19). This takes the total infrastructure allocation to $10.5 million over the Forward Estimates.
Ministerial Taskforce for the Education of Students with DisabilityChanges to education to support children and young people with a disability to access, participate and engage in education (as identified through the 2014 Ministerial Taskforce), will continue to be progressed in this Budget, with additional funding of $250 000 allocated in 2018-19, and a further $3 million in 2021-22. This is in addition to the $12 million allocated in the 2017-18 Budget over four years to support the ongoing implementation of the Taskforce’s recommendations. This initiative includes the extension of Autism specific classroom support across the State providing for further classes for high school students in the North and North West, in consultation with school communities. This will build on the successful programs already being run for primary students at Lindisfarne North Primary School, Summerdale Primary School and Romaine Park Primary School and high school students at Rose Bay High School.Provision will also be made from this funding to support the design and testing of a new needs based funding model for students with a disability. The new model will focus on delivering resources on the basis of educational adjustment required to give students with a disability the best opportunity to thrive at school.
Bravehearts School ProgramAdditional funding of $800 000 over four years has been allocated for the continued funding of the school based Bravehearts education program, with $200 000 allocated in 2018-19. The program teaches children about personal safety as a means of reducing child sexual violence.
Education 73

Stay ChatTYFunding of $250 000 per annum for four years has been allocated in the 2018-19 Budget to continue the work between Government Schools and Stay ChatTY. This program focuses on delivering a message to keep talking to one another as a means of preventing suicide and raising awareness of mental health.
74 Education

OUTPUT INFORMATIONOutputs of the Department of Education are provided under the following Output Groups: Output Group 1 - Education; and Output Group 2 - Libraries Tasmania
Table 3.2: Output Group Expense Summary1
2017-18 2018-19 2019-20 2020-21 2021-22 Forward Forward Forward
Budget Budget Estimate Estimate Estimate $'000 $'000 $'000 $'000 $'000
Minister for Education and Training
Output Group 1 - Education1.1 In School Education2 995 595 1 019 034 1 053 145 1 085 465 1 127 777 1.2 School Support Services 12 794 13 188 13 432 13 688 14 220 1.3 Early Learning3 11 596 11 896 12 316 10 312 10 430 1.4 Statutory Offices4 4 379 4 828 4 706 4 764 4 651
1 024 364
1 048 946
1 083 599
1 114 229
1 157 078
Output Group 2 - Libraries Tasmania5
2.1 Information Services and Community Learning6 35 738 37 609 38 019 38 727 40 275
2.2 Tasmanian Archives and Heritage Office 3 307 3 377 3 442 3 506 3 576 39 045 40 986 41 461 42 233 43 851
Grants and Subsidies7 329 411 354 172 370 139 386 814 397 931
TOTAL1 392 820
1 444 104
1 495 199
1 543 276
1 598 860
Notes:1. Agency estimates do not include the indexation impact of any variations to agency expenditure that
have been made since the finalisation of the Revised Estimates Report 2017-18 (including December Quarterly Report). For further information see chapter 1 of this Budget Paper.
2. The increase in In School Education reflects 2018 election commitments for Taking Education to the Next Level including: Extend Every Tasmanian High School to Year 12 by 2022; More staff in Government Schools; School Farm Resourcing; Ministerial Taskforce for the Education of Students with Disability; continued funding for the Education Act Implementation; and Australian Government funding for Quality Schools, Quality Outcomes. The increase from 2019-20 includes funding for the Working Together for Three Year Olds initiative.
3. The variation in Early Learning reflects the 2018 election commitment for operational expenses for new Early Learning Hubs. The decrease in 2020-21 reflects the completion of transition funding for the co-design and development of the Working Together for Three Year Olds initiative. Implementation funding for this initiative is in Output 1.1 In School Education.
Education 75

4. The variation in Statutory Offices reflects fixed-term funding to support transitional costs for the Office of Tasmanian Assessment, Standards and Certification allocated in the 2017-18 Budget.
5. The former Output Group 2 LINC Tasmania has been renamed Libraries Tasmania.6. The increase in Information Services and Community Learning in 2018-19 reflects the election
commitments for Library Resourcing and Branding.7. The increase in Grants and Subsidies in 2018-19 reflects the 2018 election commitments for
additional Non-Government Capital Assistance and Non-Government School Support and increased Australian Government and State Government grants to non-government schools under Quality Schools, Quality Outcomes.
Output Group 1: Education1.1 In School Education
The services provided under this Output focus on the delivery of education to students in schools enrolled in classes from Kindergarten to Year 12. The purpose of this Output is to provide a range of educational services that will help students develop intellectually, socially, morally, emotionally and physically in a stimulating, inclusive and supportive environment. The services provided under this Output are crucial to ensure that Tasmania’s young people obtain the knowledge, skills, behaviour and dispositions necessary to continue their education and training, become job-ready and lead happy and fulfilling lives. The Output has a strong focus on improving the transition of students from Year 10 and retaining them, so that they gain a meaningful Year 12 qualification, or equivalent.
1.2 School Support ServicesThe services provided under this Output focus on services provided to schools through Learning Services and Education Performance and Review.Learning Services has a key role in facilitating the sharing of resources, knowledge, innovation and learning between schools and across the State and responds to schools on the basis of their school improvement needs. Learning Services works collaboratively with networks of schools to implement whole-of-Department and Government initiatives.Education Performance and Review monitors and measures student outcomes in the pre-compulsory and compulsory years of schooling including achievement against the national benchmarks established under the National Assessment Plan - Literacy and Numeracy. It also provides statewide support and information on reporting, as well as information and data regarding teacher assessment using the standards of the Tasmanian Curriculum and the Australian Curriculum.
1.3 Early LearningThis Output has two focus areas. The first, through the Education and Care Unit, is for approving and regulating education and care services (long day care, outside school hours care and family day care) under national legislation. It is also responsible for the licensing and monitoring of all other child care services under the Child Care Act 2001. This Output also provides assistance and advice to education and care services. Funds are provided to eligible service providers as a contribution
76 Education

towards operating expenses and capital upgrades through the Education and Care Grants Program. The second focus of this Output relates to services delivered through Child and Family Centres.
Education 77

1.4 Statutory OfficesThis Output provides for the operation of independent educational Statutory Authorities administratively supported by the Department that include the Office of Tasmanian Assessment Standards and Certification, Teachers Registration Board, and the Education Registrar’s Office and Non-Government School Registration Board. TASC is responsible for Years 11 and 12 accreditation and certification. The TRB manages the registration of all Tasmanian teachers employed in all educational sectors.
Table 3.3: Performance Information - Output Group 11
Performance MeasureUnit of Measure
2015-16 Actual
2016-17 Actual
2017-18 Target
2018-19 Target
Early LearningKindergarten and Prep2
Percentage of children meeting the Kindergarten Development Check % 72.6 71.4 75.0 75.0
Percentage of Prep students achieving: Expected literacy outcomes % 86.8 86.8 87.0 87.5Expected numeracy outcomes % 87.0 86.5 87.0 87.5
Education and CareService quality assessment visits3,4 Number 84 67 50 75Visits to approved or licensed
education and child care services5 Number 202 141 200 200
Literacy and NumeracyReading6
Reading rates against National Minimum Standard Year 3
% of students at or above the
NMS 94.0 94.4 94.4 94.5Reading rates against NMS Year 5 % 90.8 92.3 94.0 94.0Reading rates against NMS Year 7 % 93.7 93.1 94.8 95.0Reading rates against NMS Year 9 % 92.7 88.7 92.8 93.0
Numeracy6
Numeracy rates against NMS Year 3
% of students at or above the
NMS 95.8 96.2 96.2 96.3Numeracy rates against NMS Year 5 % 94.0 95.0 95.0 95.0Numeracy rates against NMS Year 7 % 95.3 94.9 96.0 96.0Numeracy rates against NMS Year 9 % 95.7 95.4 96.0 96.0
78 Education

Aboriginal Students6,7
Education outcome gap across Years 3,5,7 and 9 reading and numeracy % 5.6 6.3 5.0 5.0
Education 79

Table 3.3: Performance Information - Output Group 11 (continued)
Performance MeasureUnit of Measure
2015-16 Actual
2016-17 Actual
2017-18 Target
2018-19 Target
Access, Participation and EngagementGovernment school student
satisfaction8
% 85.7 83.5 86.0 86.5
Government Schools who’s attendance in Years 7-10 is 90% or more6,9 % 63.7 63.4 64.0 65.0
Government school senior secondary students (NSSC Census)10 Number 7 535 7 536 7 850 7 850
Direct retention rate Years 10-12 for government schools11 % 61.6 62.6 64.0 65.0
Apparent retention rate Years 10-12 for government schools (full-time)12 % 73.4 74.1 75.0 75.0
Attainment Measures for 15 - 19 year old students:13
Completed 120 credit points in education and training Number 5 245 5 284 5 300 5 350
Some vocational education and training
Number 4 912 5 012 6 500 6 500
Tasmanian Certificate of Education14 Number 3 767 3 871 3 600 4 100A Tasmanian Certificate of Education % 56.4 58.9 62.0 65.0A Tertiary Entrance Rank14 Number 2 239 2 171 2 450 2 450
Sources: National Assessment Program: Literacy and Numeracy: Achievement in Reading, Writing, Language Conventions and Numeracy 2016, 2017; published at http://reports.acara.edu.au/.Department of Education Annual Report 2016-17; and Department of Education records.Office of Tasmanian Assessment, Standards & Certification records and 2016-17 Annual Report.National Schools Statistics Collection (NSSC), Schools, Australia ABS Cat No 4221.0.National Quality Agenda Information Technology System.
Notes: 1. Some additional performance measures have been identified in the 2018-19 Budget. The Department
will continue to review the Performance measures for this Output Group during 2019-20 with the aim to better reflect performance against the 2018-2021 Department of Education Strategic Plan, Learners First: Every Learner, Every Day.
2. Actual performance measures are based on calendar years and include students from government schools only. The 2015-16 and 2016-17 Actual values are based on assessments at the end of 2015 and 2016 respectively. In recent years, Kindergarten Development Check outcomes have been relatively stable with a modest decline. During the same period, the Department has refined reporting to schools, including links to additional resources to guide assessments, which may have influenced the ways teachers undertake these assessments.
3. Services are assessed against the seven Quality Areas, 18 standards and 58 elements of the National Quality Standard and ratings are published. In February 2018, the NQS was amended (now with seven Quality Areas, 15 standards and 40 elements). A risk based approach to new assessments and
80 Education

reassessments of services informs the targets. The 2017-18 target was informed by the impact of the implementation of Council of Australian Governments Review changes, in particular those to the NQS.
4. Actual performance measures are responsive to the emergent demands of the ECEC and community, in accordance with the principles of best practice regulation.
5. The number of visits to approved or licensed education and child care services is in addition to the number of service quality assessments conducted. The Department has taken a risk based approach to undertaking visits to approved or licensed education and care (child care) services while new staff have been trained in the complex requirements of the National Quality Framework. This has resulted in fewer visits during this period than originally planned.
6. Actual performance measures are based on calendar years. The measures for the 2015-16 Actuals are based on the 2016 calendar year, while the measures for 2016-17 are based on 2017 calendar year. Measures include students from government and non-government schools.
7. Aboriginal students gap is measured across Years 3, 5, 7 and 9 reading and numeracy: a lower figure represents a better result in closing the gap. This measure has been consolidated across year levels to increase the reliability of the measure, from eight separate measures in previous years that were based on relatively lower student numbers.
8. Student satisfaction is evident in survey data from all Tasmanian government schools and is based on average agreement across 12 nationally agreed items of student satisfaction. Some variations from year to year may be affected by variable sampling across schools. Student satisfaction in 2017 is based on 13 998 students.
9. Year 7-10 Government school attendance level based on a nationally reported measure of the proportion of government school students attending 90 per cent or more of the Semester 1 period.
10. Actuals are the total full-time equivalent of government senior secondary students regardless of age, at the mid-year census. The measures for the 2015-16 Actuals are based on the 2016 calendar year, while the measures for the 2016-17 Actuals are based on the 2017 calendar year. Participation numbers are affected by state-level cohort sizes.
11. Direct retention is based on tracking individual students from the mid-year census of Year 10 in government schools, to the mid-year census of Year 12 in government schools. The 2015-16 and 2016-17 Actual values are the proportion of the Year 10 students who were retained to Year 12 as at mid-2016 and 2017 respectively.
12. Apparent retention rates for Years 10-12 measure the number of Year 12 students in government schools divided by the number of Year 10 students in government schools two years prior, without tracking individual students. Figures relate to full-time government school students at both year levels. The Australian Bureau of Statistics notes that care should be exercised in the interpretation of apparent retention rates as the method of calculation does not take into account a range of factors, such as movement between the government and non-government sector and interstate/international migration. The 2015-16 and 2016-17 Actual values are based on Year 12 as numbers at mid-2016 and 2017 respectively.
13. Attainment measures include students across education sectors who have attained one or more units of credit in Tasmanian Assessment, Standards and Certification accredited courses or TASC recognised or nationally recognised Vocational Education and Training by the given year. Completion and participation numbers are affected by state-level cohort sizes. Further, rates of completion and participation are affected by economic circumstances and targets assume these circumstances, especially youth employment opportunities, will remain stable over this period.
14. The proportion of students who attained a Tasmanian Certificate of Education is based on the ABS estimated residential population in Tasmania, proportionally age-weighted to students obtaining TCE, commonly 17 or 18 years old as at 30 June. This proportional measure has been introduced because completion and participation numbers are affected by state-level cohort sizes. The 2015-16 and 2016-17 Actual values are based on TCE assessments at the end of 2016 and 2017 respectively.
Education 81

Output Group 2: Libraries Tasmania2.1 Information Services and Community Learning
This Output provides for the lifelong learning of all Tasmanians through the delivery of information, education and training, literacy support and other community services through the Libraries Tasmania network.
2.2 Tasmanian Archives and Heritage OfficeThis Output focuses on the provision of Tasmanian Information Services and the management of Tasmania’s Archival and Heritage Collection.
Table 3.4: Performance Information - Output Group 2
Performance Measure1
Unit of Measure
2015-16
Actual
2016-17 Actual
2017-18 Target
2018-19Target
Percentage of people satisfied with Libraries Tasmania services2 % …. …. …. 90
Average of library loans per lending item per annum3 Number
6.21 5.96 …. 6.00
Number of visits to archive and heritage pages on Libraries Tasmania websites4 Number 773 418 924 585 …. 1 000 000
Attendance in Libraries Tasmania programs and events per annum per 1 000 people)5 Number 183 178 …. 200
Percentage of people who feel more confident using digital technology after receiving support from Libraries Tasmania staff (including volunteers), or participating in courses6
%confident or
very confident …. …. …. 90
Notes:1. As was highlighted in the 2017-18 Budget papers, Libraries Tasmania has reviewed and revised its
performance measures in the 2018-19 Budget to better reflect its strategic focus on client-centred services and programs. This also supports a recommendation in the 2016 Auditor-General’s Assessment of Performance Measures report to the Department of Education, that the previously named LINC Tasmania move away from activity measures and towards outcome measures. Two of the five proposed indicators will measure outcomes using evidence of client experiences as the basis for continuous performance improvement. The proposed measures align with national measures used in state and territory library and archive services, and national and international public libraries. This alignment will enable better comparison with performances in other jurisdictions, which will in turn support more informed decisions that lead to enhanced user experiences.
2. This outcome measure provides a primary indication of the overall client experience of Libraries Tasmania services. The 90 per cent target is based on a 2017 client survey, which reported 87.5 per cent of respondents were either satisfied or very satisfied with Libraries Tasmania services. The target is also based on client satisfaction benchmarks and findings from national and international library and archive service surveys, which range from 88 to 95 per cent.
3. This new measure will show how frequently items in the collection are used. Due to its ageing collection, Libraries Tasmania has been above the national standard. Funding has been allocated to increase stock levels and bring the measure to within national standards. It is projected that at
82 Education

June 2018, the figure will be 6.24. The measure is obtained by dividing the total annual circulation by the total number of lending library stock.
4. This new measure indicates client engagement with archive and heritage pages accessed through the Libraries Tasmania website. Visits refer to client browsing sessions across archive and heritage pages within the same web browser. The target of one million visits is based on a count of sessions that involved visiting archive and heritage pages for the 12 months to 31 March 2018.
5. This measure indicates the level of Tasmanian participation in Libraries Tasmania’s programs and events. The June 2017 ABS population update figure will be used to measure attendances per capita. The target of 200 attendances per 1 000 people per annum is based on a count of attendances in all Libraries Tasmania programs and events by all ages, including lifelong learning and digital literacy programs, for the 12 months to 31 March 2018.
Education 83
6. This new outcome measure indicates the level to which clients are able to apply what they have learnt through the support they receive about digital technology use from Libraries Tasmania staff (including volunteers), or from participating in courses. This measure also reflects the strategic focus on contributing to improving the low levels of digital inclusion in Tasmania. The 90 per cent target is based on a 2016 American public libraries survey that found that 90 per cent of clients who participated in a program or service, say they subsequently felt more confident using what they learned.
84 Education

CAPITAL INVESTMENT PROGRAMTable 3.5 provides financial information for the Department's Capital Investment Program. Further information on the CIP is provided in chapter 6 of The Budget Budget Paper No 1.
Table 3.5: Capital Investment ProgramEstimate
d 2018-19 2019-20 2020-21 2021-22 Total Forward Forward Forward Cost Budget Estimate Estimate Estimate
$'000 $'000 $'000 $'000 $'000
New Infrastructure Commitments
Minister for Education and TrainingDevonport High 10 500 .... .... 5 250 5 250 Legana Primary 20 000 .... .... .... 5 000 New Brighton High School 30 000 .... .... 1 000 2 000 New K-12 Penguin School 20 000 1 000 4 000 7 500 7 500 New K-12 Sorell School1 22 000 1 000 10 500 10 500 .... Revitalising Cosgrove High 20 000 .... .... .... 5 000 School farm redevelopment (Brighton/JRLF) 4 300 4 300 .... .... .... School farm redevelopment (Sheffield) 3 000 .... 3 000 .... .... School Infrastructure Upgrades 6 770 1 120 3 150 2 500 .... Six New Early Learning Hubs 21 000 .... 3 500 3 500 3 500 Year 7-12 Implementation Plan - capital2 6 000 1 500 1 500 1 500 1 500
Existing Infrastructure Commitments
Minister for Education and TrainingBoat Harbour Primary School 1 800 1 350 .... .... .... East Devonport Primary School 1 750 500 .... .... .... East Launceston Primary School 4 500 4 300 .... .... .... Education Act Implementation - Capital 18 000 6 000 12 000 .... .... Hobart College 2 500 800 1 700 .... .... Illawarra Primary School 2 900 2 700 .... .... .... Lansdowne Crescent Primary School 4 730 .... 1 145 3 585 .... Molesworth Primary School 1 890 .... 260 1 630 .... Montagu Bay Primary School 1 750 750 1 000 .... .... Parklands High School 9 145 1 000 .... .... .... Queechy High School 5 000 2 450 .... .... .... Riverside High School 12 000 8 000 3 600 .... .... Riverside Primary School 2 500 500 .... .... ....
Education 85

Snug Primary School 2 500 2 460 .... .... .... Sorell School1 3 750 3 725 .... .... ....
Table 3.5: Capital Investment Program (continued)Estimate
d 2018-19 2019-20 2020-21 2021-22 Total Forward Forward Forward Cost Budget Estimate Estimate Estimate
$'000 $'000 $'000 $'000 $'000
Southern Support School 4 300 4 250 .... .... .... Spreyton Primary School 1 655 .... 260 1 395 .... St Marys District School 5 000 2 625 .... .... .... Taroona High School 5 000 4 800 .... .... .... Tasmanian Archives and Heritage Office 3 000 2 400 .... .... .... Year 7-12 Implementation Plan - capital2 10 500 1 500 1 500 1 500 ....
Total CIP Allocations 59 030 47 115 39 860 29 750
Notes:1. The 2018 election commitment funding of $22 million for the New K-12 Sorell School is in addition to
the existing funding of $3.8 million previously allocated to the project in 2016-17.2. The 2018 election commitment funding of $6 million over four years is in addition to the funding of
$4.5 million allocated in the 2017-18 Budget to extend this project.
Devonport High School RedevelopmentFunding of $10.5 million has been allocated over two years, starting in 2020-21 for a two year project for the redevelopment of Devonport High School. This development will support Devonport High School’s strong focus on community partnerships. It will provide modern learning environments and facilities to host existing programs such as the SPACE program and other programs to engage students, to help build on retention and attainment outcomes.
Extend Every Tasmanian High School to Year 12 by 2022 (Year 7-12 Implementation Plan - capital)Additional funding of $6 million over four years has been provided to continue the Government’s commitment to Extend Every Tasmanian High School to Year 12 by 2022. The number of schools already extended to Year 12 is 38, leaving 19 to be extended over the next four years. This is in addition to the $4.5 million allocation already committed in the 2017-18 Budget to support capital works for extension schools. Funding of $3 million is allocated for this initiative in 2018-19.
Legana Primary SchoolFunding of $5 million has been allocated in 2021-22 towards a $20 million project to build a new primary school in Legana.
86 Education

New Brighton High SchoolFunding of $3 million has been allocated across 2020-21 and 2021-22 as part of a $30 million project to build a new Years 7-12 High School at Brighton. This expenditure will commence in 2020-21 with a $1 million commitment.
New K-12 Penguin District SchoolFunding of $20 million over four years will be provided to fully redevelop Penguin District School as a Kindergarten to Year 12 school. This project will consolidate the current two campuses on a single site and include an Early Childhood Education and Care service, delivered in partnership with an ECEC provider. Funding of $1 million has been allocated in 2018-19 for this project.
New K-12 Sorell SchoolA further $22 million will be allocated to build upon the $3.7 million already committed in the 2016-17 Budget to upgrade Sorell School. The total $25.7 million will result in a significant re-build of the school which will include a new ECEC facility and new state of the art Science Technology, Engineering and Mathematics facility. Funding of $4.7 million will see this project commence in 2018-19.
Revitalising Cosgrove High SchoolA $20 million project, over two years, to revitalise Cosgrove High School will commence in 2021-22 with a $5 million allocation in that year. This project will serve to rebuild the existing school, creating a state of the art school providing education to Year 12. This will provide a government school option for Years 11 and 12 in Glenorchy reducing the barriers for students to access a Years 11 and 12 education.
School Farm Redevelopment BrightonFunding of $4.3 million has been allocated in 2018-19 for the redevelopment of the Jordan River Learning Federation Farm.
School Farm Redevelopment SheffieldFunding of $3 million has been allocated in 2019-20 for the redevelopment of the Sheffield School Farm.
School Infrastructure UpgradesFunding of $1.1 million has been allocated in 2018-19 in the first year of a three year $6.8 million program to provide infrastructure upgrades at Launceston College, Molesworth Environment Centre, Hellyer College and Ulverstone Primary School.
Six New Early Learning HubsFunding of $10.5 million over three years commencing in 2019-20 has been allocated commencing toward the construction of six new Early Learning Hubs. The new Hubs will be located in Sorell, Kingborough, Glenorchy, East Tamar, West Ulverstone and
Education 87

Waratah-Wynyard communities and will provide a one-stop shop for services to families with young children. Services at the Hub will include health, support and outreach and will include ECEC services designed in partnership with the ECEC sector. Four hubs will be operational by 2024.
88 Education

DETAILED BUDGET STATEMENTSTable 3.6: Statement of Comprehensive Income
2017-18 2018-19 2019-20 2020-21 2021-22 Forward Forward Forward
Budget Budget Estimate Estimate Estimate $'000 $'000 $'000 $'000 $'000
Revenue and other income from transactionsAppropriation revenue - recurrent1 932 452 967 460 993 224 1 036 069 1 077 713 Appropriation revenue - works & services2 47 825 59 030 47 115 39 860 29 750 Other revenue from government3 3 075 .... .... .... .... Grants4 16 048 8 121 9 993 148 148 Sales of goods and services 36 945 37 248 37 893 38 503 39 041 Fees and fines 215 200 204 208 213 Interest5 935 680 665 650 635 Other revenue6 31 303 30 688 31 050 31 399 31 755
Total revenue and other income from transactions
1 068 798
1 103 427
1 120 144
1 146 837
1 179 255
Expenses from transactionsEmployee benefits7 793 043 810 925 847 183 864 176 883 716 Depreciation and amortisation 51 360 51 284 51 558 51 678 51 928 Supplies and consumables 191 705 203 218 201 779 218 310 243 041 Grants and subsidies8 15 457 12 618 12 612 10 328 10 477 Other expenses 11 844 11 887 11 928 11 970 11 767
Total expenses from transactions1 063 409
1 089 932
1 125 060
1 156 462
1 200 929
Net result from transactions (net operating balance) 5 389 13 495 (4 916) (9 625) (21 674)
Other economic flows included in net resultNet gain/(loss) on non-financial assets 243 243 243 243 243
Total other economic flows included in net result 243 243 243 243 243
Net result 5 632 13 738 (4 673) (9 382) (21 431)
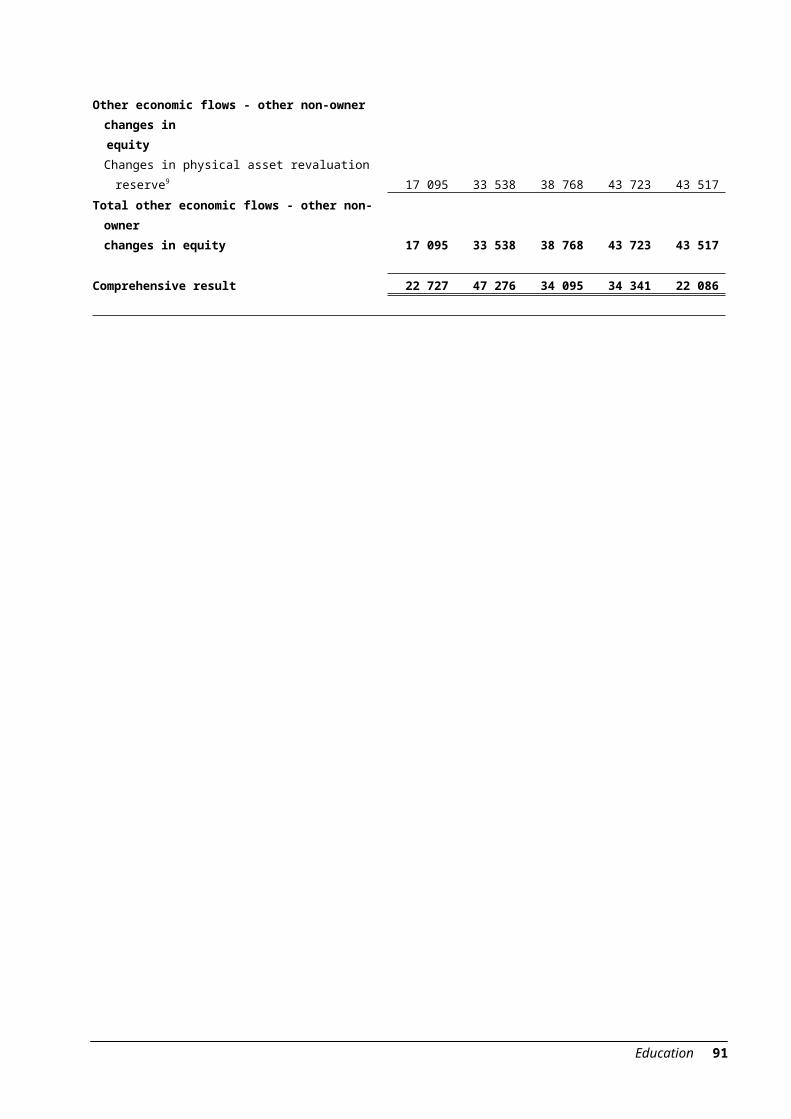
Other economic flows - other non-owner changes inequityChanges in physical asset revaluation reserve9 17 095 33 538 38 768 43 723 43 517
Education 89

Total other economic flows - other non-ownerchanges in equity 17 095 33 538 38 768 43 723 43 517
Comprehensive result 22 727 47 276 34 095 34 341 22 086
90 Education
Notes:1. The increase in Appropriation revenue - recurrent reflects 2018 election commitments for Taking
Education to the Next Level including: Extend Every Tasmanian High School to Year 12 by 2022; More staff in Government Schools; School Farm Resourcing; Ministerial Taskforce for the Education of Students with Disability; recurrent funding for new Early Learning Hubs; continued funding for the Education Act Implementation; and Australian Government funding for Quality Schools, Quality Outcomes. The increase from 2019-20 includes funding for the Working Together for 3 Year Olds initiative.
2. The variation in Appropriation revenue - works & services reflects the timing of capital projects being undertaken by the Department including 2018 election commitments for: a New Brighton High School; New K-12 Penguin School; New K-12 Sorell School; refurbishment of Devonport High and Cosgrove High; and Six New Early Learning Hubs.
3. The Other revenue from government in 2017-18 reflects the estimated funding carried forward under Section 8A(2) of the Public Account Act 1986 at the time of the 2017-18 Budget.
4. The decrease in Grants across the Forward Estimates reflects the finalisation of Australian Government National Partnership funding to the State which includes the cessation of funding from the Australian Government under the National Partnership Agreement on Universal Access to Early Childhood Education - 2018. These estimates were prepared before the release of the 2018-19 Australian Government Budget where it was announced that funding for this program will be extended to 2019.
5. The decrease in Interest revenue in 2018-19 reflects a revision to estimated revenue based on actual revenue trends.
6. The decrease in Other revenue in 2018-19 primarily reflects a revision to estimated school revenue based on actual revenue trends.
7. The increase in Employee benefits in 2018-19 primarily reflects the impact of the 2018 election commitments for Taking Education to the Next Level including: Extend Every Tasmanian High School to Year 12 by 2022; More staff in Government Schools; and School Farm Resourcing.
8. The decrease in Grants and subsidies in 2018-19 reflects the finalisation of Australian Government National Partnership funding to the State. The decrease in 2020-21 reflects the reallocation of funding originally provided for the transitional support package allocated to Support the Education and Care Sector to primarily Employee benefits and Supplies and consumables to support the co-design of the Working Together for 3 Year Olds initiative.
9. Changes in physical asset revaluation reserve reflect the revaluation of Land and Buildings.
Table 3.7: Statement of Comprehensive Income - Administered
2017-18 2018-19 2019-20 2020-21 2021-22 Forward Forward Forward
Budget Budget Estimate Estimate Estimate $'000 $'000 $'000 $'000 $'000
Revenue and other income from transactionsAppropriation revenue - recurrent1 329 411 354 172 370 139 386 814 397 931 Sales of goods and services 382 391 400 410 420
Total revenue and other income from transactions 329 793 354 563 370 539 387 224 398 351
Expenses from transactionsGrants and subsidies1 329 411 354 172 370 139 386 814 397 931 Transfers to the Consolidated Fund 382 391 400 410 420
Total expenses from transactions 329 793 354 563 370 539 387 224 398 351
Net result from transactions (net operating balance) .... .... .... .... ....
Education 91
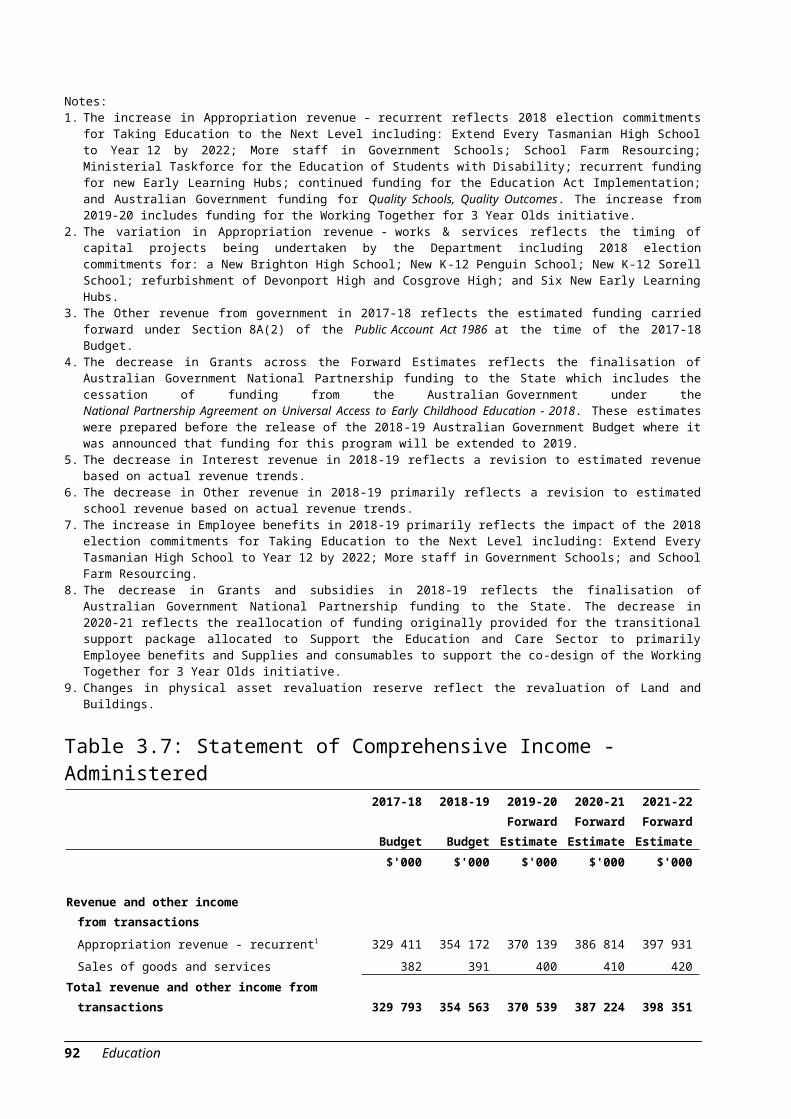
Net result .... .... .... .... ....
Comprehensive result .... .... .... .... ....
Note:1. The increases in Appropriation revenue - recurrent and Grants and subsidies reflect 2018 election
commitments for additional Non-Government Capital Assistance and Non-Government School Support, and increased Australian Government and State Government grants to non-government schools under Quality Schools, Quality Outcomes.
Table 3.8: Revenue from Appropriation by Output2017-18 2018-19 2019-20 2020-21 2021-22
Forward Forward Forward Budget Budget Estimate Estimate Estimate
$'000 $'000 $'000 $'000 $'000
Minister for Education and Training
Output Group 1 - Education1.1 In School Education1 871 445 903 617 928 035 971 886 1 011 841 1.2 School Support Services 11 459 11 853 12 097 12 353 12 651 1.3 Early Learning2 10 965 10 959 11 683 9 595 10 239 1.4 Statutory Offices3 3 839 4 288 4 166 4 224 4 103
897 708 930 717 955 981 998 058 1 038 834
Output Group 2 - Libraries Tasmania2.1 Information Services and Community
Learning4 31 777 33 695 34 132 34 836 35 634 2.2 Tasmanian Archives and Heritage Office 2 967 3 048 3 111 3 175 3 245
34 744 36 743 37 243 38 011 38 879
Grants and Subsidies5 329 411 354 172 370 139 386 814 397 931
Capital Investment Program6 47 825 59 030 47 115 39 860 29 750
Department of EducationTotal Recurrent Services 1 261 863 1 321 632 1 363 363 1 422 883 1 475 644 Total Works and Services 47 825 59 030 47 115 39 860 29 750
1 309 688
1 380 662
1 410 478
1 462 743
1 505 394
Appropriation Carried Forward 3 075 .... .... .... ....
Total Revenue from Appropriation1 312 763
1 380 662
1 410 478
1 462 743
1 505 394
92 Education

Controlled Revenue from Appropriation 983 352 1 026 490 1 040 339 1 075 929 1 107 463 Administered Revenue from Appropriation 329 411 354 172 370 139 386 814 397 931
1 312 763
1 380 662
1 410 478
1 462 743
1 505 394
Notes:1. The increase in In School Education reflects 2018 election commitments for Taking Education to the
Next Level including: Extend Every Tasmanian High School to Year 12 by 2022; More staff in Government Schools; School Farm Resourcing; Ministerial Taskforce for the Education of Students with Disability; continued funding for the Education Act Implementation; and Australian Government funding for Quality Schools, Quality Outcomes. The increase from 2019-20 includes funding for Education Act Implementation including the Working Together for 3 Year Olds initiative.
2. The variation in Early Learning reflects the 2018 election commitment for operational expenses for new Early Learning Hubs. The decrease in 2020-21 reflects the completion of transition funding for the co-design and development of the Working Together for 3 Year Olds initiative. Implementation funding for this initiative is in Output 1.1 In School Education.
3. The variation in Statutory Offices reflects fixed-term funding to support transitional costs for the Office of Tasmanian Assessment, Standards and Certification allocated in the 2017-18 Budget.
4. The increase in Information Services and Community Learning in 2018-19 reflects the election commitments for Library Resourcing and Branding.
5. The increase in Grants and subsidies in 2018-19 reflects the 2018 election commitments for additional Non-Government Capital Assistance and Non-Government School Support and increased Australian Government and State Government grants to non-government schools under Quality Schools, Quality Outcomes.
6. The variation in Capital Investment Program reflects the timing of capital projects being undertaken by the Department including 2018 election commitments for a New Brighton High School, New K-12 Penguin School, New K-12 Sorell School, refurbishment of Devonport High and Cosgrove High and Six New Early Learning Hubs.
Table 3.9: Administered Revenue2017-18 2018-19 2019-20 2020-21 2021-22
Forward Forward Forward Budget Budget Estimate Estimate Estimate
$'000 $'000 $'000 $'000 $'000
Revenue Collected on Behalf of the Consolidated FundOther Sales of Services 382 391 400 410 420
382 391 400 410 420
Revenue from AppropriationAnnual Appropriation1 329 411 354 172 370 139 386 814 397 931
329 411 354 172 370 139 386 814 397 931
Total Administered Revenue 329 793 354 563 370 539 387 224 398 351
Note:1. The increase in Annual Appropriation reflects the 2018 election commitments for additional
Non-Government Capital Assistance and Non-Government School Support and increased Australian Government and State Government grants to non-government schools under Quality Schools, Quality Outcomes.
Education 93
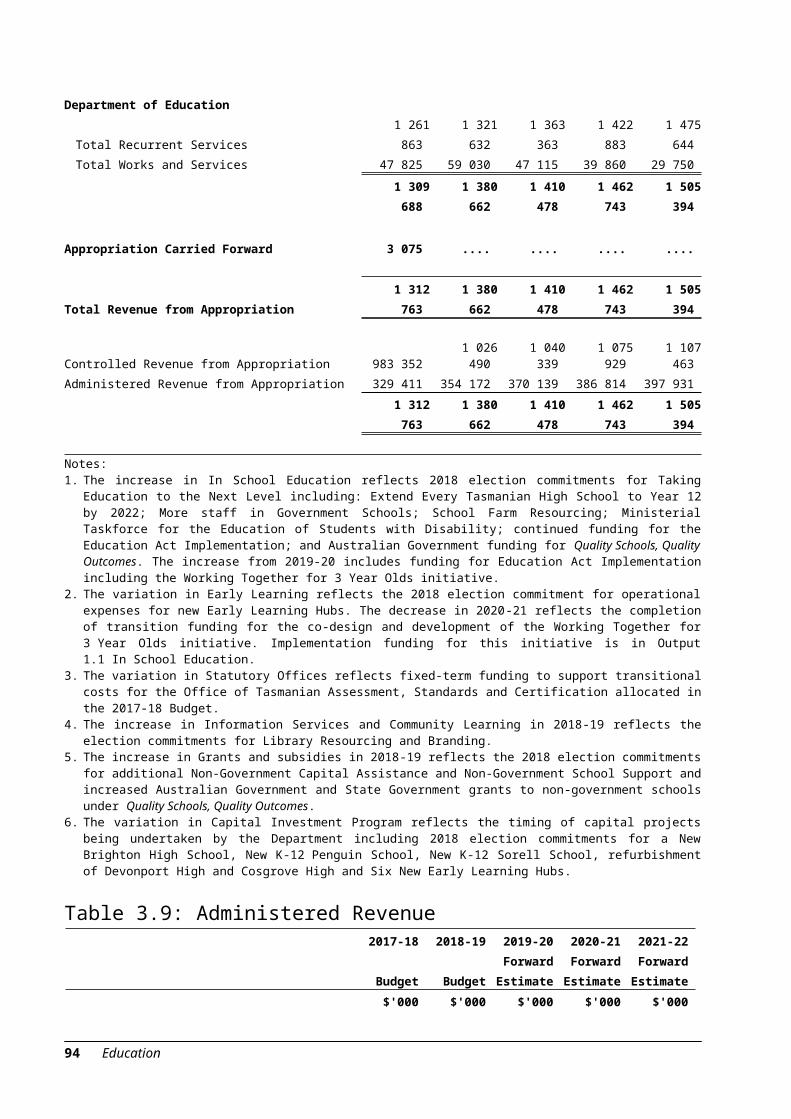
Table 3.10: Administered Expenses2017-18 2018-19 2019-20 2020-21 2021-22
Forward Forward Forward Budget Budget Estimate Estimate Estimate
$'000 $'000 $'000 $'000 $'000
Grants and SubsidiesNon-government schools: Australian
Government funded grants1 255 912 275 660 289 740 304 480 313 614 Non-government schools: State funded capital
assistance 2 673 2 673 2 673 2 673 2 673 Non-government schools: State funded
general education grants2 70 826 75 839 77 726 79 661 81 644 329 411 354 172 370 139 386 814 397 931
Transfer to the Consolidated Fund 382 391 400 410 420
Total Administered Expenses 329 793 354 563 370 539 387 224 398 351
Notes:1. The increase in Non-government schools: Australian Government funded grants reflects increased
Australian Government grants to non-government schools under Quality Schools, Quality Outcomes.2. The increase in Non-government schools: State funded general education grants reflects increased
State Government grants to non-government schools under Quality Schools, Quality Outcomes and the 2018 election commitments for Non-Government School Support.
Non-Government Schools: Australian Government Funded GrantsThis Grant Program represents Australian Government funding relating to non-government schools. These funds are administered on behalf of the Australian Department of Education and, upon receipt, are forwarded to non-government schools.
Non-Government Schools: State Funded Capital AssistanceThese grants provide funding to non-government schools and non-government school authorities for assistance with eligible capital projects in accordance with the Education Act.
Non-Government Schools: State Funded General Education GrantsThe Program covers the cost of grants which are distributed to registered non-government schools in accordance with the Education Act. Since the implementation of the Students First education reforms, funding allocations that had previously been provided to non-government schools under the Student Assistance Scheme are now included within this payment.
94 Education

Education 95

Table 3.11: Statement of Financial Position as at 30 June2018 2019 2020 2021 2022
Forward Forward Forward Budget Budget Estimate Estimate Estimate
$'000 $'000 $'000 $'000 $'000
AssetsFinancial assets
Cash and deposits 93 501 91 794 88 609 85 386 82 440 Receivables1 13 351 14 235 14 967 15 699 16 431
106 852 106 029 103 576 101 085 98 871
Non-financial assetsAssets held for sale2 4 778 4 313 4 149 3 185 2 221 Property, plant and equipment3 1 367 060 1 452 051 1 497 122 1 541 019 1 571 967 Heritage and cultural assets 44 554 46 431 48 255 50 115 51 975 Intangibles4 4 012 3 732 3 149 2 566 2 566 Other assets5 9 788 11 736 11 491 10 764 9 768
1 430 192
1 518 263
1 564 166
1 607 649
1 638 497
Total assets1 537 044
1 624 292
1 667 742
1 708 734
1 737 368
LiabilitiesPayables 6 585 7 138 7 259 7 380 7 501 Employee benefits 142 256 147 385 156 458 162 785 169 212 Other liabilities5 5 178 6 945 7 106 7 309 7 309
Total liabilities 154 019 161 468 170 823 177 474 184 022
Net assets (liabilities)1 383 025
1 462 824
1 496 919
1 531 260
1 553 346
EquityReserves 291 897 365 482 404 250 447 973 491 490 Accumulated funds 1 091 128 1 097 342 1 092 669 1 083 287 1 061 856
Total equity1 383 025
1 462 824
1 496 919
1 531 260
1 553 346
Notes:1. The increase in Receivables in 2019 reflects a revised estimate based on 30 June 2017 actuals.2. The decrease in Assets held for sale in 2019 reflects an updated estimate based on an analysis of the
timing of property sales.3. The increase in Property, plant and equipment in 2019 reflects further capital investment in schools
and the estimated indexation of the asset value base less depreciation.4. The decrease in Intangibles in 2019 primarily reflects the one-off purchase of intangibles relating to
systems development in 2017-18.
96 Education

5. The increases in Other assets and Other liabilities in 2019 reflect revised estimate based on 30 June 2017 actuals.
Education 97

Table 3.12: Statement of Cash Flows2017-18 2018-19 2019-20 2020-21 2021-22
Forward Forward Forward Budget Budget Estimate Estimate Estimate
$'000 $'000 $'000 $'000 $'000
Cash flows from operating activitiesCash inflows
Appropriation receipts - recurrent1 932 452 967 460 993 224 1 036 069 1 077 713 Appropriation receipts - capital2 47 825 59 030 47 115 39 860 29 750 Grants3 16 048 8 121 9 993 148 148 Sales of goods and services 35 429 35 982 36 627 37 237 37 775 Fees and fines 215 200 204 208 213 GST receipts 28 503 28 503 28 503 28 503 28 503 Interest received4 935 680 665 650 635 Other cash receipts5 30 303 29 688 30 050 30 399 30 755
Total cash inflows1 091 710
1 129 664
1 146 381
1 173 074
1 205 492
Cash outflowsEmployee benefits6 (701 828) (713 225) (739 730) (757 182) (774 894)Superannuation (84 894) (91 237) (94 831) (97 118) (98 846)GST payments (29 207) (29 207) (29 207) (29 207) (29 207)Grants and subsidies7 (15 457) (12 618) (12 612) (10 328) (10 477)Supplies and consumables (200 847) (212 360) (210 921) (227 452) (252 183)Other cash payments (11 766) (11 767) (11 767) (11 767) (11 767)
Total cash outflows(1 043
999)(1 070
414)(1 099
068)(1 133
054)(1 177
374)
Net cash from (used by) operating activities 47 711 59 250 47 313 40 020 28 118
Cash flows from investing activitiesPayments for acquisition of non-financial assets8 (53 283) (62 413) (50 498) (43 243) (31 064)
Net cash from (used by) investing activities (53 283) (62 413) (50 498) (43 243) (31 064)
Net increase (decrease) in cash and cash equivalentsheld (5 572) (3 163) (3 185) (3 223) (2 946)
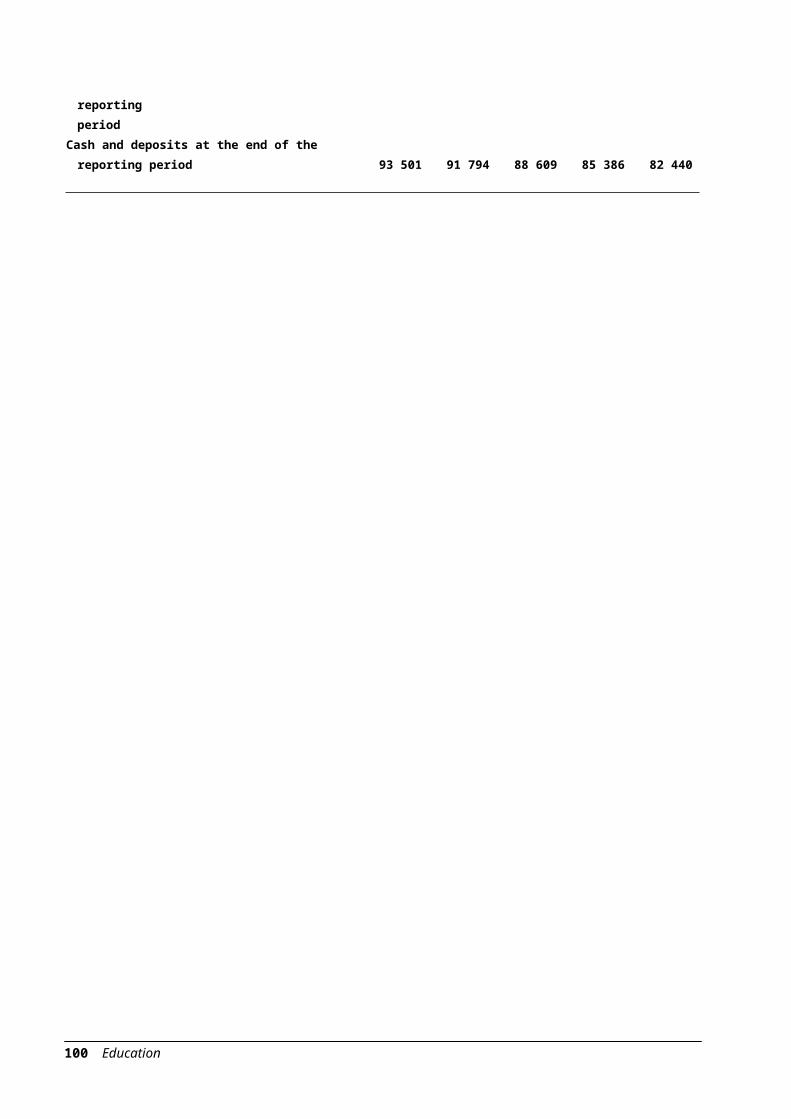
Cash and deposits at the beginning of the reportingperiod 99 073 94 957 91 794 88 609 85 386
98 Education

Cash and deposits at the end of the reporting period 93 501 91 794 88 609 85 386 82 440
Education 99
Notes:1. The increase in Appropriation receipts - recurrent reflects 2018 election commitments for Taking
Education to the Next Level including: Extend Every Tasmanian High School to Year 12 by 2022; More staff in Government Schools; School Farm Resourcing; Ministerial Taskforce for the Education of Students with Disability; recurrent funding for new Early Learning Hubs; continued funding for the Education Act Implementation; and Australian Government funding for Quality Schools, Quality Outcomes. The increase from 2019-20 includes funding for the Working Together for 3 Year Olds initiative.
2. The variation in Appropriation receipts - capital reflects the timing of capital projects being undertaken by the Department including 2018 election commitments for: a New Brighton High School; New K-12 Penguin School; New K-12 Sorell School; refurbishment of Devonport High and Cosgrove High; and Six New Early Learning Hubs.
3. The decrease in Grants across the Forward Estimates reflects the finalisation of Australian Government National Partnership funding to the State which includes the cessation of funding from the Australian Government under the National Partnership Agreement on Universal Access to Early Childhood Education - 2018. These estimates were prepared before the release of the 2018-19 Australian Government Budget where it was announced that funding for this program will be extended to 2019.
4. The decrease in Interest received in 2018-19 reflects trends based on the Department’s historical actuals.
5. The decrease in Other cash receipts in 2018-19 primarily reflects a revision to estimated school revenue based on actual revenue trends.
6. The increase in Employee benefits in 2018-19 primarily reflects the impact of the 2018 election commitments for Taking Education to the Next Level including: Extending Every Tasmanian High School to Year 12 by 2022; More staff in Government Schools; and School Farm Resourcing.
7. The decrease in Grants and subsidies in 2018-19 reflects the finalisation of Australian Government National Partnership funding to the State. The decrease in 2020-21 reflects the reallocation of funding originally provided for the transitional support package allocated to Support the Education and Care Sector to primarily Employee Entitlements and Supplies Consumables to support the co-design of the Working Together for Three Year Olds initiative.
8. Changes in Payments for acquisition of non-financial assets reflect the revaluation of Land and Buildings.
100 Education

Table 3.13: Statement of Cash Flows - Administered2017-18 2018-19 2019-20 2020-21 2021-22
Forward Forward Forward Budget Budget Estimate Estimate Estimate
$'000 $'000 $'000 $'000 $'000
Cash flows from operating activitiesCash inflows
Appropriation receipts - recurrent1 329 411 354 172 370 139 386 814 397 931 Sales of goods and services 382 391 400 410 420
Total cash inflows 329 793 354 563 370 539 387 224 398 351
Cash outflowsGrants and subsidies1 (329 411) (354 172) (370 139) (386 814) (397 931)Transfers to the Consolidated Fund (382) (391) (400) (410) (420)
Total cash outflows (329 793) (354 563) (370 539) (387 224) (398 351)
Net increase (decrease) in cash and cash equivalents held .... .... .... .... ....
Cash and deposits at the beginning of the reporting period .... .... .... .... ....
Cash and deposits at the end of the reporting period .... .... .... .... ....
Note:1. The increases in Appropriation receipts - recurrent and Grants and subsidies reflect the 2018 election
commitments for additional Non-Government Capital Assistance and Non-Government School Support and increased Australian Government and State Government grants to non-government schools under Quality Schools, Quality Outcomes.
Education 101