Embed Size (px)
Citation preview

2017Fiscal 2017 First-Half Results
jskdflroezaa
Road show London – Goldman Sachs
April 20, 2017

FORWARD-LOOKING INFORMATION
This presentation contains statements that may be considered as
forward-looking statements and as such may not relate strictly to
historical or current facts.
These statements represent management's views as of the date
they are made and Sodexo assumes no obligation to update them.
Figures have been prepared in thousands of euro and published
in millions of euro.
Alternative Performance Measures: please refer to
Appendix 6 for definitions (from slide 44 to 47).
Fiscal 2017 First-Half Results – April 20, 2017, Goldman Sachs – Roadshow London 2

1. Fiscal 2017 First Half highlights
2. Solid Financial Performance
3. Review of Operations:
On-site Services and Benefits
& Rewards Services
4. Outlook
Appendices
AGENDA
3 Fiscal 2017 First-Half Results – April 20, 2017, Goldman Sachs – Roadshow London

FISCAL 2017 FIRST HALF HIGHLIGHTS

KEY MESSAGES
First Half Fiscal 2017 highlights
As anticipated, H1 organic growth is flat:
› Q1 -1.5% due to Rugby comparative base
› Q2 +1.7%
Underlying trend in organic growth
(excluding Rugby & E&R) accelerating
› Q1 +1.1%
› Q2 +1.8%
Trend in Energy & Resources (previously
Remote Sites) improving continuously
› Q1 -4.5%
› Q2 -0.8%
BENEFITS & REWARDS SERVICES
strong organic growth
+7.4%
IMPROVED Q2
ORGANIC GROWTH
accelerating in
Corporate North America
Healthcare
Developing markets
ORGANIC GROWTH*
excluding Rugby World Cup and Energy & Resources
+1.4%
* Please refer to Appendix 6 for Alternative Performance Measures definitions (slide 44-47) 5 Fiscal 2017 First-Half Results – April 20, 2017, Goldman Sachs – Roadshow London

KEY MESSAGES
Solid performance:
Strong Operating profit1 growth
+9.7% +7.7%
Expanded Adaptation & Simplification Program
€245m costs ~ €220m savings
Net profit growth before non recurring items*
+16.6% +14.7%
1 Before exceptional expenses*
* Please refer to Appendix 6 for Alternative Performance Measures definitions (slide 44-47)
First Half Fiscal 2017 highlights
6
Operating profit margin1 increased
+60BPS +50 BPS
Increased M&A activity
€165m spent (as of 28/02/17)
EXCLUDING
CURRENCY*
TOTAL
GROWTH
EXCLUDING
CURRENCY*
TOTAL
GROWTH
Share buy-back program completed
1.9% of capital 2.9 million shares
EXCLUDING
CURRENCY*
TOTAL
GROWTH
Fiscal 2017 First-Half Results – April 20, 2017, Goldman Sachs – Roadshow London

CONTRACT WINS
First Half Fiscal 2017 highlights
7
Major recent
signatures
Colgate
Corporate contract
in Argentina,
Colombia, Czech
Republic, Italy,
Netherlands, South
Africa and Turkey
Citibanamex
Business
& Administrations
contract
in Mexico
Rio Tinto Aluminium
Energy & Resources
contract
in Australia
FM
Cross-selling
Toyota
Business
& Administrations
contract
in the US
University Hospitals
System
Heath Care Contract
in the US
Healthfirst
Heath Care Contract
in the US
Fiscal 2017 First-Half Results – April 20, 2017, Goldman Sachs – Roadshow London

CONTRACT WINS
First Half Fiscal 2017 highlights
8
Development
in Schools in Asia
Pick-up in Universities
in North America
Kang Chiao
International School
in Shanghai
Contract in China
Florida State
University
Contract in the US
Simon Fraser University
Contract in Canada
American
International
School Guangzhou
Contract in China
Development
in Benefits & Rewards
Nestlé
Product promotion
service
in the Philippines
Mexico’s Public
Prosecutor
Food and Mobility
service
in Mexico
Fiscal 2017 First-Half Results – April 20, 2017, Goldman Sachs – Roadshow London

COMMITMENTS & RECOGNITIONS
First Half Fiscal 2017 highlights
Sodexo scores
highest marks of the
sector in
RobecoSAM’s
“Sustainability
Yearbook” 2017 for
10th consecutive year
Renewed
commitment against
food waste engaging
with the Champions
12.3 coalition
For the 7th year
in a row, Sodexo
is among the
FORTUNE World’s
Most Admired
Companies
WEConnect
International award
in Colombia for
Sodexo’s inclusion
of women owned
businesses
9 Fiscal 2017 First-Half Results – April 20, 2017, Goldman Sachs – Roadshow London

Sodexo Launched the
first Global Workplace
Trends report
RESEARCH AND THOUGHT LEADERSHIP
First Half Fiscal 2017 highlights
Sodexo and Harvard University win major
4-year grant to study front-line employee health
10
Knowledge Worker
Research report
by Sodexo: creating
a workplace that
maximizes productivity
Fiscal 2017 First-Half Results – April 20, 2017, Goldman Sachs – Roadshow London

INVESTMENTS FOR GROWTH
Highlights
11
Enriching offer
Strategic move
Technical Expertise
Consolidating
our position
Fiscal 2017 First-Half Results – April 20, 2017, Goldman Sachs – Roadshow London

INVESTMENTS FOR GROWTH
SODEXO
VENTURES
Strategic Venture Capital Fund
Investing in and accompanying innovative start-ups
Commercial agreements between Sodexo and start-ups
as lever for both businesses
Creating value for clients and consumers by combining
the agility of start-ups with Sodexo’s expertise and
international footprint
12
Highlights
Fiscal 2017 First-Half Results – April 20, 2017, Goldman Sachs – Roadshow London
SOLID FINANCIAL PERFORMANCE

14
Solid financial performance
ORGANIC GROWTH
On-site Services
-0.3% | +1.2% excluding Rugby and Energy & Resources
Benefits and Rewards Services
+7.4%
ORGANIC GROWTH
+0.0% | +1.4% excluding Rugby and Energy & Resources
of which:
REVENUE GROWTH +0.4%
Currency effect +0.1%
Scope changes +0.3%
Fiscal 2017 First-Half Results – April 20, 2017, Goldman Sachs – Roadshow London

15
Solid financial performance
STRONG IMPROVEMENT IN OPERATING PERFORMANCE
€ millions
Operating margin
6.2 %
Operating profit
+60 bps TOTAL
GROWTH
At current exchange rates 6.8 %
Before exceptional expenses1
Before exceptional expenses1
658 +7.7 %
EXCLUDING
CURRENCY
EFFECT *
H1 2017 H1 2016
723
1 Costs of implementation of the Adaptation and Simplification program (€137m in H1 2017 and €37m in H1 2016)
* Please refer to Appendix 6 for Alternative Performance Measures definitions (slide 44-47)
+9.7 %
TOTAL
GROWTH
+50 bps EXCLUDING CURRENCY
EFFECT
Fiscal 2017 First-Half Results – April 20, 2017, Goldman Sachs – Roadshow London

16
Solid financial performance
ADAPTATION PROGRAM DELIVERING AND EXPANDED
€ Million
EXCEPTIONAL
IMPLEMENTATION
COSTS
TOTAL over 18 months (Sept. 2015-Feb. 2017)
245
SUSTAINABLE
ANNUAL
CUMULATED
SAVINGS Objective for
Fiscal 2018 and each year after
Achieved in
H1 Fiscal 2017
Achieved in
Fiscal 2016 32
~220
108 in FY 2016 137 in H1 2017
OBJECTIVES
Faster alignment of on-site operating expenses
Organizational simplification
Increased international pooling of resources
Success of the program: multitude of cost reduction projects submitted by the teams
Program increased to 245 million euro of costs, and closed as expected at the end of the 1st half of Fiscal 2017
Generate annual savings for Fiscal 2018 equivalent to about 90% of the exceptional costs (~ €220m)
Expected for Fiscal 2017
60
Fiscal 2017 First-Half Results – April 20, 2017, Goldman Sachs – Roadshow London

2 Net of income taxes: €99m of exceptional expenses and early debt reimbursement indemnity in H1 2017, and €24m of exceptional expenses in H1 2016,
17
Solid financial performance
PERFORMANCE IN THE P&L
CHANGE
€ millions H1 2017 H1 2016 At current
exchange rates Excluding
currency effect
Revenues 10,634 10,596 +0.4% +0.3%
Operating profit before exceptional expenses1 723 658 +9.7% +7.7%
Operating margin before exceptional expenses 6.8% 6.2% +60 bps +50 bps
Exceptional expenses (137) (37)
Operating profit 586 621
Net financial expense (56) (49)
Effective tax rate 32.6% 35.5%
Group net profit Before non recurring items2 447 383 +16.6% +14.7%
Group net profit 348 359 -3.1%
1 Costs of implementation of the Adaptation and Simplification program
Fiscal 2017 First-Half Results – April 20, 2017, Goldman Sachs – Roadshow London

EPS LEVERAGE FROM SHARE REPURCHASES
18
Group net profit
€2.98 €2.52
Earnings per share
€383m €348m
€447m €2.32
H1 Fiscal 2017
Reported
H1 Fiscal 2016 Before
non-recurring items*
H1 Fiscal 2017
Reported
H1 Fiscal 2016 Before
non-recurring items*
H1 Fiscal 2017 Before
non-recurring items*
+18.3% +16.6%
H1 Fiscal 2017 Before
non-recurring items*
* Please refer to Appendix 6 for Alternative Performance Measures definitions (slide 44-47)
Solid financial performance
Fiscal 2017 First-Half Results – April 20, 2017, Goldman Sachs – Roadshow London

19
STRONG CASH FLOW Solid financial performance
H1 2017 H1 2016
Operating cash flow 523 587
Change in working capital1 (388) (357)
Net capital expenditure (105) (176)
Free cash flow 30 54
Net acquisitions (165) (39)
Share buy-backs (316) (193)
Dividends paid to parent company shareholders (359) (335)
Other changes (including change in Financial Assets2, scope and exchange rates) (17) (70)
(Increase)/decrease in net debt (827) (583)
€ millions
1 Excluding change in financial assets in Benefits & Rewards of €(38)m in H1’17 and €43m in H1’16.
Total Change in working capital as reported in Consolidated Cash Flow statement: H1’17 of €(426)m = €(388)m + €(38)m and H1’16 of €(314)m = €(357)m + €43m
2 Sodexo Ventures investments in Wynd, Neo-Nomade and Life-Dojo
Fiscal 2017 First-Half Results – April 20, 2017, Goldman Sachs – Roadshow London

20
ROBUST BALANCE SHEET AND RATIOS Solid financial performance
February 28, 2017 February 29, 2016 February 28, 2017 February 29, 2016
Non-current assets 7,916 7,357 Shareholders’ equity 3,574 3,562
Current assets excluding cash
5,532 4,855 Non-controlling interests 39 45
Restricted cash Benefits & Rewards
486 448 Non-current liabilities 4,227 3,698
Financial assets Benefits & Rewards
376 241 Current liabilities 8,168 6,820
Cash 1,698 1,224
Total assets 16,008 14,125 Total liabilities & equity 16,008 14,125
Gross borrowings 3,758 2,800
Net debt* 1,234 923
Gearing ratio* 34% 26%
Net debt ratio* (net debt/EBITDA)
0.9 0.6
€ millions
Operating cash totaled €2,524 million1,
of which €1,847 million related to
Benefits and Rewards Services
1 Cash – Bank overdrafts of €36m + Financial assets related to BRS activity
* Please refer to Appendix 6 for Alternative Performance Measures definitions (slide 44-47) Fiscal 2017 First-Half Results – April 20, 2017, Goldman Sachs – Roadshow London

On-site Services Benefits & Rewards Services
REVIEW OF OPERATIONS
22
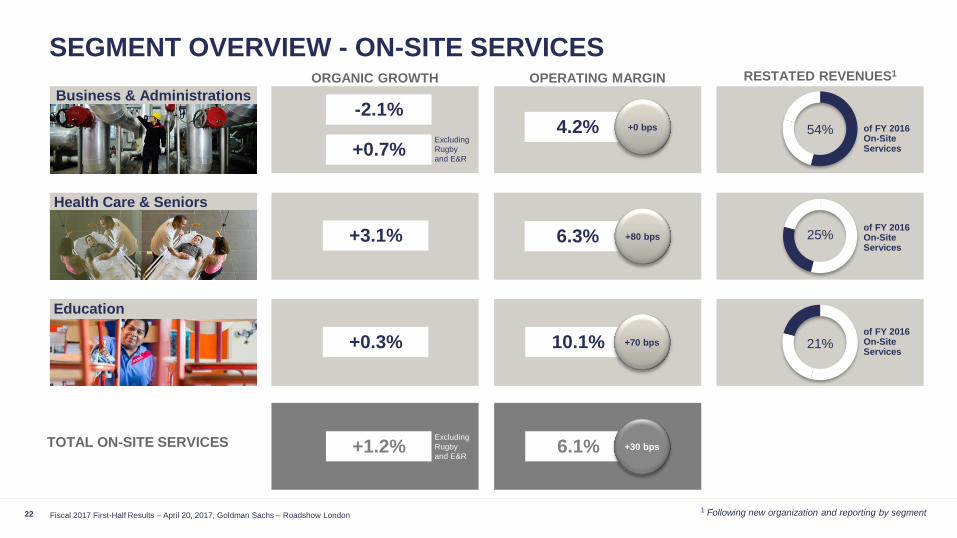
SEGMENT OVERVIEW - ON-SITE SERVICES
Business & Administrations -2.1%
+3.1%
+0.3%
ORGANIC GROWTH RESTATED REVENUES1
54%
21%
25%
Excluding
Rugby
and E&R +0.7%
OPERATING MARGIN
4.2% +0 bps
10.1% +70 bps
6.3% +80 bps
Health Care & Seniors
Education
TOTAL ON-SITE SERVICES 6.1% +30 bps Excluding
Rugby
and E&R +1.2%
of FY 2016 On-Site Services
of FY 2016 On-Site Services
of FY 2016 On-Site Services
1 Following new organization and reporting by segment Fiscal 2017 First-Half Results – April 20, 2017, Goldman Sachs – Roadshow London

23
5,196
BUSINESS & ADMINISTRATIONS - REVENUES
North America
High single digit growth in Corporate supported by airline lounges
E&R and Government services weighing on growth, even though trend is improving progressively
Europe
More than half of the decline due to Sports & Leisure, principally due to Rugby World Cup in Q1’16
E&R -16%, impacted by North Sea
Government and Agencies: loss of French prison contract (Jan 2016)
Africa, Asia, Australia, Latam & Middle East
Strong development in Corporate
Energy & Resources stabilization due to recovery in mining and onshore and contract start-ups. Offshore remains weak
On-site Services
H1 2017 H1 2016
€ millions
22%
24%
54%
+3.7%
-7.6%
+5.6%
-2.1%
ORGANIC GROWTH
Excluding
Rugby and E&R
+0.7%
of Restated B&A FY16
of Restated B&A FY16
of Restated B&A FY16
ORGANIC GROWTH
54% On-site
Services FY 16
Organic growth Unfavorable
currency effect
Acquisitions
5,322
Fiscal 2017 First-Half Results – April 20, 2017, Goldman Sachs – Roadshow London

H1 2016 H1 2017
Operating margin
-1.4%
24
BUSINESS & ADMINISTRATIONS - OPERATING PROFIT
On-site Services
4.2% 4.2%
217 222
Volume decline in revenues
Rio Tinto ramp-up
Rigorous control of SG&A
Numerous initiatives linked to
adaptation and simplification
program
CHANGE
EXCLUDING
CURRENCY
EFFECT
€ millions
H1 2017 H1 2016
TOTAL CHANGE
-3.0%
+0 bps Constant rates
Fiscal 2017 First-Half Results – April 20, 2017, Goldman Sachs – Roadshow London

25
2,419 2,500
HEALTH CARE & SENIORS - REVENUES
North America
Growth driven by cross-selling of FM Services
Contribution from new contracts
Europe
Limited development in Hospitals in France and UK
New contract ramp-up in Seniors
Africa, Asia, Australia, Latam & Middle East
Strong growth in Brazil due to multiple contract wins and increased same sites sales
Double digit growth in Chile and high single digit in Asia
On-site Services
Organic growth
Favorable currency
effect Acquisitions
+3.1%
ORGANIC GROWTH
H1 2017 H1 2016
+4.4%
-0.7%
+13.3%
25% On-site
Services FY 16
65%
4%
31%
of restated
Health Care & Seniors FY16
of restated
Health Care & Seniors FY16
of restated
Health Care & Seniors FY16
€ millions ORGANIC GROWTH
Fiscal 2017 First-Half Results – April 20, 2017, Goldman Sachs – Roadshow London

H1 2016 H1 2017
Operating margin
26
HEALTH CARE & SENIORS - OPERATING PROFIT
On-site Services
6.3% 5.5%
156
132
Reduction in SG&A costs
Improved on-site efficiency
Positive impact of the cross-selling
in UK and North America
Favorable comparable base
+19.2%
GROWTH
EXCLUDING
CURRENCY
EFFECT
€ millions
H1 2017 H1 2016
157
+18.8%
TOTAL GROWTH
+80 bps Constant rates
Fiscal 2017 First-Half Results – April 20, 2017, Goldman Sachs – Roadshow London

27
2,465 2,483
EDUCATION - REVENUES
North America
Extension at Chicago and ramp-up in Washington DC
3 days shifted from Q2 to Q3
Europe
Robust growth in Schools in Italy
Less days in France
Low prior year development in UK and France
Africa, Asia, Australia, Latam & Middle East
Very strong growth in Schools in Asia (mainly China, Singapore and India)
On-site Services
Organic growth
Favorable currency effect
€ millions
+0.3%
ORGANIC GROWTH
H1 2017 H1 2016
77%
1%
22%
of restated
Education FY16
of restated
Education FY16
of restated
Education FY16
+0.2%
-0.3%
+10.5%
ORGANIC GROWTH
21% On-site
Services FY 16
Fiscal 2017 First-Half Results – April 20, 2017, Goldman Sachs – Roadshow London

H1 2016 H1 2017
Operating margin
28
EDUCATION - OPERATING PROFIT
On-site Services
10.1% 9.4%
251
233
Strict control of SG&A
Labor productivity
Full year effect of performance
improvement of a few key contracts
+6.7%
GROWTH
EXCLUDING
CURRENCY
EFFECT
€ millions
H1 2017 H1 2016
+7.7%
TOTAL GROWTH
+70 bps Constant rates
Fiscal 2017 First-Half Results – April 20, 2017, Goldman Sachs – Roadshow London

29
On-site Services
ORGANIC GROWTH BY REGION
+6.2%
-5.5% NORTH
AMERICA +2.5%
AFRICA - ASIA -AUSTRALIA
LATAM & MIDDLE EAST
EUROPE including UK & Ireland
-2.6% excluding Rugby
Fiscal 2017 First-Half Results – April 20, 2017, Goldman Sachs – Roadshow London

30
Benefits & Rewards Services
FIRST HALF FISCAL 2017 HIGHLIGHTS
Organic growth
+6.8%
ISSUE VOLUME*
Organic growth
+7.4%
REVENUES OPERATING PROFIT
* Please refer to Appendix 6 for Alternative Performance Measures definitions (slide 44-47)
€9.1 billion €457 million €149 million
+1.7%
Growth in Operating Profit1
1 At constant rates
€
Fiscal 2017 First-Half Results – April 20, 2017, Goldman Sachs – Roadshow London

31
LATIN AMERICA Benefits & Rewards Services
3.3
Favorable currency effect
Organic growth
186 216
Favorable currency effect
Organic growth
H1 2017 H1 2016
ISSUE VOLUME € billions
REVENUES € millions
Sustained growth in Issue Volume with face value increases more than offsetting decline in number of beneficiaries in Brazil
Marked slowdown in growth in revenues in Brazil in a very competitive environment
Strong growth in the rest of the region
H1 2017 H1 2016
4.0
+7.5%
ORGANIC GROWTH
+2.9%
ORGANIC GROWTH
48% FY 16
revenues
Fiscal 2017 First-Half Results – April 20, 2017, Goldman Sachs – Roadshow London

32
EUROPE, ASIA, USA Benefits & Rewards Services
4.9 Unfavorable
currency effect
Organic growth
207 241
Acquisitions
Unfavorable currency effect
Organic growth
H1 2017 H1 2016
ISSUE VOLUME € billions
REVENUES € millions
Face value increases in Belgium
Strong growth in Italy and Central Europe
Acquisition of Inspirus in USA
Good performance of Incentive & Recognition activities in UK and USA (revenues without Issue Volume)
H1 2017 H1 2016
5.1
+6.3%
ORGANIC GROWTH
+11.5%
ORGANIC GROWTH
52% FY 16
revenues
Fiscal 2017 First-Half Results – April 20, 2017, Goldman Sachs – Roadshow London

33
OPERATING PROFIT
Benefits & Rewards Services
32.7% at current rates
33.8% Mix effect resulting from the development
of Incentive and Recognition activity
in UK and USA
Investment in Mobility and Expense offer
and Business Unit
Accelerated card migration investments
H1 2017
133
+1.7%
GROWTH
EXCLUDING
CURRENCY
EFFECT
Favorable currency effect
Change excluding
currency effect
€ millions
H1 2016
149
+12.9%
TOTAL
GROWTH
-300 bps Constant rates
-110 bps Current rates
Fiscal 2017 First-Half Results – April 20, 2017, Goldman Sachs – Roadshow London

OUTLOOK

35
FISCAL 2017 OBJECTIVES Outlook
Operating profit growth
between 8 and 9% (excluding currency effects
and exceptional expenses*)
Organic revenue growth
of around 2.5%
Confidence in acceleration in H2 based on:
Contribution from new business signed in last quarters,
despite longer lead times from signature to ramp-up
of a few large contracts
Improvement in Energy & Resources
Easier comparative base in France
Positive calendar adjustment in USA in Q4
Softer than expected environment in Europe and Africa
Confidence in delivering substantial cost savings this year as
part of the Adaptation and Simplification program:
Operating profit growth confirmed
H1 in line
with Group
expectations
* Please refer to Appendix 6 for Alternative Performance Measures definitions (slide 44-47) Fiscal 2017 First-Half Results – April 20, 2017, Goldman Sachs – Roadshow London

36
Outlook
MEDIUM-TERM OBJECTIVES
Confident in the future with,
further significant outsourcing potential and growth in developing economies
strong potential of our new segment organization
increased M&A activities
The Group confirms its medium-term objectives:
average annual growth
in revenue between 4% and 7% (excluding currency effect)
average annual growth
in operating profit of between 8%
and 10% (excluding currency effect)
Fiscal 2017 First-Half Results – April 20, 2017, Goldman Sachs – Roadshow London

Q & A

APPENDICES
1. H1 2017 exchange rates
2. Gross Financial debt
3. €300M share repurchase program
4. Financial calendar
5. Sodexo key figures
6. Alternative Performance Measure
definitions
38 Fiscal 2017 First-Half Results – April 20, 2017, Goldman Sachs – Roadshow London

39
1€ = Average rate H1
Fiscal 17
Average rate H1
Fiscal 16
Reference rate
FY Fiscal 16
Average rates:
change H1’17
vs. Reference FY’16
Closing rate H1
Fiscal 17
at February 28,
2017
Closing rates:
change February 28,
2017
vs. February 29, 2016
U.S. Dollar 1.081 1.094 1.106 +2.3% 1.060 +2.7%
Pound Sterling
0.863 0.735 0.767 -11.1% 0.853 -7.9%
Brazilian Real 3.486 4.290 4.069 +16.7% 3.281 +32.3%
Appendix 1
H1 2017 EXCHANGE RATES
Fiscal 2017 First-Half Results – April 20, 2017, Goldman Sachs – Roadshow London

40
GROSS FINANCIAL DEBT €3,758m Appendix 2
62% €
INTEREST RATE
BY CURRENCY BY MATURITY
€ millions
2,481 Average interest rate 2.1% at February 28, 2017
17% Variable
83% Fixed
35% $ 3% other
(or 2.6% for the long term debt excluding commercial paper, vs. 3.2% at August 31, 2016)
867
1
153
142
BY MATURITY
< 1 year
1-2 years
2-3 years
3-4 years
4-5 years
> 5 years 1,913
682
Fiscal 2017 First-Half Results – April 20, 2017, Goldman Sachs – Roadshow London

41
€300M SHARE REPURCHASE PROGRAM Appendix 3
€ billions
February 29, 2016 Company’s share capital February 28, 2017 August 31, 2016
Company’s share capital, number of shares 153,741,139 153,741,139 157,132,025
Treasury shares 5,814,876 3,074,444 6,166,556
Number of shares for EPS calculation (Basic weighted average number of shares) 149,936,978 151,277,059 152,025,146
2,910,690 shares corresponding to 1.9% of capital1 and a value of 300 million euro,
have been purchased by the company during H1’2017 (in line with Nov’16 share repurchase program)
As per February 28, 2017 these shares were owned by the company (as treasury shares)
and should be canceled in the calendar year.
1 1.9% = 2,910,690 / 153,741,139
Fiscal 2017 First-Half Results – April 20, 2017, Goldman Sachs – Roadshow London

42
FINANCIAL CALENDAR Appendix 4
These dates are purely indicative, and are subject to change without notice.
Regular updates are available in the calendar on our website www.sodexo.com.
Nine month revenues, Fiscal 2017 July 6, 2017
Annual results, Fiscal 2017 November 16, 2017
1st quarter revenues, Fiscal 2018 January 11, 2018
Annual Shareholders’ Meeting 2018 January 23, 2018
Fiscal 2017 First-Half Results – April 20, 2017, Goldman Sachs – Roadshow London

43
SODEXO KEY FIGURES FISCAL 2016
Appendix 5
Strong Investment Grade S&P “A-/A-1”
Founded in 1966 by Pierre Bellon
Main Shareholders as 31/08/2016:
> Bellon S.A 39.6% of capital (54.8% of actual voting rights)
> International Institutional investors 38.3%
(12th April’17)
€20.2 bn revenues
425,000 employees
19th largest employer worldwide
80 countries
€17.3 bn
75 million consumers served daily
market capitalization
Fiscal 2017 First-Half Results – April 20, 2017, Goldman Sachs – Roadshow London

ALTERNATIVE PERFORMANCE MEASURE DEFINITIONS
44
Appendix 6
Financial Ratios Definitions H1 2017 H1 2016
Gearing ratio Gross borrowings1 - Operating cash2
34% 26% Shareholders’ equity and non-controlling interests
Net debt ratio
Gross borrowings1 - Operating cash2
0.9 0.6 Earnings before Interest, Taxes, Depreciation and Amortization (EBITDA)3
Financial Ratios reconciliation H1 2017 H1 2016
1 Gross borrowings
Non-current borrowings 3,079 2,753
+ current borrowings excluding overdrafts 685 51
- derivative financial instruments recognized as assets (6) (4)
3,758 2,800
2 Operating cash
Cash and cash equivalents 1,698 1,224
+ financial assets related to the Benefits and Rewards Services activity 862 689
- bank overdrafts (36) (36)
2,524 1,877
3 Earnings before Interest, Taxes, Depreciation and Amortization (EBITDA*)
Operating profit (last 12 months) 1,060 1,144
+ depreciation and amortization (last 12 months) 272 324
1,332 1,468
*EBITDA including exceptional expenses (€37 million in H1’16, €71 million in H2’16 and €137 million in H1’17) Fiscal 2017 First-Half Results – April 20, 2017, Goldman Sachs – Roadshow London

ALTERNATIVE PERFORMANCE MEASURE DEFINITIONS
45
Appendix 6
Exceptional expenses
Exceptional expenses are the costs of implementation of the Adaptation and Simplification program (€137m in H1 2017, €37m in H1
2016 and €108m in Fiscal 2016).
Free cash flow
Please refer to slide 19.
Change excluding currency effect
Change excluding currency effect calculated converting H1 2017 figures at FY 2016 rates, except for countries with hyperinflationary
economies. As a result for Venezuelan Bolivar, H1 2017 and H1 2016 figures in VEF have been converted at the exchange rate of
USD 1 = VEF 700 vs. VEF 645 for FY 2016.
Issue volume
Issue volume corresponds to the total face value of service vouchers, cards and digitally-delivered services issued by the Group
(Benefits and Rewards Services activity) for beneficiaries on behalf of clients.
Net debt
Net debt corresponds to the Group’s borrowings at the balance sheet date, less Operating cash.
Net profit before non-recurring items
Reported Net Profit excluding non-recurring items net of taxes (respectively €92m for exceptional expenses and €7m early debt
reimbursement indemnity in H1 2017, and €24m for exceptional expenses in H1 2016).
Fiscal 2017 First-Half Results – April 20, 2017, Goldman Sachs – Roadshow London

ALTERNATIVE PERFORMANCE MEASURE DEFINITIONS
46
Appendix 6
Non-recurring items
For H1 2017: exceptional expenses of €137m related to the Adaptation and Simplification program
in operating profit and €11m of early debt reimbursement indemnity in financial expense (respectively €92m and €7m net of taxes).
For H1 2016 it concerns exceptional expenses of €37m (or €24m net of taxes)
related to the Adaptation and Simplification program.
Operating margin
Operating profit divided by Revenues.
Operating margin before exceptional expenses
Operating profit before exceptional expenses divided by Revenues.
Operating margin at constant rate
Margin calculated converting H1 2017 figures at FY 2016 rates, except for countries with hyperinflationary economies.
As a result for Venezuelan Bolivar, H1 2017 and H1 2016 figures in VEF have been converted at the exchange rate of USD 1 = VEF
700 vs. VEF 645 for FY 2016.
Operating profit before exceptional expenses
Reported Operating Profit excluding exceptional expenses (€137m in H1 2017, €37m in H1 2016 and €108m
in Fiscal 2016).
Fiscal 2017 First-Half Results – April 20, 2017, Goldman Sachs – Roadshow London

ALTERNATIVE PERFORMANCE MEASURE DEFINITIONS
47
Appendix 6
Organic growth
Organic growth corresponds to the increase in revenue for a given period (the "current period") compared to the revenue reported for
the same period of the prior fiscal year, calculated using the exchange rate for the prior fiscal year;
and excluding the impact of business acquisitions and divestments, as follows:
for businesses acquired during the current period, revenue generated since the acquisition date is excluded
from the organic growth calculation;
for businesses acquired during the prior fiscal year, revenue generated during the current period up
until the first anniversary date of the acquisition is excluded;
for businesses divested during the prior fiscal year, revenue generated in the comparative period of the prior fiscal year until the
divestment date is excluded;
for businesses divested during the current fiscal year, revenue generated in the period commencing 12 months
before the divestment date up to the end of the comparative period of the prior fiscal year is excluded.
For countries with hyperinflationary economies all figures are converted at the latest closing rate for both periods.
As a result, for the calculation of organic growth, Benefits & Rewards figures for H1 2017 and H1 2016
in Venezuelan Bolivar, have been converted at the exchange rate of USD 1 = VEF 700 vs. VEF 645 for FY 2016.
Fiscal 2017 First-Half Results – April 20, 2017, Goldman Sachs – Roadshow London

INVESTOR RELATIONS CONTACTS
48
Appendix 6
www.sodexo.com
Head of Investor Relations
Virginia JEANSON
Tel : + 33 1 57 75 80 56
[email protected]@sodexo.com
Investor Relations Manager
Sarah JAMALI-KLEIN
Tel : + 33 1 57 75 83 68
Investor Relations Coordinator
Cynthia CATTY
Tel : + 33 1 57 75 80 54
[email protected]@sodexo.com
Sodexo
255 Quai de la Bataille de Stalingrad
92130 Issy Les Moulineaux
Email : [email protected]
Fiscal 2017 First-Half Results – April 20, 2017, Goldman Sachs – Roadshow London

Thank you!