Embed Size (px)
Citation preview

2017 RETIREMENT PLAN TRENDS IN TODAY’S HEALTHCARE MARKET

2
32017 RETIREMENT PLAN TRENDS IN TODAY’S HEALTHCARE MARKET | TRANSAMERICA
HEALTHCARE SECTOR OVERVIEW
EXECUTIVE SUMMARY
GOALS AND CHALLENGES
PLAN GOALS
CHALLENGES AND CONCERNS
DEFINED CONTRIBUTION PLANS
PLAN TYPES
EMPLOYER CONTRIBUTIONS
MATCHING CONTRIBUTION LEVEL
DEFINED CONTRIBUTION PLAN ADMINISTRATION, FEES, AND EXPENSES
RETIREMENT PLANNING SERVICES
AUTOMATIC FEATURES
AUTOMATIC ENROLLMENT AND AUTOMATIC ESCALATION
DEFAULT INVESTMENT OPTIONS
PARTICIPATION RATES
DEFINED BENEFIT PLANS
PLAN OFFERING
PLAN ADMINISTRATION
FUNDING LEVEL
FUTURE CONCERNS
TOTAL RETIREMENT OUTSOURCING
ONSITE REPRESENTATIVES
ADVISORS, CONSULTANTS, AND OTHER INTERMEDIARIES
RESPONDENT CHARACTERISTICS
ABOUT THE SURVEY
4
6
8
8
8
12
12
13
13
15
16
18
18
19
20
22
22
22
23
25
25
26
28
32
34
CONTENTS
4
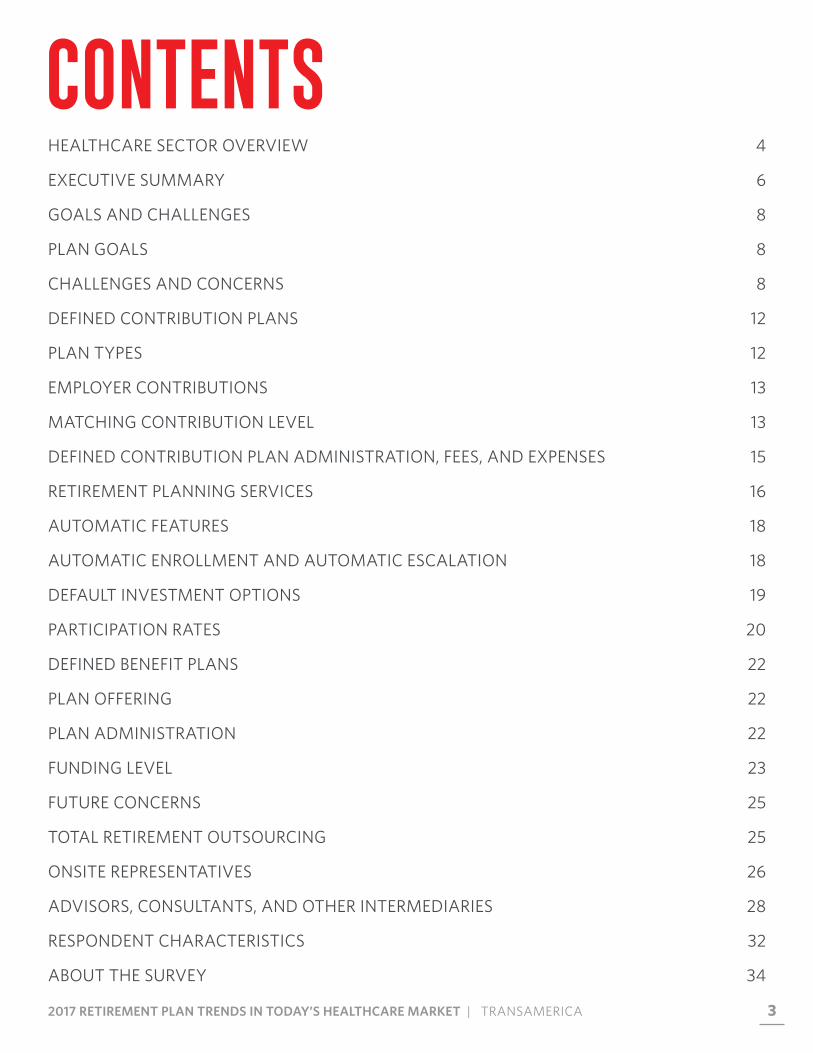
A variety of political and economic shifts bring considerable change, challenge, and volatility to the healthcare sector in 2017. Many of these shifts and changes will impact healthcare organizations, institutions that run hospitals, group practices, rehabilitation, and care facilities.
Foremost among healthcare issues is the fate of the Affordable Care Act and any subsequent replacement. Currently the future remains uncertain under the new administration. The Affordable Care Act may potentially be repealed, replaced or modified.
Another key issue affecting the entire healthcare industry, including the kind and quality of care that healthcare organizations can provide, is prescription drug pricing. Alleged price gouging by pharmaceutical laboratories for patent-protected medications strains the healthcare funding system and shrinks the resources available to pay for charitable care and emergency services. Pressure on government to bring about competition in pharma will hopefully free up resources for the sector.
Regulatory uncertainty has held up mergers and acquisitions (M&A) activity in the healthcare sector for the past year, but the situation is expected to change in 2017. In the for-profit sector, in terms of stock prices, healthcare was one of the most underperforming sectors in 2016. While the S&P 500 Index rose 13%, healthcare stocks declined more than 4%. Healthcare companies will have to take steps to turn this performance around and gain investor interest. Market forces will likely bring about increased vertical integration in the supply chain, perhaps not limited to the healthcare service sector. It is entirely possible that consolidation among pharmaceutical and biotech companies will spur a wave of acquisitions among care-providing healthcare organizations.The shortage of nursing staff in the United States is expected
to get worse over the next few years. In addition to the 3.1 million registered nurse positions in the U.S. today, the Bureau of Labor Statistics projects that more than 430,000 additional registered nurse jobs will be created over the next 10 years (an increase of about 15%). The shortage is due in part to the aging of the current population of registered nurses. The American Nurses Association reports more than half (53%) of registered nurses are over age 50. Approximately 700,000 will retire in the next 10 years. While the number of new U.S. graduates in nursing is on the rise, numbers aren’t keeping up with demand for nursing talent.
Shortage makes the nursing profession even more price elastic. In any given city, healthcare groups compete for the finite labor pool available within a 45-minute commute. In this type of labor market, workers have a disincentive to remain loyal to their employer; eligibility requirements and vesting schedules make retirement benefits a strategic employee retention tool.
HEALTHCARE SECTOR OVERVIEW
13% Rise in S&P, while healthcare stocks declined more than 4% in 2016.

52017 | RETIREMENT PLAN TRENDS IN TODAY’S HEALTHCARE MARKET
THE HEALTHIEST FUTURE TAKES A HEALTHY INVESTMENT.
52017 RETIREMENT PLAN TRENDS IN TODAY’S HEALTHCARE MARKET | TRANSAMERICA
6
To attract talent away from other occupations, healthcare organizations have been updating their retirement benefits programs to look more like those found in the corporate sector, albeit with more complexity.
In this respect, healthcare organizations are in the same situation as other employers of the not-for-profit sector. The 2016 edition of this survey found fewer healthcare organizations sponsoring a 403(b) plan than before, and more organizations sponsoring a 401(k) plan than before. Current 401(k) plans accepting regular contributions and 401(k) plans accepting Roth contributions are both enjoying a surge in popularity. Like 403(b) plans, traditional defined benefit (DB) plans are also becoming scarcer as healthcare organizations look to freeze or terminate their current plans.
The financial pressure leading healthcare organizations to free or terminate DB plans comes from two sources: (1) reduced mortality/increased longevity and (2) return rates/interests persistently short of assumptions. Retiring employees are now living into their 80s and 90s, extending DB plan sponsor obligations well beyond what actuaries predicted when plans were designed or even when reserve requirements were calculated to fund benefits of current retirees. The persistent low-interest environment of the past 20 years has made it difficult for defined benefit plan sponsors to reach assumed rates of return on invested assets. Potential interest-rate increases over the next five to 10 years might put further pressure as bond prices decline. Many healthcare organizations find that they are pouring more money into their DB plans, only to be further behind in pension obligations at year end. Further compounding the problem are Pension Benefit Guaranty Corporation (PBGC) insurance premium rate raises. DB plan funding requirements compress margins and leave healthcare organizations with fewer dollars to invest in operations. For these reasons, many healthcare organizations have little choice but to freeze their existing DB plans and to seek ways to terminate frozen plans.
With defined contribution plans as the only means to fund employee retirement, healthcare organizations report that motivating employees to save adequately is the greatest challenge to their retirement plan. Convincing staff to save any amount is a challenge, and many organizations view participation rate as the key indicator of plan success, just as retirement readiness is the key indicator in the corporate sector. Participation rates have dropped to the 70% level for non-highly compensated employees (NHCE), but have remained at levels over 95% for highly compensated employees. Such disparity can bring about testing challenges for 401(k) plans and limit plan design options for plan sponsors. Participation is a poor indicator of retirement success since retirement outcomes of plan participants is more dependent on the level of employee deferrals. Healthcare plan sponsors face internal organization challenges in getting employees retirement ready. Survey respondents find it hard to obtain management support for the kinds of changes that would ultimately enhance participant outcomes. Motivating plan committee members to enhance the plan and to go beyond meeting fiduciary obligations is difficult.
The difficulty of convincing staff to save for retirement is such that only specialized providers with deep experience in the healthcare sector can provide effective help.
EXECUTIVE SUMMARY
6
72017 RETIREMENT PLAN TRENDS IN TODAY’S HEALTHCARE MARKET | TRANSAMERICA
The 2016 edition of this survey reveals a decline in the number of healthcare plan sponsors that find their retirement plan provider to be of great help. More organizations find their provider to be of “some help.”
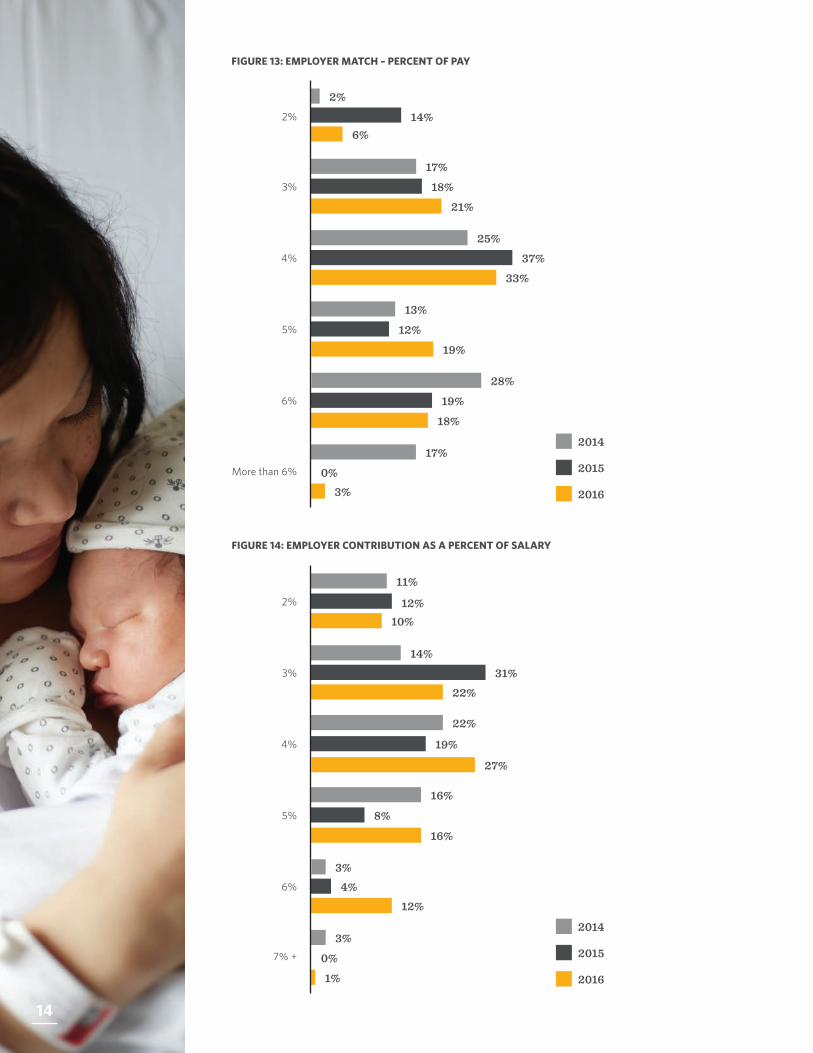
When it comes to the level of financial support for the main defined contribution plan, most healthcare organizations offer a fixed employer contribution that matches the employee contribution. In 2016, fewer plan sponsors were matching employee contributions 50-cents-on-the-dollar. More are now offering a 25-cents-on-the-dollar match or a dollar-for-dollar matching contribution. “Stretch-the-match” strategies encouraging employees to increase contributions to receive the same level of employer contributions have proven effective for enhancing contribution levels and retirement readiness. Regardless of employer match formula, healthcare organizations are evenly split when it comes to the maximum employee contribution matched. As many match employee deferrals to 3% of pay and to 5% of pay — fewer are offering a match at 4% of pay. To receive the entire employer match, many employees now must defer at least 4% of their salary. Fewer participants can receive the full match deferring just 2% or 3% of salary.
Retirement plan experts largely agree that automatic enrollment and automatic deferral increases are the most effective way of putting participants on the road to retirement readiness, especially in sectors where participation is chronically low, as is the case in healthcare. Although many healthcare organizations have adopted automatic enrollment, more need to implement automatic deferral increases to better help participants save enough to fund a comfortable lifestyle in retirement. More healthcare organizations need to offer these automatic features together.
It appears healthcare organizations implementing automatic enrollment now are electing lower default contribution rates than organizations that have had automatic enrollment. While a lower default contribution rate may satisfy the desire to contain the employer contribution budget, it is not conducive to retirement readiness and may create a liability associated with workforce aging in the long run.
Currently, 71% of healthcare organizations have a default contribution percentage of 3%, a level too low to help anyone achieve retirement success. Ironically, healthcare organizations cite their advisor as the primary motivating factor for selecting the default contribution level.
Custom asset allocation funds are no longer the prevalent Qualified Default Investment Alternative (QDIA) among healthcare plans. The most popular choice is a proprietary fund series from a management firm other than the service provider. That proprietary fund series is typically a target date series. Two-thirds of healthcare organizations choose a target date series of funds as the default election.
For 2016, healthcare organizations report they plan to hire an advisor or consultant, freeze their DB plan, and possibly enhance their DC plan or implement a hybrid plan to make up for the DB plan freeze. Some opt to bundle DB plans services with a single provider in a TRO arrangement. The number of healthcare organizations implementing TRO rose from 50% in 2015 to 62% in 2016. DB plans at healthcare organizations are, generally, adequately funded, but management worries about the impact of future funding requirements on their organization’s financial statements. Healthcare organizations also question whether employees appreciate the plan and whether liabilities might affect their creditworthiness and lead financial backers to withhold financing.
Many healthcare organizations require providers to provide on site staff support to help participants with their retirement plan decisions. About one-third of healthcare organizations have a full-time onsite plan representative assigned by their service provider. This representative helps employees better appreciate the plan, provides general financial guidance, and makes presentations at new employee sessions.
Four out of five healthcare organizations rely on a plan advisor to help with a variety of plan functions. Healthcare plans rely on the advisor (most often an investment advisor or a securities broker) to help explains fees, assist with plan design recommendations, support service provider and investment manager due diligence, make sure the plan is compliant, and improve education and outcomes for participants. Like corporate employers, healthcare organizations are finding they don’t need to meet as often with their advisor. More are meeting their advisor on a semi-annual or annual basis, and fewer on a quarterly or monthly basis.
12%Rise in healthcare organizations implementing Total Retirement Outsourcing (TRO) from 2015 to 2016.
EXECUTIVE SUMMARY
8
PLAN GOALS
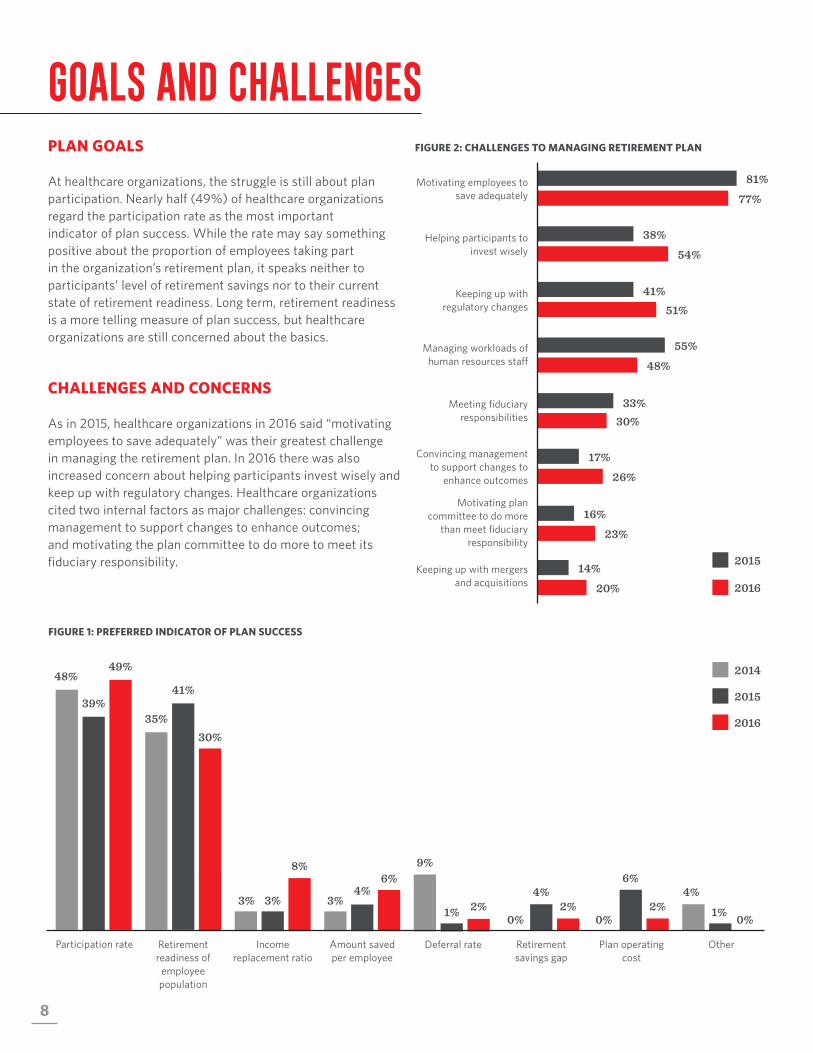
At healthcare organizations, the struggle is still about plan participation. Nearly half (49%) of healthcare organizations regard the participation rate as the most important indicator of plan success. While the rate may say something positive about the proportion of employees taking part in the organization’s retirement plan, it speaks neither to participants’ level of retirement savings nor to their current state of retirement readiness. Long term, retirement readiness is a more telling measure of plan success, but healthcare organizations are still concerned about the basics.
CHALLENGES AND CONCERNS
As in 2015, healthcare organizations in 2016 said “motivating employees to save adequately” was their greatest challenge in managing the retirement plan. In 2016 there was also increased concern about helping participants invest wisely and keep up with regulatory changes. Healthcare organizations cited two internal factors as major challenges: convincing management to support changes to enhance outcomes; and motivating the plan committee to do more to meet its fiduciary responsibility.
FIGURE 1: PREFERRED INDICATOR OF PLAN SUCCESS
FIGURE 2: CHALLENGES TO MANAGING RETIREMENT PLAN
GOALS AND CHALLENGES
Motivating employees to save adequately
81%
77%
Helping participants to invest wisely
38%
54%
Keeping up with regulatory changes
41%51%
Managing workloads of human resources staff
55%
48%
Convincing management to support changes to
enhance outcomes
17%
26%
Motivating plan committee to do more
than meet fiduciary responsibility
16%
23%
Keeping up with mergers and acquisitions
14%
20%
2015
2016
Meeting fiduciary responsibilities
33%30%
Participation rate
48%
39%
49%
Retirement readiness of
employee population
30%
41%
35%
Income replacement ratio
3% 3%
8%
Amount saved per employee
3%4%
6%9%
Deferral rate
1% 2%
Retirement savings gap
2% 0%
4%2%
0%
Plan operating cost
6%4%
Other
0%1%
2016
2014
2015
92017 RETIREMENT PLAN TRENDS IN TODAY’S HEALTHCARE MARKET | TRANSAMERICA
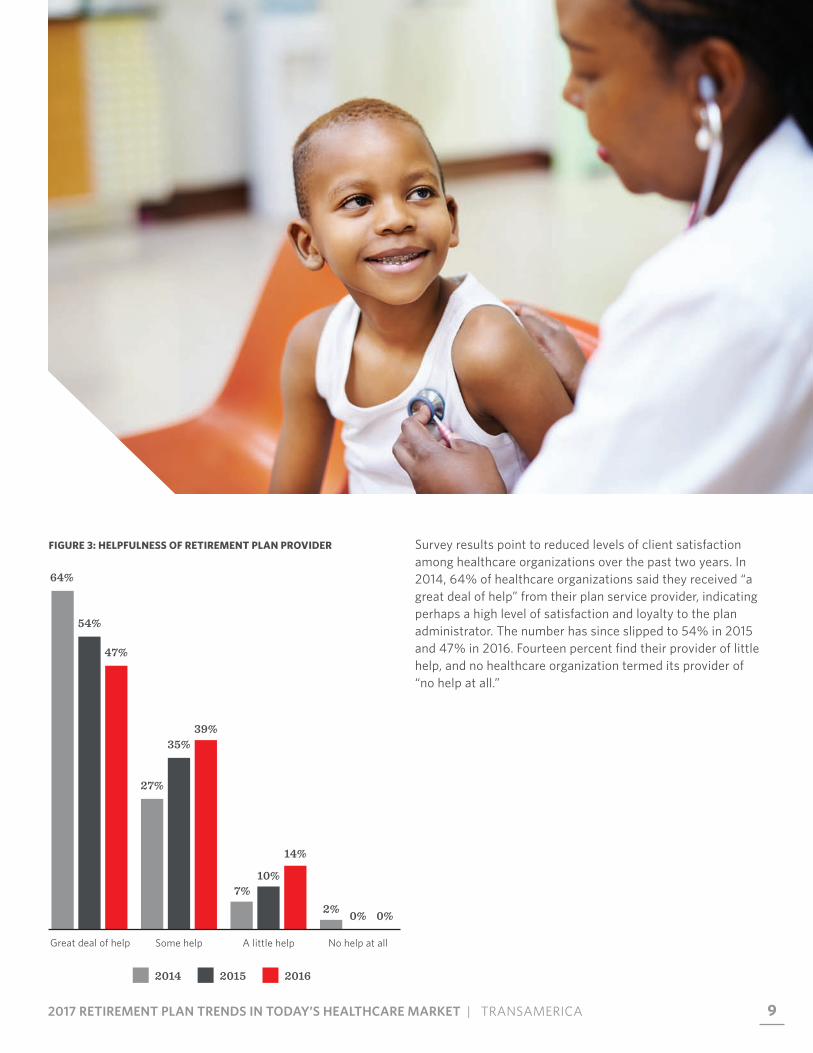
Survey results point to reduced levels of client satisfaction among healthcare organizations over the past two years. In 2014, 64% of healthcare organizations said they received “a great deal of help” from their plan service provider, indicating perhaps a high level of satisfaction and loyalty to the plan administrator. The number has since slipped to 54% in 2015 and 47% in 2016. Fourteen percent find their provider of little help, and no healthcare organization termed its provider of “no help at all.”
FIGURE 3: HELPFULNESS OF RETIREMENT PLAN PROVIDER
Great deal of help
64%
54%
47%
Some help
39%35%
27%
A little help
7%10%
14%
No help at all
2% 0% 0%
2014 2015 2016
10
FIGURE 4: FACTORS PREVENTING EMPLOYEES FROM
RETIREMENT PLAN SAVING
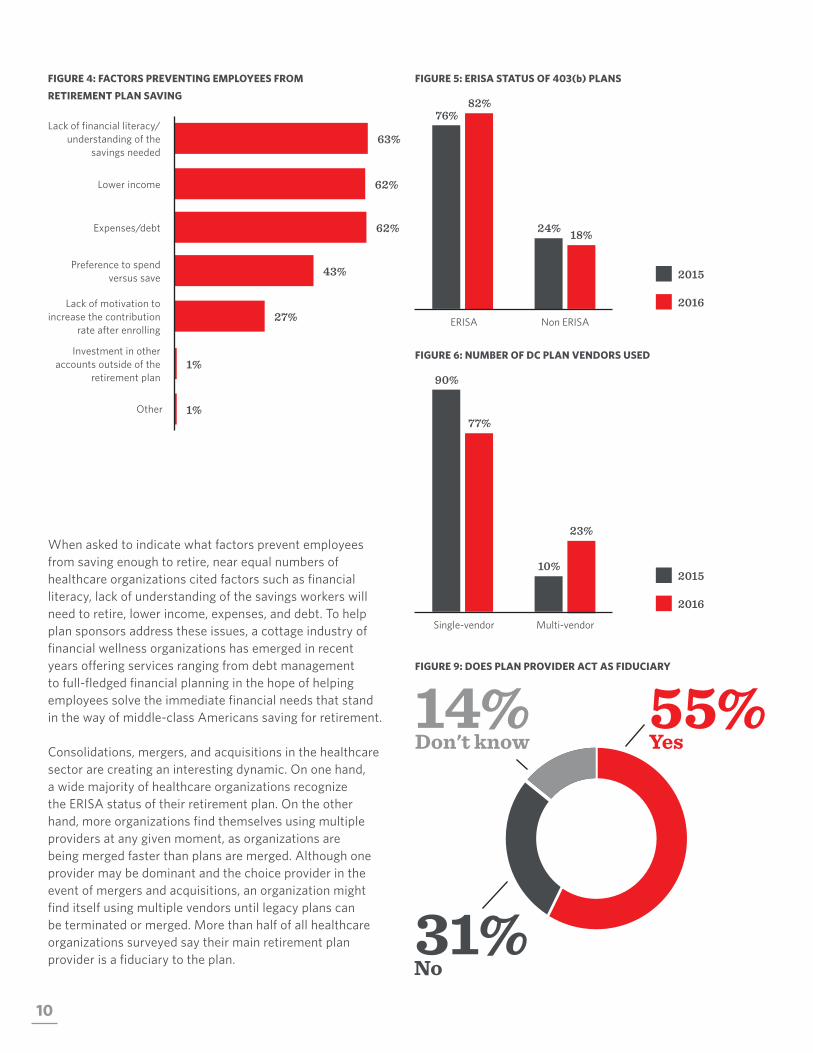
When asked to indicate what factors prevent employees from saving enough to retire, near equal numbers of healthcare organizations cited factors such as financial literacy, lack of understanding of the savings workers will need to retire, lower income, expenses, and debt. To help plan sponsors address these issues, a cottage industry of financial wellness organizations has emerged in recent years offering services ranging from debt management to full-fledged financial planning in the hope of helping employees solve the immediate financial needs that stand in the way of middle-class Americans saving for retirement.
Consolidations, mergers, and acquisitions in the healthcare sector are creating an interesting dynamic. On one hand, a wide majority of healthcare organizations recognize the ERISA status of their retirement plan. On the other hand, more organizations find themselves using multiple providers at any given moment, as organizations are being merged faster than plans are merged. Although one provider may be dominant and the choice provider in the event of mergers and acquisitions, an organization might find itself using multiple vendors until legacy plans can be terminated or merged. More than half of all healthcare organizations surveyed say their main retirement plan provider is a fiduciary to the plan.
FIGURE 5: ERISA STATUS OF 403(b) PLANS
FIGURE 6: NUMBER OF DC PLAN VENDORS USED
FIGURE 9: DOES PLAN PROVIDER ACT AS FIDUCIARY
63%Lack of financial literacy/
understanding of the savings needed
62%Lower income
62%Expenses/debt
43%Preference to spend versus save
27%Lack of motivation to
increase the contribution rate after enrolling
Other 1%
Investment in other accounts outside of the
retirement plan1%
ERISA Non ERISA
82% 76%
2016
18% 24%
2015
Single-vendor Multi-vendor
77%
90%
23%
10%
55%Yes
31%No
14%Don't know
2016
2015

112017 RETIREMENT PLAN TRENDS IN TODAY’S HEALTHCARE MARKET | TRANSAMERICA
THE FIRST STEP IS YOUR GREATEST STEP.
112017 RETIREMENT PLAN TRENDS IN TODAY’S HEALTHCARE MARKET | TRANSAMERICA
12
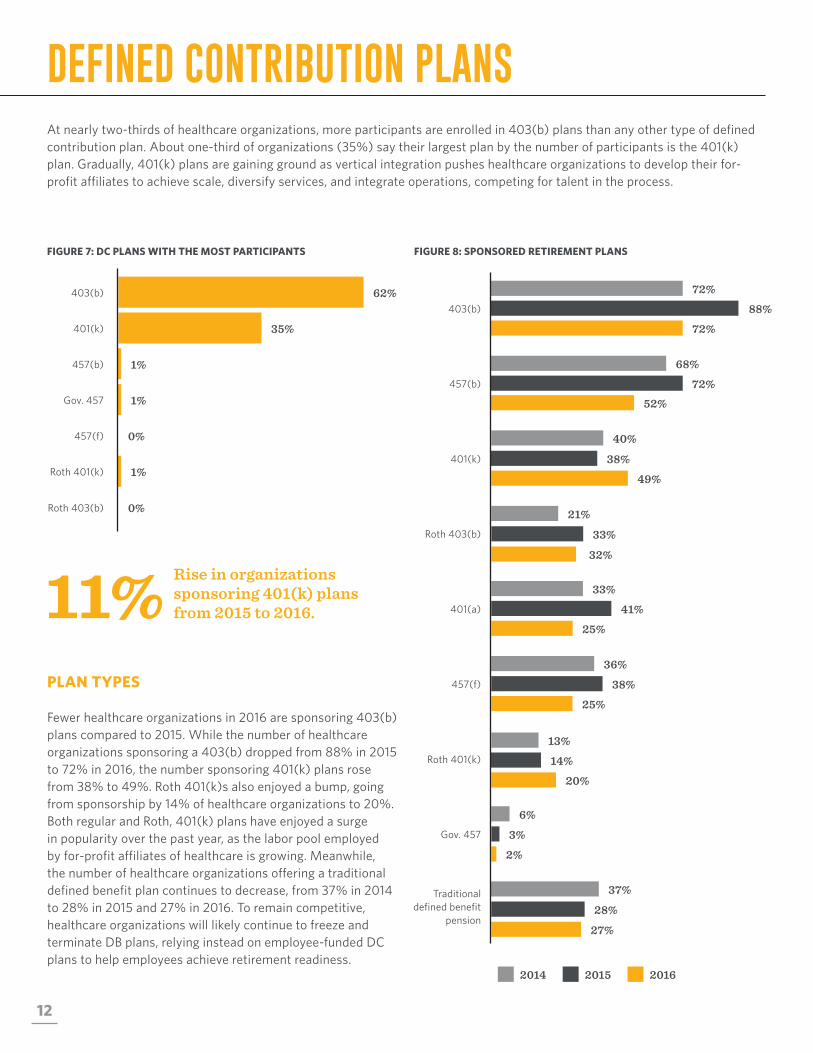
DEFINED CONTRIBUTION PLANSAt nearly two-thirds of healthcare organizations, more participants are enrolled in 403(b) plans than any other type of defined contribution plan. About one-third of organizations (35%) say their largest plan by the number of participants is the 401(k) plan. Gradually, 401(k) plans are gaining ground as vertical integration pushes healthcare organizations to develop their for-profit affiliates to achieve scale, diversify services, and integrate operations, competing for talent in the process.
FIGURE 7: DC PLANS WITH THE MOST PARTICIPANTS FIGURE 8: SPONSORED RETIREMENT PLANS
PLAN TYPES
Fewer healthcare organizations in 2016 are sponsoring 403(b) plans compared to 2015. While the number of healthcare organizations sponsoring a 403(b) dropped from 88% in 2015 to 72% in 2016, the number sponsoring 401(k) plans rose from 38% to 49%. Roth 401(k)s also enjoyed a bump, going from sponsorship by 14% of healthcare organizations to 20%. Both regular and Roth, 401(k) plans have enjoyed a surge in popularity over the past year, as the labor pool employed by for-profit affiliates of healthcare is growing. Meanwhile, the number of healthcare organizations offering a traditional defined benefit plan continues to decrease, from 37% in 2014 to 28% in 2015 and 27% in 2016. To remain competitive, healthcare organizations will likely continue to freeze and terminate DB plans, relying instead on employee-funded DC plans to help employees achieve retirement readiness.
11% Rise in organizations sponsoring 401(k) plans from 2015 to 2016.
62%
35%
1%
1%
403(b)
401(k)
457(b)
Gov. 457
0%
1%
457(f)
Roth 401(k)
0%Roth 403(b)
2014 2015 2016
457(b)
68%
72%52%
401(k)
40%
38%
49%
Roth 403(b)
21%
33%
32%
401(a)
33%
41%
25%
Roth 401(k)
13%
14%
20%
Gov. 457
6%
3%
2%
Traditional defined benefit
pension
37%
28%
27%
403(b)
72%
72%
88%
457(f)
25%
36%
38%
132017 RETIREMENT PLAN TRENDS IN TODAY’S HEALTHCARE MARKET | TRANSAMERICA
EMPLOYER CONTRIBUTIONS
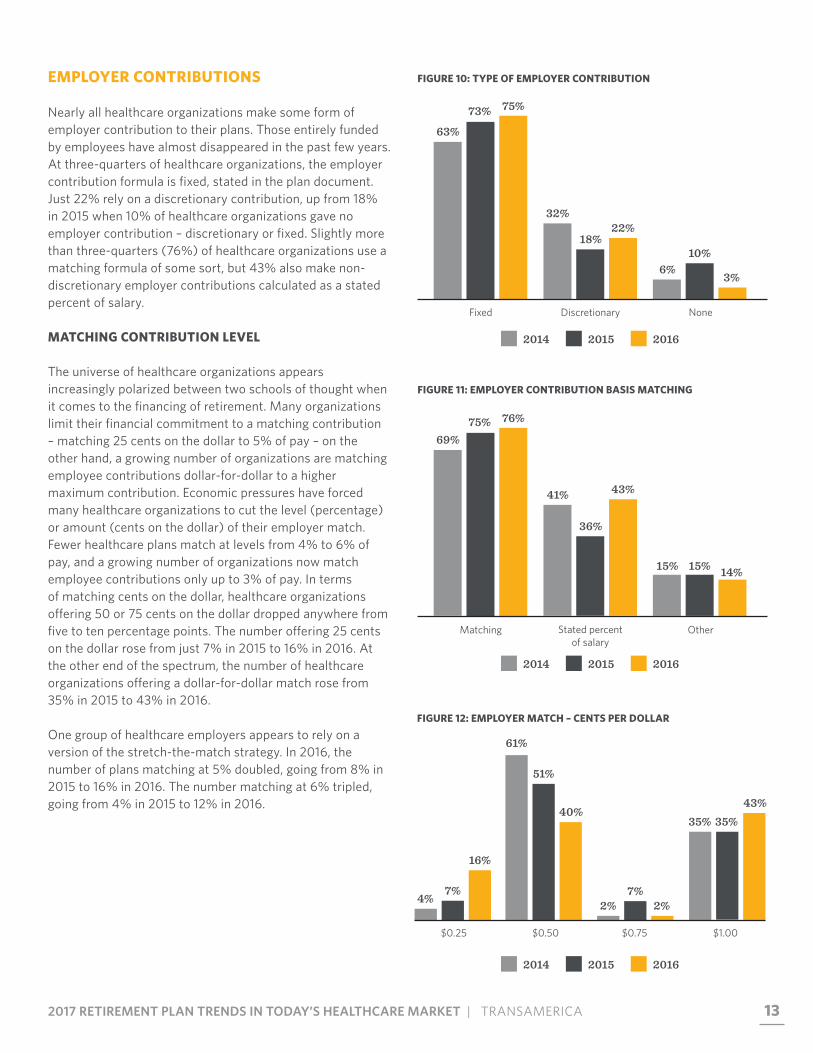
Nearly all healthcare organizations make some form of employer contribution to their plans. Those entirely funded by employees have almost disappeared in the past few years. At three-quarters of healthcare organizations, the employer contribution formula is fixed, stated in the plan document. Just 22% rely on a discretionary contribution, up from 18% in 2015 when 10% of healthcare organizations gave no employer contribution – discretionary or fixed. Slightly more than three-quarters (76%) of healthcare organizations use a matching formula of some sort, but 43% also make non-discretionary employer contributions calculated as a stated percent of salary.
MATCHING CONTRIBUTION LEVEL
The universe of healthcare organizations appears increasingly polarized between two schools of thought when it comes to the financing of retirement. Many organizations limit their financial commitment to a matching contribution – matching 25 cents on the dollar to 5% of pay – on the other hand, a growing number of organizations are matching employee contributions dollar-for-dollar to a higher maximum contribution. Economic pressures have forced many healthcare organizations to cut the level (percentage) or amount (cents on the dollar) of their employer match. Fewer healthcare plans match at levels from 4% to 6% of pay, and a growing number of organizations now match employee contributions only up to 3% of pay. In terms of matching cents on the dollar, healthcare organizations offering 50 or 75 cents on the dollar dropped anywhere from five to ten percentage points. The number offering 25 cents on the dollar rose from just 7% in 2015 to 16% in 2016. At the other end of the spectrum, the number of healthcare organizations offering a dollar-for-dollar match rose from 35% in 2015 to 43% in 2016.
One group of healthcare employers appears to rely on a version of the stretch-the-match strategy. In 2016, the number of plans matching at 5% doubled, going from 8% in 2015 to 16% in 2016. The number matching at 6% tripled, going from 4% in 2015 to 12% in 2016.
FIGURE 10: TYPE OF EMPLOYER CONTRIBUTION
FIGURE 11: EMPLOYER CONTRIBUTION BASIS MATCHING
FIGURE 12: EMPLOYER MATCH – CENTS PER DOLLAR
Fixed Discretionary None
75% 73%
63%
22% 18%
32%
3%
10% 6%
Matching Stated percent of salary
Other
76% 75% 69%
43%
36%
41%
14% 15% 15%
$0.25 $0.50 $0.75 $1.00
4% 7%
16%
35% 35% 43%
51%
40%
61%
2% 7%
2%
2014 2015 2016
2014 2015 2016
2014 2015 2016
14
FIGURE 13: EMPLOYER MATCH – PERCENT OF PAY
FIGURE 14: EMPLOYER CONTRIBUTION AS A PERCENT OF SALARY
3%
17%
18%
21%
2%
4%
5%
6%
6%14%
2%
17%
0%3%
25%
37%
33%
2016
13%
12%
19%
28%
19%
18%
More than 6%
2014
2015
3%
14%31%
22%
2%
10%12%
11%
4%
22%
19%
27%
5%
16%
8%
16%
6%
3%4%
12%
3%
0%
1%
7% +
2016
2014
2015
14
152017 RETIREMENT PLAN TRENDS IN TODAY’S HEALTHCARE MARKET | TRANSAMERICA
DEFINED CONTRIBUTION PLAN ADMINISTRATION, FEES, AND EXPENSES
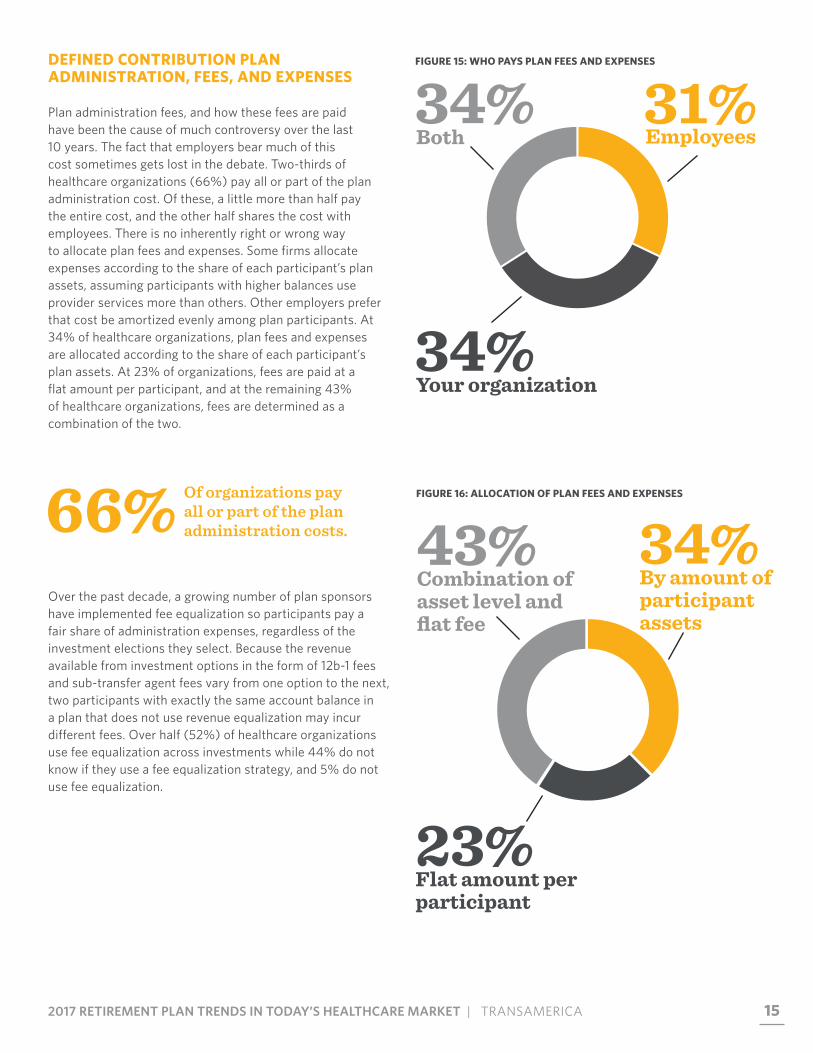
Plan administration fees, and how these fees are paid have been the cause of much controversy over the last 10 years. The fact that employers bear much of this cost sometimes gets lost in the debate. Two-thirds of healthcare organizations (66%) pay all or part of the plan administration cost. Of these, a little more than half pay the entire cost, and the other half shares the cost with employees. There is no inherently right or wrong way to allocate plan fees and expenses. Some firms allocate expenses according to the share of each participant’s plan assets, assuming participants with higher balances use provider services more than others. Other employers prefer that cost be amortized evenly among plan participants. At 34% of healthcare organizations, plan fees and expenses are allocated according to the share of each participant’s plan assets. At 23% of organizations, fees are paid at a flat amount per participant, and at the remaining 43% of healthcare organizations, fees are determined as a combination of the two.
Over the past decade, a growing number of plan sponsors have implemented fee equalization so participants pay a fair share of administration expenses, regardless of the investment elections they select. Because the revenue available from investment options in the form of 12b-1 fees and sub-transfer agent fees vary from one option to the next, two participants with exactly the same account balance in a plan that does not use revenue equalization may incur different fees. Over half (52%) of healthcare organizations use fee equalization across investments while 44% do not know if they use a fee equalization strategy, and 5% do not use fee equalization.
FIGURE 15: WHO PAYS PLAN FEES AND EXPENSES
66% Of organizations pay all or part of the plan administration costs.
31%EmployeesBoth
34%
Your organization34%
FIGURE 16: ALLOCATION OF PLAN FEES AND EXPENSES
43%Combination of asset level and flat fee
34%By amount of participant assets
23%Flat amount per participant
16
RETIREMENT PLANNING SERVICES
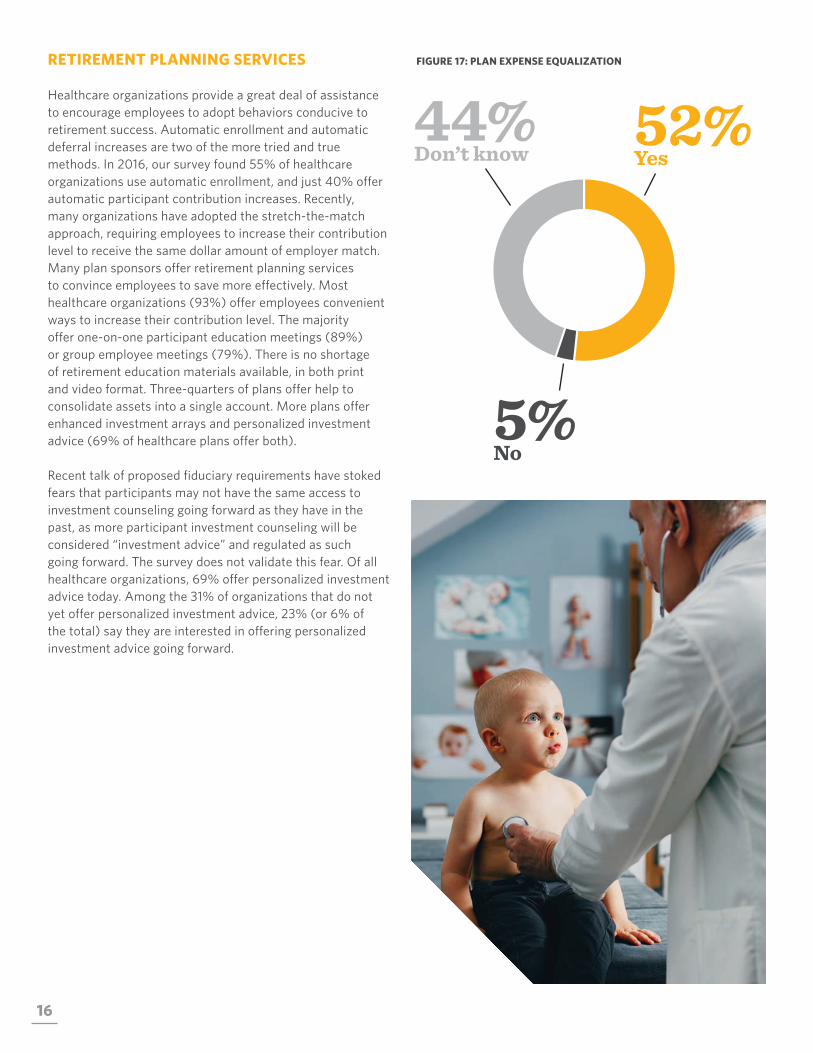
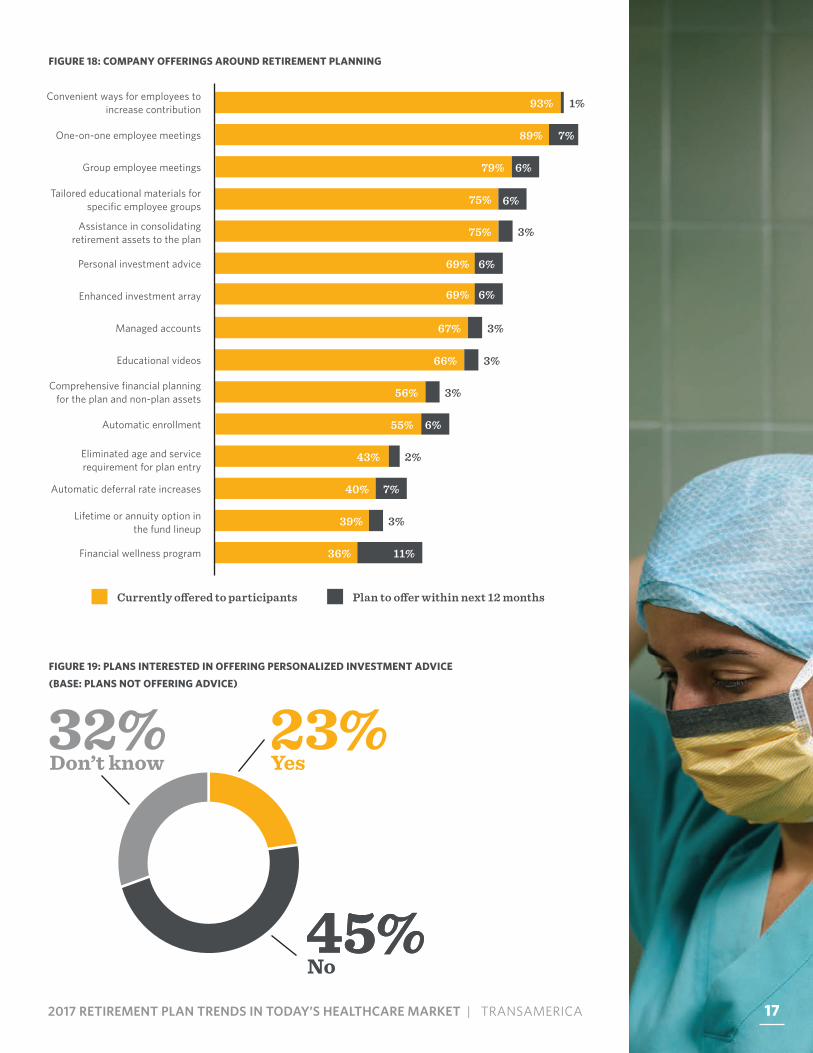
Healthcare organizations provide a great deal of assistance to encourage employees to adopt behaviors conducive to retirement success. Automatic enrollment and automatic deferral increases are two of the more tried and true methods. In 2016, our survey found 55% of healthcare organizations use automatic enrollment, and just 40% offer automatic participant contribution increases. Recently, many organizations have adopted the stretch-the-match approach, requiring employees to increase their contribution level to receive the same dollar amount of employer match. Many plan sponsors offer retirement planning services to convince employees to save more effectively. Most healthcare organizations (93%) offer employees convenient ways to increase their contribution level. The majority offer one-on-one participant education meetings (89%) or group employee meetings (79%). There is no shortage of retirement education materials available, in both print and video format. Three-quarters of plans offer help to consolidate assets into a single account. More plans offer enhanced investment arrays and personalized investment advice (69% of healthcare plans offer both).
Recent talk of proposed fiduciary requirements have stoked fears that participants may not have the same access to investment counseling going forward as they have in the past, as more participant investment counseling will be considered “investment advice” and regulated as such going forward. The survey does not validate this fear. Of all healthcare organizations, 69% offer personalized investment advice today. Among the 31% of organizations that do not yet offer personalized investment advice, 23% (or 6% of the total) say they are interested in offering personalized investment advice going forward.
FIGURE 17: PLAN EXPENSE EQUALIZATION
52%44%
5%
YesDon’t know
No
172017 RETIREMENT PLAN TRENDS IN TODAY’S HEALTHCARE MARKET | TRANSAMERICA
Currently o�ered to participants Plan to o�er within next 12 months
FIGURE 18: COMPANY OFFERINGS AROUND RETIREMENT PLANNING
FIGURE 19: PLANS INTERESTED IN OFFERING PERSONALIZED INVESTMENT ADVICE
(BASE: PLANS NOT OFFERING ADVICE)
Group employee meetings 79% 6%
Tailored educational materials for specific employee groups 75% 6%
Assistance in consolidating retirement assets to the plan
75% 3%
Personal investment advice 69% 6%
Enhanced investment array
Managed accounts 67%
Educational videos 66%
Comprehensive financial planning for the plan and non-plan assets 56%
Automatic enrollment 55%
Eliminated age and service requirement for plan entry
43%
Automatic deferral rate increases 40% 7%
Lifetime or annuity option in the fund lineup
39%
Financial wellness program 36% 11%
Convenient ways for employees to increase contribution 93% 1%
One-on-one employee meetings 89% 7%
69% 6%
3%
3%
3%
6%
3%
2%
45%
32%Don’t know
45%No
23%Yes
17
18
2016 55%
40%
AUTOMATIC FEATURES
AUTOMATIC ENROLLMENT AND AUTOMATIC ESCALATION
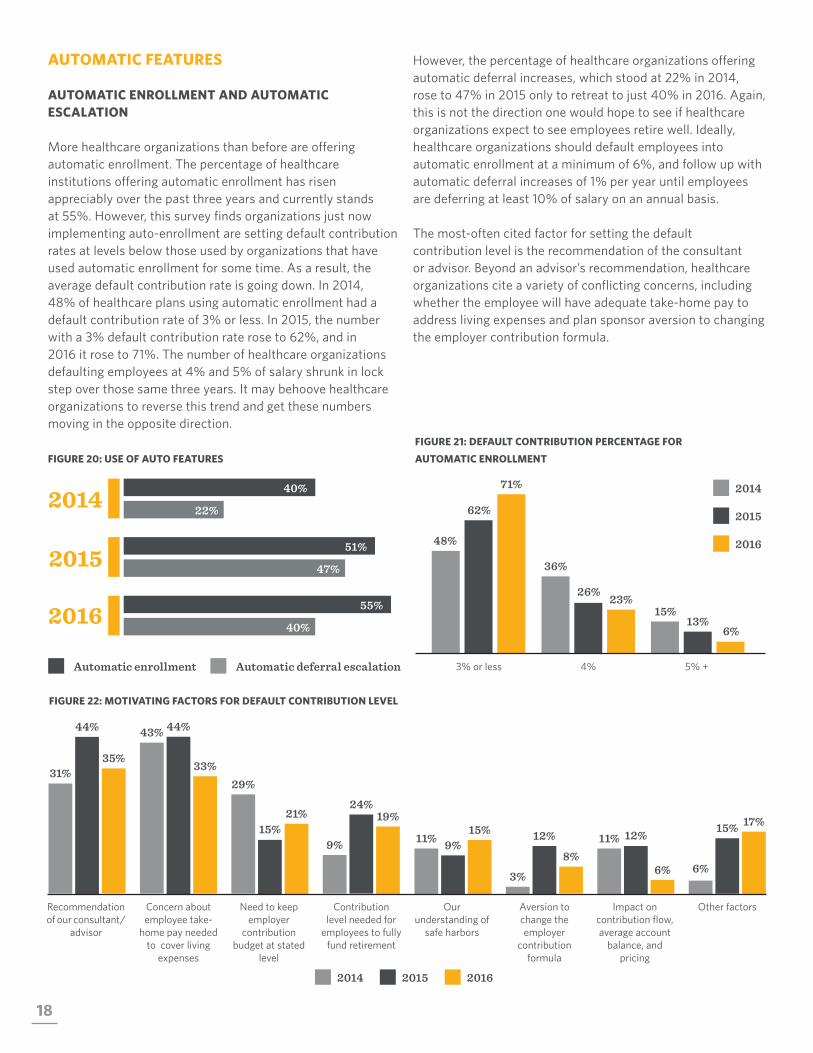
More healthcare organizations than before are offering automatic enrollment. The percentage of healthcare institutions offering automatic enrollment has risen appreciably over the past three years and currently stands at 55%. However, this survey finds organizations just now implementing auto-enrollment are setting default contribution rates at levels below those used by organizations that have used automatic enrollment for some time. As a result, the average default contribution rate is going down. In 2014, 48% of healthcare plans using automatic enrollment had a default contribution rate of 3% or less. In 2015, the number with a 3% default contribution rate rose to 62%, and in 2016 it rose to 71%. The number of healthcare organizations defaulting employees at 4% and 5% of salary shrunk in lock step over those same three years. It may behoove healthcare organizations to reverse this trend and get these numbers moving in the opposite direction.
However, the percentage of healthcare organizations offering automatic deferral increases, which stood at 22% in 2014, rose to 47% in 2015 only to retreat to just 40% in 2016. Again, this is not the direction one would hope to see if healthcare organizations expect to see employees retire well. Ideally, healthcare organizations should default employees into automatic enrollment at a minimum of 6%, and follow up with automatic deferral increases of 1% per year until employees are deferring at least 10% of salary on an annual basis.
The most-often cited factor for setting the default contribution level is the recommendation of the consultant or advisor. Beyond an advisor’s recommendation, healthcare organizations cite a variety of conflicting concerns, including whether the employee will have adequate take-home pay to address living expenses and plan sponsor aversion to changing the employer contribution formula.
FIGURE 20: USE OF AUTO FEATURES
FIGURE 21: DEFAULT CONTRIBUTION PERCENTAGE FOR
AUTOMATIC ENROLLMENT
FIGURE 22: MOTIVATING FACTORS FOR DEFAULT CONTRIBUTION LEVEL
201551%
47%
2014 40%
22%
Automatic enrollment Automatic deferral escalation 3% or less 4% 5% +
71%
62%
48%
23% 26%
36%
6% 13%
15%
Our understanding of
safe harbors
Aversion to change the employer
contribution formula
Impact on contribution flow, average account
balance, and pricing
Other factors
11% 9% 15%
6%
15% 17% 12%
8%
3%
11% 12%
6%
Recommendation of our consultant/
advisor
Concern about employee take-
home pay needed to cover living
expenses
Need to keep employer
contribution budget at stated
level
Contribution level needed for
employees to fully fund retirement
31%
44%
35%
9%
24% 19%
44%
33%
43%
29%
15% 21%
2014 2015 2016
2016
2014
2015
192017 RETIREMENT PLAN TRENDS IN TODAY’S HEALTHCARE MARKET | TRANSAMERICA
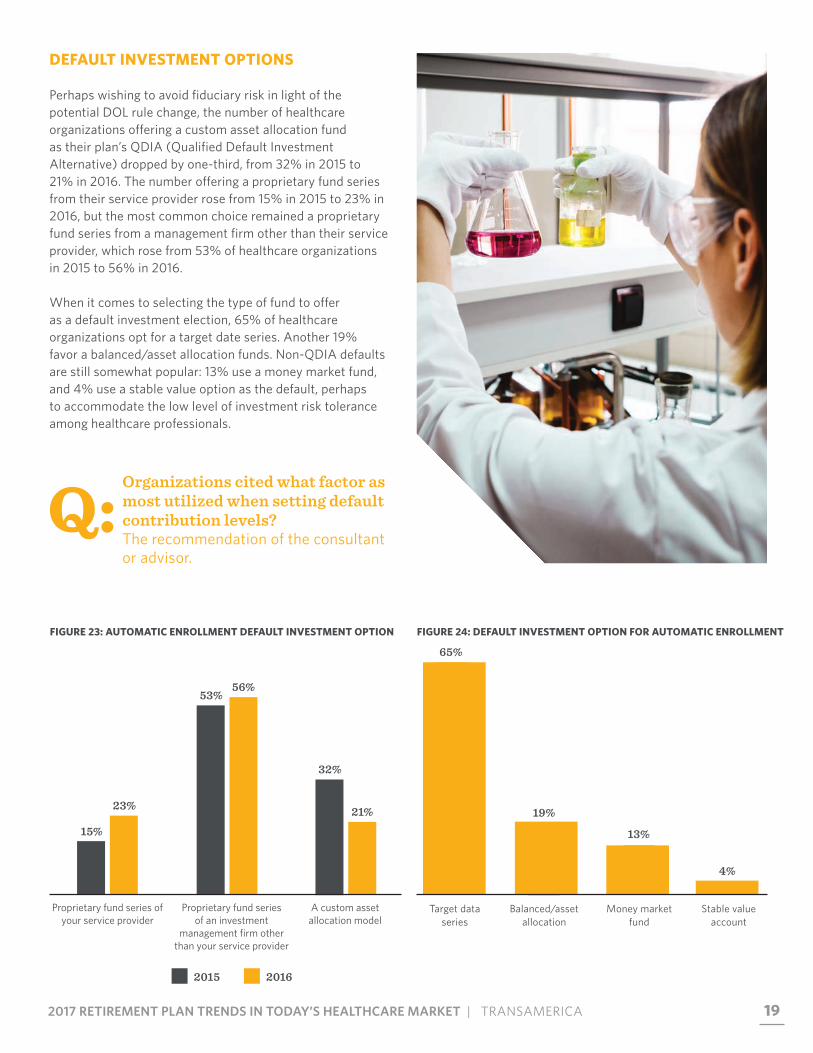
DEFAULT INVESTMENT OPTIONS
Perhaps wishing to avoid fiduciary risk in light of the potential DOL rule change, the number of healthcare organizations offering a custom asset allocation fund as their plan’s QDIA (Qualified Default Investment Alternative) dropped by one-third, from 32% in 2015 to 21% in 2016. The number offering a proprietary fund series from their service provider rose from 15% in 2015 to 23% in 2016, but the most common choice remained a proprietary fund series from a management firm other than their service provider, which rose from 53% of healthcare organizations in 2015 to 56% in 2016.
When it comes to selecting the type of fund to offer as a default investment election, 65% of healthcare organizations opt for a target date series. Another 19% favor a balanced/asset allocation funds. Non-QDIA defaults are still somewhat popular: 13% use a money market fund, and 4% use a stable value option as the default, perhaps to accommodate the low level of investment risk tolerance among healthcare professionals.
FIGURE 23: AUTOMATIC ENROLLMENT DEFAULT INVESTMENT OPTION FIGURE 24: DEFAULT INVESTMENT OPTION FOR AUTOMATIC ENROLLMENT
Q:Organizations cited what factor as most utilized when setting default contribution levels?The recommendation of the consultant or advisor.
2015 2016
Proprietary fund series of your service provider
23%
15%
Proprietary fund series of an investment
management firm other than your service provider
56% 53%
21%
32%
A custom asset allocation model
65%
Target data series
19%
Balanced/asset allocation
4%
Stable value account
13%
Money market fund
20
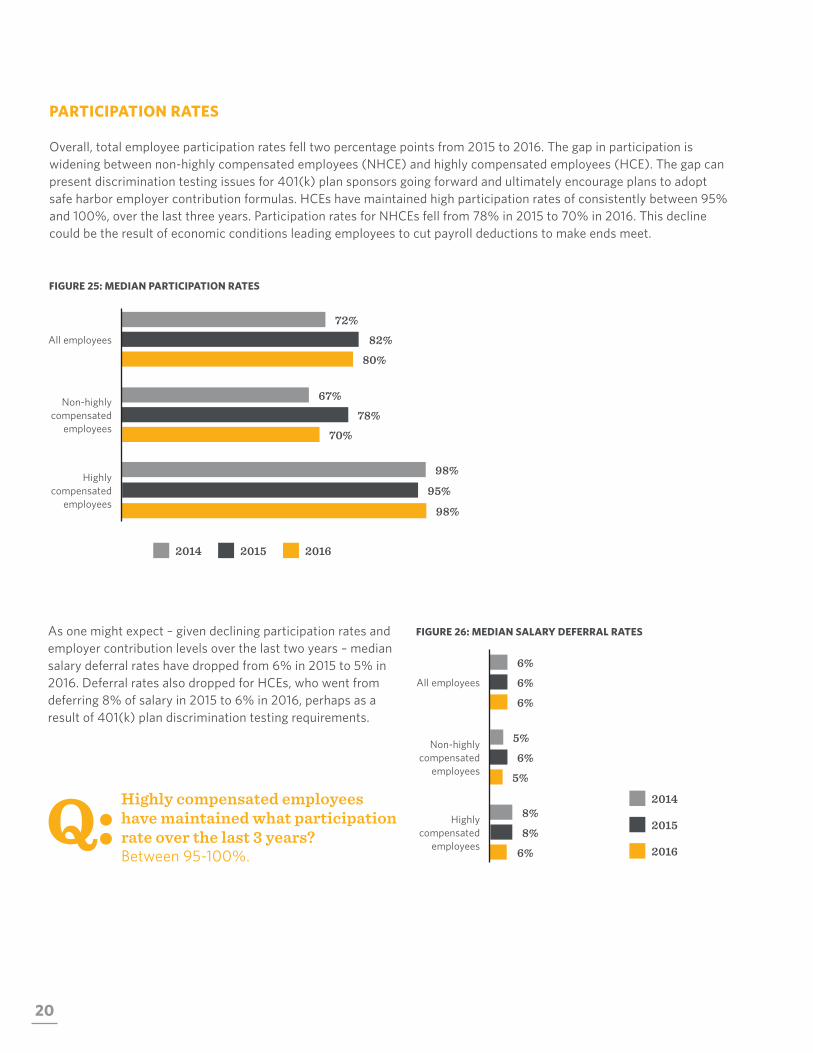
PARTICIPATION RATES
Overall, total employee participation rates fell two percentage points from 2015 to 2016. The gap in participation is widening between non-highly compensated employees (NHCE) and highly compensated employees (HCE). The gap can present discrimination testing issues for 401(k) plan sponsors going forward and ultimately encourage plans to adopt safe harbor employer contribution formulas. HCEs have maintained high participation rates of consistently between 95% and 100%, over the last three years. Participation rates for NHCEs fell from 78% in 2015 to 70% in 2016. This decline could be the result of economic conditions leading employees to cut payroll deductions to make ends meet.
FIGURE 25: MEDIAN PARTICIPATION RATES
Non-highly compensated
employees
67%
78%
70%
Highly compensated
employees
98%
95%
98%
All employees
80%
72%
82%
2014 2015 2016
Highly compensated employees have maintained what participation rate over the last 3 years?Between 95-100%.
FIGURE 26: MEDIAN SALARY DEFERRAL RATES
Non-highly compensated
employees 5%
6%
5%
Highly compensated
employees 6%
8%
8%
All employees
6%
6%
6%
As one might expect – given declining participation rates and employer contribution levels over the last two years – median salary deferral rates have dropped from 6% in 2015 to 5% in 2016. Deferral rates also dropped for HCEs, who went from deferring 8% of salary in 2015 to 6% in 2016, perhaps as a result of 401(k) plan discrimination testing requirements.
2016
2014
2015

212017 RETIREMENT PLAN TRENDS IN TODAY’S HEALTHCARE MARKET | TRANSAMERICA
YOU PLAN FOR THEIR HEALTH CARE. PLAN FOR THEIR WEALTH CARE.
212017 RETIREMENT PLAN TRENDS IN TODAY’S HEALTHCARE MARKET | TRANSAMERICA
22
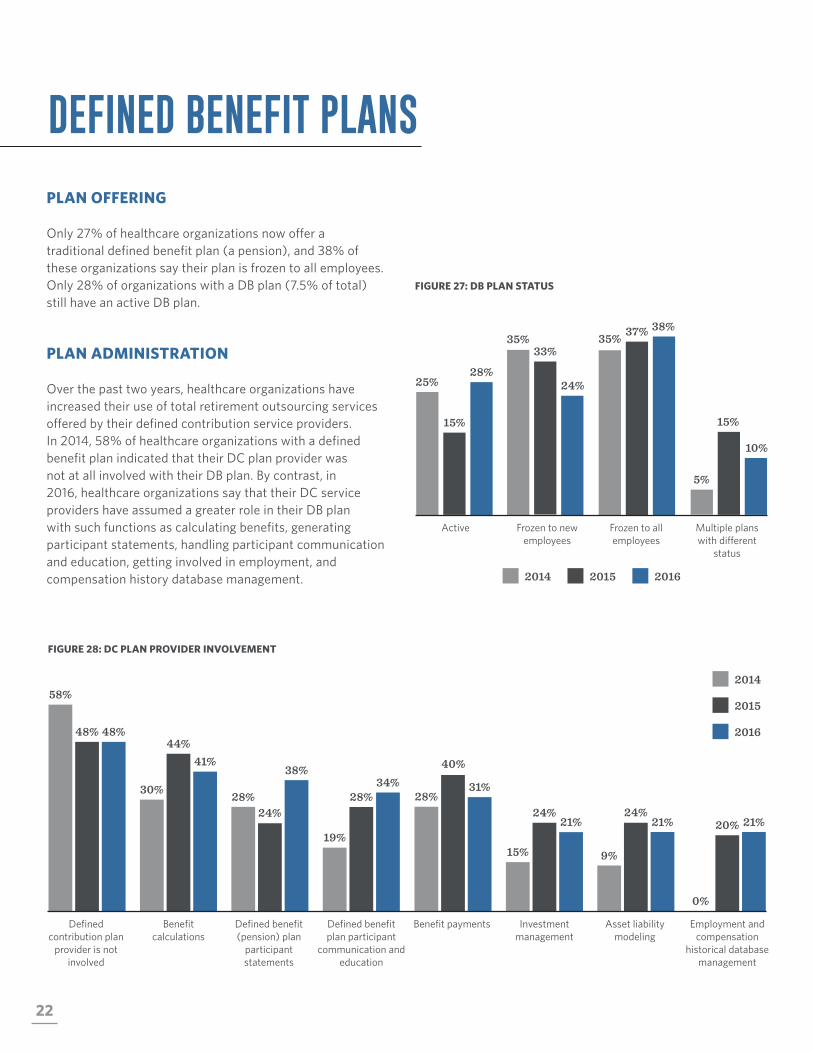
PLAN OFFERING
Only 27% of healthcare organizations now offer a traditional defined benefit plan (a pension), and 38% of these organizations say their plan is frozen to all employees. Only 28% of organizations with a DB plan (7.5% of total) still have an active DB plan.
PLAN ADMINISTRATION
Over the past two years, healthcare organizations have increased their use of total retirement outsourcing services offered by their defined contribution service providers. In 2014, 58% of healthcare organizations with a defined benefit plan indicated that their DC plan provider was not at all involved with their DB plan. By contrast, in 2016, healthcare organizations say that their DC service providers have assumed a greater role in their DB plan with such functions as calculating benefits, generating participant statements, handling participant communication and education, getting involved in employment, and compensation history database management.
FIGURE 27: DB PLAN STATUS
DEFINED BENEFIT PLANS
FIGURE 28: DC PLAN PROVIDER INVOLVEMENT
Active Frozen to new employees
Frozen to all employees
Multiple plans with different
status
25%
15%
28%
5%
15%
10%
33%
24%
35% 35% 37% 38%
2014 2015 2016
Benefit payments Investment management
Asset liability modeling
Employment and compensation
historical database management
28%
40%
31%
0%
20% 21% 24%
21%
15% 9%
24% 21%
Defined contribution plan
provider is not involved
Benefit calculations
Defined benefit (pension) plan
participant statements
Defined benefit plan participant
communication and education
58%
48% 48%
19%
28% 34%
44% 41%
30% 28% 24%
38%
2016
2014
2015
232017 RETIREMENT PLAN TRENDS IN TODAY’S HEALTHCARE MARKET | TRANSAMERICA
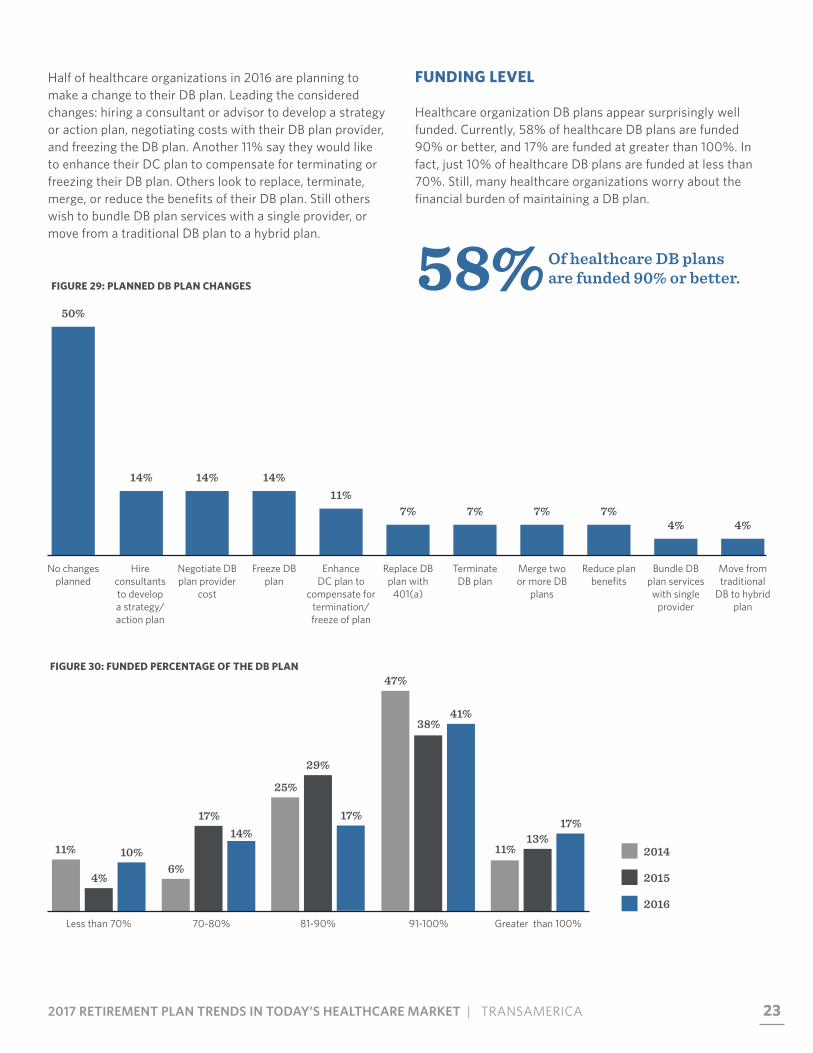
Half of healthcare organizations in 2016 are planning to make a change to their DB plan. Leading the considered changes: hiring a consultant or advisor to develop a strategy or action plan, negotiating costs with their DB plan provider, and freezing the DB plan. Another 11% say they would like to enhance their DC plan to compensate for terminating or freezing their DB plan. Others look to replace, terminate, merge, or reduce the benefits of their DB plan. Still others wish to bundle DB plan services with a single provider, or move from a traditional DB plan to a hybrid plan.
58% Of healthcare DB plans are funded 90% or better.FIGURE 29: PLANNED DB PLAN CHANGES
FUNDING LEVEL
Healthcare organization DB plans appear surprisingly well funded. Currently, 58% of healthcare DB plans are funded 90% or better, and 17% are funded at greater than 100%. In fact, just 10% of healthcare DB plans are funded at less than 70%. Still, many healthcare organizations worry about the financial burden of maintaining a DB plan.
FIGURE 30: FUNDED PERCENTAGE OF THE DB PLAN
Less than 70% 70-80% 91-100%81-90% Greater than 100%
10%
4%
11% 14%
17%
6%
41% 38%
47%
17%
29%
25%
17% 13%
11%
50%
No changes planned
14%
Hire consultants to develop a strategy/ action plan
14%
Negotiate DB plan provider
cost
14%
Freeze DB plan
11%
Enhance DC plan to
compensate for termination/ freeze of plan
7%
Replace DB plan with
401(a)
7%
Terminate DB plan
7%
Merge two or more DB
plans
7%
Reduce plan benefits
4%
Bundle DB plan services with single
provider
4%
Move from traditional
DB to hybrid plan
2016
2014
2015

24
Bundling all defined benefit plan services with a single provider is sometimes a precursor to plan termination. As more bundled plans are terminated, fewer of the remaining plans are bundled. The percent of defined benefit plans using multiple defined benefit plan service providers (e.g., actuarial services, benefit payments) is up eight percentage points from 2015 among healthcare organizations. There has been a seven-percentage-point drop (41% in 2016 vs. 48% in 2015) in the percentage of healthcare organizations using a semi-unbundled approach and a single-percentage-point drop in the number using a fully-bundled approach.
FIGURE 31: BUNDLING OF THE DB PLAN
41%
30%
38%
Unbundled: We use distinct, unaffiliated providers for each defined benefit service that is not
performed internally.
41%
48%
35%
Semi-bundled: We purchase some defined benefits services as part of a package from a
single company and retain separate companies for remaining services or perform them internally.
24%22% 21%
Fully-bundled: We purchase all defined benefit services as part of a package from a single
provider, including the management of at least 25% of the plan’s assets.
252017 RETIREMENT PLAN TRENDS IN TODAY’S HEALTHCARE MARKET | TRANSAMERICA
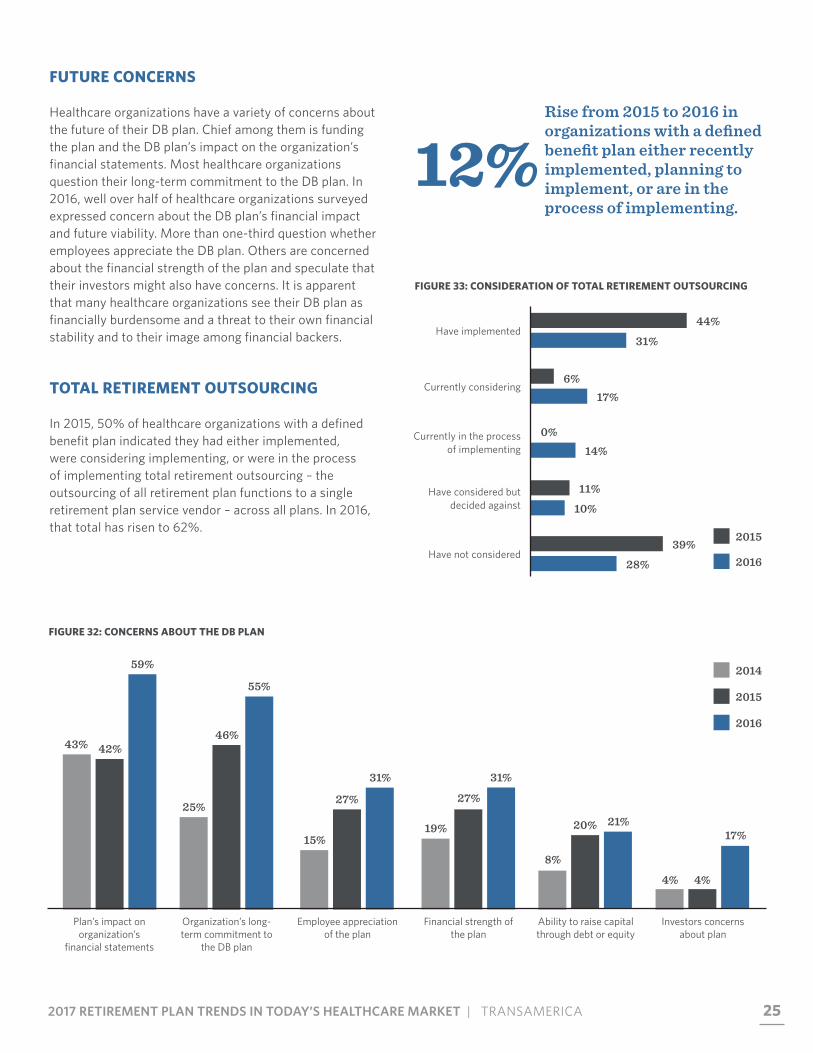
12%Rise from 2015 to 2016 in organizations with a defined benefit plan either recently implemented, planning to implement, or are in the process of implementing.
FIGURE 32: CONCERNS ABOUT THE DB PLAN
FUTURE CONCERNS
Healthcare organizations have a variety of concerns about the future of their DB plan. Chief among them is funding the plan and the DB plan’s impact on the organization’s financial statements. Most healthcare organizations question their long-term commitment to the DB plan. In 2016, well over half of healthcare organizations surveyed expressed concern about the DB plan’s financial impact and future viability. More than one-third question whether employees appreciate the DB plan. Others are concerned about the financial strength of the plan and speculate that their investors might also have concerns. It is apparent that many healthcare organizations see their DB plan as financially burdensome and a threat to their own financial stability and to their image among financial backers.
TOTAL RETIREMENT OUTSOURCING
In 2015, 50% of healthcare organizations with a defined benefit plan indicated they had either implemented, were considering implementing, or were in the process of implementing total retirement outsourcing – the outsourcing of all retirement plan functions to a single retirement plan service vendor – across all plans. In 2016, that total has risen to 62%.
FIGURE 33: CONSIDERATION OF TOTAL RETIREMENT OUTSOURCING
Have implemented44%
31%
Currently in the process of implementing
0%14%
Have considered but decided against
11%
10%
Have not considered39%
28%
2015
2016
Currently considering6%
17%
Plan’s impact on organization’s
financial statements
59%
42% 43%
Organization’s long-term commitment to
the DB plan
55%
46%
25%
Financial strength of the plan
31%
27%
19%
Employee appreciation of the plan
31%
27%
15%
Ability to raise capital through debt or equity
21% 20%
8%
Investors concerns about plan
17%
4% 4%
2016
2014
2015
26
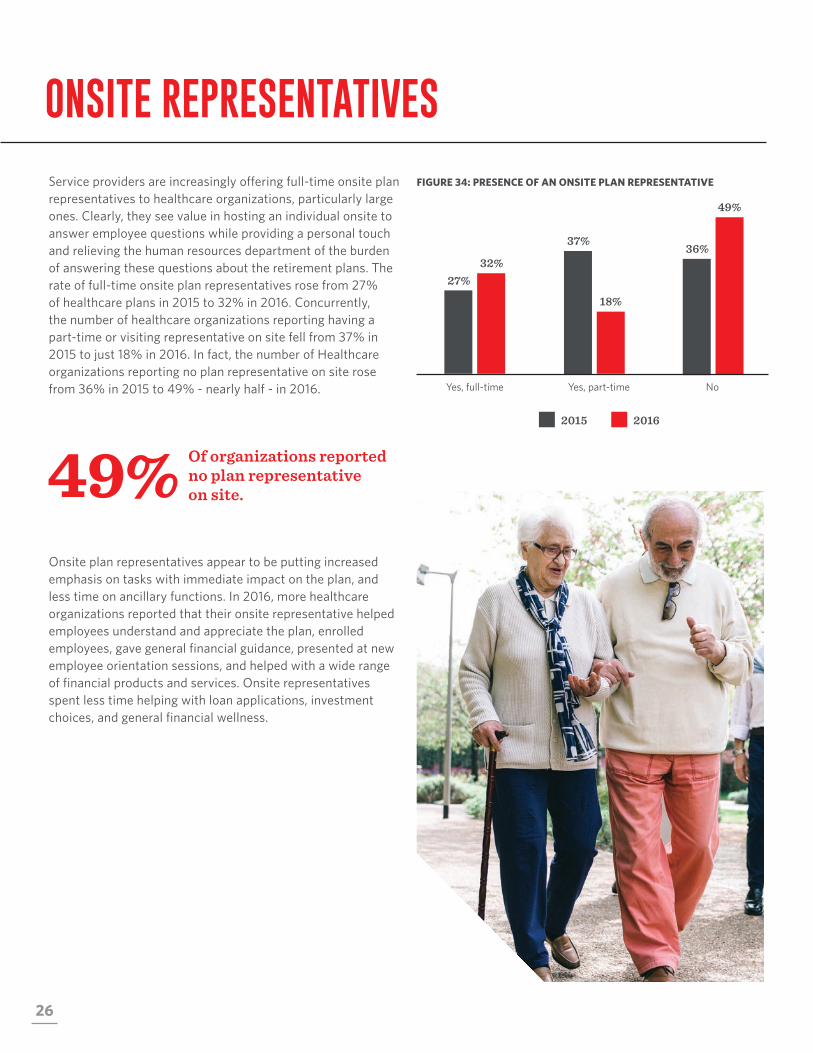
Service providers are increasingly offering full-time onsite plan representatives to healthcare organizations, particularly large ones. Clearly, they see value in hosting an individual onsite to answer employee questions while providing a personal touch and relieving the human resources department of the burden of answering these questions about the retirement plans. The rate of full-time onsite plan representatives rose from 27% of healthcare plans in 2015 to 32% in 2016. Concurrently, the number of healthcare organizations reporting having a part-time or visiting representative on site fell from 37% in 2015 to just 18% in 2016. In fact, the number of Healthcare organizations reporting no plan representative on site rose from 36% in 2015 to 49% - nearly half - in 2016.
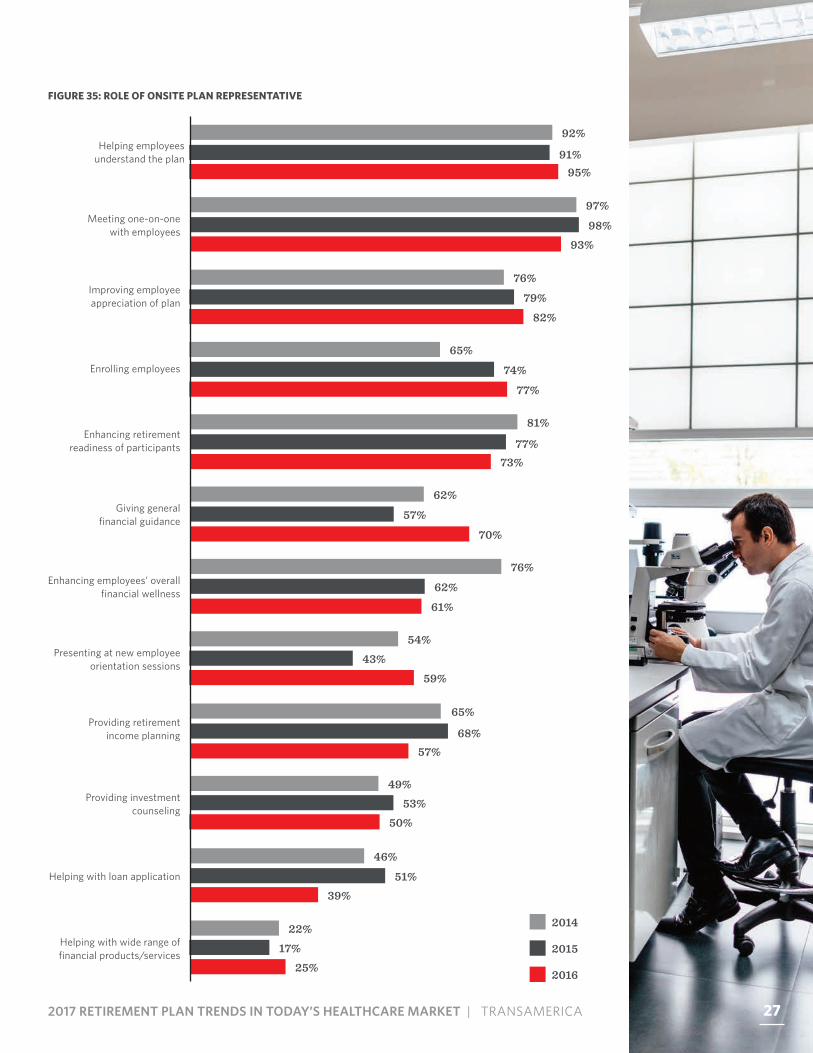
Onsite plan representatives appear to be putting increased emphasis on tasks with immediate impact on the plan, and less time on ancillary functions. In 2016, more healthcare organizations reported that their onsite representative helped employees understand and appreciate the plan, enrolled employees, gave general financial guidance, presented at new employee orientation sessions, and helped with a wide range of financial products and services. Onsite representatives spent less time helping with loan applications, investment choices, and general financial wellness.
FIGURE 34: PRESENCE OF AN ONSITE PLAN REPRESENTATIVE
ONSITE REPRESENTATIVES
49% Of organizations reported no plan representative on site.
2015 2016
Yes, full-time
32% 27%
Yes, part-time
18%
37%
49%
36%
No
272017 RETIREMENT PLAN TRENDS IN TODAY’S HEALTHCARE MARKET | TRANSAMERICA
FIGURE 35: ROLE OF ONSITE PLAN REPRESENTATIVE
Helping with wide range of financial products/services
22%17%
25%
46%
51%39%
Helping with loan application
49%53%
50%
Providing investment counseling
54%43%
59%
Presenting at new employee orientation sessions
76%
62%
61%
Enhancing employees’ overall financial wellness
62%
57%
70%
Giving general financial guidance
73%77%
81%Enhancing retirement
readiness of participants
65%
74%
77%
Enrolling employees
76%
79%82%
Improving employee appreciation of plan
97%
98%93%
Meeting one-on-one with employees
95%91%
92%Helping employees
understand the plan
57%68%
65%Providing retirement
income planning
2016
2014
2015
27
28
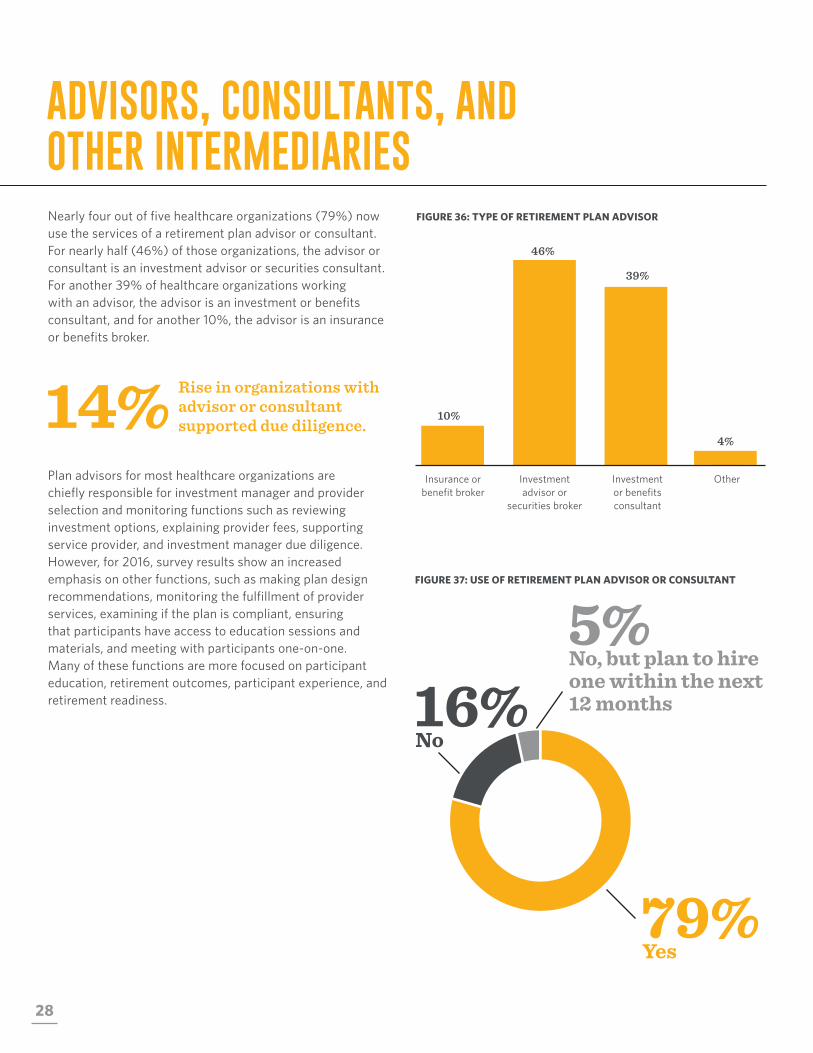
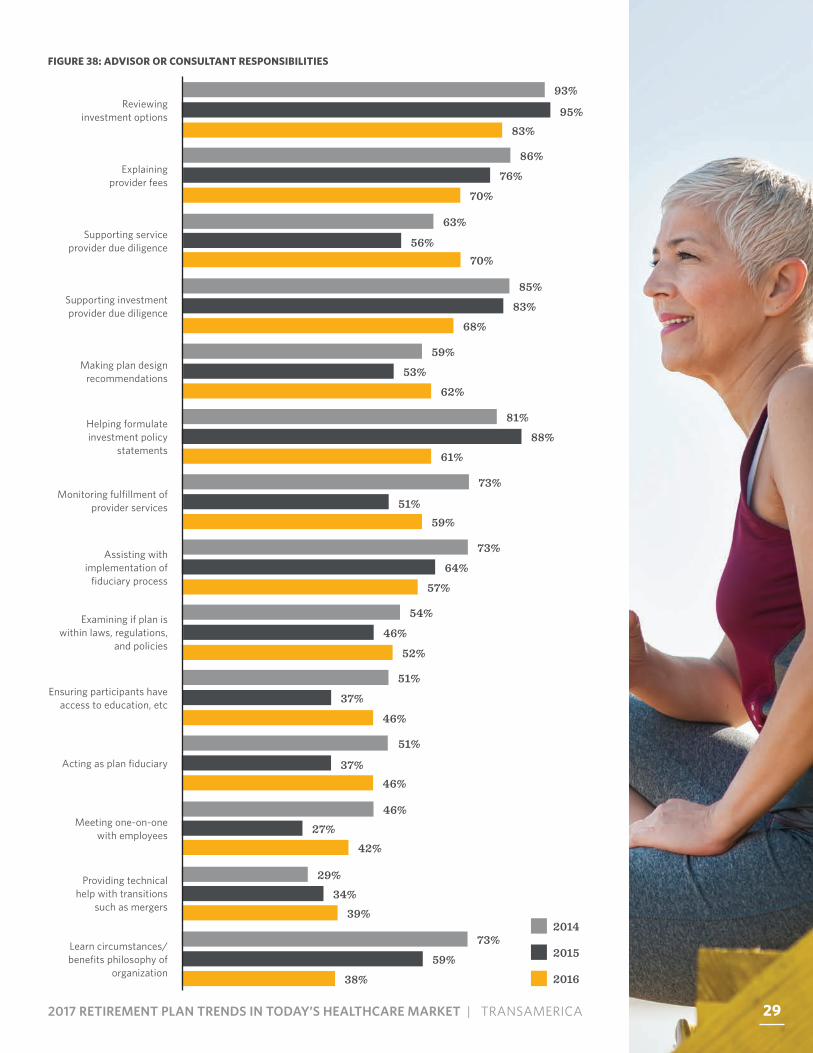
Nearly four out of five healthcare organizations (79%) now use the services of a retirement plan advisor or consultant. For nearly half (46%) of those organizations, the advisor or consultant is an investment advisor or securities consultant. For another 39% of healthcare organizations working with an advisor, the advisor is an investment or benefits consultant, and for another 10%, the advisor is an insurance or benefits broker.
Plan advisors for most healthcare organizations are chiefly responsible for investment manager and provider selection and monitoring functions such as reviewing investment options, explaining provider fees, supporting service provider, and investment manager due diligence. However, for 2016, survey results show an increased emphasis on other functions, such as making plan design recommendations, monitoring the fulfillment of provider services, examining if the plan is compliant, ensuring that participants have access to education sessions and materials, and meeting with participants one-on-one. Many of these functions are more focused on participant education, retirement outcomes, participant experience, and retirement readiness.
14% Rise in organizations with advisor or consultant supported due diligence.
16%
ADVISORS, CONSULTANTS, AND OTHER INTERMEDIARIES
FIGURE 36: TYPE OF RETIREMENT PLAN ADVISOR
FIGURE 37: USE OF RETIREMENT PLAN ADVISOR OR CONSULTANT
10%
Insurance or benefit broker
46%
Investment advisor or
securities broker
4%
Other
39%
Investment or benefits consultant
79%Yes
5%No, but plan to hire one within the next 12 months
No
292017 RETIREMENT PLAN TRENDS IN TODAY’S HEALTHCARE MARKET | TRANSAMERICA
Learn circumstances/ benefits philosophy of
organization
73%
59%
38%
29%34%
39%
Providing technical help with transitions
such as mergers
46%27%
42%
Meeting one-on-one with employees
51%
37%
46%
Ensuring participants have access to education, etc
54%
46%
52%
Examining if plan is within laws, regulations,
and policies
73%
64%
57%
Assisting with implementation of
fiduciary process
59%51%
73%Monitoring fulfillment of
provider services
81%
88%
61%
Helping formulate investment policy
statements
59%
53%
62%
Making plan design recommendations
85%
83%
68%
Supporting investment provider due diligence
70%56%
63%Supporting service
provider due diligence
46%37%
51%Acting as plan fiduciary
86%
76%
70%
Explaining provider fees
83%95%
93%Reviewing
investment options
FIGURE 38: ADVISOR OR CONSULTANT RESPONSIBILITIES
2016
2014
2015
29

30
FIGURE 39: FREQUENCY OF MEETINGS WITH ADVISOR
Many organizations, whether for-profit or not-for-profit, have determined that there is not a major need to meet monthly or quarterly with their retirement plan advisor. Some consider semi-annual or annual meetings sufficient. Just 7% of healthcare plans meet with their advisor on a monthly basis, and the number meeting quarterly fell from 72% in 2015 to 61% in 2016. Healthcare plans meeting with their advisor semi-annually rose from 14% in 2015 to 20% in 2016, and those meeting annually more than doubled, going from 5% in 2105 to 12% in 2016.
2015 2016
Monthly
7% 9%
Quarterly
61%
72%
20% 14%
Semi-annually
12% 5%
Annually
Q: Organizations meeting with plan representatives rose from 2015 to 2016 by how much?Semi-annual meetings rose 6%, while annual meetings more than doubled from 5% to 12%.

312017 RETIREMENT PLAN TRENDS IN TODAY’S HEALTHCARE MARKET | TRANSAMERICA
32
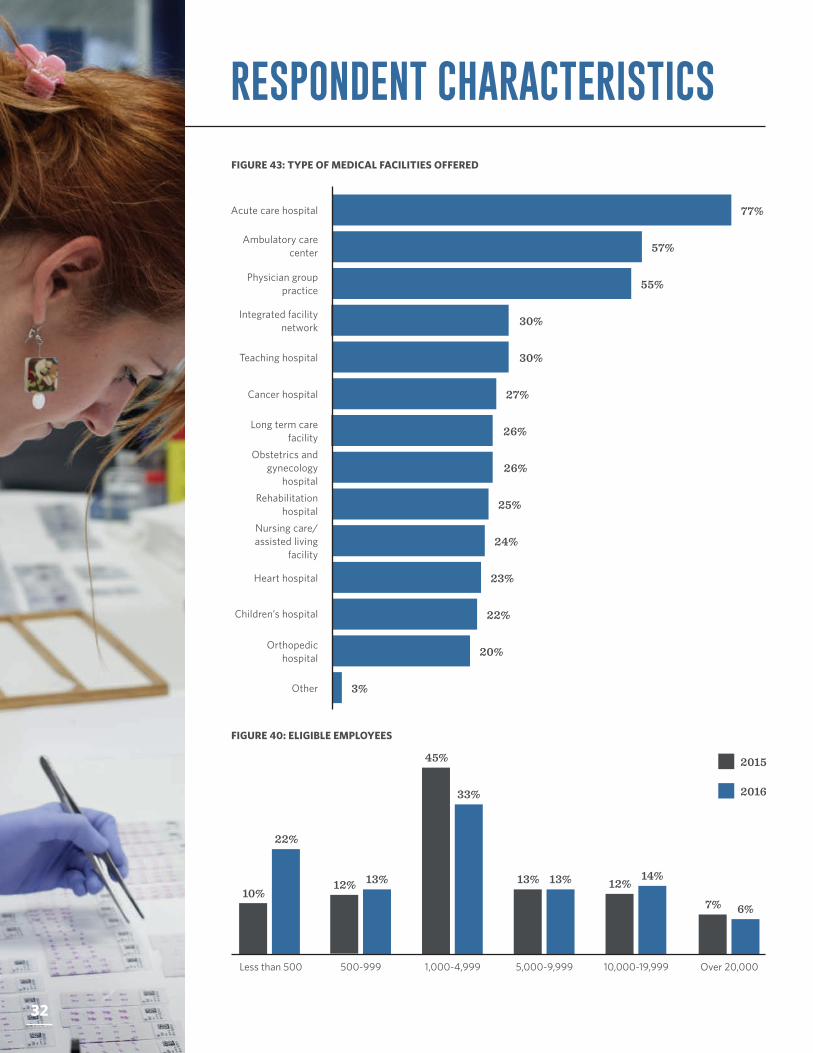
FIGURE 43: TYPE OF MEDICAL FACILITIES OFFERED
RESPONDENT CHARACTERISTICS
FIGURE 40: ELIGIBLE EMPLOYEES
77%Acute care hospital
57%Ambulatory care
center
55%Physician group practice
30%Integrated facility network
30%Teaching hospital
27%Cancer hospital
26%Long term care facility
26%Obstetrics and
gynecology hospital
25%Rehabilitation hospital
24%Nursing care/assisted living
facility
23%Heart hospital
22%Children’s hospital
20%Orthopedic hospital
3%Other
2015
2016
Less than 500 500-999
22%
10% 13% 12%
1,000-4,999
33%
45%
5,000-9,999
13% 13%
10,000-19,999
14% 12%
Over 20,000
6% 7%
32
332017 RETIREMENT PLAN TRENDS IN TODAY’S HEALTHCARE MARKET | TRANSAMERICA
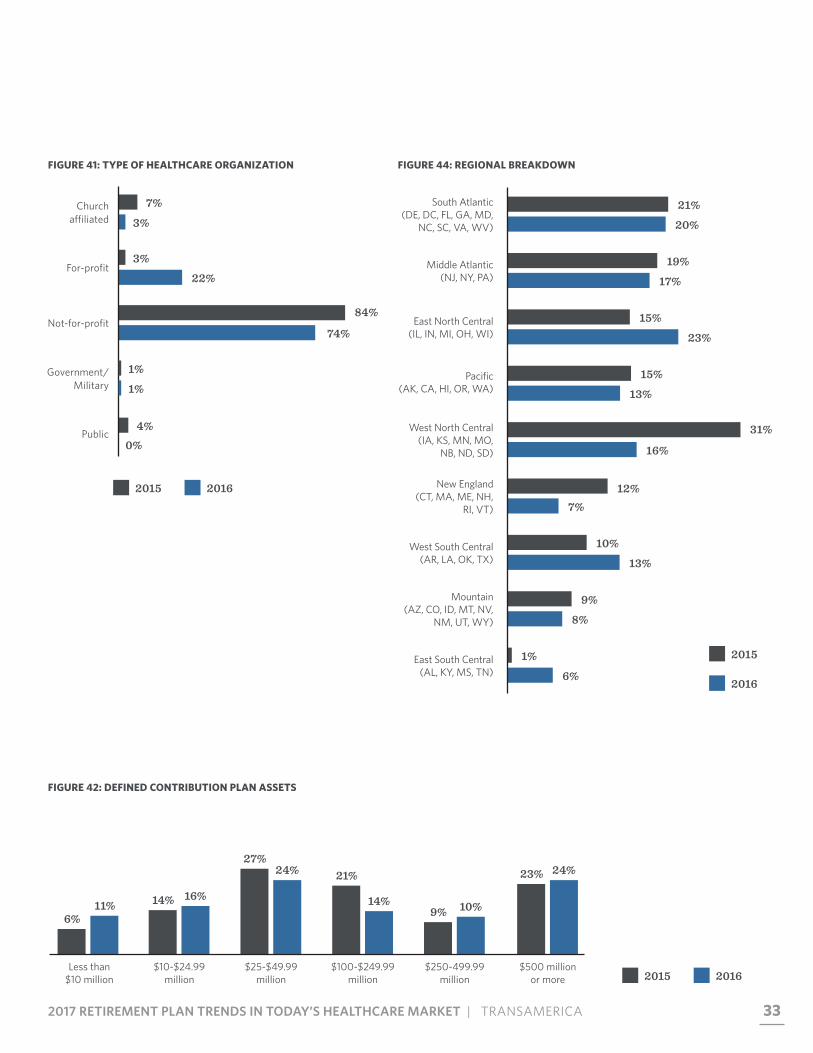
FIGURE 42: DEFINED CONTRIBUTION PLAN ASSETS
FIGURE 41: TYPE OF HEALTHCARE ORGANIZATION
Less than $10 million
$10-$24.99 million
11% 6%
16% 14%
$25-$49.99 million
24% 27%
$100-$249.99 million
14%
21%
$250-499.99 million
10% 9%
$500 million or more
24% 23%
2015 2016
Church affiliated
7%
3%
Public4%
0%
For-profit3%
22%
FIGURE 44: REGIONAL BREAKDOWN
West North Central (IA, KS, MN, MO,
NB, ND, SD)
31%
16%
Mountain (AZ, CO, ID, MT, NV,
NM, UT, WY)
9%
8%
Not-for-profit74%
84%
East South Central (AL, KY, MS, TN)
1%
6%
New England (CT, MA, ME, NH,
RI, VT)
12%7%
East North Central (IL, IN, MI, OH, WI)
15%
23%
Pacific (AK, CA, HI, OR, WA)
15%
13%
Middle Atlantic (NJ, NY, PA) 17%
19%
South Atlantic (DE, DC, FL, GA, MD,
NC, SC, VA, WV) 20%
21%
West South Central (AR, LA, OK, TX) 13%
10%
2015 2016
2015
2016
Government/ Military
1%
1%

34
ABOUT THE SURVEYRetirement Plan Trends in Today’s Healthcare Market – 2016 is the 13th annual study conducted by Transamerica Retirement Solutions and the American Hospital Association. The study presents insight on current issues that impact defined contribution and defined benefit plans of healthcare organizations. The report provides analysis to guide healthcare plan sponsors and their advisors as they benchmark their organizations in many areas of plan design and management, in order to critically evaluate opportunities for improvement.
The survey was comprised of 83 questions and was conducted online between March and September 2016. A total of 87 hospital administrators and chief financial officers responded to the survey, representing healthcare organizations with at least one active defined contribution plan.
This material is being provided for informational purposes only. It should not be viewed as an investment recommendation by Transamerica for customers or prospective customers. Customers seeking advice regarding their particular investment needs should contact a financial professional.

352017 RETIREMENT PLAN TRENDS IN TODAY’S HEALTHCARE MARKET | TRANSAMERICA
When it comes to preparing for your future, there's no time like the present.
Find out more at transamerica.com
All rights reserved. Displays or reproductions of any part of this material must include the following mention on every page: “Source: Transamerica Retirement Solutions’ Retirement Plan Trends in Today's Healthcare Market—2016.” Submit requests for display or reproduction to your Transamerica representative.
FOR PLAN SPONSOR AND FINANCIAL PROFESSIONAL USE ONLY.
24196_ERPSB0617© 2017 Transamerica Retirement Solutions, LLC
Transamerica Retirement Solutions’ retirement services are endorsed by the American Hospital Association (AHA). The American Hospital Association (AHA) Endorsement Seal is the exclusive property of the AHA. AHA Health Forum, the strategic business enterprise of the AHA, is compensated for the use of the AHA marks and for its assistance in marketing endorsed products and services. By agreement, pricing of endorsed products and services may not be increased by Transamerica Retirement Solutions to reflect fees paid to any AHA affiliate.
AHA does not endorse securities or investment products offered by or through Transamerica Retirement Solutions. None of the AHA or its affiliates, including AHA Health Forum, is a registered investment advisor, and none provides investment advice.