Embed Size (px)
Citation preview
A monthly research report from the EBRI Education and Research Fund © 2013 Employee Benefit Research Institute
November 2013 • No. 392
Employment-Based Retirement Plan Participation: Geographic Differences and Trends, 2012 By Craig Copeland, Ph.D., Employee Benefit Research Institute
A T A G L A N C E
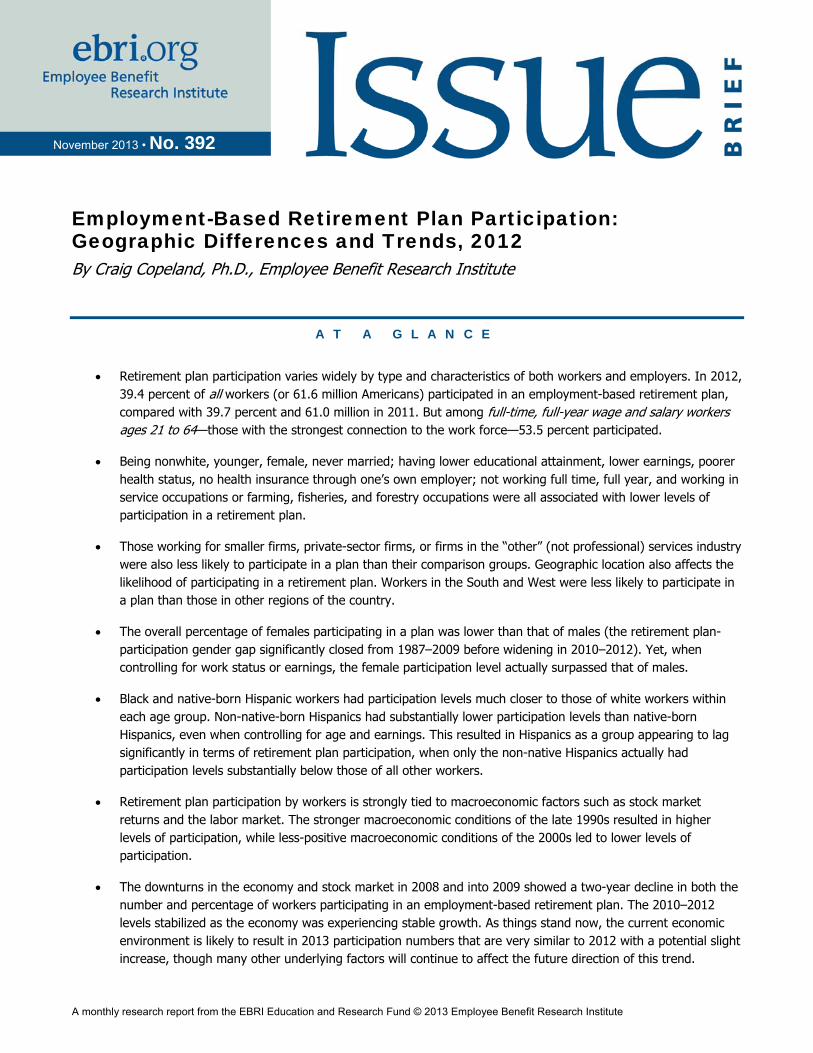
Retirement plan participation varies widely by type and characteristics of both workers and employers. In 2012, 39.4 percent of all workers (or 61.6 million Americans) participated in an employment-based retirement plan, compared with 39.7 percent and 61.0 million in 2011. But among full-time, full-year wage and salary workers ages 21 to 64—those with the strongest connection to the work force—53.5 percent participated.
Being nonwhite, younger, female, never married; having lower educational attainment, lower earnings, poorer health status, no health insurance through one’s own employer; not working full time, full year, and working in service occupations or farming, fisheries, and forestry occupations were all associated with lower levels of participation in a retirement plan.
Those working for smaller firms, private-sector firms, or firms in the “other” (not professional) services industry were also less likely to participate in a plan than their comparison groups. Geographic location also affects the likelihood of participating in a retirement plan. Workers in the South and West were less likely to participate in a plan than those in other regions of the country.
The overall percentage of females participating in a plan was lower than that of males (the retirement plan-participation gender gap significantly closed from 1987‒2009 before widening in 2010–2012). Yet, when controlling for work status or earnings, the female participation level actually surpassed that of males.
Black and native-born Hispanic workers had participation levels much closer to those of white workers within each age group. Non-native-born Hispanics had substantially lower participation levels than native-born Hispanics, even when controlling for age and earnings. This resulted in Hispanics as a group appearing to lag significantly in terms of retirement plan participation, when only the non-native Hispanics actually had participation levels substantially below those of all other workers.
Retirement plan participation by workers is strongly tied to macroeconomic factors such as stock market returns and the labor market. The stronger macroeconomic conditions of the late 1990s resulted in higher levels of participation, while less-positive macroeconomic conditions of the 2000s led to lower levels of participation.
The downturns in the economy and stock market in 2008 and into 2009 showed a two-year decline in both the number and percentage of workers participating in an employment-based retirement plan. The 2010–2012 levels stabilized as the economy was experiencing stable growth. As things stand now, the current economic environment is likely to result in 2013 participation numbers that are very similar to 2012 with a potential slight increase, though many other underlying factors will continue to affect the future direction of this trend.
ebri.org Issue Brief • November 2013 • No. 392 2
Craig Copeland is a senior research associate at the Employee Benefit Research Institute (EBRI). This Issue Brief was written with assistance from the Institute’s research and editorial staffs. Any views expressed in this report are those of the author and should not be ascribed to the officers, trustees, or other sponsors of EBRI, EBRI-ERF, or their staffs. Neither EBRI nor EBRI-ERF lobbies or takes positions on specific policy proposals. EBRI invites comment on this research.
Copyright Information: This report is copyrighted by the Employee Benefit Research Institute (EBRI). It may be used without permission but citation of the source is required.
Recommended Citation: Craig Copeland, “Employment-Based Retirement Plan Participation: Geographic Differences and Trends, 2012,” EBRI Issue Brief, no. 392, November 2013.
Report availability: This report is available on the Internet at www.ebri.org
Table of Contents Introduction .......................................................................................................................................................... 5
Retirement Plan Types ........................................................................................................................................... 6
Data ..................................................................................................................................................................... 7
Defining the “Correct” Retirement Participation Level ............................................................................................... 8
2012 Participation Levels ........................................................................................................................................ 9
Worker Characteristics ....................................................................................................................................... 9
Employer Characteristics .................................................................................................................................. 10
Further Demographic Breaks ............................................................................................................................ 10
Geographic Differences ........................................................................................................................................ 18
Trends ................................................................................................................................................................ 21
Trends in the Percentage Participating .............................................................................................................. 21
Trends across Worker Characteristics ................................................................................................................ 22
Trends across Employer Characteristics ............................................................................................................. 26
Number Without a Plan ........................................................................................................................................ 29
Conclusion .......................................................................................................................................................... 29
References .......................................................................................................................................................... 38
Endnotes ............................................................................................................................................................ 40
Figures Figure 1, Percentage of Various Work Forces Who Work for an Employer That Sponsored a Retirement Plan, and the
Percentage Who Participated in a Plan, 2012 .............................................................................................. 9
Figure 2, Percentage of Various Work Forces Who Worked for an Employer That Sponsored a Retirement Plan and the Percentage Who Participated in a Plan, by Various Characteristics, 2012 ..................................................... 11
Figure 3, Percentage of Wage and Salary Workers Ages 21–64 Who Participated in an Employment-Based Retirement Plan, by Work Status and Gender, 2012 .................................................................................................... 13
ebri.org Issue Brief • November 2013 • No. 392 3
Figure 4, Percentage of Wage and Salary Workers Ages 21–64 Who Participated in an Employment-Based Retirement Plan, by Work Status and Gender, 2001 .................................................................................................... 13
Figure 5, Percentage of Wage and Salary Workers Ages 21–64 Who Participated in an Employment-Based Retirement Plan, by Annual Earnings and Gender, 2012 .............................................................................................. 15
Figure 6, Percentage of Wage and Salary Workers Ages 21–64 Who Participated in an Employment-Based Retirement Plan, by Annual Earnings and Race/Ethnicity, 2012 .................................................................................... 15
Figure 7, Percentage of Wage and Salary Workers Ages 21–64 Who Participated in an Employment-Based Retirement Plan, by Firm Size (Number of Employees) and Race/Ethnicity, 2012 .......................................................... 16
Figure 8, Percentage of Wage and Salary Workers Ages 21–64 Who Participated in an Employment-Based Retirement Plan, by Age and Race/Ethnicity, 2012 ...................................................................................................... 16
Figure 9, Percentage of Wage and Salary Workers Ages 21–64 Who Participated in an Employment-Based Retirement Plan, by Race/Ethnicity With Hispanic Detail and Annual Earnings, 2012...................................................... 17
Figure 10, Percentage of Wage and Salary Workers Ages 21–64 Who Participated in an Employment-Based Retirement Plan, by Age and Employer Size (Number of Employees), 2012 .................................................................. 17
Figure 11, Percentage of Wage and Salary Workers Ages 21–64 Who Participated in an Employment-Based Retirement Plan, by Annual Earnings and Employer Size (Number of Employees), 2012 ................................................ 19
Figure 12, Percentage of Wage and Salary Workers Ages 21–64 Who Participated in an Employment-Based Retirement Plan, by Annual Earnings and Educational Attainment, 2012 ....................................................................... 19
Figure 13, Percentage of Wage and Salary Workers Ages 21–64 Who Participated in an Employment-Based Retirement Plan, by Age and Income, 2012 ............................................................................................................... 20
Figure 14, Percentage of Wage and Salary Workers Ages 21–64 Who Participate in an Employment-Based Retirement Plan, by Health Insurance Status and Age, 2000 and 2012 ......................................................................... 20
Figure 15, Percentage of Wage and Salary Workers Ages 55–64 Participating in an Employment-Based Retirement Plan, by Self-Reported Health Status, 2000 and 2012 ........................................................................................ 21
Figure 16, Percentage of Various Work Forces Who Participated in an Employment-Based Retirement Plan, by State, 2012 ...................................................................................................................................................... 23
Figure 17, Percentage of Various Work Forces Who Participated in an Employment-Based Retirement Plan by Consolidated Statistical Area (CSA), 2012 .................................................................................................. 24
Figure 18, Percentage of Wage and Salary Workers Ages 21–64 Who Participated in an Employment-Based Retirement Plan, by State, Three-Year-Average Trend, 2002–2012 .............................................................................. 25
Figure 19, Percentage of Various Work Forces Who Worked for an Employer That Sponsored a Retirement Plan and the Percentage Who Participated in an Employment-Based Retirement Plan, 1987–2012 .................................... 27
Figure 20, Percentage of Various Work Forces Who Participated in an Employment-Based Retirement Plan, 1987–2012 ............................................................................................................................................. 31
Figure 21, Percentage of Wage and Salary Workers Ages 21–64 Who Participated in an Employment-Based Retirement Plan, by Age, 1987–2012 ......................................................................................................................... 31

ebri.org Issue Brief • November 2013 • No. 392 4
Figure 22, Percentage of Wage and Salary Workers Ages 21–64 Who Participated in an Employment-Based Retirement Plan, by Gender, 1987–2012 .................................................................................................................... 32
Figure 23, Percentage of Wage and Salary Workers Ages 21–64 Who Participated in an Employment-Based Retirement Plan, by Race/Ethnicity, 1987–2012 .......................................................................................................... 32
Figure 24, Percentage of Wage and Salary Workers Ages 21–64 Who Participated in an Employment-Based Retirement Plan, by Educational Level, 1987–2012 ..................................................................................................... 33
Figure 25, Percentage of Wage and Salary Workers Ages 21–64 Who Participated in an Employment-Based Retirement Plan, by Annual Earnings (2012 $s), 1987–2012 ........................................................................................ 33
Figure 26, Percentage of Wage and Salary Workers Ages 21–64 Who Participated in an Employment-Based Retirement Plan, by Work Status, 1987–2012 ............................................................................................................. 34
Figure 27, Percentage of Wage and Salary Workers Ages 21–64 Who Participated in an Employment-Based Retirement Plan, by Workers' Employer Size, 1987–2012 ............................................................................................ 34
Figure 28, Percentage of Wage and Salary Workers Ages 21–64 Who Participated in an Employment-Based Retirement Plan, by Industry/Sector, 2002–2012 ........................................................................................................ 35
Figure 29, Percentage of Wage and Salary Workers Ages 21–64 Who Participated in an Employment-Based Retirement Plan, by Occupation, 2002–2012 .............................................................................................................. 35
Figure 30, Number of Workers Who Worked for an Employer That Did Not Sponsor an Employment-Based Retirement Plan and Number of Workers Who Did Not Participate in an Employment-Retirement Plan, by Various Demographic and Employer Characteristics, 2012 ...................................................................................... 36
Figure 31, Percentage of Workers Who Worked for Employers That Did Not Sponsor an Employment-Based Retirement Plan and Percentage of Workers Who did Not Participate in an Employment-Based Retirement Plan, by Various Demographic and Employer Characteristic Groups, 2012 ............................................................................ 37
ebri.org Issue Brief • November 2013 • No. 392 5
Employment-Based Retirement Plan Participation: Geographic Differences and Trends, 2012 By Craig Copeland, Ph.D., Employee Benefit Research Institute
Introduction
The financing of retirement has become a vital topic in the United States as more and more Baby Boomers rapidly approach the traditional retirement age of 65. This group, with birth years 1946–1964 (ages 49-67), currently totals just over 75 million people1 and will greatly change the demographics of the nation as it continues to age. The resulting sharp rise in the percentage of the elderly population from this generation will make it much more expensive to support programs such as Medicare and Social Security, which are designed to partially shield the elderly from the worst financial effects of old age (deteriorating health and loss of income). As a result, some changes in these programs are likely to occur that could result in an increase in the benefit-eligibility age, higher taxes, or reductions in benefits for all or certain categories of retirees (such as higher-income individuals).
Today, a retiree beneficiary turning 65 can expect Social Security to replace approximately 30 percent to 50 percent of preretirement income, depending upon his or her earnings history (Board of Trustees of the Federal Old-Age and Survivors Insurance and Disability Insurance Trust Funds 2013).2 Consequently, if workers hope to maintain their preretirement standard of living, they may need other sources of income in retirement to supplement their Social Security benefits, as Social Security was not designed to match that standard for all workers.
For both current and future retirees, an important source of additional income in retirement is likely to be an employment-based retirement plan. Therefore, understanding the percentage of workers currently participating in those plans provides critical insight into retirees’ future financial status.
In 2012, the percentage of workers participating in an employment-based retirement plan slightly declined from a year earlier. Specifically, the percentage of all workers participating in an employment-based retirement plan moved in a relatively tight band in recent years, from 39.6 percent in 2009 to 39.8 percent in 2010 to 39.7 in 2011 to 39.4 percent in 2012, while the percentage of full-time, full-year wage and salary workers ages 21–64 (those most likely to be offered a retirement plan at work) also experienced a slight decline, from 53.7 percent in 2011 to 53.5 percent in 2012. While the overall level of participation was slightly downward, a few categories of workers experienced increases in 2012, but most did not.
Retirement plan participation by workers is strongly tied to macroeconomic factors such as stock market returns and the labor market, and consequently the vibrant economic conditions of the late 1990s led to higher levels of participation, while worsening conditions in the following decade resulted in lower levels. Not surprisingly, the economic crisis of 2008 and 2009 had an impact on recent participation levels and in fact continues to affect participation, as the economy has yet to recover to the unemployment levels of the late 1990s. In addition, other underlying factors will likely continue to affect future participation trends, such as the decline in the availability and freezing of existing defined benefit (DB) pension plans in the private sector and the automatic-enrollment provisions of the Pension Protection Act (PPA) of 2006 for defined contribution (DC) plans, which are increasingly affecting new hires.
This Issue Brief more closely examines the level of participation by workers in public- and private-sector, employment-based pension or retirement plans, based on the U.S. Census Bureau’s March 2013 Current Population Survey (CPS), the most recent data currently available.3 It begins with an overview of retirement plan types and participation in these types of plans and describes the data used in this study, along with their relative strengths and weaknesses. Results on participation in employment-based retirement plans are analyzed for 2012 across various worker and employer characteristics. The report then explores retirement plan participation across U.S. geographical regions, including state-by-state comparisons as well as comparisons by certain consolidated statistical areas (CSAs). In addition, trends from 1987–2012 in employment-based retirement plan participation are presented across many of the same worker and

ebri.org Issue Brief • November 2013 • No. 392 6
employer characteristics as used for 2012. Furthermore, an accounting of the number of individuals who worked for employers that did not sponsor a plan and of workers who did not participate in a plan in 2012 is provided by various demographic and employer characteristics.
Retirement Plan Types In general, two types of tax-favored retirement plan vehicles are offered through employers and unions:
Defined contribution (DC) plans.
Defined benefit (DB) plans.
These plans differ in a variety of ways, particularly in how benefits are determined and held, the assumption of investment risk, and the manner in which plan benefits are paid.
Benefit Determination: In a DC plan, employer contributions (if any) are based on a predetermined formula,4 and, most frequently, all contributions (made by both employers and/or employees), while held in a single trust, are tracked in individual accounts on behalf of each participant. In contrast, DB plans in the private sector typically are funded solely by the employer and plan contributions are held in one trust on behalf of all participants, with these contributions subject to federal funding rules and regulations required to maintain the plan’s tax-favored status. In the public sector, a DB plan frequently requires employee contributions, which, along with earnings on those contributions, are usually pooled with funding from the government entity that sponsors the plan.
Investment Risk: The overwhelming majority of individuals participating in a DC plan assume all of the investment risk in their own account; that is, employers do not guarantee specific benefit levels. Rather, as the name suggests, it is the contribution that is defined by the terms of the plan, not the benefit, which is determined by the contributions (employer and employee) to the individuals’ accounts and the investment returns within those accounts.5 In comparison, DB-plan participants receive certain benefit amounts determined by a formula specified by the plan, typically based on average salary and years of service, regardless of the investment performance of the plan assets. Thus, in general, in DC plans the individual participant bears the investment risk; in DB plans, the risk is the responsibility of the plan sponsor (and in the public sector, ultimately the taxpayers in the jurisdiction of the sponsoring entity).
Benefit Payout: A third difference between DC and DB plans traditionally has been the manner in which they pay out benefits. DC plans usually pay out benefits in a single lump sum—the entire accumulated benefit is distributed at one time. Consequently, the recipients are responsible for managing the money from that point in time and throughout their retirement years. Alternatively, DB plans must offer life annuities (a set amount paid out regularly over time, typically monthly, for as long as the annuitants live), which, if chosen as a distribution option, eliminate the necessity of the individuals managing these assets during retirement. However, plan sponsors are allowed to “cash out” those participants who terminate employment and have a small accrued benefit, and a growing number of DB plan participants are also being offered a lump-sum distribution option.6
The term pension plan traditionally has been synonymous with a DB plan that provides a fixed-annuity payment, rather than a DC plan offering a lump-sum distribution. Although many individuals refer to a DC plan as a “pension” plan, many others still understand a pension to be an annuity payment at retirement. To minimize confusion, this study defines DB and DC plans collectively as retirement plans.7
The increase in the number of DC plan participants relative to DB plan participants over time has been well documented. For example, the Department of Labor’s Employee Benefits Security Administration’s Private Pension Plan Bulletin Historical Tables and Graphs (2013), which compiles data from the Internal Revenue Service (IRS) Form 5500, shows that the number of active participants in a private-sector DB plan decreased from 27.2 million in 1975 to 16.5 million in 2011 (a decline of 39 percent), while the number of active participants covered by a private-sector DC
ebri.org Issue Brief • November 2013 • No. 392 7
plan increased from 11.2 million to 73.7 million during that same period (an increase of over 550 percent).8 Copeland (2013), using the U.S. Census Bureau’s May 1988 Current Population Survey Employee Benefit Supplement, and the Retirement and Pension Plan Coverage Topical Modules to the 1996, 2001, 2004, and 2008 Survey of Income and Program Participation (SIPP), found that the percentage of all civilian (public and private), nonagricultural wage and salary workers ages 16 or older who considered their primary retirement plan to be a DC plan increased from 25.8 per-cent in 1988 to 78.0 percent in 2012. Another study by Copeland (2012a), using the 1992, 2007, and 2010 Surveys of Consumer Finances (SCF), found that the percentage of families with at least one participant in a retirement plan having only a DC plan increased from 37.5 percent in 1992 to 60.3 percent in 2007 and to 61.3 percent in 2010.
The reasons for this growth in the number of DC plan participants have also been well documented, such as the perception of increased work-force mobility and changes in the business and regulatory environments.9 The consequences of these trends for retirees are significant, the most important being the necessity for individuals first to accumulate sufficient assets in these accounts for retirement, and second, for individual retirees to manage the assets accumulated so as not to outlive them.10, 11 However, these issues are outside the scope of this report, given the limitations of this study’s data, which allow focusing only on participation in an employment-based retirement plan arrangement, rather than on the plan type.
Data While the analysis of employment-based retirement plan participation among plan types is important, the governmental datasets that contain this information focus only on private-sector workers, are slow to be released, do not contain detailed demographic data on the participants, or are compiled from surveys taken only at three- or five-year intervals. The data cited above regarding the breakdown of plan types from SCF illustrate these challenges, as the latest available numbers are from 2010, with the survey intervals being three years.12 The SIPP data were recently released for 2012, but also had three to five years between survey releases. Furthermore, the official compilation of private-sector plan assets and participants by the U.S. Department of Labor from the Form 5500 data that all private-sector sponsors of pension or retirement plans must file with the IRS is currently available only for plan years through 2011. Public-sector employers are not required to file these forms, making detailed data from those plans difficult to obtain even after a few years.
The timeliest survey on employment-based retirement plan offering and employee participation is the National Compensation Survey, conducted by the U.S. Department of Labor’s Bureau of Labor Statistics (BLS).13 This survey found in March 2013 that 85 percent of public-sector workers and 49 percent of private-sector workers participated in an employment-based retirement plan. The private-sector numbers had been decreasing, from 51 percent in March 2006 to 48 percent in March 2012, before the 2013 increase. This survey also found in March 2012 that 17 percent of private-sector workers participated in a DB plan and 41 percent participated in a DC plan (10 percent participated in both). While this survey does not contain detailed demographic data on the participants, it does provide breakdowns of many firm characteristics (such as size and industry) of the participants in retirement plans.
In contrast, the CPS, a monthly survey, has asked questions in a consistent manner each March since at least 1988 about whether an employee worked for an employer or union that sponsored a pension or retirement plan for any of its employees, and if the worker was included in that plan.14 The U.S. Census Bureau conducts the CPS for the BLS by interviewing about 57,000 households, asking numerous questions about individuals’ work status, employers, incomes, and basic demographic characteristics. Therefore, the CPS provides detailed information about workers from a broad sample of Americans who are participating in an employment-based plan, making it possible to establish a consistent, annual, and timely trend across numerous worker characteristics and the characteristics of their employers.

ebri.org Issue Brief • November 2013 • No. 392 8
Defining the “Correct” Retirement Participation Level There is an ongoing discussion on what the correct number is for the percentage of private- sector workers who are participating in an employment-based retirement plan. As noted, the BLS’ National Compensation Survey reports 48 percent of private-sector workers were participants in a retirement plan in March 2012, whereas the CPS shows 34.4 percent of all private-sector workers were in a retirement plan. However, the BLS survey excludes various workers, including self-employed, agricultural, and private-household. Furthermore, the BLS survey asks about workers working in only the month of March, whereas the CPS asks about anyone who worked in the previous year. Therefore, when workers who are excluded from the BLS survey are also excluded from the CPS population and only full-year workers are included, the CPS finds 42.8 percent of workers to be participating. In addition, certain small establishments are excluded from the BLS survey because of their ownership type and lack of responses. While the CPS can’t closely replicate which types of establishments are excluded, the CPS does have a firm-size variable where the smallest category is fewer than 10 employees. When workers in these firms are excluded from the CPS, the percentage participating becomes 48.5 percent. These numbers are closer to the BLS survey numbers, but this still isn’t an exact comparison.
In Dushi, Iams, and Lichtenstein (2011), the results from another individual response survey, the Survey of Income and Program Participation (SIPP), were compared with tax records, where it was found that a number of individuals said they made contributions to a defined contribution plan, although the tax record indicated they hadn’t, while others made contributions according to the tax records, but didn’t report those contributions in the survey. When the percentages were netted out, the tax records showed a 5-percentage-point higher level of participation than what the survey responses indicated. Consequently, there are issues with drawing conclusions from certain individual responses to questions on retirement plan participation. (Also see Anguelow, Iams, and Purcell (2012) for further discussion of using SIPP and tax data to determine retirement-plan-participation levels.)
In spite of these issues, the numbers are relatively similar when comparing as closely as possible the same populations between the two surveys. Therefore, when comparisons of these numbers are discussed, it should be understood what is being compared, as these numbers reflect a similar picture in private-sector retirement plan participation. Furthermore, the CPS is the only survey that provides detailed demographic characteristics of workers and retirement plan participation on an annual basis.
While the CPS provides excellent detail on overall participation in employment-based plans, it does not provide specifics about the individual plans—such as the worker’s plan type or whether the individual worker is eligible to participate in the plan sponsored by his or her employer or union. This makes the definition of terms in this study important:
The term sponsorship rate is defined as the percentage of workers in the specified work force who worked for an employer or union that sponsored a plan in a given year for any of its employees, though not necessarily for the worker in question.
In this discussion, the term percentage of workers participating in a plan is not synonymous with the standard retirement plan term participation rate, which is generally understood to mean the percentage of eligible workers who participate in a plan. Consequently, participation rate is not used in this analysis; instead, the terms participation level or percentage participating are used. To reiterate, those terms refer to the fraction of

ebri.org Issue Brief • November 2013 • No. 392 9
workers in the specified work force who participate in an employment-based pension or retirement plan regardless of the workers’ eligibility to participate in a plan. (An eligible worker is one who is offered a plan and meets the requirements to participate.)
Lastly, the term participating in a plan as used here always refers to a pension or retirement plan provided through an employment-based arrangement, not a plan such as an individual retirement account (IRA) that workers can fund outside of an employment-based arrangement.
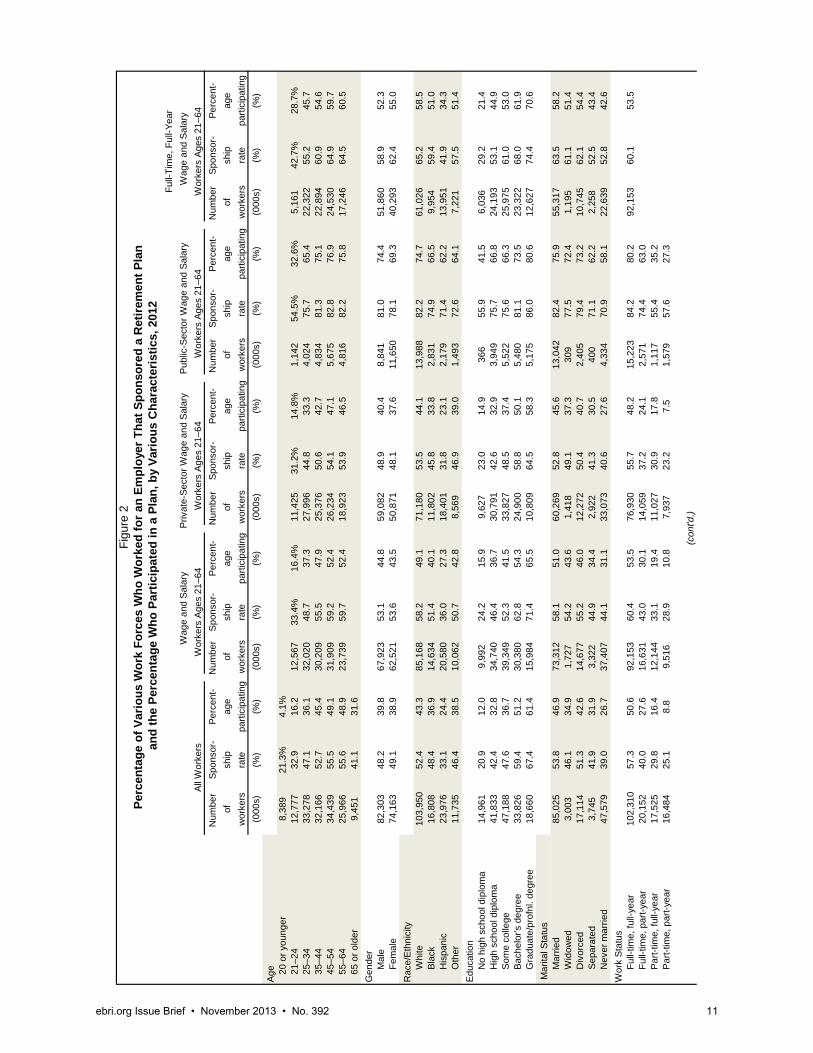
2012 Participation Levels Among the 156.5 million Americans who worked in 2012, 76.0 million worked for employers or unions that sponsored a pension or retirement plan, and 61.6 million participated in a plan (Figure 1). This translates into a sponsorship rate (the percentage of workers working for an employer or union that sponsored a plan) of 48.6 percent and a participation level of 39.4 percent.
Figure 1 Percentage of Various Work Forces Who Work for an Employer That Sponsored
a Retirement Plan, and the Percentage Who Participated in a Plan, 2012
Wage and Private-Sector Public-Sector Full-Time, Full-Year All Salary Workers Wage and Salary Wage and Salary Wage and Salary Workers Ages 21–64 Workers Ages 21–64 Workers Ages 21–64 Workers Ages 21–64
(millions)
Worker Category Total 156.5 130.4 110.0 20.5 92.2 Works for an employer sponsoring a plan 76.0 69.6 53.3 16.3 55.7 Participating in a plan 61.6 57.6 43.0 14.6 49.3
(percentage)
Worker Category Total 100.0% 100.0% 100.0% 100.0% 100.0% Works for an employer sponsoring a plan 48.6 53.4 48.5 79.3 60.4 Participating in a plan 39.4 44.2 39.1 71.5 53.5
Source: Employee Benefit Research Institute estimates from the 2013 March Current Population Survey.
However, this measure of the work force contains the unincorporated self-employed and those who typically have a looser connection to the work force—individuals under age 21 and older than age 64. Therefore, a different measure of the work force is examined: wage and salary workers ages 21–64, representing individuals who have a stronger connection to the work force and work for someone else.15 For this group, the sponsorship rate increases to 53.4 per-cent, and the portion participating increases to 44.2 percent. When separating these wage and salary workers into the public and private sectors, the percentages participating differ significantly. Seventy-one and one-half percent of the public-sector workers participated in an employment-based retirement plan, compared with 39.1 percent of the private-sector workers.
A more restrictive definition of the work force, which more closely resembles the types of workers who generally must be covered by a retirement plan in accordance with the Employee Retirement Income Security Act of 1974 (ERISA), is full-time, full-year wage and salary workers ages 21–64.16 Under this definition, 60.4 percent of these workers worked for employers sponsoring a plan, and 53.5 percent of the workers participated in a retirement plan.
The remainder of this section focuses on wage and salary workers, presenting the differences across a set of characteristics, which, in general, were representative of all the work-force populations, except where noted.
Worker Characteristics
The percentage of wage and salary workers ages 21–64 who participated in a retirement plan in 2012 increased with age (Figure 2). For those ages 21–24, 16.4 percent participated in a plan, compared with 52.4 percent of those ages
ebri.org Issue Brief • November 2013 • No. 392 10
55–64. Generally speaking, male workers were slightly more likely to have participated in a plan than females. However, female full-time, full-year workers were more likely to have participated in a plan than male full-time, full-year workers.
Being white or having attained a higher educational level were also associated with higher probabilities of participating in a retirement plan. Among white wage and salary workers ages 21‒64, 49.1 percent participated in a plan, compared with 27.3 percent of Hispanic workers. Approximately 16 percent of workers from that category without a high school diploma participated in a plan, and the percentage participating increased with educational attainment, as high as 65.5 percent of those holding graduate or professional degrees.
Married workers were more likely to participate in a plan, while never-married workers had the lowest probability, and the higher an individual’s earnings $10,000 and above, the more likely he or she participated in a plan. Less than one-fifth (16.2 percent) of wage and salary workers ages 21‒64 who had annual earnings of $10,000–$19,999 participated in a plan, compared with 69.8 percent of those earning $75,000 or more. Furthermore, full-time, full-year workers were by far the most likely type to participate in a retirement plan. Wage and salary workers ages 21‒64 working in professional and related occupations had the highest probability of participating in a retirement plan, at 58.5 percent. In comparison, workers in farming, fishing, and forestry occupations had the lowest likelihood of participating in a plan, at 9.6 percent.
Employer Characteristics
The probability of a worker participating in an employment-based retirement plan increased significantly along with the size of his or her employer (Figure 2). For wage and salary workers ages 21‒64 who worked for employers with fewer than 10 employees, 13.5 percent participated in a plan, compared with 54.8 percent of those working for employers with 1,000 or more employees. The sectors and industries of the employers also had an impact on the likelihood of participating in a plan. Workers in the manufacturing industry and the transportation, utilities, information, and financial industry had the highest probability of participating, while those in the other-services industry had the lowest probability. Public-sector workers were significantly more likely to participate than private-sector workers.
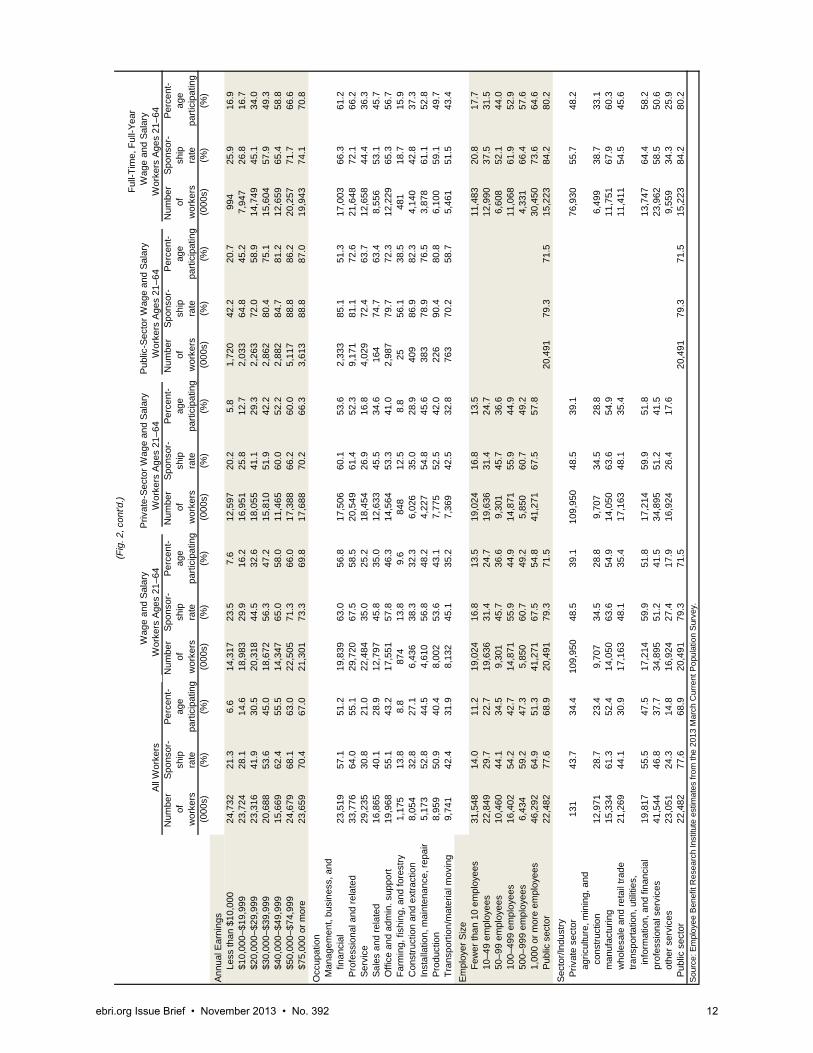
Further Demographic Breaks GenderFemale wage and salary workers ages 21–64 were found to participate in a retirement plan at a lower
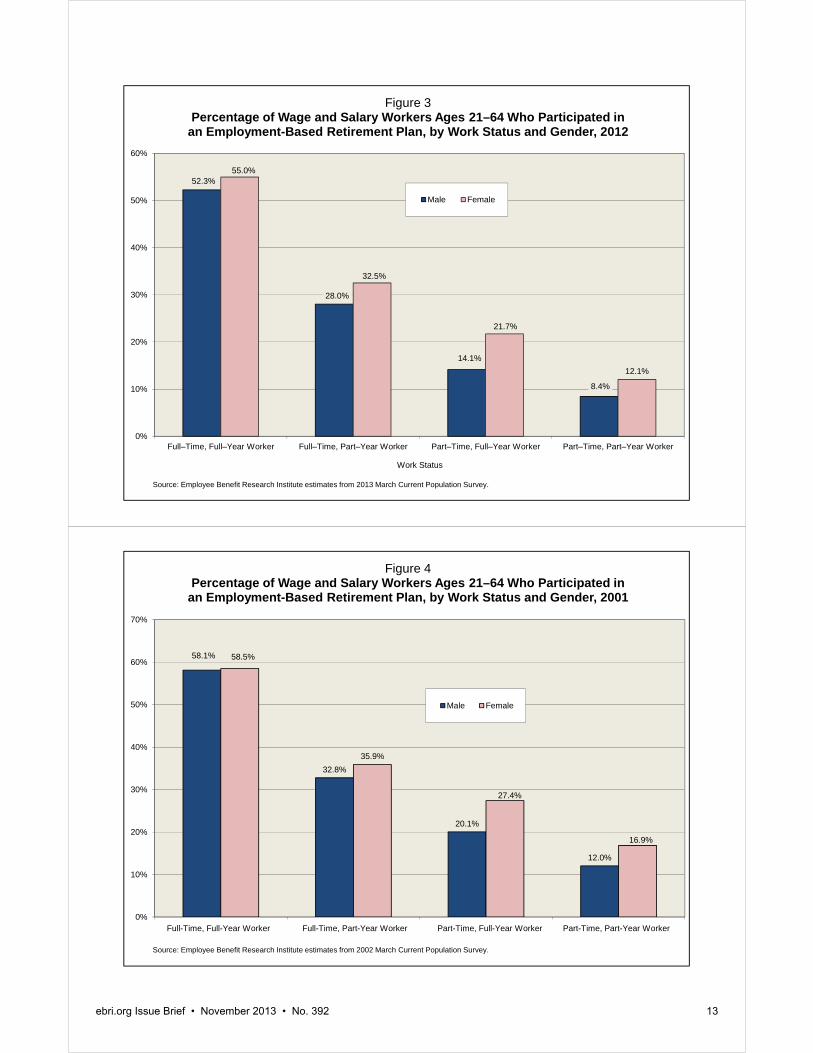
level than males. However, among full-time, full-year workers of these same ages, females had a higher rate of participation in a plan (55.0 percent for women, compared with 52.3 percent for men). In fact, across all work-status categories, females were more likely to participate in a retirement plan than males (Figure 3). This result has persisted since 2001, when the full-time, full-year participation level was slightly higher for females than for males at 58.5 per-cent to 58.1 percent (Figure 4).
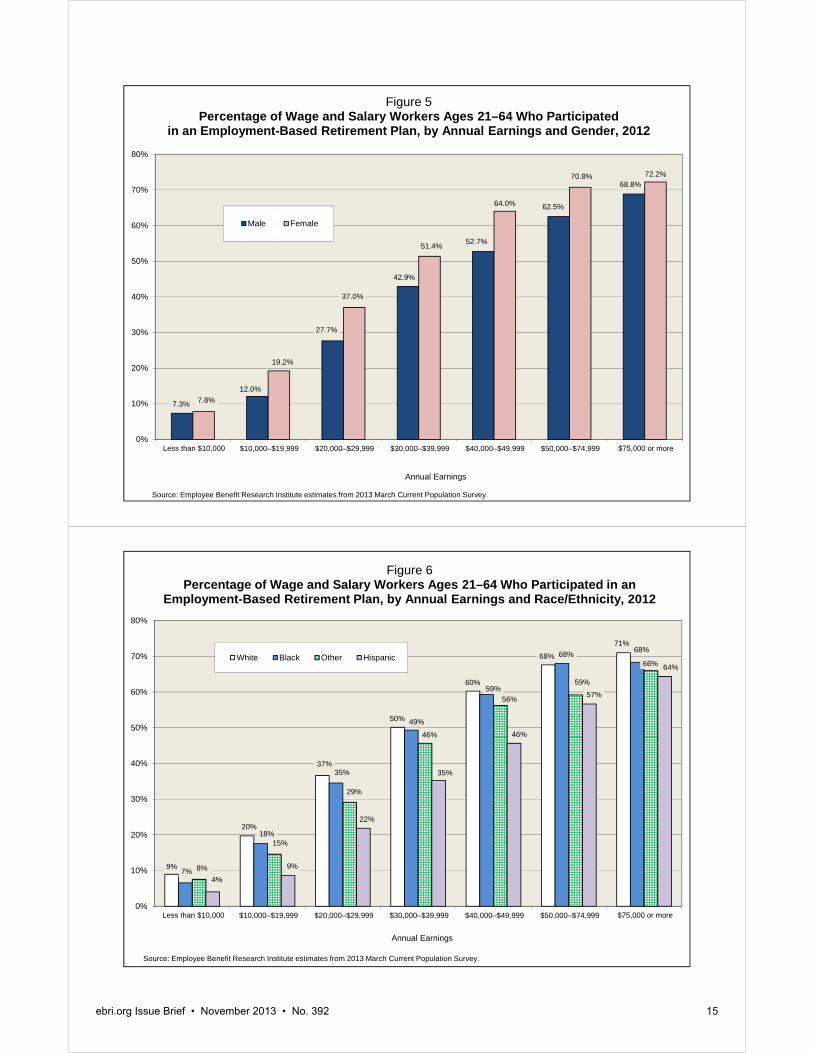
Furthermore, when examining participation by earnings level, the proportion of females participating in a plan was significantly higher than males at each earnings level, except the lowest category where it was only slightly higher (Figure 5). Consequently, it appears that female workers’ lower probability of participation in the aggregate was a result of their overall lower average earnings and lower rates of full-time work in comparison with males—characteristics often associated with lower participation levels.
Race/EthnicityAnalysis of race/ethnicity by earnings level shows that Hispanic wage and salary workers were significantly less likely than both white and black workers to participate in a retirement plan.17 The overall gap between the percentages of black and white plan participants narrowed when compared across earnings levels, with blacks surpassing whites at the income level of $50,000–$74,999 (Figure 6). In contrast, the gap between Hispanics and whites persisted in all earnings groups, although it showed some narrowing in the higher-earnings groups.
Fu
ll-Ti
me,
Ful
l-Yea
r
Wag
e an
d Sa
lary
Pr
ivat
e-Se
ctor
Wag
e an
d Sa
lary
Publ
ic-S
ecto
r Wag
e an
d Sa
lary
W
age
and
Sala
ry
All
Wor
kers
W
orke
rs A
ges
21–6
4
W
orke
rs A
ges
21–6
4
W
orke
rs A
ges
21–6
4
W
orke
rs A
ges
21–6
4
Num
ber
Spon
sor-
Perc
ent-
Num
ber
Spon
sor-
Perc
ent-
Num
ber
Spon
sor-
Perc
ent-
Num
ber
Spon
sor-
Perc
ent-
Num
ber
Spon
sor-
Perc
ent-
ofsh
ipag
eof
ship
age
ofsh
ipag
eof
ship
age
ofsh
ipag
ew
orke
rsra
tepa
rtici
patin
gw
orke
rsra
tepa
rtici
patin
gw
orke
rsra
tepa
rtici
patin
gw
orke
rsra
tepa
rtici
patin
gw
orke
rsra
tepa
rtici
patin
g(0
00s)
(%)
(%)
(000
s)(%
)(%
)(0
00s)
(%)
(%)
(000
s)(%
)(%
)(0
00s)
(%)
(%)
Age
20
or y
oung
er8,
389
21.3
%4.
1%
21–2
412
,777
32.9
16.2
12,5
6733
.4%
16.4
%11
,425
31.2
%14
.8%
1,14
254
.5%
32.6
%5,
161
42.7
%28
.7%
25
–34
33,2
7847
.136
.132
,020
48.7
37.3
27,9
9644
.833
.34,
024
75.7
65.4
22,3
2255
.245
.7
35–4
432
,166
52.7
45.4
30,2
0955
.547
.925
,376
50.6
42.7
4,83
481
.375
.122
,894
60.9
54.6
45
–54
34,4
3955
.549
.131
,909
59.2
52.4
26,2
3454
.147
.15,
675
82.8
76.9
24,5
3064
.959
.7
55–6
425
,966
55.6
48.9
23,7
3959
.752
.418
,923
53.9
46.5
4,81
682
.275
.817
,246
64.5
60.5
65
or o
lder
9,45
141
.131
.6G
ende
r M
ale
82,3
0348
.239
.867
,923
53.1
44.8
59,0
8248
.940
.48,
841
81.0
74.4
51,8
6058
.952
.3 F
emal
e74
,163
49.1
38.9
62,5
2153
.643
.550
,871
48.1
37.6
11,6
5078
.169
.340
,293
62.4
55.0
Rac
e/Et
hnic
ity W
hite
103,
950
52.4
43.3
85,1
6858
.249
.171
,180
53.5
44.1
13,9
8882
.274
.761
,026
65.2
58.5
Bla
ck16
,808
48.4
36.9
14,6
3451
.440
.111
,802
45.8
33.8
2,83
174
.966
.59,
954
59.4
51.0
His
pani
c23
,976
33.1
24.4
20,5
8036
.027
.318
,401
31.8
23.1
2,17
971
.462
.213
,951
41.9
34.3
Oth
er11
,735
46.4
38.5
10,0
6250
.742
.88,
569
46.9
39.0
1,49
372
.664
.17,
221
57.5
51.4
Educ
atio
n N
o hi
gh s
choo
l dip
lom
a14
,961
20.9
12.0
9,99
224
.215
.99,
627
23.0
14.9
366
55.9
41.5
6,03
629
.221
.4 H
igh
scho
ol d
iplo
ma
41,8
3342
.432
.834
,740
46.4
36.7
30,7
9142
.632
.93,
949
75.7
66.8
24,1
9353
.144
.9 S
ome
colle
ge47
,188
47.6
36.7
39,3
4952
.341
.533
,827
48.5
37.4
5,52
275
.666
.325
,975
61.0
53.0
Bac
helo
r's d
egre
e33
,826
59.4
51.2
30,3
8062
.854
.324
,900
58.8
50.1
5,48
081
.173
.523
,322
68.0
61.9
Gra
duat
e/pr
ofnl
. deg
ree
18,6
6067
.461
.415
,984
71.4
65.5
10,8
0964
.558
.35,
175
86.0
80.6
12,6
2774
.470
.6 M
arita
l Sta
tus
M
arrie
d85
,025
53.8
46.9
73,3
1258
.151
.060
,269
52.8
45.6
13,0
4282
.475
.955
,317
63.5
58.2
W
idow
ed3,
003
46.1
34.9
1,72
754
.243
.61,
418
49.1
37.3
309
77.5
72.4
1,19
561
.151
.4
Div
orce
d17
,114
51.3
42.6
14,6
7755
.246
.012
,272
50.4
40.7
2,40
579
.473
.210
,745
62.1
54.4
S
epar
ated
3,74
541
.931
.93,
322
44.9
34.4
2,92
241
.330
.540
071
.162
.22,
258
52.5
43.4
N
ever
mar
ried
47,5
7939
.026
.737
,407
44.1
31.1
33,0
7340
.627
.64,
334
70.9
58.1
22,6
3952
.842
.6W
ork
Stat
us F
ull-t
ime,
full-
year
10
2,31
057
.350
.692
,153
60.4
53.5
76,9
3055
.748
.215
,223
84.2
80.2
92,1
5360
.153
.5 F
ull-t
ime,
par
t-yea
r 20
,152
40.0
27.6
16,6
3143
.030
.114
,059
37.2
24.1
2,57
174
.463
.0 P
art-t
ime,
full-
year
17
,525
29.8
16.4
12,1
4433
.119
.411
,027
30.9
17.8
1,11
755
.435
.2 P
art-t
ime,
par
t-yea
r16
,484
25.1
8.8
9,51
628
.910
.87,
937
23.2
7.5
1,57
957
.627
.3
Figu
re 2
Per
cen
tag
e o
f V
ario
us
Wo
rk F
orc
es W
ho
Wo
rked
fo
r an
Em
plo
yer
Th
at S
po
nso
red
a R
etir
emen
t P
lan
an
d t
he
Per
cen
tag
e W
ho
Par
tici
pat
ed i
n a
Pla
n,
by
Var
iou
s C
har
acte
rist
ics,
201
2
(co
nt'd
.)
ebri.org Issue Brief • November 2013 • No. 392 11
Ful
l-Tim
e, F
ull-Y
ear
W
age
and
Sala
ry
Priv
ate-
Sect
or W
age
and
Sala
r yPu
blic
-Sec
tor W
age
and
Sala
ry
Wag
e an
d Sa
lary
A
ll W
orke
rs
W
orke
rs A
ges
21–6
4
W
orke
rs A
ges
21–6
4
W
orke
rs A
ges
21–6
4
W
orke
rs A
ges
21–6
4
Num
ber
Spon
sor-
Perc
ent-
Num
ber
Spon
sor-
Perc
ent-
Num
ber
Spon
sor-
Perc
ent-
Num
ber
Spon
sor-
Perc
ent-
Num
ber
Spon
sor-
Perc
ent-
o fsh
ipag
eof
ship
age
ofsh
ipag
eof
ship
age
ofsh
ipag
ew
orke
rsra
tepa
rtici
patin
gw
orke
rsra
tepa
rtici
patin
gw
orke
rsra
tepa
rtici
patin
gw
orke
rsra
tepa
rtici
patin
gw
orke
rsra
tepa
rtici
patin
g(0
00s)
(%)
(%)
(000
s)(%
)(%
)(0
00s)
(%)
(%)
(000
s)(%
)(%
)(0
00s)
(%)
(%)
Annu
al E
arni
ngs
Les
s th
an $
10,0
0024
,732
21.3
6.6
14,3
1723
.57.
612
,597
20.2
5.8
1,72
042
.220
.799
425
.916
.9 $
10,0
00–$
19,9
9923
,724
28.1
14.6
18,9
8329
.916
.216
,951
25.8
12.7
2,03
364
.845
.27,
947
26.8
16.7
$20
,000
–$29
,999
23,3
1641
.930
.520
,318
44.5
32.6
18,0
5541
.129
.32,
263
72.0
58.9
14,7
4945
.134
.0 $
30,0
00–$
39,9
9920
,688
53.6
45.0
18,6
7256
.347
.215
,810
51.9
42.2
2,86
280
.475
.115
,604
57.9
49.3
$40
,000
–$49
,999
15,6
6962
.455
.514
,347
65.0
58.0
11,4
6560
.052
.22,
882
84.7
81.2
12,6
5965
.458
.8 $
50,0
00–$
74,9
9924
,679
68.1
63.0
22,5
0571
.366
.017
,388
66.2
60.0
5,11
788
.886
.220
,257
71.7
66.6
$75
,000
or m
ore
23,6
5970
.467
.021
,301
73.3
69.8
17,6
8870
.266
.33,
613
88.8
87.0
19,9
4374
.170
.8O
ccup
atio
n M
anag
emen
t, bu
sine
ss, a
nd
f
inan
cial
23,5
1957
.151
.219
,839
63.0
56.8
17,5
0660
.153
.62,
333
85.1
51.3
17,0
0366
.361
.2 P
rofe
ssio
nal a
nd re
late
d33
,776
64.0
55.1
29,7
2067
.558
.520
,549
61.4
52.3
9,17
181
.172
.621
,648
72.1
66.2
Ser
vice
29,2
3530
.821
.022
,484
35.0
25.2
18,4
5426
.916
.84,
029
72.4
63.7
12,6
5844
.436
.3 S
ales
and
rela
ted
16,8
6540
.128
.912
,797
45.8
35.0
12,6
3345
.534
.616
474
.763
.48,
556
53.1
45.7
Offi
ce a
nd a
dmin
. sup
port
19,9
6855
.143
.217
,551
57.8
46.3
14,5
6453
.341
.02,
987
79.7
72.3
12,2
2965
.356
.7 F
arm
ing,
fish
ing,
and
fore
str y
1,17
513
.88.
887
413
.89.
684
812
.58.
825
56.1
38.5
481
18.7
15.9
Con
stru
ctio
n an
d ex
tract
ion
8,05
432
.827
.16,
436
38.3
32.3
6,02
635
.028
.940
986
.982
.34,
140
42.8
37.3
Ins
talla
tion,
mai
nten
ance
, rep
air
5,17
352
.844
.54,
610
56.8
48.2
4,22
754
.845
.638
378
.976
.53,
878
61.1
52.8
Pro
duct
ion
8,95
950
.940
.48,
002
53.6
43.1
7,77
552
.542
.022
690
.480
.86,
100
59.1
49.7
Tra
nspo
rtion
/mat
eria
l mov
ing
9,74
142
.431
.98,
132
45.1
35.2
7,36
942
.532
.876
370
.258
.75,
461
51.5
43.4
Empl
oyer
Siz
e F
ewer
than
10
empl
oyee
s31
,548
14.0
11.2
19,0
2416
.813
.519
,024
16.8
13.5
11,4
8320
.817
.7 1
0–49
em
ploy
ees
22,8
4929
.722
.719
,636
31.4
24.7
19,6
3631
.424
.712
,990
37.5
31.5
50–
99 e
mpl
oyee
s10
,460
44.1
34.5
9,30
145
.736
.69,
301
45.7
36.6
6,60
852
.144
.0 1
00–4
99 e
mpl
oyee
s16
,402
54.2
42.7
14,8
7155
.944
.914
,871
55.9
44.9
11,0
6861
.952
.9 5
00–9
99 e
mpl
oyee
s6,
434
59.2
47.3
5,85
060
.749
.25,
850
60.7
49.2
4,33
166
.457
.6 1
,000
or m
ore
empl
oyee
s46
,292
64.9
51.3
41,2
7167
.554
.841
,271
67.5
57.8
30,4
5073
.664
.6 P
ublic
sec
tor
22,4
8277
.668
.920
,491
79.3
71.5
20,4
9179
.371
.515
,223
84.2
80.2
Sect
or/In
dust
ry P
rivat
e se
ctor
131
43.7
34.4
109,
950
48.5
39.1
109,
950
48.5
39.1
76,9
3055
.748
.2 a
gric
ultu
re, m
inin
g, a
nd
cons
truct
ion
12,9
7128
.723
.49,
707
34.5
28.8
9,70
734
.528
.86,
499
38.7
33.1
man
ufac
turin
g15
,334
61.3
52.4
14,0
5063
.654
.914
,050
63.6
54.9
11,7
5167
.960
.3 w
hole
sale
and
reta
il tra
de21
,269
44.1
30.9
17,1
6348
.135
.417
,163
48.1
35.4
11,4
1154
.545
.6 tr
ansp
orta
tion,
util
ities
,
info
rmat
ion,
and
fina
ncia
l19
,817
55.5
47.5
17,2
1459
.951
.817
,214
59.9
51.8
13,7
4764
.458
.2 p
rofe
ssio
nal s
ervi
ces
41,5
4446
.837
.734
,895
51.2
41.5
34,8
9551
.241
.523
,962
58.5
50.6
oth
er s
ervi
ces
23,0
5124
.314
.816
,924
27.4
17.9
16,9
2426
.417
.69,
559
34.3
25.9
Pub
lic s
ecto
r22
,482
77.6
68.9
20,4
9179
.371
.520
,491
79.3
71.5
15,2
2384
.280
.2S
ourc
e: E
mpl
oyee
Ben
efit
Res
earc
h In
stitu
te e
stim
ates
from
the
2013
Mar
ch C
urre
nt P
opul
atio
n S
urve
y.
(Fig
. 2, c
on
t'd.)
ebri.org Issue Brief • November 2013 • No. 392 12
52.3%
28.0%
14.1%
8.4%
55.0%
32.5%
21.7%
12.1%
0%
10%
20%
30%
40%
50%
60%
Full–Time, Full–Year Worker Full–Time, Part–Year Worker Part–Time, Full–Year Worker Part–Time, Part–Year Worker
Figure 3Percentage of Wage and Salary Workers Ages 21–64 Who Participated in
an Employment-Based Retirement Plan, by Work Status and Gender, 2012
Male Female
Source: Employee Benefit Research Institute estimates from 2013 March Current Population Survey.
Work Status
58.1%
32.8%
20.1%
12.0%
58.5%
35.9%
27.4%
16.9%
0%
10%
20%
30%
40%
50%
60%
70%
Full–Time, Full–Year Worker Full–Time, Part–Year Worker Part–Time, Full–Year Worker Part–Time, Part–Year Worker
Figure 4Percentage of Wage and Salary Workers Ages 21–64 Who Participated in
an Employment-Based Retirement Plan, by Work Status and Gender, 2001
Male Female
Source: Employee Benefit Research Institute estimates from 2002 March Current Population Survey.
Full-Time, Full-Year Worker Full-Time, Part-Year Worker Part-Time, Full-Year Worker Part-Time, Part-Year Worker
ebri.org Issue Brief • November 2013 • No. 392 13

ebri.org Issue Brief • November 2013 • No. 392 14
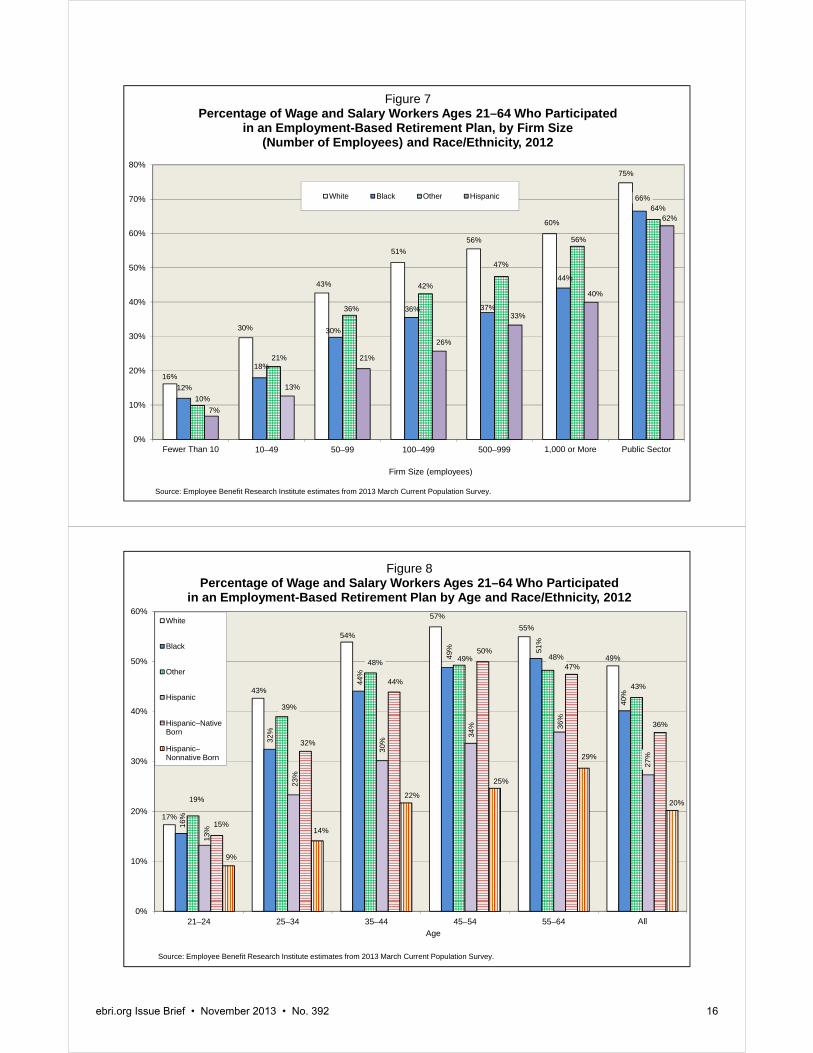
Another potential contributor to the overall lower level of participation by Hispanic workers could be the characteristics of their employers, such as firm size (number of employees). However, with the exception of public-sector employers, Hispanic workers had significantly lower levels of participation in employment-based retirement plans than workers of all the other races/ethnicities across all firm sizes (Figure 7). For workers at the smallest employers (fewer than 10 employees), 16 percent of white wage and salary workers participated in a plan, compared with 7 percent of the Hispanic workers. While these levels increased along with employer size, white workers maintained a significantly higher participation level among those working for employers with 1,000 or more employees (60 percent for whites vs. 40 percent for Hispanics).
The ages of the workers and their races/ethnicities could not explain all the differences in the level of participation, as the Hispanic workers’ participation levels were significantly lower than the white workers’ levels at each age (Figure 8). However, a dramatic shift in Hispanic-worker participation levels became apparent when analyzed by birthplace—whether born within the United States or outside the United States, regardless of citizenship. Native-born Hispanic workers―those born in the United States―ages 21–64 had participation levels very similar to those of black and other workers, although closer to but still below white workers.18 In contrast, non-native-born Hispanic workers had substantially lower levels of participation across all age groups.
While age is an important factor in retirement plan participation, the earnings levels of non-native-born Hispanics could have been lower across age groups due to possible language and custom barriers. Yet, even across earnings, non-native-born Hispanics had a lower probability of participating in a retirement plan, while native-born Hispanics had participation levels closer to those of white and black Americans (Figure 9).
Consequently, while black workers who had higher earnings or who were older had levels of retirement plan participation approaching those of white workers, all Hispanic workers combined had persistently lower levels of participation across earnings, age, and employer size. When accounting for location of birth, native-born Hispanic workers revealed participation levels closer to but still below those of black and white workers. In contrast, non-native-born Hispanic workers had levels far below those of all the other workers.
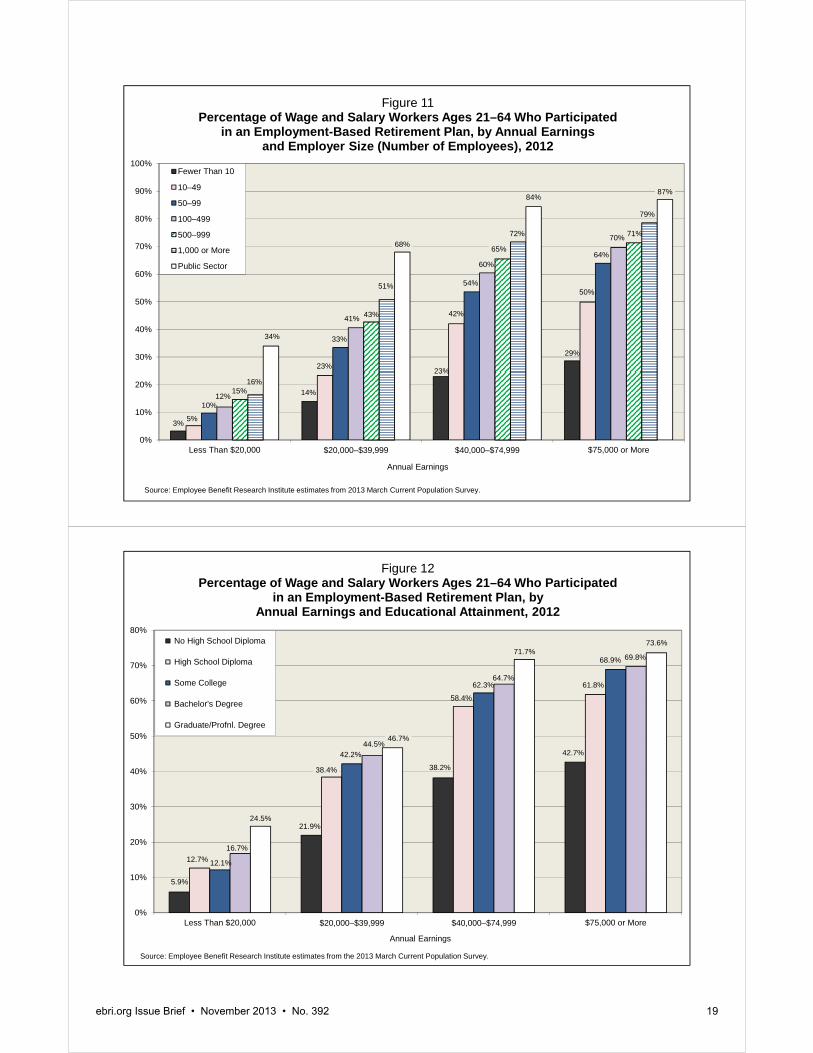
Firm SizeEmployees of smaller firms, those with fewer employees, were significantly less likely to participate in a retirement plan. A potential explanation could be that these firms employed workers with characteristics associated with lower participation, such as being younger or lower paid. However, even controlling for age, workers at smaller employers still had persistently lower levels of participation across the age groups (Figure 10). Furthermore, across various earnings levels, workers at small employers were less likely to participate in an employment-based retirement plan (Figure 11). Even among workers making $75,000 or more, a considerable disparity existed—just 29 percent of those in that income category working for the smallest employers participated in a plan, compared with 79 percent of those working for employers with 1,000 or more employees.
EducationWorkers with lower educational attainment have lower levels of retirement plan participation. While educational attainment has a strong correlation with earnings, when controlling for that factor, the most highly educated still had the highest levels of participation, and those with the least education (no high school diploma) still had significantly lower levels of participation than those with at least a high school diploma (Figure 12). Specifically, 42.7 percent of those without a high school diploma who were making $75,000 or more participated in a retirement plan, compared with 61.8 percent of those with the same earnings level, but with only a high school diploma and 73.6 percent for those with a graduate or professional degree. Consequently, the education level of workers clearly plays a role in the likelihood of participation in a retirement plan beyond determining earnings levels.
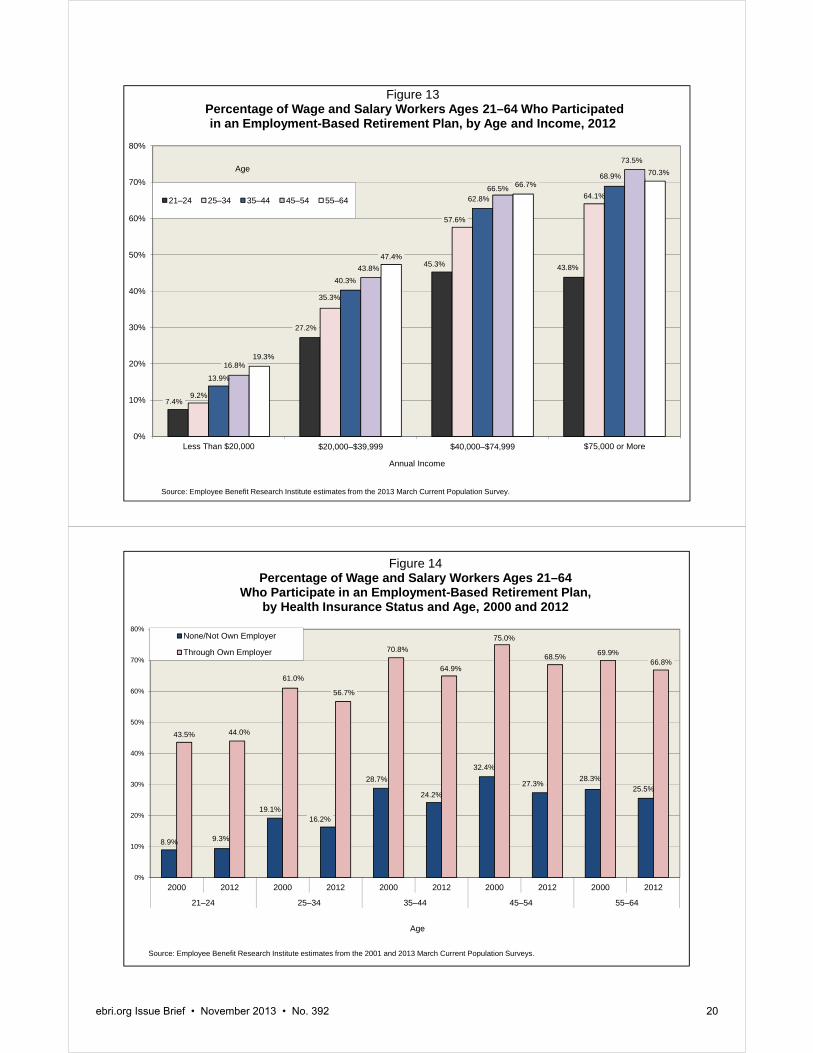
Age—Younger workers’ significantly lower likelihood of participating in a plan could be the result of having lower incomes at the start of their careers. However, when looking at workers by age across earnings, younger workers were still less likely to be retirement plan participants than older workers with the same earnings (Figure 13). Even among the highest earners ($75,000 or more), only 43.8 percent of those ages 21–24 participated in a plan, compared with 73.5 percent of those ages 45–54.
7.3%
12.0%
27.7%
42.9%
52.7%
62.5%
68.8%
7.8%
19.2%
37.0%
51.4%
64.0%
70.8% 72.2%
0%
10%
20%
30%
40%
50%
60%
70%
80%
Less than $10,000 $10,000–$19,999 $20,000–$29,999 $30,000–$39,999 $40,000–$49,999 $50,000–$74,999 $75,000 or more
Male Female
Source: Employee Benefit Research Institute estimates from 2013 March Current Population Survey.
Annual Earnings
Figure 5Percentage of Wage and Salary Workers Ages 21–64 Who Participated
in an Employment-Based Retirement Plan, by Annual Earnings and Gender, 2012
9%
20%
37%
50%
60%
68%
71%
7%
18%
35%
49%
59%
68% 68%
8%
15%
29%
46%
56%
59%
66%
4%
9%
22%
35%
46%
57%
64%
0%
10%
20%
30%
40%
50%
60%
70%
80%
Less than $10,000 $10,000–$19,999 $20,000–$29,999 $30,000–$39,999 $40,000–$49,999 $50,000–$74,999 $75,000 or more
White Black Other Hispanic
Source: Employee Benefit Research Institute estimates from 2013 March Current Population Survey.
Annual Earnings
Figure 6Percentage of Wage and Salary Workers Ages 21–64 Who Participated in an
Employment-Based Retirement Plan, by Annual Earnings and Race/Ethnicity, 2012
ebri.org Issue Brief • November 2013 • No. 392 15
16%
30%
43%
51%56%
60%
75%
12%
18%
30%
36% 37%
44%
66%
10%
21%
36%
42%
47%
56%
64%
7%
13%
21%
26%
33%
40%
62%
0%
10%
20%
30%
40%
50%
60%
70%
80%
Fewer Than 10 10–49 50–99 100–499 500–999 1,000 or More Public Sector
Figure 7Percentage of Wage and Salary Workers Ages 21–64 Who Participated
in an Employment-Based Retirement Plan, by Firm Size (Number of Employees) and Race/Ethnicity, 2012
White Black Other Hispanic
Source: Employee Benefit Research Institute estimates from 2013 March Current Population Survey.
Firm Size (employees)
17%
43%
54%
57%55%
49%
16%
32%
44%
49% 51
%
40%
19%
39%
48% 49% 48%
43%
13%
23%
30%
34% 36
%
27%
15%
32%
44%
50%
47%
36%
9%
14%
22%
25%
29%
20%
0%
10%
20%
30%
40%
50%
60%
21–24 25–34 35–44 45–54 55–64 All
Figure 8Percentage of Wage and Salary Workers Ages 21–64 Who Participated
in an Employment-Based Retirement Plan by Age and Race/Ethnicity, 2012
White
Black
Other
Hispanic
Hispanic–Native Born
Hispanic–Nonnative Born
Source: Employee Benefit Research Institute estimates from 2013 March Current Population Survey.
Age
ebri.org Issue Brief • November 2013 • No. 392 16

14.8%
43.4%
64.8%
71.0%
12.8%
41.4%
64.3%
68.3%
11.5%
37.1%
58.1%
66.0%
7.0%
27.4
%
51.6
%
64.4
%
10.0%
35.0%
57.8%
68.7%
5.1%
21.7%
43.4%
58.1%
0%
10%
20%
30%
40%
50%
60%
70%
80%
Less Than $20,000 $20,000–$39,999 $40,000–$74,999 $75,000 or More
Annual Earnings
Figure 9 Percentage of Wage and Salary Workers Ages 21–64 Who Participated
in an Employment-Based Retirement Plan, by Race/Ethnicity With Hispanic Detail and Annual Earnings, 2012
White
Black
Other
Hispanic
Hispanic–Native Born
Hispanic–Nonnative Born
Source: Employee Benefit Research Institute estimates from 2013 March Current Population Survey.
5%
10%13%
17%18%
7%
20%
28%31% 31%
17%
29%
40%
46% 45%
17%
36%
47%
54% 54%
19%
40%
54%58% 59%
21%
48%
61%
65% 65%
33%
65%
75% 77%76%
0%
10%
20%
30%
40%
50%
60%
70%
80%
90%
21–24 25–34 35–44 45–54 55–64
Figure 10Percentage of Wage and Salary Workers Ages 21–64
Who Participated in an Employment-Based Retirement Plan, by Age and Employer Size (Number of Employees), 2012
Fewer Than 10
10–49
50–99
100–499
500–999
1,000 or More
Public Sector
Source: Employee Benefit Research Institute estimates from 2013 March Current Population Survey.
Age
ebri.org Issue Brief • November 2013 • No. 392 17

ebri.org Issue Brief • November 2013 • No. 392 18
Health Insurance/StatusAn important risk to a retiree’s finances is his or her health status and health care needs.19 The availability of employment-based health insurance from the worker’s own employer and the worker’s health status were also correlated with participation in an employment-based retirement plan. Across all ages, workers with employment-based health insurance from their own employers were more than twice as likely to participate in a retirement plan as those without health insurance from their own employers (Figure 14). For instance, among workers ages 45–54 in 2012, 68.5 percent of those with health insurance through their own employer participated in an employment-based retirement plan, compared with 27.3 percent of those without health insurance through their own employer. Similar disparities occurred in 2000 in participation levels among those with and without employment-based health insurance through their own employer.
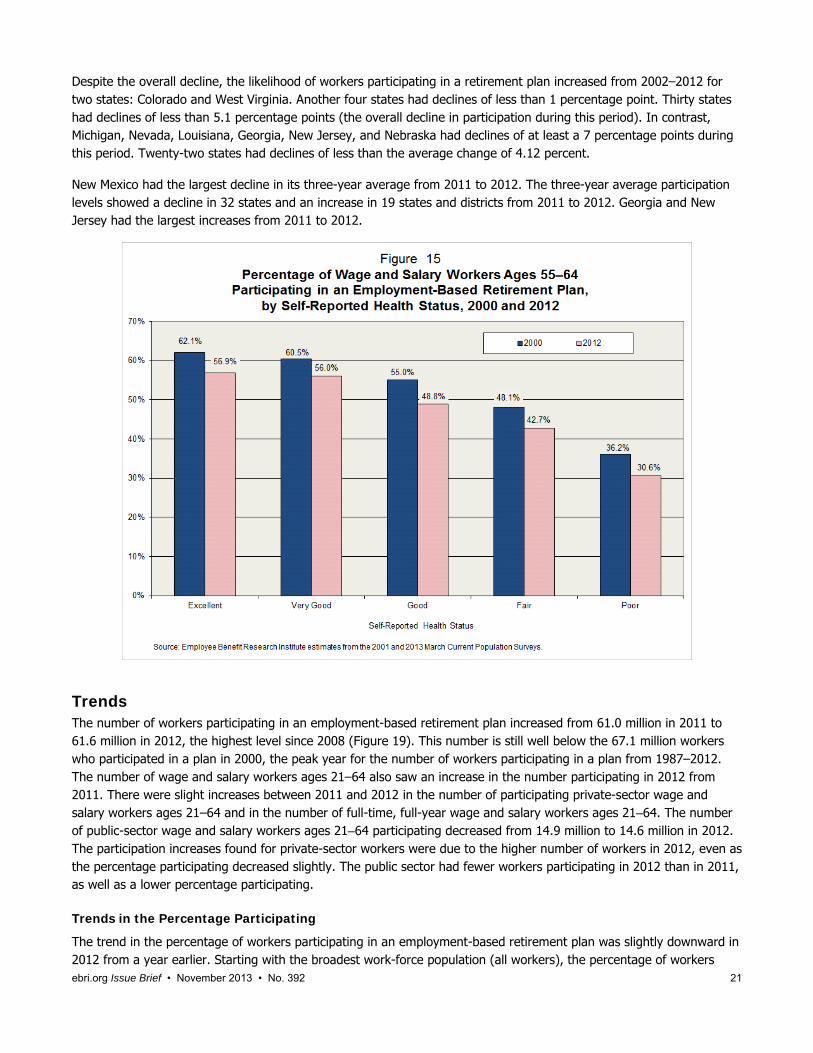
As the self-reported health status of a worker decreases, the likelihood of participating in a plan also decreases. For example, for workers ages 55–64 who reported having excellent health, 56.9 percent participated in a plan in 2012. However, among workers of the same age who reported poor health, only 30.6 percent participated in a plan (Figure 15). The same downward trend with health status occurred in 2000.
Geographic Differences Not only do the workers’ demographic characteristics affect the probability of their participation in an employment-based retirement plan, but their geographic location also has an impact.20 Wage and salary workers ages 21–64 living in New Mexico had the lowest probability (32.1 percent) of participating in a plan in 2012, while those living in Iowa had the highest probability (54.1 percent) (Figure 16). For other work-force definitions that included private-sector workers, Wisconsin workers had the highest probability (64.2 percent) of participation among full-time, full-year wage and salary workers. Minnesota workers had the highest level for private-sector wage and salary workers ages 21‒64 (50.0 percent), and District of Columbia workers had the highest participation levels for all workers (49.7 percent). At the bottom of the rankings, full-time, full-year wage and salary workers in Nevada had the lowest probability (39.7 per-cent) of participation. New Mexico workers also had the lowest probability for private-sector wage and salary workers ages 21‒64 (22.1 percent) and for all workers (28.1 percent). Among public-sector wage and salary workers, Maryland workers had the highest percentage of participation (80.4 percent), while the lowest level of participation among these public-sector workers was for those living in New Mexico (56.4 percent).21
Using wage and salary workers ages 21–64 as the proxy for the other work-force populations (with the exception of the public-sector workers), regional differences were found across the United States and among the states. The states with the lowest levels of participation—e.g., New Mexico, Florida, Nevada, Texas, and Arizona—were in the South and West (Figure 16). The states with the highest participation were in the Mid-Atlantic and upper Midwest—e.g., Iowa, Minnesota, District of Columbia, Wisconsin, and Maryland.22 In general, the Midwestern, Mid-Atlantic, and Northeastern states had the higher participation levels, while the Southern and Western states had the lowest levels.
Certain consolidated statistical areas (CSAs) were identified in the CPS, and again those CSAs located in the South and West—e.g., Johnson City-Kingsport-Bristol, VA, and Los Angeles-Long Beach-Riverside, CA—had the lowest retirement plan participation levels for the work-force definitions including private-sector workers (Figure 17). Workers from the Appleton-Oshkosh-Neenah, WI, CSA had the highest participation level for these same worker definitions. For public-sector wage and salary workers, workers form the Fresno-Madera, CA, CSA had the lowest level, while workers from the Appleton-Oshkosh-Neenah, WI, CSA had the highest participation level.
While the sample sizes of the less populated states are small (which results in large standard errors of the state-by-state estimates for retirement plan participation from the CPS), using a three-year average for the estimates can mitigate the impact of any potential sampling errors affecting year-to-year changes. Therefore, a three-year-average trend is presented to examine how the participation levels have changed in recent years (2002–2012) across states. The three-year average consists of the current year plus the two previous years, so that the 2012 three-year average consists of the estimates from 2012, 2011, and 2010. The overall three-year average of the retirement plan-participation level declined from 49.7 percent in 2002 to 44.6 percent in 2012 (Figure 18).
3%
14%
23%
29%
5%
23%
42%
50%
10%
33%
54%
64%
12%
41%
60%
70%
15%
43%
65%
71%
16%
51%
72%
79%
34%
68%
84%87%
0%
10%
20%
30%
40%
50%
60%
70%
80%
90%
100%
Less Than $20,000 $20,000–$39,999 $40,000–$74,999 $75,000 or More
Figure 11Percentage of Wage and Salary Workers Ages 21–64 Who Participated
in an Employment-Based Retirement Plan, by Annual Earnings and Employer Size (Number of Employees), 2012
Fewer Than 10
10–49
50–99
100–499
500–999
1,000 or More
Public Sector
Source: Employee Benefit Research Institute estimates from 2013 March Current Population Survey.
Annual Earnings
5.9%
21.9%
38.2%
42.7%
12.7%
38.4%
58.4%
61.8%
12.1%
42.2%
62.3%
68.9%
16.7%
44.5%
64.7%
69.8%
24.5%
46.7%
71.7%73.6%
0%
10%
20%
30%
40%
50%
60%
70%
80%
Less Than $20,000 $20,000–$39,999 $40,000–$74,999 $75,000 or More
Annual Earnings
Figure 12Percentage of Wage and Salary Workers Ages 21–64 Who Participated
in an Employment-Based Retirement Plan, by Annual Earnings and Educational Attainment, 2012
No High School Diploma
High School Diploma
Some College
Bachelor's Degree
Graduate/Profnl. Degree
Source: Employee Benefit Research Institute estimates from the 2013 March Current Population Survey.
ebri.org Issue Brief • November 2013 • No. 392 19
7.4%
27.2%
45.3% 43.8%
9.2%
35.3%
57.6%
64.1%
13.9%
40.3%
62.8%
68.9%
16.8%
43.8%
66.5%
73.5%
19.3%
47.4%
66.7%70.3%
0%
10%
20%
30%
40%
50%
60%
70%
80%
Less Than $20,000 $20,000–$39,999 $40,000–$74,999 $75,000 or More
Figure 13Percentage of Wage and Salary Workers Ages 21–64 Who Participated in an Employment-Based Retirement Plan, by Age and Income, 2012
21–24 25–34 35–44 45–54 55–64
Source: Employee Benefit Research Institute estimates from the 2013 March Current Population Survey.
Age
Annual Income
8.9% 9.3%
19.1%16.2%
28.7%
24.2%
32.4%
27.3%28.3%
25.5%
43.5% 44.0%
61.0%
56.7%
70.8%
64.9%
75.0%
68.5% 69.9%66.8%
0%
10%
20%
30%
40%
50%
60%
70%
80%
2000 2012 2000 2012 2000 2012 2000 2012 2000 2012
21–24 25–34 35–44 45–54 55–64
Age
Figure 14Percentage of Wage and Salary Workers Ages 21–64
Who Participate in an Employment-Based Retirement Plan, by Health Insurance Status and Age, 2000 and 2012
None/Not Own Employer
Through Own Employer
Source: Employee Benefit Research Institute estimates from the 2001 and 2013 March Current Population Surveys.
ebri.org Issue Brief • November 2013 • No. 392 20
ebri.org Issue Brief • November 2013 • No. 392 21
Despite the overall decline, the likelihood of workers participating in a retirement plan increased from 2002–2012 for two states: Colorado and West Virginia. Another four states had declines of less than 1 percentage point. Thirty states had declines of less than 5.1 percentage points (the overall decline in participation during this period). In contrast, Michigan, Nevada, Louisiana, Georgia, New Jersey, and Nebraska had declines of at least a 7 percentage points during this period. Twenty-two states had declines of less than the average change of 4.12 percent.
New Mexico had the largest decline in its three-year average from 2011 to 2012. The three-year average participation levels showed a decline in 32 states and an increase in 19 states and districts from 2011 to 2012. Georgia and New Jersey had the largest increases from 2011 to 2012.
Trends The number of workers participating in an employment-based retirement plan increased from 61.0 million in 2011 to 61.6 million in 2012, the highest level since 2008 (Figure 19). This number is still well below the 67.1 million workers who participated in a plan in 2000, the peak year for the number of workers participating in a plan from 1987–2012. The number of wage and salary workers ages 21‒64 also saw an increase in the number participating in 2012 from 2011. There were slight increases between 2011 and 2012 in the number of participating private-sector wage and salary workers ages 21‒64 and in the number of full-time, full-year wage and salary workers ages 21‒64. The number of public-sector wage and salary workers ages 21‒64 participating decreased from 14.9 million to 14.6 million in 2012. The participation increases found for private-sector workers were due to the higher number of workers in 2012, even as the percentage participating decreased slightly. The public sector had fewer workers participating in 2012 than in 2011, as well as a lower percentage participating.
Trends in the Percentage Participating
The trend in the percentage of workers participating in an employment-based retirement plan was slightly downward in 2012 from a year earlier. Starting with the broadest work-force population (all workers), the percentage of workers
ebri.org Issue Brief • November 2013 • No. 392 22
participating in an employment-based retirement plan reached 44.4 percent in 2000 before declining to 39.7 percent in 2006 (Figure 19). The percentage subsequently increased to 41.5 percent in 2007—the highest level since 2004—before falling to 39.6 percent in 2009, increasing to 39.8 percent in 2010, and decreasing again to 39.4 percent in 2012.
The other three work-force categories that included private-sector workers followed the same pattern of an increased number of workers in the category participating in a plan, while the percentage participating decreased from 2011 to 2012. In contrast, the number and percentage of public-sector wage and salary workers participating in a plan decreased in 2012. The percentage of these workers fell from 73.2 percent in 2011 to 71.5 percent in 2012, while the number decreased from 14.9 million to 14.6 million.
All the work-force definitions that included private-sector workers showed decreasing participation levels ranging from 0.1 percentage points to 0.4 percentage points from 2011 to 2012 (Figure 20).23 In contrast, public-sector wage and salary workers ages 21–64 showed a decrease of 1.7 percentage points.
The trends in retirement plan participation are different within these work-force definitions, as various worker characteristics (as well as those of their employers) affect these trends. The remainder of this section examines these trends across key worker and firm characteristics.
Trends across Worker Characteristics
The levels of participation for wage and salary workers ages 21–64 had relatively consistent differences across age groups during the 19872012 period (Figure 21). The trends within each age group were fairly consistent across this time period, with each age group’s participation level varying in a relatively narrow range (approximately up to 10 per-centage points). However, one major exception to the overall trend was among workers ages 55–64. From 1987‒1997, their likelihood of participating in a retirement plan was virtually identical to that of workers ages 35–44 and well below that of those ages 45–54, but by 2011 the likelihood of participation among the 55‒64 age group was significantly ahead of that of workers ages 45–54, and 6 percentage points above those ages 35–44, although in 2012, the percentage of workers age 55–64 fell to 52.4 percent, matching that of workers age 45–54.
While the relative differences between the age groups’ participation levels held relatively constant except for workers in the 55–64 age group, the trend within each age group was downward from 2000–2006, increasing in 2007 (except among those ages 21–24), and then trending downward again in 2008 and 2009, before leveling off in 2010 (except among those ages 21–24) and 2011 (except among those ages 55‒64). In 2012, the likelihood of participating in a retirement plan decreased for all workers, except for the very slight increase among those ages 45–54 (52.3 percent in 2011 to 52.4 percent in 2012) and the unchanged likelihood for those ages 35–44 (at 47.9 percent).
The percentage of male and female wage and salary workers ages 21–64 participating in an employment-based retirement plan decreased in 2012, to 44.8 percent from 45.1 percent in 2011 for males, and to 43.5 percent from 44.1 percent in 2011 for females (Figure 22). The gap between the percentage of males and females participating in a plan had almost closed by 2009 before widening again in 2010–2012. In 1987, males participated at a level just over 10 percentage points higher than females. By 2007, this gap was 0.9 percentage points, and 0.4 percentage points in 2009, before widening back to 1.3 percentage points in 2012.
The percentage of wage and salary workers ages 21–64 participating in a retirement plan in 2012 fell among black and white workers, but increased for Hispanic and other workers (Figure 23).24 This was a reversal in the 2011 trend for each of the worker race/ethnicity groups. The percentage of other workers participating in a retirement plan in 2012 jumped back above the percentage for black workers (42.8 percent compared with 40.1 percent). After slight increases in the percentage of white workers participating in a plan in both 2010 and 2011, the percentage participating for this group experienced a slight decrease in 2012. The Hispanic percentage remained well below rest of the percentages participating for each of the race/ethnicity categories, but did increase in 2012 following a decrease in 2011, which was the pattern in 2009 and 2010 as well.
Full-Time, Full-Year Wage and Salary Wage and Salary
State All Workers Workers Ages 21–64 Workers Ages 21–64 Number Participating Number Participating Number Participating Number Participating Number Participating(millions) (%) (millions) (%) (millions) (%) (millions) (%) (millions) (%)
All 156.5 39.4% 130.4 44.2% 110.0 39.1% 20.5 71.5% 92.2 53.5%Alabama 2.3 42.1 1.9 46.5 1.6 40.1 0.4 74.8 1.4 55.8Alaska 0.4 42.0 0.3 49.0 0.2 40.1 0.1 74.0 0.2 62.3Arizona 3.1 34.0 2.6 37.9 2.3 32.2 0.4 72.7 1.9 45.0Arkansas 1.3 34.3 1.1 39.2 0.9 33.3 0.2 67.5 0.8 47.6California 18.8 36.0 15.6 40.2 13.1 34.7 2.4 70.4 10.4 49.6Colorado 2.8 41.5 2.3 46.6 2.0 42.8 0.3 70.1 1.6 56.3Connecticut 1.9 44.7 1.5 50.7 1.3 47.4 0.2 69.9 1.0 61.1Delaware 0.4 40.8 0.4 46.0 0.3 41.1 0.0 78.5 0.3 54.7District of Columbia 0.4 49.7 0.3 53.3 0.2 44.3 0.1 77.6 0.2 60.9Florida 9.3 30.7 7.8 34.0 6.7 28.8 1.1 64.8 5.8 40.8Georgia 4.6 40.8 3.9 45.1 3.2 39.9 0.7 67.6 2.9 54.7Hawaii 0.6 45.2 0.5 50.2 0.4 44.3 0.1 73.2 0.4 59.8Idaho 0.8 38.3 0.6 45.3 0.5 37.7 0.1 74.4 0.4 56.5Illinois 6.5 41.9 5.5 46.4 4.7 43.0 0.7 68.5 3.9 55.4Indiana 3.1 43.8 2.5 49.6 2.2 45.7 0.3 74.9 1.8 61.4Iowa 1.7 46.0 1.4 54.1 1.2 49.7 0.2 77.0 1.0 63.4Kansas 1.5 42.4 1.2 48.9 1.0 43.8 0.2 70.1 0.9 58.6Kentucky 2.2 38.2 1.8 43.1 1.5 37.2 0.3 70.0 1.3 53.2Louisiana 2.1 34.9 1.7 39.5 1.4 34.1 0.3 65.1 1.3 46.7Maine 0.8 40.8 0.6 48.3 0.5 44.2 0.1 70.7 0.4 59.2Maryland 3.2 47.5 2.7 52.3 2.1 44.4 0.6 80.4 2.0 61.1Massachusetts 3.5 44.1 2.9 49.8 2.4 44.6 0.5 75.7 2.1 59.6Michigan 4.7 40.6 3.9 45.0 3.4 41.3 0.5 71.1 2.7 54.9Minnesota 3.0 47.1 2.5 53.6 2.2 50.0 0.3 77.1 1.8 63.3Mississippi 1.3 35.8 1.0 41.4 0.8 35.5 0.2 63.9 0.7 50.4Missouri 3.0 40.9 2.5 45.1 2.1 40.9 0.4 68.4 1.8 54.9Montana 0.5 37.5 0.4 43.8 0.3 36.3 0.1 72.3 0.3 54.9Nebraska 1.1 41.2 0.8 48.4 0.7 43.9 0.1 70.8 0.6 56.5Nevada 1.3 31.1 1.1 34.0 1.0 28.6 0.1 70.4 0.8 39.7New Hampshire 0.8 44.4 0.6 51.1 0.5 48.0 0.1 71.4 0.4 61.1New Jersey 4.6 42.3 3.9 46.3 3.3 41.6 0.5 74.9 2.7 56.4New Mexico 1.0 28.1 0.8 32.1 0.6 22.1 0.2 56.4 0.5 42.1New York 9.5 40.6 8.1 45.2 6.7 38.7 1.3 77.5 5.8 54.3North Carolina 4.5 36.5 3.8 41.6 3.2 35.9 0.6 70.2 2.7 51.5North Dakota 0.4 43.4 0.3 52.1 0.3 47.6 0.1 69.6 0.2 63.1Ohio 5.8 41.5 4.7 47.0 4.0 41.8 0.7 77.3 3.2 57.7Oklahoma 1.8 37.9 1.5 42.9 1.2 37.7 0.3 65.6 1.1 52.2Oregon 1.9 39.6 1.6 44.8 1.4 40.9 0.2 68.2 1.0 58.0Pennsylvania 6.6 44.1 5.6 49.7 4.9 45.7 0.7 77.2 3.9 59.2Rhode Island 0.5 42.7 0.4 47.6 0.4 42.8 0.1 75.6 0.3 58.6South Carolina 2.2 40.6 1.9 45.1 1.6 39.8 0.3 71.6 1.4 53.5South Dakota 0.5 38.7 0.4 47.9 0.3 43.1 0.1 72.7 0.3 58.4Tennessee 3.1 37.9 2.5 42.5 2.2 37.8 0.3 74.8 1.8 53.4Texas 13.1 33.9 11.0 37.6 9.4 32.5 1.6 67.1 8.2 45.1Utah 1.4 38.2 1.2 43.4 1.0 38.4 0.2 67.7 0.8 53.7Vermont 0.4 40.0 0.3 49.0 0.2 42.7 0.1 76.7 0.2 61.4Virginia 4.2 44.9 3.6 50.5 2.9 44.5 0.7 76.2 2.6 59.9Washington 3.6 42.7 3.1 47.8 2.6 43.7 0.4 71.7 2.0 59.4West Virginia 0.8 46.3 0.7 51.9 0.5 46.0 0.2 70.5 0.5 60.7Wisconsin 3.1 45.5 2.6 52.8 2.2 49.7 0.4 70.3 1.7 64.2Wyoming 0.3 40.8 0.3 48.8 0.2 41.3 0.1 71.2 0.2 58.8Source: Employee Benefit Research Institute estimates from the 2013 March Current Population Survey.
Ages 21–64
Public-Sector Wage and Salary Workers Ages 21–64
Figure 16Percentage of Various Work Forces Who Participated in an Employment-Based Retirement Plan, by State, 2012
Private-Sector Wageand Salary Workers
ebri.org Issue Brief • November 2013 • No. 392 23
Fu
ll-Ti
me,
Ful
l-Yea
r
W
age
and
Sal
ary
W
age
and
Sal
ary
C
onso
lidat
ed S
tatis
tical
Are
a
All
Wor
kers
W
orke
rs A
ges
21–6
4
Wor
kers
Age
s 21
–64
N
umbe
r P
artic
ipat
ing
Num
ber
Par
ticip
atin
gN
umbe
r P
artic
ipat
ing
Num
ber
Par
ticip
atin
gN
umbe
r P
artic
ipat
ing
(mill
ions
)(%
)(m
illio
ns)
(%)
(mill
ions
)(%
)(m
illio
ns)
(%)
(mill
ions
)(%
)A
ll15
6.5
39.4
%13
0.4
44.2
%11
0.0
39.1
%20
.571
.5%
92.2
53.5
%U
nrec
ored
ed C
SA
s99
.08
38.2
82.2
343
.268
.87
37.9
13.3
670
.558
.19
52.5
App
leto
n-O
shko
sh-N
eena
h, W
I0.
2554
.40.
2066
.30.
1761
.90.
0387
.10.
1578
.4B
osto
n-W
orce
ster
-Man
ches
ter,
MA
-NH
-CT-
ME
4.89
44.1
4.11
49.1
3.58
44.7
0.53
73.8
2.93
58.5
Brid
gepo
rt-N
ew H
aven
-Sta
mfo
rd, C
T1.
4044
.71.
1650
.20.
9948
.80.
1759
.40.
8161
.3C
hica
go-N
aper
ville
-Mic
higa
n C
ity, I
L-IN
-WI
0.42
42.3
0.33
46.0
0.28
42.9
0.05
67.2
0.21
55.0
Cle
vela
nd-A
kron
-Ely
ria, O
H1.
6542
.51.
4045
.91.
2141
.50.
1970
.80.
9655
.3D
ayto
n-S
prin
gfie
ld-G
reen
ville
, OH
2.58
33.8
2.14
40.8
1.92
33.0
0.22
84.0
1.49
52.9
Den
ver-
Aur
ora-
Bou
lder
, CO
0.56
41.7
0.50
45.9
0.39
42.5
0.11
67.7
0.35
56.2
Det
roit-
War
ren-
Flin
t, M
I0.
7139
.60.
5943
.20.
5140
.10.
0869
.70.
3851
.3Fr
esno
-Mad
era,
CA
0.66
35.3
0.55
38.2
0.47
32.4
0.08
58.2
0.39
51.1
Gra
nd R
apid
s-M
uske
gon-
Hol
land
, MI
0.34
43.8
0.30
51.1
0.26
47.4
0.03
73.6
0.22
66.2
Gre
ensb
oro-
-Win
ston
-Sal
em--
Hig
h P
oint
, NC
0.35
37.8
0.29
43.1
0.22
38.5
0.08
69.1
0.21
49.9
Gre
envi
lle-A
nder
son-
Sen
eca,
SC
0.99
50.9
0.80
55.7
0.69
52.1
0.10
84.4
0.56
65.7
Hun
tsvi
lle-D
ecat
ur, A
L0.
2042
.50.
1748
.10.
1538
.10.
0275
.70.
1254
.3In
dian
apol
is-A
nder
son-
Col
ombu
s, IN
8.90
45.5
7.38
53.3
6.33
49.7
1.05
77.1
4.99
67.2
John
son
City
-Kin
gspo
rt-B
risto
l, V
A0.
1529
.30.
1332
.80.
1028
.70.
0468
.20.
0940
.5Lo
s A
ngel
es-L
ong
Bea
ch-R
iver
side
, CA
0.89
33.6
0.76
37.4
0.67
32.3
0.09
68.1
0.51
45.4
Mac
on-W
arne
r-R
obin
s-Fo
rt V
alle
y, G
A1.
9941
.51.
7043
.01.
5129
.40.
2077
.51.
2161
.3M
ilwau
kee-
Rac
ine-
Wau
kesh
a, W
I10
.01
51.4
8.49
57.3
7.22
54.8
1.28
75.4
6.15
69.6
Min
neap
olis
-St.
Pau
l-St.
Clo
ud, M
N3.
0946
.82.
6752
.22.
2948
.70.
3878
.41.
8661
.7N
ew Y
ork-
New
ark-
Brid
gepo
rt, N
Y-N
J-C
T-P
A0.
9739
.10.
8343
.20.
6837
.50.
1575
.80.
6251
.8P
hila
delp
hia-
Cam
den-
Vin
elan
d, P
A-N
J-D
E-M
D0.
9345
.30.
7649
.20.
6344
.80.
1375
.70.
5558
.5R
alei
gh-D
urha
m-C
ary,
NC
4.44
44.3
3.64
48.9
3.14
42.2
0.50
79.3
2.45
57.6
Sal
t Lak
e C
ity-O
gden
-Cle
arfie
ld, U
T2.
3342
.21.
9847
.61.
7143
.20.
2769
.51.
3956
.8S
an J
ose-
San
Fra
ncis
co-O
akla
nd, C
A4.
5440
.93.
8845
.93.
0441
.10.
8476
.42.
9355
.6S
eattl
e-Ta
com
a-O
lym
pia,
WA
3.14
44.7
2.62
50.2
2.22
47.0
0.40
70.7
1.89
61.2
Was
hing
ton-
Bal
timor
e-N
orth
ern
Virg
inia
, DC
-MD
-VA
-WV
1.01
48.8
0.84
53.7
0.73
46.1
0.11
80.9
0.56
62.0
Sou
rce:
Em
ploy
ee B
enef
it R
esea
rch
Inst
itute
est
imat
es fr
om th
e 20
13 M
arch
Cur
rent
Pop
ulat
ion
Sur
vey.
A
ges
21–6
4
Pub
lic-S
ecto
r Wag
e a
nd S
alar
y W
orke
rs
Age
s 21
–64
Figu
re 1
7P
erce
nta
ge
of
Var
iou
s W
ork
Fo
rces
Wh
o P
arti
cip
ated
in a
n E
mp
loym
ent-
Bas
ed R
etir
emen
t P
lan
by
Co
nso
lidat
ed S
tati
stic
al A
rea
(CS
A),
201
2
Priv
ate-
Sec
tor W
age
and
Sal
ary
Wor
kers
ebri.org Issue Brief • November 2013 • No. 392 24
State 2002 2003 2004 2005 2006 2007 2008 2009 2010 2011 2012All 49.7% 48.8% 48.3% 47.9% 46.9% 46.6% 46.3% 46.1% 45.2% 44.8% 44.6%Alabama 52.8 50.9 51.1 50.6 50.9 50.6 49.5 48.3 45.4 46.8 47.2Alaska 52.0 49.9 49.6 48.8 50.3 49.4 50.8 51.0 52.1 51.2 50.4Arizona 44.7 43.1 42.5 42.1 40.6 39.3 38.4 37.9 38.7 38.7 39.0Arkansas 45.1 44.2 43.3 43.4 42.8 44.3 43.6 43.1 41.2 40.8 40.7California 43.5 43.8 43.6 42.8 41.7 42.0 42.0 41.7 40.8 40.2 40.1Colorado 34.2 45.0 44.6 44.6 44.3 43.4 45.1 45.7 45.6 46.0 46.0Connecticut 54.4 53.8 54.3 54.5 52.1 51.1 51.5 52.0 50.6 49.9 50.6Delaware 54.7 53.9 53.8 52.8 52.6 51.1 50.8 50.0 49.2 49.9 48.4District of Columbia 53.6 53.1 54.0 54.3 53.1 51.7 48.5 49.1 49.7 52.2 52.4Florida 41.0 40.7 40.0 39.0 37.1 36.3 35.8 35.9 36.0 35.9 35.6Georgia 49.5 48.6 46.0 45.7 43.8 45.2 44.4 43.4 40.9 40.5 42.0Hawaii 51.8 51.4 51.5 51.6 51.8 52.0 52.8 51.4 50.0 46.6 47.7Idaho 48.2 47.3 45.8 45.9 46.3 48.1 47.8 48.0 45.9 45.4 44.5Illinois 52.0 50.6 50.1 50.2 49.5 49.0 48.7 48.3 47.2 46.1 46.2Indiana 54.3 52.6 52.1 52.3 52.6 53.3 53.6 52.5 50.6 49.2 49.5Iowa 56.6 56.1 55.5 54.8 54.4 55.3 56.4 55.8 53.8 52.0 52.6Kansas 54.6 53.9 54.2 53.0 51.1 49.6 49.2 50.9 52.2 52.5 51.4Kentucky 50.9 51.8 51.3 50.9 48.7 47.5 45.0 44.3 44.6 46.1 46.1Louisiana 46.6 45.9 46.5 44.6 41.8 39.2 39.5 42.0 41.3 40.3 38.6Maine 51.2 50.6 49.1 48.8 48.6 48.8 49.7 49.1 48.0 46.8 47.3Maryland 56.3 53.4 53.7 51.4 50.3 49.0 49.0 49.7 49.1 49.5 50.6Massachusetts 53.2 52.0 51.7 51.4 50.5 50.5 50.4 51.0 50.1 48.4 48.2Michigan 54.5 53.0 52.0 51.9 50.7 50.5 49.7 48.9 46.6 44.5 43.7Minnesota 58.8 57.3 56.6 56.3 55.8 54.7 54.6 54.2 53.2 52.8 53.4Mississippi 47.6 46.9 46.9 46.1 44.9 44.7 45.3 45.2 43.1 41.4 41.1Missouri 52.7 52.4 51.8 51.9 51.3 52.1 51.8 49.8 48.6 48.3 48.2Montana 47.7 46.8 45.3 45.1 45.4 47.6 48.3 49.1 47.8 46.6 45.0Nebraska 54.7 53.9 53.2 52.4 52.0 51.3 50.6 49.7 48.2 47.8 47.6Nevada 45.1 43.4 42.3 42.3 40.8 41.2 42.4 43.4 41.1 37.8 35.6New Hampshire 53.0 51.9 52.6 53.9 52.6 52.8 51.7 52.7 50.9 50.2 49.8New Jersey 51.9 51.6 51.6 51.5 49.2 48.0 46.1 44.9 42.9 43.1 44.4New Mexico 45.4 42.8 43.5 42.8 42.6 42.2 41.3 42.0 40.5 43.0 39.5New York 49.1 47.9 47.4 47.5 46.8 45.5 44.2 44.5 44.6 45.4 45.3North Carolina 48.4 45.9 45.5 44.8 44.3 43.8 43.5 44.0 44.9 44.9 44.0North Dakota 56.0 55.2 54.5 53.9 53.5 54.8 55.9 56.3 55.2 55.4 54.2Ohio 54.8 53.5 53.4 52.9 52.2 52.2 52.5 52.9 51.3 49.3 47.9Oklahoma 46.6 46.7 47.4 46.5 45.7 45.8 48.0 49.4 48.5 48.1 46.3Oregon 48.2 48.3 49.3 49.2 48.6 48.4 48.8 48.8 48.3 48.1 47.6Pennsylvania 56.4 54.8 53.8 53.2 53.0 52.1 52.1 50.9 50.9 49.7 49.8Rhode Island 52.7 50.4 49.1 48.8 49.8 48.4 48.5 47.7 48.1 48.4 48.5South Carolina 50.1 48.6 48.0 47.9 47.3 46.3 45.7 45.2 43.6 43.7 43.7South Dakota 52.6 51.3 49.4 49.9 51.1 51.3 50.8 49.8 49.8 50.3 49.8Tennessee 50.0 48.9 48.1 47.6 45.6 45.5 44.2 43.5 41.8 42.7 43.3Texas 45.6 45.1 44.7 44.3 43.2 42.6 41.5 40.3 40.1 39.7 39.4Utah 47.4 44.8 43.4 43.1 43.0 44.3 45.1 45.9 45.1 43.6 43.0Vermont 49.8 49.0 49.1 48.5 48.8 49.1 49.9 50.3 49.9 49.1 48.7Virginia 53.6 52.4 51.5 51.2 51.0 51.1 52.6 52.2 51.5 51.1 50.9Washington 48.3 48.0 49.0 50.8 50.3 51.1 50.8 51.3 49.9 49.0 48.0West Virginia 47.8 46.3 48.2 49.0 51.0 51.2 51.3 51.1 51.7 52.1 51.8Wisconsin 57.7 55.8 54.2 53.3 53.5 55.0 54.2 54.5 52.5 53.0 52.3Wyoming 49.8 47.6 47.6 48.1 49.1 48.7 49.3 50.5 51.1 50.5 49.4Source: Employee Benefit Research Institute estimates from the 2001–2013 March Current Population Surveys.
Percentage of Wage and Salary Workers Ages 21–64 Who Participated in an Figure 18
Employment-Based Retirement Plan, by State, Three-Year-Average Trend, 2002–2012
ebri.org Issue Brief • November 2013 • No. 392 25

ebri.org Issue Brief • November 2013 • No. 392 26
The likelihood of wage and salary workers ages 21–64 participating in a retirement plan increased for those with a bachelor’s degree in 2012, while the percentages for workers in the other educational categories all declined (Figure 24). For workers with a graduate/professional degree, this likelihood decreased by 1.2 percentage points, while for those with only a bachelor’s degree, it increased by 0.3 percentage point, producing a narrowing of the participation gap between those with a graduate/professional degree over workers with only a bachelor’s degree. Furthermore, the differences in the participation levels of workers with and without a high school diploma continued to persist. The participation level in the high-school-diploma category, which has the lowest percentage participating of all categories that included a high school diploma, was still more than twice as large as that of workers without a diploma, and the participation level of workers with a graduate degree was more than four times that of those without a high school diploma.
Clearly, workers with lower educational attainment are lagging in retirement plan participation relative to those with more education—particularly when workers without a high school diploma are compared with those with a bachelor’s degree or higher. This is not surprising, because education is strongly correlated with income. However, as shown earlier in this study, the correlation with income is not the only factor, as education appears to contribute to better retirement planning.
Regarding income, the percentage of workers in all earnings groups showed small decreases in participation from 2011 to 2012, except for those with incomes of $50,000–$74,999 (slight increase) and $40,000–$49,999 (unchanged) (Figure 25).25 The largest decreases were 1.5 percentage points for workers with annual incomes of $20,000–$29,999 and $30,000‒$39,999. The relative differences in participation levels across earnings groups were virtually unchanged in 2012, a result that has been very consistent going back to 1987, with slight overall declines in the participation levels across all the earnings groups.
The percentage of full-time, full-year wage and salary workers participating in a retirement plan decreased slightly from 53.7 percent in 2011 to 53.5 percent in 2012, while the percentage for full-time, part-year workers slightly increased (Figure 26). The most dramatic change was the decrease in the percentage of part-time, full-year workers participating in a plan, dropping from 22.1 percent in 2011 to 19.4 percent in 2012. The overall trend since 1987 among each of the full-year work statuses was downward.
Trends across Employer Characteristics
Decreases occurred in 2012 in the level of participation by workers in each of the private-sector employer-size groups, except for those working for employers with 50–99 employees and for employers with 100–499 employees (Figure 27). The percentage of public-sector wage and salary workers participating decreased in 2012. Looking back at the period since 1987, the likelihoods of worker participation in the public sector and at the larger private-sector firms (500 or more employees) in 2012 were at levels significantly below their highest levels, while the probabilities of workers participating at employers with fewer than 10 employees and 100‒499 employees were above their 1991 and 1987 levels, respectively, but below their peaks.
Changes in the percentage of wage and salary workers ages 21–64 who participated in a retirement plan across each industry/sector were mixed in 2012 (Figure 28).26 Workers in wholesale and retail trade; professional services; and agriculture, mining, and construction had decreases in the likelihood of participating, while workers in other services and manufacturing had increases, and the likelihood among transportation, utilities, information, and financial workers was unchanged. Despite increases for some industries in 2012, the probability of workers in each industry having a retirement plan was lower than a decade earlier. The largest percentage-point drop from 2002 occurred for workers in the agriculture, mining, and construction industry, at 4.9 percentage points.
Workers in all occupations had decreasing probabilities of participating in a plan from 2002—2012 (Figure 29).27 The likelihood of workers in the various occupations participating in a retirement plan went up and down in a fairly narrow range over this period, with workers in eight of the 10 occupations having a decrease in the likelihood of participating in

1987
1989
1991
1993
1994
1995
1996
1997
1998
1999
2000
2001
2002
2003
2004
2005
2006
2007
2008
2009
2010
2011
2012
Num
ber o
f Wor
kers
130.
413
3.8
134.
413
6.2
138.
213
9.6
142.
114
3.8
145.
514
9.7
151.
115
0.9
151.
315
1.1
152.
715
4.7
157.
015
8.1
157.
815
4.2
152.
615
3.7
156.
5 W
orks
for a
n em
ploy
er
spo
nsor
ing
a pl
an63
.066
.368
.668
.274
.073
.777
.578
.282
.083
.385
.783
.580
.780
.681
.279
.778
.681
.979
.876
.075
.075
.276
.0 P
artic
ipat
ing
in a
pla
n49
.052
.053
.453
.156
.757
.359
.360
.163
.465
.567
.164
.963
.263
.563
.963
.662
.365
.663
.761
.060
.761
.061
.6
Tota
l10
0%10
0%10
0%10
0%10
0%10
0%10
0%10
0%10
0%10
0%10
0%10
0%10
0%10
0%10
0%10
0%10
0%10
0%10
0%10
0%10
0%10
0%10
0% W
orks
for a
n em
ploy
er
spo
nsor
ing
a pl
an48
.349
.651
.050
.153
.552
.854
.554
.456
.455
.656
.755
.353
.453
.453
.251
.550
.051
.850
.649
.349
.248
.948
.6 P
artic
ipat
ing
in a
pla
n37
.638
.939
.739
.041
.041
.041
.741
.843
.643
.844
.443
.041
.842
.041
.940
.939
.741
.540
.439
.639
.839
.739
.4
1987
1989
1991
1993
1994
1995
1996
1997
1998
1999
2000
2001
2002
2003
2004
2005
2006
2007
2008
2009
2010
2011
2012
Num
ber o
f Wor
kers
100.
210
3.4
109.
211
0.5
112.
711
5.3
117.
611
7.3
118.
912
2.4
124.
012
4.7
125.
412
5.4
126.
212
8.4
130.
313
1.2
131.
412
8.8
128.
012
8.6
130.
4 W
orks
for a
n em
ploy
er
spo
nsor
ing
a pl
an57
.360
.063
.463
.168
.068
.171
.372
.075
.176
.578
.577
.074
.674
.775
.173
.872
.475
.673
.670
.169
.469
.369
.6 P
artic
ipat
ing
in a
pla
n46
.248
.851
.151
.054
.355
.156
.957
.660
.662
.563
.962
.160
.460
.761
.060
.359
.362
.260
.457
.757
.457
.457
.6
Tota
l10
0%10
0%10
0%10
0%10
0%10
0%10
0%10
0%10
0%10
0%10
0%10
0%10
0%10
0%10
0%10
0%10
0%10
0%10
0%10
0%10
0%10
0%10
0% W
orks
for a
n em
ploy
er
spo
nsor
ing
a pl
an57
.258
.058
.157
.160
.459
.160
.661
.463
.262
.563
.361
.759
.559
.659
.557
.555
.657
.656
.054
.454
.253
.953
.4 P
artic
ipat
ing
in a
pla
n46
.147
.246
.846
.248
.247
.848
.449
.151
.051
.151
.649
.848
.248
.448
.347
.045
.547
.446
.044
.844
.944
.644
.2
1987
1989
1991
1993
1994
1995
1996
1997
1998
1999
2000
2001
2002
2003
2004
2005
2006
2007
2008
2009
2010
2011
2012
Num
ber o
f Wor
kers
82.6
85.2
90.6
91.1
93.4
96.7
99.3
98.9
100.
110
2.7
104.
310
5.1
105.
310
5.4
105.
710
8.0
109.
611
0.1
110.
710
7.6
106.
910
8.3
110.
0 W
orks
for a
n em
ploy
er
spo
nsor
ing
a pl
an41
.944
.147
.246
.751
.051
.955
.256
.258
.859
.461
.560
.357
.857
.857
.656
.855
.458
.056
.452
.952
.552
.853
.3 P
artic
ipat
ing
in a
pla
n32
.934
.837
36.6
39.3
40.8
42.8
43.7
46.1
47.3
48.7
47.4
45.4
45.5
45.4
45.1
44.1
46.3
45.0
42.2
42.3
42.5
43.0
Tota
l10
0%10
0%10
0%10
0%10
0%10
0%10
0%10
0%10
0%10
0%10
0%10
0%10
0%10
0%10
0%10
0%10
0%10
0%10
0%10
0%10
0%10
0%10
0% W
orks
for a
n em
ploy
er
spo
nsor
ing
a pl
an50
.751
.752
.151
.254
.653
.755
.656
.858
.757
.859
.057
.454
.954
.854
.552
.650
.652
.751
.049
.149
.148
.848
.5 P
artic
ipat
ing
in a
pla
n39
.840
.940
.840
.142
.142
.243
.144
.246
.146
.146
.745
.143
.143
.243
.041
.740
.342
.040
.739
.239
.539
.239
.1
(per
cent
age)
(per
cent
age)
(con
t'd.)
Figu
re 1
9P
erce
nta
ge
of
Var
iou
s W
ork
Fo
rces
Wh
o W
ork
ed f
or
an E
mp
loye
r T
hat
Sp
on
sore
d a
Ret
irem
ent
Pla
n
and
th
e P
erce
nta
ge
Wh
o P
arti
cip
ated
in a
n E
mp
loym
ent-
Bas
ed R
etir
emen
t P
lan
, 198
7–20
12
(mill
ions
)
(mill
ions
)
(mill
ions
)
All
Wo
rker
s
Pri
vate
-Sec
tor
Wag
e an
d S
alar
y W
ork
ers
Ag
es 2
1–64
Wag
e an
d S
alar
y W
ork
ers
Ag
es 2
1–64
(per
cent
age)
ebri.org Issue Brief • November 2013 • No. 392 27

1987
1989
1991
1993
1994
1995
1996
1997
1998
1999
2000
2001
2002
2003
2004
2005
2006
2007
2008
2009
2010
2011
2012
Num
ber o
f Wor
kers
17.6
18.2
18.7
19.3
19.3
18.6
18.3
18.4
18.8
19.7
19.6
19.6
20.0
20.0
20.5
20.4
20.8
21.1
20.7
21.2
21.1
20.4
20.5
Wor
ks fo
r an
empl
oyer
s
pons
orin
g a
plan
15.4
15.9
16.3
16.4
17.0
16.1
16.0
15.9
16.3
17.1
17.0
16.6
16.8
17.0
17.5
17.0
17.0
17.6
17.2
17.3
16.9
16.5
16.3
Par
ticip
atin
g in
a p
lan
13.3
13.9
14.2
14.4
15.0
14.3
14.1
13.9
14.5
15.2
15.2
14.8
15.0
15.2
15.6
15.2
15.2
15.9
15.4
15.5
15.2
14.9
14.6
Tota
l10
0%10
0%10
0%10
0%10
0%10
0%10
0%10
0%10
0%10
0%10
0%10
0%10
0%10
0%10
0%10
0%10
0%10
0%10
0%10
0%10
0%10
0%10
0% W
orks
for a
n em
ploy
er
spo
nsor
ing
a pl
an87
.487
.287
.385
.188
.186
.987
.686
.087
.186
.986
.484
.983
.784
.885
.183
.681
.883
.383
.081
.380
.381
.179
.3 P
artic
ipat
ing
in a
pla
n75
.676
.376
.174
.577
.676
.777
.175
.577
.277
.277
.375
.374
.875
.875
.874
.873
.375
.474
.572
.971
.973
.271
.5
1987
1989
1991
1993
1994
1995
1996
1997
1998
1999
2000
2001
2002
2003
2004
2005
2006
2007
2008
2009
2010
2011
2012
Num
ber o
f Wor
kers
66.2
68.9
71.7
74.2
76.5
79.9
81.7
83.0
85.9
88.6
91.3
90.1
90.0
90.3
91.7
94.0
96.4
97.1
93.4
89.0
89.1
91.0
92.2
Wor
ks fo
r an
empl
oyer
s
pons
orin
g a
plan
44.1
46.2
4848
.752
.352
.955
.456
.559
.661
.262
.660
.858
.659
.259
.659
.158
.461
.358
.455
.054
.955
.455
.7 P
artic
ipat
ing
in a
pla
n38
.740
.742
.242
.845
.646
.348
.249
.151
.853
.554
.652
.551
.151
.551
.951
.550
.653
.751
.248
.448
.648
.849
.3
Tota
l10
0%10
0%10
0%10
0%10
0%10
0%10
0%10
0%10
0%10
0%10
0%10
0%10
0%10
0%10
0%10
0%10
0%10
0%10
0%10
0%10
0%10
0%10
0% W
orks
for a
n em
ploy
er
spo
nsor
ing
a pl
an66
.667
.067
.065
.768
.466
.267
.868
.169
.469
.168
.667
.565
.165
.665
.062
.960
.563
.162
.561
.861
.660
.860
.4 P
artic
ipat
ing
in a
pla
n58
.459
.058
.957
.759
.657
.959
.059
.260
.360
.459
.858
.356
.757
.156
.654
.852
.755
.354
.854
.454
.553
.753
.5S
ourc
e: E
mpl
oyee
Ben
efit
Res
earc
h In
stitu
te e
stim
ates
from
the
1988
–201
3 M
arch
Cur
rent
Pop
ulat
ion
Sur
veys
.
(per
cent
age)
(per
cent
age)
(mill
ions
)
Fu
ll–T
ime,
Fu
ll–Y
ear
Wag
e an
d S
alar
y W
ork
ers
Ag
es 2
1–64
Pu
blic
-Sec
tor
Wag
e an
d S
alar
y W
ork
ers
Ag
es 2
1–64
(mill
ions
)
(Fig
. 19,
con
t'd.)
ebri.org Issue Brief • November 2013 • No. 392 28

ebri.org Issue Brief • November 2013 • No. 392 29
2012. Workers in the transportation/materials moving occupation experienced the largest decline in the probability of participating in a retirement plan at 6.2 percentage points from 2002—2012.
Number Without a Plan An important public-policy topic associated with an analysis of employment-based retirement plan participation is the number of workers who are not participants, as well as the number of those who work for employers/unions that do not sponsor a plan.28 This section investigates these numbers by certain demographic and employer characteristics, annual earnings, employer size, and work status (full-time/part-time) to show where potential legislation may miss workers and also to show the number of workers who are already being reached.
In 2012, 80.5 million workers worked for an employer/union that did not sponsor a retirement plan, and 94.9 million workers did not participate in a plan (Figure 30).29 Of these workers, 8.9 million (11.0 percent) were self-employed—meaning workers who could have started a plan for themselves without the need for action from their employers. Therefore, the number of workers who were wage and salary workers who worked for an employer that did not sponsor a plan was 71.6 million.
Of those 71.6 million, 19.1 million (26.7 percent) were ages 25 or younger or 65 or older. Almost 33 million (45.5 per-cent) were not full-time, full-year workers, and 25.1 million (35.1 percent) had annual earnings of less than $20,000. Furthermore, 40.2 million (56.2 percent) worked for employers with less than 100 employees.
Many of these workers fell into several of these categories simultaneously, such as being under age 21, having less than $10,000 in annual earnings, and not being full-time, full-year workers. Therefore, Figure 31 shows the number of workers who would remain in a targeted population if exclusions were made for age, annual earnings, work status, and/or employer size, to show the percentage of that group working for employers that do not sponsor a retirement plan and not participating in a retirement plan. For example, if the population of interest was wage and salary workers ages 21–64 who work full-year, make $5,000 or more in annual earnings, and work for employers with 10 or more employees, 32.5 million (or 36.4 percent of this population) worked for an employer that did not sponsor a retirement plan in 2012 (meaning that 45.4 percent of the total wage and salary workers working for employers that did not sponsor a plan fell into this group). Moreover, for workers who work full-time, full-year, make $10,000 or more in annual earnings, and work for an employer with 100 or more employees, 15.9 million (or 26.2 percent of the defined population) would be included among those working for an employer that did not sponsor a plan. Another way to look at this last number is that 73.8 percent of workers with those characteristics worked for an employer that did sponsor a retirement plan in 2012.
Conclusion In 2012, 39.4 percent of all workers, or 61.6 million Americans, participated in an employment-based retirement plan, compared with 39.7 percent and 61.0 million in 2011. Among full-time, full-year wage and salary workers ages 21 to 64—those with the strongest connection to the work force—53.5 percent participated. This percentage of participating workers varied significantly across various worker characteristics and the characteristics of their employers. Being nonwhite, younger, female, never married; having lower educational attainment, lower earnings, poorer health status, no health insurance through one’s own employer; not working full time, full year; and working in service occupations or farming, fisheries, and forestry occupations were all associated with lower levels of participation in a retirement plan. In addition, those working for smaller firms, private-sector firms, or firms in the “other” (not professional) services industry were also less likely to participate in a plan than their comparison groups. Another factor in the likelihood of workers’ participation in a retirement plan was their geographic location, with workers in the South and West less likely to participate in a plan than those in other regions of the country.
A closer examination of certain characteristics provides some revealing findings. In particular, the overall percentage of females participating in a plan was lower than that of males (the retirement plan-participation gender gap significantly
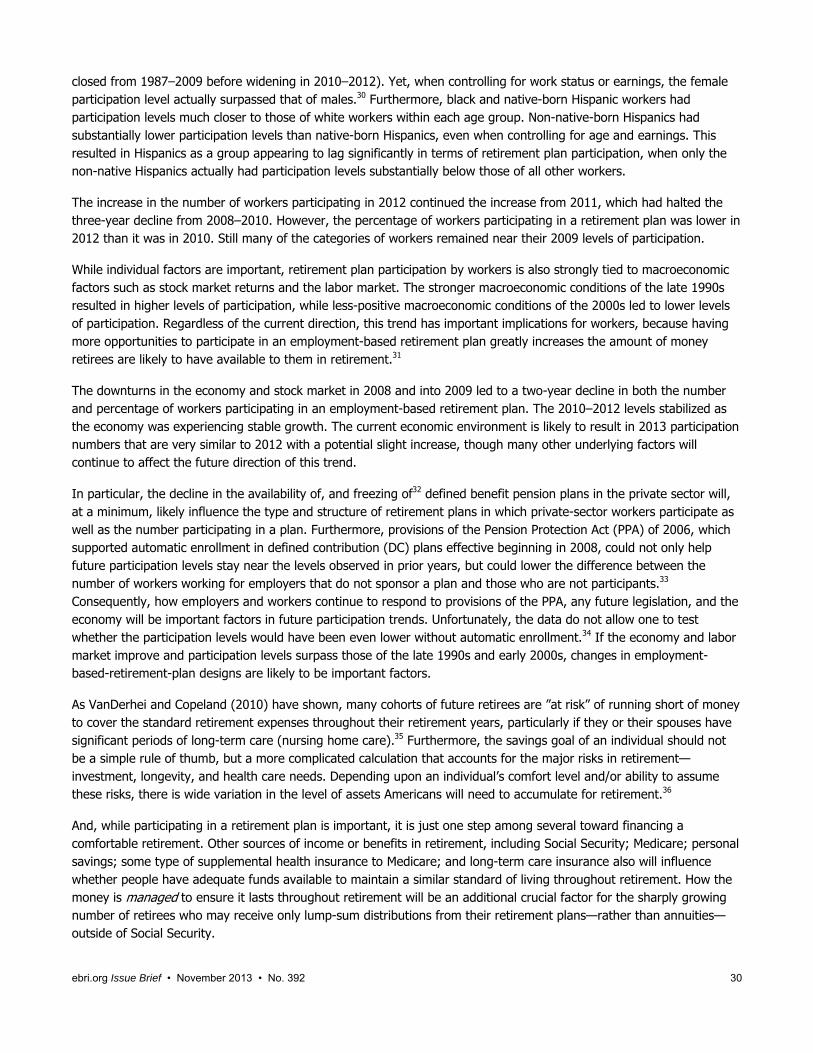
ebri.org Issue Brief • November 2013 • No. 392 30
closed from 1987‒2009 before widening in 2010–2012). Yet, when controlling for work status or earnings, the female participation level actually surpassed that of males.30 Furthermore, black and native-born Hispanic workers had participation levels much closer to those of white workers within each age group. Non-native-born Hispanics had substantially lower participation levels than native-born Hispanics, even when controlling for age and earnings. This resulted in Hispanics as a group appearing to lag significantly in terms of retirement plan participation, when only the non-native Hispanics actually had participation levels substantially below those of all other workers.
The increase in the number of workers participating in 2012 continued the increase from 2011, which had halted the three-year decline from 2008–2010. However, the percentage of workers participating in a retirement plan was lower in 2012 than it was in 2010. Still many of the categories of workers remained near their 2009 levels of participation.
While individual factors are important, retirement plan participation by workers is also strongly tied to macroeconomic factors such as stock market returns and the labor market. The stronger macroeconomic conditions of the late 1990s resulted in higher levels of participation, while less-positive macroeconomic conditions of the 2000s led to lower levels of participation. Regardless of the current direction, this trend has important implications for workers, because having more opportunities to participate in an employment-based retirement plan greatly increases the amount of money retirees are likely to have available to them in retirement.31
The downturns in the economy and stock market in 2008 and into 2009 led to a two-year decline in both the number and percentage of workers participating in an employment-based retirement plan. The 2010–2012 levels stabilized as the economy was experiencing stable growth. The current economic environment is likely to result in 2013 participation numbers that are very similar to 2012 with a potential slight increase, though many other underlying factors will continue to affect the future direction of this trend.
In particular, the decline in the availability of, and freezing of32 defined benefit pension plans in the private sector will, at a minimum, likely influence the type and structure of retirement plans in which private-sector workers participate as well as the number participating in a plan. Furthermore, provisions of the Pension Protection Act (PPA) of 2006, which supported automatic enrollment in defined contribution (DC) plans effective beginning in 2008, could not only help future participation levels stay near the levels observed in prior years, but could lower the difference between the number of workers working for employers that do not sponsor a plan and those who are not participants.33 Consequently, how employers and workers continue to respond to provisions of the PPA, any future legislation, and the economy will be important factors in future participation trends. Unfortunately, the data do not allow one to test whether the participation levels would have been even lower without automatic enrollment.34 If the economy and labor market improve and participation levels surpass those of the late 1990s and early 2000s, changes in employment-based-retirement-plan designs are likely to be important factors.
As VanDerhei and Copeland (2010) have shown, many cohorts of future retirees are ”at risk” of running short of money to cover the standard retirement expenses throughout their retirement years, particularly if they or their spouses have significant periods of long-term care (nursing home care).35 Furthermore, the savings goal of an individual should not be a simple rule of thumb, but a more complicated calculation that accounts for the major risks in retirement—investment, longevity, and health care needs. Depending upon an individual’s comfort level and/or ability to assume these risks, there is wide variation in the level of assets Americans will need to accumulate for retirement.36
And, while participating in a retirement plan is important, it is just one step among several toward financing a comfortable retirement. Other sources of income or benefits in retirement, including Social Security; Medicare; personal savings; some type of supplemental health insurance to Medicare; and long-term care insurance also will influence whether people have adequate funds available to maintain a similar standard of living throughout retirement. How the money is managed to ensure it lasts throughout retirement will be an additional crucial factor for the sharply growing number of retirees who may receive only lump-sum distributions from their retirement plans—rather than annuities—outside of Social Security.
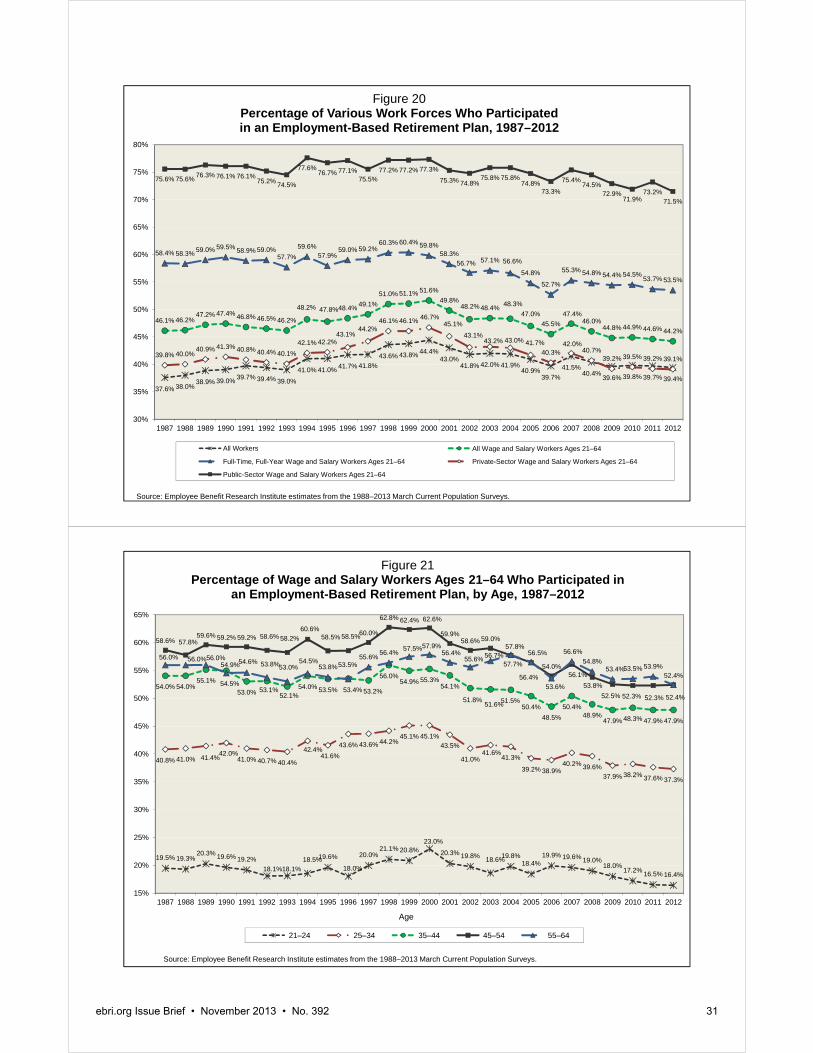
37.6% 38.0%38.9% 39.0% 39.7% 39.4% 39.0%
41.0% 41.0% 41.7% 41.8%43.6% 43.8% 44.4%
43.0%41.8% 42.0% 41.9%
40.9%39.7%
41.5%40.4% 39.6% 39.8% 39.7% 39.4%
46.1% 46.2%47.2% 47.4% 46.8% 46.5% 46.2%
48.2% 47.8%48.4% 49.1%51.0% 51.1% 51.6%
49.8%48.2% 48.4% 48.3%
47.0%45.5%
47.4%46.0%
44.8% 44.9% 44.6% 44.2%
58.4% 58.3% 59.0% 59.5% 58.9% 59.0%57.7%
59.6%57.9%
59.0% 59.2%60.3% 60.4% 59.8%
58.3%56.7% 57.1% 56.6%
54.8%
52.7%
55.3% 54.8% 54.4% 54.5% 53.7% 53.5%
39.8% 40.0%40.9% 41.3% 40.8% 40.4% 40.1%
42.1% 42.2%43.1%
44.2%46.1% 46.1% 46.7%
45.1%
43.1%43.2% 43.0% 41.7%
40.3%42.0%
40.7%39.2% 39.5% 39.2% 39.1%
75.6% 75.6% 76.3% 76.1% 76.1%75.2% 74.5%
77.6%76.7% 77.1%
75.5%77.2% 77.2% 77.3%
75.3% 74.8%75.8% 75.8%
74.8%73.3%
75.4%74.5%
72.9%71.9%
73.2%71.5%
30%
35%
40%
45%
50%
55%
60%
65%
70%
75%
80%
1987 1988 1989 1990 1991 1992 1993 1994 1995 1996 1997 1998 1999 2000 2001 2002 2003 2004 2005 2006 2007 2008 2009 2010 2011 2012
Figure 20Percentage of Various Work Forces Who Participated in an Employment-Based Retirement Plan, 1987–2012
All Workers All Wage and Salary Workers Ages 21–64
Full-Time, Full-Year Wage and Salary Workers Ages 21–64 Private-Sector Wage and Salary Workers Ages 21–64
Public-Sector Wage and Salary Workers Ages 21–64
Source: Employee Benefit Research Institute estimates from the 1988–2013 March Current Population Surveys.
19.5% 19.3%20.3% 19.6% 19.2%
18.1%18.1%18.5%19.6%
18.0%
20.0%21.1% 20.8%
23.0%
20.3% 19.8% 18.6%19.8%18.4%
19.9% 19.6% 19.0%18.0%
17.2% 16.5% 16.4%
40.8% 41.0% 41.4%42.0%41.0% 40.7% 40.4%
42.4%41.6%
43.6% 43.6% 44.2%45.1% 45.1%
43.5%
41.0%41.6%
41.3%
39.2% 38.9%40.2% 39.6%
37.9% 38.2% 37.6% 37.3%
54.0% 54.0%55.1%
54.9%
53.0% 53.1%52.1%
54.0% 53.5%
53.5%
53.2%
56.0%54.9% 55.3%
54.1%
51.8% 51.6%51.5%50.4%
48.5%50.4%
48.9%47.9% 48.3% 47.9% 47.9%
58.6% 57.8%59.6% 59.2% 59.2% 58.6% 58.2%
60.6%58.5% 58.5%60.0%
62.8% 62.4% 62.6%
59.9%58.6% 59.0%
57.7%
56.4%54.0%
56.1%53.8%
52.5% 52.3% 52.3%
52.4%
56.0% 56.0%56.0%
54.5%
54.6% 53.8%53.0%54.5%
53.8%
53.4%
55.6% 56.4% 57.5%57.9%56.4%
55.6% 56.7%57.8%
56.5%
53.6%
56.6%54.8%
53.4%53.5% 53.9%
52.4%
15%
20%
25%
30%
35%
40%
45%
50%
55%
60%
65%
1987 1988 1989 1990 1991 1992 1993 1994 1995 1996 1997 1998 1999 2000 2001 2002 2003 2004 2005 2006 2007 2008 2009 2010 2011 2012
Figure 21Percentage of Wage and Salary Workers Ages 21–64 Who Participated in
an Employment-Based Retirement Plan, by Age, 1987–2012
21–24 25–34 35–44 45–54 55–64
Source: Employee Benefit Research Institute estimates from the 1988–2013 March Current Population Surveys.
Age
ebri.org Issue Brief • November 2013 • No. 392 31

51.0% 51.2% 51.1%51.5%
50.1%
48.8% 48.5%
51.0%
50.3%50.8%
51.6%
53.6% 53.6% 53.7%
51.8%
49.7%
49.5% 49.4%
47.8%
46.2%
47.8%
46.5%
45.0%45.3% 45.1%44.8%
40.7%40.8%
42.9%
42.9%43.2%
43.9%
43.6%
45.2%
45.0%
45.8%46.4%
48.1%
48.5%
49.3%
47.6%
46.6%47.1% 47.2%
46.1%
44.9%
46.9%
45.4%
44.6% 44.4%44.1%
43.5%
40%
42%
44%
46%
48%
50%
52%
54%
56%
1987 1988 1989 1990 1991 1992 1993 1994 1995 1996 1997 1998 1999 2000 2001 2002 2003 2004 2005 2006 2007 2008 2009 2010 2011 2012
Figure 22Percentage of Wage and Salary Workers Ages 21–64 Who Participated in
an Employment-Based Retirement Plan, by Gender, 1987–2012
Male
Female
Source: Employee Benefit Research Institute estimates from the 1988–2013 March Current Population Surveys.
48.0%48.3%49.6%49.7%49.4%49.4%49.4%
51.1%50.8%51.5%
52.7%
54.7%55.4%
56.3%
54.3%
52.7%52.9%52.8%51.7%
50.4%52.2%
50.8%49.4%49.5%49.6%49.1%
43.5%44.2%
45.5%45.8%
44.1%43.4%
40.5%
45.6%46.4%
45.2%45.9%
45.8%
46.7%47.4%
46.4%
44.6%45.0%45.9%
43.1%
41.3%
43.4%
41.4%41.6%
40.9%
41.6%
40.1%
32.2%
29.8%
29.7%
29.9% 29.8%
27.9%28.4%
29.5%
28.2%
31.4%
29.8%
32.3%31.1% 31.0%
29.4%
28.7%
29.2%
28.7%27.9%
26.5%
28.5% 28.3%
26.7%27.5%26.9%27.3%
43.1%42.0%
42.1%41.2%
37.6%
40.4%38.9%
42.8%41.1%
42.7%43.4%
46.4%
45.9%44.8%
44.0%43.1%43.5%
45.8%
43.1%
42.9%
44.7%43.2%
42.4%43.0%
41.5%
42.8%
25%
30%
35%
40%
45%
50%
55%
60%
1987 1988 1989 1990 1991 1992 1993 1994 1995 1996 1997 1998 1999 2000 2001 2002 2003 2004 2005 2006 2007 2008 2009 2010 2011 2012
Figure 23Percentage of Wage and Salary Workers Ages 21–64 Who Participated in an Employment-Based Retirement Plan, by Race/Ethnicity,a 1987–2012
White Black Hispanic Other
Source: Employee Benefit Research Institute estimates from the 1988–2013 March Current Population Surveys.a Beginning with the 2003 March Current Population Survey, changes were made to the race variable, where respondents were allowed to answer to more than one race. Thus, the 2002–2010 results are not entirely comparable with prior years, but are presented for illustrative purposes. The "other" category includes those who answered to being of more than one race for 2002–2012.
ebri.org Issue Brief • November 2013 • No. 392 32
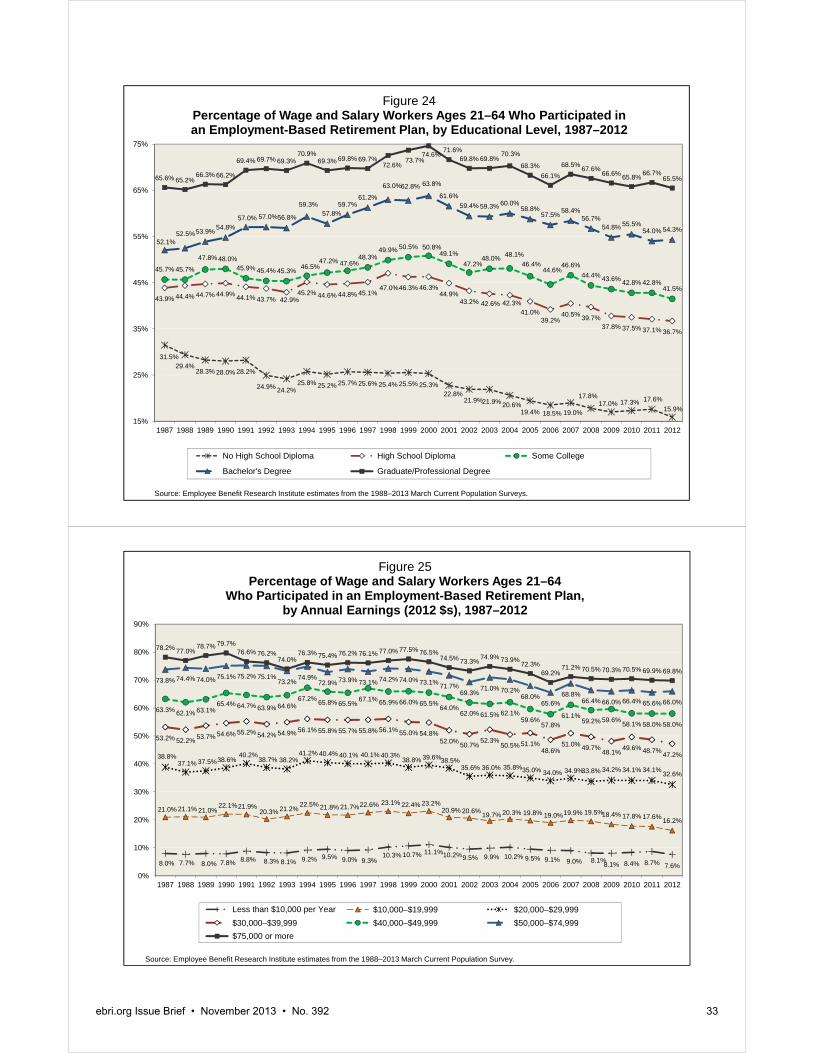
31.5%29.4%
28.3% 28.0% 28.2%
24.9% 24.2%25.8% 25.2% 25.7% 25.6% 25.4% 25.5% 25.3%
22.8%21.9%21.9% 20.6%
19.4% 18.5% 19.0%
17.8%17.0% 17.3% 17.6%
15.9%
43.9% 44.4% 44.7% 44.9% 44.1% 43.7% 42.9%45.2% 44.6% 44.8% 45.1%
47.0%46.3% 46.3%44.9%
43.2% 42.6% 42.3%41.0%
39.2%40.5% 39.7%
37.8% 37.5% 37.1% 36.7%
45.7% 45.7%
47.8% 48.0%45.9% 45.4% 45.3% 46.5%
47.2% 47.6%48.3%
49.9% 50.5% 50.8%49.1%
47.2%48.0% 48.1%
46.4%44.6%
46.6%44.4% 43.6% 42.8% 42.8%
41.5%
52.1%52.5%53.9% 54.8%
57.0% 57.0%56.8%
59.3%57.8%
59.7%61.2%
63.0%62.8% 63.8%
61.6%59.4% 59.3% 60.0%
58.8%57.5% 58.4%
56.7%54.8% 55.5%
54.0% 54.3%
65.6% 65.2%66.3% 66.2%
69.4% 69.7% 69.3%70.9%
69.3% 69.8% 69.7%72.6%
73.7%74.6%
71.6%69.8% 69.8%
70.3%
68.3%66.1%
68.5% 67.6%66.6% 65.8% 66.7%
65.5%
15%
25%
35%
45%
55%
65%
75%
1987 1988 1989 1990 1991 1992 1993 1994 1995 1996 1997 1998 1999 2000 2001 2002 2003 2004 2005 2006 2007 2008 2009 2010 2011 2012
Figure 24Percentage of Wage and Salary Workers Ages 21–64 Who Participated in an Employment-Based Retirement Plan, by Educational Level, 1987–2012
No High School Diploma High School Diploma Some College
Bachelor's Degree Graduate/Professional Degree
Source: Employee Benefit Research Institute estimates from the 1988–2013 March Current Population Surveys.
8.0% 7.7% 8.0% 7.8% 8.8% 8.3% 8.1% 9.2% 9.5% 9.0% 9.3%10.3% 10.7% 11.1%10.2%9.5% 9.9% 10.2% 9.5% 9.1% 9.0% 8.1%8.1% 8.4% 8.7% 7.6%
21.0% 21.1% 21.0%22.1%21.9%
20.3% 21.2%22.5% 21.8% 21.7%22.6% 23.1% 22.4% 23.2%
20.9% 20.6% 19.7% 20.3% 19.8% 19.0%19.9% 19.5%18.4% 17.8% 17.6% 16.2%
38.8%37.1% 37.5%38.6%
40.2%38.7% 38.2%
41.2% 40.4% 40.1% 40.1% 40.3%38.8% 39.6%38.5%
35.6% 36.0% 35.8%35.0% 34.0% 34.9%33.8% 34.2% 34.1% 34.1% 32.6%
53.2% 52.2% 53.7% 54.6% 55.2% 54.2% 54.9% 56.1% 55.8% 55.7% 55.8% 56.1% 55.0% 54.8%52.0% 50.7%
52.3%50.5% 51.1%
48.6%51.0% 49.7%
48.1% 49.6% 48.7% 47.2%
63.3% 62.1% 63.1%65.4% 64.7% 63.9% 64.6%
67.2% 65.8% 65.5%67.1% 65.9% 66.0% 65.5% 64.0%
62.0% 61.5% 62.1%59.6%
57.8%61.1%
59.2% 59.6% 58.1% 58.0% 58.0%
73.8% 74.4% 74.0% 75.1% 75.2% 75.1%73.2% 74.9%
72.9% 73.9% 73.1% 74.2% 74.0% 73.1% 71.7%69.3%
71.0% 70.2%68.0%
65.6%68.8%
66.4% 66.0% 66.4% 65.6% 66.0%
78.2% 77.0%78.7% 79.7%
76.6% 76.2%74.0%
76.3% 75.4% 76.2% 76.1% 77.0% 77.5% 76.5%74.5% 73.3% 74.9% 73.9% 72.3%
69.2%71.2% 70.5% 70.3% 70.5% 69.9% 69.8%
0%
10%
20%
30%
40%
50%
60%
70%
80%
90%
1987 1988 1989 1990 1991 1992 1993 1994 1995 1996 1997 1998 1999 2000 2001 2002 2003 2004 2005 2006 2007 2008 2009 2010 2011 2012
Figure 25Percentage of Wage and Salary Workers Ages 21–64
Who Participated in an Employment-Based Retirement Plan, by Annual Earnings (2012 $s), 1987–2012
Less than $10,000 per Year $10,000–$19,999 $20,000–$29,999$30,000–$39,999 $40,000–$49,999 $50,000–$74,999 $75,000 or more
Source: Employee Benefit Research Institute estimates from the 1988–2013 March Current Population Survey.
ebri.org Issue Brief • November 2013 • No. 392 33
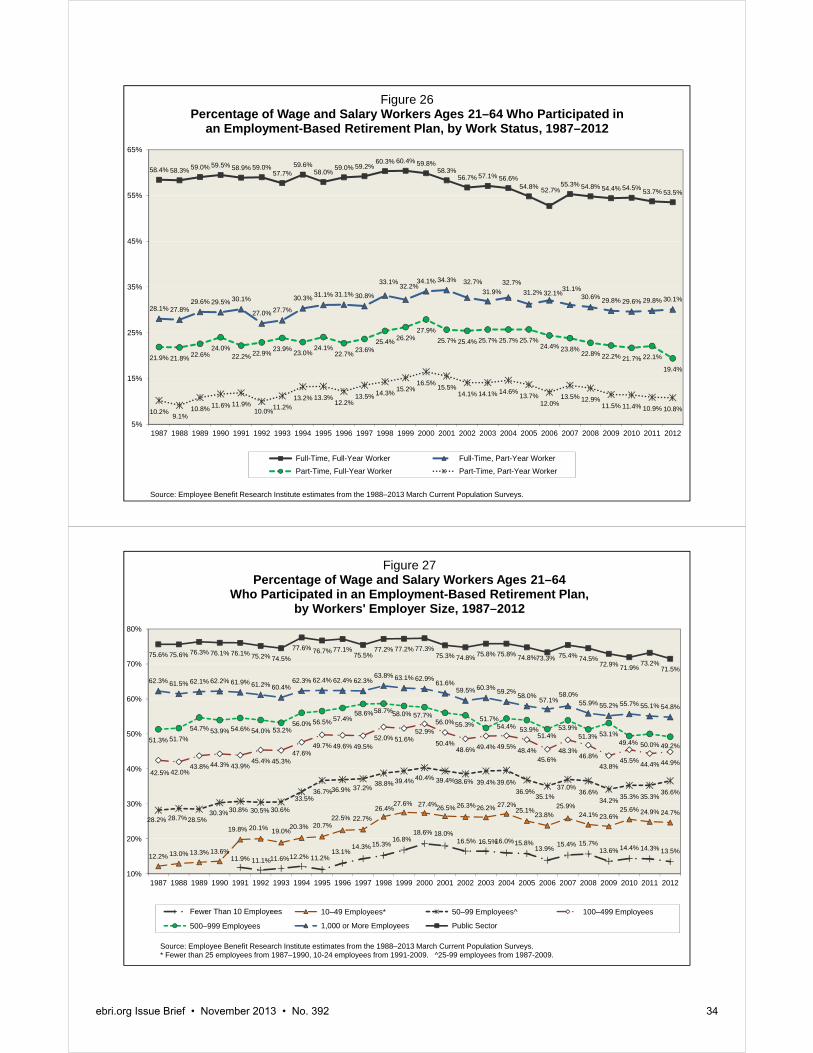
58.4% 58.3% 59.0% 59.5% 58.9% 59.0%57.7%
59.6%58.0%
59.0% 59.2%60.3% 60.4% 59.8%
58.3%56.7% 57.1% 56.6%
54.8% 52.7%55.3% 54.8% 54.4% 54.5% 53.7% 53.5%
28.1% 27.8%29.6% 29.5% 30.1%
27.0% 27.7%
30.3% 31.1% 31.1% 30.8%
33.1% 32.2%34.1% 34.3% 32.7%
31.9%32.7%
31.2% 32.1%31.1%30.6% 29.8% 29.6% 29.8% 30.1%
21.9% 21.8% 22.6%24.0%
22.2% 22.9% 23.9% 23.0%24.1%
22.7% 23.6%25.4% 26.2%
27.9%25.7% 25.4% 25.7% 25.7% 25.7%
24.4% 23.8%22.8% 22.2% 21.7% 22.1%
19.4%
10.2%9.1%
10.8% 11.6% 11.9%10.0%11.2%
13.2% 13.3%12.2%
13.5% 14.3% 15.2%16.5% 15.5%
14.1% 14.1% 14.6% 13.7%12.0%
13.5% 12.9%11.5% 11.4% 10.9% 10.8%
5%
15%
25%
35%
45%
55%
65%
1987 1988 1989 1990 1991 1992 1993 1994 1995 1996 1997 1998 1999 2000 2001 2002 2003 2004 2005 2006 2007 2008 2009 2010 2011 2012
Figure 26Percentage of Wage and Salary Workers Ages 21–64 Who Participated in
an Employment-Based Retirement Plan, by Work Status, 1987–2012
Full-Time, Full-Year Worker Full-Time, Part-Year Worker Part-Time, Full-Year Worker Part-Time, Part-Year Worker
Source: Employee Benefit Research Institute estimates from the 1988–2013 March Current Population Surveys.
11.9% 11.1%11.6%12.2% 11.2%13.1%
14.3% 15.3%16.8%
18.6% 18.0%16.5% 16.5%16.0%15.8%
13.9% 15.4% 15.7%13.6% 14.4% 14.3% 13.5%
12.2% 13.0% 13.3% 13.6%
19.8% 20.1% 19.0%20.3% 20.7%22.5% 22.7%
26.4%27.6% 27.4%26.5% 26.3%26.2% 27.2%
25.1%23.8%25.9%
24.1% 23.6%25.6% 24.9% 24.7%
28.2% 28.7%28.5%30.3%30.8% 30.5% 30.6%
33.5%36.7%36.9% 37.2% 38.8% 39.4% 40.4% 39.4%38.6% 39.4% 39.6%
36.9%35.1%
37.0%36.6%
34.2% 35.3% 35.3%36.6%
42.5% 42.0%43.8% 44.3% 43.9%
45.4% 45.3%47.6%
49.7% 49.6% 49.5%52.0% 51.6%
52.9%
50.4%48.6% 49.4% 49.5% 48.4%
45.6%48.3%
46.8%43.8%
45.5% 44.4% 44.9%
51.3% 51.7%54.7% 53.9% 54.6% 54.0% 53.2%
56.0% 56.5% 57.4%58.6%58.7%58.0% 57.7%
56.0%55.3%51.7%
54.4% 53.9%51.4%
53.9%51.3% 53.1%
49.4% 50.0% 49.2%
62.3% 61.5% 62.1% 62.2% 61.9% 61.2% 60.4%62.3% 62.4% 62.4% 62.3%
63.8% 63.1% 62.9% 61.6%59.5% 60.3% 59.2% 58.0% 57.1%
58.0%55.9% 55.2% 55.7% 55.1% 54.8%
75.6% 75.6% 76.3% 76.1% 76.1% 75.2% 74.5%77.6% 76.7% 77.1%
75.5%77.2% 77.2% 77.3%
75.3% 74.8% 75.8% 75.8% 74.8%73.3% 75.4% 74.5%72.9% 71.9%
73.2%71.5%
10%
20%
30%
40%
50%
60%
70%
80%
1987 1988 1989 1990 1991 1992 1993 1994 1995 1996 1997 1998 1999 2000 2001 2002 2003 2004 2005 2006 2007 2008 2009 2010 2011 2012
Figure 27Percentage of Wage and Salary Workers Ages 21–64
Who Participated in an Employment-Based Retirement Plan, by Workers' Employer Size, 1987–2012
Fewer Than 10 Employees 10–49 Employees* 50–99 Employees^ 100–499 Employees
500–999 Employees 1,000 or More Employees Public Sector
Source: Employee Benefit Research Institute estimates from the 1988–2013 March Current Population Surveys.* Fewer than 25 employees from 1987–1990, 10-24 employees from 1991-2009. ^25-99 employees from 1987-2009.
ebri.org Issue Brief • November 2013 • No. 392 34
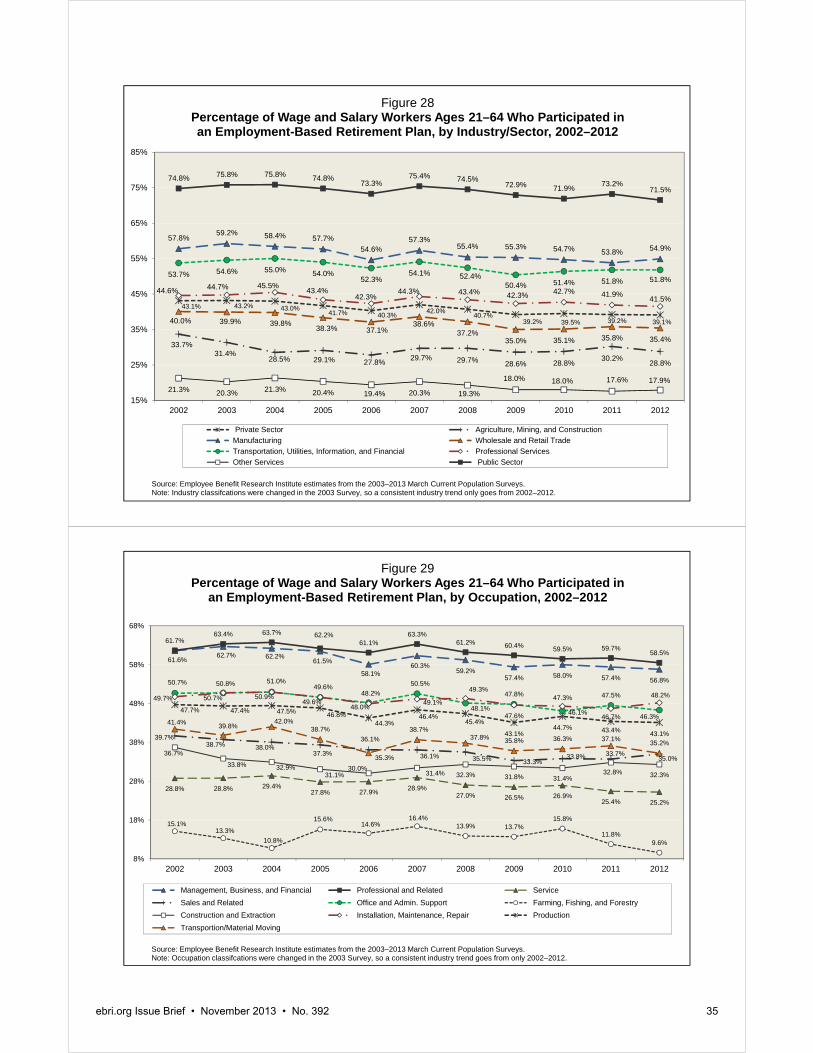
43.1% 43.2% 43.0%41.7% 40.3% 42.0% 40.7%
39.2% 39.5% 39.2% 39.1%
33.7%31.4%
28.5% 29.1% 27.8% 29.7% 29.7% 28.6% 28.8% 30.2% 28.8%
57.8%59.2% 58.4% 57.7%
54.6%57.3%
55.4% 55.3% 54.7% 53.8% 54.9%
40.0% 39.9% 39.8%38.3% 37.1%
38.6%37.2%
35.0% 35.1% 35.8% 35.4%
53.7% 54.6% 55.0% 54.0%52.3%
54.1% 52.4%50.4% 51.4% 51.8% 51.8%
44.6% 44.7% 45.5%43.4%
42.3%44.3% 43.4% 42.3% 42.7% 41.9% 41.5%
21.3% 20.3% 21.3% 20.4% 19.4% 20.3% 19.3%
18.0% 18.0% 17.6% 17.9%
74.8% 75.8% 75.8% 74.8%73.3%
75.4% 74.5%72.9% 71.9% 73.2%
71.5%
15%
25%
35%
45%
55%
65%
75%
85%
2002 2003 2004 2005 2006 2007 2008 2009 2010 2011 2012
Figure 28 Percentage of Wage and Salary Workers Ages 21–64 Who Participated in an Employment-Based Retirement Plan, by Industry/Sector, 2002–2012
Private Sector Agriculture, Mining, and Construction Manufacturing Wholesale and Retail Trade Transportation, Utilities, Information, and Financial Professional Services Other Services Public Sector
Source: Employee Benefit Research Institute estimates from the 2003–2013 March Current Population Surveys.Note: Industry classifcations were changed in the 2003 Survey, so a consistent industry trend only goes from 2002–2012.
61.6%62.7% 62.2%
61.5%
58.1%60.3%
59.2%57.4% 58.0% 57.4% 56.8%
61.7%63.4% 63.7% 62.2%
61.1%63.3%
61.2% 60.4% 59.5% 59.7%58.5%
28.8% 28.8% 29.4%27.8% 27.9% 28.9%
27.0% 26.5% 26.9%25.4% 25.2%
39.7%38.7% 38.0%
37.3%
36.1%
36.1% 35.5% 33.3%33.8% 33.7%
35.0%
50.7%
50.7%
51.0%49.6%
48.2%50.5%
48.1%
47.8%
46.1%
47.5%
46.3%
15.1%13.3%
10.8%
15.6%14.6%
16.4%13.9% 13.7%
15.8%
11.8%9.6%
36.7%
33.8% 32.9%31.1%
30.0%31.4% 32.3% 31.8% 31.4%
32.8% 32.3%
49.7%
50.8%
50.9%49.6%
48.0%49.1%
49.3%
47.6%
47.3%
46.7%
48.2%
47.7% 47.4% 47.5% 46.8%44.3%
46.4%45.4%
43.1%44.7% 43.4% 43.1%
41.4% 39.8%42.0%
38.7%
35.3%
38.7%37.8% 35.8% 36.3% 37.1% 35.2%
8%
18%
28%
38%
48%
58%
68%
2002 2003 2004 2005 2006 2007 2008 2009 2010 2011 2012
Figure 29 Percentage of Wage and Salary Workers Ages 21–64 Who Participated in
an Employment-Based Retirement Plan, by Occupation, 2002–2012
Management, Business, and Financial Professional and Related Service Sales and Related Office and Admin. Support Farming, Fishing, and Forestry Construction and Extraction Installation, Maintenance, Repair Production Transportion/Material Moving
Source: Employee Benefit Research Institute estimates from the 2003–2013 March Current Population Surveys.Note: Occupation classifcations were changed in the 2003 Survey, so a consistent industry trend goes from only 2002–2012.
ebri.org Issue Brief • November 2013 • No. 392 35
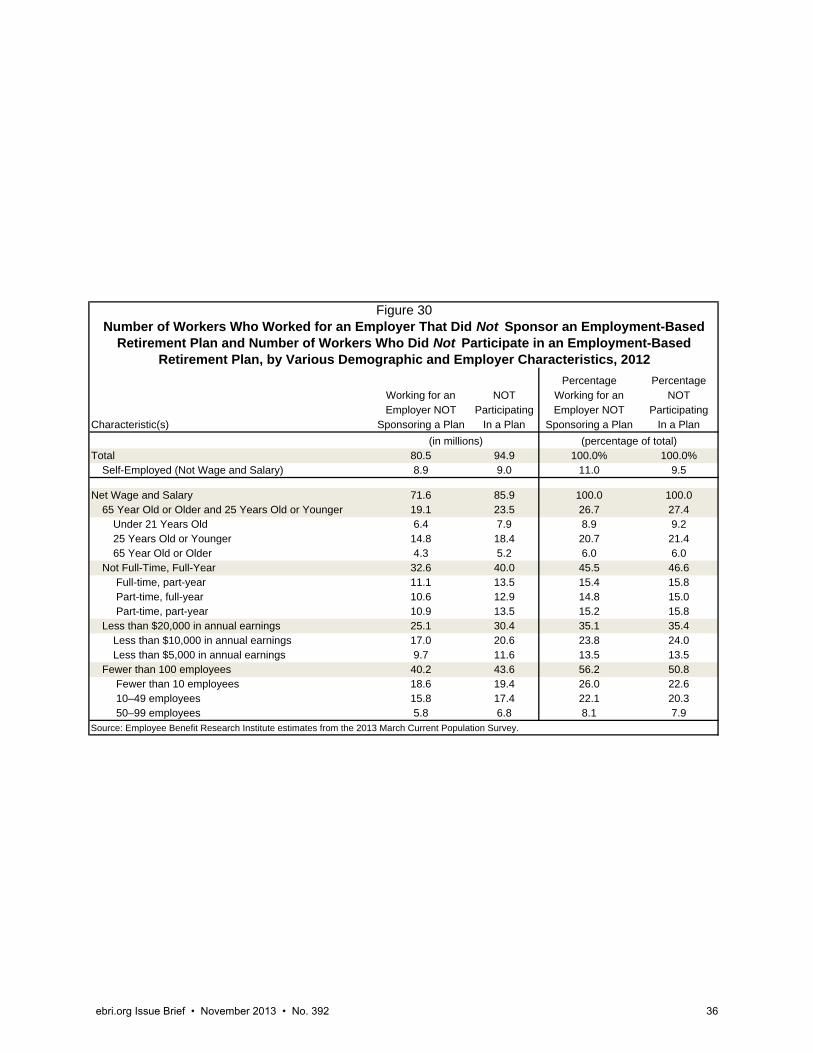
Percentage PercentageWorking for an NOT Working for an NOTEmployer NOT Participating Employer NOT Participating
Characteristic(s) Sponsoring a Plan In a Plan Sponsoring a Plan In a Plan
Total 80.5 94.9 100.0% 100.0%Self-Employed (Not Wage and Salary) 8.9 9.0 11.0 9.5
Net Wage and Salary 71.6 85.9 100.0 100.065 Year Old or Older and 25 Years Old or Younger 19.1 23.5 26.7 27.4
Under 21 Years Old 6.4 7.9 8.9 9.225 Years Old or Younger 14.8 18.4 20.7 21.465 Year Old or Older 4.3 5.2 6.0 6.0
Not Full-Time, Full-Year 32.6 40.0 45.5 46.6 Full-time, part-year 11.1 13.5 15.4 15.8 Part-time, full-year 10.6 12.9 14.8 15.0 Part-time, part-year 10.9 13.5 15.2 15.8
Less than $20,000 in annual earnings 25.1 30.4 35.1 35.4Less than $10,000 in annual earnings 17.0 20.6 23.8 24.0Less than $5,000 in annual earnings 9.7 11.6 13.5 13.5
Fewer than 100 employees 40.2 43.6 56.2 50.8 Fewer than 10 employees 18.6 19.4 26.0 22.6 10–49 employees 15.8 17.4 22.1 20.3 50–99 employees 5.8 6.8 8.1 7.9
Source: Employee Benefit Research Institute estimates from the 2013 March Current Population Survey.
Figure 30Number of Workers Who Worked for an Employer That Did Not Sponsor an Employment-Based
Retirement Plan and Number of Workers Who Did Not Participate in an Employment-BasedRetirement Plan, by Various Demographic and Employer Characteristics, 2012
(in millions) (percentage of total)
ebri.org Issue Brief • November 2013 • No. 392 36
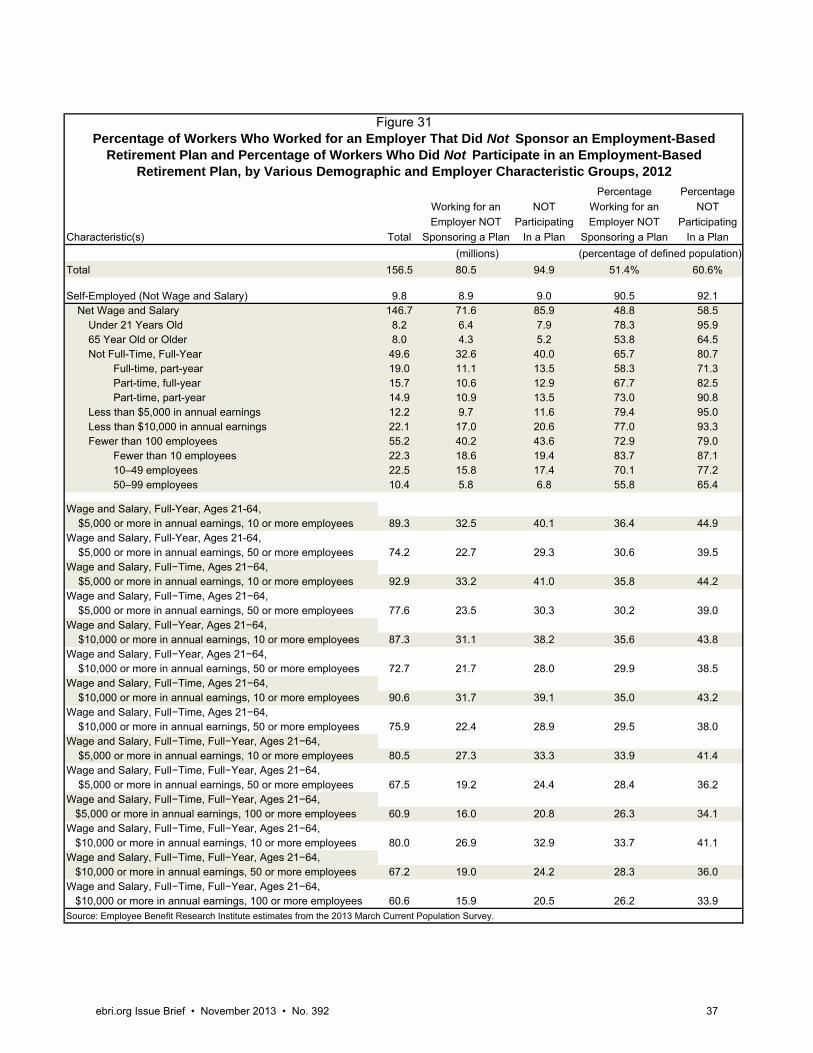
Percentage Percentage
Working for an NOT Working for an NOT
Employer NOT Participating Employer NOT Participating
Characteristic(s) Total Sponsoring a Plan In a Plan Sponsoring a Plan In a Plan
Total 156.5 80.5 94.9 51.4% 60.6%
Self-Employed (Not Wage and Salary) 9.8 8.9 9.0 90.5 92.1Net Wage and Salary 146.7 71.6 85.9 48.8 58.5
Under 21 Years Old 8.2 6.4 7.9 78.3 95.965 Year Old or Older 8.0 4.3 5.2 53.8 64.5Not Full-Time, Full-Year 49.6 32.6 40.0 65.7 80.7
Full-time, part-year 19.0 11.1 13.5 58.3 71.3 Part-time, full-year 15.7 10.6 12.9 67.7 82.5 Part-time, part-year 14.9 10.9 13.5 73.0 90.8
Less than $5,000 in annual earnings 12.2 9.7 11.6 79.4 95.0Less than $10,000 in annual earnings 22.1 17.0 20.6 77.0 93.3Fewer than 100 employees 55.2 40.2 43.6 72.9 79.0
Fewer than 10 employees 22.3 18.6 19.4 83.7 87.1 10–49 employees 22.5 15.8 17.4 70.1 77.2 50–99 employees 10.4 5.8 6.8 55.8 65.4
Wage and Salary, Full-Year, Ages 21-64, $5,000 or more in annual earnings, 10 or more employees 89.3 32.5 40.1 36.4 44.9Wage and Salary, Full-Year, Ages 21-64, $5,000 or more in annual earnings, 50 or more employees 74.2 22.7 29.3 30.6 39.5Wage and Salary, Full−Time, Ages 21−64, $5,000 or more in annual earnings, 10 or more employees 92.9 33.2 41.0 35.8 44.2Wage and Salary, Full−Time, Ages 21−64, $5,000 or more in annual earnings, 50 or more employees 77.6 23.5 30.3 30.2 39.0Wage and Salary, Full−Year, Ages 21−64, $10,000 or more in annual earnings, 10 or more employees 87.3 31.1 38.2 35.6 43.8Wage and Salary, Full−Year, Ages 21−64, $10,000 or more in annual earnings, 50 or more employees 72.7 21.7 28.0 29.9 38.5Wage and Salary, Full−Time, Ages 21−64, $10,000 or more in annual earnings, 10 or more employees 90.6 31.7 39.1 35.0 43.2Wage and Salary, Full−Time, Ages 21−64, $10,000 or more in annual earnings, 50 or more employees 75.9 22.4 28.9 29.5 38.0Wage and Salary, Full−Time, Full−Year, Ages 21−64, $5,000 or more in annual earnings, 10 or more employees 80.5 27.3 33.3 33.9 41.4Wage and Salary, Full−Time, Full−Year, Ages 21−64, $5,000 or more in annual earnings, 50 or more employees 67.5 19.2 24.4 28.4 36.2Wage and Salary, Full−Time, Full−Year, Ages 21−64, $5,000 or more in annual earnings, 100 or more employees 60.9 16.0 20.8 26.3 34.1Wage and Salary, Full−Time, Full−Year, Ages 21−64, $10,000 or more in annual earnings, 10 or more employees 80.0 26.9 32.9 33.7 41.1Wage and Salary, Full−Time, Full−Year, Ages 21−64, $10,000 or more in annual earnings, 50 or more employees 67.2 19.0 24.2 28.3 36.0Wage and Salary, Full−Time, Full−Year, Ages 21−64, $10,000 or more in annual earnings, 100 or more employees 60.6 15.9 20.5 26.2 33.9Source: Employee Benefit Research Institute estimates from the 2013 March Current Population Survey.
(percentage of defined population)
Figure 31Percentage of Workers Who Worked for an Employer That Did Not Sponsor an Employment-Based
Retirement Plan and Percentage of Workers Who Did Not Participate in an Employment-BasedRetirement Plan, by Various Demographic and Employer Characteristic Groups, 2012
(millions)
ebri.org Issue Brief • November 2013 • No. 392 37
ebri.org Issue Brief • November 2013 • No. 392 38
References Anguelow, Chris E., Howard M. Iams, and Patrick J. Purcell. “Shifting Income Sources of the Aged,” Social Security
Bulletin. Vol. 72, No. 3, August 2012 www.ssa.gov/policy/docs/ssb/v72n3/v72n3p59.html
Board of Trustees of the Federal Old-Age and Survivors Insurance and Disability Insurance Trust Funds. The 2013 Annual Report of the Board of Trustees of the Federal Old-Age and Survivors Insurance and Disability Insurance Trust Funds. May 31, 2013 www.ssa.gov/oact/TR/2013/tr2013.pdf
Copeland, Craig. “Individual Account Retirement Plans: An Analysis of the 2010 Survey of Consumer Finances.” EBRI Issue Brief, no. 375 (Employee Benefit Research Institute, September 2012a).
________. “Employment-Based Retirement Plan Participation: Geographic Differences and Trends, 2011.” EBRI Issue Brief, no. 378 (Employee Benefit Research Institute, November 2012b).
________. “Retirement Plan Participation: Survey of Income and Program Participation (SIPP) Data, 2012.” EBRI Notes, no. 8 (Employee Benefit Research Institute, August 2013): 2–13.
Dushi, Irena, Howard M. Iams, and Jules Lichtenstein. “Assessment of Retirement Plan Coverage by Firm Size, Using W-2 Tax Records,” Social Security Bulletin. Vol. 71, No. 2, May 2011 www.ssa.gov/policy/docs/ssb/v71n2/v71n2p53.pdf
Fronstin, Paul. “Counting the Uninsured: A Comparison of National Surveys.” EBRI Issue Brief, no. 225 (Employee Benefit Research Institute, September 2000).
________. “Sources of Health Insurance and Characteristics of the Uninsured: Analysis of the March 2011 Current Population Survey.” EBRI Issue Brief, no. 362 (Employee Benefit Research Institute, September 2011).
Holden, Sarah, and Jack VanDerhei. “Can 401 Accumulations Generate Significant Income for Future Retirees?” EBRI Issue Brief, no. 251 (Employee Benefit Research Institute, November 2002).
Purcell, Patrick. “Pension Sponsorship and Participation: Summary of Recent Trends.” CRS Reports for Congress RL30122 (Congressional Research Services, September 11, 2009).
Treasury Inspector General for Tax Administration, Statistical Trends in Retirement Plans. No. 2010-10-097. August 9, 2010 www.treas.gov/tigta/auditreports/2010reports/201010097fr.pdf
U.S. Department of Labor. Bureau of Labor Statistics. Employee Benefits in Medium and Large Private Establishments, 1995 (1998). www.bls.gov/ncs/ebs/sp/ebbl0015.pdf
________. Employee Benefits in Medium and Large Private Establishments, 1997 (1999). www.bls.gov/ncs/ebs/sp/ebbl0017.pdf
________. National Compensation Survey: Employee Benefits in Private Industry, 2000 (2003). www.bls.gov/ncs/ebs/sp/ebbl0019.pdf
________. National Compensation Survey: Employee Benefits in Private Industry, March 2005 Summary (2005). www.bls.gov/ncs/ebs/sp/ebbl0022.pdf
________. National Compensation Survey: Employee Benefits in Private Industry, March 2006 Summary (2006). www.bls.gov/ncs/ebs/sp/ebsm0004.pdf
________. National Compensation Survey: Employee Benefits in Private Industry, March 2007 Summary (August 2007). www.bls.gov/ncs/ebs/sp/ebsm0006.pdf
ebri.org Issue Brief • November 2013 • No. 392 39
________. National Compensation Survey: Employee Benefits in the United States, March 2008. Press Release (August 7, 2008) www.bls.gov/ncs/ebs/sp/ebnr0014.pdf
________. National Compensation Survey: Employee Benefits in the United States, March 2009 Press Release (July 28, 2009) www.bls.gov/ncs/ebs/sp/ebnr0015.pdf
________. National Compensation Survey: Employee Benefits in the United States, March 2010 Press Release (July 27, 2010) www.bls.gov/ncs/ebs/sp/ebnr0016.pdf
________. National Compensation Survey: Employee Benefits in the United States, March 2011 Press Release (July 2011a) www.bls.gov/ncs/ebs/sp/ebnr0017.txt
________. National Compensation Survey: Retirement Benefits, March 2010: Private Industry—Retirement Benefits: Access, Participation, and Take-up Rates Data Table. (July 2011b) www.bls.gov/ncs/ebs/benefits/2010/ownership/private/table02a.htm
________. National Compensation Survey: Health and Retirement Provisions in Private Industry in the United States, 2010 (August, 2011c) www.bls.gov/ncs/ebs/detailedprovisions/2010/ebbl0047.pdf
________. National Compensation Survey: Employee Benefits in the United States, March 2012 Press Release (July 2012) www.bls.gov/ncs/ebs/sp/ebnr0018.txt
________. National Compensation Survey: Employee Benefits in the United States, March 2013 Press Release (July 2013) www.bls.gov/news.release/ebs2.t01.htm
U.S. Department of Labor. Employee Benefits Security Administration, Private Pension Plan Bulletin Abstract of 2011 Form 5500 Annual Reports (June 2013), www.dol.gov/ebsa/pdf/2011pensionplanbulletin.pdf
________. Employee Benefits Security Administration, Private Pension Plan Bulletin Historical Tables and Graphs (June 2013), www.dol.gov/ebsa/pdf/historicaltables.pdf
VanDerhei, Jack. “Measuring Retirement Income Adequacy: Calculating Realistic Income Replacement Rates.” EBRI Issue Brief, no. 297 (Employee Benefit Research Institute, September 2006).
VanDerhei, Jack, and Craig Copeland. “The Changing Face of Private Retirement Plans.” EBRI Issue Brief, no. 232 (Employee Benefit Research Institute, April 2001).
________. “Can America Afford Tomorrow’s Retirees: Results From the EBRI-ERF Retirement Security Projection Model.” EBRI Issue Brief, no. 263 (Employee Benefit Research Institute, November 2003).
________. “ERISA At 30: The Decline of Private-Sector Defined Benefit Promises and Annuity Payments? What Will It Mean?” EBRI Issue Brief, no. 269 (Employee Benefit Research Institute, May 2004).
________. “The Impact of PPA on Retirement Savings for 401(k) Participants” EBRI Issue Brief, no. 318 (Employee Benefit Research Institute, June 2008).
________. “The EBRI Retirement Readiness Rating™: Retirement Income Preparation and Future Prospects.” EBRI Issue Brief, no. 344 (Employee Benefit Research Institute, July 2010).
________. “The Impact of Deferring Retirement Age on Retirement Income Adequacy.” EBRI Issue Brief, no. 358 (Employee Benefit Research Institute, June 2011).
Jack VanDerhei, Sarah Holden, Luis Alonso, and Steven Bass, “401(k) Plan Asset Allocation, Account Balances, and Loan Activity in 2011,” EBRI Issue Brief, no. 380 (Employee Benefit Research Institute, December 2012).
ebri.org Issue Brief • November 2013 • No. 392 40
Endnotes 1 The 75 million comes from the Census Bureau’s Current Population Survey of the noninstitutionalized population currently living in the United States, including immigrants, both citizens and noncitizens.
2 For families with one earner meeting the spousal benefit criteria, these replacement rates would increase by 50 percent, because the nonworking spouse could qualify for a benefit equal to 50 percent of the working spouse’s benefit. Therefore, on a family basis for one-earner couples, the replacement rates would range from about 45 percent to 75 percent.
3 See Copeland (2012b) for results from 2011 in this annual publication series from the Current Population Survey.
4 Technically, most private, qualified defined contribution plans are either money purchase or profit-sharing plans (Sec. 401(k) plans are of the latter type). Under the former, the plan sponsor typically commits to a fixed percentage of compensation each year. For a profit-sharing plan, plan contributions may be made on a discretionary basis by the plan sponsor, but how these contributions are allocated among individual employee accounts must be based on a specified, predetermined formula meeting certain requirements if the plan is to qualify for tax-favored status.
5 Employer contributions may be subject to vesting rules, such that participants do not have full legal rights to employer contributions made on their behalf until they have reached a certain minimum number of years of service. Consequently, if the participant terminates employment before reaching this minimum level of service, the benefit available would be reduced by the nonvested portion of the account balance.
6 Lump-sum distributions are increasingly available in DB plans. For example, in 2010, 46 percent of full-time employees in private-sector DB plans were eligible for lump-sum distributions (U.S. Department of Labor, 2011c). That compares with 1997 and 1995, when 76 percent and 85 percent, respectively, of full-time workers participating in a DB plan in a medium or large establishment were not offered a lump-sum distribution (U.S. Department of Labor, 1999, 1998).
7 The Employee Retirement Income Security Act of 1974 (ERISA) expanded the definition of pension to include both DB and DC plans, and within most private-sector discussions it now is used to refer to both. Whereas, in the public sector, the term pension is still largely reserved for DB plans.
8 The 2011 number for active defined contribution participants includes some participants who were not included prior to 2004, in particular those classified as not contributing under the revised requirements for completing the Form 5500. Therefore, some of the increase in the time series was due to including more participants as actives who were not included in prior years. This resulted in 9 million more being counted as actives in 2004—the last year both ways of reporting were possible. See Department of Labor, Employee Benefits Security Administration’s Private Pension Plan Bulletin Historical Tables and Graphs (2013) for more information. Furthermore, over 18 million participants in 401(k) plans had employers that also sponsored other pension plans (See U.S. Department of Labor Employee Benefits Security Administration, Private Pension Plan Bulletin Abstract of 2011 Form 5500 Annual Reports, June 2013 p. 47 table D5). Consequently, these aggregate numbers reported from the Form 5500s included a significant number of double counting. In contrast, the CPS only counts an individual once regardless of the number of plans that individual is participating in during the year.
Not accounting for this double counting or inclusion of more participants as considered active found in these reports can lead to conclusions that are contradicted by this study. Such as:
“Employer-sponsored retirement plan participation has significantly outpaced the growth in the working age population over the past 30 years. Between July 1977 and July 2007, the working age population (i.e., people between the age of 18 and 64 years) grew 44.8 percent (from 130.9 million to 189.5 million). However, employer-sponsored retirement plan participation grew 102.1 percent (from 42.7 million to 86.3 million) between CYs 1977 and 2007. This rate of growth indicates that working Americans are increasingly participating in retirement plans sponsored by their employers.” (See Treasury Inspector General for Tax Administration, Statistical Trends in Retirement Plans. August 9, 2010).

ebri.org Issue Brief • November 2013 • No. 392 41
These numbers are evidence of the increase in the number of participants that have more than one plan due to the proliferation of DC plans in the private sector, but not an increase in the fraction of workers that are participants in a retirement plan.
9 See VanDerhei and Copeland (April 2001).
10 See VanDerhei, Holden, Alonso, and Bass (2012) for results on how current workers, in their present jobs, are doing in terms of accumulating assets in 401(k) plans. One important caveat of this study in regard to overall accumulations of workers in 401(k) plans is that the study does not include any assets accumulated at past jobs that have not been rolled into the worker’s current employment-based plan.
11 See VanDerhei and Copeland (April 2001) for discussion of the reasons for the growth in DC plans and the consequences of this growth for retirees.
12 The 2010 SCF was released in early-mid 2012 with 2010 data. Therefore, the data are two years behind the CPS used in this study. However, SCF remains the most updated survey of overall assets held by American households (among other things) and is an essential piece in the evaluation of the status of Americans’ preparation for retirement.
13 See from the Bureau of Labor Statistics website: “Employee Benefits in the United States‒March 2013” (July 2013), www.bls.gov/news.release/ebs2.t01.htm; “Employee Benefits in the United States‒March 2012” (September 2012), www.bls.gov/ncs/ebs/benefits/2012/ebbl0050.pdf “Employee Benefits in the United States‒March 2011” (July 2011a), www.bls.gov/ncs/ebs/sp/ebnr0017.txt; and “Retirement Benefits, March 2010: Private Industry,” Retirement Benefits: Access, Participation, and Take-up Rates Data Table (July 2011b), www.bls.gov/ncs/ebs/benefits/2010/ownership/private/table02a.htm
14 Each March, the CPS asks about retirement plan participation in the prior year. For example, the March 2013 CPS asks about retirement plan participation in 2012.
15 Wage and salary workers include all workers who work for someone else as well as those who are self-employed and are incorporated. Thus, the unincorporated self-employed are not included.
16 A worker who is at least 21 years of age, has one year of tenure, and works more than 2,000 hours in a year, in general, must be covered by an employer who offers a private-sector retirement plan to its workers (IRC Sec. 401(a) 26). Typically, public-sector employers follow similar rules, despite not being governed by all of the same statutes as those for private-sector employers.
17 Starting with the 2003 March Current Population Survey, changes were made to the race questions, allowing respondents to answer to more than one race, e.g., white and black. These individuals are included in the “other race” category. Thus, the white category only includes those who responded that they were white only, blacks as black only, etc.
18 Native-born means the worker was born in the continental United States, Hawaii, or Alaska, but not U.S. territories such as Puerto Rico.
19 See VanDerhei and Copeland (2011) for an examination of health care costs in retirement and the impact of deferring retirement age to cover these health care costs so that workers have sufficient income in retirement in order to maintain the same standard of living throughout retirement.
20 The economic conditions within the geographic locations play an important role in the differences across the locations, such as local unemployment rates, job types (i.e., manufacturing vs. retail) available, etc.
21 State estimates of the less populated states are less reliable than those of more populated states due to the sample size in the survey in those states. Consequently, these state estimates should be used with caution. Furthermore, due to the fairly
ebri.org Issue Brief • November 2013 • No. 392 42
significant standard error in the less populated states, in order to lessen any potential sampling error, three-year averages are used to present trends in the state estimates. See Fronstin (2011) for use of the three-year state averages in the analysis of employment-based health insurance coverage.
22 The District of Columbia is considered a state ease of exposition.
23 As discussed earlier, the CPS is the most up-to-date and consistent survey of retirement plan participation among all employees with detailed demographic data. SIPP also has data on these issues. In Copeland (2013), the percentage of workers participating in a retirement plan was found to have increased from 1998 to 2003 and then to have decreased by 2006 before increasing again in 2009 and 2012, according to SIPP data. Furthermore, the level of participation was higher in SIPP than that in CPS. While the level of difference can be easily explained, as the SIPP study on retirement plan participation is focused only on those working at the time of the survey (compared with CPS, which asks individuals about retirement plan participation for anybody who worked in the past year, not just those currently working), the trend differences cannot be easily explained. While the SIPP trend did not match the CPS trend from 1998 to 2003, it did match the drop found in CPS from 2003 to 2006 and was close in 2009 with the increase and decrease found in CPS between those years. In 2012, CPS had a participation level below the 2009 level, while SIPP showed an increase between 2009 and 2012. Results from SIPP and CPS data have also provided differences in the percentage of individuals without health insurance that have not been completely explained other than by methodology issues. See Fronstin (2000, 2011) for a further discussion on the differences in these two surveys in counting the uninsured. In addition, the most recent SCF also shows a decrease in the percentage of families with workers who participate in an employment-based retirement plan from 2007 to 2010 matching the CPS (Copeland 2012a). For comparison, results from the U.S. Department of Labor’s Bureau of Labor Statistics (2003, 2005, 2006, 2007, 2008, 2009, 2010, 2011a, and 2012) show an increase in the percentage of private-sector workers participating in a retirement plan from 48 percent in 2000, 49 percent in 2003, 50 percent in 2005, and to 51 percent in 2006‒2009 before declines in 2010 to 50 percent, 49 percent in 2011 and 48 percent in 2012. However, the BLS survey is a survey of private establishments about their employees’ participation, while CPS is a survey directly asked of households. Consequently, the BLS survey does not provide the level of individual demographic data that the CPS does. Therefore, the CPS has the most up-to-date breakdowns of retirement plan participation by individual demographic data from the longest consistent set of annually asked questions on this topic. See Purcell (2009) for a further discussion on the differences from the BLS numbers in the National Compensation Survey and the CPS.
24 The race categories were revised in the 2003 survey to allow for combinations of races. However, the distribution of workers among the race categories was virtually unchanged even with those of more than one race being moved to the “other race” category. Consequently, the trend for the race/ethnicity categories is presented despite the inconsistent definitions of these categories.
25 All earnings amounts are in 2012 dollars, that is, all earnings from years prior to 2012 are inflated by the consumer price index (CPI) level to reach 2012 dollars. Earnings are defined as the amount a worker is paid in compensation—wages and salary. This does not include investment income or other income sources.
26 The industry definitions within the 2003 CPS were altered. Consequently, industry participation levels before 2002 cannot be compared with the more current years’ results.
27 The occupation definitions within the 2003 CPS were altered. Consequently, occupation participation levels before 2002 cannot be compared with the more current years’ results.
28 An employment-based retirement plan can be sponsored by an employer or by a union. “Employer sponsored” is used in this section of the study for brevity, but it should be understood that it also means “union sponsored.”
29 This includes the 80.5 million who worked for employers/unions that did not sponsor a plan plus 14.4 million who worked for employers that sponsored a plan but did not participate in the plan for whatever reason.
ebri.org Issue Brief • November 2013 • No. 392 43
30 While females have higher participation levels in each work status and earnings category, they have a lower likelihood of participating in a defined contribution plan when eligible. From the 2010 SCF, female family heads had a participation rate of 70.9 percent in DC plans compared with 80.3 percent for male family heads. Consequently, it appears that females are more likely to work for employers that offer a plan than are males.
31 See Holden and VanDerhei (2002) for projections of replacement rates from 401(k) plans for 401(k)-plan participants under various career 401(k)-plan-participation scenarios to see the impact of how continuously participating in a plan substantially increases the replacement rate to be expected from these plans. See VanDerhei and Copeland (2010) for more information on how an increased number of future years eligible for participation in a DC plan reduces the likelihood of workers having inadequate retirement income to cover standard expenses and uninsured medical expenses in retirement.
32 It is uncertain how participants in a frozen plan with an accumulated benefit will answer the question about participating in a plan.
33 See VanDerhei and Copeland (2008) for an estimation of the possible impact on 401(k) plan account accumulations from automatic enrollment.
34 The impact of automatic enrollment is hard to quantify from this survey, as numerous other factors are affecting the levels of participation. Automatic enrollment, in many cases, has only been implemented for new hires, not for all workers, and in some cases, has replaced a DB plan that would have had 100 percent participation in almost all cases given the nature of the plan. Furthermore, not all DC plans have implemented an automatic enrollment feature. Consequently, the impact of automatic enrollment will take a number of years before it can drive the overall level of participation in the labor force, because only a very small fraction of the labor force is subject to automatic enrollment each year.
35 These expenses include housing, food, apparel and services, transportation, reading and education, and entertainment plus basic health care costs such as Medicare premiums and Medigap premiums and stochastic health care expenditures for those who have nursing home or home health care episodes of care. The level of nonstochastic expenses is a function of the retiree’s retirement income.
36 See VanDerhei (2006) for a further discussion of the amount of income needed to be replaced, when accounting for various types of risk in retirement and the probability of successfully doing so.

EBRI Employee Benefit Research Institute Issue Brief (ISSN 0887137X) is published monthly by the Employee Benefit Research Institute, 1100 13th St. NW, Suite 878, Washington, DC, 20005-4051, at $300 per year or is included as part of a membership subscription. Periodi-cals postage rate paid in Washington, DC, and additional mailing offices. POSTMASTER: Send address changes to: EBRI Issue Brief, 1100 13th St. NW, Suite 878, Washington, DC, 20005-4051. Copyright 2013 by Employee Benefit Research Institute. All rights reserved. No. 392.
The Employee Benefit Research Institute (EBRI) was founded in 1978. Its mission is to contribute to, to encourage, and to enhance the development of sound employee benefit programs and sound public policy through objective research and education. EBRI is the only private, nonprofit, nonpartisan, Washington, DC-based organization committed exclusively to public policy research and education on economic security and employee benefit issues. EBRI’s membership includes a cross-section of pension funds; businesses; trade associations; labor unions; health care providers and insurers; government organizations; and service firms.
EBRI’s work advances knowledge and understanding of employee benefits and their importance to the nation’s economy among policymakers, the news media, and the public. It does this by conducting and publishing policy research, analysis, and special reports on employee benefits issues; holding educational briefings for EBRI members, congressional and federal agency staff, and the news media; and sponsoring public opinion surveys on employee benefit issues. EBRI’s Education and Research Fund (EBRI-ERF) performs the charitable, educational, and scientific functions of the Institute. EBRI-ERF is a tax-exempt organization supported by contributions and grants.
EBRI Issue Briefs is a monthly periodical with in-depth evaluation of employee benefit issues and trends, as well as critical analyses of employee benefit policies and proposals. EBRI Notes is a monthly periodical providing current information on a variety of employee benefit topics. EBRIef is a weekly roundup of EBRI research and insights, as well as updates on surveys, studies, litigation, legislation and regulation affecting employee benefit plans, while EBRI’s Blog supplements our regular publications, offering commentary on questions received from news reporters, policymakers, and others. EBRI Fundamentals of Employee Benefit Programs offers a straightforward, basic explanation of employee benefit programs in the private and public sectors. The EBRI Databook on Employee Benefits is a statistical reference work on employee benefit programs and work force-related issues.
Contact EBRI Publications, (202) 659-0670; fax publication orders to (202) 775-6312. Subscriptions to EBRI Issue Briefs are included as part of EBRI membership, or as part of a $199 annual subscription to EBRI Notes and EBRI Issue Briefs. Change of Address: EBRI, 1100 13th St. NW, Suite 878, Washington, DC, 20005-4051, (202) 659-0670; fax number, (202) 775-6312; e-mail: [email protected] Membership Information: Inquiries regarding EBRI membership and/or contributions to EBRI-ERF should be directed to EBRI President Dallas Salisbury at the above address, (202) 659-0670; e-mail: [email protected]
Editorial Board: Dallas L. Salisbury, publisher; Stephen Blakely, editor. Any views expressed in this publication and those of the authors should not be ascribed to the officers, trustees, members, or other sponsors of the Employee Benefit Research Institute, the EBRI Education and Research Fund, or their staffs. Nothing herein is to be construed as an attempt to aid or hinder the adoption of any pending legislation, regulation, or interpretative rule, or as legal, accounting, actuarial, or other such professional advice. www.ebri.org
EBRI Issue Brief is registered in the U.S. Patent and Trademark Office. ISSN: 0887137X/90 0887137X/90 $ .50+.50
© 2013, Employee Benefit Research InstituteEducation and Research Fund. All rights reserved.
Who we are
What we do
Our publications
Orders/ Subscriptions