Embed Size (px)
Citation preview

1
2

2017 Key Highlights
• We achieved great results in 2017.• First - Our total sales reached an all-time high of 31.5 million tons, an increase of
4% over 2016. This is as a result of the growing petroleum products market inTurkey and our strong operational performance.
• Second - Our refineries processed 30.7 million tons of crude oil and otherfeedstock.
Our crude capacity utilization was 101.4% while our total utilization reached 108.1%;which is another record for 2017.• Third – Our company’s net refining margin of 8.1 dollars per barrel in 2017 was
also above our target this year. This net margin was 35% higher than the margin in2016, reflecting better refining environment and higher production volume.
• Accordingly, we generated 5.9 Billion TL in EBITDA and 4.5 Billion TL in ProfitBefore Tax in 2017.
3
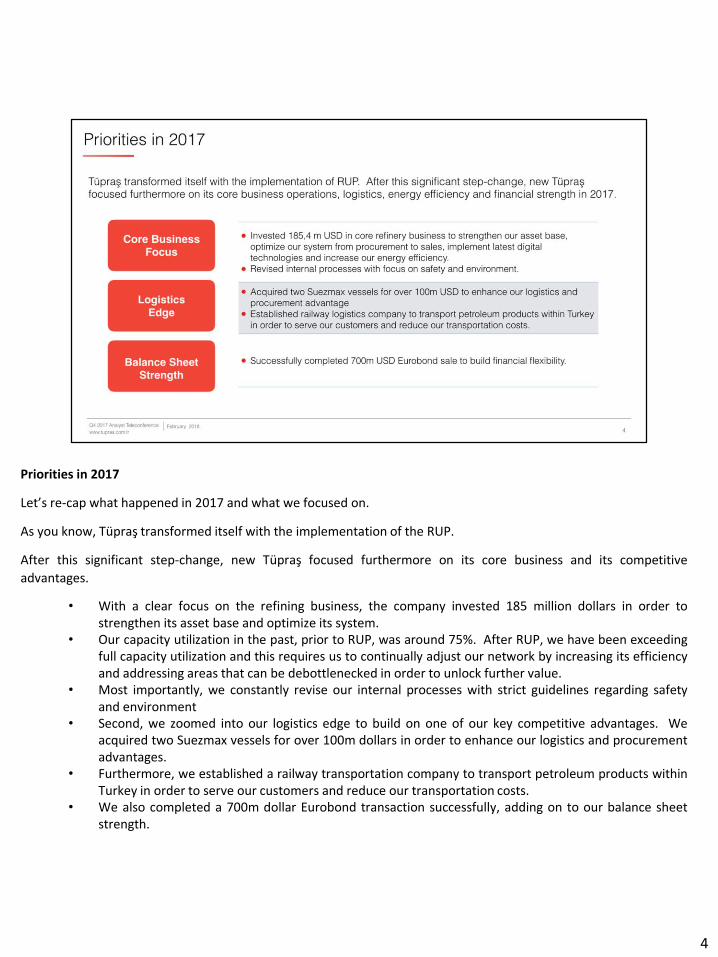
Priorities in 2017
Let’s re-cap what happened in 2017 and what we focused on.
As you know, Tüpraş transformed itself with the implementation of the RUP.
After this significant step-change, new Tüpraş focused furthermore on its core business and its competitive
advantages.
• With a clear focus on the refining business, the company invested 185 million dollars in order tostrengthen its asset base and optimize its system.
• Our capacity utilization in the past, prior to RUP, was around 75%. After RUP, we have been exceedingfull capacity utilization and this requires us to continually adjust our network by increasing its efficiencyand addressing areas that can be debottlenecked in order to unlock further value.
• Most importantly, we constantly revise our internal processes with strict guidelines regarding safetyand environment
• Second, we zoomed into our logistics edge to build on one of our key competitive advantages. Weacquired two Suezmax vessels for over 100m dollars in order to enhance our logistics and procurementadvantages.
• Furthermore, we established a railway transportation company to transport petroleum products withinTurkey in order to serve our customers and reduce our transportation costs.
• We also completed a 700m dollar Eurobond transaction successfully, adding on to our balance sheetstrength.
4
5

Market Conditions in Fourth Quarter of 2017
As you know, after a fairly weak refining environment in 2016, we witnessed a normalization trendin the product cracks primarily due to the strength of global economies and decline in product stock,supported by extensive refinery maintenances in the first half of the year. As a result, cracksimproved across the board.
In the third quarter of 2017, cracks peaked further as a result of the unexpected supply disruptionsincluding refinery fires in Europe and stronger than the usual hurricane season in the US.
Once the impact of these one-off factors faded, cracks reverted back to their normalization trend,reflecting the seasonally low nature of Q4.
If we look closely at Q4 2017, At the beginning of the quarter, refinery maintenances in Russia and Europe tightened product supply and positively affected all product crack margins. However, by the end of the quarter, US refineries’ utilizations reverted back to their pre-hurricane highs in December and Chinese refineries’ utilizations were highest ever. This was different from the historical seasonal norm. With the end of maintenances, supply in Europe started increasing as a result of exports from the US and Russia to Europe as well as the production increase in the region. From time to time, this increase was supported further by additional trade flows from India and
6

China. Despite this supply increase, diesel cracks were supported by strong global economies, import requirements of Latin America and West Africa as well as the Asian demand fueled by the Chinese spec change to 10ppm in Jan 2017. In addition, heating consumption was also a positive factor for diesel during the quarter. While gasoline cracks performed well most of the year, they were significantly down in Q4 due to the end of the driving season, harsh winter and high capacity utilizations in the US. In addition, trade flows from Europe to the US ceased after the Harvey affect diminished. Fuel oil cracks on the other hand started the quarter strong at -6.3 $ per barrel. However, increasing Russian exports as well as lower Fuel Oil demand caused cracks to decline. During the 4th quarter, crude prices rapidly increased from 55 dollar per barrel to 66.5 dollar per barrel, and light-heavy crude oil price differentials narrowed. A number of factors contributing to these trends include: OPEC supply cut extension announcement until the end of 2018, high compliance between OPEC and non-OPEC crude producers, crude stock declines, political instabilities in the Middle East, from Saudi Arabia to Iran, and in Venezuela
6
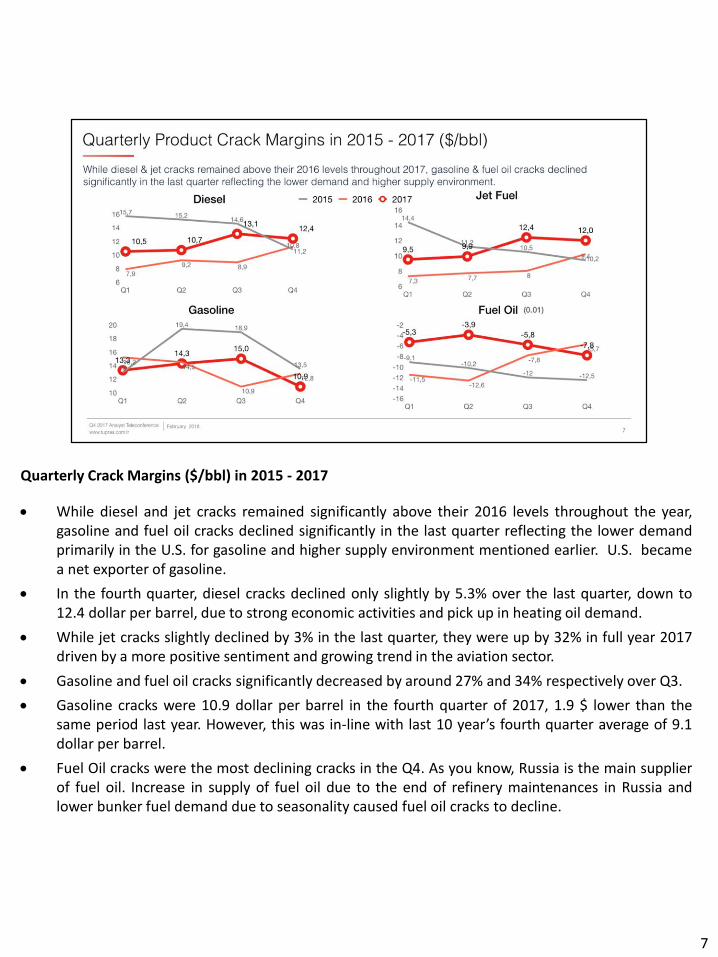
Quarterly Crack Margins ($/bbl) in 2015 - 2017
While diesel and jet cracks remained significantly above their 2016 levels throughout the year,gasoline and fuel oil cracks declined significantly in the last quarter reflecting the lower demandprimarily in the U.S. for gasoline and higher supply environment mentioned earlier. U.S. becamea net exporter of gasoline.
In the fourth quarter, diesel cracks declined only slightly by 5.3% over the last quarter, down to12.4 dollar per barrel, due to strong economic activities and pick up in heating oil demand.
While jet cracks slightly declined by 3% in the last quarter, they were up by 32% in full year 2017driven by a more positive sentiment and growing trend in the aviation sector.
Gasoline and fuel oil cracks significantly decreased by around 27% and 34% respectively over Q3.
Gasoline cracks were 10.9 dollar per barrel in the fourth quarter of 2017, 1.9 $ lower than thesame period last year. However, this was in-line with last 10 year’s fourth quarter average of 9.1dollar per barrel.
Fuel Oil cracks were the most declining cracks in the Q4. As you know, Russia is the main supplierof fuel oil. Increase in supply of fuel oil due to the end of refinery maintenances in Russia andlower bunker fuel demand due to seasonality caused fuel oil cracks to decline.
7
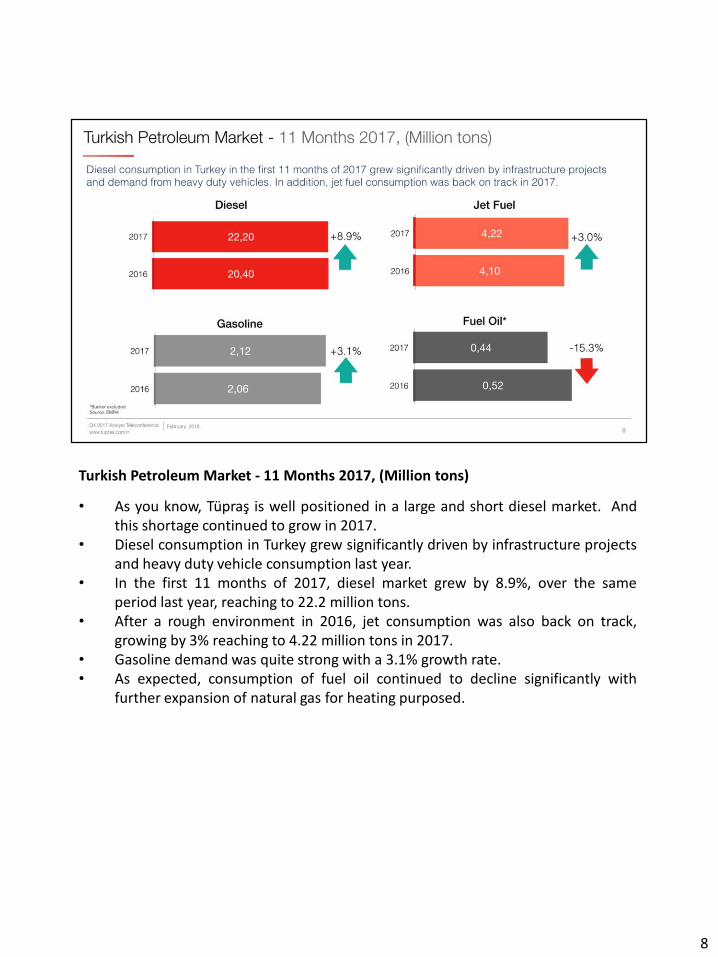
Turkish Petroleum Market - 11 Months 2017, (Million tons)
• As you know, Tüpraş is well positioned in a large and short diesel market. Andthis shortage continued to grow in 2017.
• Diesel consumption in Turkey grew significantly driven by infrastructure projectsand heavy duty vehicle consumption last year.
• In the first 11 months of 2017, diesel market grew by 8.9%, over the sameperiod last year, reaching to 22.2 million tons.
• After a rough environment in 2016, jet consumption was also back on track,growing by 3% reaching to 4.22 million tons in 2017.
• Gasoline demand was quite strong with a 3.1% growth rate.• As expected, consumption of fuel oil continued to decline significantly with
further expansion of natural gas for heating purposed.
8

Crude Price Differentials ($/bbl)
• As you can see, on the left graph, Brent - Ural differentials narrowed to -0.35dollar per barrel in the fourth quarter of 2017.
• In line with this trend, light - heavy crude price differentials continued tonarrow, as depicted on the right graph.
• Following contributed to this trend: While OPEC & Non OPEC supply cuts andproduction problems in Venezuela and Mexico affected heavy barrels,production of light and sweet crude from the U.S., Nigeria and Libya remainedhigh.
• How did this affect Tüpraş? Narrowing of the differentials impacted our fullyear profit before tax by negative 516 million TL. In the last quarter of the year,this affected profit before tax by negative 462 million TL.
9
10
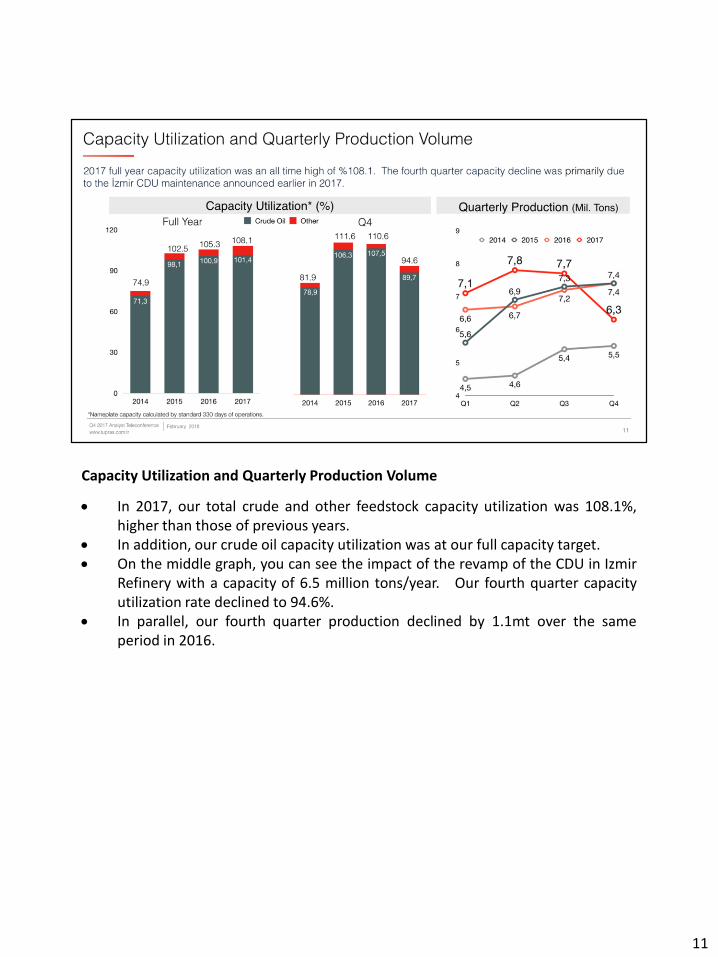
Capacity Utilization and Quarterly Production Volume
In 2017, our total crude and other feedstock capacity utilization was 108.1%,higher than those of previous years.
In addition, our crude oil capacity utilization was at our full capacity target. On the middle graph, you can see the impact of the revamp of the CDU in Izmir
Refinery with a capacity of 6.5 million tons/year. Our fourth quarter capacityutilization rate declined to 94.6%.
In parallel, our fourth quarter production declined by 1.1mt over the sameperiod in 2016.
11
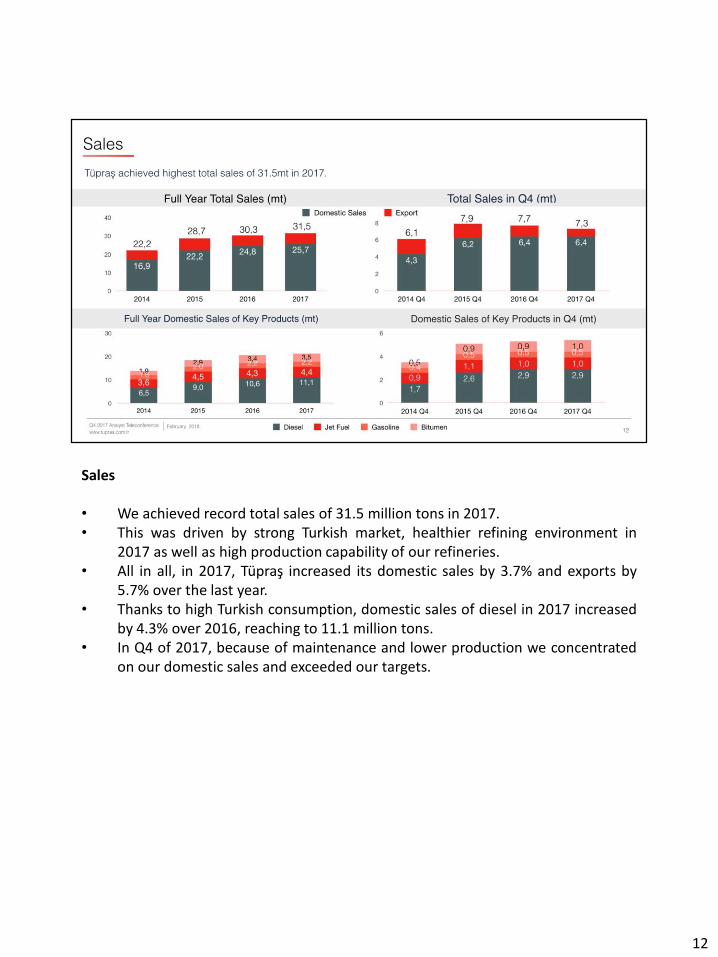
Sales
• We achieved record total sales of 31.5 million tons in 2017.• This was driven by strong Turkish market, healthier refining environment in
2017 as well as high production capability of our refineries.• All in all, in 2017, Tüpraş increased its domestic sales by 3.7% and exports by
5.7% over the last year.• Thanks to high Turkish consumption, domestic sales of diesel in 2017 increased
by 4.3% over 2016, reaching to 11.1 million tons.• In Q4 of 2017, because of maintenance and lower production we concentrated
on our domestic sales and exceeded our targets.
12

OPET
• Opet continues to be the second largest fuel oil distribution company in Turkey.• As of November 2017, Opet had close to 18% market share in white products
and 23% share in black products.• In 2017, Opet expanded its retail footprint to 1,560 stations.
13

Our Marine and Railway Logistics Advantage
• As mentioned at the beginning, we invested in our logistics capability byexpanding our vessel fleet in our subsidiary Ditaş and by establishing a railwaytransportation company in 2017.
• We continually expand on our logistics flexibility in order to optimize our entiresystem, reduce our costs and serve our customers’ needs.
14
15
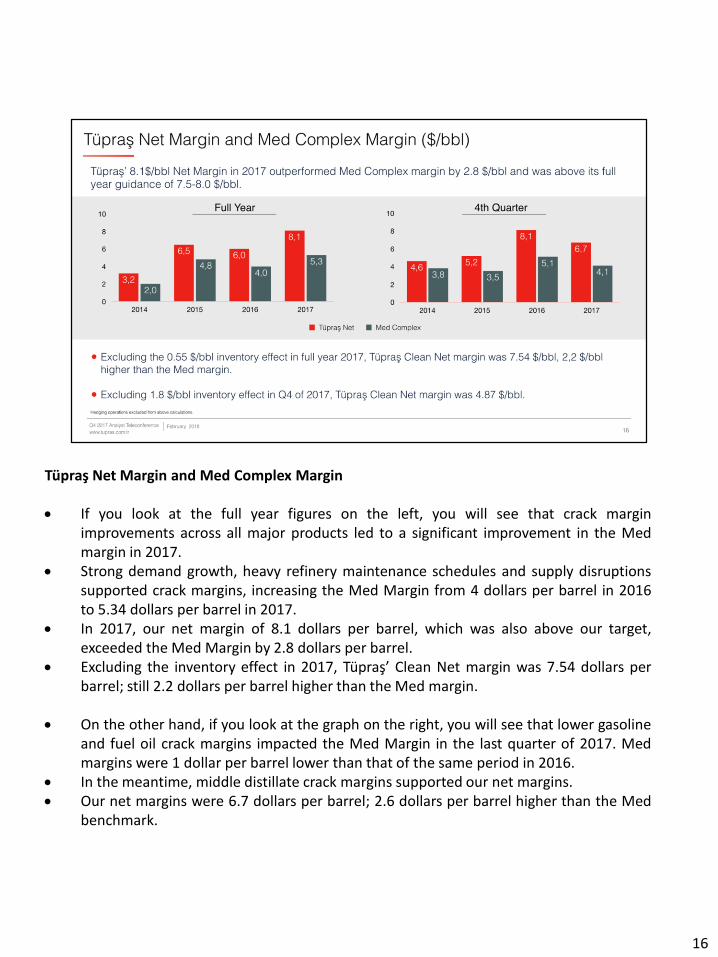
Tüpraş Net Margin and Med Complex Margin
If you look at the full year figures on the left, you will see that crack marginimprovements across all major products led to a significant improvement in the Medmargin in 2017.
Strong demand growth, heavy refinery maintenance schedules and supply disruptionssupported crack margins, increasing the Med Margin from 4 dollars per barrel in 2016to 5.34 dollars per barrel in 2017.
In 2017, our net margin of 8.1 dollars per barrel, which was also above our target,exceeded the Med Margin by 2.8 dollars per barrel.
Excluding the inventory effect in 2017, Tüpraş’ Clean Net margin was 7.54 dollars perbarrel; still 2.2 dollars per barrel higher than the Med margin.
On the other hand, if you look at the graph on the right, you will see that lower gasolineand fuel oil crack margins impacted the Med Margin in the last quarter of 2017. Medmargins were 1 dollar per barrel lower than that of the same period in 2016.
In the meantime, middle distillate crack margins supported our net margins. Our net margins were 6.7 dollars per barrel; 2.6 dollars per barrel higher than the Med
benchmark.
16

Income Statement (in TL)
Let’s first focus on full year on the left side. In 2017, Tüpraş doubled its operating profit and increased its EBITDA by 73%. Our total sales revenue increased by 55% due to our record sales volume, crude oil price increase by 24%
and healthier refining environment in 2017 compared to 2016. Gross profit increased by 70% driven by favorable market conditions and operational performance. Two digits inflation numbers and the depreciation of the local currency contributed to a 16% increase in
our operating expenses for the full year. Although the dollar – TL FX rate increased by around 20%, thanks to our successful FX management
policies, our net profit increased significantly to 3.8 Billion TL. As a result, our full year EBITDA reached an all-time high of around 5.9 Billion TL.
If you look at the right side for the Q4 figures:
While our sales revenue increased by 36%, our gross profit decreased due to the narrowing of crudedifferentials and decrease in crack margins.
With regards to hedging, we aim to hedge our inventory risk before the end of the year so as to keepaccumulated profit throughout the year for a healthy dividend distribution.
As per our risk policies, we followed the market trend and successfully hedged crude at around 55 dollars
17
on average very close to the maximum December price seen until the last point to hedgeDecember in future markets, end of October.
This let us keep some of the positive stock effect above the beginning of the year cost ofinventory. As the crude prices went up beyond 55 dollars, we did not have that additionaladvantage given our hedges in place.
In terms of operating expenses, our dollar denominated costs such as shipping, maintenance,storage were affected from the depreciation of TL. If you look at the Income Statement in USDin the back later, you will see that the operating expenses increased only by 5%, which is in linewith 2.9% increase in sales volume.
In the fourth quarter of 2017, our net profit increase has been limited. This was primarily due
to a one off adjustment during the closing procedure of the incentive process we went through
at the end of the year. This only affected the IFRS table, not the Statuary accounts, and we do
not expect this to have an impact on our dividend distribution capability.
17

Full Year Profit Before Tax Bridge, 2016-2017
As you see in this full year Profit Before Tax bridge, an increase of 2.5 Billion TLover 2016 was primarily due to product price fundamentals and crack margins.
I will go over the top 3 drivers for the difference:• First - As I mentioned in the market section, favorable refining market
conditions and our higher total crack margin in 2017 over 2016 contributedaround 1.4 billion TL to our Profit Before Tax. Later on, you can see the crackmargin breakdown in the back.
• Second - Continuous increase in FX and crude oil prices throughout the yearalso had a positive impact of around 1.5 Billion TL.
• Third – This overall increase was partially offset by the narrowing of crude oildifferentials, as I explained earlier.
In summary, given all of these factors, our Profit Before Tax more than doubledin 2017.
18
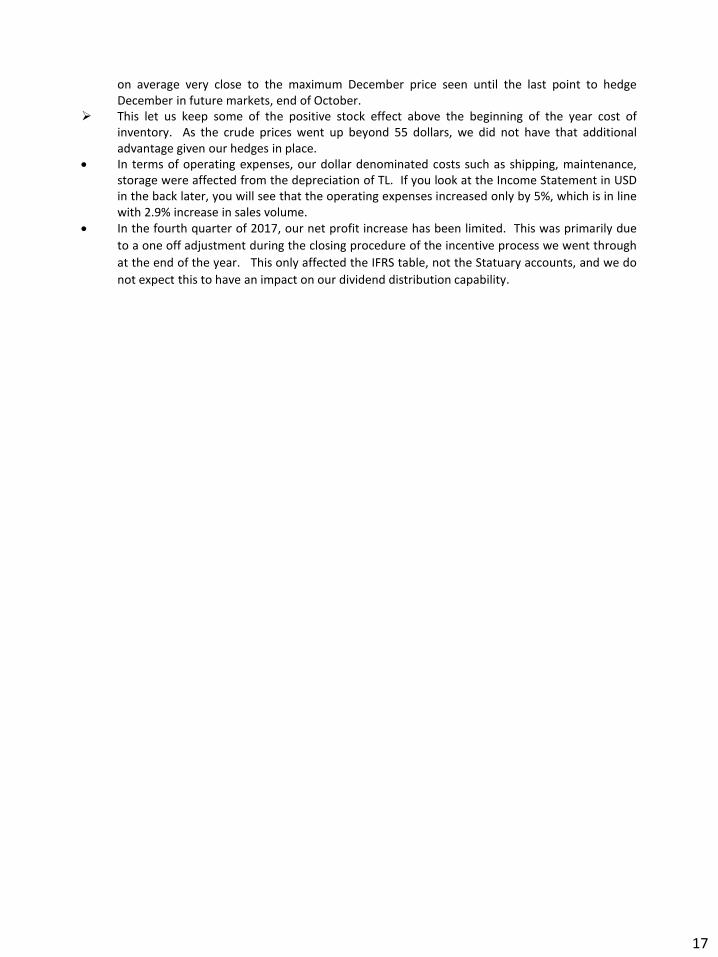
Q4 Profit Before Tax Bridge, 2016-2017
• In this one, we have a different picture. When we are looking at this picture,let’s keep in mind that Q4 is a seasonally low quarter and our largest crudedistillation unit in İzmir was going through a revamp in the fourth quarter.
• On this bridge, decline in crude oil differentials is visible with around negative460 million TL. This offsets combined positive impact of inventory valuationincrease and crack margin improvements.
• In addition, you also see the impact of maintenance in İzmir with respect tocapacity utilization and product yield in Operational Optimization.
In summary, given all of these factors, our Profit Before Tax was lower over thequite high result same period in 2016.
19
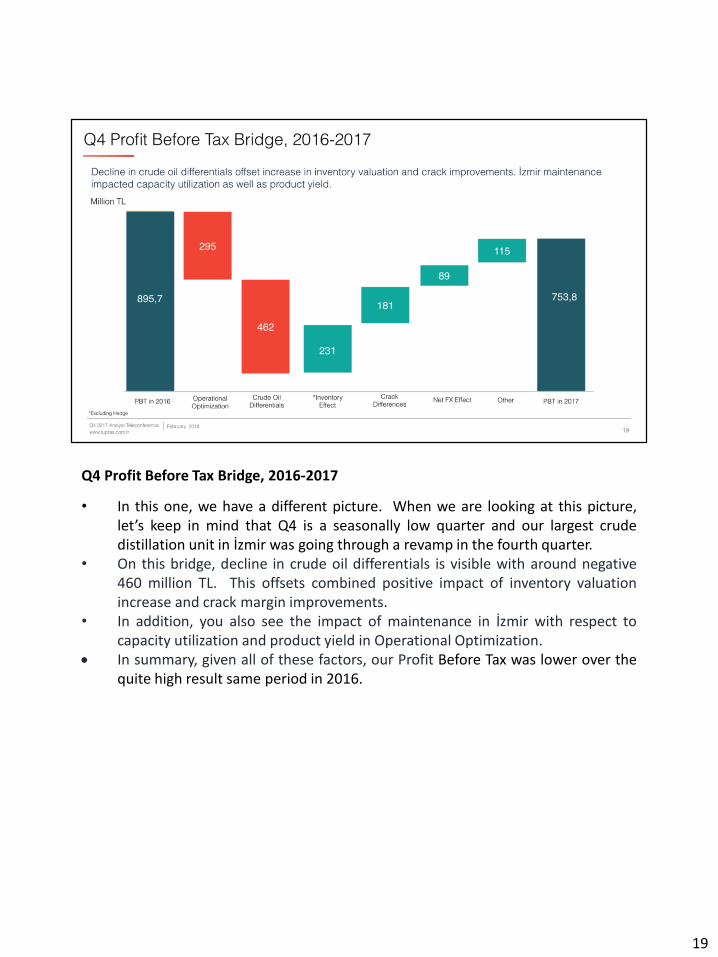
Financial Highlights (mn $)
• You see our financial highlights.• In summary, Tüpraş generated record high EBITDA around 1.6 billion dollars and
Net Income around 1 billion dollars USD in 2017.• Our full year net income in 2017 nearly doubled the net income in 2016.• Our Net Debt to EBITDA ratio was 1.1 given our record high EBITDA.• Consequently, the return on our equity was realized as 41% in 2017 Q4.
20
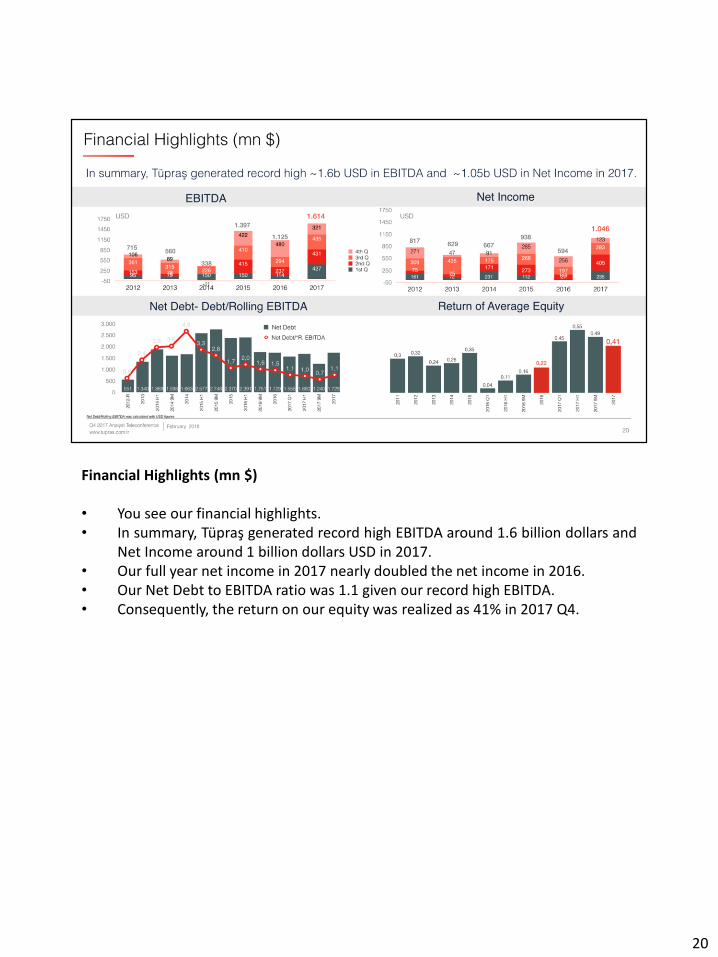
Balance Sheet Analysis
• On this slide, you see a robust financial structure. Main highlights are:• Our Cash & Cash Equivalents increased by 614 million dollars to 2.3 billion
dollars at the end of 2017.• Similarly, our total financial loans increased by the same amount due to the
successful completion of our Eurobond sale in 2017. The maturing Eurobond inMay 2018 will be paid back decreasing the short term gross debt by 700.
• Lower exports and capacity utilization in the quarter decreased our receivablesby 210 million USD.
• Decrease in payables is primarily due to supply mix for this period.
21
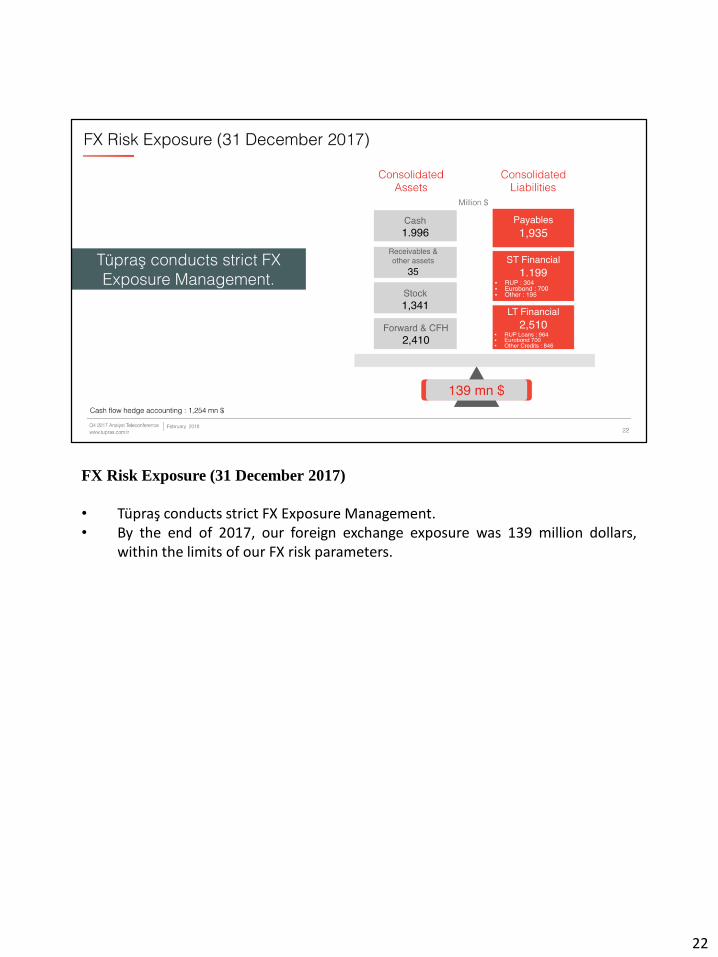
FX Risk Exposure (31 December 2017)
• Tüpraş conducts strict FX Exposure Management.• By the end of 2017, our foreign exchange exposure was 139 million dollars,
within the limits of our FX risk parameters.
22
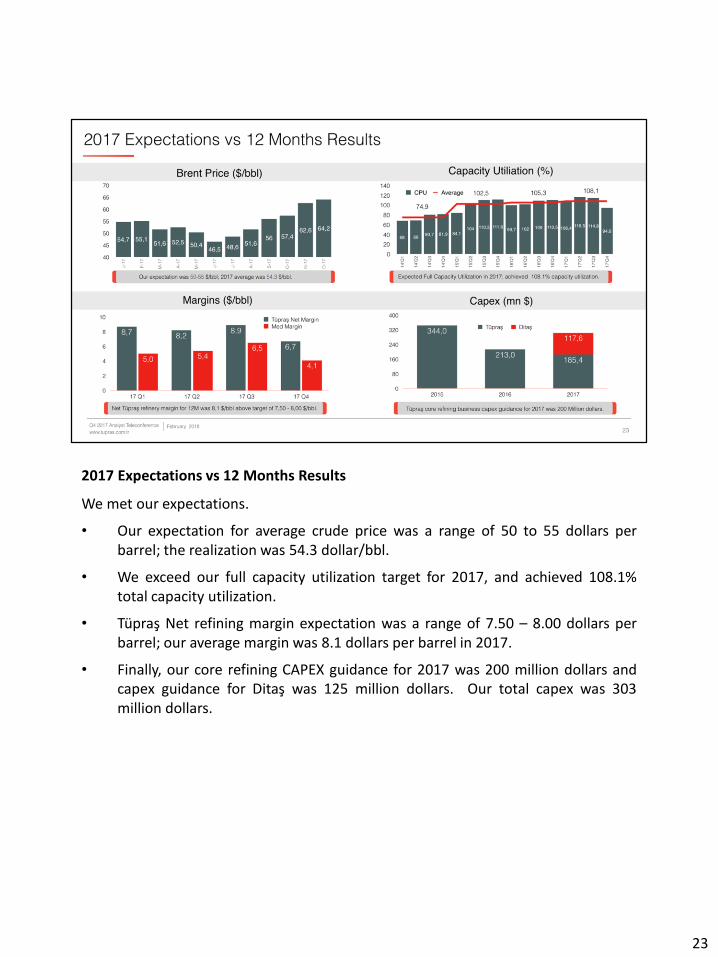
2017 Expectations vs 12 Months Results
We met our expectations.
• Our expectation for average crude price was a range of 50 to 55 dollars perbarrel; the realization was 54.3 dollar/bbl.
• We exceed our full capacity utilization target for 2017, and achieved 108.1%total capacity utilization.
• Tüpraş Net refining margin expectation was a range of 7.50 – 8.00 dollars perbarrel; our average margin was 8.1 dollars per barrel in 2017.
• Finally, our core refining CAPEX guidance for 2017 was 200 million dollars andcapex guidance for Ditaş was 125 million dollars. Our total capex was 303million dollars.
23
24
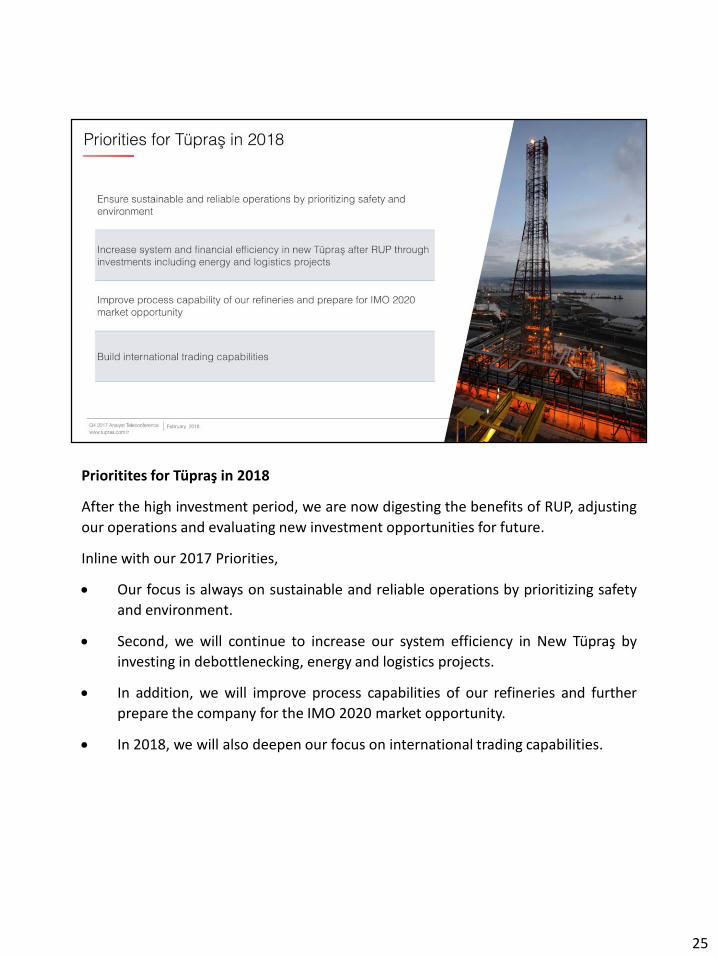
Prioritites for Tüpraş in 2018
After the high investment period, we are now digesting the benefits of RUP, adjusting
our operations and evaluating new investment opportunities for future.
Inline with our 2017 Priorities,
Our focus is always on sustainable and reliable operations by prioritizing safety
and environment.
Second, we will continue to increase our system efficiency in New Tüpraş by
investing in debottlenecking, energy and logistics projects.
In addition, we will improve process capabilities of our refineries and further
prepare the company for the IMO 2020 market opportunity.
In 2018, we will also deepen our focus on international trading capabilities.
25

2018 Refinery Maintenance Schedule
Here you see our Refinery Maintenance Schedule for 2018.
As you are familiar, in this sector, each unit needs to go through maintenance in
every 4 to 5 years.
Since we have several units doing the same work in a refinery, a complete
shutdown is rare. For example, İzmir CDU is one of our 8 CDUs. We usually
continue with lower production.
From time to time, we need complete shutdown of a refinery.
2018 maintenance effects have been included in our year-end expectations.
Even though we are planning a one complete shutdown (battery) and
maintenances in two main refineries, we still target 104.6% total capacity
utilization with the help of semi-product charges to conversion units.
If there are any changes in our schedule that may impact our target full year
capacity utilization rate, we will revise our year end expectations accordingly.
26

2018 Expectations
The average Brent price in 2018 is expected to be 55-60 dollars per barrel. We expect Med Complex margins to be between 4.75 – 5.00 dollars per barrel
band in 2018. Net Tüpraş refinery margin is expected to be in the region of 7,50 - 8,00 dollars
per barrel Full Total Capacity Utilization using imported semi-products such as ASRFO and
HVGO Production: approximately 28.3 million tons Total sales: 31.0 million tons Refining investments is expected to be around 250 Million dollars.
27

28