Embed Size (px)
Citation preview
2017 Investor DayInstitutional Clients Group
Jamie Forese, Citigroup President and CEO, Institutional Clients GroupJuly 25, 2017

1
Institutional Clients Group
73% 65% 49%
70%
22% 32% 45%
30%
5% 3% 5% $1,864 $959 $71 $15
Assets Deposits Revenues Net Income
ICGGCB Corp / Other• Largest proprietary global network with physical presence in 98 markets
• Clearing / custody network in 63 markets
• Trading floors in 77 markets
• Facilitating ~$4 trillion of flows daily
• Leading cash management and trade finance business, serving >80% of global Fortune 500 companies
• Leading player in FICC across the global marketplace – 10%+ global market share
• Trusted advisor and banker to institutional clients
• Industry-leading operating efficiency at 55%(1)
• RoTCE of 13.1% on $80+ billion of average TCE(1)
ICG: $1,353 $624 $35 $11
($B, LTM’17)Our Franchise Significant Contribution to Citi
Note: Throughout this presentation, LTM is defined as last twelve months ending June 30th and totals may not sum due to rounding. GCB: Global Consumer Banking; ICG: Institutional Clients Group.(1) Reflects results for LTM’17. As used throughout this presentation, Tangible Common Equity (TCE) and Return on TCE (RoTCE) are preliminary and non-GAAP financial measures.
For additional information on these measures, please refer to Slide 41. (2) End of period as of June 30, 2017.
(2) (2)

2
Treasury & Trade Solutions(1) #1 #1
Fixed Income & Equity Markets(2) #2 #2
Global Debt Underwriting(3) #3 #3
Global Equity Underwriting(3) #5 #4
Global Announced M&A(4) #4 #5
Global Investment Banking(3) #7 #5
LTM’172012
Industry Leader with Significant Scale
Banking:$17B Revenue
Markets & Securities Services:
$18B Revenue
Best Bank for Markets (2017)
Best Bank for Transaction Services (2017)
Best Bank for Digital and Financial Inclusion (2017)
#1 for Global Fixed Income Market Share and Service Quality
(2016 – most recent)#1(5) in U.S. Fixed Income Market Share and Service Quality (2017)
Most Innovative Private Bank in the World
Best Private Bank in Mexico
Best U.S. Private Bank
Best Credit Provider
Bank of the Year (2016)
Best Bond House (2016)
Note:(1) Source: Coalition. Results are based upon Citi’s internal product offering taxonomy. LTM’17 as of 2Q’17. 2Q'17 reflects results based on preliminary industry revenue pool. Peer group includes: BAC,
BARC, BNP, DB, HSBC, JPM, SG, SCB and WFC.(2) Source: Coalition. Results are based upon Citi’s internal product offering taxonomy. LTM’17 as of 2Q’17. 2Q'17 reflects results based on preliminary industry revenue pool. Peer group includes: BAC,
BARC, BNP, CS, DB, GS, JPM, MS, RBS and UBS.(3) Based on wallet share per Dealogic as of June 30, 2017.(4) Based on transaction volume per Dealogic as of June 30, 2017.(5) Tied at #1 in U.S. Fixed Income Market Share (#1 in Service Quality).
(LTM’17)

3
Uniquely Positioned to Deliver Attractive, Sustainable Returns
A differentiated franchise…
…with significant
upside potential
• An institutional franchise with unparalleled global reach and diversification
• Uniquely positioned to take advantage of evolving global trends and the emergence of rapidly expanding global companies with multi-product needs
• Trusted relationships built with a balance between corporate and investor clients
• A disciplined approach that has allowed us to deliver industry-leading efficiency and returns, while investing in talent
• A culture committed to enabling growth and progress through responsible finance
• A track record of establishing market-leading franchises that are well positioned to deliver attractive, sustainable returns
• Opportunities to capture share growth and benefit from rising rate environment
• Potential $2.5+ billion in EBT growth in medium-term through market share growth, revenue pool expansion and improvement in interest rate environment
• Longer-term target RoTCE of over 14% on $80+ billion of average TCE

4
Agenda
Path to Realizing Upside Potential
Key Takeaways
Strong Foundation for Growth

5
Unparalleled Proprietary Global NetworkUnique scale and global network to grow and transact with our clients around the world
Trading Floors– 77 Markets
Physical Presence – 98 Countries / TerritoriesServing Clients> 200 Countries / Territories
NAM38%
EMEA31%
Asia20%
LATAM12%
LTM’17 Revenue
6
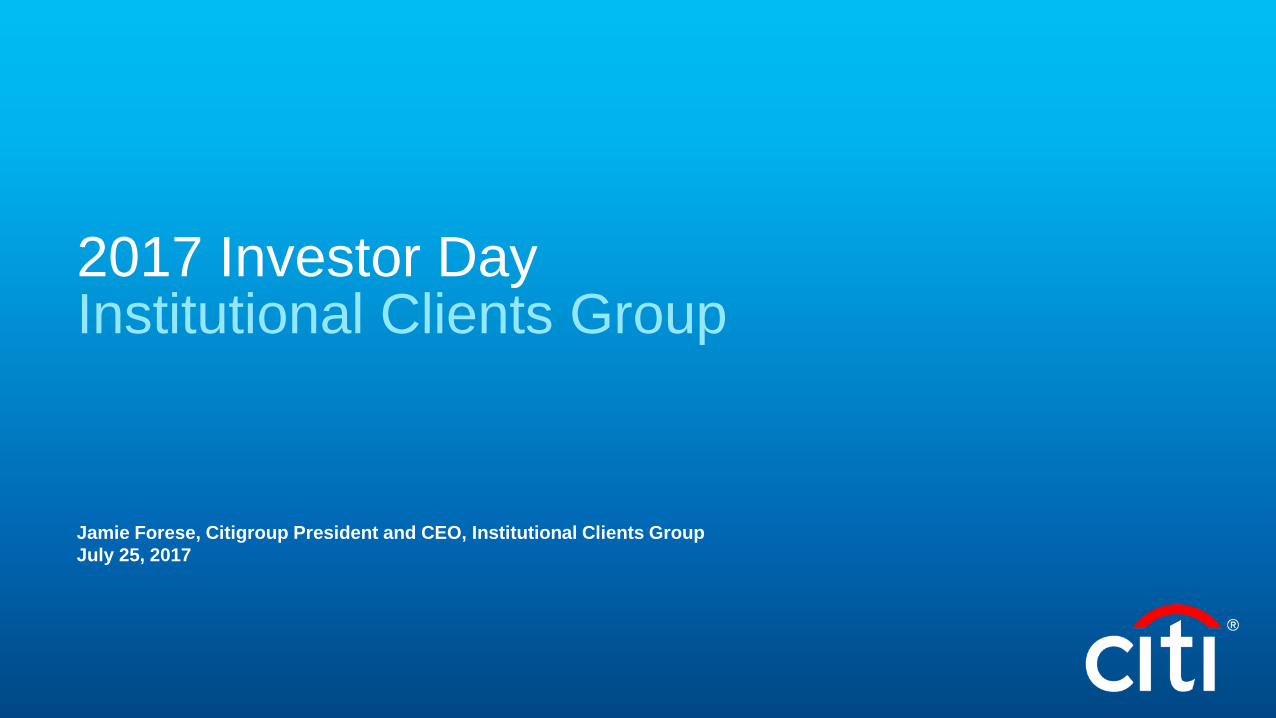
Cash Equities
Full Suite of Integrated Products and Services
Strategic, Less Frequent
Benefit less from the Network
Transactional, Recurring
Benefit more from the Network
M&A Advisory
Debt Underwriting
Prime Finance
Equity Underwriting
Credit & Spread Products
Rates
Equity DerivativesCommodities
Foreign Exchange
Securities Services
Treasury Services
Trade FinanceNetwork drives ~60% of total ICG
revenue over the last twelve months
Corporate Lending
Issuer Services

7 Note: Excludes other revenue of $(512)MM and the impact of mark-to-market gains / (losses) on hedges related to accrual loans $(431)MM. As used throughout this presentation, exclusion of other revenue and the impact of gains / (losses) on hedges related to accrual loans are non-GAAP financial measures.
Present Where Clients Need Us with the Products and Services They Require
65%
35%
DevelopedMarkets
($23 Billion)
EmergingMarkets
($13 Billion)
(LTM’17)

8
Rates & Currencies
21%
Other FICC16%
Equity Markets
10%
Corporate Lending5%
Developed Markets Revenue ($23 Billion)(LTM’17)
Present Where Clients Need Us with the Products and Services They Require
Diversified set of products serving corporate and financial institution clients(1)
Securities Services5%
Note: Excludes other revenue of $(417)MM and the impact of mark-to-market gains / (losses) on hedges related to accrual loans of $(330)MM.(1) Corporate clients referred to as Non-FI Corporates herein. Financial Institution clients referred to as FI herein.
42% of Developed
Markets revenue
generated through the
Network
Treasury &Trade Solutions
17%
InvestmentBanking
18%
PrivateBank9%
Developed Markets
65%

9
Securities Services
8%
Emerging Markets
35%
Emerging Markets Revenue ($13 Billion)Equity Markets
4%
(LTM’17)
Rates & Currencies36%
Present Where Clients Need Us with the Products and Services They Require
89% of emerging markets revenue generatedfrom multinational corporate clients
Corporate Lending 6%
Private Bank 6%
Investment Banking 5%Other FICC 2% 77% of
Emerging Markets revenue
generated through the
Network
Note: Excludes other revenue of $(95)MM and the impact of mark-to-market gains / (losses) on hedges related to accrual loans $(101)MM.
Rates & Currencies36%
Treasury & Trade Solutions
33%

10
Performance Reflects Benefit of Network-driven Strategy(1)
(Constant $B)
Investment Banking
Other FICC(3)
Benefits from the Proprietary
Network
CAGR
5%
8%
(8)%
4%
2%
4%
3%
3%
12%
Other ICG(4)
Treasury & Trade Solutions
Securities Services
Rates & Currencies
Corporate Lending(2)
Equity Markets
Private Bank
9% CAGR in businesses
most significantly tied to global
network
(0.4) (1.2) (0.9)4.8 3.6 3.6 3.9
4.6 4.5 4.3 4.9
2.6 2.6 2.7 2.9
2.6 3.1 2.8 2.8
1.7 1.8 1.7 1.8
7.1 7.5 9.2 9.3
1.8 2.0 2.2
2.2 7.1 7.2
7.9 8.1
$31.9 $32.5 $33.1
$35.0
2014 2015 2016 LTM'17NM
Total Revenue
Note: Totals may not sum due to rounding. Constant dollar excludes the impact of foreign exchange translation into U.S. dollars for reporting purposes and, as used throughout this presentation, is a non-GAAP financial measure. For a reconciliation of constant dollars to reported results, please refer to Slide 41.
(1) Revenue excludes, as applicable, CVA / DVA in all periods prior to 1Q’16 and, as used throughout this presentation, is a non-GAAP financial measure. Please refer to Slide 41 for a reconciliation of this information to reported results.
(2) Corporate Lending revenues exclude the impact of mark-to-market gains / (losses) on hedges related to accrual loans.(3) Other FICC consists of Spread Products and Commodities.(4) Predominantly the impact of mark-to-market gains / (losses) on hedges related to accrual loans.

11
Focus on Clients Who Most Value Citi’s Global Capabilities
• Multinational corporations expanding globally, particularly into emerging markets
• Emerging market companies growing beyond their home market / region
• Financial institutions, global investment managers and public sector entities
~60% of Client Revenue
~40% of Client Revenue
ICG Client Base(1)
Continued Progress in Client Rationalization(1) Target Client Base
~32,000
~21,000~17,000 ~15,500 ~14,000
2012 2013 2014 2015 2016
(57)%
Financial Institutions(2)
~7,500Clients
Non-FI Corporates
~6,500 Clients
Note:(1) Excludes ~10,000 ultra high net worth / high net worth Private Bank clients. Client revenues defined as those revenues directly attributable to a client transaction at the time of inception. Revenue reflects
results for the last twelve months ending May 31, 2017.(2) FI clients include Financial Institutions, Public Sector and Investor clients.

12
Large Multi-Nationals Driving Corporate Client Revenue Growth
$8.7
$20.8
$8.9
$23.0
<41
41+
LTM’17(1) Revenue – Non-FI Corporate Clients 2016 2015
Avg. Client Revenue by # of Countries; ($MM)
Corporate Client Revenue Driven by Global Multinationals Our Clients’ Expansion Drives Revenue Growth
Our growth story is synergistic with that of our clientsCiti offers the broadest global footprintto our multinational clients
Regional / Domestics
16%
Global & Multinational84%
Note:(1) LTM’17 reflects last twelve months ending May 31, 2017.
3%
11%

13
Other Markets
36%
Treasury & Trade
Solutions18%
Rates & Currencies
21%
Securities Services
16%
Investors and Financial Institutions Value Our Broad Product Suite and Service Quality
0
2
4
6
8
10
12
(40) (20) 0 20 40 60 80
Mar
ket S
hare
(%)
Service Quality
2016
2008
2012
We are a leader in client service and satisfactionCiti offers a holistic and relevant product set
(LTM’17)(1) 2016 Global Fixed Income Survey Results (Greenwich Associates)Financial Institution Client Revenue by Product Service Quality and Market Share Increasing
28% of revenue from non-Markets products
Corporate Lending 2%Investment Banking 7%
Note:(1) LTM’17 reflects last twelve months ending May 31, 2017.
Peer Banks
55% of revenue
from the
network

14
Target Client Strategy Drives a High Quality Credit PortfolioWhile we lead with the network, we lend to broaden relationships and facilitate access to client wallets
North America
54%Other
EM12%
Western Europe
21%
Energy9%
HedgeFunds 5%
Insurance & SPEs 5%
Other 3%
Developed Asia, 2%
Brazil 3%
Singapore 2%Hong Kong 2%
India 2%Mexico 2%
AAA / AA /A48%
BBB34%
BB / B16%
CCC or Below2%
2Q’17 Exposure: $586B
Exposure by Geography Exposure by Industry Exposure by Ratings
82% of overall loan exposure is investment grade credit quality – historical loss rate of 5bps over last 5 years
TMT11%
Energy9%
Real Estate
8%
Power, Chemicals, Metals and
Mining10%
Banks(1)
7%
AAA / AA / A49%
BBB34%
BB / B16%
PublicSector 5%
Health 5%
Note: Exposure represents direct outstandings and unfunded lending commitments within ICG excluding private bank. All information as of 2Q’17 is preliminary.(1) Includes broker-dealers.
Transportation & Industrial
21%
Food, Beverage & Household Products 7%
Consumer Durables & Retail 4%

15
Unique Value Proposition for Traditional and Next Generation ClientsPositioned to grow with traditional and next generation clients
Traditional ClientsWe are a trusted advisor providing integrated solutions across a comprehensive suite of products with unparalleled market access
Next Generation ClientsWe are a trusted advisor with a mature and diverse product set, which can be quickly deployed to meet evolving global needs
Note: Not to scale.
Illustrative Examples
Pres
ence
(# C
ount
ries)
Length of Relationship100+ Years
Long-Standing Multinational Corporation• 30 products in >50 countries• 100+ year relationship with Citi
Next Generation Client• >15 products in >10 countries• ~5 year relationship with Citi
~5 Years

16
Illustrative Client Example – Leveraging the NetworkLeveraging the network and product suite to support client’s rapid geographic expansion
Revenue Distribution by ProductEp
isod
icR
ecur
ring
10.5xRevenue Multiple
2013 2014 2015 2016
Debt U/W
M&A Advisory
TTS
Corporate Lending
Rates & Currencies
ProductsSubsidiariesCountries
<5<5<5
2013>20>15>10
2016

17
Illustrative Client Example – Growing Recurring RevenueGrowing recurring revenue while capitalizing on strategic opportunities
Debt U/W
Equity U/W
Revenue Distribution by Product
2010 2011 2012 2013 2014 2015 2016
TTS
Corporate LendingRates & Currencies
Epis
odic
Rec
urrin
g100.6x
Revenue Multiple
ProductsSubsidiariesCountries
<5<5<5
2010>15>15>10
2016

18
Serving as Trusted Advisor and Most Important Banking PartnerClient Relationship Strength (Wallet Share)
“One of Several” “An Important” “Most Important”
We believe we are the most important or an important banking partner with >50% of our clients
2.6%
7.5%
17.4%
48%
$48.8B
19%
$51.5B
33%
$52.7B
% Clients
Total Addressable Wallet
1% increment in wallet share translates to ~$1.5B in revenue
Note: Source: Citi estimates. Banking Wallet from Dealogic. FX Wallet from Coalition est. for 2016 Non-FI Corporates. Cash Wallet from ICG Analytics est. for 2016. Markets Wallet from Coalition for 2016 for FI clients.

19
56.2%55.1%
Disciplined Expense Management has Created Capacity to Absorb Headwinds
(Constant $B) Front Office Expense O&T ExpenseRevenueEfficiency Ratio(1) Disciplined Expense Management
(% Operations & Technology Direct Staff)Transition of Headcount to Low Cost Locations
• Industry-leading operating efficiency at 55%
• Right-sized our front office to position for market opportunities
• Simplified our organization structure
• Established a more efficient and scalable Operations & Technology function
‒ Migration of resources away from high cost locations
‒ Automation and simplification of processes – common platforms, machine-enabled processes, robotics
‒ Simplification of technology platform
• Infrastructure scaled to absorb additional volume without significant incremental cost
Efficiency Ratio
High
Medium
Low
(8)%
(1)%
9%
vs. 2014
41% 50%
38% 37% 21% 13%
2014 2Q'17Note: Constant dollar excludes the impact of foreign exchange translation into U.S. dollars for reporting. For a reconciliation of constant dollars to reported results, please refer to Slide 41.(1) Revenue excludes, as applicable, CVA / DVA in all periods prior to 1Q’16. Please refer to Slide 41 for a reconciliation of this information to reported results.
2014 LTM'17
14.2 15.5
$31.9
3.7
$35.0
3.8 $17.9 $19.3

20
Agenda
Path to Realizing Upside Potential
Key Takeaways
Strong Foundation for Growth

21
Positioned to Achieve Above 14% RoTCE
13.1%~14%
~(100) bps
~400 bps ~70 bps
~(210) bps ~(50) bps
LTM'17RoTCE
RevenueGrowth
EfficiencySavings
Investments& Growth
Cost of Credit Capital SupportingGrowth
2020RoTCE
EBT Growth: $2.5B+(2)
$35.0BLTM’17
55.1%$15.8B
RevenueOperating Efficiency
EBT
CAGR(2):4%+/-
Low – 50%4 – 6%
Revenue Expenses Balance SheetIllustrative Path to Growth
Note: Totals may not sum due to rounding.(1) For additional information on this measure, please refer to Slide 41. (2) Illustrative results through 2020.
(1)
Longer-Term Target: 14%+

22
Treasury and Trade Solutions
Investment Banking
Fixed Income Markets
Private Bank
Equity Markets
Securities Services
0.0%
0.5%
1.0%
1.5%
2.0%
0.0% 5.0% 10.0% 15.0% 20.0% 25.0%
RO
A
RoTCE
Majority of Businesses Generate Attractive ReturnsStrong returns in industry-leading franchises with opportunities for improvement
13.1% LTM’17 RoTCE(1)
Note: Mark-to-market gains / (losses) on hedges related to accrual loans are allocated across products. (1) For additional information on this measure, please refer to Slide 41.
10% Cost ofCapital
Circle size represents LTM’17 Net Income

23
We are Investing to Extend Our Leadership Position…Fi
xed
Inco
me(
1)Tr
easu
ry &
Tra
de S
olut
ions (Constant $B)
Revenue
Rank(3) #1 #1 #1 #1 #1
Revenue
Citi’s Wallet Share(2)
(Constant $B)
$12.9 $11.8 $11.2 $12.8 $13.2
10.3% 10.0% 10.0% 11.0% 11.0%
2013 2014 2015 2016 LTM'17
$6.9 $7.1 $7.2 $7.9 $8.1
2013 2014 2015 2016 LTM'17
Rank(2) #2 #2 #2 #2 #2
Note: Constant dollar excludes the impact of foreign exchange translation into U.S. dollars for reporting purposes. For a reconciliation of constant dollars to reported results, please refer to Slide 41.(1) Revenue excludes, as applicable, CVA / DVA in all periods prior to 1Q’16. (2) Source: Coalition. Results based on Citi internal product offering taxonomy. Wallet share based on industry revenue pools. LTM’17 as of 2Q’17. 2Q'17 reflects results based on preliminary industry
revenue pool. Peer group includes: BAC, BARC, BNP, CS, DB, GS, JPM, MS, RBS and UBS.(3) Source: Coalition. Results based on Citi internal product offering taxonomy. LTM’17 as of 2Q’17. 2Q'17 reflects results based on preliminary industry revenue pool. Peer group includes: BAC, BARC,
BNP, DB, HSBC, JPM, SG, SCB and WFC.

24
…And Grow Our Wallet ShareEq
uity
Mar
kets
(1)
Inve
stm
ent B
anki
ng(3
)
(Constant $B)
(Constant $B)
Revenue
Rank(2) #9 #9 #9 #8 #7
Rank #5 #6 #5 #5 #5
Revenue
Citi’s Wallet Share(2)
Gap to #5:1.4%
$3.0 $2.6 $3.1 $2.8 $2.8
5.0% 4.9% 5.1% 5.5% 5.4%
2013 2014 2015 2016 LTM'17
$4.3 $4.6 $4.5 $4.3 $4.9
5.3% 5.1% 5.1% 4.8% 5.2%
-6.0%
-4.0%
-2.0%
0.0%
2.0%
4.0%
6.0%
8.0%
0.0
1.0
2.0
3.0
4.0
5.0
6.0
7.0
8.0
9.0
2013 2014 2015 2016 LTM'17
Note: Constant dollar excludes the impact of foreign exchange translation into U.S. dollars for reporting. For a reconciliation of constant dollars to reported results, please refer to Slide 41.(1) Revenue excludes, as applicable, CVA / DVA in all periods prior to 1Q’16. (2) Source: Coalition. Results based on Citi internal product offering taxonomy. Wallet share based on industry revenue pools. LTM’17 as of 2Q’17. 2Q'17 reflects results based on preliminary industry
revenue pool. Peer group includes: BAC, BARC, BNP, CS, DB, GS, JPM, MS, RBS and UBS.(3) Wallet share and rank based on Dealogic as of June 30, 2017.
Citi’s Wallet Share

25
Potential To Deliver Significant EBT GrowthDrive revenue growth and efficiency while maintaining target client focus
$2.5B+ EBT(1)
Note: Totals may not sum due to rounding. IB: Investment Banking.(1) Illustrative results through 2020.
Revenues
Expenses
Cost of Credit
• ~2% growth in overall revenue pools
• Improving economic environment
• Higher interest rate forecast
• Extend leadership in TTS & FICC• Gain wallet share in Equities and IB• Leverage network and capabilities to
grow Securities Services & Private Bank
• Continuing to migrate resources away from high cost locations• Seeking to automate and simplify processes for additional productivity savings • Technology driven solutions
• Continued target client strategy discipline• Normalization of credit
Growth in Overall Market Higher Interest Rates Market Share Growth
CAGR:4%+/-
Efficiency Ratio:
Low – 50%
~35% ~20% ~45%

26
All Businesses Contribute to Revenue GrowthContinue to grow market-leading franchises and capture share in Equities and Investment Banking
Treasury & Trade Solutions
Fixed Income Markets
Equity Markets
Investment Banking
Securities Services
Private Bank
• Capitalize on investments in talent and technology • Prudently allocate balance sheet to drive wallet share growth
• Continue to leverage global network to drive marginal share growth in flat market • Invest to improve efficiency of infrastructure
• Invest in talent to drive wallet share growth in key sectors – e.g., Technology, FIG and Energy
• Build wealth management / capital markets revenue to augment strength in banking / lending• Capture benefit of improving interest rate environment
• Leverage global footprint and largest direct custody network to win mandates with target clients• Capture benefit of improving interest rate environment
1
2
3
4
5
6
• Invest in technology to enhance the overall client experience• Capture benefit of improving interest rate environment

27
$8.1
Treasury and Trade Solutions – Extend our Leading PositionLeading provider of global cash management and trade finance services
LTM'17
$29
$40
2012 LTM'17
(EOP Constant $B)• Invest in platform and client experience – digitization and client onboarding
• Maintain and grow high quality deposit base – benefit from improving interest rate environment
• Grow Commercial Cards, supply chain finance, and other payments solutions (e.g., USD Clearing)
• Drive revenue in adjacent products – Rates & Currencies
CAGR: 8%
(Constant $B)
Trade
2012-LTM’17CAGR
(3)%8%
9%
(2)%
NAM
EMEA
Asia
LATAM
2012-LTM’17CAGR
4%
(3)%
2%
10%
Commercial Cards Spend ($B)
49
72
2012 LTM'17
USD Clearing (#MM)
Execution Priorities Growing Deposit Base
Growing Volumes
Payments& Receivables
Comm. Cards
CashManagement
$8.1
1
$298 $354 $369 $395 $419 $421
2012 2013 2014 2015 2016 LTM'17
3%3%
Note: Constant dollar excludes the impact of foreign exchange translation into U.S. dollars for reporting purposes. For a reconciliation of constant dollars to reported results, please refer to Slide 41.
LTM'17
Revenue Composition and Growth
32%
29%
22%
16%
50%
23%
18%9%
28
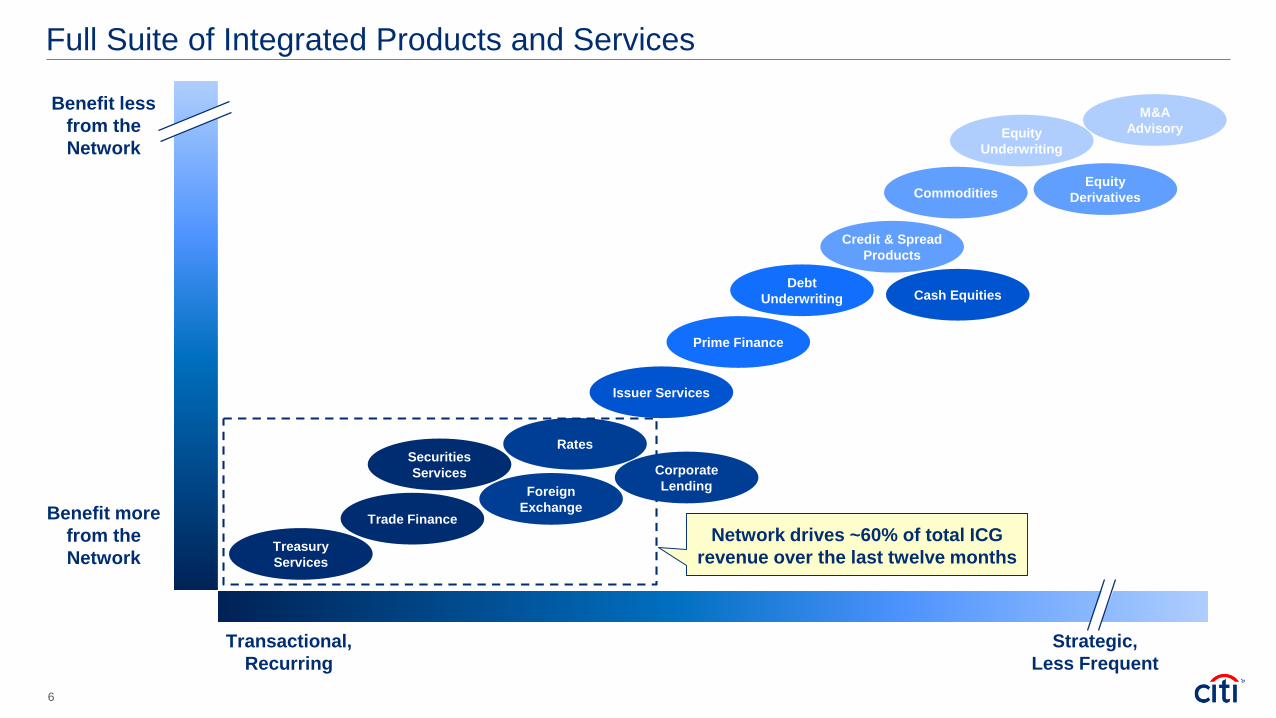
Digitizing Treasury and Trade Solutions to Improve Client ExperienceDigitizing banking from origination to execution, starting with our CitiDirect BE platform
26 languages
500k+ users
135+ currencies
• Seamless connectivity – access anytime, anywhere using CitiDirect BE Mobile and BE Tablet
• Execute payment, receivable & trade transactions globally
• Optimize working capital, liquidity, investments and FX
• Customizable data analytics
• Received 2016 Global Mobile Award for “Best Mobile Service or App for Enterprise”
• First bank to offer real-time payment and account information via APIs
• Rapid adoption of mobile platform (introduced in 2011) –volume grew from $1B in 2012 to $2T in LTM’17(1)
CitiDirect BE Seamless, Internet-based Global Platforms
1
Note:(1) LTM’17 reflects last twelve months ending May 31, 2017.

29
Fixed Income – Extend our Leading PositionLeading player across products with diversified client base
• Further deepen client relationships – marginal share growth in a roughly flat market
• Enhance client experience and ease of execution with Citi (#1 rank for service quality – Greenwich Associates)
• Electronification of sales, trading and client interaction
• Continue to optimize capital and resource utilization
(Constant $B) Rates & Currencies Other FICC(2)
Asset Managers
22%
Banks17%
Hedge Funds15%
Non-FI Corporates
34%
Insurers 6%Other 7%
Top 3
Citi Competitor Global Ranking by Product(3)
Revenue Recovery Across Products
Revenue Diversified by Client Type(1)
Execution Priorities
4 – 5>5 G10 Rates
G10 FX
Local MarketsCredit
Securitized Products
Municipals
Commodities
2
>40% Non-FI corporates in
Rates & Currencies
Note: Constant dollar excludes the impact of foreign exchange translation into U.S. dollars for reporting purposes. For a reconciliation of constant dollars to reported results, please refer to Slide 41. Revenue excludes, as applicable, CVA / DVA in all periods prior to 1Q’16.
(1) Client revenues defined as those revenues directly attributable to a client transaction at the time of inception.(2) Includes spread products, commodities and other fixed income.(3) Source: Coalition. Results are based upon Citi’s internal product offering taxonomy. Peer group includes: BAC, BARC, BNP, CS, DB, GS, JPM, MS, RBS and UBS.
9.4 8.4 7.1 7.5 9.2 9.3
4.4 4.5 4.8 3.6
3.6 3.9
$13.8 $12.9 $11.8 $11.2$12.8 $13.2
2012 2013 2014 2015 2016 LTM'17
3 3 4 4 2
4 2 1 3 2
1 1 1 1 1
5 5 5 4 3
3 1 1 1 2
1 1 1 1 1
9 6 4 3 2
2012 2013 2014 2015 2016

30
Providing Clients Unparalleled Digital Access to Citi’s Analytics and Trading PlatformIntegral to trading and investment decisions for 125,000+ client users in Fixed Income and Equities
2
Citi Velocity 2.0 Trading
Citi Velocity
• Citi Velocity offers unparalleled access to Citi's research, commentary, videos, data, analytics and proprietary models
• Over 82,000 institutional client users in over 130 countries
• Client clicks have grown 144% over the last five years with 9.7MM client clicks over the last year
• Institutional Investor ranks Citi Velocity the #2 web based analytics platform amongst 26 competitor products
Citi Velocity
2.0 Trading
• Launched in 2012 to provide unparalleled access to FX markets
• Recognized as #1 single-dealer cross-asset platform, it has been extended to offer Interest Rate products, Futures and Commodities, with Credit and Equity products in the pipeline
• Velocity 2.0 has received 50+ industry awards, including “Most Innovative” and “Best Overall” single-dealer platform
CitiFX Pulse
• Citi's end-to-end electronic FX solution for corporate clients globally
• CitiFX Pulse has won multiple awards for “Best Corporate e-Trading Platform”

31
CitiCAGR
5%
13%
4%
(4)%
Equity Markets – Invest to Capture Share GrowthFocused effort to enhance product offering to grow share as the marketplace normalizes
January 2014 June 2017
Cash Derivatives Prime Services
• Drive wallet share growth through investments in talent, technology and balance sheet
‒ Growth focused on bridging gaps in financing and derivatives
• Talent investments to drive execution focus and enable sales synergies between Derivatives and Cash
• Technology investments to drive platform stability
• Balance sheet allocation in Delta One and Prime Finance to drive better access across full equities wallet
• Initial signs of progress: share growth of 40bps in 2016 (vs. 2015), while industry revenue declined 15%(1)
‒ Execution and strategy will be adjusted to industry dynamic and macro environment
MarketCAGR
0%
7%
1%
(4)%
($B)
Prime Finance & Delta One
68%
Industry Global Revenue Pool(1)
Execution Priorities Growth in Client Balances
3
Note: Equity Markets Revenue excludes, as applicable, CVA / DVA in all periods prior to 1Q’16. (1) Source: Coalition. Results are based upon Citi’s internal product offering taxonomy. LTM’17 as of 2Q’17. 2Q'17 reflects results based on preliminary industry revenue pool. Peer group includes: BAC,
BARC, BNP, CS, DB, GS, JPM, MS, RBS and UBS.
20 22 20 21 17 16
17 20 18 20 16 17
13 16 17 20
18 19
$50 $58 $56 $60
$51 $52
2012 2013 2014 2015 2016 LTM'17

32
Fixed IncomeMarkets
DebtUnderwriting
EquityMarkets
EquityUnderwriting
Equity Markets – Realistic Aspiration to be a Top 5 Player
#1 #2 #3 #4 #5 #6 #8 #9 #10
• Positive stride in 1Q’17 – rank increase to #7 from #9
‒ Senior talent acquired: subject matter experts in Cash, Derivatives and Prime (technology, sales and client executives)
‒ Research coverage enhanced in key sectors and regions; ranked #5 in U.S. Equities Research Advisory Share by Institutional clients in 2017(3)
Equity Markets
#7
1Q’17 Coalition Global Revenue Ranking by Product(1)
LTM’17 Citi Rank by Product
• Citi improved to #7 from #9 in 1Q’16• $0.7B annual revenue gap to #5
3
#7
#4#2
#3
Note:(1) Source: Coalition. Results are based upon Citi’s internal product offering taxonomy. LTM’17 as of 1Q’17. Peer group includes: BAC, BARC, BNP, CS, DB, GS, JPM, MS, RBS and UBS.(2) Based on Debt Underwriting and Equity Underwriting rank per Dealogic as of June 30, 2017.(3) 2017 Greenwich Associates study results, tied at #5.
Progress to Date
Client Opportunities
• Upside opportunity remains – market share underweight relative to overall ICG franchise
‒ Significant cross-sell opportunity with existing Fixed Income clients
‒ Focus on Prime Brokerage – multiplier effect on Equities revenue (~1.5x on Derivatives and Cash)
‒ Focused enhancement of client experience and scalability / stability through platform optimization
(1) (2) (1) (2)

33
2.6 2.4 2.5 2.5 2.7 3.0
0.7 1.0 1.2 0.9 0.6 0.9 0.7 0.8 0.9 1.1 1.0 1.1 $4.0 $4.3 $4.6 $4.5 $4.3
$4.9
2012 2013 2014 2015 2016 LTM'17
Investment Banking – Invest to Capture Share GrowthSelectively investing to drive wallet share growth with target clients in key sectors
• Drive revenue and wallet share growth with target clients
• Maintain leadership in DCM while continuing to execute on recent momentum in ECM and announced M&A
• Continue to selectively invest in sectors to strengthen wallet share with target clients: Technology, FIG, Energy, selected countries
Debt Underwriting Equity Underwriting Advisory CitiCAGR
Citi Overall Wallet Share(2) Target Market Wallet Share(3)
(Constant $B)
(bps, LTM’17 vs. 2012)
Execution Priorities
Target Market Share Gains(1)
Revenue Trends
Wallet Share Growth
4
Note: Constant dollar excludes the impact of foreign exchange translation into U.S. dollars for reporting purposes. For a reconciliation of constant dollars to reported results, please refer to Slide 41. Based on data from Dealogic data as of June 30, 2017.
(1) Target market wallet represents Citi’s wallet share with the clients in its coverage universe. Source: Dealogic, 2012 – LTM ending June 30, 2017.(2) Citi wallet share of total investment banking fee pool for total industry. Source: Dealogic, 2012 – LTM ending June 30, 2017.(3) Target market wallet represents Citi’s wallet share with the clients in its coverage universe.
5%
3%
5%12%
431
236145
55 88
Technology RealEstate
Industrials FinancialInstitutions
Overall
5.0% 5.2%
2012 LTM'17
7.9% 8.8%
2012 LTM'17

34
• Drive wallet share growth by continuing to leverage our global custody network to win mandates with institutional clients─ Largest direct custody network with presence in 63 markets─ Top 5 global custodian
• Grow client base and continue to invest in global platform─ Over 3,000 clients (broker dealers, custodians, asset managers,
insurance, pension funds and sovereign wealth funds) ─ Investments in our product platform (launching leading client
data portal and ETF solutions)─ Further expansion of our proprietary custody network
Serving Largest Asset Managers Globally
Securities Services – Extend Leading Position and Invest to Capture Share GrowthLeveraging Direct Custody network to grow Investor Services
5
(Revenue, Constant $B)
• Seamless completion of divestitures of non-core franchises:Hedge Fund and Private Equity Fund Administration, Open Wealth, US Transfer Agency, Canada Fund Administration and Yield Book (in progress)
• Delivered strong growth in our core Custody and Fund Administration businesses
• Delivered substantial improvement in operating efficiency
• Continued to invest in the platform throughout the transformation
• Successfully navigated complex global market changes
Completed Multi-year Effort to Re-focus Investor ServicesExecution Priorities
$1.6 $1.7 $1.8 $2.0 $2.2 $2.2
2012 2013 2014 2015 2016 LTM'17
CAGR: 7%
Note: Constant dollar excludes the impact of foreign exchange translation into U.S. dollars for reporting purposes. For a reconciliation of constant dollars to reported results, please refer to Slide 41.

35
Private Bank – Extend our Leading PositionLeveraging footprint and platform to deliver full product suite and best-in-class client experience
Lending39%
CapitalMarkets &
Investments33%
Banking28%
(LTM'17)
• Maintain strong momentum driven by new target client acquisitions and benefit from improving interest rate environment
• Deliver platform to clients and become a trusted advisor
• Grow franchise in strategic markets through targeted hiring
• Invest in platform and technology for best-in-class client experience
$2.4$2.5 $2.6 $2.6 $2.7 $2.9
2012 2013 2014 2015 2016 LTM'17
(Constant $B)
Revenue Trends
Product Revenue Composition
Strategic Priorities
Deposits, Loans and Investments AUM Growth
CAGR: 4%
6
(Constant $B)
$62
$92
2012 LTM'17
CAGR: 12%
Note: Constant dollar excludes the impact of foreign exchange translation into U.S. dollars for reporting purposes. For a reconciliation of constant dollars to reported results, please refer to Slide 41. Revenue excludes, as applicable, CVA / DVA in all periods prior to 1Q’16. MI: Managed Investments.
EOP Deposits EOP Loans MI AUM
$49
$81
2012 LTM'17
CAGR: 9% CAGR: 8%
$50
$71
2012 LTM'17

36
Private Bank – Target Client ExampleFocus on leveraging full platform across geographies and Citi businesses
6
GCB – Credit CardsICG – MarketsICG – CPB ICG – TTS Family office based in Singapore with interests in Asia, Africa and Europe
Private Bank relationship in Singapore and Geneva
$80MM+ assets under management and $100MMoutstanding credit (margin line)
Local corporate bank relationship in Africa
Executed $200MM transaction through Citi Agency & Trust in Hong Kong
Pursuing FX Trading and capital markets opportunities in Singapore
Citi Ultima Card in Singapore
Africa
Geneva
Hong Kong
Singapore
Activity OverviewClient Overview

37
Agenda
Path to Realizing Upside Potential
Key Takeaways
Strong Foundation for Growth

38
Key Takeaways
Institutional franchise with unparalleled global reach and diversification that is difficult to replicate
Serving a diverse target client base for whom we are an important and trusted banking partner – with opportunities to grow with them going forward
Leveraging experience to extend leadership positions and grow share where significant opportunities exist
A disciplined approach that has allowed us to deliver industry-leading efficiency and returns
Potential to deliver $2.5+ billion in EBT growth by 2020 and above 14% RoTCEon $80+ billion of average TCE longer term
1
2
3
4
5

39
Certain statements in this presentation are “forward-looking statements” within the meaning of the rules and regulations of the U.S. Securities and Exchange Commission (SEC). Such statements may be identified by words such as believe, expect, anticipate, intend, estimate, may increase, may fluctuate, target, illustrative and similar expressions or future or conditional verbs such as will, should, would and could. These statements are based on management’s current expectations and are subject to uncertainty and changes in circumstances. These statements are not guarantees of future results or occurrences. Actual results and capital and other financial condition may differ materially from those included in these statements due to a variety of factors, including, among others, the efficacy of Citi’s business strategies and execution of those strategies, such as those relating to its key investment, efficiency and capital optimization initiatives, governmental or regulatory actions or approvals, macroeconomic challenges and conditions, such as the level of interest rates, the precautionary statements included in this presentation and those contained in Citigroup’s filings with the SEC, including without limitation the “Risk Factors” section of Citigroup’s 2016 Form 10-K. Any forward-looking statements made by or on behalf of Citigroup speak only as to the date they are made, and Citi does not undertake to update forward-looking statements to reflect the impact of circumstances or events that arise after the date the forward-looking statements were made.


41
FX Impact and Other Reconciliations($MM, except balance sheet items in $B)
Note: Totals may not sum due to rounding.(1) Corporate Lending revenues exclude the impact of mark-to-market gains / (losses) on hedges related to accrual loans.
Institutional Clients Group LTM'17 2016 2015 2014Reported Revenues $34,982 $33,227 $33,332 $33,362
Impact of CVA/DVA - - 269 (343)Adjusted Revenues $34,982 $33,227 $33,063 $33,705
Impact of FX Translation - (85) (565) (1,816)Adjusted Revenues in Constant Dollars $34,982 $33,142 $32,498 $31,889
Reported Expenses $19,285 $18,956 $19,087 $19,500Impact of FX Translation - (58) (585) (1,594)
Reported Expenses in Constant Dollars $19,285 $18,898 $18,502 $17,906
Adjusted Efficiency Ratio in Constant Dollars 55% 57% 57% 56%
Net Income $10,768
Average TCE Allocation ($B) 82
RoTCE 13.1%
Treasury & Trade Solutions LTM'17 2016 2015 2014 2013 2012Reported Revenues $8,135 $7,897 $7,482 $7,808 $7,735 $7,981
Impact of FX Translation - 23 (238) (659) (802) (836)Reported Revenues in Constant Dollars $8,135 $7,920 $7,244 $7,149 $6,933 $7,145
Reported EOP Deposits $421 $412 $394 $379 $379 $324Impact of FX Translation - 7 1 (10) (25) (26)
Reported EOP in Constant Dollars $421 $419 $395 $369 $354 $298
Equity Markets LTM'17 2016 2015 2014 2013 2012Reported Revenues $2,799 $2,812 $3,101 $2,721 $2,905 $2,364
Impact of FX Translation - 11 (18) (144) 46 (9)Reported Revenues in Constant Dollars $2,799 $2,823 $3,083 $2,577 $2,951 $2,355
Investment Banking LTM'17 2016 2015 2014 2013 2012Reported Revenues $4,914 $4,302 $4,557 $4,730 $4,421 $4,103
Impact of FX Translation - 5 (19) (134) (148) (136)Reported Revenues in Constant Dollars $4,914 $4,307 $4,538 $4,596 $4,273 $3,967
Rates & Currencies LTM'17 2016 2015 2014 2013 2012Reported Revenues $9,322 $9,289 $7,616 $7,305 $8,875 $10,017
Impact of FX Translation - (106) (77) (245) (456) (587)Reported Revenues in Constant Dollars $9,322 $9,183 $7,539 $7,060 $8,419 $9,430
Private Bank LTM'17 2016 2015 2014 2013 2012Reported Revenues $2,883 $2,709 $2,582 $2,664 $2,496 $2,406
Impact of FX Translation - (1) (17) (46) (37) (18)Reported Revenues in Constant Dollars $2,883 $2,708 $2,565 $2,618 $2,459 $2,388
Securities Services LTM'17 2016 2015 2014 2013 2012Reported Revenues $2,189 $2,152 $2,114 $2,050 $1,978 $1,947
Impact of FX Translation - 2 (76) (265) (287) (322)Reported Revenues in Constant Dollars $2,189 $2,154 $2,038 $1,785 $1,691 $1,625
Fixed Income LTM'17 2016 2015 2014 2013 2012Reported Revenues $13,207 $12,853 $11,277 $12,174 $13,538 $14,638
Impact of FX Translation - (98) (123) (362) (620) (820)Reported Revenues in Constant Dollars $13,207 $12,755 $11,154 $11,812 $12,918 $13,818
Corporate Lending(1) LTM'17 2016 2015 2014Reported Revenues $1,798 $1,718 $1,827 $1,886
Impact of FX Translation - (0) (50) (170)Reported Revenues in Constant Dollars $1,798 $1,718 $1,777 $1,716


![Institutional Investor meeting [Company Update]](https://img.pdfslide.us/doc/110x75/577c985b1a28ab163a8b58e9/institutional-investor-meeting-company-update.jpg)