Embed Size (px)
Citation preview
Finning International Inc.
2017
Finning International Inc. 2017 Annual Results
1
MANAGEMENT’S DISCUSSION AND ANALYSIS February 5, 2018
This Management’s Discussion and Analysis (MD&A) of Finning International Inc. (Finning or the Company) should be read in conjunction with the audited annual consolidated financial statements for the year ended December 31, 2017 and the accompanying notes thereto, which have been prepared in accordance with International Financial Reporting Standards (IFRS). All dollar amounts presented in this MD&A are expressed in Canadian dollars, unless otherwise stated. Additional information relating to the Company, including its current Annual Information Form (AIF), can be found under the Company’s profile on the SEDAR (System for Electronic Document Analysis and Retrieval) website at www.sedar.com.
Finning International Inc. (TSX:FTT) is the world’s largest Caterpillar Inc. (Caterpillar) equipment dealer delivering service to customers for 85 years. The Company sells, rents, and provides parts and service for equipment and engines to customers in various industries, including mining, construction, petroleum, forestry, and a wide range of power systems applications. Finning aims to consistently deliver solutions that enable customers to achieve the lowest equipment owning and operating costs while maximizing uptime.
2017 Annual Highlights
Basic EPS (1) earned in 2017 was $1.31 and in 2016 was $0.38. Results in both the current and prior year include items which management does not consider indicative of operational and financial trends. These items include severance and restructuring costs in both years, insurance proceeds in 2017 related to the 2016 Alberta wildfires, and the unavoidable costs incurred last year due to that fire, an early debt redemption premium in 2017, as well as losses in 2016 on power system projects and alleged fraudulent activity by a customer in 2016. These items are described on pages 4 and 5 in this MD&A.
Excluding the items noted above, and detailed on pages 4 and 5 in this MD&A, Adjusted EPS (2)(3) was $1.36 in 2017, 55% higher than the Adjusted EPS of $0.88 earned in 2016. Adjusted EPS was up from 2016 due to strong results from all operations.
Revenue of $6.3 billion was up 11% from 2016 reflecting an 18% increase in new equipment revenue and a 10% increase in product support revenue. All operations reported higher revenue compared to 2016.
SG&A (1) costs relative to revenue were lower than 2016 in all operations, and down on a consolidated basis. Excluding the impact in SG&A of the significant items noted above, SG&A costs relative to revenue were down 140 basis points, reflecting the strong leverage of incremental revenues on fixed costs.
EBIT (1) was $399 million and EBIT margin was 6.4% in 2017 compared to $165 million and 2.9% in 2016.
Adjusting for the impact of the significant items noted above, Adjusted EBIT (3) of $400 million and Adjusted EBIT margin of 6.4% was higher than the 2016 Adjusted EBIT of $273 million and Adjusted EBIT margin of 4.9%, due to higher sales volumes and strong leverage on fixed costs.
Adjusted EBITDA (1)(2)(3) was up 26% from 2016.
Free cash flow (2) in 2017 of $165 million reflected lower cash generation in the Company’s South American and Canadian operations compared to 2016 largely due to an increase in inventory purchases to meet higher demand.
Working capital to sales ratio (2) improved by 330 basis points and inventory turns (2) were up 14% from 2016, despite higher inventory levels to meet stronger demand.
(1) Basic Earnings Per Share (EPS); Selling, General & Administrative expenses (SG&A); Earnings Before Finance Costs and Income Taxes(EBIT); Earnings Before Finance Costs, Income Taxes, Depreciation and Amortization (EBITDA).
(2) These financial metrics, referred to as “non-GAAP financial measures” do not have a standardized meaning under International Financial Reporting Standards (IFRS), which are also referred to herein as Generally Accepted Accounting Principles (GAAP), and therefore may not be comparable to similar measures presented by other issuers. For additional information regarding these financial metrics, including definitions and reconciliations from each of these non-GAAP financial measures to their most directly comparable measure under GAAP, where available, see the heading “Description of Non-GAAP Financial Measures and Reconciliations” later in this MD&A.
(3) Certain 2017 and 2016 financial metrics were impacted by significant items management does not consider indicative of operational and financial trends either by nature or amount; these significant items are described on pages 4 and 5 in this MD&A and the financial metrics which have been adjusted to take into account these items are referred to as “Adjusted” metrics.
Finning International Inc. 2017 Annual Results
2
Table of Contents
2017 Annual Overview ................................................................................................................................................ 3
Non-GAAP Financial Measures ................................................................................................................................... 4
Strategic Direction ....................................................................................................................................................... 6
Key Performance Measures ........................................................................................................................................ 7
Annual Results ............................................................................................................................................................. 9
Invested Capital ......................................................................................................................................................... 11
Return on Invested Capital and Invested Capital Turnover ...................................................................................... 12
Results by Reportable Segment ................................................................................................................................ 13
Fourth Quarter Overview ........................................................................................................................................... 18
Outlook ...................................................................................................................................................................... 27
Liquidity and Capital Resources ................................................................................................................................ 28
Contractual Obligations ............................................................................................................................................. 31
Significant Accounting Estimates and Contingencies ............................................................................................... 31
Risk Factors and Management .................................................................................................................................. 33
Contingencies and Guarantees ................................................................................................................................. 37
Outstanding Share Data ............................................................................................................................................ 37
Controls and Procedures Certification ....................................................................................................................... 38
Description of Non-GAAP Financial Measures and Reconciliations ......................................................................... 39
Selected Annual Information ..................................................................................................................................... 49
Selected Quarterly Information .................................................................................................................................. 50
Forward-Looking Disclaimer ...................................................................................................................................... 51
Finning International Inc. 2017 Annual Results
3
2017 Annual Overview
%change
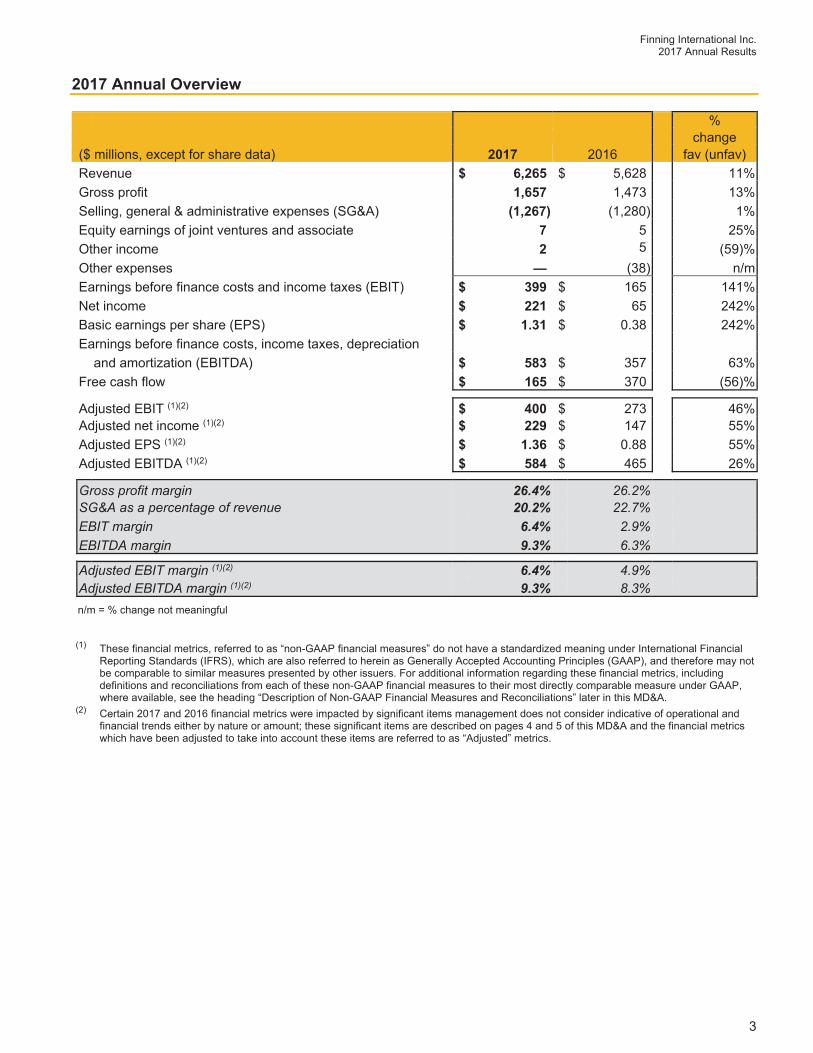
($ millions, except for share data) 2017 2016 fav (unfav) Revenue $ 6,265 $ 5,628 11% Gross profit 1,657 1,473 13% Selling, general & administrative expenses (SG&A) (1,267) (1,280) 1% Equity earnings of joint ventures and associate 7 5 25% Other income 2 5 (59)% Other expenses — (38) n/m Earnings before finance costs and income taxes (EBIT) $ 399 $ 165 141% Net income $ 221 $ 65 242% Basic earnings per share (EPS) $ 1.31 $ 0.38 242% Earnings before finance costs, income taxes, depreciation and amortization (EBITDA) $ 583 $ 357 63% Free cash flow $ 165 $ 370 (56)%
Adjusted EBIT (1)(2) $ 400 $ 273 46% Adjusted net income (1)(2) $ 229 $ 147 55% Adjusted EPS (1)(2) $ 1.36 $ 0.88 55% Adjusted EBITDA (1)(2) $ 584 $ 465 26%
Gross profit margin 26.4% 26.2%SG&A as a percentage of revenue 20.2% 22.7%EBIT margin 6.4% 2.9%EBITDA margin 9.3% 6.3%
Adjusted EBIT margin (1)(2) 6.4% 4.9%Adjusted EBITDA margin (1)(2) 9.3% 8.3%n/m = % change not meaningful
(1) These financial metrics, referred to as “non-GAAP financial measures” do not have a standardized meaning under International Financial Reporting Standards (IFRS), which are also referred to herein as Generally Accepted Accounting Principles (GAAP), and therefore may not be comparable to similar measures presented by other issuers. For additional information regarding these financial metrics, including definitions and reconciliations from each of these non-GAAP financial measures to their most directly comparable measure under GAAP, where available, see the heading “Description of Non-GAAP Financial Measures and Reconciliations” later in this MD&A.
(2) Certain 2017 and 2016 financial metrics were impacted by significant items management does not consider indicative of operational and financial trends either by nature or amount; these significant items are described on pages 4 and 5 of this MD&A and the financial metrics which have been adjusted to take into account these items are referred to as “Adjusted” metrics.
Finning International Inc. 2017 Annual Results
4
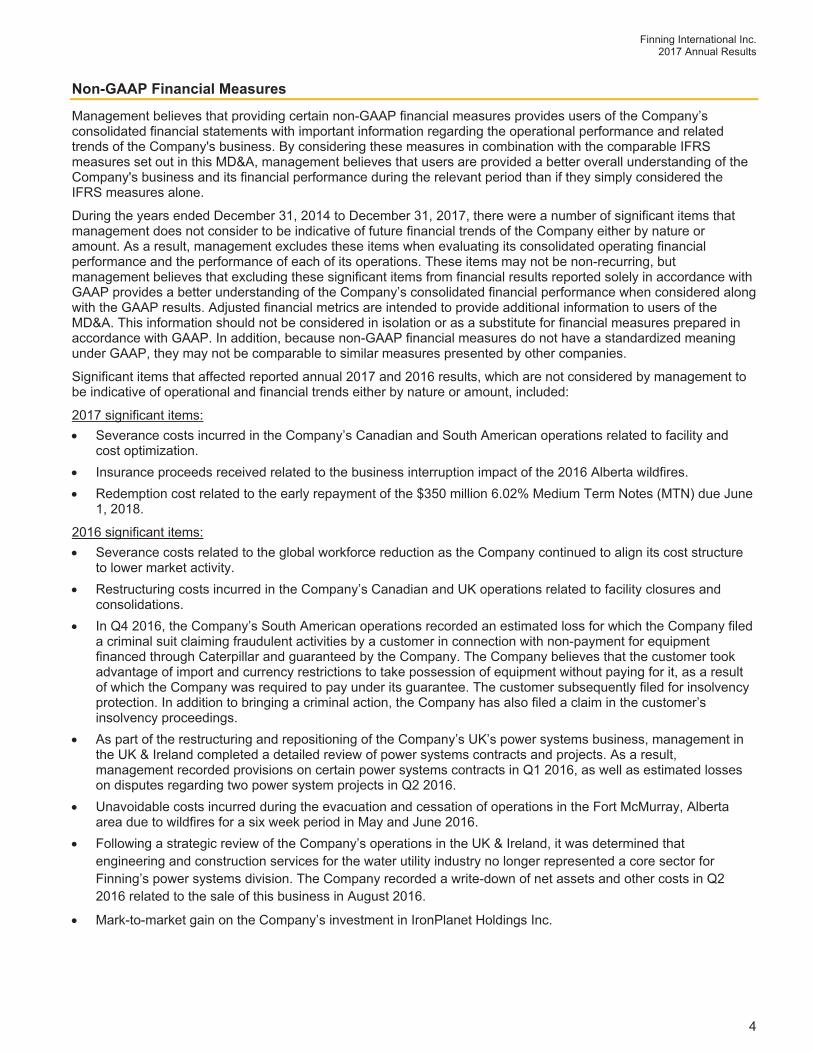
Non-GAAP Financial Measures
Management believes that providing certain non-GAAP financial measures provides users of the Company’s consolidated financial statements with important information regarding the operational performance and related trends of the Company's business. By considering these measures in combination with the comparable IFRS measures set out in this MD&A, management believes that users are provided a better overall understanding of the Company's business and its financial performance during the relevant period than if they simply considered the IFRS measures alone.
During the years ended December 31, 2014 to December 31, 2017, there were a number of significant items that management does not consider to be indicative of future financial trends of the Company either by nature or amount. As a result, management excludes these items when evaluating its consolidated operating financial performance and the performance of each of its operations. These items may not be non-recurring, but management believes that excluding these significant items from financial results reported solely in accordance with GAAP provides a better understanding of the Company’s consolidated financial performance when considered along with the GAAP results. Adjusted financial metrics are intended to provide additional information to users of the MD&A. This information should not be considered in isolation or as a substitute for financial measures prepared in accordance with GAAP. In addition, because non-GAAP financial measures do not have a standardized meaning under GAAP, they may not be comparable to similar measures presented by other companies.
Significant items that affected reported annual 2017 and 2016 results, which are not considered by management to be indicative of operational and financial trends either by nature or amount, included:
2017 significant items: Severance costs incurred in the Company’s Canadian and South American operations related to facility and
cost optimization. Insurance proceeds received related to the business interruption impact of the 2016 Alberta wildfires. Redemption cost related to the early repayment of the $350 million 6.02% Medium Term Notes (MTN) due June
1, 2018.
2016 significant items: Severance costs related to the global workforce reduction as the Company continued to align its cost structure
to lower market activity. Restructuring costs incurred in the Company’s Canadian and UK operations related to facility closures and
consolidations. In Q4 2016, the Company’s South American operations recorded an estimated loss for which the Company filed
a criminal suit claiming fraudulent activities by a customer in connection with non-payment for equipment financed through Caterpillar and guaranteed by the Company. The Company believes that the customer took advantage of import and currency restrictions to take possession of equipment without paying for it, as a result of which the Company was required to pay under its guarantee. The customer subsequently filed for insolvency protection. In addition to bringing a criminal action, the Company has also filed a claim in the customer’s insolvency proceedings.
As part of the restructuring and repositioning of the Company’s UK’s power systems business, management in the UK & Ireland completed a detailed review of power systems contracts and projects. As a result, management recorded provisions on certain power systems contracts in Q1 2016, as well as estimated losses on disputes regarding two power system projects in Q2 2016.
Unavoidable costs incurred during the evacuation and cessation of operations in the Fort McMurray, Alberta area due to wildfires for a six week period in May and June 2016.
Following a strategic review of the Company’s operations in the UK & Ireland, it was determined that engineering and construction services for the water utility industry no longer represented a core sector for Finning’s power systems division. The Company recorded a write-down of net assets and other costs in Q2 2016 related to the sale of this business in August 2016.
Mark-to-market gain on the Company’s investment in IronPlanet Holdings Inc.
Finning International Inc. 2017 Annual Results
5
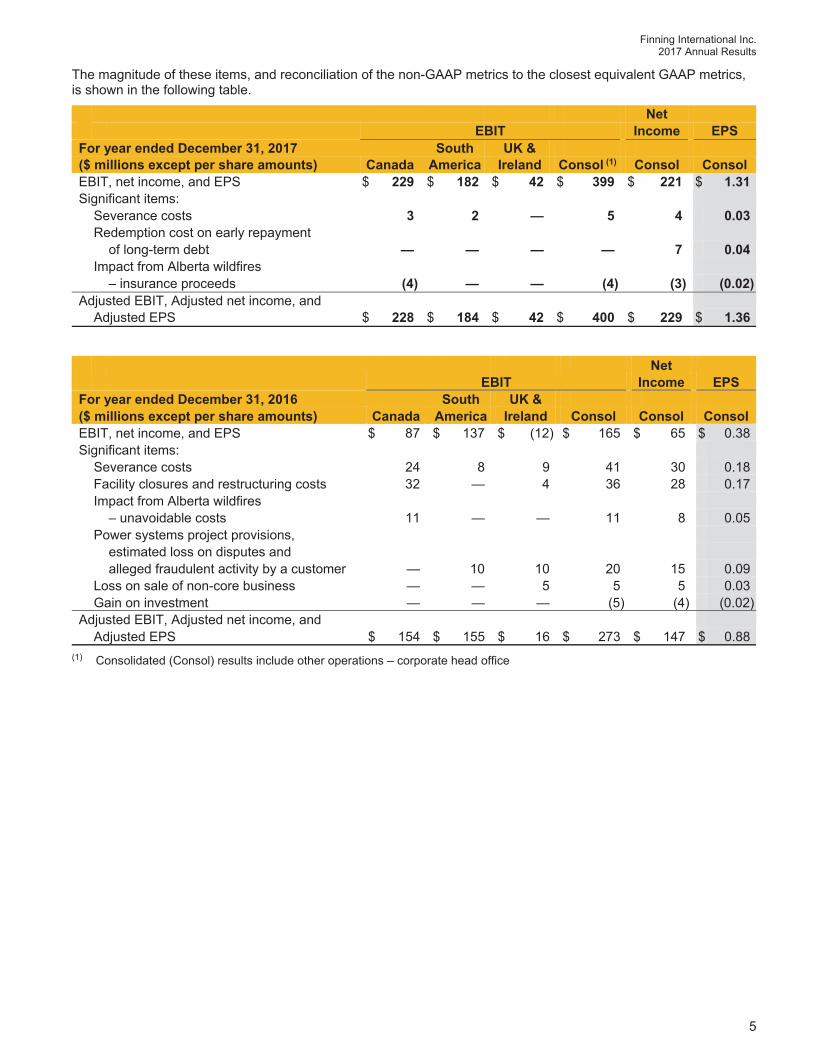
The magnitude of these items, and reconciliation of the non-GAAP metrics to the closest equivalent GAAP metrics, is shown in the following table.
NetEBIT Income EPS
For year ended December 31, 2017 South UK & ($ millions except per share amounts) Canada America Ireland Consol (1) Consol Consol EBIT, net income, and EPS $ 229 $ 182 $ 42 $ 399 $ 221 $ 1.31Significant items: Severance costs 3 2 — 5 4 0.03 Redemption cost on early repayment of long-term debt — — — — 7 0.04 Impact from Alberta wildfires – insurance proceeds (4) — — (4) (3) (0.02)Adjusted EBIT, Adjusted net income, and Adjusted EPS $ 228 $ 184 $ 42 $ 400 $ 229 $ 1.36
Net
EBIT Income EPSFor year ended December 31, 2016 South UK & ($ millions except per share amounts) Canada America Ireland Consol Consol Consol EBIT, net income, and EPS $ 87 $ 137 $ (12) $ 165 $ 65 $ 0.38Significant items: Severance costs 24 8 9 41 30 0.18 Facility closures and restructuring costs 32 — 4 36 28 0.17 Impact from Alberta wildfires – unavoidable costs 11 — — 11 8 0.05 Power systems project provisions, estimated loss on disputes and alleged fraudulent activity by a customer — 10 10 20 15 0.09 Loss on sale of non-core business — — 5 5 5 0.03 Gain on investment — — — (5) (4) (0.02)Adjusted EBIT, Adjusted net income, and Adjusted EPS $ 154 $ 155 $ 16 $ 273 $ 147 $ 0.88
(1) Consolidated (Consol) results include other operations – corporate head office
Finning International Inc. 2017 Annual Results
6
Strategic Direction
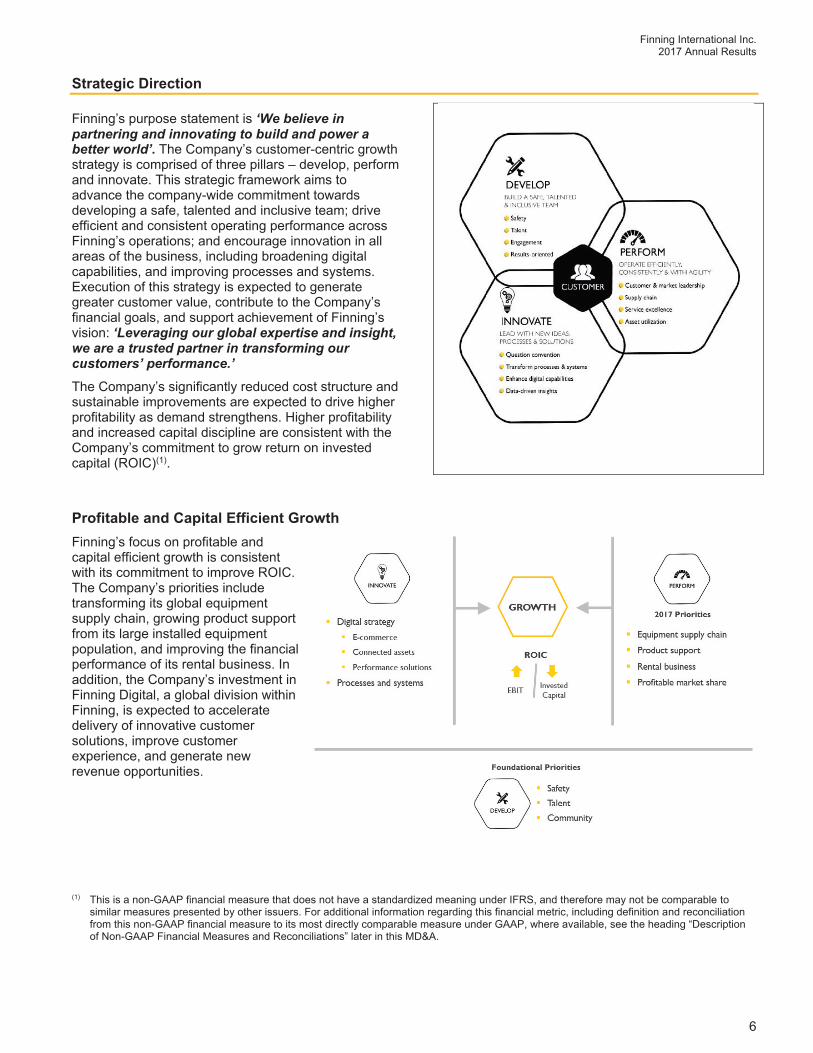
Finning’s purpose statement is ‘We believe in partnering and innovating to build and power a better world’. The Company’s customer-centric growth strategy is comprised of three pillars – develop, perform and innovate. This strategic framework aims to advance the company-wide commitment towards developing a safe, talented and inclusive team; drive efficient and consistent operating performance across Finning’s operations; and encourage innovation in all areas of the business, including broadening digital capabilities, and improving processes and systems. Execution of this strategy is expected to generate greater customer value, contribute to the Company’s financial goals, and support achievement of Finning’s vision: ‘Leveraging our global expertise and insight, we are a trusted partner in transforming our customers’ performance.’The Company’s significantly reduced cost structure and sustainable improvements are expected to drive higher profitability as demand strengthens. Higher profitability and increased capital discipline are consistent with the Company’s commitment to grow return on invested capital (ROIC)(1).
Profitable and Capital Efficient Growth Finning’s focus on profitable and capital efficient growth is consistent with its commitment to improve ROIC. The Company’s priorities include transforming its global equipment supply chain, growing product support from its large installed equipment population, and improving the financial performance of its rental business. In addition, the Company’s investment in Finning Digital, a global division within Finning, is expected to accelerate delivery of innovative customer solutions, improve customer experience, and generate new revenue opportunities.
(1) This is a non-GAAP financial measure that does not have a standardized meaning under IFRS, and therefore may not be comparable to similar measures presented by other issuers. For additional information regarding this financial metric, including definition and reconciliation from this non-GAAP financial measure to its most directly comparable measure under GAAP, where available, see the heading “Descriptionof Non-GAAP Financial Measures and Reconciliations” later in this MD&A.
Finning International Inc. 2017 Annual Results
7
Annual Key Performance Measures
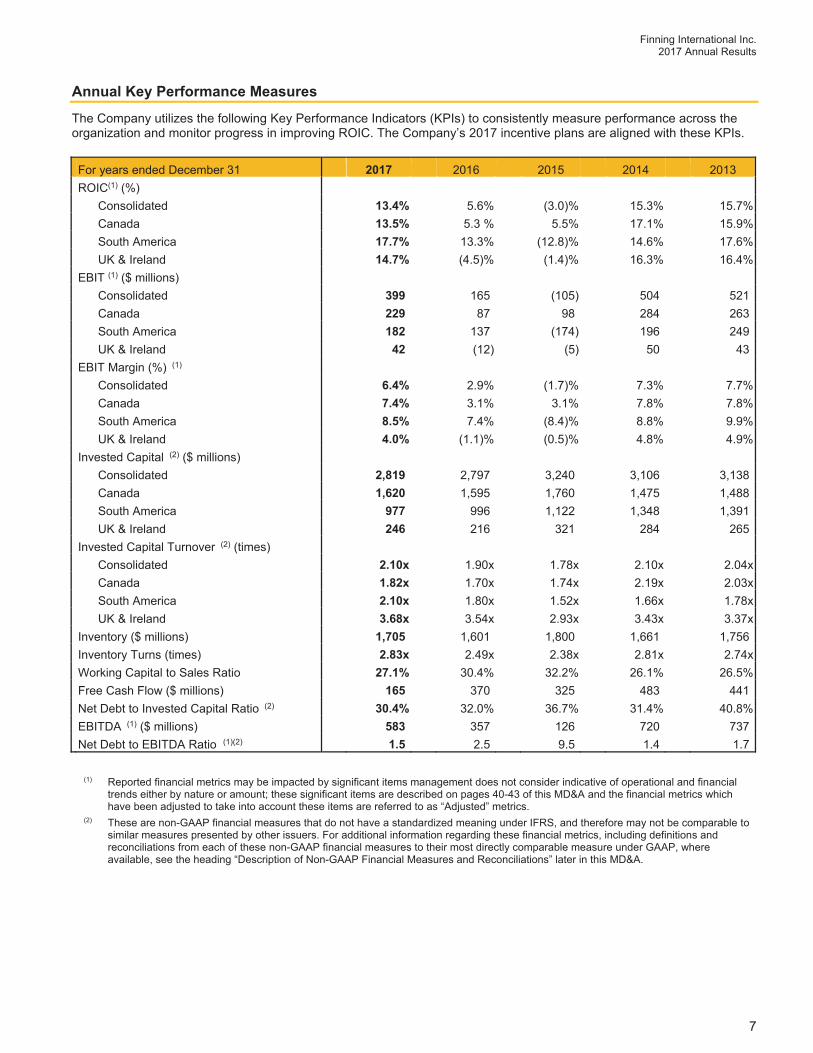
The Company utilizes the following Key Performance Indicators (KPIs) to consistently measure performance across the organization and monitor progress in improving ROIC. The Company’s 2017 incentive plans are aligned with these KPIs.
For years ended December 31 2017 2016 2015 2014 2013 ROIC(1) (%) Consolidated 13.4% 5.6% (3.0)% 15.3% 15.7% Canada 13.5% 5.3 % 5.5% 17.1% 15.9% South America 17.7% 13.3% (12.8)% 14.6% 17.6% UK & Ireland 14.7% (4.5)% (1.4)% 16.3% 16.4% EBIT (1) ($ millions) Consolidated 399 165 (105) 504 521 Canada 229 87 98 284 263 South America 182 137 (174) 196 249 UK & Ireland 42 (12) (5) 50 43 EBIT Margin (%) (1) Consolidated 6.4% 2.9% (1.7)% 7.3% 7.7% Canada 7.4% 3.1% 3.1% 7.8% 7.8% South America 8.5% 7.4% (8.4)% 8.8% 9.9% UK & Ireland 4.0% (1.1)% (0.5)% 4.8% 4.9% Invested Capital (2) ($ millions) Consolidated 2,819 2,797 3,240 3,106 3,138 Canada 1,620 1,595 1,760 1,475 1,488 South America 977 996 1,122 1,348 1,391 UK & Ireland 246 216 321 284 265 Invested Capital Turnover (2) (times) Consolidated 2.10x 1.90x 1.78x 2.10x 2.04x Canada 1.82x 1.70x 1.74x 2.19x 2.03x South America 2.10x 1.80x 1.52x 1.66x 1.78x UK & Ireland 3.68x 3.54x 2.93x 3.43x 3.37x Inventory ($ millions) 1,705 1,601 1,800 1,661 1,756 Inventory Turns (times) 2.83x 2.49x 2.38x 2.81x 2.74x Working Capital to Sales Ratio 27.1% 30.4% 32.2% 26.1% 26.5% Free Cash Flow ($ millions) 165 370 325 483 441 Net Debt to Invested Capital Ratio (2) 30.4% 32.0% 36.7% 31.4% 40.8% EBITDA (1) ($ millions) 583 357 126 720 737 Net Debt to EBITDA Ratio (1)(2) 1.5 2.5 9.5 1.4 1.7
(1) Reported financial metrics may be impacted by significant items management does not consider indicative of operational and financialtrends either by nature or amount; these significant items are described on pages 40-43 of this MD&A and the financial metrics which have been adjusted to take into account these items are referred to as “Adjusted” metrics.
(2) These are non-GAAP financial measures that do not have a standardized meaning under IFRS, and therefore may not be comparable to similar measures presented by other issuers. For additional information regarding these financial metrics, including definitions and reconciliations from each of these non-GAAP financial measures to their most directly comparable measure under GAAP, where available, see the heading “Description of Non-GAAP Financial Measures and Reconciliations” later in this MD&A.
Finning International Inc. 2017 Annual Results
8
Annual Key Performance Measures – Adjusted
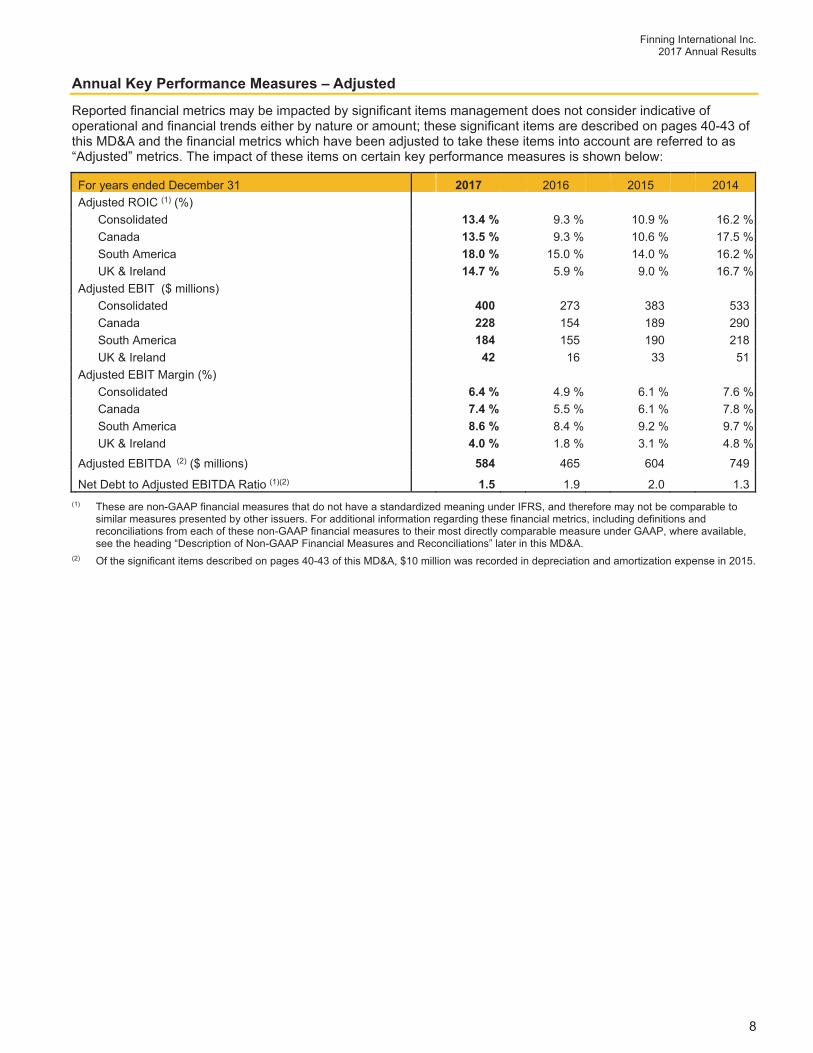
Reported financial metrics may be impacted by significant items management does not consider indicative of operational and financial trends either by nature or amount; these significant items are described on pages 40-43 of this MD&A and the financial metrics which have been adjusted to take these items into account are referred to as “Adjusted” metrics. The impact of these items on certain key performance measures is shown below:
For years ended December 31 2017 2016 2015 2014 Adjusted ROIC (1) (%) Consolidated 13.4 % 9.3 % 10.9 % 16.2 % Canada 13.5 % 9.3 % 10.6 % 17.5 % South America 18.0 % 15.0 % 14.0 % 16.2 % UK & Ireland 14.7 % 5.9 % 9.0 % 16.7 % Adjusted EBIT ($ millions) Consolidated 400 273 383 533 Canada 228 154 189 290 South America 184 155 190 218 UK & Ireland 42 16 33 51 Adjusted EBIT Margin (%) Consolidated 6.4 % 4.9 % 6.1 % 7.6 % Canada 7.4 % 5.5 % 6.1 % 7.8 % South America 8.6 % 8.4 % 9.2 % 9.7 % UK & Ireland 4.0 % 1.8 % 3.1 % 4.8 %
Adjusted EBITDA (2) ($ millions) 584 465 604 749
Net Debt to Adjusted EBITDA Ratio (1)(2) 1.5 1.9 2.0 1.3(1) These are non-GAAP financial measures that do not have a standardized meaning under IFRS, and therefore may not be comparable to
similar measures presented by other issuers. For additional information regarding these financial metrics, including definitions and reconciliations from each of these non-GAAP financial measures to their most directly comparable measure under GAAP, where available,see the heading “Description of Non-GAAP Financial Measures and Reconciliations” later in this MD&A.
(2) Of the significant items described on pages 40-43 of this MD&A, $10 million was recorded in depreciation and amortization expense in 2015.
Finning International Inc. 2017 Annual Results
9
Revenue
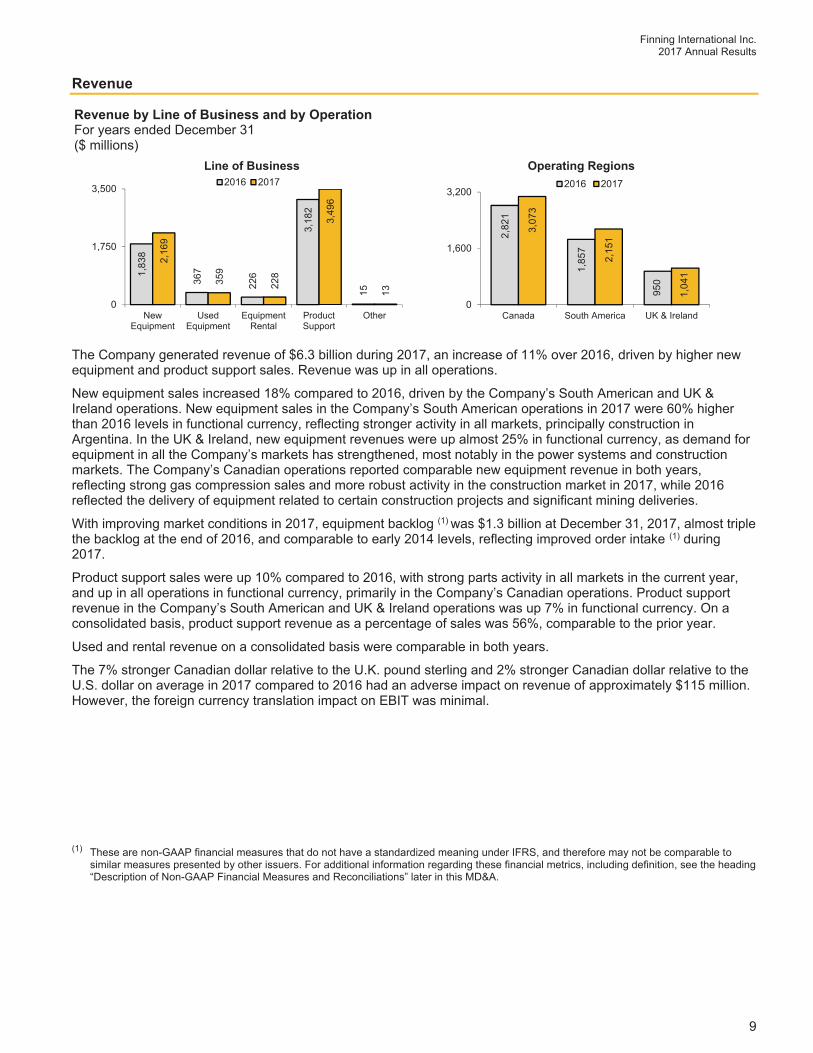
The Company generated revenue of $6.3 billion during 2017, an increase of 11% over 2016, driven by higher new equipment and product support sales. Revenue was up in all operations.
New equipment sales increased 18% compared to 2016, driven by the Company’s South American and UK & Ireland operations. New equipment sales in the Company’s South American operations in 2017 were 60% higher than 2016 levels in functional currency, reflecting stronger activity in all markets, principally construction in Argentina. In the UK & Ireland, new equipment revenues were up almost 25% in functional currency, as demand for equipment in all the Company’s markets has strengthened, most notably in the power systems and construction markets. The Company’s Canadian operations reported comparable new equipment revenue in both years, reflecting strong gas compression sales and more robust activity in the construction market in 2017, while 2016 reflected the delivery of equipment related to certain construction projects and significant mining deliveries.
With improving market conditions in 2017, equipment backlog (1) was $1.3 billion at December 31, 2017, almost triple the backlog at the end of 2016, and comparable to early 2014 levels, reflecting improved order intake (1) during 2017.
Product support sales were up 10% compared to 2016, with strong parts activity in all markets in the current year, and up in all operations in functional currency, primarily in the Company’s Canadian operations. Product support revenue in the Company’s South American and UK & Ireland operations was up 7% in functional currency. On a consolidated basis, product support revenue as a percentage of sales was 56%, comparable to the prior year.
Used and rental revenue on a consolidated basis were comparable in both years.
The 7% stronger Canadian dollar relative to the U.K. pound sterling and 2% stronger Canadian dollar relative to the U.S. dollar on average in 2017 compared to 2016 had an adverse impact on revenue of approximately $115 million. However, the foreign currency translation impact on EBIT was minimal.
(1) These are non-GAAP financial measures that do not have a standardized meaning under IFRS, and therefore may not be comparable tosimilar measures presented by other issuers. For additional information regarding these financial metrics, including definition, see the heading “Description of Non-GAAP Financial Measures and Reconciliations” later in this MD&A.
Revenue by Line of Business and by Operation For years ended December 31 ($ millions)
1,83
8
367
226
3,18
2
15
2,16
9
359
228
3,49
6
13
0
1,750
3,500
NewEquipment
UsedEquipment
EquipmentRental
ProductSupport
Other
Line of Business2016 2017
2,82
1
1,85
7
950
3,07
3
2,15
1
1,04
1
0
1,600
3,200
Canada South America UK & Ireland
Operating Regions2016 2017
Finning International Inc. 2017 Annual Results
10
Earnings Before Finance Costs and Income Taxes
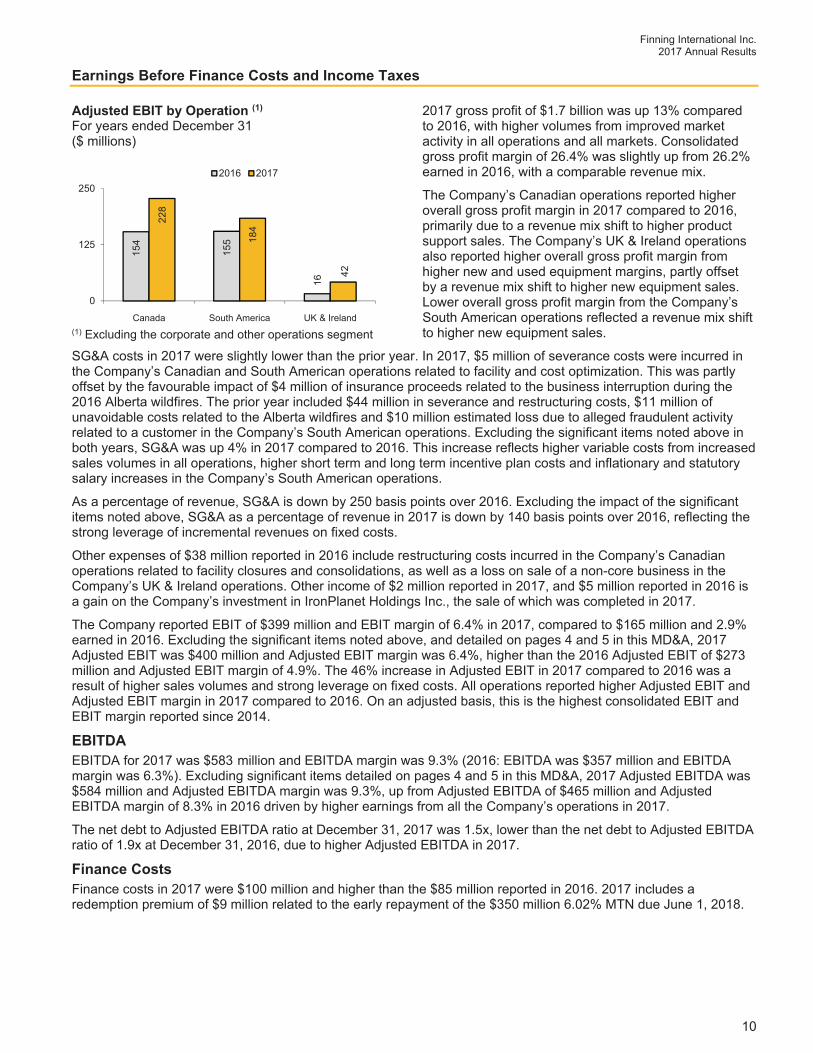
2017 gross profit of $1.7 billion was up 13% compared to 2016, with higher volumes from improved market activity in all operations and all markets. Consolidated gross profit margin of 26.4% was slightly up from 26.2% earned in 2016, with a comparable revenue mix.
The Company’s Canadian operations reported higher overall gross profit margin in 2017 compared to 2016, primarily due to a revenue mix shift to higher product support sales. The Company’s UK & Ireland operations also reported higher overall gross profit margin from higher new and used equipment margins, partly offset by a revenue mix shift to higher new equipment sales. Lower overall gross profit margin from the Company’s South American operations reflected a revenue mix shift to higher new equipment sales.
SG&A costs in 2017 were slightly lower than the prior year. In 2017, $5 million of severance costs were incurred in the Company’s Canadian and South American operations related to facility and cost optimization. This was partly offset by the favourable impact of $4 million of insurance proceeds related to the business interruption during the 2016 Alberta wildfires. The prior year included $44 million in severance and restructuring costs, $11 million of unavoidable costs related to the Alberta wildfires and $10 million estimated loss due to alleged fraudulent activity related to a customer in the Company’s South American operations. Excluding the significant items noted above in both years, SG&A was up 4% in 2017 compared to 2016. This increase reflects higher variable costs from increased sales volumes in all operations, higher short term and long term incentive plan costs and inflationary and statutory salary increases in the Company’s South American operations.
As a percentage of revenue, SG&A is down by 250 basis points over 2016. Excluding the impact of the significant items noted above, SG&A as a percentage of revenue in 2017 is down by 140 basis points over 2016, reflecting the strong leverage of incremental revenues on fixed costs.
Other expenses of $38 million reported in 2016 include restructuring costs incurred in the Company’s Canadian operations related to facility closures and consolidations, as well as a loss on sale of a non-core business in the Company’s UK & Ireland operations. Other income of $2 million reported in 2017, and $5 million reported in 2016 is a gain on the Company’s investment in IronPlanet Holdings Inc., the sale of which was completed in 2017.
The Company reported EBIT of $399 million and EBIT margin of 6.4% in 2017, compared to $165 million and 2.9% earned in 2016. Excluding the significant items noted above, and detailed on pages 4 and 5 in this MD&A, 2017 Adjusted EBIT was $400 million and Adjusted EBIT margin was 6.4%, higher than the 2016 Adjusted EBIT of $273 million and Adjusted EBIT margin of 4.9%. The 46% increase in Adjusted EBIT in 2017 compared to 2016 was a result of higher sales volumes and strong leverage on fixed costs. All operations reported higher Adjusted EBIT and Adjusted EBIT margin in 2017 compared to 2016. On an adjusted basis, this is the highest consolidated EBIT and EBIT margin reported since 2014.
EBITDAEBITDA for 2017 was $583 million and EBITDA margin was 9.3% (2016: EBITDA was $357 million and EBITDA margin was 6.3%). Excluding significant items detailed on pages 4 and 5 in this MD&A, 2017 Adjusted EBITDA was $584 million and Adjusted EBITDA margin was 9.3%, up from Adjusted EBITDA of $465 million and Adjusted EBITDA margin of 8.3% in 2016 driven by higher earnings from all the Company’s operations in 2017.
The net debt to Adjusted EBITDA ratio at December 31, 2017 was 1.5x, lower than the net debt to Adjusted EBITDA ratio of 1.9x at December 31, 2016, due to higher Adjusted EBITDA in 2017.
Finance CostsFinance costs in 2017 were $100 million and higher than the $85 million reported in 2016. 2017 includes a redemption premium of $9 million related to the early repayment of the $350 million 6.02% MTN due June 1, 2018.
Adjusted EBIT by Operation (1)
For years ended December 31 ($ millions)
(1) Excluding the corporate and other operations segment
154
155
16
228
184
42
0
125
250
Canada South America UK & Ireland
2016 2017
Finning International Inc. 2017 Annual Results
11
Provision for Income Taxes The consolidated provision for income taxes for the year ended December 31, 2017 was $78 million at an annual effective tax rate of 26.0%. The annual effective tax rate for 2016 was 19.0% and was lower than 2017 due to the mix of income from various jurisdictions in which the Company carries on business. Management expects the Company’s effective tax rate to generally be within the 25-30% range on an annual basis. The rate may fluctuate from year to year as a result of changes in the source of income from various jurisdictions, relative income from the various jurisdictions in which the Company carries on business, changes in the estimation of tax reserves, and changes in tax rates and tax legislation. Net Income Net income was $221 million and basic EPS was $1.31 in 2017, compared to $65 million and $0.38 per share in 2016. Excluding significant items noted on pages 4 and 5 in this MD&A, Adjusted EPS in 2017 was $1.36 and higher than 2016 Adjusted EPS of $0.88. The increase in Adjusted net income and Adjusted EPS compared to 2016 was due to higher sales volumes and improved profitability from cost reduction measures and leverage of incremental revenues on fixed costs.
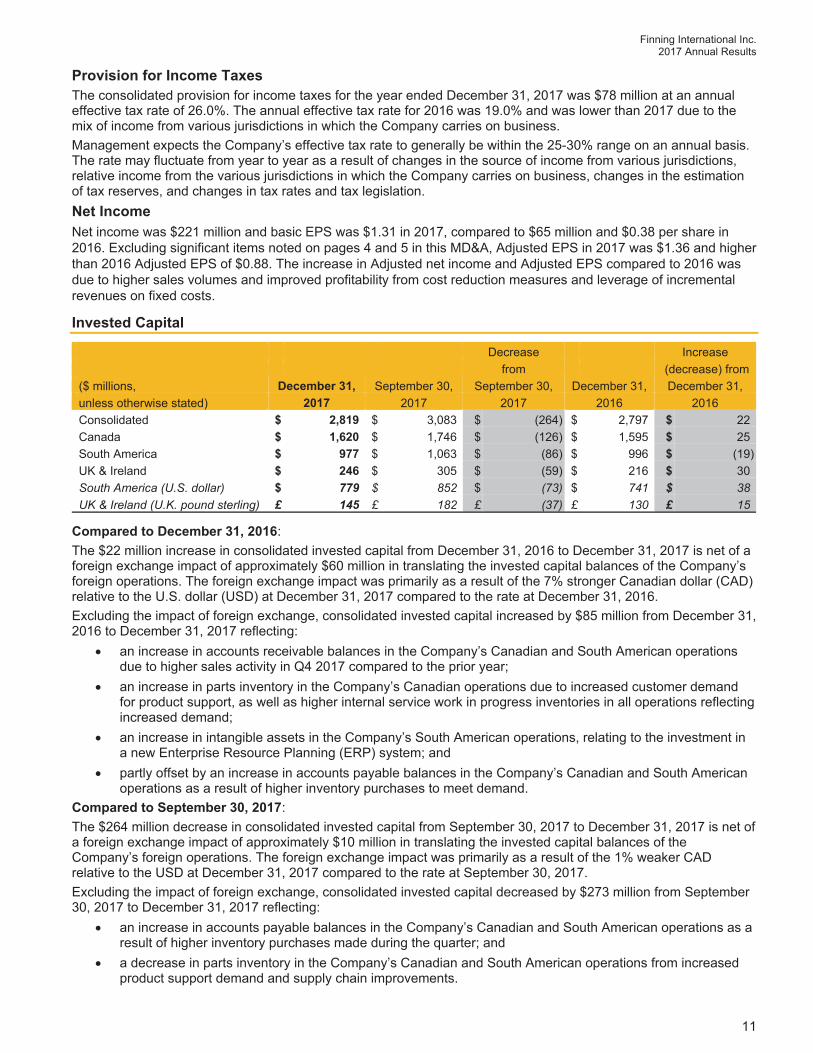
Invested Capital
Decrease Increase from (decrease) from
($ millions, December 31, September 30, September 30, December 31, December 31, unless otherwise stated) 2017 2017 2017 2016 2016
Consolidated $ 2,819 $ 3,083 $ (264) $ 2,797 $ 22 Canada $ 1,620 $ 1,746 $ (126) $ 1,595 $ 25 South America $ 977 $ 1,063 $ (86) $ 996 $ (19) UK & Ireland $ 246 $ 305 $ (59) $ 216 $ 30 South America (U.S. dollar) $ 779 $ 852 $ (73) $ 741 $ 38 UK & Ireland (U.K. pound sterling) £ 145 £ 182 £ (37) £ 130 £ 15
Compared to December 31, 2016:The $22 million increase in consolidated invested capital from December 31, 2016 to December 31, 2017 is net of a foreign exchange impact of approximately $60 million in translating the invested capital balances of the Company’s foreign operations. The foreign exchange impact was primarily as a result of the 7% stronger Canadian dollar (CAD) relative to the U.S. dollar (USD) at December 31, 2017 compared to the rate at December 31, 2016. Excluding the impact of foreign exchange, consolidated invested capital increased by $85 million from December 31, 2016 to December 31, 2017 reflecting:
an increase in accounts receivable balances in the Company’s Canadian and South American operations due to higher sales activity in Q4 2017 compared to the prior year;
an increase in parts inventory in the Company’s Canadian operations due to increased customer demand for product support, as well as higher internal service work in progress inventories in all operations reflecting increased demand;
an increase in intangible assets in the Company’s South American operations, relating to the investment in a new Enterprise Resource Planning (ERP) system; and
partly offset by an increase in accounts payable balances in the Company’s Canadian and South American operations as a result of higher inventory purchases to meet demand.
Compared to September 30, 2017:The $264 million decrease in consolidated invested capital from September 30, 2017 to December 31, 2017 is net of a foreign exchange impact of approximately $10 million in translating the invested capital balances of the Company’s foreign operations. The foreign exchange impact was primarily as a result of the 1% weaker CAD relative to the USD at December 31, 2017 compared to the rate at September 30, 2017. Excluding the impact of foreign exchange, consolidated invested capital decreased by $273 million from September 30, 2017 to December 31, 2017 reflecting:
an increase in accounts payable balances in the Company’s Canadian and South American operations as a result of higher inventory purchases made during the quarter; and
a decrease in parts inventory in the Company’s Canadian and South American operations from increased product support demand and supply chain improvements.
Finning International Inc. 2017 Annual Results
12
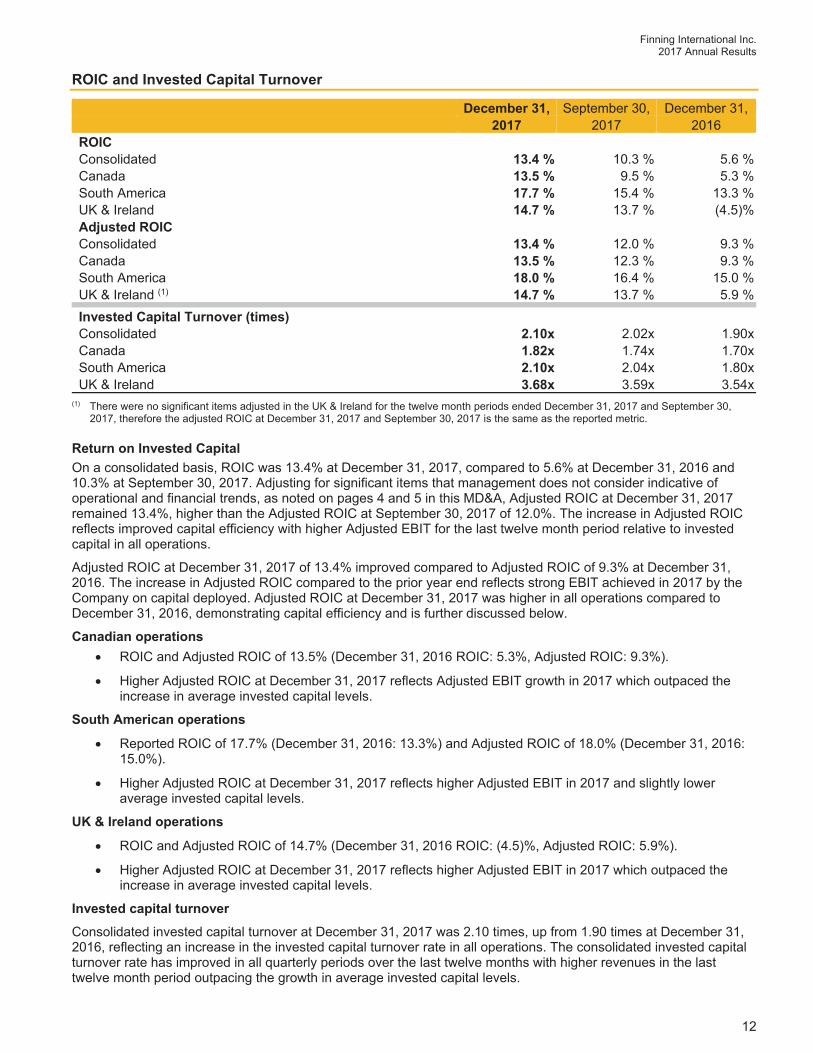
ROIC and Invested Capital Turnover
December 31, September 30, December 31, 2017 2017 2016
ROIC Consolidated 13.4 % 10.3 % 5.6 % Canada 13.5 % 9.5 % 5.3 % South America 17.7 % 15.4 % 13.3 % UK & Ireland 14.7 % 13.7 % (4.5)%Adjusted ROIC
Consolidated 13.4 % 12.0 % 9.3 % Canada 13.5 % 12.3 % 9.3 % South America 18.0 % 16.4 % 15.0 % UK & Ireland (1) 14.7 % 13.7 % 5.9 % Invested Capital Turnover (times) Consolidated 2.10x 2.02x 1.90x Canada 1.82x 1.74x 1.70x South America 2.10x 2.04x 1.80x UK & Ireland 3.68x 3.59x 3.54x(1) There were no significant items adjusted in the UK & Ireland for the twelve month periods ended December 31, 2017 and September 30,
2017, therefore the adjusted ROIC at December 31, 2017 and September 30, 2017 is the same as the reported metric.
Return on Invested Capital On a consolidated basis, ROIC was 13.4% at December 31, 2017, compared to 5.6% at December 31, 2016 and 10.3% at September 30, 2017. Adjusting for significant items that management does not consider indicative of operational and financial trends, as noted on pages 4 and 5 in this MD&A, Adjusted ROIC at December 31, 2017 remained 13.4%, higher than the Adjusted ROIC at September 30, 2017 of 12.0%. The increase in Adjusted ROIC reflects improved capital efficiency with higher Adjusted EBIT for the last twelve month period relative to invested capital in all operations.
Adjusted ROIC at December 31, 2017 of 13.4% improved compared to Adjusted ROIC of 9.3% at December 31, 2016. The increase in Adjusted ROIC compared to the prior year end reflects strong EBIT achieved in 2017 by the Company on capital deployed. Adjusted ROIC at December 31, 2017 was higher in all operations compared to December 31, 2016, demonstrating capital efficiency and is further discussed below.
Canadian operations ROIC and Adjusted ROIC of 13.5% (December 31, 2016 ROIC: 5.3%, Adjusted ROIC: 9.3%).
Higher Adjusted ROIC at December 31, 2017 reflects Adjusted EBIT growth in 2017 which outpaced the increase in average invested capital levels.
South American operations
Reported ROIC of 17.7% (December 31, 2016: 13.3%) and Adjusted ROIC of 18.0% (December 31, 2016: 15.0%).
Higher Adjusted ROIC at December 31, 2017 reflects higher Adjusted EBIT in 2017 and slightly lower average invested capital levels.
UK & Ireland operations
ROIC and Adjusted ROIC of 14.7% (December 31, 2016 ROIC: (4.5)%, Adjusted ROIC: 5.9%).
Higher Adjusted ROIC at December 31, 2017 reflects higher Adjusted EBIT in 2017 which outpaced the increase in average invested capital levels.
Invested capital turnover Consolidated invested capital turnover at December 31, 2017 was 2.10 times, up from 1.90 times at December 31, 2016, reflecting an increase in the invested capital turnover rate in all operations. The consolidated invested capital turnover rate has improved in all quarterly periods over the last twelve months with higher revenues in the last twelve month period outpacing the growth in average invested capital levels.
Finning International Inc. 2017 Annual Results
13
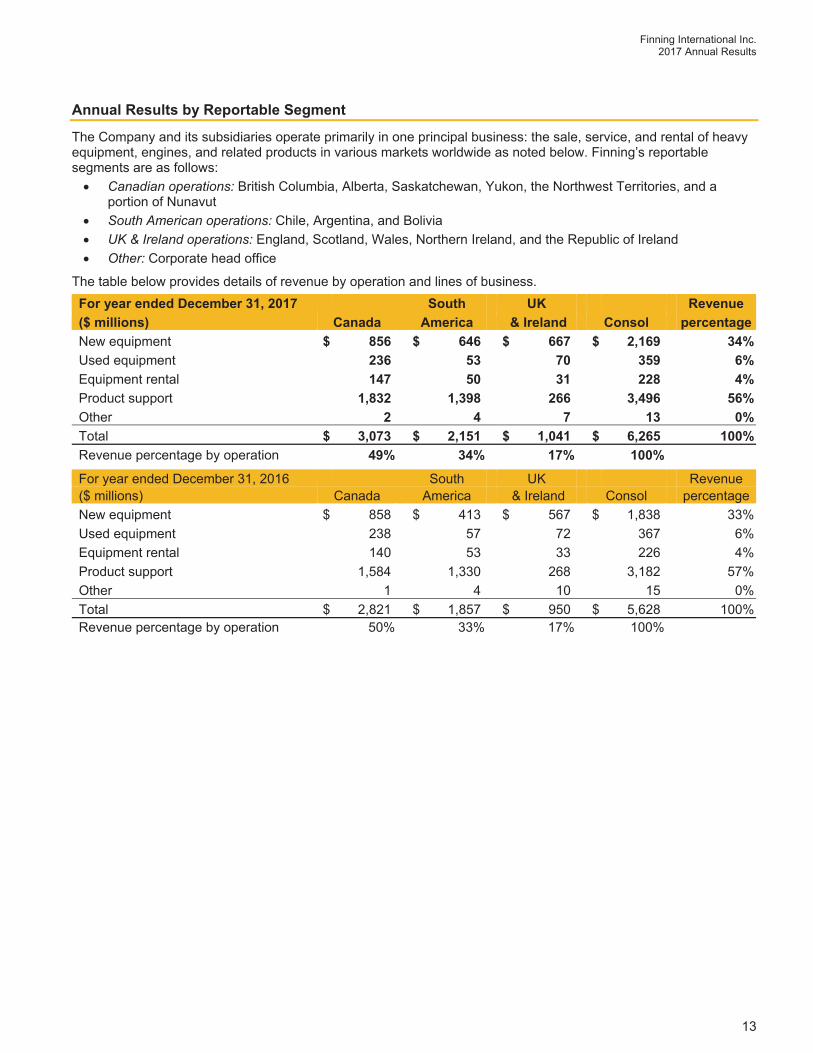
Annual Results by Reportable Segment
The Company and its subsidiaries operate primarily in one principal business: the sale, service, and rental of heavy equipment, engines, and related products in various markets worldwide as noted below. Finning’s reportable segments are as follows:
Canadian operations: British Columbia, Alberta, Saskatchewan, Yukon, the Northwest Territories, and a portion of Nunavut South American operations: Chile, Argentina, and Bolivia UK & Ireland operations: England, Scotland, Wales, Northern Ireland, and the Republic of Ireland Other: Corporate head office
The table below provides details of revenue by operation and lines of business. For year ended December 31, 2017 South UK Revenue ($ millions) Canada America & Ireland Consol percentage
New equipment $ 856 $ 646 $ 667 $ 2,169 34% Used equipment 236 53 70 359 6% Equipment rental 147 50 31 228 4% Product support 1,832 1,398 266 3,496 56% Other 2 4 7 13 0% Total $ 3,073 $ 2,151 $ 1,041 $ 6,265 100% Revenue percentage by operation 49% 34% 17% 100%
For year ended December 31, 2016 South UK Revenue ($ millions) Canada America & Ireland Consol percentage
New equipment $ 858 $ 413 $ 567 $ 1,838 33% Used equipment 238 57 72 367 6% Equipment rental 140 53 33 226 4% Product support 1,584 1,330 268 3,182 57% Other 1 4 10 15 0% Total $ 2,821 $ 1,857 $ 950 $ 5,628 100% Revenue percentage by operation 50% 33% 17% 100%
Finning International Inc. 2017 Annual Results
14
Canadian Operations
The Canadian reporting segment includes Finning (Canada), OEM Remanufacturing Company Inc. (OEM), and a 25% interest in Pipeline Machinery International (PLM). The Canadian operations sell, service, and rent mainly Caterpillar equipment and engines in British Columbia, Alberta, Saskatchewan, Yukon, the Northwest Territories, and a portion of Nunavut. The Canadian operations’ markets include mining (including the oil sands), construction, conventional oil and gas, forestry, and power systems.
The table below provides details of the results from the Canadian operations:
For years ended December 31 ($ millions) 2017 2016
Revenue from external sources $ 3,073 $ 2,821 Operating costs (2,757) (2,609) Depreciation and amortization (99) (100) Equity earnings of joint ventures 12 8 Other expenses — (33) EBIT $ 229 $ 87 EBIT margin 7.4% 3.1% EBITDA $ 328 $ 187 EBITDA margin 10.7% 6.6%
Adjusted EBIT (1) $ 228 $ 154Adjusted EBIT margin (1) 7.4% 5.5%Adjusted EBITDA (1) $ 327 $ 254Adjusted EBITDA margin (1) 10.7% 9.0%(1) Significant items that affected results for 2017 and 2016 which management does not consider to be indicative of operational and financial
trends are described on pages 4 and 5 of this MD&A.
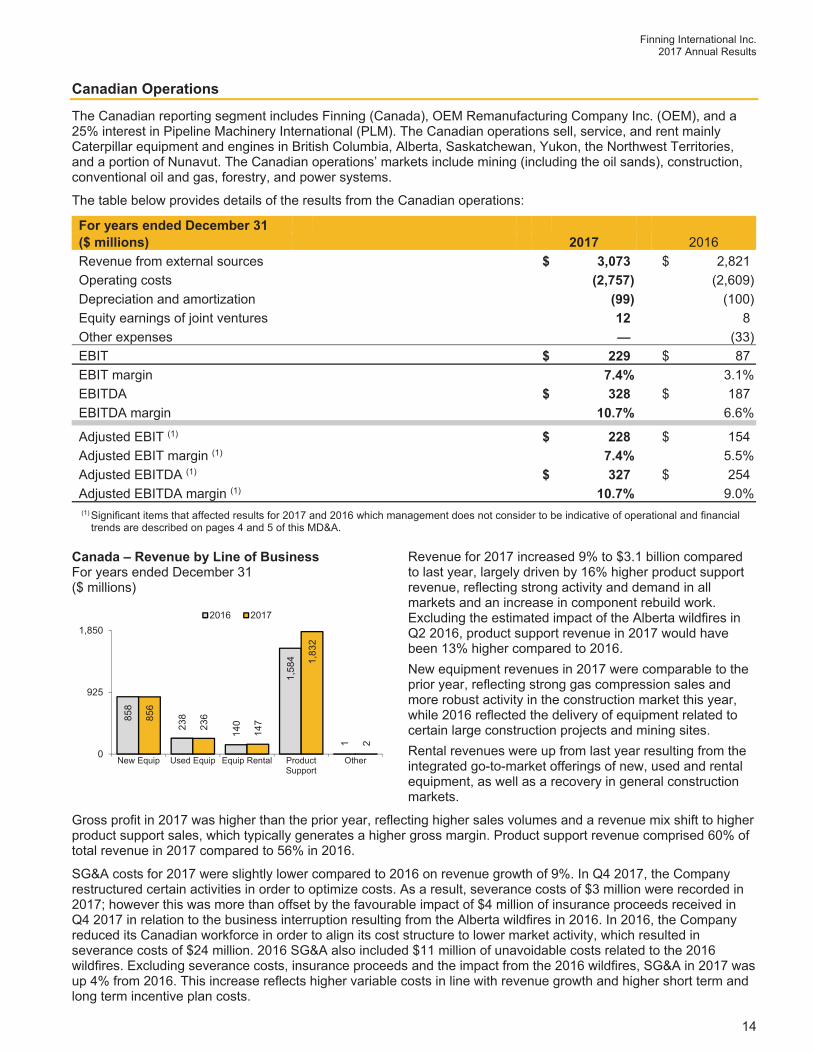
Revenue for 2017 increased 9% to $3.1 billion compared to last year, largely driven by 16% higher product support revenue, reflecting strong activity and demand in all markets and an increase in component rebuild work. Excluding the estimated impact of the Alberta wildfires in Q2 2016, product support revenue in 2017 would have been 13% higher compared to 2016. New equipment revenues in 2017 were comparable to the prior year, reflecting strong gas compression sales and more robust activity in the construction market this year, while 2016 reflected the delivery of equipment related to certain large construction projects and mining sites. Rental revenues were up from last year resulting from the integrated go-to-market offerings of new, used and rental equipment, as well as a recovery in general construction markets.
Gross profit in 2017 was higher than the prior year, reflecting higher sales volumes and a revenue mix shift to higher product support sales, which typically generates a higher gross margin. Product support revenue comprised 60% of total revenue in 2017 compared to 56% in 2016.
SG&A costs for 2017 were slightly lower compared to 2016 on revenue growth of 9%. In Q4 2017, the Company restructured certain activities in order to optimize costs. As a result, severance costs of $3 million were recorded in 2017; however this was more than offset by the favourable impact of $4 million of insurance proceeds received in Q4 2017 in relation to the business interruption resulting from the Alberta wildfires in 2016. In 2016, the Company reduced its Canadian workforce in order to align its cost structure to lower market activity, which resulted in severance costs of $24 million. 2016 SG&A also included $11 million of unavoidable costs related to the 2016 wildfires. Excluding severance costs, insurance proceeds and the impact from the 2016 wildfires, SG&A in 2017 was up 4% from 2016. This increase reflects higher variable costs in line with revenue growth and higher short term and long term incentive plan costs.
Canada – Revenue by Line of Business For years ended December 31 ($ millions)
858
238
140
1,58
4
1
856
236
147
1,83
2
2
0
925
1,850
New Equip Used Equip Equip Rental ProductSupport
Other
2016 2017
Finning International Inc. 2017 Annual Results
15
In 2016, the Canadian operations recognized $33 million of costs in other expenses related to facility closures and restructuring to adjust its footprint to lower market activity.
The Canadian operations contributed EBIT of $229 million in 2017, compared to the $87 million earned in the prior year. EBIT margin was 7.4% in 2017 and 3.1% in 2016. Excluding severance and restructuring costs, as well as the impact of the Alberta wildfires discussed earlier, Adjusted EBIT margin for 2016 was 5.5%. Adjusted EBIT margin of 7.4% in 2017 was higher than the prior year due to higher gross profit margins achieved in the current year and the leverage of incremental revenues on fixed costs.
South American Operations
Finning’s South American operations sell, service, and rent mainly Caterpillar equipment and engines in Chile, Argentina, and Bolivia. The South American operations’ markets include mining, construction, forestry, and power systems. The table below provides details of the results from the South American operations:For years ended December 31 ($ millions) 2017 2016
Revenue from external sources $ 2,151 $ 1,857 Operating costs (1,911) (1,658) Depreciation and amortization (58) (62) EBIT $ 182 $ 137 EBIT margin 8.5% 7.4% EBITDA $ 240 $ 199 EBITDA margin 11.1% 10.7%
Adjusted EBIT (1) $ 184 $ 155Adjusted EBIT margin (1) 8.6% 8.4%Adjusted EBITDA (1) $ 242 $ 217Adjusted EBITDA margin (1) 11.3% 11.7%(1) Significant items that affected results for 2017 and 2016 which management does not consider to be indicative of operational and financial
trends are described on pages 4 and 5 of this MD&A.
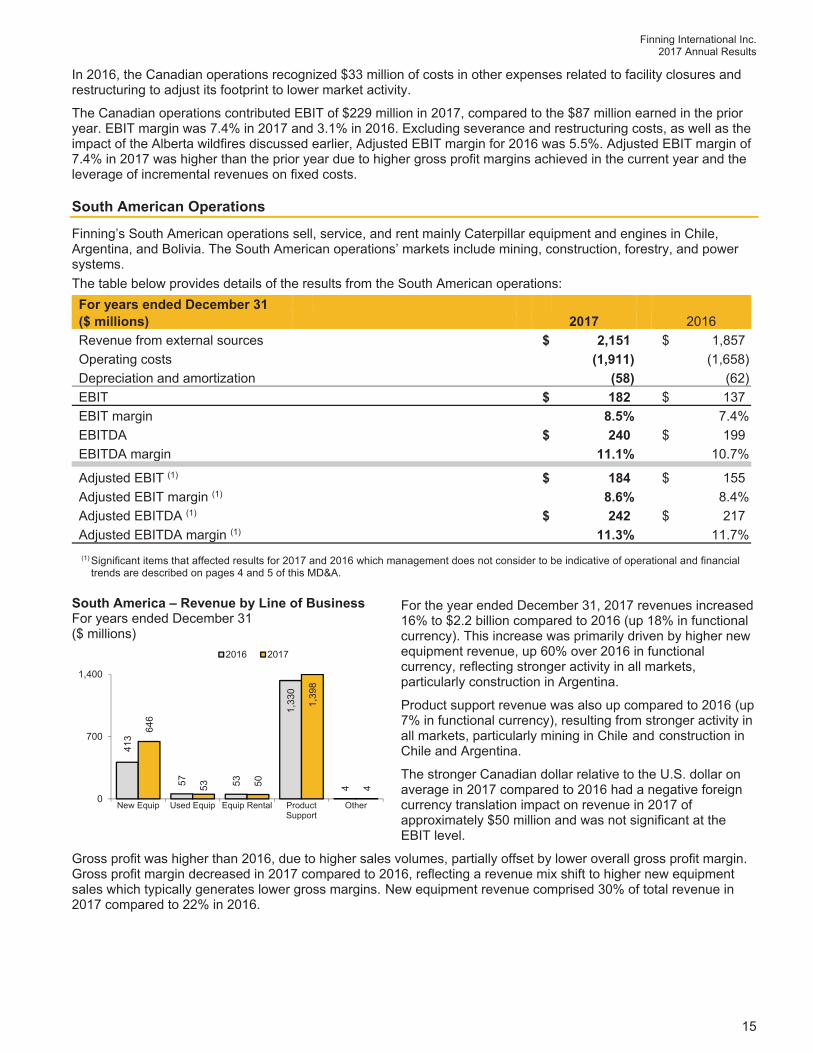
For the year ended December 31, 2017 revenues increased 16% to $2.2 billion compared to 2016 (up 18% in functional currency). This increase was primarily driven by higher new equipment revenue, up 60% over 2016 in functional currency, reflecting stronger activity in all markets, particularly construction in Argentina.
Product support revenue was also up compared to 2016 (up 7% in functional currency), resulting from stronger activity in all markets, particularly mining in Chile and construction in Chile and Argentina.
The stronger Canadian dollar relative to the U.S. dollar on average in 2017 compared to 2016 had a negative foreign currency translation impact on revenue in 2017 of approximately $50 million and was not significant at the EBIT level.
Gross profit was higher than 2016, due to higher sales volumes, partially offset by lower overall gross profit margin. Gross profit margin decreased in 2017 compared to 2016, reflecting a revenue mix shift to higher new equipment sales which typically generates lower gross margins. New equipment revenue comprised 30% of total revenue in 2017 compared to 22% in 2016.
South America – Revenue by Line of Business For years ended December 31 ($ millions)
413
57 53
1,33
0
4
646
53 50
1,39
8
4
0
700
1,400
New Equip Used Equip Equip Rental ProductSupport
Other
2016 2017
Finning International Inc. 2017 Annual Results
16
SG&A costs in the Company’s South American operations for 2017 were higher compared to 2016 (up 5% in functional currency). In 2017, the Company reduced its South American workforce related to a specific mine closure in Argentina resulting in $2 million of severance costs compared to $8 million incurred in 2016 as the Company aligned its cost structure to lower market activity. Prior year SG&A costs also included a $10 million estimated loss due to alleged fraudulent activity related to a customer in the South American operations. Excluding these significant items, SG&A costs (in functional currency) in 2017 increased by 9% compared to 2016. The increase in SG&A was due in large part to inflationary and statutory salary increases and higher variable costs from increased sales volumes, as well as higher short term and long term incentive plan costs. SG&A costs relative to sales were lower in 2017 compared to the prior year due to the leverage of incremental revenues on fixed costs.
For 2017, the Company’s South American operations contributed EBIT of $182 million and an EBIT margin of 8.5% compared to $137 million and 7.4% respectively in 2016. Excluding severance costs in both periods, and the 2016 provision related to alleged fraudulent activity noted above, Adjusted EBIT margin for 2017 was 8.6%, higher than the 2016 Adjusted EBIT margin of 8.4%. The lower gross profit margin in the current year from mix of sales was more than offset by lower SG&A costs as a percentage of revenue.
UK & Ireland Operations
The Company’s UK & Ireland operations sell, service, and rent mainly Caterpillar equipment and engines in England, Scotland, Wales, Northern Ireland, and the Republic of Ireland. The UK & Ireland operations’ markets include quarrying, construction, power systems, and mining.
The table below provides details of the results from the UK & Ireland operations:
For years ended December 31 ($ millions) 2017 2016
Revenue from external sources $ 1,041 $ 950 Operating costs (973) (927) Depreciation and amortization (26) (30) Other expenses – related to sale of business — (5) EBIT $ 42 $ (12) EBIT margin 4.0% (1.1)% EBITDA $ 68 $ 18 EBITDA margin 6.5% 2.0%
Adjusted EBIT (1) $ 42 $ 16Adjusted EBIT margin (1) 4.0% 1.8%Adjusted EBITDA (1) $ 68 $ 46Adjusted EBITDA margin (1) 6.5% 4.8%(1) There were no significant items adjusted in EBIT in 2017, therefore the adjusted metrics above for the year ended December 31, 2017 are
the same as the reported metrics. Significant items that affected results for 2016 which management does not consider to be indicative of operational and financial trends are described on pages 4 and 5 of this MD&A.
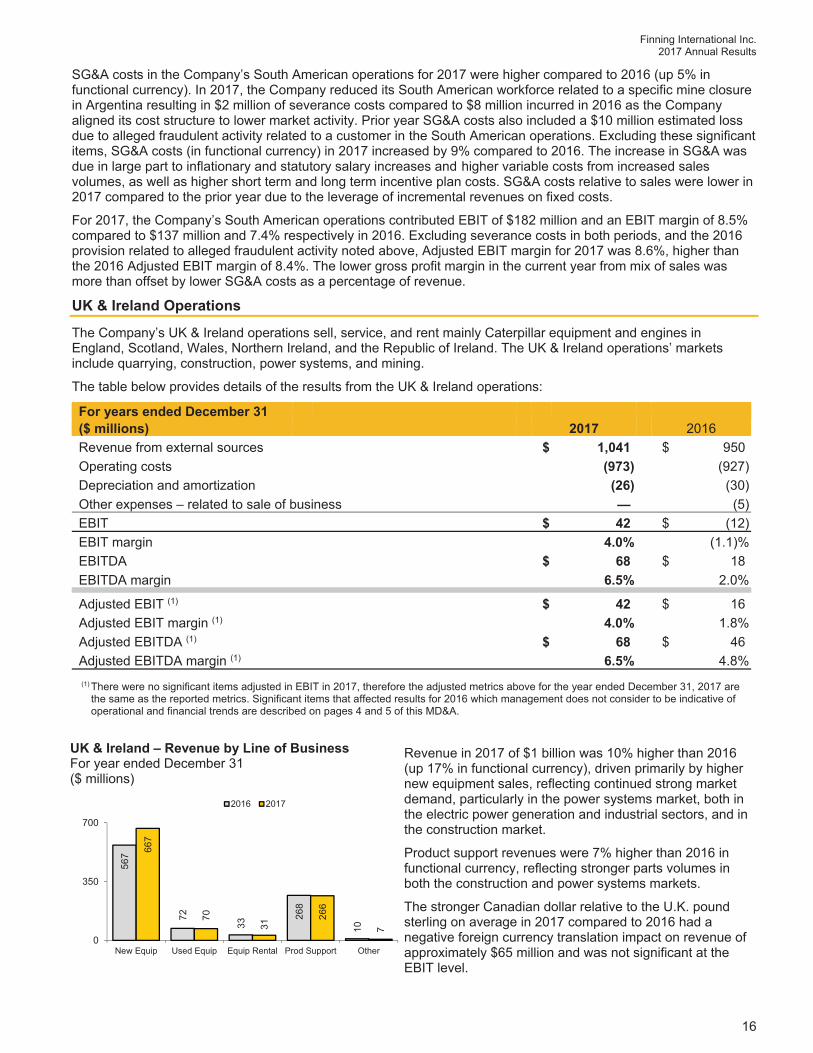
Revenue in 2017 of $1 billion was 10% higher than 2016 (up 17% in functional currency), driven primarily by higher new equipment sales, reflecting continued strong market demand, particularly in the power systems market, both in the electric power generation and industrial sectors, and in the construction market.
Product support revenues were 7% higher than 2016 in functional currency, reflecting stronger parts volumes in both the construction and power systems markets.
The stronger Canadian dollar relative to the U.K. pound sterling on average in 2017 compared to 2016 had a negative foreign currency translation impact on revenue of approximately $65 million and was not significant at the EBIT level.
UK & Ireland – Revenue by Line of Business For year ended December 31 ($ millions)
567
72
33
268
10
667
70
31
266
7
0
350
700
New Equip Used Equip Equip Rental Prod Support Other
2016 2017
Finning International Inc. 2017 Annual Results
17
Gross profit was higher than 2016, reflecting higher sales volumes, as well as higher overall gross profit margin from higher new and used equipment margins reflecting improved performance of power systems projects, partly offset by a revenue mix shift to new equipment sales.
In 2016, as part of the restructuring and repositioning of the UK’s power systems business, management in the UK & Ireland completed a detailed review of power systems contracts and projects. As a result of this review, management recorded a provision of $10 million in the first half of 2016 relating to certain power systems contracts and projects, unfavourably impacting gross profit margins in 2016, and contributing to the comparative improvement in 2017.
SG&A costs for 2017 were lower compared to 2016 (down 5% in functional currency). Excluding severance and restructuring costs of $13 million in 2016, SG&A costs (in functional currency) in 2017 increased by 4% compared to 2016. This increase reflects higher variable costs due to revenue growth. SG&A costs relative to sales were lower in 2017 as a result of higher volumes.
Following a strategic review in 2016 of the Company’s operations in the UK, it was determined that engineering and construction services for the water utility industry no longer represented a core sector for Finning’s power systems division in the UK. As a result, the Company recorded a charge in other expenses of approximately $5 million in the second quarter of 2016, representing the write-down of net assets and other costs related to the August 2016 sale of this business.
The UK & Ireland operations reported EBIT of $42 million, compared to an EBIT loss of $(12) million in 2016. EBIT margin was 4.0% compared to (1.1)% in 2016. Excluding significant items noted above in 2016, Adjusted EBIT margin for 2016 was 1.8%, significantly lower than the 4.0% EBIT margin achieved for 2017. EBIT margin was higher in 2017 due to lower SG&A costs relative to sales as noted above as well as higher gross profit margin achieved in the current year from higher new and used equipment margins.
Corporate and Other Operations
Net operating costs before finance costs and income taxes of the Company’s corporate and other operations segment were $54 million in 2017 compared to $47 million in 2016. Included in this segment are corporate operating costs, as well as equity earnings (loss) from the Company’s 28.8% investment in Energyst B.V.
Net operating costs in 2017 were $7 million higher than 2016 primarily due to:
$4 million higher long-term incentive plan costs due to improved performance against targets;
$2 million higher equity loss from Energyst B.V.; and
Higher gain recorded in 2016 relating to the sale of the Company’s investment in IronPlanet Holdings Inc. in Q2 2017 (2017: $2 million gain on sale; 2016: $5 million mark-to-market gain on this investment)
Finning International Inc. 2017 Annual Results
18
Fourth Quarter Overview
%change
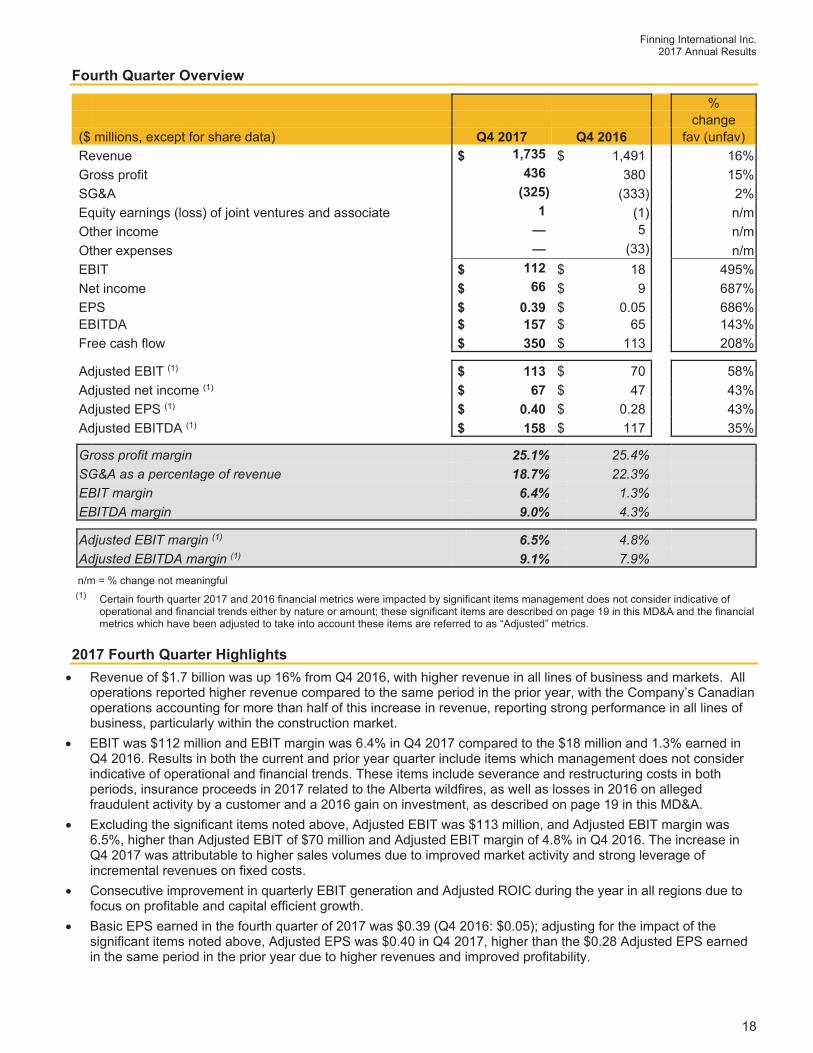
($ millions, except for share data) Q4 2017 Q4 2016 fav (unfav) Revenue $ 1,735 $ 1,491 16% Gross profit 436 380 15% SG&A (325) (333) 2% Equity earnings (loss) of joint ventures and associate 1 (1) n/m Other income — 5 n/m Other expenses — (33) n/m EBIT $ 112 $ 18 495% Net income $ 66 $ 9 687% EPS $ 0.39 $ 0.05 686% EBITDA $ 157 $ 65 143% Free cash flow $ 350 $ 113 208%
Adjusted EBIT (1) $ 113 $ 70 58% Adjusted net income (1) $ 67 $ 47 43% Adjusted EPS (1) $ 0.40 $ 0.28 43% Adjusted EBITDA (1) $ 158 $ 117 35%
Gross profit margin 25.1% 25.4%SG&A as a percentage of revenue 18.7% 22.3%EBIT margin 6.4% 1.3%EBITDA margin 9.0% 4.3%
Adjusted EBIT margin (1) 6.5% 4.8%Adjusted EBITDA margin (1) 9.1% 7.9%n/m = % change not meaningful(1) Certain fourth quarter 2017 and 2016 financial metrics were impacted by significant items management does not consider indicative of
operational and financial trends either by nature or amount; these significant items are described on page 19 in this MD&A and the financial metrics which have been adjusted to take into account these items are referred to as “Adjusted” metrics.
2017 Fourth Quarter Highlights Revenue of $1.7 billion was up 16% from Q4 2016, with higher revenue in all lines of business and markets. All
operations reported higher revenue compared to the same period in the prior year, with the Company’s Canadian operations accounting for more than half of this increase in revenue, reporting strong performance in all lines of business, particularly within the construction market.
EBIT was $112 million and EBIT margin was 6.4% in Q4 2017 compared to the $18 million and 1.3% earned in Q4 2016. Results in both the current and prior year quarter include items which management does not consider indicative of operational and financial trends. These items include severance and restructuring costs in both periods, insurance proceeds in 2017 related to the Alberta wildfires, as well as losses in 2016 on alleged fraudulent activity by a customer and a 2016 gain on investment, as described on page 19 in this MD&A.
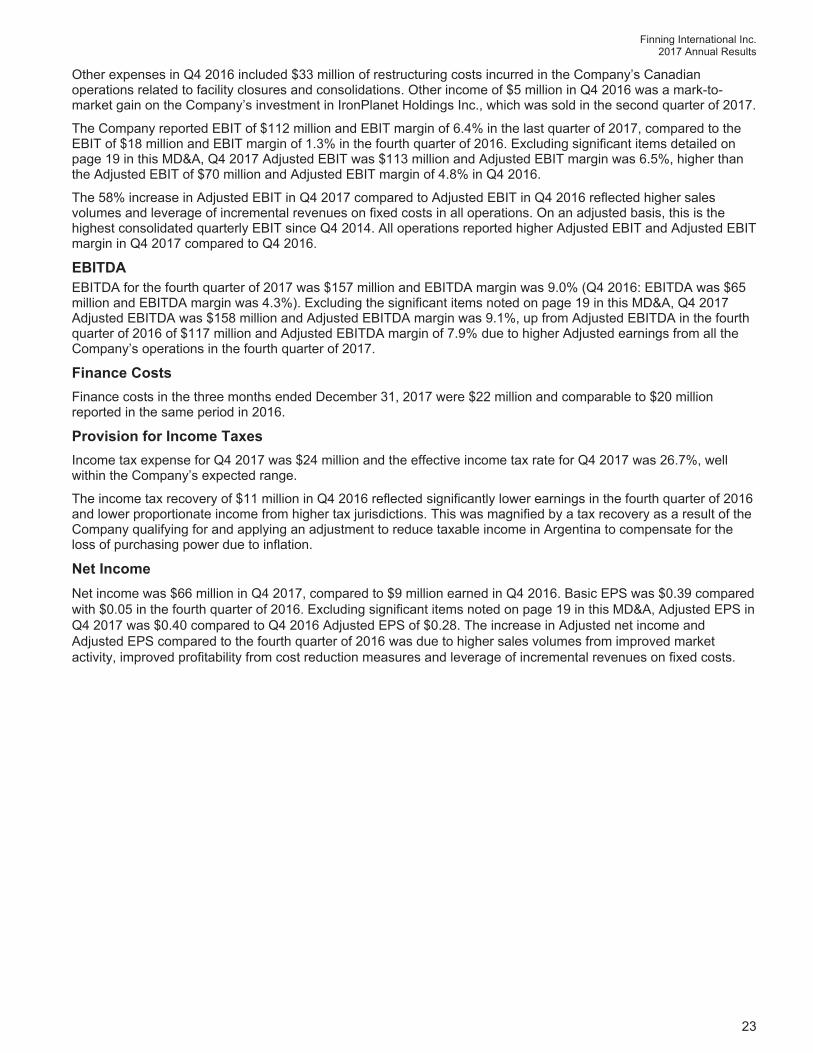
Excluding the significant items noted above, Adjusted EBIT was $113 million, and Adjusted EBIT margin was 6.5%, higher than Adjusted EBIT of $70 million and Adjusted EBIT margin of 4.8% in Q4 2016. The increase in Q4 2017 was attributable to higher sales volumes due to improved market activity and strong leverage of incremental revenues on fixed costs.
Consecutive improvement in quarterly EBIT generation and Adjusted ROIC during the year in all regions due to focus on profitable and capital efficient growth.
Basic EPS earned in the fourth quarter of 2017 was $0.39 (Q4 2016: $0.05); adjusting for the impact of the significant items noted above, Adjusted EPS was $0.40 in Q4 2017, higher than the $0.28 Adjusted EPS earned in the same period in the prior year due to higher revenues and improved profitability.
Finning International Inc. 2017 Annual Results
19
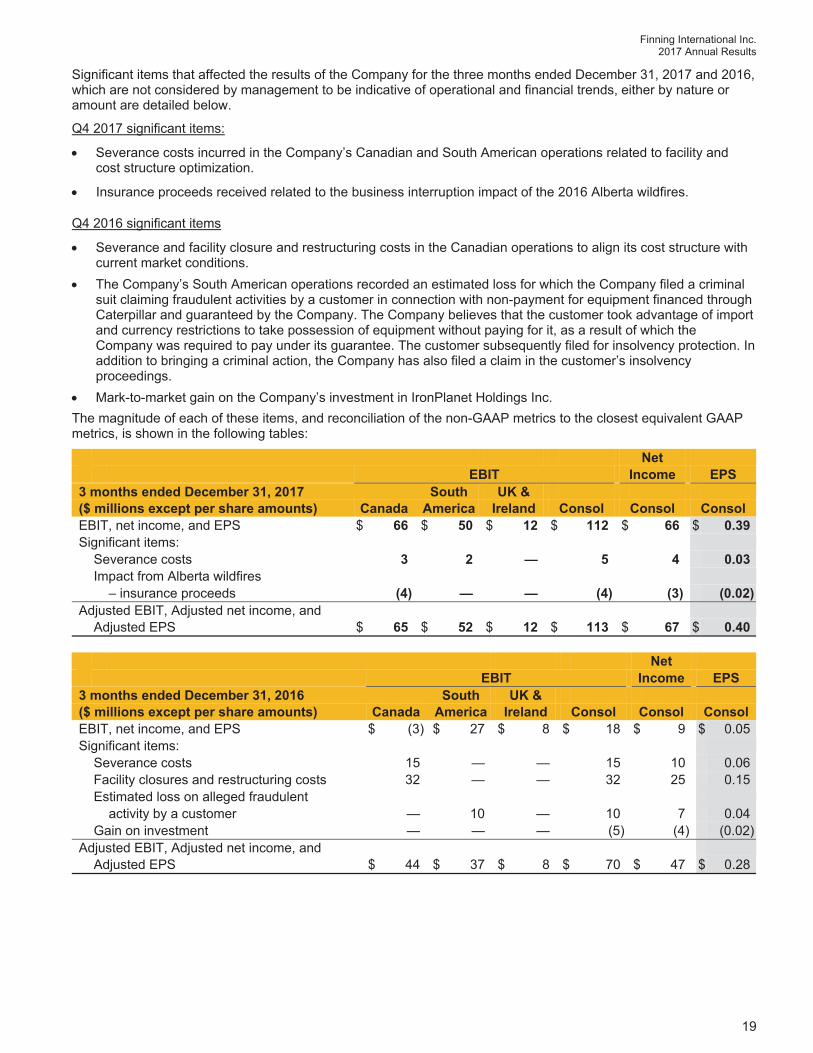
Significant items that affected the results of the Company for the three months ended December 31, 2017 and 2016, which are not considered by management to be indicative of operational and financial trends, either by nature or amount are detailed below.
Q4 2017 significant items:
Severance costs incurred in the Company’s Canadian and South American operations related to facility and cost structure optimization.
Insurance proceeds received related to the business interruption impact of the 2016 Alberta wildfires.
Q4 2016 significant items
Severance and facility closure and restructuring costs in the Canadian operations to align its cost structure with current market conditions.
The Company’s South American operations recorded an estimated loss for which the Company filed a criminal suit claiming fraudulent activities by a customer in connection with non-payment for equipment financed through Caterpillar and guaranteed by the Company. The Company believes that the customer took advantage of import and currency restrictions to take possession of equipment without paying for it, as a result of which the Company was required to pay under its guarantee. The customer subsequently filed for insolvency protection. In addition to bringing a criminal action, the Company has also filed a claim in the customer’s insolvency proceedings.
Mark-to-market gain on the Company’s investment in IronPlanet Holdings Inc. The magnitude of each of these items, and reconciliation of the non-GAAP metrics to the closest equivalent GAAP metrics, is shown in the following tables:
NetEBIT Income EPS
3 months ended December 31, 2017 South UK & ($ millions except per share amounts) Canada America Ireland Consol Consol Consol EBIT, net income, and EPS $ 66 $ 50 $ 12 $ 112 $ 66 $ 0.39Significant items: Severance costs 3 2 — 5 4 0.03 Impact from Alberta wildfires – insurance proceeds (4) — — (4) (3) (0.02)Adjusted EBIT, Adjusted net income, and Adjusted EPS $ 65 $ 52 $ 12 $ 113 $ 67 $ 0.40
NetEBIT Income EPS
3 months ended December 31, 2016 South UK & ($ millions except per share amounts) Canada America Ireland Consol Consol Consol EBIT, net income, and EPS $ (3) $ 27 $ 8 $ 18 $ 9 $ 0.05Significant items: Severance costs 15 — — 15 10 0.06 Facility closures and restructuring costs 32 — — 32 25 0.15 Estimated loss on alleged fraudulent activity by a customer — 10 — 10 7 0.04 Gain on investment — — — (5) (4) (0.02)Adjusted EBIT, Adjusted net income, and Adjusted EPS $ 44 $ 37 $ 8 $ 70 $ 47 $ 0.28
Finning International Inc. 2017 Annual Results
20
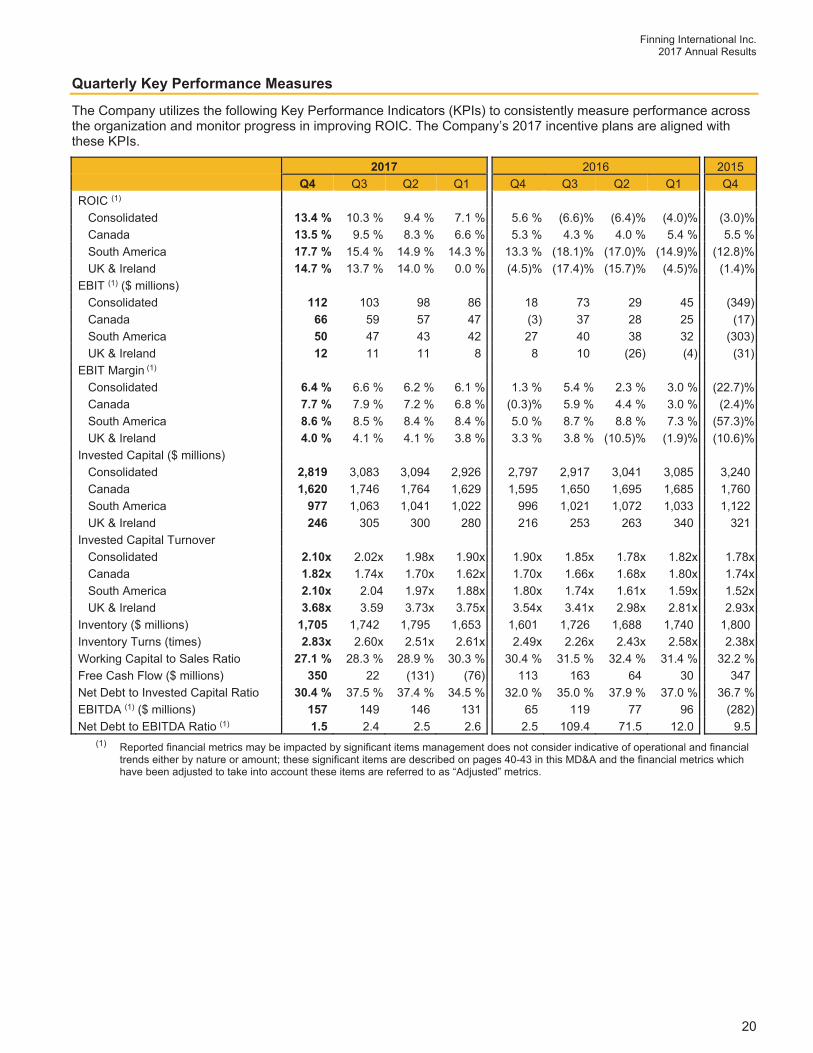
Quarterly Key Performance Measures
The Company utilizes the following Key Performance Indicators (KPIs) to consistently measure performance across the organization and monitor progress in improving ROIC. The Company’s 2017 incentive plans are aligned with these KPIs.
2017 2016 2015 Q4 Q3 Q2 Q1 Q4 Q3 Q2 Q1 Q4
ROIC (1) Consolidated 13.4 % 10.3 % 9.4 % 7.1 % 5.6 % (6.6)% (6.4)% (4.0)% (3.0)% Canada 13.5 % 9.5 % 8.3 % 6.6 % 5.3 % 4.3 % 4.0 % 5.4 % 5.5 % South America 17.7 % 15.4 % 14.9 % 14.3 % 13.3 % (18.1)% (17.0)% (14.9)% (12.8)% UK & Ireland 14.7 % 13.7 % 14.0 % 0.0 % (4.5)% (17.4)% (15.7)% (4.5)% (1.4)% EBIT (1) ($ millions) Consolidated 112 103 98 86 18 73 29 45 (349) Canada 66 59 57 47 (3) 37 28 25 (17) South America 50 47 43 42 27 40 38 32 (303) UK & Ireland 12 11 11 8 8 10 (26) (4) (31) EBIT Margin (1) Consolidated 6.4 % 6.6 % 6.2 % 6.1 % 1.3 % 5.4 % 2.3 % 3.0 % (22.7)% Canada 7.7 % 7.9 % 7.2 % 6.8 % (0.3)% 5.9 % 4.4 % 3.0 % (2.4)% South America 8.6 % 8.5 % 8.4 % 8.4 % 5.0 % 8.7 % 8.8 % 7.3 % (57.3)% UK & Ireland 4.0 % 4.1 % 4.1 % 3.8 % 3.3 % 3.8 % (10.5)% (1.9)% (10.6)% Invested Capital ($ millions) Consolidated 2,819 3,083 3,094 2,926 2,797 2,917 3,041 3,085 3,240 Canada 1,620 1,746 1,764 1,629 1,595 1,650 1,695 1,685 1,760 South America 977 1,063 1,041 1,022 996 1,021 1,072 1,033 1,122 UK & Ireland 246 305 300 280 216 253 263 340 321 Invested Capital Turnover Consolidated 2.10x 2.02x 1.98x 1.90x 1.90x 1.85x 1.78x 1.82x 1.78x Canada 1.82x 1.74x 1.70x 1.62x 1.70x 1.66x 1.68x 1.80x 1.74x South America 2.10x 2.04 1.97x 1.88x 1.80x 1.74x 1.61x 1.59x 1.52x UK & Ireland 3.68x 3.59 3.73x 3.75x 3.54x 3.41x 2.98x 2.81x 2.93x Inventory ($ millions) 1,705 1,742 1,795 1,653 1,601 1,726 1,688 1,740 1,800 Inventory Turns (times) 2.83x 2.60x 2.51x 2.61x 2.49x 2.26x 2.43x 2.58x 2.38x Working Capital to Sales Ratio 27.1 % 28.3 % 28.9 % 30.3 % 30.4 % 31.5 % 32.4 % 31.4 % 32.2 % Free Cash Flow ($ millions) 350 22 (131) (76) 113 163 64 30 347 Net Debt to Invested Capital Ratio 30.4 % 37.5 % 37.4 % 34.5 % 32.0 % 35.0 % 37.9 % 37.0 % 36.7 % EBITDA (1) ($ millions) 157 149 146 131 65 119 77 96 (282) Net Debt to EBITDA Ratio (1) 1.5 2.4 2.5 2.6 2.5 109.4 71.5 12.0 9.5
(1) Reported financial metrics may be impacted by significant items management does not consider indicative of operational and financialtrends either by nature or amount; these significant items are described on pages 40-43 in this MD&A and the financial metrics which have been adjusted to take into account these items are referred to as “Adjusted” metrics.
Finning International Inc. 2017 Annual Results
21
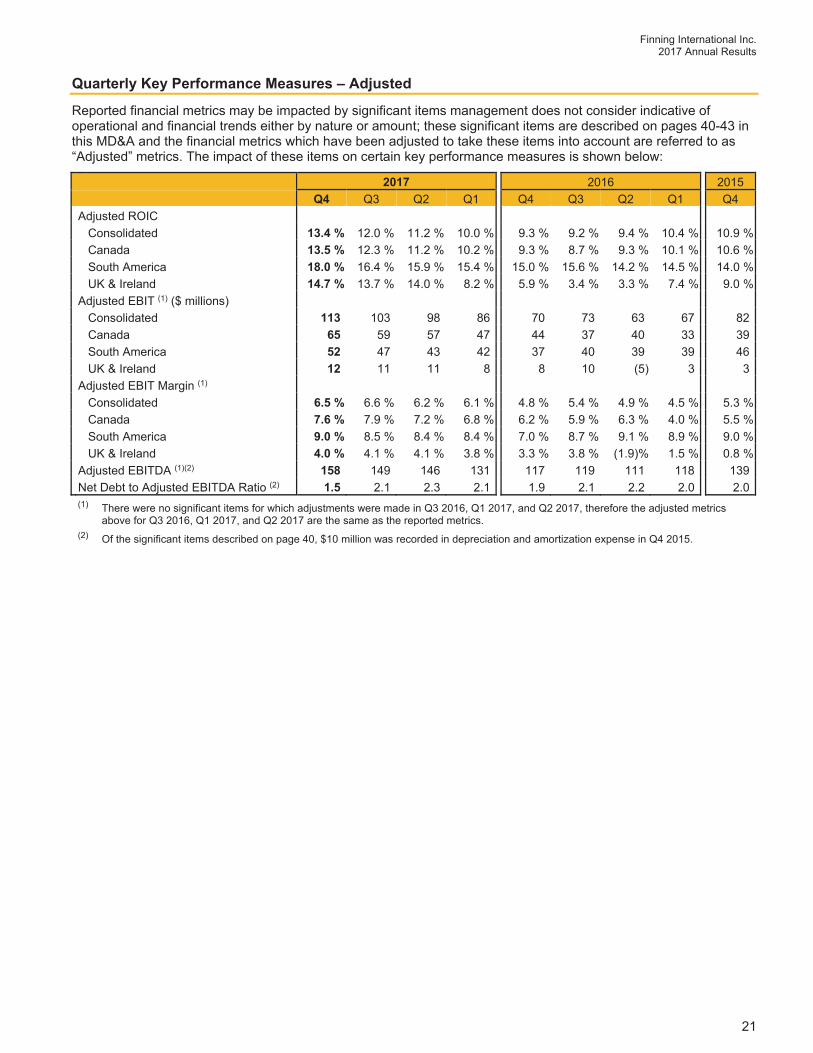
Quarterly Key Performance Measures – Adjusted
Reported financial metrics may be impacted by significant items management does not consider indicative of operational and financial trends either by nature or amount; these significant items are described on pages 40-43 in this MD&A and the financial metrics which have been adjusted to take these items into account are referred to as “Adjusted” metrics. The impact of these items on certain key performance measures is shown below:
2017 2016 2015 Q4 Q3 Q2 Q1 Q4 Q3 Q2 Q1 Q4
Adjusted ROIC Consolidated 13.4 % 12.0 % 11.2 % 10.0 % 9.3 % 9.2 % 9.4 % 10.4 % 10.9 % Canada 13.5 % 12.3 % 11.2 % 10.2 % 9.3 % 8.7 % 9.3 % 10.1 % 10.6 % South America 18.0 % 16.4 % 15.9 % 15.4 % 15.0 % 15.6 % 14.2 % 14.5 % 14.0 % UK & Ireland 14.7 % 13.7 % 14.0 % 8.2 % 5.9 % 3.4 % 3.3 % 7.4 % 9.0 % Adjusted EBIT (1) ($ millions) Consolidated 113 103 98 86 70 73 63 67 82 Canada 65 59 57 47 44 37 40 33 39 South America 52 47 43 42 37 40 39 39 46 UK & Ireland 12 11 11 8 8 10 (5) 3 3 Adjusted EBIT Margin (1) Consolidated 6.5 % 6.6 % 6.2 % 6.1 % 4.8 % 5.4 % 4.9 % 4.5 % 5.3 % Canada 7.6 % 7.9 % 7.2 % 6.8 % 6.2 % 5.9 % 6.3 % 4.0 % 5.5 % South America 9.0 % 8.5 % 8.4 % 8.4 % 7.0 % 8.7 % 9.1 % 8.9 % 9.0 % UK & Ireland 4.0 % 4.1 % 4.1 % 3.8 % 3.3 % 3.8 % (1.9)% 1.5 % 0.8 % Adjusted EBITDA (1)(2) 158 149 146 131 117 119 111 118 139 Net Debt to Adjusted EBITDA Ratio (2) 1.5 2.1 2.3 2.1 1.9 2.1 2.2 2.0 2.0
(1) There were no significant items for which adjustments were made in Q3 2016, Q1 2017, and Q2 2017, therefore the adjusted metricsabove for Q3 2016, Q1 2017, and Q2 2017 are the same as the reported metrics.
(2) Of the significant items described on page 40, $10 million was recorded in depreciation and amortization expense in Q4 2015.
Finning International Inc. 2017 Annual Results
22
Revenue
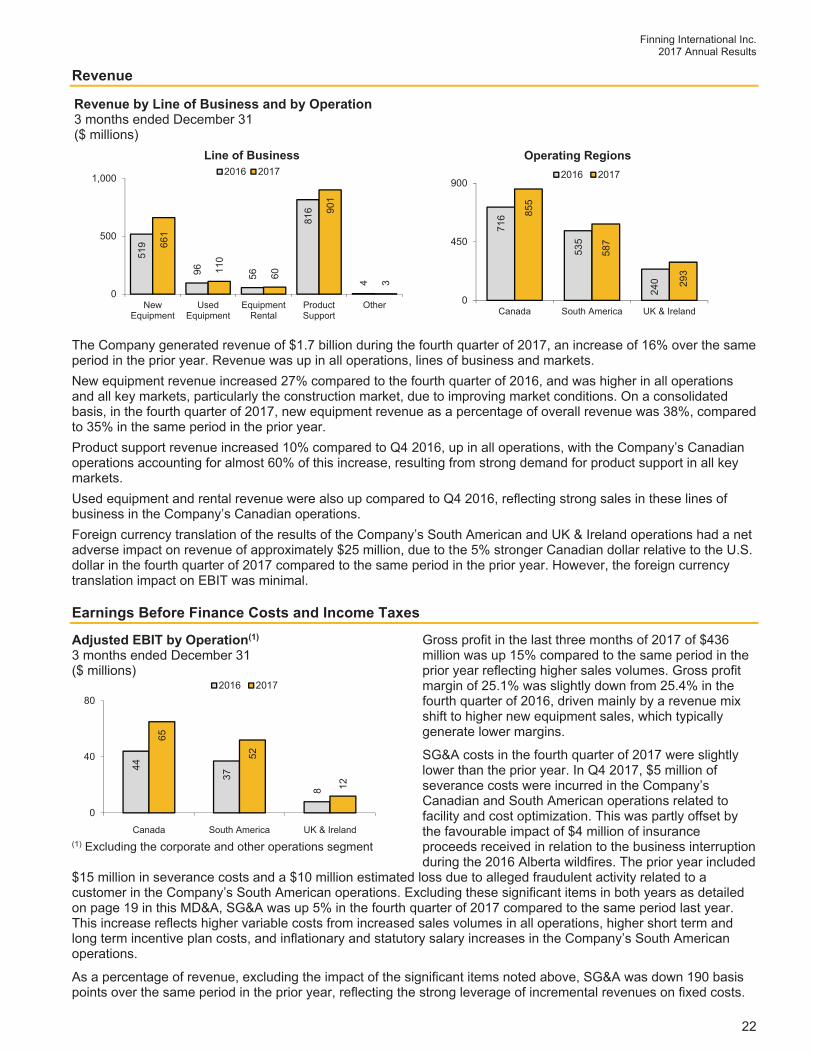
The Company generated revenue of $1.7 billion during the fourth quarter of 2017, an increase of 16% over the same period in the prior year. Revenue was up in all operations, lines of business and markets. New equipment revenue increased 27% compared to the fourth quarter of 2016, and was higher in all operations and all key markets, particularly the construction market, due to improving market conditions. On a consolidated basis, in the fourth quarter of 2017, new equipment revenue as a percentage of overall revenue was 38%, compared to 35% in the same period in the prior year. Product support revenue increased 10% compared to Q4 2016, up in all operations, with the Company’s Canadian operations accounting for almost 60% of this increase, resulting from strong demand for product support in all key markets. Used equipment and rental revenue were also up compared to Q4 2016, reflecting strong sales in these lines of business in the Company’s Canadian operations. Foreign currency translation of the results of the Company’s South American and UK & Ireland operations had a net adverse impact on revenue of approximately $25 million, due to the 5% stronger Canadian dollar relative to the U.S. dollar in the fourth quarter of 2017 compared to the same period in the prior year. However, the foreign currency translation impact on EBIT was minimal.
Earnings Before Finance Costs and Income Taxes
Gross profit in the last three months of 2017 of $436 million was up 15% compared to the same period in the prior year reflecting higher sales volumes. Gross profit margin of 25.1% was slightly down from 25.4% in the fourth quarter of 2016, driven mainly by a revenue mix shift to higher new equipment sales, which typically generate lower margins.
SG&A costs in the fourth quarter of 2017 were slightly lower than the prior year. In Q4 2017, $5 million of severance costs were incurred in the Company’s Canadian and South American operations related to facility and cost optimization. This was partly offset by the favourable impact of $4 million of insurance proceeds received in relation to the business interruption during the 2016 Alberta wildfires. The prior year included
$15 million in severance costs and a $10 million estimated loss due to alleged fraudulent activity related to a customer in the Company’s South American operations. Excluding these significant items in both years as detailed on page 19 in this MD&A, SG&A was up 5% in the fourth quarter of 2017 compared to the same period last year. This increase reflects higher variable costs from increased sales volumes in all operations, higher short term and long term incentive plan costs, and inflationary and statutory salary increases in the Company’s South American operations.
As a percentage of revenue, excluding the impact of the significant items noted above, SG&A was down 190 basis points over the same period in the prior year, reflecting the strong leverage of incremental revenues on fixed costs.
Revenue by Line of Business and by Operation 3 months ended December 31 ($ millions)
Adjusted EBIT by Operation(1)
3 months ended December 31 ($ millions)
(1) Excluding the corporate and other operations segment
519
96 56
816
4
661
110
60
901
3
0
500
1,000
NewEquipment
UsedEquipment
EquipmentRental
ProductSupport
Other
Line of Business2016 2017
716
535
240
855
587
293
0
450
900
Canada South America UK & Ireland
Operating Regions2016 2017
44
37
8
65
52
12
0
40
80
Canada South America UK & Ireland
2016 2017
Finning International Inc. 2017 Annual Results
23
Other expenses in Q4 2016 included $33 million of restructuring costs incurred in the Company’s Canadian operations related to facility closures and consolidations. Other income of $5 million in Q4 2016 was a mark-to-market gain on the Company’s investment in IronPlanet Holdings Inc., which was sold in the second quarter of 2017.
The Company reported EBIT of $112 million and EBIT margin of 6.4% in the last quarter of 2017, compared to the EBIT of $18 million and EBIT margin of 1.3% in the fourth quarter of 2016. Excluding significant items detailed on page 19 in this MD&A, Q4 2017 Adjusted EBIT was $113 million and Adjusted EBIT margin was 6.5%, higher than the Adjusted EBIT of $70 million and Adjusted EBIT margin of 4.8% in Q4 2016.
The 58% increase in Adjusted EBIT in Q4 2017 compared to Adjusted EBIT in Q4 2016 reflected higher sales volumes and leverage of incremental revenues on fixed costs in all operations. On an adjusted basis, this is the highest consolidated quarterly EBIT since Q4 2014. All operations reported higher Adjusted EBIT and Adjusted EBIT margin in Q4 2017 compared to Q4 2016.
EBITDAEBITDA for the fourth quarter of 2017 was $157 million and EBITDA margin was 9.0% (Q4 2016: EBITDA was $65 million and EBITDA margin was 4.3%). Excluding the significant items noted on page 19 in this MD&A, Q4 2017 Adjusted EBITDA was $158 million and Adjusted EBITDA margin was 9.1%, up from Adjusted EBITDA in the fourth quarter of 2016 of $117 million and Adjusted EBITDA margin of 7.9% due to higher Adjusted earnings from all the Company’s operations in the fourth quarter of 2017.
Finance CostsFinance costs in the three months ended December 31, 2017 were $22 million and comparable to $20 million reported in the same period in 2016.
Provision for Income Taxes Income tax expense for Q4 2017 was $24 million and the effective income tax rate for Q4 2017 was 26.7%, well within the Company’s expected range.
The income tax recovery of $11 million in Q4 2016 reflected significantly lower earnings in the fourth quarter of 2016 and lower proportionate income from higher tax jurisdictions. This was magnified by a tax recovery as a result of the Company qualifying for and applying an adjustment to reduce taxable income in Argentina to compensate for the loss of purchasing power due to inflation.
Net Income Net income was $66 million in Q4 2017, compared to $9 million earned in Q4 2016. Basic EPS was $0.39 compared with $0.05 in the fourth quarter of 2016. Excluding significant items noted on page 19 in this MD&A, Adjusted EPS in Q4 2017 was $0.40 compared to Q4 2016 Adjusted EPS of $0.28. The increase in Adjusted net income and Adjusted EPS compared to the fourth quarter of 2016 was due to higher sales volumes from improved market activity, improved profitability from cost reduction measures and leverage of incremental revenues on fixed costs.
Finning International Inc. 2017 Annual Results
24
Quarterly Results by Reportable Segment The table below provides details of revenue by operations and lines of business and results by operations. For 3 months ended South UK RevenueDecember 31, 2017 ($ millions) Canada America & Ireland Other Consol %
New equipment $ 267 $ 194 $ 200 $ — $ 661 38% Used equipment 77 13 20 — 110 6% Equipment rental 40 12 8 — 60 4% Product support 470 367 64 — 901 52% Other 1 1 1 — 3 — Total revenues $ 855 $ 587 $ 293 $ — $ 1,735 100% Operating costs (767) (522) (275) (15) (1,579) Depreciation and amortization (24) (15) (6) — (45) Equity earnings (loss) 2 — — (1) 1 EBIT $ 66 50 12 (16) 112 Revenue percentage by operations 49% 34% 17% — 100% EBIT margin 7.7% 8.6% 4.0% — 6.4% EBITDA $ 90 65 18 (16) 157 EBITDA margin 10.6% 10.9% 6.1% — 9.0% Adjusted EBIT(1) $ 65 52 12 (16) 113 Adjusted EBIT margin(1) 7.6% 9.0% 4.0% — 6.5% Adjusted EBITDA(1) $ 89 67 18 (16) 158 Adjusted EBITDA margin(1) 10.4% 11.4% 6.1% — 9.1% For 3 months ended South UK Revenue December 31, 2016 ($ millions) Canada America & Ireland Other Consol %
New equipment $ 202 $ 168 $ 149 $ — $ 519 35% Used equipment 59 16 21 — 96 6% Equipment rental 34 13 9 — 56 4% Product support 421 336 59 — 816 55% Other — 2 2 — 4 — Total revenues $ 716 $ 535 $ 240 $ — $ 1,491 100% Operating costs (663) (492) (225) (17) (1,397) Depreciation and amortization (24) (16) (7) — (47) Equity earnings (loss) 1 — — (2) (1) Other expenses (33) — — — (33) Other income — — — 5 5 EBIT $ (3) 27 8 (14) 18 Revenue percentage by operations 48% 36% 16% — 100% EBIT margin (0.3)% 5.0% 3.3% — 1.3% EBITDA $ 21 43 15 (14) 65 EBITDA margin 3.0% 7.9% 6.1% — 4.3%
Adjusted EBIT(1) $ 44 37 8 (19) 70 Adjusted EBIT margin(1) 6.2% 7.0% 3.3% — 4.8% Adjusted EBITDA(1) $ 68 53 15 (19) 117 Adjusted EBITDA margin(1) 9.5% 9.9% 6.1% — 7.9%
(1) Certain Q4 2017 and 2016 financial metrics were impacted by significant items management does not consider indicative of operationaland financial trends either by nature or amount; these significant items are described on page 19 of this MD&A and the financial metrics which have been adjusted to take into account these items are referred to as “Adjusted” metrics.
Finning International Inc. 2017 Annual Results
25
Quarterly Overview by Reportable Segment
CanadaFourth quarter 2017 revenue of $855 million was 19% higher than the fourth quarter of 2016, reflecting higher demand across all lines of business, particularly within the construction market.
New equipment revenue was up 32% in the fourth quarter of 2017 compared to last year, with higher deliveries in the construction and power systems markets. Product support revenue was up 12% compared to the fourth quarter of 2016, primarily due to strong parts activity in the construction market and component demand in mining markets. Used equipment revenue was also up in Q4 2017, particularly in the general construction market, with higher ex-rental fleet sales in 2017, partly offset by strong mining deliveries in the prior year.
Gross profit in Q4 2017 was higher than the prior year, reflecting higher sales volumes. Gross profit margin decreased in Q4 2017 compared to Q4 2016 primarily due to a revenue mix shift to higher new equipment sales which typically generate lower margins. New equipment revenue comprised 31% of total revenue in Q4 2017 compared to 28% in Q4 2016.
SG&A was lower in Q4 2017 compared to the same period in the prior year. Adjusted for severance costs recorded in both periods, as well as the insurance proceeds related to the Alberta wildfires received in Q4 2017, SG&A costs were up 3%, but relative to sales were 310 basis points lower in Q4 2017 compared to the same period in the prior year. SG&A costs in Q4 2017 reflected higher variable costs from increased sales volumes with improved market activity and higher short term and long term incentive plan costs.
Other expenses in Q4 2016 included $33 million of costs related to facility closures and restructuring.
Q4 2017 EBIT was $66 million, compared to a loss of $(3) million in Q4 2016. EBIT margin was 7.7% in Q4 2017 compared to (0.3)% in the same period in 2016. Excluding the significant items noted above and as summarized on page 19 in this MD&A, Q4 2017 Adjusted EBIT margin was 7.6%, higher than the Adjusted EBIT margin of 6.2% earned in Q4 2016 primarily due to strong leverage of incremental revenues on fixed costs.
South America Fourth quarter 2017 revenue of $587 million was 10% higher than the fourth quarter of 2016 (up 15% in functional currency), reflecting higher demand across most lines of business. Product support revenue was up 14% in functional currency from 2016, primarily reflecting stronger parts sales in the Chilean mining and construction markets. New equipment sales were up 21% in functional currency reflecting improvement in the construction and mining markets.
The stronger Canadian dollar relative to the U.S. dollar on average in the quarter compared to Q4 2016 had an unfavourable foreign currency translation impact on revenue in Q4 2017 of approximately $30 million and was not significant at the EBIT level.
Gross profit increased compared to Q4 2016, reflecting higher sales volumes and higher overall gross profit margin. Gross profit margin increased in Q4 2017 compared to Q4 2016, reflecting higher margins in product support and rental revenues. Higher product support margins reflected improved operational performance in mining contracts. The mix of revenues in the fourth quarter was comparable in 2017 and 2016.
SG&A (in functional currency) in Q4 2017 was slightly higher compared to the same period in the prior year. Adjusted for severance costs recorded in Q4 2017, and an estimated loss due to alleged fraudulent activity by a customer in Q4 2016, SG&A costs were up 11% in functional currency but relative to sales were 60 basis points lower in Q4 2017 compared to the same period in the prior year. The increase in SG&A is primarily due to variable costs from increased sales volumes and higher short term and long term plan incentive costs as well as inflationary and statutory salary increases.
Q4 2017 EBIT was $50 million, compared to $27 million in Q4 2016 and Q4 2017 EBIT margin was 8.6%, compared to 5.0% earned in the same period in 2016. Excluding the significant items noted above and as summarized on page 19 in this MD&A, Q4 2017 Adjusted EBIT margin was 9.0%, higher than the Adjusted EBIT margin of 7.0% earned in Q4 2016 due to higher gross profit margins achieved in the quarter in the current year and the leverage of incremental revenues on fixed costs. The fourth quarter results from last year were also impacted by the negative performance of a specific mining maintenance contract.
UK & Ireland Fourth quarter 2017 revenue of $293 million was 22% higher than the fourth quarter of 2016 (up 20% in functional currency), driven primarily by higher new equipment sales (up 31% in functional currency), reflecting higher deliveries particularly in the construction market.
Finning International Inc. 2017 Annual Results
26
Product support revenues were up 6% in functional currency compared to the prior year’s fourth quarter, reflecting higher parts revenues in all markets.
The weaker Canadian dollar relative to the U.K. pound sterling on average in the quarter compared to last quarter in the prior year had a favourable foreign currency translation impact on revenue in the fourth quarter of 2017 of approximately $5 million and was not significant at the EBIT level.
Q4 2017 gross profit was higher than the same period in the prior year, reflecting higher sales volumes and a higher overall gross profit margin. Gross profit margin increased in Q4 2017 compared to the last quarter in the prior year, mostly reflecting higher margins in new and used equipment, partly offset by a revenue mix shift to new equipment sales which typically generate lower margins. New equipment revenue comprised 68% of total revenue in Q4 2017 compared to 62% in Q4 2016.
Q4 2017 SG&A in functional currency increased by 23% compared to the same period in the prior year, which was in line with revenue growth.
Q4 2017 EBIT was $12 million, compared to $8 million in Q4 2016. EBIT margin was 4.0% in Q4 2017, higher than the 3.3% earned in Q4 2016 primarily due to higher gross profit margin.
Finning International Inc. 2017 Annual Results
27
Outlook
The Company remains focused on generating earnings leverage while investing in growth opportunities and long-term strategic initiatives to transform customer experience. Continued progress on optimizing the global supply chain is expected to drive further working capital efficiencies and support positive annual free cash flow in 2018. The Company remains committed to improving its return on invested capital.
Canada The gradual recovery of commodity prices is supporting improved activity levels from mining producers and contractors. In 2018, the Company expects an increase in new equipment deliveries to mining customers, including the oil sands. Demand for parts and service, including component rebuilds, is expected to remain strong in mining.
In British Columbia, activity levels are robust despite customers remaining cautious about opportunities for any significant infrastructure projects. In Alberta, current and proposed infrastructure projects are expected to support an increase in demand for construction equipment. Demand for power systems products, parts, and services has increased as a result of significantly improved activity in the oil and gas sector, particularly gas compression. In Saskatchewan, the new pipeline projects are starting to translate into improved demand for equipment. Product support activity in the heavy construction and power systems markets has strengthened across all provinces.
Equipment markets remain very competitive across all sectors in Western Canada. The Company believes the rate of recovery will continue to depend on the commodity markets and timing of significant infrastructure projects.
South America In Chile, copper production levels and fleet utilization continue to improve, which is expected to have a positive impact on future demand for mining equipment and product support, including component rebuilds.
Following the presidential election in December 2017, the Company expects the new Chilean government to invest in infrastructure, which will support an improved long-term outlook for equipment sales and product support in the construction sector.
In Argentina, the Company is successfully selling equipment into the growing but competitive construction market. The Company expects the current level of public investment in infrastructure to continue, and oil and gas development to accelerate going forward.
The Company will continue to invest in a new ERP system in the South American operations, which is expected to go live in 2018. As a result, the Company’s EBIT margin in South America is expected to be around 8.5% in 2018.
UK & Ireland In the UK & Ireland, activity levels in the quarry, general construction, and plant hire sectors are expected to generate steady demand for new equipment and product support. In the power systems sector, the Company continues to capitalize on strong demand for standby and short-term capacity power solutions. Competitive pricing pressures in the UK’s equipment markets remain intense.
In early 2017, the UK started a two year process to exit the European Union (Brexit), and there are significant uncertainties around the impact and final outcome. While Brexit has not had a material impact on activity levels to this point, it has resulted in economic uncertainty that continues to impact customer confidence and future investment decisions. To help offset reduced business confidence, the UK government is accelerating investments in large-scale rail, power, road, and airport infrastructure projects.
Foreign Exchange Exposure The Company expects on-going volatility in foreign exchange markets to continue impacting its results. The devaluation of the Canadian dollar increases earnings translated from the Company’s foreign subsidiaries; the opposite is true for the appreciation of the Canadian dollar. Transactional gains or losses are dependent on the Company’s hedging activities and general market conditions.
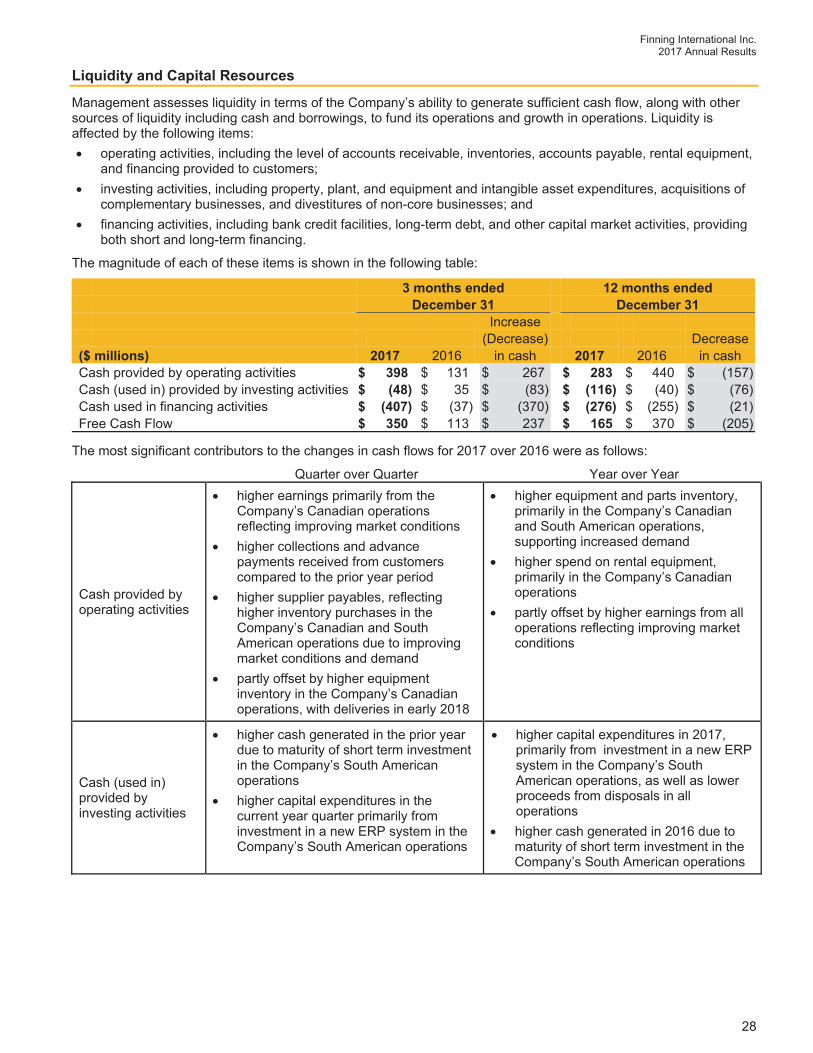
Finning International Inc. 2017 Annual Results
28
Liquidity and Capital Resources
Management assesses liquidity in terms of the Company’s ability to generate sufficient cash flow, along with other sources of liquidity including cash and borrowings, to fund its operations and growth in operations. Liquidity is affected by the following items:
operating activities, including the level of accounts receivable, inventories, accounts payable, rental equipment, and financing provided to customers;
investing activities, including property, plant, and equipment and intangible asset expenditures, acquisitions of complementary businesses, and divestitures of non-core businesses; and
financing activities, including bank credit facilities, long-term debt, and other capital market activities, providing both short and long-term financing.
The magnitude of each of these items is shown in the following table:
3 months ended 12 months ended December 31 December 31
Increase (Decrease) Decrease
($ millions) 2017 2016 in cash 2017 2016 in cash Cash provided by operating activities $ 398 $ 131 $ 267 $ 283 $ 440 $ (157) Cash (used in) provided by investing activities $ (48) $ 35 $ (83) $ (116) $ (40) $ (76) Cash used in financing activities $ (407) $ (37) $ (370) $ (276) $ (255) $ (21) Free Cash Flow $ 350 $ 113 $ 237 $ 165 $ 370 $ (205)
The most significant contributors to the changes in cash flows for 2017 over 2016 were as follows:
Quarter over Quarter Year over Year
Cash provided by operating activities
higher earnings primarily from the Company’s Canadian operations reflecting improving market conditions
higher collections and advance payments received from customers compared to the prior year period
higher supplier payables, reflecting higher inventory purchases in the Company’s Canadian and South American operations due to improving market conditions and demand
partly offset by higher equipment inventory in the Company’s Canadian operations, with deliveries in early 2018
higher equipment and parts inventory, primarily in the Company’s Canadian and South American operations, supporting increased demand
higher spend on rental equipment, primarily in the Company’s Canadian operations
partly offset by higher earnings from all operations reflecting improving market conditions
Cash (used in) provided by investing activities
higher cash generated in the prior year due to maturity of short term investment in the Company’s South American operations
higher capital expenditures in the current year quarter primarily from investment in a new ERP system in the Company’s South American operations
higher capital expenditures in 2017, primarily from investment in a new ERP system in the Company’s South American operations, as well as lower proceeds from disposals in all operations higher cash generated in 2016 due to maturity of short term investment in the Company’s South American operations
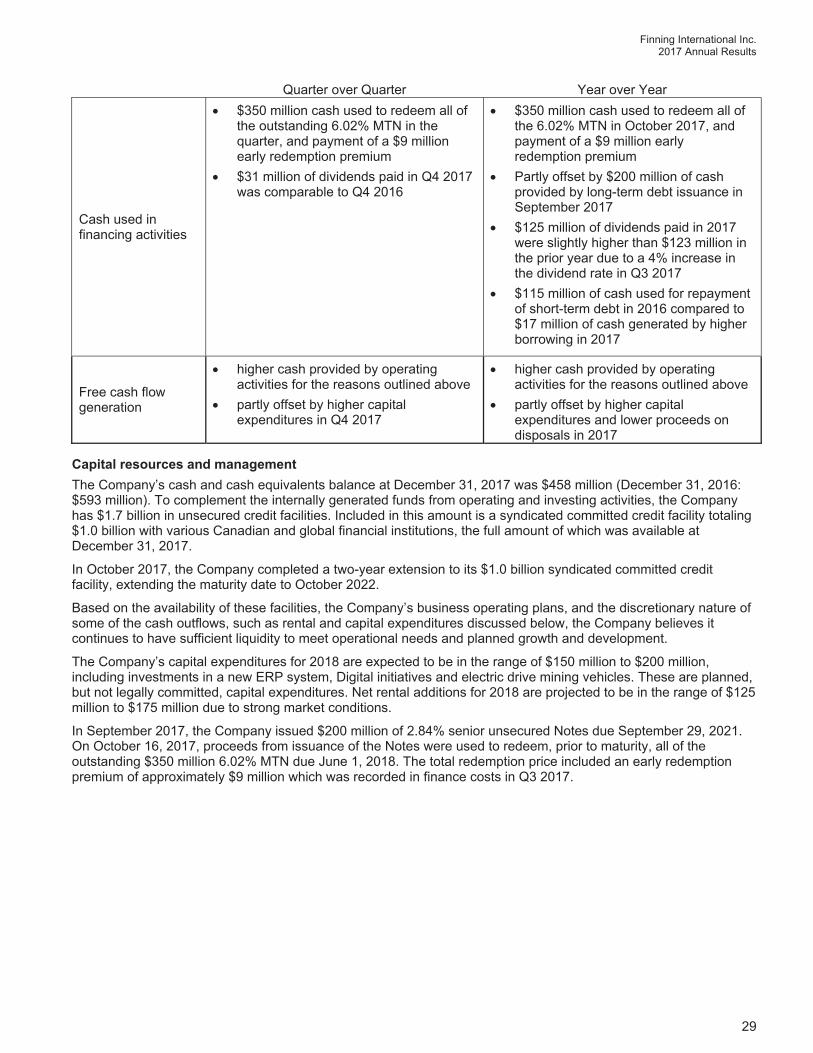
Finning International Inc. 2017 Annual Results
29
Capital resources and management The Company’s cash and cash equivalents balance at December 31, 2017 was $458 million (December 31, 2016: $593 million). To complement the internally generated funds from operating and investing activities, the Company has $1.7 billion in unsecured credit facilities. Included in this amount is a syndicated committed credit facility totaling $1.0 billion with various Canadian and global financial institutions, the full amount of which was available at December 31, 2017.
In October 2017, the Company completed a two-year extension to its $1.0 billion syndicated committed credit facility, extending the maturity date to October 2022.
Based on the availability of these facilities, the Company’s business operating plans, and the discretionary nature of some of the cash outflows, such as rental and capital expenditures discussed below, the Company believes it continues to have sufficient liquidity to meet operational needs and planned growth and development.
The Company’s capital expenditures for 2018 are expected to be in the range of $150 million to $200 million, including investments in a new ERP system, Digital initiatives and electric drive mining vehicles. These are planned, but not legally committed, capital expenditures. Net rental additions for 2018 are projected to be in the range of $125 million to $175 million due to strong market conditions.
In September 2017, the Company issued $200 million of 2.84% senior unsecured Notes due September 29, 2021. On October 16, 2017, proceeds from issuance of the Notes were used to redeem, prior to maturity, all of the outstanding $350 million 6.02% MTN due June 1, 2018. The total redemption price included an early redemption premium of approximately $9 million which was recorded in finance costs in Q3 2017.
Quarter over Quarter Year over Year
Cash used in financing activities
$350 million cash used to redeem all of the outstanding 6.02% MTN in the quarter, and payment of a $9 million early redemption premium
$31 million of dividends paid in Q4 2017 was comparable to Q4 2016
$350 million cash used to redeem all of the 6.02% MTN in October 2017, and payment of a $9 million early redemption premium
Partly offset by $200 million of cash provided by long-term debt issuance in September 2017
$125 million of dividends paid in 2017 were slightly higher than $123 million in the prior year due to a 4% increase in the dividend rate in Q3 2017
$115 million of cash used for repayment of short-term debt in 2016 compared to $17 million of cash generated by higher borrowing in 2017
Free cash flow generation
higher cash provided by operating activities for the reasons outlined above
partly offset by higher capital expenditures in Q4 2017
higher cash provided by operating activities for the reasons outlined above
partly offset by higher capital expenditures and lower proceeds on disposals in 2017
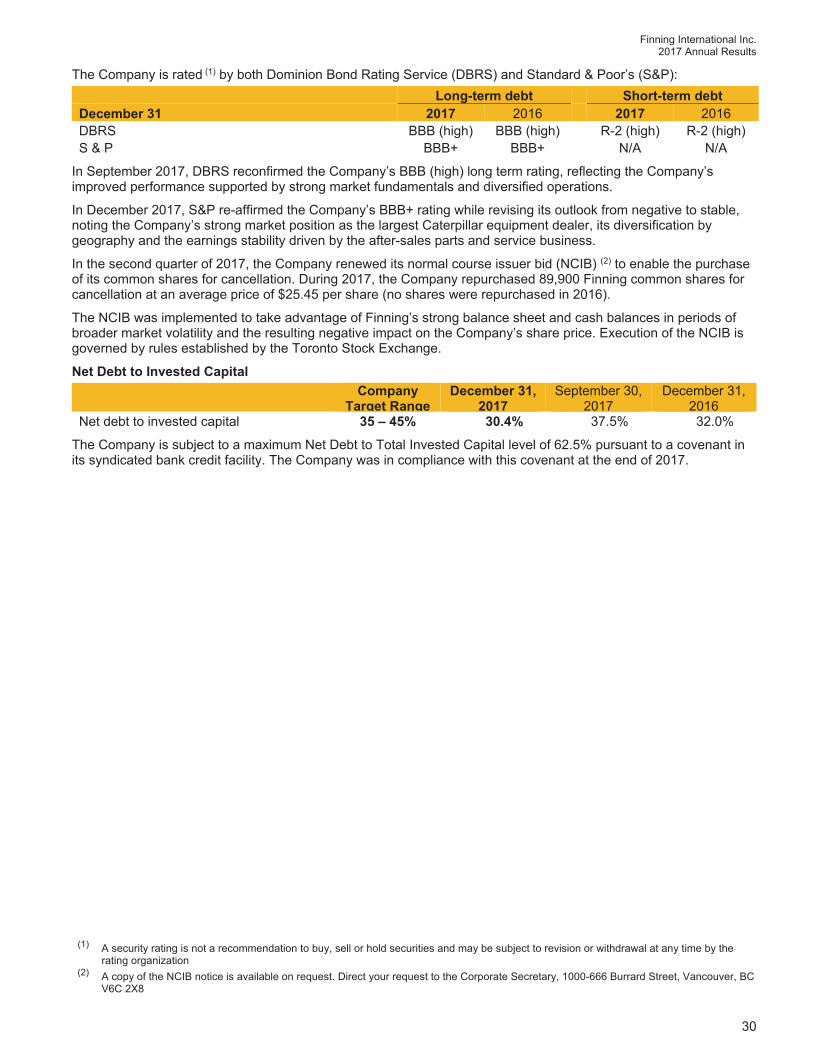
Finning International Inc. 2017 Annual Results
30
The Company is rated (1) by both Dominion Bond Rating Service (DBRS) and Standard & Poor’s (S&P): Long-term debt Short-term debt
December 31 2017 2016 2017 2016 DBRS BBB (high) BBB (high) R-2 (high) R-2 (high) S & P BBB+ BBB+ N/A N/A
In September 2017, DBRS reconfirmed the Company’s BBB (high) long term rating, reflecting the Company’s improved performance supported by strong market fundamentals and diversified operations.
In December 2017, S&P re-affirmed the Company’s BBB+ rating while revising its outlook from negative to stable, noting the Company’s strong market position as the largest Caterpillar equipment dealer, its diversification by geography and the earnings stability driven by the after-sales parts and service business.
In the second quarter of 2017, the Company renewed its normal course issuer bid (NCIB) (2) to enable the purchase of its common shares for cancellation. During 2017, the Company repurchased 89,900 Finning common shares for cancellation at an average price of $25.45 per share (no shares were repurchased in 2016).
The NCIB was implemented to take advantage of Finning’s strong balance sheet and cash balances in periods of broader market volatility and the resulting negative impact on the Company’s share price. Execution of the NCIB is governed by rules established by the Toronto Stock Exchange.
Net Debt to Invested Capital Company
Target RangeDecember 31,
2017September 30,
2017 December 31,
2016Net debt to invested capital 35 – 45% 30.4% 37.5% 32.0%
The Company is subject to a maximum Net Debt to Total Invested Capital level of 62.5% pursuant to a covenant in its syndicated bank credit facility. The Company was in compliance with this covenant at the end of 2017.
(1) A security rating is not a recommendation to buy, sell or hold securities and may be subject to revision or withdrawal at any time by the rating organization
(2) A copy of the NCIB notice is available on request. Direct your request to the Corporate Secretary, 1000-666 Burrard Street, Vancouver, BC V6C 2X8
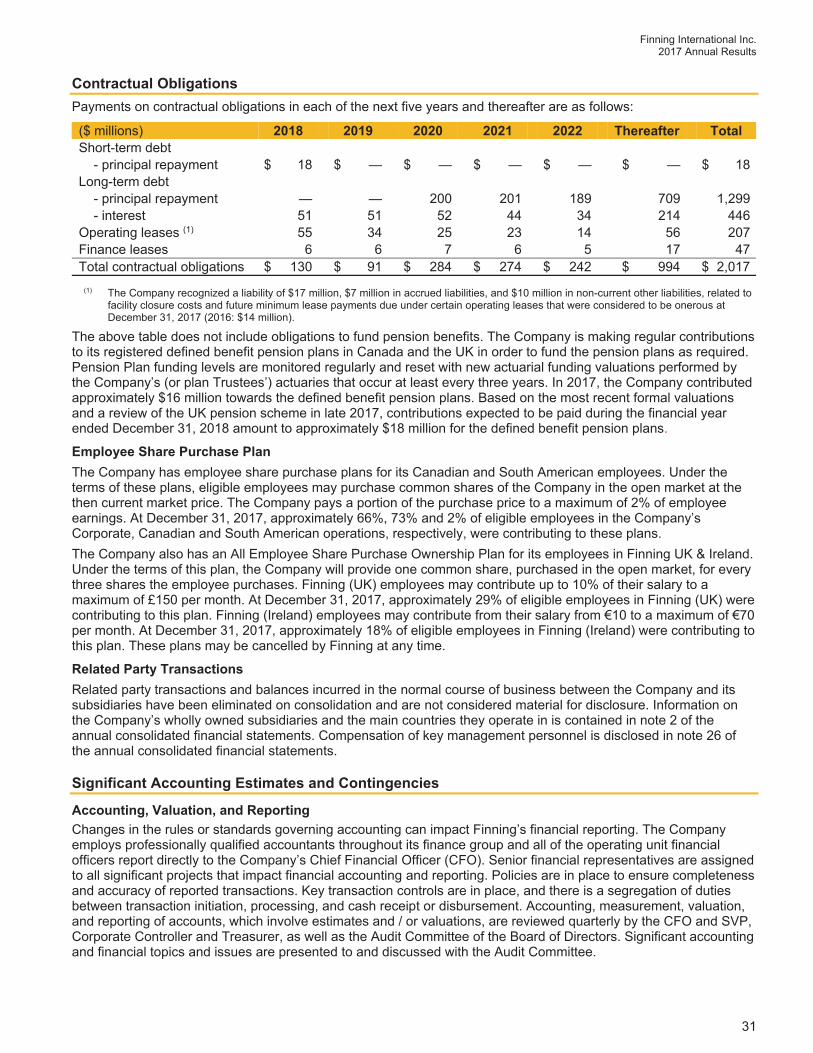
Finning International Inc. 2017 Annual Results
31
Contractual Obligations Payments on contractual obligations in each of the next five years and thereafter are as follows:
($ millions) 2018 2019 2020 2021 2022 Thereafter Total Short-term debt
- principal repayment $ 18 $ — $ — $ — $ — $ — $ 18 Long-term debt
- principal repayment — — 200 201 189 709 1,299- interest 51 51 52 44 34 214 446
Operating leases (1) 55 34 25 23 14 56 207 Finance leases 6 6 7 6 5 17 47 Total contractual obligations $ 130 $ 91 $ 284 $ 274 $ 242 $ 994 $ 2,017
(1) The Company recognized a liability of $17 million, $7 million in accrued liabilities, and $10 million in non-current other liabilities, related to facility closure costs and future minimum lease payments due under certain operating leases that were considered to be onerous atDecember 31, 2017 (2016: $14 million).
The above table does not include obligations to fund pension benefits. The Company is making regular contributions to its registered defined benefit pension plans in Canada and the UK in order to fund the pension plans as required. Pension Plan funding levels are monitored regularly and reset with new actuarial funding valuations performed by the Company’s (or plan Trustees’) actuaries that occur at least every three years. In 2017, the Company contributed approximately $16 million towards the defined benefit pension plans. Based on the most recent formal valuations and a review of the UK pension scheme in late 2017, contributions expected to be paid during the financial year ended December 31, 2018 amount to approximately $18 million for the defined benefit pension plans.
Employee Share Purchase Plan The Company has employee share purchase plans for its Canadian and South American employees. Under the terms of these plans, eligible employees may purchase common shares of the Company in the open market at the then current market price. The Company pays a portion of the purchase price to a maximum of 2% of employee earnings. At December 31, 2017, approximately 66%, 73% and 2% of eligible employees in the Company’s Corporate, Canadian and South American operations, respectively, were contributing to these plans. The Company also has an All Employee Share Purchase Ownership Plan for its employees in Finning UK & Ireland. Under the terms of this plan, the Company will provide one common share, purchased in the open market, for every three shares the employee purchases. Finning (UK) employees may contribute up to 10% of their salary to a maximum of £150 per month. At December 31, 2017, approximately 29% of eligible employees in Finning (UK) were contributing to this plan. Finning (Ireland) employees may contribute from their salary from €10 to a maximum of €70 per month. At December 31, 2017, approximately 18% of eligible employees in Finning (Ireland) were contributing to this plan. These plans may be cancelled by Finning at any time.
Related Party Transactions Related party transactions and balances incurred in the normal course of business between the Company and its subsidiaries have been eliminated on consolidation and are not considered material for disclosure. Information on the Company’s wholly owned subsidiaries and the main countries they operate in is contained in note 2 of the annual consolidated financial statements. Compensation of key management personnel is disclosed in note 26 of the annual consolidated financial statements.
Significant Accounting Estimates and Contingencies
Accounting, Valuation, and Reporting Changes in the rules or standards governing accounting can impact Finning’s financial reporting. The Company employs professionally qualified accountants throughout its finance group and all of the operating unit financial officers report directly to the Company’s Chief Financial Officer (CFO). Senior financial representatives are assigned to all significant projects that impact financial accounting and reporting. Policies are in place to ensure completeness and accuracy of reported transactions. Key transaction controls are in place, and there is a segregation of duties between transaction initiation, processing, and cash receipt or disbursement. Accounting, measurement, valuation, and reporting of accounts, which involve estimates and / or valuations, are reviewed quarterly by the CFO and SVP, Corporate Controller and Treasurer, as well as the Audit Committee of the Board of Directors. Significant accounting and financial topics and issues are presented to and discussed with the Audit Committee.
Finning International Inc. 2017 Annual Results
32
Management’s discussion and analysis of the Company’s financial condition and results of operations is based on the Company’s annual consolidated financial statements, which have been prepared in accordance with IFRS. The Company’s significant accounting policies are contained in the notes to the annual consolidated financial statements for the year ended December 31, 2017. Certain policies require management to make judgments, estimates, and assumptions in respect of the application of accounting policies and the reported amounts of assets, liabilities, revenues and expenses, and disclosure of contingent assets and liabilities. These policies may require particularly subjective and complex judgments to be made as they relate to matters that are inherently uncertain and because there is a likelihood that materially different amounts could be reported under different conditions or using different assumptions. The Company has discussed the development, selection, and application of its key accounting policies, and the critical accounting estimates and assumptions they involve, with the Audit Committee. The more significant estimates and judgements include:
recoverable values for goodwill and other indefinite-lived intangible assets identifying the cash-generating unit to which assets should be allocated for impairment testing allowance for doubtful accounts provisions for warranty provisions for income tax the determination of post-employment employee benefits provisions for slow-moving and obsolete inventory the useful lives of the rental fleet and capital assets and related residual values revenues and costs associated with long term contracts (primarily power and energy systems and long-term
product support contracts) revenues and costs associated with the sale of assets with either repurchase commitments or rental purchase
options determination of the functional currency of each entity of the Company inputs to the models to determine the fair value of certain share-based payments
For additional information on the above judgements, estimates, and assumptions made, please refer to the annual consolidated financial statements for the year ended December 31, 2017.
Goodwill and intangible assets with indefinite lives The Company performs impairment tests on its goodwill and intangible assets with indefinite lives at the appropriate level (cash generating unit or group of cash generating units (CGU)) at least annually and when events or changes in circumstances indicate that their value may not be fully recoverable. Any potential goodwill or intangible asset impairment is identified by comparing the recoverable amount of the CGU to its carrying value. If the recoverable amount of the CGU exceeds its carrying value, then goodwill and/or the intangible asset are considered not to be impaired. If the recoverable amount of the CGU is less than the carrying amount, then the impairment loss is allocated first to reduce the carrying amount of any goodwill allocated to the CGU and then to the other assets of the CGU unit pro-rata on the basis of the carrying amount of each asset in the CGU. Any impairment loss is recognized immediately in the consolidated statement of income. Impairment losses recognized for goodwill are never reversed but impairment losses on indefinite-lived intangible assets may be reversed. If there is any indication that the circumstances leading to the impairment loss of an indefinite-lived intangible asset no longer exist or may have decreased, management estimates the recoverable value of the CGU. Indicators of a recovery include sustainable improvement of the economic performance of the CGU and a positive trend in the forecast or budgeted results of the CGU. If the recoverable amount exceeds the carrying amount, then a previously recognized impairment loss is considered to have been reversed (either fully or in part). Any reversal of impairment loss is recognized immediately in the consolidated statement of net income.
The Company determines the recoverable amount of a CGU using a discounted cash flow model. The process of determining these recoverable amounts requires management to make estimates and assumptions including, but not limited to, future cash flows, growth projections, associated economic risk assumptions and estimates of key operating metrics and drivers, and the weighted average cost of capital rates. Cash flow projections are based on financial budgets presented to the Company’s Board of Directors. Projected cash flows are discounted using a weighted average cost of capital. These estimates are subject to change due to uncertain competitive and economic market conditions and changes in business strategies.
The Company performed its assessment of goodwill and intangible assets with indefinite lives and determined that there was no impairment at December 31, 2017 and 2016. There were no impairment reversals in 2017 or 2016 related to the distribution network in the Company’s South America operations. Please refer to note 20 in the annual consolidated financial statements for further details.
Finning International Inc. 2017 Annual Results
33
Income tax asset or liability Estimations in the recognition of tax assets or liabilities require assessments to be made based on the potential tax treatment of certain items that will only be resolved once finally agreed with the relevant tax authorities. Significant judgment is required as income tax laws and regulations can be complex and are potentially subject to different interpretation between the Company and the respective tax authority. Due to the number of variables associated with the differing tax laws and regulations across the multiple jurisdictions in which the Company operates, the precision and reliability of the resulting estimates are subject to uncertainties and may change as additional information becomes known. Net income in subsequent periods may be impacted by the amount that estimates differ from the final tax return.
Deferred tax assets and liabilities comprise the tax effect of temporary differences between the carrying amount and tax basis of assets and liabilities, as well as the tax effect of unused tax losses.
Assumptions underlying the composition of deferred tax assets and liabilities include estimates of future results of operations and the timing of reversal of temporary differences as well as the substantively enacted tax rates and laws in each jurisdiction at the time of the expected reversal. The composition of deferred tax assets and liabilities is reasonably likely to change from period to period due to the uncertainties surrounding these assumptions and changes in tax rates or regimes could have a material adverse effect on expected results.
Financial Instruments Cash and cash equivalents, accounts receivable, unbilled work in progress, supplier claims receivable, and instalment and other notes receivable are classified as loans and receivables. They are measured at amortized cost using the effective interest method.
Derivative financial instruments and short-term investments are classified as fair value through profit or loss and are recorded on the consolidated statement of financial position at fair value. Changes in fair value are recognized in the consolidated statement of net income except for changes in fair value related to derivative financial instruments which are effectively designated as hedging instruments which are recognized in other comprehensive income.
Short-term and long-term debt and accounts payable are classified as other financial liabilities. They are measured at amortized cost using the effective interest method.
Most of the Company’s financial instruments are measured at amortized cost and as a result, any income, expense, gain, or loss is not material.
New Accounting PronouncementsThe adoption of recent amendments to accounting standards as noted below had no impact on the Company’s financial results. For more details on recent changes in accounting policies, please refer to note 2 of the Company’s annual consolidated financial statements. The effect of future accounting pronouncements and effective dates are also discussed in note 2 of the annual consolidated financial statements.
Changes in Accounting Policies The Company has adopted the following amendments to standards: IAS 7, Statement of Cash Flows (effective January 1, 2017) introduces new requirements to disclose changes in
liabilities arising from financing activities, including changes arising from cash flows and non-cash flows. The required disclosures have been added to Note 24 of the Company’s 2017 annual consolidated financial statements.
Risk Factors and Management
Finning and its subsidiaries are exposed to market, credit, liquidity, and other risks in the normal course of their business activities. The Company’s Enterprise Risk Management (ERM) process is designed to ensure that such risks are identified, managed, and reported. This ERM framework assists the Company in managing business activities and risks across the organization in order to achieve the Company’s strategic objectives.
Finning International Inc. 2017 Annual Results
34
The Company is dedicated to a strong risk management culture to protect and enhance shareholder value. On a quarterly basis, the Audit Committee reviews the Company’s process with respect to risk assessment and management of key risks, including the Company’s major financial risks and exposures and the steps taken to monitor and control such exposures. Changes to the key risks are reviewed by the Audit Committee. The Audit Committee also reviews the adequacy of disclosures of key risks in the Company’s AIF, MD&A, and annual consolidated financial statements. All key financial risks are disclosed in the MD&A and other key business risks are disclosed in the Company’s AIF. For more information on the Company’s financial instruments, including accounting policies, description of risks, and relevant risk sensitivities, please refer to note 7 of the Company’s annual consolidated financial statements.
Market Risk and Hedging Market risk is the risk that changes in the market, such as foreign exchange rates, interest rates and commodity prices, will affect the Company’s income or the fair value of its financial instruments. The objective of market risk management is to manage and control market risk exposures within acceptable parameters.
The Company utilizes derivative financial instruments and foreign currency debt in order to manage its foreign currency and interest rate exposure. The Company uses derivative financial instruments only in connection with managing related risk positions and does not use them for trading or speculative purposes. All such transactions are carried out within the guidelines set by the Company and approved by the Company’s Audit Committee.
Foreign Exchange Risk
The Company is geographically diversified, with significant investments in several different countries. The Company transacts business in multiple currencies, the most significant of which are the Canadian dollar (CAD), U.S. dollar (USD), U.K. pound sterling (GBP), Chilean peso (CLP), and Argentine peso (ARS). As a result, the Company has foreign currency exposure with respect to items denominated in foreign currencies. The main types of foreign exchange risk of the Company can be categorized as follows:
Translation ExposureThe most significant foreign exchange impact on the Company’s net income and other comprehensive income is the translation of foreign currency based earnings and net assets or liabilities into Canadian dollars, which is the Company’s presentation currency. The functional currency of the Company’s South American operations is USD and of the Company’s UK & Ireland operations is primarily GBP (Finning Ireland Limited’s’ functional currency is the Euro).
As the Company’s South American and UK & Ireland operations have functional currencies other than the CAD, exchange rate movements between the USD/CAD and GBP/CAD will impact the consolidated results of the South American and UK & Ireland operations in CAD terms. The Company does not hedge its exposure to foreign exchange risk with regard to foreign currency earnings.
Assets and liabilities of the Company’s South American and UK & Ireland operations are translated into CAD using the exchange rates in effect at the statement of financial position dates. Any translation gains and losses are recorded as foreign currency translation adjustments in other comprehensive income. To the extent practical, it is the Company’s objective to manage this exposure. The Company has hedged a portion of its foreign investments with foreign currency denominated loans. The currency translation loss of $89 million recorded in 2017 resulted from the 7% stronger CAD relative to USD, partially offset by the 2% weaker CAD relative to GBP at December 31, 2017 compared to December 31, 2016. This was partially offset by $41 million of unrealized foreign exchange gains on net investment hedges.
Transaction Exposure Many of the Company’s operations purchase, sell, rent, and lease products as well as incur costs in currencies other than their functional currency. This mismatch of currencies creates transactional exposure, which may affect the Company’s profitability as exchange rates fluctuate. For example, the Company’s Canadian operating results are exposed to volatility in USD/CAD rates between the timing of equipment and parts purchases and the ultimate sale to customers, where purchases or sales are made in USD. A portion of this exposure is hedged through the use of forward exchange contracts as well as managed through pricing practices. The Company applies hedge accounting to hedges of certain inventory purchases in its Canadian and UK operations.
The results of the Company’s operations are impacted by the translation of its foreign denominated transactions; the results of the Canadian operations are impacted by USD based revenue and costs and the results of the South American operations are impacted by CLP and ARS based revenues and costs.
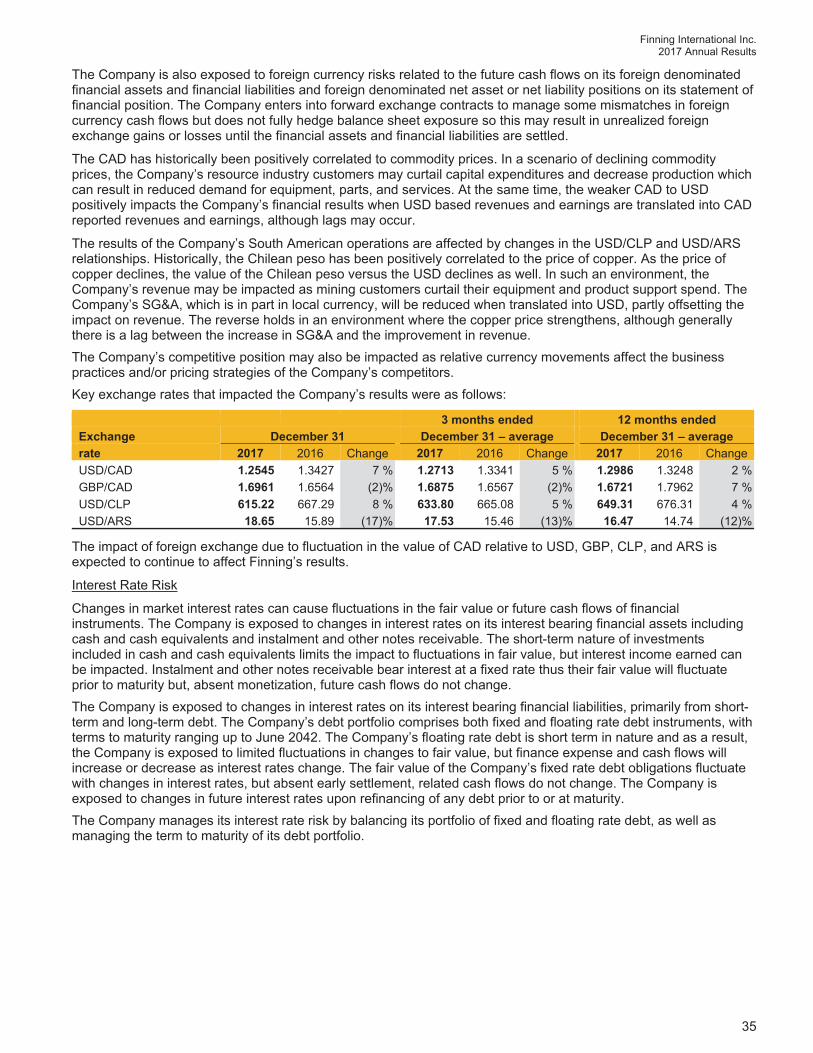
Finning International Inc. 2017 Annual Results
35
The Company is also exposed to foreign currency risks related to the future cash flows on its foreign denominated financial assets and financial liabilities and foreign denominated net asset or net liability positions on its statement of financial position. The Company enters into forward exchange contracts to manage some mismatches in foreign currency cash flows but does not fully hedge balance sheet exposure so this may result in unrealized foreign exchange gains or losses until the financial assets and financial liabilities are settled.
The CAD has historically been positively correlated to commodity prices. In a scenario of declining commodity prices, the Company’s resource industry customers may curtail capital expenditures and decrease production which can result in reduced demand for equipment, parts, and services. At the same time, the weaker CAD to USD positively impacts the Company’s financial results when USD based revenues and earnings are translated into CAD reported revenues and earnings, although lags may occur.
The results of the Company’s South American operations are affected by changes in the USD/CLP and USD/ARS relationships. Historically, the Chilean peso has been positively correlated to the price of copper. As the price of copper declines, the value of the Chilean peso versus the USD declines as well. In such an environment, the Company’s revenue may be impacted as mining customers curtail their equipment and product support spend. The Company’s SG&A, which is in part in local currency, will be reduced when translated into USD, partly offsetting the impact on revenue. The reverse holds in an environment where the copper price strengthens, although generally there is a lag between the increase in SG&A and the improvement in revenue. The Company’s competitive position may also be impacted as relative currency movements affect the business practices and/or pricing strategies of the Company’s competitors. Key exchange rates that impacted the Company’s results were as follows:
3 months ended 12 months ended Exchange December 31 December 31 – average December 31 – average rate 2017 2016 Change 2017 2016 Change 2017 2016 Change
USD/CAD 1.2545 1.3427 7 % 1.2713 1.3341 5 % 1.2986 1.3248 2 % GBP/CAD 1.6961 1.6564 (2)% 1.6875 1.6567 (2)% 1.6721 1.7962 7 % USD/CLP 615.22 667.29 8 % 633.80 665.08 5 % 649.31 676.31 4 % USD/ARS 18.65 15.89 (17)% 17.53 15.46 (13)% 16.47 14.74 (12)%
The impact of foreign exchange due to fluctuation in the value of CAD relative to USD, GBP, CLP, and ARS is expected to continue to affect Finning’s results.
Interest Rate Risk
Changes in market interest rates can cause fluctuations in the fair value or future cash flows of financial instruments. The Company is exposed to changes in interest rates on its interest bearing financial assets including cash and cash equivalents and instalment and other notes receivable. The short-term nature of investments included in cash and cash equivalents limits the impact to fluctuations in fair value, but interest income earned can be impacted. Instalment and other notes receivable bear interest at a fixed rate thus their fair value will fluctuate prior to maturity but, absent monetization, future cash flows do not change. The Company is exposed to changes in interest rates on its interest bearing financial liabilities, primarily from short-term and long-term debt. The Company’s debt portfolio comprises both fixed and floating rate debt instruments, with terms to maturity ranging up to June 2042. The Company’s floating rate debt is short term in nature and as a result, the Company is exposed to limited fluctuations in changes to fair value, but finance expense and cash flows will increase or decrease as interest rates change. The fair value of the Company’s fixed rate debt obligations fluctuate with changes in interest rates, but absent early settlement, related cash flows do not change. The Company is exposed to changes in future interest rates upon refinancing of any debt prior to or at maturity. The Company manages its interest rate risk by balancing its portfolio of fixed and floating rate debt, as well as managing the term to maturity of its debt portfolio.
Finning International Inc. 2017 Annual Results
36
Commodity Prices
The Company provides equipment, parts, and service to customers in resource and construction industries. In the resource sector, fluctuations in commodity prices and changes in long-term outlook for commodities impact customer decisions regarding capital expenditures and production levels, which determine demand for equipment, parts and service. In the construction sector, publicly funded infrastructure spending is indirectly impacted by fluctuations in commodity prices, particularly in regions with resource-based economies (such as the prices of copper, gold and other metals; thermal and metallurgical coal; natural gas, oil, and lumber). In Canada, the Company’s customers are exposed to the price of oil, mostly in the oil sands in Northern Alberta. In South America, the Company’s customers are primarily exposed to the price of copper and, to a much lesser extent, the prices of gold, other metals, and natural gas. In the UK & Ireland, the Company’s resource sector customers operate in thermal coal and off-shore oil & gas. Significant fluctuations in these commodity prices could have a material impact on the Company’s financial results. In periods of significantly lower commodity prices, demand is reduced as development of new projects is slowed or stopped and production from existing projects can be curtailed, leading to less demand for equipment. However, product support growth has been, and is expected to continue to be, important in mitigating the effects of downturns in the business cycle. Alternatively, if commodity prices rapidly increase, customer demand for Finning’s products and services could increase and apply pressure on the Company’s ability to supply the products or skilled technicians on a timely and cost efficient basis. To assist in mitigating the impacts of fluctuations in demand for its products, Finning management works closely with Caterpillar to endeavor to achieve an adequate and timely supply of product or offers customers alternative solutions and has implemented human resources recruiting strategies to achieve adequate staffing levels.
Credit Risk Credit risk is the risk of financial loss to the Company if a customer or counterparty to a financial instrument fails to meet its contractual obligations, and arises principally in respect of the Company’s cash and cash equivalents, short-term investments, receivables from customers and suppliers, instalment and other notes receivable, and derivative assets.
Credit risk associated with cash and cash equivalents and short-term investments is managed by ensuring that these financial assets are held with major financial institutions with strong investment grade ratings and by monitoring the exposures with any single institution. An ongoing review is performed to evaluate the changes in the credit rating of counterparties.
The Company has credit exposure arising from its derivative instruments relating to counterparties defaulting on their obligations. However, the Company minimizes this risk by ensuring there is no excessive concentration of credit risk with any single counterparty, by active credit monitoring, and by dealing primarily with major financial institutions that have a credit rating of at least A from S&P and/or A2 from Moody’s. The Company has a large diversified customer base and is not dependent on any single customer or group of customers. Credit risk associated with receivables from customers and suppliers is minimized because of the diversification of the Company’s operations as well as its large customer base and its geographical dispersion.
Liquidity Risk Liquidity risk is the risk that the Company will not be able to meet its financial obligations as they fall due. The Company’s approach to managing liquidity is to ensure, as far as possible, that it will have sufficient liquid financial resources to fund its operations and meet its commitments and obligations. The Company maintains uncommitted bilateral and committed syndicated bank credit facilities, continuously monitors actual and forecast cash flows, and manages maturity profiles of financial liabilities. Based on the availability of credit facilities, the Company’s business operating plans, and the discretionary nature of some of the cash outflows, such as rental and capital expenditures, the Company believes it continues to have sufficient liquidity to meet operational needs.
Financing Arrangements The Company will require capital to finance its future growth and to refinance its outstanding debt obligations as they come due for repayment. If the cash generated from the Company’s operations is not sufficient to fund future capital and debt repayment requirements, the Company will require additional debt or equity financing in the capital markets. The Company’s ability to access capital markets on terms that are acceptable will be dependent upon prevailing market conditions, as well as the Company’s future financial condition. Further, the Company’s ability to increase the level of debt financing may be limited by its financial covenants or its credit rating objectives. Although the Company does not anticipate any difficulties in raising necessary funds in the future, there can be no assurance that capital will be available on suitable terms and conditions, or that borrowing costs and credit ratings will not be adversely affected. In addition, the Company’s current financing arrangements contain certain restrictive covenants that may impact the Company’s future operating and financial flexibility.

Finning International Inc. 2017 Annual Results
37
Share-Based Payment Risk Share-based payment plans are an integral part of the Company’s employee compensation program, and can be in the form of the Company’s common shares or cash payments that reflect the value of the shares. Share-based payment plans are accounted for at fair value, and the expense associated with these plans can therefore vary as the Company’s share price, share price volatility, and employee exercise behavior change. For further details on the Company’s share-based payment plans, please refer to note 10 of the Company’s annual consolidated financial statements.
Contingencies and Guarantees
Due to the size, complexity, and nature of the Company’s operations, various legal, customs, and tax matters are pending. It is not currently possible for management to predict the outcome of such matters due to various factors, including: the preliminary nature of some claims, an incomplete factual record, and uncertainty concerning procedures and their resolution by the courts, customs, or tax authorities. However, subject to these limitations, management is of the opinion, based on legal assessments and information presently available, that, except as stated below, it is not likely that any liability would have a material effect on the Company’s financial position or results of operations.
Finning’s South American operations began to export an agricultural animal feed product from Argentina in the third quarter of 2012 in response to the Argentine government’s efforts to balance imports and exports and to manage access to foreign currency exchange. These exports enabled Finning to import goods into Argentina to satisfy customer demand, while meeting the government’s requirements. Finning’s South American operations have not exported agricultural animal feed product since the third quarter of 2013.The Company has received a number of claims from the Argentina Customs Authority associated with export of agricultural product. The Company is appealing these claims, believes they are without merit, and is confident in its position. These pending matters may take a number of years to resolve. Should the ultimate resolution of these matters differ from management’s assessment, a material adjustment could arise and negatively impact the Company’s financial position.
The Company enters into contracts with rights of return, in certain circumstances, for the repurchase of equipment sold to customers for an amount which is generally based on a discount from the estimated future fair value of that equipment. As at December 31, 2017, the total estimated value of these contracts outstanding is $119 million (2016: $121 million) coming due at periods ranging from 2018 to 2023. The Company’s experience to date has been that the equipment at the exercise date of the contract is generally worth more than the repurchase amount, however, there can be no assurance that this experience will continue in the future. The total amount recognized as a provision against these contracts is $1 million (2016: $1 million).
For further information on the Company’s contingencies, commitments, guarantees, and indemnifications, refer to notes 28 and 29 of the notes to the annual consolidated financial statements.
Outstanding Share Data
As at February 1, 2018 Common shares outstanding 168,287,877 Options outstanding 3,765,131
Finning International Inc. 2017 Annual Results
38
Controls and Procedures Certification
Disclosure Controls and Procedures
Management is responsible for establishing and maintaining a system of controls and procedures over the public disclosure of financial and non-financial information regarding the Company. Such controls and procedures are designed to provide reasonable assurance that all relevant information is gathered and reported to senior management, including the Chief Executive Officer (CEO) and Chief Financial Officer (CFO), on a timely basis so that appropriate decisions can be made regarding public disclosure. The CEO and the CFO, together with other members of management, have designed the Company’s disclosure controls and procedures in order to provide reasonable assurance that material information relating to the Company and its consolidated subsidiaries is made known to them in a timely manner. The Company has a Disclosure Policy and a Disclosure Committee in place to mitigate risks associated with the disclosure of inaccurate or incomplete information, or failure to disclose required information. The Disclosure Policy sets out accountabilities, authorized spokespersons, and Finning’s approach to the
determination, preparation, and dissemination of material information. The policy also defines restrictions on insider trading and the handling of confidential information.
The Disclosure Committee, consisting of senior management and legal counsel, reviews all financial information prepared for communication to the public to ensure it meets all regulatory requirements. The Disclosure Committee is responsible for raising any outstanding issues it believes require the attention of the Audit Committee for that Committee’s approval prior to recommending disclosure.
Internal Control over Financial Reporting Management is responsible for establishing and maintaining adequate internal control over financial reporting. Management has designed internal control over financial reporting to provide reasonable assurance regarding the reliability of financial reporting and the preparation of financial statements in accordance with IFRS. There has been no change in the design of the Company’s internal control over financial reporting during the year ended December 31, 2017, that would materially affect, or is reasonably likely to materially affect, the Company’s internal control over financial reporting. Regular involvement of the Company’s internal audit function and quarterly reporting to the Audit Committee assist in providing reasonable assurance that the objectives of the control system are met. While the officers of the Company have designed the Company’s disclosure controls and procedures and internal control over financial reporting to provide reasonable assurance that the objectives of the control system are met, they are aware that these controls and procedures may not prevent all errors and fraud. A control system, no matter how well conceived or operated, can only provide reasonable, not absolute, assurance that the objectives of the control system are met.
Evaluation of Effectiveness
As required by National Instrument 52-109, Certification of Disclosure in Issuers’ Annual and Interim Filings (NI 52-109) issued by the Canadian securities regulatory authorities, an evaluation of the design and testing of the effectiveness of the operation of the Company’s disclosure controls and procedures and internal control over financial reporting was conducted as of December 31, 2017, by and under the supervision of management. In making the assessment of the effectiveness of the Company’s disclosure controls and procedures and internal control over financial reporting, management used the criteria set forth by the Committee of Sponsoring Organizations of the Treadway Commission (COSO) in Internal Control – Integrated Framework (2013 edition). The evaluation included documentation review, enquiries, testing, and other procedures considered by management to be appropriate in the circumstances.
Based on that evaluation, the CEO and CFO have concluded that the Company’s disclosure controls and procedures and internal control over financial reporting were effective as of December 31, 2017.
Finning International Inc. 2017 Annual Results
39
Description of Non-GAAP Financial Measures and Reconciliations
Non-GAAP Financial Measures
Management believes that providing certain non-GAAP financial measures provides users of the Company’s consolidated financial statements with important information regarding the operational performance and related trends of the Company's business. By considering these measures in combination with the comparable IFRS financial measures, where available, management believes that users are provided a better overall understanding of the Company's business and its financial performance during the relevant period than if they simply considered the IFRS financial measures alone. The non-GAAP financial measures used by management do not have any standardized meaning prescribed by IFRS and therefore may not be comparable to similar measures presented by other issuers. Accordingly, these measures should not be considered as a substitute or alternative for GAAP measures as determined in accordance with IFRS. Set out below is a description of the non-GAAP financial measures used by the Company in this MD&A and a quantitative reconciliation from each non-GAAP financial measure to the most directly comparable measure, where available, specified, defined, or determined under GAAP and used in the Company’s consolidated financial statements (GAAP measures).
Key Performance Indicators Management uses key performance indicators (KPIs) to consistently measure performance against the Company’s priorities across the organization. The Company’s KPIs include, among others, ROIC, net debt to invested capital, inventory turns, invested capital turnover, working capital to sales ratio, equipment backlog, and net debt to EBITDA ratio. These KPIs, including those that are expressed as ratios, are non-GAAP financial measures that do not have a standardized meaning under IFRS and may not be comparable to similar measures used by other issuers.
Adjusted net income and Adjusted EPS Adjusted net income excludes from net income (as disclosed in the Company’s consolidated statement of income) the after-tax amounts of significant items that are not considered to be indicative of operational and financial trends either by nature or amount to provide a better overall understanding of the Company’s underlying business performance. The tax impact of each significant item is calculated by applying the relevant applicable tax rate for the jurisdiction in which the significant item occurred.
Adjusted EPS is calculated by dividing Adjusted net income by the weighted average number of common shares outstanding during the period.
An example of a reconciliation between net income and EPS (the nearest GAAP measures) and Adjusted net income and Adjusted EPS can be found on page 5 of this MD&A.
EBITDA, Adjusted EBITDA, and Adjusted EBIT EBITDA is defined as earnings before finance costs, income taxes, depreciation, and amortization and is utilized by management to assess and evaluate the financial performance of its operating segments. Management believes that EBITDA improves comparability between periods by eliminating the impact of finance costs, income taxes, depreciation, and amortization. EBITDA is also commonly regarded as an indirect measure of operating cash flow, a significant indicator of success for many businesses and is a common valuation metric. Management may also calculate an Adjusted EBIT and Adjusted EBITDA to exclude items that are not considered to be indicative of operational and financial trends either by nature or amount to provide a better overall understanding of the Company’s underlying business performance.
EBITDA is calculated by adding depreciation and amortization to EBIT. Adjusted EBITDA is calculated by adding depreciation and amortization to Adjusted EBIT. The most comparable GAAP financial measure to EBITDA is EBIT.
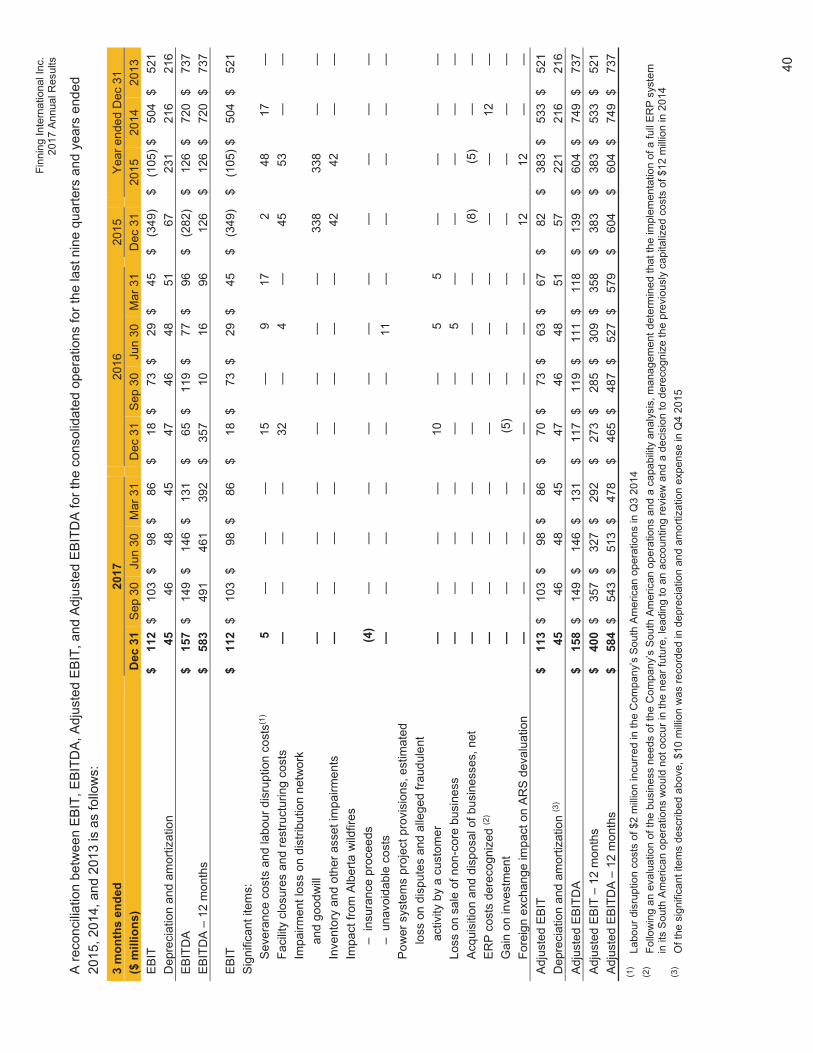
Finn
ing
Inte
rnat
iona
l Inc
. 20
17 A
nnua
l Res
ults
40
A re
conc
iliatio
n be
twee
n EB
IT, E
BIT
DA
, Adj
uste
d E
BIT
, and
Adj
uste
d E
BIT
DA
for t
he c
onso
lidat
ed o
pera
tions
for t
he la
st n
ine
quar
ters
and
yea
rs e
nded
20
15, 2
014,
and
201
3 is
as
follo
ws:
3 m
onth
s en
ded
2017
20
16
2015
Ye
ar e
nded
Dec
31
($ m
illio
ns)
Dec
31
Sep
30Ju
n 30
M
ar 3
1D
ec 3
1 Se
p 30
Jun
30
Mar
31
Dec
31
2015
20
14
2013
E
BIT
$11
2$
103
$98
$86
$
18 $
73
$29
$45
$
(349
) $
(105
)$50
4$
521
Dep
reci
atio
n an
d am
ortiz
atio
n 45
4648
45
47
4648
51
67
231
216
216
EB
ITD
A
$15
7$
149
$14
6$
131
$
65 $
11
9$
77$
96
$(2
82)
$12
6$
720
$73
7 EB
ITD
A –
12 m
onth
s $
583
491
461
392
$
357
1016
96
126
$
126
$72
0$
737
EBIT
$
112
$10
3$
98$
86
$18
$
73$
29$
45
$(3
49)
$(1
05)$
504
$52
1 S
igni
fican
t ite
ms:
S
ever
ance
cos
ts a
nd la
bour
dis
rupt
ion
cost
s(1)
5—
——
15
—
917
2
48
17—
Fa
cilit
y cl
osur
es a
nd re
stru
ctur
ing
cost
s —
——
—
32
—4
—
45
53—
—
Impa
irmen
t los
s on
dis
tribu
tion
netw
ork
and
good
will
—
——
——
—
——
33
8
338
——
In
vent
ory
and
othe
r ass
et im
pairm
ents
—
——
—
—
——
—
42
42—
—
Impa
ct fr
om A
lber
ta w
ildfir
es
–
insu
ranc
e pr
ocee
ds
(4)
——
——
—
——
—
—
——
– u
navo
idab
le c
osts
—
——
——
—
11—
—
—
——
P
ower
sys
tem
s pr
ojec
t pro
visi
ons,
est
imat
ed
lo
ss o
n di
sput
es a
nd a
llege
d fra
udul
ent
a
ctiv
ity b
y a
cust
omer
—
——
—
10
—5
5
—
——
—
Loss
on
sale
of n
on-c
ore
busi
ness
—
——
——
—
5—
—
—
——
A
cqui
sitio
n an
d di
spos
al o
f bus
ines
ses,
net
—
——
—
—
——
—
(8)
(5)
——
E
RP
cos
ts d
erec
ogni
zed
(2)
——
——
—
—
——
—
—
12—
G
ain
on in
vest
men
t —
——
—
(5)
——
—
—
——
—
Fore
ign
exch
ange
impa
ct o
n AR
S de
valu
atio
n —
——
—
—
——
—
12
12—
—
Adj
uste
d E
BIT
$
113
$10
3$
98$
86
$70
$
73$
63$
67
$82
$
383
$53
3$
521
Dep
reci
atio
n an
d am
ortiz
atio
n (3
)45
4648
45
47
4648
51
57
221
216
216
Adj
uste
d E
BIT
DA
$
158
$14
9$
146
$13
1
$11
7 $
119
$11
1$
118
$
139
$
604
$74
9$
737
Adj
uste
d E
BIT
– 1
2 m
onth
s $
400
$35
7$
327
$29
2
$27
3 $
285
$30
9$
358
$
383
$
383
$53
3$
521
Adj
uste
d E
BIT
DA
– 1
2 m
onth
s $
584
$54
3$
513
$47
8
$46
5 $
487
$52
7$
579
$
604
$
604
$74
9$
737
(1)
Labo
ur d
isru
ptio
n co
sts
of $
2 m
illio
n in
curr
ed in
the
Com
pany
’s S
outh
Am
eric
an o
pera
tions
in Q
3 20
14
(2)
Follo
win
g an
eva
luat
ion
of th
e bu
sine
ss n
eeds
of t
he C
ompa
ny’s
Sou
th A
mer
ican
ope
ratio
ns a
nd a
cap
abili
ty a
naly
sis,
man
agem
ent d
eter
min
ed th
at th
e im
plem
enta
tion
of a
full
ER
P s
yste
m
in it
s S
outh
Am
eric
an o
pera
tions
wou
ld n
ot o
ccur
in th
e ne
ar fu
ture
, lea
ding
to a
n ac
coun
ting
revi
ew a
nd a
dec
isio
n to
der
ecog
nize
the
prev
ious
ly c
apita
lized
cos
ts o
f $12
mill
ion
in 2
014
(3)
Of t
he s
igni
fican
t ite
ms
desc
ribed
abo
ve, $
10 m
illio
n w
as re
cord
ed in
dep
reci
atio
n an
d am
ortiz
atio
n ex
pens
e in
Q4
2015
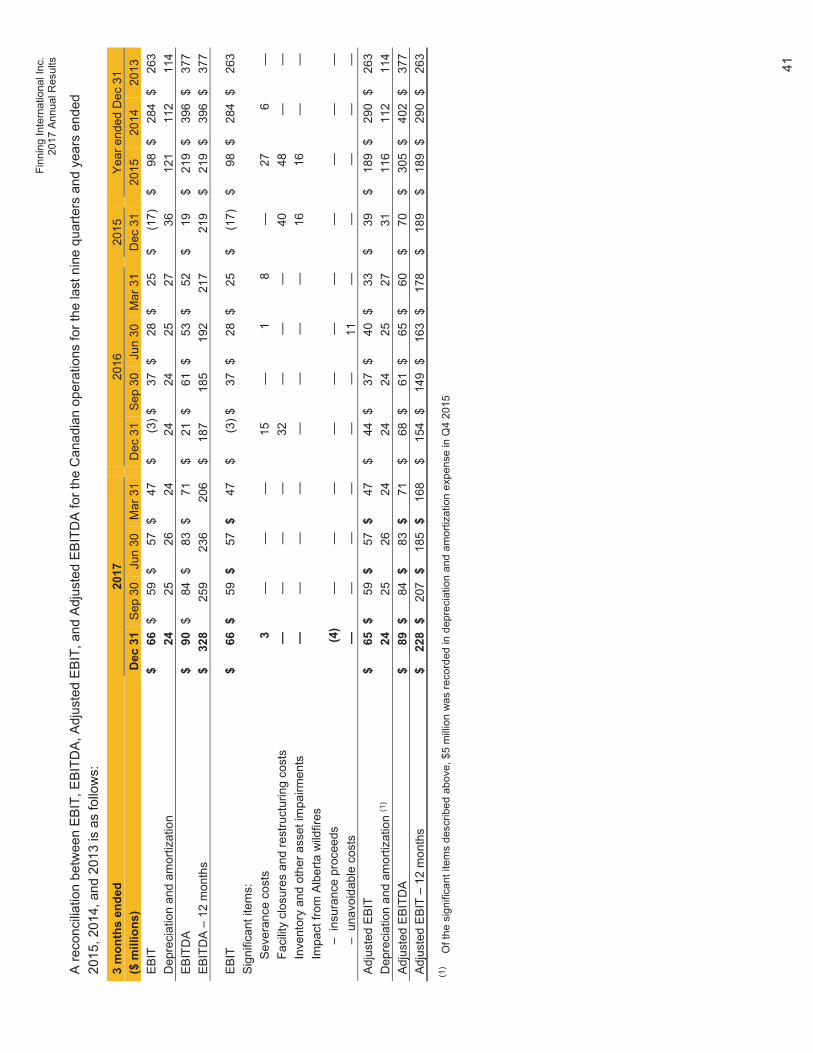
Finn
ing
Inte
rnat
iona
l Inc
. 20
17 A
nnua
l Res
ults
41
A re
conc
iliatio
n be
twee
n EB
IT, E
BIT
DA
, Adj
uste
d E
BIT
, and
Adj
uste
d E
BIT
DA
for t
he C
anad
ian
oper
atio
ns fo
r the
last
nin
e qu
arte
rs a
nd y
ears
end
ed
2015
, 201
4, a
nd 2
013
is a
s fo
llow
s:
3 m
onth
s en
ded
2017
20
16
2015
Ye
ar e
nded
Dec
31
($ m
illio
ns)
Dec
31
Sep
30Ju
n 30
M
ar 3
1D
ec 3
1 Se
p 30
Jun
30
Mar
31
Dec
31
2015
20
14
2013
E
BIT
$66
$59
$57
$47
$
(3) $
37
$28
$25
$
(17)
$
98$
284
$26
3 D
epre
ciat
ion
and
amor
tizat
ion
2425
2624
24
24
2527
36
12
111
211
4 E
BIT
DA
$
90$
84$
83$
71
$21
$
61$
53$
52
$19
$
219
$39
6$
377
EBIT
DA
– 12
mon
ths
$32
825
923
620
6
$18
7 18
519
221
7
219
$
219
$39
6$
377
EBIT
$
66$
59$
57$
47
$(3
) $
37$
28$
25
$(1
7)
$98
$28
4$
263
Sig
nific
ant i
tem
s:
Sev
eran
ce c
osts
3
——
—
15
—1
8
—
276
—
Faci
lity
clos
ures
and
rest
ruct
urin
g co
sts
——
——
32
—
——
40
48
——
In
vent
ory
and
othe
r ass
et im
pairm
ents
—
——
—
—
——
—
16
16—
—
Impa
ct fr
om A
lber
ta w
ildfir
es
–
insu
ranc
e pr
ocee
ds
(4)
——
——
—
——
—
—
——
– u
navo
idab
le c
osts
—
——
——
—
11—
—
—
——
A
djus
ted
EB
IT
$65
$59
$57
$47
$
44 $
37
$40
$33
$
39
$18
9$
290
$26
3 D
epre
ciat
ion
and
amor
tizat
ion
(1)
2425
2624
24
24
2527
31
11
611
211
4 A
djus
ted
EB
ITD
A
$89
$84
$83
$71
$
68 $
61
$65
$60
$
70
$30
5$
402
$37
7 A
djus
ted
EB
IT –
12
mon
ths
$22
8$
207
$18
5$
168
$
154
$ 14
9$
163
$17
8
$18
9
$18
9$
290
$26
3
(1)
Of t
he s
igni
fican
t ite
ms
desc
ribed
abo
ve, $
5 m
illio
n w
as re
cord
ed in
dep
reci
atio
n an
d am
ortiz
atio
n ex
pens
e in
Q4
2015
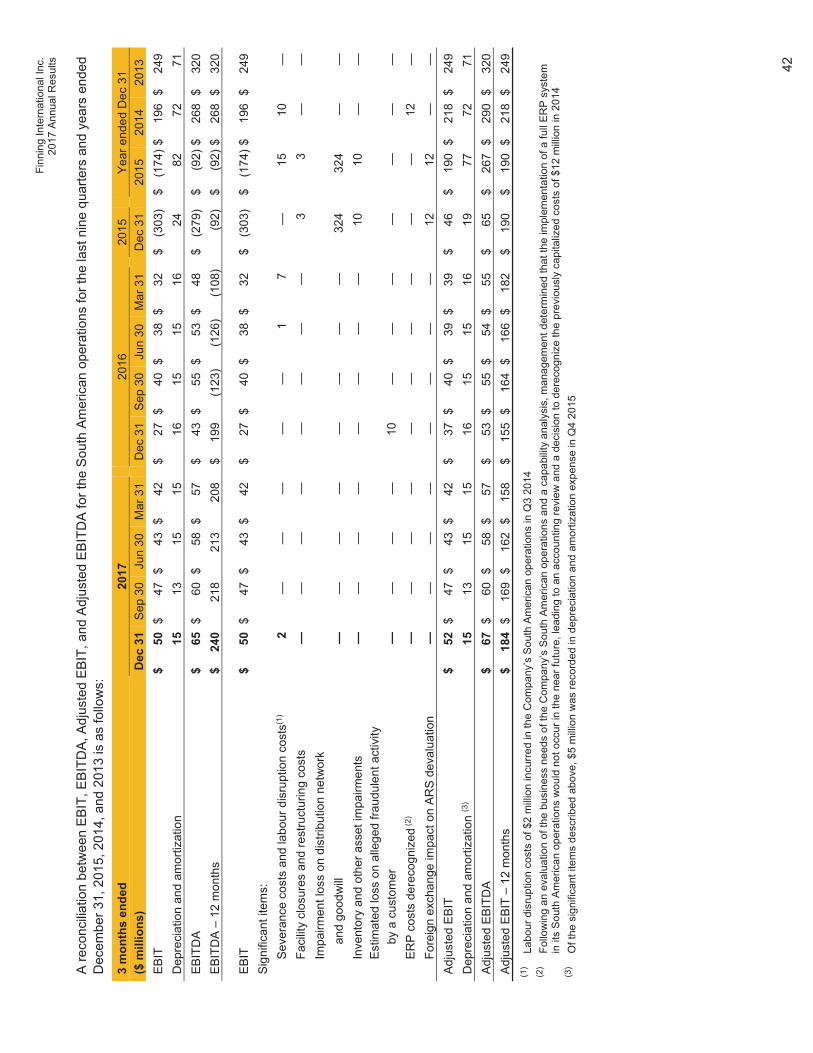
Finn
ing
Inte
rnat
iona
l Inc
. 20
17 A
nnua
l Res
ults
42
A re
conc
iliatio
n be
twee
n EB
IT, E
BIT
DA
, Adj
uste
d E
BIT
, and
Adj
uste
d E
BIT
DA
for t
he S
outh
Am
eric
an o
pera
tions
for t
he la
st n
ine
quar
ters
and
yea
rs e
nded
D
ecem
ber 3
1, 2
015,
201
4, a
nd 2
013
is a
s fo
llow
s:
3 m
onth
s en
ded
2017
20
16
2015
Ye
ar e
nded
Dec
31
($ m
illio
ns)
Dec
31
Sep
30Ju
n 30
M
ar 3
1D
ec 3
1 Se
p 30
Jun
30
Mar
31
Dec
31
2015
20
14
2013
E
BIT
$50
$47
$43
$42
$
27 $
40
$38
$32
$
(303
) $
(174
)$19
6$
249
Dep
reci
atio
n an
d am
ortiz
atio
n 15
1315
15
16
1515
16
24
8272
71
EB
ITD
A
$65
$60
$58
$57
$
43 $
55
$53
$48
$
(279
) $
(92)
$26
8$
320
EBIT
DA
– 12
mon
ths
$24
021
821
320
8
$19
9 (1
23)
(126
)(1
08)
(92)
$
(92)
$26
8$
320
EBIT
$
50$
47$
43$
42
$27
$
40$
38$
32
$(3
03)
$(1
74)$
196
$24
9 S
igni
fican
t ite
ms:
S
ever
ance
cos
ts a
nd la
bour
dis
rupt
ion
cost
s(1)
2—
——
—
—
17
—
15
10—
Fa
cilit
y cl
osur
es a
nd re
stru
ctur
ing
cost
s —
——
—
—
——
—
3
3—
—
Impa
irmen
t los
s on
dis
tribu
tion
netw
ork
and
good
will
—
——
——
—
——
32
4
324
——
In
vent
ory
and
othe
r ass
et im
pairm
ents
—
——
—
—
——
—
10
10—
—
Est
imat
ed lo
ss o
n al
lege
d fra
udul
ent a
ctiv
ity
by
a c
usto
mer
—
——
—
10
——
—
—
——
—
ER
P c
osts
der
ecog
nize
d (2)
——
——
—
—
——
—
—
12—
Fo
reig
n ex
chan
ge im
pact
on
ARS
deva
luat
ion
——
——
—
—
——
12
12
——
A
djus
ted
EB
IT
$52
$47
$43
$42
$
37 $
40
$39
$39
$
46
$19
0$
218
$24
9 D
epre
ciat
ion
and
amor
tizat
ion
(3)
1513
1515
16
15
1516
19
77
7271
A
djus
ted
EB
ITD
A
$67
$60
$58
$57
$
53 $
55
$54
$55
$
65
$26
7$
290
$32
0 A
djus
ted
EB
IT –
12
mon
ths
$18
4$
169
$16
2$
158
$
155
$ 16
4$
166
$18
2
$19
0
$19
0$
218
$24
9 (1
)La
bour
dis
rupt
ion
cost
s of
$2
mill
ion
incu
rred
in th
e C
ompa
ny’s
Sou
th A
mer
ican
ope
ratio
ns in
Q3
2014
(2
)Fo
llow
ing
an e
valu
atio
n of
the
busi
ness
nee
ds o
f the
Com
pany
’s S
outh
Am
eric
an o
pera
tions
and
a c
apab
ility
ana
lysi
s, m
anag
emen
t det
erm
ined
that
the
impl
emen
tatio
n of
a fu
ll E
RP
sys
tem
in
its
Sou
th A
mer
ican
ope
ratio
ns w
ould
not
occ
ur in
the
near
futu
re, l
eadi
ng to
an
acco
untin
g re
view
and
a d
ecis
ion
to d
erec
ogni
ze th
e pr
evio
usly
cap
italiz
ed c
osts
of $
12 m
illio
n in
201
4 (3
)O
f the
sig
nific
ant i
tem
s de
scrib
ed a
bove
, $5
mill
ion
was
reco
rded
in d
epre
ciat
ion
and
amor
tizat
ion
expe
nse
in Q
4 20
15
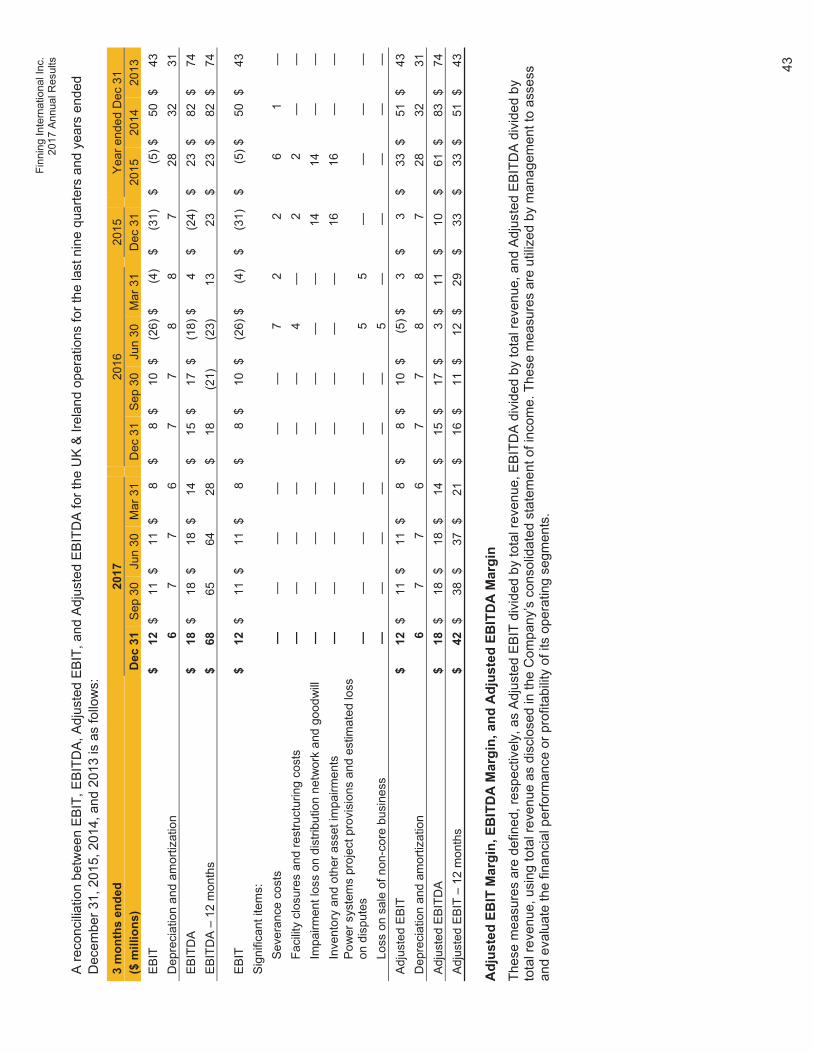
Finn
ing
Inte
rnat
iona
l Inc
. 20
17 A
nnua
l Res
ults
43
A re
conc
iliatio
n be
twee
n EB
IT, E
BIT
DA
, Adj
uste
d E
BIT
, and
Adj
uste
d E
BIT
DA
for t
he U
K &
Irel
and
oper
atio
ns fo
r the
last
nin
e qu
arte
rs a
nd y
ears
end
ed
Dec
embe
r 31,
201
5, 2
014,
and
201
3 is
as
follo
ws:
3 m
onth
s en
ded
2017
20
16
2015
Ye
ar e
nded
Dec
31
($ m
illio
ns)
Dec
31
Sep
30Ju
n 30
M
ar 3
1D
ec 3
1 Se
p 30
Jun
30
Mar
31
Dec
31
2015
20
14
2013
E
BIT
$12
$11
$11
$8
$
8 $
10$
(26)
$(4
) $
(31)
$
(5)$
50$
43
Dep
reci
atio
n an
d am
ortiz
atio
n 6
77
6
7 7
88
7
28
3231
E
BIT
DA
$
18$
18$
18$
14
$15
$
17$
(18)
$4
$
(24)
$
23$
82$
74
EBIT
DA
– 12
mon
ths
$68
6564
28
$18
(2
1)(2
3)13
23
$
23$
82$
74
EBIT
$
12$
11$
11$
8
$8
$ 10
$(2
6)$
(4)
$(3
1)
$(5
)$50
$43
S
igni
fican
t ite
ms:
S
ever
ance
cos
ts
——
——
—
—
72
2
6
1—
Fa
cilit
y cl
osur
es a
nd re
stru
ctur
ing
cost
s —
——
—
—
—4
—
2
2—
—
Impa
irmen
t los
s on
dis
tribu
tion
netw
ork
and
good
will
——
——
—
——
—
14
14—
—
Inve
ntor
y an
d ot
her a
sset
impa
irmen
ts
——
——
—
—
——
16
16
——
P
ower
sys
tem
s pr
ojec
t pro
visi
ons
and
estim
ated
loss
on
dis
pute
s
——
——
—
—
55
—
—
——
Lo
ss o
n sa
le o
f non
-cor
e bu
sine
ss
——
——
—
—5
—
—
——
—
Adj
uste
d E
BIT
$
12$
11$
11$
8
$8
$ 10
$(5
)$3
$
3
$33
$51
$43
D
epre
ciat
ion
and
amor
tizat
ion
6
77
6
7 7
88
7
28
3231
A
djus
ted
EB
ITD
A
$18
$18
$18
$14
$
15 $
17
$3
$11
$
10
$61
$83
$74
A
djus
ted
EB
IT –
12
mon
ths
$42
$38
$37
$21
$
16 $
11
$12
$29
$
33
$33
$51
$43
Adj
uste
d EB
IT M
argi
n, E
BIT
DA
Mar
gin,
and
Adj
uste
d EB
ITD
A M
argi
n
Thes
e m
easu
res
are
defin
ed, r
espe
ctiv
ely,
as
Adj
uste
d E
BIT
div
ided
by
tota
l rev
enue
, EB
ITD
A d
ivid
ed b
y to
tal r
even
ue, a
nd A
djus
ted
EB
ITD
A d
ivid
ed b
y to
tal r
even
ue, u
sing
tota
l rev
enue
as
disc
lose
d in
the
Com
pany
’s c
onso
lidat
ed s
tate
men
t of i
ncom
e. T
hese
mea
sure
s ar
e ut
ilized
by
man
agem
ent t
o as
sess
an
d ev
alua
te th
e fin
anci
al p
erfo
rman
ce o
r pro
fitab
ility
of i
ts o
pera
ting
segm
ents
.
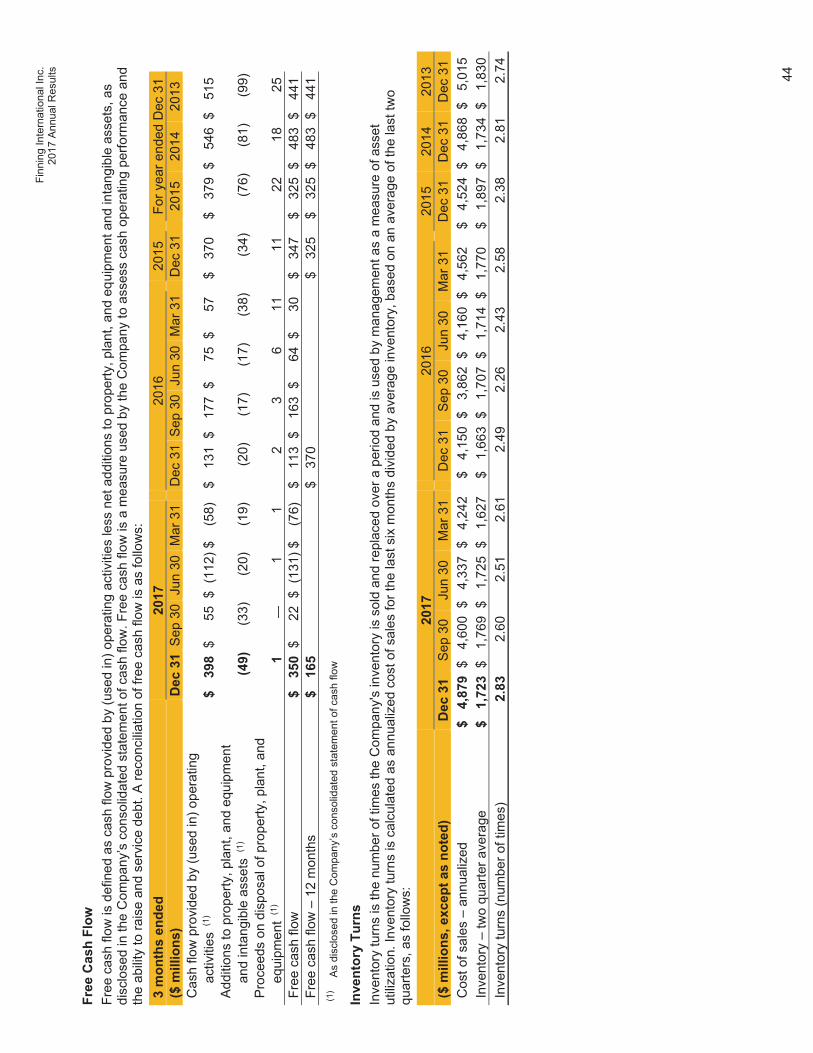
Finn
ing
Inte
rnat
iona
l Inc
. 20
17 A
nnua
l Res
ults
44
Free
Cas
h Fl
ow
Free
cas
h flo
w is
def
ined
as
cash
flow
pro
vide
d by
(use
d in
) ope
ratin
g ac
tiviti
es le
ss n
et a
dditi
ons
to p
rope
rty, p
lant
, and
equ
ipm
ent a
nd in
tang
ible
ass
ets,
as
disc
lose
d in
the
Com
pany
’s c
onso
lidat
ed s
tate
men
t of c
ash
flow
. Fre
e ca
sh fl
ow is
a m
easu
re u
sed
by th
e C
ompa
ny to
ass
ess
cash
ope
ratin
g pe
rform
ance
and
th
e ab
ility
to ra
ise
and
serv
ice
debt
. A re
conc
iliatio
n of
free
cas
h flo
w is
as
follo
ws:
3 m
onth
s en
ded
2017
20
16
2015
Fo
r yea
r end
ed D
ec 3
1($
mill
ions
) D
ec 3
1S
ep 3
0Ju
n 30
Mar
31
Dec
31
Sep
30
Jun
30M
ar 3
1D
ec 3
120
15
2014
20
13
Cas
h flo
w p
rovi
ded
by (u
sed
in) o
pera
ting
ac
tiviti
es (1
)$
398
$55
$(1
12)$
(58)
$
131
$ 17
7$
75$
57
$37
0
$37
9$
546
$51
5 A
dditi
ons
to p
rope
rty, p
lant
, and
equ
ipm
ent
an
d in
tang
ible
ass
ets
(1)
(49)
(33)
(20)
(19)
(2
0)
(17)
(17)
(38)
(3
4)
(76)
(81)
(99)
Pro
ceed
s on
dis
posa
l of p
rope
rty, p
lant
, and
equi
pmen
t (1)
1—
11
2
36
11
11
2218
25 F
ree
cash
flow
$
350
$22
$(1
31)$
(76)
$
113
$ 16
3$
64$
30
$34
7
$32
5$
483
$44
1 F
ree
cash
flow
– 1
2 m
onth
s $
165
$37
0
$
325
$
325
$48
3$
441
(1)
As
disc
lose
d in
the
Com
pany
’s c
onso
lidat
ed s
tate
men
t of c
ash
flow
Inve
ntor
y Tu
rns
Inve
ntor
y tu
rns
is th
e nu
mbe
r of t
imes
the
Com
pany
's in
vent
ory
is s
old
and
repl
aced
ove
r a p
erio
d an
d is
use
d by
man
agem
ent a
s a
mea
sure
of a
sset
ut
ilizat
ion.
Inve
ntor
y tu
rns
is c
alcu
late
d as
ann
ualiz
ed c
ost o
f sal
es fo
r the
last
six
mon
ths
divi
ded
by a
vera
ge in
vent
ory,
bas
ed o
n an
ave
rage
of t
he la
st tw
o qu
arte
rs, a
s fo
llow
s:
2017
20
16
2015
20
14
2013
($
mill
ions
, exc
ept a
s no
ted)
D
ec 3
1 S
ep 3
0 Ju
n 30
M
ar 3
1 D
ec 3
1 S
ep 3
0 Ju
n 30
M
ar 3
1 D
ec 3
1 D
ec 3
1 D
ec 3
1 C
ost o
f sal
es –
ann
ualiz
ed
$4,
879
$4,
600
$4,
337
$4,
242
$
4,15
0 $
3,86
2$
4,16
0$
4,56
2
$4,
524
$4,
868
$5,
015
Inv
ento
ry –
two
quar
ter a
vera
ge
$1,
723
$1,
769
$1,
725
$1,
627
$
1,66
3 $
1,70
7$
1,71
4$
1,77
0
$1,
897
$1,
734
$1,
830
Inv
ento
ry tu
rns
(num
ber o
f tim
es)
2.83
2.60
2.51
2.61
2.
49
2.26
2.43
2.58
2.
382.
812.
74
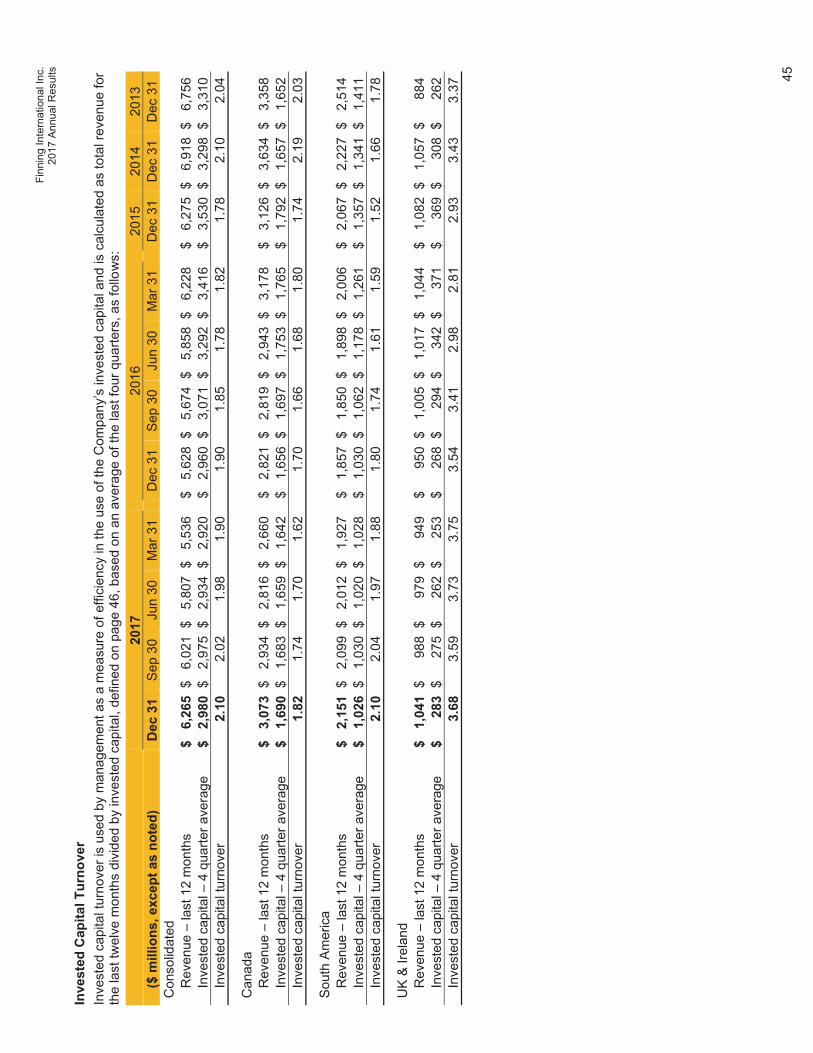
Finn
ing
Inte
rnat
iona
l Inc
. 20
17 A
nnua
l Res
ults
45
Inve
sted
Cap
ital T
urno
ver
Inve
sted
cap
ital t
urno
ver i
s us
ed b
y m
anag
emen
t as
a m
easu
re o
f effi
cien
cy in
the
use
of th
e C
ompa
ny’s
inve
sted
cap
ital a
nd is
cal
cula
ted
as to
tal r
even
ue fo
r th
e la
st tw
elve
mon
ths
divi
ded
by in
vest
ed c
apita
l, de
fined
on
page
46,
bas
ed o
n an
ave
rage
of t
he la
st fo
ur q
uarte
rs, a
s fo
llow
s:
2017
20
16
2015
20
14
2013
($
mill
ions
, exc
ept a
s no
ted)
D
ec 3
1 S
ep 3
0 Ju
n 30
M
ar 3
1 D
ec 3
1 S
ep 3
0 Ju
n 30
M
ar 3
1 D
ec 3
1 D
ec 3
1 D
ec 3
1 C
onso
lidat
ed
R
even
ue –
last
12
mon
ths
$ 6,
265
$6,
021
$5,
807
$5,
536
$
5,62
8$
5,67
4$
5,85
8$
6,22
8
$6,
275
$6,
918
$6,
756
In
vest
ed c
apita
l – 4
qua
rter a
vera
ge
$ 2,
980
$2,
975
$2,
934
$2,
920
$
2,96
0$
3,07
1$
3,29
2$
3,41
6
$3,
530
$3,
298
$3,
310
In
vest
ed c
apita
l tur
nove
r 2.
102.
021.
981.
90
1.90
1.85
1.78
1.82
1.
782.
102.
04
Can
ada
R
even
ue –
last
12
mon
ths
$ 3,
073
$2,
934
$2,
816
$2,
660
$
2,82
1$
2,81
9$
2,94
3$
3,17
8
$3,
126
$3,
634
$3,
358
In
vest
ed c
apita
l – 4
qua
rter a
vera
ge
$ 1,
690
$1,
683
$1,
659
$1,
642
$
1,65
6$
1,69
7$
1,75
3$
1,76
5
$1,
792
$1,
657
$1,
652
In
vest
ed c
apita
l tur
nove
r 1.
821.
741.
701.
62
1.70
1.66
1.68
1.80
1.
742.
192.
03
Sou
th A
mer
ica
R
even
ue –
last
12
mon
ths
$ 2,
151
$2,
099
$2,
012
$1,
927
$
1,85
7$
1,85
0$
1,89
8$
2,00
6
$2,
067
$2,
227
$2,
514
In
vest
ed c
apita
l – 4
qua
rter a
vera
ge
$ 1,
026
$1,
030
$1,
020
$1,
028
$
1,03
0$
1,06
2$
1,17
8$
1,26
1
$1,
357
$1,
341
$1,
411
In
vest
ed c
apita
l tur
nove
r 2.
102.
041.
971.
88
1.80
1.74
1.61
1.59
1.
521.
661.
78
UK
& Ir
elan
d
Rev
enue
– la
st 1
2 m
onth
s $
1,04
1$
988
$97
9$
949
$
950
$ 1,
005
$1,
017
$1,
044
$
1,08
2$
1,05
7$
884
In
vest
ed c
apita
l – 4
qua
rter a
vera
ge
$ 28
3$
275
$26
2$
253
$
268
$ 29
4$
342
$37
1
$36
9$
308
$26
2
Inve
sted
cap
ital t
urno
ver
3.68
3.59
3.73
3.75
3.
543.
412.
982.
81
2.93
3.43
3.37
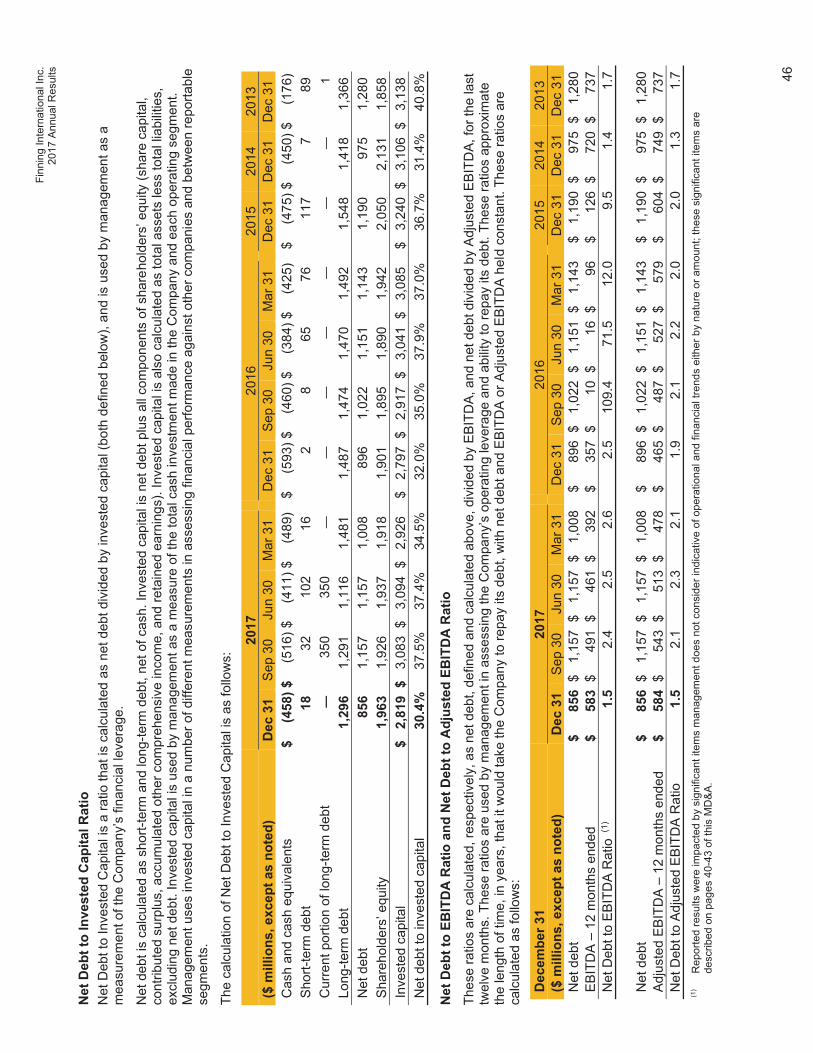
Finn
ing
Inte
rnat
iona
l Inc
. 20
17 A
nnua
l Res
ults
46
Net
Deb
t to
Inve
sted
Cap
ital R
atio
N
et D
ebt t
o In
vest
ed C
apita
l is
a ra
tio th
at is
cal
cula
ted
as n
et d
ebt d
ivid
ed b
y in
vest
ed c
apita
l (bo
th d
efin
ed b
elow
), an
d is
use
d by
man
agem
ent a
s a
mea
sure
men
t of t
he C
ompa
ny’s
fina
ncia
l lev
erag
e.
Net
deb
t is
calc
ulat
ed a
s sh
ort-t
erm
and
long
-term
deb
t, ne
t of c
ash.
Inve
sted
cap
ital i
s ne
t deb
t plu
s al
l com
pone
nts
of s
hare
hold
ers’
equ
ity (s
hare
cap
ital,
cont
ribut
ed s
urpl
us, a
ccum
ulat
ed o
ther
com
preh
ensi
ve in
com
e, a
nd re
tain
ed e
arni
ngs)
. Inv
este
d ca
pita
l is
also
cal
cula
ted
as to
tal a
sset
s le
ss to
tal l
iabi
litie
s,
excl
udin
g ne
t deb
t. In
vest
ed c
apita
l is
used
by
man
agem
ent a
s a
mea
sure
of t
he to
tal c
ash
inve
stm
ent m
ade
in th
e C
ompa
ny a
nd e
ach
oper
atin
g se
gmen
t. M
anag
emen
t use
s in
vest
ed c
apita
l in
a nu
mbe
r of d
iffer
ent m
easu
rem
ents
in a
sses
sing
fina
ncia
l per
form
ance
aga
inst
oth
er c
ompa
nies
and
bet
wee
n re
porta
ble
segm
ents
.
The
calc
ulat
ion
of N
et D
ebt t
o In
vest
ed C
apita
l is
as fo
llow
s: 20
17
2016
20
15
2014
20
13
($ m
illio
ns, e
xcep
t as
note
d)
Dec
31
Sep
30
Jun
30
Mar
31
Dec
31
Sep
30
Jun
30
Mar
31
Dec
31
Dec
31
Dec
31
Cas
h an
d ca
sh e
quiv
alen
ts
$ (4
58)$
(516
)$(4
11)$
(489
) $
(593
) $
(460
)$(3
84)$
(425
) $
(475
)$(4
50)$
(176
) S
hort-
term
deb
t 18
3210
216
2
865
76
117
789
Cur
rent
por
tion
of lo
ng-te
rm d
ebt
—35
035
0—
——
——
——
1 L
ong-
term
deb
t 1,
296
1,29
11,
116
1,48
1
1,48
71,
474
1,47
01,
492
1,
548
1,41
81,
366
Net
deb
t 85
61,
157
1,15
71,
008
89
61,
022
1,15
11,
143
1,
190
975
1,28
0 S
hare
hold
ers’
equ
ity
1,96
31,
926
1,93
71,
918
1,
901
1,89
51,
890
1,94
2
2,05
02,
131
1,85
8 I
nves
ted
capi
tal
$ 2,
819
$3,
083
$3,
094
$2,
926
$
2,79
7$
2,91
7$
3,04
1$
3,08
5
$3,
240
$3,
106
$3,
138
Net
deb
t to
inve
sted
cap
ital
30
.4%
37
.5%
37
.4%
34
.5%
32.0
%
35.0
%
37.9
%
37.0
%36
.7%
31.4
%40
.8%
Net
Deb
t to
EBIT
DA
Rat
io a
nd N
et D
ebt t
o A
djus
ted
EBIT
DA
Rat
io
Thes
e ra
tios
are
calc
ulat
ed, r
espe
ctiv
ely,
as
net d
ebt,
defin
ed a
nd c
alcu
late
d ab
ove,
div
ided
by
EB
ITD
A, a
nd n
et d
ebt d
ivid
ed b
y A
djus
ted
EB
ITD
A, f
or th
e la
st
twel
ve m
onth
s. T
hese
ratio
s ar
e us
ed b
y m
anag
emen
t in
asse
ssin
g th
e C
ompa
ny’s
ope
ratin
g le
vera
ge a
nd a
bilit
y to
repa
y its
deb
t. Th
ese
ratio
s ap
prox
imat
e th
e le
ngth
of t
ime,
in y
ears
, tha
t it w
ould
take
the
Com
pany
to re
pay
its d
ebt,
with
net
deb
t and
EB
ITD
A o
r Adj
uste
d E
BIT
DA
hel
d co
nsta
nt. T
hese
ratio
s ar
e ca
lcul
ated
as
follo
ws:
Dec
embe
r 31
2017
20
16
2015
20
14
2013
($
mill
ions
, exc
ept a
s no
ted)
D
ec 3
1 S
ep 3
0 Ju
n 30
M
ar 3
1 D
ec 3
1 S
ep 3
0 Ju
n 30
M
ar 3
1 D
ec 3
1 D
ec 3
1 D
ec 3
1 N
et d
ebt
$ 85
6$
1,15
7$
1,15
7$
1,00
8
$89
6 $
1,02
2$
1,15
1$
1,14
3
$1,
190
$97
5$
1,28
0 E
BIT
DA
– 1
2 m
onth
s en
ded
$ 58
3$
491
$46
1$
392
$
357
$ 10
$16
$96
$
126
$72
0$
737
Net
Deb
t to
EB
ITD
A R
atio
(1)
1.5
2.4
2.5
2.6
2.
5 10
9.4
71.5
12.0
9.
51.
41.
7
N
et d
ebt
$ 85
6$
1,15
7$
1,15
7$
1,00
8
$89
6 $
1,02
2$
1,15
1$
1,14
3
$1,
190
$97
5$
1,28
0 A
djus
ted
EB
ITD
A –
12
mon
ths
ende
d $
584
$54
3$
513
$47
8
$46
5 $
487
$52
7$
579
$
604
$74
9$
737
Net
Deb
t to
Adj
uste
d E
BIT
DA
Rat
io
1.5
2.1
2.3
2.1
1.
9 2.
12.
22.
0
2.0
1.3
1.7
(1)
Rep
orte
d re
sults
wer
e im
pact
ed b
y si
gnifi
cant
item
s m
anag
emen
t doe
s no
t con
side
r ind
icat
ive
of o
pera
tiona
l and
fina
ncia
l tre
nds
eith
er b
y na
ture
or a
mou
nt; t
hese
sig
nific
ant i
tem
s ar
e de
scrib
ed o
n pa
ges
40-4
3 of
this
MD
&A
.
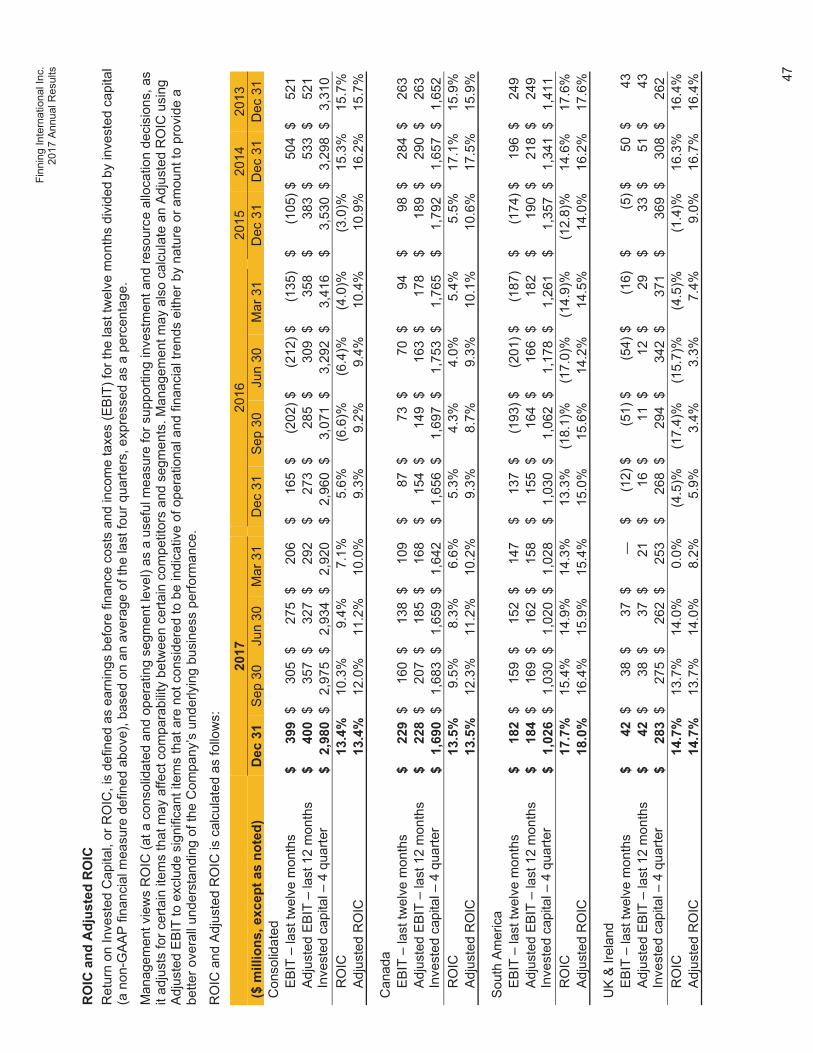
Finn
ing
Inte
rnat
iona
l Inc
. 20
17 A
nnua
l Res
ults
47
RO
IC a
nd A
djus
ted
RO
IC
Ret
urn
on In
vest
ed C
apita
l, or
RO
IC, i
s de
fined
as
earn
ings
bef
ore
finan
ce c
osts
and
inco
me
taxe
s (E
BIT
) for
the
last
twel
ve m
onth
s di
vide
d by
inve
sted
cap
ital
(a n
on-G
AA
P fin
anci
al m
easu
re d
efin
ed a
bove
), ba
sed
on a
n av
erag
e of
the
last
four
qua
rters
, exp
ress
ed a
s a
perc
enta
ge.
Man
agem
ent v
iew
s R
OIC
(at a
con
solid
ated
and
ope
ratin
g se
gmen
t lev
el) a
s a
usef
ul m
easu
re fo
r sup
porti
ng in
vest
men
t and
reso
urce
allo
catio
n de
cisi
ons,
as
it ad
just
s fo
r cer
tain
item
s th
at m
ay a
ffect
com
para
bilit
y be
twee
n ce
rtain
com
petit
ors
and
segm
ents
. Man
agem
ent m
ay a
lso
calc
ulat
e an
Adj
uste
d R
OIC
usi
ng
Adj
uste
d E
BIT
to e
xclu
de s
igni
fican
t ite
ms
that
are
not
con
side
red
to b
e in
dica
tive
of o
pera
tiona
l and
fina
ncia
l tre
nds
eith
er b
y na
ture
or a
mou
nt to
pro
vide
a
bette
r ove
rall
unde
rsta
ndin
g of
the
Com
pany
’s u
nder
lyin
g bu
sine
ss p
erfo
rman
ce.
RO
IC a
nd A
djus
ted
RO
IC is
cal
cula
ted
as fo
llow
s:
2017
20
16
2015
20
14
2013
($
mill
ions
, exc
ept a
s no
ted)
D
ec 3
1 S
ep 3
0 Ju
n 30
M
ar 3
1 D
ec 3
1 S
ep 3
0 Ju
n 30
M
ar 3
1 D
ec 3
1 D
ec 3
1 D
ec 3
1 C
onso
lidat
ed
E
BIT
– la
st tw
elve
mon
ths
$ 39
9$
305
$27
5$
206
$
165
$(2
02) $
(212
)$(1
35)
$(1
05)$
504
$52
1
Adj
uste
d E
BIT
– la
st 1
2 m
onth
s $
400
$35
7$
327
$29
2
$27
3$
285
$30
9$
358
$
383
$53
3$
521
Inve
sted
cap
ital –
4 q
uarte
r $
2,98
0$
2,97
5$
2,93
4$
2,92
0
$2,
960
$3,
071
$3,
292
$3,
416
$
3,53
0$
3,29
8$
3,31
0
RO
IC
13.4
%10
.3%
9.4%
7.1%
5.
6% (6
.6)%
(6
.4)%
(4.0
)%
(3.0
)%15
.3%
15.7
%
Adj
uste
d R
OIC
13
.4%
12.0
%11
.2%
10.0
%
9.3%
9.2%
9.
4%10
.4%
10
.9%
16.2
%15
.7%
Can
ada
E
BIT
– la
st tw
elve
mon
ths
$ 22
9$
160
$13
8$
109
$
87$
73 $
70$
94
$98
$28
4$
263
A
djus
ted
EB
IT –
last
12
mon
ths
$ 22
8$
207
$18
5$
168
$
154
$14
9 $
163
$17
8
$18
9$
290
$26
3In
vest
ed c
apita
l – 4
qua
rter
$ 1,
690
$1,
683
$1,
659
$1,
642
$
1,65
6$
1,69
7 $
1,75
3$
1,76
5
$1,
792
$1,
657
$1,
652
R
OIC
13
.5%
9.5%
8.3%
6.6%
5.
3%4.
3%
4.0%
5.4%
5.
5%17
.1%
15.9
%
Adj
uste
d R
OIC
13
.5%
12.3
%11
.2%
10.2
%
9.3%
8.7%
9.
3%10
.1%
10
.6%
17.5
%15
.9%
Sou
th A
mer
ica
E
BIT
– la
st tw
elve
mon
ths
$ 18
2$
159
$15
2$
147
$
137
$(1
93) $
(201
)$(1
87)
$(1
74)$
196
$24
9
Adj
uste
d E
BIT
– la
st 1
2 m
onth
s $
184
$16
9$
162
$15
8
$15
5$
164
$16
6$
182
$
190
$21
8$
249
Inve
sted
cap
ital –
4 q
uarte
r $
1,02
6$
1,03
0$
1,02
0$
1,02
8
$1,
030
$1,
062
$1,
178
$1,
261
$
1,35
7$
1,34
1$
1,41
1
RO
IC
17.7
%15
.4%
14.9
%14
.3%
13
.3%
(18.
1)%
(1
7.0)
%
(14.
9)%
(12.
8)%
14.6
%17
.6%
A
djus
ted
RO
IC
18.0
%16
.4%
15.9
%15
.4%
15
.0%
15.6
%
14.2
%14
.5%
14
.0%
16.2
%17
.6%
UK
& Ir
elan
d
EB
IT –
last
twel
ve m
onth
s $
42$
38$
37$
—
$(1
2)$
(51)
$(5
4)$
(16)
$
(5)$
50$
43
Adj
uste
d E
BIT
– la
st 1
2 m
onth
s $
42$
38$
37$
21
$16
$11
$12
$29
$
33$
51$
43In
vest
ed c
apita
l – 4
qua
rter
$ 28
3$
275
$26
2$
253
$
268
$29
4 $
342
$37
1
$36
9$
308
$26
2
RO
IC
14.7
%13
.7%
14.0
%0.
0%
(4.5
)%
(17.
4)%
(1
5.7)
%
(4.5
)%
(1
.4)%
16.3
%16
.4%
A
djus
ted
RO
IC
14.7
%13
.7%
14.0
%8.
2%
5.9%
3.4%
3.
3%7.
4%
9.0%
16.7
%16
.4%
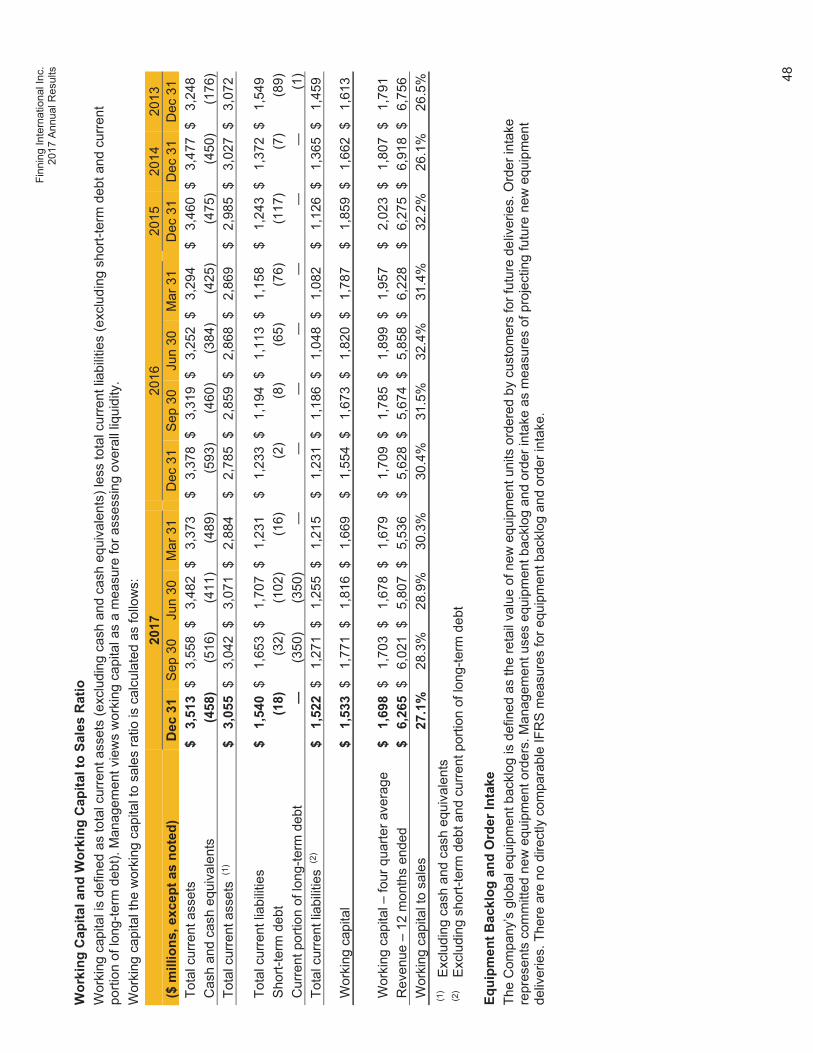
Finn
ing
Inte
rnat
iona
l Inc
. 20
17 A
nnua
l Res
ults
48
Wor
king
Cap
ital a
nd W
orki
ng C
apita
l to
Sale
s R
atio
W
orki
ng c
apita
l is
defin
ed a
s to
tal c
urre
nt a
sset
s (e
xclu
ding
cas
h an
d ca
sh e
quiv
alen
ts) l
ess
tota
l cur
rent
liab
ilitie
s (e
xclu
ding
sho
rt-te
rm d
ebt a
nd c
urre
nt
porti
on o
f lon
g-te
rm d
ebt).
Man
agem
ent v
iew
s w
orki
ng c
apita
l as
a m
easu
re fo
r ass
essi
ng o
vera
ll liq
uidi
ty.
Wor
king
cap
ital t
he w
orki
ng c
apita
l to
sale
s ra
tio is
cal
cula
ted
as fo
llow
s:
2017
20
16
2015
20
14
2013
($
mill
ions
, exc
ept a
s no
ted)
D
ec 3
1 S
ep 3
0 Ju
n 30
M
ar 3
1 D
ec 3
1 S
ep 3
0 Ju
n 30
M
ar 3
1 D
ec 3
1 D
ec 3
1 D
ec 3
1 T
otal
cur
rent
ass
ets
$ 3,
513
$3,
558
$3,
482
$3,
373
$3,
378
$ 3,
319
$3,
252
$3,
294
$3,
460
$3,
477
$3,
248
Cas
h an
d ca
sh e
quiv
alen
ts
(458
)(5
16)
(411
)(4
89)
(593
) (4
60)
(384
)(4
25)
(475
)(4
50)
(176
) T
otal
cur
rent
ass
ets
(1)
$ 3,
055
$3,
042
$3,
071
$2,
884
$2,
785
$ 2,
859
$2,
868
$2,
869
$2,
985
$3,
027
$3,
072
Tot
al c
urre
nt li
abilit
ies
$ 1,
540
$1,
653
$1,
707
$1,
231
$1,
233
$ 1,
194
$1,
113
$1,
158
$1,
243
$1,
372
$1,
549
Sho
rt-te
rm d
ebt
(18)
(32)
(102
)(1
6)(2
) (8
)(6
5)(7
6)(1
17)
(7)
(89)
Cur
rent
por
tion
of lo
ng-te
rm d
ebt
—(3
50)
(350
)—
——
——
——
(1)
Tot
al c
urre
nt li
abilit
ies
(2)
$ 1,
522
$1,
271
$1,
255
$1,
215
$1,
231
$ 1,
186
$1,
048
$1,
082
$1,
126
$1,
365
$1,
459
Wor
king
cap
ital
$ 1,
533
$1,
771
$1,
816
$1,
669
$1,
554
$ 1,
673
$1,
820
$1,
787
$1,
859
$1,
662
$1,
613
Wor
king
cap
ital –
four
qua
rter a
vera
ge
$ 1,
698
$1,
703
$1,
678
$1,
679
$
1,70
9$
1,78
5$
1,89
9$
1,95
7
$2,
023
$1,
807
$1,
791
Rev
enue
– 1
2 m
onth
s en
ded
$ 6,
265
$6,
021
$5,
807
$5,
536
$
5,62
8$
5,67
4$
5,85
8$
6,22
8
$6,
275
$6,
918
$6,
756
Wor
king
cap
ital t
o sa
les
27.1
%28
.3%
28.9
%30
.3%
30.4
%
31.5
%32
.4%
31.4
%32
.2%
26.1
%26
.5%
(1)
Exc
ludi
ng c
ash
and
cash
equ
ival
ents
(2
) E
xclu
ding
sho
rt-te
rm d
ebt a
nd c
urre
nt p
ortio
n of
long
-term
deb
t
Equi
pmen
t Bac
klog
and
Ord
er In
take
Th
e C
ompa
ny’s
glo
bal e
quip
men
t bac
klog
is d
efin
ed a
s th
e re
tail
valu
e of
new
equ
ipm
ent u
nits
ord
ered
by
cust
omer
s fo
r fut
ure
deliv
erie
s. O
rder
inta
ke
repr
esen
ts c
omm
itted
new
equ
ipm
ent o
rder
s. M
anag
emen
t use
s eq
uipm
ent b
ackl
og a
nd o
rder
inta
ke a
s m
easu
res
of p
roje
ctin
g fu
ture
new
equ
ipm
ent
deliv
erie
s. T
here
are
no
dire
ctly
com
para
ble
IFR
S m
easu
res
for e
quip
men
t bac
klog
and
ord
er in
take
.

Finning International Inc. 2017 Annual Results
49
Selected Annual Information
($ millions, except for share and option data) 2017 2016 2015 Total revenue from external sources $ 6,265 $ 5,628 $ 6,275Net income (loss) (1) $ 221 $ 65 $ (161)Earnings Per Share (1) (2)
Basic EPS $ 1.31 $ 0.38 $ (0.94) Diluted EPS $ 1.31 $ 0.38 $ (0.94)
Total assets (1) $ 5,092 $ 4,910 $ 5,108Long-term debt
Non-current 1,296 1,487 1,548Total long-term debt (3) $ 1,296 $ 1,487 $ 1,548Cash dividends declared per common share $ 0.745 $ 0.730 $ 0.725
1) In July 2015, the Company’s Canadian operations acquired the operating assets of the Saskatchewan dealership and became the approved Caterpillar dealer in Saskatchewan. The results of operations and financial position of this acquired business have been included in the figures above since the date of acquisition.
2) Results in 2017, 2016, and 2015 were impacted by the following items:
($ millions except per share amounts) 2017 2016 2015
Impact from Alberta wildfires - insurance proceeds $ (4) $ — $ — - unavoidable costs — 11 — Severance costs 5 41 48 Facility closures and restructuring costs — 36 53 Power system project provisions, estimated loss on disputes and — 20 — alleged fraudulent activity by a customer Gain on investment — (5) — Acquisition and disposal of businesses, net — 5 (5)Distribution network and goodwill impairment — — 338Inventory and other asset impairments — — 42 Foreign exchange impact on ARS devaluation — — 12 Impact of significant items (a) on EBIT: $ 1 $ 108 $ 488 Impact of above significant items on EPS: $ 0.01 $ 0.50 $ 2.21 Items impacting net income only (below EBIT) - impact on EPS: Redemption costs on early repayment of long-term debt ($7 million after tax) $ 0.04 $ — $ — Tax impact on devaluation of ARS ($12 million) — — 0.07 Capital loss utilized / tax rate change ($8 million) — — (0.05)Impact of significant items on EPS: $ 0.05 $ 0.50 $ 2.23
(a) Of the significant items described above, $10 million was recorded in depreciation and amortization expense in Q4 2015.
3) In 2017, the Company issued $200 million of 2.84% senior unsecured Notes due September 29, 2021. Proceeds from the issuance of the Notes were used to redeem, prior to maturity, all of the outstanding $350 million, 6.02% Medium Term Notes due June 1, 2018.
In 2017, the Company completed a two-year extension to its $1.0 billion syndicated committed credit facility, extending the maturity date to October 2022.
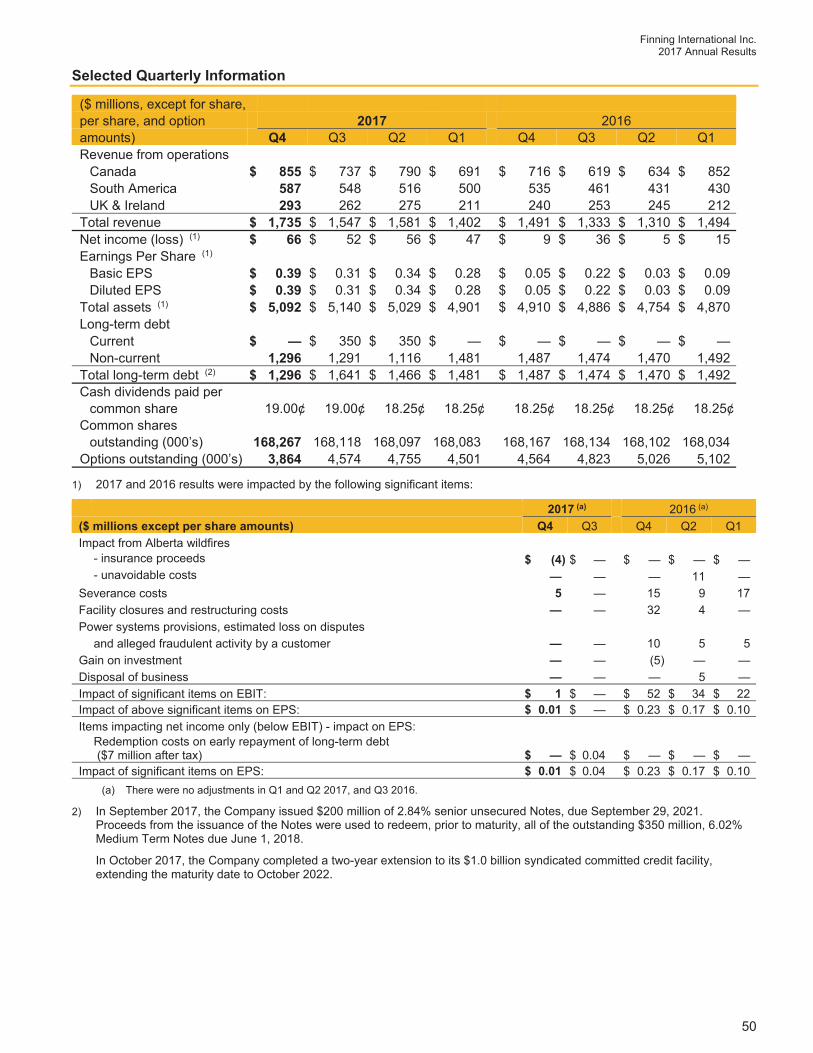
Finning International Inc. 2017 Annual Results
50
Selected Quarterly Information
($ millions, except for share, per share, and option 2017 2016 amounts) Q4 Q3 Q2 Q1 Q4 Q3 Q2 Q1
Revenue from operations Canada $ 855 $ 737 $ 790 $ 691 $ 716 $ 619 $ 634 $ 852 South America 587 548 516 500 535 461 431 430 UK & Ireland 293 262 275 211 240 253 245 212 Total revenue $ 1,735 $ 1,547 $ 1,581 $ 1,402 $ 1,491 $ 1,333 $ 1,310 $ 1,494 Net income (loss) (1) $ 66 $ 52 $ 56 $ 47 $ 9 $ 36 $ 5 $ 15 Earnings Per Share (1)
Basic EPS $ 0.39 $ 0.31 $ 0.34 $ 0.28 $ 0.05 $ 0.22 $ 0.03 $ 0.09 Diluted EPS $ 0.39 $ 0.31 $ 0.34 $ 0.28 $ 0.05 $ 0.22 $ 0.03 $ 0.09 Total assets (1) $ 5,092 $ 5,140 $ 5,029 $ 4,901 $ 4,910 $ 4,886 $ 4,754 $ 4,870 Long-term debt Current $ — $ 350 $ 350 $ — $ — $ — $ — $ — Non-current 1,296 1,291 1,116 1,481 1,487 1,474 1,470 1,492 Total long-term debt (2) $ 1,296 $ 1,641 $ 1,466 $ 1,481 $ 1,487 $ 1,474 $ 1,470 $ 1,492 Cash dividends paid per common share 19.00¢ 19.00¢ 18.25¢ 18.25¢ 18.25¢ 18.25¢ 18.25¢ 18.25¢ Common shares outstanding (000’s) 168,267 168,118 168,097 168,083 168,167 168,134 168,102 168,034 Options outstanding (000’s) 3,864 4,574 4,755 4,501 4,564 4,823 5,026 5,102
1) 2017 and 2016 results were impacted by the following significant items:
2017 (a) 2016 (a)
($ millions except per share amounts) Q4 Q3 Q4 Q2 Q1 Impact from Alberta wildfires
- insurance proceeds $ (4) $ — $ — $ — $ —- unavoidable costs — — — 11 —
Severance costs 5 — 15 9 17 Facility closures and restructuring costs — — 32 4 — Power systems provisions, estimated loss on disputes and alleged fraudulent activity by a customer — — 10 5 5 Gain on investment — — (5) — — Disposal of business — — — 5 — Impact of significant items on EBIT: $ 1 $ — $ 52 $ 34 $ 22 Impact of above significant items on EPS: $ 0.01 $ — $ 0.23 $ 0.17 $ 0.10 Items impacting net income only (below EBIT) - impact on EPS:
Redemption costs on early repayment of long-term debt ($7 million after tax) $ — $ 0.04 $ — $ — $ —
Impact of significant items on EPS: $ 0.01 $ 0.04 $ 0.23 $ 0.17 $ 0.10(a) There were no adjustments in Q1 and Q2 2017, and Q3 2016.
2) In September 2017, the Company issued $200 million of 2.84% senior unsecured Notes, due September 29, 2021. Proceeds from the issuance of the Notes were used to redeem, prior to maturity, all of the outstanding $350 million, 6.02% Medium Term Notes due June 1, 2018.
In October 2017, the Company completed a two-year extension to its $1.0 billion syndicated committed credit facility, extending the maturity date to October 2022.
Finning International Inc. 2017 Annual Results
51
Forward-Looking Disclaimer
This report contains statements about the Company’s business outlook, objectives, plans, strategic priorities and other statements that are not historical facts. A statement Finning makes is forward-looking when it uses what the Company knows and expects today to make a statement about the future. Forward-looking statements may include terminology such as aim, anticipate, assumption, believe, could, expect, goal, guidance, intend, may, objective, outlook, plan, project, seek, should, strategy, strive, target, and will, and variations of such terminology. Forward-looking statements in this reportinclude, but are not limited to, statements with respect to: expectations with respect to the economy, markets and activities and the associated impact on the Company’s financial results; in Canada, activity levels from mining producers and contractors, demand for mining, oil sands, construction and pipeline equipment, parts and services, demand for power systems products, expected deliveries of new equipment, competitive market conditions, upcoming infrastructure projects, and activity in the oil and gas sector; in South America, expected demand for mining equipment and product support as a result of copper production levels and fleet utilization, expectations of increased investment in infrastructure by the new Chilean government and resultant activity in the construction sector, expectations regarding the Argentina government’s continuing level of public investment in infrastructure and the acceleration of oil and gas development in Argentina, and Finning’s continued investment in a new ERP system expected to go live in 2018 and the impact on EBIT margin; in the UK & Ireland, demand for new equipment and product support, demand in the power systems sector, the impact of Brexit and competitive pricing pressure; expected impact of and volatility in foreign exchange markets; expected revenue and free cash flow; expected profitability levels; expected capital expenditures and expected net rental additions for 2018; Finning’s belief that it continues to have sufficient liquidity to meet operational needs and planned growth and development; expected range of the Company’s effective tax rate; the Company’s focus on generating earnings leverage while investing in growth opportunities and long-term strategic initiatives; expected progress on optimizing the global supply chain and its expected results; expected results from cost reductions and sustainability improvements; the Company’s commitment to grow return on invested capital; expected results from execution of the Company's strategy framework; the Company’s priorities including growing product support from its large installed equipment population, and improving the financial performance of its rental business; timing and delivery of innovative customer solutions; planned activities and anticipated results of Finning Digital; payments on contractual obligations over the next five years; Finning’s contributions to its registered defined benefit pension plans; the expected impact of recently adopted amendments to accounting standards or future expected changes; Finning’s plans to manage its financial risks and uncertainties; Finning’s opinion that certain potential legal, customs, and tax liabilities would not have a material effect on its financial position orresults of operation; and Finning’s belief that the claims from the Argentina Customs Authority are without merit. All such forward-looking statements are made pursuant to the ‘safe harbour’ provisions of applicable Canadian securities laws.
Unless otherwise indicated by us, forward-looking statements in this report reflect Finning’s expectations at the date in this MD&A. Except as may be required by Canadian securities laws, Finning does not undertake any obligation to update or revise any forward-looking statement, whether as a result of new information, future events, or otherwise. Forward-looking statements, by their very nature, are subject to numerous risks and uncertainties and are based on several assumptions which give rise to the possibility that actual results could differ materially from the expectations expressed in or implied by such forward-looking statements and that Finning’s business outlook, objectives, plans, strategic priorities and other statements that are not historical facts may not be achieved. As a result, Finning cannot guarantee that any forward-looking statement will materialize. Factors that could cause actual results or events to differ materially from those expressed in or implied by these forward-looking statements include: general economic and market conditions; foreign exchange rates; commodity prices; the level of customer confidence and spending, and the demand for, and prices of, Finning’s products and services; Finning’s ability to maintain its relationship with Caterpillar; Finning’sdependence on the continued market acceptance of its products, including Caterpillar products, and the timely supply of parts and equipment; Finning’s ability to continue to improve productivity and operational efficiencies while continuing to maintain customer service; Finning’s ability to manage cost pressures as growth in revenue occurs; Finning’s ability to negotiate satisfactory purchase or investment terms and prices, obtain necessary approvals, and secure financing on attractive terms or at all; Finning’s ability to manage its growth strategy effectively; Finning’s ability to effectively price and manage long-term product support contracts with its customers; Finning’s ability to reduce costs in response to slowing activity levels; Finning’s ability to attract sufficient skilled labour resources as market conditions, business strategy or technologies change; Finning’s ability to negotiate and renew collective bargaining agreements with satisfactory terms for Finning’s employees and the Company; the intensity of competitive activity; Finning’s ability to raise the capital needed to implement its business plan; regulatory initiatives or proceedings, litigation and changes in laws or regulations; stock market volatility; changes in political and economic environments for operations; the occurrence of one or more natural disasters, pandemic outbreaks, geo-political events, acts of terrorism or similar disruptions; fluctuations in defined benefit pension plan contributions and related pension expenses; the availability of insurance at commercially reasonable rates or that the amount of insurance coverage will be adequate to cover all liability or loss incurred by Finning; the potential of warranty claims being greater than Finning anticipates; the integrity, reliability and availability of, and benefits from information technology and the data processed by that technology; and Finning’s ability to protect itself from cybersecurity threats or incidents. Forward-looking statements are provided in this report for the purpose of giving information about management’s current expectations and plans and allowing investors and others to get a better understanding of Finning’s operating environment. However, readers are cautioned that it may not be appropriate to use such forward-looking statements for any other purpose.
Finning International Inc. 2017 Annual Results
52
Forward-looking statements made in this report are based on a number of assumptions that Finning believed were reasonable on the day the Company made the forward-looking statements including but not limited to (i) that general economic and market conditions will be maintained; (ii) that the level of customer confidence and spending, and the demand for, and prices of, Finning’s products and services will be maintained; (iii) Finning’s ability to successfully execute its plans and intentions; (vi) Finning’s ability to attract and retain skilled staff; (iv) market competition; (v) the products and technology offered by the Company’s competitors; and (vi) that our current good relationships with Caterpillar, our suppliers, service providers and other third parties will be maintained. Refer in particular to the Outlook section of this MD&A for forward-looking statements. Some of the assumptions, risks, and other factors which could cause results to differ materially from those expressed in the forward-looking statements contained in this report are discussed in Section 4 of the Company’s current AIF and in the annual MD&A for the financial risks.
Finning cautions readers that the risks described in the MD&A and the AIF are not the only ones that could impact the Company. Additional risks and uncertainties not currently known to the Company or that are currently deemed to be immaterial may also have a material adverse effect on Finning’s business, financial condition, or results of operations.
Finning International Inc. 2017 Annual Results
1
MANAGEMENT'S REPORT TO THE SHAREHOLDERS
The accompanying Consolidated Financial Statements and Management’s Discussion and Analysis (MD&A) are the responsibility of the management of Finning International Inc. (the Company). The Consolidated Financial Statements have been prepared in accordance with International Financial Reporting Standards which recognize the necessity of relying on management's best estimates and informed judgments. The financial information presented in the Company’s MD&A is consistent with that in the Consolidated Financial Statements. The Consolidated Financial Statements and MD&A have, in management's opinion, been properly prepared within reasonable limits of materiality.
The Company maintains an accounting system and related controls to provide management with reasonable assurance that transactions are executed and recorded in accordance with its authorizations, that assets are properly safeguarded and accounted for, and that financial records are reliable for preparation of financial statements.
The Company's independent auditors, Deloitte LLP, have audited the Consolidated Financial Statements, as reflected in their report for 2017.
The Board of Directors oversees management’s responsibilities for the Consolidated Financial Statements primarily through the activities of its Audit Committee. The Audit Committee of the Board of Directors is composed solely of directors who are neither officers nor employees of the Company. The Audit Committee meets regularly during the year with management of the Company and the Company’s independent auditors to review the Company’s interim and annual consolidated financial statements and MD&A. The Audit Committee also reviews internal accounting controls, risk management, internal and external audit results and accounting principles and practices. The Audit Committee is responsible for approving the remuneration and terms of engagement of the Company’s independent auditors. The Audit Committee also meets with the independent auditors, without management present, to discuss the results of their audit and the quality of financial reporting. On a quarterly basis, the Audit Committee reports its findings to the Board of Directors, and recommends approval of the interim and annual Consolidated Financial Statements.
/s/ L. Scott Thomson /s/ Steven M. Nielsen
L. Scott Thomson Steven M. Nielsen President and Chief Executive Officer Executive Vice President and Chief Financial Officer February 5, 2018 1000-666 Burrard Street, Vancouver, BC, V6C 2X8, Canada
Finning International Inc. 2017 Annual Results
2
INDEPENDENT AUDITOR’S REPORT
To the Shareholders of Finning International Inc. We have audited the accompanying consolidated financial statements of Finning International Inc., which comprise the consolidated statements of financial position as at December 31, 2017 and December 31, 2016, and the consolidated statements of net income, comprehensive income (loss), shareholders’ equity and cash flow for the years then ended and a summary of significant accounting policies and other explanatory information.
Management's Responsibility for the Consolidated Financial Statements Management is responsible for the preparation and fair presentation of these consolidated financial statements in accordance with International Financial Reporting Standards, and for such internal control as management determines is necessary to enable the preparation of consolidated financial statements that are free from material misstatement, whether due to fraud or error.
Auditor's Responsibility Our responsibility is to express an opinion on these consolidated financial statements based on our audits. We conducted our audits in accordance with Canadian generally accepted auditing standards. Those standards require that we comply with ethical requirements and plan and perform the audit to obtain reasonable assurance about whether the consolidated financial statements are free from material misstatement.
An audit involves performing procedures to obtain audit evidence about the amounts and disclosures in the consolidated financial statements. The procedures selected depend on the auditor's judgment, including the assessment of the risks of material misstatement of the consolidated financial statements, whether due to fraud or error. In making those risk assessments, the auditor considers internal control relevant to the entity's preparation and fair presentation of the consolidated financial statements in order to design audit procedures that are appropriate in the circumstances, but not for the purpose of expressing an opinion on the effectiveness of the entity's internal control. An audit also includes evaluating the appropriateness of accounting policies used and the reasonableness of accounting estimates made by management, as well as evaluating the overall presentation of the consolidated financial statements.
We believe that the audit evidence we have obtained in our audits is sufficient and appropriate to provide a basis for our audit opinion.
OpinionIn our opinion, the consolidated financial statements present fairly, in all material respects, the financial position of Finning International Inc. as at December 31, 2017 and December 31, 2016, and its financial performance and its cash flows for the years then ended in accordance with International Financial Reporting Standards.
/s/ Deloitte LLP Chartered Professional Accountants February 5, 2018 Vancouver, British Columbia
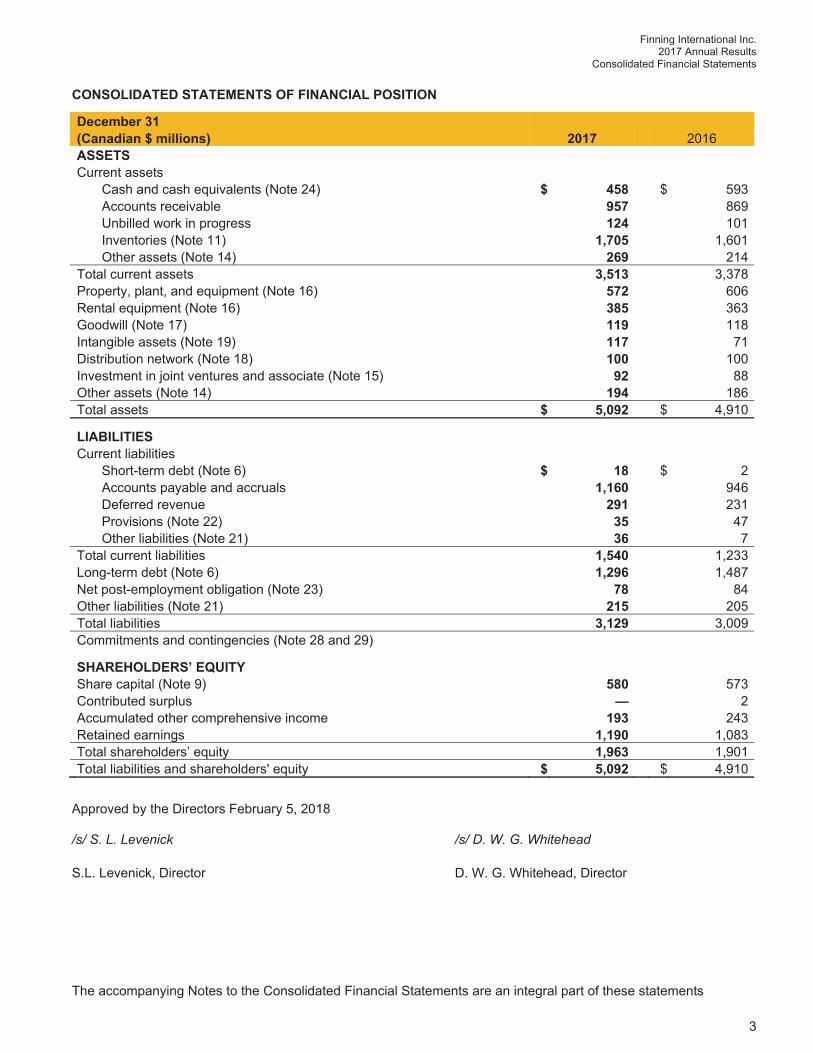
Finning International Inc. 2017 Annual Results
Consolidated Financial Statements
The accompanying Notes to the Consolidated Financial Statements are an integral part of these statements
3
CONSOLIDATED STATEMENTS OF FINANCIAL POSITION
December 31 (Canadian $ millions) 2017 2016 ASSETS Current assets Cash and cash equivalents (Note 24) $ 458 $ 593 Accounts receivable 957 869 Unbilled work in progress 124 101 Inventories (Note 11) 1,705 1,601 Other assets (Note 14) 269 214 Total current assets 3,513 3,378 Property, plant, and equipment (Note 16) 572 606 Rental equipment (Note 16) 385 363 Goodwill (Note 17) 119 118 Intangible assets (Note 19) 117 71 Distribution network (Note 18) 100 100 Investment in joint ventures and associate (Note 15) 92 88 Other assets (Note 14) 194 186 Total assets $ 5,092 $ 4,910
LIABILITIES Current liabilities Short-term debt (Note 6) $ 18 $ 2 Accounts payable and accruals 1,160 946 Deferred revenue 291 231 Provisions (Note 22) 35 47 Other liabilities (Note 21) 36 7 Total current liabilities 1,540 1,233 Long-term debt (Note 6) 1,296 1,487 Net post-employment obligation (Note 23) 78 84 Other liabilities (Note 21) 215 205 Total liabilities 3,129 3,009 Commitments and contingencies (Note 28 and 29)
SHAREHOLDERS’ EQUITY Share capital (Note 9) 580 573 Contributed surplus — 2 Accumulated other comprehensive income 193 243 Retained earnings 1,190 1,083 Total shareholders’ equity 1,963 1,901 Total liabilities and shareholders' equity $ 5,092 $ 4,910
Approved by the Directors February 5, 2018
/s/ S. L. Levenick /s/ D. W. G. Whitehead
S.L. Levenick, Director D. W. G. Whitehead, Director
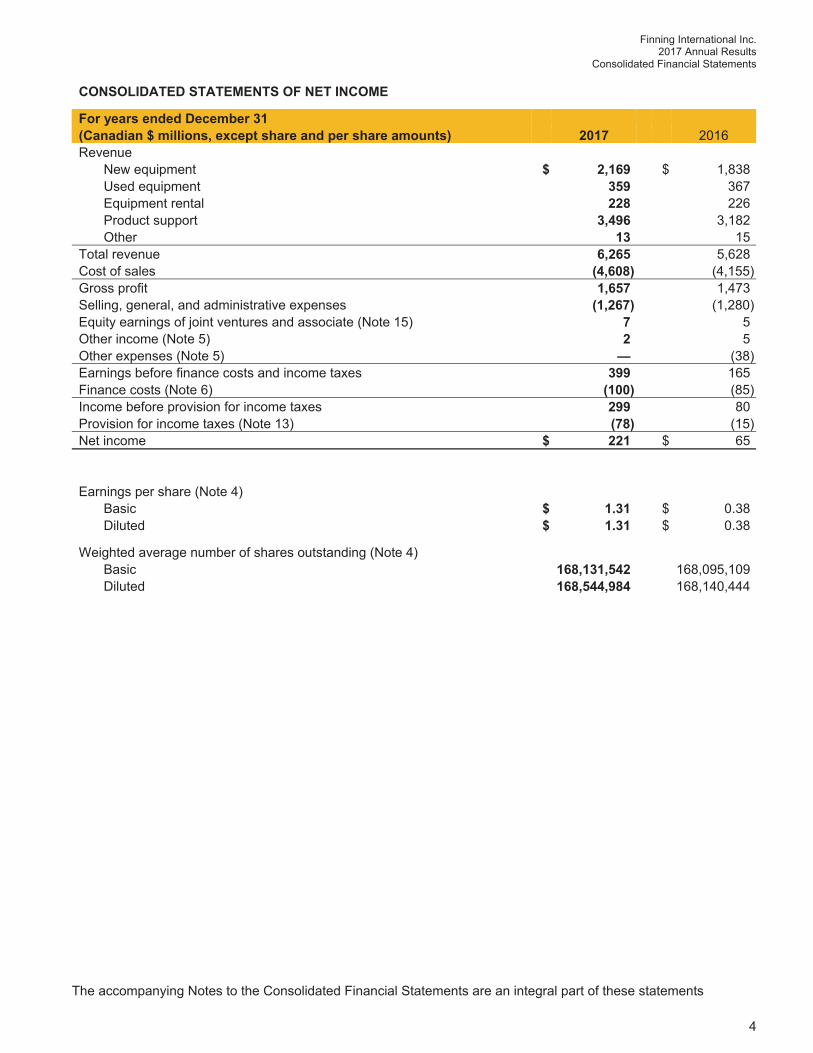
Finning International Inc. 2017 Annual Results
Consolidated Financial Statements
The accompanying Notes to the Consolidated Financial Statements are an integral part of these statements
4
CONSOLIDATED STATEMENTS OF NET INCOME
For years ended December 31 (Canadian $ millions, except share and per share amounts) 2017 2016
Revenue New equipment $ 2,169 $ 1,838 Used equipment 359 367 Equipment rental 228 226 Product support 3,496 3,182 Other 13 15 Total revenue 6,265 5,628 Cost of sales (4,608) (4,155) Gross profit 1,657 1,473 Selling, general, and administrative expenses (1,267) (1,280) Equity earnings of joint ventures and associate (Note 15) 7 5 Other income (Note 5) 2 5 Other expenses (Note 5) — (38) Earnings before finance costs and income taxes 399 165 Finance costs (Note 6) (100) (85) Income before provision for income taxes 299 80 Provision for income taxes (Note 13) (78) (15) Net income $ 221 $ 65 Earnings per share (Note 4) Basic $ 1.31 $ 0.38 Diluted $ 1.31 $ 0.38
Weighted average number of shares outstanding (Note 4) Basic 168,131,542 168,095,109 Diluted 168,544,984 168,140,444
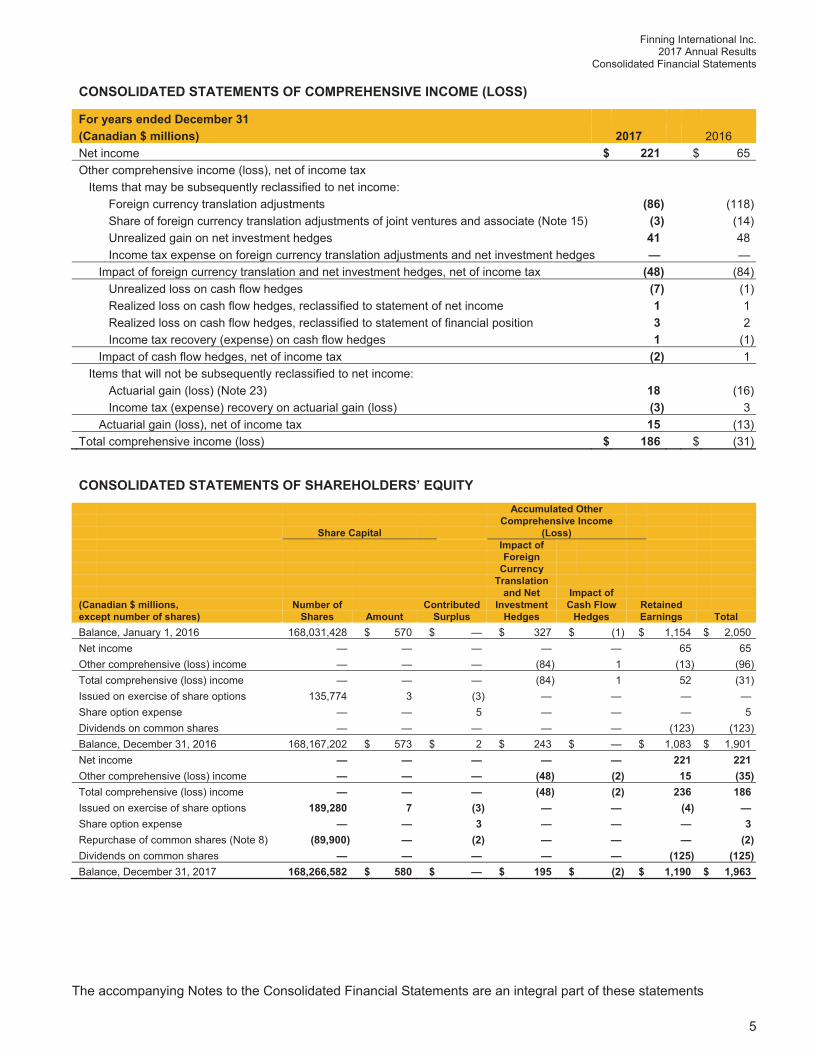
Finning International Inc. 2017 Annual Results
Consolidated Financial Statements
The accompanying Notes to the Consolidated Financial Statements are an integral part of these statements
5
CONSOLIDATED STATEMENTS OF COMPREHENSIVE INCOME (LOSS)
For years ended December 31 (Canadian $ millions) 2017 2016
Net income $ 221 $ 65 Other comprehensive income (loss), net of income tax Items that may be subsequently reclassified to net income: Foreign currency translation adjustments (86) (118) Share of foreign currency translation adjustments of joint ventures and associate (Note 15) (3) (14) Unrealized gain on net investment hedges 41 48 Income tax expense on foreign currency translation adjustments and net investment hedges — — Impact of foreign currency translation and net investment hedges, net of income tax (48) (84) Unrealized loss on cash flow hedges (7) (1) Realized loss on cash flow hedges, reclassified to statement of net income 1 1 Realized loss on cash flow hedges, reclassified to statement of financial position 3 2 Income tax recovery (expense) on cash flow hedges 1 (1) Impact of cash flow hedges, net of income tax (2) 1 Items that will not be subsequently reclassified to net income: Actuarial gain (loss) (Note 23) 18 (16) Income tax (expense) recovery on actuarial gain (loss) (3) 3 Actuarial gain (loss), net of income tax 15 (13) Total comprehensive income (loss) $ 186 $ (31)
CONSOLIDATED STATEMENTS OF SHAREHOLDERS’ EQUITY Accumulated Other
Comprehensive IncomeShare Capital (Loss)
Impact ofForeign
CurrencyTranslation
and Net Impact of(Canadian $ millions, Number of Contributed Investment Cash Flow Retainedexcept number of shares) Shares Amount Surplus Hedges Hedges Earnings Total
Balance, January 1, 2016 168,031,428 $ 570 $ — $ 327 $ (1) $ 1,154 $ 2,050 Net income — — — — — 65 65 Other comprehensive (loss) income — — — (84) 1 (13) (96) Total comprehensive (loss) income — — — (84) 1 52 (31) Issued on exercise of share options 135,774 3 (3) — — — — Share option expense — — 5 — — — 5 Dividends on common shares — — — — — (123) (123) Balance, December 31, 2016 168,167,202 $ 573 $ 2 $ 243 $ — $ 1,083 $ 1,901 Net income — — — — — 221 221 Other comprehensive (loss) income — — — (48) (2) 15 (35) Total comprehensive (loss) income — — — (48) (2) 236 186 Issued on exercise of share options 189,280 7 (3) — — (4) — Share option expense — — 3 — — — 3 Repurchase of common shares (Note 8) (89,900) — (2) — — — (2) Dividends on common shares — — — — — (125) (125) Balance, December 31, 2017 168,266,582 $ 580 $ — $ 195 $ (2) $ 1,190 $ 1,963
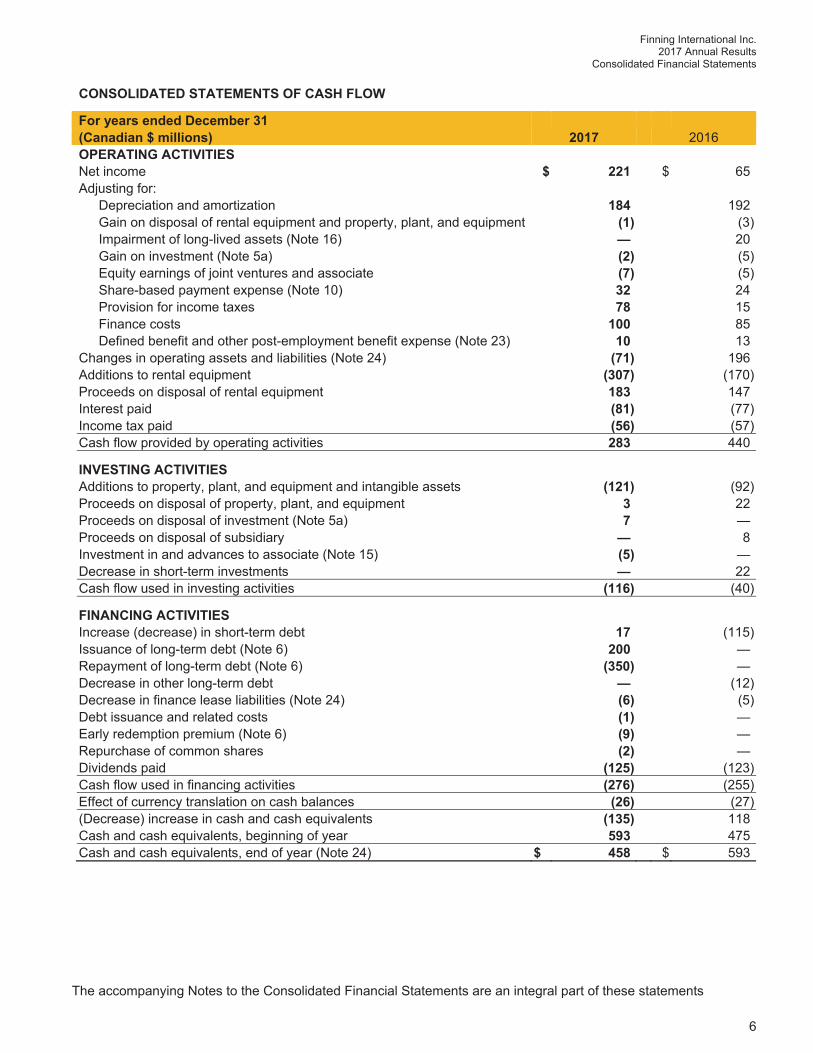
Finning International Inc. 2017 Annual Results
Consolidated Financial Statements
The accompanying Notes to the Consolidated Financial Statements are an integral part of these statements
6
CONSOLIDATED STATEMENTS OF CASH FLOW
For years ended December 31 (Canadian $ millions) 2017 2016
OPERATING ACTIVITIES Net income $ 221 $ 65 Adjusting for: Depreciation and amortization 184 192 Gain on disposal of rental equipment and property, plant, and equipment (1) (3) Impairment of long-lived assets (Note 16) — 20 Gain on investment (Note 5a) (2) (5) Equity earnings of joint ventures and associate (7) (5) Share-based payment expense (Note 10) 32 24 Provision for income taxes 78 15 Finance costs 100 85 Defined benefit and other post-employment benefit expense (Note 23) 10 13 Changes in operating assets and liabilities (Note 24) (71) 196 Additions to rental equipment (307) (170) Proceeds on disposal of rental equipment 183 147 Interest paid (81) (77) Income tax paid (56) (57) Cash flow provided by operating activities 283 440
INVESTING ACTIVITIES Additions to property, plant, and equipment and intangible assets (121) (92) Proceeds on disposal of property, plant, and equipment 3 22 Proceeds on disposal of investment (Note 5a) 7 — Proceeds on disposal of subsidiary — 8 Investment in and advances to associate (Note 15) (5) — Decrease in short-term investments — 22 Cash flow used in investing activities (116) (40)
FINANCING ACTIVITIES Increase (decrease) in short-term debt 17 (115) Issuance of long-term debt (Note 6) 200 — Repayment of long-term debt (Note 6) (350) — Decrease in other long-term debt — (12) Decrease in finance lease liabilities (Note 24) (6) (5) Debt issuance and related costs (1) — Early redemption premium (Note 6) (9) — Repurchase of common shares (2) — Dividends paid (125) (123) Cash flow used in financing activities (276) (255) Effect of currency translation on cash balances (26) (27) (Decrease) increase in cash and cash equivalents (135) 118 Cash and cash equivalents, beginning of year 593 475 Cash and cash equivalents, end of year (Note 24) $ 458 $ 593
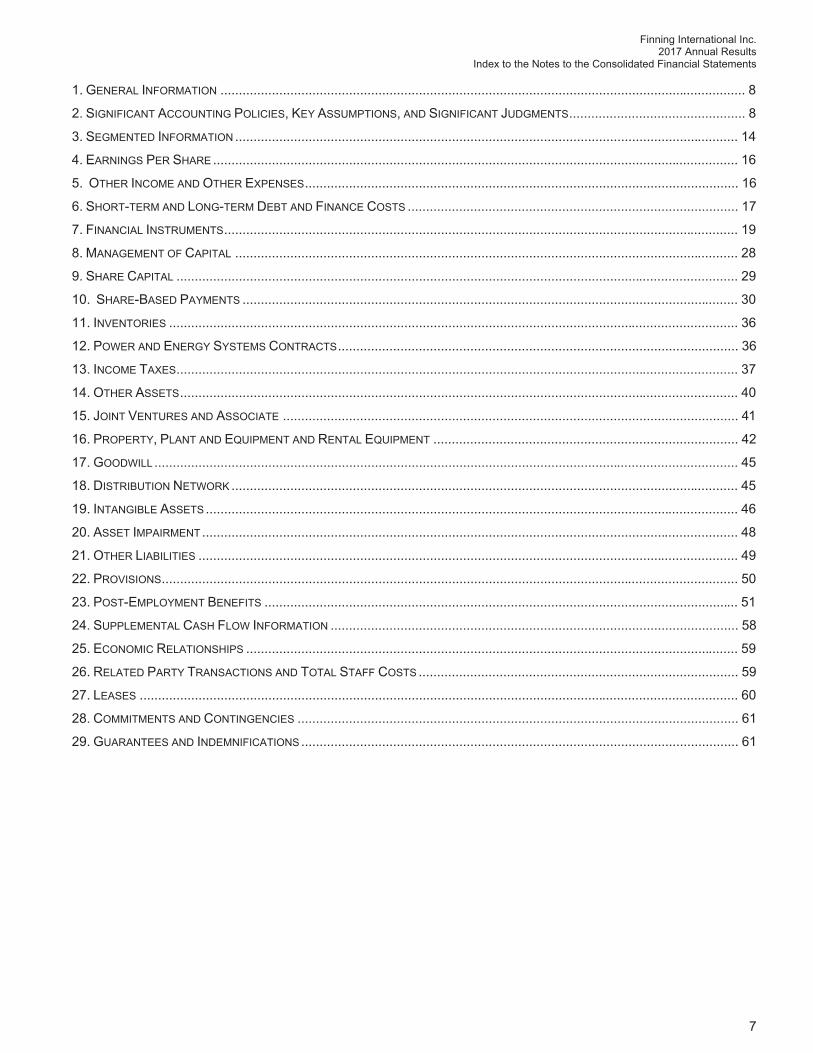
Finning International Inc. 2017 Annual Results
Index to the Notes to the Consolidated Financial Statements
7
1. GENERAL INFORMATION ............................................................................................................................................... 8 2. SIGNIFICANT ACCOUNTING POLICIES, KEY ASSUMPTIONS, AND SIGNIFICANT JUDGMENTS ................................................ 8 3. SEGMENTED INFORMATION ......................................................................................................................................... 14 4. EARNINGS PER SHARE ............................................................................................................................................... 16 5. OTHER INCOME AND OTHER EXPENSES ...................................................................................................................... 16 6. SHORT-TERM AND LONG-TERM DEBT AND FINANCE COSTS .......................................................................................... 17 7. FINANCIAL INSTRUMENTS ............................................................................................................................................ 19 8. MANAGEMENT OF CAPITAL ......................................................................................................................................... 28 9. SHARE CAPITAL ......................................................................................................................................................... 29 10. SHARE-BASED PAYMENTS ....................................................................................................................................... 30 11. INVENTORIES ........................................................................................................................................................... 36 12. POWER AND ENERGY SYSTEMS CONTRACTS ............................................................................................................. 36 13. INCOME TAXES ......................................................................................................................................................... 37 14. OTHER ASSETS ........................................................................................................................................................ 40 15. JOINT VENTURES AND ASSOCIATE ............................................................................................................................ 41 16. PROPERTY, PLANT AND EQUIPMENT AND RENTAL EQUIPMENT ................................................................................... 42 17. GOODWILL ............................................................................................................................................................... 45 18. DISTRIBUTION NETWORK .......................................................................................................................................... 45 19. INTANGIBLE ASSETS ................................................................................................................................................. 46 20. ASSET IMPAIRMENT .................................................................................................................................................. 48 21. OTHER LIABILITIES ................................................................................................................................................... 49 22. PROVISIONS ............................................................................................................................................................. 50 23. POST-EMPLOYMENT BENEFITS ................................................................................................................................. 51
24. SUPPLEMENTAL CASH FLOW INFORMATION ............................................................................................................... 58 25. ECONOMIC RELATIONSHIPS ...................................................................................................................................... 59 26. RELATED PARTY TRANSACTIONS AND TOTAL STAFF COSTS ....................................................................................... 59 27. LEASES ................................................................................................................................................................... 60 28. COMMITMENTS AND CONTINGENCIES ........................................................................................................................ 61 29. GUARANTEES AND INDEMNIFICATIONS ....................................................................................................................... 61
Finning International Inc. 2017 Annual Results
Notes to the Consolidated Financial Statements
8
1. GENERAL INFORMATION
Finning International Inc. (“Finning”) is a widely held, publicly traded corporation, listed on the Toronto Stock Exchange (TSX: FTT). The registered and head office of the Company is located at Suite 1000, Park Place, 666 Burrard Street, Vancouver, British Columbia, Canada. The Company’s principal business is the sale of heavy equipment and power and energy systems, rental of equipment, and providing product support including sales of parts and servicing of equipment.
2. SIGNIFICANT ACCOUNTING POLICIES, KEY ASSUMPTIONS, AND SIGNIFICANT JUDGMENTS
These consolidated financial statements of Finning and its subsidiaries (together, the “Company”) have been prepared in accordance with International Financial Reporting Standards (IFRS) issued and effective as of February 5, 2018, the date these consolidated financial statements were authorized for issuance by the Company’s Board of Directors. The Company has applied the same accounting policies consistently to all periods presented unless otherwise noted.
The preparation of financial statements in conformity with IFRS requires management to make judgments, estimates, and assumptions in respect of the application of accounting policies and the reported amounts of assets, liabilities, income, and expenses. Actual results may differ from those judgments, estimates, and assumptions.
Certain of the Company’s accounting policies that relate to the financial statements as a whole, as well as estimates and judgments it has made and how they affect the amounts reported in the consolidated financial statements, are incorporated in this section. This note also describes new standards, amendments or interpretations that are effective and applied by the Company during 2017 or are not yet effective. Where an accounting policy, estimate, or judgment is applicable to a specific note to the accounts, it is described within that note.
These consolidated financial statements were prepared under the historical cost basis except for derivative financial instruments, contingent consideration, and liabilities for share-based payment arrangements, which have been measured at fair value.
(a) Principles of Consolidation
Accounting Policy
The consolidated financial statements include the accounts of the Company, which includes the Finning (Canada) division and Finning’s wholly owned subsidiaries. Subsidiaries are those entities over which Finning has the power over the investee, is exposed, or has rights, to variable returns from its involvement with the investee, and has the ability to use its power to affect its returns, generally accompanying a shareholding that confers more than half of the voting rights. The consolidated financial statements include the operating results of acquired or disposed subsidiaries from the date the Company obtains control or the date control is lost.
The Company’s principal wholly owned subsidiaries, and the main countries in which they operate, are as follows:
Principal place Functional Name of business % ownership currency (1)
Finning (UK) Ltd United Kingdom 100% GBP Finning Chile S.A. Chile 100% USD Finning Argentina S.A. Argentina 100% USD Finning Soluciones Mineras S.A. Argentina 100% USD Moncouver S.A. Uruguay 100% USD Finning Bolivia S.A. Bolivia 100% USD OEM Remanufacturing Company Inc. Canada 100% CAD Finning (Ireland) Limited Republic of Ireland 100% EUR (1) Canadian dollar (CAD), United States dollar (USD), U.K. pound sterling (GBP), Euro (EUR)
All shareholdings are of ordinary shares or other equity capital. Other subsidiaries, while included in the consolidated financial statements, are not considered material.
Finning International Inc. 2017 Annual Results
Notes to the Consolidated Financial Statements
9
(b) Foreign Currency Translation
Accounting Policy These consolidated financial statements are presented in Canadian dollars, which is the functional currency of the parent company. Transactions undertaken in foreign currencies are translated into the entity’s functional currency at exchange rates prevailing at the time the transactions occurred. Account balances denominated in foreign currencies are translated into the entity’s functional currency as follows: Monetary items are translated at exchange rates in effect at the statement of financial position dates and non-
monetary items are translated at historical exchange rates; and Foreign exchange gains and losses are included in income except where the exchange gain or loss arises from
the translation of monetary items designated as cash flow hedges. The effective portion of hedging gains and losses associated with these cash flow hedges is recorded, net of tax, in other comprehensive income until it is reclassified to include it in the initial carrying cost of the hedged asset or hedged liability and recognized in earnings on the same basis as the hedged item.
Financial statements of foreign operations are translated from the functional currency of the foreign operation into Canadian dollars as follows: Assets and liabilities are translated using the exchange rates in effect at the statement of financial position
dates; Revenue and expense items are translated at average exchange rates prevailing during the period that the
transactions occurred; and Foreign currency translation adjustments and gains and losses on net investment hedges are reported within
other comprehensive income. Cumulative foreign currency translation adjustments, net of gains and losses on net investment hedges, are recognized in net income upon the disposal of a foreign operation (i.e. a disposal of the Company’s entire interest in a foreign operation, or a disposal that involves loss of control of a subsidiary that includes a foreign operation, loss of joint control over a jointly controlled entity that includes a foreign operation, or loss of significant influence over an associate that includes a foreign operation).
The Company has hedged some of its investments in foreign subsidiaries using foreign currency denominated borrowings. Foreign exchange gains or losses arising from the translation of these hedging instruments are accounted for as items of other comprehensive income and presented on the consolidated statement of financial position. Foreign exchange gains or losses arising from net investment hedging instruments are recognized in net income upon the disposal of a foreign operation. See Note 7 for further details on the Company’s hedge accounting policy.
Areas of Significant Judgment Management has made judgments with regard to the determination of the functional currency of each entity of the Company.
Finning International Inc. 2017 Annual Results
Notes to the Consolidated Financial Statements
10
(c) Revenue Recognition
Accounting Policy Revenue recognition occurs when there is an arrangement with a customer, primarily in the form of a contract or purchase order, a fixed or determinable sales price is established with the customer, performance requirements are achieved, and it is probable that economic benefits associated with the transaction will flow to the Company. Revenue is measured at fair value of the consideration received or receivable net of any incentives offered.
Revenue is recognized as performance requirements are achieved in accordance with the following: Revenue from sales of equipment is recognized at the time title to the equipment and significant risks and
rewards of ownership passes to the customer, which is generally at the time of shipment of the product to the customer;
Revenue from equipment rentals and operating leases is recognized in accordance with the terms of the relevant agreement with the customer, either evenly over the term of that agreement or on a usage basis such as the number of hours that the equipment is used;
Revenue from product support includes sales of parts and servicing of equipment. For sales of parts, revenue is recognized when the part is shipped to the customer or when the part is installed in the customer’s equipment. For servicing of equipment, revenue is recognized as the service work is performed. Product support is also offered to customers in the form of long-term maintenance and repair contracts. For these contracts, revenue is recognized on a basis proportionate to the service work that has been performed based on the parts and labour service provided. Parts revenue is recognized based on parts list price and service revenue is recognized based on standard billing labour rates. If it is expected that the overall contract will incur a loss, this loss is recognized immediately in the consolidated statement of net income. Periodically, amounts are received from customers under long-term contracts in advance of the associated contract work being performed. These amounts are recorded on the consolidated statement of financial position as deferred revenue; and,
The revenue recognition accounting policy for power and energy system contracts with customers is described in Note 12.
If an arrangement with a customer involves the provision of multiple elements, the total arrangement value is allocated to each element as a separate unit of accounting based on their fair values if:
a. The delivered item has value to the customer on a stand-alone basis; b. There is objective and reliable evidence of the fair value of the undelivered item; and c. The arrangement includes a general right of return relative to the delivered item and delivery or performance
of the undelivered item is considered probable and substantially in the control of the Company.
Finning International Inc. 2017 Annual Results
Notes to the Consolidated Financial Statements
11
Areas of Estimation Uncertainty Long-Term Contracts
Where the outcome of a long-term contract (primarily power and energy systems and maintenance and repair contracts) can be estimated reliably, revenue and costs are recognized by reference to the stage of completion of the contract activity at the statement of financial position date and is measured primarily based on the proportion of contract costs incurred for work performed to date relative to the estimated total contract costs. Variations in contract work, claims and incentive payments are included to the extent that they have been agreed with the customer. Where the outcome of a long-term contract cannot be estimated reliably, contract revenue is recognized in the current period to the extent that it is probable that contract costs will be recoverable. Contract costs are recognized as expenses in the period in which they are incurred. When it is probable that total contract costs will exceed total contract revenue, the expected loss is recognized as an expense immediately.
Repurchase Commitments
Guaranteed residual values are periodically given in connection with repurchase commitments provided to customers. The likelihood of the repurchase commitments being exercised is assessed at the inception of the contract to determine whether significant risks and rewards have been transferred to the customer and if revenue should be recognized. The likelihood of the repurchase commitments being exercised, and quantification of the possible loss, if any, on resale of the equipment, is assessed at the inception of the contract and at each reporting period thereafter. Significant assumptions are made in estimating residual values. These are assessed based on past experience and take into account expected future market conditions and projected disposal values.
Areas of Significant Judgment Rental Purchase Options
Rental purchase options (RPOs) are rental agreements with customers which include an option to purchase the equipment at the end of the rental term. The Company periodically sells portfolios of RPOs to financial institutions, and is required to make judgments as to whether the risks and rewards of ownership of the underlying assets have been transferred in such circumstances. The level of residual value risk retained by the Company, the continuing managerial involvement of the Company in the assets, and the transfer of title to the assets are all considered when assessing whether the risks and rewards of ownership have been transferred to third parties and hence whether revenue should be recognized on the sale of the assets and associated rental contracts.
(d) Amendments to Standards The Company has adopted the following amendments to standards:
IAS 7, Statement of Cash Flows (effective January 1, 2017) introduces new requirements to disclose changes in liabilities arising from financing activities, including changes arising from cash flows and non-cash changes. The required disclosures have been added to Note 24 of the Company’s 2017 Consolidated Financial Statements.
Finning International Inc. 2017 Annual Results
Notes to the Consolidated Financial Statements
12
(e) Future Accounting Pronouncements The Company has not applied the following new standards and IFRS Interpretations Committee Interpretation (IFRIC) that have been issued but are not yet effective:
IFRS 15, Revenue from Contracts with Customers (IFRS 15) (effective date January 1, 2018) requires companies to recognize revenue to depict the transfer of promised goods or services to customers in an amount that reflects the consideration to which the entity expects to be entitled in exchange for those goods or services. IFRS 15 will supersede existing standards and interpretations, including International Accounting Standards (IAS) 18, Revenue and IAS 11, Construction Contracts. Additionally, IFRS 15 will significantly increase disclosures related to revenue recognition. Entities are permitted to apply the amendments either retrospectively to each prior reporting period presented or retrospectively with the cumulative effect of initially applying IFRS 15 at the date of initial application.
Management evaluated the new standard and has completed its assessment including a review of revenue contracts with customers. Management has determined that the new standard will have the following impact on the timing and pattern of revenue recognition:
Revenue for sales of new equipment, used equipment, and parts will remain largely unchanged;
Revenue for complex power systems projects and servicing of equipment will be recognized over time in a pattern that reflects the measure of progress. While the total amount of revenue recognized under IFRS 15 will not change materially, the timing of revenue recognized may differ to reflect the measure of progress or allocation of the transaction price.
Revenue for non-complex power systems projects will be recognized at points in time as the performance obligations are satisfied (upon delivery of the equipment to the customer or commissioning of the power system project).
Revenue for rental equipment is excluded from the scope of the new revenue standard and therefore will remain unchanged upon adoption of IFRS 15.
The Company will apply some of the practical expedients available under IFRS 15 such as, the Company will not restate financial statements for any contracts completed and modifications made to such contracts prior to January 1, 2017 and management will use the transaction price at the date the contract was completed rather than estimating variable consideration amounts in the comparative reporting periods. Management will apply the new standard retrospectively to each reporting period presented. The estimated impact is summarized in the table below.
IFRS 9, Financial Instruments (IFRS 9) (effective January 1, 2018) introduces new requirements for the classification and measurement of financial assets and financial liabilities, impairment of financial assets, and hedge accounting. The Company will apply this standard retrospectively. Under the new standard, management will utilize a provision matrix, permitted under the simplified approach, to estimate expected credit losses for trade receivables. Management does not expect any adjustment on transition for this change in methodology from incurred credit losses under the current rules of IAS 39, Financial Instruments: Recognition and Measurement (IAS 39).
Management elects to apply the hedge accounting requirements of IFRS 9 to its existing hedging relationships. As a result, cash flow hedges of certain highly probable forecast transactions do not meet the requirements under the new rules and as a result, any effective portion of such hedges previously recognized in other comprehensive income will be restated to the consolidated statement of net income in the comparative period.
Under IAS 39, if a hedged forecast transaction subsequently results in the recognition of a non-financial asset or non-financial liability, the Company reclassifies that amount and includes it directly in the initial cost of the asset or the liability with an offsetting entry in other comprehensive income, referred to as a basis adjustment. Upon adoption of IFRS 9, the Company will be required to remove the basis adjustment directly from accumulated other comprehensive income and is not considered a reclassification adjustment and therefore will no longer impact other comprehensive income. The estimated impact of this change is summarized in the table below and will result in changes in both the statements of comprehensive income and shareholders’ equity.
Except as outlined in the table below, management does not expect the adoption of IFRS 9 to result in any other changes to the consolidated statements of financial position, net income, comprehensive income or loss, shareholders’ equity, or cash flow.
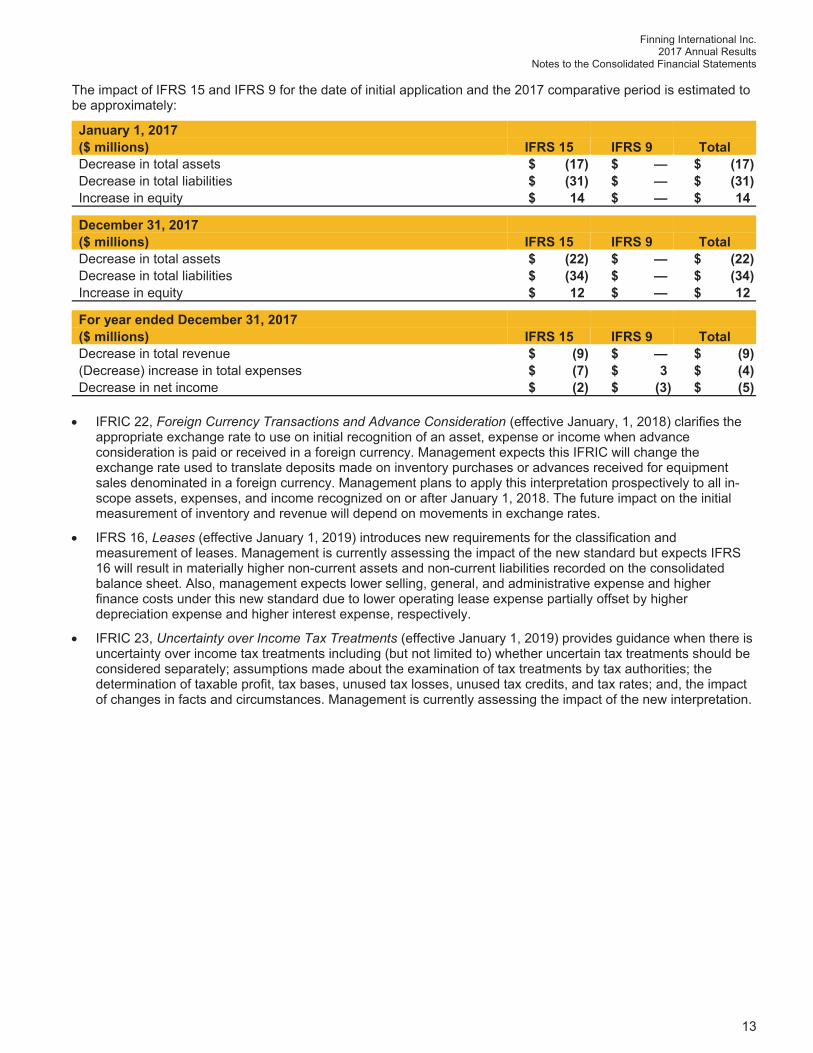
Finning International Inc. 2017 Annual Results
Notes to the Consolidated Financial Statements
13
The impact of IFRS 15 and IFRS 9 for the date of initial application and the 2017 comparative period is estimated to be approximately:
January 1, 2017 ($ millions) IFRS 15 IFRS 9 Total
Decrease in total assets $ (17) $ — $ (17) Decrease in total liabilities $ (31) $ — $ (31) Increase in equity $ 14 $ — $ 14
December 31, 2017 ($ millions) IFRS 15 IFRS 9 Total
Decrease in total assets $ (22) $ — $ (22) Decrease in total liabilities $ (34) $ — $ (34) Increase in equity $ 12 $ — $ 12
For year ended December 31, 2017 ($ millions) IFRS 15 IFRS 9 Total
Decrease in total revenue $ (9) $ — $ (9) (Decrease) increase in total expenses $ (7) $ 3 $ (4) Decrease in net income $ (2) $ (3) $ (5)
IFRIC 22, Foreign Currency Transactions and Advance Consideration (effective January, 1, 2018) clarifies the appropriate exchange rate to use on initial recognition of an asset, expense or income when advance consideration is paid or received in a foreign currency. Management expects this IFRIC will change the exchange rate used to translate deposits made on inventory purchases or advances received for equipment sales denominated in a foreign currency. Management plans to apply this interpretation prospectively to all in-scope assets, expenses, and income recognized on or after January 1, 2018. The future impact on the initial measurement of inventory and revenue will depend on movements in exchange rates.
IFRS 16, Leases (effective January 1, 2019) introduces new requirements for the classification and measurement of leases. Management is currently assessing the impact of the new standard but expects IFRS 16 will result in materially higher non-current assets and non-current liabilities recorded on the consolidated balance sheet. Also, management expects lower selling, general, and administrative expense and higher finance costs under this new standard due to lower operating lease expense partially offset by higher depreciation expense and higher interest expense, respectively.
IFRIC 23, Uncertainty over Income Tax Treatments (effective January 1, 2019) provides guidance when there is uncertainty over income tax treatments including (but not limited to) whether uncertain tax treatments should be considered separately; assumptions made about the examination of tax treatments by tax authorities; the determination of taxable profit, tax bases, unused tax losses, unused tax credits, and tax rates; and, the impact of changes in facts and circumstances. Management is currently assessing the impact of the new interpretation.
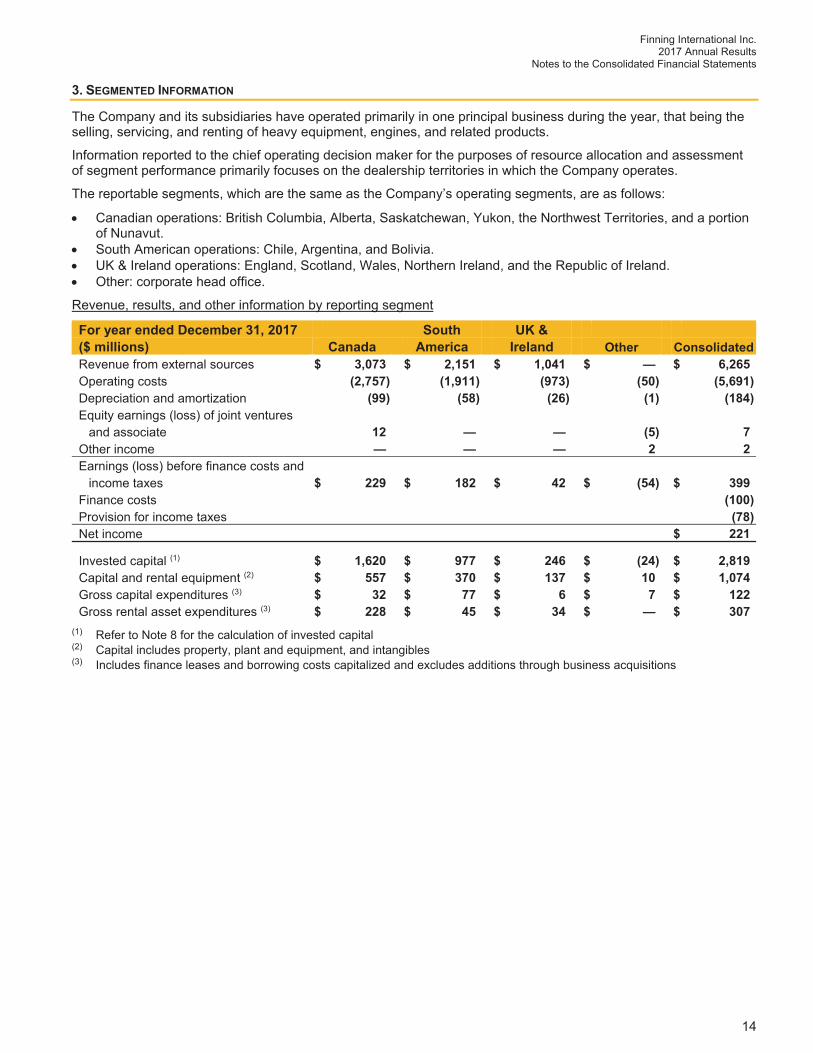
Finning International Inc. 2017 Annual Results
Notes to the Consolidated Financial Statements
14
3. SEGMENTED INFORMATION
The Company and its subsidiaries have operated primarily in one principal business during the year, that being the selling, servicing, and renting of heavy equipment, engines, and related products.
Information reported to the chief operating decision maker for the purposes of resource allocation and assessment of segment performance primarily focuses on the dealership territories in which the Company operates.
The reportable segments, which are the same as the Company’s operating segments, are as follows:
Canadian operations: British Columbia, Alberta, Saskatchewan, Yukon, the Northwest Territories, and a portion of Nunavut.
South American operations: Chile, Argentina, and Bolivia. UK & Ireland operations: England, Scotland, Wales, Northern Ireland, and the Republic of Ireland. Other: corporate head office.
Revenue, results, and other information by reporting segment
For year ended December 31, 2017 South UK & ($ millions) Canada America Ireland Other Consolidated
Revenue from external sources $ 3,073 $ 2,151 $ 1,041 $ — $ 6,265 Operating costs (2,757) (1,911) (973) (50) (5,691) Depreciation and amortization (99) (58) (26) (1) (184) Equity earnings (loss) of joint ventures and associate 12 — — (5) 7 Other income — — — 2 2 Earnings (loss) before finance costs and income taxes $ 229 $ 182 $ 42 $ (54) $ 399 Finance costs (100) Provision for income taxes (78)Net income $ 221
Invested capital (1) $ 1,620 $ 977 $ 246 $ (24) $ 2,819 Capital and rental equipment (2) $ 557 $ 370 $ 137 $ 10 $ 1,074 Gross capital expenditures (3) $ 32 $ 77 $ 6 $ 7 $ 122 Gross rental asset expenditures (3) $ 228 $ 45 $ 34 $ — $ 307(1) Refer to Note 8 for the calculation of invested capital (2) Capital includes property, plant and equipment, and intangibles (3) Includes finance leases and borrowing costs capitalized and excludes additions through business acquisitions
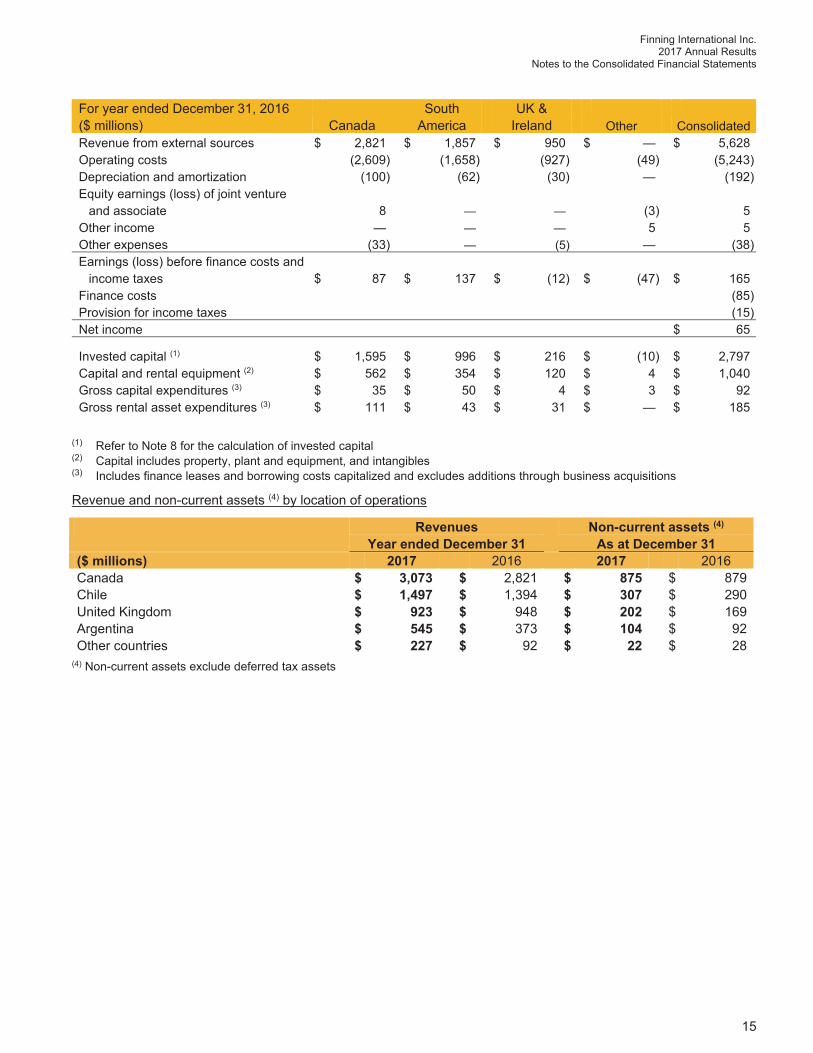
Finning International Inc. 2017 Annual Results
Notes to the Consolidated Financial Statements
15
For year ended December 31, 2016 South UK & ($ millions) Canada America Ireland Other Consolidated Revenue from external sources $ 2,821 $ 1,857 $ 950 $ — $ 5,628 Operating costs (2,609) (1,658) (927) (49) (5,243) Depreciation and amortization (100) (62) (30) — (192) Equity earnings (loss) of joint venture and associate 8 — — (3) 5 Other income — — — 5 5 Other expenses (33) — (5) — (38) Earnings (loss) before finance costs and income taxes $ 87 $ 137 $ (12) $ (47) $ 165 Finance costs (85) Provision for income taxes (15)Net income $ 65
Invested capital (1) $ 1,595 $ 996 $ 216 $ (10) $ 2,797 Capital and rental equipment (2) $ 562 $ 354 $ 120 $ 4 $ 1,040 Gross capital expenditures (3) $ 35 $ 50 $ 4 $ 3 $ 92 Gross rental asset expenditures (3) $ 111 $ 43 $ 31 $ — $ 185 (1) Refer to Note 8 for the calculation of invested capital (2) Capital includes property, plant and equipment, and intangibles (3) Includes finance leases and borrowing costs capitalized and excludes additions through business acquisitions
Revenue and non-current assets (4) by location of operations
Revenues Non-current assets (4)
Year ended December 31 As at December 31 ($ millions) 2017 2016 2017 2016 Canada $ 3,073 $ 2,821 $ 875 $ 879 Chile $ 1,497 $ 1,394 $ 307 $ 290 United Kingdom $ 923 $ 948 $ 202 $ 169 Argentina $ 545 $ 373 $ 104 $ 92 Other countries $ 227 $ 92 $ 22 $ 28(4) Non-current assets exclude deferred tax assets
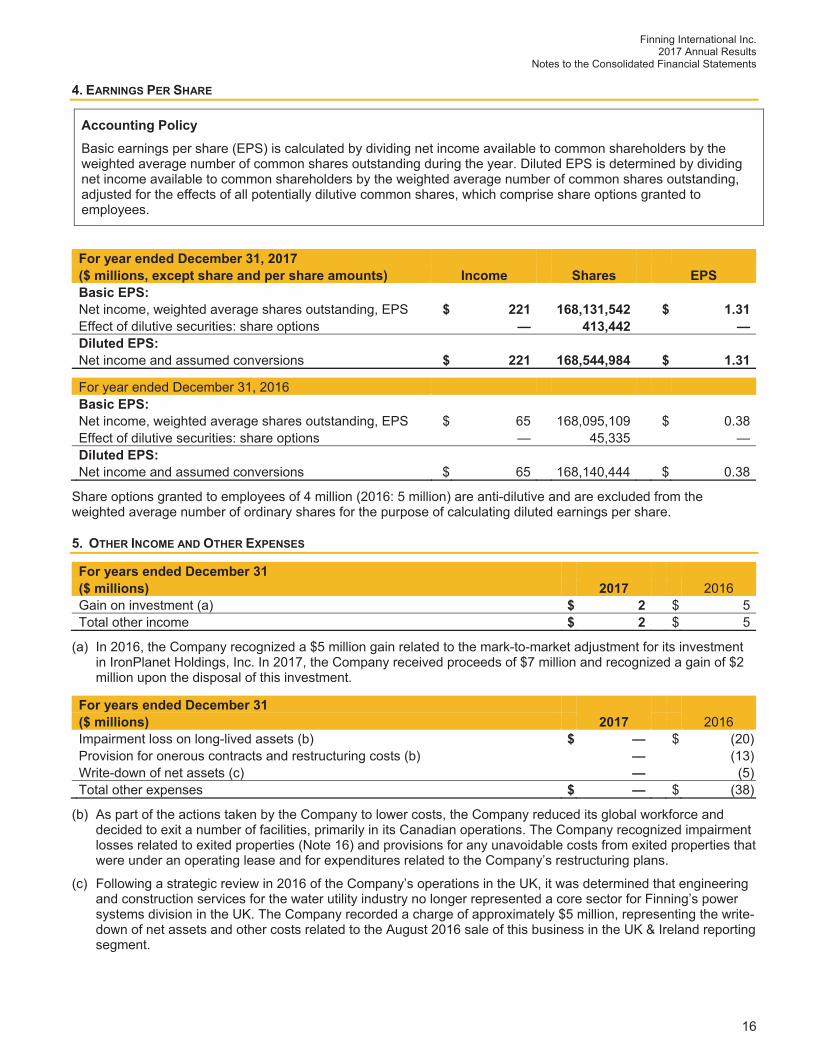
Finning International Inc. 2017 Annual Results
Notes to the Consolidated Financial Statements
16
4. EARNINGS PER SHARE
Accounting Policy Basic earnings per share (EPS) is calculated by dividing net income available to common shareholders by the weighted average number of common shares outstanding during the year. Diluted EPS is determined by dividing net income available to common shareholders by the weighted average number of common shares outstanding, adjusted for the effects of all potentially dilutive common shares, which comprise share options granted to employees.
For year ended December 31, 2017 ($ millions, except share and per share amounts) Income Shares EPS
Basic EPS: Net income, weighted average shares outstanding, EPS $ 221 168,131,542 $ 1.31 Effect of dilutive securities: share options — 413,442 — Diluted EPS: Net income and assumed conversions $ 221 168,544,984 $ 1.31
For year ended December 31, 2016 Basic EPS: Net income, weighted average shares outstanding, EPS $ 65 168,095,109 $ 0.38 Effect of dilutive securities: share options — 45,335 — Diluted EPS: Net income and assumed conversions $ 65 168,140,444 $ 0.38
Share options granted to employees of 4 million (2016: 5 million) are anti-dilutive and are excluded from the weighted average number of ordinary shares for the purpose of calculating diluted earnings per share.
5. OTHER INCOME AND OTHER EXPENSES
For years ended December 31 ($ millions) 2017 2016
Gain on investment (a) $ 2 $ 5 Total other income $ 2 $ 5
(a) In 2016, the Company recognized a $5 million gain related to the mark-to-market adjustment for its investment in IronPlanet Holdings, Inc. In 2017, the Company received proceeds of $7 million and recognized a gain of $2 million upon the disposal of this investment.
For years ended December 31 2017 2016 ($ millions)
Impairment loss on long-lived assets (b) $ — $ (20) Provision for onerous contracts and restructuring costs (b) — (13) Write-down of net assets (c) — (5) Total other expenses $ — $ (38)
(b) As part of the actions taken by the Company to lower costs, the Company reduced its global workforce and decided to exit a number of facilities, primarily in its Canadian operations. The Company recognized impairment losses related to exited properties (Note 16) and provisions for any unavoidable costs from exited properties that were under an operating lease and for expenditures related to the Company’s restructuring plans.
(c) Following a strategic review in 2016 of the Company’s operations in the UK, it was determined that engineering and construction services for the water utility industry no longer represented a core sector for Finning’s power systems division in the UK. The Company recorded a charge of approximately $5 million, representing the write-down of net assets and other costs related to the August 2016 sale of this business in the UK & Ireland reporting segment.
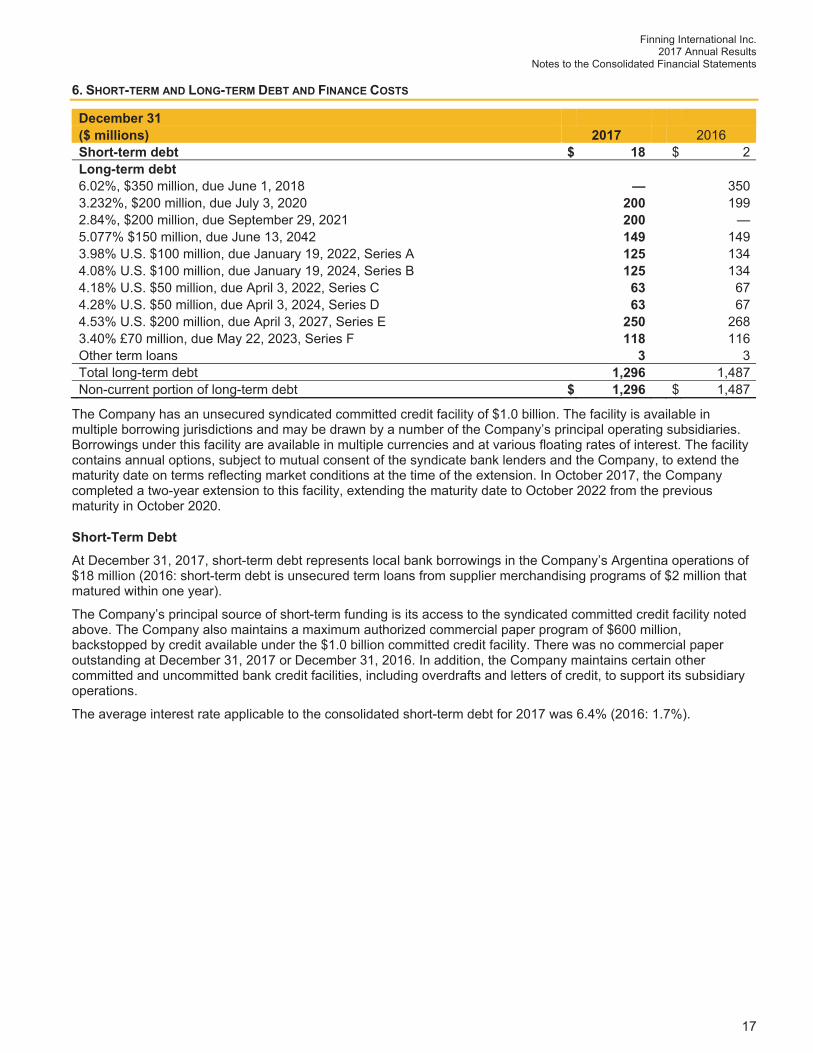
Finning International Inc. 2017 Annual Results
Notes to the Consolidated Financial Statements
17
6. SHORT-TERM AND LONG-TERM DEBT AND FINANCE COSTS
December 31 ($ millions) 2017 2016
Short-term debt $ 18 $ 2 Long-term debt 6.02%, $350 million, due June 1, 2018 — 350 3.232%, $200 million, due July 3, 2020 200 199 2.84%, $200 million, due September 29, 2021 200 — 5.077% $150 million, due June 13, 2042 149 149 3.98% U.S. $100 million, due January 19, 2022, Series A 125 134 4.08% U.S. $100 million, due January 19, 2024, Series B 125 134 4.18% U.S. $50 million, due April 3, 2022, Series C 63 67 4.28% U.S. $50 million, due April 3, 2024, Series D 63 67 4.53% U.S. $200 million, due April 3, 2027, Series E 250 268 3.40% £70 million, due May 22, 2023, Series F 118 116 Other term loans 3 3 Total long-term debt 1,296 1,487 Non-current portion of long-term debt $ 1,296 $ 1,487
The Company has an unsecured syndicated committed credit facility of $1.0 billion. The facility is available in multiple borrowing jurisdictions and may be drawn by a number of the Company’s principal operating subsidiaries. Borrowings under this facility are available in multiple currencies and at various floating rates of interest. The facility contains annual options, subject to mutual consent of the syndicate bank lenders and the Company, to extend the maturity date on terms reflecting market conditions at the time of the extension. In October 2017, the Company completed a two-year extension to this facility, extending the maturity date to October 2022 from the previous maturity in October 2020.
Short-Term DebtAt December 31, 2017, short-term debt represents local bank borrowings in the Company’s Argentina operations of $18 million (2016: short-term debt is unsecured term loans from supplier merchandising programs of $2 million that matured within one year).
The Company’s principal source of short-term funding is its access to the syndicated committed credit facility noted above. The Company also maintains a maximum authorized commercial paper program of $600 million, backstopped by credit available under the $1.0 billion committed credit facility. There was no commercial paper outstanding at December 31, 2017 or December 31, 2016. In addition, the Company maintains certain other committed and uncommitted bank credit facilities, including overdrafts and letters of credit, to support its subsidiary operations.
The average interest rate applicable to the consolidated short-term debt for 2017 was 6.4% (2016: 1.7%).
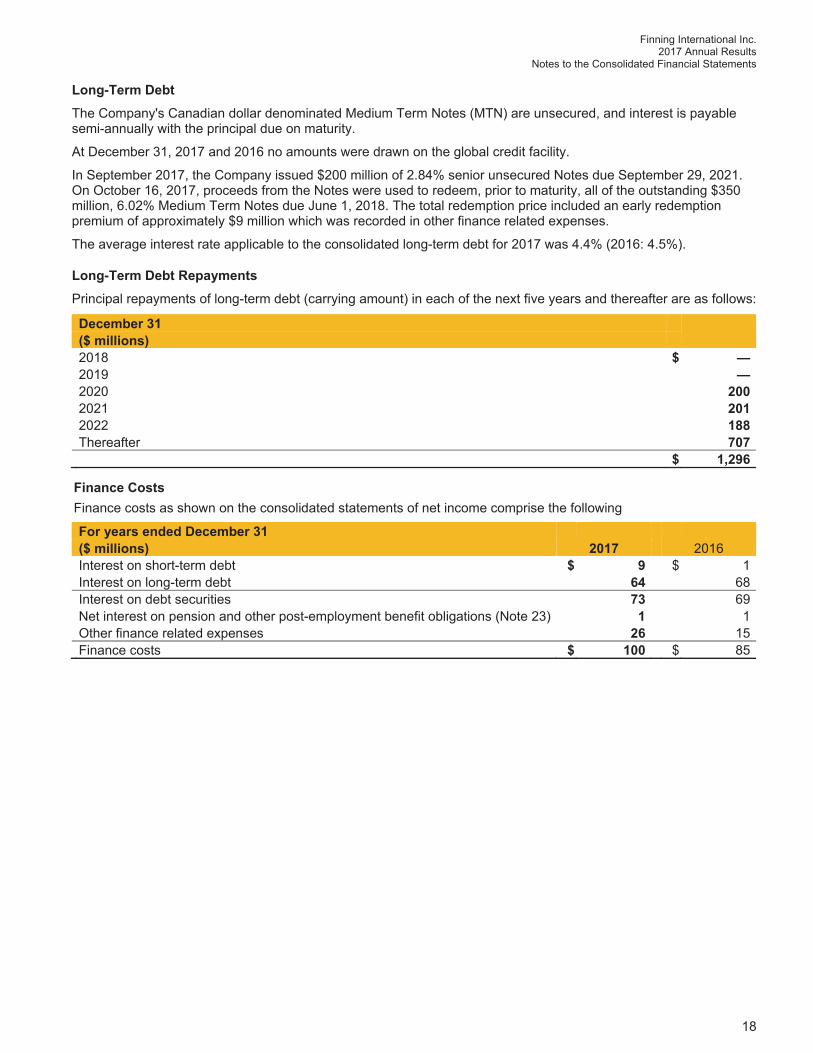
Finning International Inc. 2017 Annual Results
Notes to the Consolidated Financial Statements
18
Long-Term DebtThe Company's Canadian dollar denominated Medium Term Notes (MTN) are unsecured, and interest is payable semi-annually with the principal due on maturity.
At December 31, 2017 and 2016 no amounts were drawn on the global credit facility.
In September 2017, the Company issued $200 million of 2.84% senior unsecured Notes due September 29, 2021. On October 16, 2017, proceeds from the Notes were used to redeem, prior to maturity, all of the outstanding $350 million, 6.02% Medium Term Notes due June 1, 2018. The total redemption price included an early redemption premium of approximately $9 million which was recorded in other finance related expenses.
The average interest rate applicable to the consolidated long-term debt for 2017 was 4.4% (2016: 4.5%).
Long-Term Debt Repayments
Principal repayments of long-term debt (carrying amount) in each of the next five years and thereafter are as follows:
December 31 ($ millions)
2018 $ — 2019 — 2020 200 2021 201 2022 188 Thereafter 707 $ 1,296
Finance Costs Finance costs as shown on the consolidated statements of net income comprise the following For years ended December 31 ($ millions) 2017 2016
Interest on short-term debt $ 9 $ 1 Interest on long-term debt 64 68 Interest on debt securities 73 69 Net interest on pension and other post-employment benefit obligations (Note 23) 1 1 Other finance related expenses 26 15 Finance costs $ 100 $ 85
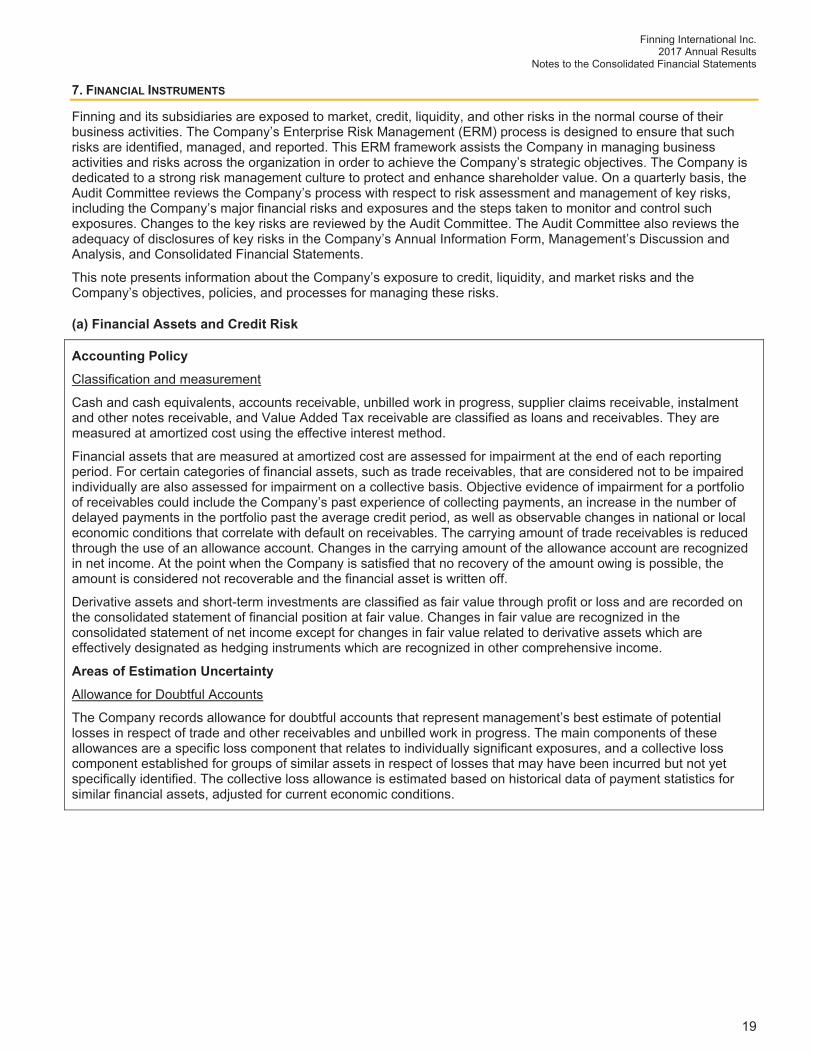
Finning International Inc. 2017 Annual Results
Notes to the Consolidated Financial Statements
19
7. FINANCIAL INSTRUMENTS
Finning and its subsidiaries are exposed to market, credit, liquidity, and other risks in the normal course of their business activities. The Company’s Enterprise Risk Management (ERM) process is designed to ensure that such risks are identified, managed, and reported. This ERM framework assists the Company in managing business activities and risks across the organization in order to achieve the Company’s strategic objectives. The Company is dedicated to a strong risk management culture to protect and enhance shareholder value. On a quarterly basis, the Audit Committee reviews the Company’s process with respect to risk assessment and management of key risks, including the Company’s major financial risks and exposures and the steps taken to monitor and control such exposures. Changes to the key risks are reviewed by the Audit Committee. The Audit Committee also reviews the adequacy of disclosures of key risks in the Company’s Annual Information Form, Management’s Discussion and Analysis, and Consolidated Financial Statements.
This note presents information about the Company’s exposure to credit, liquidity, and market risks and the Company’s objectives, policies, and processes for managing these risks.
(a) Financial Assets and Credit Risk
Accounting Policy Classification and measurement
Cash and cash equivalents, accounts receivable, unbilled work in progress, supplier claims receivable, instalment and other notes receivable, and Value Added Tax receivable are classified as loans and receivables. They are measured at amortized cost using the effective interest method.
Financial assets that are measured at amortized cost are assessed for impairment at the end of each reporting period. For certain categories of financial assets, such as trade receivables, that are considered not to be impaired individually are also assessed for impairment on a collective basis. Objective evidence of impairment for a portfolio of receivables could include the Company’s past experience of collecting payments, an increase in the number of delayed payments in the portfolio past the average credit period, as well as observable changes in national or local economic conditions that correlate with default on receivables. The carrying amount of trade receivables is reduced through the use of an allowance account. Changes in the carrying amount of the allowance account are recognized in net income. At the point when the Company is satisfied that no recovery of the amount owing is possible, the amount is considered not recoverable and the financial asset is written off.
Derivative assets and short-term investments are classified as fair value through profit or loss and are recorded on the consolidated statement of financial position at fair value. Changes in fair value are recognized in the consolidated statement of net income except for changes in fair value related to derivative assets which are effectively designated as hedging instruments which are recognized in other comprehensive income.
Areas of Estimation Uncertainty Allowance for Doubtful Accounts
The Company records allowance for doubtful accounts that represent management’s best estimate of potential losses in respect of trade and other receivables and unbilled work in progress. The main components of these allowances are a specific loss component that relates to individually significant exposures, and a collective loss component established for groups of similar assets in respect of losses that may have been incurred but not yet specifically identified. The collective loss allowance is estimated based on historical data of payment statistics for similar financial assets, adjusted for current economic conditions.
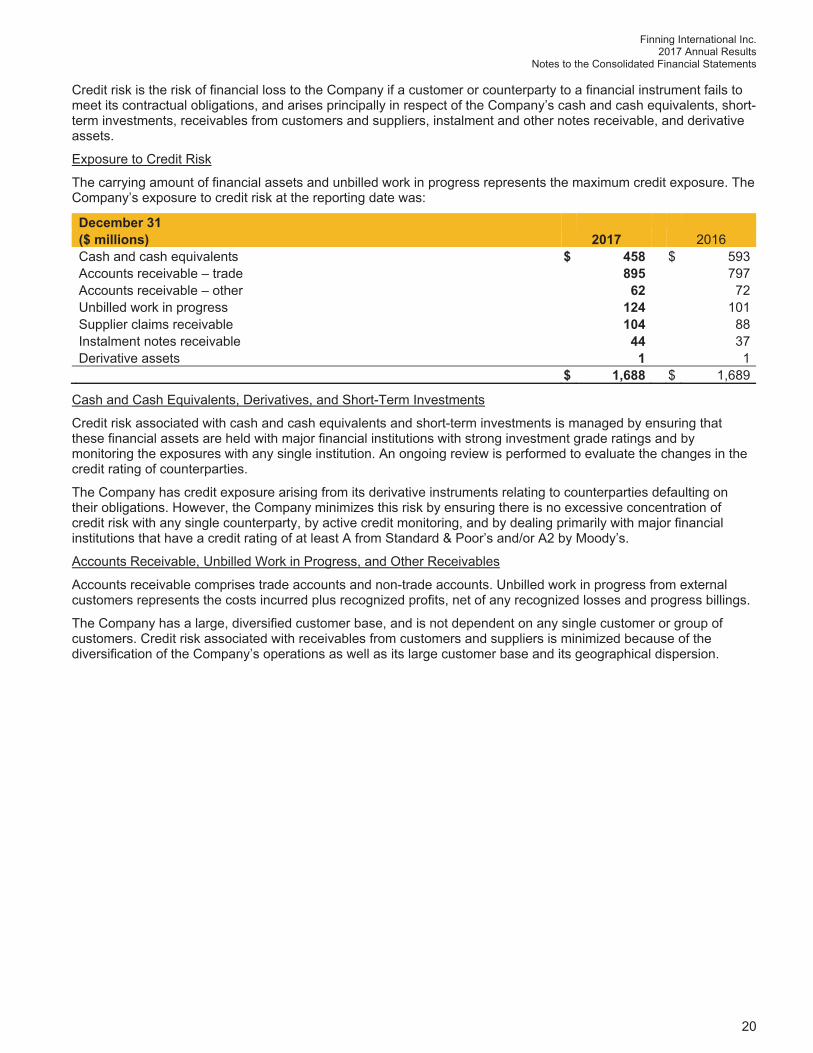
Finning International Inc. 2017 Annual Results
Notes to the Consolidated Financial Statements
20
Credit risk is the risk of financial loss to the Company if a customer or counterparty to a financial instrument fails to meet its contractual obligations, and arises principally in respect of the Company’s cash and cash equivalents, short-term investments, receivables from customers and suppliers, instalment and other notes receivable, and derivative assets.
Exposure to Credit Risk
The carrying amount of financial assets and unbilled work in progress represents the maximum credit exposure. The Company’s exposure to credit risk at the reporting date was:
December 31 ($ millions) 2017 2016
Cash and cash equivalents $ 458 $ 593 Accounts receivable – trade 895 797 Accounts receivable – other 62 72 Unbilled work in progress 124 101 Supplier claims receivable 104 88 Instalment notes receivable 44 37 Derivative assets 1 1 $ 1,688 $ 1,689
Cash and Cash Equivalents, Derivatives, and Short-Term Investments
Credit risk associated with cash and cash equivalents and short-term investments is managed by ensuring that these financial assets are held with major financial institutions with strong investment grade ratings and by monitoring the exposures with any single institution. An ongoing review is performed to evaluate the changes in the credit rating of counterparties.
The Company has credit exposure arising from its derivative instruments relating to counterparties defaulting on their obligations. However, the Company minimizes this risk by ensuring there is no excessive concentration of credit risk with any single counterparty, by active credit monitoring, and by dealing primarily with major financial institutions that have a credit rating of at least A from Standard & Poor’s and/or A2 by Moody’s.
Accounts Receivable, Unbilled Work in Progress, and Other Receivables
Accounts receivable comprises trade accounts and non-trade accounts. Unbilled work in progress from external customers represents the costs incurred plus recognized profits, net of any recognized losses and progress billings.
The Company has a large, diversified customer base, and is not dependent on any single customer or group of customers. Credit risk associated with receivables from customers and suppliers is minimized because of the diversification of the Company’s operations as well as its large customer base and its geographical dispersion.
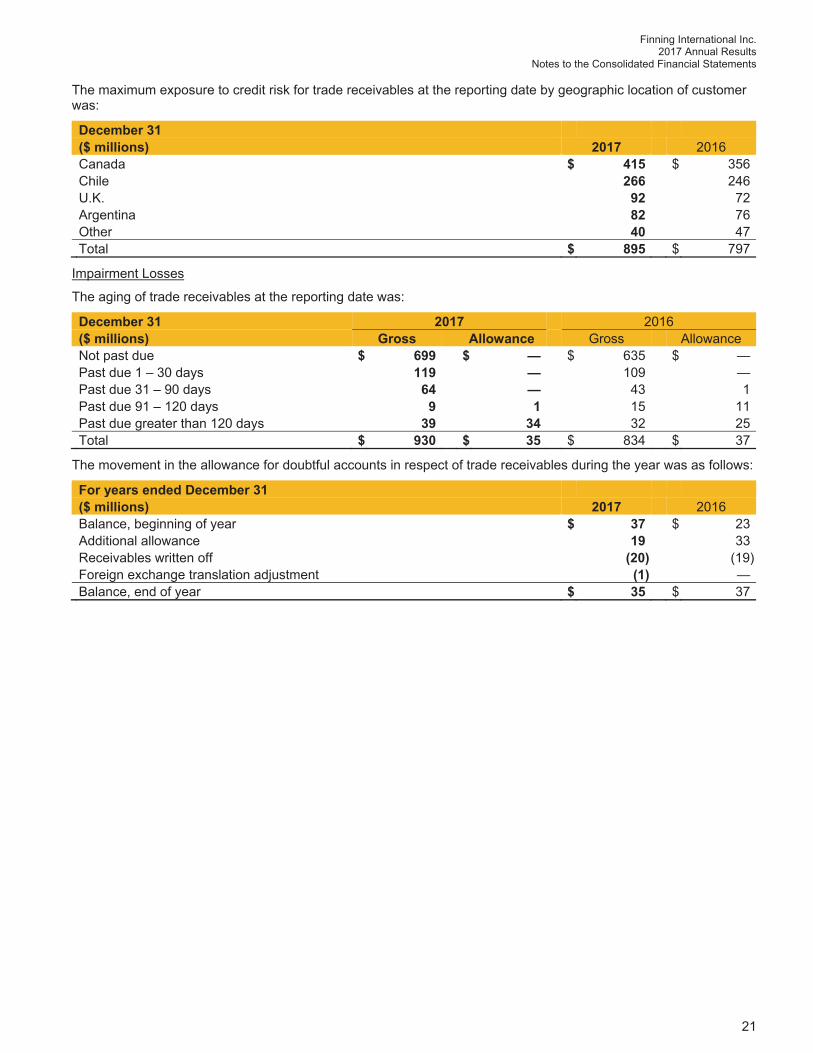
Finning International Inc. 2017 Annual Results
Notes to the Consolidated Financial Statements
21
The maximum exposure to credit risk for trade receivables at the reporting date by geographic location of customer was:
December 31 ($ millions) 2017 2016
Canada $ 415 $ 356 Chile 266 246 U.K. 92 72 Argentina 82 76 Other 40 47 Total $ 895 $ 797
Impairment Losses
The aging of trade receivables at the reporting date was:
December 31 2017 2016 ($ millions) Gross Allowance Gross Allowance
Not past due $ 699 $ — $ 635 $ — Past due 1 – 30 days 119 — 109 — Past due 31 – 90 days 64 — 43 1 Past due 91 – 120 days 9 1 15 11 Past due greater than 120 days 39 34 32 25 Total $ 930 $ 35 $ 834 $ 37
The movement in the allowance for doubtful accounts in respect of trade receivables during the year was as follows:
For years ended December 31 ($ millions) 2017 2016
Balance, beginning of year $ 37 $ 23 Additional allowance 19 33 Receivables written off (20) (19) Foreign exchange translation adjustment (1) — Balance, end of year $ 35 $ 37
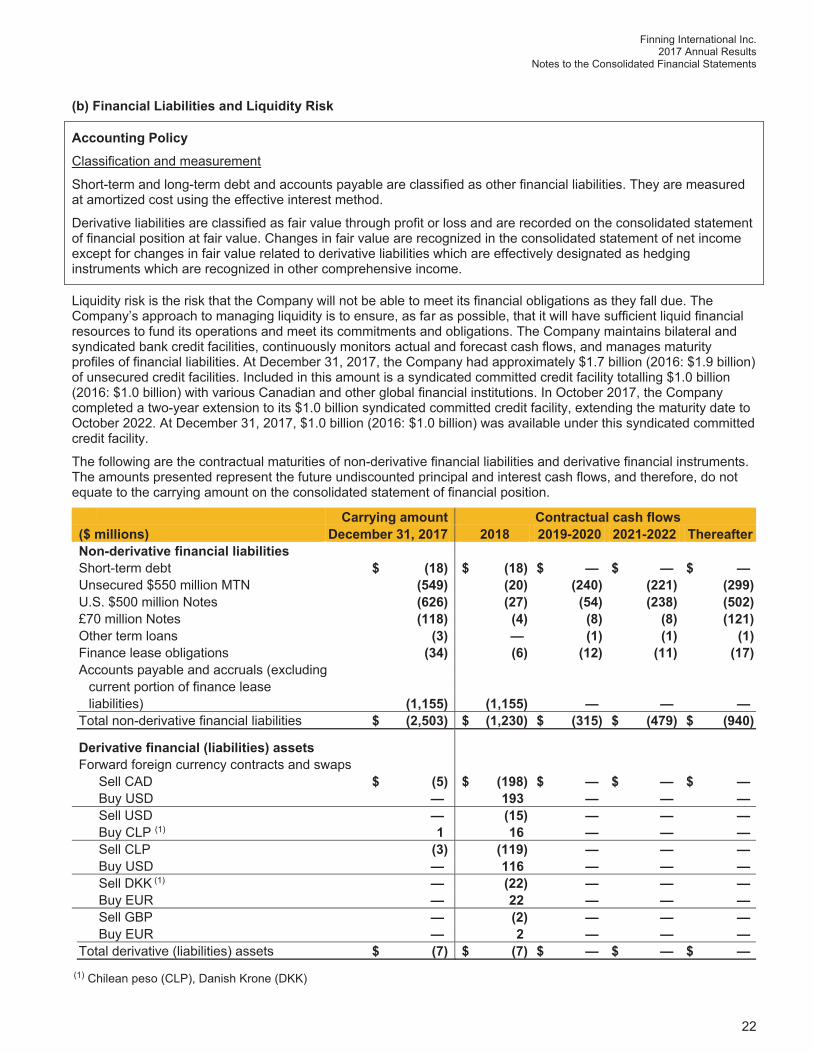
Finning International Inc. 2017 Annual Results
Notes to the Consolidated Financial Statements
22
(b) Financial Liabilities and Liquidity Risk
Accounting Policy Classification and measurement
Short-term and long-term debt and accounts payable are classified as other financial liabilities. They are measured at amortized cost using the effective interest method.
Derivative liabilities are classified as fair value through profit or loss and are recorded on the consolidated statement of financial position at fair value. Changes in fair value are recognized in the consolidated statement of net income except for changes in fair value related to derivative liabilities which are effectively designated as hedging instruments which are recognized in other comprehensive income.
Liquidity risk is the risk that the Company will not be able to meet its financial obligations as they fall due. The Company’s approach to managing liquidity is to ensure, as far as possible, that it will have sufficient liquid financial resources to fund its operations and meet its commitments and obligations. The Company maintains bilateral and syndicated bank credit facilities, continuously monitors actual and forecast cash flows, and manages maturity profiles of financial liabilities. At December 31, 2017, the Company had approximately $1.7 billion (2016: $1.9 billion) of unsecured credit facilities. Included in this amount is a syndicated committed credit facility totalling $1.0 billion (2016: $1.0 billion) with various Canadian and other global financial institutions. In October 2017, the Company completed a two-year extension to its $1.0 billion syndicated committed credit facility, extending the maturity date to October 2022. At December 31, 2017, $1.0 billion (2016: $1.0 billion) was available under this syndicated committed credit facility.
The following are the contractual maturities of non-derivative financial liabilities and derivative financial instruments. The amounts presented represent the future undiscounted principal and interest cash flows, and therefore, do not equate to the carrying amount on the consolidated statement of financial position.
Carrying amount Contractual cash flows ($ millions) December 31, 2017 2018 2019-2020 2021-2022 Thereafter
Non-derivative financial liabilities Short-term debt $ (18) $ (18) $ — $ — $ — Unsecured $550 million MTN (549) (20) (240) (221) (299) U.S. $500 million Notes (626) (27) (54) (238) (502) £70 million Notes (118) (4) (8) (8) (121) Other term loans (3) — (1) (1) (1) Finance lease obligations (34) (6) (12) (11) (17) Accounts payable and accruals (excluding current portion of finance lease liabilities) (1,155) (1,155) — — — Total non-derivative financial liabilities $ (2,503) $ (1,230) $ (315) $ (479) $ (940)
Derivative financial (liabilities) assets Forward foreign currency contracts and swaps Sell CAD $ (5) $ (198) $ — $ — $ — Buy USD — 193 — — — Sell USD — (15) — — — Buy CLP (1) 1 16 — — — Sell CLP (3) (119) — — — Buy USD — 116 — — — Sell DKK (1) — (22) — — — Buy EUR — 22 — — — Sell GBP — (2) — — — Buy EUR — 2 — — — Total derivative (liabilities) assets $ (7) $ (7) $ — $ — $ —(1) Chilean peso (CLP), Danish Krone (DKK)
Finning International Inc. 2017 Annual Results
Notes to the Consolidated Financial Statements
23
(c) Hedging and Market Risk
Accounting Policy Hedges
The Company utilizes derivative financial instruments and foreign currency debt in order to manage its foreign currency and interest rate exposure. The Company uses derivative financial instruments only in connection with managing related risk positions and does not use them for trading or speculative purposes.
The Company determines whether or not to formally designate, for accounting purposes, eligible hedging relationships between hedging instruments and hedged items. This process includes linking derivatives to specific risks from assets or liabilities on the statement of financial position or specific firm commitments or forecasted transactions. For hedges designated as such for accounting purposes, the Company documents and formally assesses, both at inception and on an ongoing basis, whether the hedging instrument is highly effective in offsetting changes in fair value or cash flows associated with the identified hedged items. When derivative instruments have been designated as a hedge and are highly effective in offsetting the identified hedged risk, hedge accounting is applied to the derivative instruments. The ineffective portion of hedging gains and losses of highly effective hedges is reported in net income.
Cash Flow Hedges
The Company uses foreign exchange forward contracts and, at times, may use options to hedge the currency risk associated with certain foreign currency purchase commitments, payroll, and associated accounts payable and accounts receivable for periods up to two years in advance. The effective portion of hedging gains and losses associated with these cash flow hedges is recorded, net of tax, in other comprehensive income and recognized in earnings in the same period as the hedged item. For cash flow hedges of non-financial items, these gains and losses are reclassified and included in the initial carrying cost of the hedged asset or hedged liability. The gain or loss relating to any ineffective portion is recognized immediately in the consolidated statement of income.
When a hedging instrument expires or is sold, or when a hedge is discontinued or no longer meets the criteria for hedge accounting, any accumulated gain or loss recorded in other comprehensive income at that time remains in accumulated other comprehensive income until the originally hedged transaction affects income. When a forecasted transaction is no longer expected to occur, the accumulated gain or loss that was reported in other comprehensive income is immediately recorded in the consolidated statement of income.
Gains and losses relating to foreign exchange forward contracts that are not designated as hedges for accounting purposes are recorded in the consolidated statement of income as selling, general, and administrative expenses or finance costs, as appropriate.
Net Investment Hedges
The Company typically uses foreign currency debt to hedge foreign currency gains and losses on its long-term net investments in foreign operations. The effective portion of the gain or loss of such instruments associated with the hedged risk is recorded in other comprehensive income. These gains or losses are recognized in net income upon the disposal of a foreign operation (i.e. a disposal of the Company’s entire interest in a foreign operation, or a disposal that involves loss of control of a subsidiary that includes a foreign operation, loss of joint control over a jointly controlled entity that includes a foreign operation, or loss of significant influence over an associate that includes a foreign operation).
Finning International Inc. 2017 Annual Results
Notes to the Consolidated Financial Statements
24
Market risk is the risk that changes in the market, such as foreign exchange rates and interest rates, will affect the Company’s income or the fair value of its financial instruments. The objective of market risk management is to manage and control market risk exposures within acceptable parameters.
Foreign Exchange Risk
The Company is geographically diversified, with significant investments in several different countries. The Company transacts business in multiple currencies, the most significant of which are the CAD, USD, GBP, CLP, and Argentine peso (ARS).
As a result, the Company has foreign currency exposure with respect to items denominated in foreign currencies. The main types of foreign exchange risk of the Company can be categorized as follows:
Translation Exposure
The most significant foreign exchange impact on the Company’s net income and other comprehensive income is the translation of foreign currency based earnings and net assets or liabilities into Canadian dollars, which is the Company’s presentation currency. The Company’s South American and UK & Ireland operations have functional currencies other than the CAD and, as a result, exchange rate movements between the USD/CAD and GBP/CAD will impact the consolidated results of the South American and UK & Ireland operations in CAD terms. The Company does not hedge its exposure to foreign exchange risk with regard to foreign currency earnings.
Assets and liabilities of the Company’s South American and UK & Ireland operations are translated into CAD using the exchange rates in effect at the statement of financial position dates. Any translation gains and losses are recorded as foreign currency translation adjustments in other comprehensive income. To the extent practical, it is the Company’s objective to manage this exposure. The Company has hedged a portion of its foreign investments with foreign currency denominated loans.
The fair value of the Company’s long-term debt that is designated as net investment hedging instruments is $813 million (2016: $839 million).
Transaction Exposure
Many of the Company’s operations purchase, sell, rent, and lease products as well as incur costs in currencies other than their functional currency. This mismatch of currencies creates transactional exposure, which may affect the Company’s profitability as exchange rates fluctuate. For example, the Company’s Canadian operating results are exposed to volatility in USD/CAD rates between the timing of equipment and parts purchases and the ultimate sale to customers. A portion of this exposure is hedged through the use of forward exchange contracts as well as managed through pricing practices. The Company applies hedge accounting to hedges of certain inventory purchases in its Canadian and UK operations. For the year ended December 31, 2017 the Company entered into forward exchange contracts for inventory purchases of U.S. $319 million of which approximately U.S. $19 million related to forecast transactions that were no longer expected to occur. These hedges were discontinued and the ineffective portion of $(1) million was recognized in the consolidated statement of net income immediately.
The results of the Company’s operations are impacted by the translation of its foreign denominated transactions; the results of the Canadian operations are impacted by USD based revenue and costs and the results of the South American operations are impacted by CLP and ARS based revenues and costs.
The Company is also exposed to foreign currency risks related to the future cash flows on its foreign denominated financial assets and financial liabilities and foreign denominated net asset or net liability positions on its statement of financial position. The Company enters into forward exchange contracts to manage some mismatches in foreign currency cash flows but does not fully hedge balance sheet exposure so this may result in unrealized foreign exchange gains or losses until the financial assets and financial liabilities are settled.
The fair value of derivative instruments designated as cash flow hedging instruments is $(2) million (2016: less than $1 million).
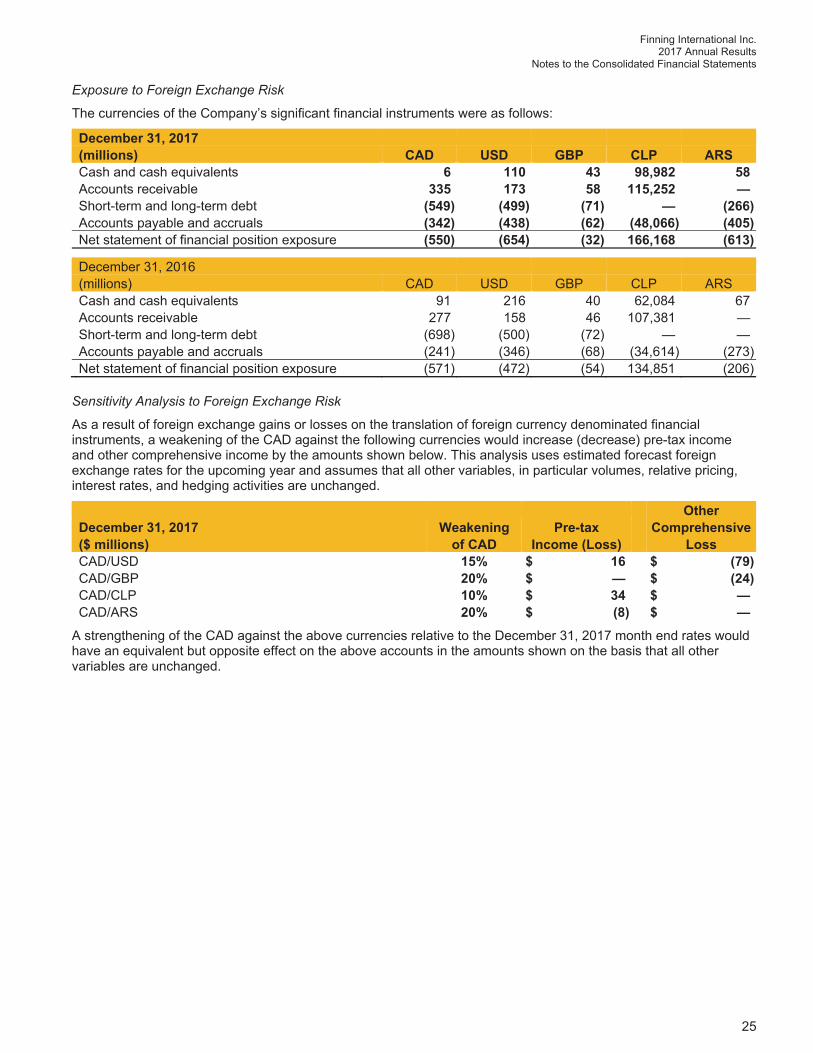
Finning International Inc. 2017 Annual Results
Notes to the Consolidated Financial Statements
25
Exposure to Foreign Exchange Risk
The currencies of the Company’s significant financial instruments were as follows:
December 31, 2017 (millions) CAD USD GBP CLP ARS
Cash and cash equivalents 6 110 43 98,982 58 Accounts receivable 335 173 58 115,252 — Short-term and long-term debt (549) (499) (71) — (266) Accounts payable and accruals (342) (438) (62) (48,066) (405) Net statement of financial position exposure (550) (654) (32) 166,168 (613)
December 31, 2016 (millions) CAD USD GBP CLP ARS
Cash and cash equivalents 91 216 40 62,084 67 Accounts receivable 277 158 46 107,381 — Short-term and long-term debt (698) (500) (72) — — Accounts payable and accruals (241) (346) (68) (34,614) (273) Net statement of financial position exposure (571) (472) (54) 134,851 (206)
Sensitivity Analysis to Foreign Exchange Risk
As a result of foreign exchange gains or losses on the translation of foreign currency denominated financial instruments, a weakening of the CAD against the following currencies would increase (decrease) pre-tax income and other comprehensive income by the amounts shown below. This analysis uses estimated forecast foreign exchange rates for the upcoming year and assumes that all other variables, in particular volumes, relative pricing, interest rates, and hedging activities are unchanged.
Other December 31, 2017 Weakening Pre-tax Comprehensive($ millions) of CAD Income (Loss) Loss
CAD/USD 15% $ 16 $ (79) CAD/GBP 20% $ — $ (24) CAD/CLP 10% $ 34 $ — CAD/ARS 20% $ (8) $ —A strengthening of the CAD against the above currencies relative to the December 31, 2017 month end rates would have an equivalent but opposite effect on the above accounts in the amounts shown on the basis that all other variables are unchanged.
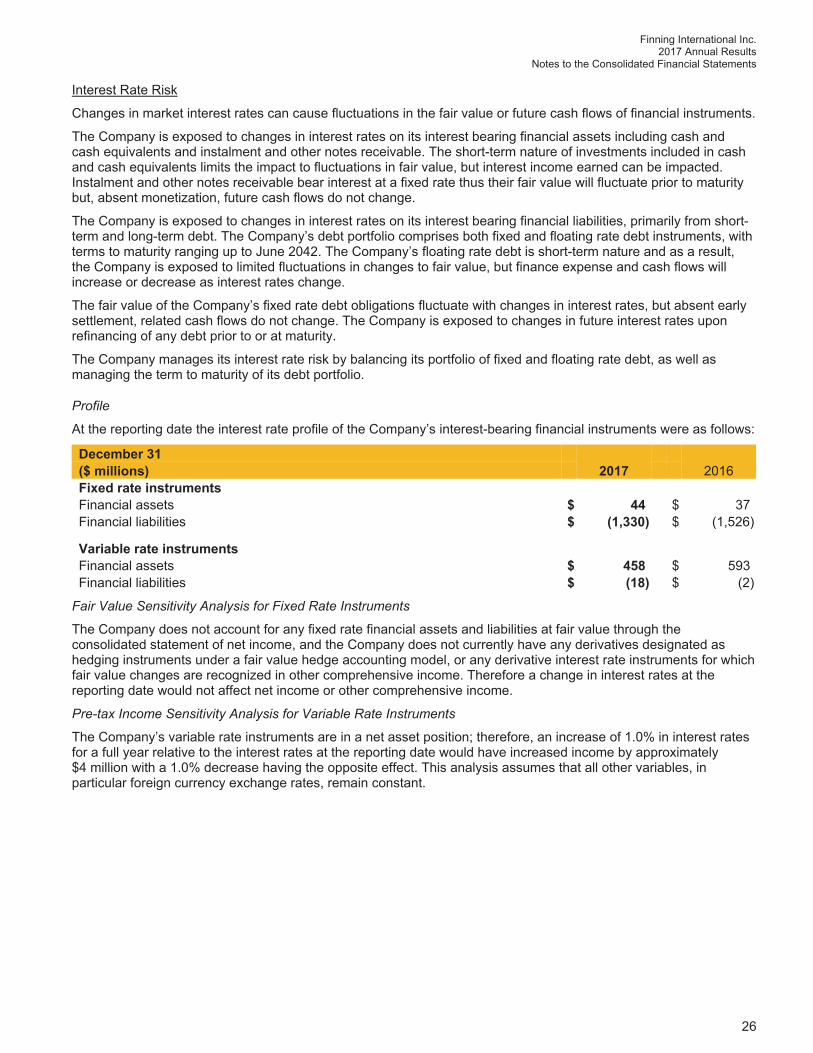
Finning International Inc. 2017 Annual Results
Notes to the Consolidated Financial Statements
26
Interest Rate Risk
Changes in market interest rates can cause fluctuations in the fair value or future cash flows of financial instruments.
The Company is exposed to changes in interest rates on its interest bearing financial assets including cash and cash equivalents and instalment and other notes receivable. The short-term nature of investments included in cash and cash equivalents limits the impact to fluctuations in fair value, but interest income earned can be impacted. Instalment and other notes receivable bear interest at a fixed rate thus their fair value will fluctuate prior to maturity but, absent monetization, future cash flows do not change.
The Company is exposed to changes in interest rates on its interest bearing financial liabilities, primarily from short-term and long-term debt. The Company’s debt portfolio comprises both fixed and floating rate debt instruments, with terms to maturity ranging up to June 2042. The Company’s floating rate debt is short-term nature and as a result, the Company is exposed to limited fluctuations in changes to fair value, but finance expense and cash flows will increase or decrease as interest rates change.
The fair value of the Company’s fixed rate debt obligations fluctuate with changes in interest rates, but absent early settlement, related cash flows do not change. The Company is exposed to changes in future interest rates upon refinancing of any debt prior to or at maturity.
The Company manages its interest rate risk by balancing its portfolio of fixed and floating rate debt, as well as managing the term to maturity of its debt portfolio.
Profile
At the reporting date the interest rate profile of the Company’s interest-bearing financial instruments were as follows:
December 31 2017 2016 ($ millions)
Fixed rate instruments Financial assets $ 44 $ 37 Financial liabilities $ (1,330) $ (1,526)
Variable rate instruments Financial assets $ 458 $ 593 Financial liabilities $ (18) $ (2)
Fair Value Sensitivity Analysis for Fixed Rate Instruments
The Company does not account for any fixed rate financial assets and liabilities at fair value through the consolidated statement of net income, and the Company does not currently have any derivatives designated as hedging instruments under a fair value hedge accounting model, or any derivative interest rate instruments for which fair value changes are recognized in other comprehensive income. Therefore a change in interest rates at the reporting date would not affect net income or other comprehensive income.
Pre-tax Income Sensitivity Analysis for Variable Rate Instruments
The Company’s variable rate instruments are in a net asset position; therefore, an increase of 1.0% in interest rates for a full year relative to the interest rates at the reporting date would have increased income by approximately $4 million with a 1.0% decrease having the opposite effect. This analysis assumes that all other variables, in particular foreign currency exchange rates, remain constant.
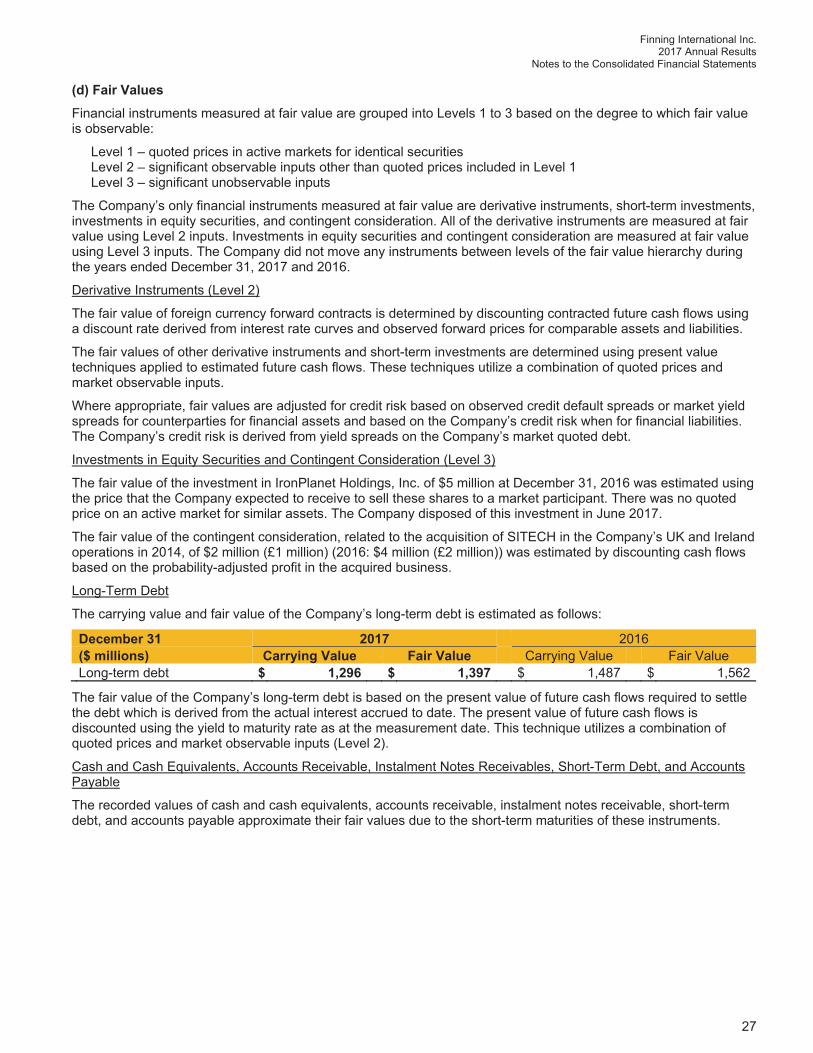
Finning International Inc. 2017 Annual Results
Notes to the Consolidated Financial Statements
27
(d) Fair ValuesFinancial instruments measured at fair value are grouped into Levels 1 to 3 based on the degree to which fair value is observable:
Level 1 – quoted prices in active markets for identical securities Level 2 – significant observable inputs other than quoted prices included in Level 1 Level 3 – significant unobservable inputs
The Company’s only financial instruments measured at fair value are derivative instruments, short-term investments, investments in equity securities, and contingent consideration. All of the derivative instruments are measured at fair value using Level 2 inputs. Investments in equity securities and contingent consideration are measured at fair value using Level 3 inputs. The Company did not move any instruments between levels of the fair value hierarchy during the years ended December 31, 2017 and 2016.
Derivative Instruments (Level 2)
The fair value of foreign currency forward contracts is determined by discounting contracted future cash flows using a discount rate derived from interest rate curves and observed forward prices for comparable assets and liabilities.
The fair values of other derivative instruments and short-term investments are determined using present value techniques applied to estimated future cash flows. These techniques utilize a combination of quoted prices and market observable inputs.
Where appropriate, fair values are adjusted for credit risk based on observed credit default spreads or market yield spreads for counterparties for financial assets and based on the Company’s credit risk when for financial liabilities. The Company’s credit risk is derived from yield spreads on the Company’s market quoted debt.
Investments in Equity Securities and Contingent Consideration (Level 3)
The fair value of the investment in IronPlanet Holdings, Inc. of $5 million at December 31, 2016 was estimated using the price that the Company expected to receive to sell these shares to a market participant. There was no quoted price on an active market for similar assets. The Company disposed of this investment in June 2017.
The fair value of the contingent consideration, related to the acquisition of SITECH in the Company’s UK and Ireland operations in 2014, of $2 million (£1 million) (2016: $4 million (£2 million)) was estimated by discounting cash flows based on the probability-adjusted profit in the acquired business.
Long-Term Debt
The carrying value and fair value of the Company’s long-term debt is estimated as follows:
December 31 2017 2016 ($ millions) Carrying Value Fair Value Carrying Value Fair Value
Long-term debt $ 1,296 $ 1,397 $ 1,487 $ 1,562
The fair value of the Company’s long-term debt is based on the present value of future cash flows required to settle the debt which is derived from the actual interest accrued to date. The present value of future cash flows is discounted using the yield to maturity rate as at the measurement date. This technique utilizes a combination of quoted prices and market observable inputs (Level 2).
Cash and Cash Equivalents, Accounts Receivable, Instalment Notes Receivables, Short-Term Debt, and Accounts Payable
The recorded values of cash and cash equivalents, accounts receivable, instalment notes receivable, short-term debt, and accounts payable approximate their fair values due to the short-term maturities of these instruments.
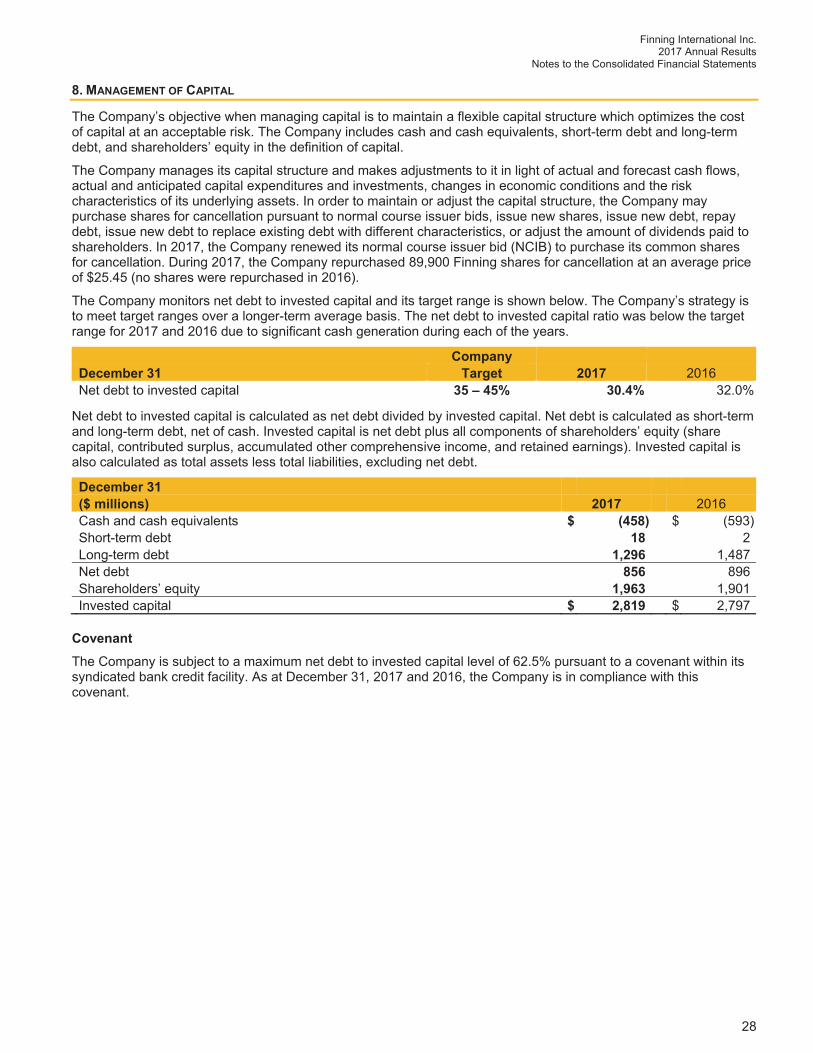
Finning International Inc. 2017 Annual Results
Notes to the Consolidated Financial Statements
28
8. MANAGEMENT OF CAPITAL
The Company’s objective when managing capital is to maintain a flexible capital structure which optimizes the cost of capital at an acceptable risk. The Company includes cash and cash equivalents, short-term debt and long-term debt, and shareholders’ equity in the definition of capital.
The Company manages its capital structure and makes adjustments to it in light of actual and forecast cash flows, actual and anticipated capital expenditures and investments, changes in economic conditions and the risk characteristics of its underlying assets. In order to maintain or adjust the capital structure, the Company may purchase shares for cancellation pursuant to normal course issuer bids, issue new shares, issue new debt, repay debt, issue new debt to replace existing debt with different characteristics, or adjust the amount of dividends paid to shareholders. In 2017, the Company renewed its normal course issuer bid (NCIB) to purchase its common shares for cancellation. During 2017, the Company repurchased 89,900 Finning shares for cancellation at an average price of $25.45 (no shares were repurchased in 2016).
The Company monitors net debt to invested capital and its target range is shown below. The Company’s strategy is to meet target ranges over a longer-term average basis. The net debt to invested capital ratio was below the target range for 2017 and 2016 due to significant cash generation during each of the years.
Company December 31 Target 2017 2016
Net debt to invested capital 35 – 45% 30.4% 32.0%
Net debt to invested capital is calculated as net debt divided by invested capital. Net debt is calculated as short-term and long-term debt, net of cash. Invested capital is net debt plus all components of shareholders’ equity (share capital, contributed surplus, accumulated other comprehensive income, and retained earnings). Invested capital is also calculated as total assets less total liabilities, excluding net debt.
December 31 ($ millions) 2017 2016
Cash and cash equivalents $ (458) $ (593) Short-term debt 18 2 Long-term debt 1,296 1,487 Net debt 856 896 Shareholders’ equity 1,963 1,901 Invested capital $ 2,819 $ 2,797
Covenant The Company is subject to a maximum net debt to invested capital level of 62.5% pursuant to a covenant within its syndicated bank credit facility. As at December 31, 2017 and 2016, the Company is in compliance with this covenant.
Finning International Inc. 2017 Annual Results
Notes to the Consolidated Financial Statements
29
9. SHARE CAPITAL
Accounting Policy Common shares repurchased by the Company are recognized as a reduction in share capital and contributed surplus (and retained earnings once contributed surplus is fully drawn down) on the date of repurchase. A liability is recognized for any committed repurchases but not yet settled at a reporting period end with a corresponding reduction in contributed surplus (or retained earnings). The cash consideration paid to repurchase shares is presented as a financing activity in the Statement of Cash Flows. Details of the transaction (number of shares repurchased and amount deducted from equity) are disclosed in the Statement of Shareholder’s Equity.
The Company is authorized to issue an unlimited number of preferred shares without par value, of which 4.4 million are designated as cumulative redeemable convertible preferred shares. The Company had no preferred shares outstanding for the years ended December 31, 2017 and 2016.
The Company is authorized to issue an unlimited number of common shares. All issued common shares have no par value and are fully paid.
The Company's dealership agreements with subsidiaries of Caterpillar Inc. (Caterpillar) are fundamental to its business and a change in control of Finning may result in Caterpillar exercising its right to terminate those dealership agreements.
In addition, a shareholder rights plan is in place, which is intended to provide all holders of common shares with the opportunity to receive full and fair value for all of their shares if a third party attempts to acquire a significant interest in the Company. The rights plan provides that one share purchase right has been issued for each common share and will trade with the common shares until such time as any person or group, other than a “permitted bidder”, bids to acquire or acquires 20% or more of the Company's common shares, at which time the share purchase rights become exercisable. The rights may also be triggered by a third party proposal for a merger, amalgamation or similar transaction. In May 2017, the rights plan was extended for three years such that it will automatically terminate at the end of the Company’s Annual Meeting of shareholders in 2020 unless further extended by the shareholders prior to that time. The rights plan was also amended to reflect recent amendments made to Canada’s take-over bid regime.
The rights will not be triggered if a bid meets certain criteria (a permitted bid). These criteria include that: the offer is made for all outstanding voting shares of the Company; more than 50% of the voting shares have been tendered by independent shareholders pursuant to the bid and
not withdrawn (voting shares tendered may be withdrawn until taken up and paid for); and the bid must expire not less than 105 days after the date of the bid circular, or such shorter period that a take-
over bid (that is not exempt from the general take-over bid requirements under applicable securities law) must remain open for deposits of securities thereunder, in the applicable circumstances at such time.
Finning International Inc. 2017 Annual Results
Notes to the Consolidated Financial Statements
30
10. SHARE-BASED PAYMENTS
Accounting Policy The Company has share option plans and other share-based compensation plans for directors and certain eligible employees.
Equity settled share-based payments are measured at fair value using the Black-Scholes option pricing model. The fair value is determined on the grant date of the share option and recorded over the vesting period in selling, general, and administrative expense, based on the Company’s estimate of options that will vest, with a corresponding increase to contributed surplus. When share options are exercised, the proceeds received by the Company, together with any related amount recorded in contributed surplus, are credited to share capital.
Total Shareholder Return Performance Share Units are measured at fair value using the Monte Carlo model and all other cash-settled share-based awards are measured at fair value using the period-end closing share price (2016: Black-Scholes model). Cash settled share-based compensation plans are recognized as a liability. Compensation expense which arises from vesting and fluctuations in the fair value of the Company’s cash settled share-based compensation plans is recognized in selling, general, and administrative expense in the consolidated statement of income with the corresponding liability recorded on the consolidated statement of financial position in long-term other liabilities.
Areas of Estimation Uncertainty The Company uses inputs in the Black-Scholes option pricing models to determine the fair value of share options. Inputs to the model are subject to various estimates relating to volatility, interest rates, dividend yields and expected life of the units issued. Fair value inputs are subject to market factors as well as internal estimates. The Company considers historic trends together with any new information to determine the best estimate of fair value at the date of grant. Separate from the fair value calculation, the Company is required to estimate the expected forfeiture rate of equity-settled share-based payments in estimating how many units will vest.
The Company also estimates the projected outcome of performance conditions for Performance Share Units (PSUs), including the relative ranking of the Company’s total shareholder return compared with a specified peer group using a Monte Carlo simulation option-pricing model and forecasting the Company’s return on invested capital.
In 2017 and 2016, long-term incentives for executives and senior management were a combination of share options, performance share units, restricted share units, and deferred share units.
Share Options The Company has one share option plan for certain employees. Options granted under the plan vest over a three-year period and are exercisable over a seven-year period. The exercise price of each option is based on the weighted average trading price of the common shares of the Company on the date prior to the grant. Under the Stock Option Plan, the Company may issue up to 7.5 million common shares pursuant to the exercise of share options. At December 31, 2017, approximately 2 million common shares remain eligible to be issued in connection with future grants.
In 2017, the Company granted 440,238 common share options to senior executives and management of the Company (2016: 515,840 common share options). The Company only grants and prices share options when all material information has been disclosed to the market.
Under the Stock Option Plan, exercises generally utilize the cashless method, whereby the actual number of shares issued is based on the premium between the fair value at the time of exercise and the grant value, and the equivalent value of the number of options up to the grant value is withheld. Share options exercised in 2017 comprised both cash and cashless exercises. 1,007,594 options were exercised in 2017 resulting in 189,280 common shares being issued; 818,314 options were withheld and returned to the option pool for future issues/grants (2016: 636,091 options were exercised resulting in 135,774 common shares being issued; 500,317 options were withheld and returned to the option pool for future issues/grants).
Finning International Inc. 2017 Annual Results
Notes to the Consolidated Financial Statements
31
Details of the share option plans are as follows:
2017 2016 Weighted Average Weighted Average
For years ended December 31 Options Exercise Price Options Exercise Price Options outstanding, beginning of year 4,563,871 $ 25.20 5,170,689 $ 24.78 Granted 440,238 $ 26.84 515,840 $ 22.05 Exercised (1,007,594) $ 24.71 (636,091) $ 18.44 Forfeited (132,177) $ 27.10 (485,644) $ 26.28 Expired — $ — (923) $ 24.25 Options outstanding, end of year 3,864,338 $ 25.45 4,563,871 $ 25.20 Exercisable, end of year 2,641,850 $ 25.66 2,829,646 $ 25.32
The fair value of the options granted has been estimated on the date of grant using the following weighted-average assumptions:
2017 Grant 2016 Grant Dividend yield 2.72% 2.55% Expected volatility (1) 29.32% 30.56% Risk-free interest rate 1.10% 0.76% Expected life 5.55 years 5.45 years Share price $ 26.84 $ 22.05 (1) Expected volatility is based on historical share price volatility of Finning shares
The weighted average grant date fair value of options granted during the year was $5.49 (2016: $4.69).
The following table summarizes information about share options outstanding at December 31, 2017:
Options Outstanding Options Exercisable Weighted Weighted Weighted
Range of Number Average Average Number Average exercise prices outstanding Remaining Life Exercise Price outstanding Exercise Price
$19.53 - $22.15 693,098 4.44 years $ 21.79 370,186 $ 21.81 $22.16 - $24.97 375,194 2.33 years $ 22.40 375,194 $ 22.40 $24.98 - $25.47 1,127,110 4.36 years $ 25.44 688,316 $ 25.44 $25.48 - $27.46 861,474 4.32 years $ 26.27 406,124 $ 25.72 $27.47 - $32.38 807,462 3.01 years $ 29.14 802,030 $ 29.12 3,864,338 3.89 years $ 25.45 2,641,850 $ 25.66
Other Share-Based Payment PlansThe Company has other share-based payment plans in the form of deferred share units, performance share units, and restricted share units that use notional common share units.
Details of the plans are as follows:
Directors
Directors’ Deferred Share Unit (DDSU) Plan A
The Company offers a DDSU Plan A for members of the Board of Directors. Under the DDSU Plan A, non-employee Directors of the Company may also elect to allocate all or a portion of their annual compensation as deferred share units. These units are fully vested upon issuance. These units accumulate dividend equivalents in the form of additional units based on the dividends paid on the Company’s common shares.
Units are redeemable for cash or shares or a combination of cash and shares (as requested by the holder) only following cessation of service on the Board of Directors and must be redeemed by December 31st of the year following the year in which the cessation occurred. The value of the deferred share units when converted to cash will be equivalent to the market value of the Company’s common shares at the time the conversion takes place.
Finning International Inc. 2017 Annual Results
Notes to the Consolidated Financial Statements
32
Non-employee Directors of the Company were granted a total of 55,698 share units in 2017 (2016: 49,839 share units), and expensed over the calendar year as the units were issued. An additional 22,410 (2016: 31,416) DDSUs were issued in lieu of cash compensation payable for service as a Director. A further 10,467 (2016: 9,968) DDSUs were granted to Directors during 2017 as payment for notional dividends.
Executive
Executive Deferred Share Unit (Exec DSU) Plan
Under the Exec DSU Plan, executives of the Company may elect to have all or a portion of their annual bonus issued in the form of deferred share units. The Exec DSU Plan utilizes notional units that become fully vested at the time of issuance. Vested deferred share units are redeemable for cash before December 15th of the year following the year employment with the Company ceases. Only vested units accumulate dividend equivalents in the form of additional units based on the dividends paid on the Company’s common shares.
Executives were granted a total of 9,589 deferred share units in 2017 (2016: 24,250) in lieu of their annual bonus payment and 878 deferred share units (2016: 794 deferred share units) were issued as payment for notional dividends.
Deferred Share Unit (DSU-B) Plan B for Executives
Under the DSU-B Plan, executives of the Company may be awarded deferred share units as approved by the Board of Directors. The DSU-B Plan utilizes notional units that become vested in accordance with terms set at the time of grant, or in certain years, the vesting schedule set out in the plan. Vested deferred share units are redeemable for cash or for common shares of the Company for a period of 30 days after cessation of employment with the Company, or before December 31st of the year following the year of retirement, death, or disability. Deferred share units that have not vested within five years from the date that they were granted will expire. Only vested units accumulate dividend equivalents in the form of additional deferred share units based on the dividends paid on the Company’s common shares.
During 2017, 4,263 (2016: 7,987) DSU-Bs were granted to executives as payment for notional dividends.
Performance Share Unit (PSU) Plan
Under the PSU Plan, executives of the Company may be awarded performance share units as approved by the Board of Directors. This plan utilizes notional units that vest upon achieving future specified performance levels. Vested units accumulate dividend equivalents in the form of additional units based on the dividends paid on the Company’s common shares. All PSUs granted in 2017 and 2016 were divided equally into two categories. Half of the awards are based on the extent to which the Company’s average return on invested capital achieves or exceeds the specified performance levels over a three-year period (ROIC PSUs). The remaining half of the awards is based on the performance of the Company’s total shareholder return over the three-year period relative to the performance of the total shareholder return of all companies in the S&P/TSX Capped Industrials Index (TSR PSUs).
Vested performance share units are redeemable in cash based on the five-day volume-weighted average price of the common shares at the end of the performance period. Executives of the Company were granted a total of 448,782 performance share units in 2017, based on 100% vesting (2016: 630,580 performance share units) and 14,000 dividend equivalent units were recorded in relation to the 2015 grant as the expected payout (2016: 8,000 dividend equivalent units were recorded in relation to the 2014 grant as the expected payout).
Compensation expense for the PSU Plan is recorded over the three-year performance period. The amount of compensation expense is adjusted over the three-year performance period to reflect the fair value of the PSUs and the number of PSUs anticipated to vest.
Finning International Inc. 2017 Annual Results
Notes to the Consolidated Financial Statements
33
The specified levels and respective vesting percentages for the 2017 and 2016 grant are as follows:
TSR PSUs
Percentile Rank < 25th Percentile 25th Percentile 50th Percentile 75th Percentile 100th Percentile TSR PSUs Vested 0% 50% 100% 150% 200%
ROIC PSUs
The specified levels and respective vesting percentages for the 2017 grant are as follows: Average Return on Invested Capital
Performance Level (over three-year period) Proportion of PSUs Vesting Below Threshold < 9.5% Nil Threshold 9.5% 50% Target 12.5% 100% Maximum 15.5% or more 200%
The specified levels and respective vesting percentages for the 2016 grant are as follows: Average Return on Invested Capital
Performance Level (over three-year period) Proportion of PSUs Vesting Below Threshold < 9.5% Nil Threshold 9.5% 50% Target 12.5% 100% Maximum 14% or more 200%
Restricted Share Unit Plan
In February 2016, the Board of Directors approved a Restricted Share Unit (RSU) Plan for executives. This plan utilizes notional units that may become vested in accordance with terms set at the time of grant. All units accumulate dividend equivalents in the form of additional units based on the dividends paid on the Company’s common shares.
Restricted share units that have vested are redeemable in cash based on the five-day volume-weighted average trading price of the Company’s common shares at the end of the three-year period. During the year ended December 31, 2017, 197,709 units were granted to Executives (2016: 271,455 units) and 10,915 notional units (2016: 5,934 notional units) are issuable as payment for dividends upon vesting.
Finning International Inc. 2017 Annual Results
Notes to the Consolidated Financial Statements
34
Details of the DSU, PSU, and RSU plans are as follows: For year ended December 31, 2017 Exec Units DSU DSU-B DDSU PSU RSU Total
Outstanding, beginning of year 24,889 191,467 368,366 824,962 262,196 1,671,880 Additions 10,467 4,263 88,575 613,858 208,624 925,787 Exercised — (73,187) (38,657) (82,759) — (194,603) Forfeited — — — (51,603) (22,740) (74,343) Outstanding, end of year 35,356 122,543 418,284 1,304,458 448,080 2,328,721
Vested, beginning of year 24,889 187,201 368,366 93,824 — 674,280 Vested 10,467 8,529 88,575 162,046 — 269,617 Exercised — (73,187) (38,657) (82,759) — (194,603) Vested, end of year 35,356 122,543 418,284 173,111 — 749,294
Liability ($ millions)
Balance, beginning of year $ 1 $ 4 $ 8 $ 12 $ 2 $ 27 Expensed — 2 6 18 5 31 Exercised — (2) (1) (3) — (6) Forfeited — — — (2) — (2) Balance, end of year $ 1 $ 4 $ 13 $ 25 $ 7 $ 50
For year ended December 31, 2016 Exec Units DSU DSU-B DDSU PSU RSU Total Outstanding, beginning of year — 272,742 277,143 163,444 — 713,329 Additions 25,044 7,987 91,223 718,499 277,389 1,120,142 Exercised (155) (89,262) — — — (89,417) Forfeited — — — (56,981) (15,193) (72,174) Outstanding, end of year 24,889 191,467 368,366 824,962 262,196 1,671,880
Vested, beginning of year — 264,210 277,143 — — 541,353 Vested 25,044 12,253 91,223 93,824 — 222,344 Exercised (155) (89,262) — — — (89,417) Vested, end of year 24,889 187,201 368,366 93,824 — 674,280
Liability
($ millions)
Balance, beginning of year $ — $ 5 $ 4 $ 2 $ — $ 11 Expensed 1 1 4 11 2 19 Exercised — (2) — — — (2) Forfeited — — — (1) — (1) Balance, end of year $ 1 $ 4 $ 8 $ 12 $ 2 $ 27
Finning International Inc. 2017 Annual Results
Notes to the Consolidated Financial Statements
35
The fair value of the DSUs, ROIC PSUs, and RSUs outstanding as at December 31, 2017 has been estimated using the period-end closing share price of $31.72 and December 31, 2016 has been estimated using the Black-Scholes option-pricing model with the following weighted-average assumptions:
December 31, 2016 Exec DSU DSU-B DDSU PSU RSU Dividend yield 2.79 % 2.79 % 2.67 % 2.98 % 2.98 % Expected volatility 28.97 % 28.97 % 30.61 % 29.94 % 29.94 % Risk-free interest rate 1.06 % 1.06 % 1.19 % 0.85 % 0.85 % Expected life 4.66 years 4.66 years 5.58 years 3.00 years 3.00 years Share price at year-end $ 26.29 $ 26.29 $ 26.29 $ 26.29 $ 26.29 Estimated fair value per unit at year end $ 23.08 $ 23.08 $ 22.65 $ 24.04 $ 24.04
The impact of the share-based payment plans on the Company’s financial statements was as follows: For years ended December 31
2017 2016 ($ millions) Consolidated statement of income Compensation expense arising from equity-settled share option incentive plan $ 3 $ 5 Compensation expense arising from cash-settled share based payments 29 19 $ 32 $ 24 Consolidated statement of financial position Current liability for cash-settled share-based payments $ 5 $ 4 Non-current liability for cash-settled share-based payments (to be incurred between 1-5 years) (Note 21) $ 45 $ 23
The total intrinsic value of vested but not settled share-based payments was $24 million (2016: $18 million).
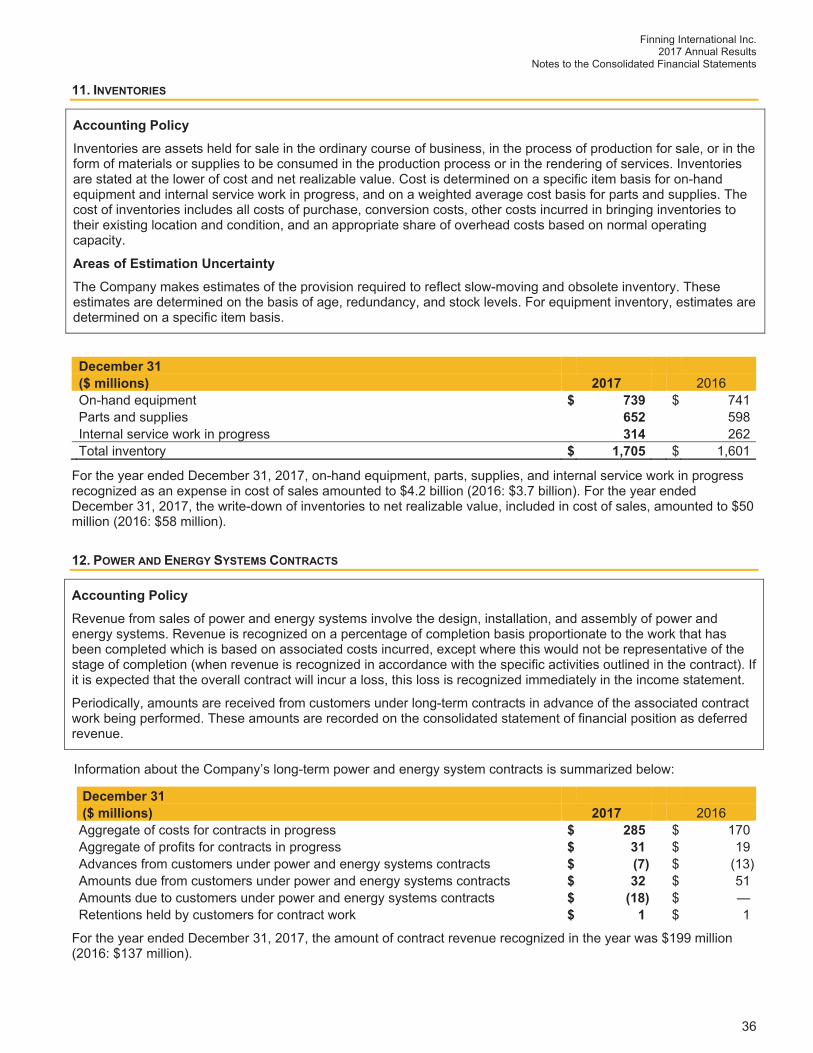
Finning International Inc. 2017 Annual Results
Notes to the Consolidated Financial Statements
36
11. INVENTORIES
Accounting Policy Inventories are assets held for sale in the ordinary course of business, in the process of production for sale, or in the form of materials or supplies to be consumed in the production process or in the rendering of services. Inventories are stated at the lower of cost and net realizable value. Cost is determined on a specific item basis for on-hand equipment and internal service work in progress, and on a weighted average cost basis for parts and supplies. The cost of inventories includes all costs of purchase, conversion costs, other costs incurred in bringing inventories to their existing location and condition, and an appropriate share of overhead costs based on normal operating capacity.
Areas of Estimation Uncertainty The Company makes estimates of the provision required to reflect slow-moving and obsolete inventory. These estimates are determined on the basis of age, redundancy, and stock levels. For equipment inventory, estimates are determined on a specific item basis.
December 31 ($ millions) 2017 2016
On-hand equipment $ 739 $ 741 Parts and supplies 652 598 Internal service work in progress 314 262 Total inventory $ 1,705 $ 1,601
For the year ended December 31, 2017, on-hand equipment, parts, supplies, and internal service work in progress recognized as an expense in cost of sales amounted to $4.2 billion (2016: $3.7 billion). For the year ended December 31, 2017, the write-down of inventories to net realizable value, included in cost of sales, amounted to $50 million (2016: $58 million).
12. POWER AND ENERGY SYSTEMS CONTRACTS
Accounting Policy Revenue from sales of power and energy systems involve the design, installation, and assembly of power and energy systems. Revenue is recognized on a percentage of completion basis proportionate to the work that has been completed which is based on associated costs incurred, except where this would not be representative of the stage of completion (when revenue is recognized in accordance with the specific activities outlined in the contract). If it is expected that the overall contract will incur a loss, this loss is recognized immediately in the income statement.
Periodically, amounts are received from customers under long-term contracts in advance of the associated contract work being performed. These amounts are recorded on the consolidated statement of financial position as deferred revenue.
Information about the Company’s long-term power and energy system contracts is summarized below:
December 31 ($ millions) 2017 2016 Aggregate of costs for contracts in progress $ 285 $ 170 Aggregate of profits for contracts in progress $ 31 $ 19 Advances from customers under power and energy systems contracts $ (7) $ (13) Amounts due from customers under power and energy systems contracts $ 32 $ 51 Amounts due to customers under power and energy systems contracts $ (18) $ — Retentions held by customers for contract work $ 1 $ 1
For the year ended December 31, 2017, the amount of contract revenue recognized in the year was $199 million (2016: $137 million).
Finning International Inc. 2017 Annual Results
Notes to the Consolidated Financial Statements
37
13. INCOME TAXES
Accounting Policy The balance sheet liability method of tax allocation is used in accounting for income taxes. Under this method, the carry forward of unused tax losses and unused tax credits and the temporary differences arising from the difference between the tax basis of an asset and a liability and its carrying amount on the statement of financial position are used to calculate deferred tax assets or liabilities. Deferred tax liabilities are recognized for all taxable temporary differences and deferred tax assets are recognized to the extent that it is probable that taxable profits will be available against which the carry forward of unused tax losses, unused tax credits, and the deductible temporary differences can be utilized. Such deferred tax assets and liabilities are not recognized if the temporary difference arises from the initial recognition of goodwill or from the initial recognition (other than in a business combination) of other assets and liabilities in a transaction that affects neither taxable profit nor the accounting profit. Deferred tax liabilities are recognized for taxable temporary differences associated with investments in subsidiaries and associates, and interests in joint ventures, except where the Company is able to control the reversal of the temporary difference and it is probable that the temporary difference will not reverse in the foreseeable future. Deferred tax assets or liabilities are calculated using tax rates anticipated to be in effect in the periods that the asset is expected to be realized or the liability is expected to be settled based on the laws that have been enacted or substantively enacted by the reporting date. The effect of a change in income tax rates on deferred tax assets and liabilities is recognized in income and/or equity in the period that the change becomes enacted or substantively enacted.
The charge for current tax is based on the results for the year as adjusted for items which are non-assessable or disallowed using tax rates enacted or substantively enacted by the statement of financial position date.
Deferred tax assets and liabilities are offset when there is a legally enforceable right to set off current tax assets against current tax liabilities and when they relate to income taxes levied by the same taxation authority and the Company intends to settle its tax assets and liabilities on a net basis.
Current and deferred tax are recognized in net income, except when they relate to items that are recognized in other comprehensive income or directly in equity, in which case, the current and deferred tax are also recognized in other comprehensive income or directly in equity, respectively. Where current tax or deferred tax arises from the initial accounting for a business combination, the tax effect is included in the accounting for the business combination. The Company records the deferred tax impact of foreign exchange gains or losses arising on the translation of foreign denominated non-monetary assets and non-monetary liabilities in provision for income tax in the consolidated statement of net income.
Areas of Estimation Uncertainty Estimations of the tax asset or liability require assessments to be made based on the potential tax treatment of certain items that will only be resolved once finally agreed with the relevant tax authorities.
Assumptions underlying the composition of deferred tax assets and liabilities include estimates of future results of operations and the timing of reversal of temporary differences as well as the substantively enacted tax rates and laws in each jurisdiction at the time of the expected reversal. The composition of deferred tax assets and liabilities change from period to period due to the uncertainties surrounding these assumptions and changes in tax rates or regimes could have a material adverse effect on expected results.
Areas of Significant Judgment Judgment is required as income tax laws and regulations can be complex and are potentially subject to different interpretation between the Company and the respective tax authority. Due to the number of variables associated with the differing tax laws and regulations across the multiple jurisdictions in which the Company operates, the precision and reliability of the resulting estimates are subject to uncertainties and may change as additional information becomes known. Net income in subsequent periods may be impacted by the amount that estimates differ from the final tax return.
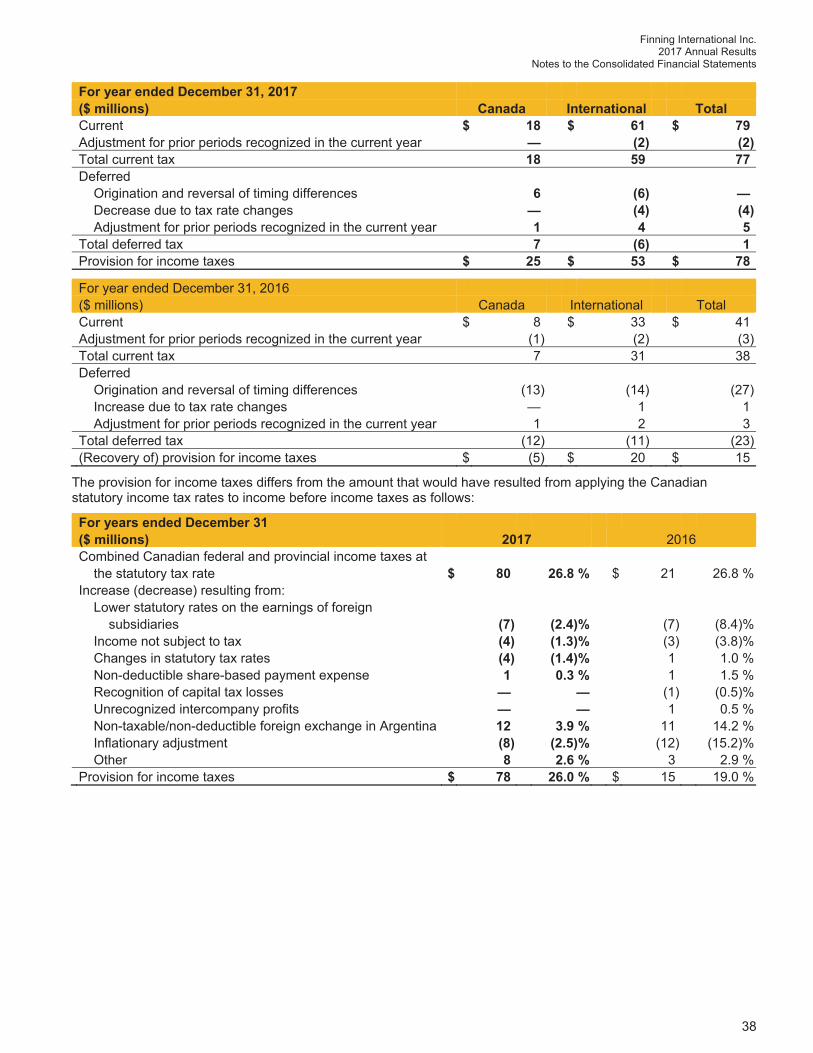
Finning International Inc. 2017 Annual Results
Notes to the Consolidated Financial Statements
38
For year ended December 31, 2017 ($ millions) Canada International Total Current $ 18 $ 61 $ 79Adjustment for prior periods recognized in the current year — (2) (2)Total current tax 18 59 77Deferred Origination and reversal of timing differences 6 (6) — Decrease due to tax rate changes — (4) (4) Adjustment for prior periods recognized in the current year 1 4 5Total deferred tax 7 (6) 1Provision for income taxes $ 25 $ 53 $ 78
For year ended December 31, 2016 ($ millions) Canada International Total Current $ 8 $ 33 $ 41 Adjustment for prior periods recognized in the current year (1) (2) (3) Total current tax 7 31 38 Deferred Origination and reversal of timing differences (13) (14) (27) Increase due to tax rate changes — 1 1 Adjustment for prior periods recognized in the current year 1 2 3 Total deferred tax (12) (11) (23) (Recovery of) provision for income taxes $ (5) $ 20 $ 15
The provision for income taxes differs from the amount that would have resulted from applying the Canadian statutory income tax rates to income before income taxes as follows:
For years ended December 31 ($ millions) 2017 2016 Combined Canadian federal and provincial income taxes at the statutory tax rate $ 80 26.8 % $ 21 26.8 %Increase (decrease) resulting from: Lower statutory rates on the earnings of foreign subsidiaries (7) (2.4)% (7) (8.4)% Income not subject to tax (4) (1.3)% (3) (3.8)% Changes in statutory tax rates (4) (1.4)% 1 1.0 % Non-deductible share-based payment expense 1 0.3 % 1 1.5 % Recognition of capital tax losses — — (1) (0.5)% Unrecognized intercompany profits — — 1 0.5 % Non-taxable/non-deductible foreign exchange in Argentina 12 3.9 % 11 14.2 % Inflationary adjustment (8) (2.5)% (12) (15.2)% Other 8 2.6 % 3 2.9 %Provision for income taxes $ 78 26.0 % $ 15 19.0 %
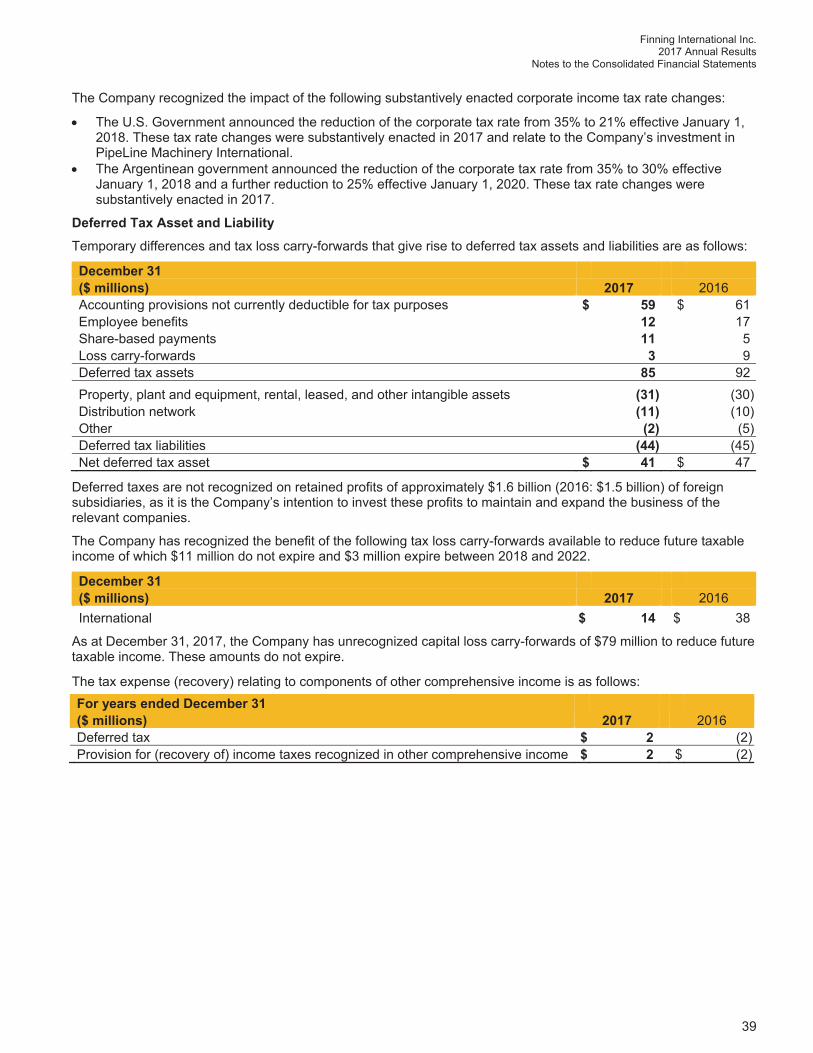
Finning International Inc. 2017 Annual Results
Notes to the Consolidated Financial Statements
39
The Company recognized the impact of the following substantively enacted corporate income tax rate changes:
The U.S. Government announced the reduction of the corporate tax rate from 35% to 21% effective January 1, 2018. These tax rate changes were substantively enacted in 2017 and relate to the Company’s investment in PipeLine Machinery International.
The Argentinean government announced the reduction of the corporate tax rate from 35% to 30% effective January 1, 2018 and a further reduction to 25% effective January 1, 2020. These tax rate changes were substantively enacted in 2017.
Deferred Tax Asset and Liability Temporary differences and tax loss carry-forwards that give rise to deferred tax assets and liabilities are as follows:
December 31 ($ millions) 2017 2016
Accounting provisions not currently deductible for tax purposes $ 59 $ 61 Employee benefits 12 17 Share-based payments 11 5 Loss carry-forwards 3 9 Deferred tax assets 85 92 Property, plant and equipment, rental, leased, and other intangible assets (31) (30) Distribution network (11) (10) Other (2) (5) Deferred tax liabilities (44) (45) Net deferred tax asset $ 41 $ 47
Deferred taxes are not recognized on retained profits of approximately $1.6 billion (2016: $1.5 billion) of foreign subsidiaries, as it is the Company’s intention to invest these profits to maintain and expand the business of the relevant companies.
The Company has recognized the benefit of the following tax loss carry-forwards available to reduce future taxable income of which $11 million do not expire and $3 million expire between 2018 and 2022.
December 31 ($ millions) 2017 2016
International $ 14 $ 38
As at December 31, 2017, the Company has unrecognized capital loss carry-forwards of $79 million to reduce future taxable income. These amounts do not expire.
The tax expense (recovery) relating to components of other comprehensive income is as follows: For years ended December 31 ($ millions) 2017 2016
Deferred tax $ 2 (2) Provision for (recovery of) income taxes recognized in other comprehensive income $ 2 $ (2)
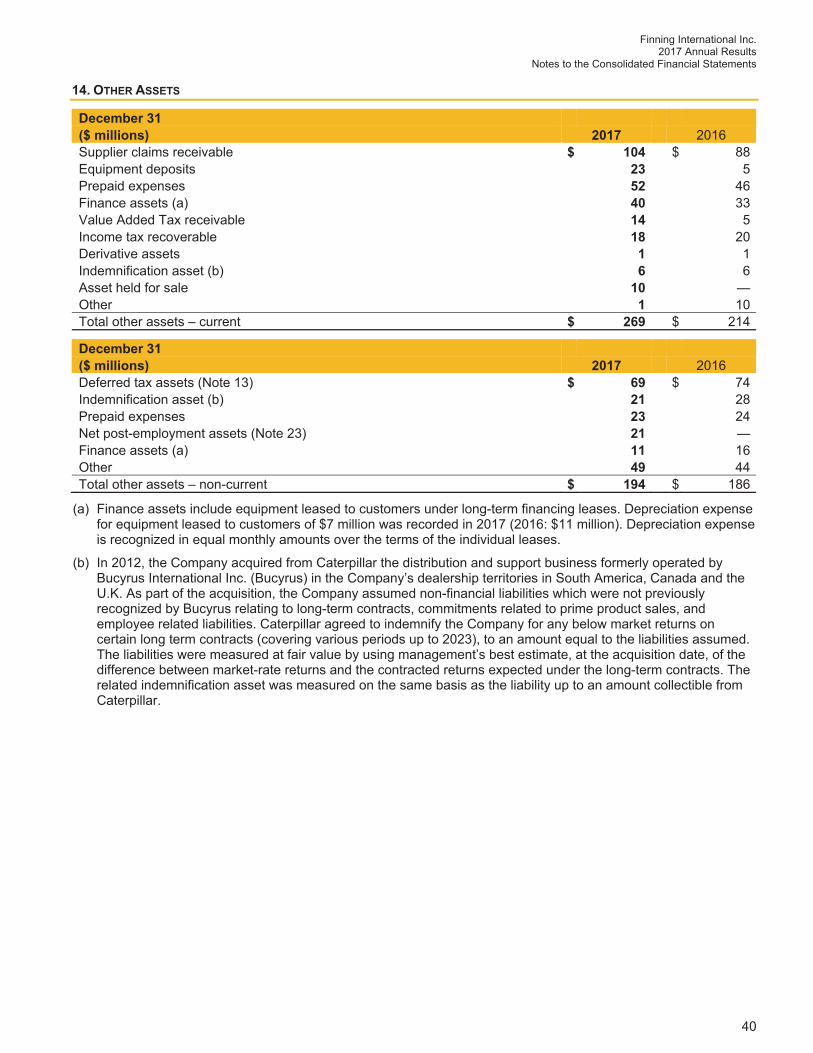
Finning International Inc. 2017 Annual Results
Notes to the Consolidated Financial Statements
40
14. OTHER ASSETS
December 31 ($ millions) 2017 2016
Supplier claims receivable $ 104 $ 88 Equipment deposits 23 5 Prepaid expenses 52 46 Finance assets (a) 40 33 Value Added Tax receivable 14 5 Income tax recoverable 18 20 Derivative assets 1 1 Indemnification asset (b) 6 6 Asset held for sale 10 — Other 1 10 Total other assets – current $ 269 $ 214
December 31 ($ millions) 2017 2016
Deferred tax assets (Note 13) $ 69 $ 74 Indemnification asset (b) 21 28 Prepaid expenses 23 24 Net post-employment assets (Note 23) 21 — Finance assets (a) 11 16 Other 49 44 Total other assets – non-current $ 194 $ 186
(a) Finance assets include equipment leased to customers under long-term financing leases. Depreciation expense for equipment leased to customers of $7 million was recorded in 2017 (2016: $11 million). Depreciation expense is recognized in equal monthly amounts over the terms of the individual leases.
(b) In 2012, the Company acquired from Caterpillar the distribution and support business formerly operated by Bucyrus International Inc. (Bucyrus) in the Company’s dealership territories in South America, Canada and the U.K. As part of the acquisition, the Company assumed non-financial liabilities which were not previously recognized by Bucyrus relating to long-term contracts, commitments related to prime product sales, and employee related liabilities. Caterpillar agreed to indemnify the Company for any below market returns on certain long term contracts (covering various periods up to 2023), to an amount equal to the liabilities assumed. The liabilities were measured at fair value by using management’s best estimate, at the acquisition date, of the difference between market-rate returns and the contracted returns expected under the long-term contracts. The related indemnification asset was measured on the same basis as the liability up to an amount collectible from Caterpillar.
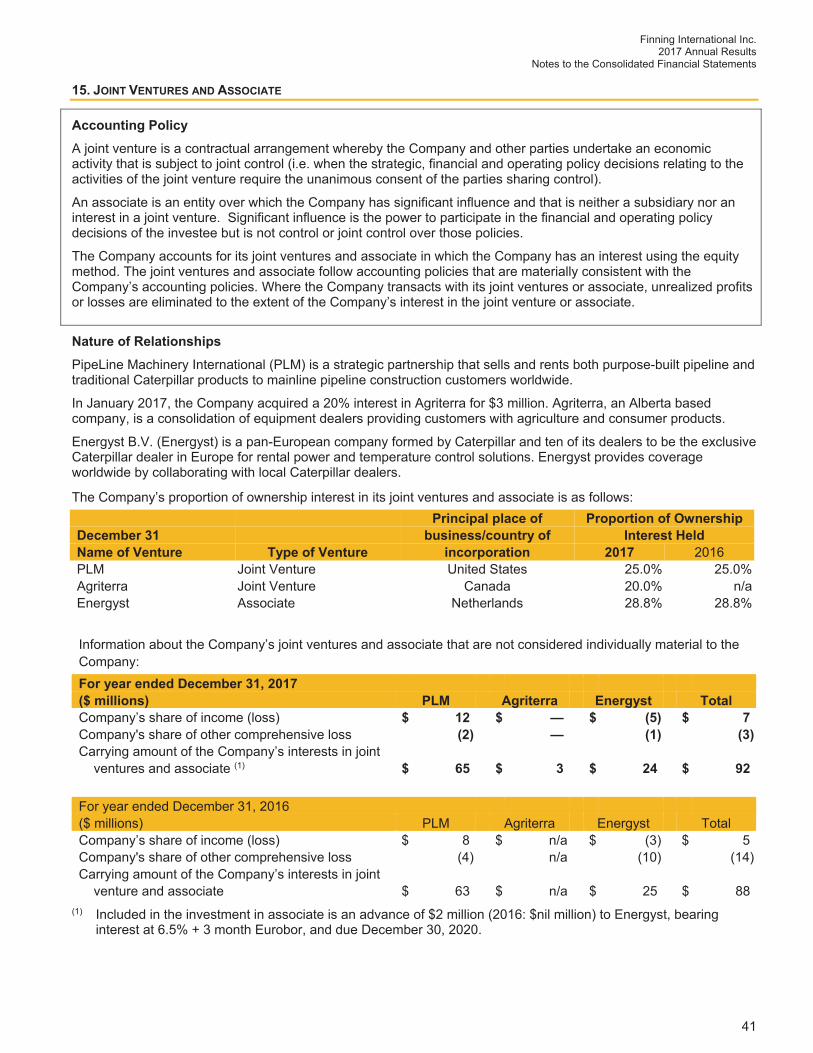
Finning International Inc. 2017 Annual Results
Notes to the Consolidated Financial Statements
41
15. JOINT VENTURES AND ASSOCIATE
Accounting Policy A joint venture is a contractual arrangement whereby the Company and other parties undertake an economic activity that is subject to joint control (i.e. when the strategic, financial and operating policy decisions relating to the activities of the joint venture require the unanimous consent of the parties sharing control).
An associate is an entity over which the Company has significant influence and that is neither a subsidiary nor an interest in a joint venture. Significant influence is the power to participate in the financial and operating policy decisions of the investee but is not control or joint control over those policies.
The Company accounts for its joint ventures and associate in which the Company has an interest using the equity method. The joint ventures and associate follow accounting policies that are materially consistent with the Company’s accounting policies. Where the Company transacts with its joint ventures or associate, unrealized profits or losses are eliminated to the extent of the Company’s interest in the joint venture or associate.
Nature of Relationships PipeLine Machinery International (PLM) is a strategic partnership that sells and rents both purpose-built pipeline and traditional Caterpillar products to mainline pipeline construction customers worldwide.
In January 2017, the Company acquired a 20% interest in Agriterra for $3 million. Agriterra, an Alberta based company, is a consolidation of equipment dealers providing customers with agriculture and consumer products.
Energyst B.V. (Energyst) is a pan-European company formed by Caterpillar and ten of its dealers to be the exclusive Caterpillar dealer in Europe for rental power and temperature control solutions. Energyst provides coverage worldwide by collaborating with local Caterpillar dealers.
The Company’s proportion of ownership interest in its joint ventures and associate is as follows: Principal place of Proportion of Ownership
December 31 business/country of Interest Held Name of Venture Type of Venture incorporation 2017 2016
PLM Joint Venture United States 25.0% 25.0% Agriterra Joint Venture Canada 20.0% n/a Energyst Associate Netherlands 28.8% 28.8%
Information about the Company’s joint ventures and associate that are not considered individually material to the Company: For year ended December 31, 2017 ($ millions) PLM Agriterra Energyst Total Company’s share of income (loss) $ 12 $ — $ (5) $ 7Company's share of other comprehensive loss (2) — (1) (3)
Carrying amount of the Company’s interests in joint ventures and associate (1) $ 65 $ 3 $ 24 $ 92 For year ended December 31, 2016 ($ millions) PLM Agriterra Energyst Total Company’s share of income (loss) $ 8 $ n/a $ (3) $ 5 Company's share of other comprehensive loss (4) n/a (10) (14) Carrying amount of the Company’s interests in joint venture and associate $ 63 $ n/a $ 25 $ 88(1) Included in the investment in associate is an advance of $2 million (2016: $nil million) to Energyst, bearing
interest at 6.5% + 3 month Eurobor, and due December 30, 2020.
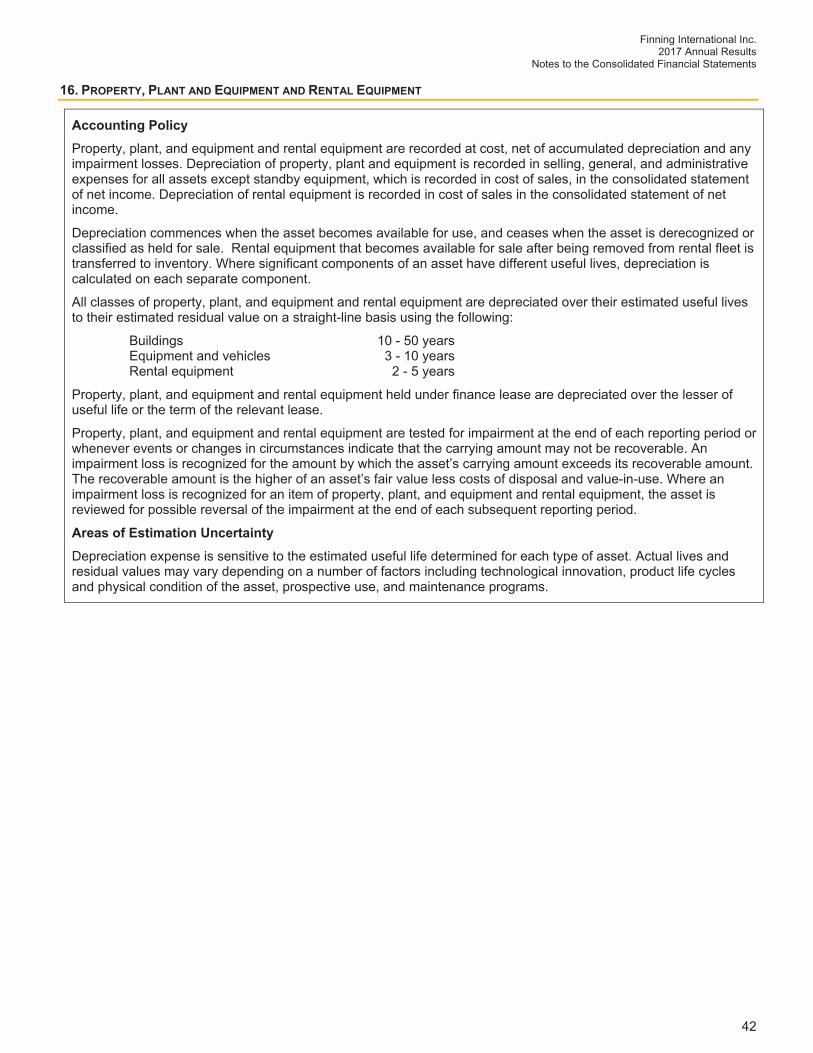
Finning International Inc. 2017 Annual Results
Notes to the Consolidated Financial Statements
42
16. PROPERTY, PLANT AND EQUIPMENT AND RENTAL EQUIPMENT
Accounting Policy Property, plant, and equipment and rental equipment are recorded at cost, net of accumulated depreciation and any impairment losses. Depreciation of property, plant and equipment is recorded in selling, general, and administrative expenses for all assets except standby equipment, which is recorded in cost of sales, in the consolidated statement of net income. Depreciation of rental equipment is recorded in cost of sales in the consolidated statement of net income.
Depreciation commences when the asset becomes available for use, and ceases when the asset is derecognized or classified as held for sale. Rental equipment that becomes available for sale after being removed from rental fleet is transferred to inventory. Where significant components of an asset have different useful lives, depreciation is calculated on each separate component.
All classes of property, plant, and equipment and rental equipment are depreciated over their estimated useful lives to their estimated residual value on a straight-line basis using the following:
Buildings 10 - 50 years Equipment and vehicles 3 - 10 years Rental equipment 2 - 5 years
Property, plant, and equipment and rental equipment held under finance lease are depreciated over the lesser of useful life or the term of the relevant lease.
Property, plant, and equipment and rental equipment are tested for impairment at the end of each reporting period or whenever events or changes in circumstances indicate that the carrying amount may not be recoverable. An impairment loss is recognized for the amount by which the asset’s carrying amount exceeds its recoverable amount. The recoverable amount is the higher of an asset’s fair value less costs of disposal and value-in-use. Where an impairment loss is recognized for an item of property, plant, and equipment and rental equipment, the asset is reviewed for possible reversal of the impairment at the end of each subsequent reporting period.
Areas of Estimation Uncertainty Depreciation expense is sensitive to the estimated useful life determined for each type of asset. Actual lives and residual values may vary depending on a number of factors including technological innovation, product life cycles and physical condition of the asset, prospective use, and maintenance programs.
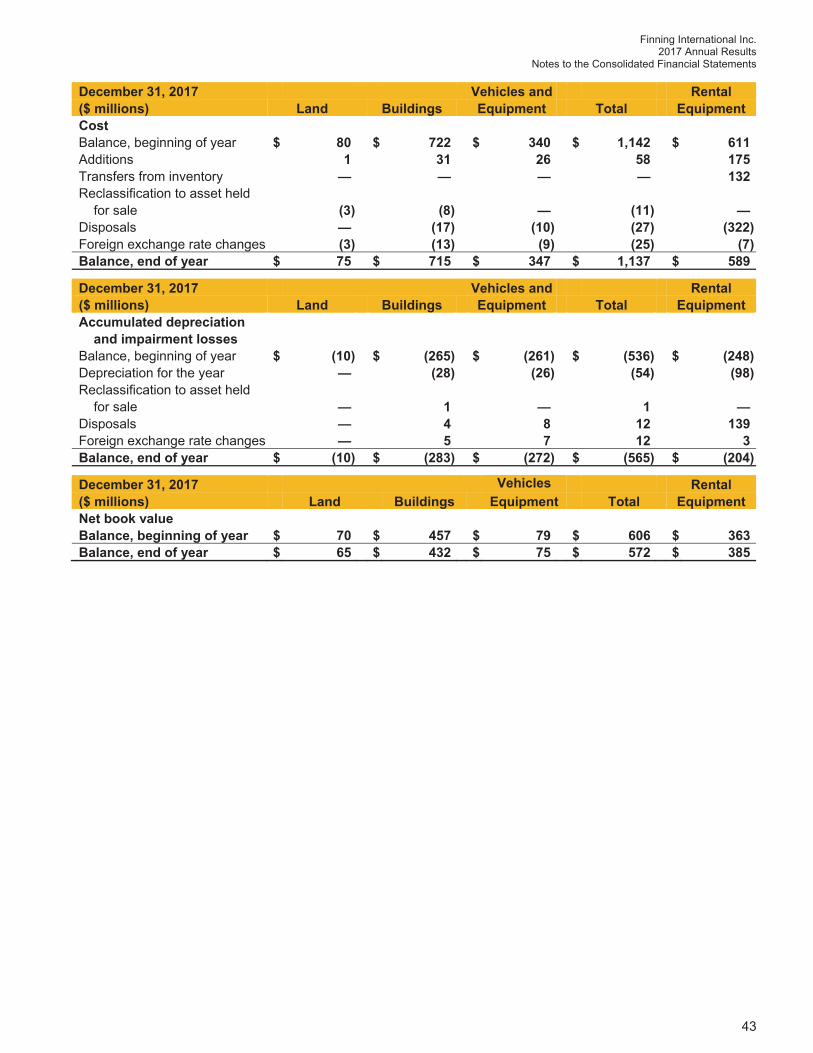
Finning International Inc. 2017 Annual Results
Notes to the Consolidated Financial Statements
43
December 31, 2017 Vehicles and Rental ($ millions) Land Buildings Equipment Total Equipment
Cost Balance, beginning of year $ 80 $ 722 $ 340 $ 1,142 $ 611 Additions 1 31 26 58 175 Transfers from inventory — — — — 132 Reclassification to asset held for sale (3) (8) — (11) — Disposals — (17) (10) (27) (322) Foreign exchange rate changes (3) (13) (9) (25) (7) Balance, end of year $ 75 $ 715 $ 347 $ 1,137 $ 589
December 31, 2017 Vehicles and Rental ($ millions) Land Buildings Equipment Total Equipment
Accumulated depreciation and impairment losses Balance, beginning of year $ (10) $ (265) $ (261) $ (536) $ (248) Depreciation for the year — (28) (26) (54) (98) Reclassification to asset held for sale — 1 — 1 — Disposals — 4 8 12 139 Foreign exchange rate changes — 5 7 12 3 Balance, end of year $ (10) $ (283) $ (272) $ (565) $ (204)
December 31, 2017 Vehicles Rental ($ millions) Land Buildings Equipment Total Equipment
Net book value Balance, beginning of year $ 70 $ 457 $ 79 $ 606 $ 363 Balance, end of year $ 65 $ 432 $ 75 $ 572 $ 385
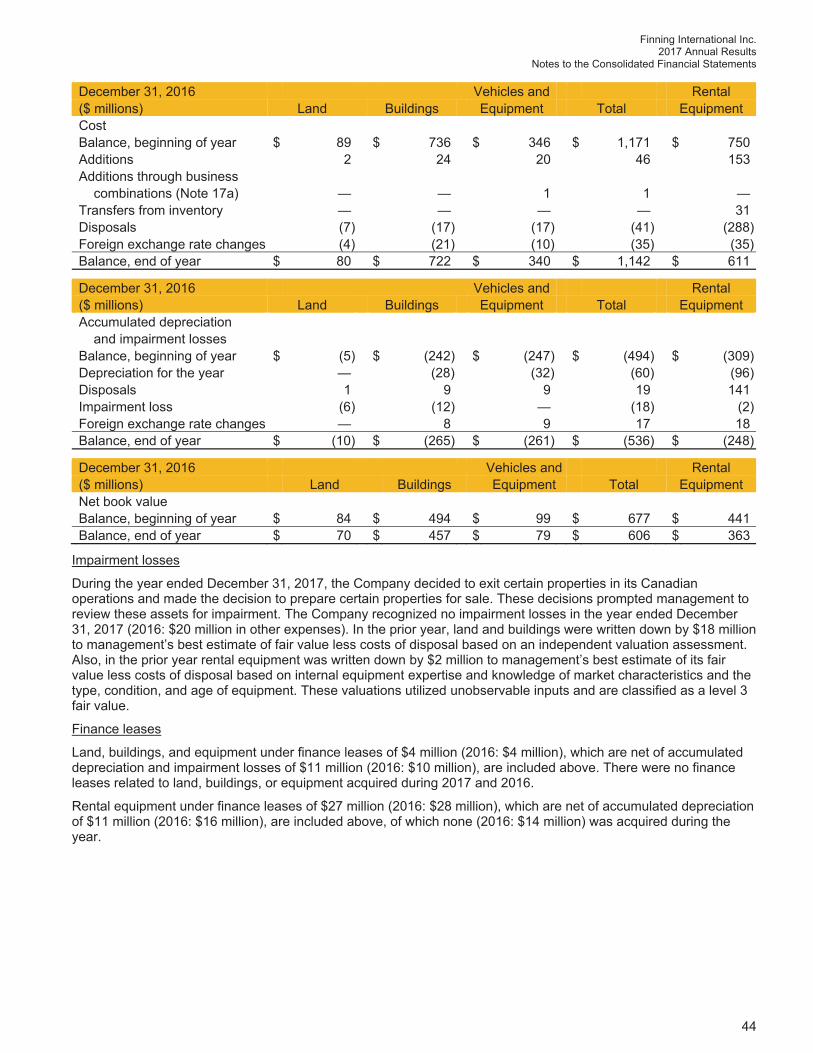
Finning International Inc. 2017 Annual Results
Notes to the Consolidated Financial Statements
44
December 31, 2016 Vehicles and Rental ($ millions) Land Buildings Equipment Total Equipment Cost Balance, beginning of year $ 89 $ 736 $ 346 $ 1,171 $ 750 Additions 2 24 20 46 153 Additions through business combinations (Note 17a) — — 1 1 — Transfers from inventory — — — — 31 Disposals (7) (17) (17) (41) (288) Foreign exchange rate changes (4) (21) (10) (35) (35) Balance, end of year $ 80 $ 722 $ 340 $ 1,142 $ 611
December 31, 2016 Vehicles and Rental ($ millions) Land Buildings Equipment Total Equipment Accumulated depreciation and impairment losses Balance, beginning of year $ (5) $ (242) $ (247) $ (494) $ (309) Depreciation for the year — (28) (32) (60) (96) Disposals 1 9 9 19 141 Impairment loss (6) (12) — (18) (2) Foreign exchange rate changes — 8 9 17 18 Balance, end of year $ (10) $ (265) $ (261) $ (536) $ (248)
December 31, 2016 Vehicles and Rental ($ millions) Land Buildings Equipment Total Equipment Net book value Balance, beginning of year $ 84 $ 494 $ 99 $ 677 $ 441 Balance, end of year $ 70 $ 457 $ 79 $ 606 $ 363
Impairment losses
During the year ended December 31, 2017, the Company decided to exit certain properties in its Canadian operations and made the decision to prepare certain properties for sale. These decisions prompted management to review these assets for impairment. The Company recognized no impairment losses in the year ended December 31, 2017 (2016: $20 million in other expenses). In the prior year, land and buildings were written down by $18 million to management’s best estimate of fair value less costs of disposal based on an independent valuation assessment. Also, in the prior year rental equipment was written down by $2 million to management’s best estimate of its fair value less costs of disposal based on internal equipment expertise and knowledge of market characteristics and the type, condition, and age of equipment. These valuations utilized unobservable inputs and are classified as a level 3 fair value.
Finance leases
Land, buildings, and equipment under finance leases of $4 million (2016: $4 million), which are net of accumulated depreciation and impairment losses of $11 million (2016: $10 million), are included above. There were no finance leases related to land, buildings, or equipment acquired during 2017 and 2016.
Rental equipment under finance leases of $27 million (2016: $28 million), which are net of accumulated depreciation of $11 million (2016: $16 million), are included above, of which none (2016: $14 million) was acquired during the year.
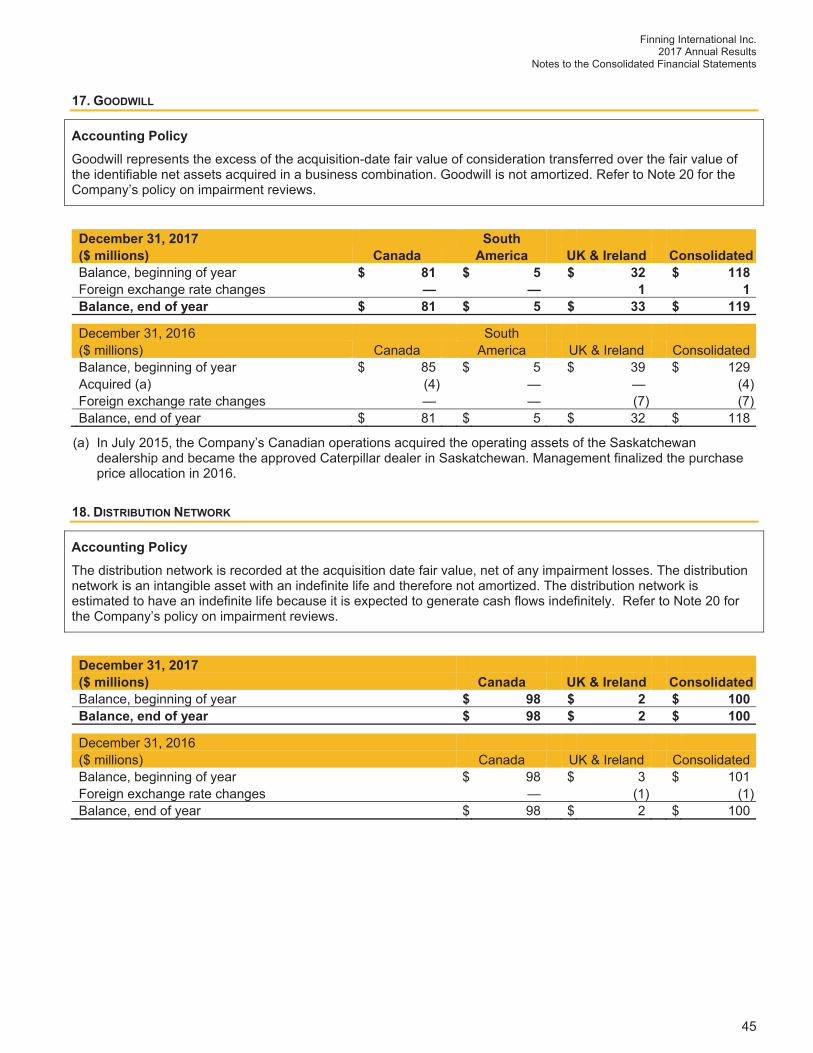
Finning International Inc. 2017 Annual Results
Notes to the Consolidated Financial Statements
45
17. GOODWILL
Accounting Policy Goodwill represents the excess of the acquisition-date fair value of consideration transferred over the fair value of the identifiable net assets acquired in a business combination. Goodwill is not amortized. Refer to Note 20 for the Company’s policy on impairment reviews.
December 31, 2017 South ($ millions) Canada America UK & Ireland Consolidated
Balance, beginning of year $ 81 $ 5 $ 32 $ 118 Foreign exchange rate changes — — 1 1 Balance, end of year $ 81 $ 5 $ 33 $ 119
December 31, 2016 South ($ millions) Canada America UK & Ireland Consolidated Balance, beginning of year $ 85 $ 5 $ 39 $ 129 Acquired (a) (4) — — (4) Foreign exchange rate changes — — (7) (7) Balance, end of year $ 81 $ 5 $ 32 $ 118
(a) In July 2015, the Company’s Canadian operations acquired the operating assets of the Saskatchewan dealership and became the approved Caterpillar dealer in Saskatchewan. Management finalized the purchase price allocation in 2016.
18. DISTRIBUTION NETWORK
Accounting Policy The distribution network is recorded at the acquisition date fair value, net of any impairment losses. The distribution network is an intangible asset with an indefinite life and therefore not amortized. The distribution network is estimated to have an indefinite life because it is expected to generate cash flows indefinitely. Refer to Note 20 for the Company’s policy on impairment reviews.
December 31, 2017 ($ millions) Canada UK & Ireland Consolidated
Balance, beginning of year $ 98 $ 2 $ 100 Balance, end of year $ 98 $ 2 $ 100
December 31, 2016 ($ millions) Canada UK & Ireland Consolidated Balance, beginning of year $ 98 $ 3 $ 101 Foreign exchange rate changes — (1) (1) Balance, end of year $ 98 $ 2 $ 100
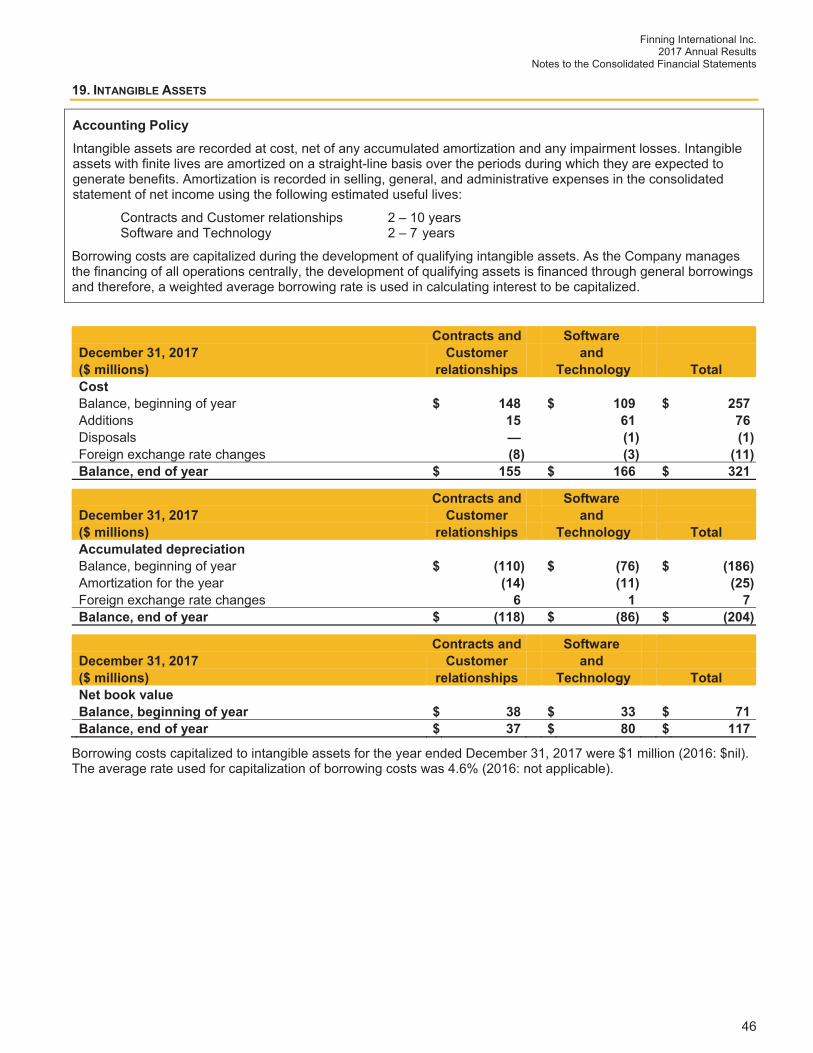
Finning International Inc. 2017 Annual Results
Notes to the Consolidated Financial Statements
46
19. INTANGIBLE ASSETS
Accounting Policy Intangible assets are recorded at cost, net of any accumulated amortization and any impairment losses. Intangible assets with finite lives are amortized on a straight-line basis over the periods during which they are expected to generate benefits. Amortization is recorded in selling, general, and administrative expenses in the consolidated statement of net income using the following estimated useful lives:
Contracts and Customer relationships 2 – 10 years Software and Technology 2 – 7 years
Borrowing costs are capitalized during the development of qualifying intangible assets. As the Company manages the financing of all operations centrally, the development of qualifying assets is financed through general borrowings and therefore, a weighted average borrowing rate is used in calculating interest to be capitalized.
Contracts and Software December 31, 2017 Customer and ($ millions) relationships Technology Total
Cost Balance, beginning of year $ 148 $ 109 $ 257 Additions 15 61 76 Disposals — (1) (1) Foreign exchange rate changes (8) (3) (11) Balance, end of year $ 155 $ 166 $ 321
Contracts and Software December 31, 2017 Customer and ($ millions) relationships Technology Total
Accumulated depreciation Balance, beginning of year $ (110) $ (76) $ (186) Amortization for the year (14) (11) (25) Foreign exchange rate changes 6 1 7 Balance, end of year $ (118) $ (86) $ (204)
Contracts and Software December 31, 2017 Customer and ($ millions) relationships Technology Total
Net book value Balance, beginning of year $ 38 $ 33 $ 71 Balance, end of year $ 37 $ 80 $ 117
Borrowing costs capitalized to intangible assets for the year ended December 31, 2017 were $1 million (2016: $nil). The average rate used for capitalization of borrowing costs was 4.6% (2016: not applicable).
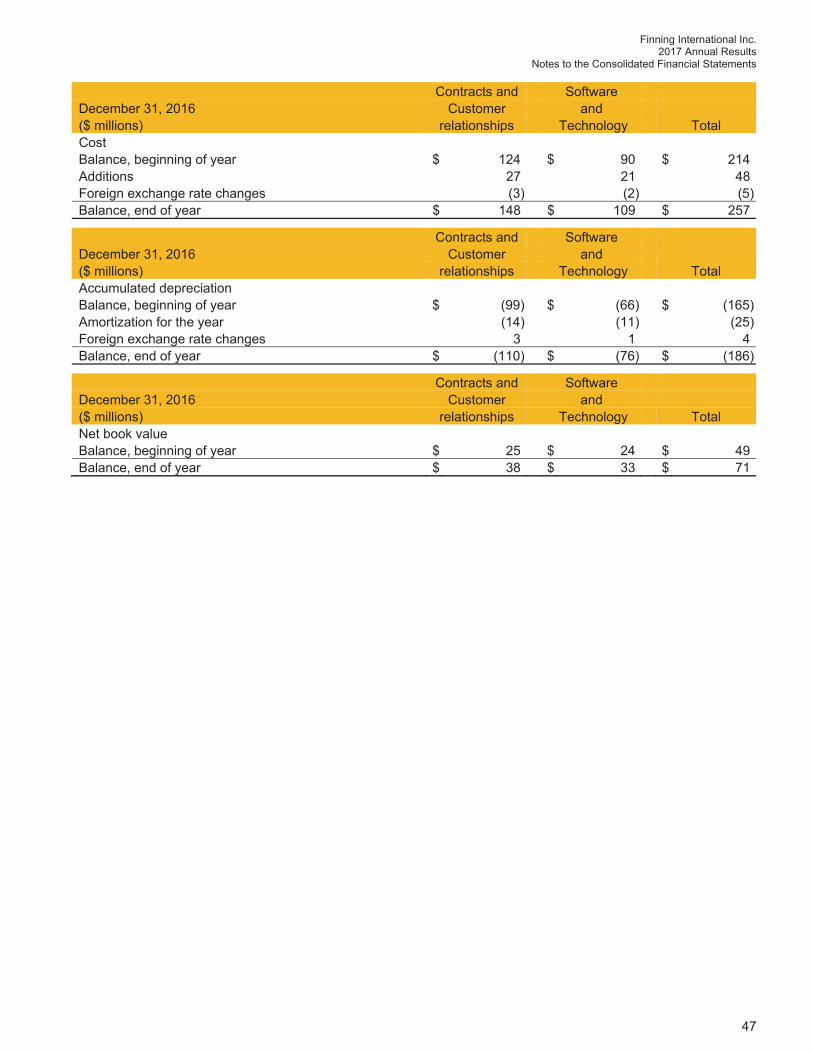
Finning International Inc. 2017 Annual Results
Notes to the Consolidated Financial Statements
47
Contracts and Software December 31, 2016 Customer and ($ millions) relationships Technology Total Cost Balance, beginning of year $ 124 $ 90 $ 214 Additions 27 21 48 Foreign exchange rate changes (3) (2) (5) Balance, end of year $ 148 $ 109 $ 257
Contracts and Software December 31, 2016 Customer and ($ millions) relationships Technology Total Accumulated depreciation Balance, beginning of year $ (99) $ (66) $ (165) Amortization for the year (14) (11) (25) Foreign exchange rate changes 3 1 4 Balance, end of year $ (110) $ (76) $ (186)
Contracts and Software December 31, 2016 Customer and ($ millions) relationships Technology Total Net book value Balance, beginning of year $ 25 $ 24 $ 49 Balance, end of year $ 38 $ 33 $ 71
Finning International Inc. 2017 Annual Results
Notes to the Consolidated Financial Statements
48
20. ASSET IMPAIRMENT
Accounting Policy Goodwill and intangible assets with indefinite lives are subject to an assessment for impairment at least annually and when events or changes in circumstances indicate that their value may not be fully recoverable, in which case the assessment is done at that time. Assets which do not have separate identifiable cash inflows are allocated to cash generating units (CGUs). CGUs are subject to impairment reviews whenever there is an indication they may be impaired. For the purpose of impairment testing, goodwill is allocated to each of the Company’s CGUs or group of CGUs expected to benefit from the acquisition. The level at which goodwill is allocated represents the lowest level at which goodwill is monitored for internal management purposes and is not higher than an operating segment. If the recoverable amount of the CGU is less than the carrying amount, then the impairment loss is allocated first to reduce the carrying amount of any goodwill allocated to the unit and then to the other assets of the unit pro-rata on the basis of the carrying amount of each asset in the unit, unless the impairment loss would reduce the carrying amount of an individual asset below the highest of its fair value less costs of disposal; its value-in-use; or, zero. Any impairment is recognized immediately in the consolidated statement of net income. Impairment losses on goodwill are never reversed but impairment losses on indefinite-lived intangible assets may be reversed. If there is any indication that the circumstances leading to the impairment loss of an indefinite-lived intangible asset no longer exist or may have decreased, management estimates the recoverable value of the CGU. Indicators of a recovery include sustainable improvement of the economic performance of the CGU and a positive trend in the forecast or budgeted results of the CGU. If the recoverable amount exceeds the carrying amount, then a previously recognized impairment loss is considered to have been reversed (either fully or in part). Any reversal of impairment loss is recognized immediately in the consolidated statement of net income.
Areas of Significant Judgment Judgment is used in identifying an appropriate discount rate and growth rate for these calculations, identifying the CGUs to which the intangible assets should be allocated to, and the CGU or group of CGUs at which goodwill is monitored for internal management purposes.
Areas of Estimation Uncertainty The recoverable value of CGUs require the use of estimates related to the future operating results and cash generating ability of the assets.
Recoverable value
The recoverable amount of all CGUs and groups of CGUs are determined based on a value-in-use calculation. The value-in-use calculation uses cash flow projections based on financial budgets which employ the following key assumptions: future cash flows and growth projections, associated economic risk assumptions, and estimates of achieving key operating metrics and drivers.
The cash flow projection key assumptions are based upon the Company’s financial budgets, covering a three-year period which is discounted using post-tax weighted average cost of capital (WACC) rates. For the annual impairment testing valuation purposes, the cash flows subsequent to the three-year projection period are extrapolated using growth rates based on estimated long-term real gross domestic product and inflation (where appropriate) in the markets in which the Company operates.
Finning International Inc. 2017 Annual Results
Notes to the Consolidated Financial Statements
49
Key assumptions
The significant assumptions used in the Company’s value-in-use calculations for each CGU or group of CGUs are as follows:
2017 2016 Post-tax Post-tax For years ended December 31 WACC rate Growth rate WACC rate Growth rate
Canada 9% 2% 8% 2% Canada Mining 9% 1% 8% 2% Chile 9% 3% 8% 3% UK & Ireland 9% 2% 9% 2%
Sensitivities to key assumptions
Sensitivity testing is conducted as part of the annual impairment tests, including stress testing the WACC rate with all other assumptions being held constant. Management believes that any reasonable change in the key assumptions used to determine the recoverable amount would not cause the carrying amount of any cash generating unit or group of cash generating units to exceed its recoverable amount. Management believes its assumptions are reasonable. If future events were to differ from management’s best estimate, key assumptions and associated cash flows could be materially adversely affected and the Company could potentially experience future material impairment charges in respect of the intangibles with indefinite lives and goodwill.
Overview of annual impairment tests
There were no impairment losses recognized in 2017 or 2016 related to CGUs, goodwill, or distribution networks. There were no impairment reversals in 2017 or 2016 related to the distribution network in the Company’s South American operations.
21. OTHER LIABILITIES
December 31 ($ millions) 2017 2016
Income tax payable $ 28 $ 7 Derivative liabilities 8 — Total other liabilities – current $ 36 $ 7
December 31 ($ millions) 2017 2016
Deferred revenue $ 58 $ 37 Deferred tax liabilities (Note 13) 28 27 Liability for long-term contracts (Note 14b) 21 28 Finance lease liabilities (a) (Note 27) 29 34 Onerous contracts 10 12 Share-based payments (Note 10) 45 23 Provisions (Note 22) 7 7 Other 17 37 Total other liabilities – non-current $ 215 $ 205
(a) Finance leases were issued at varying rates of interest from 2% 10% and mature on various dates up to 2078.
Finning International Inc. 2017 Annual Results
Notes to the Consolidated Financial Statements
50
22. PROVISIONS
Accounting Policy
Warranty claims
Provisions are made for estimated warranty claims in respect of certain equipment, spare parts, and service supplied to customers which are still under warranty at the end of the reporting period. These claims are expected to be settled in the next financial year.
Other provisions
Provisions are recognized if it is expected that a long-term service or power and energy systems contract will incur a loss. The expected loss is recognized as a provision with a corresponding expense in the statement of net income.
Areas of Estimation Uncertainty Management estimates the warranty provision based on claims notified and past experience. Factors that could impact the estimated claim include the quality of the equipment, spare parts, and labour costs.
For year ended December 31, 2017 Warranty ($ millions) Claims Other Total
Balance, beginning of year $ 31 $ 23 $ 54 New provisions 30 24 54 Charges against provisions (32) (33) (65) Foreign exchange rate changes (1) — (1) Balance, end of year $ 28 $ 14 $ 42 Current portion $ 28 $ 7 $ 35 Non-current portion $ — $ 7 $ 7
For year ended December 31, 2016 Warranty ($ millions) Claims Other Total Balance, beginning of year $ 41 $ 24 $ 65 New provisions 34 42 76 Charges against provisions (41) (41) (82) Foreign exchange rate changes (3) (2) (5) Balance, end of year $ 31 $ 23 $ 54 Current portion $ 31 $ 16 $ 47 Non-current portion $ — $ 7 $ 7
Finning International Inc. 2017 Annual Results
Notes to the Consolidated Financial Statements
51
23. POST-EMPLOYMENT BENEFITS
The Company and its subsidiaries offer a number of benefit plans that provide pension and other benefits to many of its employees in Canada, the U.K., the Republic of Ireland, and South America. These plans include defined benefit and defined contribution pension plans in Canada, UK and Ireland, and include other post-employment benefits in South America.
Pension Plans
The defined benefit pension plans include both registered and non-registered pension plans that provide a pension based on the members’ final average earnings and years of service while participating in the pension plan.
In Canada, defined benefit pension plans exist for eligible employees but are closed to new members. Final average earnings are based on the highest 3 or 5 year average salary depending on employment category and there is no standard indexation feature. Effective July 1, 2004, non-executive members of the defined benefit pension plan were offered a voluntary opportunity to convert their benefits to a defined contribution pension plan. The registered defined benefit pension plan was subsequently closed to all new non-executive employees, who became eligible to enter one of the Company’s defined contribution pension plans. Effective January 1, 2010, the defined benefit pension plan was closed to new executive employees as well, who became eligible to join a defined contribution pension plan. Pension benefits under the registered defined benefit pension plan’s formula that exceed the maximum taxation limits are provided from a non-registered supplemental pension plan. Benefits under this plan are partially funded by a Retirement Compensation Arrangement.
Finning (UK) provided a defined benefit pension plan for eligible employees hired prior to January 2003. Under this plan, final average earnings are based on the highest 3-year period and benefits are indexed annually with inflation subject to limits. Effective January 2003, this plan was closed to new employees who became eligible to join a defined contribution pension plan. In December 2011, the UK defined benefit pension plan was further amended to cease future accruals for existing members from April 2012 at which time affected members began accruing benefits under a defined contribution pension plan.
The defined contribution pension plans are pension plans under which the Company pays fixed contributions, as a percentage of earnings, into the plans, where an account exists for each plan member.
In Canada, the defined contribution pension plans are registered pension plans that offer a base Company contribution rate for all members. The Company will also partially match non-executive employee contributions to a maximum additional Company contribution of 1% of employee earnings. The registered defined contribution pension plan for executive employees is supplemented by an unfunded supplementary accumulation plan. Where contributions under the registered plan would otherwise exceed the maximum taxation limit, the excess contributions are provided through this supplemental plan.
In the UK, the defined contribution pension plans offer a match of employee contributions, within a required range, plus 1%. The Company’s Irish subsidiary has a defined contribution pension plan, which offers a match of employee contributions at a level set by the Company.
Other Post-Employment Benefits
The Company’s South American employees do not participate in employer pension plans but are covered by country specific government pension arrangements.
Employment terms at some of the Company’s South American operations provide for a payment when an employment contract comes to an end under certain conditions, which can be considered a post-employment benefit. The benefit is typically at the rate of one month of final salary for each year of service (subject in most cases to a cap as to the number of qualifying years of service and a cap on the salary rate). The Company’s South American post-employment benefits are not funded.
Finning International Inc. 2017 Annual Results
Notes to the Consolidated Financial Statements
52
Accounting Policy Pension Plans
Defined Benefit Plans:
The cost of pensions and other retirement benefits is determined by independent actuaries using the projected unit credit method.
Current service costs, past service costs, and administration costs (net of employee contributions) are recognized in selling, general, and administrative expenses and net interest costs are recognized in finance costs in the consolidated statement of net income. Net interest cost is calculated by applying the discount rate at the beginning of the period to the net defined benefit liability or asset and contributions to and benefit payments from the plan during the year.
Actuarial gains and losses arising from experience and changes in actuarial assumptions are recognized in other comprehensive income in the period in which they occur.
The amount recognized in the consolidated statement of financial position represents the present value of the defined benefit obligation reduced by the fair value of plan assets. The present value of the defined benefit obligation is determined by discounting the estimated future cash outflows using high-quality corporate bond yields, denominated in the same currency of the benefits to be paid, that approximate the timing of the related pension obligation.
Defined Contribution Plans:
The cost of pension benefits includes the current service cost, which comprise the actual contributions made and accrued by the Company during the year. These contributions are based on a fixed percentage of member earnings for the year and are charged to the consolidated statement of net income as they become due.
Other Post-Employment Benefits
The Company’s post-employment benefits in South America are accounted for as an unfunded defined benefit pension plan. Current service costs are recognized in selling, general, and administrative expenses and interest costs are recognized in finance costs in the consolidated statement of net income. Interest costs are calculated by applying the discount rate at the beginning of the period to the post-employment benefit liability and contributions to and benefit payments from the plan during the year.
Actuarial gains and losses arising from experience and changes in actuarial assumptions are recognized in other comprehensive income in the period in which they occur.
The amount recognized in the consolidated statement of financial position represents the present value of the post-employment benefit obligation. The obligation recognized is based on valuations performed and regularly updated through independent actuarial calculations by using the projected unit credit method.
Areas of Significant Judgment
Actuarial valuations of the Company’s defined benefit plans and other post-employment benefits are based on assumptions requiring significant judgment, such as mortality rates, inflation (which is particularly relevant in the UK), estimates of future salary increases, and employee turnover. Judgment is exercised in setting these assumptions. These assumptions combined with the high quality corporate bond yield, used to discount the estimated future cash flows, impact the measurement of the net defined benefit obligation, the net benefit cost, the actuarial gains and losses recognized in other comprehensive income, and funding levels in Canada and the UK.
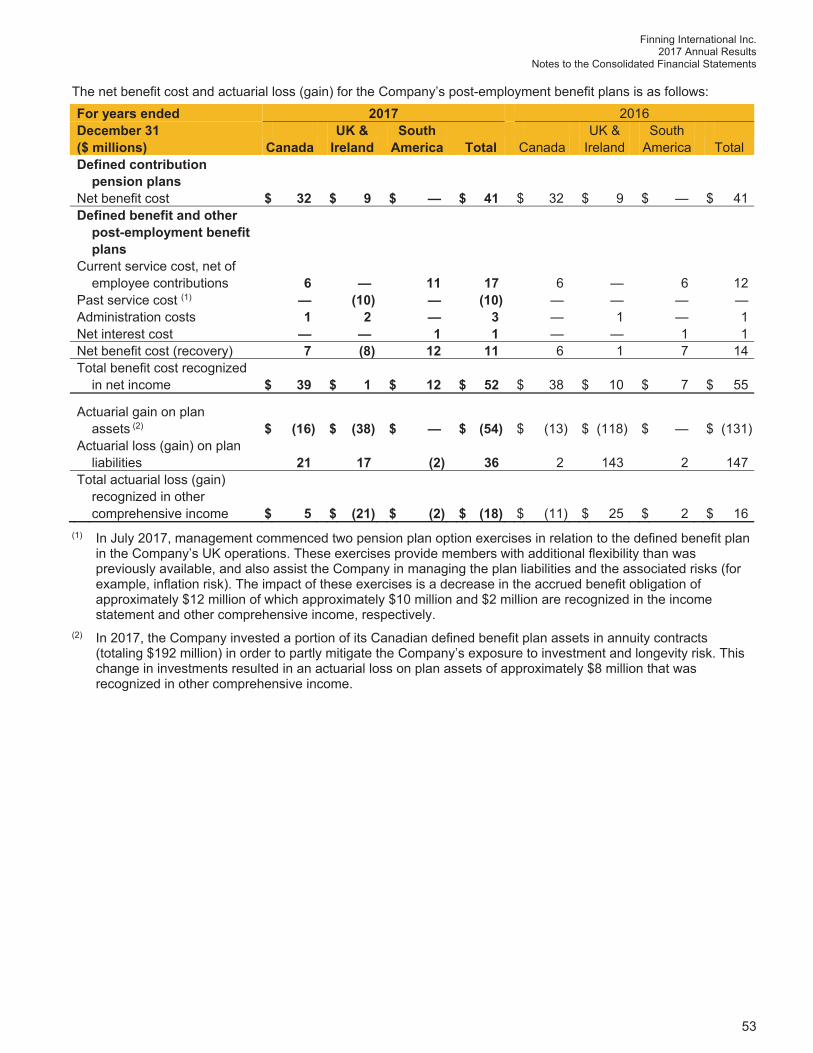
Finning International Inc. 2017 Annual Results
Notes to the Consolidated Financial Statements
53
The net benefit cost and actuarial loss (gain) for the Company’s post-employment benefit plans is as follows: For years ended 2017 2016 December 31 UK & South UK & South ($ millions) Canada Ireland America Total Canada Ireland America Total
Defined contribution pension plans Net benefit cost $ 32 $ 9 $ — $ 41 $ 32 $ 9 $ — $ 41 Defined benefit and other post-employment benefit plans Current service cost, net of employee contributions 6 — 11 17 6 — 6 12 Past service cost (1) — (10) — (10) — — — — Administration costs 1 2 — 3 — 1 — 1 Net interest cost — — 1 1 — — 1 1 Net benefit cost (recovery) 7 (8) 12 11 6 1 7 14 Total benefit cost recognized in net income $ 39 $ 1 $ 12 $ 52 $ 38 $ 10 $ 7 $ 55
Actuarial gain on plan assets (2) $ (16) $ (38) $ — $ (54) $ (13) $ (118) $ — $ (131) Actuarial loss (gain) on plan liabilities 21 17 (2) 36 2 143 2 147 Total actuarial loss (gain) recognized in other comprehensive income $ 5 $ (21) $ (2) $ (18) $ (11) $ 25 $ 2 $ 16(1) In July 2017, management commenced two pension plan option exercises in relation to the defined benefit plan
in the Company’s UK operations. These exercises provide members with additional flexibility than was previously available, and also assist the Company in managing the plan liabilities and the associated risks (for example, inflation risk). The impact of these exercises is a decrease in the accrued benefit obligation of approximately $12 million of which approximately $10 million and $2 million are recognized in the income statement and other comprehensive income, respectively.
(2) In 2017, the Company invested a portion of its Canadian defined benefit plan assets in annuity contracts (totaling $192 million) in order to partly mitigate the Company’s exposure to investment and longevity risk. This change in investments resulted in an actuarial loss on plan assets of approximately $8 million that was recognized in other comprehensive income.
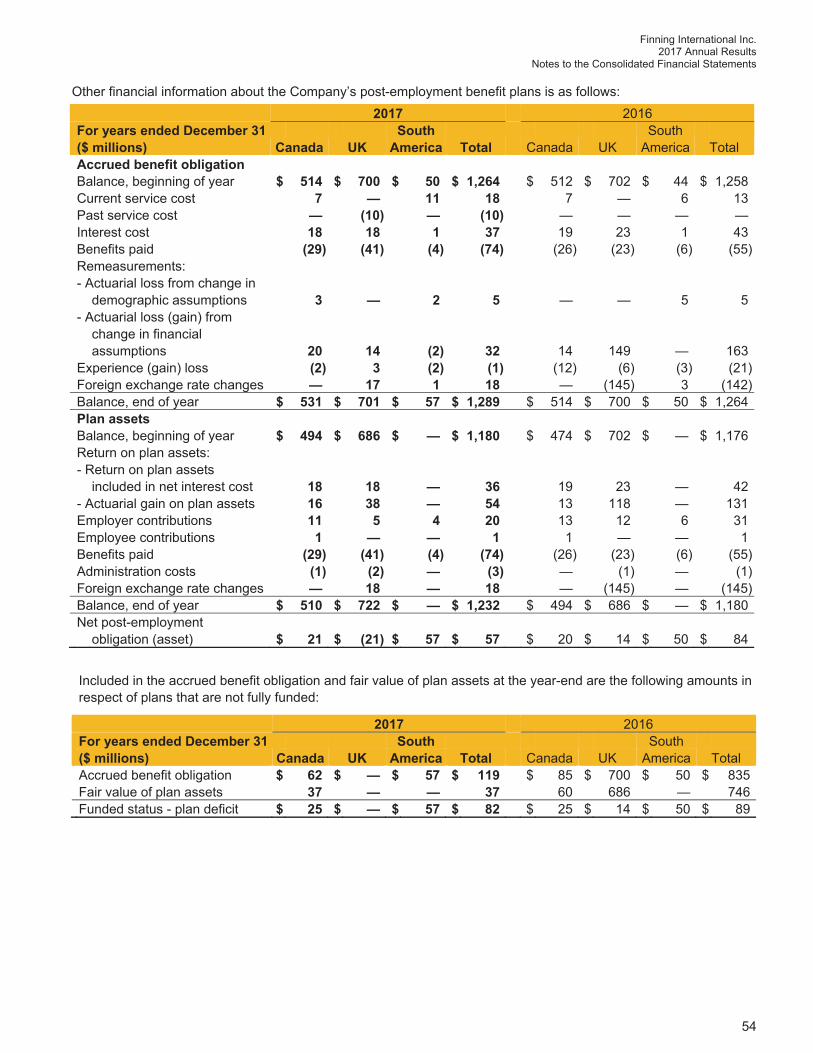
Finning International Inc. 2017 Annual Results
Notes to the Consolidated Financial Statements
54
Other financial information about the Company’s post-employment benefit plans is as follows: 2017 2016
For years ended December 31 South South ($ millions) Canada UK America Total Canada UK America Total Accrued benefit obligation Balance, beginning of year $ 514 $ 700 $ 50 $ 1,264 $ 512 $ 702 $ 44 $ 1,258Current service cost 7 — 11 18 7 — 6 13Past service cost — (10) — (10) — — — —Interest cost 18 18 1 37 19 23 1 43Benefits paid (29) (41) (4) (74) (26) (23) (6) (55)Remeasurements: - Actuarial loss from change in demographic assumptions 3 — 2 5 — — 5 5
- Actuarial loss (gain) from change in financial assumptions 20 14 (2) 32 14 149 — 163Experience (gain) loss (2) 3 (2) (1) (12) (6) (3) (21)Foreign exchange rate changes — 17 1 18 — (145) 3 (142)Balance, end of year $ 531 $ 701 $ 57 $ 1,289 $ 514 $ 700 $ 50 $ 1,264
Plan assets Balance, beginning of year $ 494 $ 686 $ — $ 1,180 $ 474 $ 702 $ — $ 1,176Return on plan assets: - Return on plan assets included in net interest cost 18 18 — 36 19 23 — 42- Actuarial gain on plan assets 16 38 — 54 13 118 — 131Employer contributions 11 5 4 20 13 12 6 31Employee contributions 1 — — 1 1 — — 1Benefits paid (29) (41) (4) (74) (26) (23) (6) (55)Administration costs (1) (2) — (3) — (1) — (1)Foreign exchange rate changes — 18 — 18 — (145) — (145)Balance, end of year $ 510 $ 722 $ — $ 1,232 $ 494 $ 686 $ — $ 1,180Net post-employment obligation (asset) $ 21 $ (21) $ 57 $ 57 $ 20 $ 14 $ 50 $ 84
Included in the accrued benefit obligation and fair value of plan assets at the year-end are the following amounts in respect of plans that are not fully funded:
2017 2016 For years ended December 31 South South
($ millions) Canada UK America Total Canada UK America Total Accrued benefit obligation $ 62 $ — $ 57 $ 119 $ 85 $ 700 $ 50 $ 835Fair value of plan assets 37 — — 37 60 686 — 746Funded status - plan deficit $ 25 $ — $ 57 $ 82 $ 25 $ 14 $ 50 $ 89
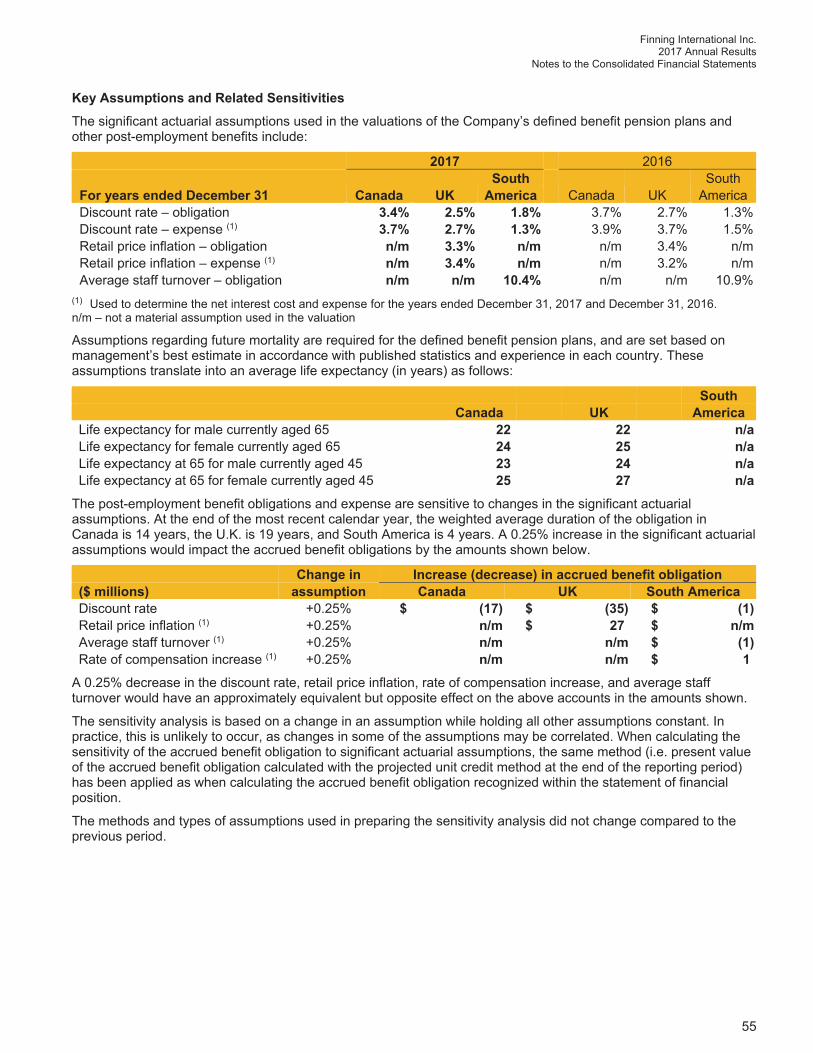
Finning International Inc. 2017 Annual Results
Notes to the Consolidated Financial Statements
55
Key Assumptions and Related SensitivitiesThe significant actuarial assumptions used in the valuations of the Company’s defined benefit pension plans and other post-employment benefits include:
2017 2016 South South
For years ended December 31 Canada UK America Canada UK America Discount rate – obligation 3.4% 2.5% 1.8% 3.7% 2.7% 1.3% Discount rate – expense (1) 3.7% 2.7% 1.3% 3.9% 3.7% 1.5% Retail price inflation – obligation n/m 3.3% n/m n/m 3.4% n/m Retail price inflation – expense (1) n/m 3.4% n/m n/m 3.2% n/m Average staff turnover – obligation n/m n/m 10.4% n/m n/m 10.9%(1) Used to determine the net interest cost and expense for the years ended December 31, 2017 and December 31, 2016. n/m – not a material assumption used in the valuation
Assumptions regarding future mortality are required for the defined benefit pension plans, and are set based on management’s best estimate in accordance with published statistics and experience in each country. These assumptions translate into an average life expectancy (in years) as follows:
South Canada UK America
Life expectancy for male currently aged 65 22 22 1 n/a Life expectancy for female currently aged 65 24 25 1 n/a Life expectancy at 65 for male currently aged 45 23 24 1 n/a Life expectancy at 65 for female currently aged 45 25 27 1 n/aThe post-employment benefit obligations and expense are sensitive to changes in the significant actuarial assumptions. At the end of the most recent calendar year, the weighted average duration of the obligation in Canada is 14 years, the U.K. is 19 years, and South America is 4 years. A 0.25% increase in the significant actuarial assumptions would impact the accrued benefit obligations by the amounts shown below.
Change in Increase (decrease) in accrued benefit obligation ($ millions) assumption Canada UK South America
Discount rate +0.25% $ (17) $ (35) $ (1) Retail price inflation (1) +0.25% n/m $ 27 $ n/m Average staff turnover (1) +0.25% n/m n/m $ (1) Rate of compensation increase (1) +0.25% n/m n/m $ 1A 0.25% decrease in the discount rate, retail price inflation, rate of compensation increase, and average staff turnover would have an approximately equivalent but opposite effect on the above accounts in the amounts shown.
The sensitivity analysis is based on a change in an assumption while holding all other assumptions constant. In practice, this is unlikely to occur, as changes in some of the assumptions may be correlated. When calculating the sensitivity of the accrued benefit obligation to significant actuarial assumptions, the same method (i.e. present value of the accrued benefit obligation calculated with the projected unit credit method at the end of the reporting period) has been applied as when calculating the accrued benefit obligation recognized within the statement of financial position.
The methods and types of assumptions used in preparing the sensitivity analysis did not change compared to the previous period.
Finning International Inc. 2017 Annual Results
Notes to the Consolidated Financial Statements
56
Funding and Valuations of Defined Benefit PlansIn Canada, the Company is funding its obligations in accordance with pension legislation requiring funding of going concern deficits over a fifteen year period and solvency deficits over a ten year period. In the U.K., at the last formal valuation, a schedule was set out for contributions to be made until mid-2021. Based on the most recent formal valuations and a review of the UK pension scheme following the liability management exercises that were completed in late 2017, the contributions expected to be paid during the financial year ended December 31, 2018 amount to approximately $18 million for the defined benefit pension plans. Funding levels are monitored regularly and reset with new valuations that occur at least every three years. Defined benefit pension plans are country and entity specific. The valuation dates of the Company’s material post-employment benefit plans are as follows:
Last Actuarial Next Required Actuarial Post-Employment Benefit Obligations Valuation Date Valuation Date
Canada – Regular & Executive DB Plan December 31, 2016 December 31, 2019 Canada – Executive Supplemental Income Plan December 31, 2016 December 31, 2019 Finning UK Defined Benefit Scheme December 31, 2014 December 31, 2017 (1) Finning South America Pension Arrangements December 31, 2017 December 31, 2020 (1) The December 31, 2017 actuarial valuations are in progress as at February 5, 2018.
Plan Assets
The fair values of plan assets are determined using a combination of quoted prices and market observable inputs except for investments in real estate and annuity contracts. The fair values of real estate investment funds is based on the net asset value reported by the funds in their audited financial statements and are determined using inputs that are not based on observable market data (unobservable inputs). Investments in annuity contracts by the plan will have cashflows that exactly match the amount and timing of certain benefits payable under the plans. The value of these contracts is deemed to be the present value of the related obligations. Plan assets are principally invested in the following securities (segregated by geography):
Canada UK Canada Global (1) UK Global (1)
Fixed-income (2) 81% — 62% 10% Equity (3) 5% 10% 1% 22% Real estate investment funds — — 5% — Cash and cash equivalents 4% — — —(1) Global investments exclude investments in Canadian and UK securities in Canada and UK, respectively. (2) Fixed-income includes investments in annuity contracts in Canada. (3) Half of the UK scheme's equity investments are hedged to the GBP to manage foreign currency risk.
Plan assets do not include any direct investment in common shares of the Company at December 31, 2017 and 2016.
Finning International Inc. 2017 Annual Results
Notes to the Consolidated Financial Statements
57
Key RisksThrough its defined benefit pension plans, the Company is exposed to a number of risks, the most significant of which are detailed below:
Investment Risk (i.e. asset volatility)
The plan liabilities are calculated using a discount rate set with reference to high quality corporate bond yields; if plan assets underperform this yield, this will create a deficit. Both the Canadian and U.K. plans invest in various asset categories including primarily equities, fixed income, and real estate. These investments, in aggregate, are expected to outperform corporate bonds in the long-term but may result in volatility in the shorter-term.
To help mitigate this risk, in selecting the portfolios and the weightings in each category, the Company considers and monitors how the duration and the expected yield of the investments match the expected cash outflows arising from the pension obligations. A framework has been developed and adopted for each of the Canadian and U.K. defined benefit pension plans whereby the investments will be adjusted over time as plan funding positions improve. The planned adjustments are intended to improve the asset-liability match over time. This is to be accomplished primarily by reducing the exposure to equity investments over time and increasing exposure to investments such as long-term fixed interest securities with maturities that better match the benefit payments as they fall due. Recent progress included investments in annuity contracts in Canada and liability matching funds in the U.K.
Equity investments still remain in the plans, as the Company believes that equities offer higher returns over the long term with an acceptable level of risk considering the proportion of assets held in this category and the long-term nature of the liabilities. Investments remain well diversified, such that the failure of any single investment would not have a material impact on the overall level of assets.
Discount Rate Risk (i.e. changes in bond yields)
A decrease in corporate bond yields will increase the value placed on the plan liabilities. This risk is managed by selecting certain investments that aim to better match assets and liabilities. For example, a liability increase that results from a decrease in corporate bond yields will be partially offset by an increase in the value of the plans’ bond holdings.
Inflation Risk
The majority of the pension obligations in the U.K. are linked to inflation. Higher inflation will lead to higher liabilities although, in most cases, caps on the level of inflationary increases are in place to protect the plan against extreme inflation. While some of the plan’s assets are either unaffected by (i.e. fixed interest bonds) or loosely correlated with (i.e. equities) inflation, in recent years, the plan has increased its investments in assets that have a direct correlation with inflation (e.g. real estate, index-linked gilts and liability matching funds) in order to manage this risk. To further manage the risk, during 2017, the Company offered pensioners a voluntary ‘Pension Increase Exchange’ whereby pensioners had a choice to trade certain automatic future inflationary adjustments for a higher immediate pension that will not increase with inflation, or will but to a lesser degree in some cases. This option provided members with additional flexibility in how they receive their pension, and also lowered the Company’s exposure to inflation risk.
In the Canadian plans, the pension payments are not linked to inflation, so this is not a direct risk. However, to the extent that future benefits are based on final average earnings and salaries are generally linked to inflation to some degree, an increase in inflation beyond expectations will result in higher liabilities. With a relatively small number of employees still earning benefits in a defined benefit plan, this risk is limited.
Longevity Risk (i.e. increasing life expectancy)
The plans provide benefits for the life of the member after retirement, so increases in life expectancy will result in an increase in the plans’ liabilities. This is particularly significant in the U.K. plan, where inflationary increases result in higher sensitivity to changes in life expectancy.
The Company has mitigated much of this risk in the Canadian registered pension plan with the purchase of annuity contracts which provide cashflows that exactly match the amount and timing of the majority of the retiree benefit payments currently under the plans.
Finning International Inc. 2017 Annual Results
Notes to the Consolidated Financial Statements
58
Maturity AnalysisExpected maturity analysis of undiscounted pension and other post-employment benefit obligations of the Company’s operations in Canada, U.K. and Ireland, and South America are as follows:
December 31, 2017 Less than Between Between Over ($ millions) a year 1-2 years 2-5 years 5 years Total
Defined benefit pension plans $ 46 $ 47 $ 151 $ 1,808 $ $ 2,052 Other post-employment benefits 7 4 11 83 1 105 Total $ 53 $ 51 $ 162 $ 1,891 $ $ 2,157
Accumulated Remeasurement Losses
The accumulated actuarial loss, net of tax, of the post-employment benefit obligations in the Company’s operations in Canada, U.K. and Ireland, and South America recognized in retained earnings is $213 million as at December 31, 2017 (December 31, 2016: $228 million).
24. SUPPLEMENTAL CASH FLOW INFORMATION
Accounting Policy Cash and cash equivalents comprise cash on hand together with short-term investments, consisting of highly rated and liquid money market instruments with original maturities of three months or less, and are classified as loans and receivables.
The components of cash and cash equivalents are as follows: December 31 ($ millions) 2017 2016
Cash $ 279 $ 458 Cash equivalents 179 135 Cash and cash equivalents $ 458 $ 593
The changes in operating assets and liabilities are as follows: For years ended December 31 ($ millions) 2017 2016
Accounts receivable $ (111) $ (71) Unbilled work in progress (24) (6) Inventories (148) 134 Other assets (52) (3) Accounts payable and accruals 234 177 Other liabilities 30 (35) Changes in operating assets and liabilities $ (71) $ 196
Finning International Inc. 2017 Annual Results
Notes to the Consolidated Financial Statements
59
The changes in liabilities arising from financing activities are as follows:
Short-term Long-term Finance lease ($ millions) debt debt liability Total
Balance, January 1, 2017 $ 2 $ 1,487 $ 39 $ 1,528 Cash flows provided by (used in) Financing activities 17 (150) (6) (139) Operating activities — — (2) (2) Total cash movements $ 17 $ (150) $ (8) $ (141) Non-cash changes Interest expense — — 2 2 Foreign exchange rate changes (1) (41) 1 (41) Total non-cash movements $ (1) $ (41) $ 3 $ (39) Balance, December 31, 2017 $ 18 $ 1,296 $ 34 $ 1,348
Dividends of $0.745 (2016: $0.73) per share were paid during the year. Subsequent to year end in February 2018, the Board of Directors approved a quarterly dividend of $0.19 per share payable on March 8, 2018 to shareholders of record on February 22, 2018. This dividend will be considered an eligible dividend for Canadian income tax purposes. As at December 31, 2017, the Company has not recognized a liability for this dividend.
25. ECONOMIC RELATIONSHIPS
The Company distributes and services heavy equipment, engines, and related products. The Company has dealership agreements with numerous equipment manufacturers, of which the most significant are with subsidiaries of Caterpillar. Distribution and servicing of Caterpillar products account for the major portion of the Company's operations. Finning has a strong relationship with Caterpillar that has been ongoing since 1933.
26. RELATED PARTY TRANSACTIONS AND TOTAL STAFF COSTS
Balances and transactions between the Company and its subsidiaries, which are related parties, have been eliminated on consolidation and are not disclosed in this note.
The remuneration of the Board of Directors during the year was as follows: For years ended December 31 ($ millions) 2017 2016
Short-term benefits $ 1 $ — Share-based payments 6 4 Total $ 7 $ 4
The remuneration of key management personnel excluding the Board of Directors (defined as officers of the Company and country presidents) during the year was as follows: For years ended December 31 ($ millions) 2017 2016
Salaries and benefits $ 9 $ 9 Post-employment benefits 1 1 Share-based payments 9 11 Total $ 19 $ 21
Total staff costs, including salaries, benefits, pension, share-based payments, termination payments, and commissions are $1,180 million (2016: $1,130 million). This amount includes staff costs associated with key management personnel noted above.
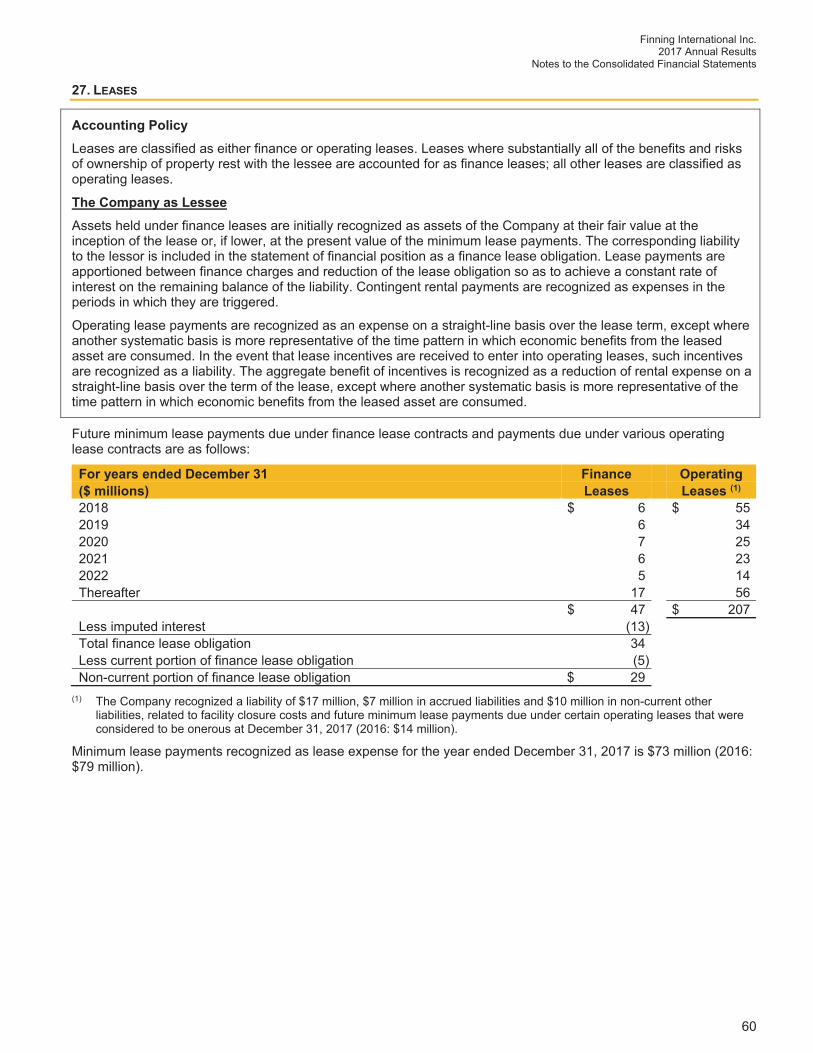
Finning International Inc. 2017 Annual Results
Notes to the Consolidated Financial Statements
60
27. LEASES
Accounting Policy Leases are classified as either finance or operating leases. Leases where substantially all of the benefits and risks of ownership of property rest with the lessee are accounted for as finance leases; all other leases are classified as operating leases.
The Company as Lessee Assets held under finance leases are initially recognized as assets of the Company at their fair value at the inception of the lease or, if lower, at the present value of the minimum lease payments. The corresponding liability to the lessor is included in the statement of financial position as a finance lease obligation. Lease payments are apportioned between finance charges and reduction of the lease obligation so as to achieve a constant rate of interest on the remaining balance of the liability. Contingent rental payments are recognized as expenses in the periods in which they are triggered.
Operating lease payments are recognized as an expense on a straight-line basis over the lease term, except where another systematic basis is more representative of the time pattern in which economic benefits from the leased asset are consumed. In the event that lease incentives are received to enter into operating leases, such incentives are recognized as a liability. The aggregate benefit of incentives is recognized as a reduction of rental expense on a straight-line basis over the term of the lease, except where another systematic basis is more representative of the time pattern in which economic benefits from the leased asset are consumed.
Future minimum lease payments due under finance lease contracts and payments due under various operating lease contracts are as follows:
For years ended December 31 Finance Operating ($ millions) Leases Leases (1)
2018 $ 6 $ 55 2019 6 34 2020 7 25 2021 6 23 2022 5 14 Thereafter 17 56 $ 47 $ 207 Less imputed interest (13) Total finance lease obligation 34 Less current portion of finance lease obligation (5) Non-current portion of finance lease obligation $ 29 (1) The Company recognized a liability of $17 million, $7 million in accrued liabilities and $10 million in non-current other
liabilities, related to facility closure costs and future minimum lease payments due under certain operating leases that were considered to be onerous at December 31, 2017 (2016: $14 million).
Minimum lease payments recognized as lease expense for the year ended December 31, 2017 is $73 million (2016: $79 million).
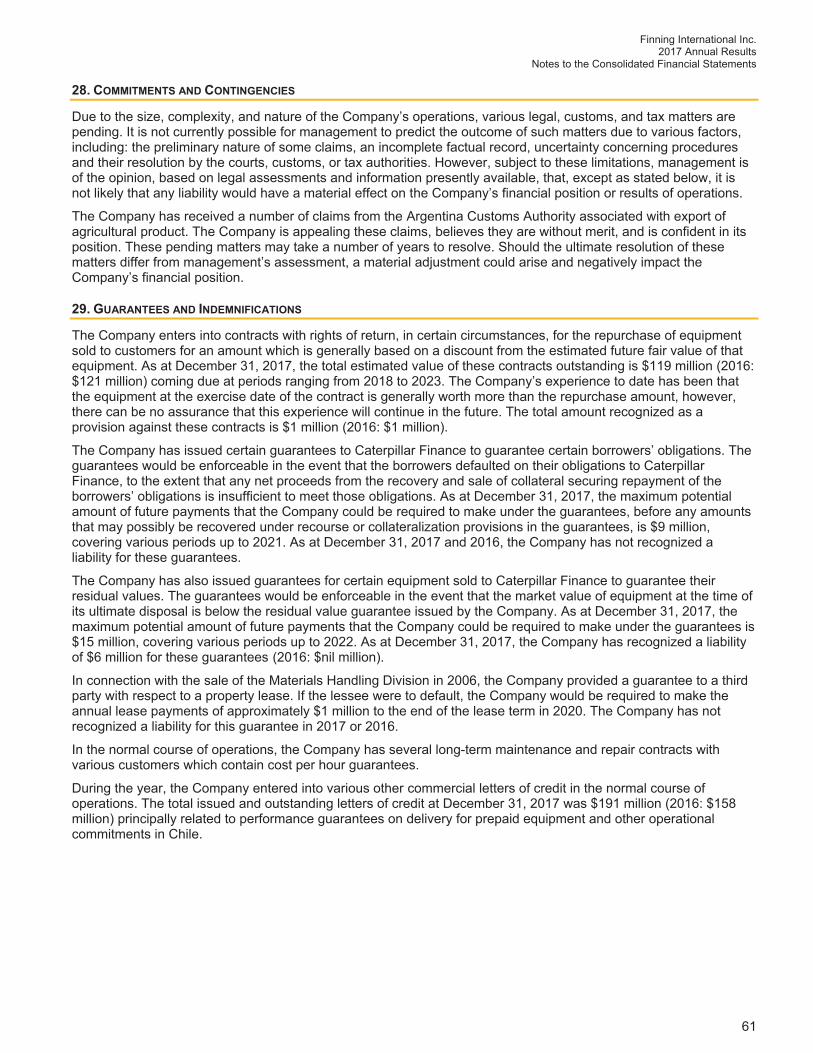
Finning International Inc. 2017 Annual Results
Notes to the Consolidated Financial Statements
61
28. COMMITMENTS AND CONTINGENCIES
Due to the size, complexity, and nature of the Company’s operations, various legal, customs, and tax matters are pending. It is not currently possible for management to predict the outcome of such matters due to various factors, including: the preliminary nature of some claims, an incomplete factual record, uncertainty concerning procedures and their resolution by the courts, customs, or tax authorities. However, subject to these limitations, management is of the opinion, based on legal assessments and information presently available, that, except as stated below, it is not likely that any liability would have a material effect on the Company’s financial position or results of operations.
The Company has received a number of claims from the Argentina Customs Authority associated with export of agricultural product. The Company is appealing these claims, believes they are without merit, and is confident in its position. These pending matters may take a number of years to resolve. Should the ultimate resolution of these matters differ from management’s assessment, a material adjustment could arise and negatively impact the Company’s financial position.
29. GUARANTEES AND INDEMNIFICATIONS
The Company enters into contracts with rights of return, in certain circumstances, for the repurchase of equipment sold to customers for an amount which is generally based on a discount from the estimated future fair value of that equipment. As at December 31, 2017, the total estimated value of these contracts outstanding is $119 million (2016: $121 million) coming due at periods ranging from 2018 to 2023. The Company’s experience to date has been that the equipment at the exercise date of the contract is generally worth more than the repurchase amount, however, there can be no assurance that this experience will continue in the future. The total amount recognized as a provision against these contracts is $1 million (2016: $1 million).
The Company has issued certain guarantees to Caterpillar Finance to guarantee certain borrowers’ obligations. The guarantees would be enforceable in the event that the borrowers defaulted on their obligations to Caterpillar Finance, to the extent that any net proceeds from the recovery and sale of collateral securing repayment of the borrowers’ obligations is insufficient to meet those obligations. As at December 31, 2017, the maximum potential amount of future payments that the Company could be required to make under the guarantees, before any amounts that may possibly be recovered under recourse or collateralization provisions in the guarantees, is $9 million, covering various periods up to 2021. As at December 31, 2017 and 2016, the Company has not recognized a liability for these guarantees.
The Company has also issued guarantees for certain equipment sold to Caterpillar Finance to guarantee their residual values. The guarantees would be enforceable in the event that the market value of equipment at the time of its ultimate disposal is below the residual value guarantee issued by the Company. As at December 31, 2017, the maximum potential amount of future payments that the Company could be required to make under the guarantees is $15 million, covering various periods up to 2022. As at December 31, 2017, the Company has recognized a liability of $6 million for these guarantees (2016: $nil million).
In connection with the sale of the Materials Handling Division in 2006, the Company provided a guarantee to a third party with respect to a property lease. If the lessee were to default, the Company would be required to make the annual lease payments of approximately $1 million to the end of the lease term in 2020. The Company has not recognized a liability for this guarantee in 2017 or 2016.
In the normal course of operations, the Company has several long-term maintenance and repair contracts with various customers which contain cost per hour guarantees.
During the year, the Company entered into various other commercial letters of credit in the normal course of operations. The total issued and outstanding letters of credit at December 31, 2017 was $191 million (2016: $158 million) principally related to performance guarantees on delivery for prepaid equipment and other operational commitments in Chile.

Finning International Inc.1000 – 666 Burrard StreetVancouver, British Columbia V6C 2X8


![[XLS] of applications... · Web view10/16/2017 10/16/2017 12/4/2017 12/4/2017 12/4/2017 12/4/2017 12/4/2017 12/4/2017 12/4/2017 12/4/2017 12/4/2017 2/10/2017 2/10/2017 9/2/2017 12/7/2017](https://img.pdfslide.us/doc/110x75/5b0243937f8b9a89598f584c/xls-of-applicationsweb-view10162017-10162017-1242017-1242017-1242017.jpg)


![[XLS]engineeringstudentsdata.comengineeringstudentsdata.com/downloads/2017/2017... · Web view2017. 2017. 2017. 2017. 2017. 2017. 2017. 2017. 2017. 2017. 2017. 2017. 2017. 2017. 2017](https://img.pdfslide.us/doc/110x75/5b037ece7f8b9a0a548c409a/xlseng-view2017-2017-2017-2017-2017-2017-2017-2017-2017-2017-2017-2017.jpg)