Embed Size (px)
Citation preview

STATE OF WISCONSIN
DETI-17957-ECL-P (R. 3/2018)
2017 ECONOMIC ANDWORKFORCE PROFILE
Eau Claire County
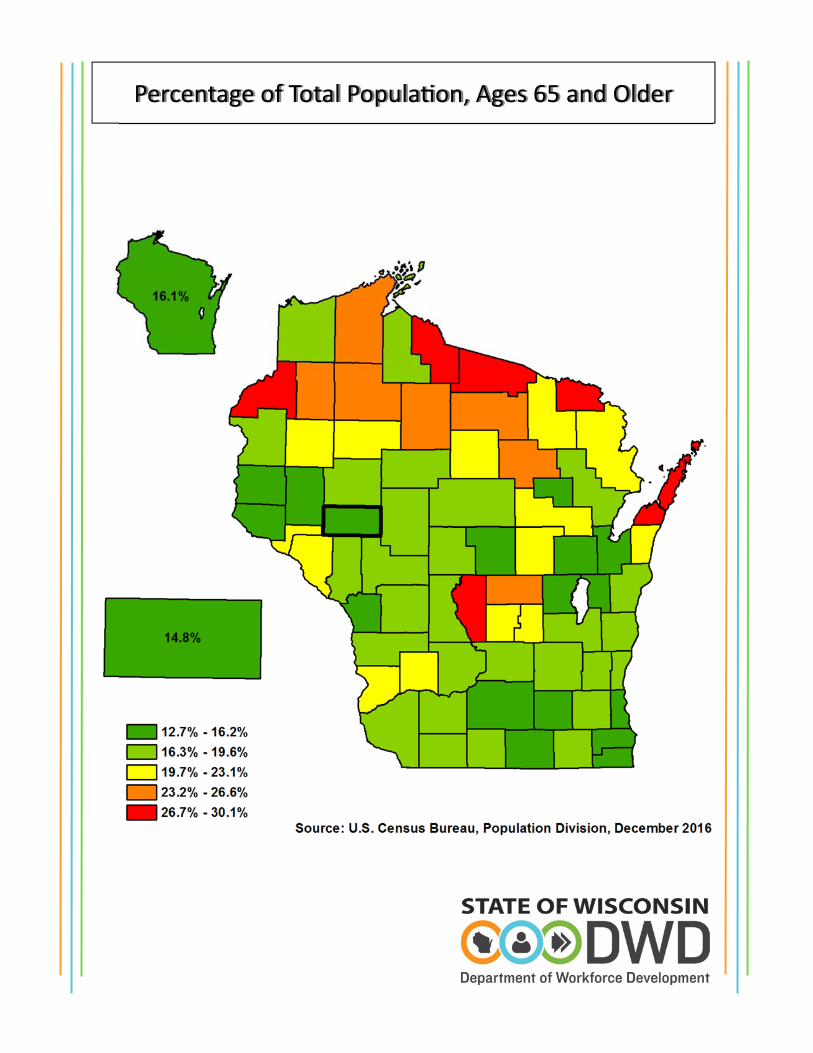
Percentage of Total Popula on, Ages 65 and Older
1
Wisconsin now has more people employed and more private sector jobs than at any me in its history. As of this wri ng, the state added 56,100 jobs during 2016 and 2017 . Employment increased in almost all industry sectors, with prominent gains in construc on, manufacturing, and healthcare.
Wisconsin’s unemployment rate is near lows not seen in a genera on, decreasing from 4.3 percent in January 2016 to 3.2 percent in December 2017, on a seasonally adjusted basis.
Wisconsin faces a worker quan ty challenge. The number of re ring Baby Boomers nearly match the influx of new workers, resul ng in a slow growing workforce and placing constraints on the ability by employers across all industries to hire talent. Many businesses report that the lack of available workers has hindered expansion and, in some cases, even curtailed their ability to meet current product orders.
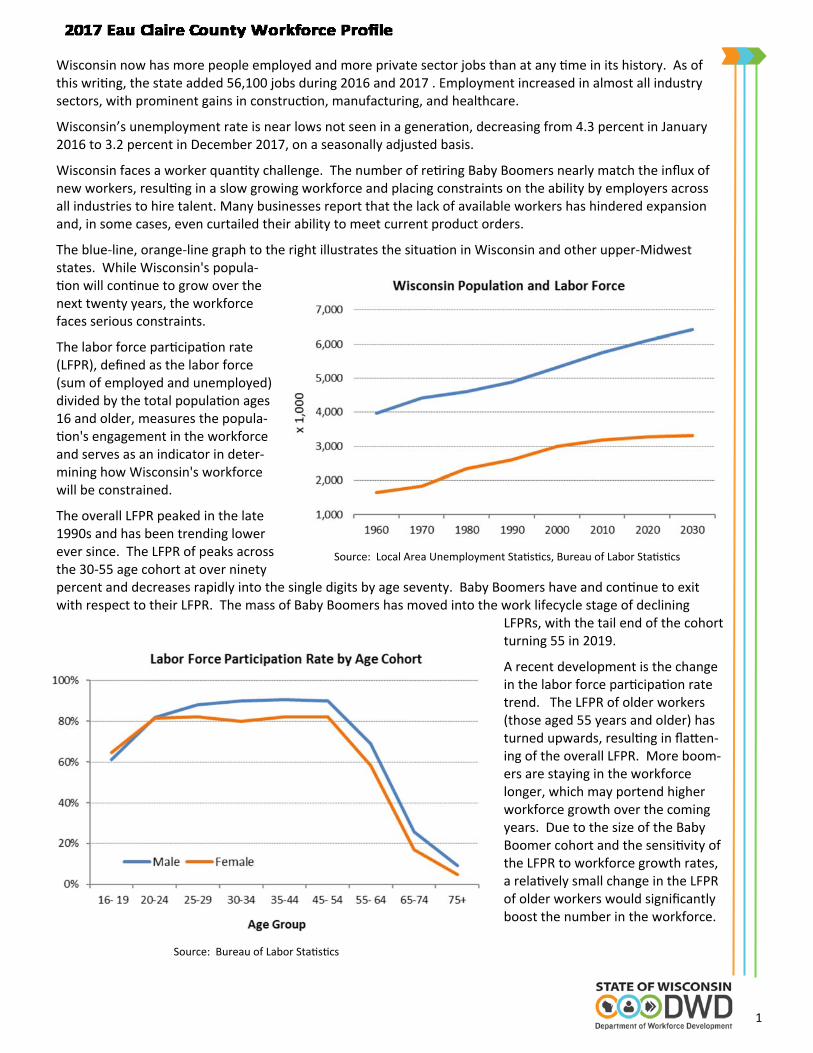
The blue‐line, orange‐line graph to the right illustrates the situa on in Wisconsin and other upper‐Midwest states. While Wisconsin's popula‐
on will con nue to grow over the next twenty years, the workforce faces serious constraints.
The labor force par cipa on rate (LFPR), defined as the labor force (sum of employed and unemployed) divided by the total popula on ages 16 and older, measures the popula‐
on's engagement in the workforce and serves as an indicator in deter‐mining how Wisconsin's workforce will be constrained.
The overall LFPR peaked in the late 1990s and has been trending lower ever since. The LFPR of peaks across the 30‐55 age cohort at over ninety percent and decreases rapidly into the single digits by age seventy. Baby Boomers have and con nue to exit with respect to their LFPR. The mass of Baby Boomers has moved into the work lifecycle stage of declining
LFPRs, with the tail end of the cohort turning 55 in 2019.
A recent development is the change in the labor force par cipa on rate trend. The LFPR of older workers (those aged 55 years and older) has turned upwards, resul ng in fla en‐ing of the overall LFPR. More boom‐ers are staying in the workforce longer, which may portend higher workforce growth over the coming years. Due to the size of the Baby Boomer cohort and the sensi vity of the LFPR to workforce growth rates, a rela vely small change in the LFPR of older workers would significantly boost the number in the workforce.
Source: Local Area Unemployment Sta s cs, Bureau of Labor Sta s cs
Source: Bureau of Labor Sta s cs
2
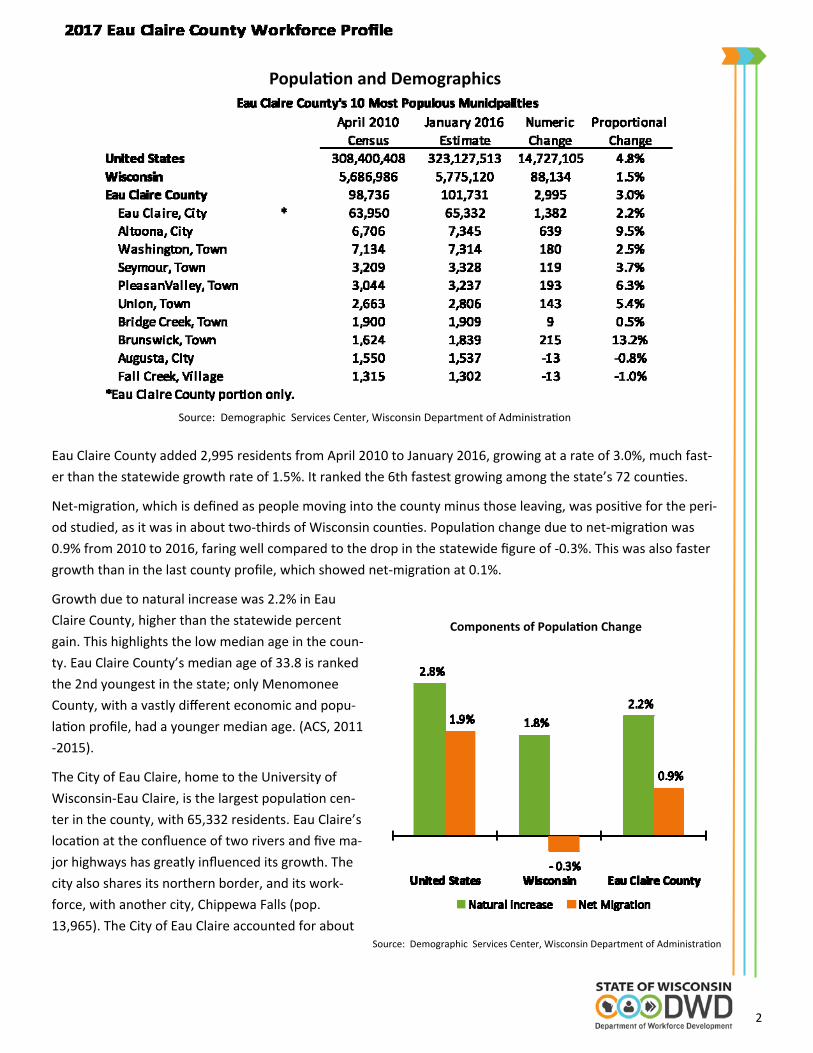
Popula on and Demographics
Eau Claire County added 2,995 residents from April 2010 to January 2016, growing at a rate of 3.0%, much fast‐
er than the statewide growth rate of 1.5%. It ranked the 6th fastest growing among the state’s 72 coun es.
Net‐migra on, which is defined as people moving into the county minus those leaving, was posi ve for the peri‐
od studied, as it was in about two‐thirds of Wisconsin coun es. Popula on change due to net‐migra on was
0.9% from 2010 to 2016, faring well compared to the drop in the statewide figure of ‐0.3%. This was also faster
growth than in the last county profile, which showed net‐migra on at 0.1%.
Growth due to natural increase was 2.2% in Eau
Claire County, higher than the statewide percent
gain. This highlights the low median age in the coun‐
ty. Eau Claire County’s median age of 33.8 is ranked
the 2nd youngest in the state; only Menomonee
County, with a vastly different economic and popu‐
la on profile, had a younger median age. (ACS, 2011
‐2015).
The City of Eau Claire, home to the University of
Wisconsin‐Eau Claire, is the largest popula on cen‐
ter in the county, with 65,332 residents. Eau Claire’s
loca on at the confluence of two rivers and five ma‐
jor highways has greatly influenced its growth. The
city also shares its northern border, and its work‐
force, with another city, Chippewa Falls (pop.
13,965). The City of Eau Claire accounted for about
Source: Demographic Services Center, Wisconsin Department of Administra on
Source: Demographic Services Center, Wisconsin Department of Administra on
Components of Popula on Change
3
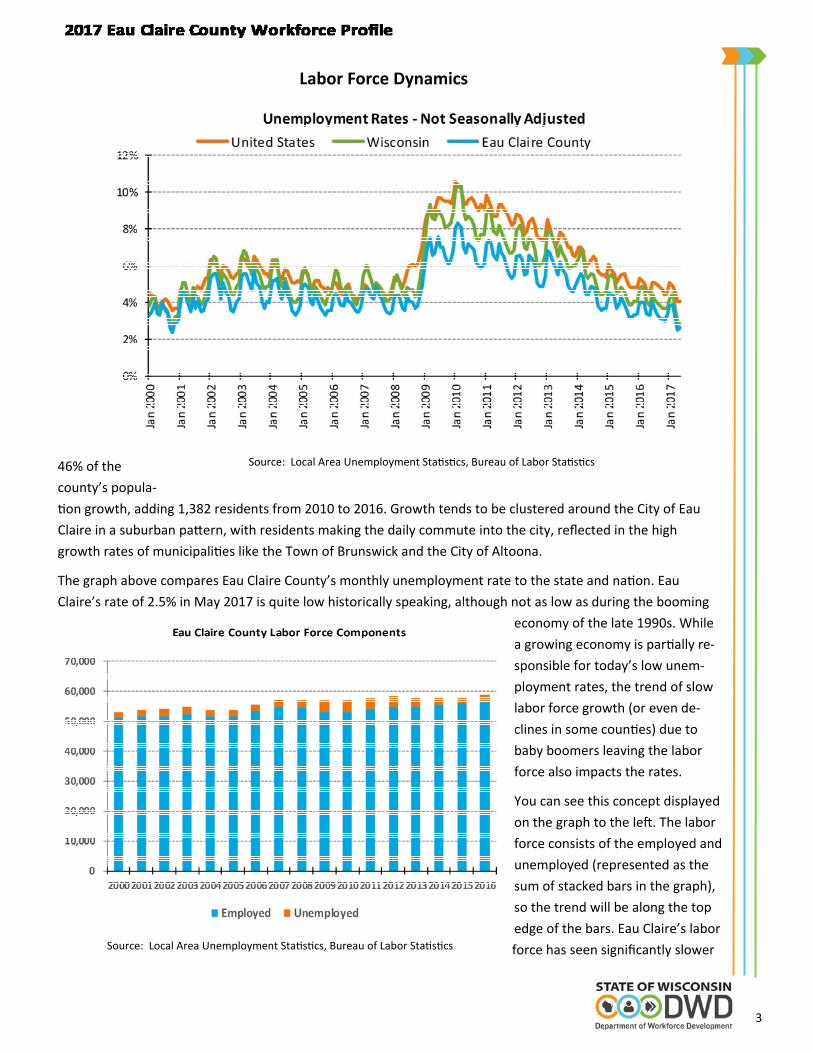
Labor Force Dynamics
46% of the
county’s popula‐
on growth, adding 1,382 residents from 2010 to 2016. Growth tends to be clustered around the City of Eau
Claire in a suburban pa ern, with residents making the daily commute into the city, reflected in the high
growth rates of municipali es like the Town of Brunswick and the City of Altoona.
The graph above compares Eau Claire County’s monthly unemployment rate to the state and na on. Eau
Claire’s rate of 2.5% in May 2017 is quite low historically speaking, although not as low as during the booming
economy of the late 1990s. While
a growing economy is par ally re‐
sponsible for today’s low unem‐
ployment rates, the trend of slow
labor force growth (or even de‐
clines in some coun es) due to
baby boomers leaving the labor
force also impacts the rates.
You can see this concept displayed
on the graph to the le . The labor
force consists of the employed and
unemployed (represented as the
sum of stacked bars in the graph),
so the trend will be along the top
edge of the bars. Eau Claire’s labor
force has seen significantly slower
Source: Local Area Unemployment Sta s cs, Bureau of Labor Sta s cs
Source: Local Area Unemployment Sta s cs, Bureau of Labor Sta s cs
4
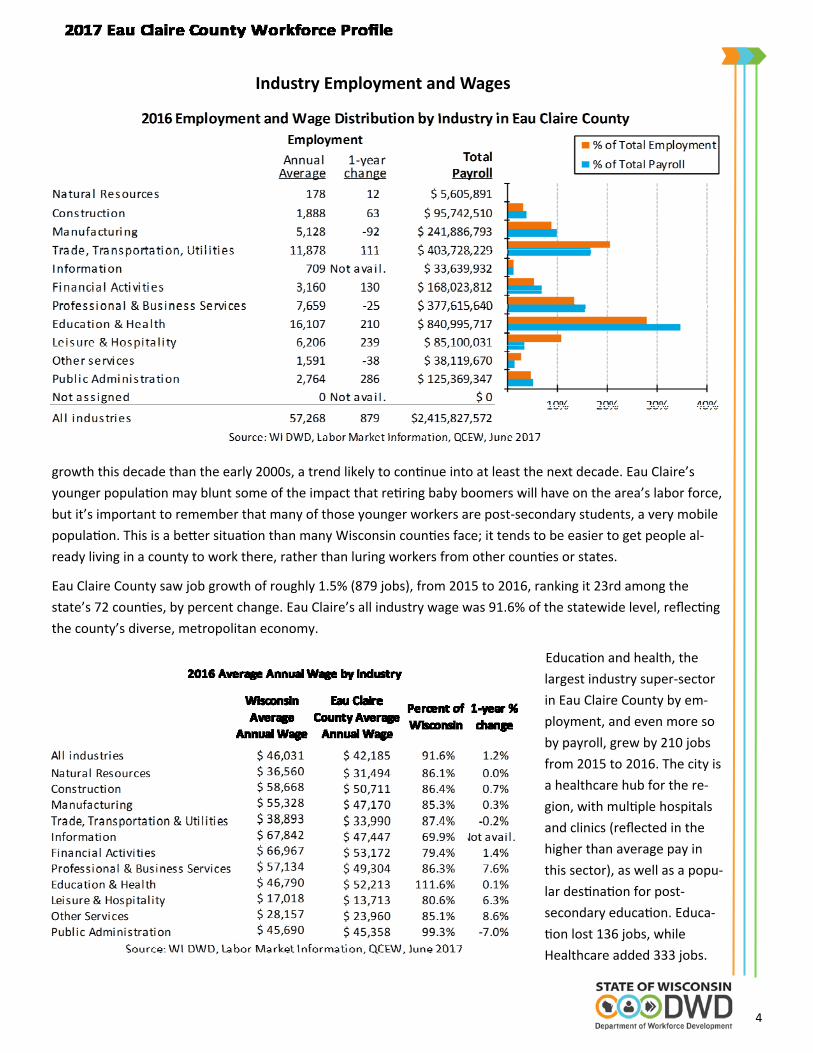
Industry Employment and Wages
growth this decade than the early 2000s, a trend likely to con nue into at least the next decade. Eau Claire’s
younger popula on may blunt some of the impact that re ring baby boomers will have on the area’s labor force,
but it’s important to remember that many of those younger workers are post‐secondary students, a very mobile
popula on. This is a be er situa on than many Wisconsin coun es face; it tends to be easier to get people al‐
ready living in a county to work there, rather than luring workers from other coun es or states.
Eau Claire County saw job growth of roughly 1.5% (879 jobs), from 2015 to 2016, ranking it 23rd among the
state’s 72 coun es, by percent change. Eau Claire’s all industry wage was 91.6% of the statewide level, reflec ng
the county’s diverse, metropolitan economy.
Educa on and health, the
largest industry super‐sector
in Eau Claire County by em‐
ployment, and even more so
by payroll, grew by 210 jobs
from 2015 to 2016. The city is
a healthcare hub for the re‐
gion, with mul ple hospitals
and clinics (reflected in the
higher than average pay in
this sector), as well as a popu‐
lar des na on for post‐
secondary educa on. Educa‐
on lost 136 jobs, while
Healthcare added 333 jobs.
5
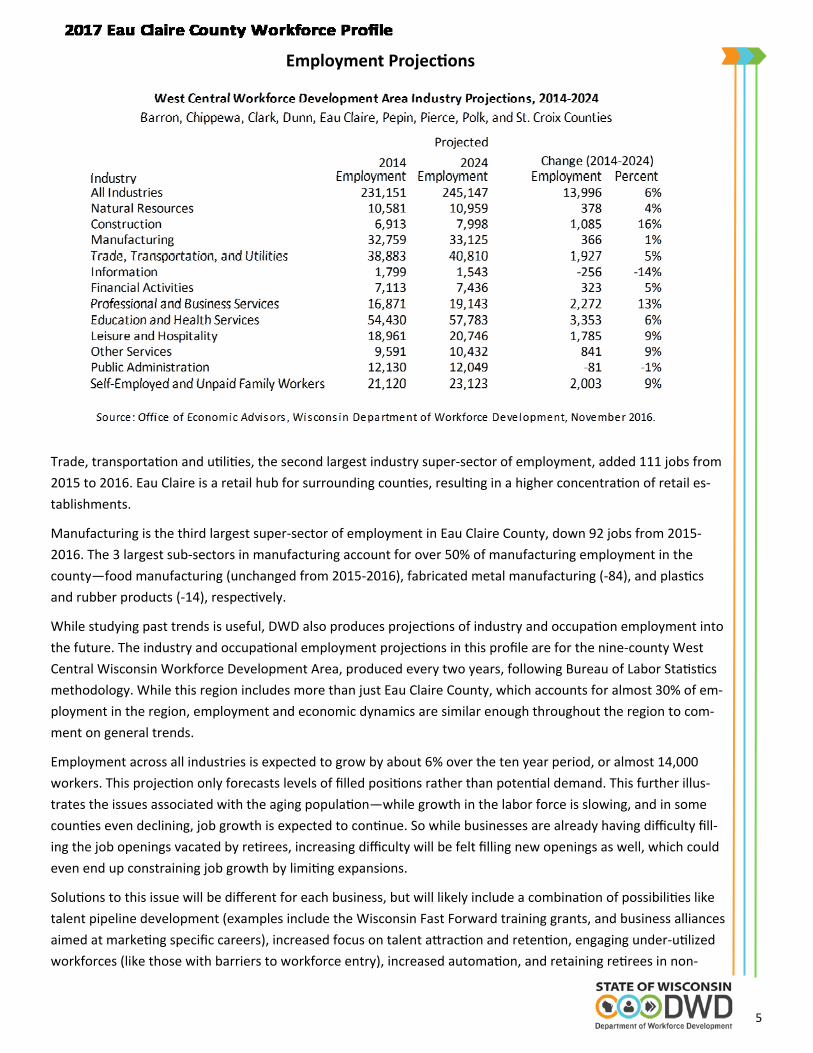
Employment Projec ons
Trade, transporta on and u li es, the second largest industry super‐sector of employment, added 111 jobs from
2015 to 2016. Eau Claire is a retail hub for surrounding coun es, resul ng in a higher concentra on of retail es‐
tablishments.
Manufacturing is the third largest super‐sector of employment in Eau Claire County, down 92 jobs from 2015‐
2016. The 3 largest sub‐sectors in manufacturing account for over 50% of manufacturing employment in the
county—food manufacturing (unchanged from 2015‐2016), fabricated metal manufacturing (‐84), and plas cs
and rubber products (‐14), respec vely.
While studying past trends is useful, DWD also produces projec ons of industry and occupa on employment into
the future. The industry and occupa onal employment projec ons in this profile are for the nine‐county West
Central Wisconsin Workforce Development Area, produced every two years, following Bureau of Labor Sta s cs
methodology. While this region includes more than just Eau Claire County, which accounts for almost 30% of em‐
ployment in the region, employment and economic dynamics are similar enough throughout the region to com‐
ment on general trends.
Employment across all industries is expected to grow by about 6% over the ten year period, or almost 14,000
workers. This projec on only forecasts levels of filled posi ons rather than poten al demand. This further illus‐
trates the issues associated with the aging popula on—while growth in the labor force is slowing, and in some
coun es even declining, job growth is expected to con nue. So while businesses are already having difficulty fill‐
ing the job openings vacated by re rees, increasing difficulty will be felt filling new openings as well, which could
even end up constraining job growth by limi ng expansions.
Solu ons to this issue will be different for each business, but will likely include a combina on of possibili es like
talent pipeline development (examples include the Wisconsin Fast Forward training grants, and business alliances
aimed at marke ng specific careers), increased focus on talent a rac on and reten on, engaging under‐u lized
workforces (like those with barriers to workforce entry), increased automa on, and retaining re rees in non‐
6
Employment Projec ons
conven onal work arrangements to name a few.
The most significant numerical growth is expected in Educa on and Health Services (3,353, 6% growth rate), and
Professional and Business Services (2,272, 13.5% growth rate). Another super‐sector with strong an cipated
growth is the Construc on sector (1,085, 15.7%).
While industry projec ons have their uses, a more func onal approach is projected occupa onal growth. An
examina on of projected occupa onal employment growth reveals a possible explana on for the moderate
growth rates an cipated in a number of the region’s largest industry sectors. We first see that the most signifi‐
cant occupa onal growth can be observed in a number of occupa onal categories largely concentrated in the
Health Services sector, including Healthcare Prac oners, Healthcare Support, and Personal Care and Services
workers. Significant growth is also an cipated in many other occupa onal sectors, suppor ng the narra ve of
long‐range stability in many of the region’s largest industries. The other trend that is also illustrated is that of
labor constraints as openings created due to replacement needs outnumber those generated by new growth by
over three‐to‐one in the region. This is the reason for the increased importance placed on the availability and
skill sets of young workers entering the region’s workforce. It’s vitally important to realize that slow growth or
Source: Office of Economic Advisors, Wisconsin Department of Workforce Development, September 2015
7
declines in employment don’t necessarily reflect on the health of those industries. Employment declines may be
due to factors such as increased automa on and produc vity. There will be many openings simply due to re re‐
ments!
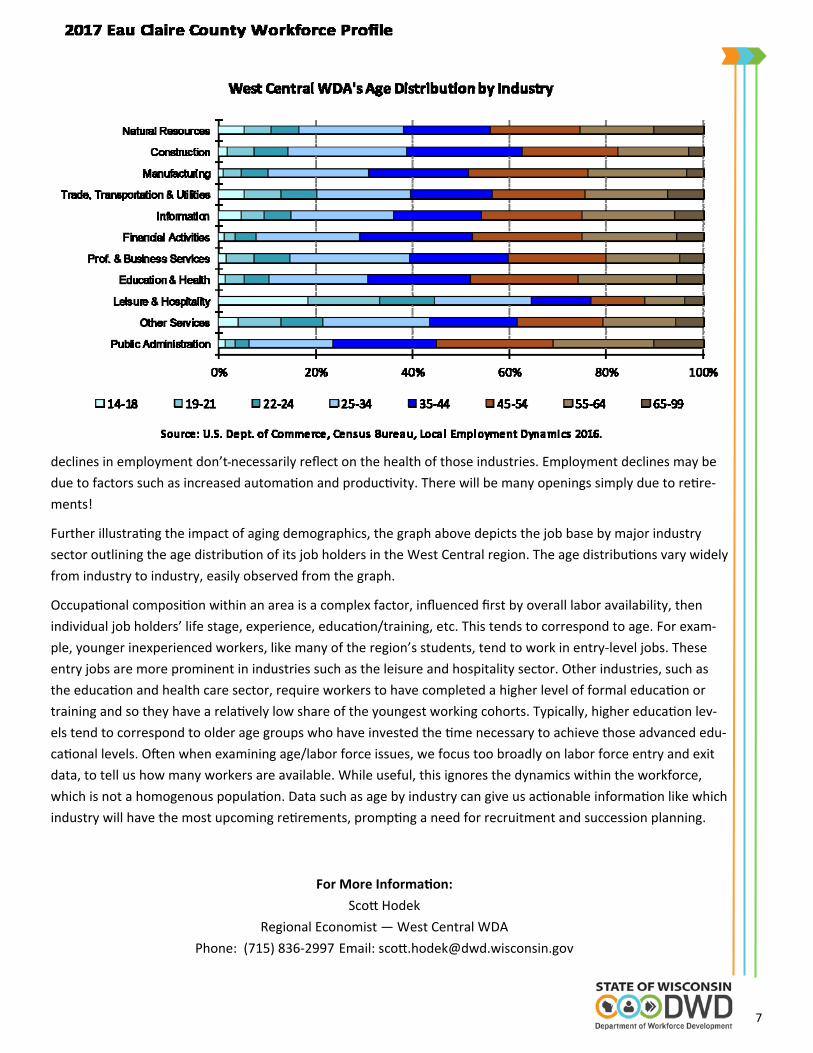
Further illustra ng the impact of aging demographics, the graph above depicts the job base by major industry
sector outlining the age distribu on of its job holders in the West Central region. The age distribu ons vary widely
from industry to industry, easily observed from the graph.
Occupa onal composi on within an area is a complex factor, influenced first by overall labor availability, then
individual job holders’ life stage, experience, educa on/training, etc. This tends to correspond to age. For exam‐
ple, younger inexperienced workers, like many of the region’s students, tend to work in entry‐level jobs. These
entry jobs are more prominent in industries such as the leisure and hospitality sector. Other industries, such as
the educa on and health care sector, require workers to have completed a higher level of formal educa on or
training and so they have a rela vely low share of the youngest working cohorts. Typically, higher educa on lev‐
els tend to correspond to older age groups who have invested the me necessary to achieve those advanced edu‐
ca onal levels. O en when examining age/labor force issues, we focus too broadly on labor force entry and exit
data, to tell us how many workers are available. While useful, this ignores the dynamics within the workforce,
which is not a homogenous popula on. Data such as age by industry can give us ac onable informa on like which
industry will have the most upcoming re rements, promp ng a need for recruitment and succession planning.
For More Informa on:
Sco Hodek
Regional Economist — West Central WDA
Phone: (715) 836‐2997 Email: sco [email protected]


![[XLS]worknet.wisconsin.govworknet.wisconsin.gov/worknet_info/downloads/OCCPRJ/lt... · Web view6476 297 4.8099999999999996 30 465 495 16680 18020 19390 22860 335 362 27 8.06 3 18](https://img.pdfslide.us/doc/110x75/5b02b08a7f8b9a84339001e1/xls-view6476-297-48099999999999996-30-465-495-16680-18020-19390-22860-335-362.jpg)


![[XLS]worknet.wisconsin.govworknet.wisconsin.gov/worknet_info/downloads/OES/all... · Web view78050 66.95 139260 88.94 184990 4560 4.8 36.44 75790 2.5 31.91 66360 16.84 35020 22.67](https://img.pdfslide.us/doc/110x75/5ac333187f8b9aa0518c0f99/xls-view78050-6695-139260-8894-184990-4560-48-3644-75790-25-3191-66360-1684.jpg)