Embed Size (px)
Citation preview
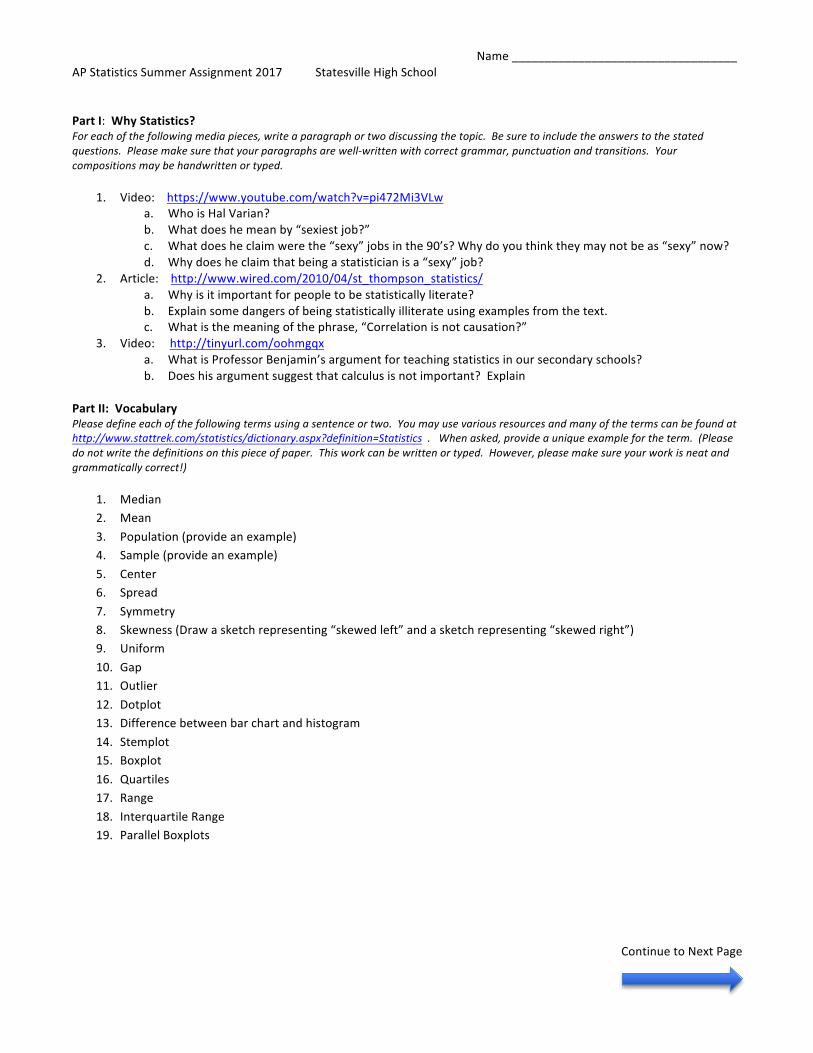
Name__________________________________APStatisticsSummerAssignment2017StatesvilleHighSchool PartI:WhyStatistics?Foreachofthefollowingmediapieces,writeaparagraphortwodiscussingthetopic.Besuretoincludetheanswerstothestatedquestions.Pleasemakesurethatyourparagraphsarewell-writtenwithcorrectgrammar,punctuationandtransitions.Yourcompositionsmaybehandwrittenortyped.
1. Video:https://www.youtube.com/watch?v=pi472Mi3VLwa. WhoisHalVarian?b. Whatdoeshemeanby“sexiestjob?”c. Whatdoesheclaimwerethe“sexy”jobsinthe90’s?Whydoyouthinktheymaynotbeas“sexy”now?d. Whydoesheclaimthatbeingastatisticianisa“sexy”job?
2. Article:http://www.wired.com/2010/04/st_thompson_statistics/a. Whyisitimportantforpeopletobestatisticallyliterate?b. Explainsomedangersofbeingstatisticallyilliterateusingexamplesfromthetext.c. Whatisthemeaningofthephrase,“Correlationisnotcausation?”
3. Video:http://tinyurl.com/oohmgqxa. WhatisProfessorBenjamin’sargumentforteachingstatisticsinoursecondaryschools?b. Doeshisargumentsuggestthatcalculusisnotimportant?Explain
PartII:VocabularyPleasedefineeachofthefollowingtermsusingasentenceortwo.Youmayusevariousresourcesandmanyofthetermscanbefoundathttp://www.stattrek.com/statistics/dictionary.aspx?definition=Statistics.Whenasked,provideauniqueexamplefortheterm.(Pleasedonotwritethedefinitionsonthispieceofpaper.Thisworkcanbewrittenortyped.However,pleasemakesureyourworkisneatandgrammaticallycorrect!)
1. Median2. Mean3. Population(provideanexample)4. Sample(provideanexample)5. Center6. Spread7. Symmetry8. Skewness(Drawasketchrepresenting“skewedleft”andasketchrepresenting“skewedright”)9. Uniform10. Gap11. Outlier12. Dotplot13. Differencebetweenbarchartandhistogram14. Stemplot15. Boxplot16. Quartiles17. Range18. InterquartileRange19. ParallelBoxplots
ContinuetoNextPage
Name__________________________________APStatisticsSummerAssignment2017StatesvilleHighSchool PartIII:DescribingandDisplayingDataPleasecompletethefollowingexercisesonaseparatesheetofpaper.Ifagraphorplotisrequired,pleaseusegraphpaper,rulerandincludeallnecessarylabels.Whenaskedfordescriptionsorexplanations,pleaseusecompletesentences.
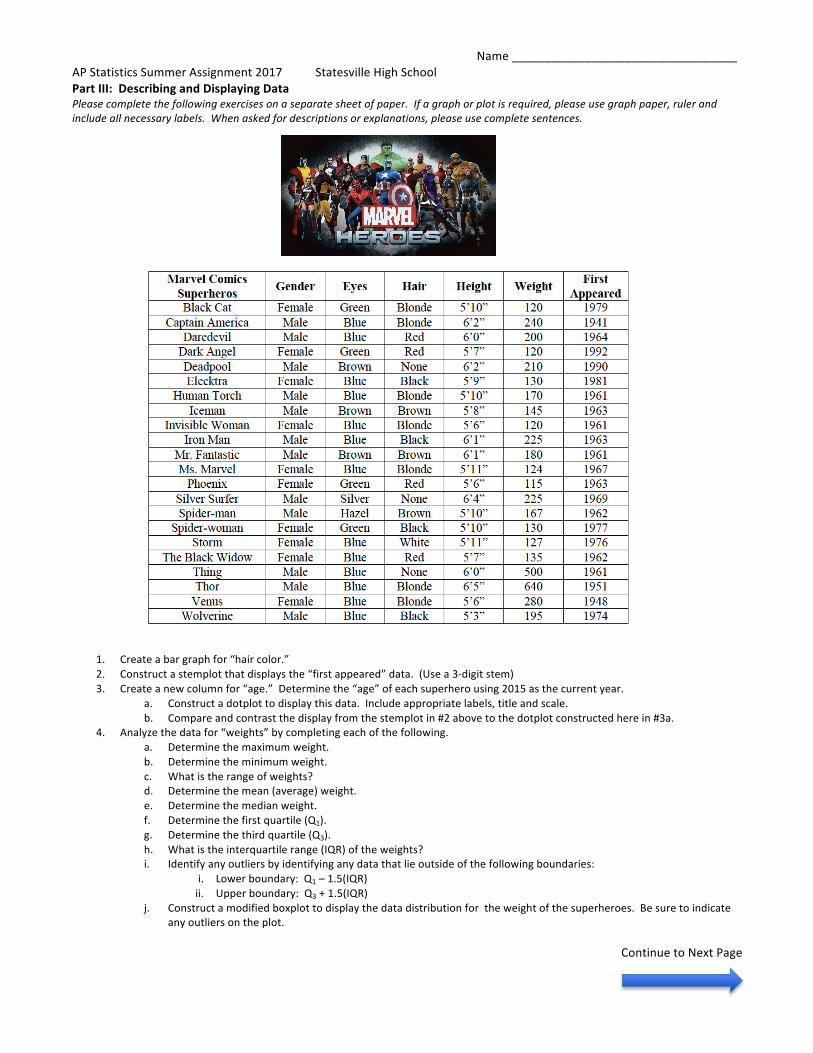
1. Createabargraphfor“haircolor.”2. Constructastemplotthatdisplaysthe“firstappeared”data.(Usea3-digitstem)3. Createanewcolumnfor“age.”Determinethe“age”ofeachsuperherousing2015asthecurrentyear.
a. Constructadotplottodisplaythisdata.Includeappropriatelabels,titleandscale.b. Compareandcontrastthedisplayfromthestemplotin#2abovetothedotplotconstructedherein#3a.
4. Analyzethedatafor“weights”bycompletingeachofthefollowing.a. Determinethemaximumweight.b. Determinetheminimumweight.c. Whatistherangeofweights?d. Determinethemean(average)weight.e. Determinethemedianweight.f. Determinethefirstquartile(Q1).g. Determinethethirdquartile(Q3).h. Whatistheinterquartilerange(IQR)oftheweights?i. Identifyanyoutliersbyidentifyinganydatathatlieoutsideofthefollowingboundaries:
i. Lowerboundary:Q1–1.5(IQR)ii. Upperboundary:Q3+1.5(IQR)
j. Constructamodifiedboxplottodisplaythedatadistributionfortheweightofthesuperheroes.Besuretoindicateanyoutliersontheplot.
ContinuetoNextPage
Name__________________________________APStatisticsSummerAssignment2017StatesvilleHighSchool
5. Convertallheightstoinches.Then,determineeachofthefollowingmeasuresofcentraltendency.a. Mean(𝑥)b. Medianc. Mode
6. Whichmeasureofcentraltendencybestdescribesthetypicalheightofasuperhero?Justifyyouranswerusingthecomputationsfrom#5above.
7. SupposethatTheHulkisaddedtotheoriginaldata.Whenangered,hecangrowtobe96inchestall.Determinethemeasuresofcentraltendencyforthenowmodifieddataset.
a. Meanb. Medianc. Mode
8. Usingtheinformationin#5and#7above,answereachofthefollowingquestions.a. WhichmeasureofcentraltendencywasmostaffectedbytheHulk?b. Whichmeasureofcentraltendencybestdescribesthetypicalheightofsuperheroes?Explainyourreasoning.