Embed Size (px)
Citation preview

APSTATISTICS–WESTFIELDHIGHSCHOOLSUMMER2018ASSIGNMENT
Ifyouarereadingthis,youareaccessingthecopyofthesummerassignmentpostedontheWestfieldHSwebsite.Makesureyouhavedonethefollowing:
1. PickupatextbookfrommeinR117(behindSS3,sameroomasAPinfosession)orfromMs.KeederinR123.Youwillneedittocompletetheassignment.
2. CheckthatyoucanaccessBlackboard.Afteryoulogin,youshouldseeAPStatisticsat
WestfieldHighSchoolunderMyOrganizations.Youwillneedtosubmitpartofyourassignmentonline.
Ifyouhavequestions,feelfreetostopbymyroombefore/afterschooloremailme.

APSTATISTICS–WESTFIELDHIGHSCHOOLSUMMER2018ASSIGNMENT
Congratulationsondecidingtotakestatistics!Moststudentsaresurprisedtofindthatstatisticsisverydifferentfromwhattheyexpectedandthatitisaverypracticalcourse.Thoughconsideredamathcourse,itisunlikeanyotheryouhaveevertaken.Oneelementofthecourseworkthatsurprisesstudentsisthatsolutionsrequiregoodwrittencommunication,notjustnumericalanswers.Thisisasmuchawritingcourseasitisamathcourse!
BriefDescriptionofSummerAssignment:Thesummerassignmentconsistsof4parts.Somewillbeturnedin(hardcopy)andotherswillbesubmittedthroughBlackboard.Itintroducesyoutostatisticsandgivesyoupracticeonsomebasicstatisticalconcepts.ObjectivesofSummerAssignment:Forstudentsto…
becomeexcitedaboutthestudyofstatistics, learnthatitisacourserequiringlotsofreadingandwriting, gainunderstandingofbasicstatisticaltopics,and reviewstatisticalconceptsthatyouwereexposedtoduringMath7/8,AlgebraIandAlgebra2.
ResourcesNecessarytoCompleteAssignment:Graphingcalculator,InternetAccess,TextbookDueDate:FIRSTdayofclass.Onlineportionsshouldbesubmittedpriortothestartofclass.Remember,thisisanAPCourse!Donotexpectittobe“easy”.Althoughitmaynotseemasdifficultcomputationallyascalculus,itrequiresagreatdealofoutsidereadingandhomework,andathoroughunderstandingofmanyabstractconcepts.YouarenowanAPstudent.Lesson#1–Donotprocrastinate!Startthesummerassignmentearlyenoughtoallowfortimeforquestionsifnecessary.Ifyouhaveanyquestionsorproblems,youmaycontactmeviae‐mailatgwlee@fcps.edu.Pleasedonotwaituntilthelastminutetobeginortoreceiveclarificationabouttheassignment.Enjoyyoursummer! MissLee [email protected]“Statisticalthinkingwillonedaybeasnecessaryforeffectivecitizenshipastheabilitytoreadandwrite.”
HGWells

SUMMERASSIGNMENTOVERVIEWPart1:Getthenecessarymaterials!Part2:Becomeexcitedaboutthestudyofstatisticsbyviewingsomevideosandwritingaboutthem.
ThiswritingassignmentshouldbesubmittedthroughBlackboard.Part3:Gettoknowyourtextbookandreviewstatisticalconceptsthatyoulearnedinpreviousmathclasses.
Theguidedreadingnotesandsomepracticeproblemswillbeturnedin(onpaper)inclassonthefirstdayofschool.AnswerstotherestofthepracticeproblemsshouldbesubmittedthroughBlackboard.
Part4:Begintothinkaboutadatacollectionprojectyouwillbecompletingthisyearbydoingsome
preliminarythinkingaboutyourtopic.ThisassignmentshouldbesubmittedthroughBlackboard.THEWHSHONORCODEAPPLIESTOTHISASSIGNMENT:DOYOUROWNWORK.DONOTCOPYANSWERSFROMYOURCLASSMATES.Solet’sbegin!
PART1:GETMATERIALSFORCLASSMandatory
YOUMUSTHAVEYOUROWNGRAPHINGCALCULATORANDBRINGITTOCLASSEVERYDAY!!Wewillbeginusingitonthefirstdayofschool.ATI‐83istheminimumcalculatorneededforthiscourse.TI‐84orTI‐84+is(much)better.YoucanfindTI‐84calculatorsnewandusedatmanystoresaswellasonline.Ifyoudonothavethecurrentoperatingsystem,MissLeewillhelpyougetanupdate.TI‐89sandTI‐NspiresareallowedbuthavedifferentmenusandwillNOTbedemonstratedinclass.IfyouhaveaTI‐89,downloadaquickguidehere(http://www.sonoma.edu/users/n/nickleac/ti89.pdf)orbringtheoriginalTI‐89manual.IfyouhaveaTI‐Nspire,IsuggestyougetaTI‐84faceplateorbewillingtolookupstuffonyourown.
Youwillneeda3‐ringbinderorsomeotherefficientmethodoforganizingpapers(e.g.projectsorter–availableonAmazon.com).Trustme,weuseaLOTofpaperinthisclass–you’llneedit.
Youwillneed#2pencils,erasers,andblackorbluepens. Youshouldalreadyhavepickedupacopyofthetextbook(ThePracticeofStatisticsforAP*,byStarnes,
Yates,Moore,4thed).Optional
IrecommendthatyoudownloadtheappforBlackboard,especiallyifyouuseamobiledevicefrequently.Iwillpostnotes,homeworksolutions,andannouncementsonBlackboardduringtheschoolyearandyouareexpectedtocheckitdaily.
Itisnotnecessarytopurchaseareviewbook,butstudentssometimesaskmeforrecommendations.Thetextbookweareusingisexcellent,andIalsopostlinksonBlackboardtofreeonlinereviewresources.However,ifyouwouldliketopurchaseone,Ihaveahighopinionofthefollowing:
Book:5Stepstoa5APStatistics(5Stepstoa5ontheAdvancedPlacementExaminationsSeries)ISBN:125986376X.Toobtainacopyofthebook,Irecommendeitherabookseller(ex.Barnes&Noble)orAmazon(under$14),Amazonalsohasusedcopies.
Flashcards:Barron'sAPStatisticsFlashCards,2ndEdition.ISBN:1438074018.Dittotheabove.

PART2:LEARNTOLOVESTATISTICS.Watch/listentothefollowing(2videosand1podcast)andwriteasummary(twoorthreeparagraphs)ofwhatyoulearnedaboutstatisticsthatyoudidnotknowbefore.Includeexamplesfromthevideosinyourwriteup.Thesummaryneedstobetyped.YoushouldsubmityourassignmentthroughBlackboard.IhighlyrecommendthatyoucompleteyourassignmentusingawordprocessoranduploadaWorddocument(orotherword‐processingfileformat,butkeepinmindthatwedonothaveApplecomputersatschool)orPDFdocumentinsteadoftypingdirectlyintheassignmentbox.
(3min)http://www.ted.com/talks/lang/eng/arthur_benjamin_s_formula_for_changing_math_education.html (18min)http://www.ted.com/talks/david_mccandless_the_beauty_of_data_visualization.html (18min–thisonemaymakemoresenseafteryoudoPart3)
https://99percentinvisible.org/episode/on‐average/
PART3:GETTOKNOWYOURTEXTANDREVIEWTHESTATFROMPREVIOUSMATHCLASSES.Youwillbeusingyourtextbookforthispart.Itnotonlyhascontentbutgreatexamplesaswellascalculatorhelp.Ialsorecommendthefollowingwebsites(nowandduringtheschoolyear)ifyoufindyouneedadditionalhelp.
http://www.stattrek.com/o Providestrainingandtoolstohelpyousolvestatisticsproblems
http://apstatsguy.com/o Entertainingvideos
http://www.khanacademy.org/math/statisticso Introductiontostatisticsvideos–careful,notalloftheseapplytoAPStat
Irecommendyoustartbyreadingchapter1inthetextbookandworkingthroughtheguidedreadingnotes.Asyoufinisheachsection,completethepracticeproblems.Thepracticeproblemsarepartiallypaper‐and‐pencil,partiallyonline(Blackboard).Thispartmostcloselyresembleshowtheclasswillworkduringtheschoolyear,soitshouldhelpyougetafeelforwhatwe’llbedoing.Trustme,thetextbookisagreatresource!DoNOTgetstuckfortoolongonanyoneconcept.Ifthetextbookandonlineresourcesarenothelping,orifyouneedclarification,[email protected].
PART4:APPLYINGWHATYOUKNOW:PLANNINGAHEADTOCOLLECTINGDATA.Oneofthewaysyouwill“do”statisticsthisyearistocollectdatafrompeopleintheWestfieldHighSchoolcommunity.Someofyourprojectswillbeselectedforpublicationinthisyear’syearbook.ThisisyourchancetostartthinkingaboutsomethingyouwouldliketoknowaboutpeopleintheWestfieldcommunity.YourchoicenowdoesNOTmeanthatyouaredefinitelycommittedtoit–therewillbetimetochangeandmodifyit.However,norepeatsareallowed,sothecooleryourideaisthesooneryouwanttohaveitfiguredout.

SUMMER ASSIGNMENT CHECK-LIST
Have you completed the following….
Part 1: Get the necessary materials!
Part 2: Writing Assignment about Videos
Part 3: Guided reading notes Part 3: Practice problems (on paper) Part 3: Practice problems (on Blackboard)
Part 4: Submit your preliminary project topic
Bring completed guided reading notes, practice problems, and your calculator on the first day of class!! I cannot wait to meet you and begin this awesome course!
Miss Lee

Name: ____________________________________
Guided Reading Notes Chapter 1: Exploring Data
Key Vocabulary: individual variable – categorical,
quantitative distribution frequency table relative frequency table pie chart bar graph side-by-side bar graph two-way table marginal distributions conditional distributions association
dotplot stemplot histogram SOCS Shape center outlier symmetric skewed spread variability mean
x Median resistant quartiles - Q1, Q3 IQR five-number summary minimum maximum boxplot standard deviation variance
Preface to the Student (pp. xiv) Start before chapter 1. Seriously. Read this page carefully - it points out some of the most useful (and overlooked) features of your textbook. Look for these features as you read the rest of your summer assignment. You can read the rest of the preface pages now, but they won't be as relevant to you.
Overview: What is Statistics? (pp.xx-xxiii) 1. In your own words, what is statistics? 2. Why is statistics important?

3. Which of the examples in the overview did you find the most interesting? Why?
Data Analysis: Making Sense of Data (pp.2-6) 4. Individuals are… 5. A variable is… 6. When you first meet a new data set, ask yourself:
Who…
What…
Why, When, Where and How…
7. Explain the difference between a categorical variable and a quantitative (or numeric) variable. Give an
example of each.
8. Give an example of a categorical variable that has number values.
9. Define distribution:

10. What are the four steps to exploring data?
Begin by….
Study relationships…
Start with a …
Then add…
11. Define inference. *Answer the practice problems and Blackboard questions on the Introduction now.
1.1 Analyzing Categorical Data (pp.8-22) 12. A frequency table displays…
13. A relative frequency table displays… 14. What type of data are pie charts and bar graphs used for? 15. Categories in a bar graph are represented by ___________ and the bar heights give the category
__________________. 16. What is a two-way table?
17. Define marginal distribution.

18. What are the two steps in examining a marginal distribution? 19. What is a conditional distribution? Give an example demonstrating how to calculate one set of
conditional distributions in a two-way table. 20. What is the purpose of using a segmented bar graph? 21. Describe the four steps to organizing a statistical problem:
State…
Plan…
Do…
Conclude…
22. Explain what it meant by an association between two variables. *Answer the practice problems and Blackboard questions on §1.1 now.

1.2 Displaying Quantitative Data with Graphs (pp.27-42) 23. What is a dotplot? Draw an example.
24. When examining a distribution, you can describe the overall pattern by its
S__________ O____________ C___________ S__________
25. If a distribution is symmetric, what does it look like? 26. If a distribution is skewed to the right, what does it look like? 27. If a distribution is skewed to the left, what does it look like? 28. Describe and illustrate the following distributions:
a. Unimodal
b. Bimodal
c. Multimodal 29. When is it beneficial to split the stems on a stemplot?

30. When is it best to use a back-to-back stemplot? 31. List the three steps involved in making a histogram. 32. Follow the instructions starting on page 38 and work through the calculator example to create a histogram
on your calculator. The data are on page 35 (yes, I know it’s really long, but this is a critical skill to learn). Email Miss Lee if you get lost or stuck on a step.
33. Why is it advantageous to use a relative frequency histogram instead of a frequency histogram? 34. How are a stemplot and a histogram similar? *Answer the practice problems and Blackboard questions on §1.2 now.
1.3 Displaying Quantitative Data with Numbers (pp.50-67) 35. What is the most common measure of center? 36. Explain how to calculate the mean, x̅.
37. What is the meaning of ?

38. Explain the difference between x̅ and . 39. Define resistant measure. 40. Explain why the mean is not a resistant measure of center. 41. What is the median of a distribution? Explain how to find it. 42. Explain why the median is a resistant measure of center. 43. How does the shape of the distribution affect the mean and median?
44. What is the range? 45. Is the range a resistant measure of spread? Explain.

46. How do you find first quartile Q1 and third quartile Q3?
47. What is the Interquartile Range (IQR)? 48. Is the IQR a resistant measure of spread? Explain. 49. How is the IQR used to identify outliers? 50. What is the five-number summary of a distribution? 51. Explain how to use the five-number summary to make a boxplot. 52. Follow the instructions starting on page 61 and work through the calculator example to create a boxplot
on your calculator. The data are on page 53. Email Miss Lee if you get lost or stuck on a step. (Hint: don’t clear the lists when you have finished – you’ll need to use the same data for #56 below).

53. What does the standard deviation measure? How do we calculate it? 54. What is the relationship between variance and standard deviation? 55. What are the properties of the standard deviation as explained on page 64?
56. Follow the instructions starting on page 65 and work through the calculator example to find one varaiable
statistics on your calculator (just part I, you are not using computer software now). The data are on page 53, if you cleared it from #52 above). Email Miss Lee if you get lost or stuck on a step.
57. How should one go about choosing measures of center and spread? *Answer the practice problems and Blackboard questions on §1.3 now.

Summarize the main points of the chapter in your own words! (Try to use 5 sentences or less – otherwise it’s not a summary. Diagrams are ok.)

APSTATISTICS Name:________________________________________________
SUMMERASSIGNMENT:PRACTICEPROBLEMS
Data Analysis: Making Sense of Data (pp.2-6) 1) AnswerthetwoquestionsfortheCheckYourUnderstanding(CYA)onpage5(Hint:answerstoallCheck
YourUnderstandingsareinthebackofthebook).1. WhoaretheindividualsinJake’sstudy?
2. WhatvariablesdidJakemeasure?Identifyeachascategorialorquantitative.Blackboard:ThefollowingquestionsshouldbeansweredonBlackboard.Theyarereproducedhereforyourconvenience,butanswersmustbesubmittedthroughBlackboardforcredit.Makenoteofanythingthatyoudonotunderstandbelowandbepreparedtoaskquestionsthefirstdayofclass.Usethefollowingscenariofor#1‐2:AttheCensusBureauWebsite,youcanviewdetaileddatacollectedbytheAmericanCommunitySurvey.Thetablebelowincludesdatafor10peoplechosenatrandomfromthemorethanonemillionpeopleinhouseholdscontactedbythesurvey.“School”givesthehighestlevelofeducationcompleted.1. Theindividualsinthisdataset
are…2. Howmanyvariablesdoesthe
datasetcontain?Howmanyarecategorical?
Determineifthevariableslistedbelowarequantitativeorcategorical.3. Timeittakestogettoschool4. Numberofpairsofshoesowned5. Haircolor6. Temperatureofacupofcoffee7. Gender
8. WhetherornotsomeoneusesFacebook
9. Height10. Amountofoilspilled11. AgeofOscarwinners
12. Typeofpainmedication13. Jellybeanflavor14. Countryoforigin15. Typeofmeat16. Teachersalaries
1.1 Analyzing Categorical Data (pp.8-22) 2) AnswerthetwoquestionsfortheCheckYourUnderstandingonpage14.
1. Usethedatainthetwo‐waytableonpage12tocalculatethemarginaldistribution(inpercents)ofgender.
Weight(lb) Age(yr)Traveltowork(min) School Gender
Incomelastyear($)
187 66 0 Ninthgrade 1 24,000158 66 n/a Highschoolgrad 2 0176 54 10 Assoc.degree 2 11,900339 37 10 Assoc.degree 1 6,00091 27 10 Somecollege 2 30,000155 18 n/a Highschoolgrad 2 0213 38 15 Master’sdegree 2 125,000194 40 0 Highschoolgrad 1 800221 18 20 Highschoolgrad 1 2,500193 11 n/a Fifthgrade 1 0

2. Makeagraphtodisplaythemarginaldistribution.Describewhatyousee.3) AnswerquestiononefortheCheckYourUnderstandingonpage17.
1. Findtheconditionaldistributionsofgenderamongeachoftheotherfouropinioncategories(wedid“Almostcertain”earlier).
Blackboard:Again,answerstothefollowingquestionsmustbesubmittedthroughBlackboardforcredit.Usethefollowingscenariofor#1‐6:TheNationalSurveyofAdolescentHealthinterviewedseveralthousandteens(grades7to12).Onequestionaskedwas“Whatdoyouthinkthearethechancesyouwillbemarriedinthenexttenyears?”Hereisatwo‐waytableoftheresponsesbygender:1. Thepercentoffemalesamongtherespondentswas…2. Isthepercentfromthepreviousquestionpartofa
marginaldistributionoraconditionaldistribution?Ofwhichvariable(s)?
3. Whatpercentoffemalesthoughtthattheywerealmostcertaintobemarriedinthenexttenyears?
4. Isthepercentfromthepreviousquestionpartofpartofamarginaldistributionoraconditional
distribution?Ofwhichvariable(s)?5. Whatpercentofthosewhothoughttheywerealmostcertaintobemarriedwerefemale?
6. Isthepercentfromthepreviousquestionpartofpartofamarginaldistributionoraconditional
distribution?Ofwhichvariable(s)?
Female MaleAlmostnochance 119 103Somechance,butprobablynot 150 171A50‐50chance 447 512Agoodchance 735 710Almostcertain 1174 756

1.2 Displaying Quantitative Data with Graphs (pp.27-42) 4) Answerquestions1‐4fortheCheckYourUnderstandingonpage31.
1. Describetheshapeofthedistribution.
2. Describethecenterofthedistribution.
3. Describethespreadofthedistribution.
4. Identifyanypotentialoutliers.5) AnswerthetwoquestionsfortheCheckYourUnderstandingonpage39.
1. ConstructahistogramthatdisplaysthedistributionofIQscoreseffectively.
2. Describewhatyousee.Isthedistributionbell‐shaped?
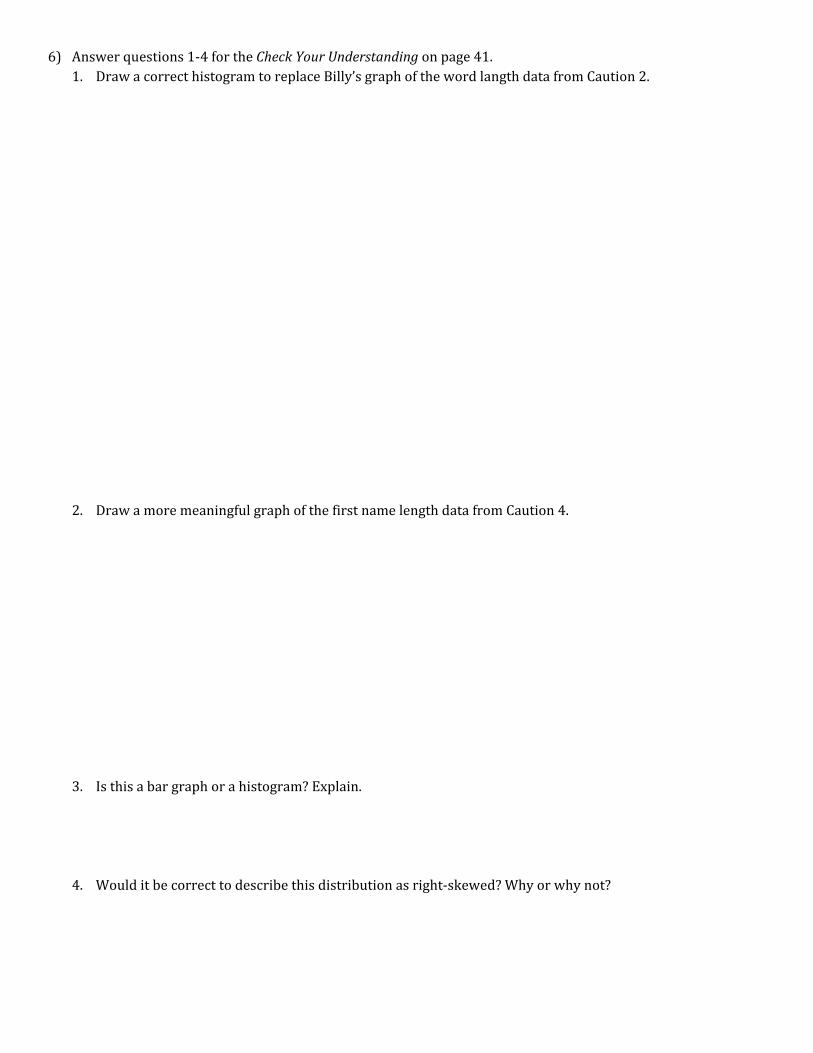
6) Answerquestions1‐4fortheCheckYourUnderstandingonpage41.1. DrawacorrecthistogramtoreplaceBilly’sgraphofthewordlangthdatafromCaution2.
2. DrawamoremeaningfulgraphofthefirstnamelengthdatafromCaution4.
3. Isthisabargraphorahistogram?Explain.
4. Woulditbecorrecttodescribethisdistributionasright‐skewed?Whyorwhynot?

Blackboard:Again,answerstothefollowingquestionsmustbesubmittedthroughBlackboardforcredit.1. Refertop.35,CYA#2.WhatpercentofAlaskaresidentsare65orolder?2. Refertop.35,CYA#3.Ignoringtheoutlier,theshapeofthedistributionis…3. Refertop.35,CYA#4.Thecenterofthedistributioniscloseto…4. Herearetheamountsofmoney(cents)incoinscarriedby10studentsinastatisticsclass:50,35,0,97,76,
0,0,87,23,65.Tomakeastemplotofthesedata,whatstemswouldyouuse?5. Oneofthefollowing12scoreswasomittedfromthestemplot:
84 76 92 92 88 9668 80 92 88 76 96
Themissingnumberis…
6. YoulookatrealestateadsforhousesinNaples,Florida.Therearemanyhousesrangingfrom$200,000to$500,000inprice.Thefewhousesonthewater,however,havepricesupto$15million.Whatwilltheshapeofthedistributionofhousepricesbe?
Usethefollowingscenariofor#7‐9:Thehistogramshowsthedistributionofthepercentsofwomenaged15andoverwhohavenevermarriedineachofthe50statesandtheDistrictofColumbia.7. Theleftmostbarinthehistogramcoverspercents
ofnever‐marriedwomenranging…
8. Thecenterofthisdistributionisintheinterval…
9. Inaboutwhatpercentofstateshaveatleast30%ofwomenaged15andovernevermarried?
1.3 Displaying Quantitative Data with Numbers (pp.50-67) 7) Answerquestions1‐4fortheCheckYourUnderstandingonpage55.
1. Basedonlyonthestemplot,wouldyouexpectthemeantraveltimetobelessthan,aboutthesameas,orlargerthanthemedian?Why?
2. Useyourcalculatortofindthemeantraveltime.WasyouranswertoQuestion1correct?
3. InterpretyourresultfromQuestion2incontextwithoutusingthewords“mean”or“average.”
4. Wouldthemeanorthemedianbeamoreappropriatesummaryofthecenterofthisdistributionofdrivetimes?Justifyyouranswer.

8) Answerquestions1‐4fortheCheckYourUnderstandingonpage61.1. Findthefive‐numbersummaryforthesedatabyhand.Showyourwork.
2. CalculatetheIQR.Interpretthisvalueincontext.
3. Determinewhetherthereareanyoutliersusingthe1.5xIQRrule.
4. Drawaboxplotofthedata.9) Answerquestions1‐4fortheCheckYourUnderstandingonpage64.
1. Findandinterpretthemean.

2. Makeatablethatshows,foreachvalue,itsdeviationfromthemeananditssquareddeviationfromthemean.
3. Showhowtocalculatethevarianceandstandarddeviationfromthevaluesinyourtable.
4. Interpretthemeaningofthestandarddeviationinthissetting.Blackboard:Again,answerstothefollowingquestionsmustbesubmittedthroughBlackboardforcredit.1. Ifadistributionisskewedtotherightwithnooutliers,whatconclusion,ifany,canyoudrawaboutthe
relativevaluesofthemeanandmedian?2. Youhavedataontheweightsingramsof5babypythons.Themeanweightis31.8andthestandard
deviationoftheweightsis2.39.Thecorrectunitsforthestandarddeviationare…
3. Herearesomemeasuresofcenterandspread:median,mean,standarddeviation,range,maximum.Whichisleastaffectedifanextremehighoutlierisaddedtoyourdata?
4. Whatareallthevaluesthatastandarddeviationsxcanpossiblytake?

APSTATISTICS Name:______________________________________Per_____
DATACOLLECTIONPROJECT,PRELIMINARYPARTYouaregoingtobecollectingdatafromyourfellowstudentsforaprojectthisyear(andpossiblepublicationinthisyear’sGuardian).Thepartyouarecompletingnowdealswithpickingyourtopicandsubmittingitforapproval.Keepinmindthateventually,youwillbeworkingwithanotherstudent,andyoumayhavetopickwhichofyourtopicstouseorotherwisecompromise.Feelfreetobecreative!Youmaywanttolookatsomeofthequestionsthatwerepublishedinthisyear’syearbook.Themorefunandcreativeyourtopic,themorelikelyyouaretobepublished.Youwillsubmityouranswersonline,butyouwillwanttocollectyourthoughtsonpaperfirst.
1. Whatisyourpopulationofinterest?Bespecificaboutwhoyouareinterestedinfindingoutabout.Usuallythisis“allWestfieldstudents,”butitdoesnotneedtobe.Forinstance,itcanbe“allfreshmen”or“femalefallathletes”or“allcustodians.”
2. Whatisyourvariable(s)?Bespecific.WhatdoyouwanttoknowaboutthepeopleatWestfieldthisyear?Ifyou’rehavingdifficultyputtingitintowords,thinkaboutifyouweretographthedistributionofyourresults–whatwouldthelabelsbe?
3. Isyourvariablequantitativeorcategorical?
4. Givetheexactwordingofthequestionyouwanttouse.Ifyouaregatheringcategoricaldataandplantosuggestcategories,givemetheseaswell.Makeyourwordingclear.Ifyourquestionistoolong,peopleprobablywon’treadit.
5. Whyisthistopicofinteresttoyou?Choosesomethingthat’sactuallyinteresting.Ifit’snot,itwillbeboringforyouandforme,anditprobablywon’tgetprintedintheyearbook.Befunandcreative!Makeitsomethingyouwouldwanttoreadabout,thatotherwisewouldn’tgetintotheyearbook.
Onceyouhavethoughtitthroughandjotteddownyourthoughts,useBlackboardtosubmityouranswer.EventualtopicsaresubjecttoapprovalbyMissLee,Ms.Keeder,andMs.Naeve.Laterthisyear…Youwillworkwithanotherstudenttofinalizeyourtopic.Youwillbedesigningyoursample,collectingyourdata,andsummarizingandanalyzingyourresults.