Embed Size (px)
Citation preview

Southeastern Power
Administration
2017 Annual Report

2017 Annual Report � Southeastern Power Administration � 1
TABLE OF Contents
Fast Facts..............................................................................................................................2
Letter to the Secretary........................................................................................................3
Mission, Vision and Organization ..................................................................................4
Marketing Map ...................................................................................................................5
Marketing Objectives.........................................................................................................6
Rates & Repayments ..........................................................................................................7
Customer Funding .............................................................................................................8
Program Direction............................................................................................................10
Georgia-Alabama-South Carolina System ...................................................................12
Kerr-Philpott System .......................................................................................................14
Cumberland System ........................................................................................................16
Jim Woodruff System.......................................................................................................18
Customer Sales .................................................................................................................20
2017 Financial Overview, Financial Statements, Report ............................................23
1166 ATHENS TECH ROADELBERTON, GA 30635-6711
706.213.3800FAX: 706.213.3884
www.energy.gov/sepa/southeastern-power-administration

2 � 2017 Annual Report � Southeastern Power Administration
FAST FACTS
Administrator:Kenneth E. Legg
Headquarters:1166 Athens Tech RoadElberton, GA 30635-6711Telephone: 706-213-3800Fax: 706-213-3884
Website: energy.gov/sepa/southeastern-power-administration
Number of Employees:44
Brian Stewart, US Army Corps of Engineers Park Ranger at Philpott Project in Bassett, Virginia, is credited with photographing the concrete dam, spillway and powerhouse on the cover and above. In Fiscal Year 2017, Philpott's Federalpower customers signed an agreement authorizing a $20 million work effort to rehabilitate the two main generators.
Marketing Area:Alabama, Florida, Georgia, Illinois, Kentucky, Mississippi, North Carolina, South Carolina, Tennessee, Virginia and West Virginia
Customers:Electric Cooperatives...................................................... 196Public Bodies ................................................................... 288Investor-Owned Utilities ................................................... 1Total .................................................................................. 485
Financial Data:Power Revenues and OtherOperating Revenues .......................................$314 millionTotal Capital Investment...................................$2.8 billionInvestment Remaining ..................................... $1.6 billion Cumulative Investment Repaid.......................$1.1 billionCumulative Interest Paid on Investment .......$2.2 billion

2017 Annual Report � Southeastern Power Administration � 3
Letter to the Secretary
Secretary Perry:I am pleased to submit Southeastern Power Administration's (Southeastern) Fiscal Year 2017 AnnualReport. This report reflects our agency's programs, accomplishments, operational and financial activitiesfor the 12-month period beginning October 1, 2016, and ending September 30, 2017.In 2017, Southeastern marketed more than 6.0 billion kilowatt-hours of energy to 485 wholesalecustomers in ten southeastern states. Power revenues totaled nearly $302 million.Southeastern proposed new rate schedules for the Georgia-Alabama-South Carolina System. Theadjustment was a revenue reduction of about nine percent to the level required to meet repaymentobligations. The new rate schedules were effective October 1, 2017, for a period of five years.Southeastern Federal Power Customers, LLC, the United States Army Corps of Engineers (Corps) andSoutheastern entered into an agreement to fund the rehabilitation of generating units at the PhilpottProject in Virginia. These units have been operating for 64 years. The approved funding of $20 millionis based on current generator output and incidental uprate. An alternative proposal to increase generatorcapacity will be considered once detailed cost estimates are available.Southeastern negotiated new scheduling and transmission arrangements with Duke Energy Progressfor the delivery of power to three Cumberland System preference customers in western North Carolina.The new arrangements were effective January 1, 2017.Southeastern, Tennessee Valley Authority, the Corps and the Tennessee Valley Public Power Associationexecuted a two-year extension to their customer funding agreement. Continued funding under thisagreement will support the 20 year, $1.2 billion program to modernize the Cumberland System Projects.Anticipating another challenging year as we compete in the electric power industry, Southeastern willcontinue to partner with our customers, the Corps and other stakeholders to provide reliable hydropowerat the lowest possible cost consistent with sound business principles.
Sincerely,
Kenneth E. LeggAdministrator

4 � 2017 Annual Report � Southeastern Power Administration
Mission, Vision & Organization
Mission StatementThe mission of Southeastern is to market and deliverfederal hydroelectric power, at the lowest possible cost,to public bodies and cooperatives in the SoutheasternUnited States.
Vision StatementSoutheastern will excel in an evolving energy marketby maintaining a well-trained, flexible workforce in anopen, rewarding and safe environment.
Organizational Chart
Human Resources andAdministration
Joel W. SeymourAssistant Administrator
Finance and Marketing
Virgil G. Hobbs IIIAssistant Administrator
Power Resources
Herbert R. NadlerAssistant Administrator
Office of the
Administrator
Kenneth E. LeggAdministrator
Legal Affairs
Leon Jourolmon IVAttorney-Advisor
Power Marketing Liaison
Barbara SmithVice President for National Relations
S o u th e a s t e r nP o w e rA d m i n i s t r a t i o n
U.S. Department of Energy

2017 Annual Report � Southeastern Power Administration � 5
Marketing Map

6 � 2017 Annual Report � Southeastern Power Administration
MARKETING OBJECTIVES
Southeastern was created in 1950 by the Secretary ofthe Interior to carry out the functions assigned to theSecretary by the Flood Control Act of 1944. In 1977,Southeastern was transferred to the newly createdDepartment of Energy (DOE). Headquartered inElberton, Georgia, Southeastern has the authorityto market hydroelectric power and energy fromreservoir projects operated by the Corps in the statesof Alabama, Florida, Georgia, Illinois, Kentucky,Mississippi, North Carolina, South Carolina,Tennessee, Virginia and West Virginia.
The objectives of Southeastern are to market theelectric power and energy generated by the Federalreservoir projects and to encourage widespread useof the power at the lowest possible cost toconsumers. Power rates are formulated based on
sound financial principles. Preference in the sale ofpower is given to public bodies and cooperatives,referred to as preference customers. Southeasterndoes not own transmission lines and must contractwith other utilities to provide transmission servicefor the delivery of Federal power.
Southeastern's responsibilities include negotiating,preparing, executing and administering contractsfor the sale of electric power. Southeasternprepares wholesale rates and repayment studiesfor the regional interconnected reservoir projects,supporting deliveries made to serve contractualloads. Southeastern is responsible for schedulinghydropower generation at the Corps' facilities withinits marketing area to ensure and maintain continuityof electric service to its customers.
“Electric power and energy generated at reservoir projects under the control of theDepart ment of the Army not required in the operation of such projects shall bedelivered to the Secretary of Energy, who shall transmit and dispose of such powerand energy in such manner as to encourage the most widespread use thereof atthe lowest possible rates to consumers consistent with sound business principles,the rate schedules to become effective upon confirmation and approval by theSecretary of Energy. Rate schedules shall be drawn having regard to the recovery(upon the basis of the application of such rate schedules to the capacity of theelectric facilities of the projects) of the cost of producing and transmitting suchelectric energy, including the amortization of the capital investment allocated topower over a reasonable period of years. Preference in the sale of such power andenergy shall be given to public bodies and cooperatives. The Secretary of Energyis authorized, from funds to be appropriated by Congress, to construct or acquire,by purchase or other agreement, only such transmission lines and related facilitiesas may be necessary in order to make the power and energy generated at saidprojects available in wholesale quantities for sale on fair and reasonable termsand conditions to facilities owned by the Federal Govern ment, public bodies,cooperatives and privately owned companies. All monies received from such salesshall be deposited in the Treasury of the United States as miscellaneous receipts.”
Section 5 of the Flood Control Act of 1944

2017 Annual Report � Southeastern Power Administration � 7
Rates & Repayments
Kerr-Philpott
Rate schedules were effective on October 1, 2015, andapproved on a final basis by the Federal Energy Regu-latory Commisson (FERC) for the Kerr-Philpott Systemon February 24, 2016.
Cumberland
In FY 2015, Southeastern proposed a rate adjustmentthat included the cost recovery of dam safety repairs atWolf Creek and Center Hill. The rates were effective onOctober 1, 2015, and were approved on a final basis byFERC for the Cumberland System on May 6, 2016.
Georgia-Alabama-South Carolina
New Georgia-Alabama-South Carolina System rateschedules were approved on an interim basis by theDeputy Secretary of Energy on August 24, 2017. Therate schedules were effective on October 1, 2017, andapproved on a final basis January 25, 2018, by FERC.
Jim Woodruff
Rates were effective on October 1, 2016, and approvedon a final basis by FERC for the Jim Woodruff Systemon on October 20, 2016.
One of the major responsibilities of Southeastern is todesign, formulate and justify rates. Repayment studiesprepared by the agency determine revenue require-ments and appropriate rate levels.
Repayment studies for each of Southeastern's fourpower marketing systems are updated annually anddemonstrate the adequacy of the rates for each system.Rates are considered to be adequate when revenues aresufficient to repay all costs associated with power pro-duction and transmission costs. Power production andtransmission costs include the amortization of Federalinvestment allocated to power. An outline of the statusof repayment is included in Table 1.
Initial Unpaid Year of Cumulative Total Investment Balance System Repayment Cumulative Expenses Investment Repaid of Studies Revenue and Interest to be Repaid to Date Investment $ $ $ $ $
GA-AL-SC 1950 5,069 4,473 1,871 596 1,275
Jim Woodruff 1957 281 241 77 40 37
Cumberland 1949 1,751 1,387 576 364 212
Kerr-Philpott 1953 655 552 227 103 124
TOTAL 7,756 6,653 2,751 1,103 1,648
Status of Repayment as of September 30, 2017 (in millions) - Table 1

8 � 2017 Annual Report � Southeastern Power Administration
Customer Funding
Georgia-Alabama-South Carolina Customer Funding:
On July 25, 2017, Sub-Agreement #23 was signedwhich approved funds for the replacement of thedigital microwave communication system for theAllatoona, Buford, Carters, Millers Ferry, and JonesBluff (Robert F. Henry Project) powerhouses in theMobile District. The total funds collected for thiswork item was $2,200,000.
Sub-Agreement #24 was signed on July 25, 2017, andfunds were approved for the replacement of thestatic frequency converter disconnect switchesenabling pump operations at the Richard B. Russellpowerhouse. The total funding requirement for thiswork item was $530,000, which included fundsavailable from closed-out completed work items.
Amendment #5 to Sub-Agreement #9 was signed onJuly 25, 2017, to increase the funding requirement by$1,000,000 for the replacement of the plant controlsat the Allatoona powerhouse for a total funding
requirement of $4,200,000, which included fundsavailable from closed-out completed work items.
Kerr-Philpott System Customer Funding:
On May 26, 2017, Sub-Agreement #4 was signed toprovide funding for the replacement of turbines andgenerators at the Philpott powerhouse. The totalfunding requirement for this work item was$20,000,000, and the collection of these funds are on-going.
Customer Funding Summary
GA-AL-SC System
Digital Microwave System ......................$2,200,000Russell Disconnect Switches ......................$530,000Allatoona Plant Controls........................$4,200,000
Kerr-Philpott System
Philpott Turbines and Generators..........$20,000,000
Carters Pump Generator 3 stator core replaced and ready to have newinsulated conductors installed. The machine is scheduled to return toservice in June 2018.
New main power transformer installed in theMiller’s Ferry switchyard stepping-up voltagefrom generator to transmission system.

2017 Annual Report � Southeastern Power Administration � 9
Cumberland System Customer Funding:
In May 2017, the Long-Term Memorandum of Agree-ment Project Review Committee recommended theformal approval of Sub-Agreement #8. The ProgramCoordination Committee members, representing 24customers outside the Tennessee Valley Authorityservice territory, signed the document approvingfunding of intake and draft tube gate liftingequipment at Barkley, Cheatham, Old Hickory andCordell Hull. The Sub-Agreement also initiatedfunding the rehabilitation of Old Hickory whichincludes replacing generators, turbines, trans-formers, excitation equipment and direct currentsystem components.
In August 2017, the Short-Term Memorandum ofAgreement Sub-Agreement #3 was signed on behalfof the 154 Tennessee Valley preference entitiescollecting $25 million of customer funds torehabilitate the four generators at the Barkleypowerhouse.
Customer Funding Summary
Cumberland System
Barkley Rehabilitation .........................$ 25,650,000 Old Hickory Rehabilitation..................$ 17,250,000
Brown Thornton representing Cumberland System Preference Customers in Kentucky and Mississippi poses in the CenterHill Generator 2 water passage next to new wicket gates and aerating turbine. As the turbine rotates, air is naturally drawninto hollow passages through valves and piping, shown in photo at right, to improve downstream dissolved oxygen levels.

10 � 2017 Annual Report � Southeastern Power Administration
PROGRAM DIRECTION
Human Capital UpdateTo maintain organization effectiveness and accomplishSoutheastern’s mission, we continue to utilize ourallocation of Full-Time Equivalent (FTE) employees.Southeastern experienced limited turn-over among itsprofessional staff. As needed, we have followed oursuccession plan and employee development initiativesto acquire necessary training, make suitabilitydeterminations, initiate security clearances andfacilitate certifications for new and existing employees.
Information ManagementSoutheastern’s Information Management Team hascompletely rewritten our Energy Management Systemin preparation for the completion of the Corps upgradeto the Supervisory Control and Data Acquisition(SCADA) equipment within the Georgia-Alabama-South Carolina system. The new Energy ManagementSystem has improved processing speed and error-handling, as well as increased network performanceand an enhanced alerting capability. We are currentlyworking with the Corps to test the new SCADA as theyfinalize development and begin installation.
Below, Mobile District Corps Management hosted a tour of Buford Powerhouse for Sawnee Electric MembershipCorporation Board Members and Executive Staff along with Georgia Transmission Corporation, Georgia System OperationsCorporation and Oglethorpe Power Corporation Chief Officers. Southeastern Administrator and Senior Staff provided abriefing of the Federal Power Program.

2017 Annual Report � Southeastern Power Administration � 11
Above and below, Senior Leaders from the US Bureau of Reclamation, US Army Corps of Engineers Headquarters, GreatLakes & Ohio River Division, Mississippi Valley Division, Northwestern Division, South Atlantic Division, SouthwesternDivision, US Department of Energy Headquarters, Bonneville Power Administration, Southeastern Power Administration,Southwestern Power Administration and Western Area Power Administration met throughout the year forming theFederal Hydropower Council. The group is focusing efforts to improve, alter and adopt common infrastructure acquisitionstrategies, cost accounting procedures, water storage program administration, operations & maintenance efficienciesand communication plans to sustain the Nation’s government owned and marketed power systems.

12 � 2017 Annual Report � Southeastern Power Administration
20 40 60 80 100 120
0 20 40 60 80 100 120
R
40 60 80 100 120 140
00 2020 4040 6060 8080
100100
120120
140140
00 2020 4040 6060 8080 100100
120120
140140
Hartwell
R.B. Russell
J.S. Thurmond
Buford
West Point
W.F. George
Allatoona
Carters
R.F. Henry
Millers Ferry
0 20 40 60 80 100 120 140
0 20 40 60 80 100 120 140
2008200920102011201220132014201520162017
00 2020 4040 6060 8080
100100
120120
00 2020 4040 6060 8080 100100
120120
0 20 40 60 80 100 120
0 20 40 60 80 100 120
40 60 80 100 120 140
0
40 60 80 100 120 140
0 40 60 80 100 120 140
Georgia - Alabama - South Carolina
The Georgia-Alabama-South Carolina System consistsof ten projects located in or on the border of Alabama,Georgia and South Carolina. The power generated atthese projects is sold to 175 preference entities serving203 preference customers in Alabama, Florida, Georgia,Mississippi, North Carolina and South Carolina.
Operational PerformanceGeneration from streamflow for FY 2017 was 65% of theaverage. Figure A illustrates the percent of averagegeneration by project, and Figure B shows systemgeneration for the years 2008 through 2017.
The customer funded work on the Allatoona switchyardwas completed. The customers agreed to fund the repairwork at the project that was caused during the fire inMay of 2014. Allatoona Generator #4 was returned asthe station service unit for the plant in June 2017. Thefull plant is expected to return to service in June 2018.
During March of FY 2017, Carters reversible pumpGenerator #3 was removed from service for reha-bilitation. The return to service is scheduled for June2018.
Work on analyzing the vibration problem on Generator#3 at Hartwell continued during FY 2017. The solutionto mitigate the vibrations requires a reconfiguration ofthe generator windings. The projected return of the unitis October 2018.
West Point transformer installation was completed inAugust 2017.
Actual Generation as a Percentage of Average System Generation - Figure B
Actual Generation as a Percentage of Average Project Generation - Figure A

2017 Annual Report � Southeastern Power Administration � 13
system report
FY 2017 Revenue by Source - Figure C
FY 2017 Application of Revenues - Figure D
Financial PerformanceTotal revenue for the Georgia-Alabama-South CarolinaSystem in FY 2017 was $214.2 million. Of this amount,$205.4 million was derived from the sale of 2,595,445megawatt-hours of energy and 2,184.2 megawatts of ca-pacity. Total operating expenses, excluding depreciation,were $117.4 million. Interest charged to Federal invest-ment was $63.7 million and repayment of the Federal in-vestment was $33.1 million. Figure C shows the revenueby source for this system and Figure D shows the appli-cation of revenues.
Table 2 indicates the current rates. Current rates for theGeorgia-Alabama-South Carolina System were ap-proved on an interim basis August 24, 2017, by theDeputy Secretary of Energy. The rate schedules are ef-fective for the period October 1, 2017, through September30, 2022
Cooperatives52.74%
Municipals37.99%
State5.15%
Other4.12%
Repayment15.43%
Interest29.75%
Operations14.88%
Maintenance13.54%
Transmission12.10%
Purchased Power14.30%
Power Rates - Table 2
Product Effective October 1, 2017
Capacity 4.09 $/kW/MonthEnergy 12.33 mills/kWhGeneration Services 0.12 $/kW/Month
Rate schedules provide for a monthly pass-through of actualpurchase power, transmission and ancillary service expense.

14 � 2017 Annual Report � Southeastern Power Administration
Actual Generation as a Percentage of Average Project Generation - Figure E
00 2020 4040 6060 8080 100100
00 2020 4040 6060 8080 100100
Philpott
Kerr
60 80 100 120 140 160
0 20 40 60 80 100 120 140 160
0
0 20 40 60 80 100
0 20 40 60 80 100
Actual Generation as a Percentage of Average System Generation - Figure F
2008200920102011201220132014201520162017
00 2020 4040 6060 8080
100100
120120
140140
160160
00 2020 4040 6060 8080 100100
120120
140140
160160
0 20 40 60 80 100 120 140 160
0 20 40 60 80 100 120 140 160
0
KERR-PHILPOTT
The Kerr-Philpott System consists of two projects – JohnH. Kerr on the Roanoke River and Philpott on the SmithRiver. Power generated at the projects is marketed to 75preference customers in North Carolina and Virginia.
Operational PerformanceGeneration for FY 2017 was 93% of average. Figure E il-lustrates the percent of average generation by project forthe year. Figure F shows the system generation by yearfrom 2008 through 2017.
In March 2016, Philpott Project experienced a breakerfire that forced a total plant outage. Contracts wereawarded for fire cleanup and the replacement of gener-ator control systems destroyed by the fire. The plant re-turned to service in September 2017. Generator #2 willremain unavailable until rehabilitation is complete.
Steven Jones,Wilmington DistrictHydropower Chief (left)and Christopher Powell,Philpott OperationsProject Manager, providea Philpott Powerplanttour for Alice Wolfe, BlueRidge Power AgencyGeneral Manager andFederal power municipalcustomers Durwin Joyce,City of Martinsville,Virginia, A.K. Briele, Cityof Salem, Virginia andMichael Goad, City ofRadford, Virginia.

Capacity 3.65 $/kW/MonthEnergy 14.80 mills/kWh
2017 Annual Report � Southeastern Power Administration � 15
Power Rates - Table 3
Financial PerformanceTotal revenue for the Kerr-Philpott System in FY 2017 was$26.2 million. Of this amount, $25.8 million was derivedfrom the sale of 416,166 megawatt-hours of energy and196.5 megawatts of capacity.
Total operating expenses, excluding depreciation, were$20.4 million. Interest charged to Federal investment was$5.4 million and repayment of the Federal investment was$0.4 million in FY 2017. Figure G shows the revenue bysource for the Kerr-Philpott System and Figure H showsthe application of revenues.
Table 3 indicates the current rates. Current rates for theKerr-Philpott System were approved by FERC on a finalbasis on February 24, 2016. The rate schedules are effec-tive for the period October 1, 2015, through September30, 2020.
Rate schedules also provide an adjustment to true-up energy andcapacity rates based on the cumulative net revenue available forrepayment. The rates for capacity and energy for the period April1, 2018, through March 31, 2019, will be as follows:Capacity 3.96 $/kW/MonthEnergy 15.60 mills/kWh
Product ThroughSeptember 30, 2017
system report
FY 2017 Revenue by Source - Figure G
FY 2017 Application of Revenues - Figure H
Cooperatives78.89%
Other1.54%
Municipals19.57%
Repayment1.39%
Interest20.59%
Operations23.35%
Maintenance20.05%
Transmission34.55%
Purchased Power0.07%

16 � 2017 Annual Report � Southeastern Power Administration
Actual Generation as a Percentage of Average Project Generation - Figure I
Actual Generation as a Percentage of Average System Generation - Figure J
CUMBERLAND
There are nine projects in the Cumberland Systemlocated in Kentucky and Tennessee. The power producedat these projects is delivered to 25 preference entities thatserve 210 preference customers in Alabama, Georgia,Illinois, Kentucky, Mississippi, North Carolina, Tennesseeand Virginia.
Operational PerformanceGeneration for the system during FY 2017 was 96% ofaverage. The percentage of average generation by projectis shown in Figure I, and Figure J shows systemgeneration for the years 2008 through 2017.
During FY 2017, partial peaking operation for schedulingcontinues under the Revised Interim Operating Plan dueto the Dam Safety repair work at the Center Hill Project.The major rehabilitation of Center Hill Generator #2 wascompleted in August 2017. Following the return ofGenerator #2, the major rehabilitation of Center HillGenerator #1 was initiated. Generator #1 is expected toreturn June 2018.
The outage of Generator #4 at Old Hickory continueddue to alignment problems. The major rehabilitationcontract was awarded in March 2017. The Generator isexpected to return to service in April 2019.
Barkley
Cheatham
J. Percy Priest
Old Hickory
Center Hill
Cordell Hull
Dale Hollow
Wolf Creek
Laurel
20 40 60 80 100 120
00 2020 4040 6060 8080 100100 120120 140140
00 2020 4040 6060 8080 100100 120120 140140
30 60 90 120 150
0 30 60 90 120 150
0 20 40 60 80 100 120 140
20 40 60 80 100 120
0 20 40 60 80 100 120 140
2008200920102011201220132014201520162017
00 2020 4040 6060 8080
100100
120120
00 2020 4040 6060 8080 100100
120120
0 20 40 60 80 100 120
0
30 60 90 120 150
0 30 60 90 120 150
0
0 20 40 60 80 100 120
0 100 120 140

2017 Annual Report � Southeastern Power Administration � 17
system report
FY 2017 Revenue by Source - Figure K
FY 2017 Application of Revenues - Figure L
Municipals9.38%
Cooperatives34.03%
Other4.27%
TennesseeValley
52.32%
Repayment17.27%
Interest9.62%
Operations52.17%
Maintenance5.46%
Transmission15.48%
Power Rates - Table 4
Capacity 1.911 $/kW/Month EnergyEnergy 12.53 mills/kWh
This is the rate under a revised interim operating plan, effective July1, 2014.
Rate schedules provide for a monthly pass-through of actualpurchase power, transmission and ancillary service expense.Rateschedules also provide an adjustment to true-up capacity andenergy rate based on transfers of specific power investment to plantin service for the preceding fiscal year. The rates for capacity andenergy for the period April 1, 2018, through March 31, 2019, willbe as follows:Capacity 1.943 $/kW/MonthEnergy 13.17mills/kWh
Financial PerformanceTotal revenue for the Cumberland System in FY 2017was $62.7 million. Of this amount, $60.0 million wasderived from the sale of 2,820,121 megawatt-hours ofenergy and 829.5 megawatts of capacity. Total operatingexpenses, excluding depreciation, were $45.8 million.Interest charged to Federal investment was $6.0 millionand repayment was $10.9 million. Figure K shows therevenue by source for the Cumberland System andFigure L shows the application of revenues.
Table 4 indicates the current rates. Current rates for theCumberland System were approved by FERC on a finalbasis on May 6, 2016. The rate schedules are effective forthe period October 1, 2015, through September 30, 2020.
Product ThroughSeptember 30, 2017

18 � 2017 Annual Report � Southeastern Power Administration
JIM WOODRUFF
The Jim Woodruff System is a single-project systemlocated on the border of Florida and Georgia. Thissystem has six preference customers and one investor-owned utility located in the central panhandle of Florida.
Operational PerformanceGeneration during FY 2017 was 80% of average. FigureM illustrates the project’s generation for the years 2008through 2017.
There were no significant operational issues in theWoodruff System during FY 2017.
2008200920102011201220132014201520162017
00 2020 4040 6060 8080
100100
120120
00 2020 4040 6060 8080 100100
120120
0 20 40 60 80 100 120
0 20 40 60 80 100 120
Actual Generation as a Percentage of Average System Generation - Figure M
The Federal power generated from Lake Seminole and the Jim Woodruff Powerplant serve two municipal and four cooperativecustomers in Florida’s central panhandle.

2017 Annual Report � Southeastern Power Administration � 19
system report
Financial PerformanceTotal revenue from the Jim Woodruff System was $10.7million in FY 2017. Of this amount, $10.6 million wasderived from the sale of 213,214 megawatt-hours ofenergy and 36 megawatts of capacity.
Total operating expenses, excluding depreciation, were$6.4 million. Interest charged to the Federal investmentwas $1.9 million and repayment of the Federalinvestment was $2.4 million. Figure N shows therevenue by source for the System and Figure O showsthe application of revenues.
Table 5 indicates the current rates. Current rates forthe Jim Woodruff System were approved by FERC on afinal basis October 20, 2016. The rate schedules wereeffective beginning October 1, 2016, and extend throughSeptember 30, 2021.
Power Rates - Table 5
Product ThroughSeptember 30, 2017
Capacity 7.74 $/kW/MonthEnergy 20.44 mills/kWh
Rate schedules provide for a monthly pass-through of actualpurchased power.
FY 2017 Revenue by Source - Figure N
FY 2017 Application of Revenues - Figure O
Municipals26.39%
Cooperatives66.90%
Other0.91%
IOUs5.80%
Transmission3.36%
PurchasedPower18.83%
Repayment22.46%
Interest18.17%
Operations12.33% Maintenance
24.85%
20 � 2017 Annual Report � Southeastern Power Administration
CUSTOMER SALES
GEORGIA-ALABAMA-SOUTH CAROLINA SYSTEM
Alabama Baldwin County EMC 17,284 19,953,524 2,240,982.80 Black Warrior EMC 18,494 26,049,506 2,492,546.30 Central Alabama EC 18,660 21,408,665 2,418,332.59 Clarke-Washington EMC 6,678 7,547,540 864,458.85 Coosa Valley EC 5,728 6,541,202 742,191.91 Dixie EC 7,273 8,377,245 942,965.62 Pea River EC 3,422 3,864,924 442,914.87 Pioneer EC 10,056 11,554,981 1,303,275.88 Tallapoosa River EC 11,494 13,084,988 1,488,828.07 Tombigbee EC 6,578 9,207,905 886,164.46 Wiregrass EC 8,467 9,658,817 1,097,055.17 PowerSouth Energy Cooperative 100,000 121,030,000 8,532,006.05 City of Alexander City 7,846 11,198,051 1,058,597.98 City of Dothan 52,461 74,922,056 7,079,119.04 City of Evergreen 4,047 5,770,309 545,913.82 City of Fairhope 6,248 8,920,172 843,050.11 City of Foley 21,199 30,254,670 2,860,311.33 City of Hartford 3,050 4,234,826 410,174.64 City of LaFayette 2,358 3,363,425 318,105.73 City of Lanett 5,321 7,594,383 717,921.66 City of Luverne 3,158 4,506,802 426,075.70 City of Opelika 20,809 29,706,351 2,807,795.68 City of Piedmont 3,869 5,411,971 521,138.18 City of Robertsdale 3,372 4,747,168 454,383.55 City of Sylacauga 16,494 23,054,649 2,221,319.43 City of Troy 10,079 10,273,890 1,305,663.04 City of Tuskegee 11,689 16,514,508 1,575,701.82 Alabama Total 386,134 498,752,528 46,596,994.28
FloridaChoctawhatchee EC 1,231 1,419,874 159,558.82 West Florida ECA 8,402 9,717,080 1,089,611.58 Florida Total 9,633 11,136,954 1,249,170.40
GeorgiaAltamaha EMC 10,956 10,484,953 855,199.25 Amicalola EMC 11,513 11,014,005 898,598.43 Canoochee EMC 9,392 8,989,932 733,151.51 Carroll EMC 17,032 16,295,616 1,329,396.41 Central Georgia EMC 13,381 12,809,220 1,044,558.70 Coastal EMC 3,157 3,023,726 246,476.44 Cobb EMC 42,613 40,817,316 3,326,988.85 Colquitt EMC 38,410 36,741,429 2,997,854.50 Coweta-Fayette EMC 13,378 12,812,192 1,044,439.90 Diverse Power, Inc. 12,050 11,538,107 940,716.49 Excelsior EMC 8,914 8,530,233 695,795.49 Flint EMC 55,744 52,051,867 4,335,095.54 Grady EMC 10,439 9,985,624 814,753.59 Greystone Power Corporation 31,540 30,201,583 2,462,285.44 Habersham EMC 10,176 9,734,968 794,244.81 Hart EMC 18,630 17,815,405 1,453,944.70 Irwin EMC 8,246 7,886,253 643,560.22 Jackson EMC 48,415 46,338,686 3,779,263.64 Jefferson EMC 14,188 13,585,956 1,107,638.88 Little Ocmulgee EMC 7,754 7,413,672 605,121.54 Middle Georgia EMC 6,028 5,766,079 470,477.04 Mitchell EMC 18,023 17,240,781 1,406,687.76 Ocmulgee EMC 8,188 7,830,774 639,033.34 Oconee EMC 8,018 7,673,245 625,865.47 Okefenoke Rural EMC 9,487 9,077,120 740,493.37 Planters EMC 10,258 9,812,244 800,621.91 Rayle EMC 10,350 9,899,428 807,786.18 Satilla Rural EMC 30,374 29,054,312 2,370,650.14 Sawnee EMC 19,423 18,590,161 1,516,157.56 Slash Pine EMC 4,785 4,577,198 373,464.83 Snapping Shoals EMC 20,119 19,269,808 1,570,753.59 Southern Rivers Energy 6,842 6,548,763 534,088.61 Sumter EMC 11,437 10,945,646 892,752.39 Three Notch EMC 12,194 11,666,905 951,778.96 Tri-County EMC 6,416 6,144,541 500,904.45 Upson EMC 4,581 4,383,015 357,561.64 Walton EMC 31,322 30,012,356 2,445,652.02 Washington EMC 14,249 13,633,510 1,112,186.48 City of Acworth 2,303 3,245,207 206,299.31 City of Adel 6,902 9,719,568 618,143.89 City of Albany 60,831 85,725,726 5,449,301.11 City of Barnesville 2,635 3,712,354 236,025.44 City of Blakely 5,412 7,623,241 484,738.82 City of Brinson 156 220,438 13,986.94 City of Buford 2,356 3,319,658 211,042.12
City of Cairo 6,253 8,814,472 560,200.43 City of Calhoun 7,660 10,802,759 686,353.24 City of Camilla 6,072 8,550,240 543,798.71 City of Cartersville 17,152 24,166,068 1,536,384.75 City of College Park 15,559 21,936,896 1,394,005.10 City of Commerce 4,456 6,272,901 399,035.76 City of Covington 9,382 13,223,161 840,482.34 City of Dalton 45,822 67,118,113 4,125,717.81 City of Doerun 629 886,121 56,340.45 City of Douglas 10,180 14,341,392 911,837.92 City of East Point 33,488 47,171,555 2,999,453.57 City of Elberton 11,447 16,116,551 1,025,124.88 City of Ellaville 936 1,319,691 83,860.85 City of Fairburn 1,799 2,537,189 161,196.30 City of Fitzgerald 9,720 13,694,686 870,662.27 City of Forsyth 3,720 5,240,801 333,208.86 City of Fort Valley 9,417 13,268,417 843,534.33 City of Grantville 470 661,305 42,081.71 City of Griffin 18,157 25,583,559 1,626,438.25 City of Hampton 832 769,803 103,508.46 City of Hogansville 1,531 2,156,171 137,120.21 City of Jackson 2,067 2,912,364 185,152.85 City of LaFayette 6,607 9,307,891 591,800.43 City of Lagrange 17,096 24,097,451 1,531,579.33 City of Lawrenceville 4,795 6,764,860 429,695.26 City of Marietta 37,172 52,410,900 3,330,447.17 City of Monroe 7,223 10,173,570 646,932.68 City of Monticello 1,836 2,585,362 164,429.49 City of Moultrie 15,480 21,808,432 1,386,577.15 City of Newnan 6,893 9,712,262 617,447.78 City of Norcross 1,736 2,448,140 155,547.31 City of Oxford 458 646,706 41,054.22 City of Palmetto 923 1,300,714 82,682.92 City of Quitman 4,428 6,234,948 396,558.51 City of Sandersville 4,997 7,037,849 447,551.20 City of Sylvania 5,436 7,664,120 487,033.38 City of Sylvester 3,952 5,570,719 354,052.46 City of Thomaston 7,687 10,836,336 688,680.38 City of Thomasville 25,053 35,300,212 2,244,158.32 City of Washington 5,068 7,138,579 453,925.45 City of West Point 4,683 6,591,146 419,336.81 City of Whigham 319 449,627 28,577.88 Crisp County Power Commission 18,068 25,455,097 1,618,403.36 Town of Mansfield 379 532,840 33,925.34
Georgia Total 1,095,655 1,265,374,797 91,061,433.58
MississippiCoast EPA 26,863 38,393,099 3,625,493.23 East Mississippi EPA 11,336 16,172,673 1,529,820.21 Singing River EPA 33,684 48,152,637 4,546,291.44 Cooperative Energy 68,000 67,974,000 5,347,393.26
Mississippi Total 139,883 170,692,409 15,048,998.14
North CarolinaBlue Ridge EMC 7,311 11,054,334 690,698.44 EnergyUnited EMC 16,302 23,027,010 1,424,200.31 Haywood EMC 926 1,387,782 87,226.28 Pee Dee EMC 455 677,477 42,744.85 Rutherford EMC 24,018 36,202,626 2,266,527.16 Union EMC 11,633 17,517,235 1,097,442.90 City of Cherryville 1,478 914,959 108,799.88 City of Concord 8,007 5,093,829 713,373.62 City of Gastonia 15,971 9,883,364 1,175,589.73 City of Kings Mountain 2,896 1,841,795 258,002.42 City of Lincolnton 1,577 975,672 116,074.20 City of Monroe 7,693 4,761,690 566,288.34 City of Morganton 9,535 14,356,844 899,277.78 City of Newton 2,067 1,278,514 152,133.06 City of Shelby 5,892 3,645,428 433,679.97 City of Statesville 9,705 6,005,440 714,355.89 Town of Bostic 412 625,417 38,975.47 Town of Cornelius 361 223,564 26,576.31 Town of Dallas 1,299 825,667 115,715.86 Town of Drexel 879 1,326,318 82,966.97 Town of Forest City 2,721 1,731,233 242,429.06 Town of Granite Falls 828 512,123 60,940.93 Town of Huntersville 490 302,839 36,058.75 Town of Landis 1,098 678,894 80,807.68 Town of Maiden 1,235 763,773 90,894.23 Town of Pineville 490 302,839 36,058.75
North Carolina Total 135,279 145,916,666 11,557,838.84
CUSTOMER CAPACITY ENERGY REVENUE (kW) (kWh) ($)
CUSTOMER CAPACITY ENERGY REVENUE (kW) (kWh) ($)

2017 Annual Report � Southeastern Power Administration � 21
South CarolinaCentral Electric Power Cooperative 180,700 241,943,262 19,327,458.49 Little River EC 522 593,271 64,044.19 City of Abbeville 2,959 4,460,170 250,076.42 City of Clinton 2,975 1,723,821 210,423.57 City of Easley 8,656 12,209,304 755,893.40 City of Gaffney 6,986 9,859,389 610,171.32 City of Georgetown 5,300 6,831,639 585,321.80 City of Greenwood 11,404 17,350,698 1,079,756.38 City of Greer 9,159 12,972,598 800,892.93 City of Laurens 5,891 8,335,072 514,952.45 City of Newberry 3,277 1,898,408 231,776.14 City of Orangeburg 13,779 15,543,720 1,687,786.44 City of Rock Hill 19,115 26,961,241 1,669,225.39 City of Seneca 2,688 1,643,040 197,438.45 City of Union 3,484 2,019,262 246,435.55 City of Westminster 678 392,438 47,946.98 Town of Bamberg 2,300 2,927,843 253,151.81 Town of Due West 285 181,187 25,388.89 Town of McCormick 522 573,129 63,916.96 Town of Prosperity 602 938,095 66,674.29 Town of Winnsboro 1,366 1,490,137 167,027.20 South Carolina PSA 135,000 132,723,800 11,025,614.92
South Carolina Total 417,648 503,571,524 39,881,373.97
Georgia-Alabama-SouthCarolina System Total 2,184,232 2,595,444,878 205,393,809.21
KERR-PHILPOTT SYSTEM
North Carolina Albemarle EMC 2,593 6,083,540 238,012.55 Brunswick EMC 3,515 8,431,939 378,828.71 Carteret-Craven EMC 2,735 6,468,485 293,268.40 Central EMC 1,239 2,972,168 133,533.12 Edgecombe-Martin County EMC 4,155 9,875,619 383,655.66 Four County EMC 4,198 10,070,350 452,439.09 Halifax EMC 2,606 6,198,161 249,504.90 Jones-Onslow EMC 5,184 12,435,611 558,705.12 Lumbee River EMC 3,729 8,945,292 401,892.56 Pee Dee EMC 2,968 7,119,771 319,875.84 Piedmont EMC 1,086 2,573,720 116,683.66 Pitt & Greene EMC 1,580 3,790,176 170,284.40 Randolph EMC 3,608 8,655,034 388,851.88 Roanoke EMC 5,528 13,044,940 508,760.44 South River EMC 6,119 14,678,530 659,474.61 Tideland EMC 3,098 7,367,588 296,364.31 Tri-County EMC 3,096 7,426,824 333,671.20 Wake EMC 2,164 5,191,100 233,224.90 City of Elizabeth City 2,073 1,553,770 292,530.20 City of Kinston 1,466 1,098,808 118,833.61 City of Laurinburg 415 311,054 33,639.77 City of Lumberton 895 670,825 72,548.39 City of New Bern 1,204 902,430 97,595.86 City of Rocky Mount 2,538 1,902,304 205,729.70 City of Washington 2,703 2,025,976 219,104.56 City of Wilson 2,950 2,211,106 239,126.27 Fayetteville Public Works Commission 5,431 4,070,684 440,235.52 Greenville Utilities Commission 7,534 5,642,614 610,704.19 Town of Apex 145 108,424 11,753.71 Town of Ayden 208 155,901 16,860.40 Town of Belhaven 182 136,415 25,682.84 Town of Benson 120 89,945 9,727.18 Town of Clayton 161 120,672 13,050.61 Town of Edenton 775 580,883 109,363.65 Town of Enfield 259 193,545 16,540.21 Town of Farmville 237 177,636 19,211.13 Town of Fremont 60 44,970 4,863.50 Town of Hamilton 40 29,981 5,644.58 Town of Hertford 203 152,154 28,646.21 Town of Hobgood 46 34,479 6,491.28 Town of Hookerton 30 22,487 2,431.84 Town of La Grange 93 69,709 7,538.59 Town of Louisburg 857 31,571,164 556,109.24 Town of Pikeville 40 29,981 3,242.42 Town of Red Springs 117 87,697 9,484.03 Town of Robersonville 232 173,887 32,738.48 Town of Scotland Neck 304 227,857 42,898.79 Town of Selma 183 136,844 14,833.92 Town of Smithfield 378 283,148 30,640.55 Town of Tarboro 2,145 1,607,736 302,690.43 Town of Wake Forest 149 111,496 12,077.89 Town of Windsor 331 247,344 46,655.33
North Carolina Total 93,705 198,112,775 9,776,256.23
VirginiaB-A-R-C EC 3,740 8,813,625 632,182.42 Central Virginia EC 7,956 18,766,239 1,345,664.70 Community EC 4,230 9,982,288 715,256.11 Craig-Botetourt EC 1,692 7,049,443 338,304.29 Mecklenburg EMC 11,344 26,988,199 1,922,040.16 Northern Neck EC 3,944 9,262,006 666,090.10 Northern Virginia EC 3,268 7,433,877 548,061.83 Prince George EC 2,530 5,941,396 427,283.90 Rappahannock EC 22,427 52,949,452 3,792,649.04 Shenandoah Valley EMC 9,938 23,604,273 1,683,126.30 Southside EC 14,575 34,322,924 2,463,184.19 City of Bedford 1,200 905,645 76,726.74 City of Danville 5,600 4,226,343 358,058.20 City of Franklin 1,003 749,505 141,375.56 City of Martinsville 1,600 1,207,526 102,302.33 City of Radford 1,300 981,576 83,114.33 City of Salem 2,200 1,661,127 140,654.97 Harrisonburg Electric Commission 2,691 2,037,169 379,788.86 Town of Blackstone 389 290,687 54,830.63 Town of Culpepper 391 295,998 55,182.99 Town of Elkton 171 127,784 24,102.94 Town of Richlands 500 377,353 31,969.50 Town of Wakefield 106 79,208 14,940.97
Virginia Total 102,795 218,053,643 15,996,891.06
Kerr-Philpott System Total 196,500 416,166,418 25,773,147.29
JIM WOODRUFF SYSTEM
FloridaCentral Florida EC 2,300 11,189,524 560,098.15 Suwannee Valley EC 4,800 23,054,487 1,159,128.44 Talquin EC 13,500 81,982,749 4,158,899.68 Tri-County EC 5,200 24,951,941 1,305,400.46 City of Chattahoochee 1,800 10,718,062 560,895.48 City of Quincy 8,400 45,174,963 2,272,824.86 Duke Energy Florida - 16,142,726 623,260.87
Jim Woodruff System Total 36,000 213,214,452 10,640,507.94
CUMBERLAND SYSTEM
IllinoisSouthern Illinois Power Cooperative 24,000 35,000,000 1,292,393.04 Illinois Total 24,000 35,000,000 1,292,393.04
KentuckyBig Rivers Electric Corporation 154,000 236,398,000 8,412,184.58 East Kentucky Power Cooperative 157,000 221,955,000 8,680,491.33 City of Barbourville 1,916 3,479,350 126,085.13 City of Bardstown 1,957 3,553,804 128,721.42 City of Bardwell 472 857,126 31,010.46 City of Benham 216 392,244 14,257.81 City of Corbin 2,263 4,109,483 148,903.88 City of Falmouth 514 933,395 33,788.07 City of Frankfort 13,605 24,705,925 895,038.20 City of Henderson 10,000 14,970,000 550,025.08 City of Madisonville 6,796 12,341,158 447,126.85 City of Nicholasville 2,226 4,042,293 146,450.15 City of Owensboro 21,775 39,542,188 1,432,514.41 City of Paris 1,188 2,157,342 78,130.42 City of Providence 1,072 1,946,692 70,540.90 City of Princeton 313 1,633,720 35,462.87 City of Paducah 2,183 11,394,280 247,353.36
Kentucky Total 377,496 584,412,000 21,478,084.92 MississippiCooperative Energy 44,000 57,123,000 2,274,805.84 Mississippi Delta Energy Agency 10,000 14,039,000 524,604.81 Municipal Energy Agency of Mississippi 16,000 23,427,000 864,747.25
Mississippi Total 70,000 94,589,000 3,664,157.90 North CarolinaFrench Broad EMC 7,029 10,616,911 517,215.54 Haywood EMC 2,057 3,107,386 151,372.23 Town of Waynesville 1,457 2,060,074 105,433.02
North Carolina Total 10,543 15,784,371 774,020.79 Tennessee Valley RegionTVA Acquisition for154 TVPPA Members 347,504 2,090,336,000 32,798,208.30
Cumberland System Total 829,543 2,820,121,371 60,006,864.95
Grand Total 3,246,275 6,044,947,119 301,816,329.39
CUSTOMER CAPACITY ENERGY REVENUE (kW) (kWh) ($)
CUSTOMER CAPACITY ENERGY REVENUE (kW) (kWh) ($)

22 � 2017 Annual Report � Southeastern Power Administration
Federal hydropower customers, owners and marketers convene biannually at Southeastern Federal Power Alliance, above,and Team Cumberland, below, meetings to discuss matters of mutual concern.
Public and investor owned utility hydropower operators gathered and networked in Nashville for the 2017 Joint Hydro.Ninety-five individuals participated, the most ever in the meeting’s 40 year history.

2017 Annual Report � Southeastern Power Administration � 23
Southeastern Power
Administration
2017Financial Overview
andFinancial Statements

24 � 2017 Annual Report � Southeastern Power Administration
contents
Financial Overview and Program Performance ............................................................................................. 25
Independent Auditors’ Report ........................................................................................................................... 29
Combined Financial Statements:
Combined Balance Sheets as of September 30, 2017 and 2016........................................................................................................................... 32
Combined Statements of Revenue and Expenses for the years ended September 30, 2017 and 2016............................................................................................................... 33
Combined Statements of Changes inCapitalization for the years ended September 30, 2017 and 2016............................................................................................................... 34
Combined Statements of Cash Flows for the yearsended September 30, 2017 and 2016............................................................................................................... 35
Notes to the Combined Financial Statements –September 30, 2017 and 2016 .......................................................................................................................... 36
Schedules:
1 – Combining Schedules of Balance Sheet Data as of September 30, 2017 and 2016 ........................................................................................................... 48
2 – Combining Schedules of Revenues and Expenses Data for the years endedSeptember 30, 2017 and 2016 .................................................................................................................... 50
3 – Schedule of Amount and Allocation of Gross Utility Plant Investment (unaudited)as of September 30, 2017 ........................................................................................................................... 52
2017 Financial Overview & Financial Statements
2017 Annual Report � Southeastern Power Administration � 25
DescriptionThe Southeastern Federal Power Program (the Program) consists of all activities associated with theproduction, transmission and disposition of Federal power marketed under Section 5 of the Flood ControlAct of 1944 in 11 states. These states are: Alabama, Florida, Georgia, Illinois, Kentucky, Mississippi, NorthCarolina, South Carolina, Tennessee, Virginia and West Virginia. The Program includes the accounts of twoseparate Federal government agencies — the Southeastern Power Administration (Southeastern), an agencyof the United States Department of Energy and the hydroelectric generating plants and power operations ofthe United States Army Corps of Engineers (Corps), an agency of the United States Department of Defensefor which Southeastern markets the power. Southeastern purchases, transmits and markets power withinfour separate power systems (each including one or more Corps generating projects for which rates are set).These systems are: Georgia-Alabama-South Carolina System; Jim Woodruff System; Cumberland System;and Kerr-Philpott System.
The Corps operates 22 Federal hydroelectric generating projects in commercial service as of September 30,2017, for which Southeastern is the power marketing agency. The Corps and Southeastern are separatelymanaged and financed; however, the financial statements are combined under the Program title.
Costs of multiple purpose Corps projects are allocated to individual purposes (e.g., power, recreation, navigationand flood control) through a cost allocation process. Specific and joint-function costs allocated to power areincluded in the attached combined balance sheets.
The Program accounts are maintained in conformity with accounting principles generally accepted in theUnited States and with the Uniform System of Accounts prescribed for electric utilities by the Federal EnergyRegulatory Commission. The Program's accounting policies also reflect requirements of specific legislationand executive directives issued by the applicable government agencies.
Southeastern and the Corps receive Congressional appropriations through the Department of Energy andthe Department of Defense to finance their operations. The Corps has also received Congressionalappropriations to finance construction of its hydroelectric projects. In accordance with the Flood Control Actof 1944, Southeastern is responsible for repayment, with interest, of its appropriations, as well as Corpsconstruction and operation appropriations allocated to power.

26 � 2017 Annual Report � Southeastern Power Administration
0.0
0.2
0.4
0.6
0.8
1.0
1.2
0.0
0.2
0.4
0.6
0.8
1.0
1.2
FY 2011 FY2012 FY2013 FY2014
R
60000-60000
40000-40000
20000-20000
0
000020000
000040000
000060000
0000800001.2
1.0
0.8
0.6
0.4
0.2
0.0
1.2
1.0
0.8
0.6
0.4
0.2
0.0 FY 2013 FY 2014 FY 2015 FY 2016 FY2017
0
Debt Service Coverage Ratio - Figure P
Program PerformanceDuring FY 2017, Southeastern marketed 6.0 billionkilowatt-hours of energy to 485 wholesale customers.The Program's revenues totaled $313.8 million, $15.4million less than in FY 2016.
Financial Performance Debt Service Coverage RatioThe debt service coverage ratio measures the adequacyof a utility's cash flow to cover debt service cash, bothprincipal and interest.
Specifically, the debt service coverage ratio measuresrevenues in excess of operating expenses requiring cash,or cash flow from operations available to make debtservice payments of principal and interest. A ratio of 1.0would generally indicate just enough cash flow to makeprincipal and interest payments on outstanding debt, inaddition to meeting all other cash expenses. A ratio of1.5 would indicate sufficient cash flow to pay 1.5 timesthe amount of debt service actually due. Debt servicecoverage is an important measure of financial health,particularly for public power systems with no significantsurplus or equity as a cushion. Since the revenues of apower marketing administration are applied to operatingexpenses and debt service requirements with typically noreturn built into rates, the level of debt service coverageis viewed as an important means of determining therevenue shortfalls that could be sustained before debtservice payments were adversely affected. A balanceexists between maintaining a sound financial conditionand maintaining the lowest rates consistent with the not-for-profit orientation of power marketing agencies.

2017 Annual Report � Southeastern Power Administration � 27
FY 2013 FY 2014 FY 2015 FY 2016 FY 2017
0.00
0.05
0.10
0.15
0.20
0.25
0.30
0.35
0.40
0.00
0.05
0.10
0.15
0.20
0.25
0.30
0.35
0.40
0%
5%
10%
15%
20%
25%
30%
35%
40%
0%
5%
10%
15%
20%
25%
30%
35%
40%
Cumulative Principal Payments as a Percentage of Total Investment - Figure Q
Over the last five years, the Program's debt service ratiohas ranged from about 0.870 to 1.140. The Program'sdebt service ratio for FY 2013 is above normal due toimproved streamflow conditions and lower thanexpected operating expenses. FY 2014 was slightly abovenormal due to average streamflow conditions withslightly lower than expected operating expenses. FY 2015was below average due to higher than expectedoperating expenses and streamflow conditions. FY 2016was slightly above normal due to improved streamflowconditions and lower than expected operating expenses.FY 2017 actual generation was better than planned. TheProgram's debt service coverage ratio for fiscal years2013-2017 is illustrated in Figure P.
Cumulative Principal as a Percentage of Total FederalInvestment (Plant-in-Service)This indicator is a cumulative cash flow measure. Itmeasures the cumulative principal payments maderelative to the total Federal investment to date. Duringa period of capital expansion, this ratio would tendto decrease, whereas increases in cumulative paymentsover time would be expected for a mature system.Thus, a system with little time remaining in itsrepayment period would be expected to have a ratio ofcumulative principal payments relative to total Federalinvestment that approaches 100%. This indicatorprovides useful information by showing therelationship between the cumulative amount ofprincipal paid to date by the Program, as well as theprogress made over the period studied. While analysisof this indicator does not necessarily provideconclusive information without further analysis ofadditional factors, such as the average age of thesystem, the measure nevertheless provides valuableinformation on the status of repayment. The Program'sprincipal payments as a percentage of total investmentis now 38.7%. Payments as a percent of total investmentare illustrated in Figure Q.

28 � 2017 Annual Report � Southeastern Power Administration
FY 2013 FY 2014 FY 2015 FY 2016 FY 2017-60000
-40000
-20000
0
20000
40000
60000
80000
0
20000
40000
60000
80000
0
20000
40000
60000
80000$80M
$60M
$40M
$20M
$0
$80M
$60M
$40M
$20M
$0
Variance of Actual fromPlanned Principal Payment The Power Marketing Administrations show relativelylarge fluctuations between actual and planned revenuesdue to the high variability of water over the yearsanalyzed. A negative number means that actualrepayment is not as large as expected. A positive numbermeans that actual repayment is larger than expected.The FY 2013 ratio of 22.6% is due to improved streamflowconditions and lower than expected operating expenses.The FY 2014 ratio of 2.39% is due to slightly lower thanexpected operating expenses. The FY 2015 ratio of –32.8%was due to higher than expected operating expenses andlower than average streamflow conditions. The FY 2016ratio of 2.7% is due to improved streamflow conditionsand lower than expected operating expenses. The FY 2017ratio of 10.9% reflects a higher amount for repaymentthan planned. The variance of actual from plannedpayment is found in Figure R.
Net Cash to the TreasuryNet cash flow to the Treasury measures the actual netcash flow, both inflows and outflows, to the U.S. Treasury,excluding revenue from the Tennessee Valley Authority(TVA). This indicator focuses on cash flows as opposedto accrual accounting results.Because of its cash nature, this indicator is negativelyinfluenced during years of large capital expenditures.Even in years of favorable financial performance, smallor negative cash flow to the U.S. Treasury may result. Inaddition, the variability of water levels explains some ofthe fluctuation of this measure.This indicator provides valuable financial informationrelated to the annual effect of the power marketingadministrations on the cash position of the U.S. Treasury.The measure should be used only in combination withother financial indicators to assess the Program's financialperformance. Net cash flow to the U.S Treasury isillustrated in Figure S.
Percent Variance of Actual FromPlanned Principal Payments - Figure R
Net Cash Flow to the Treasury – Figure S
FY 1999 FY 2000 FY 2001 FY 2002
F FY 2011 FY 2012 FY 2013 FY 2014-
FY 2013 FY 2014 FY 2015 FY 2016 FY 2017-60-60
-50-50
-40-40
-30-30
-20-20
-10-10
00
1010
2020
3030
-60-60
-50-50
-40-40
-30-30
-20-20
-10-10
00
1010
2020
3030
FY 2011 FY 2012 FY 2013 FY 2014-
-0.4
-0.3
-0.2
-0.1
0.0
0.1
0.2
0.3
-0.4
-0.3
-0.2
-0.1
0.0
0.1
0.2
0.330%
20%
10%
0%
-10%
-20%
-30%
-40%
30%
20%
10%
0%
-10%
-20%
-30%
-40%
2017 Annual Report � Southeastern Power Administration � 29
SOUTHEASTERN FEDERAL POWER PROGRAM
Combined Financial Statements
September 30, 2017 and 2016
iii
ofof
f f
Deffof of
of
of
r
ffThe Administrator of Southeastern Power Administration and the
U.S. Department of E Energy Office of In Inspector General:
Repo tt on the Combined Financial StatementsWe have audited the accompanying combined financial statements f th the Southeastern Federal PProgram (the Program), which comprise the combined balance sheets as of September 30, 2017and the related combined statements f r revenues and expenses, changes in capitalization, and cthe years then ended, and the related notes to the combined financial statements. The combined statements include the Southeastern Power Administration (SEPA), a component f th the U.S. DepEnergy, and the hydroelectric power generating function f th the U.S. Department of Def fenense, ArmEngineers (the generating agency) for which SEPA markets the related power.
Management is responsible for the or the preparation and fair presentation of th these combined financialaccordance with U.S. generally accepted accounting principles; this includes the design, implememaintenance f i internal control relevant to the preparation and fair presentation f th the combined fstatements that are free from material misstatement, whether due to fraud or error.
Responsibbill tty
Our responsibility is to express an opinion on these combined financial statements based on our conducted our audits in accordance with auditing standards generally accepted in the United StatThose standards require that we plan and perform the audits to obtain reasonable assurance abocombined financial statements are free from material misstatement.
of
Power 7 and 2016,
cash flows for d financialpartment of
my Corps of
statements in entation, and financial
audits. We tes f A America. out whether the
ures in the
due to fraud or
ocedures that ectiveness of
timates made ents.
asis for our
espects, the 16, and the erally accepted
ofof
pi
f of
f of
fff
An audit involves performing procedures to obtain audit evidence abo
assessment of th the risks of m material misstatement of th the combined finaerror. In making those risk assessmentpreparation and fair presentation f th the combined financial statementare appropriate in the circumstances, but not for the purpose of ex expre
appropriateness f ac accounting policies used and the reasonablenessby management, as well as evaluating the overall presentation of th the
We believe that the audit evidence we have obtained is sufficient andaudit opinion.
O innion
In our opinion, the combined financial statements referred to above pfinancial position f th the Southeastern Federal Power Program as of Sresults f i its operations and its cash flows for the years then ended in accounting principles.
of
ef
out the amounts and disclosu
ancial statements, whether d
ts in order to design audit proessing an opinion on the fffe
f s significant accounting est combined financial stateme
d appropriate to provide a ba
present fairly, in all material rSeptember 30, 2017 and 201n accordance with U.S. gene
30 � 2017 Annual Report � Southeastern Power Administration
of
ub
art of
f
rOther Matterss
Supplementary and Other Information
Our audits were conducted for the purpose of f forming an opinion on tstatements as a whole. The supplementary information in schedulesadditional analysis and is not a required p f th the basic combined fi
The supplementary information in schedules 1 and 2 is the responsiband relates directly to the underlying accounting and other records usfinancial statements. Such information has been s jjected to the audthe basic combined financial statements and certain additional procedsuch information directly to the underlying accounting and other recorfinancial statements or to the basic combined financial statements thein accordance with auditing standards generally accepted in the Unitesupplementary information in schedules 1 and 2 is fairly stated in all mcombined financial statements as a whole.
The supplementary information in schedule 3 has not been subjectedaudits f th the basic combined financial statements and, accordingly, wany assurance on it.
of
of
the Program 1 through 3 is presented for purposes ofnancial statements.
bility f m management and was derived from sed to prepare the basic combined
diting procedures applied in the audits ofdures, including comparing and reconcilingrds used to prepare the basic combinedemselves, and other additional proceduresed States f A America. In our opinion, the material respects in relation to the basic
d to the auditing procedures applied in thewe do not express an opinion or provide
2
Denver, ColoradoMarch 26, 2018
2017 Annual Report � Southeastern Power Administration � 31

SOUTHEASTERN FEDERAL POWER PROGRAM
Combined Balance Sheets
September 30, 2017 and 2016
(In thousands)
Assets 2017 2016
Utility plant in service (note 4) $ 2,687,006 2,620,138 Accumulated depreciation (note 6) (1,097,903) (1,057,823)
Net completed plant (note 6) 1,589,103 1,562,315
Construction work-in-progress 83,394 95,127
Net utility plant (note 6) 1,672,497 1,657,442
Cash 373,200 336,085 Accounts receivable, net 26,861 27,346 Regulatory assets 9,090 9,847 Other assets 428 286
Total assets (note 6) $ 2,082,076 2,031,006
Total Liabilities and Capitalization
Liabilities:Accounts payable and accrued liabilities $ 14,542 13,448 Workers’ compensation actuarial liability 9,090 9,847
Total liabilities 23,632 23,295
Capitalization:Payable to U.S. Treasury (notes 3 and 4(b)) 2,117,612 2,072,629 Accumulated net deficit (note 6) (59,168) (64,918)
Total capitalization (note 6) 2,058,444 2,007,711
Commitments and contingencies (note 5) — —
Total liabilities and capitalization (note 6) $ 2,082,076 2,031,006
See accompanying notes to combined financial statements.
32 � 2017 Annual Report � Southeastern Power Administration

SOUTHEASTERN FEDERAL POWER PROGRAM
Combined Statements of Revenues and Expenses
Years ended September 30, 2017 and 2016
(In thousands)
2017 2016
Operating revenues:Sales of electric power $ 301,816 317,705 Other operating revenues 12,009 11,464
Total operating revenues 313,825 329,169
Operating expenses, excluding depreciation expense:Operations 72,008 73,679 Maintenance 40,334 35,736 Purchased power 32,692 23,122 Purchased transmission services 45,040 44,263
Total operating expenses, excluding depreciation expense 190,074 176,800
Depreciation expense (note 6) 40,899 42,201
Total operating expenses (note 6) 230,973 219,001
Net operating revenues (note 6) 82,852 110,168
Interest expenses:Interest on payable to U.S. Treasury 80,701 82,217 Interest charged to construction (3,599) (2,596)
Net interest expenses 77,102 79,621
Net revenues (note 6) $ 5,750 30,547
See accompanying notes to combined financial statements.
2017 Annual Report � Southeastern Power Administration � 33

SOUTHEASTERN FEDERAL POWER PROGRAM
Combined Statements of Changes in Capitalization
Years ended September 30, 2017 and 2016
(In thousands)
Payable to U.S. Accumulated TotalTreasury net deficit capitalization
Total capitalization as of September 30, 2015 (note 6) $ 2,052,579 (95,465) 1,957,114
Additions:Congressional appropriations 108,586 — 108,586 Interest 82,217 — 82,217 Transfers of property and services, net 9,446 — 9,446
Total additions to capitalization 200,249 — 200,249
Deductions:Payments to U.S. Treasury (173,461) — (173,461) Rate adjustments to congressional appropriations (note 4(b)) (6,738) — (6,738)
Total deductions to capitalization (180,199) — (180,199)
Net revenues for the year ended September 30, 2016 (note 6) — 30,547 30,547
Total capitalization as of September 30, 2016 (note 6) $ 2,072,629 (64,918) 2,007,711
Additions:Congressional appropriations 129,956 — 129,956 Interest 80,701 — 80,701 Transfers of property and services, net 7,115 — 7,115
Total additions to capitalization 217,772 — 217,772
Deductions:Payments to U.S. Treasury (171,456) — (171,456) Rate adjustments to congressional appropriations (note 4(b)) (1,333) — (1,333)
Total deductions to capitalization (172,789) — (172,789)
Net revenues for the year ended September 30, 2017 — 5,750 5,750
Total capitalization as of September 30, 2017 $ 2,117,612 (59,168) 2,058,444
See accompanying notes to combined financial statements.
34 � 2017 Annual Report � Southeastern Power Administration

SOUTHEASTERN FEDERAL POWER PROGRAM
Combined Statements of Cash Flows
Years ended September 30, 2017 and 2016
(In thousands)
2017 2016
Cash flows from operating activities:Net revenues (note 6) $ 5,750 30,547 Adjustments to reconcile net revenues to net cash
provided by operating activities:Depreciation (note 6) 40,899 42,201 Interest on payable to U.S. Treasury, net 77,102 79,621 Unfunded retirement benefits 4,308 4,373 (Increase) decrease in assets:
Accounts receivable, net 485 (3,231) Other assets (142) 10
Increase (decrease) in liabilities:Accounts payable and accrued liabilities 1,094 1,325
Net cash provided by operating activities 129,496 154,846
Cash flows from investing activities:Investment in utility plant (53,687) (54,909)
Cash flows from financing activities:Congressional appropriations 129,956 108,586 Payments to U.S. Treasury (171,456) (173,461) Transfers (to) from other federal agencies, net 2,806 5,073
Net cash used in financing activities (38,694) (59,802)
Net increase in cash 37,115 40,135
Cash, beginning of year 336,085 295,950
Cash, end of year $ 373,200 336,085
Supplemental disclosures:Cash paid for interest $ 77,102 79,621 Interest charged to construction 3,599 2,596 Adjustments to power allocations impacting (note 4(b)):
Congressional appropriations 1,333 6,738 Payments to U.S. Treasury (interest on payable to U.S.
Treasury) — — Investment in utility plant 1,333 6,738
See accompanying notes to combined financial statements.
2017 Annual Report � Southeastern Power Administration � 35

SOUTHEASTERN FEDERAL POWER PROGRAM
Notes to Combined Financial Statements
September 30, 2017 and 2016
7 (Continued)
(1) Organization and Basis of Presentation
activities associated with the production, transmission, and disposition of all federal power marketed under Section 5 of the Flood
1 states of Alabama, Florida, Georgia, Illinois, Kentucky, Mississippi, North Carolina, South Carolina, Tennessee, Virginia, and West Virginia. The accompanying combined financial statements of the Program include the accounts of two separate federal government agencies a component of the
, for which Southeastern markets the related power. Southeastern and the Corps are separately managed and financed, and each maintains its own accounting records. For purposes of financial and operational reporting, the facilities and related operations of Southeastern and the respective hydroelectric generating activity of the Corps are combined as the Program. U.S. government agencies are exempt from all income taxes imposed by any governing body, whether it is a federal, state or commonwealth of the United States, or a local government.
Southeastern purchases, transmits, and markets power within four separate power systems: Georgia-Alabama-South Carolina; Jim Woodruff; Cumberland; and Kerr-Philpott. As of September 30, 2017, the four power systems include 22 hydroelectric generating projects owned and operated by the Corps of Engineers. The projects serve multiple purposes, including power, recreation, navigation, and flood control. The costs of multipurpose generating agency projects are assigned to specific hydroelectric power functions through a cost allocation process administratively developed pursuant to relevant law. These combined financial statements include only those expenses and net assets of the Corps that are expected to be recovered through sales of power and other related revenues. Costs of multipurpose Corps projects are allocated to power and non-power purposes. The portion of total project costs allocated to power is included in the accompanying combined financial statements.
Over the life of the combined hydroelectric power systems, the accumulated net deficit represents timing differences between the recognition of expenses and related revenues. Southeastern and the generating agency are nonprofit federal agencies; therefore, ultimately the agencies will collect funds through power rates to repay all congressional appropriations amounts as discussed in note 2(b). Thus, the individual power systems may at any point in time have an accumulated deficit, but there are no operating or going-concern implications because of the federal of the DOE and DOD and the liquidity and positive cash flows from operations of the Program.
(2) Summary of Significant Accounting Policies (a) General
The accompanying combined financial statements are prepared in accordance with accounting principles and standards prescribed by the DOE, including the Uniform System of Accounts prescribed for electric utilities by the Federal Energy Regulatory Commissio . These practices integrate accounting principles generally accepted in the United States of America as established by the
authorized by federal statute or allowed by federal regulation.
36 � 2017 Annual Report � Southeastern Power Administration

SOUTHEASTERN FEDERAL POWER PROGRAM
Notes to Combined Financial Statements
September 30, 2017 and 2016
8 (Continued)
(b) Congressional Authority and Financing
Southeastern and the Corps of Engineers receive congressional appropriations through the Energy and Water Development and Related Agencies Appropriations Bill to finance their operations.
the use of receipts collected from the sale of Federal hydroelectric power, resulting in a net zero appropriation. The Corps also receives appropriations to finance construction of its hydroelectric projects; however, the Corps operations are not fully offset by the use of receipts. In accordance with the Flood Control Act, Southeastern is responsible for repayment to the federal government, with interest, of its appropriations and the portion of Corps appropriations allocated for construction and operation of the power projects.
Congressional appropriations received by the Corps are authorized and allocated to individual projects. gressional appropriations in amounts
approximating estimated current year expenses and to adjust the distribution, as necessary, within the . Project costs that are not specific to a project purpose are
distributed between power and non-power purposes based on project cost allocations.
(c) Operating Revenues
Operating revenues are recorded on an accrual basis as earned. Cash received from sales, less amounts legislatively authorized for use in operations, is deposited directly with the U.S. Treasury and is reflected as repayments to the U.S. Treasury, which is included in the payable to U.S. Treasury in the combined balance sheets.
Southeastern markets federal power and provides services necessary to market power on behalf of nonfederal entities. The agent transactions are evaluated under the provisions of FASB Accounting
605-45, Revenue Recognition Principal Agent Considerations, to determine whether the transactions should be reported at the gross or net value.
the gross value because Southeastern typically shares in the risks and rewards of the transaction.
Southeastern may provide multiple services to any one customer. Significant services may include the sale of electric power, ancillary services, and the purchase and resale of electric power and transmission services. The Program accounts for these arrangements in accordance with the provisions of ASC Subtopic 605-25, Revenue Recognition Multiple Element Arrangements,
-13, Multiple-Deliverable Revenue Arrangements. Services qualify as separate units of accounting with distinguishable rates, terms, and delivery schedules. Services are provided to meet customer contractual obligations, and revenues are recognized when services are provided.
Other operating revenues generally consist of water revenue and headwater benefits attributable to the power function, and other miscellaneous revenue.
Accounts receivable, net represents amounts billed to customers but not collected, net of the related allowance of $0 as of September 30, 2017 and 2016. The estimate of the allowance for accounts receivable is based on past experience in the collection of receivables and an analysis of the outstanding balances. Interest may be charged on the principal portion of delinquent receivables based
2017 Annual Report � Southeastern Power Administration � 37

SOUTHEASTERN FEDERAL POWER PROGRAM
Notes to Combined Financial Statements
September 30, 2017 and 2016
9 (Continued)
on rates published by the U.S. Treasury for the period in which the debt became delinquent. Delinquent receivables are charged off against the allowance once they are deemed uncollectible.
Billing methods used by Southeastern include net billing and bill crediting. Net billing is a two-way agreement between Southeastern and a customer, whereby both parties buy and sell power or services to each other. Monthly sales and purchases, including any customer advances received, are netted between the two parties and the customer is provided either an invoice or a credit. Bill crediting involves a three-way net billing arrangement among Southeastern, a customer, and a third party whereby all three parties are involved in purchase and sales transactions. Under both billing methods,
combined financial statements.
(d) Confirmation and Approval of Rates The Flood Control Act requires rates to be set to encourage widespread use of electricity at the lowest possible cost, consistent with sound business principles, to preference customers (i.e., public bodies and cooperatives). Rates are established under the requirements of the Flood Control Act, related legislation, and executive departmental directives, and are intended to provide sufficient revenues to meet all required payments of Program costs. Such Program costs include operation and maintenance expenses, wheeling fees to connecting utilities for transmission of power to customers, purchased power costs to meet firm power sale requirements, and payment to the U.S. Treasury for the investment in utility plant and interest thereon. Southeastern has established rate schedules for each of the four power systems. These rates generally are adjusted at five-year intervals, or less, under the
and DOE Order RA 6120.2.
The rates required under present DOE policy make provision for recovery of the federal investment in generating facilities within the service lives of the assets, not to exceed 50 years from the date placed in service. Operation and maintenance expenses and expensed interest are intended to be recovered annually. Utility plant assets are depreciated on a straight-line basis over their estimated service lives, which differ from the established repayment period. Accordingly, there are differences in the amortization of utility plant for financial reporting and for rate-setting purposes.
to develop power and transmission rates for the power projects. The Deputy Secretary of Energy has the authority to confirm, approve, and place such rates in effect on an interim basis. Projects under construction are included in the combined financial statements at the multi-purpose allocation rate specific to the related project. Any adjustments to the multi-purpose allocation rate, as determined necessary by Southeastern's Administrator, are recorded at the time the asset is placed into service and subjected to repayment (note 4(b)).
The Secretary has delegated to FERC the authority to confirm, approve, and place such rates in effect on a final basis and to remand or to disapprove such rates. (1) whether the rates are the lowest possible consistent with sound business principles; (2) whether the revenue levels generated are sufficient to recover the costs of producing and transmitting electric energy, including repayment within the period permitted by law; and (3) the assumptions and projections used in developing the rates. be arbitrary, capricious, or in violation of the law. Refunds with interest, as determined by FERC, are authorized if final approved rates are lower than rates approved on an interim basis. However, if at any
38 � 2017 Annual Report � Southeastern Power Administration

SOUTHEASTERN FEDERAL POWER PROGRAM
Notes to Combined Financial Statements
September 30, 2017 and 2016
10 (Continued)
time FERC determines that the administrative cost of a refund would exceed the amount to be refunded, no refunds will be required. As of September 30, 2017, the Georgia-Alabama-South Carolina System was awaiting final rate approval by FERC. There were no revenues subject to refund.
ASC 980 Topic, Regulated Operations. The provisions of ASC Topic 980 require, among other things, regulated enterprises to reflect rate actions of the regulator in their financial statements, when appropriate. These rate actions can provide reasonable assurance of the existence of an asset, reduce or eliminate the value of an asset, or impose a liability on a regulated enterprise.
(e) Cash Cash consists of power receipts authorized by Congress for use in operations and the unexpended balance of funds appropriated by Congress for the Program-related activities of Southeastern and the Corps of Engineers, and is maintained by the U.S. Treasury.
(f) Utility Plant Utility plant in service and construction work-in-progress consist principally of generating facilities and are stated at cost, net of contributions by entities outside the Program. Cost includes direct labor and materials; payments to contractors; indirect charges for engineering, supervision, and similar overhead items; and interest on federal funds used during construction. The costs of additions, replacements, and betterments are capitalized, while repairs and minor replacement costs are charged to operation and maintenance expenses. The cost of utility plant retired, together with removal costs less salvage, is charged against accumulated depreciation when the property is removed from service. There were no material asset retirements or asset retirement obligations as of September 30, 2017.
The policy of the Program is to move capitalized costs into completed utility plant at the time a project or feature of a project is deemed to be substantially complete. A project is substantially complete when it is providing benefits and services for the intended purpose, and is generating project purpose revenue, where applicable.
Plant assets of the Program are currently depreciated using the straight-line method over the estimated service lives ranging from 5 to 100 years for transmission and generation assets. Moveable equipment includes computers, copiers, mobile cranes, energy testing equipment, trucks, and boats. Moveable equipment is currently depreciated using the straight-line method over the estimated service lives ranging from 5 to 50 years.
The Program is subject to ASC Topic 980. Most completed utility plant, as required by law, is recovered through the rates, regardless of whether an asset is abandoned, loses value, is disposed of significantly before the end of its estimated useful life, or is destroyed. Consequently, the cash flow is not impaired, regardless of the condition of the asset.
(g) Interest on the Payable to U.S. Treasury Interest, a component of total capitalization, is accrued annually on the outstanding payable to the U.S. Treasury based on federal statutes and power system legislation. Such interest is reflected as an expense in the combined financial statements. Interest rates on unpaid balances ranged from 2.375% to 6.25% for the years ended September 30, 2017 and 2016.
2017 Annual Report � Southeastern Power Administration � 39

SOUTHEASTERN FEDERAL POWER PROGRAM
Notes to Combined Financial Statements
September 30, 2017 and 2016
11 (Continued)
Interest charged to construction represents interest on federal funds used during utility plant construction and is included in the cost of completed projects. Applicable interest rates ranged from 2.375% to 5.125% for the years ended September 30, 2017 and 2016, depending on the year in which construction of the transmission and generation facilities was initiated and requirements of the authorizing legislation.
(h) Transfer of Property and Services, Net
Transfer of property and services, net is a component of total capitalization that represents the cumulative receipt of transfers of assets or costs offset by the cumulative disbursement of transfers of revenues. Transfers are recognized upon physical delivery of the asset or performance of the service. Transfers occur between projects, project types, and other federal entities. Transfers between Southeastern and the generating agency eliminate upon combination.
(i) Retirement Benefits
Substantially all employees engaged in Program activities participate in either the Civil Service . Both are
contributory defined benefit pension plans and are not covered under the Employee Retirement Income Security Act of 1974. Pension benefit expense under CSRS and FERS is equivalent to 7.0% and up to 13.7%, respectively, of eligible employee compensation. Program contributions to these plans are submitted to benefit program trust funds administered by the Office of Personnel Management (the OPM), and totaled $9.0 million and $7.0 million for the years ended September 30, 2017 and 2016, respectively. The contribution levels do not reflect the total current cost/full cost requirements to fund the pension plans. Additional sources of funding for CSRS and FERS benefits include direct appropriations to the OPM, not Southeastern or the Corps, and is approximately 32.8% and 14.7% of base salary, respectively. In addition to the amounts contributed to the CSRS and FERS, the Program has recorded $4.3 million of annual pension and retirement benefits expense for the years ended September 30, 2017 and 2016. This amount reflects the contribution made on behalf of Southeastern and the Corps by OPM to benefit program trust funds. This expense will be recovered from power customers through the future sale of power. Costs incurred by OPM on behalf of the Program are included as transfers of property and services, net within the payable to U.S. Treasury on the combined balance sheets.
Other retirement benefits administered by the OPM include the Federal Employees Health Benefits . FEHB is
calculated at $5,412 and $6,266 per employee in fiscal years 2017 and 2016, respectively, and FEGLI is based on 0.02% of base salary for each employee enrolled in these programs.
As a federal agency, all postretirement activity is managed by OPM; therefore, neither the assets of the plans nor the actuarial data with respect to the accumulated plan benefits relative to Program employees are included in this report.
(j) Derivative and Hedging Activities The Program analyzes derivative financial instruments under ASC Topic 815, Derivatives and Hedging, subsequently updated by ASU No. 2010-11, Scope Exception Related to Embedded Credit Derivatives. This standard requires that all derivative instruments, as defined by ASC Topic 815, be recorded on the
40 � 2017 Annual Report � Southeastern Power Administration

SOUTHEASTERN FEDERAL POWER PROGRAM
Notes to Combined Financial Statements
September 30, 2017 and 2016
12 (Continued)
value must be recognized currently in the combined statements of revenues and expenses, unless the derivative has been designated in a qualifying hedging relationship. The application of hedge
in the combined statements of revenues and expenses to the extent effective. ASC Topic 815 requires that the hedging relationship be highly effective and that an organization formally designate a hedging relationship at the inception of the contract to apply hedge accounting.
The Program enters into contracts for the purchase and sale of electricity for use in its business operations. ASC Topic 815 requires the Program to evaluate these contracts to determine whether the contracts are derivatives. Certain contracts that literally meet the definition of a derivative may be exempted from ASC Topic 815 as normal purchases or normal sales. Normal purchases and sales are contracts that provide for the purchase or sale of something other than a financial instrument or derivative instrument that will be delivered in quantities expected to be used or sold over a reasonable period in the normal course of business. Contracts that meet the requirements of normal purchases or sales are documented and exempted from the accounting and reporting requirements of ASC Topic 815.
contracts by either providing power to a third
policy does not authorize the use of derivative or hedging instruments for speculative purposes such as
power. Accordingly, the Program evaluates all of its contracts to determine if they are derivatives and, if applicable, to ensure that they qualify and meet the normal purchases and normal sales designation requirements under ASC Topic 815. Normal purchases and normal sales contracts are accounted for as executory contracts as required under accounting principles generally accepted in the United States. As of September 30, 2017 and 2016, the Program has no contracts accounted for as derivatives.
(k) Concentrations of Credit Risk
Financial instruments, which potentially subject the Program to credit risk, include accounts receivable for customer purchases of power, transmission, or other products and services. These receivables are primarily held with a group of diverse customers that are generally large, stable, and established organizations, which do not represent a significant credit risk. Although the Program is affected by the business environment of the utility industry, management does not believe a significant risk of loss from a concentration of credit exists.
(l) Regulatory Assets
dministrator and other regulatory agencies. These assets arise from specific costs that would have been included in the determination of net revenue or deficit in one period, but are deferred until a different period for purposes of developing rates to charge for services, per the requirements of ASC Topic 980. The Program defers costs as regulatory assets so that the costs will be recovered through the rates during the periods when the costs are scheduled to be repaid. This ensures the matching of revenues and expenses. The Program does not earn a rate of return on its regulatory assets. The asset listed below is regulatory in nature:
2017 Annual Report � Southeastern Power Administration � 41

SOUTHEASTERN FEDERAL POWER PROGRAM
Notes to Combined Financial Statements
September 30, 2017 and 2016
13 (Continued)
s
aid by the U.S.
reimburse. . The actuarial liability for future claims was determined using historical
benefit payment patterns and the U.S. Treasury discount rates.
The recovery of these future claims will be deferred for purposes of the rate-making process until such time the future claims are actually submitted and paid by the DOL. Therefore, the recognition of the expense associated with this actuarially-determined liability has been recorded as a regulatory asset in the combined balance sheets to reflect the effects of the rate-making process. cumulative unpaid expenses associated with estimated future claims are approximately $9.1 million and $9.9 million as of September 30, 2017 and 2016, respectively.
(m) Fair Value of Financial Instruments ASC Topic 825, Financial Instruments, requires disclosure of the fair value of financial instruments. The carrying (recorded) value of short-term financial instruments, including cash, accounts receivable, accounts payable and accrued liabilities, and other assets approximates the fair value of these instruments because of the short maturity of these instruments. The fair value of the payable to U.S. Treasury and of certain unfunded and actuarially based liabilities cannot be determined, as the future payout dates have yet to be determined.
(n) Use of Estimates
The preparation of the combined financial statements in accordance with accounting principles generally accepted in the United States of America requires Program management to make estimates and assumptions that affect the reported amounts of assets and liabilities. Significant items subject to such estimates and assumptions include: the useful lives of completed utility plant, allowance for doubtful accounts, employee benefit obligations, and other contingencies. Actual results could differ from those estimates.
(o) Reclassifications
Certain 2016 amounts have been reclassified to conform to the current year presentation.
(p) Recent Accounting Pronouncements In May 2014, the FASB issued ASU No. 2014-09, Revenue from Contracts with Customers, which requires an entity to recognize the amount of revenue which it expects to be entitled for the transfer of promised goods or services to customers. ASU No. 2014-09 will replace most existing revenue recognition guidance in U.S. GAAP when it becomes effective. ASU No. 2014-09 is effective for the Program for periods beginning after December 15, 2018. ASU No. 2014-09 permits the use of either the retrospective or cumulative effect transition method. The Program has not yet selected a transition method and is currently evaluating the effect that ASU No. 2014-09 will have on the Program's combined financial statements and related disclosures.
42 � 2017 Annual Report � Southeastern Power Administration
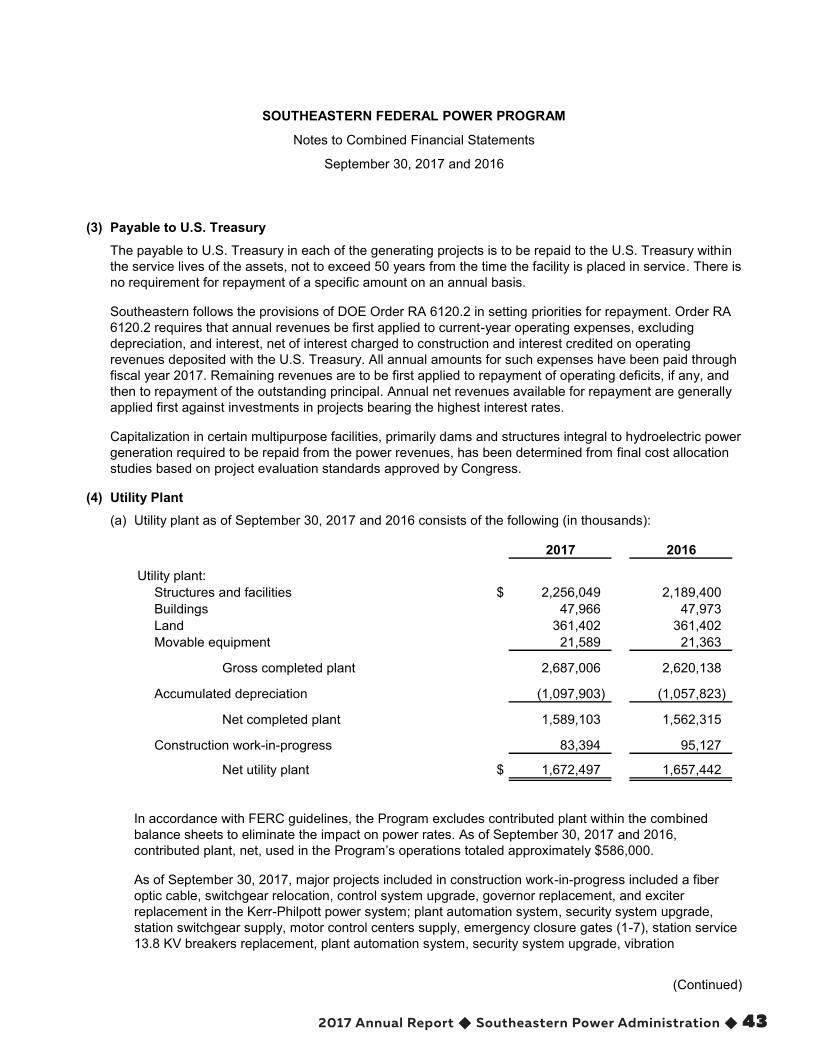
SOUTHEASTERN FEDERAL POWER PROGRAM
Notes to Combined Financial Statements
September 30, 2017 and 2016
14 (Continued)
(3) Payable to U.S. Treasury
The payable to U.S. Treasury in each of the generating projects is to be repaid to the U.S. Treasury within the service lives of the assets, not to exceed 50 years from the time the facility is placed in service. There is no requirement for repayment of a specific amount on an annual basis.
Southeastern follows the provisions of DOE Order RA 6120.2 in setting priorities for repayment. Order RA 6120.2 requires that annual revenues be first applied to current-year operating expenses, excluding depreciation, and interest, net of interest charged to construction and interest credited on operating revenues deposited with the U.S. Treasury. All annual amounts for such expenses have been paid through fiscal year 2017. Remaining revenues are to be first applied to repayment of operating deficits, if any, and then to repayment of the outstanding principal. Annual net revenues available for repayment are generally applied first against investments in projects bearing the highest interest rates.
Capitalization in certain multipurpose facilities, primarily dams and structures integral to hydroelectric power generation required to be repaid from the power revenues, has been determined from final cost allocation studies based on project evaluation standards approved by Congress.
(4) Utility Plant (a) Utility plant as of September 30, 2017 and 2016 consists of the following (in thousands):
2017 2016
Utility plant:Structures and facilities $ 2,256,049 2,189,400 Buildings 47,966 47,973 Land 361,402 361,402 Movable equipment 21,589 21,363
Gross completed plant 2,687,006 2,620,138
Accumulated depreciation (1,097,903) (1,057,823)
Net completed plant 1,589,103 1,562,315
Construction work-in-progress 83,394 95,127
Net utility plant $ 1,672,497 1,657,442
In accordance with FERC guidelines, the Program excludes contributed plant within the combined balance sheets to eliminate the impact on power rates. As of September 30, 2017 and 2016, contributed plant, net, used in the 586,000.
As of September 30, 2017, major projects included in construction work-in-progress included a fiber optic cable, switchgear relocation, control system upgrade, governor replacement, and exciter replacement in the Kerr-Philpott power system; plant automation system, security system upgrade, station switchgear supply, motor control centers supply, emergency closure gates (1-7), station service 13.8 KV breakers replacement, plant automation system, security system upgrade, vibration
2017 Annual Report � Southeastern Power Administration � 43

SOUTHEASTERN FEDERAL POWER PROGRAM
Notes to Combined Financial Statements
September 30, 2017 and 2016
15 (Continued)
corrections, and Allatoona reconstruction in the Georgia-Alabama-South Carolina power system; Supervisory Control and Data Acquisition (SCADA) system servers and motor control centers in the Jim Woodruff System; and turbines, auxiliary dam, tail deck slot fillers, station service breakers, a generator, thrust bearing pressure plates, and springs and spillway modifications in the Cumberland power system.
As of September 30, 2016, major projects included in construction work-in-progress included switchgear relocation, governor replacement, exciter replacement, and a headgate machinery upgrade in the Kerr-Philpott power system; plant automation system, security system upgrade, station switchgear supply, motor control centers supply, emergency closure gates (1-7), station service 13.8 KV breakers replacement, main transformers, switchyard bus and insulators, motor control centers, raw water supply system, microwave system, remote operations, station battery, and main switchgear in the Georgia-Alabama-South Carolina power system; SCADA system servers and motor control centers in the Jim Woodruff System; and dam safety remediations, generator rewinds, turbine replacements, and relay and breaker replacement in the Cumberland power system.
(b) Adjustments to Multi-Purpose Utility Plant Allocation Rates In fiscal year 2014, the majority of the scheduled remediation efforts to the Wolf Creek project within the Cumberland power system were completed and placed into service. The remediation efforts addressed problems with karst foundation seepage. Total project costs of $656.9 million included $555.3 million in construction remediation costs and $101.6 million in interest during construction. Typically, multi-purpose rehabilitation costs are allocated to the power function based on established cost studies at 55.113%.
Administrator determined the costs represented dam safety remediation costs under the Dam Safety Act (Section 1203 of the Water Resources Development Act of 1986) rather than major rehabilitation
typical multi-purpose allocation rate would not provide for the lowest possible rate consistent with
o the Deputy Secretary, U.S. Department of Energy. The Deputy Secretary approved the rate order. The rate action was to cap repayment of the remediation costs at 15% under the Dam Safety Act. These costs were
-purpose allocation rate of 55.113%. Consequently, Program management recorded a rate action adjustment to the Wolf Creek project of $260.1 million to utility plant in service and $47.6 million to accumulated interest payable, resulting in a reduction of $307.7 million in the payable to U.S. Treasury as of September 30, 2014.
In fiscal year 2015, additional remediation efforts to the Wolf Creek project within the Cumberland power system were completed and placed into service. Total project costs of $2.8 million were incurred for construction remediation costs with no additional interest during construction. Costs were then
-purpose allocation rate of 55.113% and subjected to the rate action to cap repayment of the remediation costs of 15% under the Dam Safety Act. Program management recorded a rate action adjustment to the Wolf Creek project of $1.3 million to utility plant in service, resulting in a reduction of this amount being payable to U.S. Treasury as of September 30, 2015.
44 � 2017 Annual Report � Southeastern Power Administration

SOUTHEASTERN FEDERAL POWER PROGRAM
Notes to Combined Financial Statements
September 30, 2017 and 2016
16 (Continued)
In fiscal year 2017 and 2016, $1.2 million and $3.7 million, respectively was incurred in construction remediation costs for Wolf Creek with no additional interest during construction. These costs were also capped under the Dam Safety Act. Program management recorded a rate action adjustment to the Wolf Creek project of $0.5 million and $1.7 million, respectively, to utility plant in service, resulting in a reduction of this amount being payable to U.S Treasury.
As of September 30, 2015, scheduled remediation efforts to the Center Hill project within the Cumberland power system were completed and placed into service. Total project costs of $280.7 million included $236.9 million in construction remediation and $43.8 million in interest during construction. Typically, multipurpose rehabilitation costs are allocated to the power function based on established cost studies at 42.545%. repayment at 15% under the Dam Safety Act. Consequently, Program management recorded a rate action adjustment to the Center Hill project of $85.7 million to utility plant in service and $15.8 million to accumulated interest payable, resulting in a reduction of $101.5 million in payable to U.S. Treasury as of September 30, 2015.
In fiscal year 2017 and 2016, $2.1 million and $13.8 million, respectively, was incurred in construction remediation costs for Center Hill with no additional interest during construction. These costs were also capped under the Dam Safety Act. Program management recorded a rate action adjustment to the project of $0.8 million and $5.0 million, respectively, to utility plant in service, resulting in a reduction of this amount being payable to U.S Treasury.
These rSecretary of Energy, who has authority to confirm, approve, and place rates into effect on an interim basis. The Deputy Secretary of Energy provided interim apprate actions and the Federal Energy Regulatory Commission approved these rate actions on a final basis.
(5) Commitments and Contingencies (a) General
Southeastern and the Corps of Engineers are presently parties to certain claims and legal actions arising in the ordinary course of Program activities. However, in the opinions of management, such
of operations, or cash flows. Power-related claims against the Corps of Engineers, whose ultimate disposition will be paid by the U.S. Treasury Judgment Fund and are not subject to reimbursement from power revenues, are excluded from the combined financial statements and notes thereto.
(b) Transmission Contract Commitments
long-term commitments for these transmission contracts are subject to the availability of federal funds and contingent upon authority from Congress. To fulfill its contractual obligations to deliver power, Southeastern has historically had to purchase a certain level of transmission services under these
2017 Annual Report � Southeastern Power Administration � 45

SOUTHEASTERN FEDERAL POWER PROGRAM
Notes to Combined Financial Statements
September 30, 2017 and 2016
17 (Continued)
arrangements. Southeastern fully intends to provide ongoing services to power customers and will continue to acquire resources under these contracts. The budgeted amounts are as follows (in thousands):
Commitments fortransmission
services
Fiscal year ending September 30,
$ 42,019 43,201 44,546 45,958 47,439
$ 223,163
2020
20182019
20222021
(6) Adjustments to Accumulated Depreciation
During the year ended September 30, 2017, an error was identified in the useful life of a power house within the Georgia-Alabama-South Carolina power system. The Program recognized the cumulated effect of the error in periods prior to those that are presented by decreasing accumulated depreciation and accumulated net deficit by approximately $16.0 million as of October 1, 2015.
The following table presents the effects of the immaterial errors that were corrected on the combined balance sheets and statements of revenues and expenses as of September 30, 2016:
As previously reported Adjustments As adjusted
Balance sheet:Accumulated depreciation $ (1,073,843) 16,020 (1,057,823) Net completed plant 1,546,295 16,020 1,562,315 Net utility plant 1,641,422 16,020 1,657,442 Total assets 2,014,986 16,020 2,031,006 Accumulated net deficit 80,938 (16,020) 64,918 Total capitalization (1,991,691) (16,020) (2,007,711) Total liabilities and capitalization (2,014,986) (16,020) (2,031,006)
Statement of revenues and expenses:Depreciation expense 42,852 (651) 42,201 Total operating expenses 219,652 (651) 219,001 Net operating revenues 109,517 651 110,168 Net revenues 29,896 651 30,547
46 � 2017 Annual Report � Southeastern Power Administration

SOUTHEASTERN FEDERAL POWER PROGRAM
Notes to Combined Financial Statements
September 30, 2017 and 2016
18
Impacted financial statement line items appearing in the combined statements of changes in capitalization and cash flows have also been revised accordingly.
(7) Subsequent Events
The Program has evaluated all subsequent events as of September 30, 2016 through the date of the combined financial statements were available to be issued on March 26, 2018, and identified no subsequent events requiring disclosure.
2017 Annual Report � Southeastern Power Administration � 47

Sche
dule
1SO
UTH
EAST
ERN
FED
ERAL
PO
WER
PR
OG
RAM
Com
bini
ng S
ched
ule
of B
alan
ce S
heet
Dat
a
Sep
tem
ber 3
0, 2
017
(In th
ousa
nds)
Asse
tsG
A-AL
-SC
Jim
Woo
druf
fK
err-
Philp
ott
Cum
berla
ndTo
tal
Util
ity p
lant
in s
ervi
ce$
1,84
1,19
3
73,3
72
207,
799
56
4,64
2
2,68
7,00
6
Acc
umul
ated
dep
reci
atio
n(7
04,9
32)
(32,
750)
(7
8,14
2)
(282
,079
) (1
,097
,903
)
Net
com
plet
ed p
lant
1,13
6,26
1
40,6
22
129,
657
28
2,56
3
1,58
9,10
3
Con
stru
ctio
n w
ork-
in-p
rogr
ess
31,8
73
841
10
,080
40
,600
83
,394
Net
util
ity p
lant
1,16
8,13
4
41,4
63
139,
737
32
3,16
3
1,67
2,49
7
Cas
h10
7,67
8
4,02
6
28,7
86
232,
710
37
3,20
0
Acc
ount
s re
ceiv
able
, net
20,3
73
785
1,
998
3,
705
26
,861
R
egul
ator
y as
sets
3,78
3
1,93
0
29
3,34
8
9,09
0
Oth
er a
sset
s25
2
8
50
118
42
8
Tota
l ass
ets
$1,
300,
220
48
,212
17
0,60
0
563,
044
2,
082,
076
Tota
l Lia
bilit
ies
and
Cap
italiz
atio
n
Liab
ilitie
s:A
ccou
nts
paya
ble
and
accr
ued
liabi
litie
s$
10,3
02
184
1,
719
2,
337
14
,542
W
orke
rs’ c
ompe
nsat
ion
actu
aria
l lia
bilit
y3,
783
1,
930
28
3,
349
9,
090
Tota
l lia
bilit
ies
14,0
85
2,11
4
1,74
7
5,68
6
23,6
32
Cap
italiz
atio
n:P
ayab
le to
U.S
. Tre
asur
y1,
425,
444
42
,438
16
2,99
6
486,
734
2,
117,
612
A
ccum
ulat
ed n
et re
venu
es (d
efic
it)(1
39,3
09)
3,66
0
5,85
7
70,6
24
(5
9,16
8)
Tota
l cap
italiz
atio
n1,
286,
135
46
,098
16
8,85
3
557,
358
2,
058,
444
Com
mitm
ents
and
con
tinge
ncie
s—
—
—
—
—
Tota
l lia
bilit
ies
and
capi
taliz
atio
n$
1,30
0,22
0
48,2
12
170,
600
56
3,04
4
2,08
2,07
6
See
acc
ompa
nyin
g in
depe
nden
t aud
itors
’ rep
ort.
48 � 2017 Annual Report � Southeastern Power Administration

Sche
dule
1SO
UTH
EAST
ERN
FED
ERAL
PO
WER
PR
OG
RAM
Com
bini
ng S
ched
ule
of B
alan
ce S
heet
Dat
a
Sep
tem
ber 3
0, 2
016
(In th
ousa
nds)
Asse
tsG
A-AL
-SC
Jim
Woo
druf
fK
err-
Philp
ott
Cum
berla
ndTo
tal
Util
ity p
lant
in s
ervi
ce$
1,80
5,73
0
73,3
71
208,
527
53
2,51
0
2,62
0,13
8
Acc
umul
ated
dep
reci
atio
n(6
76,4
91)
(31,
228)
(7
4,63
8)
(275
,466
) (1
,057
,823
)
Net
com
plet
ed p
lant
1,12
9,23
9
42,1
43
133,
889
25
7,04
4
1,56
2,31
5
Con
stru
ctio
n w
ork-
in-p
rogr
ess
38,9
38
460
5,
512
50
,217
95
,127
Net
util
ity p
lant
1,16
8,17
7
42,6
03
139,
401
30
7,26
1
1,65
7,44
2
Cas
h12
3,33
7
3,77
8
13,0
09
195,
961
33
6,08
5
Acc
ount
s re
ceiv
able
, net
20,7
49
1,20
9
2,64
2
2,74
6
27,3
46
Reg
ulat
ory
asse
ts3,
257
1,
556
6
5,
028
9,
847
O
ther
ass
ets
161
6
33
86
28
6
Tota
l ass
ets
$1,
315,
681
49
,152
15
5,09
1
511,
082
2,
031,
006
Tota
l Lia
bilit
ies
and
Cap
italiz
atio
n
Liab
ilitie
s:A
ccou
nts
paya
ble
and
accr
ued
liabi
litie
s$
8,76
7
542
1,
704
2,
435
13
,448
W
orke
rs’ c
ompe
nsat
ion
actu
aria
l lia
bilit
y3,
257
1,
556
6
5,
028
9,
847
Tota
l lia
bilit
ies
12,0
24
2,09
8
1,71
0
7,46
3
23,2
95
Cap
italiz
atio
n:P
ayab
le to
U.S
. Tre
asur
y1,
447,
633
44
,282
14
3,55
6
437,
158
2,
072,
629
A
ccum
ulat
ed n
et re
venu
es (d
efic
it)(1
43,9
76)
2,77
2
9,82
5
66,4
61
(6
4,91
8)
Tota
l cap
italiz
atio
n1,
303,
657
47
,054
15
3,38
1
503,
619
2,
007,
711
Com
mitm
ents
and
con
tinge
ncie
s—
—
—
—
—
Tota
l lia
bilit
ies
and
capi
taliz
atio
n$
1,31
5,68
1
49,1
52
155,
091
51
1,08
2
2,03
1,00
6
See
acc
ompa
nyin
g in
depe
nden
t aud
itors
’ rep
ort.
2017 Annual Report � Southeastern Power Administration � 49

Sche
dule
2SO
UTH
EAST
ERN
FED
ERAL
PO
WER
PR
OG
RAM
Com
bini
ng S
ched
ule
of R
even
ues
and
Exp
ense
s D
ata
Year
end
ed S
epte
mbe
r 30,
201
7
(In th
ousa
nds)
GA-
AL-S
CJi
m W
oodr
uff
Ker
r-Ph
ilpot
tC
umbe
rland
Tota
l
Ope
ratin
g re
venu
es:
Sal
es o
f ele
ctric
pow
er$
205,
396
10
,640
25
,773
60
,007
30
1,81
6
Oth
er o
pera
ting
reve
nues
8,82
8
98
403
2,
680
12
,009
Tota
l ope
ratin
g re
venu
es21
4,22
4
10,7
38
26,1
76
62,6
87
313,
825
Ope
ratin
g ex
pens
es, e
xclu
ding
dep
reci
atio
n ex
pens
e:O
pera
tions
31,8
67
1,32
4
6,11
1
32,7
06
72,0
08
Mai
nten
ance
28,9
96
2,66
8
5,24
9
3,42
1
40,3
34
Pur
chas
ed p
ower
30,6
51
2,02
3
18
—
32,6
92
Pur
chas
ed tr
ansm
issi
on s
ervi
ces
25,9
29
361
9,
044
9,
706
45
,040
Tota
l ope
ratin
g ex
pens
es, e
xclu
ding
depr
ecia
tion
expe
nse
117,
443
6,
376
20
,422
45
,833
19
0,07
4
Dep
reci
atio
n ex
pens
e28
,385
1,
523
4,
331
6,
660
40
,899
Tota
l ope
ratin
g ex
pens
es14
5,82
8
7,89
9
24,7
53
52,4
93
230,
973
Net
ope
ratin
g re
venu
es68
,396
2,
839
1,
423
10
,194
82
,852
Inte
rest
exp
ense
s:In
tere
st o
n pa
yabl
e to
U.S
. Tre
asur
y65
,286
1,
966
5,
628
7,
821
80
,701
In
tere
st c
harg
ed to
con
stru
ctio
n(1
,557
) (1
5)
(237
) (1
,790
) (3
,599
)
Net
inte
rest
exp
ense
s63
,729
1,
951
5,
391
6,
031
77
,102
Net
reve
nues
(def
icit)
$4,
667
88
8
(3,9
68)
4,16
3
5,75
0
See
acc
ompa
nyin
g in
depe
nden
t aud
itors
’ rep
ort.
50 � 2017 Annual Report � Southeastern Power Administration

Sche
dule
2SO
UTH
EAST
ERN
FED
ERAL
PO
WER
PR
OG
RAM
Com
bini
ng S
ched
ule
of R
even
ues
and
Exp
ense
s D
ata
Year
end
ed S
epte
mbe
r 30,
201
6
(In th
ousa
nds)
GA-
AL-S
CJi
m W
oodr
uff
Ker
r-Ph
ilpot
tC
umbe
rland
Tota
l
Ope
ratin
g re
venu
es:
Sal
es o
f ele
ctric
pow
er$
208,
270
10
,934
33
,333
65
,168
31
7,70
5
Oth
er o
pera
ting
reve
nues
6,63
2
42
774
4,
016
11
,464
Tota
l ope
ratin
g re
venu
es21
4,90
2
10,9
76
34,1
07
69,1
84
329,
169
Ope
ratin
g ex
pens
es, e
xclu
ding
dep
reci
atio
n ex
pens
e:O
pera
tions
31,9
88
2,23
2
5,24
2
34,2
17
73,6
79
Mai
nten
ance
25,8
24
1,87
7
4,70
4
3,33
1
35,7
36
Pur
chas
ed p
ower
16,5
94
2,70
9
3,81
9
—
23,1
22
Pur
chas
ed tr
ansm
issi
on s
ervi
ces
23,7
21
338
6,
682
13
,522
44
,263
Tota
l ope
ratin
g ex
pens
es, e
xclu
ding
depr
ecia
tion
expe
nse
98,1
27
7,15
6
20,4
47
51,0
70
176,
800
Dep
reci
atio
n ex
pens
e28
,403
1,
533
4,
335
7,
930
42
,201
Tota
l ope
ratin
g ex
pens
es12
6,53
0
8,68
9
24,7
82
59,0
00
219,
001
Net
ope
ratin
g re
venu
es88
,372
2,
287
9,
325
10
,184
11
0,16
8
Inte
rest
exp
ense
s:In
tere
st o
n pa
yabl
e to
U.S
. Tre
asur
y67
,156
2,
076
5,
789
7,
196
82
,217
In
tere
st c
harg
ed to
con
stru
ctio
n(1
,185
) (1
4)
(101
) (1
,296
) (2
,596
)
Net
inte
rest
exp
ense
s65
,971
2,
062
5,
688
5,
900
79
,621
Net
reve
nues
(def
icit)
$22
,401
22
5
3,63
7
4,28
4
30,5
47
See
acc
ompa
nyin
g in
depe
nden
t aud
itors
’ rep
ort.
2017 Annual Report � Southeastern Power Administration � 51

Sche
dule
3SO
UTH
EAST
ERN
FED
ERAL
PO
WER
PR
OG
RAM
Sch
edul
e of
Am
ount
and
Allo
catio
n of
Gro
ss U
tility
Pla
nt In
vest
men
t (un
audi
ted)
As
of S
epte
mbe
r 30,
201
7
(In th
ousa
nds)
Allo
cate
d to
:
Proj
ects
in s
ervi
ce a
nd o
ther
Tota
lPo
wer
Nav
igat
ion
Floo
d ris
k m
anag
emen
tFi
sh a
nd
wild
life
Rec
reat
ion
Dam
Saf
ety
Oth
er
Perc
ent o
f tot
al
plan
t in
vest
men
t re
turn
able
fr
om p
ower
re
venu
e
Alla
toon
a$
83,7
72
61,2
48
—
10,2
18
—
12,0
74
—
232
(a
)73
.1%
Buf
ord
103,
354
83
,996
2,
151
4,
765
—
12
,442
—
—
81
.3%
Car
ters
198,
466
16
6,82
4
—
20,0
51
—
11,5
91
—
—
84.1
%J.
Stro
m T
hurm
ond
192,
258
16
6,90
9
4,37
0
4,11
5
—
16,8
64
—
—
86.8
%W
alte
r F. G
eorg
e28
8,03
3
191,
861
82
,593
—
34
8
13,2
31
—
—
66.6
%H
artw
ell
209,
291
17
7,53
6
4,01
5
15,9
77
—
11,7
63
—
—
84.8
%M
illers
Fer
ry/H
enry
248,
620
13
9,67
0
87,1
67
—
—
21,7
83
—
—
56.2
%W
est P
oint
177,
985
90
,893
2,
725
22
,188
13
,982
48
,197
—
—
51
.1%
Ric
hard
B. R
usse
ll90
6,28
2
792,
524
—
87
4
—
112,
884
—
—
87
.4%
Mar
ketin
g fa
cilit
ies
1,60
5
1,60
5
—
—
—
—
—
—
100.
0%
Tota
l GA
-AL-
SC
Sys
tem
2,40
9,66
6
1,87
3,06
6
183,
021
78
,188
14
,330
26
0,82
9
—
232
77
.7%
Jim
Woo
druf
f12
4,23
2
74,1
63
41,9
89
—
—
8,08
0
—
—
59.7
%M
arke
ting
faci
litie
s50
50
—
—
—
—
—
—
10
0.0%
Tota
l Jim
Woo
druf
f Sys
tem
124,
282
74
,213
41
,989
—
—
8,
080
—
—
59
.7%
Bar
kley
238,
415
75
,301
12
8,85
0
25,7
43
—
8,52
1
—
—
31.6
%J.
Per
cy P
riest
73,3
83
16,0
73
—
27,3
89
—
29,9
21
—
—
21.9
%C
heat
ham
85,1
27
25,3
40
55,2
04
—
—
4,58
3
—
—
29.8
%C
orde
ll H
ull
98,8
25
46,7
27
17,6
84
—
—
27,8
31
—
6,58
3
(b)
47.3
%O
ld H
icko
ry87
,763
53
,376
28
,980
—
—
5,
407
—
—
60
.8%
Cen
ter H
ill45
7,39
0
119,
649
—
76
,649
—
8,
275
25
2,12
0
697
(c
)26
.2%
Dal
e H
ollo
w49
,021
32
,366
—
14
,149
—
2,
506
—
—
66
.0%
Wol
f Cre
ek92
2,62
4
207,
319
—
12
9,90
1
—
20,2
68
564,
890
24
6
(c)
22.5
%La
urel
53,1
52
29,1
27
—
—
—
17,6
59
—
6,36
6
(b)
54.8
%M
arke
ting
faci
litie
s55
1
551
—
—
—
—
—
—
10
0.0%
Con
tribu
tions
in a
id o
f con
stru
ctio
n(5
87)
(5
87)
—
—
—
—
—
—
10
0.0%
Tota
l Cum
berla
nd B
asin
Sys
tem
2,06
5,66
4
605,
242
23
0,71
8
273,
831
—
12
4,97
1
817,
010
13
,892
29
.3%
John
H. K
err
228,
659
19
2,36
6
—
26,7
18
—
9,18
4
—
391
(a
)84
.1%
Phi
lpot
t40
,411
25
,213
—
9,
212
—
5,
986
—
—
62
.4%
Mar
ketin
g fa
cilit
ies
300
30
0
—
—
—
—
—
—
100.
0%
Tota
l Ker
r-P
hilp
ott S
yste
m26
9,37
0
217,
879
—
35
,930
—
15
,170
—
39
1
80.9
%
Tota
l$
4,86
8,98
2
2,77
0,40
0
455,
728
38
7,94
9
14,3
30
409,
050
81
7,01
0
14,5
15
56.9
%
(a)
Wat
er s
uppl
y(b
)A
rea
rede
velo
pmen
t(c
)W
orld
War
II s
uspe
nsio
n co
sts
See
acc
ompa
nyin
g in
depe
nden
t aud
itors
’ rep
ort.
52 � 2017 Annual Report � Southeastern Power Administration

1166 ATHENS TECH ROADELBERTON, GA 30635-6711706.213.3800FAX: 706.213.3884www.energy.gov/sepa/southeastern-power-administration