Embed Size (px)
Citation preview
2016–17 Basin-scale evaluation of Commonwealth environmental water — Vegetation Diversity
Prepared by: Samantha Capon and Julia Mynott
Final ReportLa Trobe Publication 191/2018
document.docx 1

2016–17 Basin-scale evaluation of Commonwealth environmental water — Vegetation DiversityReport prepared for the Commonwealth Environmental Water Office by La Trobe University
For further information contact:
Nick Bond
La Trobe UniversityPO Box 991 Wodonga VIC 3689
Ph: (02) 6024 9650
Email: [email protected] Web: www.la trobe.edu.au Enquiries: [email protected]
Report Citation: Capon S and Mynott J (2018) 2016–17 Basin-scale evaluation of Commonwealth environmental water - Vegetation Diversity. Final Report prepared for the Commonwealth Environmental Water Office by La Trobe University, Publication 193/2018, September, 63pp.
2016 – 17 Basin-scale evaluation of Commonwealth environmental water — Vegetation Diversity
This monitoring project was commissioned and funded by Commonwealth Environmental Water Office.
Copyright
© Copyright Commonwealth of Australia, 2018
2016–17 Basin-scale evaluation of Commonwealth environmental water — Biodiversity (2018) is licensed by the Commonwealth of Australia for use under a Creative Commons By Attribution 3.0 Australia licence with the exception of the Coat of Arms of the Commonwealth of Australia, the logo of the agency responsible for publishing the report, content supplied by third parties, and any images depicting people. For licence conditions see: http://creativecommons.org/licenses/by/3.0/au/
This report should be attributed as Hale J (2018) 2016–17 Basin-scale evaluation of Commonwealth environmental water — Biodiversity. Final Report prepared for the Commonwealth Environmental Water Office by La Trobe University, Publication 193/2018, September, 55pp.
Disclaimer
The views and opinions expressed in this publication are those of the authors and do not necessarily reflect those of the Australian Government or the Minister for the Environment.
While reasonable efforts have been made to ensure that the contents of this publication are factually correct, the Commonwealth does not accept responsibility for the accuracy or completeness of the contents, and shall not be liable for any loss or damage that may be occasioned directly or indirectly through the use of, or reliance on, the contents of this publication.
The material contained in this publication represents the opinion of the author(s) only. While every effort has been made to ensure that the information in this publication is accurate, the author(s) and La Trobe University do not accept any liability for any loss or damage howsoever arising whether in contract, tort or otherwise which may be incurred by any person as a result of any reliance or use of any statement in this publication. The author(s) and La Trobe University do not give any warranties in relation to the accuracy, completeness and up-to-date status of the information in this publication.
Where legislation implies any condition or warranty which cannot be excluded restricted or modified, such condition or warranty shall be deemed to be included provided that the author’s and La Trobe University’s liability for a breach of such condition or warranty is, at the option of La Trobe University, limited to the supply of the services again or the cost of supplying the services again.
2016 – 17 Basin-scale evaluation of Commonwealth environmental water — Vegetation Diversity
Document history and status
Version Date Issued Reviewed by Approved by Revision type
Draft 6/7/2018 M&E Providers
External
Draft 6/7/2018 CEWO External
Final 17/9/2018 Jennifer Hale Nicole Thurgate Internal
Final 25/9/2018 CEWO Sam Roseby External
Distribution of copies
Version Quantity Issued to
Draft 1 x PDF 1 x Word CEWO and M&E Providers
Final 1 x PDF 1 x Word Paul Marsh, Sam Roseby
Filename and path: Projects\CEWO\CEWH Long Term Monitoring Project\499 LTIM Stage 2 2014-19 Basin evaluation\Final Reports
Author(s): Samantha Capon and Julia Mynott
Author affiliation(s): Griffith University and The Murray‒Darling Freshwater Research Centre
Project Manager: Nicole Thurgate
Client: Commonwealth Environmental Water Office
Project Title: Basin evaluation of the contribution of Commonwealth environmental water to the environmental objectives of the Murray‒Darling Basin Plan
Document Version: Final
Project Number: M/BUS/499
Contract Number: PRN 1213-0427
2016 – 17 Basin-scale evaluation of Commonwealth environmental water — Vegetation Diversity
Acknowledgements:
The authors wish to thank the Basin Matters project team for their continued support, particularly Shane Brooks for his significant contributions to data management and spatial analyses presented here. Nick Bond also provided significant data management support during the preparation of this report. Susan Gehrig and Cherie Campbell have also made substantial contributions.
This project was undertaken using data collected for the Commonwealth Environmental Water Office Long Term Intervention Monitoring project. Assistance provided by the Monitoring and Evaluation Providers with the interpretation of data is greatly appreciated. The authors would also like to thank all Monitoring and Evaluation Provider staff involved in the collection and management of data.
2016 – 17 Basin-scale evaluation of Commonwealth environmental water — Vegetation Diversity
Contents1 Introduction..................................................................................................................................... 1
1.1 Context.....................................................................................................................................................1
1.2 Evaluation objectives................................................................................................................................2
1.3 Summary of Basin Matter outcomes to date............................................................................................3
1.4 Summary of watering actions with expected outcomes for the year relevant to this Basin Matter evaluation..........................................................................................................................................................3
2 Methods........................................................................................................................................... 6
2.1 2016-17 evaluation approach...................................................................................................................6
2.1.1 Aggregated Area scale, annual evaluation.......................................................................................7
2.1.2 Basin scale, annual evaluation.........................................................................................................8
3 Aggregated area scale evaluation....................................................................................................12
3.1 Key findings............................................................................................................................................12
3.2 Effects of Commonwealth environmental water on plant species diversity at wetland Selected Areas in 2016 – 17.........................................................................................................................................................13
3.3 Effects of Commonwealth environmental water on vegetation community diversity across wetland Selected Areas in 2016 – 17.............................................................................................................................14
4 Basin scale evaluation..................................................................................................................... 21
4.1 Key findings............................................................................................................................................21
4.2 Effects of Commonwealth environmental water on plant species diversity at the Basin scale in 2016 – 17 21
4.3 Effects of Commonwealth environmental water on vegetation community diversity at the Basin scale in 2016 – 17.........................................................................................................................................................22
5 Synthesis of outcomes and implications for adaptive management.................................................24
References.................................................................................................................................................. 26
Appendix A. Watering actions contributed to by Commonwealth environmental water in 2016 – 17 with Expected Outcomes related to vegetation...................................................................................................27
Appendix B. Plant taxa recorded by LTIM from wetland and floodplain Selected Areas in 2016 – 17.............36
Appendix C: Progress Report towards correcting data issues........................................................................52
List of tablesTable 1. Summary of watering actions and expected outcomes related to vegetation at Selected Areas in 2016–
17 considered in this Basin Evaluation Report. Please note that only some of these watering actions were monitored under the LTIM program. N.B. In the current report, vegetation diversity responses have only been evaluated across the four floodplain/wetland systems (i.e. Gwydir, Lachlan, Murrumbidgee and Warrego Darling). For findings from the two river system Selected Areas (i.e. Edward Wakool and Goulburn), please refer to 2016 – 17 Selected Area reports...........4
Table 2. Vegetation diversity sampling design at wetland Selected Areas in 2016 – 17. (N.B. refers to methods for collecting data regarding % cover of plant taxa).......................................................................10
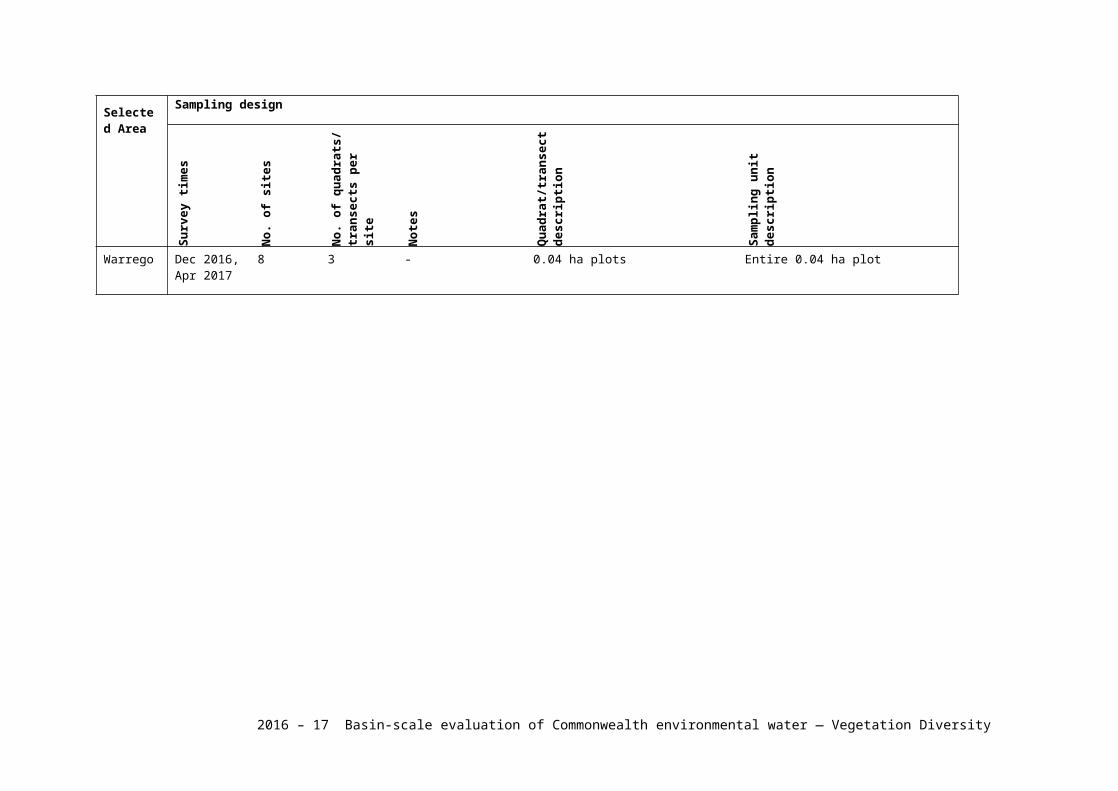
Table 3. Water regime categories assigned to vegetation diversity field survey plots/transects at wetland Selected Areas in 2016–17. D indicates ‘Dry’ and W ‘Wet’. Refer to Section 2.1.1 for further details on water regime categories. Numbers indicate the total number of plots / transects surveyed in each water regime category at each survey time. Numbers in brackets indicate the number of sample points (i.e. locations) across which these plots / transects were distributed. The number of
2016 – 17 Basin-scale evaluation of Commonwealth environmental water — Vegetation Diversity
plots / transects (and associated sample points) affected by CEW watering actions delivered during 2016 – 17 are shown in bold where relevant......................................................................11
Table 4. Plant species only present in each wetland and floodplain Selected Area in 2016 – 17 in plots/transects following inundation by Commonwealth environmental water delivered during 2016 – 17. (N.B. No Commonwealth environmental water inundated vegetation survey plots during 2016 – 17 in the Lachlan river system). Note: asterisks (*) indicate exotic species.............................................13
Table 5. Plant species only recorded from the Basin in plots/transects inundated by Commonwealth environmental water delivered during 2016 – 17...........................................................................22
List of figuresFigure 1. Vegetation diversity monitoring sites at Selected Areas in 2016–2017 including the four wetland
Selected Areas evaluated in this report (i.e. the Gwydir river system, the Lachlan river system, Murrumbidgee river system and the Junction of the Warrego and Darling rivers) as well as the two river channel and riverbank Selected Areas (i.e. the Edward-Wakool river system and the Goulburn River). Extent of inundation by Commonwealth environmental water is also illustrated. 9
Figure 2. Mean total vegetation cover of survey plots / transects in each water regime class in Selected Areas with inundation by Commonwealth environmental water in 2016-17. Error bars indicate +/– standard error. In abbreviated water regime classes, D = Dry and W = Wet. * indicate proportion of plots/transects in water regime class inundated by Commonwealth environmental water (N.B. no % given where all samples were influenced by Commonwealth environmental water)............15
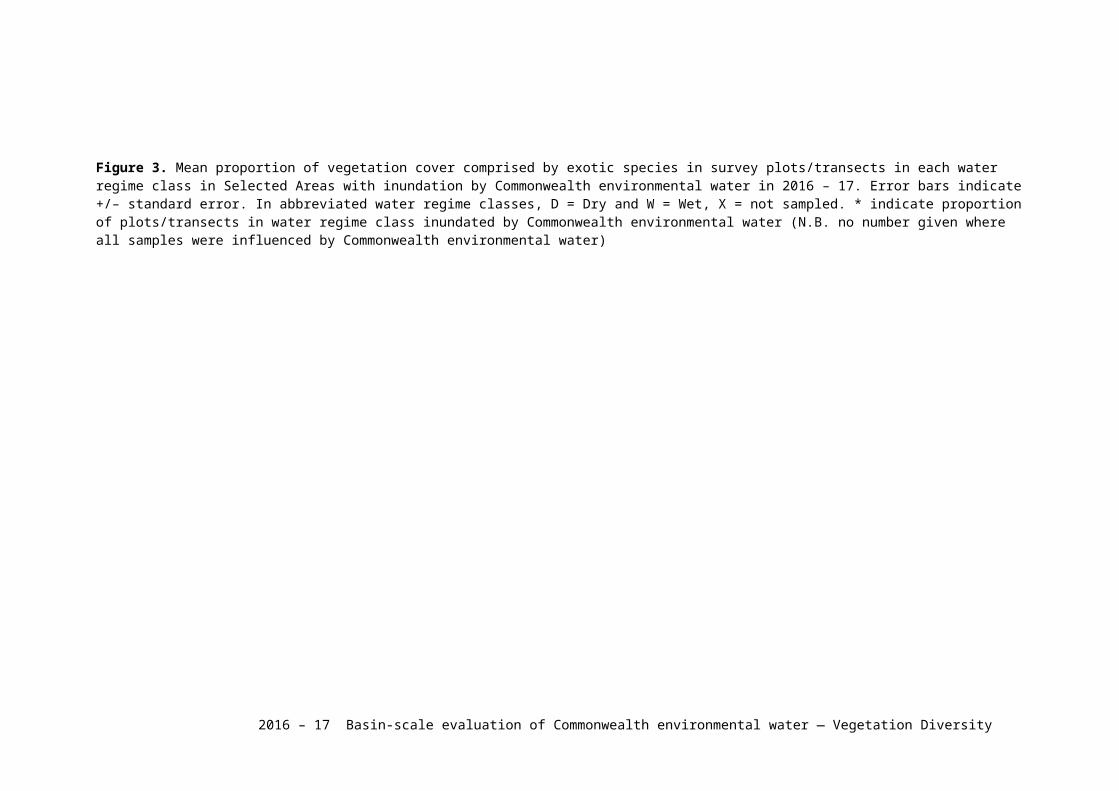
Figure 3. Mean proportion of vegetation cover comprised by exotic species in survey plots / transects in each water regime class in Selected Areas with inundation by Commonwealth environmental water in 2016-17. Error bars indicate +/– standard error. In abbreviated water regime classes, D = Dry and W = Wet. * indicate proportion of plots/transects in water regime class inundated by Commonwealth environmental water (N.B. no % given where all samples were influenced by Commonwealth environmental water)...........................................................................................16
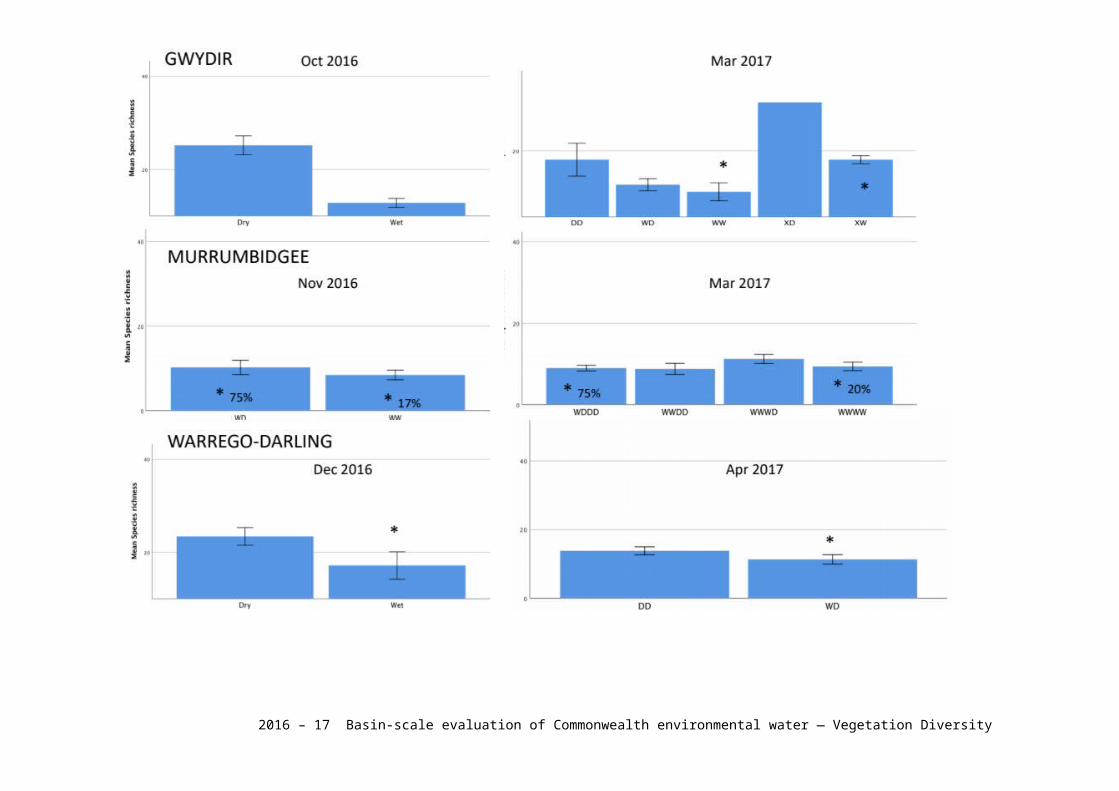
Figure 4. Mean plant species richness (excluding trees) of survey plots / transects in each water regime class in Selected Areas with inundation by Commonwealth environmental water in 2016-17. Error bars indicate +/– standard error. In abbreviated water regime classes, D = Dry and W = Wet. * indicate proportion of plots/transects in water regime class inundated by Commonwealth environmental water (N.B. no % given where all samples were influenced by Commonwealth environmental water).............................................................................................................................................17
Figure 5. nMDS ordination of vegetation community composition at plots surveyed in 2016-17 in the Gwydir river system with respect to Water Regime; October 2016: W – wet, D – dry; March 2017: WW – wet in October 2016 and in March 2017, XD – only sampled in March 2017 and dry, XW – only sampled in March 2017 and wet, WD – wet in October 2067 and dry in March 2017, DD – dry in both October 2016 and March 2017. Orange circles indicate plots inundated by Commonwealth environmental water......................................................................................................................19
Figure 6. nMDS ordination of vegetation community composition at plots surveyed in 2016-17 in the Murrumbdigee river system with respect to Water Regime; September 2016: W – wet, D – dry; November 2016: WW – wet in September 2016 and in November 2016, WD – wet in September 2016 and dry in November 2016; Jan 2017: WWD – wet in September 2016 and November 2016 and dry in Jan 2017, WDD – wet in September 2016 and dry in November 2016 and Jan 2017, WWW – wet in September 2016, November 2016 and Jan 2017; March 2017: WWDD – wet in September 2016 and November 2016 and dry in Jan 2017 and March 2017, WDDD – wet in September 2016 and dry in November 2016, Jan 2017 and March 2017, WWWW– wet in September 2016, November 2016, Jan 2017 and March 2017, WWWD – wet in September 2016, November 2016 and Jan 2017 and dry in March 2017. Orange cirlces indicate plots inundated by Commonwealth environmental water............................................................................................19
Figure 7. nMDS ordination of vegetation community composition at plots surveyed in 2016-17 in the junction of the Warrego and Darling rivers with respect to Water Regime; December 2016: W – wet, D –
2016 – 17 Basin-scale evaluation of Commonwealth environmental water — Vegetation Diversity
dry; April 2017: DD – dry in December 2016 and in April 2017, WD – wet in December 2016 and dry in April 2017. N.B. Wet plots in December 2016 (i.e. W) were all inundated by Commonwealth environmental water and all became wet-dry plots in April 2017 (WD).........................................20
Figure 8. nMDS ordination of vegetation community composition at plots surveyed in 2016-17 in the four wetland Selected Areas: JWD = junction of the Warrego and Darling rivers, MUR = Murrumbidgee river system, LAC = Lachlan river system and GWY = Gwydir river system. (N.B. extreme outliers are not shown in this plot)..............................................................................................................23
Figure 9. Bootstrapped nMDS ordination of vegetation community composition at plots surveyed in 2016-17 in the four wetland Selected Areas according to water regime category. (N.B. for plots in the Murrumbidgee river system sampled on the third and fourth sampling occasions during 2016-17 are categorised according only to the current and immediately preceding water regime)............23
2016 – 17 Basin-scale evaluation of Commonwealth environmental water — Vegetation Diversity
1 Introduction1.1 Context
Vegetation diversity is included in the suite of matters for evaluation at the Basin scale in the Long Term Intervention Monitoring (LTIM) Project because of its high ecological, socio-economic and cultural values, its sensitivity to watering and its alignment with the Basin Plan objectives (Capon et al. 2013, 2016). Flooding and drying typically have a prevailing influence on the growth, reproduction and interactions of riverine and wetland plants which exhibit a range of responses to surface water hydrology depending on their traits and life history stage as well as the hydrological characteristics (e.g. inundation depth, duration etc.) and antecedent conditions which they experience (Nilsson & Svedmark 2002; Brock et al. 2006; Capon 2003, 2016). Vegetation composition and structure in riverine landscapes therefore tend to closely reflect patterns of wetting and drying both in the short-term and over longer time periods (Stromberg 2001; Capon 2005, 2016).
In the Basin, riverine and wetland plants are characterised by a range of traits which enable their survival in the face of high levels of hydrologic variability and unpredictability (Capon & Reid 2016). In particular, many herbaceous wetland plants develop large, long-lived soil seedbanks which allow plant species to persist during dry periods as dormant propagules which germinate and establish in response to more favourable conditions (Brock et al. 2006). While many submerged, floating and some emergent aquatic plants can germinate and establish from seeds during flooding, most wetland plants that rely on soil seed banks for regeneration tend to establish during the moist conditions following the recession of floodwaters rather than during periods of inundation. Consequently, greater local plant species diversity, including more rare species, in wetlands of the Basin might be expected under drier conditions that have been preceded by flooding (e.g. Kenny et al. 2017). Furthermore, long durations of wetting or very regular inundation may promote vegetative spread and high biomass production amongst competitively dominant perennial aquatic and amphibious plants, reducing plant species diversity, but increasing vegetation cover, at a local scale (Reid & Capon 2011). Following extended dry periods, however, such aquatic plant species, which often lack significant persistent soil seed banks, may take some time to recolonise a particular wetland meaning species richness may still increase initially in response to persistent wetting before eventually stabilising.
Because of temporal and spatial variation in patterns of wetting and drying across wetland landscapes in the Murray-Darling Basin, a range of plant habitats, characterised by varying flood histories, are present at any time. The heterogeneity of plant habitats is also enhanced at a landscape scale by differences in other environmental conditions (e.g. soil types, shading, litter cover, etc.; Capon et al. 2017) and spatial attributes (e.g. proximity to other land systems; Capon & Reid 2016). Because different suites of wetland plants are likely to grow under these different conditions, both plant species diversity and the diversity of the vegetation communities which these comprise are therefore likely to be promoted by greater heterogeneity of wetting and drying regimes across the landscape.
The LTIM Project provides an opportunity to investigate riverine and wetland vegetation responses to watering across multiple scales and to learn more about the expected outcomes for vegetation diversity of watering actions.
2016 – 17 Basin-scale evaluation of Commonwealth environmental water — Vegetation Diversity
1.2 Evaluation objectives
Overall, the Vegetation Diversity Basin Matter evaluation seeks to describe vegetation diversity responses to Commonwealth environmental water in the current water year as well as over the duration of the LTIM Project. The evaluation draws on vegetation monitoring data collected across six of the seven Selected Areas, in addition to available hydrologic data and aquatic ecosystem mapping. Four of the Selected Areas included in the Vegetation Diversity Basin Matter evaluation comprise large wetland systems (i.e. the Gwydir river system, the Lachlan river system, Murrumbidgee river system and the Junction of the Warrego and Darling rivers) while the other two (i.e. the Edward-Wakool river system and the Goulburn River) comprise river channel and riverbank habitats.
The overall questions addressed by the Basin scale evaluation of vegetation diversity during the five year duration of the current LTIM Project are:
1. What did Commonwealth environmental water contribute to plant species diversity?
i.e. How did Commonwealth environmental water affect the presence, distribution and abundance of individual plant species?
2. What did Commonwealth environmental water contribute to vegetation community diversity?
i.e. How did Commonwealth environmental water affect the composition and structure of particular vegetation communities?
How did Commonwealth environmental water affect the composition and structure of particular vegscapes?
2016-17 evaluation objectives
The specific questions addressed by the Basin scale evaluation of vegetation diversity for 2016-17 are:
1. What did Commonwealth environmental water contribute to plant species diversity in the four wetland Selected Areas during 2016-17?
2. What did Commonwealth environmental water contribute to vegetation community diversity in the four wetland Selected Areas during 2016-17 at both site and landscape scales?
2016 – 17 Basin-scale evaluation of Commonwealth environmental water — Vegetation Diversity
1.3 Summary of Basin Matter outcomes to date
In the first and second years of the LTIM project (2014 – 15 and 2015 – 16), vegetation diversity responses to Commonwealth environmental water have varied considerably across the relevant Selected Areas. Key findings of the basin matter evaluation to date include:
inundation by Commonwealth environmental water has promoted the establishment and growth of significant numbers of native plant species, especially native grasses and sedges, at the scale of both Selected Areas and the entire Basin;
increases in vegetation cover and plant species richness have occurred in most, but not all, vegetation communities inundated by Commonwealth environmental water;
greater vegetation cover typically occurs in vegetation communities subject to continuous flooding and, to a lesser degree, those which have recently started drying following wetting;
reductions in the cover and distribution of exotic plant species have occurred in response to watering in some Selected Areas while, in others, short flood durations may have promoted the cover of exotic plant species;
greater cover and diversity of exotic plant species have typically been observed in vegetation communities under dry conditions;
inundation by Commonwealth environmental water resulted in shifts in vegetation community composition, especially shifts in the abundance of native species, towards a greater abundance of hydrophylic species (e.g. emergent grasses and sedges) and a reduction in the cover of exotic forbs; and
watering actions enhanced the diversity and heterogeneity of vegetation communities at landscape scales within each Selected Area as well as across the Basin.
1.4 Summary of watering actions with expected outcomes for the year relevant to this Basin Matter evaluation
Commonwealth environmental water contributed to fifty-six watering actions, comprising a total of 1,359.75 GL, during 2016-17 for expected outcomes associated with vegetation diversity across the Basin (Appendix A). Fifteen of these watering actions, comprising a total of 116 703 ML, were within the LTIM Selected Areas relevant to the Vegetation Diversity Basin Matter (Table 1).
2016 – 17 Basin-scale evaluation of Commonwealth environmental water — Vegetation Diversity
Table 1. Summary of watering actions and expected outcomes related to vegetation at Selected Areas in 2016–17 considered in this Basin Evaluation Report. Please note that only some of these watering actions were monitored under the LTIM program. N.B. In the current report, vegetation diversity responses have only been evaluated across the four floodplain/wetland systems (i.e. Gwydir, Lachlan, Murrumbidgee and Warrego Darling). For findings from the two river system Selected Areas (i.e. Edward Wakool and Goulburn), please refer to 2016 – 17 Selected Area reports.
Water Action Number
Surface water region/asset Commonwealth environmental water volume
(ML)
Dates Flow component Expected ecological outcome1
1617-GWY-01 Gwydir - Gwydir Wetlands 9000 27/12/16 - 28/02/17 Wetland Maintenance of inundation of broad areas of semi-permanent wetland vegetation following significant natural flooding, to support vegetation condition and reproduction
1617-GWY-02 Gwydir - Mallowa Wetlands 7496 13/01/17 - 01/04/17 Wetland Support further recovery of vegetation extent and condition
1617-MBG-02 Murrumbidgee - Yanco-Billabong- Forest Creek system: Wanganella Swamp
5000 19/11/16 - 04/01/17 Wetland Maintaining and improving the condition of wetland vegetation.
1617-MBG-03 Murrumbidgee - Nimmie-Caira: Eulimbah
2320 28/11/16 - 03/03/17 Wetland Maintaining and improving the condition of wetland vegetation.
1617-MBG-04 Murrumbidgee - Nimmie-Caira: Telephone Bank
5425 24/11/16 - 20/03/17 Wetland Maintaining and improving the condition of wetland vegetation.
1617-MBG-05 Murrumbidgee - Yanga National Park
2155 29/10/16 - 13/02/17 Wetland Maintaining and improving the condition of wetland vegetation.
1617-MBG-06 Murrumbidgee - YNorth Redbank: Tori Lignum Swamp
844 27/10/16 - 13/02/17 Wetland Maintaining and improving the condition of wetland vegetation.
1617-MBG-07 Murrumbidgee - Toogimbie IPA Wetlands
998 18/3/17 - 04/04/17 07/05/17 - 24/06/17
Wetland Improve wetland health and resilience by building on improvements to vegetation condition in response to natural flooding and previous environmental water delivery.
1617-MBG-08 Murrumbidgee - Nimmie-Caira: Nap Nap
630 03/01/17 - 07/01/17 Wetland Maintaining and improving the condition of wetland vegetation.
1617-MBG-09 Murrumbidgee - Nimmie-Caira: Is-Y-Coed (Kieeta and Kia Lakes)
5000 10/02/17 - 20/03/17 Wetland Maintain and improve wetland vegetation condition in Kia Lake
2016 – 17 Basin-scale evaluation of Commonwealth environmental water — Vegetation Diversity
1617-MBG-10 Murrumbidgee - Lower Murrumbidgee River
47548 01/04/17 - 20/04/17 Fresh Support riparian vegetation
1617-MBG-11 Murrumbidgee - Lower Murrumbidgee Floodplain
15507 04/08/16 - 03/09/16 Wetland Maintain wetland and floodplain vegetation condition.
1617-MBG-12 Murrumbidgee - Western Lakes
5060 07/11/16 - 19/12/16 Wetland Provide habitat for waterbirds, and native wetland dependent fauna and improve the condition of aquatic, riparian and wetland vegetation.
1617-WAR-07 Warrego: Toorale Western Floodplain
5023 19/07/16 - 12/09/16 Wetland Maintain wetland vegetation and waterbird habitat on Warrego Western Floodplain.
1617-WAR-08 Warrego: Toorale Western Floodplain
4697 12/09/16 - 20/09/16 Wetland Maintain wetland vegetation and waterbird habitat on Warrego Western Floodplain.
1 As reported by CEWO.
2016 – 17 Basin-scale evaluation of Commonwealth environmental water — Vegetation Diversity
2 Methods
2.1 2016-17 evaluation approach
Following three years of monitoring under the LTIM project in Selected Areas that have, during this period, experienced a wide diversity of conditions, a large database of vegetation diversity records has accumulated. The availability of hydrologic data and aquatic ecosystem mapping has similarly changed during this period. As a result, the current LTIM vegetation diversity database and its association with supporting data, especially hydrologic information, has required a considerable overhaul during the past year, a process which is ongoing as further quality assurance and control is implemented. Consequently, the Basin-scale evaluation for vegetation diversity for 2016-17 considers only that data for which this process has been completed and therefore concentrates on evaluating vegetation diversity responses to Commonwealth environmental water in the year of 2016-17 only rather than for the whole three year period of LTIM to date (see Appendix C for further information). Furthermore, this year’s Basin Matter evaluation of vegetation diversity responses only considers the four wetland Selected Areas (i.e. Gwydir, Lachlan and Murrumbidgee river systems and the Junction of the Warrego and Darling rivers). Vegetation diversity responses to watering in the Edward-Wakool river system and the Goulburn River are reported in their respective Selected Area reports for 2016-17. A full analysis of vegetation diversity responses to Commonwealth environmental water will be conducted for 2017 – 18 following completion of the database quality assurance and control process currently underway, including analyses that incorporate data collected in the preceding three years.
This Basin evaluation of vegetation diversity outcomes of Commonwealth environmental water for 2016 – 17 synthesises and evaluates vegetation diversity data collected by Monitoring and Evaluation (M&E) Providers at the four wetland Selected Areas during this water year. Vegetation diversity data is assessed in this report with respect to:
1. Plant species diversity: effects of Commonwealth environmental water on the presence and richness of plant species within and across the wetland Selected Areas; and
2. Vegetation community diversity: effects of Commonwealth environmental water on the structure and composition of vegetation communities within and across the wetland Selected Areas.
In this year’s Basin evaluation, the following assessments are made:
1. Aggregated area scale, annual evaluation. Vegetation diversity responses to Commonwealth environmental water actions are identified and compared across wetland Selected Areas for 2016 – 17.
2. Basin scale, annual evaluation. Vegetation diversity responses to Commonwealth environmental water actions are identified and compared in relation to vegetation responses at all wetland Selected Areas for 2016 – 17.
2016 – 17 Basin-scale evaluation of Commonwealth environmental water — Vegetation Diversity
2.1.1 Aggregated Area scale, annual evaluation
Monitoring data evaluated
The sampling design and timing of vegetation diversity data collection from the four wetland Selected Areas in 2016 – 17 are summarised in Table 2.
Fifteen Commonwealth environmental water actions with vegetation diversity expected outcomes were delivered in 2016 – 17 across three of the four wetland Selected Areas considered in this evaluation report (Table 1). Only five watering actions contributed to inundation of LTIM vegetation diversity monitoring sites (Table 3). No Commonwealth environmental water was delivered to the Lachlan river system during 2016-17 for vegetation diversity outcomes, although substantial inundation occurred during the year, significantly affecting sampling during this period (Table 1).
In the Gwydir river system, many sites surveyed during October 2016 were wet, or partially wet, due to natural inundation (Table 3). By March 2017, some of these had dried out but others remained wet due to the delivery of Commonwealth environmental water (Table 3). In the Murrumbidgee river system, natural flooding had inundated all monitoring sites during September 2016. In later sampling events during 2016 – 2017, some of these had dried out while others remained wet including two sites to which Commonwealth environmental water had been delivered (Table 3). In the Junction of the Warrego and Darling rivers, half of the vegetation monitoring plots were inundated by Commonwealth environmental water during December 2016, but all plots were dry by April 2017 (Table 3).
Data analyses
To conduct an aggregated area scale evaluation, we assigned relatively equivalent water regime categories to each vegetation survey plot or transect at each of the four wetland Selected Areas for each survey date during 2016 – 17, i.e. ‘Wet’ or ‘Dry’ (Table 3). Water regime categories were determined from data provided by, and through consultation with, M&E Providers. Where a ‘Wet’ category was designated if the majority of the sampling area was inundated at the time of surveying. Water regime categories for the second survey date in 2016 – 17 (and third and fourth for the Murrumbidgee river system) were assigned by concatenating the hydrologic condition at each survey date, i.e. Wet-wet, Wet-dry etc. (Table 3). Throughout this report, water regime categories are abbreviated where necessary, i.e. W = wet, D = dry.
Because of variation in the timing of survey dates between Selected Areas, as well as differences in the watering actions delivered, water regime categories cannot be considered as strictly equivalent between Selected Areas or even within Selected Areas. In the absence of more detailed inundation information, however, these water regime categories provide an indication of the hydrological condition at the time of survey and of broad recent antecedent patterns of wetting and drying influencing vegetation diversity at each survey point, i.e. whether or not a plot was wet or dry at the time of sampling and during any preceding sampling times. Because this year’s evaluation focuses solely on monitoring data collected in 2016 – 17, however, neither hydrological conditions prior to the first LTIM survey in this year, nor differences in annual watering patterns (e.g. inundation duration, depth etc.), are therefore considered in this assessment. Additionally, effects of any very short duration wetting occurring entirely between survey dates is not captured. We also determined
2016 – 17 Basin-scale evaluation of Commonwealth environmental water — Vegetation Diversity
which vegetation survey plots were inundated by Commonwealth environmental water during 2016 – 17 through consultation with M&E Providers.
Plant species diversity responses to Commonwealth environmental water across the wetland Selected Areas in 2016 – 17 were assessed by determining the presence and absence of recorded species in plots/transects of different water regime categories within each Selected Area. Species only appearing in plots/transects inundated by Commonwealth environmental water actions in each of these Selected Areas during this year were then identified and compared between Selected Areas.
Vegetation community responses across the wetland Selected Areas were assessed in relation to total cover, the proportion of total vegetation cover comprising exotic species, species richness and vegetation community composition. Except for community composition, we examined differences in these variables in relation to water regime category at each survey time within each of these Selected Areas using univariate general linear models (GLM) on untransformed data in SPSS (version 25.0). Where relevant, Tukey’s b post-hoc tests were conducted to determine which groups differed significantly from each other. Trends in vegetation community responses to watering were then compared between Selected Areas inundated by Commonwealth environmental water.
We also explored patterns in vegetation community composition in relation to water regime category, survey date and inundation by Commonwealth environmental water using non-metric multi-dimensional scaling (nMDS) based on Bray–Curtis similarity measures calculated from matrices of species abundance (i.e. % cover) at a plot/transect level in Primer 7. Prior to these analyses, species only recorded in a single plot were removed from data matrices. We also conducted analysis of similarity (ANOSIM) and multivariate dispersion (MVDISP) in Primer to examine patterns in vegetation community composition amongst water regime categories.
2.1.2 Basin scale, annual evaluation
We assessed plant species diversity responses to Commonwealth environmental water at a Basin scale for 2016 – 17 by determining the presence and absence of recorded species in plots/transects of different water regime categories across all wetland Selected Areas. Species only appearing in plots/transects inundated by Commonwealth environmental water actions across all of these Selected Areas during this year were identified.
Vegetation community diversity outcomes were assessed by conducting nMDS based on Bray–Curtis similarity measures calculated from matrices of species cover combined across all four wetland/floodplain Selected Areas in relation to water regime category during 2016 – 17. ANOSIM was used to identify significant differences between groups and MVDSIP and Bootstrapping procedures in PRIMER 7 were used to explore heterogeneity of sampling points with respect to Selected Area and water regime category.
2016 – 17 Basin-scale evaluation of Commonwealth environmental water — Vegetation Diversity
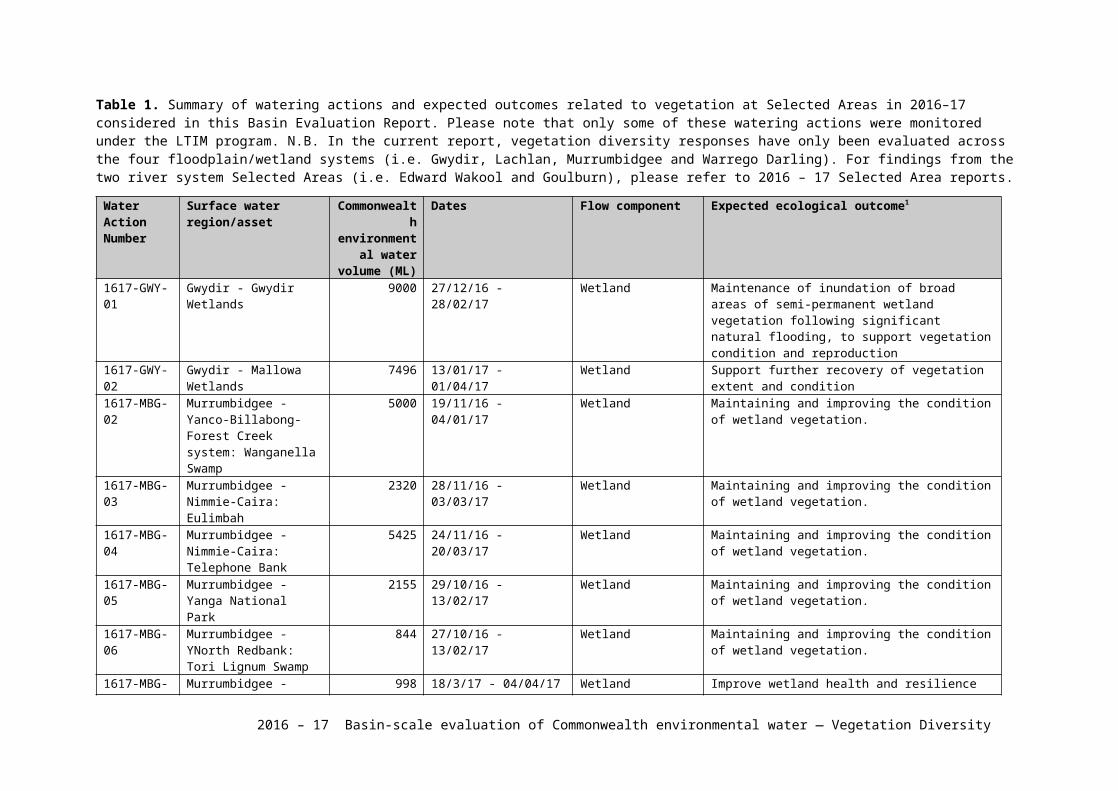
Figure 1. Vegetation diversity monitoring sites at Selected Areas in 2016–2017 including the four wetland Selected Areas evaluated in this report (i.e. the Gwydir river system, the Lachlan river system, Murrumbidgee river system and the Junction of the Warrego and Darling rivers) as well as the two river channel and riverbank Selected Areas (i.e. the Edward-Wakool river system and the Goulburn River). Extent of inundation by Commonwealth environmental water during 2016 – 17 is also illustrated.
2016 – 17 Basin-scale evaluation of Commonwealth environmental water — Vegetation Diversity
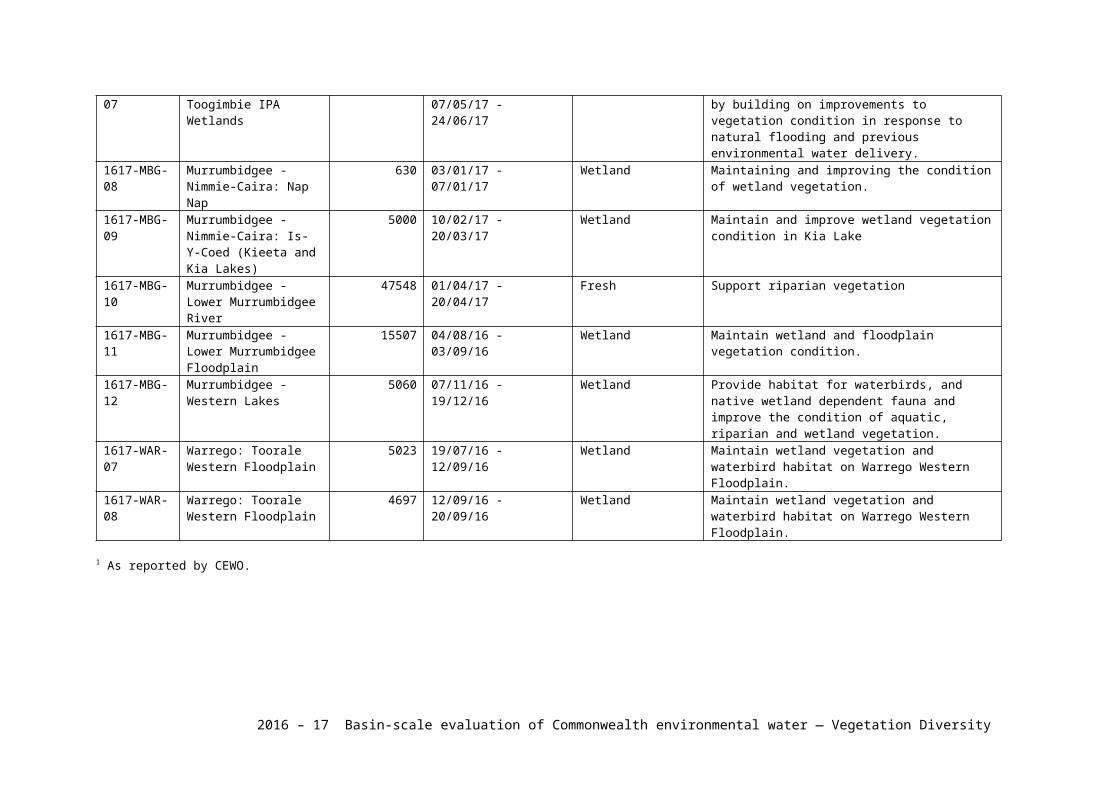
Table 2. Vegetation diversity sampling design at wetland Selected Areas in 2016 – 17. (N.B. refers to methods for collecting data regarding % cover of plant taxa).
Selected Area
Sampling design
Surv
ey ti
mes
No.
of s
ites
No.
of q
uadr
ats/
tr
anse
cts p
er si
te
Not
es
Qua
drat
/tra
nsec
t de
scrip
tion
Sam
plin
g un
it de
scrip
tion
Gwydir Oct 2016, Mar 2017
13 1–4 3 sites only surveyed in Oct 2016; 2 sites only surveyed in Mar 2017
0.04 ha plots Entire 0.04 ha plot
Lachlan Oct -Nov2016 – Feb 2017,Apr – Jun 2017
1-9 2–4 Sampling was considerably restricted by major flooding during this year, especially during first survey period
100 m transects 1 m2 quadrats every 10 m along transect
4-17 2–4 0.1 ha plots (trees) with nested 0.04 ha plots (understorey)
Entire 0.04 ha plot (Note: canopy cover recorded for 0.1 ha plot)
Murrum-bidgee
Sept 2016, Nov 2016, Jan -Feb2017, Mar 2017
12 3–5 Sampling was considerably restricted by major flooding during the first survey time (4 sites not surveyed)
Transects, 90 – 250 m long depending on wetland bathymetry and area
3 – 5 x 1 × 10 m2 quadrats along transect
Warrego Dec 2016,Apr 2017
8 3 - 0.04 ha plots Entire 0.04 ha plot
2016 – 17 Basin-scale evaluation of Commonwealth environmental water — Vegetation Diversity
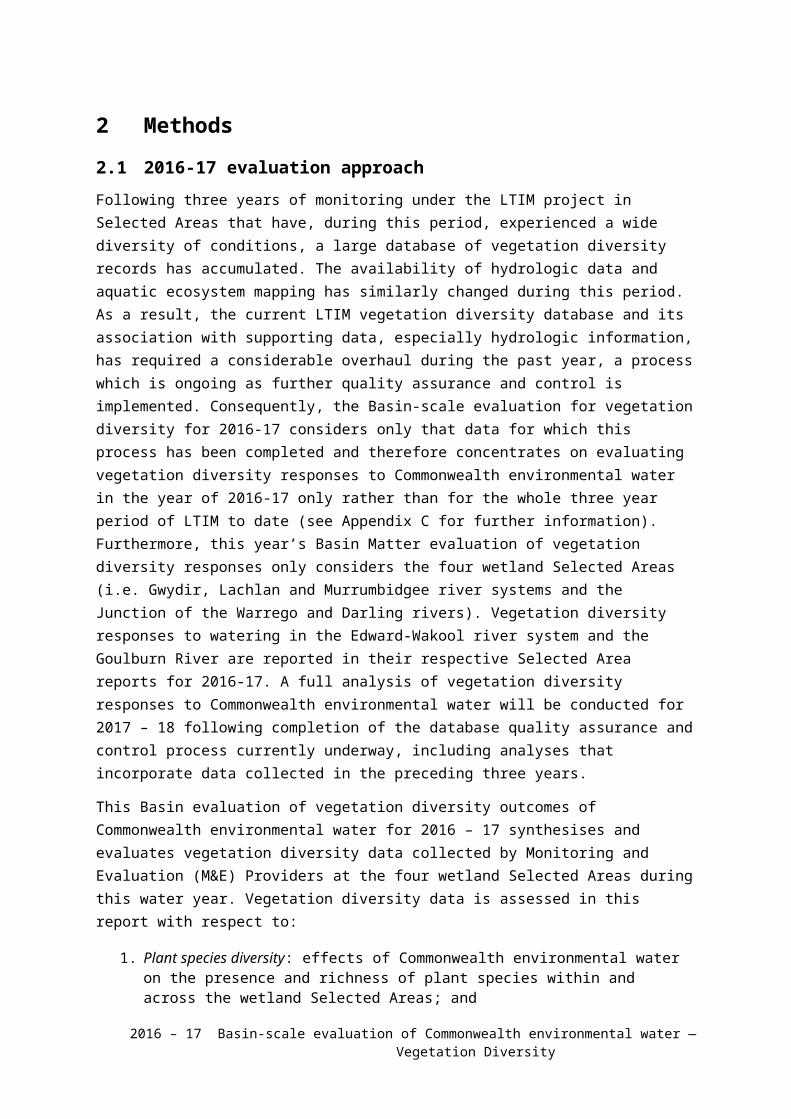
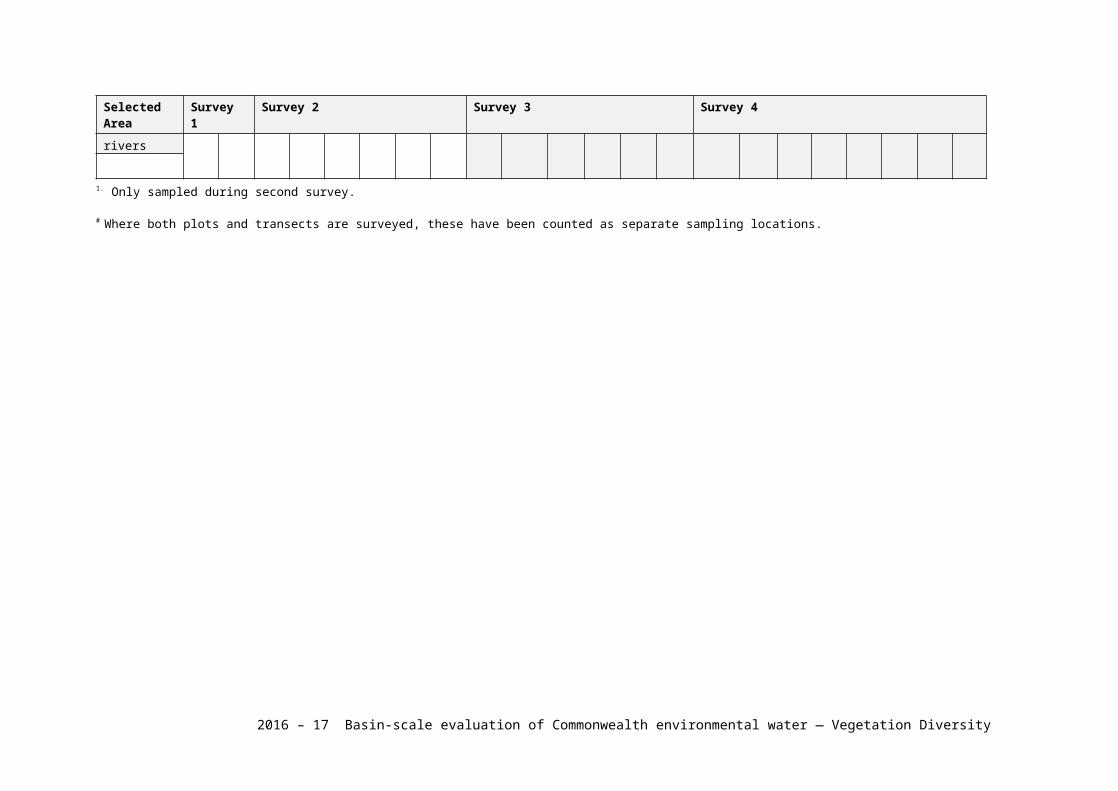
Table 3. Water regime categories assigned to vegetation diversity field survey plots/transects at wetland Selected Areas in 2016–17. D indicates ‘Dry’ and W ‘Wet’. Refer to Section 2.1.1 for further details on water regime categories. Numbers indicate the total number of plots / transects surveyed in each water regime category at each survey time. Numbers in brackets indicate the number of sample points (i.e. locations) across which these plots / transects were distributed. The number of plots / transects (and associated sample points) affected by CEW watering actions delivered during 2016 – 17 are shown in bold where relevant.
Selected Area Survey 1 Survey 2 Survey 3 Survey 4
D W D-D D-W
W-D
W-W
W1 D1 D-D-D
D-W-D
D-W-W
W-D-D
W-W-D
W-W-W
D-D-D-D
D-W-D-D
D-W-W-D
D-W-W-W
W-D-D-D
W-W-D-D
W-W-W-D
W-W-W-W
Gwydir river system
6 (3)
28 (9)
16 (7)
0 19 (6)
7 (2)
4 (3)
1 (1)
Lachlan river system#
32 (15)
19 (8)
6 (3)
0 19 (9)
17 (8)
1 (1)
11 (5)
Murrumbidgee river system
0 33 (12) 3 (1)
0 0 4 (2)3 (1)
29 (11) 4 (2)
0 0 0 0 0 4 (2) 3 (1)
5 (3)
24 (10) 4 (2)
0 0 0 0 4 (2) 3 (1)
4 (3)
0 20 (10) 4 (2)
Junction of the Warrego and Darling rivers
12 (5)
12 (6)
12 (5)
0 12 (6)
0 0 0
1. Only sampled during second survey.
# Where both plots and transects are surveyed, these have been counted as separate sampling locations.
2016 – 17 Basin-scale evaluation of Commonwealth environmental water — Vegetation Diversity
3 Aggregated area scale evaluation
3.1 Key findings
At each wetland Selected Area inundated by Commonwealth environmental water in 2016-17, between three and ten plant species were only recorded from plots inundated by Commonwealth environmental water. These taxa mostly comprised native sedges, forbs and grasses but also included one exotic species in each Selected Area.
Total vegetation cover varied in relation to inundation by Commonwealth environmental water across the wetland Selected Areas in 2016-17 tending to be higher in wetter plots/transects in the Gwydir and Murrumbidgee river systems but was greater in drier plots in the Junction of the Warrego and Darling rivers.
The proportion of vegetation cover comprising exotic plant species in the Gwydir and Murrumbidgee river systems tended to be lower in wetter plots/transects, including those inundated by Commonwealth environmental water, and higher in plots/transects that experienced longer durations of drying. In the Junction of the Warrego and Darling rivers, however, a reverse trend was apparent with higher proportions of exotic cover present in plots that were inundated by Commonwealth environmental water.
In each of the three wetland Selected Areas inundated by Commonwealth environmental water in 2016 – 17, more plant species tended to be present in drier plots/transects than those which were inundated by either natural flooding or Commonwealth environmental water.
Shifts in vegetation community composition were apparent in relation to survey time and water regime in the three wetland Selected Areas inundated by Commonwealth environmental water during 2016 – 17. Although shifts in composition varied between these Selected Areas, distinctive vegetation communities were associated with inundation by Commonwealth environmental water during 2016 – 17.
Inundation by Commonwealth environmental water significantly increased the diversity of vegetation communities at a landscape scale across each Selected Area during 2016 – 17 by generating different vegetation assemblages than would otherwise have occurred.
2016 – 17 Basin-scale evaluation of Commonwealth environmental water — Vegetation Diversity
3.2 Effects of Commonwealth environmental water on plant species diversity at wetland Selected Areas in 2016 – 17
In the Gwydir river system, 126 understorey plant taxa were recorded during 2016 – 17 (Appendix B). Eleven of these (~9 %) were only recorded from plots that had been inundated, or partially inundated, by Commonwealth environmental water during this year including one native sedge (Eleocharis pallens), five native forbs (Haloragis glauca, Brachyscome basaltica, Commelina cyanea, Ammania multiflora, Calotis scapigera, Portulaca oleracea), two native grasses (Paspalidium constrictum, Echinochloa inundata) and a sub-shrub only identified to genus (Abutilon). One exotic forb (Verbena officinalis) was also only recorded from plots inundated, or partially inundated, by Commonwealth environmental water during this year.
Vegetation surveys conducted in the Lachlan river system during the year recorded a total of 171 plant taxa, excluding trees (Appendix B). While substantial natural flooding occurred in the Lachlan river system during 2016 – 17, there was no inundation due to Commonwealth environmental water.
In the Murrumbidgee river system, 119 plant taxa were recorded during 2016 – 17 (Appendix B). Nine of these (~8 %) were only recorded from transects that had been inundated, or partially inundated, by Commonwealth environmental water during this year including two native sedges (Cyperus difformis, Juncus flavidus), five native forbs (Ammannia multiflora, Polygonum plebium, Crassula helmsii, Daucus glochidiatus, Plantago cunninghamii), one native grass (Paspalum distichum). One exotic sedge (Cyperus eragrostis) was observed only in a transect that was inundated, or partially inundated, by Commonwealth environmental water during this year.
One hundred and thirty-six plant taxa were recorded in the Junction of the Warrego and Darling rivers during 2016 – 17 (Appendix B). Five of these (~4 %) excluding trees were only observed in plots inundated, or partially inundated, by Commonwealth environmental water during this year. Including three native forbs (Calotis cuneata, Hypercium gramineum, Xerochrysum), one native grass (Juncus usitatus) and one exotic forb (Taraxacum officinale),
Table 4. Plant species only present in each wetland and floodplain Selected Area in 2016 – 17 in plots/transects following inundation by Commonwealth environmental water delivered during 2016 – 17. (N.B. No Commonwealth environmental water inundated vegetation survey plots during 2016 – 17 in the Lachlan river system). Note: asterisks (*) indicate exotic species.
Gwydir river system Murrumbidgee river system Junction of the Warrego and Darling Rivers
Grasses
Paspalidium constrictum, Echinochloa inundata
Paspalum distichum
Forbs
Haloragis glauca, Brachyscome basaltica, Commelina cyanea, Ammania multiflora, Calotis scapigera, Portulaca oleracea, Verbena officinalis*
Polygonum plebium, Ammannia multiflora, Crassula helmsii, Daucus glochidiatus, Plantago cunninghamii
Calotis cuneate, Hypercium gramineum, Taraxacum officinale*, Xerochrysum sp.
Sedges / rushes
Eleocharis pallens Cyperus difformis, Cyperus eragrostis*, Juncus flavidus
Juncus usitatus
Sub-shrubs / shrubs
Abutilon sp.
2016 – 17 Basin-scale evaluation of Commonwealth environmental water — Vegetation Diversity
3.3 Effects of Commonwealth environmental water on vegetation community diversity across wetland Selected Areas in 2016 – 17
Vegetation cover
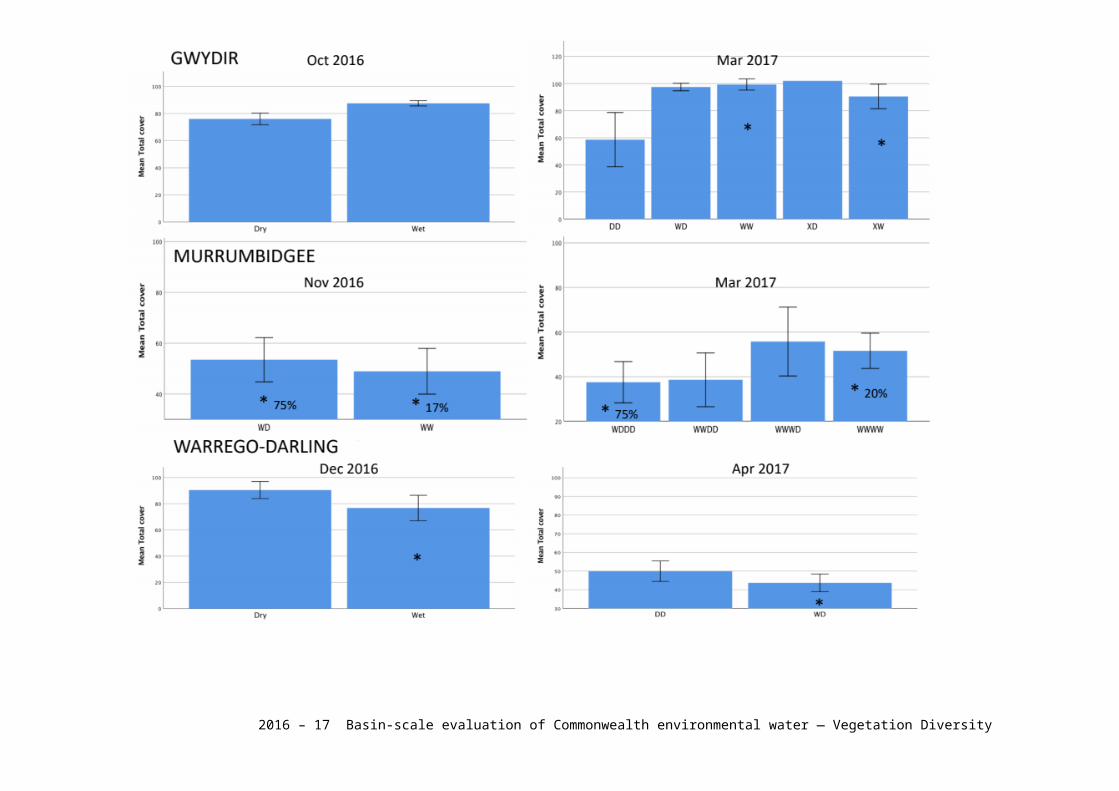
Mixed vegetation cover responses were apparent across the Selected Areas that were inundated by Commonwealth environmental water during 2016 – 17 (Figure 2).
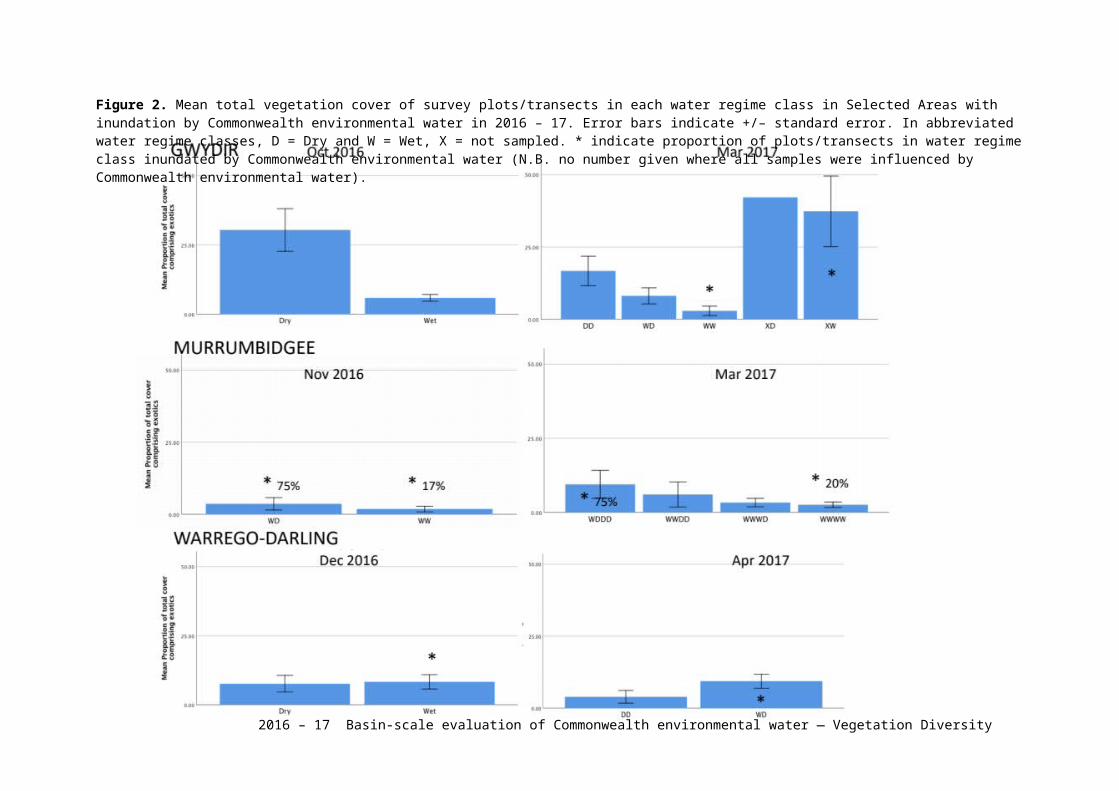
In the Gwydir river system, total cover in October 2016 was significantly higher in wet plots than dry plots (p < 0.0001; Figure 2). In March 2017, total cover was significantly lower (p < 0.05) in plots that remained dry than in those which had dried out or remained wet as a result of inundation by Commonwealth environmental water in between the two vegetation surveys (Figure 2). The proportion of vegetation cover comprising exotic species was significantly higher (p < 0.05) in dry plots than in wet plots in October 2016 but did not differ between water regime classes in March 2017 (Figure 3). Continuously wet plots, however, including those which remained wet due to inundation by Commonwealth environmental water, tended to have the lowest proportions of exotic cover in March 2017 (Figure 3).
In the Murrumbidgee river system, there were no significant differences in total cover between water regime classes at any survey time (Figure 2). Greatest total cover, however, tended to occur in transects which had experienced recent drying following wetting, including those which were inundated, or partially inundated, by Commonwealth environmental water during the year. No significant differences between water regime classes with respect to the proportion of vegetation cover comprising exotic species was detected for any survey time (Figure 3). However, there was a tendency for lower proportionate exotic species cover in transects with continuous wetting and for greater proportions of exotic cover to occur following longer periods of drying (Figure 3).
At the Junction of the Warrego and Darling rivers, total cover did not significantly differ between dry plots or those inundated by Commonwealth environmental water in December 2016 but tended to be lower in the in the plots inundated by Commonwealth environmental water. In April 2017, all plots were dry and total cover did not differ between those plots which had previously been wet or those which had been dry in both surveys although there was again a trend for higher total cover in the latter. There were no significant differences in proportionate exotic species cover between water regime class during either survey time although, in April 2017, this tended to be higher in plots that had been inundated by Commonwealth environmental water and had subsequently dried out than in plots which were dry in both surveys (Figure 3).
Species richness
In general, plant species richness was higher under dry conditions in the three Selected Areas that experienced inundation by Commonwealth environmental water during 2016 – 17 (Figure 4). Species richness of plots differed significantly with respect to water regime class in the Gwydir river system in both October 2016 (p < 0.001) and March 2017 (p < 0.01; Figure 4). At both times, species richness was greatest in dry plots, lowest in wet plots and intermediate in plots that were drying out following wetting. No significant differences in the species richness of plots / transects between water regime classes were apparent at either the Murrumbidgee river system or the Junction of the Warrego and Darling rivers at any survey time (Figure 4). However, in the latter Selected Area, drier plots tended to have higher numbers of plant species.
2016 – 17 Basin-scale evaluation of Commonwealth environmental water — Vegetation Diversity
Figure 2. Mean total vegetation cover of survey plots/transects in each water regime class in Selected Areas with inundation by Commonwealth environmental water in 2016 – 17. Error bars indicate +/– standard error. In abbreviated water regime classes, D = Dry and W = Wet, X = not sampled. * indicate proportion of plots/transects in water regime class inundated by Commonwealth environmental water (N.B. no number given where all samples were influenced by Commonwealth environmental water).
2016 – 17 Basin-scale evaluation of Commonwealth environmental water — Vegetation Diversity
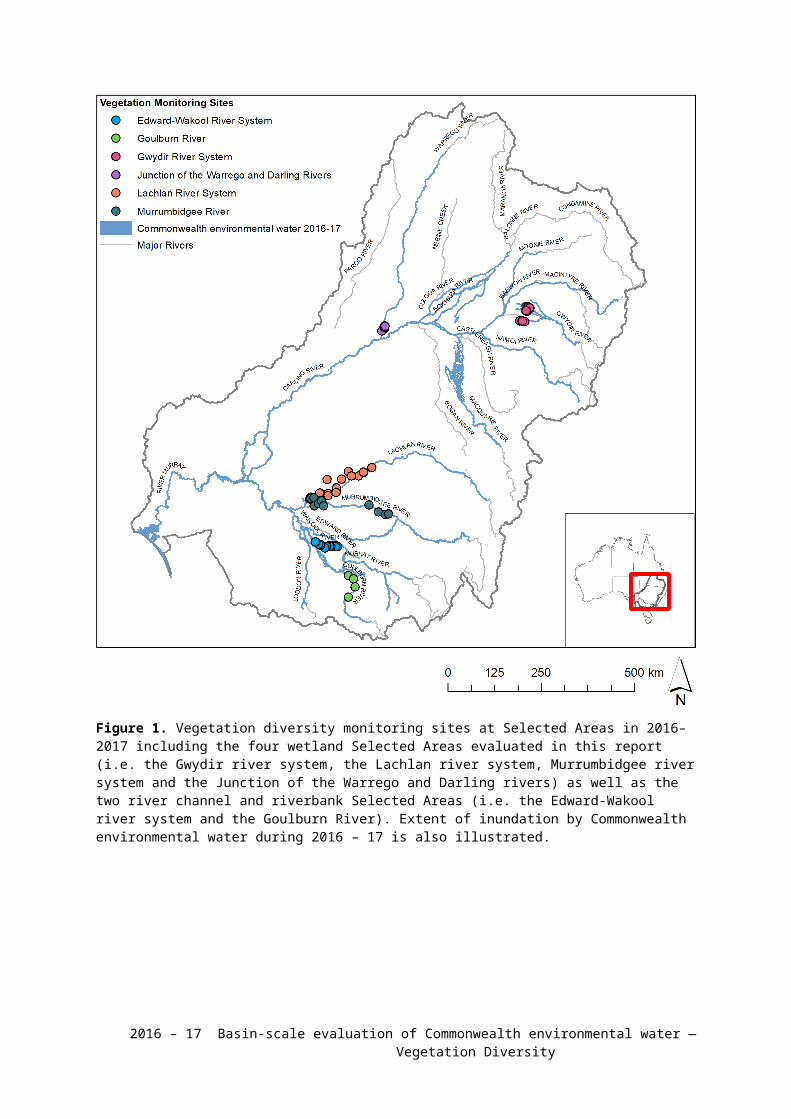
Figure 3. Mean proportion of vegetation cover comprised by exotic species in survey plots/transects in each water regime class in Selected Areas with inundation by Commonwealth environmental water in 2016 – 17. Error bars indicate +/– standard error. In abbreviated water regime classes, D = Dry and W = Wet, X = not sampled. * indicate proportion of plots/transects in water regime class inundated by Commonwealth environmental water (N.B. no number given where all samples were influenced by Commonwealth environmental water)
2016 – 17 Basin-scale evaluation of Commonwealth environmental water — Vegetation Diversity
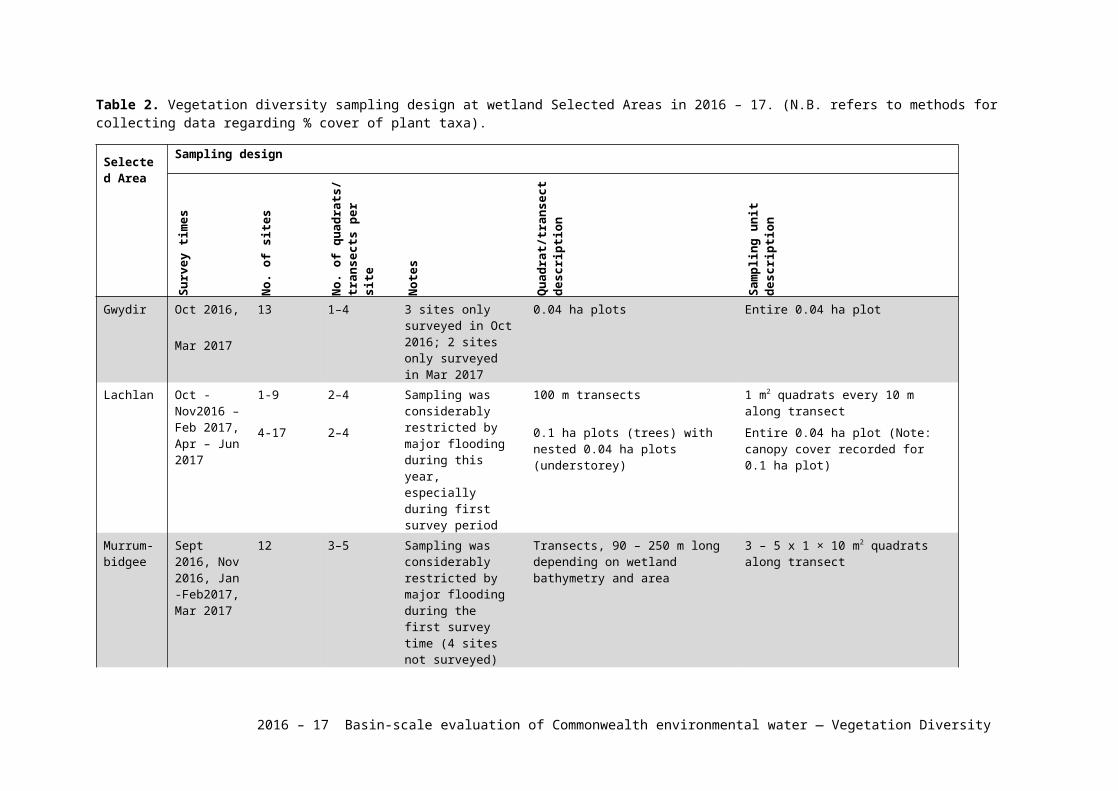
Figure 4. Mean plant species richness (excluding trees) of survey plots/transects in each water regime class in Selected Areas with inundation by Commonwealth environmental water in 2016 – 17. Error bars indicate +/– standard error. In abbreviated water regime classes, D = Dry and W = Wet, X = not sampled. * indicate proportion of plots/transects in water regime class inundated by Commonwealth environmental water (N.B. no number given where all samples were influenced by Commonwealth environmental water).
2016 – 17 Basin-scale evaluation of Commonwealth environmental water — Vegetation Diversity
Vegetation composition
Shifts in vegetation community composition varied between the three wetland Selected Areas inundated by Commonwealth environmental water during 2016 – 17 (Figures 5-7). In all cases, however, inundation by Commonwealth environmental water is strongly associated with a greater diversity of vegetation communities across each Selected Area at particular survey times, as well as throughout this year, by generating different vegetation assemblages than would otherwise have been present, i.e. a more diverse vegscape.
In the Gwydir river system, significant differences in vegetation community composition in relation to water regime were particularly apparent in March 2017, especially between plots that had remained wet in both surveys and those which had been dry in both (R = 0.545, significance level = 0.3%) and between plots which had been wet and then dried out and those which had been dry in both (R = 0.426, significance level = 0.7%; Figure 5). Consequently, Commonwealth environmental water contributed significantly to the diversity of vegetation communities because all of those plots which were wet in both surveys had been inundated by Commonwealth environmental water. The additional wet sites surveyed in March 2017 (i.e. labelled XW in Figure 5) had also been inundated by Commonwealth environmental water and had vegetation communities with significantly different composition from the other wet plots at this time (R = 0.776, significance level = 0.3%). No significant difference in vegetation community composition was detected, however, between plots that remained wet in both surveys and those which had dried out.
In the Murrumbidgee river system, few significant differences were apparent in vegetation community composition in relation to water regime category reflecting the relatively consistent and widespread wet conditions at this Selected Area during this year (Figure 6). By the final survey time in March 2017, however, some clear differences in vegetation community composition were apparent between plots and transects that had only been wet in September 2016 and had subsequently been drying (i.e. labelled WDDD in Figure 6) and those which had been wet during the first three survey dates of this year but were dry in March 2017 (i.e. labelled WWWD in Figure 6; R = 0.521, significance level = 2.9%). The greatest dispersion of plots/transects was identified for Wet plots during September 2016 (1.257) followed by WW plots in November 2016 (1.007), indicating that a high diversity of vegetation assemblages was generated at a landscape scale under these water regime conditions at each survey time.
In the Junction of the Warrego and Darling rivers, strong differences in vegetation community composition were detected between the two survey dates across all combinations of water regime (Figure 7). In April 2017, vegetation community composition also exhibited a clear, but relatively minor, difference between plots that had been dry throughout the year and those which had been inundated by Commonwealth environmental water in December 2016 (R = 0.181, significance level = 1.4%). The lowest dispersion of plots was apparent amongst plots assigned to DD (0.684) and D (0.871) water regime categories. In contrast, the greatest dispersion of vegetation assemblages occurred in plots that dried out following wetting in April 2017, i.e. WD (1.264).
2016 – 17 Basin-scale evaluation of Commonwealth environmental water — Vegetation Diversity
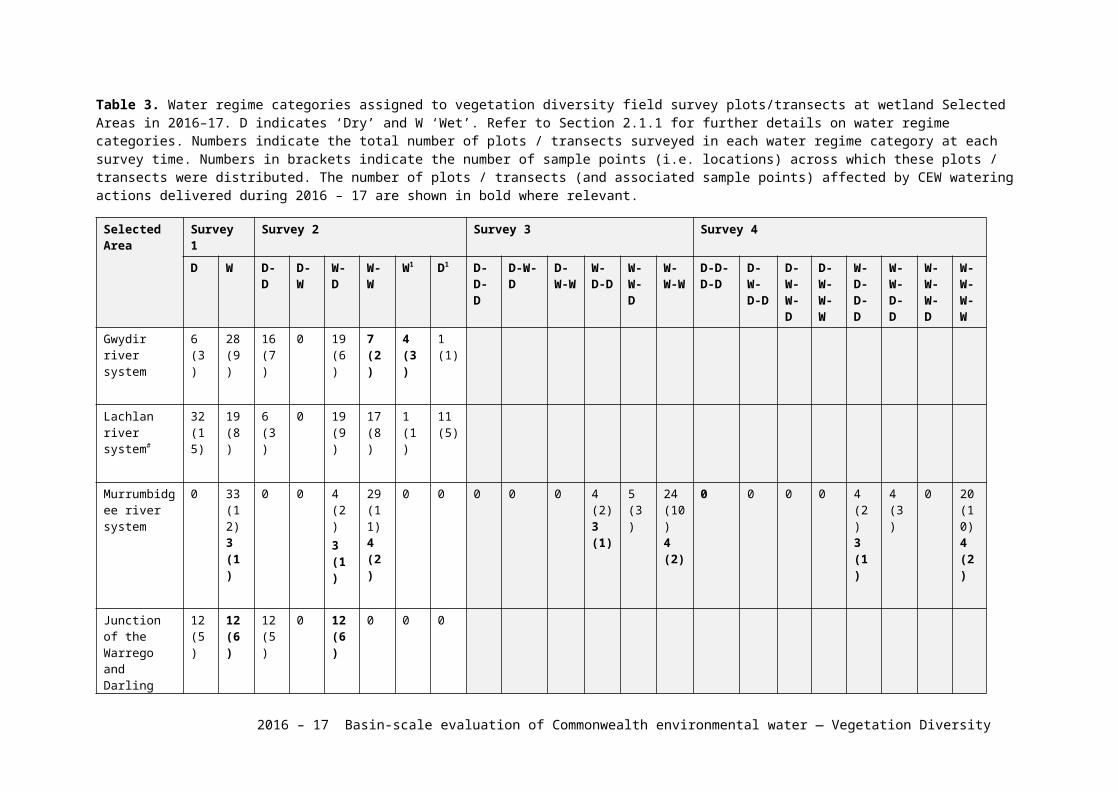
Figure 5. nMDS ordination of vegetation community composition at plots surveyed in 2016 – 17 in the Gwydir river system with respect to Water Regime; October 2016: W – wet, D – dry; March 2017: WW – wet in October 2016 and in March 2017, XD – only sampled in March 2017 and dry, XW – only sampled in March 2017 and wet, WD – wet in October 2017 and dry in March 2017, DD – dry in both October 2016 and March 2017. Orange circles indicate plots inundated by Commonwealth environmental water. Where points are closer together in the ordination point, this indicates greater similarity in vegetation community composition.
Figure 6. nMDS ordination of vegetation community composition at plots surveyed in 2016 – 17 in the Murrumbidgee river system with respect to Water Regime; September 2016: W – wet, D – dry; November 2016: WW – wet in September 2016 and in November 2016, WD – wet in September 2016 and dry in November 2016; Jan 2017: WWD – wet in September 2016 and November 2016 and dry in Jan 2017, WDD – wet in September 2016 and dry in November 2016 and Jan 2017, WWW – wet in September 2016, November 2016 and Jan 2017; March 2017: WWDD – wet in September 2016 and November 2016 and dry in Jan 2017 and March 2017, WDDD – wet in September 2016 and dry in November 2016, Jan 2017 and March 2017, WWWW– wet in September 2016, November 2016, Jan 2017 and March 2017, WWWD – wet in September 2016, November 2016 and Jan 2017 and dry in March 2017. Orange circles indicate plots inundated by
2016 – 17 Basin-scale evaluation of Commonwealth environmental water — Vegetation Diversity
Commonwealth environmental water. Where points are closer together in the ordination point, this indicates greater similarity in vegetation community composition.
Figure 7. nMDS ordination of vegetation community composition at plots surveyed in 2016 – 17 in the Junction of the Warrego and Darling rivers with respect to Water Regime; December 2016: W – wet, D – dry; April 2017: DD – dry in December 2016 and in April 2017, WD – wet in December 2016 and dry in April 2017. N.B. Wet plots in December 2016 (i.e. W) were all inundated by Commonwealth environmental water and all became wet-dry plots in April 2017 (WD). Where points are closer together in the ordination point, this indicates greater similarity in vegetation community composition.
2016 – 17 Basin-scale evaluation of Commonwealth environmental water — Vegetation Diversity
4 Basin scale evaluation
4.1 Key findings
Ten plant species were observed only in plots/transects across the three wetland Selected Areas in 2016 – 17 that were inundated by Commonwealth environmental water during this year: two native grasses, one native shrub, five native forbs, one exotic forb and one exotic sedge.
No plant taxa of specific conservation concern were observed in any of the wetland Selected Areas in 2016 – 17.
Despite virtually all of the plant taxa recorded across wetland Selected Areas in 2016 – 17 being widely distributed both within and beyond the Murray-Darling Basin, the composition of vegetation communities present in each Selected Area was highly distinctive. The greatest similarity between vegetation assemblages was apparent between the Murrumbidgee and Lachlan river systems.
Multivariate ‘averages’ of community composition with respect to water regime across all four wetland Selected Areas in 2016 – 17 indicate distinctive vegetation assemblages between each water regime category with most similarity apparent between plots which were wet in early surveys during this year and those which were wet and then dried out by later surveys in the year.
The highest diversity of vegetation assemblages across all four wetland Selected Areas in 2016 – 17 occurred amongst plots/transects which were wet in early surveys during this year followed by those which were wet and then dried out by later surveys in the year.
4.2 Effects of Commonwealth environmental water on plant species diversity at the Basin scale in 2016 – 17
A total of 361 plant taxa were recorded across the four wetland Selected Areas in 2016 – 17 (Appendix B). Ten of these were only recorded during 2016-17 in plots/transects inundated by Commonwealth environmental water delivered during this year, including two native grasses, one native shrub and five native forbs (Table 5). Two exotic species, the forb Taraxacum officinale and the sedge Cyperus eragrostis were also only observed in plots/transects inundated by Commonwealth environmental water delivered in 2016 – 17.
The ranges of nearly all of the plant taxa recorded across the four wetland Selected Areas in 2016 – 17 extend across all, or most of, the States of the Basin as well as having distributions beyond the Basin. No species of conservation concern, as per species listed under the national Environment Protection and Biodiversity Conservation Act 1999 or the New South Wales Threatened Species Conservation Act 1995 were observed across the four wetland Selected Areas in 2016 – 17.
2016 – 17 Basin-scale evaluation of Commonwealth environmental water — Vegetation Diversity
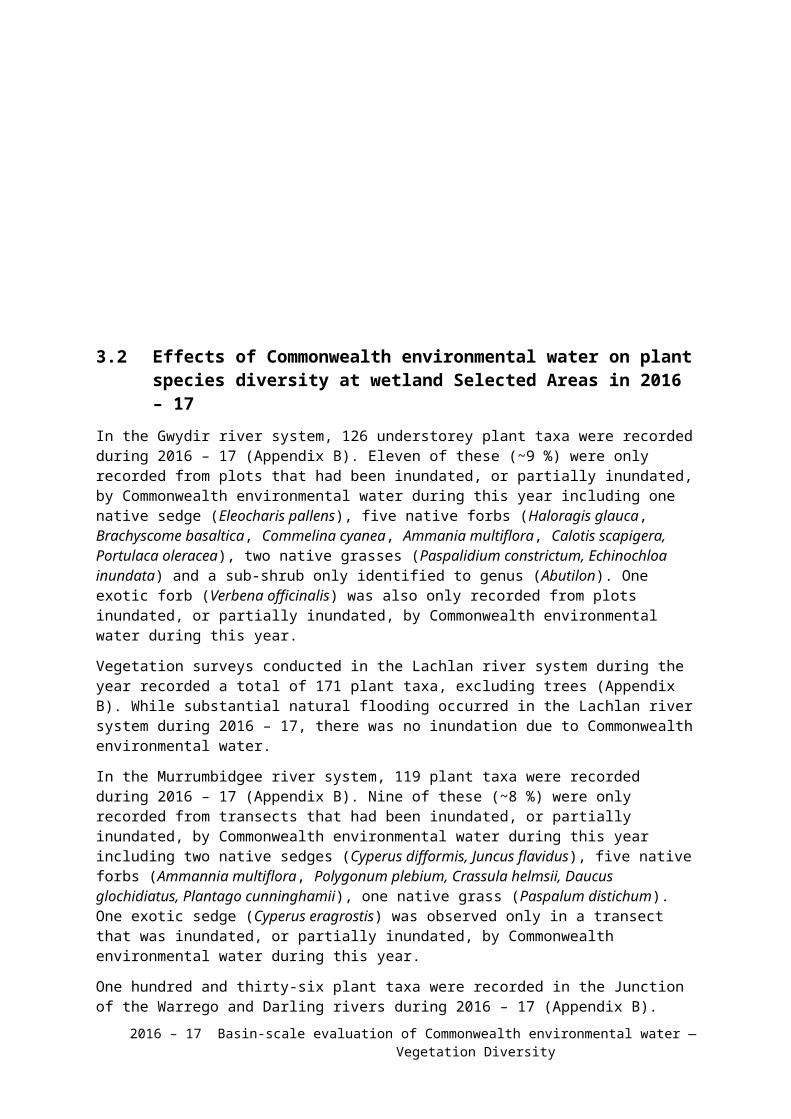
Table 5. Plant species only recorded from the Basin in plots/transects inundated by Commonwealth environmental water delivered during 2016 – 17.
Plant group Species
Grasses Paspalidium constrictum Echinochloa inundata
Forbs Commelina cyaneaHypercium gramineumTaraxacum officinale*Calotis cuneateCrassula helmsiiXerochrysum
Sedges / rushes Cyperus eragrostis*
Shrub Abutilon sp.Note: asterisks (*) indicate exotic species
4.3 Effects of Commonwealth environmental water on vegetation community diversity at the Basin scale in 2016 – 17
Vegetation community composition recorded at plots/transects in 2016 – 17 differed significantly between the four wetland Selected Areas (R = 0.492, significance level = 0.1%; Figure 8). Vegetation community composition was most distinctive between plots in the Junction of the Warrego and Darling rivers and the Gwydir river system (R = 0.859, significance level = 0.1%). In contrast, most overlap in community composition was apparent between plots/transects monitored in the Lachlan river system and the Murrumbidgee river system (R = 0.254, significance level = 0.1%). The greatest dispersion in community composition within a Selected Area was detected for the Murrumbidgee river system (1.197) followed by the Lachlan river system (0.955) and the Junction of the Warrego and Darling rivers (0.678) with the least amount of dispersion apparent amongst vegetation assemblages of the Gwydir river system (0.61).
With respect to water regime category across all of the wetland Selected Areas, a clear seasonal shift in vegetation community composition was apparent (Figure 9). Vegetation community composition was most different between dry plots during early surveys and plots which remained dry during later surveys (R = 0.256, significance level = 0.1%). Vegetation community composition also differed between plots that were wet during the first survey and those which remained wet during later surveys (i.e. WW; R = 0.135, significance level = 0.1%). Plots that were wet in two (or more) surveys (i.e. WW) also differed significantly in vegetation community composition from those which were wet initially but then dried out (i.e. WD; R = 0.174, significant level = 0.1%).
The greatest multivariate dispersion exhibited by surveyed vegetation communities across all four wetland Selected Areas occurred in the Wet water regime class (1.22) followed by the Wet-dry water regime class (i.e. WD: 1.123). The least amount of dispersion was apparent in dry sites during initial survey events (0.718) or, in later survey events, in sites that remained wet (0.936) or remained dry (0.957).
2016 – 17 Basin-scale evaluation of Commonwealth environmental water — Vegetation Diversity
Figure 8. nMDS ordination of vegetation community composition at plots surveyed in 2016 – 17 in the four wetland Selected Areas: JWD = Junction of the Warrego and Darling rivers, MUR = Murrumbidgee river system, LAC = Lachlan river system and GWY = Gwydir river system. (N.B. extreme outliers are not shown in this plot). Where points are closer together in the ordination point, this indicates greater similarity in vegetation community composition.
Figure 9. Bootstrapped nMDS ordination of vegetation community composition at plots surveyed in 2016 – 17 in the four wetland Selected Areas according to water regime category. (N.B. for plots in the Murrumbidgee river system sampled on the third and fourth sampling occasions during 2016 – 17 are categorised according only to the current and immediately preceding water regime). Where points are closer together in the ordination point, this indicates greater similarity in vegetation community composition.
2016 – 17 Basin-scale evaluation of Commonwealth environmental water — Vegetation Diversity
5 Synthesis of outcomes and implications for adaptive management
Commonwealth environmental water contributed to inundation of a relatively small proportion of monitored plots/transects across the four wetland Selected Areas in 2016 – 17. Nevertheless, this appears to have significantly contributed to the diversity of plant species and vegetation communities present in Selected Areas as well as across the Basin during this year, thereby contributing to the achievement of the Basin Plan objectives.
A summary of key findings and their implications for adaptive management are provided here.
Commonwealth environmental water increased plant species diversity in 2016 – 17
A significant number of plant taxa, mostly native, at each Selected Area (5-11 species), as well as cumulatively across all wetland Selected Areas (10 species), were only present in those plots/transects that were inundated by Commonwealth environmental water during this year. Consequently, there is a high probability that Commonwealth environmental water significantly enhanced plant species diversity in wetland habitats during 2016-17 as well as across the Basin as a whole.
Basin scale plant diversity is very likely to be enhanced by delivery of watering actions that inundate areas which would not have been flooded in the absence of environmental water.
Commonwealth environmental water delivered in 2016 – 17 resulted in shifts in total plant cover, exotic plant cover and species richness of inundated wetland vegetation communities
Vegetation communities at wetland Selected Areas that were inundated in 2016 – 17, both by Commonwealth environmental water and other sources, tended to differ with respect to plant cover and species richness from those which remained dry. However, these responses varied considerably in both strength and direction between Selected Areas. The most consistent trend across the wetland Selected Areas inundated by Commonwealth environmental water in 2016 – 17 was a tendency for higher species richness in plots/transects during drier conditions, especially following drawdown of floodwaters. This supports the hypothesis that vegetation communities with fewer, but different and typically more productive, plant species are typical in the Basin’s dryland wetlands during periods of inundation and that the highest local species richness over the long-term is likely to be generated by a variable wetting and drying regime (Brock et al. 2006, Capon et al. 2016).
To enhance landscape-scale plant diversity, watering actions should be delivered which provide a variety of wetting and drying regimes across the landscape including, where relevant, semi-permanent inundation of some wetlands, as well as moderate to infrequent wetting of other wetlands. Only targeting water delivery to semi-permanent wetlands (or vice versa), however, is likely to limit plant species diversity at landscape scale over the long-term.
Commonwealth environmental water delivered in 2016 – 17 increased the diversity of vegetation communities present across wetland landscapes in each Selected Area as well as across the Basin.
The composition of vegetation communities present at the four wetland Selected Areas in 2016 – 17 differed significantly both at a Basin scale, i.e. between Selected Areas, and within Selected Areas in relation to water regime. At any survey time, the composition of vegetation communities under dry
2016 – 17 Basin-scale evaluation of Commonwealth environmental water — Vegetation Diversity
conditions significantly differed from those under wet conditions. Furthermore, vegetation communities under dry conditions also exhibit differences in composition depending on whether they were previously inundated or not. Diversity of vegetation communities was also clearly promoted both within Selected Areas and at a Basin scale by wetting and, to a slightly lesser extent, drying following wetting. Consequently, Commonwealth environmental water resulting in wetland inundation across the Basin in 2016 – 17 is extremely likely to have generated a greater diversity of vegetation communities than would otherwise have been present.
To enhance landscape-scale vegetation community diversity, watering actions should be delivered which provide a variety of wetting and drying regimes across the landscape including, where relevant, semi-permanent inundation of some wetlands, as well as moderate to infrequent wetting of other wetlands. Only targeting water delivery to semi-permanent wetlands (or vice versa), however, is likely to limit vegetation community diversity at landscape scale over the long-term.
Vegetation diversity across multiple scales is likely to be promoted by environmental watering that generates a dynamic mosaic of wetting and drying regimes. Greater species diversity and heterogeneity of vegetation communities at landscape and Basin scales is highly likely to be promoted by delivery of Commonwealth environmental water that generates a diversity of hydrologic regimes within and between wetlands over both short (i.e. annual) and longer time frames. In contrast, regular and predictable watering of some wetland areas at the expense of occasionally delivering water to some less regularly inundated parts of the wetland landscape has the potential to result in reduction in plant species diversity at both local and landscape scales as well as declines in the heterogeneity of vegetation communities. It is important to recognize, however, that in some regions (e.g. the Murrumbidgee), some areas of semi-permanent inundation will also contribute to spatial and temporal heterogeneity of wetland vegetation by promoting vegetation communities dominated by a few (or single) highly productive aquatic or amphibious plant species. Trade-offs may be required, however, between maintaining high levels of aquatic plant growth amongst a few dominant species in semi-permanent wetlands and promoting vegetation diversity across the broader landscape.
To promote diversity of vegetation communities across the Basin, prioritisation of watering actions should aim to generate a dynamic mosaic of wetting and drying regimes at multiple scales an allow for semi-permanent inundation of some wetlands and moderate to infrequent inundation of others.
2016 – 17 Basin-scale evaluation of Commonwealth environmental water — Vegetation Diversity
ReferencesBrock MA, Capon SJ, Porter JL (2006) Disturbance of plant communities dependent on desert rivers. In: Kingsford RT (ed) Ecology of desert rivers. Cambridge University Press, Cambridge, pp 100–132.
Capon S (2016) Riparian herbs. In: Capon S, James C, Reid M (eds) Vegetation of Australian riverine landscapes. CSIRO Publishing, Melbourne, pp 103–118.
Capon SJ, Reid MA (2016) Vegetation resilience to mega drought along a typical floodplain gradient ‐of the southern Murray Darling Basin, Australia. ‐ Journal of Vegetation Science 27(5), 926-937.
Capon S, James C, Reid M (2016) Vegetation of Australian Riverine Landscapes. CSIRO Publishing, Melbourne.
Capon SJ (2003) Plant community responses to wetting and drying in a large arid floodplain. River Research and Applications 19(5–6), 509–520.
Capon SJ (2005) Flood variability and spatial variation in plant community composition and structure on a large arid floodplain. Journal of Arid Environments 60(2), 283–302.
Capon SJ, Chambers LE, Mac Nally R, Naiman RJ, Davies P, Marshall N, Pittock J, Reid M, Capon T, Douglas M, Catford J (2013) Riparian ecosystems in the 21st century: hotspots for climate change adaptation? Ecosystems 16(3), 359–381.
Capon SJ, Balcombe SR, McBroom J (2017) Environmental watering for vegetation diversity outcomes must account for local canopy conditions. Ecohydrology.
Kenny SA, Moxham C, Sutter G (2017) The response of rare floodplain plants to an environmental watering event at Hattah Lakes, Victoria. The Victorian Naturalist 134(1), 19-27.
Nilsson C, Svedmark M (2002) Basic principles and ecological consequences of changing water regimes: riparian plant communities. Environmental Management 30(4), 468–480.
Reid M, Capon S (2011) Role of the soil seed bank in vegetation responses to environmental flows on a drought-affected floodplain. River Systems 19(3), 249–259.
Stromberg JC (2001) Restoration of riparian vegetation in the south-western United States: importance of flow regimes and fluvial dynamism. Journal of Arid Environments 49(1), 17–34.
2016 – 17 Basin-scale evaluation of Commonwealth environmental water — Vegetation Diversity
Appendix A. Watering actions contributed to by Commonwealth environmental water in 2016 – 17 with Expected Outcomes related to vegetation
Water Action Number Surface water region/asset
Commonwealth environmental water volume
(ML)
Dates Flow component Expected ecological outcome1
1617-BRD-01 Border Rivers - Severn River
823.53 01/07/16 - 30/06/17 Bankfull Inundation, maintenance of riparian vegetation
1617-CLM-01 Lower Murray: Coorong, Lower Lakes and Murray Mouth
618476 01/06/16 - 30/06/17 Fresh, base flow Maintain elevated barrage flow September-December to support recruitment of Ruppia tuberosa where possible. Maintain the health of lake vegetation communities and inundate low lying wetlands.
1617-CNM-01 Central Murray: Barmah-Millewa Forest
39170 22/06/16 - 31/12/16 Overbank 2. Maintain the extent and condition of riparian and in-channel vegetation by:a) Increasing periods of growth for non-woody vegetation communities that closely fringe or occur within the River Murray channel, anabranches and low elevation floodplain wetlands.b) Protecting the current extent of Ruppia tuberosa by supporting suitable habitat conditions (salinity and water levels) within the Coorong South Lagoon to promote growth and survival.c) Maintaining the diversity, condition and extent of aquatic and littoral vegetation in the Lower Lakes.d) Maintaining the extent and condition of inundation dependent river red gum, black box, lignum and non-woody vegetation within low-lying areas of floodplain, with scale of contribution subject to seasonal conditions.
2016 – 17 Basin-scale evaluation of Commonwealth environmental water — Vegetation Diversity
1617-CNM-02 Central Murray: Murray River
124754 01/01/17 - 30/06/17 Fresh 2. Maintain the extent and condition of riparian and in-channel vegetation by:a) Increasing periods of growth for non-woody vegetation communities that closely fringe or occur within the River Murray channel, anabranches and low elevation floodplain wetlands.b) Protecting the current extent of Ruppia tuberosa by supporting suitable habitat conditions (salinity and water levels) within the Coorong South Lagoon to promote growth and survival.c) Maintaining the diversity, condition and extent of aquatic and littoral vegetation in the Lower Lakes.
1617-CON-01 Condamine: Lower Balonne floodplain system
28869.6 21/09/16 - 03/10/16 Bankfull Inundate/support core lignum rookery habitat (lignum) in Narran Lakes.
1617-EWK-04 Edward Wakool: Colligen-Neimur
21542 01/01/17 - 30/06/17 Base flow To determine if using long recessions to flows promotes the recovery of in-stream aquatic vegetation in the Colligen-Niemur system (as observed in the Yallakool-Wakool system.
1617-EWK-05 Edward Wakool: Wakool River
2770 01/01/174 - 30/06/17
Base flow To provide recessions to flows of a rate and duration that contributes to ongoing recovery of instream in-stream aquatic vegetation.
1617-EWK-06 Edward Wakool: Yallakool Creek
27581 01/01/17 - 30/03/17 Fresh To provide recessions to flows of a rate and duration that contributes to ongoing recovery of instream in-stream aquatic vegetation.
1617-EWK-08 Edward Wakool: Tuppal Creek
1320 30/03/17 - 15/05/17 Base flow Improvement in the ecological condition of the creek with an increase in canopy cover of stressed riparian vegetation.
1617-GLB-03 Goulburn - Lower Goulburn River
64290 01/03/17 - 03/04/17 Fresh To support the survival and condition of in-channel native vegetation. Encourage the establishment of stream bank and in-channel vegetation by supporting the recruitment of aquatic and riparian vegetation to improve stream bank stability.
2016 – 17 Basin-scale evaluation of Commonwealth environmental water — Vegetation Diversity
1617-GLB-04 Goulburn - Lower Goulburn River
39585 04/04/17 - 25/06/17 Base flow To support the survival and condition of in-channel native vegetation. Encourage the establishment of stream bank and in-channel vegetation by supporting the recruitment of aquatic and riparian vegetation to improve stream bank stability.
1617-GLB-05 Goulburn - Lower Goulburn River
21119 26/06/17 - 26/06/17 Fresh Encourage the establishment of stream bank and in-channel vegetation by supporting the recruitment of aquatic and riparian vegetation to improve stream bank stability.
1617-GWY-01 Gwydir - Gwydir Wetlands
9000 27/12/16 - 28/02/17 Wetland Maintenance of inundation of broad areas of semi-permanent wetland vegetation following significant natural flooding, to support vegetation condition and reproduction
1617-GWY-02 Gwydir - Mallowa Wetlands
7496 13/01/17 - 01/04/17 Wetland Support further recovery of vegetation extent and condition
1617-LDL-01 Lower Darling- Lower Darling River
71248.6 02/10/16 - 08/01/1724/04/17 - 30/06/17
Fresh, base flow Maintain the condition of riparian and floodplain vegetation, particularly river red gums that line parts of the channel
1617-LDL-02 Lower Darling- Great Darling Anabranch
89204 16/02/17 - 30/06/17 Fresh Maintain the condition of riparian and floodplain vegetation, particularly river red gums that line parts of the channel
1617-LOD-02 Loddon- Loddon River 1100 13/05/17 - 30/05/17 Fresh Provide flow variation to help with bank soil moisture and vegetation.
1617-LWM-01 Lower Murray - Calperum Station
1276.74 01/06/16 - 01/06/17 Wetland Prolong the benefits to black box communities higher in the floodplain and continuing to support black box recruits from the high flows in 2011. Support maintenance of lignum and chenopod shrubland communities.
2016 – 17 Basin-scale evaluation of Commonwealth environmental water — Vegetation Diversity
1617-LWM-02 Lower Murray - Pike River complex
5.35 01/11/16 - 01/06/17 Wetland Prolong the benefits to black box communities higher in the floodplain and continuing to support black box recruits from the high flows in 2011. Support maintenance of lignum and chenopod shrubland communities.
1617-LWM-03 Lower Murray - Loxton Riverfront Reserve
32.33 01/04/17 - 01/06/17 Wetland Prolong the benefits to black box communities higher in the floodplain and continuing to support black box recruits from the high flows in 2011. Support maintenance of lignum and chenopod shrubland communities.
1617-LWM-04 Lower Murray - Rillis Lagoons
35.43 01/04/17 - 01/06/17 Wetland Prolong the benefits to black box communities higher in the floodplain and continuing to support black box recruits from the high flows in 2011. Support maintenance of lignum and chenopod shrubland communities.
1617-LWM-05 Lower Murray - Kroehn’s Landing
2.59 01/06/17 - 30/06/17 Wetland Prolong the benefits to black box communities higher in the floodplain and continuing to support black box recruits from the high flows in 2011. Support maintenance of lignum and chenopod shrubland communities.
1617-LWM-06 Lower Murray - Thieles Lagoon
11.19 01/04/17 - 01/06/17 Wetland Prolong the benefits to black box communities higher in the floodplain and continuing to support black box recruits from the high flows in 2011. Support maintenance of lignum and chenopod shrubland communities.
1617-LWM-07 Lower Murray - Ramco River Terrace
2.71 01/05/16 - 01/06/17 Wetland Prolong the benefits to black box communities higher in the floodplain and continuing to support black box recruits from the high flows in 2011. Support maintenance of lignum and chenopod shrubland communities.
2016 – 17 Basin-scale evaluation of Commonwealth environmental water — Vegetation Diversity
1617-LWM-08 Lower Murray - Gurra- Lyrup Lagoon
110.54 01/04/17 - 01/06/17 Wetland Prolong the benefits to black box communities higher in the floodplain and continuing to support black box recruits from the high flows in 2011. Support maintenance of lignum and chenopod shrubland communities.
1617-LWM-09 Lower Murray - Riversleigh Lagoon
180.01 01/04/17 - 01/06/17 Wetland Prolong the benefits to black box communities higher in the floodplain and continuing to support black box recruits from the high flows in 2011. Support maintenance of lignum and chenopod shrubland communities.
1617-LWM-11 Lower Murray - Bookmark Creek
239 01/01/17 - 30/06/17 Wetland Maintaining black box, river red gum and lignum floodplain communities. Increasing size and health of juvenile river red gums.
1617-LWM-12 Lower Murray - Rufus River
29570 17/12/16 - 01/01/17 Fresh Supporting a sustained and adequate population of Ruppia tuberosa:- By increasing barrage flows to maintain water levels within the south lagoon to benefit flowering and seed set.Maintaining the extent and condition of riparian and in-channel vegetation by- Increasing periods of growth for non-woody vegetation communities that closely fringe or occur within the River Murray channel, anabranches and low elevation floodplain wetlands.
2016 – 17 Basin-scale evaluation of Commonwealth environmental water — Vegetation Diversity
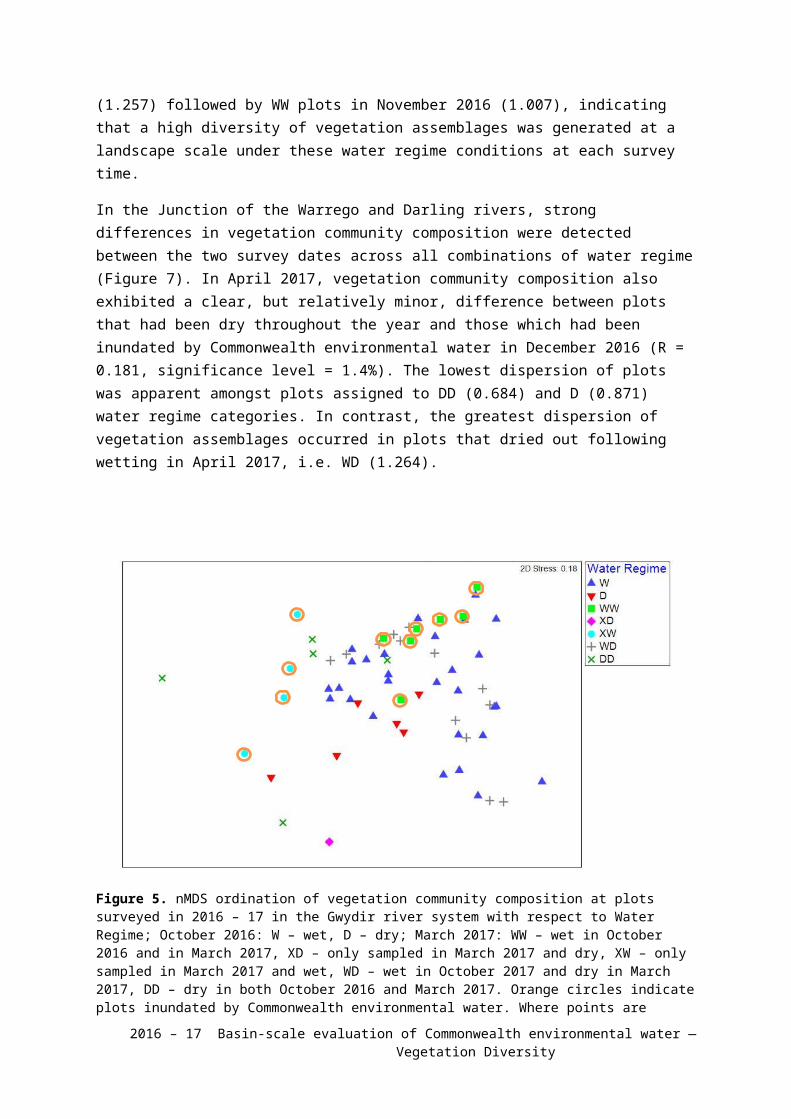
1617-LWM-13 Lower Murray - Lock 15 0 04/07/16 - 28/07/16 Fresh Maintaining the extent and condition of riparian and in-channel vegetation by- Increasing periods of growth for non-woody vegetation communities that closely fringe or occur within the River Murray channel, anabranches and low elevation floodplain wetlands.- Maintaining the extent and condition of inundation dependent river red gum, black box, lignum and non-woody vegetation within low-lying areas of floodplain, with scale of contribution subject to seasonal conditions.
1617-LWM-15 Lower Murray - Lock 9 0 15/07/16 - 30/12/16 Fresh Maintaining the extent and condition of riparian and in-channel vegetation by:- Increasing periods of growth for non-woody vegetation communities that closely fringe or occur within the River Murray channel, anabranches and low elevation floodplain wetlands.- Maintaining the extent and condition of inundation dependent river red gum, black box, lignum and non-woody vegetation within low-lying areas of floodplain, with scale of contribution subject to seasonal conditions.
1617-LWM-16 Lower Murray - Lock 9 0 30/04/17 - 30/06/17 Fresh Maintaining the extent and condition of riparian and in-channel vegetation by:- Maintaining the extent and condition of inundation dependent river red gum, black box, lignum and non-woody vegetation within low-lying areas of floodplain, with scale of contribution subject to seasonal conditions.
2016 – 17 Basin-scale evaluation of Commonwealth environmental water — Vegetation Diversity
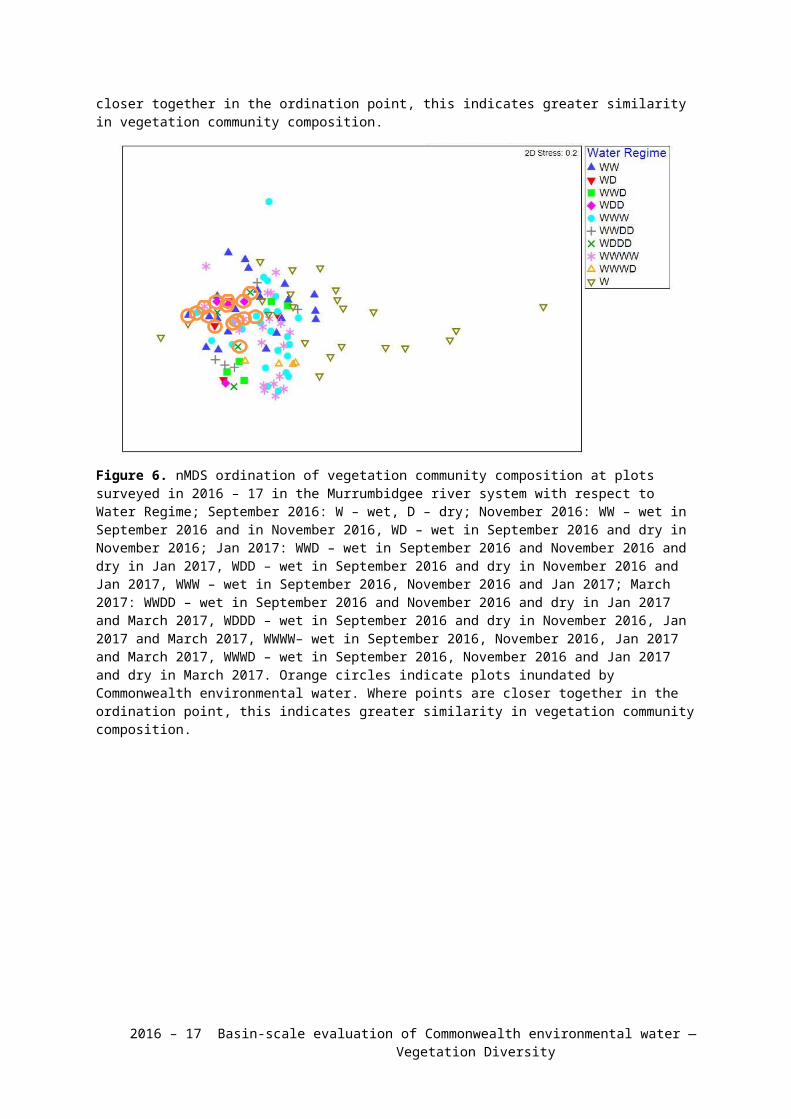
1617-LWM-17 Lower Murray - Lock 8 0 20/7/16 - 14/10/16 Fresh Maintaining the extent and condition of riparian and in-channel vegetation by:- Increasing periods of growth for non-woody vegetation communities that closely fringe or occur within the River Murray channel, anabranches and low elevation floodplain wetlands.- Maintaining the extent and condition of inundation dependent river red gum, black box, lignum and non-woody vegetation within low-lying areas of floodplain, with scale of contribution subject to seasonal conditions.
1617-LWM-18 Lower Murray - Lock 8 0 26/01/17 - 23/05/17 12/06/17 - 30/06/17
Fresh Maintaining the extent and condition of riparian and in-channel vegetation by:- Maintaining the extent and condition of inundation dependent river red gum, black box, lignum and non-woody vegetation within low-lying areas of floodplain, with scale of contribution subject to seasonal conditions.
1617-LWM-19 Lower Murray - Lock 7 0 01/08/16 - 01/01/17 Fresh Maintaining the extent and condition of riparian and in-channel vegetation by:- Increasing periods of growth for non-woody vegetation communities that closely fringe or occur within the River Murray channel, anabranches and low elevation floodplain wetlands.- Maintaining the extent and condition of inundation dependent river red gum, black box, lignum and non-woody vegetation within low-lying areas of floodplain, with scale of contribution subject to seasonal conditions.
1617-LWM-20 Lower Murray - Lock 7 0 01/02/1701/03/1701/05/17 - 01/06/17
Fresh Maintaining the extent and condition of riparian and in-channel vegetation by:- Maintaining the extent and condition of inundation dependent river red gum, black box, lignum and non-woody vegetation within low-lying areas of floodplain, with scale of contribution subject to seasonal conditions.
2016 – 17 Basin-scale evaluation of Commonwealth environmental water — Vegetation Diversity
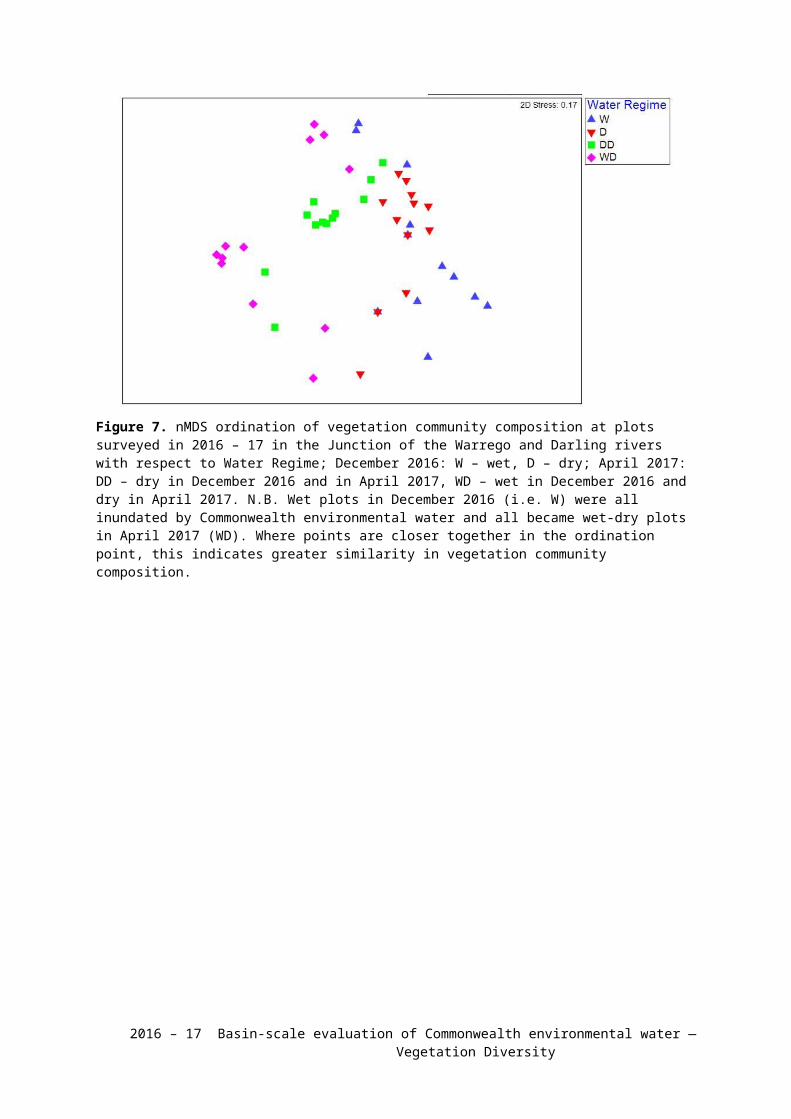
1617-LWM-21 Lower Murray - Lock 5 0 01/07/16 - 01/10/16 Fresh Maintaining the extent and condition of riparian and in-channel vegetation by:- Increasing periods of growth for non-woody vegetation communities that closely fringe or occur within the River Murray channel, anabranches and low elevation floodplain wetlands.- Maintaining the extent and condition of inundation dependent river red gum, black box, lignum and non-woody vegetation within low-lying areas of floodplain, with scale of contribution subject to seasonal conditions.
1617-LWM-22 Lower Murray - Lock 2 0 01/07/16 - 01/10/16 Fresh Maintaining the extent and condition of riparian and in-channel vegetation by:- Increasing periods of growth for non-woody vegetation communities that closely fringe or occur within the River Murray channel, anabranches and low elevation floodplain wetlands.- Maintaining the extent and condition of inundation dependent river red gum, black box, lignum and non-woody vegetation within low-lying areas of floodplain, with scale of contribution subject to seasonal conditions.
1617-MBG-02 Murrumbidgee - Yanco-Billabong- Forest Creek system: Wanganella Swamp
5000 19/11/16 - 04/01/17 Wetland Maintaining and improving the condition of wetland vegetation.
1617-MBG-03 Murrumbidgee - Nimmie-Caira: Eulimbah
2320 28/11/16 - 03/03/17 Wetland Maintaining and improving the condition of wetland vegetation.
1617-MBG-04 Murrumbidgee - Nimmie-Caira: Telephone Bank
5425 24/11/16 - 20/03/17 Wetland Maintaining and improving the condition of wetland vegetation.
1617-MBG-05 Murrumbidgee - Yanga National Park
2155 29/10/16 - 13/02/17 Wetland Maintaining and improving the condition of wetland vegetation.
1617-MBG-06 Murrumbidgee - YNorth Redbank: Tori Lignum Swamp
844 27/10/16 - 13/02/17 Wetland Maintaining and improving the condition of wetland vegetation.
2016 – 17 Basin-scale evaluation of Commonwealth environmental water — Vegetation Diversity
1617-MBG-07 Murrumbidgee - Toogimbie IPA Wetlands
998 18/3/17 - 04/04/17 07/05/17 - 24/06/17
Wetland Improve wetland health and resilience by building on improvements to vegetation condition in response to natural flooding and previous environmental water delivery.
1617-MBG-08 Murrumbidgee - Nimmie-Caira: Nap Nap
630 03/01/17 - 07/01/17 Wetland Maintaining and improving the condition of wetland vegetation.
1617-MBG-09 Murrumbidgee - Nimmie-Caira: Is-Y-Coed (Kieeta and Kia Lakes)
5000 10/02/17 - 20/03/17 Wetland Maintain and improve wetland vegetation condition in Kia Lake
1617-MBG-10 Murrumbidgee - Lower Murrumbidgee River
47548 01/04/17 - 20/04/17 Fresh Support riparian vegetation
1617-MBG-11 Murrumbidgee - Lower Murrumbidgee Floodplain
15507 04/08/16 - 03/09/16 Wetland Maintain wetland and floodplain vegetation condition.
1617-MBG-12 Murrumbidgee - Western Lakes
5060 07/11/16 - 19/12/16 Wetland Provide habitat for waterbirds, and native wetland dependent fauna and improve the condition of aquatic, riparian and wetland vegetation.
1617-MCQ-01 Macquarie - Macquarie Marshes
17039 24/01/17 - 18/02/17 Wetland Support the lifecycle completion of semi-permanent wetland vegetation.
1617-MCQ-03 Macquarie - Lower Macquarie River
27583 16/04/17 - 15/05/17 Fresh Inundation of wetland vegetation.
1617-MCQ-04 Macquarie - Macquarie Marshes
3000 24/07/16 - 30/07/16 Wetland Inundate semi-permanent wetland vegetation.
1617-MCQ-05 Macquarie - Macquarie Marshes
3500 06/09/16 - 13/09/16 Wetland Inundate semi-permanent wetland vegetation.
1617-MCQ-06 Macquarie - Macquarie Marshes
750 19/12/16 - 21/12/16 Wetland Maintain inundation of wetland vegetation
1617-NAM-01 Namoi - Lower Namoi River
7852 28/02/17 - 20/05/17 Base flow Maintain the condition of riparian and floodplain vegetation, particularly river red gums that line parts of the channel
1617-WAR-07 Warrego: Toorale Western Floodplain
5023 19/07/16 - 12/09/16 Wetland Maintain wetland vegetation and waterbird habitat on Warrego Western Floodplain.
1617-WAR-08 Warrego: Toorale Western Floodplain
4697 12/09/16 - 20/09/16 Wetland Maintain wetland vegetation and waterbird habitat on Warrego Western Floodplain.
TOTAL 1359745.62
1 As reported by CEWO.
2016 – 17 Basin-scale evaluation of Commonwealth environmental water — Vegetation Diversity
Appendix B. Plant taxa recorded by LTIM from wetland and floodplain Selected Areas in 2016 – 17 Note: Species present (+), bolded (+) species only present with CEW water, asterisk (*) indicates exotic species.
Lachlan Warrego-Darling Murrumbidgee Gwydir
Species Dry Wet Dry Wet - CEW Dry Dry - CEW Wet Wet - CEW Dry Wet Wet - CEW
Abutilon +
Abutilon theophrasti* + +
Acacia salicina +
Acacia stenophylla + + + + + + + + +
Acacia victoriae +
Aeschynomene indica + + + + +
Alternanthera +
Alternanthera denticulata + + + + + + + + + +
Ammannia multiflora + + +
Amphibromus nervosus + + +
Amyema cambagei +
Amyema quandang var. quandang + +
Anagallis arvensis* + +
Argemone ochroleuca* + +
Asperula gemella + +
Asperula geminifolia + + + + +
Aster subulatus* + + + +
Asteraceae +
Atalaya hemiglauca +
2016 – 17 Basin-scale evaluation of Commonwealth environmental water — Vegetation Diversity
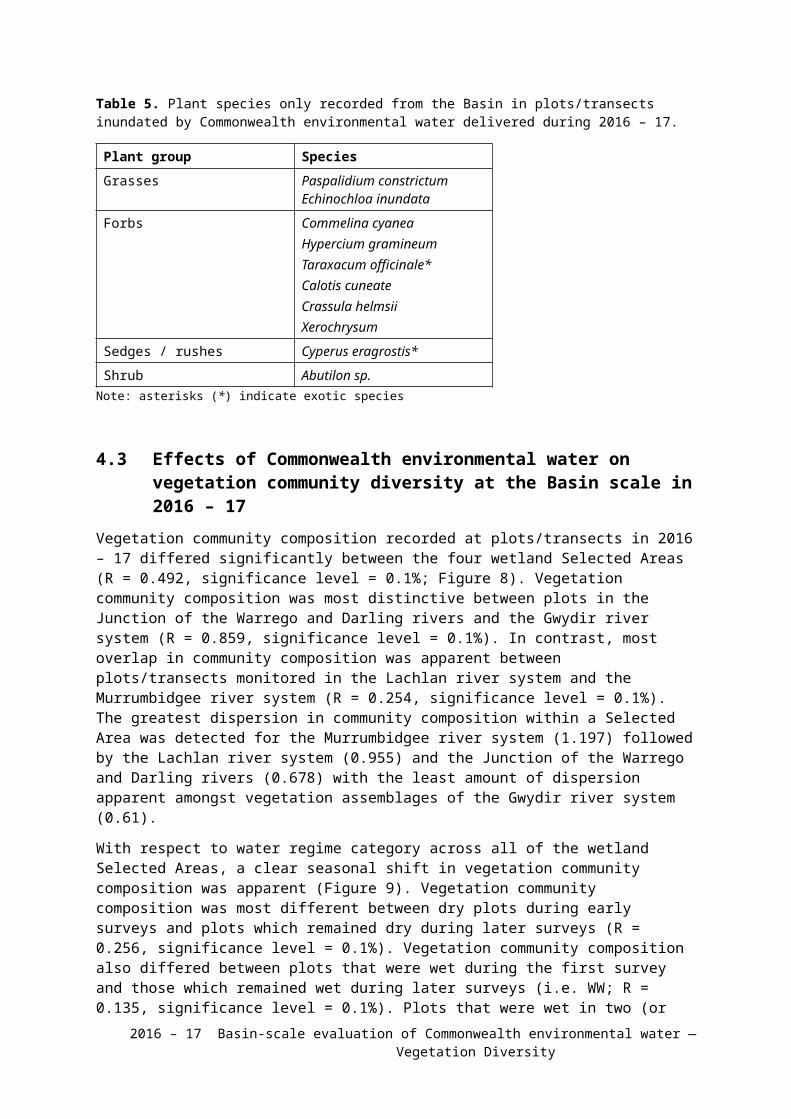
Atriplex +
Atriplex angulata + +
Atriplex leptocarpa +
Atriplex nummularia + +
Atriplex semibaccata + + + +
Atriplex vesicaria + +
Austrodanthonia + +
Austrostipa +
Avena* +
Azolla +
Azolla filiculoides + + + + + +
Bergia trimera + +
Berula erecta* +
Boerhavia dominii + +
Bolboschoenus caldwellii +
Bolboschoenus fluviatilis + + +
Brachyscome basaltica +
Brachyscome basaltica var. gracilis + +
Brachyscome ciliaris +
Brachyscome dentata + +
Brachyscome melanocarpa +
Brachyscome papillosa +
Brassicaceae + +
2016 – 17 Basin-scale evaluation of Commonwealth environmental water — Vegetation Diversity
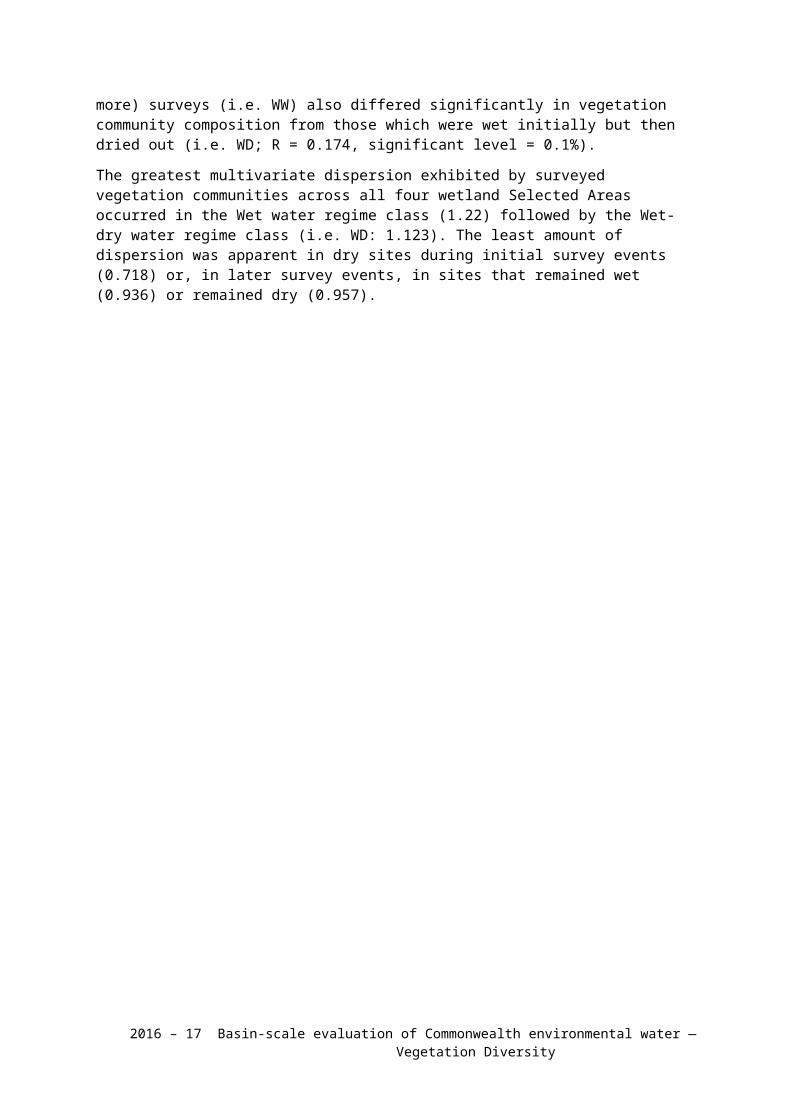
Bromus +
Bulbine +
Bulbine bulbosa +
Bulbine semibarbata +
Callitriche sonderi + +
Calotis +
Calotis cuneata +
Calotis cuneifolia +
Calotis hispidula + +
Calotis latiuscula + +
Calotis scabiosifolia +
Calotis scapigera + + + +
Capsella bursa-pastoris* +
Carduus* + +
Carex appressa + + +
Carex inversa + +
Carrichtera annua* + +
Carthamus lanatus* +
Casuarina cristata +
Centaurea calcitrapa* +
Centaurea melitensis* + +
Centipeda +
Centipeda cunninghamii + + + + + +
2016 – 17 Basin-scale evaluation of Commonwealth environmental water — Vegetation Diversity
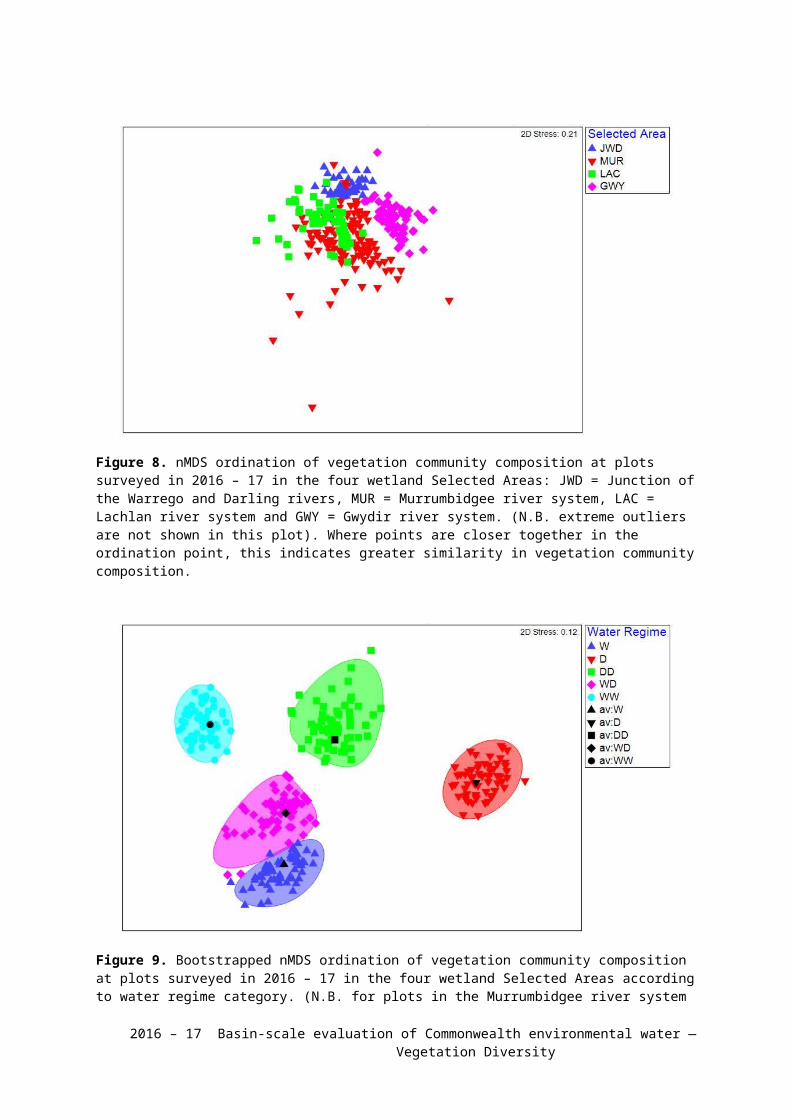
Centipeda minima +
Centipeda thespidioides +
Chamaesyce drummondii + + + + +
Chenopodium +
Chenopodium album* + +
Chenopodium melanocarpum + + + +
Chenopodium murale* + +
Chenopodium nitrariaceum + + + + +
Chenopodium pumilio + +
Chlorophyton +
Cirsium vulgare* + + + + + + + + +
Citrullus lanatus* + +
Commelina cyanea +
Convolvulus arvensis* +
Convolvulus graminetinus +
Conyza* + +
Conyza bonariensis* + + + + +
Conyza sumatrensis* +
Cotula bipinnata* +
Crassula helmsii +
Crinum flaccidum +
Cucumis +
Cucumis melo subsp. agrestis +
2016 – 17 Basin-scale evaluation of Commonwealth environmental water — Vegetation Diversity
Cucumis myriocarpus* + + + +
Cucumis myriocarpus subsp. leptodermis*
+
Cullen cinereum +
Cullen tenax + +
Cyclospermum leptophyllum* + +
Cynodon dactylon + + + + + + +
Cynoglossum +
Cynoglossum australe + +
Cynoglossum suaveolens +
Cyperaceae +
Cyperus + + +
Cyperus bifax + + + +
Cyperus concinnus + +
Cyperus difformis + + + +
Cyperus eragrostis* +
Cyperus gymnocaulos +
Damasonium minus + + + + + +
Daucus glochidiatus + +
Dentella minutissima +
Deyeuxia +
Diplachne fusca + + + + +
Dodonaea viscosa + +
2016 – 17 Basin-scale evaluation of Commonwealth environmental water — Vegetation Diversity
Dodonaea viscosa subsp. angustissima +
Duma florulenta + + + + + + + + + + +
Dysphania +
Dysphania pumilio + + +
Echinochloa colona + + +
Echinochloa crus-galli* + +
Echinochloa inundata +
Echium plantagineum* + + + + + +
Eclipta platyglossa + + + + + + +
Einadia nutans + + + +
Einadia nutans var. linifolia +
Einadia nutans var. linifolia 1 +
Einadia nutans var. nutans + +
Einadia polygonoides + + +
Einadia trigonos + +
Elatine gratioloides + + +
Eleocharis + +
Eleocharis acuta + + + + +
Eleocharis pallens + + +
Eleocharis plana + + +
Eleocharis pusilla + + + + + + + + +
Eleocharis sphacelata + + + +
Enchylaena tomentosa + + + + + + +
2016 – 17 Basin-scale evaluation of Commonwealth environmental water — Vegetation Diversity
Enteropogon acicularis +
Epaltes australis +
Eragrostis + +
Eremophila debilis +
Eremophila desertii +
Eryngium paludosum +
Eucalyptus +
Eucalyptus camaldulensis + + + + + + + +
Eucalyptus coolabah + + + + +
Eucalyptus largiflorens + + + + +
Eucalyptus populnea +
Eucalyptus populnea subsp. bimbil +
Euchiton sphaericus + + +
Euphorbia drummondii + +
Euphorbia planiticola +
Euphorbia stevenii +
Fabaceae + +
Fumaria* +
Galium +
Galium aparine* + + +
Galium gaudichaudii +
Galium murale* +
Glinus lotoides + + + + + +
2016 – 17 Basin-scale evaluation of Commonwealth environmental water — Vegetation Diversity

Glycine tabacina + +
Gnaphalium +
Goodenia fascicularis + +
Goodenia glauca +
Goodenia heteromera + + + + + +
Goodenia pinnatifida + +
Haloragis glauca + +
Haloragis glauca forma glauca + + +
Hedypnois rhagadioloides* +
Heliotropium +
Heliotropium curassavicum + +
Heliotropium europaeum + + + + +
Heliotropium supinum* +
Hordeum* +
Hordeum leporinum* +
Hypericum gramineum +
Hypochaeris microcephala var. albiflora* +
Hypochaeris radicata* + + + +
Isolepis + + +
Juncus + + + + +
Juncus aridicola + + +
Juncus flavidus + + +
Juncus usitatus + + + +
2016 – 17 Basin-scale evaluation of Commonwealth environmental water — Vegetation Diversity
Lachnagrostis filiformis + + + + +
Lactuca saligna* + + + +
Lactuca serriola* + + + +
Leiocarpa +
Lemna + + +
Lemna minor +
Lepidium +
Lepidium bonariense* + + +
Lepidium hyssopifolium +
Lepidium pseudohyssopifolium + +
Limosella australis + +
Lobelia purpurascens + +
Lolium* +
Ludwigia octovalvis + + +
Ludwigia peploides +
Ludwigia peploides var. montevidensis + + + + + + + +
Lycium ferocissimum* + + + + +
Lysiana subfalcata +
Lythrum hyssopifolia + + +
Lythrum salicaria +
Maireana +
Maireana aphylla +
Maireana brevifolia +
2016 – 17 Basin-scale evaluation of Commonwealth environmental water — Vegetation Diversity
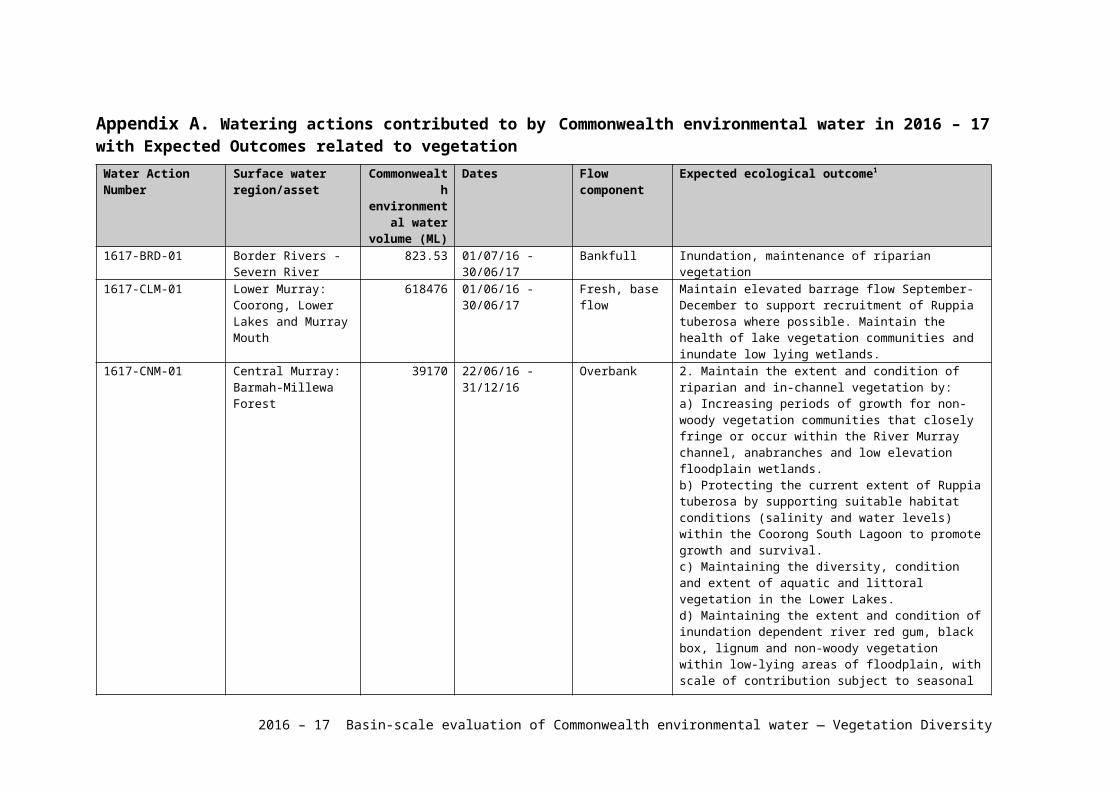
Maireana pyramidata +
Malva preissiana +
Malvaceae + +
Malvastrum +
Marrubium vulgare* + +
Marsilea +
Marsilea costulifera +
Marsilea drummondii + + + + + + + + + + +
Marsilea hirsuta +
Medicago* +
Medicago arabica* +
Medicago polymorpha* + + + + + + +
Melilotus indicus* +
Mentha australis + + + + + +
Mimulus gracilis + + +
Minuria integerrima +
Modiola caroliniana* + +
Myoporum +
Myoporum montanum + + +
Myosurus australis + +
Myriophyllum + + +
Myriophyllum crispatum +
Myriophyllum papillosum + + + +
2016 – 17 Basin-scale evaluation of Commonwealth environmental water — Vegetation Diversity
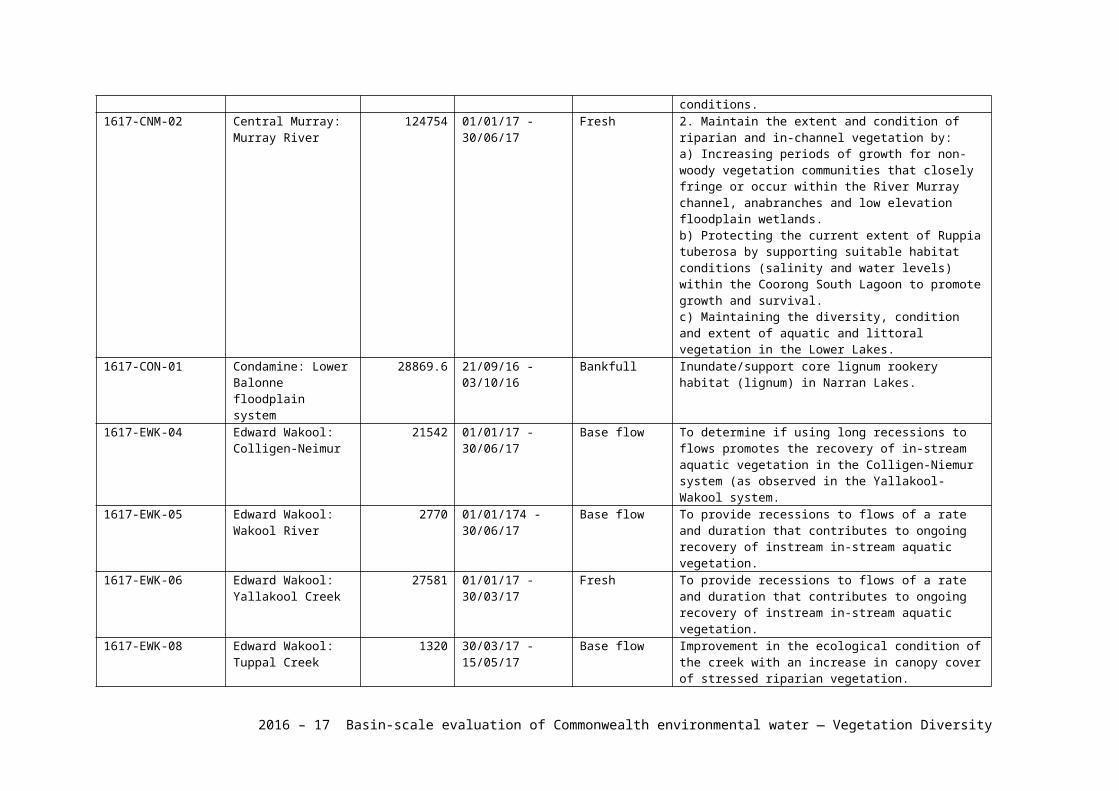
Myriophyllum verrucosum + +
NA + + + +
Nicotiana velutina + +
Nymphoides crenata +
Ottelia ovalifolia + + + +
Oxalis + +
Oxalis chnoodes +
Oxalis corniculata* + + + +
Oxalis perennans + +
Panicum + + +
Panicum decompositum var. tenuius +
Paspalidium constrictum +
Paspalidium jubiflorum + + + + + + + + + +
Paspalum dilatatum* +
Paspalum distichum + + + + + + +
Persicaria +
Persicaria decipiens + + + + + + + +
Persicaria lapathifolia + +
Persicaria prostrata + + + + + +
Petrorhagia nanteuilii* + +
Phyla canescens* + + + + + +
Phyla nodiflora + + + +
Phyllanthus lacunarius + + +
2016 – 17 Basin-scale evaluation of Commonwealth environmental water — Vegetation Diversity
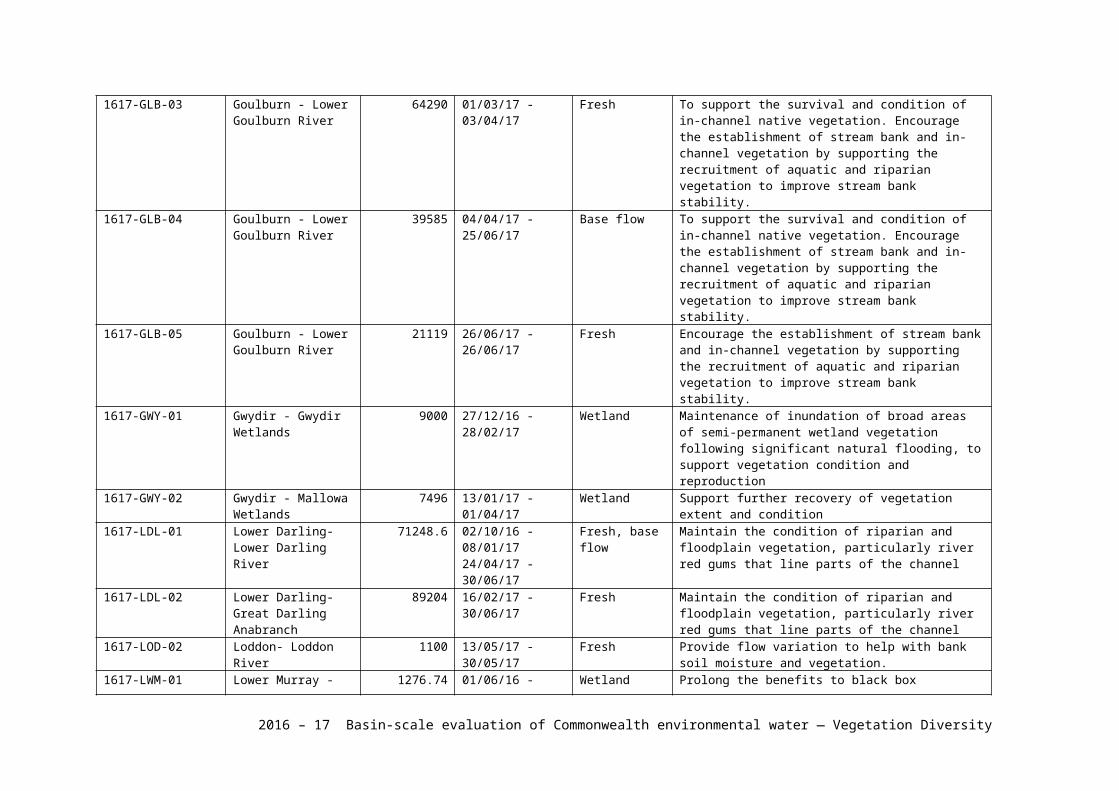
Physalis* +
Physalis minima* + +
Plantago cunninghamii + + + +
Plantago debilis + +
Poa fordeana +
Poaceae + +
Polygonum arenastrum* + +
Polygonum aviculare* + + + + + + +
Polygonum plebeium + + + +
Polypogon monspeliensis* + +
Portulaca oleracea + + +
Potamogeton +
Potamogeton crispus +
Potamogeton tricarinatus +
Pratia concolor + + + + + + + +
Pseudognaphalium luteoalbum + +
Pseudoraphis spinescens + + +
Psilocaulon tenue* +
Ranunculus +
Ranunculus pentandrus + +
Ranunculus pumilio + + + +
Ranunculus sessiliflorus +
Ranunculus undosus + + + + + +
2016 – 17 Basin-scale evaluation of Commonwealth environmental water — Vegetation Diversity
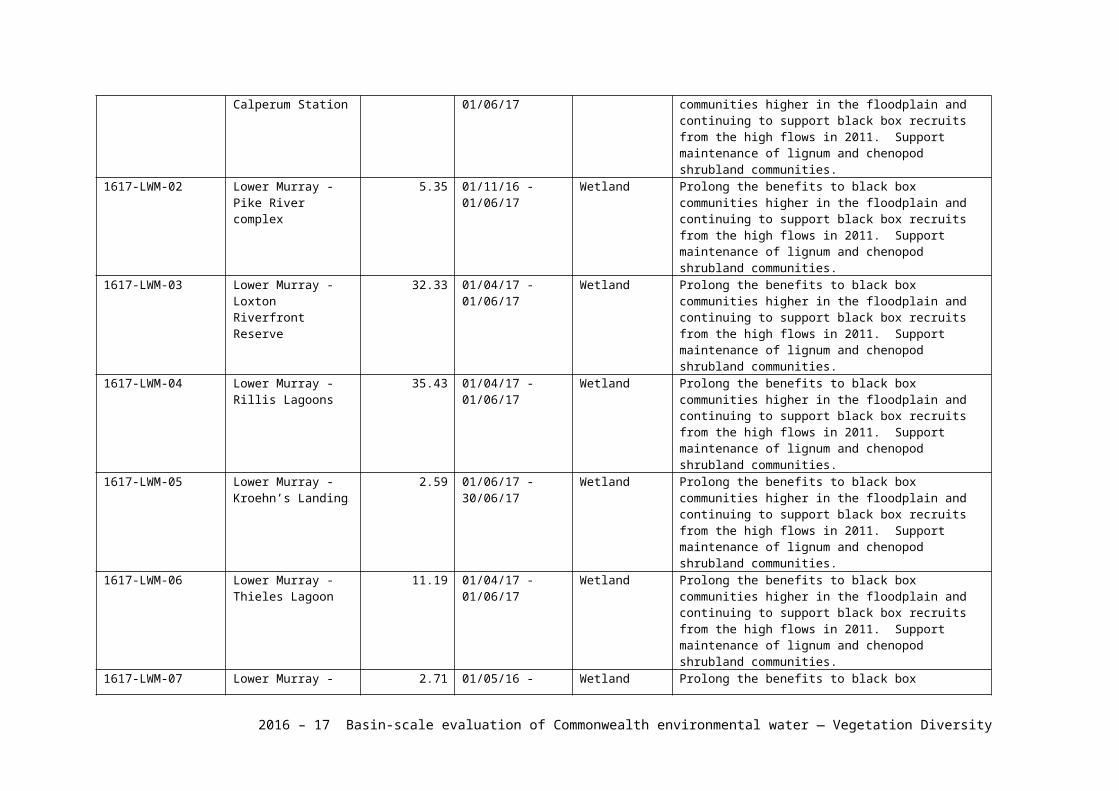
Rapistrum rugosum* + +
Rhagodia spinescens + + + + +
Rhodanthe corymbiflora +
Rorippa eustylis + + + +
Rorippa laciniata +
Rorippa palustris* +
Rumex + + + + +
Rumex brownii + + + + +
Rumex crispus* + +
Rumex tenax + + + + +
Rytidosperma caespitosum +
Salsola australis + + +
Schismus barbatus* +
Scleroblitum atriplicinum +
Sclerolaena +
Sclerolaena birchii + + + +
Sclerolaena brachyptera +
Sclerolaena calcarata +
Sclerolaena constricta +
Sclerolaena divaricata +
Sclerolaena intricata +
Sclerolaena muricata + + + + + + + +
Sclerolaena muricata var. muricata + +
2016 – 17 Basin-scale evaluation of Commonwealth environmental water — Vegetation Diversity
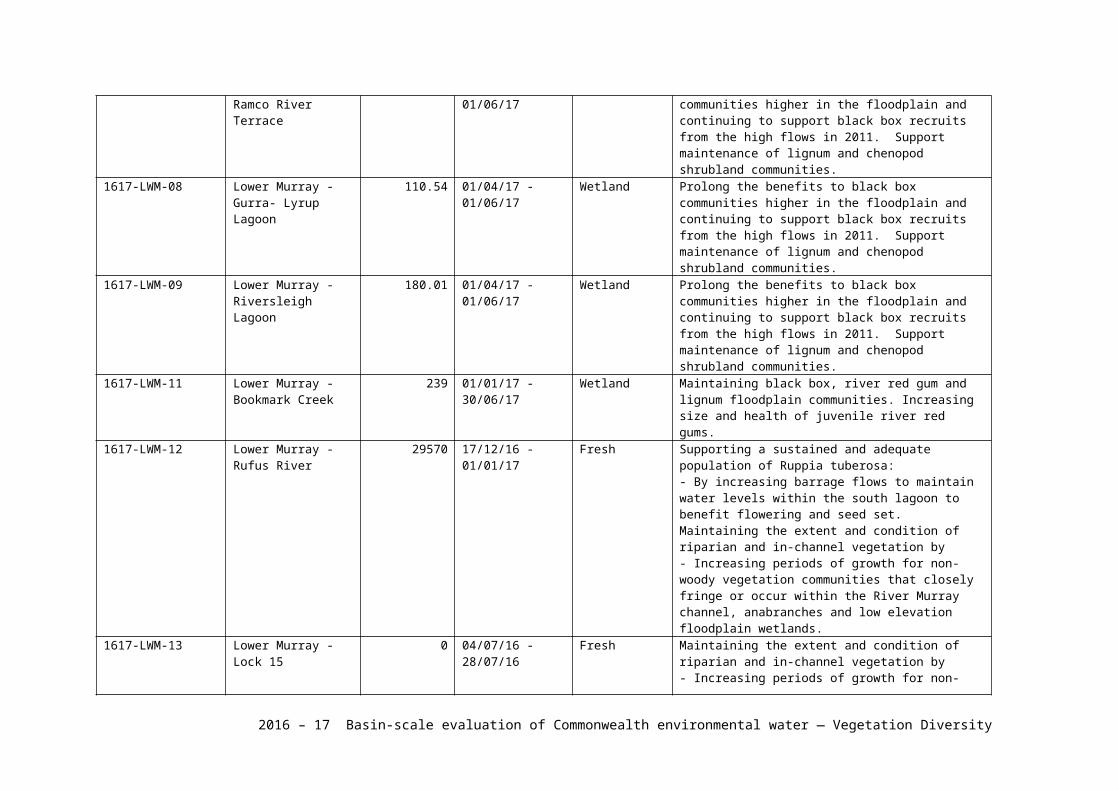
Sclerolaena muricata var. villosa + +
Sclerolaena stelligera +
Sclerolaena tricuspis + +
Senecio + + +
Senecio cunninghamii var. cunninghamii + +
Senecio glossanthus + +
Senecio hispidulus +
Senecio quadridentatus + + +
Senecio runcinifolius + + + + + + +
Sesbania cannabina +
Sesbania cannabina var. cannabina +
Sida +
Sida corrugata + + + +
Sida cunninghamii + +
Silene* + +
Sinapis* + +
Sisymbrium* + + +
Sisymbrium erysimoides* + +
Sisymbrium irio* + + + +
Solanum +
Solanum esuriale + +
Solanum nigrum* + + + + +
Sonchus asper* +
2016 – 17 Basin-scale evaluation of Commonwealth environmental water — Vegetation Diversity
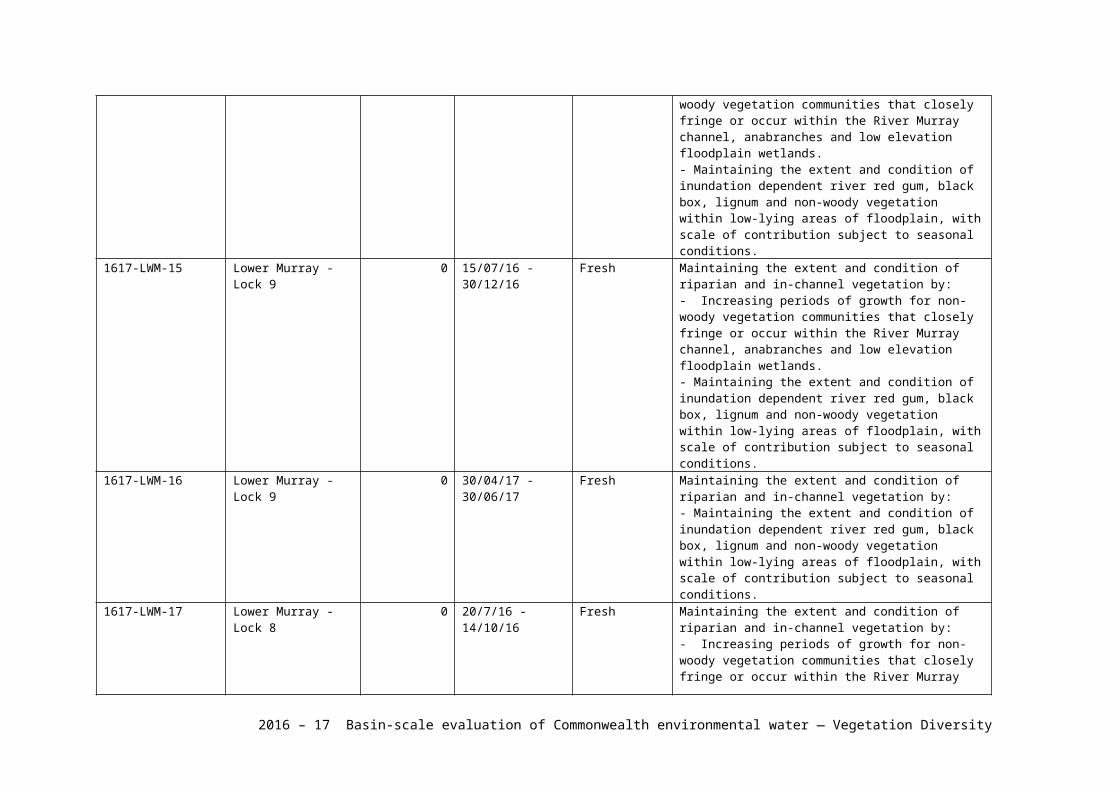
Sonchus oleraceus* + + + + + +
Spergularia marina +
Sporobolus caroli +
Sporobolus mitchellii +
Stellaria angustifolia + + + + +
Stellaria media* +
Stemodia florulenta + +
Swainsona + +
Taraxacum officinale* +
Tetragonia +
Tetragonia eremaea + +
Tetragonia tetragonoides +
Teucrium racemosum + +
Tragopogon porrifolius* +
Tribulus terrestris* + +
Triglochin +
Triglochin dubia + + +
Triglochin procera +
Trigonella suavissima +
Typha + + + +
Typha domingensis + + +
Urtica incisa* +
Urtica urens* +
2016 – 17 Basin-scale evaluation of Commonwealth environmental water — Vegetation Diversity
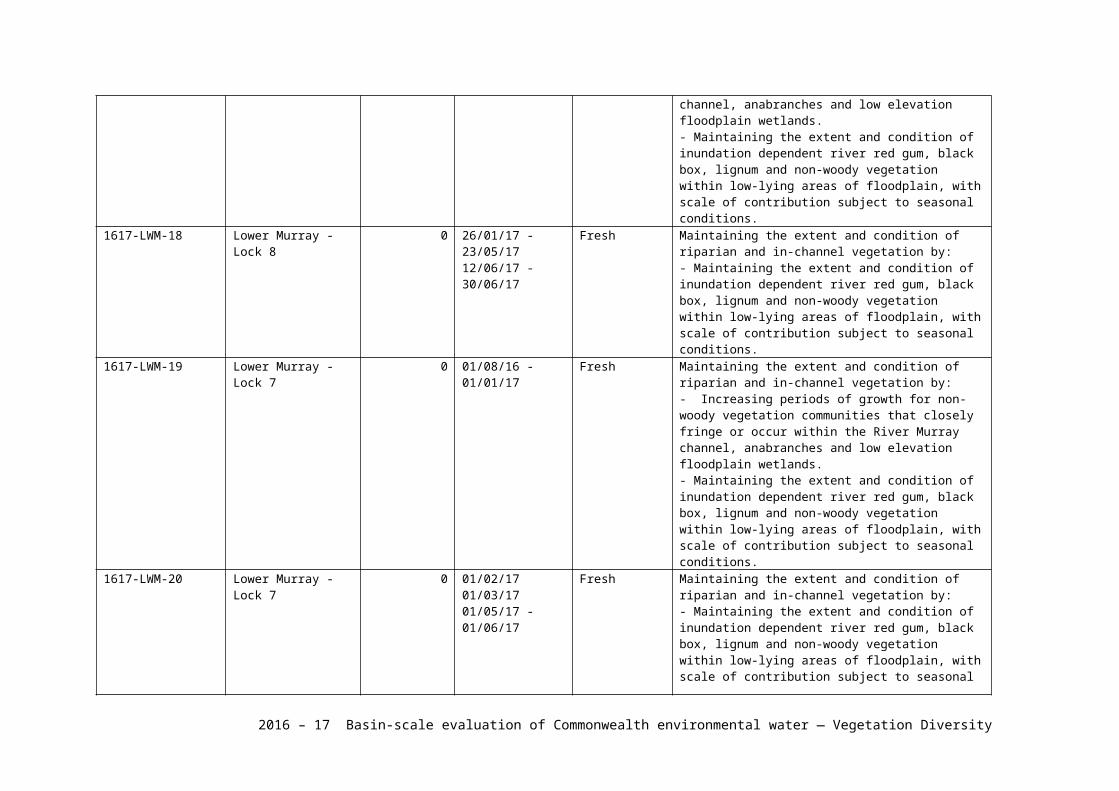
Utricularia gibba +
Vachellia farnesiana + +
Vallisneria gigantea +
Verbascum virgatum* + +
Verbena bonariensis* +
Verbena gaudichaudii + +
Verbena officinalis* + + + + +
Verbena supina* + + + +
Verbesina encelioides* +
Veronica peregrina* + +
Vittadinia cuneata + + + +
Vittadinia cuneata var. morrisii +
Wahlenbergia + +
Wahlenbergia communis + +
Wahlenbergia fluminalis + + +
Wahlenbergia gracilis + +
Walwhalleya proluta + +
Xanthium occidentale* + + + + + + +
Xanthium spinosum* + + + + + + +
Xerochrysum sp. +
Zygophyllum apiculatum + +
2016 – 17 Basin-scale evaluation of Commonwealth environmental water — Vegetation Diversity
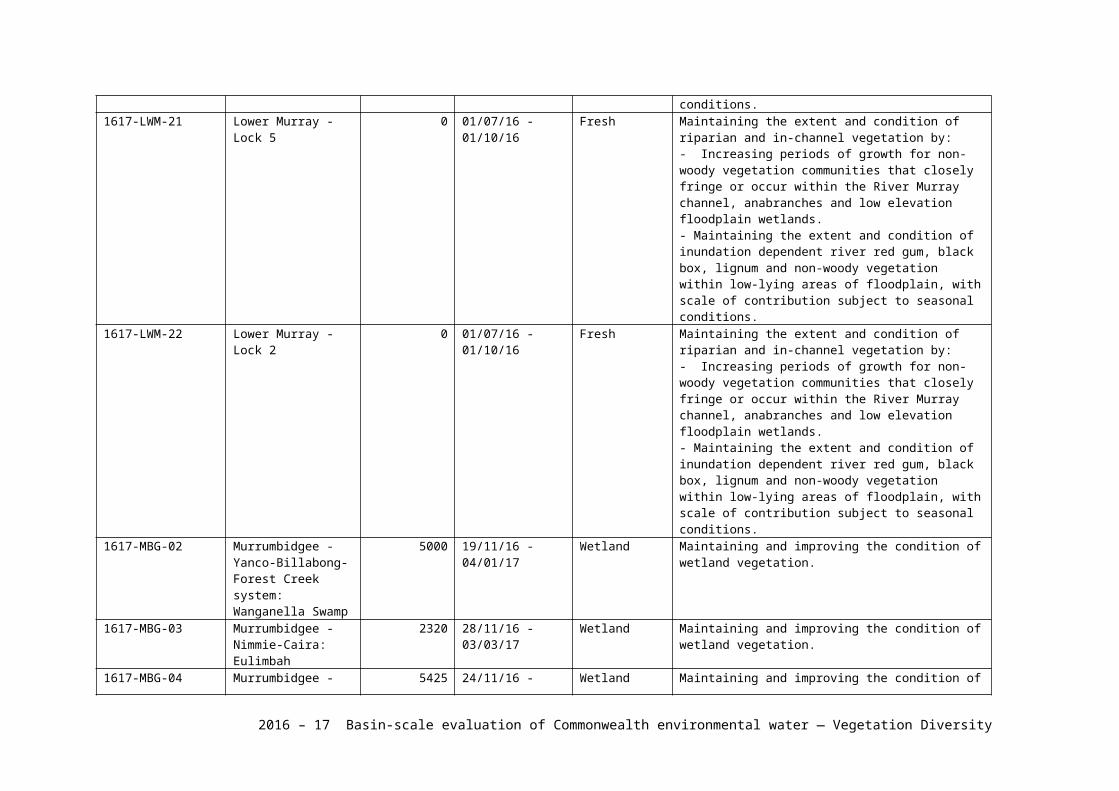
Appendix C: Progress Report towards correcting data issuesYear 3 (September 2017)
OverviewThis progress report has been prepared to provide a succinct update on the current status of the Vegetation Diversity Basin Matter with particular attention to the objectives outlined in the Foundation Report (Table C1). An update of the current status of the project in relation to these objectives and some of the limitations that have constrained this project to date is provided along with a proposed workplan for the remainder of the project and steps to overcome these limitations.
Current statusProgress to date on all three objectives has been significantly hindered by data problems that have compounded over time (Tables C1 and C2). These data problems have resulted from a combination of different data collection methods (i.e. divergence from standard methods and variation between Selected Areas) and inadequate data entry and QA/QC protocols in the MDMS. A summary of these problems is provided in Table C2.
Proposed workplanData collation
Since the 2018 annual forum, considerable progress has been made in identifying the causes of the data problems summarised in Table C2 and developing steps to resolve these. In particular, an agreed upon and thoroughly checked species list has now been collaboratively compiled and this will be used to constrain data entries in the MDMS. A protocol for adding new species to this list has also be specified in the revised data standard document. Other minor data management conventions (which had compounded to become major problems) have also been addressed in the new data standards which are to underpin the MDMS redesign (Table C2). M&E Providers have agreed to enter their data according to the new standards into Excel prior to availability of the revised MDMS so that the Vegetation Diversity team can progress with their other tasks. This data re-entry should ensure a comprehensive and relatively clean dataset without current problems concerning missing data.
Prior to this re-entry of data, however, it is critical that the problems associated with ‘Fragmented data standards’ (Table C2) are addressed collectively to ensure adequate understanding of the resolution and comparability of data entered into the MDMS and to inform its appropriate interpretation in the Basin scale analyses. This is to be addressed in a collaborative workshop planned for October 4-5 in Brisbane, to be supported by collaboration funds from both the Basin scale project and those provided to individual Selected Areas.
Data analyses and predictive modelling
Once a comprehensive and consistent dataset is available, the vegetation diversity Basin Matter team will be able to make progress against the objectives outlined in the Foundation Report (Table C1) as well as preparing the Year 4 Evaluation Report.
2016 – 17 Basin-scale evaluation of Commonwealth environmental water — Vegetation Diversity
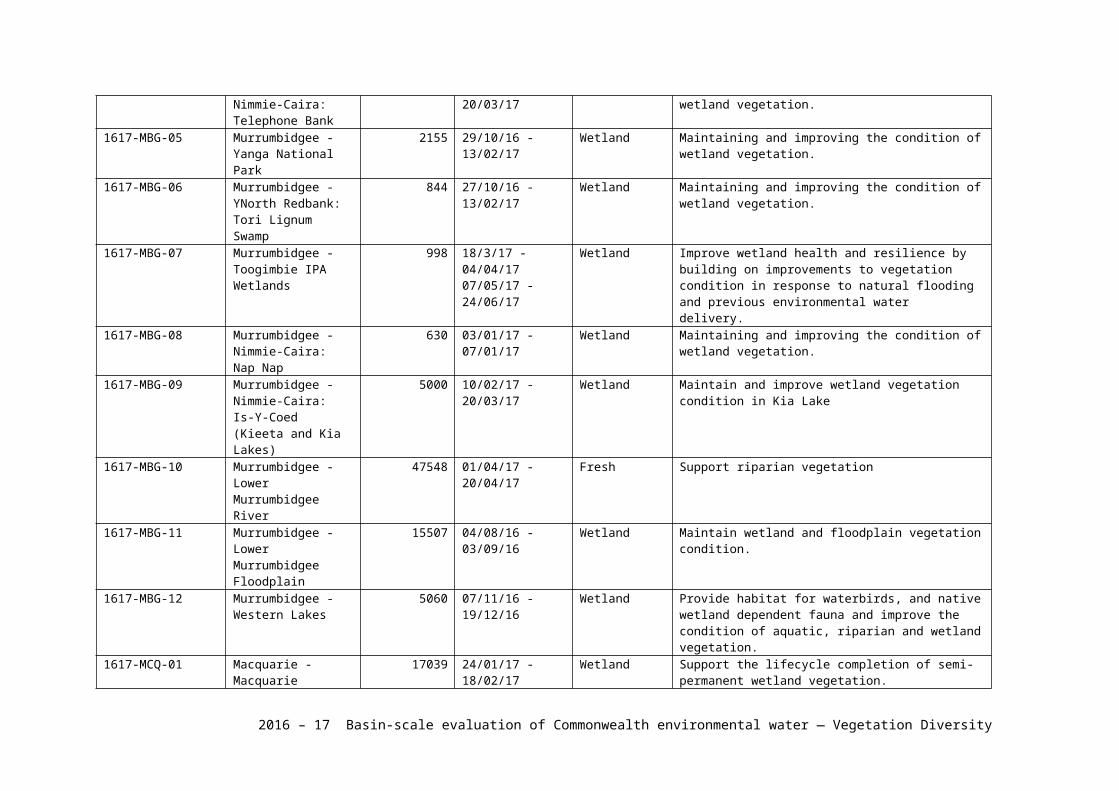
Year 4 Evaluation Report
Based on the availability of a complete and clean revised dataset, the Year 4 Evaluation Report will include analyses addressing the evaluation questions for vegetation diversity over 2017-18 as well as the four-year project duration (2014-18) at both an aggregated area scale and a basin scale.
In development of the Year 4 Evaluation Report, the project team will also seek to capitalise on the revised dataset by:
- Evaluating vegetation structure responses - Evaluating vegetation diversity responses in relation to ANAE wetland types- Investigating relationships between vegetation responses to flow and non-flow drivers
Model development
In addition to addressing some outstanding matters concerning the data structures, the aforementioned collaborative workshop will seek to further develop conceptual models of wetland vegetation community responses to watering regimes over short- (i.e. individual event) and longer (i.e. multiple years) time frames. The aim will be to develop a generic state and transition model of vegetation communities which might underpin the development of more quantitative modelling.
Revised data will be used to develop a range of predictive models to evaluate vegetation responses under counterfactual scenarios as well as in unmonitored areas. It is difficult to be specific regarding the final form of the modelling as this will be an iterative process which we have not yet commenced because of resourcing and the need to maximise benefits from our time allocation to modelling. Therefore, we are awaiting a suitable dataset before committing significant time to modelling.
2016 – 17 Basin-scale evaluation of Commonwealth environmental water — Vegetation Diversity
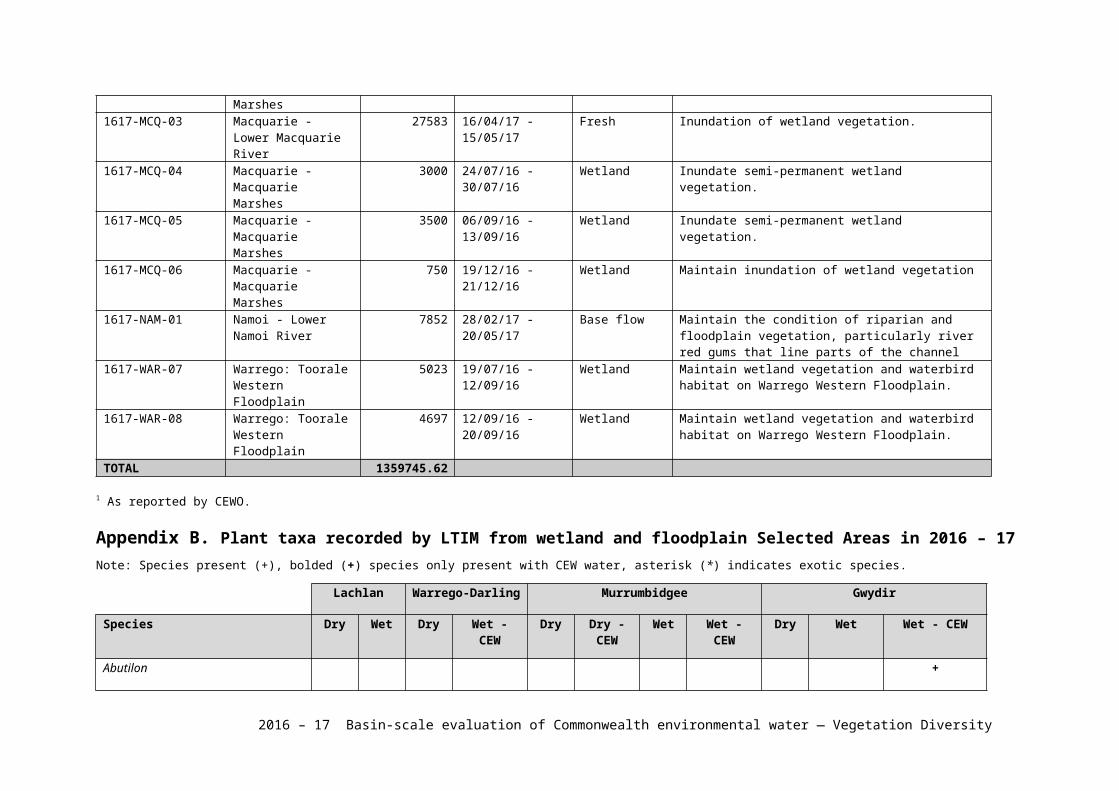
Table C1. Key components of evaluation approach (Section 3.2, Vegetation Diversity Foundation Report)
Component Description Current Status Steps forward
Foundational review Generation and compilation of databases of:
1.) Plant species responses to watering2.) Vegetation community responses to
watering
Incomplete datasets have constrained compilation of these databases.
On provision of revised datasets by M&E providers, we will compile:
1. A database of all plant taxa recorded in Selected Areas and their affinity to particular watering regimes
2. A database of vegetation community traits (e.g. species richness, cover etc.) under different watering regimes in relation to: i) sampling locations and ii) ANAE wetland types
Aggregated analysis Statistical analyses of aggregated LTIM vegetation data to determine 1.) plant species and 2.) vegetation community responses to watering across Selected Areas
As above This will be completed as part of the development of evaluation reports for Years 4 and 5.
Predictive models Predictive models of counterfactual and expected outcomes of watering for vegetation diversity
On provision of revised datasets by M&E providers, we will investigate: the development of:
1. A model relating plant species and vegetation community diversity to the diversity of watering regimes to evaluate responses under counterfactual scenarios within Selected Areas; and
2. A predictive model relating selected vegetation community responses to available predictor variables (i.e. hydrologic and non-flow drivers)
2016 – 17 Basin-scale evaluation of Commonwealth environmental water — Vegetation Diversity
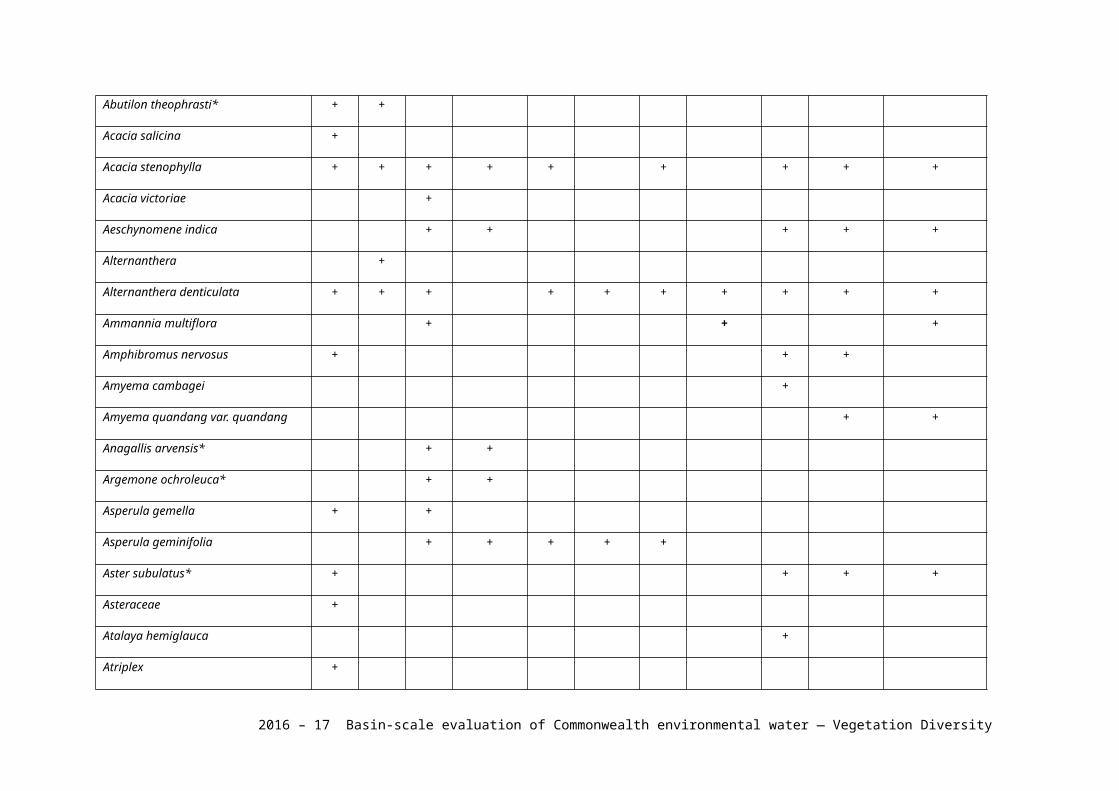
Table C2. Key problems, their consequences and proposed resolution relating to Vegetation Diversity data management
Problem Consequence Resolution 2017-2018
Database corrupting data on upload – duplicate records
Significant lost time aggregating data outside of Envirosys
Corrupt data still in MDMS Cleaned data has not been uploaded
Working with Shane Brookes to resolve issue long-term (in progress) Cleaned data revealed duplication also through multiple stratum being uploaded
and not assigned, working with Shane and Selected Area teams (in progress) Combining multi-year data imprudent as results would not be correct (affected Year
3 report but will be resolved for Year 4 report)Inadequate QA/QC
Missing sites Missing samples Variation in trip times not
accounted for
Significant unplanned overhead addressing issues
Delays to Basin matter reporting Reduced confidence in provider reports
Assigning a Trip ID within the MDMS will remove issues relating to some missing samples, in progress (completed)
Identifying missing data and having Selected Areas upload any that are missing (in progress)
Legacy data not updated
Y1 data not updated to Y2 standards
Hinders multi-year comparison. Significant overhead aligning data
among years
New changes in MDMS with complete re-upload of data will hopefully amend this (in progress)
Fragmented data standards Incompatible data Overhead to aggregate and identify
common data elements
Re-aligning data standards and understanding of key units within MDMS and consistency throughout Selected Areas data measures (in progress)
Developing an understanding of different methods and developing a consistency across the Selected Areas to determine the resolution of data for multi-year analysis (in progress)
Inconsistent use of species names
Overhead to align data from multiple Selected Areas for Basin evaluation
Duplicate records within Area data sets from spelling errors in species names
Negotiated a common list of species names for fish and vegetation (completed) Requires uploading to MDMS and enforced checking during uploads (waiting on
Envirosys upgrade)
2016 – 17 Basin-scale evaluation of Commonwealth environmental water — Vegetation Diversity
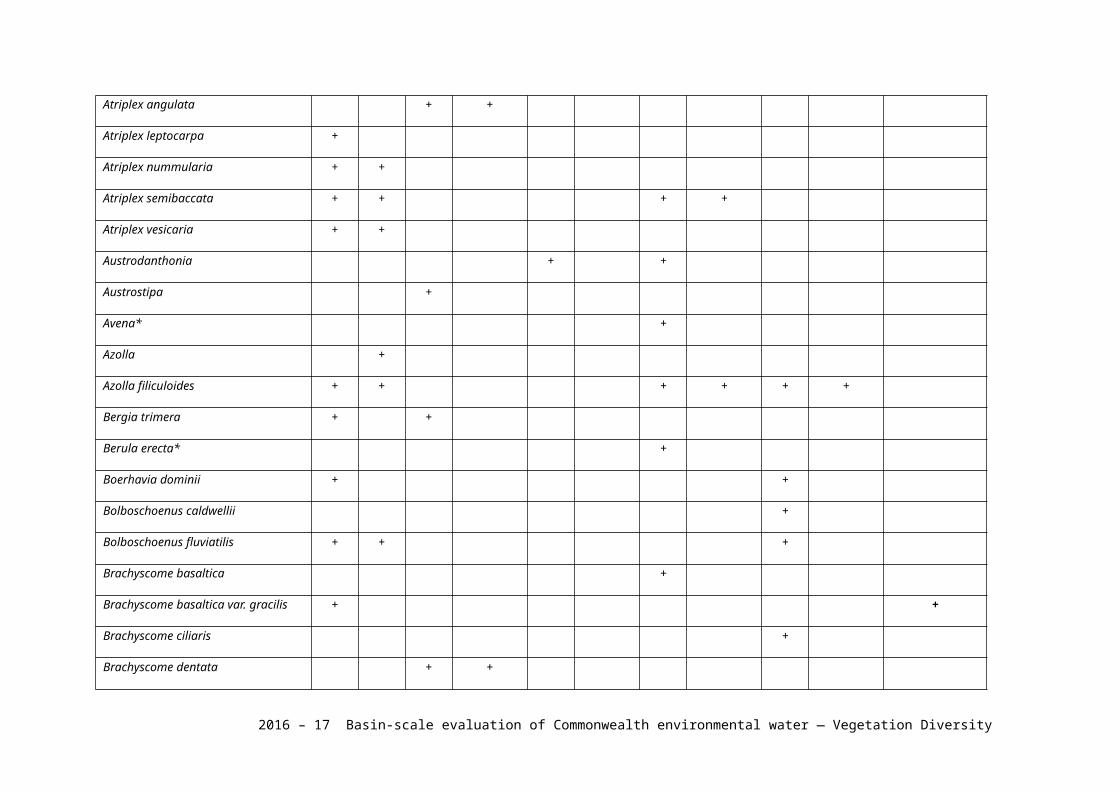
2016 – 17 Basin-scale evaluation of Commonwealth environmental water — Vegetation Diversity