Embed Size (px)
Citation preview

2017 NSBA SMALL BUSINESS REGULATIONS SURVEY
2016 YEAR-END ECONOMIC REPORT

NSBA 2016 YEAR-END ECONOMIC REPORT
2
© 2017 NSBA All Rights Reserved.
FOREWORDThe National Small Business Association (NSBA) is the nation’s first small-business advocacy organization, celebrating 80 years of small-business representation in Washington, D.C. Focused on federal advocacy and operating on a staunchly nonpartisan basis, NSBA conducts a series of surveys every year, including two Economic Reports.
The 2016 Year-End Economic Report shows a vastly improved small-business outlook. The number of small-business owners who say today’s economy is better than six months ago is nearly doubled, from 22 percent in July 2016 to 43 percent today, the highest this indicator has been since 2008. Furthermore, small businesses anticipating economic expansion in the next 12 months increased significantly, from 29 percent six months ago to 54 percent today.
There was a notable drop, continuing the downward trend we’ve seen in the last several years in the number of small-business owners who say economic uncertainty is a significant problem facing their business. This indicator is at its lowest point in nine years. Unfortunately, the cost of health insurance and regulatory and tax burdens remain at similar or higher levels than the previous survey in terms of significant challenges facing America’s small businesses.
When it comes to confidence in their own business, the findings showed positive gains, however not quite to the level as the positive gains in overall economic outlook. Eighty percent of small-business owners are confident in the future of their business—the highest this indicator has been in nine years—and 78 percent report they already are growing or anticipate growth this year.
Looking back over the past year, the number of small firms reporting growth in revenues was at its highest point in eight years. Unfortunately, there were just modest gains in hiring—today 25 percent report hiring over the last year whereas just 23 percent did so six months ago. Not surprising, given small-business owners inherent optimistic spirit: hiring projections for the coming 12 months was up 10 percentage points.
On a less-positive note, small-business access to capital remains stubbornly unchanged with just 69 percent of small firms able to get adequate financing. According to NSBA data from as far back as 1993, there is a clear correlation to a small-business owner’s ability to hire and his/her ability to get financing. This survey clearly shows that even the most positive outlook won’t make a dent in hiring if financing is elusive to small firms.
In addition to our general policy questions, we focused on several federal contracting questions and found that 60 percent of small federal contractors rated entering the federal marketplace moderate to very difficult. Furthermore, prime contractors receive the most timely payments with notable dips in payment times for subcontractors—something for which NSBA has been seeking a remedy for years.
On more broad policy topics, the number one thing small business wants Congress and the Administration to do is end the partisan gridlock and work together, followed closely by tax simplification, reduce health care costs and address the deficit.
The 2016 Year-End Economic Report was conducted on-line Jan. 16 through Feb. 8, 2017 among 1,426 small-business owners. We hope you find this report informative and useful. Please contact NSBA’s media office for inquiries at [email protected].
Sincerely,
Pedro Alfonso NSBA Chair Dynamic Concepts, Inc.
Todd McCrackenNSBA President and CEO

3
© 2017 NSBA All Rights Reserved.
NSBA 2016 YEAR-END ECONOMIC REPORT
In what region is your business located?
New England 5%Mid-Atlantic 19%Great Lakes 17%Farm Belt 6%South 26%Mountain 13%Pacific 14%
Which of the following best describes the industry or sector in which your business operates?
Construction 12%
Manufacturing 12%
Other Services (except Public Administration) 11%
Professional 10%
Scientific and Technical Services 9%
Health Care and Social Assistance 8%
Information (IT) 6%
Retail Trade 6%
Agriculture, Forestry, Fishing and Hunting 5%
Transportation and Warehousing 4%
Educational Services 3%
Wholesale Trade 3%
Arts, Entertainment, and Recreation 2%
Real Estate, Rental and Leasing 2%
Accommodation and Food Services 2%
Utilities 1%
Management of Companies and Enterprises 1%
Finance 1%
Administrative and Support 1%
Insurance 1%
Public Administration 1%
Waste Management and Remediation Services 1%
Which of the following best describes the structure of your business?
PARTNERSHIPSOLE PROPRIETORSHIP
LLCCORPORATION S-CORP
18%
33%
14%
3%
33%
How many total full-time personnel are currently employed by your business?
12%
50%
22%
14%
3%
0
1 to 5
6 to 19
20 to 99
100 to 499
DEMOGRAPHICS
What were your gross sales or revenues for your most recent fiscal year?
What was your total payroll for the most recent fiscal year?
Less than $100,000
Less than $100,000
$100,000 - $250,000
$100,000 to $500,000
$250,000 - $500,000
$500,000 to $1 Million
$500,000 - $1 Million
$1 - $5 Million
$1 - $5 Million
$5 - $25 Million
$5 - $25 Million
$25 - $75 Million
$25 - $75 Million
$75 - $150 Million
$75 - $150 Million
More than $150 Million
More than $150 Million
30%
46%
13%
25%
9%
11%
11%21%
12%
10%
3%
2%
1%
1%
0%
1%
2%
NSBA 2016 YEAR-END ECONOMIC REPORT
4
© 2017 NSBA All Rights Reserved.
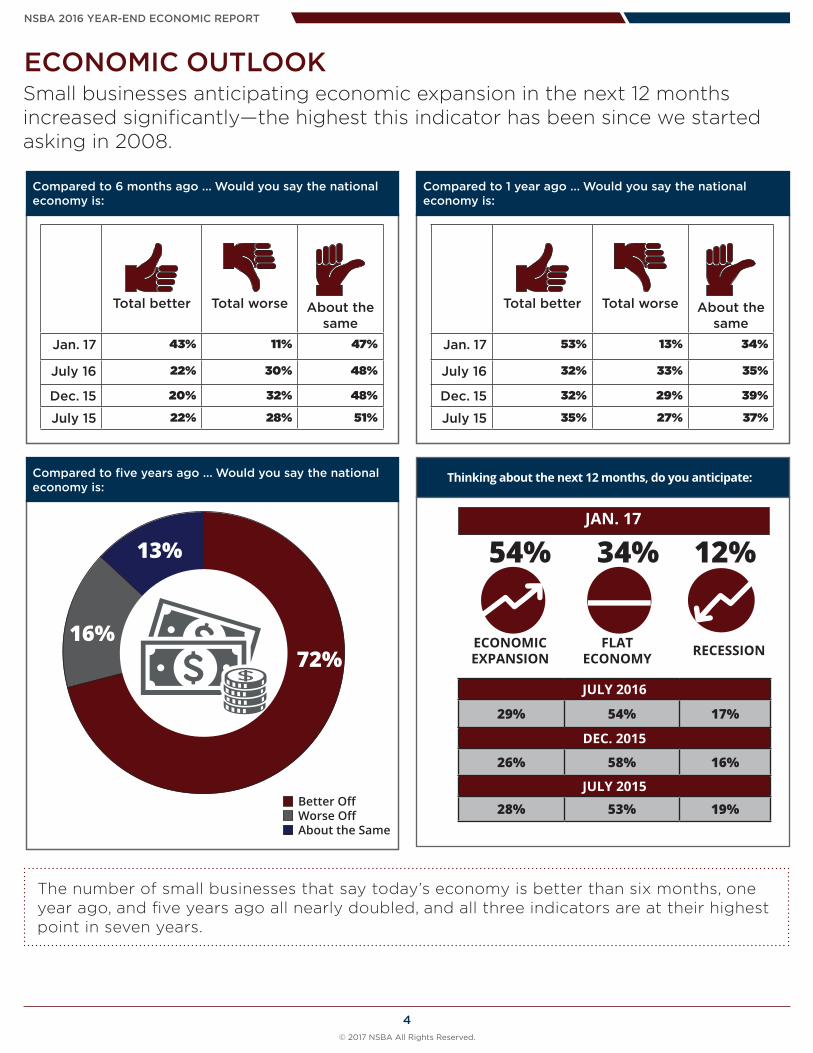
ECONOMIC OUTLOOKSmall businesses anticipating economic expansion in the next 12 months increased significantly—the highest this indicator has been since we started asking in 2008.
Total better Total worse About the same
Jan. 17 53% 13% 34%
July 16 32% 33% 35%
Dec. 15 32% 29% 39%
July 15 35% 27% 37%
Total better Total worse About the same
Jan. 17 43% 11% 47%
July 16 22% 30% 48%
Dec. 15 20% 32% 48%
July 15 22% 28% 51%
Compared to 1 year ago ... Would you say the national economy is:
Compared to 6 months ago ... Would you say the national economy is:
Compared to five years ago ... Would you say the national economy is:
Better OffWorse Off About the Same
72%16%
13%
Thinking about the next 12 months, do you anticipate:
54% 34% 12%
ECONOMICEXPANSION
FLAT ECONOMY RECESSION
JULY 2016
29% 54% 17%
DEC. 2015
26% 58% 16%
JULY 2015
28% 53% 19%
JAN. 17
The number of small businesses that say today’s economy is better than six months, one year ago, and five years ago all nearly doubled, and all three indicators are at their highest point in seven years.

5
© 2017 NSBA All Rights Reserved.
NSBA 2016 YEAR-END ECONOMIC REPORT
ECONOMIC OUTLOOKSmall-business outlook on the overall economy is vastly improved from just six months ago.
The number of small businesses that say economic uncertainty is a significant problem facing their business is at its lowest point in nine years.
There was a jump in the number of small businesses anticipating rising interest rates—echoing recent Fed increases as well as underscoring an improving economy.
What are the three most significant challenges to the future growth and survival of your business? (Please check the three most important challenges)
Jan. 17 July 16 Dec. 15 July 15
Economic uncertainty 44% 49% 49% 51%Cost of health insurance benefits 30% 28% 36% 34%
Regulatory burdens 28% 29% 33% 31%
Decline in customer spending 25% 29% 34% 30%
Federal taxes 23% 19% 24% 23%
Lack of qualified workers 22% 19% 21% 26%
Lack of available capital 22% 21% 19% 20%
Partisan gridlock in D.C. 15% 15% 14% 14%
Cost of employee salaries 14% 13% 15% 14%
State and local taxes 13% 13% 12% 12%
Growing national debt 9% 9% 12% 12%
Cost of technology 8% 9% 8% 7%
Cost of employee benefits 7% 8% 6% 8%
Cost of training workers 5% 5% 5% 4%
Foreign competition 5% 5% 6% 6%
No major challenges 4% 5% 3% 2%
Do you foresee any of the following issues being a problem for your business in the coming 12 months?
Jan. 17 July 16
Inflation 32% 32%
Deflation 3% 6%
Rising interest rates 34% 24%
None of the above 49% 53%

NSBA 2016 YEAR-END ECONOMIC REPORT
6
© 2017 NSBA All Rights Reserved.
SMALL BUSINESS CONFIDENCEWhile confidence in their own business saw notable gains—and continued the last eight-year trend—these gains weren’t as large as the positive movement in small-business owners’ economic outlook.
From a financial perspective, how do you feel right now about the future for your business?
Do you believe there will be growth opportunities for your business…
Jan. 17 July 16 Dec. 15 July 15
Very confident 34% 28% 23% 26%
Somewhat confident 46% 44% 53% 46%
Not very confident 15% 20% 18% 21%
Not at all confident 5% 8% 7% 8%
Jan. 17 July 16 Dec. 15 July 15
In the next 3 months 11% 7% 4% 7%
In the next 3 to 6 months 18% 14% 14% 12%
In the next 6 to 12 months 31% 33% 32% 28%
None in the coming year 22% 30% 33% 33%
My business is already growing 19% 17% 17% 20%
Eighty percent of small-business owners are confident in the future of their business—the highest this indicator has been in nine years.
Sixty percent of small businesses anticipate growth for their firm in the coming year, and a total of 78 percent report they already are growing or anticipate growth this year.
7
© 2017 NSBA All Rights Reserved.
NSBA 2016 YEAR-END ECONOMIC REPORT
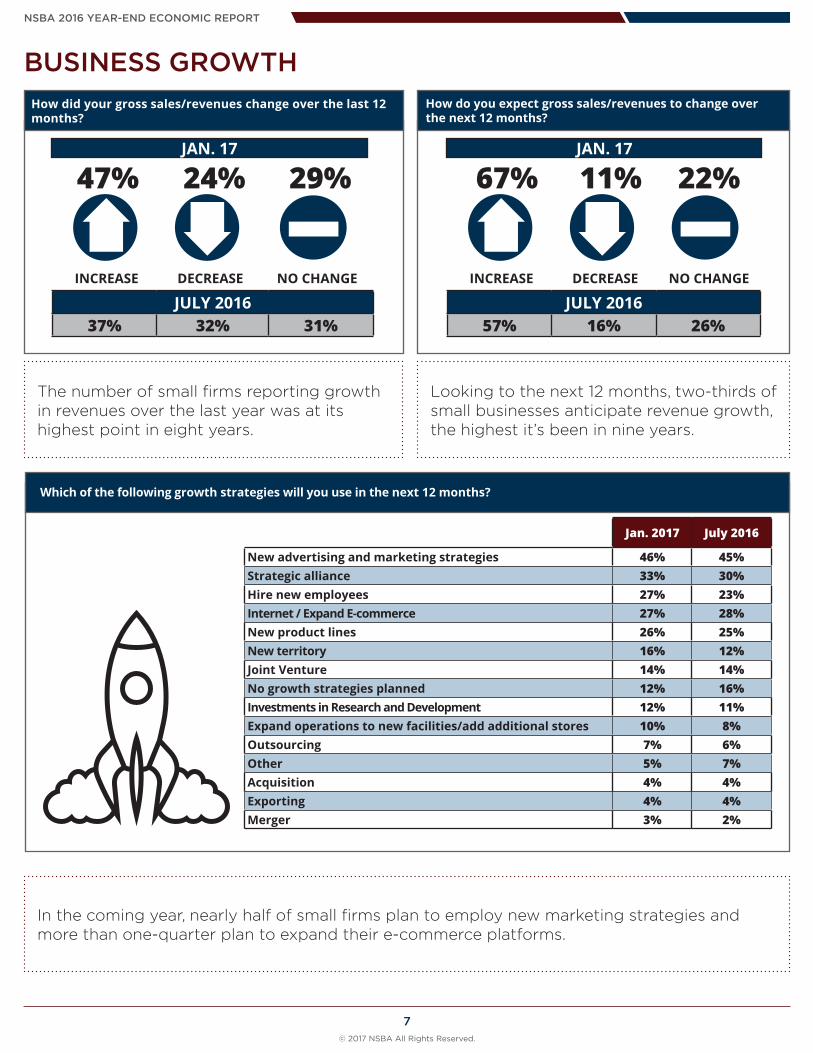
The number of small firms reporting growth in revenues over the last year was at its highest point in eight years.
In the coming year, nearly half of small firms plan to employ new marketing strategies and more than one-quarter plan to expand their e-commerce platforms.
Looking to the next 12 months, two-thirds of small businesses anticipate revenue growth, the highest it’s been in nine years.
BUSINESS GROWTHHow did your gross sales/revenues change over the last 12 months?
How do you expect gross sales/revenues to change over the next 12 months?
47% 67%24% 11%29% 22%
INCREASE INCREASEDECREASE DECREASENO CHANGE NO CHANGE
JULY 201637% 32% 31%
JULY 201657% 16% 26%
JAN. 17 JAN. 17
Which of the following growth strategies will you use in the next 12 months?
Jan. 2017 July 2016
New advertising and marketing strategies 46% 45%Strategic alliance 33% 30%Hire new employees 27% 23%Internet / Expand E-commerce 27% 28%New product lines 26% 25%New territory 16% 12%Joint Venture 14% 14%No growth strategies planned 12% 16%Investments in Research and Development 12% 11%Expand operations to new facilities/add additional stores 10% 8%Outsourcing 7% 6%Other 5% 7%Acquisition 4% 4%Exporting 4% 4%Merger 3% 2%

NSBA 2016 YEAR-END ECONOMIC REPORT
8
© 2017 NSBA All Rights Reserved.
Although there were just modest gains in hiring over the past 12 months, there was a notable gain among small-business owners projecting hiring in the coming 12 months, up from 33 percent six months ago to 43 percent today.
In the last year, half of all small-business owners increased employee wages and more than half project further salary increases in the coming year.
JOB GROWTH
How did the number of employees change over the last 12 months?
How do you expect the number of employees to change over the next 12 months?
How did employee compensation change over the last 12 months?
How do you expect employee compensation to change over the next 12 months?
25%
43%
50%
57%
14%
5%
9%
5%
61%
53%
41%
38%
INCREASE
INCREASE
INCREASE
INCREASE
DECREASE
DECREASE
DECREASE
DECREASE
NO CHANGE
NO CHANGE
NO CHANGE
NO CHANGE
JULY 201623% 16% 61%
JULY 201633% 8% 58%
JULY 201644% 12% 45%
JULY 201651% 6% 44%
JAN. 17
JAN. 17
JAN. 17
JAN. 17

9
© 2017 NSBA All Rights Reserved.
NSBA 2016 YEAR-END ECONOMIC REPORT
According to NSBA data from as far back as 1993, there is a clear correlation to a small-business owner’s ability to hire and his/her ability to get financing.
Despite a significant shift in outlook, small-business access to capital remains stubbornly unchanged with just 69 percent of small firms able to get adequate financing.
SMALL BUSINESS FINANCING
`Correlation between financing and employment
80%
70%
60%
50%
40%
30%
20%
10% 0%
Increased EmploymentAble to get financing
19931994
19951996
19972000
20072008
20092010
20112012
20132014
2015Ju
ly 16
Jan. 1
7
Is your business able to obtain adequate financing?
69% 31%
YES NO
JULY 201669% 31%
DEC. 201573% 27%
JULY 201569% 31%
JAN. 2017
For bank loans that are currently outstanding, which of the following has occurred in the last twelve months?
Terms have become less favorable to your business. 11%
Terms have stayed the same 31%
Terms have become more favorable to your business 3%
Do not have outstanding loans. 56%

NSBA 2016 YEAR-END ECONOMIC REPORT
10
© 2017 NSBA All Rights Reserved.
SMALL BUSINESS FINANCINGWhat types of financing has your company used within the past 12 months to meet your capital needs?
Jan. 2017
July 2016
Bank Loan (Dec. 12=total of 3 options below) 49% 48%
- Large Bank Loan 15% 14%
- Community Bank Loan 14% 14%
- Credit Union Loan 3% 3%
Credit cards 32% 31%
Earnings of the business 30% 33%
Used no financing 30% 29%
Private loan (friends or family) 15% 17%
Vendor credit 13% 13%
Leasing 6% 5%
Venture capital/Angel investors 4% 3%
Small Business Administration (SBA) loan 3% 3%
Online or non-bank lender 2% 2%
Private placement of debt 2% 2%
Private placement of stock 2% 1%
State/Regional Loan and Incentive Programs 2% 3%
Crowdfunding 1% 1%
Selling/pledging accounts receivable 1% 1%
Other 7% 6%
Community bank lending remains stubbornly low given their past levels of small-business lending.
Sixteen percent of small firms were forced to lay off employees as a direct result of their inability to garner financing.
Have you experienced any of the following changes on any of your lines of credit or on your credit cards in the last six months?
18% 5% 77%
INCREASE DECREASE NO CHANGE
JAN. 2017
If capital availability is a problem for your business, what is the effect on your operations?
Jan. 2017 July 2016
Not a problem / No effects 53% 48%
Unable to grow business or expand operations
36% 41%
Reduced the number of employees 16% 20%
Unable to finance increased sales 14% 17%
Reduced benefits to employees 10% 13%
Unable to increase inventory to meet demand
10% 11%
Closed stores or branches 3% 2%
Other 4% 4%
11
© 2017 NSBA All Rights Reserved.
NSBA 2016 YEAR-END ECONOMIC REPORT
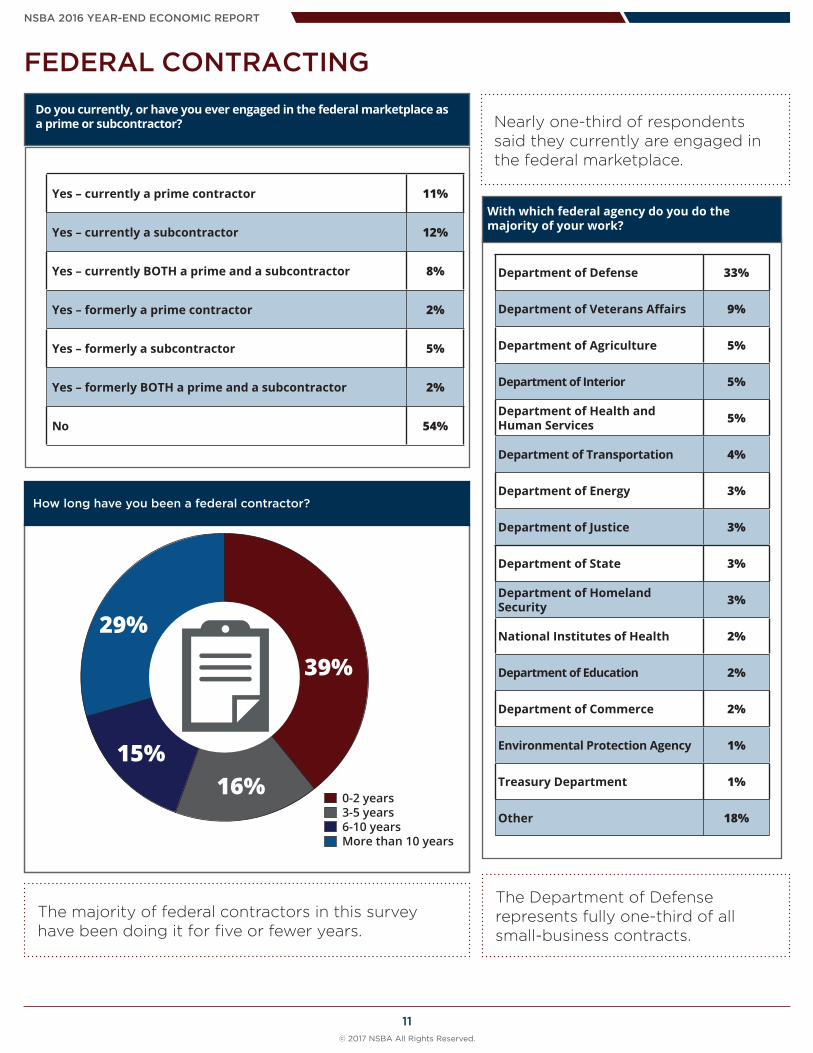
How long have you been a federal contractor?
FEDERAL CONTRACTINGDo you currently, or have you ever engaged in the federal marketplace as a prime or subcontractor?
Yes – currently a prime contractor 11%
Yes – currently a subcontractor 12%
Yes – currently BOTH a prime and a subcontractor 8%
Yes – formerly a prime contractor 2%
Yes – formerly a subcontractor 5%
Yes – formerly BOTH a prime and a subcontractor 2%
No 54%
Nearly one-third of respondents said they currently are engaged in the federal marketplace.
The Department of Defense represents fully one-third of all small-business contracts.
The majority of federal contractors in this survey have been doing it for five or fewer years.
With which federal agency do you do the majority of your work?
Department of Defense 33%
Department of Veterans Affairs 9%
Department of Agriculture 5%
Department of Interior 5%
Department of Health and Human Services 5%
Department of Transportation 4%
Department of Energy 3%
Department of Justice 3%
Department of State 3%
Department of Homeland Security 3%
National Institutes of Health 2%
Department of Education 2%
Department of Commerce 2%
Environmental Protection Agency 1%
Treasury Department 1%
Other 18%0-2 years3-5 years6-10 yearsMore than 10 years
29%
39%
15%16%

NSBA 2016 YEAR-END ECONOMIC REPORT
12
© 2017 NSBA All Rights Reserved.
On a scale of 1-4 with 4 being the MOST difficult, how difficult was it for you to get into the federal contracting arena?
FEDERAL CONTRACTINGApproximately what percentage of your business is composed of federal contracting?
0-5 percent 48%
6-10 percent 8%
11-20 percent 7%
21-50 percent 11%
More than 50 percent 26%
Sixty-three percent of federal contractors say that contracting accounts for less than 20 percent of their total business.
When asked to rate 1-4 with 4 being the most difficult, the average federal contractor gave “entering the federal marketplace” a 3.
The small-business owner him/herself overwhelmingly handles the firm’s federal contracting work. No surprise, then that 60 percent rated entering the federal marketplace moderately to very difficult.
More than one-in-five subcontractors are given less than one week to make changes to their existing contracts.
Who in your business oversees your federal contracting work?
Please select how timely you receive your payment from the following various sources.
Please select on average, how much time you typically are given to make requested adjustments to your contracts with the following various sources.
I do 84%A member of my staff does 12%I outsource this work 1%Other 4%
Within 30 days
30-60 days
60-90 days
90-120 days
Federal government agency 51% 29% 11% 6%
Prime contractor 38% 34% 15% 7%
First-tier subcontractor 30% 40% 16% 8%
Less than 1 week
1 to 2 weeks
3 to 4 weeks
5 to 8 weeks
Federal government agency
18% 20% 19% 7%
Prime contractor 22% 25% 18% 6%
First-tier subcontractor 18% 23% 22% 5%
Not difficultSomewhat difficultModerately difficultVery difficult
35%
17%
25%
23%

13
© 2017 NSBA All Rights Reserved.
NSBA 2016 YEAR-END ECONOMIC REPORT
PUBLIC POLICY
The number one thing small business wants Congress and the Administration to do: end the partisan gridlock and work together.
Which one of the following issues do you believe Congress and President Trump’s administration should address first?
End the partisan gridlock and work together 17%
Simplify the tax system 14%
Rein-in costs of health care reform 13%
Reduce the national deficit 13%
Reduce the tax burden 9%
Reduce the regulatory burden on businesses 8%
Increase small business access to capital 8%
Other 7%
Improve education to provide a qualified domestic workforce 4%
Reform the immigration system 2%
Reform the federal contracting system 1%
Enact a comprehensive energy policy 1%
Remove barriers to small-business exporting 1%
Tort reform 1%
Implement cybersecurity procedures and/or standards 1%
Credit card reform (that includes SB) 1%
Reduce the burden of unfair labor laws 1%
Which of the following deficit-reducing proposals would you support? (Check all that apply)
Reform and reduce entitlement spending 48%
Targeted cuts for certain federal agencies and programs 44%
Greater authority of the administration to reduce Congressionally-approved spending 34%
A tax increase for those making more than $250,000 annually 30%
Eliminate all tax credits and deductions in conjunction with dramatically lower income tax rates 26%
A combination of tax increases and spending cuts 26%
Eliminate certain tax credits and deductions—even those which may benefit my business 23%
An across-the-board budget cut for federal agencies 22%
Other 11%

NSBA 2016 YEAR-END ECONOMIC REPORT
14
© 2017 NSBA All Rights Reserved.
CONCLUSION
Small employers comprise 99.7 percent of all employer firms in the U.S. One in two workers in the private workforce run or work for a small business, and one in four individuals in the total U.S. population is part of the small-business community.
Small businesses simply need an environment to grow and create jobs: economic stability; predictability, fairness and transparency in taxes and health care costs; common-sense regulations that don’t unfairly disadvantage small firms; and lawmakers willing to tackle the major issues facing our country, and to do so together.
Please click here for more information on NSBA’s priority policies.
For past Economic Reports and other issue-specific surveys from NSBA, please visit our Surveys & Reports page on the NSBA website.
For questions, interviews or to reprint any or all of this report, please contact the NSBA public affairs department at [email protected] or 202-552-2904.
The 2016 Year-End Economic Report was conducted on-line Jan. 16 through Feb. 8, 2017 among 1,426 small-business owners—both members and nonmembers of NSBA—representing every
industry in every state in the nation.
METHODOLOGY

2017 NSBA SMALL BUSINESS REGULATIONS SURVEY
2016 YEAR-END ECONOMIC REPORT