Embed Size (px)
Citation preview


2 0 1 6 A n n u a l R e p o r t
Table ofContents
Corporate Profile 7
Financial Highlights 8
Message from the Chairman
10
Message from the President
12
Review of Operations 14
Corporate Governance 23
Recognition 32
Board of Directors 34
Statement of Management’s
Responsibility for Financial Statements
42
43 Report of Independent Auditors
46 Statements of Financial Position
47 Statements of Profit or Loss
49 Statements of Comprehensive Income
50 Statements of Changes in Equity
51 Statements of Cash Flows
53 Notes to Financial Statements
116 Management Directory
117 Products and Services
118 Corporate Information

Rural Access,Nationwide
Reach

Corporate ProfileOne Network Bank, Inc. (A Rural Bank) operates as a subsidiary of BDO Unibank, Inc., the largest bank in the Philippines. ONB provides a wide range of financial products and services including loans, deposits, cash management, remittances, and bills payment in unserved and underserved areas.
ONB’s network of branches and automated teller machines, most of which are located in countryside Mindanao, is complemented by access to BDO’s nationwide network of over 900 branches and more than 3,000 ATMs. Expansion of the network is an ongoing endeavor, with a goal of covering more of the Bank’s target market segments.
The corporate governance practices of the Bank are consistent with that of its Parent Bank: fairness, accountability, transparency, integrity, and performance. The members of the Board of Directors are all professionals with competencies and experience in the disciplines of banking, accounting, economics, law, agri-business, and development finance.
With the support and guidance of its parent bank, ONB aims to provide more innovative and convenient banking solutions to its growing customer base.

Financial Highlights

9
Operating Results( IN MILLION PESOS)
2016 2015 2014
Net Income After Tax 60 399 462
Total Comprehensive Income 27 139 574
Resources 27,119 25,660 29,619
Net Loans and Receivables 21,239 20,517 20,906
Deposit Liabilities 22,837 21,462 18,046
Stockholders’ Equity 3,746 3,773 3,632
Selected Financial Ratios
2016 2015 2014
Return on Equity 1.60% 10.76% 13.81%
Return on Assets 0.23% 1.44% 1.69%
Capital Adequacy Ratio 12.08% 15.42% 12.88%
Intermediation Ratio 95% 96% 116%
Liquidity Ratio 14% 14.30% 26.46%
Expense to Gross Income Ratio 80% 69% 71%
Non-Performing Loans (NPL) 6.53% 3.99% 3.08%
Non-Performing Assets (NPA) 5.29% 3.32% 2.26%

10
Message from the Chairman

11
To our shareholders, clients, and colleagues,
I am pleased to report that your Bank delivered a respectable performance in 2016 on the back of strategic initiatives implemented following its acquisition by BDO Unibank, Inc. (BDO).
We integrated ONB’s support and delivery systems with BDO to achieve operational efficiency and to streamline the workflow in terms of branch operations, accounting, compliance, risk management, and IT infrastructure.
We likewise implemented a rebranding strategy, leveraging on BDO’s brand recognition and reputation, to raise the visibility of the Bank and bring new banking capabilities to the communities where we operate.
Following these transformational initiatives, we embarked on a regional expansion to boost our distribution network and expanded our lineup of banking products and solutions, making ONB more accessible and relevant to its target markets.
The outlook for 2017 remains optimistic. We continue to see a robust demand for salary loans and expansion opportunities in the SME space. We will embark on new business models for microfinance and continue to leverage on the institutional synergy between ONB and BDO in carrying out our expansion program.
Let me close by extending my gratitude to the members of the Board and to the management team for their perseverance and commitment in completing a speedy, successful integration, and to our clients for their continued trust and confidence in the Bank.
Sincerely,
Nestor V. Tan Chairman

12
Message from the President

13
Dear clients and shareholders,
Over the last 12 months, we laid down the essential foundations for a strong, strategic, and sustainable growth.
We took concrete steps toward streamlining our workflow and processes with BDO. We initiated improvements in the delivery of products and services, adopted a calculated credit expansion, and maintained a more prudent provisioning approach. We also enhanced our banking operations on the back of system upgrades and process alignment with BDO, thus providing customers with added convenience in terms of faster and more efficient product and service delivery. As a result, we stood resilient amid challenging business conditions. We undertook initiatives to raise brand awareness and sustain growth metrics. We opened 17 new branches and rolled out 183 new ATMs, implemented rebranding across all platforms, launched a national print ad campaign, and invited valued clients to a night of appreciation that also set the backdrop for unveiling a stronger, BDO-powered ONB.
In addition to these initiatives, we conducted the BDO Culture Orientation Program to create a workplace that motivates employees to do their best, enhancing their capability to be innovative and competitive for them to actively take part in the Bank’s long-term growth.
With total assets at P27.12 billion and equity at P3.75 billion, One Network Bank remains to be the country’s leading rural bank. We increased our loan portfolio to P21.60 billion, supported by the substantial 19% increase in low-cost deposits. However, our bottom line dipped by 85% due to integration costs, alignment with BDO’s more conservative provisioning policies, and investments for future growth.
Moving ahead, we remain bullish as we complete the Bank’s integration and prepare the foundation for future growth. Initiatives are underway to expand the Bank’s reach, tap new market segments, and enhance bank products and solutions.
We would like to acknowledge the engagement of our personnel and thank them for their efforts in working toward the Bank’s success, and our clients for their continued trust, the hallmark of our operations.
Yours truly,
Ramon t. MilitarOfficer-in-Charge

14
Review of OperationsFinancial Performance
The Bank’s financial performance demonstrated resilience amid a challenging business environment. Loan portfolio expanded 5% to P21.60 billion. Deposits increased by 6% to P22.84 billion, driven by the 19% surge in low-cost deposits.
Interest expense saw a 30% decline owing to the strong growth in CASA. Net interest income fell 9% to P1.24 billion, non-interest income dipped 4% to P1.15 billion. Following a more prudent and calculated approach to impairment provisioning, the Bank experienced an 85% drop in net income to P60 million.
Equity slipped by 1% to P3.75 billion while total assets rose 6% to P27.12 billion. Nonperforming loans ratio and nonperforming assets stood at 6.53% and 5.29%, respectively, still better than industry levels.

Committed toServing TheUnderserved
16
Operational Highlights
DEPOSIT-TAKING
The success of ONB’s deposit-taking business is anchored on a legacy of bringing modern financial services and solutions closer to the unbanked and underbanked segments. Amid challenges in setting up offices in regions outside of Mindanao, the Bank ended its first year of nationwide expansion with 17 new branches to increase its branch count to 122 — the largest among rural banks. This expanded branch network continues to serve as the backbone for its growth momentum. The Bank posted a 6% increase in total deposits to P22.84 billion, driven by the 19% expansion in low-cost Checking Account/Savings Account (CASA) deposits and 9% reduction in higher-cost Time Deposits. Consequently, the CASA ratio rose to 62% in 2016 from 55% in 2015.
Operating as the primary vehicle for BDO to deliver its services to unserved areas, ONB will open more branches in 2017. The bigger branch network, supported by systems aligned with BDO, paves the way for the Bank to grow its business while enabling more of its target market segments to enjoy seamless transactions between urban centers and growth areas.
TREASURY
Efficient and proactive management of day-to-day cash flow and liquidity of funds underpinned the performance of the Bank’s treasury business. The Treasury Group sustained its efforts to maintain and create profitable opportunities for business clients through competitive pricing of deposits while meeting fund requirements for its
lending activities. Moving forward, Treasury operations will focus on supporting the Bank’s expansion program and its introduction of new microfinance strategies.
LENDING
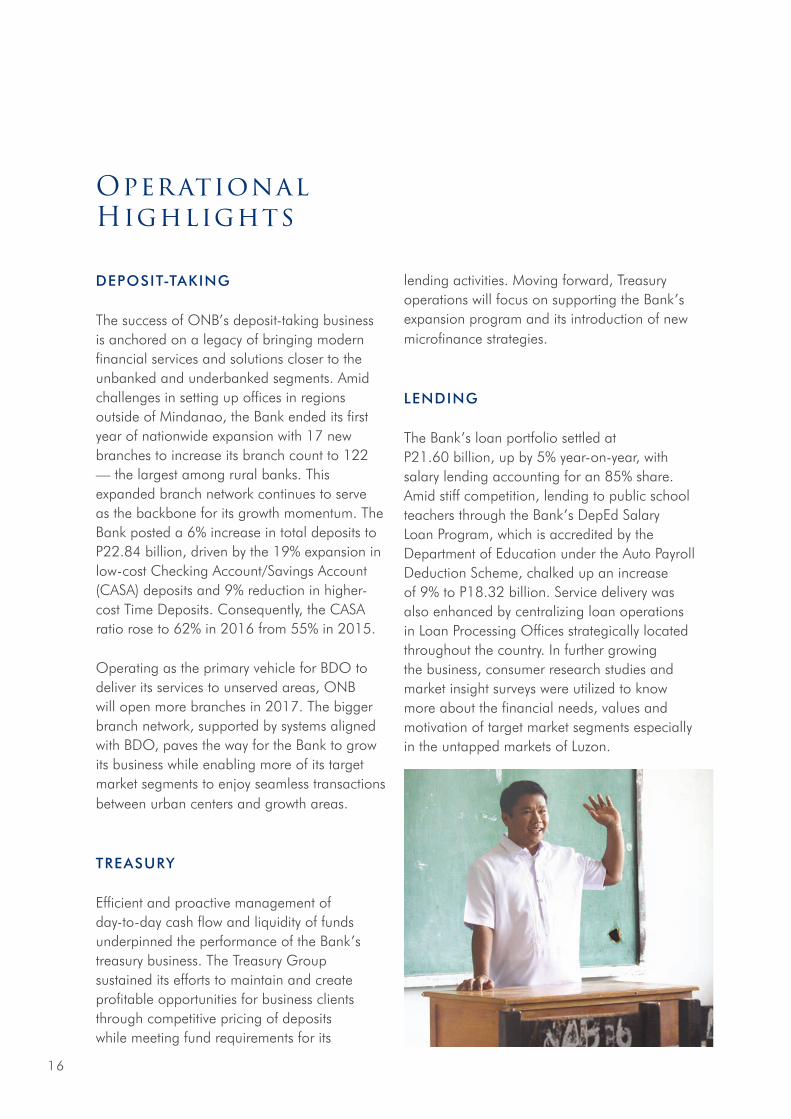
The Bank’s loan portfolio settled at P21.60 billion, up by 5% year-on-year, with salary lending accounting for an 85% share. Amid stiff competition, lending to public school teachers through the Bank’s DepEd Salary Loan Program, which is accredited by the Department of Education under the Auto Payroll Deduction Scheme, chalked up an increase of 9% to P18.32 billion. Service delivery was also enhanced by centralizing loan operations in Loan Processing Offices strategically located throughout the country. In further growing the business, consumer research studies and market insight surveys were utilized to know more about the financial needs, values and motivation of target market segments especially in the untapped markets of Luzon.

17
review of operations
Lending to institutions, small and medium enterprises, and agribusinesses stood at P3.28 billion, representing an 11.5% decline from the previous year, as internal processes were streamlined toward a more calculated approach on credit expansion to maintain asset quality. Nonperforming loans ratio stood at 6.53%, still better than the rural banking industry percentage of 10.26%.
NON-INTEREST INCOME SOURCES
Services and delivery systems were upgraded and aligned with BDO, thus enabling faster response to the increasing demand for fund transfers, deposit pickup, cash delivery, and payroll services. To spearhead and manage operations in cash management for personal and business transactions, the Transaction Banking Department was established during the year.
Significant improvements in the Bank’s corporate products were anchored on the robust technological infrastructure brought in by BDO that allowed the expansion of cash management platforms and channels best suited for companies with operations in the countryside. Clients now benefit from a faster and more accessible Business Online Banking system as well as an easier documentation process for cash management.
With this technological advantage, more online banking solutions were introduced to address the evolving needs of its target market, with service options comparable to commercial banks but more flexible and more affordable.
This included the centralized payroll processing system implemented in 2016 which gained over 200 payroll servicing clients.
Moving forward, ONB will continue to not only develop more cash management solutions but also provide after-sales servicing to clients. Having added more billers for bills payment including BDO Credit Card payments, the Bank intends to expand the network of ONB collection points for BDO billers and vice versa. Preparations are underway for the implementation of Personal Online Banking.
The Bank also beefed up its ATM network with 183 new machines and aligned its technology to a better and more robust system in line, focusing on responding to the increasing demand in underbanked areas for access to modern banking products and services. The Bank’s ATM network reached a total of 220, benefiting local and international cardholders especially in areas where ONB is the sole bank in operation.
Total Deposits
P22.84 BillionTotal Loans
P21.60 Billion
18
All ATMs have been replaced with more advanced units and migrated to the IST/Switch processor, with state-of-the-art architecture that allows seamless integration of transactions between systems and networks, thereby ensuring more security for cardholders. The Bank now reaps the rewards of these initiatives, receiving feedback on better customer experience predicated by faster transactions, shorter queues, commendable security features, and improved ATM appearance and screen display. Notably, a significant decline in complaints regarding unsuccessful transactions has also been reported.
ONB also launched its Mobile ATM, deploying it to key provinces in Luzon to support promotional activities of new branches while also helping the Salary Loans Unit reach out to schools.
More recent initiatives are focused on developing ATM function improvements such as interbank fund transfer, bills payment, e-load
or airtime reload, checkbook reorder, and Personal Online Banking enrollment activation. In addition to the deployment of 200 onsite and offsite ATMs in growth areas of Luzon and Visayas, the Bank also intends to roll out cash accept machines, allow cardless withdrawal transactions, and activate additional international switches.
In compliance with the requirement of the Bangko Sentral ng Pilipinas (BSP), the Bank upgraded its cards to the new One Network ATM Debit Cards with EMV (Europay, Mastercard, and Visa) chip card technology. The new cards come with a range of features for the convenience of cardholders — among them enhanced security, the ability to perform transactions overseas, convenient online purchasing, and contactless payment. Cardholders transacting at BDO ATMs nationwide also now enjoy inter-network transactions at no cost. For 2017, the Bank will continue to work on additional card functions like fund transfer and bills payment through POS, ATM, and online channels as well as ID functionality for the EMV chip debit card.
On the remittance front, the Bank’s successful integration with BDO brought in new opportunities to service foreign remittances originating from BDO partners. Despite the reduction in remittance tie-ups, transaction volume remained steady as affiliation with BDO provided new markets. The partnership with BDO Remit yielded a transaction count comparable to the volume the Bank generated the previous year when it maintained 14 tie-ups.
Distribution Net work
122 Branches220 ATMs
Manpower
1,684 Employees

19
review of operations
Servicing domestic remittances became more efficient after migrating to BDO Send Money Domestic Remittance System. This not only facilitates cash pick-up at any BDO or ONB branch in the country but also allows ONB to accommodate credit-to-BDO account transactions. Meanwhile, plans are in the pipeline for the Bank’s Remittance Operations Center to facilitate credit-to-account foreign remittance transactions which will significantly reduce processing time.
The Bank continued to fill the gap in collecting SSS (Social Security System) and PhilHealth (Philippine Health Insurance Corporation) contributions, especially in areas where there are very few or no payment centers. Standardization of communications made the collation of daily reports from branches more efficient. Moving forward, the Bank is preparing for the deployment of computer application enhancements to expedite faster processing of SSS and PhilHealth transactions in branches and to prepare for accepting other government payment transactions.
SUPPORT AND DELIVERY SYSTEMS
The last twelve months saw intensive efforts to standardize applications, infrastructure, and procedures for ICT, HR, and Marketing — an imperative to optimize business processes and improve the Bank’s ability to respond to changing market conditions. As such, integration activities resulted in the timely consolidation and submission of internal and regulatory reports, improvement of communications, and development and implementation of new products and services.
20
To drive customer satisfaction and allow faster processing of an ever increasing transaction volume, the Bank’s core banking system was migrated to the BDO International Comprehensive Banking System (ICBS), which features an easy interface and enables faster report generation for Current and Savings Accounts, Time Deposit Accounts, and General Ledger. The Bank also migrated its anti-money laundering system to BDO SAS-AML system to align implementation of risk management techniques. Meanwhile, MHUB switch was changed to BDO IST/ATM Switch and ATMs were replaced in compliance with EMV standards.
The adoption of BDO systems was essential not only in reducing costs but also in responding to evolving client expectations. Process efficiency for loan transactions improved after the existing loans processing system was converted into a web-based application. Clients now enjoy a more efficient service delivery following increased sophistication in systems for cash management, online banking, and other electronic channels. In 2017, the Bank will continue to further align its systems and other applications with BDO standards to support speedier communications, increased employee productivity, and deeper customer satisfaction.
The Bank continued to manage its risk appetite in 2016 and embarked on key initiatives to further reinforce risk management. The quality of credit risk management policies and procedures was enhanced and the credit risk limit structure was clearly defined. To reasonably estimate provisions for loans, the Bank strengthened its Loan Loss Methodology which essentially supported sustainability of its balance sheet. In addition to regular monitoring
and reporting of Liquidity Risk Limits to the Risk Management Committee, the revised Risk Control Self-Assessment, Key Risk Indicators and Loss Event Reporting tools were fully implemented. For 2017, risk management framework policies will continue to be aligned with that of BDO.
The Bank adopted a new human resource development and management system. Procedures on recruitment, availment of employee benefits, and other HRMD processes were folded into the workflow of the BDO Human Resources Group, thus allowing for improved turnaround time commitments and efficiency. A series of Culture Orientation Programs was organized to mark the transition of ONB personnel into the BDO family and for them to learn what it means to embody the Parent Bank’s “We find ways” service philosophy. Employees involved in operations were trained on the new system to complement efforts to enhance IT infrastructure. To maintain a consistently positive customer experience across all branch counters, product training for frontliners was conducted to empower them to effectively offer client solutions. Development programs geared toward developing technical competencies were also carried out.
Marketing communication strategies were re-engineered. In addition to ensuring that all branches bore new signage, the Bank updated the look and feel of its delivery channels. Its corporate website, for instance, now forms part of a coordinated brand identity and is maximized as a platform for reaching out to clients. To illustrate the key message of its rebranding initiatives, the Bank gathered its valued clients, branch heads, and key officers

21
review of operations
of ONB and BDO for a night of appreciation at the SMX Convention Center in Davao City last August 2016. A print ad campaign conveying the synergy of ONB and BDO was also launched to support the growth objectives of the Bank.
Several on-the-ground activities were conducted in 2016, particularly in Luzon and Visayas, to tap into new market segments and expand customer base. The Bank’s consumer research arm also executed different market insight surveys to support business units in formulating responses to the evolving preferences of clients.
GOING FORWARD
ONB is confident that its growth story will be sustained in 2017 as it continues to leverage on its extensive branch network and its affiliation with BDO.
The Bank will continue to realize the benefits and advantages from its integration strategy, such as efficient operational infrastructures and streamlined workflow, to keep operating expenses at manageable levels.
Looking ahead, increased level of business activity and engagement with customers will be key priorities to scale up balance sheet growth. The Bank aims to expand its geographic footprint by opening more branches in 2017 and to tap into the needs of new target markets.
Lending to the consumer segment is expected to pick up following the initiatives in 2016 to make it easier for new target markets to do business with the Bank. As sustained demand for additional working capital is anticipated especially in the growth regions of the country, the Bank gears up for tapping into the microfinancing needs of the countryside.
Overall, the Bank is confident that it will sustain its strong regional presence as it widens its product offering and makes banking more convenient in unserved and underserved areas.

Fairness,Accountabilit y,Transparency,
Integrit y &Performance

23
ONB is committed to ensuring that the corporate governance principles of its Parent Bank, BDO Unibank, Inc. — fairness, accountability, transparency, integrity, and performance — permeate the core practices of the institution. More than enabling the Bank to comply with statutory and regulatory requisites, these practices are essential for its journey towards a sustainable financial position.
Corporate Governance
24
BOARD OF DIRECTORS
The Board of Directors bears the responsibility of ensuring that good governance principles are carried out through sufficient mechanisms and that compliance with regulations are observed. It is composed of seven (7) executive, non-executive, and independent directors with a good balance of skill, knowledge and experience among its members to properly carry out their decision-making responsibilities in the different aspects of the Bank’s operations. All members of the Board are professionals with competencies in the fields of banking, accounting, microfinance, economics, law and agribusiness.
Members of the Board are elected by the shareholders during the annual stockholders meeting. Each member holds office for one year, subject to the approved qualification and disqualification criteria established under the Corporate Governance Committee, fit and proper rule of the Bangko Sentral ng Pilipinas (BSP), and other existing laws and regulations of the country. Independent Directors are independent of management and free from any business or other relationship that may impede their insight on matters.
The primary role of the Board is to approve and oversee the implementation of the Bank’s strategic plans, risk strategy, corporate governance, culture of transparency and corporate values. It defines appropriate
governance policies and practices for the Bank and makes certain that these are periodically reviewed for improvement. It ensures that there is a performance standard in place or a budget plan consistent with the Bank’s strategic objectives. It also develops an appropriate plan of succession.
The Board regards conducting regular evaluation as essential in determining its effectiveness and in improving its structure, composition, and practices and procedures. The Corporate Governance Committee facilitates an annual review of the performance, duties and responsibilities of the Board, various Board level committees, Chief Executive Officer, individual directors and independent directors to remain relevant amid changes in the business environment and consistent with sound corporate governance practices. In 2016, the Board adopted its Parent Bank’s Corporate Governance Scorecard model in measuring its level of compliance with corporate governance guidelines mandated by regulators. Comments are solicited in the new scorecard, which not only aided in assessing the total value of corporate governance of the Bank but also led to opportunities for systematic improvements of areas noted to be weak.
The Board convenes every month in addition to special meetings, when necessary. In 2016, the Board met twelve (12) times to evaluate and approve various matters relevant to the Bank’s operations.
Governance Structure

25
Corporate Governance
Mr. Alex V. Buenaventura resigned from the Board on October 31, 2016. On September 24, 2016, the Board approved the nomination and election of Ms. Maria Lourdes Jocelyn S. Pineda as Independent Director, following the resignation of Mr. Domingo A. Ramos effective on the same date.
Attendance Board of Directors Meetings 2016
Directors No. of
Meetings
Attended
Total
No. of
Meetings
Percentage
Rating
1. Nestor V. Tan 12 12 100%
2. Alex V.
Buenaventura* 8 8 100%
3. Rolando C.
Tanchanco 11 12 92%
4. Pedro M.
Florescio III 9 12 75%
5. Jaime C. Yu 7 12 58%
6. Evelyn T. Ang 11 12 92%
7. Domingo A.
Ramos** 8 8 100%
8. Maria Lourdes
Jocelyn S.
Pineda*** 3 3 100%
*Resigned from the Board effective October 31, 2016. ** Resigned from the Board effective September 24, 2016.*** Elected as Independent Director on September 24, 2016.
BOARD COMMITTEES
The Board is assisted by five (5) committees in discharging its roles and functions, with Related Party Transaction Committee as the most recently formed committee. Board committees operate under their respective defined Terms of Reference which are approved by the Board and updated regularly to ensure relevance in line with changes in corporate governance practices. The composition of these committees and their respective responsibilities are provided below.
1. Executive Committee
Chairperson: Alex V. Buenaventura (until October 31, 2016)Members: Rolando C. Tanchanco, Jaime C. Yu
The Executive Committee is primarily responsible for ensuring that the mandates and resolutions of the Board of Directors, the Monetary Board of the Bangko Sentral ng Pilipinas as well as all policies and regulations necessary for the conduct of bank operations are carried into effect. Committee meetings cover credit policy, loan approvals and updates, branch operations, treasury, information technology and e-channels, human resource developments, and other projects and initiatives to enhance the Bank’s operational efficiency and service delivery. The Executive Committee also has the authority to endorse to the Board

26
recommendations to establish branch offices and any amendments to the Bank’s Articles of Incorporation and/or Bylaws.
The Committee held 12 meetings in 2016.
2. Audit Committee
Chairperson: Evelyn T. Ang (Independent Director)Members: Pedro M. Florescio III; Domingo A. Ramos (Independent Director until September 24, 2016); Maria Lourdes Jocelyn S. Pineda (Independent Director starting September 24, 2016)
Internal Audit and Controls• Organizing the Internal Audit Department,
appointing or removing the head of Internal Audit and key internal auditors, and recommending respective remuneration for approval of the Board.
• Reviewing annual internal audit plans, including audit scope, resources, budget and timetable, to ensure its conformity with the objectives of the Bank.
• Reporting major issues to the Board and ensuring that the management is taking corrective actions in a timely manner to address weaknesses, non-compliance with policies, laws and regulations and other issues identified by auditors.
• Examining, evaluating and improving risk management, internal control systems and governance processes of the organization.
• Ensuring that the internal audit function maintains an open communication with senior management, the Audit Committee, external auditors and supervisory authority.
External Audit Engagement and Reports• Recommending the appointment, re-
appointment and/or change, and remuneration of external auditor.
• Discussing with the external auditor the nature, scope and expenses of the audit prior to the commencement of audit work.
• Reviewing the management representation letter stating management’s responsibility over the financial statements and financial reporting process.
• Reporting to the Board of Directors the performance of the external auditors.
Operational, Financial and Anti Money Laundering Compliance• Reviewing and approval of the annual
plan of the Compliance and Anti Money Laundering Office
• Reviewing of the quarterly, half-year and annual financial statements before submission to the Board

27
Corporate Governance
• Reviewing of the reports of the Bangko Sentral ng Pilipinas and other regulatory bodies as well as notices on financial or administrative penalties incurred due to delayed or non-submission of required regulatory reports
• Reviewing and reporting to the Board the annual performance appraisal of the Compliance Office and Anti Money Laundering Unit
In 2016, the Audit Committee accomplished the following according to its oversight responsibilities established in its Terms of Reference:
1. On its oversight function over Internal Audit:• Approved the 2016 Audit Plan and IS Audit
Manual.• Approved the Audit Committee Report,
Internal Audit Annual Plan and Policy Statement.
• Reviewed and confirmed IAD Report on 2015 Closing Report, Accomplishment Reports and Audit Proficiency ratings, as well as the result of the Annual Performance Evaluation of IAD Personnel covering Assisting Auditors to Unit Heads.
• Confirmed the approval to allow branches to complete their conversion activities before being subjected to audit.
• Consistently monitored changes to the BAC – Approved Audit Plan.
• Discussed and monitored 2016 Audit Proficiency of Head Office and Branches and updates on IT projects.
2. On its oversight function over Compliance:• Approved the revisions/ enhancements on
Compliance Charter, Compliance System and AMLA Charter.
• Approved the annual plans and compliance roadmaps, enhanced manuals and independent testing frameworks of Regulatory Compliance and AML Units.
• Reviewed and discussed Compliance Progress Report, and significant regulatory issuances and penalties or fees.
• Approved the revisions to the Compliance Program particularly on the following: a) DOSRI Policy and Monitoring Program, b) Validation of Regulatory Report, c) Discontinuance of Branch Compliance Review, and d) Compliance Coordinators’ (CC) Framework.
• Approved the Bank’s Information Sharing Framework (IAD, RMD and COD).
• Reviewed the results and monitored the progress of the Independent Compliance and AML Testing.
• Consistently monitored the updates on CTR, STR, alerts management and results of due diligence.
• Discussed the AML Rating and updates on BSP Report on Examination (ROE) Directives.
3. Others• Discussed and approved the Annual Board
Audit Committee Plan and committee’s terms of reference.
28
For the financial year 2016, the Committee reviewed the audited financial statements with the management and external auditors. It believes that the financial statements are fairly presented in conformity with the relevant financial reporting standards in all material aspects.
The Committee held four meetings in 2016 with Mr. Florescio present in all meetings; Ms. Ang present in 3 meetings; and Mr. Ramos and Ms. Pineda present in 2 meetings.
3. Risk Management Committee
Chairperson: Domingo A. Ramos (Independent Director until September 24, 2016); Maria Lourdes Jocelyn S. Pineda (Independent Director starting September 24, 2016) Members: Pedro M. Florescio III, Rolando C. Tanchanco
The Risk Management Committee, as an extension of the Board, develops and oversees the risk management program of the Bank. It defines and approves policies and limits related to credit portfolio risks, as well as market, liquidity and operational risks. It supports the Board in performing its risk oversight functions and evaluates and approves risk management plans, defining the policies, limits and strategies for managing and controlling the major risks of the Bank. It is responsible for assessing the
probability of each risk exposure becoming a reality, estimating its possible effect and cost, and identifying practical strategies to minimize losses if risk becomes real. The Committee also reviews risk-mitigating strategies to identify emerging risk exposures and to ensure relevance, comprehensiveness and effectiveness of the Bank’s existing risk management program.
During the year, the Committee accomplished the following according to its oversight responsibilities established in its Terms of Reference:
• Conducted regular discussions of the Bank’s exposures to credit risks, market and liquidity risks, and operational risks, including risk mitigation strategies, where necessary and applicable.
• Approved the amendments to the Operational Risk Management (ORM) Framework, the revised Market and Liquidity Risk Management Manual.
• Shifted from a Business Unit Approach to Key Business Process Approach to identify Business Units to be prioritized in the recovery in times of disruptions.
• Aligned the Bank’s Credit Review and Credit Evaluation processes with that of Parent Bank which includes the adoption of BDO’s Internal Credit Risk and Rating System (ICRRS) Model and Credit Scorecard.

29
Corporate Governance
• Approved the Credit Risk Limits and Guidelines for the Bank monitoring of credit exposures in compliance with regulatory requirements.
• Approved and endorsed to the Board of Directors the ONB Credit Policy Manual, ONB Operational Risk Management (ORM) Policies and Bulletins, and the Detailed Mapping of ONB’s Key Business Processes.
• Adopted BSP’s uniform Stress Test Framework, focusing on its application to the Bank’s salary loan portfolio.
• Developed a Loan Loss Methodology (LLM), based on BSP Circular 855 (Guidelines on Sound Credit Risk Management Practices), to set up provisions for probable losses for the Bank’s loans.
The Committee met four times in 2016 with Messrs. Florescio and Tanchanco present in all meetings; Mr. Ramos attending 2 meetings; and Ms. Pineda attending one meeting.
4. Corporate Governance Committee
Chairperson: Domingo A. Ramos (Independent Director until September 24, 2016); Maria Lourdes Jocelyn S. Pineda (Independent Director starting September 24, 2016) Members: Evelyn T. Ang (Independent Director), Jaime C. Yu
The Corporate Governance Committee provides assistance to the Board in fulfilling its responsibilities for corporate governance. The Bank abides by a Corporate Governance charter that is annually reviewed and updated to align existing policies and procedures with the decrees of regulatory bodies.
The Committee evaluates Board Committee memberships and term limits; reviews adequacy of charters adopted by each committee of the Board; and assesses the effectiveness of corporate governance principles and guidelines to recommend changes for Board approval. It conducts annual performance evaluation of the Committee’s performance, constitution and terms of reference to ensure that these are operating at maximum effectiveness. It reviews succession planning for key leadership positions and recommends specific programs or topics for the continuing education of existing directors.
For the year 2016, the Committee recommended the revisions on the Corporate Governance Manual to harmonize the Bank’s Corporate Governance Policies with Parent Bank, particularly on the BDO Conglomerate Map, Corporate Governance Scorecard, Policy on Disclosure of Sensitive/Confidential Matters to Management and Conflict of Interest Policy.

30
The committee convenes at least once every quarter and as often as needed. Ability to act on matters is by the consent by majority of the Committee members.
The Committee met once in 2016 with all the members in attendance.
5. Related Party Transactions Committee
Chairperson: Evelyn T. Ang (Independent Director) Members: Pedro M. Florescio III; Maria Lourdes Jocelyn S. Pineda (Independent Director starting September 24, 2016)
The Related Party Transactions Committee is constituted for the purpose of transparency and fairness of the Bank and all its stakeholders. It ensures that the terms of the Related Party Transactions for approval of the Board are conducted at arm’s length and in accordance with regulatory requirements.
The Committee evaluates proposed Related Party Transactions by considering the nature of the transaction and the identities of the parties involved in the transaction or relationship; the terms and conditions are no less favorable than the terms available to unrelated third parties
under the same circumstances; reputational risks that may arise as a result of or in connection with the proposed transaction; the impact on the independence of a director or senior officer; the extent that such transactions would present an improper conflict of interest for any director or senior officers of the Bank; the material facts of the proposed transaction including the proposed aggregate value; and any other relevant information and justifications in entering into these transactions and compliance with the rules and regulations of Related Party Transactions.
The Committee ensures that related party transactions are subject to periodic independent review or audit in compliance with relevant rules and regulations governing related party transactions. It reviews the adequacy of the Terms of Reference at least annually and as soon as necessary and to ensure that subsequent changes are approved by the Board of Directors.
The Committee convenes every month with the presence of at least two (2) members, with additional meetings at the discretion of the Committee Chairman. Ability to act on matters is by the consent by majority of the Committee members.

31
Corporate Governance
In 2016, the Committee approved the Related Party Transaction Committee Charter. It approved and endorsed to the Board of Directors for the Bank to adopt its Parent Bank’s Related Party Transaction except for the materiality threshold. It also continued to consistently monitored the Related Party Transaction Exposures.
The Committee met once in 2016 with Mr. Florescio and Ms. Pineda attending the meeting.
RELATED PARTY TRANSACTIONS
The Bank aims to conduct its affairs with a high degree of integrity, ensuring that there is effective compliance with existing laws, rules and regulations at all times and no stakeholder is unduly disadvantaged. In 2016, ONB adopted its Parent Bank’s procedures for the approval and disclosure of related party transactions, such as credit accommodations, products or services extended by the Bank to its directors, officers, stockholders and their related parties in their personal capacity or to their company and vice versa. Under this policy, the Related Party Transactions Committee determines if the transaction is in the ordinary course of business and meets the arm’s length requirements, focusing on the transaction’s terms and conditions as well as the purpose and reason for entering into the transaction, prior to endorsing it to the Board for approval.
GOING FORWARD
For 2017, the Bank will increase the number of members of the Board of Directors from seven (7) to 11, following a Board Resolution created during the Annual Stockholders Meeting. The Bank will sustain the adoption and implementation of the corporate governance practices of its Parent Bank and continue to work towards maximizing shareholder value.

32
RecognitionSSS Hall of Fame AwardeeOne Network Bank was conferred a Hall of Fame Award by the Social Security System (SSS) for its performance as Best Collection Partner under the Rural Bank category for three consecutive years during the Balikat ng Bayan Awards 2016.
The Bank was lauded for its continuing efforts to assist the SSS in its collection of contributions and salary loan payments from members through its wide branch infrastructure strategically dispersed in unserved and underserved areas.
ONB Officer-in-Charge Ramon T. Militar (third from right) and First Vice President Alberto O. Quiogue (fourth from left) receive the plaque of recognition from SSS President and CEO Emilio S. de Quiros, Jr. (second from right) and Finance Secretary Carlos G. Dominguez III (third from left). Also gracing the awarding were, from left, SSS Senior Vice President for Account Management Group and Balikat ng Bayan Awards Committee Chairperson Judy Frances A. See, SSS Commission Chairman Juan B. Santos, and SSS VP for Treasury Division Guillermo M. Urbano, Jr.


Board of Directors

35
Nestor V. Tan, the President and CEO of BDO Unibank, Inc., was elected Chairman of the Board of Directors of ONB in August 2015. Concurrently, he holds vice chairmanships and/or directorships in the following subsidiaries of BDO Unibank, Inc.: BDO Leasing and Finance, Inc. (PLC), BDO Capital & Investment Corporation, BDO Insurance Brokers, Inc., BDO Life Assurance Holdings Corp. (formerly Generali Pilipinas Holding Company), BDO Life Assurance Company, Inc. (formerly Generali Pilipinas Life Assurance Company, Inc.), BDO Remit (USA), Inc., and SM Keppel Land, Inc. He also concurrently holds the Chairmanship of BDO Strategic Holdings Inc., BancNet, Philippine Dealings System Holding Corp. and RBB Micro Finance Foundation. He is a Trustee of BDO Foundation, Inc., the De La Salle University Board of Advisors, and the Asian Institute of Management. At present, he is the Director of the Asian School of Business & Technology, and serves as President and Director of the Bankers Association of the Philippines.
Prior to joining BDO Unibank, Mr. Tan was Chief Operating Officer of the Financial Institutions Services Group of BZW, the investment banking subsidiary of the Barclays Group. His banking career spans nearly four decades and includes posts at global financial institutions, among them Mellon Bank (now BNY Mellon) in Pittsburgh, PA; Bankers Trust Company (now Deutsche Bank) in New York; and the Barclays Group in New York and London. He holds a bachelor’s degree in Commerce from De La Salle University and an MBA from the Wharton School, University of Pennsylvania.
Nestor V. TanChairmanFilipino, 58 years old

36
Jaime C. YuDirectorFilipino, 58 years old
Jaime C. Yu was elected Director of ONB in August 2015. He is concurrently a Senior Executive Vice President of BDO, heading its Branch Banking Group. Mr. Yu joined BDO in December 1997. He has extensive experience in commercial, corporate, and investment banking from the International Corporate Bank and Union Bank of the Philippines, where he held various positions prior to his appointment as First Vice President and Region Head for the Manila-Pasay area. He holds a Bachelor of Arts in Economics from De La Salle University and is an MBA graduate from the Ateneo de Manila University.
Pedro M. Florescio IIIDirectorFilipino, 62 years old
Pedro M. Florescio III was elected Director of ONB in August 2015. He concurrently holds the position of Executive Vice President and Treasurer of BDO. He is also a Director of BDO Elite Savings Bank (formerly GE Money Bank, Inc.). He holds a bachelor’s degree in Business Administration from the University of the East, Manila, and has attended numerous treasury programs and trainings in major financial centers. He has more than 25 years of experience in treasury functions within and outside the country. Mr. Florescio was previously connected with Equitable PCI Bank, Inc., Far East & Trust Company, Dao Heng Bank Ltd. (Hong Kong), International Bank of Asia (Hong Kong), Chemical Bank (Manila), Societe Generale (Manila), European Asian Bank (Manila), and PCIBank. He was the past President of MART (The Money Market Association of the Philippines year 2005) and ACI Philippines (The Financial Markets Association of the Philippines year 1997, 1998, and 2007).

37
Board of Directors
Rol ando C. TanchancoDirectorFilipino, 54 years old
Rolando C. Tanchanco was elected Director of ONB in August 2015. He is concurrently an Executive Vice President in BDO, heading its Consumer Lending Group. Prior to joining BDO, Mr. Tanchanco was President of Philam Savings Bank and Head of AIG Credit Card. He is currently a Director of BDO Elite Savings Bank, Inc. and Trans Union Phils. He holds a bachelor’s degree in Business Economics from the University of the Philippines and acquired his MBM at the Asian Institute of Management.
Evelyn t. AngIndependent DirectorFilipino, 63 years old
Evelyn T. Ang was elected Independent Director of ONB in 2011. She is the Chairwoman and President of the following family-owned corporations: Five Jewels Corporation, a Davao-based corporation engaged in the distribution of United Laboratories Products and B-Meg Animal Feeds; DABISCO Development Corporation, a Davao-based corporation engaged in real estate and distribution of B-Meg Animal Feeds for large farms; South Sea Designs, Inc., a Davao-based corporation engaged in export of rattan furniture; Phil Agro Industrial Corporation, a Bukidnon-based corporation engaged in the manufacture of cassava starch and also provides financing and technical assistance to cassava farmers; and FJC Farm, Inc., a Bukidnon-based corporation engaged in hog raising. She is a graduate of BSBA Financial Management in University of the Philippines and received her MBA from the Ateneo de Davao University.

38
Maria Lourdes Jocelyn S. PinedaIndependent DirectorFilipino, 60 years old
Maria Lourdes Jocelyn S. Pineda was elected Independent Director of ONB on September 2016. She is an independent international consultant for banking, financial inclusion and microfinance, and training. Formerly, she was President and Chief Executive Officer of Merchant Savings & Loan Association, Inc. (Rizal Microbank – A Thrift Bank of RCBC). From 2009 to 2012, she was the President and Chief Executive Officer of President Jose P. Laurel Rural Bank in Batangas. From 2005 to 2007, she served as the Regional Manager/Coordinator for Visayas Region of Chemonics International/Microenterprise Access to Banking (MABS), a USAID project in partnership with Rural Bankers Association of the Philippines. In 2003, she was a consultant of Microfinance technical Assistance consultant for UNDP Upland Development Programme. She holds a bachelor’s degree in Business Administration from Ateneo de Davao University and received her MBA, Magna Cum Laude, from University of the Philippines.
Bambeth Mahal C. Jambangan-DiezCorporate SecretaryFilipino, 35 years old
Bambeth Mahal C. Jambangan-Diez was appointed Corporate Secretary of ONB in January 2014 and concurrently serves as Legal Department Head from January 2014 up to the present. She was formerly the Unit Head of ONB Legal Services from July 2009 to December 2013. She was a part-time faculty member of Ateneo de Davao University from 2009 to 2012 under the School of Arts and Sciences. She served as paralegal of Legal Rights Center, an NGO, in 2006. She served as paralegal and legislative staff in Sangguniang Panlunsod in 2007, and as legal writer of Legal Division, DENR-XI. She holds a degree in AB Political Science, Cum Laude, from the Ateneo de Davao University where she also finished her Bachelor of Laws in 2009.

Teresita T. SyAdviser to the Board

OurProgress
by theNumbers

41
FinancialStatements

42
Statement of Management ’s Responsibilit y for Financial Statements
The management of ONE NETWORK BANK, INC. (A RURAL BANK) (the Bank) is responsible for the preparation and fair presentation of the financial statements, including the schedules attached therein, for the years ended December 31, 2016 and 2015, in accordance with the prescribed financial reporting framework indicated therein, and for such internal control as management determines is necessary to enable the preparation of financial statements that are free from material misstatement, whether due to fraud or error.
In preparing the financial statements, management is responsible for assessing the Bank’s ability to continue as a going concern, disclosing, as applicable, matters related to going concern and using the going concern basis of accounting unless management either intends to liquidate the Bank or to cease operations, or has no realistic alternative to do so.
The Board of Directors is responsible for overseeing the Bank’s financial reporting process.
The Board of Directors reviews and approves the financial statements, including the schedules attached therein, and submits the same to the stockholders.
Punongbayan & Araullo, the independent auditors, appointed by the stockholders, has audited the financial statements of the Bank in accordance with Philippine Standards on Auditing, and in their report to the stockholders, have expressed their opinion on the fairness of presentation upon completion of such audit.
Nestor V. Tan
Ramon T. Militar
Romulo C. Guerrero
Chairman of the Board Officer-in-charge Comptroller
SUBSCRIBED AND SWORN to before me on this 11th day of April 2017; affiant exhibiting to me their Community Tax Certificate Numbers as follows:
ATTY. BAMBETH MAHAL C. JAMBANGANNotary Public for Davao City
Serial No. 2017-0835-2018 until December 31, 2018PTR No. 8049970 - 01/03/17 - Davao City
IBP Lifetime Member Roll No. 09796 - 03/11/11 - Pasig CityMCLE Compliance No. III-00205116 / IV-0001914
Roll of Attorney’s No. 56206One Network Bank Bldg., Km. 9, Sasa, Davao City
Doc. No. 155Page No. 31
Book No. XVIISeries No. 2017
NAMENestor V. Tan
Ramon T. MilitarRomulo C. Guerrero
CTC No.051351051265112014323677

43
Financial Statements
Report of Independent Auditors
THE BOARD OF DIRECTORS AND THE STOCKHOLDERS ONE NETWORK BANK, INC. (A RURAL BANK) (A SUBSIDIARY OF BDO UNIBANK, INC.) KM. 9, SASA, DAVAO CITY
REPORT ON THE AUDIT OF THE FINANCIAL STATEMENTS
OpinionWe have audited the financial statements of One Network Bank, Inc. (a Rural Bank) (the Bank), which comprise the statements of financial position as at December 31, 2016 and 2015, and the statements of profit or loss, statements of comprehensive income, statements of changes in equity and statements of cash flows for each of the three years in the period ended December 31, 2016, and notes to the financial statements, including a summary of significant accounting policies.
In our opinion, the accompanying financial statements present fairly, in all material respects, the financial position of the Bank as at December 31, 2016 and 2015, and its financial performance and its cash flows for each of the three years in the period ended December 31, 2016 in accordance with Philippine Financial Reporting Standards (PFRS).
Basis for OpinionWe conducted our audits in accordance with Philippine Standards on Auditing (PSA). Our responsibilities under those standards are further described in the Auditors’ Responsibilities for the Audits of the Financial Statements section of our report. We are independent of the Bank in accordance with the Code of Ethics for Professional Accountants in the Philippines (Code of Ethics) together with the ethical requirements that are relevant to our audits of the financial statements in the Philippines, and we have fulfilled our other ethical responsibilities in accordance with these requirements and the Code of Ethics. We believe that the audit evidence we have obtained is sufficient and appropriate to provide a basis for our opinion.
Responsibilities of Management and Those Charged with Governance for the Financial StatementsManagement is responsible for the preparation and fair presentation of the financial statements in accordance with PFRS, and for such internal control as management determines is necessary to enable the preparation of financial statements that are free from material misstatement, whether due to fraud or error.
In preparing the financial statements, management is responsible for assessing the Bank’s ability to continue as a going concern, disclosing, as applicable, matters related to going concern and using the going concern basis of accounting unless management either intends to liquidate the Bank or to cease operations, or has no realistic alternative but to do so.

44
Those charged with governance are responsible for overseeing the Bank’s financial reporting process.
Auditors’ Responsibilities for the Audit of the Financial StatementsOur objectives are to obtain reasonable assurance about whether the financial statements as a whole are free from material misstatement, whether due to fraud or error, and to issue an auditors’ report that includes our opinion. Reasonable assurance is a high level of assurance, but is not a guarantee that an audit conducted in accordance with PSA will always detect a material misstatement when it exists. Misstatements can arise from fraud or error and are considered material if, individually or in the aggregate, they could reasonably be expected to influence the economic decisions of users taken on the basis of these financial statements.
As part of an audit in accordance with PSA, we exercise professional judgment and maintain professional skepticism throughout the audit. We also:
• Identify and assess the risks of material misstatement of the financial statements, whether due to fraud or error, design and perform audit procedures responsive to those risks, and obtain audit evidence that is sufficient and appropriate to provide a basis for our opinion. The risk of not detecting a material misstatement resulting from fraud is higher than for one resulting from error, as fraud may involve collusion, forgery, intentional omissions, misrepresentations, or the override of internal control.
• Obtain an understanding of internal control relevant to the audit in order to design audit procedures that are appropriate in the circumstances, but not for the purpose of expressing an opinion on the effectiveness of the Bank’s internal control.
• Evaluate the appropriateness of accounting policies used and the reasonableness of accounting estimates and related disclosures made by management.
• Conclude on the appropriateness of management’s use of the going concern basis of accounting and, based on the audit evidence obtained, whether a material uncertainty exists related to events or conditions that may cast significant doubt on the Bank’s ability to continue as a going concern. If we conclude that a material uncertainty exists, we are required to draw attention in our auditors’ report to the related disclosures in the financial statements or, if such disclosures are inadequate, to modify our opinion. Our conclusions are based on the audit evidence obtained up to the date of our auditors’ report. However, future events or conditions may cause the Bank to cease to continue as a going concern.
• Evaluate the overall presentation, structure and content of the financial statements, including the disclosures, and whether the financial statements represent the underlying transactions and events in a manner that achieves fair presentation.
We communicate with those charged with governance regarding, among other matters, the planned scope and timing of the audit and significant audit findings, including any significant deficiencies in internal control that we identify during our audit.

45
Financial Statements
REPORT ON OTHER LEGAL AND REGULATORY REQUIREMENTS
Our audits were conducted for the purpose of forming an opinion on the basic financial statements taken as a whole. The supplementary information for the year ended December 31, 2016 required by the Bureau of Internal Revenue as disclosed in Note 26 to the financial statements is presented for purposes of additional analysis and is not a required part of the basic financial statements prepared in accordance with PFRS. Such supplementary information is the responsibility of management. The supplementary information has been subjected to the auditing procedures applied in the audit of the basic financial statements and, in our opinion, is fairly stated in all material respects in relation to the basic financial statements taken as a whole.
PUNONGBAYAN & ARAULLO
By: Ramilito L. Nañol aPartner
CPA Reg. No. 0090741TIN 109-228-427PTR No. 5908629, January 3, 2017, Makati City
SEC Group A AccreditationPartner - No. 0395-AR-3 (until May 19, 2019)Firm - No. 0002-FR-4 (until Apr. 30, 2018)
BIR AN 08-002511-19-2015 (until Mar. 18, 2018)Firm’s BOA/PRC Cert. of Reg. No. 0002 (until Dec. 31, 2018)
March 25, 2017
46
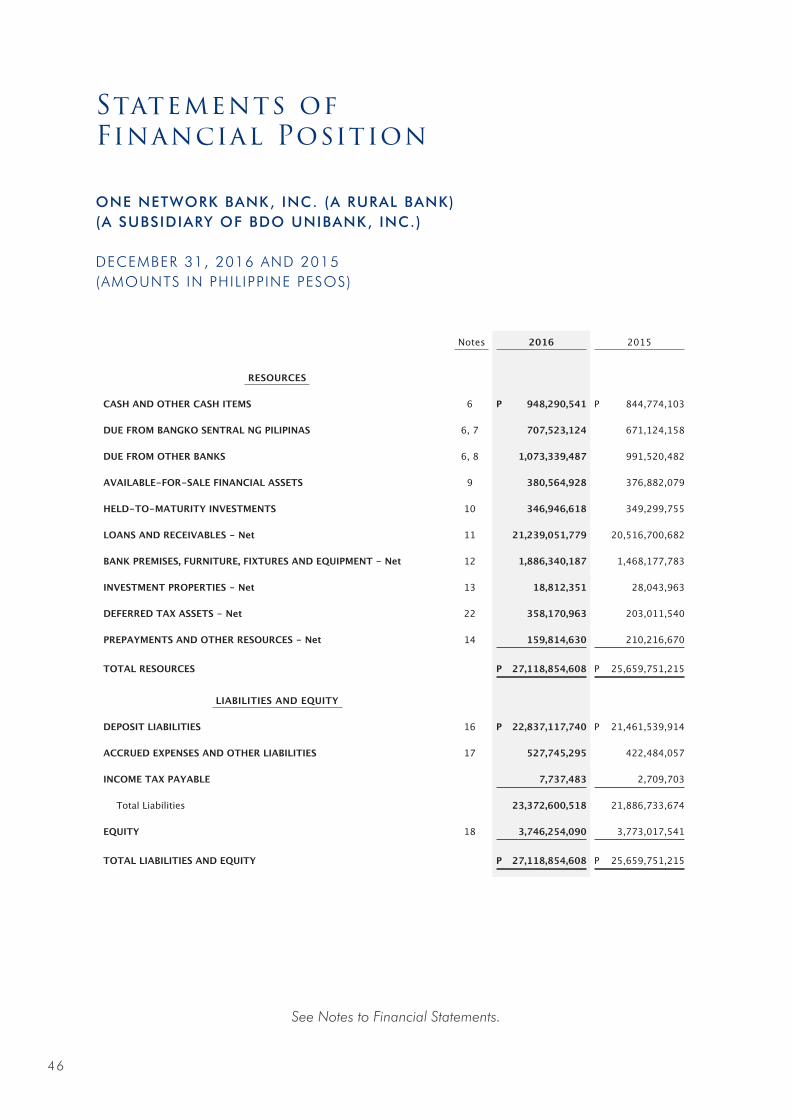
Statements of Financial Position
ONE NETWORK BANK, INC. (A RURAL BANK) (A SUBSIDIARY OF BDO UNIBANK, INC.)
DECEMBER 31, 2016 AND 2015 (AMOUNTS IN PHIL IPPINE PESOS)
Notes 2016 2015
RESOURCES
CASH AND OTHER CASH ITEMS 6 P 948,290,541 P 844,774,103
DUE FROM BANGKO SENTRAL NG PILIPINAS 6, 7 707,523,124 671,124,158
DUE FROM OTHER BANKS 6, 8 1,073,339,487 991,520,482
AVAILABLE-FOR-SALE FINANCIAL ASSETS 9 380,564,928 376,882,079
HELD-TO-MATURITY INVESTMENTS 10 346,946,618 349,299,755
LOANS AND RECEIVABLES - Net 11 21,239,051,779 20,516,700,682
BANK PREMISES, FURNITURE, FIXTURES AND EQUIPMENT - Net 12 1,886,340,187 1,468,177,783
INVESTMENT PROPERTIES - Net 13 18,812,351 28,043,963
DEFERRED TAX ASSETS - Net 22 358,170,963 203,011,540
PREPAYMENTS AND OTHER RESOURCES - Net 14 159,814,630 210,216,670
TOTAL RESOURCES P 27,118,854,608 P 25,659,751,215
LIABILITIES AND EQUITY
DEPOSIT LIABILITIES 16 P 22,837,117,740 P 21,461,539,914
ACCRUED EXPENSES AND OTHER LIABILITIES 17 527,745,295 422,484,057
INCOME TAX PAYABLE 7,737,483 2,709,703
Total Liabilities 23,372,600,518 21,886,733,674
EQUITY 18 3,746,254,090 3,773,017,541
TOTAL LIABILITIES AND EQUITY P 27,118,854,608 P 25,659,751,215
See Notes to Financial Statements.

47
Financial Statements
Statements of Profit or Loss
ONE NETWORK BANK, INC. (A RURAL BANK) (A SUBSIDIARY OF BDO UNIBANK, INC.)
FOR THE YEARS ENDED DECEMBER 31, 2016, 2015 AND 2014 (AMOUNTS IN PHIL IPPINE PESOS)
Notes 2016 2015 2014
INTEREST INCOME ON
Loans and receivables 11 P 1,496,192,515 P 1,641,332,761 P 1,582,794,440
Investments 9, 10 38,182,726 121,552,514 121,305,765
Deposits with other banks 8 7,724,686 27,156,369 34,161,353
Post-employment defined benefit plan - net 21 2,990,894 339,807 -
1,545,090,821 1,790,381,451 1,738,261,558
INTEREST EXPENSE ON
Deposit liabilities 16 305,314,558 335,120,549 325,260,500
Bills payable 19 362,500 98,612,829 167,187,046
Post-employment defined benefit plan - net 21 - - 2,891,608
305,677,058 433,733,378 495,339,154
NET INTEREST INCOME 1,239,413,763 1,356,648,073 1,242,922,404
IMPAIRMENT LOSSES 15 364,515,482 270,328,438 31,561,470
NET INTEREST INCOME AFTER IMPAIRMENT LOSSES 874,898,281 1,086,319,635 1,211,360,934
OTHER INCOME
Service charges, fees and commissions 1,131,221,305 980,071,592 1,084,113,674
Others 20 19,476,208 223,076,189 35,918,158
1,150,697,513 1,203,147,781 1,120,031,832
See Notes to Financial Statements.
FORWARD

48
Notes 2016 2015 2014
OTHER OPERATING EXPENSES
Compensation and employee benefits 19, 21 P 809,001,340 P 574,328,651 P 545,318,577
Occupancy and equipment-related expenses 12, 14, 19, 25 383,245,492 349,712,018 306,281,349
Taxes and licenses 26 267,118,722 362,880,762 285,584,729
Security, messengerial and janitorial services 107,964,580 92,287,054 90,284,633
Transportation and travel 87,135,068 118,828,915 129,673,934
Fees and commissions 82,634,308 73,137,342 60,524,387
Stationery and supplies 70,822,785 49,074,476 56,689,820
Insurance 40,877,335 25,184,978 35,033,097
Communications, telephone and telegraph 24,790,711 50,902,177 45,074,261
Fuel and lubricants 15,062,838 23,284,214 29,352,168
Professional fees 6,288,983 5,868,404 10,428,073
Banking fees 5,918,307 8,017,220 7,248,460
Charitable contributions 2,663,243 6,719,523 3,587,240
Advertising and publicities 613,899 1,522,668 23,918,084
Others 12 18,165,796 21,492,708 38,713,286
1,922,303,407 1,763,241,110 1,667,712,098
PROFIT BEFORE TAX 103,292,387 526,226,306 663,680,668
TAX EXPENSE 22 42,959,159 127,636,407 201,851,434
NET PROFIT P 60,333,228 P 398,589,899 P 461,829,234
Basic and Diluted Earnings Per Share 23 P 0.24 P 1.61 P 1.87
See Notes to Financial Statements.
Statements of Profit or Loss
ONE NETWORK BANK, INC. (A RURAL BANK) (A SUBSIDIARY OF BDO UNIBANK, INC.)
FOR THE YEARS ENDED DECEMBER 31, 2016, 2015 AND 2014 (AMOUNTS IN PHIL IPPINE PESOS)
49
Financial Statements
Statements of Comprehensive Income
ONE NETWORK BANK, INC. (A RURAL BANK) (A SUBSIDIARY OF BDO UNIBANK, INC.)
FOR THE YEARS ENDED DECEMBER 31, 2016, 2015 AND 2014 (AMOUNTS IN PHIL IPPINE PESOS)
Notes 2016 2015 2014
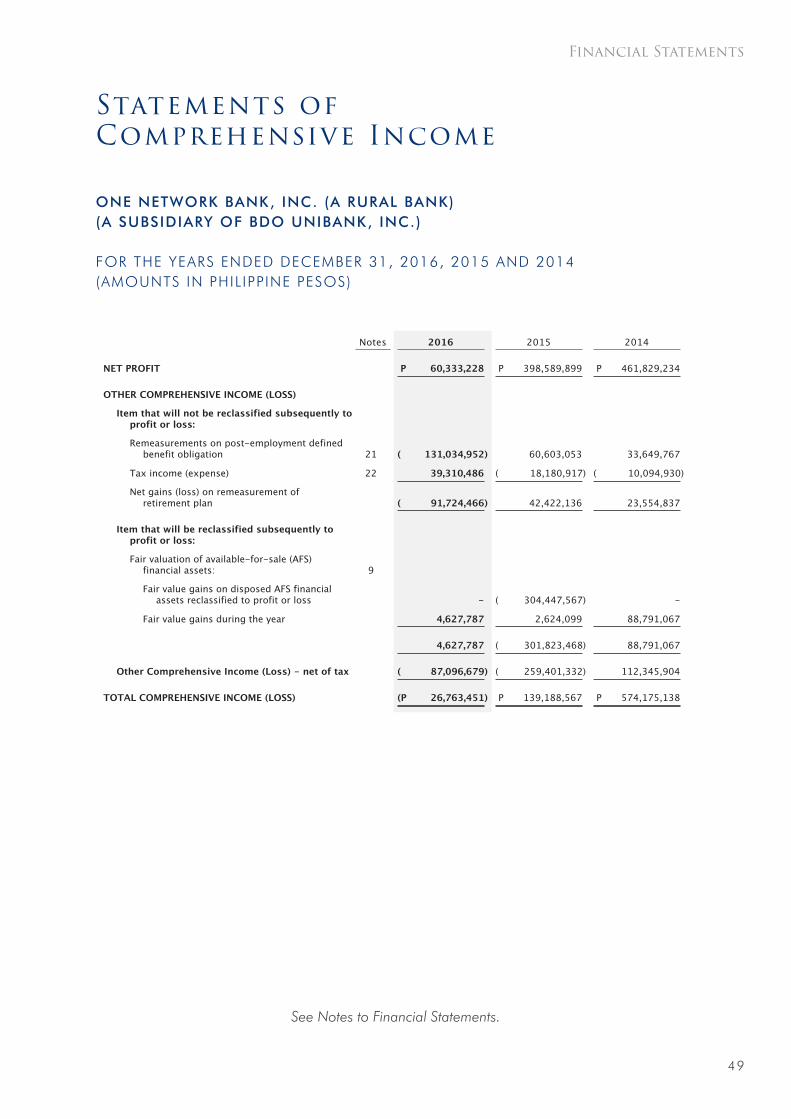
NET PROFIT P 60,333,228 P 398,589,899 P 461,829,234
OTHER COMPREHENSIVE INCOME (LOSS)
Item that will not be reclassified subsequently to profit or loss:
Remeasurements on post-employment defined benefit obligation 21 ( 131,034,952) 60,603,053 33,649,767
Tax income (expense) 22 39,310,486 ( 18,180,917) ( 10,094,930)
Net gains (loss) on remeasurement of retirement plan ( 91,724,466) 42,422,136 23,554,837
Item that will be reclassified subsequently to profit or loss:
Fair valuation of available-for-sale (AFS) financial assets: 9
Fair value gains on disposed AFS financial assets reclassified to profit or loss - ( 304,447,567) -
Fair value gains during the year 4,627,787 2,624,099 88,791,067
4,627,787 ( 301,823,468) 88,791,067
Other Comprehensive Income (Loss) - net of tax ( 87,096,679) ( 259,401,332) 112,345,904
TOTAL COMPREHENSIVE INCOME (LOSS) (P 26,763,451) P 139,188,567 P 574,175,138
See Notes to Financial Statements.

50
Statements of Changes in Equit y
ONE NETWORK BANK, INC. (A RURAL BANK) (A SUBSIDIARY OF BDO UNIBANK, INC.)
FOR THE YEARS ENDED DECEMBER 31, 2016, 2015 AND 2014 (AMOUNTS IN PHIL IPPINE PESOS)
NoteCapital Stock
Other Reserves
Revaluation Reserves Surplus Total
Balance at January 1, 2016 P 2,473,943,930 P 294,647,965 (P 32,197,202) P 1,036,622,848 P 3,773,017,541
Total comprehensive income for the year 18 - - ( 87,096,679) 60,333,228 ( 26,763,451)
Balance at December 31, 2016 P 2,473,943,930 P 294,647,965 (P 119,293,881) P 1,096,956,076 P 3,746,254,090
Balance at January 1, 2015 P 2,473,136,820 P 294,041,825 P 227,204,130 P 638,032,949 P 3,632,415,724
Issuance of shares during the year 18 807,110 606,140 - - 1,413,250
Total comprehensive income for the year 18 - - ( 259,401,332) 398,589,899 139,188,567
Balance at December 31, 2015 P 2,473,943,930 P 294,647,965 (P 32,197,202) P 1,036,622,848 P 3,773,017,541
Balance at January 1, 2014 P 2,211,503,970 P 293,115,955 P 114,858,226 P 436,607,829 P 3,056,085,980
Issuance of shares during the year 18 1,232,850 925,870 - - 2,158,720
Stock dividends 18 260,400,000 - - ( 260,400,000) -
Cash dividends 18 - - - ( 4,114) ( 4,114)
Total comprehensive income for the year 18 - - 112,345,904 461,829,234 574,175,138
Balance at December 31, 2014 P 261,632,850 P 925,870 P 112,345,904 P 201,425,120 P 576,329,744
See Notes to Financial Statements.

51
Financial Statements
Statements of Cash Flows
ONE NETWORK BANK, INC. (A RURAL BANK) (A SUBSIDIARY OF BDO UNIBANK, INC.)
FOR THE YEARS ENDED DECEMBER 31, 2016, 2015 AND 2014 (AMOUNTS IN PHIL IPPINE PESOS)
Notes 2016 2015 2014
CASH FLOWS FROM OPERATING ACTIVITIES
Profit before tax P 103,292,387 P 526,226,306 P 663,680,668
Adjustments for:
Impairment losses 15 364,515,482 270,328,438 31,561,470
Depreciation and amortization 12, 13, 14 211,413,028 154,169,828 131,270,212
Income from disposal of investment properties 20 ( 660,240) ( 442,816) ( 7,553,770)
Gain on disposal of available-for-sale (AFS) financial assets 20 - ( 206,066,074) ( 16,827,593)
Income from disposal of bank premises, furniture, fixtures and equipment 20 - ( 198,599) ( 110,806)
Operating profit before changes in resources and liabilities 678,560,657 744,017,083 802,020,181
Decrease (increase) in loans and receivables ( 1,079,380,601) 113,394,889 ( 2,970,309,964)
Decrease (increase) in prepayments and other resources 47,121,317 ( 30,005,988) 14,491,323
Increase in deposit liabilities 1,375,577,826 3,415,544,028 46,402,256
Increase (decrease) in accrued expenses and other liabilities ( 42,420,922) ( 97,807,709) 63,111,340
Cash generated from (used in) operations 979,458,277 4,145,142,303 ( 2,044,284,864)
Cash paid for income taxes ( 150,870,219) ( 144,852,484) ( 172,945,514)
Net Cash From (Used in) Operating Activities 828,588,058 4,000,289,819 ( 2,217,230,378)
CASH FLOWS FROM INVESTING ACTIVITIES
Acquisitions of bank premises, furniture, fixtures and equipment 12 ( 594,305,945) ( 79,850,948) ( 339,201,319)
Acquisitions of software and other intangibles 14 ( 15,116,044) ( 469,584) ( 41,942,724)
Proceeds from disposal of investment properties 13 2,568,340 915,663 12,185,933
Proceeds from disposal of AFS financial assets 9 - 1,964,777,944 420,101,307
Acquisitions of AFS financial assets 9 - ( 235,003,509) ( 928,807,246)
Proceeds from disposal of bank premises, furniture, fixtures and equipment 20 - 198,599 110,806
Acquisitions of held-to-maturity investments - - ( 212,075,107)
Net Cash From (Used in) Investing Activities ( 606,853,649) 1,650,568,165 ( 1,089,628,350)
See Notes to Financial Statements.
FORWARD

52
Notes 2016 2015 2014
CASH FLOWS FROM FINANCING ACTIVITIES
Repayments of bills payable - ( 14,812,642,079) ( 8,558,344,758)
Proceeds from availment of bills payable - 7,457,710,000 12,373,811,679
Cash dividends paid 18 - - ( 4,114)
Net Cash From (Used in) Financing Activities - ( 7,354,932,079) 3,815,462,807
NET INCREASE (DECREASE) IN CASH AND CASH EQUIVALENTS 221,734,409 ( 1,704,074,095) 508,604,079
CASH AND CASH EQUIVALENTS AT BEGINNING OF YEAR 6
Cash and other cash items 844,774,103 1,009,883,341 1,251,437,159
Due from Bangko Sentral ng Pilipinas 671,124,158 816,473,444 516,725,972
Due from other banks 991,520,482 2,385,136,053 1,934,725,628
2,507,418,743 4,211,492,838 3,702,888,759
CASH AND CASH EQUIVALENTS AT END OF YEAR 6
Cash and other cash items 948,290,541 844,774,103 1,009,883,341
Due from Bangko Sentral ng Pilipinas 707,523,124 671,124,158 816,473,444
Due from other banks 1,073,339,487 991,520,482 2,385,136,053
P 2,729,153,152 P 2,507,418,743 P 4,211,492,838
Supplemental Information on Non-Cash Investing and Financing Activities:
(1) In 2016, 2015 and 2014, the Bank acquired certain parcels of land amounting to P1.5 million, P5.4 million and P1.8 million, respectively, in settlement of loans and receivables (see Note 13).
(2) In 2015 and 2014, 80,711 shares and 123,285 shares, respectively, were issued in lieu of the subscribed and accrued employee stock option plan totalling P2.2 million (see Note 18). No similar transaction occurred in 2016.
(3) In 2014, stock dividends declared and distributed to all common stockholders amounted to P260.4 million (see Note 18). There are no stock dividends declared and distributed in 2016 and 2015.
See Notes to Financial Statements.
Statements of Cash Flows
ONE NETWORK BANK, INC. (A RURAL BANK) (A SUBSIDIARY OF BDO UNIBANK, INC.)
FOR THE YEARS ENDED DECEMBER 31, 2016, 2015 AND 2014 (AMOUNTS IN PHIL IPPINE PESOS)
53
Financial Statements
Notes to Financial Statements
ONE NETWORK BANK, INC. (A RURAL BANK) (A SUBSIDIARY OF BDO UNIBANK, INC.)
NOTES TO FINANCIAL STATEMENTS DECEMBER 31, 2016, 2015 AND 2014 (AMOUNTS IN PHIL IPPINE PESOS)
1. CORPORATE INFORMATION
1.1 Incorporation and Operations
One Network Bank, Inc. (a Rural Bank) (the Bank) was organized as a result of the consolidation of the two rural banks, namely, One Network Rural Bank, Inc. (ONRBI) and Rural Bank of New Corella (Davao del Norte), Inc. (RBNCI). The Bank was incorporated in the Philippines and was registered with the Securities and Exchange Commission (SEC) on July 14, 2011 to engage and carry on the business of a rural bank as provided in the Rural Banks Act of 1992. The Bank started its commercial operations on September 1, 2011.
On April 18, 2012, a plan of merger was made and entered into by the Bank with Rural Bank of San Enrique (Iloilo), Inc. (RBSEI) doing business under the name and style of Banco San Enrique (a Rural Bank). On April 12, 2013, the SEC approved the merger of the Bank with RBSEI, with the former as the surviving entity.
On July 20, 2015, BDO Unibank, Inc. (BDO or the Parent Bank), with the approval of the Monetary Board (MB) of the Bangko Sentral ng Pilipinas (BSP), successfully acquired 99.59% of the Bank’s outstanding capital stock making the Bank the latest member of the BDO Group. As payment, the selling shareholders of the Bank received a total of 64,499,890 listed common shares of BDO. As of December 31, 2016, BDO owns 99.76% of the Bank’s outstanding capital stock.
On June 17, 2016, the Parent Bank entered into a Sale and Purchase Agreement with TPG Growth III SF PTE. Ltd. (TPG) whereby the latter shall purchase 98,949,533 common shares of ONB (constituting 40.00%) held by the Parent Bank. The transaction has been approved by the BSP on December 8, 2016 and is still subject to the completion of certain closing conditions. TPG is the middle market and growth equity investment platform of TPG, a global private investment firm.
As a banking institution, the Bank is regulated by the BSP. In this regard, it is required to comply with the rules and regulations of the BSP such as those relating to maintenance of reserve requirements on deposit liabilities and deposit substitutes and those relating to the adoption and use of safe and sound banking practices, among others, as promulgated by the BSP. The Bank is also subject to the provisions of Republic Act (RA) No. 8791, otherwise known as the General Banking Law of 2000.
The Bank’s Foreign Currency Deposit Unit (FCDU) was registered with the Bureau of Internal Revenue (BIR) on December 21, 2012 and was authorized by the BSP to engage in foreign currency deposit operations on October 31, 2013. FCDU has only started commercial operations in December 2013.
The registered office of the Bank is located at Km. 9, Sasa, Davao City. As of December 31, 2016 and 2015, the Bank operates and maintains 122 branches nationwide and 107 branches (including 17 satellite offices) nationwide, respectively.
54
1.2 Approval of Financial Statements
The financial statements of the Bank as at and for the year ended December 31, 2016 (including the comparative financial statements as at December 31, 2015 and for the years ended December 31, 2015 and 2014) were authorized for issue by the Board of Directors (BOD) of the Bank on March 25, 2017.
2. SUMMARY OF SIGNIFICANT ACCOUNTING POLICIES
The significant accounting policies that have been used in the preparation of these financial statements are summarized below and in the succeeding pages. These policies have been consistently applied to all the years presented, unless otherwise stated.
2.1 Basis of Preparation of Financial Statements
(a) Statement of Compliance with Philippine Financial Reporting Standards
The financial statements of the Bank have been prepared in accordance with Philippine Financial Reporting Standards (PFRS). PFRS are adopted by the Financial Reporting Standards Council (FRSC) from the pronouncements issued by the International Accounting Standards Board, and approved by the Philippine Board of Accountancy.
The financial statements have been prepared using the measurement bases specified by PFRS for each type of asset, liability, income and expense. The measurement bases are more fully described in the accounting policies that follow.
(b) Presentation of Financial Statements
The financial statements are presented in accordance with Philippine Accounting Standards (PAS) 1, Presentation of Financial Statements. The Bank presents statement of comprehensive income separate from the statement of profit or loss.
The Bank presents a third statement of financial position as at the beginning of the preceding period when it applies an accounting policy retrospectively, or makes a retrospective restatement or reclassification of items that has a material effect on the information in the statement of financial position at the beginning of the preceding period. The related notes to the third statement of financial position are not required to be disclosed.
(c) Functional and Presentation Currency
These financial statements are presented in Philippines pesos, the Bank’s functional and presentation currency, and all values represent absolute amounts except when otherwise indicated.
Items included in the financial statements of the Bank are measured using its functional currency. Functional currency is the currency of the primary economic environment in which the Bank operates.
55
Financial Statements
2.2 Adoption of New and Amended PFRS
(a) Effective in 2016 that are Relevant to the Bank
The Bank adopted for the first time the following amendment and annual improvements to PFRS, which are mandatorily effective for annual periods beginning on or after January 1, 2016:
PAS 1 (Amendments): Presentation of Financial Statements – Disclosure Initiative
PAS 16 and 38 (Amendments):
Property, Plant and Equipment, and Intangible Assets – Clarification of Acceptable Methods of Depreciation and Amortization
PAS 16 and 41 (Amendments):
Property, Plant and Equipment, and Agriculture – Bearer Plants
Annual Improvements: Annual Improvements to PFRS (2012-2014 Cycle)
Discussed below and in the succeeding pages are the relevant information about these amendment and improvements.
(i) PAS 1 (Amendments), Presentation of Financial Statements – Disclosure Initiative. The amendments encourage entities to apply professional judgment in presenting and disclosing information in the financial statements. Accordingly, they clarify that materiality applies to the whole financial statements and an entity shall not reduce the understandability of the financial statements by obscuring material information with immaterial information or by aggregating material items that have different natures or functions. Moreover, the amendments clarify that an entity’s share in other comprehensive income of associates and joint ventures accounted for using equity method should be presented based on whether or not such other comprehensive income item will subsequently be reclassified to profit or loss. They further clarify that in determining the order of presenting the notes and disclosures, an entity shall consider the understandability and comparability of the financial statements. The amendments did not have a significant impact in the Bank’s financial statements as these merely clarify existing requirements.
(ii) PAS 16 (Amendments), Property, Plant and Equipment, and PAS 38 (Amendments), Intangible Assets – Clarification of Acceptable Methods of Depreciation and Amortization. The amendments in PAS 16 clarify that a depreciation method that is based on revenue that is generated by an activity that includes the use of an asset is not appropriate for property, plant and equipment. In addition, amendments to PAS 38 introduce a rebuttable presumption that an amortization method that is based on the revenue generated by an activity that includes the use of an intangible asset is not appropriate, which can only be overcome in limited circumstances where the intangible asset is expressed as a measure of revenue, or when it can be demonstrated that revenue and the consumption of the economic benefits of an intangible asset are highly correlated. The amendments also provide guidance that the expected future reductions in the selling price of an item that was produced using the asset could indicate an expectation of technological or commercial obsolescence of an asset, which may reflect a reduction of the future economic benefits embodied in the asset. The amendments did not have a significant impact in the Bank’s financial statements as these merely clarify existing requirements.
(iii) PAS 16 (Amendments), Property, Plant and Equipment, and PAS 41 (Amendments), Agriculture – Bearer Plants. The amendments define a bearer plant as a living plant that is used in the production or supply of agricultural produce, is expected to bear produce for more than one period and has a remote likelihood of being sold as agricultural produce, except for incidental scrap sales. On this basis, bearer plant is now included within the scope of PAS 16 rather than PAS 41, allowing such assets to be accounted for as property, plant and equipment and to be measured after initial recognition at cost or revaluation basis in accordance with PAS 16. The amendments further clarify that produce growing on bearer plants remains within the scope of PAS 41. The amendments did not have a significant impact in the Bank’s financial statements as these merely clarify existing requirements.

56
(iv) Annual Improvements to PFRS (2012-2014 Cycle). Among the improvements, PAS 19 (Amendments), Employee Benefits – Discount Rate: Regional Market Issue is relevant to the Bank but management does not expect these to have material impact on the Bank’s financial statements: The amendments clarify that the currency and term of the high quality corporate bonds which were used to determine the discount rate for post-employment benefit obligations shall be made consistent with the currency and estimated term of the post-employment benefit obligations.
(b) Effective in 2016 that are not Relevant to the Bank
The following new PFRS, amendements and annual improvements to existing standards are mandatorily effective for annual periods beginning on or after January 1, 2016 but are not relevant to the Bank’s financial statements:
PFRS 11 (Amendments): Joint Arrangements – Accounting for Acquisitions of Interests in Joint Operations
PFRS 10, PFRS 12 and PAS 28 (Amendments):
Consolidated Financial Statements, Disclosure of Interests in Other Entities, and Investments in Associates and Joint Ventures – Investment Entities – Applying the Consolidation Exception
PFRS 14: Regulatory Deferral Accounts
PAS 27 (Amendments): Separate Financial Statements – Equity Method in Separate Financial Statements
Annual Improvements to PFRS (2012-2014 Cycle) PFRS 5 (Amendments):
Non-current Assets Held for Sale and Discontinued Operations – Changes in Methods of Disposal
PFRS 7 (Amendments): Financial Instruments: Disclosures – Applicability of the Amendments to PFRS 7 to Condensed Interim Financial Statements
PFRS 7 (Amendments): Financial Instruments: Disclosures – Servicing Contracts
PAS 34 (Amendments): Interim Financial Reporting – Disclosure of Information “Elsewhere in the Interim Financial Report”
(c) Effective Subsequent to 2016 but not Adopted Early
There are new PFRS and amendments to existing standards effective for annual periods subsequent to 2016, which are adopted by the FRSC. Management will adopt the relevant pronouncements, presented below and in the succeeding pages, in accordance with their transitional provisions; and, unless otherwise stated, none of these are expected to have significant impact on the Bank’s financial statements.
(i) PAS 7 (Amendments), Statement of Cash Flows – Disclosure Initiative (effective from January 1, 2017). The amendments are designed to improve the quality of information provided to users of financial statements about changes in an entity’s debt and related cash flows (and non-cash changes). They require an entity to provide disclosures that enable users to evaluate changes in liabilities arising from financing activities. An entity applies its judgment when determining the exact form and content of the disclosures needed to satisfy this requirement. Moreover, they suggest a number of specific disclosures that may be necessary in order to satisfy the above requirement, including: (a) changes in liabilities arising from financing activities caused by changes in financing cash flows, foreign exchange rates or fair values, or obtaining or losing control of subsidiaries or other businesses; and, (b) a reconciliation of the opening and closing balances of liabilities arising from financing activities in the statement of financial position including those changes identified immediately above.
57
Financial Statements
(ii) PAS 12 (Amendments), Income Taxes – Recognition of Deferred Tax Assets for Unrealized Losses (effective from January 1, 2017). The focus of the amendments is to clarify how to account for deferred tax assets related to debt instruments measured at fair value, particularly where changes in the market interest rate decrease the fair value of a debt instrument below cost. The amendments provide guidance in the following areas where diversity in practice previously existed: (a) existence of a deductible temporary difference; (b) recovering an asset for more than its carrying amount; (c) probable future taxable profit against which deductible temporary differences are assessed for utilization; and, (d) combined versus separate assessment of deferred tax asset recognition for each deductible temporary difference.
(iii) PFRS 9 (2014), Financial Instruments (effective from January 1, 2018). This new standard on financial instruments will eventually replace PAS 39 and PFRS 9 (2009, 2010 and 2013 versions). This standard contains, among others, the following:
• three principal classification categories for financial assets based on the business model on how an entity is managing its financial instruments;
• an expected loss model in determining impairment of all financial assets that are not measured at fair value through profit or loss (FVTPL), which generally depends on whether there has been a significant increase in credit risk since initial recognition of a financial asset; and,
• a new model on hedge accounting that provides significant improvements principally by aligning hedge accounting more closely with the risk management activities undertaken by entities when hedging their financial and non-financial risk exposures.
In accordance with the financial asset classification principle of PFRS 9 (2014), a financial asset is classified and measured at amortized cost if the asset is held within a business model whose objective is to hold financial assets in order to collect the contractual cash flows that represent solely payments of principal and interest (SPPI) on the principal outstanding. Moreover, a financial asset is classified and subsequently measured at fair value through other comprehensive income if it meets the SPPI criterion and is held in a business model whose objective is achieved by both collecting contractual cash flows and selling the financial assets. All other financial assets are measured at FVTPL.
In addition, PFRS 9 (2014) allows entities to make an irrevocable election to present subsequent changes in the fair value of an equity instrument that is not held for trading in other comprehensive income.
The accounting for embedded derivatives in host contracts that are financial assets is simplified by removing the requirement to consider whether or not they are closely related, and, in most arrangements, does not require separation from the host contract.
For liabilities, the standard retains most of the PAS 39 requirements which include amortized cost accounting for most financial liabilities, with bifurcation of embedded derivatives. The amendment also requires changes in the fair value of an entity’s own debt instruments caused by changes in its own credit quality to be recognized in other comprehensive income rather than in profit or loss.
The Bank does not expect to implement and adopt any version of PFRS 9 until its effective date. In addition, management is currently assessing the impact of PFRS 9 on the financial statements of the Bank and it will conduct a comprehensive study of the potential impact of this standard prior to its mandatory adoption date to assess the impact of all changes.
(iv) PFRS 15, Revenue from Contracts with Customers (effective from January 1, 2018). The standard will replace PAS 18, Revenue, and PAS 11, Construction Contracts, the related Interpretations on revenue recognition: IFRIC 13, Customer Loyalty Programmes, IFRIC 15, Agreement for the Construction of Real Estate, IFRIC 18, Transfer of Assets from Customers and Standing Interpretations Committee 31, Revenue – Barter Transactions Involving Advertising Services, effective January 1, 2018. This new standard establishes a comprehensive framework for determining when to recognize revenue and how much revenue to recognize. The core principle in the said framework is for an entity to recognize revenue to depict the transfer of promised goods or services to the customer in an amount that reflects the consideration to which the entity expects to be entitled in exchange for those goods or services.
Management is currently assessing the impact of this standard on the Bank’s financial statements.

58
(v) PFRS 16, Leases (effective from January 1, 2019). The new standard will eventually replace PAS 17, Leases.
For lessees, it requires to account for leases “on-balance sheet” by recognizing a “right of use” asset and a lease liability. The lease liability is initially measured as the present value of future lease payments. For this purpose, lease payments include fixed, non-cancellable payments for lease elements, amounts due under residual value guarantees, certain types of contingent payments and amounts due during optional periods to the extent that extension is reasonably certain. In subsequent periods, the “right-of-use” asset is accounted for similarly to a purchased asset and depreciated or amortized. The lease liability is accounted for similarly to as financial liability using the effective interest method. However, the new standard provides important reliefs or exemptions for short-term leases and leases of low value assets. If these exemptions are used, the accounting is similar to operating lease accounting under PAS 17 where lease payments are recognized as expenses on a straight-line basis over the lease term or another systematic basis (if more representative of the pattern of the lessee’s benefit).
For lessors, lease accounting is similar to PAS 17’s. In particular, the distinction between finance and operating leases is retained. The definitions of each type of lease, and the supporting indicators of a finance lease, are substantially the same as PAS 17’s. The basic accounting mechanics are also similar, but with some different or more explicit guidance in few areas. These include variable payments, sub-leases, lease modifications, the treatment of initial direct costs and lessor disclosures.
Management is currently assessing the impact of this new standard in its financial statements.
2.3 Financial Assets
Financial assets are recognized when the Bank becomes a party to the contractual terms of the financial instrument. For purposes of classifying financial assets, an instrument is considered as an equity instrument if it is non-derivative and meets the definition of equity for the issuer in accordance with the criteria of PAS 32. All other non-derivative financial instruments are treated as debt instruments.
(a) Classification and Measurement of Financial Assets
Financial assets other than those designated and effective as hedging instruments are classified into the following categories: financial assets at FVTPL, loans and receivables, held-to-maturity (HTM) investments and available-for-sale (AFS) financial assets. Financial assets are assigned to the different categories by management on initial recognition, depending on the purpose for which the investments were acquired.
Regular purchases and sales of financial assets are recognized on their trade date. All financial assets that are not classified as at FVTPL are initially recognized at fair value plus any directly attributable transaction costs. Financial assets carried at FVTPL are initially recorded at fair value and the related transaction costs are recognized in profit or loss. A more detailed description of the four categories of financial assets is as follows:
(i) Financial Assets at FVTPL
This category includes financial assets that are either classified as held for trading or that meets certain conditions and are designated by the entity to be carried at fair value through profit or loss upon initial recognition. All derivatives fall into this category, except for those designated and effective as hedging instruments.
Financial assets at FVTPL are measured at fair value, and changes therein are recognized in profit or loss. Financial assets (except derivatives and financial instruments originally designated as financial assets at fair value through profit or loss) may be reclassified out of FVTPL category if they are no longer held for the purpose of being sold or repurchased in the near term.

59
Financial Statements
(ii) Loans and Receivables
Loans and receivables are non-derivative financial assets with fixed or determinable payments that are not quoted in an active market. They arise when the Bank provides money or services directly to a debtor with no intention of trading the receivables.
The Bank’s financial assets categorized as loans and receivables are presented as Cash and Other Cash Items, Due From BSP, Due From Other Banks, Loans and Receivables, Security deposit (presented as part of Advance rental and security deposits under Prepayments and Other Resources in the statement of financial position) and Sales contract receivable (presented as part of Prepayments and Other Resources in the statement of financial position). Cash and other cash items, due from BSP and due from other banks include cash on hand, savings and demand deposits and short-term, highly liquid investments with original maturities of three months or less, readily convertible to known amounts of cash and which are subject to insignificant risk of changes in value.
Loans and receivables are subsequently measured at amortized cost using the effective interest method, less impairment loss, if any.
(iii) HTM Investments
This category includes non-derivative financial assets with fixed or determinable payments and a fixed date of maturity that the Bank has the positive intention and ability to hold to maturity. Investments intended to be held for an undefined period are not included in this classification. If the Bank were to sell other than an insignificant amount of HTM investments, the whole category would be tainted and reclassified to AFS financial assets. The Bank currently holds government and corporate bonds designated into this category.
Subsequent to initial recognition, HTM investments are measured at amortized cost using the effective interest method, less impairment losses, if any. Impairment loss, which is the difference between the carrying value and the present value of estimated future cash flows of the investment, is recognized when there is objective evidence that the investment has been impaired.
(iv) AFS Financial Assets
This category includes non-derivative financial assets that are either designated to this category or do not qualify for inclusion in any of the other categories of financial assets. The Bank’s AFS financial assets include government bonds.
All financial assets within this category are subsequently measured at fair value, except for equity instruments that do not have a quoted market price in an active market and whose fair value cannot be reliably measured which are measured at cost, less impairment loss, if any. Gains and losses are recognized in other comprehensive income, net of any income tax effects, and are reported as part of the Revaluation Reserves account in equity, except for interest and dividend income, impairment losses and foreign exchange differences on monetary assets, which are recognized in profit or loss.
When the financial asset is disposed of or is determined to be impaired, that is, when there is a significant or prolonged decline in the fair value of the security below its cost, the cumulative fair value gains or losses recognized in other comprehensive income is reclassified from equity to profit or loss and is presented as reclassification adjustment within other comprehensive income even though the financial asset has not been derecognized.

60
(b) Impairment of Financial Assets
The Bank assesses at the end of each reporting period whether there is objective evidence that a financial asset or group of financial assets is impaired. A financial asset or a group of financial assets is impaired and impairment losses are incurred if, and only if, there is objective evidence of impairment as a result of one or more events that occurred after the initial recognition of the asset (a loss event) and that loss event has an impact on the estimated future cash flows of the financial asset or group of financial assets that can be reliably estimated.
Objective evidence that a financial asset or group of assets is impaired includes observable data that comes to the attention of the Bank about certain loss events, including, among others: (i) significant financial difficulty of the issuer or debtor; (ii) a breach of contract, such as a default or delinquency in interest or principal payments; (iii) it is probable that the borrower will enter bankruptcy or other financial reorganization; (iv) the disappearance of an active market for that financial asset because of financial difficulties; or, (v) observable data indicating that there is a measurable decrease in the estimated future cash flows from a group of financial assets since the initial recognition of those assets, although the decrease cannot yet be identified with the individual financial assets in the group.
The Bank recognizes impairment loss based on the category of financial assets as follows:
(i) Carried at Amortized Cost – Loans and Receivables and HTM Investments
For assets carried at amortized cost, the Bank first assesses whether objective evidence of impairment exists individually for financial assets that are individually significant and individually or collectively for financial assets that are not individually significant. If the Bank determines that no objective evidence of impairment exists for an individually assessed financial asset, whether significant or not, the Bank includes the asset in a group of financial assets with similar credit risk characteristics and collectively assesses them for impairment. Assets that are individually assessed for impairment and for which an impairment loss is or continues to be recognized are not included in a collective assessment of impairment.
If there is objective evidence that an impairment loss on loans and receivable or HTM investments carried at amortized cost has been incurred, the amount of the loss is measured as the difference between the asset’s carrying amount and the present value of estimated future cash flows (excluding future credit losses that have not been incurred) discounted at the financial asset’s original effective interest rate.
The carrying amount of the asset is reduced through the use of an allowance account and the amount of the loss is recognized in profit or loss. If a loan or HTM investment has a variable interest rate, the discount rate for measuring any impairment loss is the current effective interest rate determined under the contract. When practicable, the Bank may measure impairment on the basis of an instrument’s fair value using an observable market price.
The calculation of the present value of the estimated future cash flows of a collateralized financial asset reflects the cash flows that may result from foreclosure less costs for obtaining and selling the collateral, whether or not foreclosure is probable.
For the purpose of a collective evaluation of impairment, financial assets are grouped on the basis of similar credit risk characteristics (i.e., on the basis of the Bank’s grading process that considers asset type, industry, geographical location, collateral type, past due status and other relevant factors). Those characteristics are relevant to the estimation of future cash flows for groups of such assets by being indicative of the debtors’ ability to pay all amounts due according to the contractual terms of the assets being evaluated.
Future cash flows in a group of financial assets that are collectively evaluated for impairment are estimated on the basis of the contractual cash flows of the assets and historical loss experience for assets with credit risk characteristics similar to those in the group. Historical loss experience is adjusted on the basis of current observable data to reflect the effects of current conditions that did not affect the period on which the historical loss experience is based and to remove the effects of conditions in the historical period that do not exist currently.
61
Financial Statements
Estimates of changes in future cash flows for groups of assets should reflect and be consistent with changes in related observable data from period to period. The methodologies and assumptions used for estimating future cash flows are reviewed regularly by the Bank to reduce any differences between loss estimates and actual loss experience.
When a loan is uncollectible subject to BSP guidelines, it may be written off against the related allowance for loan impairment. Such loans are written off after all the necessary procedures, including approval from the management, the BOD and the BSP, have been completed and the amount of the loss has been determined. Subsequent recoveries of amounts previously written off are presented as part of Other Income in the statement of profit or loss.
If, in a subsequent period, the amount of the impairment loss decreases and the decrease can be related objectively to an event occurring after the impairment was recognized (such as an improvement in the debtor’s credit rating), the previously recognized impairment loss is reversed by adjusting the allowance account. The amount of the reversal is recognized in profit or loss.
When possible, the Bank seeks to restructure loans rather than to take possession of collateral. This may involve extending payment arrangements and the agreement of new loan conditions. Once the terms have been renegotiated, the loan is no longer considered past due. Management continuously reviews restructured loans to ensure that all criteria are met and that future payments are likely to occur. The loans continue to be subject to an individual or collective impairment assessment, calculated using the loans’ original effective interest rate. The difference between the recorded sale of the original loan and the present value of the restructured cash flows, discounted at the original effective interest rate, is recognized in profit or loss as part of Impairment Losses.
(ii) Carried at Fair Value – AFS Financial Assets
When a decline in the fair value of an AFS financial asset has been recognized in other comprehensive income and there is objective evidence that the asset is impaired, the cumulative loss – measured as the difference between the acquisition cost (net of any principal repayment and amortization) and current fair value, less any impairment loss on that financial asset previously recognized in profit or loss – is reclassified from Revaluation Reserves to profit or loss as a reclassification adjustment even though the financial asset has not been derecognized.
Impairment losses recognized in profit or loss on equity instruments are not reversed through profit or loss. Reversal of impairment losses is recognized in other comprehensive income, except for financial assets that are debt securities which are recognized in profit or loss only if the reversal can be objectively related to an event occurring after the impairment loss was recognized.
(c) Items of Income and Expense Related to Financial Assets
All income and expenses, including impairment losses, relating to financial assets that are recognized in profit or loss are presented as part of Interest Income or Interest Expense, Impairment Losses, Gain on Disposal of AFS Financial Assets, Dividend Income and Recoveries from Accounts Written-off (presented as part of Other Income) in the statement of profit or loss.
Non-compounding interest, dividend income and other cash flows resulting from holding financial assets are recognized in profit or loss when earned, regardless of how the related carrying amount of financial assets is measured.
(d) Derecognition of Financial Assets
The financial assets (or where applicable, a part of a financial asset or part of a group of financial assets) are derecognized when the contractual rights to receive cash flows from the financial instruments expire, or when the financial assets and all substantial risks and rewards of ownership have been transferred to another party. If the Bank neither transfers nor retains substantially all the risks and rewards of ownership and continues to control the transferred asset, the Bank recognizes its retained interest in the asset and an associated liability for amounts it may have to pay. If the Bank retains substantially all the risks and rewards of ownership of a transferred financial asset, the Bank continues to recognize the financial asset and also recognizes a collateralized borrowing for the proceeds received.

62
2.4 Bank Premises, Furniture, Fixtures and Equipment
Bank premises, furniture, fixtures and equipment, except for land, are carried at acquisition cost or construction cost less subsequent depreciation and amortization and any impairment losses. Land held for administration is stated at cost less any impairment losses.
The cost of an asset comprises its purchase price and directly attributable costs of bringing the asset to working condition for its intended use. Expenditures for additions, major improvements and renewals are capitalized while expenditures for repairs and maintenance are charged to expense as incurred.
Depreciation is computed on the straight-line basis over the estimated useful lives of the assets as follows:
Buildings 20-25 yearsFurniture, fixtures and equipment 3-5 years
Leasehold and land improvements are amortized over the terms of the related leases or the useful lives of the improvements of five years, whichever is shorter. In 2016, the Bank has standardized its estimated useful life for all leasehold and land improvements to five years.
Construction in progress represents properties under construction and is stated at cost. This includes cost of construction and other direct costs. The account is not depreciated until such time that the assets are completed and available for use.
An asset’s carrying amount is written down immediately to its recoverable amount if the asset’s carrying amount is greater than its estimated recoverable amount (see Note 2.14).
The residual values, estimated useful lives and method of depreciation of bank premises, furniture, fixtures and equipment are reviewed, and adjusted if appropriate, at the end of each reporting period. In 2016, the estimated useful life of the Bank’s buildings was revised from 20 to 25 years in harmonization with the Parent Bank policy.
Fully-depreciated and fully-amortized assets are retained in the accounts until they are no longer in use and no further charge for depreciation is made in respect for those assets.
An item of bank premises, furniture, fixtures and equipment, including the related accumulated depreciation, amortization and impairment losses, is derecognized upon disposal or when no future economic benefits are expected to arise from the continued use of the asset. Any gain or loss arising on derecognition of the asset (calculated as the difference between the net disposal proceeds and the carrying amount of the item) is included in profit or loss in the year the item is derecognized.
2.5 Investment Properties
Investment properties include parcels of land and buildings and related improvements acquired by the Bank from defaulting borrowers not held for sale in the next 12 months. These are initially measured at acquisition cost which comprise the carrying amount of the related loan after adjustments for unamortized premium or discount less allowance for credit losses plus accrued interest and directly attributable costs. Subsequently, investment properties are stated at cost less accumulated depreciation and any impairment in value.
Direct operating expenses related to investment properties, such as repairs and maintenance, and real estate taxes are normally charged to profit or loss in the period in which these costs are incurred.
An asset’s carrying amount is written down immediately to its recoverable amount if the asset’s carrying amount is greater than its estimated recoverable amount (see Note 2.14).

63
Financial Statements
Investment property is derecognized upon disposal or when permanently withdrawn from use and no future economic benefit is expected from its disposal. Any gain or loss on the retirement or disposal of an investment property is recognized in profit or loss in the year of retirement or disposal.
2.6 Prepayments and Other Resources
Prepayments and other resources pertain to other resources controlled by the Bank as a result of past events. They are recognized in the financial statements when it is probable that the future economic benefits will flow to the entity and the asset has a cost or value that can be measured reliably.
2.7 Intangible Assets
Intangible assets include license and software and other intangibles which are accounted for under the cost model. The cost of the asset is the amount of cash or cash equivalents paid or the fair value of the other considerations given up to acquire an asset at the time of its acquisition or production.
License, which has an indefinite useful life, is accounted for at cost less any accumulated impairment losses.
Capitalized costs of software and other intangibles are amortized on a straight-line basis over the estimated useful lives (ranging from three to ten years) as the lives of these intangible assets are considered finite. Acquired computer software licenses are capitalized on the basis of the costs incurred to acquire and install the specific software.
When an intangible asset is disposed of, the gain or loss on disposal is determined as the difference between the proceeds and the carrying amount of the asset and is recognized in profit or loss.
These intangible assets are reviewed for impairment annually or more frequently if events or changes in circumstances indicate that the carrying value may be impaired (see Note 2.14).
License and software and other intangible assets are presented as part of Prepayments and Other Resources account in the statement of financial position.
2.8 Financial Liabilities
Financial liabilities, which include deposit liabilities, and accrued expenses and other liabilities (excluding tax-related payables and post-employment defined benefit obligation), are recognized when the Bank becomes a party to the contractual terms of the instrument. All interest-related charges incurred on financial liabilities are recognized as an expense in profit or loss under the caption Interest Expense in the statement of profit or loss.
Deposit liabilities are recognized initially at fair value and subsequently measured at amortized cost.
Accrued expenses and other liabilities are recognized initially at their fair value and subsequently measured at amortized cost less settlement payments.
Dividend distributions to shareholders, if any, are recognized as financial liabilities when the dividends are approved by the shareholders and the BSP.
Financial liabilities are derecognized from the statement of financial position only when the obligations are extinguished either through discharge, cancellation or expiration. The difference between the carrying amount of the financial liability derecognized and the consideration paid or payable is recognized in profit or loss.
64
2.9 Offsetting Financial Instruments
Financial assets and liabilities are offset and the resulting net amount, considered as a single financial asset or financial liability, is reported in the statement of financial position when the Bank currently has a legally enforceable right to set-off the recognized amounts and there is an intention to settle on a net basis, or realize the asset and settle the liability simultaneously. The right of set-off must be available at the end of the reporting period, that is, it is not contingent on a future event. It must also be enforceable in the normal course of business, in the event of default, and in the event of insolvency or bankruptcy; and must be legally enforceable for both entity and all counterparties to the financial instruments.
2.10 Provisions and Contingencies
Provisions are recognized when present obligations will probably lead to an outflow of economic resources and they can be estimated reliably even if the timing or amount of the outflow may still be uncertain. A present obligation arises from the presence of a legal or constructive obligation that has resulted from past events.
Provisions are measured at the estimated expenditure required to settle the present obligation, based on the most reliable evidence available at the end of the reporting period, including the risks and uncertainties associated with the present obligation. Where there are a number of similar obligations, the likelihood that an outflow will be required in settlement is determined by considering the class of obligations as a whole. When time value of money is material, long-term provisions are discounted to their present values using a pretax rate that reflects market assessments and the risks specific to the obligation. The increase in the provision due to passage of time is recognized as interest expense. Provisions are reviewed at the end of each reporting period and adjusted to reflect the current best estimate.
In those cases where the possible outflow of economic resource as a result of present obligations is considered improbable or remote, or the amount to be provided for cannot be measured reliably, no liability is recognized in the financial statements. Similarly, possible inflows of economic benefits to the Bank that do not yet meet the recognition criteria of an asset are considered contingent assets, hence, are not recognized in the financial statements. On the other hand, any reimbursement that the Bank can be virtually certain to collect from a third party with respect to the obligation is recognized as a separate asset not exceeding the amount of the related provision.
2.11 Revenue and Expense Recognition
Revenue comprises revenue from rendering of services measured by reference to the fair value of consideration received or receivable by the Bank for the services rendered.
Revenue is recognized to the extent that the revenue can be reliably measured; it is probable that future economic benefits will flow to the Bank; and the costs incurred or to be incurred can be measured reliably. In addition, the following specific recognition criteria must also be met before the significant revenue is recognized.
(a) Interest – Interest income and expenses are recognized in profit or loss for all instruments measured at amortized cost using the effective interest method.
The effective interest method is a method of calculating the amortized cost of a financial asset or a financial liability and of allocating the interest income or interest expense over the relevant period. The effective interest rate is the rate that exactly discounts estimated future cash payments or receipts through the expected life of the financial instrument or, when appropriate, a shorter period to the net carrying amount of the financial asset or financial liability. When calculating the effective interest rate, the Bank estimates cash flows considering all contractual terms of the financial instrument but does not consider future credit losses. The calculation includes all fees and points paid or received between parties to the contract that are an integral part of the effective interest rate, transaction costs and all other premiums or discounts.
65
Financial Statements
(b) Service charges, fees and commissions – Revenue is generally recognized when the service has been provided.
(c) Gain on disposal of AFS financial assets – Income is recognized when the ownership of the financial assets is transferred to the buyer. It is presented as part of Other Income in the statement of profit or loss. Consequently, the result of the revaluation of such asset at the end of the reporting period is presented as part of Fair Value Gain or Loss on AFS financial assets in the statement of comprehensive income.
Cost and expenses are recognized in profit or loss upon utilization of goods or services or at the date they are incurred. All finance costs are reported in profit or loss on an accrual basis.
2.12 Leases
The Bank is a lessee in various lease agreements. Leases which do not transfer to the Bank substantially all the risks and benefits of ownership of the asset are classified as operating leases. Operating lease payments (net of any incentive received from the lessor) are recognized as expense in profit or loss on a straight-line basis over the lease term. Associated costs, such as repairs and maintenance and insurance, are expensed as incurred.
The Bank determines whether an arrangement is, or contains, a lease based on the substance of the arrangement. It makes an assessment of whether the fulfillment of the arrangement is dependent on the use of a specific asset or assets and the arrangement conveys a right to use the asset.
2.13 Foreign Currency Transactions and Translation
The accounting records of the Bank are maintained in Philippine pesos. Foreign currency transactions during the year are translated into the functional currency at exchange rates which approximate those prevailing on transaction dates.
Foreign currency gains and losses resulting from the settlement of such transactions and from the translation at year-end exchange rates of monetary assets and liabilities denominated in foreign currencies are recognized in profit or loss.
2.14 Impairment of Non-financial Assets
The Bank’s bank premises, furniture, fixtures and equipment, investment properties, software and other intangibles and goodwill (both presented as part of Prepayments and Other Resources) are subject to impairment testing. Individual assets or cash-generating units except goodwill is tested for impairment whenever events or changes in circumstances indicate that the carrying amount may not be recoverable. Goodwill, on the other hand, are subject to annual test of impairment.
For purposes of assessing impairment, assets are grouped at the lowest levels for which there are separately identifiable cash flows (cash-generating units). As a result, assets are tested for impairment either individually or at the cash-generating unit level.
Impairment loss is recognized for the amount by which the asset’s or cash-generating unit’s carrying amount exceeds its recoverable amounts which is the higher of its fair value less costs to sell and its value in use. In determining value in use, management estimates the expected future cash flows from each cash-generating unit and determines the suitable interest rate in order to calculate the present value of those cash flows. The data used for impairment testing procedures are directly linked to the Bank’s latest approved budget, adjusted as necessary to exclude the effects of asset enhancements. Discount factors are determined individually for each cash-generating unit and reflect management’s assessment of respective risk profiles, such as market and asset-specific risk factors.
All assets are subsequently reassessed for indications that an impairment loss previously recognized may no longer exist. An impairment loss is reversed if the asset’s or cash generating unit’s recoverable amount exceeds its carrying amount.

66
2.15 Employee Benefits
The Bank provides post-employment benefits to employees through a defined benefit plan and defined benefit contribution plan, as well as bonus plans which are recognized as those stated below and in the succeeding page.
(a) Post-employment Defined Benefit Plan
A defined benefit plan is a post-employment plan that defines an amount of post-employment benefit that an employee will receive on retirement, usually dependent on one or more factors such as age, years of service and salary. The legal obligation for any benefits from this kind of post-employment plan remains with the Bank, even if plan assets for funding the defined benefit plan have been acquired. Plan assets may include assets specifically designated to a long-term benefit fund, as well as qualifying insurance policies. The Bank’s post-employment defined benefit plan covers all regular full-time employees. The pension plan is tax-qualified, noncontributory and administered by a trustee.
The liability recognized in the statement of financial position for a defined benefit plan is the present value of the defined benefit obligation at the end of the reporting period less the fair value of plan assets. The defined benefit obligation is calculated every two years by independent actuaries using the projected unit credit method. The present value of the defined benefit obligation is determined by discounting the estimated future cash outflows for expected benefit payments using a discount rate derived from the interest rates of a zero coupon government bond as published by Philippine Dealing & Exchange Corp., that are denominated in the currency in which the benefits will be paid and that have terms to maturity approximating to the terms of the related post-employment liability.
Remeasurements, comprising of actuarial gains and losses arising from experience adjustments and changes in actuarial assumptions and the return on plan assets (excluding amount included in net interest) are reflected immediately in the statement of financial position with a charge or credit recognized in other comprehensive income in the period in which they arise. Net interest is calculated by applying the discount rate at the beginning of the period, taking account of any changes in the net defined benefit liability or asset during the period as a result of contributions and benefit payments. Net interest is reported as part of Interest Income or Interest Expense in the statement of profit or loss.
Past-service costs are recognized immediately in profit or loss in the period of a plan amendment or curtailment.
(b) Post-employment Defined Contribution Plan
A defined contribution plan is a post-employment plan under which the Bank pays fixed contributions into an independent entity, such as the Social Security System. The Bank has no legal or constructive obligations to pay further contributions after payment of the fixed contribution. The contributions recognized in respect of defined contribution plans are expensed as they fall due. Liabilities and assets may be recognized if underpayment or prepayment has occurred.
(c) Bonus Plans
The Bank recognizes a liability and an expense for bonuses, based on a formula that takes into consideration the profit attributable to the Bank’s shareholders after certain adjustments. The Bank recognizes a provision where it is contractually obliged to pay the benefits, or where there is a past practice that has created a constructive obligation.
67
Financial Statements
2.16 Income Taxes
Tax expense recognized in profit or loss comprises the sum of deferred tax and current tax not recognized in other comprehensive income or directly in equity, if any.
Current tax assets or liabilities comprise those claims from, or obligations to, fiscal authorities relating to the current or prior reporting period, that are uncollected or unpaid at the end of the reporting period. They are calculated using the tax rates and tax laws applicable to the fiscal periods to which they relate, based on the taxable profit for the year. All changes to current tax assets or liabilities are recognized as a component of tax expense in profit or loss.
Deferred tax is accounted for using the liability method, on temporary differences at the end of the reporting period between the tax base of assets and liabilities and their carrying amounts for financial reporting purposes. Under the liability method, with certain exceptions, deferred tax liabilities are recognized for all taxable temporary differences and deferred tax assets are recognized for all deductible temporary differences and the carryforward of unused tax losses and unused tax credits to the extent that it is probable that taxable profit will be available against which the deductible temporary differences can be utilized. Unrecognized deferred tax assets are reassessed at the end of each reporting period and are recognized to the extent that it has become probable that future taxable profit will be available to allow such deferred tax assets to be recovered.
Deferred tax assets and liabilities are measured at the tax rates that are expected to apply in the period when the asset is realized or the liability is settled provided such tax rates have been enacted or substantively enacted at the end of the reporting period.
The carrying amount of deferred tax assets is reviewed at the end of each reporting period and reduced to the extent that it is probable that sufficient taxable profit will be available to allow all or part of the deferred tax asset to be utilized.
The measurement of deferred tax liabilities and assets reflects the tax consequences that would follow from the manner in which the Bank expects, at the end of the reporting period, to recover or settle the carrying amount of its assets and liabilities.
Most changes in deferred tax assets or liabilities are recognized as a component of tax expense in profit or loss, except to the extent that it relates to items recognized in other comprehensive income or directly in equity. In this case, the tax is also recognized in other comprehensive income or directly in equity, respectively.
Deferred tax assets and deferred tax liabilities are offset if the Bank has a legally enforceable right to set off current tax assets against current tax liabilities and the deferred taxes related to the same entity and the same taxation authority.
2.17 Related Party Relationships and Transactions
Related party transactions are transfers of resources, services or obligations between the Bank and its related parties, regardless whether a price is charged.
Parties are considered to be related if one party has the ability to control the other party or exercise significant influence over the other party in making financial and operating decisions. These parties include: (a) individuals owning, directly or indirectly through one or more intermediaries, control or are controlled by, or under common control with the Bank; (b) associates; (c) individuals owning, directly or indirectly, an interest in the voting power of the Bank that gives them significant influence over the Bank and close members of the family of any such individual; and, (d) the Bank’s funded post-employment defined benefit plan.
In considering each possible related party relationship, attention is directed to the substance of the relationship and not merely on the legal form.

68
2.18 Equity
Capital stock represents the nominal value of shares that have been issued.
Other reserves represent the difference between the net assets received from ONRBI and RBNCI and the amount of the shares issued which basically pertains to the net earnings of ONRBI and RBNCI prior to consolidation. This is subsequently reduced by the amount of stock and cash dividends declared which were effected against Other Reserves as approved by the BSP.
Revaluation reserves comprise fair value gains on revaluation of AFS financial assets and remeasurements of post-employment defined benefit plan.
Surplus represents all current and prior period results of operations as reported in the statement of profit or loss, reduced by the amounts of dividends declared.
2.19 Earnings Per Share
Basic earnings per share (EPS) is computed by dividing net profit by the weighted average number of common shares issued and outstanding during the period, after retroactive adjustment for any stock dividend declared in the current period.
The diluted EPS is computed by dividing net profit by the weighted average number of outstanding and dilutive potential common shares. Both basic and dilutive EPS amounts are computed after giving retroactive effect to stock dividends declared during the current period, if any.
2.20 Events After the End of the Reporting Period
Any post-year-end event that provides additional information about the Bank’s financial position at the end of the reporting period (adjusting event) is reflected in the financial statements. Post-year-end events that are not adjusting events, if any, are disclosed when material to the financial statements.
3. SIGNIFICANT ACCOUNTING JUDGMENTS AND ESTIMATES
The preparation of the Bank’s financial statements in accordance with PFRS requires management to make judgments and estimates that affect the amounts reported in the financial statements and related notes. Judgments and estimates are continually evaluated and are based on historical experience and other factors, including expectations of future events that are believed to be reasonable under the circumstances. Actual results may ultimately differ from these estimates.

69
Financial Statements
3.1 Critical Management Judgments in Applying Accounting Policies
In the process of applying the Bank’s accounting policies, management has made the following judgments, apart from those involving estimation, which have the most significant effect on the amounts recognized in the financial statements:
(a) Classification Financial Assets as HTM Investments
In classifying non-derivative financial assets with fixed or determinable payments and fixed maturity, such as bonds, as HTM investments, the Bank evaluates its intention and ability to hold such investments up to maturity. Management has confirmed its intention and determined its ability to hold the investments up to maturity. If the Bank fails to keep these investments to maturity other than for specific circumstances as allowed under the standard, it will be required to reclassify the whole class as AFS financial assets. In such a case, the investments would, therefore, be measured at fair value, not at amortized cost.
(b) Impairment of AFS Financial Assets
The determination when an investment is other-than-temporarily impaired requires significant judgment. In making this judgment, the Bank evaluates, among other factors, the duration and extent to which the fair value of an investment is less than its cost, and the financial health of and near-term business outlook for the investee, including factors such as industry and sector performance, changes in technology and operational and financing cash flows.
Based on the recent evaluation of information and circumstances affecting the Bank’s AFS financial assets, management concluded that the assets are not impaired as at December 31, 2016 and 2015. Future changes in those information and circumstances might significantly affect the carrying amount of the assets.
(c) Distinction between Investment Properties and Owner-managed Properties
The Bank determines whether a property qualifies as an investment property. In making its judgment, the Bank considers whether the property generates cash flows largely independent of the other assets held by an entity. Owner-occupied properties generate cash flows that are attributable not only to the property but also to other assets used in operations.
(d) Distinction between Operating and Finance Leases
The Bank has entered into various lease agreements as a lessee. Critical judgment was exercised by management to distinguish each lease agreement as either an operating or a finance lease by looking at the transfer or retention of significant risk and rewards of ownership of the properties covered by the agreements. Failure to make the right judgment will result in either overstatement or understatement of assets and liabilities. All of the Bank’s lease agreements are accounted for as operating leases.
(e) Recognition of Provisions and Contingencies
Judgment is exercised by management to distinguish between provisions and contingencies. Policies on recognition and disclosure of provisions and contingencies are discussed in Note 2.10 and disclosures of relevant contingencies are presented in Note 25.

70
3.2 Key Sources of Estimation Uncertainty
The following are the key assumptions concerning the future, and other key sources of estimation uncertainty at the end of the reporting period, that have a significant risk of causing a material adjustment to the carrying amounts of assets and liabilities within the next reporting period:
(a) Fair Value Measurement for Financial Instruments
Management applies valuation techniques to determine the fair value of financial instruments where active market quotes are not available. This requires management to develop estimates and assumptions based on market inputs, using observable data that market participants would use in pricing the instrument. Where such data is not observable, management uses its best estimate. Estimated fair values of financial instruments may vary from the actual prices that would be achieved in an arm’s length transaction at the end of the reporting period.
The carrying values of the Bank’s AFS financial assets and the amounts of fair value changes recognized during the years on those assets are disclosed in Note 9.
(b) Impairment of Loans and Receivables
Adequate amount of allowance for impairment is provided for specific and groups of accounts, where objective evidence of impairment exists. For loans receivables, the Bank evaluates these accounts based on available facts and circumstances, including, but not limited to, the length of the Bank’s relationship with the borrowers, the borrowers’ current credit status, average age of accounts, collection experience and historical loss experience. For other receivables, the Bank assesses the significant financial difficulty of the debtor or where applicable, the observable data indicating that there is a measurable decrease in the estimated future cash flows since the initial recognition of the financial asset, although the decrease cannot yet be identified.
The methodology and assumptions used in estimating future cash flows are reviewed regularly by the Bank to reduce any differences between loss estimates and actual loss experience.
The carrying value of loans and receivables and the analysis of allowance for impairment on such financial assets are shown in Notes 11 and 15, respectively.
(c) Estimation of Useful Lives of Bank Premises, Furniture, Fixtures and Equipment, Investment Properties, and Software and Other Intangible Assets
The Bank estimates the useful lives of bank premises, furniture, fixtures and equipment, investment properties, and software and other intangibles – presented as part of Prepayments and Other Resources account in the statements of financial position, based on the period over which the assets are expected to be available for use. The estimated useful lives of bank premises, furniture, fixtures and equipment, investment properties, and software and other intangibles are reviewed periodically and are updated if expectations differ from previous estimates due to physical wear and tear, technical or commercial obsolescence and legal or other limits on the use of the assets.
The carrying amounts of bank premises, furniture, fixtures and equipment, investment properties, and software and other intangibles are analyzed in Notes 12, 13 and 14, respectively. Based on management’s assessment as at December 31, 2016 and 2015, there is no change in estimated useful lives of these assets during those years. Actual results, however, may vary due to changes in estimates brought about by changes in factors mentioned above.

71
Financial Statements
(d) Determination of Realizable Amount of Deferred Tax Assets
The Bank reviews its deferred tax assets at the end of each reporting period and reduces the carrying amount to the extent that it is no longer probable that sufficient taxable profit will be available to allow all or part of the deferred tax assets to be utilized.
Management assessed that the deferred tax assets recognized as at December 31, 2016 and 2015 will be fully utilized in the coming years. The carrying value of deferred tax assets as of those dates is disclosed in Note 22.
(e) Impairment of Non-financial Assets
In assessing impairment, management estimates the recoverable amount of each asset or a cash-generating unit based on expected future cash flows and uses an interest rate to calculate the present value of those cash flows. Estimation uncertainty relates to assumptions about future operating results and the determination of a suitable discount rate (see Note 2.14). Though management believes that the assumptions used in the estimation of fair values reflected in the financial statements are appropriate and reasonable, significant changes in these assumptions may materially affect the assessment of recoverable values and any resulting impairment loss could have a material adverse effect on the results of operations.
Based on management’s assessment, impairment losses on non-financial assets were recognized in 2016 amounting to P0.8 million. No impairment loss was recognized both in 2015 and 2014 as disclosed in Note 15.
(f) Valuation of Post-employment Defined Benefit Obligation
The determination of the Bank’s obligation and cost of post-employment defined benefit is dependent on the selection of certain assumptions used by independent actuaries engaged by the Bank in calculating such amounts. Those assumptions include, among others, discount rates and salary rate increase. A significant change in any of these actuarial assumptions may generally affect the recognized expense and the carrying amount of the post-employment benefit obligation in the next reporting period.
The amounts of post-employment defined benefit obligation and expense and an analysis of the movements in the estimated present value of post-employment defined benefit obligation, as well as the significant assumptions used in estimating such obligation in the next reporting period are presented in Note 21.2.
4. RISK MANAGEMENT OBJECTIVES AND POLICIES
The Bank is exposed to a variety of potential risks arising from its business activities. It enters into financial instrument contracts, which consist of AFS financial assets, HTM investments, loans and receivables, and financial liabilities such as deposits and bills payable to finance the Bank’s operations. The Bank’s financial assets and liabilities by category are summarized in Note 5. The main types of risks to which the Bank is exposed includes market risk, credit risk, liquidity risk, operations risk and legal and regulatory risk.
The Bank’s risk management is coordinated with its Parent Bank, in close cooperation with the BOD, and focuses on actively securing the Bank’s short to medium-term cash flows by minimizing the exposure to financial markets. Long-term financial investments are managed to generate lasting returns.
The Bank does not actively engage in the trading of financial assets for speculative purposes nor does it write options. The most significant financial risks to which the Bank is exposed to are described in the succeeding paragraphs.

72
4.1 Risk Oversight Structure
The BOD is primarily responsible for approving the credit policies and the overall risk capacity of the Bank. Board committees have been established by the BOD to oversee the increasingly varied risk management activities of the Bank with the active participation of senior management.
(a) Risk Oversight Committee
To manage the financial risk for holding financial assets and liabilities, the Bank’s Risk Oversight Committee (ROC) was created to address the risks it faces in its banking activities, including liquidity, interest rate, credit and market risks. ROC provides oversight of credit, market, liquidity, operations, legal and other risks taken throughout the Bank. The Risk Management Department performs an independent business function within the Bank and is responsible for developing and maintaining the Bank’s risk policy framework.
The Bank’s ROC was created with the following core responsibilities:
(i) identify and evaluate exposures;(ii) develop risk management strategies;(iii) implement the risk management plan; and,(iv) review and revise the plan as needed.
The ROC has the following specific duties and responsibilities:
(i) review the risk infrastructure and operating policies to ensure these are congruent with corporate policies on prudent risk management, and conform to regulatory, industry and technological standards, trends and best practices. On an on-going basis, identify and assess the external risk that may affect the business plans and directions of the Bank;
(ii) review the Bank’s capital allocation methodology;(iii) establish, in consultation with Management and subject to BOD’s approval, corporate policies and guidelines
for risk management, reporting, and management;(iv) review the Bank’s asset management activities, including oversight structure for general policies and reports;(v) review the steps that Management has taken to monitor and control risk exposures. Review the management’s
performance against these policies and benchmarks;(vi) promote the continuous development of risk programs and infrastructure; ensure that business units provide for
ongoing review of the adequacy and soundness of policies, assumptions and practices;(vii) create and promote risk culture that requires and encourages the highest standards of ethical behavior by risk
managers and risk-taking personnel;(viii) encourage the professional development and training of staff engaged in both risk management activities and
risk-taking activities;(ix) review annually the ROC charter to reassess its adequacy, implement best practices and propose necessary
changes to the BOD’s approval; and,(x) submit its annual performance report to the BOD.
(b) Audit Committee
The Bank’s Audit Committee’s main function is to assist the BOD in oversight functions and adopts a more proactive role in ensuring accountability on the part of management as well as of the internal and external auditors. The committee monitors the internal control over financial reporting of the Bank and the audits of its financial statements, substantiates the performance of the Banks’s internal audit, verifies the independent auditor’s qualifications and independence, thus safeguarding the overall objectivity of the financial reporting and internal control processes and confirms the compliance of the Bank with legal and regulatory requirements.

73
Financial Statements
4.2 Market Risk
The Bank is exposed to market risk through its use of financial instruments and specifically to foreign currency risk, interest rate risk and certain other price risk which result from its operating, investing and financing activities.
(a) Foreign Currency Risk
Most of the Bank’s transactions are carried out in Philippine pesos, its functional currency. The Bank’s exposures to currency exchange rates may arise from deposits with other banks denominated in currencies other than the Philippine peso. As at December 31, 2016 and 2015, the Bank has no significant foreign currency risk exposure as it has no significant foreign currency-denominated deposits with other banks and deposit liabilities to depositors.
(b) Interest Rate Risk
The Bank is exposed to changes in market interest rates through its due from other banks, which are subject to variable interest rates (see Note 6).
Due from other banks are tested on a reasonably possible change of +/- 0.56% and +/- 1.75% in 2016 and 2015, respectively. These percentages have been determined based on the average market volatility of interest rates, using standard deviation, in the previous 12 months estimated at 99.00% level of confidence. The sensitivity analysis is based on the Bank’s financial instruments held at the end of the each reporting period, with effect estimated from the beginning of the year. All other variables are held constant.
The changes in percentages would affect profit or loss before tax by +/-P6.0 million and +/-P4.9 million in 2016 and 2015, respectively, and equity after tax by +/-P4.2 million and +/-P3.4 million in 2016 and 2015, respectively.
(c) Other Price Risk
The Bank’s market price risk arises from its investments carried at fair value. The Bank manages exposure to price risk of AFS financial assets by monitoring the changes in the market price of these investments and at some extent, diversifying the investment portfolio in accordance with the limit set by management.
Based on the volatility assumptions of the benchmark index for government bonds classified as AFS financial assets, an average volatility of +/-2.86% and +/-11.31% in 2016 and 2015, respectively, were observed with all other variables held constant. These changes in percentages would impact other comprehensive income by +/- P10.9 million and +/- P42.6 million in 2016 and 2015, respectively.
4.3 Credit Risk
Credit risk is the risk that a counterparty may fail to discharge an obligation to the Bank. The Bank is exposed to this risk for various financial instruments arising from granting loans and receivables to customers, including related parties, placing deposits with other banks and investing in bonds.
The Bank continuously monitors defaults of borrowers and other counterparties, identified either individually or by group, and incorporates this information into its credit risk controls. The Bank’s policy is to deal only with creditworthy counterparties. In addition, for certain types of loans, collaterals are required to mitigate credit risk.

74
The maximum credit risk exposure of financial assets is the carrying amount of the financial assets as shown in the statements of financial position or in the detailed analysis provided in the notes to the financial statements, as summarized below.
Notes 2016 2015
Cash and cash equivalents 6 P 2,729,153,152 P 2,507,418,743
AFS financial assets 9 380,564,928 376,882,079
HTM investments 10 346,946,618 349,299,755
Loans and receivables – net 11 21,239,051,779 20,516,700,682
Security deposit 14 9,094,612 4,270,452
Sales contract receivables - net 14 3,316,898 910,286
P 24,708,127,987 P 23,755,481,997
The Bank’s financial assets are in part secured by collateral guarantees and other credit enhancements, as described below and in the succeeding pages.
(a) Cash and Cash Equivalents
The credit risk for cash and cash equivalents is considered negligible, since the counterparties are reputable banks with high quality external credit ratings. Included in the cash and cash equivalents are cash in banks and short-term placements which are insured by the Philippine Deposit Insurance Corporation (PDIC) up to a maximum coverage of P0.5 million for every depositor per banking institution.
(b) AFS Financial Assets and HTM Investments
The carrying amount of AFS financial assets and HTM investments is the maximum possible credit risk exposure of the Bank in relation to the said investments.
(c) Loans and Receivables
In respect of loans and receivables, the Bank is not exposed to any significant credit risk exposure to any single counterparty or any group of counterparties having similar characteristics. However, the Bank is exposed to credit risk on its concentration to salary loan products which consist of 75.58% and 82.47% of the Bank’s total loan portfolio as at December 31, 2016 and 2015, respectively. Although most of the salary loans are unsecured loans, such are enrolled in automatic payroll deduction system, a payment scheme wherein the institution where the borrower belongs ensures deduction from the payroll and remits the payment directly to the Bank. Based on historical information about borrower default rates, management considers the credit quality of loans and receivables that are not past due or impaired to be good.
Exposure to credit risk is managed through regular analysis of the ability of borrowers and potential borrowers to meet interest and capital repayment obligations and by changing these lending limits when appropriate. Exposure to credit risk is also managed in part by obtaining collateral and personal guarantees. With respect to foreclosed collaterals, these are normally actively disposed by the Bank.
The Bank’s loans are actively monitored to avoid significant concentrations of credit risk in accordance with the BSP’s prohibitions on maintaining a financial exposure to any single person or group of persons in excess of 25.00% of its net worth.

75
Financial Statements
In addition, the Bank has credit risk exposure on unimpaired loans and other receivables that are past due per BSP definition as at the end of the reporting period. As at December 31, 2016 and 2015, loans and receivables that are past due but not impaired amounted to P944.1 million and P238.7 million, respectively, which are outstanding for less than one year.
The table below shows the credit quality by class of financial assets based on the Bank’s rating system as at December 31, 2016.
High GradeStandard
GradeSubstandard
Grade
Past Due and Individually
Impaired Total
Cash and cash equivalents P 2,729,153,152 P - P - P - P 2,729,153,152
AFS financial assets 380,564,928 - - - 380,564,928
HTM investments 346,946,618 - - - 346,946,618
Loans and receivables – gross 20,213,418,065 93,148,329 944,129,614 891,061,121 22,141,757,129
Security deposit 9,094,612 - - - 9,094,612
Sales contract receivables – gross - - 3,672,767 - 3,672,767
P 23,679,177,375 P 93,148,329 P 947,802,381 P 891,061,121 P 25,611,189,206
The table below shows the credit quality by class of financial assets based on the Bank’s rating system as at December 31, 2015.
High GradeStandard
GradeSubstandard
Grade
Past Due and Individually
Impaired Total
Cash and cash equivalents P 2,507,418,743 P - P - P - P 2,507,418,743
AFS financial assets 376,882,079 - - - 376,882,079
HTM investments 349,299,755 - - - 349,299,755
Loans and receivables – gross 20,228,247,593 74,126,018 238,652,788 669,305,033 21,210,331,432
Security deposit 4,270,452 - - - 4,270,452
Sales contract receivables – gross - - 910,286 355,869 1,266,155
P 23,466,118,622 P 74,126,018 P 239,563,074 P 669,660,902 P 24,449,468,616
The credit grades used by the Bank in evaluating the credit quality of its loans and receivables are the following:
(a) High grade or low risk loans
These loans are neither past due nor impaired which are fully secured by collateral and with good collection status. This category includes credit grades 1 to 3. High grade loans are those which possess high probability of collection, as evidenced by counterparties having ability to satisfy their obligations and that the collaterals used to secure the loans are readily enforceable.
(b) Standard grade or medium risk loans
Standard grade loans are neither past due nor impaired with partially secured loan status. This category includes credit grade 4 to 5. The standard grade category includes loans for which collections are probable due to the reputation and financial capacity to pay of the counterparty but have been outstanding for a considerable length of time.

76
(c) Substandard grade or high risk loans
Substandard grade loans are those where the counterparties are, most likely, not capable of honoring their financial obligations. These loans include impaired loans which have continuous loan collection default issues or past due but not impaired loans and receivable accounts.
An estimate of the fair value of collateral and other security enhancements held by the Bank against loans and receivables as at December 31, 2016 and 2015 amounted to P6,447.6 million and P6,088.0 million, respectively.
4.4 Liquidity Risk
Liquidity risk is the risk that there could be insufficient funds available to adequately meet the credit demands of the Bank’s customers and repay deposits on maturity. The Bank manages liquidity risk by holding sufficient liquid assets of appropriate quality to ensure short-term funding requirements are met and by maintaining a balanced loan portfolio. In addition, the Bank seeks to maintain sufficient liquidity to take advantage of interest rate opportunities when they arise.
The analyses of the maturity groupings of financial resources, financial liabilities and off-book items as at December 31, 2016 and 2015 are presented below and in the succeeding page.
2016
NotesOne year
and below
Over one year
to five yearsBeyond
five years Total
Financial resources:
Cash and cash equivalents 6 P 2,729,153,152 P - P - P 2,729,153,152
AFS financial assets 9 101,681,158 - 278,883,770 380,564,928
HTM investments 10 - 302,226 346,644,392 346,946,618
Loans and receivables – net 11 2,587,964,490 16,938,437,671 1,712,649,618 21,239,051,779
Security deposit 14 - 9,094,612 - 9,094,612
Sales contract receivables – net 14 3,316,898 - - 3,316,898
5,422,115,698 16,947,834,509 2,338,177,780 24,708,127,987
Financial liabilities:
Deposit liabilities 16 21,635,037,832 1,202,079,908 - 22,837,117,740
Accrued expenses and other liabilities (except tax-related payables and post-employment defined benefit obligation) 17 368,364,366 6,190,875 - 374,555,241
22,003,402,198 1,208,270,783 - 23,211,672,981
On-book positive (negative) gap ( 16,581,286,500) 15,739,563,726 2,338,177,780 1,496,455,006
Contingent assets - - - -
Contingent liabilities 35,257,699 - - 35,257,699
Off-book gap ( 35,257,699) - - ( 35,257,699)
Cumulative total positive (negative) gap (P 16,616,544,199) P 15,739,563,726 P 2,338,177,780 P 1,461,197,307

77
Financial Statements
2015
NotesOne year
and below
Over one year
to five yearsBeyond
five years Total
Financial resources:
Cash and cash equivalents 6 P 2,507,418,743 P - P - P 2,507,418,743
AFS financial assets 9 502,850 - 376,379,229 376,882,079
HTM investments 10 - - 349,299,755 349,299,755
Loans and receivables – net 11 3,172,300,493 15,949,411,506 1,394,988,683 20,516,700,682
Security deposit 14 - 4,270,452 - 4,270,452
Sales contract receivables – net 14 910,286 - - 910,286
5,681,132,372 15,953,681,958 2,120,667,667 23,755,481,997
Financial liabilities:
Deposit liabilities 16 19,940,460,570 1,521,079,344 - 21,461,539,914
Accrued expenses and other liabilities (except tax-related payables and post-employment defined benefit obligation) 17 401,434,653 6,189,549 - 407,624,202
20,341,895,223 1,527,268,893 - 21,869,164,116
On-book positive (negative) gap ( 14,660,762,851) 14,426,413,065 2,120,667,667 1,886,317,881
Contingent assets - - - -
Contingent liabilities 100,136,835 2,606 - 100,139,441
Off-book gap ( 100,136,835) ( 2,606) - ( 100,139,441)
Cumulative total positive (negative) gap ( P14,760,899,686) P 14,426,410,459 P 2,120,667,667 P 1,786,178,440
As at December 31, 2016, the Bank’s financial liabilities have contractual maturities which are presented below.
Current Non-current
Within Six Months
6 to 12 Months
One to Five Years
Deposit liabilities P 20,322,550,695 P 1,354,819,911 P 1,279,961,608
Accrued expenses and other liabilities (except tax-related payables and post-employment defined benefit obligation) 356,265,412 11,683,941 6,190,875
P 20,678,816,107 P 1,366,503,852 P 1,286,152,483

78
As at December 31, 2015, the Bank’s financial liabilities have contractual maturities which are presented below.
Current Non-current
Within Six Months
6 to 12 Months
One to Five Years
Deposit liabilities P 19,643,008,476 P 317,219,735 P 1,774,045,598
Accrued expenses and other liabilities (except tax- related payables) 382,355,689 19,078,965 6,189,548
P 20,025,364,165 P 336,298,700 P 1,780,235,146
The contractual maturities reflect the gross cash flows, which may differ from the carrying values of the liabilities at the end of each reporting period.
4.5 Operations Risk
Operations risks are risks arising from the potential inadequate information systems, operations or transactional problems (relating to service or product delivery), breaches in internal controls and fraud or unforeseen catastrophes that may result in unexpected loss. Operations risks include the risk of loss arising from various types of human or technical error, settlement or payments failures, business interruption, administrative and legal risks, and the risk arising from systems not performing adequately.
The Bank has established measures to mitigate the effects of risks related to operations through its senior management. At year-end, the Bank also ensures that disclosures are made in the financial statements for any significant accounts, if any, which may have been affected by such risk.
4.6 Legal and Regulatory Risks
Legal risk pertains to the Bank’s exposure to losses arising from cases decided not in favor of the Bank where significant legal costs have already been incurred, or in some instances, where the Bank may be required to pay damages. The Bank is often involved in litigation in enforcing its collection rights under loan agreements in case of borrower default. The Bank may incur significant legal expenses as a result of these events, but the Bank may still end up with non-collection or non-enforcement of claims. The Bank has established measures to avoid or mitigate the effects of these adverse decisions and engages several qualified legal advisors, who were endorsed to and carefully approved by senior management. At year-end, the Bank also ensures that material adjustments or disclosures are made in the financial statements for any significant commitments or contingencies which may have arisen from legal proceedings involving the Bank.
Regulatory risk refers to the potential risk for the Bank to suffer financial loss due to changes in the laws or monetary, tax or other governmental regulations of a country. The monitoring of the Bank’s compliance with these regulations, as well as the study of the potential impact of new laws and regulations, is the primary responsibility of the Bank’s Compliance Officer. The Compliance Office is responsible for communicating and disseminating new rules and regulations to all units, analyzing and addressing compliance issues, performing periodic compliance testing on branches and Head Office units, and reporting compliance findings to the Audit Committee and the BOD.
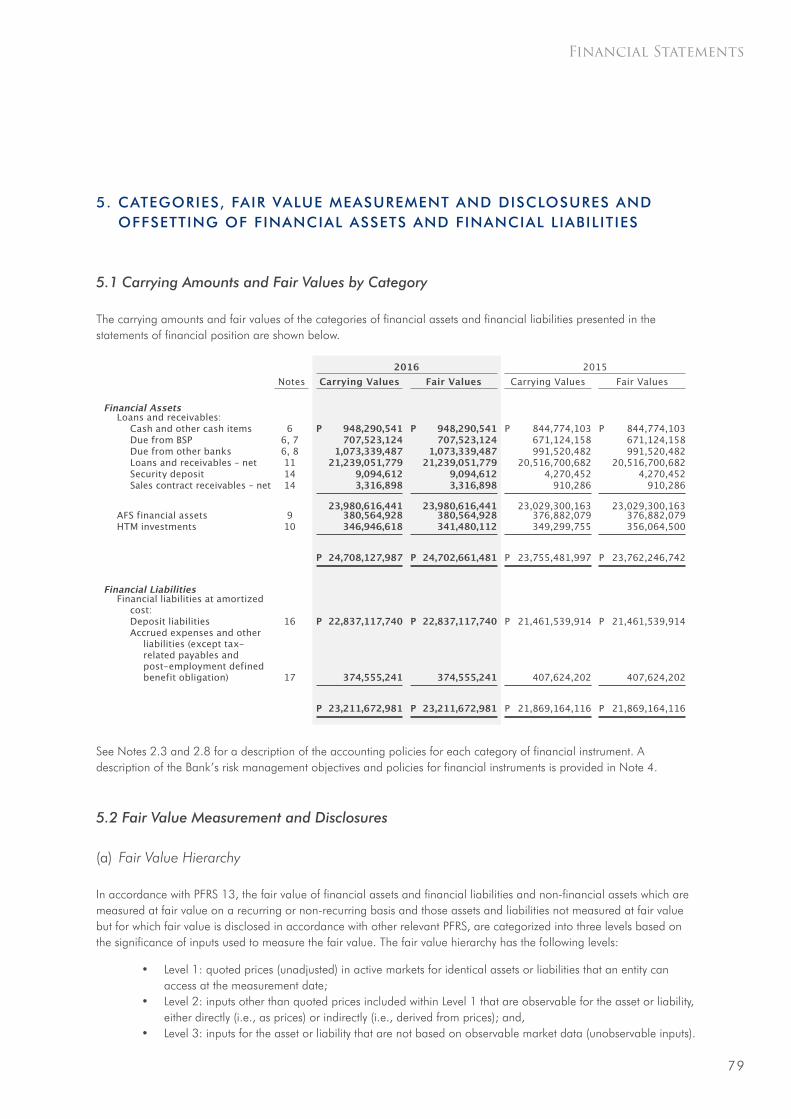
79
Financial Statements
5. CATEGORIES, FAIR VALUE MEASUREMENT AND DISCLOSURES AND OFFSETTING OF FINANCIAL ASSETS AND FINANCIAL LIABILITIES
5.1 Carrying Amounts and Fair Values by Category
The carrying amounts and fair values of the categories of financial assets and financial liabilities presented in the statements of financial position are shown below.
2016 2015
Notes Carrying Values Fair Values Carrying Values Fair Values
Financial AssetsLoans and receivables:
Cash and other cash items 6 P 948,290,541 P 948,290,541 P 844,774,103 P 844,774,103Due from BSP 6, 7 707,523,124 707,523,124 671,124,158 671,124,158Due from other banks 6, 8 1,073,339,487 1,073,339,487 991,520,482 991,520,482Loans and receivables – net 11 21,239,051,779 21,239,051,779 20,516,700,682 20,516,700,682Security deposit 14 9,094,612 9,094,612 4,270,452 4,270,452Sales contract receivables – net 14 3,316,898 3,316,898 910,286 910,286
23,980,616,441 23,980,616,441 23,029,300,163 23,029,300,163AFS financial assets 9 380,564,928 380,564,928 376,882,079 376,882,079HTM investments 10 346,946,618 341,480,112 349,299,755 356,064,500
P 24,708,127,987 P 24,702,661,481 P 23,755,481,997 P 23,762,246,742
Financial LiabilitiesFinancial liabilities at amortized
cost:Deposit liabilities 16 P 22,837,117,740 P 22,837,117,740 P 21,461,539,914 P 21,461,539,914Accrued expenses and other
liabilities (except tax-related payables and post-employment defined benefit obligation) 17 374,555,241 374,555,241 407,624,202 407,624,202
P 23,211,672,981 P 23,211,672,981 P 21,869,164,116 P 21,869,164,116
See Notes 2.3 and 2.8 for a description of the accounting policies for each category of financial instrument. A description of the Bank’s risk management objectives and policies for financial instruments is provided in Note 4.
5.2 Fair Value Measurement and Disclosures
(a) Fair Value Hierarchy
In accordance with PFRS 13, the fair value of financial assets and financial liabilities and non-financial assets which are measured at fair value on a recurring or non-recurring basis and those assets and liabilities not measured at fair value but for which fair value is disclosed in accordance with other relevant PFRS, are categorized into three levels based on the significance of inputs used to measure the fair value. The fair value hierarchy has the following levels:
• Level 1: quoted prices (unadjusted) in active markets for identical assets or liabilities that an entity can access at the measurement date;
• Level 2: inputs other than quoted prices included within Level 1 that are observable for the asset or liability, either directly (i.e., as prices) or indirectly (i.e., derived from prices); and,
• Level 3: inputs for the asset or liability that are not based on observable market data (unobservable inputs).
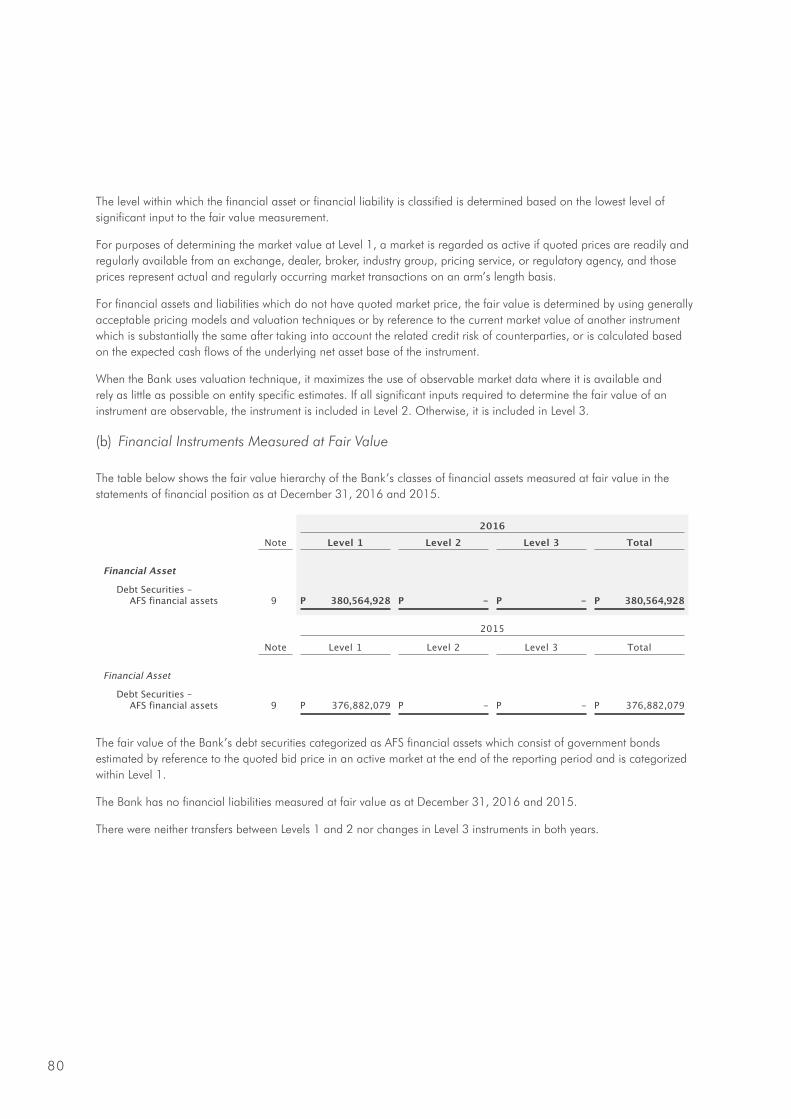
80
The level within which the financial asset or financial liability is classified is determined based on the lowest level of significant input to the fair value measurement.
For purposes of determining the market value at Level 1, a market is regarded as active if quoted prices are readily and regularly available from an exchange, dealer, broker, industry group, pricing service, or regulatory agency, and those prices represent actual and regularly occurring market transactions on an arm’s length basis.
For financial assets and liabilities which do not have quoted market price, the fair value is determined by using generally acceptable pricing models and valuation techniques or by reference to the current market value of another instrument which is substantially the same after taking into account the related credit risk of counterparties, or is calculated based on the expected cash flows of the underlying net asset base of the instrument.
When the Bank uses valuation technique, it maximizes the use of observable market data where it is available and rely as little as possible on entity specific estimates. If all significant inputs required to determine the fair value of an instrument are observable, the instrument is included in Level 2. Otherwise, it is included in Level 3.
(b) Financial Instruments Measured at Fair Value
The table below shows the fair value hierarchy of the Bank’s classes of financial assets measured at fair value in the statements of financial position as at December 31, 2016 and 2015.
2016
Note Level 1 Level 2 Level 3 Total
Financial Asset
Debt Securities – AFS financial assets 9 P 380,564,928 P - P - P 380,564,928
2015
Note Level 1 Level 2 Level 3 Total
Financial Asset
Debt Securities – AFS financial assets 9 P 376,882,079 P - P - P 376,882,079
The fair value of the Bank’s debt securities categorized as AFS financial assets which consist of government bonds estimated by reference to the quoted bid price in an active market at the end of the reporting period and is categorized within Level 1.
The Bank has no financial liabilities measured at fair value as at December 31, 2016 and 2015.
There were neither transfers between Levels 1 and 2 nor changes in Level 3 instruments in both years.

81
Financial Statements
(c) Financial Instruments Measured at Amortized Cost for which Fair Value is Disclosed
The table below summarizes the fair value hierarchy of the Bank’s financial assets and financial liabilities which are not measured at fair value in the statements of financial position but for which fair value is disclosed.
2016
Notes Level 1 Level 2 Level 3 Total
Financial Assets
Loans and receivables:
Cash and cash equivalents 6 P 2,729,153,152 P - P - P 2,729,153,152
Loans and receivables – net 11 - - 21,239,051,779 21,239,051,779
HTM investments 10 - 341,480,112 - 341,480,112
P 2,729,153,152 P 341,480,112 P 21,239,051,779 P 24,309,685,043
Financial Liabilities
Financial liabilities at amortized cost:
Deposit liabilities 16 P - P - P 22,837,117,740 P 22,837,117,740
Accrued expenses and other liabilities (except tax-related payables and post-employment defined benefit obligation) 17 - - 374,555,241 374,555,241
P - P - P 23,211,672,981 P 23,211,672,981
2015
Notes Level 1 Level 2 Level 3 Total
Financial Assets
Loans and receivables:
Cash and cash equivalents 6 P 2,507,418,743 P - P - P 2,507,418,743
Loans and receivables – net 11 - - 20,516,700,682 20,516,700,682
HTM investments 10 - 356,064,500 - 356,064,500
P 2,507,418,743 P 356,064,500 P 20,516,700,682 P 23,380,183,925
Financial Liabilities
Financial liabilities at amortized cost:
Deposit liabilities 16 P - P - P 21,461,539,914 P 21,461,539,914
Accrued expenses and other liabilities (except tax-related payables and post-employment defined benefit obligation) 17 - - 407,624,202 407,624,202
P - P - P 21,869,164,116 P 21,869,164,116
For financial assets with fair values included in Level 1, management considers that the carrying amounts of financial instruments approximate their fair values.

82
(d) Fair Value Measurement for Non-financial Assets
There were no non-financial assets measured at fair value as at December 31, 2016 and 2015.
The fair value disclosed for the Bank’s investment properties, which consist of parcels of land, is based on Level 2. The Level 2 fair value of land was derived using the market comparable approach that reflects the recent transaction prices for similar properties in nearby locations. Under this approach, when sales prices of comparable land in close proximity are used in the valuation of the subject property with no adjustment on the price, fair value is included in Level 2 (see Note 13).
5.3 Offsetting of Financial Assets and Financial Liabilities
The following financial assets with net amounts presented in the statements of financial position are subject to offsetting, enforceable master netting arrangements and similar agreements:
Gross amounts recognized in the statements of financial position Net amount
presented in the statements
of financial position
Related amounts not set-off in the statements
of financial position
Net amount
Financial assets
Financial liabilities set-off
Financial instruments
Cash collateral received
December 31, 2016 – Loans and receivables – net P 21,322,311,763 (P 83,259,984) P 21,239,051,779 (P 94,787,534) P - P 21,144,264,245
December 31, 2015 – Loans and receivables – net P 20,595,432,930 (P 78,732,248) P 20,516,700,682 (P 94,305,476) P - P 20,422,395,206
The following financial liabilities with net amounts presented in the statements of financial position are subject to offsetting, enforceable master netting arrangements and similar agreements:
Gross amounts recognized in the statements of financial position Net amount
presented in the statements
of financial position
Related amounts not set-off in the statements
of financial position
Net amount
Financial assets
Financial assets set-off
Financial instruments
Cash collateral received
December 31, 2016 – Deposit liabilities P 22,920,377,724 (P 83,259,984) P 22,837,117,740 (P 94,787,534) P - P 22,742,330,206
December 31, 2015 – Deposit liabilities P 21,540,272,162 (P 78,732,248) P 21,461,539,914 (P 94,305,476) P - P 21,367,234,438
Financial assets and financial liabilities set-off pertain to the Bank’s loans and receivables collateralized by deposit hold-out. Financial instruments subject to offsetting but not set-off in the statements of financial position pertain to AFS financial assets, HTM investments, and loans and receivables collateralized or assigned against bills payable.
For financial assets and financial liabilities subject to enforceable master netting arrangements or similar arrangements above, each agreement between the Bank and counterparties allows for net settlement of the relevant financial assets and financial liabilities when both elect to settle on a net basis. In the absence of such an election, financial assets and financial liabilities will be settled on a gross basis; however, each party to the master netting agreement or similar agreement will have the option to settle all such amounts on a net basis in the event of default of the other party.

83
Financial Statements
6. CASH AND CASH EQUIVALENTS
For purposes of presenting the cash flows, cash and cash equivalents consist of the following:
Notes 2016 2015
Cash and other cash items P 948,290,541 P 844,774,103
Due from BSP 7 707,523,124 671,124,158
Due from other banks 8 1,073,339,487 991,520,482
P 2,729,153,152 P 2,507,418,743
Cash consists primarily of funds in the form of Philippine currency notes and coins in the Bank’s vault and those in the possession of tellers. Other cash items include cash items (other than currency and coins on hand) such as checks drawn on other banks or other branches after the Bank’s clearing cut-off time until the close of the regular banking hours.
7. DUE FROM BANGKO SENTRAL NG PILIPINAS
This account represents the Bank’s demand deposit with the BSP in compliance with BSP’s reserve requirements (see Note 6). The Bank has satisfactorily complied with the reserve requirements of the BSP. Deposits with BSP do not earn interest.
8. DUE FROM OTHER BANKS
This account is composed of the following as at December 31:
Note 2016 2015
Demand and savings P 557,139,294 P 826,210,504
Time 516,200,193 165,309,978
6 P 1,073,339,487 P 991,520,482
Savings deposit bears interest at 0.13% to 0.50%, 0.10% to 1.25%, and 0.25% to 2.50% per annum in 2016, 2015 and 2014, respectively. All of the Bank’s time deposits, which can be pre-terminated anytime, will mature within one year to two years and bear interest at rates ranging from 0.38% to 1.00%, 0.38% to 7.19% , and 0.38% to 7.35% per annum in 2016, 2015 and 2014, respectively. Interest income on deposits with other banks amounted to P7.7 million, P27.2 million and P34.2 million in 2016, 2015 and 2014, respectively, which is presented as Interest Income on Deposits with Other Banks in the statements of profit or loss.

84
9. AFS FINANCIAL ASSETS
This account consists of peso-denominated bonds issued by the Philippine government and certain private corporations with annual nominal interest rates ranging from 3.25% to 10.25% and will mature in various dates until 2032.
The reconciliation of the carrying amounts of AFS financial assets as at December 31 are presented below.
2016 2015
Balance at beginning of year P 376,882,079 P 2,202,413,908
Unrealized fair value gains - net 4,627,787 2,624,099
Transfers ( 944,938) -
Cost of AFS financial assets disposed - ( 1,758,711,870)
Fair value gains of AFS financial assets disposed - ( 304,447,567)
Additions - 235,003,509
Balance at end of year P 380,564,928 P 376,882,079
As at December 31, 2016 and 2015, there are no AFS investments pleged as collateral for any obligation of the Bank.
The fair value of government bonds have been determined under Level 1 fair value hierarchy and measured directly by reference to published prices in an active market [see Note 5.2(b)].
The interest income recognized on AFS financial assets amounting to P22.6 million, P106.6 million and P106.7 million in 2016, 2015 and 2014, respectively, is presented as part of Interest Income on Investments in the statements of profit or loss. Gain on disposal of AFS financial assets amounted to nil, P206.1 million and P16.8 million in 2016, 2015 and 2014, respectively, and is presented as part of Others under Other Income in the statements of profit or loss (see Note 20).
10. HELD-TO-MATURITY INVESTMENTS
This account consists of investments in bonds issued by Rizal Commercial Banking Corporation (RCBC), Philippine National Bank (PNB) and Land Bank of the Philippines (LBP), broken down as follows:
2016 2015
RCBC P 278,957,352 P 281,190,831
PNB 67,687,040 68,108,924
LBP 302,226 -
P 346,946,618 P 349,299,755
Bond investment in RCBC was acquired in 2013 for liquidity reserve purposes of the Bank, which bears fixed coupon rates ranging from 3.25% to 10.25% per annum, and will mature on varied dates on 2023 and 2026.
Bond investments in PNB was acquired in 2014 for liquidity reserve purpose.
Bond investments in LBP represent investment received as payment for the land sold under the Voluntary Offer to Sell program of the Department of Agrarian Reform. These investments bear market interest rates based on the 91-day treasury bill rates and are redeemable in ten annual installments from the dates these were issued.

85
Financial Statements
The fair value of the Bank’s HTM investments amounted to P341.5 million and P356.1 million as of December 31, 2016 and 2015, respectively, and have been determined under Level 2 fair value hierarchy [see Note 5.2(c)].
The interest income recognized during the year for HTM investments, presented as part of Interest Income on Investments in the statements of profit or loss, amounted to P15.6 million, P15.0 million and P14.6 million in 2016, 2015 and 2014, respectively.
Management assessed that no impairment loss on the Bank’s HTM investments is required to be recognized in 2016, 2015 and 2014.
11. LOANS AND RECEIVABLES
As at December 31, the breakdown of this account follows:
Note 2016 2015
Loans:
Individual consumption P 13,952,053,040 P 11,684,982,597
Agricultural 2,665,844,302 3,325,707,406
Housing 3,890,190,078 3,710,725,723
Commercial 574,873,721 1,806,693,785
Others 513,638,609 34,735,709
21,596,599,750 20,562,845,220
Allowance for impairment 15 ( 823,059,944) ( 608,904,103)
Unearned discounts ( 11,644,229) ( 24,325,717)
20,761,895,577 19,929,615,400
Accrued interest receivable 273,064,058 385,690,240
Allowance for impairment 15 ( 43,656,904) ( 25,010,536)
229,407,154 360,679,704
Accounts receivable 272,093,321 261,795,972
Allowance for impairment 15 ( 24,344,273) ( 35,390,394)
247,749,048 226,405,578
P 21,239,051,779 P 20,516,700,682
Loans considered past due as at December 31, 2016 and 2015 amounted to P1,545.7 million and P819.8 million, respectively. Portion of the past due accounts are accounts under litigation and are covered with real estate mortgages, which could be foreclosed to reduce possible losses from non-collection.
Loans to directors, officers, stockholders and related interests (DOSRI) amounted to P0.2 million and P11.7 million as at December 31, 2016 and 2015, respectively, representing 0.00% and 0.06% of the total loan portfolio as at those dates, respectively. Current and unsecured DOSRI loans as of December 31, 2016 and 2015 amounted to P0.16 million and P0.4 million, respectively (see Note 19.1).
Interest income on loans and receivables recognized amounting to P1,496.2 million, P1,641.3 million and P1,582.8 million in 2016, 2015 and 2014, respectively, is presented as Interest Income on Loans and Receivables in the statements of profit or loss.

86
The breakdown of loans as to secured and unsecured follows:
2016 2015
Unsecured P 18,338,028,531 P 17,052,260,856
Secured:
Real estate mortgage 3,175,311,235 3,431,852,116
Deposit hold-out 83,259,984 78,732,248
3,258,571,219 3,510,584,364
P 21,596,599,750 P 20,562,845,220
The breakdown of loans as to the Bank’s credit accommodations by industry follows:
2016 2015
Agricultural P 2,311,464,917 P 3,272,385,735
Education 7,484,906,547 6,963,323,832
Real estate, rental and business activities 4,067,112,178 4,074,436,300
Wholesale and retail trade 1,411,455,312 1,989,864,437
Others 6,321,660,796 4,262,834,916
P 21,596,599,750 P 20,562,845,220
The maturity profile of the Bank’s loans is shown below.
2016 2015
One year and below P 2,945,512,461 P 2,281,096,309
One year to five years 16,938,437,671 16,424,772,200
Beyond five years 1,712,649,618 1,856,976,711
P 21,596,599,750 P 20,562,845,220
The classification of loans as to interest rate follows:
2016 2015
Over 25.00% - 30.00% P 3,368,724 P 3,351,180
Over 20.00% - 25.00% 1,261,492 3,772,671
Over 15.00% - 20.00% 9,210,079 17,251,104
15.00% and below 21,582,759,455 20,538,470,265
P 21,596,599,750 P 20,562,845,220

87
Financial Statements
The breakdown of loans by status is presented as follows:
2016 2015
Current P 20,050,929,420 P 19,743,092,358
Past due 1,544,948,397 817,951,508
In litigation 721,933 1,801,354
P 21,596,599,750 P 20,562,845,220
Non-performing loans (NPL) included in the total loan portfolio of the Bank as at December 31, 2016 and 2015 are presented below as net of specific allowance for impairment in compliance with BSP Circular 772, which amends regulations governing non-performing loans.
2016 2015
NPL P 1,409,290,705 P 819,752,862
Allowance for impairment ( 602,725,361) ( 414,342,661)
P 806,565,344 P 405,410,201
Per BSP’s Manual of Regulations for Banks (MORB), non-performing loans shall, as a general rule, refer to loan accounts whose principal and/or interest is unpaid for 30 days or more after due date or after they have become past due in accordance with existing rules and regulations. This shall apply to loans payable in lump sum and loans payable in quarterly, semi-annual or annual installments, in which case, the total outstanding balance thereof shall be considered non-performing. In the case of loans payable in monthly installments, the total outstanding balance thereof shall be considered nonperforming when three or more installments are in arrears. In the case of loans payable in daily, weekly or semi-monthly installments, the entire outstanding balance of the loan/receivable shall be considered as past due when the total amount of arrearages reaches 10.00% of the total loan/receivable balance. Restructured loans shall be considered non-performing except when as of restructuring date, it has an updated principal and interest payments and it is fully secured by real estate with loan value of up to 60.00% of the appraised value of real estate security and the insured improvements and such other first class collaterals.

88
12. BANK PREMISES, FURNITURE, FIXTURES AND EQUIPMENT
The gross carrying amounts and accumulated depreciation and amortization and allowance for impairment of bank premises, furniture, fixtures and equipment at the beginning and end of 2016 and 2015 are shown below.
Land Buildings
Furniture, Fixtures and Equipment
Leasehold and Land
ImprovementsConstruction in Progress Total
December 31, 2016Cost P 739,779,460 P 987,263,406 P 1,005,154,807 P 93,787,188 P 23,222,511 P 2,849,207,372Accumulated
depreciation and amortization - ( 254,512,265) ( 679,877,196) ( 9,569,921) - ( 943,959,382)
Allowance for impairment ( 14,162,457) ( 4,745,346) - - - ( 18,907,803)
Net carrying amount P 725,617,003 P 728,005,795 P 325,277,611 P 84,217,267 P 23,222,511 P 1,886,340,187
December 31, 2015Cost P 739,333,484 P 779,871,093 P 734,766,529 P 21,508,161 P 2,704,506 P 2,278,183,773Accumulated
depreciation and amortization - ( 220,649,401) ( 563,908,202) ( 7,230,819) - ( 791,788,422)
Allowance for impairment ( 13,833,696) ( 4,383,872) - - - ( 18,217,568)
Net carrying amount P 725,499,788 P 554,837,820 P 170,858,327 P 14,277,342 P 2,704,506 P 1,468,177,783
January 1, 2015Cost P 738,801,682 P 731,051,124 P 769,724,240 P 22,362,555 P 35,201,703 P 2,297,141,304Accumulated
depreciation and amortization - ( 184,729,601) ( 558,573,401) ( 9,836,195) - ( 753,139,197)
Allowance for impairment ( 13,833,696) ( 4,383,872) - - - ( 18,217,568)
Net carrying amount P 724,967,986 P 541,937,651 P 211,150,839 P 12,526,360 P 35,201,703 P 1,525,784,539

89
Financial Statements
A reconciliation of the carrying amounts at the beginning and end of 2016 and 2015, of bank premises, furniture, fixtures and equipment is shown below.
Land Buildings
Furniture, Fixtures and Equipment
Leasehold and Land
ImprovementsConstruction in Progress Total
Balance at January 1, 2016, net of accumulated depreciation and amortization P 725,499,788 P 554,837,820 P 170,858,327 P 14,277,342 P 2,704,506 P 1,468,177,783
Additions 445,976 27,991,587 276,628,810 2,358,465 286,881,107 594,305,945Transfers - 190,068,694 - 76,294,408 (266,363,102) -Adjustment to cost - ( 9,571,528) - - - ( 9,571,528)Adjustment to
accumulated depreciation - 9,582,188 17,398,824 3,078,244 - 30,059,256
Cost of disposal - ( 1,096,440) ( 6,240,532) ( 6,373,846) - ( 13,710,818) Accumulated
depreciation of assets disposed - 537,654 6,240,532 3,833,526 - 10,611,712
Impairment loss ( 328,761) ( 361,474) - - - ( 690,235)Depreciation and
amortization charges for the year - ( 43,982,706) ( 139,608,350) ( 9,250,872) - ( 192,841,928)
Balance at December 31, 2016, net of accumulated depreciation and amortization P 725,617,003 P 728,005,795 P 325,277,611 P 84,217,267 P 23,222,511 P 1,886,340,187
Balance at January 1, 2015, net of accumulated depreciation and amortization P 724,967,986 P 541,937,651 P 211,150,839 P 12,526,360 P 35,201,703 P 1,525,784,539
Additions 531,802 21,001,928 52,635,338 4,148,882 1,532,998 79,850,948Transfers - 31,833,050 2,197,145 - ( 34,030,195) -Cost of disposal - ( 4,015,009) ( 89,790,194) ( 5,003,276) - ( 98,808,479)Accumulated
depreciation of assets disposed - 4,015,009 89,790,194 5,003,276 - 98,808,479
Depreciation and amortization charges for the year - ( 39,934,809) ( 95,124,995) ( 2,397,900) - ( 137,457,704)
Balance at December 31, 2015, net of accumulated depreciation and amortization P 725,499,788 P 554,837,820 P 170,858,327 P 14,277,342 P 2,704,506 P 1,468,177,783
Based on management’s assumption which is based on the recoverable amount of the properties, impairment loss amounting to P0.7 million was recognized in 2016. No impairment was recognized 2015. The recoverable amount of Land and Buildings was based on the present value of estimated future cash flows discounted at the current selling market rate.

90
In 2016, the estimated useful life of the Bank’s buildings was revised from a range of two to 25 years to 20 to 25 years. Furthermore, the Bank also revised its estimated useful life for leasehold and land improvements from a range of three to 20 years to standard estimated useful life of five years. The change in the estimated useful lives of the Bank’s buildings, and leasehold and land improvements is due to the harmonization of the Bank’s policies with the Parent Bank.
The Bank recognized a loss on disposal of certain parts of the Bank’s buildings and leasehold and land improvements totaling P3.1 million, which is presented as part of Others under Other Operating Expenses in the 2016 statement of profit or loss.
Total depreciation and amortization expense amounted to P192.8 million, P137.5 million and P116.7 million for the years ended December 31, 2016, 2015 and 2014, respectively, and is presented as part of Occupancy and Equipment-related Expenses under Other Operating Expenses in the statements of profit or loss.
Cost of fully-depreciated and fully-amortized assets still used in operations amounted to P266.5 million and P384.1 million in 2016 and 2015, respectively.
In 2016 and 2015, there are no bank premises, furniture, fixtures and equipment pledged as collateral for any obligation of the Bank.
Under BSP rules, investments in bank premises, furniture, fixtures and equipment should not exceed 50.00% of the Bank's unimpaired capital. As at December 31, 2015, the Bank has satisfactorily complied with this requirement. However, as at December 31, 2016, the Bank has breached this requirement due to the full implementation of BSP's Circular No. 855 which resulted in additional loan loss provision and the rebranding of the Bank and upgrades on the IT software and hardware. These were necessary to provide seamless delivery of quality service to the Bank's existing and prospective customers. Thus, the breach is not solely a result of additional investments but also due to changes in capital arising from regulatory changes. The Bank has committed to address this breach by setting up plans to increase its net worth, which includes, but is not limited to, additional capital infusion in the succeeding years.
13. INVESTMENT PROPERTIES
This account represents parcels of land and buildings and related improvements, which are held for capital appreciation, acquired in settlement of loans. Investment properties are carried at cost less allowance for impairment and accumulated depreciation. Real estate tax on investment properties amounting to P0.2 million and P0.3 million as of December 31, 2016 and 2015, respectively, were recognized as a related expense in 2016 and 2015 and is presented as part of Taxes and Licenses under Other Operating Expenses [see Note 26.1(e)].
The gross carrying amounts and allowance for impairment of investment properties as at December 31, 2016 and 2015 are shown below.
Note 2016 2015
Cost P 20,870,814 P 29,858,648
Allowance for impairment 15 ( 1,884,130) ( 1,814,685)
Accumulated depreciation ( 174,333) -
Net carrying amount P 18,812,351 P 28,043,963

91
Financial Statements
A reconciliation of the carrying amount at the beginning and end of 2016 and 2015 is shown below.
Note 2016 2015
Balance at January 1, net of allowance for impairment and accumulated depreciation P 28,043,963 P 23,129,794
Disposals ( 10,471,797) ( 472,847)
Additions 1,483,963 5,387,016
Depreciation ( 174,333) -
Impairment losses 15 ( 69,445) -
Balance at December 31, net of allowance for impairment and accumulated depreciation
P 18,812,351 P 28,043,963
The fair value of investment properties amounted to P21.43 million and P13.4 million as at December 31, 2016 and 2015, respectively [see Note 5.2(d)]. The fair values were determined through appraisals which were conducted by an in-house appraiser of the Bank, except for the appraisals of investment properties with carrying amount exceeding P5.0 million, which was conducted by an independent appraiser acceptable to the BSP.
The Bank recognized income from disposal of investment properties amounting to P0.7 million, P0.4 million and P7.6 million in 2016, 2015 and 2014, respectively, and is presented as Income from disposal of investment properties under Other Income in the statements of profit or loss (see Note 20). Proceeds from disposal of investment properties amounted to P2.6 million, P0.9 million and P12.2 million in 2016, 2015 and 2014, respectively.
14. PREPAYMENTS AND OTHER RESOURCES
The composition of this account as at December 31 is shown below.
Notes 2016 2015
Prepaid expenses P 49,529,698 P 43,689,201
Software and other intangibles – net 38,001,618 41,282,341
Unused stationery and supplies 26,856,665 13,223,032
Advance rental and security deposits 19,394,256 15,350,913
Goodwill 14,013,933 14,013,933
Sales contract receivables 3,672,767 1,266,155
Other investments 532,000 6,448,462
Post-employment defined benefit asset 21.2 - 63,604,206
Others 9,289,250 12,226,296
161,290,187 211,104,539
Allowance for impairment 15 ( 1,475,557) ( 887,869)
P 159,814,630 P 210,216,670
Prepaid expenses pertain to the Bank’s advance payment of administrative expenses related to advertising, personnel uniform, rent, insurance and other expenses. Prepaid expenses also include the balance of prepaid electronic documentary stamp tax (eDST) amounting to P19.0 million and P12.0 million as of December 31, 2016 and 2015, respectively [see Note 26.1(d)].

92
Software and other intangibles pertain to various purchased computer software license used in financial services activity and other operations of the Bank.
Goodwill, which is assessed to have an indefinite useful life, is subject to annual impairment testing and whenever there is an indication of impairment. Management believes that there are no additional impairment losses required to be recognized on the intangible asset in 2016, 2015 and 2014.
The gross carrying amounts and accumulated amortization of software and other intangibles as at December 31, 2016 and 2015 are shown below.
2016 2015
Cost P 136,543,665 P 121,427,621
Accumulated amortization ( 98,542,047) ( 80,145,280)
Net carrying amount P 38,001,618 P 41,282,341
A reconciliation of the carrying amounts of software and other intangibles at the beginning and end of 2016 and 2015 is shown below.
2016 2015
Balance at beginning of year P 41,282,341 P 53,220,902
Amortization during the year ( 18,396,767) ( 16,712,124)
Additions 15,116,044 469,584
Transfers - 4,303,979
Balance at end of year P 38,001,618 P 41,282,341
The amortization of the software and other intangibles for the year ended December 31, 2016, 2015 and 2014 is presented as part of Occupancy and Equipment-related Expenses in the statements of profit or loss.

93
Financial Statements
15. ALLOWANCE FOR IMPAIRMENT
The changes in the allowance for impairment are presented below.
Notes 2016 2015
Balance at beginning of year:
Loans and receivables P 669,305,033 P 613,833,330
Bank premises, furniture, fixtures and equipment 18,217,568 18,217,568
Investment properties 1,814,685 1,814,685
Prepayments and other resources 887,869 817,031
690,225,155 634,682,614
Impairment losses –
Loans and receivables 363,755,802 270,328,438
Bank premises, furniture, fixtures and equipment 12 690,235 -
Investment properties 13 69,445 -
364,515,482 270,328,438
Write-off of loans and receivables ( 127,861,609) ( 212,312,707)
Adjustments and reversals ( 13,550,417) ( 2,473,190)
( 141,412,026) ( 214,785,897)
Balance at end of year:
Loans and receivables 11 891,061,121 669,305,033
Bank premises, furniture, fixtures and equipment 12 18,907,803 18,217,568
Investment properties 13 1,884,130 1,814,685
Prepayments and other resources 14 1,475,557 887,869
P 913,328,611 P 690,225,155
16. DEPOSIT LIABILITIES
As at December 31, 2016 and 2015, deposit liabilities consist of the following:
2016 2015
Demand P 1,083,049,976 P 1,703,653,171
Savings 13,024,013,823 10,152,066,750
Time 8,730,053,941 9,605,819,993
P 22,837,117,740 P 21,461,539,914
Outstanding balance of deposits from DOSRI amounted to P104.1 million and nil as at December 31, 2016 and 2015, respectively (see Note 19.1).
Savings deposits have an annual interest rate of 0.50% for all years presented while time deposits have interest rates ranging from 0.88% to 2.25% in 2016 while 0.05% to 7.00% per annum in 2015.

94
The breakdown of time deposits as to their maturities is presented below.
2016 2015
One year and below P 7,527,974,033 P 8,084,740,649
More than one year but not more than three years 980,744,848 1,521,079,344
More than three years but not more than five years 221,335,060 -
P 8,730,053,941 P 9,605,819,993
Interest expense on deposit liabilities recognized during the year amounted to P305.3 million, P335.1 million and P325.3 million in 2016, 2015 and 2014, respectively, and is presented as Interest Expense on Deposit Liabilities in the statements of profit or loss.
17. ACCRUED EXPENSES AND OTHER LIABILITIES
The breakdown of this account follows:
Note 2016 2015
Accounts payable P 245,193,434 P 225,084,811
Post-employment defined benefit obligation 21.2 112,471,853 -
Accrued expenses 21.1 84,336,928 76,054,382
Manager’s check 46,618,988 53,611,430
Withholding tax payable 16,847,905 14,859,855
Deferred credits 1,486,398 3,616,984
Bills purchased - 40,988,717
Unearned income - 2,354,844
Other payables 20,789,789 5,913,034
P 527,745,295 P 422,484,057
Accrued expenses include administrative expenses and accrued interest expenses related to the Bank’s deposit liabilities.

95
Financial Statements
18. EQUITY
18.1 Capital Stock
Capital stock consists of:
Shares Amount
2016 2015 2014 2016 2015 2014
Preferred stock – P10 par value
Authorized – 30,000,000 shares
Issued and outstanding 20,560 20,560 20,560 P 205,600 P 205,600 P 205,600
Common stock – P10 par value
Authorized – 550,000,000 shares
Issued and outstanding
Balance at beginning of year 247,373,833 247,293,122 221,129,837 2,473,738,330 2,472,931,220 2,211,298,370
Issued during the year - 80,711 123,285 - 807,110 1,232,850
Stock dividends - - 26,040,000 - - 260,400,000
Balance at end of year 247,373,833 247,373,833 247,293,122 2,473,738,330 2,473,738,330 2,472,931,220
P 2,473,943,930 P 2,473,943,930 P 2,473,136,820
The preferred shares have the following rights, preferences, conditions and limitations:
(a) Preferred stock shall be issued only against Philippine Government investment in the capital stock of the Bank. Preferred stock issued shall have preference over common stock in the assets of the Bank in the event of liquidation.
(b) Preferred stock shall be non-voting but in case of sale by the government of its preferred stock to private shareholders, such stock are converted into common with voting rights upon approval of the corresponding amendment of the Articles of Incorporation by the SEC, thereby reducing the number of outstanding common stock.
(c) Preferred stock shall share in dividend distribution at two per centum thereof without preference. The amount of any dividends payable to any of stock may be applied to the repayment of the stockholders indebtedness to the Bank.
As at December 31, 2016, 2015 and 2014, the Bank has 618, 367 and 1,796 stockholders, respectively. Of the total number of stockholders, 535, 261 and 1,665 stockholders own 100 or more shares each of the Bank’s capital stock as at December 31, 2016, 2015 and 2014, respectively.

96
18.2 Other Reserves
In 2015, 80,711 shares were issued in lieu of the subscribed and accrued employee stock option plan for consideration amounting to P1.4 million that resulted to P0.6 million excess or premium which was recognized as part of Other Reserves in the 2015 statement of financial position. There was no similar transaction in 2016.
18.3 Revaluation Reserves
The components and reconciliation of items of other comprehensive income presented in the statements of changes in equity at their aggregate amount under Revaluation Reserves account, are shown below.
AFS Financial Assets
Post- employment
Defined Benefit Obligation Total
Balance at January 1, 2016 (P 47,711,533) P 15,514,331 (P 32,197,202)
Fair value gains on AFS financial assets - net 4,627,787 - 4,627,787
Remeasurements of post-employment defined benefit obligation - ( 131,034,952) ( 131,034,952)
Other comprehensive income (loss) before tax 4,627,787 ( 131,034,952) ( 126,407,165)
Tax income - 39,310,486 39,310,486
Other comprehensive income (loss)after tax 4,627,787 ( 91,724,466) ( 87,096,679)
Balance at December 31, 2016 (P 43,083,746) (P 76,210,135) (P 119,293,881)
Balance at January 1, 2015 P 254,111,935 (P 26,907,805) P 227,204,130
Fair value gains on disposed AFS financial assets reclassified to profit or loss ( 304,447,567) - ( 304,447,567)
Fair value gains on AFS financial assets - net 2,624,099 - 2,624,099
Remeasurements of post-employment defined benefit obligation - 60,603,053 60,603,053
Other comprehensive income (loss) before tax ( 301,823,468) 60,603,053 ( 241,220,415)
Tax expense - ( 18,180,917) ( 18,180,917)
Other comprehensive income (loss) after tax ( 301,823,468) 42,422,136 ( 259,401,332)
Balance at December 31, 2015 (P 47,711,533) P 15,514,331 ( P32,197,202)
Balance at January 1, 2014 P 165,320,868 (P 50,462,642) P 114,858,226
Fair value gains on AFS financial assets – net 88,791,067 - 88,791,067
Remeasurements of post-employment defined benefit obligation - 33,649,767 33,649,767
Other comprehensive income before tax 88,791,067 33,649,767 122,440,834
Tax expense - ( 10,094,930) ( 10,094,930)
Other comprehensive income after tax 88,791,067 23,554,837 112,345,904
Balance at December 31, 2014 P 254,111,935 (P 26,907,805) P 227,204,130

97
Financial Statements
18.4 Surplus
On June 16, 2014, the BSP approved the stock and cash dividend declaration of the Bank to stockholders of record as of February 28, 2014. The stock dividends amounted to P260.4 million to all common stockholders or 11.78% per share and the cash dividend amounted to P4,114 or 2.00% to all preferred stockholders. There were no dividends declared both in 2016 and 2015.
In compliance with MORB, a portion of the Bank’s surplus corresponding to the accumulated balance of deferred income tax amounting to P358.2 million as at December 31, 2016 is not available for dividend declaration until realized by the Bank.
18.5 Capital Management Objectives, Policies and Procedures
BSP, as the Bank’s lead regulator, sets and monitors capital requirements for the Bank. In implementing current capital requirements, the BSP requires the Bank to maintain a prescribed capital and ratio of qualifying capital to risk-weighted assets.
The MB, in its Resolution No. 1607 dated October 9, 2014, approved the new minimum capitalization requirements for banks. For rural banks with head office in other areas, particularly cities up to third class municipalities outside National Capital Region and with more than 50 branches, the required minimum capitalization is P80.0 million. Based on the foregoing, the Bank has complied with the BSP capitalization requirement.
Under current banking regulations, the combined capital accounts of each bank should not be less than an amount equal to ten percent of its risk assets. The qualifying capital of the Bank for purposes of determining the capital-to-risk assets ratio to total equity excluding:
(a) unbooked valuation reserves and other capital adjustments as may be required by the BSP;(b) total outstanding unsecured credit accommodations to DOSRI;(c) deferred tax asset or liability;(d) goodwill;(e) sinking fund for redemption of redeemable preferred shares; and,(f) other regulatory deductions.
Risk assets consist of total assets after exclusion of cash on hand, due from BSP, loans covered by hold-out on or assignment of deposits, loans or acceptances under letters of credit to the extent covered by margin deposits, and other non-risk items as determined by the MB of the BSP.
The amount of surplus funds available for dividend declaration is determined also on the basis of regulatory net worth after considering certain adjustments.
Under existing BSP regulations, the determination of the Bank’s compliance with regulatory requirements and ratios is based on the amount of the Bank’s unimpaired capital (regulatory net worth) reported to the BSP, determined on the basis of regulatory accounting policies, which differ from PFRS in some aspects.

98
The BSP has adopted the Basel 3 risk-based capital adequacy framework effective January 1, 2014, which requires the Bank, as a subsidiary of a universal bank required to adopt Basel 3, to maintain the following:
(a) Common Equity Tier 1 (CET1) of at least 6.00% of risk-weighted assets;(b) Tier 1 Capital of at least 7.50% of risk-weighted assets;(c) Qualifying Capital (Tier 1 plus Tier 2 Capital) of at least 10.00% of risk-weighted assets; and,(d) Capital Conservation Buffer of 2.50% of risk-weighted assets, comprised of CET1 Capital.
The regulatory capital is analyzed as CET1 Capital, Additional Tier 1 Capital and Tier 2 Capital, each adjusted for prescribed regulatory deductions.
Risk assets consist of total assets after exclusion of cash on hand, due from BSP, loans covered by hold-out on or assignment of deposits, loans or acceptances under letters of credit to the extent covered by margin deposits, and other non-risk items as determined by the Monetary Board of the BSP.
The Bank’s policy is to maintain a strong capital base as to maintain investor, creditor and market confidence and to sustain future development of the business. The impact of the level of capital on shareholder’s return is recognized by the Bank as well as the need to maintain a balance between the higher returns that might be possible with greater gearing and the advantages and security afforded by a sound capital position.
At the end of each reporting period, the Bank has complied with the prescribed ratio of qualifying capital to risk-weighted assets.
Further, under an existing BSP circular, rural banks and cooperative banks must meet a minimum capital threshold amounting to P80.0 million. As of December 31, 2016 and 2015, the Bank has complied with the above capitalization requirement.
The Bank’s regulatory capital position based on the Basel 3 risk-based capital adequacy framework as of December 31, 2016 and 2015 are as follows (in thousands):
2016 2015
Tier 1 Capital
CET 1 P 2,988,318 P 3,535,047
Additional Tier 1 231,176 -
3,219,494 3,535,047
Tier 2 Capital 220,335 194,561
Total Regulatory Capital P 3,439,829 P 3,729,608
Total Qualifying Capital P 3,439,829 P 3,729,608
Total Risk-weighted assets P 28,474,789 P 24,846,350
Capital ratios:
CET 1 Ratio 10.49% 14.23%
Capital Conservation Buffer 5.94% 8.23%
Tier 1 Capital Ratio 11.31% 14.23%
Total Capital Adequacy Ratio 12.08% 15.01%
The Bank has not yet fully adopted Basel 3 in 2015. The Bank has adopted Basel 1.5 in 2015 and in the previous years.

99
Financial Statements
On January 1, 2012, BSP Circular 688, dated May 26, 2010, took effect containing the revised risk-based adequacy framework for stand-alone thrift banks, rural banks and cooperative banks which is based on Basel 1.5 wherein CAR shall not be less than 10.00% of the qualifying capital to risk-weighted assets.
In computing the CAR, the regulatory qualifying capital is analyzed into two tiers which are: (i) Tier 1 Capital, and (ii) Tier 2 Capital; less deductions from the Total Tier 1 and Tier 2, as provided in BSP Circular 688.
The Bank’s regulatory capital position as at December 31, 2015 and 2014 is presented below (in thousands).
2015 2014
Tier 1 capital P 3,586,862 P 2,896,226
Tier 2 capital 194,561 196,359
Total regulatory capital 3,781,423 3,092,585
Total qualifying capital 3,781,423 3,092,585
Risk-weighted assets 24,525,519 24,003,259
Capital ratios:
Total regulatory capital expressed as a percentage of total risk-weighted assets 15.42% 12.88%
Total Tier 1 capital expressed as a percentage of total risk weighted assets 14.63% 12.07%
As shown in the above information, the Bank has complied with the BSP capital ratio requirements as at December 31, 2016, 2015 and 2014.

100
19. RELATED PARTY TRANSACTIONS
The Bank’s related parties include the Parent Bank, its DOSRI and others as described below and in the succeeding pages. None of the transactions incorporates special terms and conditions and no guarantee was given or received. Outstanding balances are usually settled in cash.
Related Party Category Notes
Amount of Transactions Outstanding Balance
2016 2015 2014 2016 2015
Parent
Due from other banks 8, 19.1 (P 320,559,590) P 336,145,091 P - P 301,281,092 P 621,840,682
Deposit liabilities 300,000,000 - - 300,000,000
Investments 19.2 - ( 316,691,161) - - 502,850
Interest income on investments 19.2 - 10,762,904 - - -
Bills payable 19.6 - ( 500,000,000) - - -
Interest expense on bills payable 19.6 362,500 9,976,075 - - -
Rentals 19.4 2,237,572 - - - -
Related parties under common ownership
Due from other banks 19.1 21,534,362 ( 507,114,798) - 56,682,577 35,148,215
Investments 19.2 788,049 ( 881,038,895) - 102,448,049 101,660,000
Interest income on investments 19.2 5,750,525 50,592,313 - - -
Bills payable 19.6 - ( 300,000,000) - - -
Interest expense on bills payable 19.6 - 1,011,111 - - -
Rentals 19.4 1,579,926 - - - -
Directors
Deposits 16, 19.1 55,769,185 ( 76,080,179) ( 48,563,302) 55,769,185 -
Officers
Loans 11, 19.1 - - ( 70,000) - -
Deposits 16, 19.1 38,644,842 ( 1,381,355) - 38,644,842 -
Stockholders
Loans 11, 19.1 - ( 3,416,502) ( 2,645,426) - -
Deposits 16, 19.1 9,641,693 ( 1,339,480,580) 789,971,887 9,641,693 -
Rental 19.4 128,040 112,970 1,553,588 - -

101
Financial Statements
Related Party Category Notes
Amount of Transactions Outstanding Balance
2016 2015 2014 2016 2015
Related interests
Loans 11, 19.1 (P 11,526,325) (P 7,865,009) P 7,188,674 P 161,319 P 11,687,644
Deposits 16, 19.1 - ( 1,782,723,839) ( 2,897,328,790) - -
DOSRI
Interest income on loans 19.1 177,172 939,722 1,012,918 - -
Interest expense on deposits 19.1 413,353 - 112,323,252 - -
Key management personnel
Compensation and benefits
19.319.5 18,805,000 14,808,737 14,471,818 - -
19.1 Loans and Deposits
In the ordinary course of business, the Bank has loan and deposit transactions with the Parent Bank, banks under common ownership, and its DOSRI. Under the Bank’s policy, these loans and other transactions are made substantially on the same terms and conditions as with other individuals and businesses of comparable risks.
Under the General Banking Act and BSP regulations, the amount of direct credit accommodations to each of the Bank’s directors, officers and stockholders, of which 70.00% must be secured, should not exceed the amount of their respective deposits and book value of their respective investments in the Bank.
In addition, the aggregate DOSRI loans generally should not exceed the Bank’s capital funds or 15.00% of the Bank’s loan portfolio, whichever is lower. As at December 31, 2016 and 2015, the Bank is in compliance with these regulations (see Note 11). Total deposits from DOSRI has outstanding balance of P104.1 million and nil as at December 31, 2016 and 2015, respectively (see Note 16).
The following additional information is presented relative to DOSRI loans:
2016 2015
Total DOSRI loans P 161,319 P 11,687,644
Total unsecured loans 161,319 435,729
% of DOSRI loans to total loan portfolio 0.00% 0.06%
% of past-due DOSRI loans to total DOSRI loans 0.00% 0.00%
% of unsecured DOSRI loans to total DOSRI loans 0.00% 3.73%
% of non-performing DOSRI loans to total DOSRI loans 0.00% 0.00%
As at December 31, 2016, 2015 and 2014, the allowance for impairment losses on DOSRI loans deemed sufficient by the management amounted to nil, P0.1 million and P0.2 million, respectively.
Due from other banks include deposits with the Parent Bank and CBC, a related party under common ownership, amounted to P358.0 million and P657.0 million as of December 31, 2016 and 2015, respectively. Interest rate for these due from other banks ranges from 0.10% to 1.00% in 2016.

102
19.2 Investments
The Bank acquires various types of local currency government securities such as Power Sector Assets and Liabilities Management (PSALM) – fixed rate retail bonds, treasury notes, corporate fixed rate bonds and retail treasury bonds from the Parent Bank and CBC, a related party under common ownership, and other banks to earn interest income, realize trading gains and to comply with several BSP liquidity reserve requirements (see Note 9). As at December 31, 2016, the outstanding investment acquired from related party under common ownership have a coupon rate of 5.74% and is presented as part of AFS Financial Assets in the 2016 statement of financial position.
In 2016 and 2015, interest income earned from investments acquired from the Parent Bank and CBC amounted to P5.8 million and P61.4 million, respectively, and is presented as part of Interest Income on Investments in the statements of profit or loss.
19.3 Key Management Personnel Compensations
The compensations of key management personnel are broken down as follows:
2016 2015 2014
Salaries and wages P 13,530,000 P 12,317,784 P 10,475,622
Benefits 5,275,000 2,490,953 3,996,196
P 18,805,000 P 14,808,737 P 14,471,818
These are presented as part of Compensation and employee benefits under Other Operating Expenses in the statements of profit or loss (see Note 21.1).
19.4 Rentals
The Bank is a lessee under a non-cancellable lease agreement with the Parent Bank, a related party under common ownership and a stockholder for an office space, with a lease term of one to ten years. The lease with the stockholder has an escalation rate of 5.00% at the start of the second year. Total amount of rent expense in 2016, 2015 and 2014 amounted to P3.9 million, P0.1 million and P1.6 million, respectively, which is presented as part of Occupancy and Equipment-related Expenses under Other Operating Expenses in the statements of profit or loss. There are no outstanding liabilities as at December 31, 2016 and 2015.
19.5 Retirement Plan
The Bank’s retirement fund for its post-employment defined benefit plan is administered and managed by a trustee bank, which is the Parent Bank. The fair value and the composition of the plan assets as at December 31, 2016 and 2015 are presented in Note 21.2.
The retirement plan asset includes quoted equity securities issued by the Parent Bank and other related parties amounting to P47.9 million and P26.9 million as of December 31, 2016 and 2015, respectively.

103
Financial Statements
The retirement fund neither provides any guarantee or surety for any obligations of the Bank nor its investments covered by any restrictions or liens.
The details of the contributions of the Bank and benefits paid out by the plan are presented in Note 21.2.
19.6 Bills Payable
Under normal trade terms, the Bank transacts with the credit facilities of the Parent Bank and CBC, a related party under common ownership, to avail short-term renewable bills payable to fund operating activities which includes funding lending operations.
The bills payable bear interest ranging from 3.00% to 3.25% in 2015.
There are no outstanding bills payable as of December 31, 2016 and 2015. Interest expense related to these borrowings amounted to P0.4 million and P11.0 million in 2016 and 2015, respectively, and is presented as part of Interest Expense on Bills Payable in the statements of profit or loss.
20. OTHER INCOME
This account is composed of the following:
Notes 2016 2015 2014
Recoveries from accounts written off P 13,381,466 P 2,479,519 P 20,629
Rental income 1,483 20,133 63,960
Gain on disposal of AFS financial assets 9 - 206,066,074 16,827,593
Dividend income - 6,666,000 -
Income from disposal of:
Investment properties 13 660,240 442,816 7,553,770
Bank premises, furniture, fixtures and equipment - 198,599 110,806
Miscellaneous 5,433,019 7,203,048 11,341,400
P 19,476,208 P 223,076,189 P 35,918,158
Miscellaneous income pertains to PeraDala and utility bills payment charges, sale of automated teller machine jackets and lost passbook replacement fees.

104
21. EMPLOYEE BENEFITS
21.1 Compensation and Employee Benefits
Expenses recognized for compensation and employee benefits are presented below.
Note 2016 2015 2014
Short-term employee benefits P 760,969,339 P 528,710,546 P 504,574,301
Post-employment defined benefit 21.2 48,032,001 45,618,105 40,744,276
P 809,001,340 P 574,328,651 P 545,318,577
Outstanding short-term employee benefits amounting to nil and P10.9 million as at December 31, 2016 and 2015, respectively, are included as part of Accrued expenses under Accrued Expenses and Other Liabilities in the statements of financial position (see Note 17).
21.2 Post-employment Defined Benefit Plan
(a) Characteristics of the Defined Benefit Plan
The Bank maintains a funded, tax-qualified, noncontributory post-employment benefit plan that is being administered by a trustee bank that is legally separated from the Bank. The trustee bank managed the fund in coordination with the Bank’s Retirement Plan Committee who acts in the best interest of the plan assets and is responsible for setting the investment policies. The post-employment plan covers all regular full-time employees.
The normal retirement age is 60 with a minimum of five years of credited service. The plan also provides for an early retirement at age 50 with a minimum of 15 years of credited service and late retirement after age 60 but not beyond age 65, both subject to the approval of the Bank’s BOD. Normal retirement benefit is an amount equivalent to 150.00% of plan salary for every year of credited service. The normal and late retirement benefits shall be computed in accordance with the retirement benefit formula as of normal or late retirement date.
(b) Explanation of Amounts Presented in the Financial Statements
Actuarial valuations are made every two years to update the retirement benefit costs and the amount of contributions. All amounts presented below are based on the actuarial valuation report obtained from an independent actuary in 2016.

105
Financial Statements
The amounts of post-employment defined benefit obligation (asset) recognized in the statements of financial position (see Notes 14 and 17) are determined as follows:
2016 2015
Present value of the obligation P 660,759,547 P 446,314,235
Fair value of plan assets ( 548,287,694) ( 513,942,259)
112,471,853 ( 67,628,024)
Effect of the asset ceiling - 4,023,818
P 112,471,853 (P 63,604,206)
The movements in the present value of the post-employment defined benefit obligation are as follows:
2016 2015
Balance at beginning of year P 446,314,235 P 468,295,354
Current service cost 48,032,001 45,618,105
Interest expense 21,824,766 21,026,461
Benefits paid ( 4,881,432) -
Remeasurements:
Actuarial losses arising from:
Experience adjustments 122,862,996 ( 60,817,171)
Changes in financial assumptions 26,606,981 ( 27,808,514)
Balance at end of year P 660,759,547 P 446,314,235
The movements in the fair value of plan assets are presented below.
2016 2015
Balance at beginning of year P 513,942,259 P 435,152,036
Interest income 25,012,425 21,366,268
Return (loss) on plan assets (excluding amounts included in net interest) 14,214,442 ( 23,998,814)
Benefits paid ( 4,881,432) -
Contributions to the plan - 81,422,769
Balance at end of year P 548,287,694 P 513,942,259

106
The composition of the fair value of plan assets at the end of the reporting period by category and risk characteristics is shown below.
2016 2015
Quoted equity securities:
Holding firms P 86,060,959 P 72,086,579
Electrical, energy, power and utilities 32,633,014 23,171,505
Property 30,265,423 23,583,305
Banks 29,967,403 15,804,682
Food and beverage 19,965,502 11,753,760
Telecommunications 10,917,696 13,767,668
Mining 9,113,000 7,589,400
Retail 7,464,015 5,039,251
Oil 5,167,035 -
Transportation services 785,694 2,598,991
Other financial institutions - 5,291,000
Construction, infrastructure and allied services - 1,656,652
232,339,741 182,342,793
Government securities 186,888,128 185,197,626
Corporate bonds (rated AA and above) 86,620,968 47,762,759
Cash and cash equivalents 12,604,414 93,919,765
Dividends and interest receivables 2,754,229 3,892,354
Others 27,080,214 826,962
P 548,287,694 P 513,942,259
The fair values of the above equity and debt securities are determined based on quoted market prices in active markets (classified as Level 1 of the fair value hierarchy).
The plan assets earned a return of P39.2 million in 2016 and incurred a negative return of P2.6 million in 2015.
Plan assets do not comprise any of the Bank’s own financial instruments or any of its assets occupied and/or used in its operations.

107
Financial Statements
The components of amounts recognized in profit or loss and in other comprehensive income in respect of the defined benefit post-employment plan are presented below.
2016 2015 2014
Reported in profit or loss:
Current service cost P 48,032,001 P 45,618,105 P 40,744,276
Net interest expense (income) ( 2,990,894) ( 339,807) 2,891,608
P 45,041,107 P 45,278,298 P 43,635,884
Reported in other comprehensive income (loss):
Return (loss) on plan assets* P 14,214,442 (P 23,998,814) P 33,649,767
Actuarial gains (losses) arising from:
Experience Adjustments ( 122,862,996) 60,817,171 -
Changes in financial assumptions ( 26,606,981) 27,808,514 -
Changes in the effect of the asset ceiling 4,220,583 ( 4,023,818) -
(P 131,034,952) P 60,603,053 P 33,649,767
*Excluding amounts included in net interest expense (income).
Current service cost is allocated and presented in the statements of profit or loss presented as part of Compensation and employee benefits under Other Operating Expenses (see Note 21.1). Net interest cost (income) on post-employment defined benefit plan is presented under Interest Expense (Income) in the statements of profit or loss.
Amounts recognized in other comprehensive income were included within items that will not be reclassified subsequently to profit or loss.
In determining the amounts of the defined benefit post-employment obligation, the following significant actuarial assumptions were used:
2016 2015 2014
Discount rates 5.50% 4.89% 4.49%
Expected rate of salary increases 9.00% 8.00% 10.00%
Assumptions regarding future mortality experience are based on published statistics and mortality tables. The average remaining working lives of an individual retiring at the age of 60 is 29.3 years both for male and female. These assumptions were developed by management with the assistance of an independent actuary. Discount factors are determined close to the end of each reporting period by reference to the interest rates of a zero coupon bond government bond with terms to maturity approximating to the terms of the post-employment obligation. Other assumptions are based on current actuarial benchmarks and management’s historical experience.

108
(c) Risks Associated with the Retirement Plan
The plan exposes the Bank to actuarial risks such as investment risk, interest rate risk, longevity risk and salary risk, as presented below.
(i) Investment and Interest Rate Risks
The present value of the defined benefit obligation is calculated using a discount rate determined by reference to market yields of government bonds. Generally, a decrease in the interest rate of a reference government bonds will increase the plan obligation. However, this will be partially offset by an increase in the return on the plan’s investments in debt securities and if the return on plan asset falls below this rate, it will create a deficit in the plan.
Currently, the plan has relatively balanced investment in cash and cash equivalents, equity securities and debt securities. Due to the long-term nature of the plan obligation, a level of continuing equity and debt investments is an appropriate element of the Bank’s long-term strategy to manage the plan efficiently.
(ii) Longevity and Salary Risks
The present value of the defined benefit obligation is calculated by reference to the best estimate of the mortality of the plan participants both during and after their employment, and to their future salaries. Consequently, increases in the life expectancy and salary of the plan participants will result in an increase in the plan obligation.
(d) Other information
The information on the sensitivity analysis for certain significant actuarial assumptions, the Bank’s asset-liability matching strategy, and the timing and uncertainty of future cash flows related to the retirement plan are described below and in the succeeding page.
(i) Sensitivity Analysis
The following table summarizes the effects of changes in the significant actuarial assumptions used in the determination of the defined benefit obligation as at December 31, 2016 and 2015:
Impact on Post-employment Benefit Obligation
Change in
AssumptionIncrease in Assumption
Decrease in Assumption
December 31, 2016
Discount rate +/- 1.00% (P 83,518,428) P 99,935,112
Salary growth rate +/- 1.00% 89,157,908 ( 76,916,562)
December 31, 2015
Discount rate +/- 1.00% (P 61,120,598) P 73,663,218
Salary growth rate +/- 1.00% 66,054,502 ( 56,560,155)
The sensitivity analysis in the previous page is based on a change in an assumption while holding all other assumptions constant. This analysis may not be representative of the actual change in the defined benefit obligation as it is unlikely that the change in assumptions would occur in isolation of one another as some of the assumptions may be correlated. Furthermore, in presenting the above sensitivity analysis, the present value of the defined benefit obligation has been calculated using the projected unit credit method at the end of the reporting period, which is the same as that applied in calculating the defined benefit obligation recognized in the statements of financial position.
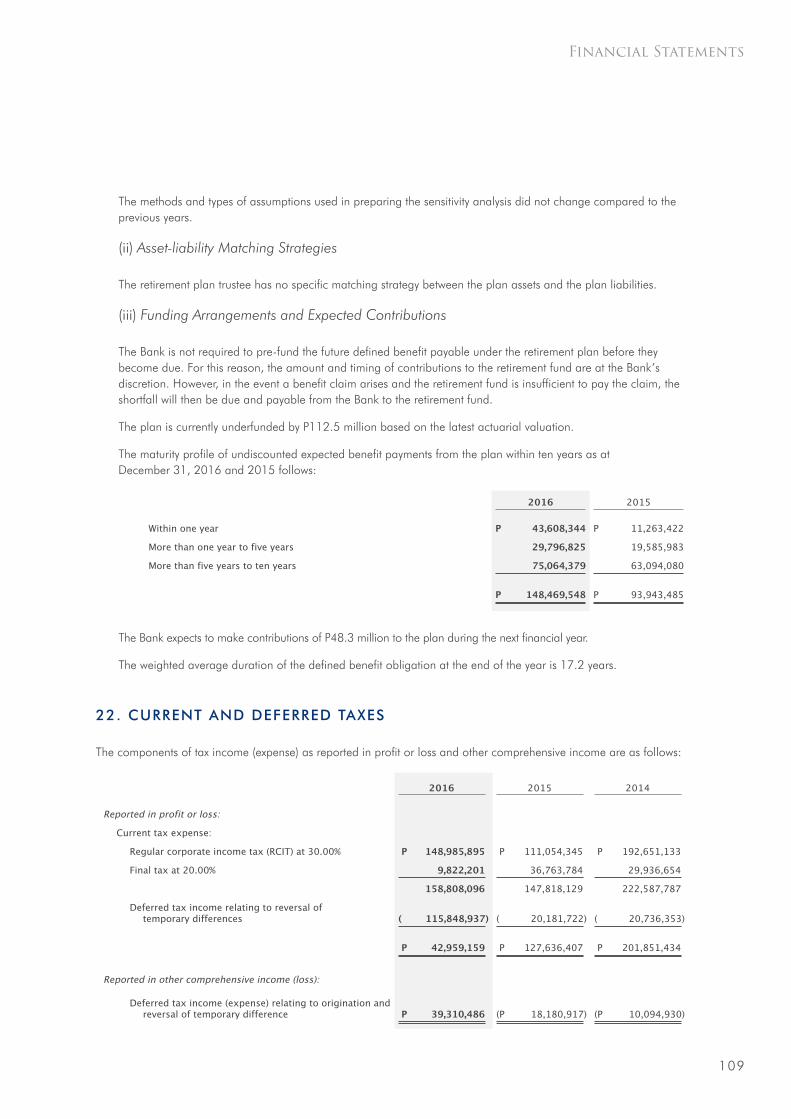
109
Financial Statements
The methods and types of assumptions used in preparing the sensitivity analysis did not change compared to the previous years.
(ii) Asset-liability Matching Strategies
The retirement plan trustee has no specific matching strategy between the plan assets and the plan liabilities.
(iii) Funding Arrangements and Expected Contributions
The Bank is not required to pre-fund the future defined benefit payable under the retirement plan before they become due. For this reason, the amount and timing of contributions to the retirement fund are at the Bank’s discretion. However, in the event a benefit claim arises and the retirement fund is insufficient to pay the claim, the shortfall will then be due and payable from the Bank to the retirement fund.
The plan is currently underfunded by P112.5 million based on the latest actuarial valuation.
The maturity profile of undiscounted expected benefit payments from the plan within ten years as at December 31, 2016 and 2015 follows:
2016 2015
Within one year P 43,608,344 P 11,263,422
More than one year to five years 29,796,825 19,585,983
More than five years to ten years 75,064,379 63,094,080
P 148,469,548 P 93,943,485
The Bank expects to make contributions of P48.3 million to the plan during the next financial year.
The weighted average duration of the defined benefit obligation at the end of the year is 17.2 years.
22. CURRENT AND DEFERRED TAXES
The components of tax income (expense) as reported in profit or loss and other comprehensive income are as follows:
2016 2015 2014
Reported in profit or loss:
Current tax expense:
Regular corporate income tax (RCIT) at 30.00% P 148,985,895 P 111,054,345 P 192,651,133
Final tax at 20.00% 9,822,201 36,763,784 29,936,654
158,808,096 147,818,129 222,587,787
Deferred tax income relating to reversal of temporary differences ( 115,848,937) ( 20,181,722) ( 20,736,353)
P 42,959,159 P 127,636,407 P 201,851,434
Reported in other comprehensive income (loss):
Deferred tax income (expense) relating to origination and reversal of temporary difference P 39,310,486 (P 18,180,917) (P 10,094,930)

110
The reconciliation of tax on pretax profit computed at the applicable statutory rates to tax expense reported in profit or loss is as follows:
2016 2015 2014
Tax on pretax profit at 30.00% P 30,987,716 P 157,867,892 P 199,104,200
Adjustment for income subjected to lower income tax rate ( 3,950,022) ( 7,848,880) ( 16,703,481)
Tax effects of:
Non-deductible expenses 11,330,724 26,723,603 9,107,748
Non-deductible interest expense 4,590,741 14,722,179 15,391,245
Non-taxable gain from disposal of AFS investments with maturity of more than five years - ( 61,819,822) ( 5,048,278)
Non-taxable dividend and other income
- ( 2,008,565) -
Tax expense P 42,959,159 P 127,636,407 P 201,851,434
The net deferred tax assets and liability relate to the following as at December 31, 2016 and 2015:
Statements of Financial Position
Profit or Loss
Other Comprehensive Income
2016 2015 2016 2015 2014 2016 2015 2014
Deferred tax assets:
Allowance for impairment P 281,488,702 P 209,498,940 P 71,989,762 P 17,404,719 P 7,100,968 P - P - P -
Post-employment defined benefit plan 75,811,361 28,046,060 8,454,815 9,873,033 7,638,589 39,310,486 ( 18,180,917) ( 10,094,930)
Provision for contingencies 870,900 870,900 - - - - - -
Unamortized past service cost - - - ( 842,953) - - -
358,170,963 238,415,900 80,444,577 27,277,752 13,896,604 39,310,486 ( 18,180,917) ( 10,094,930)
Deferred tax liability – Accrual of effective interest income - ( 35,404,360) 35,404,360 ( 7,096,030) 6,839,749 - - -
Deferred tax assets - net P 358,170,963 P 203,011,540
Deferred tax income (expense) P 115,848,937 P 20,181,722 P 20,736,353 P 39,310,486 (P 18,180,917) (P 10,094,930)
The Bank is subject to the minimum corporate income tax (MCIT), which is computed at 2.00% of gross income, as defined under the tax regulations, or RCIT, whichever is higher. No MCIT was reported in 2016, 2015 and 2014, as the RCIT was higher than MCIT in both years.
In 2016, 2015 and 2014, the Bank claimed itemized deductions in computing for its income tax due.
Upon execution of the merger with RBSEI, deferred tax assets on allowance for impairment on loans receivable amounting to P3.6 million was transferred to the Bank.

111
Financial Statements
23. EARNINGS PER SHARE
EPS amounts are computed as follows:
2016 2015 2014
(a) Net profit attributable to common shares P 60,333,228 P 398,589,899 P 461,829,234
(b) Net profit attributable to common shares and potential common shares 60,333,228 398,589,899 461,829,234
(c) Weighted average number of outstanding common shares 247,373,833 247,359,433 247,185,248
(d) Weighted average number of outstanding common shares and potential shares 247,373,833 247,359,433 247,185,248
Earnings per share
Basic (a/c) P 0.24 P 1.61 P 1.87
Diluted (b/d) P 0.24 P 1.61 P 1.87
The Bank has no significant dilutive potential common shares as of December 31, 2016, 2015 and 2014.
24. QUANTITATIVE INDICATORS OF FINANCIAL PERFORMANCE
The following are the basic financial performance ratios as of and for the years ended December 31, 2016, 2015 and 2014:
2016 2015 2014
Return on average equity 1.60% 10.76% 13.81%
Return on average assets 0.23% 1.44% 1.69%
Net interest margin 5.48% 5.64% 5.24%
25. COMMITMENTS AND CONTINGENCIES
25.1 Operating Lease Commitments – Bank as Lessee
The Bank is a lessee under non-cancellable operating lease agreements covering offices and certain branches. The leases have terms ranging from 1 to 25 years, with renewal options, and include annual escalation rates ranging from 3.00% to 10.00%. Rent expense amounted to P31.5 million, P33.9 million and P28.4 million in 2016, 2015 and 2014, respectively, and is presented as part of the Occupancy and Equipment-related Expenses account under Other Operating Expenses in statements of profit or loss. The future minimum rentals payable under these non-cancellable operating leases are shown below.
2016 2015 2014
Within one year P 23,340,125 P 6,235,692 P 5,546,617
After one year but not more than five years 102,197,499 22,980,829 17,402,851
More than five years 80,925,315 7,286,513 6,038,101
P 206,462,939 P 36,503,034 P 28,987,569

112
25.2 Contingencies
There are contingent liabilities such as litigations and claims that arise in the normal course of the Bank’s operations which are not reflected in the Bank’s financial statements. The Bank’s management is of the opinion that losses, if any, as at December 31, 2016 and 2015, from these claims will not have any material effect on the Bank’s financial statements.
26. SUPPLEMENTAL INFORMATION REQUIRED BY THE BUREAU OF INTERNAL REVENUE
Presented below and in the succeeding pages is the supplementary information which is required by the BIR under its existing revenue regulations (RR) to be disclosed as part of the notes to financial statements. This supplementary information is not a required disclosure under PFRS.
26.1 Requirements Under RR 15-2010
The information on taxes, duties and license fees paid or accrued during the taxable year required under RR 15-2010 are as follows:
(a) Gross Receipts Tax
In lieu of the value-added tax, the Bank is subject to the GRT imposed on all banks and non-bank financial intermediaries pursuant to Section 121.2 of the Tax Code.
During 2016, the Bank paid GRT amounting P152,466,615. The amount is presented as part of Taxes and Licenses under Operating Expenses in the 2016 statement of profit or loss [see Note 26.1(e)].
(b) Taxes on Importation
The Bank does not have any landed cost, customs duties and tariff fees in 2016 since it does not have any importation during the year.
(c) Excise Tax
The Bank did not have any transactions in 2016, which are subject to excise tax.
(d) Documentary Stamp Tax (DST)
In general, the Bank’s DST transactions arise from the execution of debt instruments, time deposits and issuance of new shares.
For the year ended December 31, 2016, the composition of DST is as follows:
Debt instruments P 115,505,041
Time deposits 37,425,130
Checks 2,589,849
Others 261,209
P 155,781,229
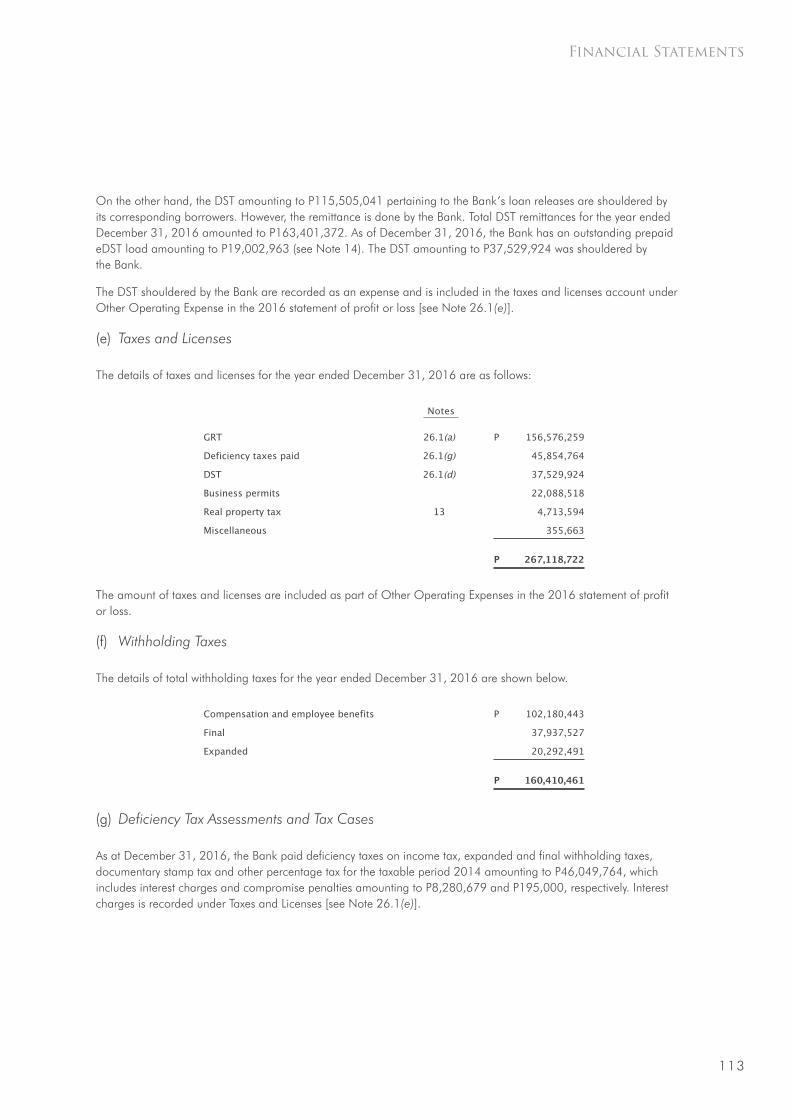
113
Financial Statements
On the other hand, the DST amounting to P115,505,041 pertaining to the Bank’s loan releases are shouldered by its corresponding borrowers. However, the remittance is done by the Bank. Total DST remittances for the year ended December 31, 2016 amounted to P163,401,372. As of December 31, 2016, the Bank has an outstanding prepaid eDST load amounting to P19,002,963 (see Note 14). The DST amounting to P37,529,924 was shouldered by the Bank.
The DST shouldered by the Bank are recorded as an expense and is included in the taxes and licenses account under Other Operating Expense in the 2016 statement of profit or loss [see Note 26.1(e)].
(e) Taxes and Licenses
The details of taxes and licenses for the year ended December 31, 2016 are as follows:
Notes
GRT 26.1(a) P 156,576,259
Deficiency taxes paid 26.1(g) 45,854,764
DST 26.1(d) 37,529,924
Business permits 22,088,518
Real property tax 13 4,713,594
Miscellaneous 355,663
P 267,118,722
The amount of taxes and licenses are included as part of Other Operating Expenses in the 2016 statement of profit or loss.
(f) Withholding Taxes
The details of total withholding taxes for the year ended December 31, 2016 are shown below.
Compensation and employee benefits P 102,180,443
Final 37,937,527
Expanded 20,292,491
P 160,410,461
(g) Deficiency Tax Assessments and Tax Cases
As at December 31, 2016, the Bank paid deficiency taxes on income tax, expanded and final withholding taxes, documentary stamp tax and other percentage tax for the taxable period 2014 amounting to P46,049,764, which includes interest charges and compromise penalties amounting to P8,280,679 and P195,000, respectively. Interest charges is recorded under Taxes and Licenses [see Note 26.1(e)].

114
26.2 Requirements under RR 19-2011
RR 19-2011 requires schedules of taxable revenues and other non-operating income, cost of sales and services, itemized deductions and other significant tax information, to be disclosed in the notes to financial statements.
The amounts of taxable revenues and income, and deductible costs and expenses presented below and on the next page are based on relevant tax regulations issued by the BIR, hence, may not be the same as the amounts reflected in the 2016 statement of profit or loss.
(a) Taxable Revenues
The composition of Bank’s taxable revenues subject to regular tax rate for the year ended December 31, 2016 represents interest income amounting to P1,614,207,048.
(b) Deductible Cost of Services
Deductible cost of services which are under the regular tax rate for year ended December 31, 2016 comprise the following:
Salaries, wages and benefits P 713,133,245
Interest expense 290,374,587
PDIC insurance 40,877,335
BSP supervision fee 6,187,739
P 1,050,572,906
(c) Taxable Non-operating and Other Income
The details of taxable non-operating and other income in 2016, which are subject to regular tax rate are shown below.
Service charges, fees and commissions P 1,131,221,305
Others 19,476,208
P 1,150,697,513
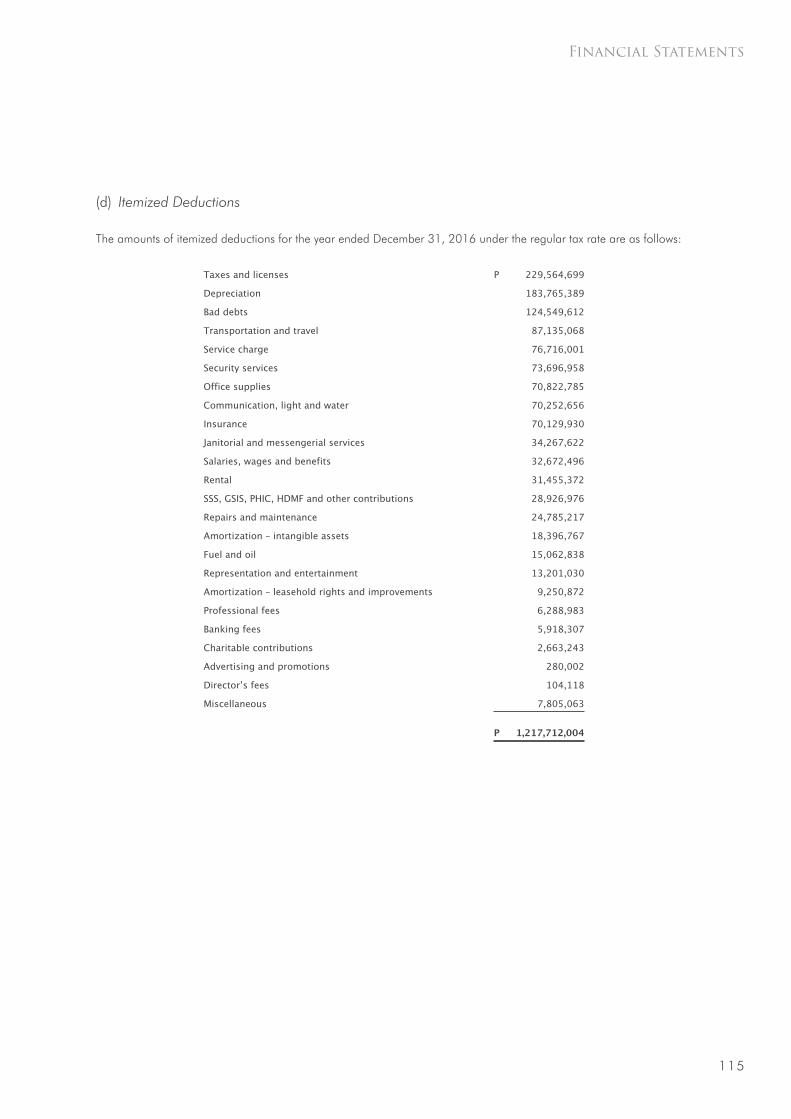
115
Financial Statements
(d) Itemized Deductions
The amounts of itemized deductions for the year ended December 31, 2016 under the regular tax rate are as follows:
Taxes and licenses P 229,564,699
Depreciation 183,765,389
Bad debts 124,549,612
Transportation and travel 87,135,068
Service charge 76,716,001
Security services 73,696,958
Office supplies 70,822,785
Communication, light and water 70,252,656
Insurance 70,129,930
Janitorial and messengerial services 34,267,622
Salaries, wages and benefits 32,672,496
Rental 31,455,372
SSS, GSIS, PHIC, HDMF and other contributions 28,926,976
Repairs and maintenance 24,785,217
Amortization – intangible assets 18,396,767
Fuel and oil 15,062,838
Representation and entertainment 13,201,030
Amortization – leasehold rights and improvements 9,250,872
Professional fees 6,288,983
Banking fees 5,918,307
Charitable contributions 2,663,243
Advertising and promotions 280,002
Director’s fees 104,118
Miscellaneous 7,805,063
P 1,217,712,004

116
Management Directory Board of DirectorsChairman Nestor V. Tan
Directors Jaime C. Yu Rolando C. Tanchanco Pedro M. Florescio III Alex V. Buenaventura (President until October 31, 2016) Evelyn T. Ang Maria Lourdes Jocelyn S. Pineda
Adviser Teresita T. Sy
Corporate Secretary Bambeth Mahal C. Jambangan-Diez
Assistant Corporate Secretary Cecilia S. Santos
Principal OfficersOfficer-in-Charge Ramon T. Militar
Senior Vice President Romulo C. Guerrero
First Vice President Nelson L. Billena Alberto O. Quiogue
Vice President Maria Agnes R. Aragon
Senior Assistant Vice President David S. Aquino (until December 23, 2016) Ronnie B. Hombre Minda A. Lim

117
Products and ServicesDepositRegular Savings DepositRegular Checking AccountRegular Time DepositOne Savings/One Checking AccountYoung PeraSavers AccountATM Deposit AccountsSSS Pensioner Account
LoanSalary LoansSSS Pensioner LoansBusiness LoansAgri-Development Loans
Transaction BankingCash Management ServicesBusiness Online Banking
Other ServicesRemittance
Interbranch Transaction Services
Domestic Remittance Services Palawan Pawnshop Express Pera Padala
Inward Foreign Remittance Services BDO Remittance Chinabank
Bills Payment

118
Corporate InformationCompany HeadquartersOne Network Bank, Inc. (A Rural Bank) ONB Center Km. 9, Sasa, Davao City Philippines +63 (082) 233-7777 Company website: www.onenetworkbank.com.ph
Branches and ATMsFor the complete list of ONB branches and ATM locations, please visit www.onenetworkbank.com.ph