Embed Size (px)
Citation preview

NCSBN RESEARCH BRIEF
Volume 70 | July 2017
2016 NCLEX® Examination Statistics
2016 NCLEX® Examination Statistics
National Council of State Boards of Nursing, Inc. (NCSBN®)
Mission Statement
The National Council of State Boards of Nursing (NCSBN®) provides education, service and research through collaborative leadership to promote evidence-based regulatory excellence for patient safety and public protection.
Copyright ©2016 National Council of State Boards of Nursing, Inc. (NCSBN®)
All rights reserved. NCSBN®, NCLEX®, NCLEX-RN®, NCLEX-PN®, NNAAP®, MACE®, Nursys® and TERCAP® are registered trademarks of NCSBN and this document may not be used, reproduced or disseminated to any third party without writ-ten permission from NCSBN.
Permission is granted to boards of nursing to use or reproduce all or parts of this document for licensure related purposes only. Nonprofit education programs have permission to use or reproduce all or parts of this document for educational purposes only. Use or reproduction of this document for commercial or for-profit use is strictly prohibited. Any authorized reproduction of this document shall display the notice: “Copyright by the National Council of State Boards of Nursing, Inc. All rights reserved.” Or, if a portion of the document is reproduced or incorporated in other materials, such written materials shall include the following credit: “Portions copyrighted by the National Council of State Boards of Nursing, Inc. All rights reserved.”
Address inquiries in writing to NCSBN Permissions, 111 E. Wacker Drive, Suite 2900, Chicago, IL 60601-4277. Suggested Citation: National Council of State Boards of Nursing. (2016). 2015 Nurse Licensee Volume and NCLEX® Examination Statistics. Chicago: Author.
ISBN# 978-0-9903603-6-0
National Council of State Boards of Nursing, Inc. (NCSBN) | 2017
3TABLE OF CONTENTS
TABLE OF CONTENTSIntroduction . . . . . . . . . . . . . . . . . . . . . . . . . . . . . . . . . . . . . . . . . . . . . . . . . . . . . . . . . . . . . . . . . . . . . . . . . 5
List of Tables
Table 1. Candidates Taking the NCLEX-RN® by Type of Candidate . . . . . . . . . . . . . . . . . . . . . . . . . . . . . 7Table 2. Candidates Taking the NCLEX-RN® for Canadian
Licensure/Registration, by Type of Candidate . . . . . . . . . . . . . . . . . . . . . . . . . . . . . . . . . . . . . . . . . . 8Table 3. Summary Statistics for First-Time NCLEX-RN® Candidates for U.S. Licensure
and Canadian Licensure/Registration . . . . . . . . . . . . . . . . . . . . . . . . . . . . . . . . . . . . . . . . . . . . . . . . . 8Table 4. First-Time, U.S.-Educated Candidates Taking the NCLEX-RN®
for U.S. Licensure, by Degree Type (Jan. 1–March 31, 2016) . . . . . . . . . . . . . . . . . . . . . . . . . . . . . . . 9Table 5. First-Time, U.S.-Educated Candidates Taking the NCLEX-RN®
for U.S. Licensure, by Degree Type (April 1–June 30, 2016) . . . . . . . . . . . . . . . . . . . . . . . . . . . . . . . 11Table 6. First-Time, U.S.-Educated Candidates Taking the NCLEX-RN®,
by Degree Type (July 1–Sept. 30, 2016) . . . . . . . . . . . . . . . . . . . . . . . . . . . . . . . . . . . . . . . . . . . . . . 13Table 7. First-Time, U.S.-Educated Candidates Taking the NCLEX-RN®,
for U.S. Licensure, by Degree Type (Oct. 1–Dec. 31, 2016) . . . . . . . . . . . . . . . . . . . . . . . . . . . . . . . 15Table 8. First-Time, U.S. Educated Candidates Taking the NCLEX-RN®
for U.S. Licensure, by Degree Type (Jan. 1–Dec. 31, 2016) . . . . . . . . . . . . . . . . . . . . . . . . . . . . . . . . 17Table 9. First-Time, Internationally Educated Candidates Taking the NCLEX-RN®
for U.S. Licensure, by Country of Education (Jan.1–Dec. 31, 2016) . . . . . . . . . . . . . . . . . . . . . . . . . 19Table 10. First-Time, Canadian Educated Candidates Taking the NCLEX-RN® for
Canadian Licensure/Registration, by Degree Type (Oct. 1–Dec. 31, 2016) . . . . . . . . . . . . . . . . . . . 24Table 11. First-Time, Internationally Educated Candidates Taking the NCLEX-RN® for
Canadian Licensure/Registration, by Country of Education (Jan. 1–Dec. 31, 2016) . . . . . . . . . . . . 25Table 12. Candidates Taking the NCLEX-PN®, by Type of Candidate . . . . . . . . . . . . . . . . . . . . . . . . . . . 39Table 13. Summary Statistics for First-Time, U.S.-Educated Candidates. . . . . . . . . . . . . . . . . . . . . . . . . 39Table 14. First-Time, U.S.-Educated Candidates Taking the NCLEX-PN®
(Jan. 1–Dec. 31, 2016). . . . . . . . . . . . . . . . . . . . . . . . . . . . . . . . . . . . . . . . . . . . . . . . . . . . . . . . . . . . 40Table 15. First-Time, Internationally Educated Candidates Taking the NCLEX-PN®,
by Country of Education (Jan. 1–Dec. 31, 2016). . . . . . . . . . . . . . . . . . . . . . . . . . . . . . . . . . . . . . . . 42
List of Figures
Figure 1. NCLEX-RN® Pass Rates for First-Time, U.S.-Educated Candidates for U.S. Licensure . . . . . . 27Figure 2. NCLEX-RN® Pass Rates for All Candidates for U.S. Licensure . . . . . . . . . . . . . . . . . . . . . . . . . 28Figure 3. NCLEX-RN® Yearly Pass Rates for U.S. Licensure . . . . . . . . . . . . . . . . . . . . . . . . . . . . . . . . . . . 29Figure 4. NCLEX-RN® Pass Rates for First-Time, Canadian-Educated Candidates for Canadian
Licensure/Registration . . . . . . . . . . . . . . . . . . . . . . . . . . . . . . . . . . . . . . . . . . . . . . . . . . . . . . . . . . . . 30Figure 5. NCLEX-RN® Pass Rates for All Candidates for Canadian Licensure/Registration . . . . . . . . . . 31Figure 6. NCLEX-RN® Yearly Pass Rates for Canadian Licensure/Registration . . . . . . . . . . . . . . . . . . . . 32Figure 7. NCLEX-RN® Volume for First-Time, U.S.-Educated Candidates for U.S. Licensure . . . . . . . . . 33Figure 8. NCLEX-RN® Volume for All Candidates for U.S. Licensure . . . . . . . . . . . . . . . . . . . . . . . . . . . . 34Figure 9. NCLEX-RN® Annual Volume for U.S. Licensure, April 1994–December 2016 . . . . . . . . . . . . . 35
National Council of State Boards of Nursing, Inc. (NCSBN) | 2017
4 TABLE OF CONTENTS
Figure 10. NCLEX-RN® Volume for First-Time, Canadian Educated Candidates for Canadian Licensure/Registration . . . . . . . . . . . . . . . . . . . . . . . . . . . . . . . . . . . . . . . . . . . . . . . . . . . . . . . . . . . . 36
Figure 11. NCLEX-RN® Volume for All Candidates for Canadian Licensure/Registration . . . . . . . . . . . . 37Figure 12. NCLEX-RN® Annual Volume for Canadian Licensure/Registration,
January 2015–December 2016 . . . . . . . . . . . . . . . . . . . . . . . . . . . . . . . . . . . . . . . . . . . . . . . . . . . . . 38Figure 13. NCLEX-PN® Pass Rates for First-Time, U.S.-Educated Candidates . . . . . . . . . . . . . . . . . . . . 44Figure 14. NCLEX-PN® Pass Rates for All Candidates . . . . . . . . . . . . . . . . . . . . . . . . . . . . . . . . . . . . . . . 45Figure 15. NCLEX-PN® Annual Pass Rates, April 1994–December 2016 . . . . . . . . . . . . . . . . . . . . . . . . . 46Figure 16. NCLEX-PN® Volume for First-Time, U.S.-Educated Candidates . . . . . . . . . . . . . . . . . . . . . . . 47Figure 17. NCLEX-PN® Volume for All Candidates . . . . . . . . . . . . . . . . . . . . . . . . . . . . . . . . . . . . . . . . . . 48Figure 18. NCLEX-PN® Annual Volume, April 1994–December 1994 . . . . . . . . . . . . . . . . . . . . . . . . . . . 49
TABLE OF CONTENTS
National Council of State Boards of Nursing, Inc. (NCSBN) | 2017
5INTRODUCTION
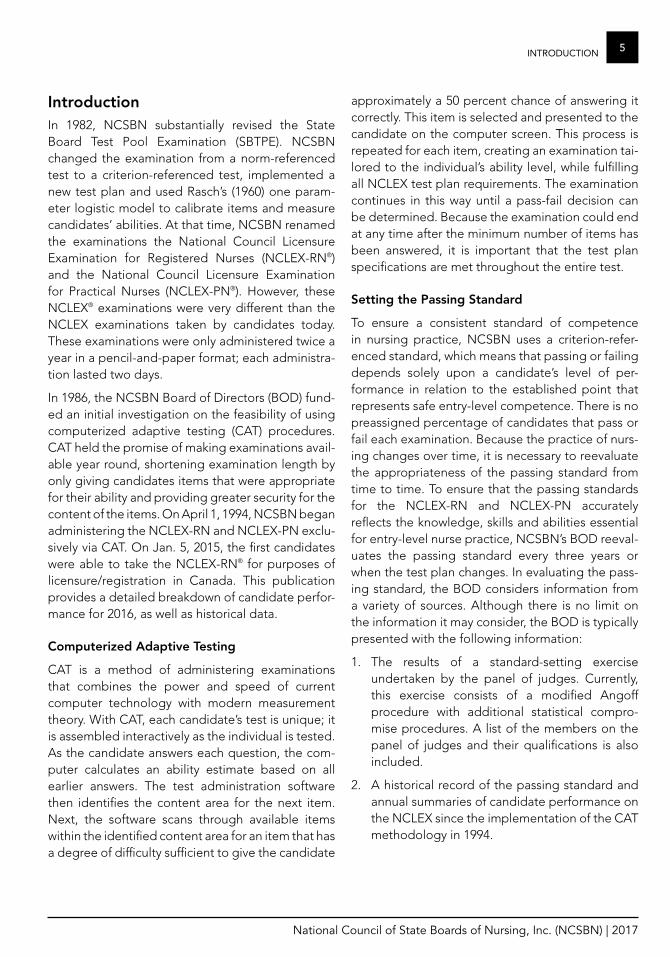
IntroductionIn 1982, NCSBN substantially revised the State Board Test Pool Examination (SBTPE). NCSBN changed the examination from a norm-referenced test to a criterion-referenced test, implemented a new test plan and used Rasch’s (1960) one param-eter logistic model to calibrate items and measure candidates’ abilities. At that time, NCSBN renamed the examinations the National Council Licensure Examination for Registered Nurses (NCLEX-RN®) and the National Council Licensure Examination for Practical Nurses (NCLEX-PN®). However, these NCLEX® examinations were very different than the NCLEX examinations taken by candidates today. These examinations were only administered twice a year in a pencil-and-paper format; each administra-tion lasted two days.
In 1986, the NCSBN Board of Directors (BOD) fund-ed an initial investigation on the feasibility of using computerized adaptive testing (CAT) procedures. CAT held the promise of making examinations avail-able year round, shortening examination length by only giving candidates items that were appropriate for their ability and providing greater security for the content of the items. On April 1, 1994, NCSBN began administering the NCLEX-RN and NCLEX-PN exclu-sively via CAT. On Jan. 5, 2015, the first candidates were able to take the NCLEX-RN® for purposes of licensure/registration in Canada. This publication provides a detailed breakdown of candidate perfor-mance for 2016, as well as historical data.
Computerized Adaptive Testing
CAT is a method of administering examinations that combines the power and speed of current computer technology with modern measurement theory. With CAT, each candidate’s test is unique; it is assembled interactively as the individual is tested. As the candidate answers each question, the com-puter calculates an ability estimate based on all earlier answers. The test administration software then identifies the content area for the next item. Next, the software scans through available items within the identified content area for an item that has a degree of difficulty sufficient to give the candidate
approximately a 50 percent chance of answering it correctly. This item is selected and presented to the candidate on the computer screen. This process is repeated for each item, creating an examination tai-lored to the individual’s ability level, while fulfilling all NCLEX test plan requirements. The examination continues in this way until a pass-fail decision can be determined. Because the examination could end at any time after the minimum number of items has been answered, it is important that the test plan specifications are met throughout the entire test.
Setting the Passing Standard
To ensure a consistent standard of competence in nursing practice, NCSBN uses a criterion-refer-enced standard, which means that passing or failing depends solely upon a candidate’s level of per-formance in relation to the established point that represents safe entry-level competence. There is no preassigned percentage of candidates that pass or fail each examination. Because the practice of nurs-ing changes over time, it is necessary to reevaluate the appropriateness of the passing standard from time to time. To ensure that the passing standards for the NCLEX-RN and NCLEX-PN accurately reflects the knowledge, skills and abilities essential for entry-level nurse practice, NCSBN’s BOD reeval-uates the passing standard every three years or when the test plan changes. In evaluating the pass-ing standard, the BOD considers information from a variety of sources. Although there is no limit on the information it may consider, the BOD is typically presented with the following information:
1. The results of a standard-setting exercise undertaken by the panel of judges. Currently, this exercise consists of a modified Angoff procedure with additional statistical compro-mise procedures. A list of the members on the panel of judges and their qualifications is also included.
2. A historical record of the passing standard and annual summaries of candidate performance on the NCLEX since the implementation of the CAT methodology in 1994.
National Council of State Boards of Nursing, Inc. (NCSBN) | 2017
6 INTRODUCTION
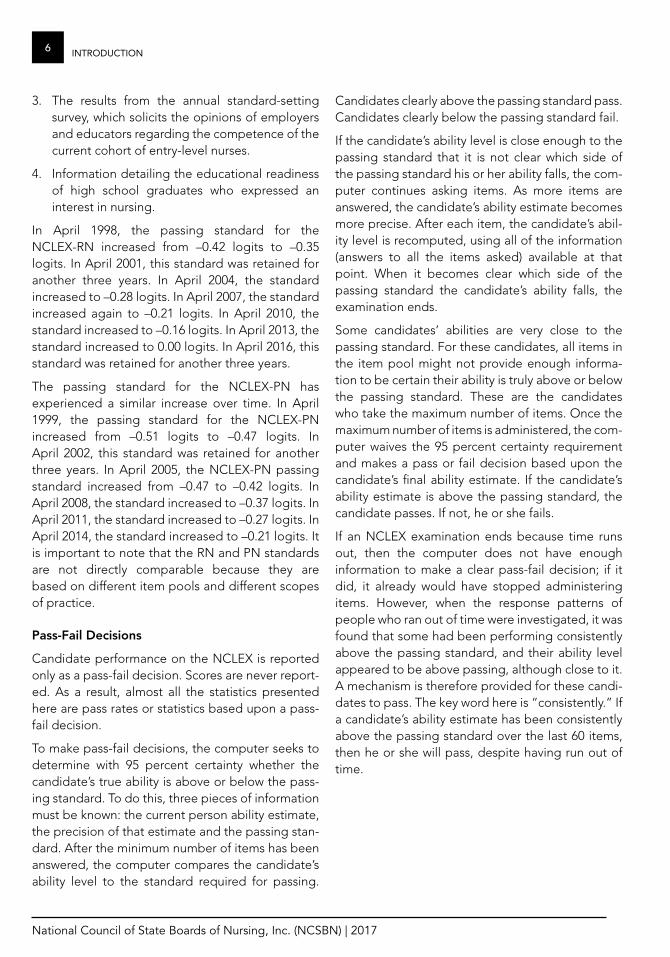
3. The results from the annual standard-setting survey, which solicits the opinions of employers and educators regarding the competence of the current cohort of entry-level nurses.
4. Information detailing the educational readiness of high school graduates who expressed an interest in nursing.
In April 1998, the passing standard for the NCLEX-RN increased from –0.42 logits to –0.35 logits. In April 2001, this standard was retained for another three years. In April 2004, the standard increased to –0.28 logits. In April 2007, the standard increased again to –0.21 logits. In April 2010, the standard increased to –0.16 logits. In April 2013, the standard increased to 0.00 logits. In April 2016, this standard was retained for another three years.
The passing standard for the NCLEX-PN has experienced a similar increase over time. In April 1999, the passing standard for the NCLEX-PN increased from –0.51 logits to –0.47 logits. In April 2002, this standard was retained for another three years. In April 2005, the NCLEX-PN passing standard increased from –0.47 to –0.42 logits. In April 2008, the standard increased to –0.37 logits. In April 2011, the standard increased to –0.27 logits. In April 2014, the standard increased to –0.21 logits. It is important to note that the RN and PN standards are not directly comparable because they are based on different item pools and different scopes of practice.
Pass-Fail Decisions
Candidate performance on the NCLEX is reported only as a pass-fail decision. Scores are never report-ed. As a result, almost all the statistics presented here are pass rates or statistics based upon a pass-fail decision.
To make pass-fail decisions, the computer seeks to determine with 95 percent certainty whether the candidate’s true ability is above or below the pass-ing standard. To do this, three pieces of information must be known: the current person ability estimate, the precision of that estimate and the passing stan-dard. After the minimum number of items has been answered, the computer compares the candidate’s ability level to the standard required for passing.
Candidates clearly above the passing standard pass. Candidates clearly below the passing standard fail.
If the candidate’s ability level is close enough to the passing standard that it is not clear which side of the passing standard his or her ability falls, the com-puter continues asking items. As more items are answered, the candidate’s ability estimate becomes more precise. After each item, the candidate’s abil-ity level is recomputed, using all of the information (answers to all the items asked) available at that point. When it becomes clear which side of the passing standard the candidate’s ability falls, the examination ends.
Some candidates’ abilities are very close to the passing standard. For these candidates, all items in the item pool might not provide enough informa-tion to be certain their ability is truly above or below the passing standard. These are the candidates who take the maximum number of items. Once the maximum number of items is administered, the com-puter waives the 95 percent certainty requirement and makes a pass or fail decision based upon the candidate’s final ability estimate. If the candidate’s ability estimate is above the passing standard, the candidate passes. If not, he or she fails.
If an NCLEX examination ends because time runs out, then the computer does not have enough information to make a clear pass-fail decision; if it did, it already would have stopped administering items. However, when the response patterns of people who ran out of time were investigated, it was found that some had been performing consistently above the passing standard, and their ability level appeared to be above passing, although close to it. A mechanism is therefore provided for these candi-dates to pass. The key word here is “consistently.” If a candidate’s ability estimate has been consistently above the passing standard over the last 60 items, then he or she will pass, despite having run out of time.
72016 NCLEX® EXAMINATION STATISTICS
National Council of State Boards of Nursing, Inc. (NCSBN) | 2017
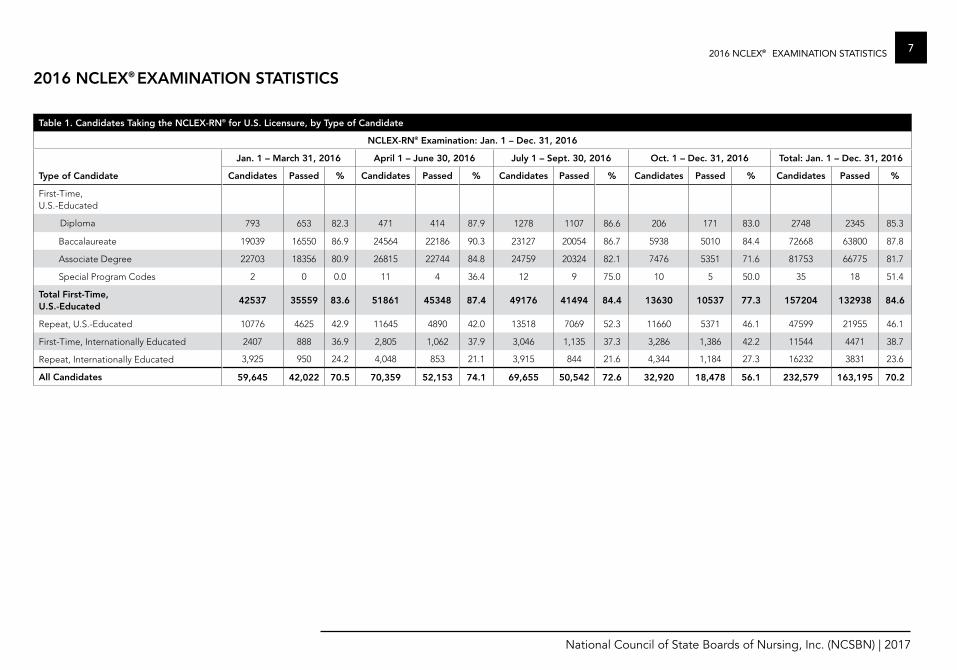
Table 1. Candidates Taking the NCLEX-RN® for U.S. Licensure, by Type of Candidate
NCLEX-RN® Examination: Jan. 1 – Dec. 31, 2016
Jan. 1 – March 31, 2016 April 1 – June 30, 2016 July 1 – Sept. 30, 2016 Oct. 1 – Dec. 31, 2016 Total: Jan. 1 – Dec. 31, 2016
Type of Candidate Candidates Passed % Candidates Passed % Candidates Passed % Candidates Passed % Candidates Passed %
First-Time, U.S.-Educated
Diploma 793 653 82.3 471 414 87.9 1278 1107 86.6 206 171 83.0 2748 2345 85.3
Baccalaureate 19039 16550 86.9 24564 22186 90.3 23127 20054 86.7 5938 5010 84.4 72668 63800 87.8
Associate Degree 22703 18356 80.9 26815 22744 84.8 24759 20324 82.1 7476 5351 71.6 81753 66775 81.7
Special Program Codes 2 0 0.0 11 4 36.4 12 9 75.0 10 5 50.0 35 18 51.4
Total First-Time, U.S.-Educated
42537 35559 83.6 51861 45348 87.4 49176 41494 84.4 13630 10537 77.3 157204 132938 84.6
Repeat, U.S.-Educated 10776 4625 42.9 11645 4890 42.0 13518 7069 52.3 11660 5371 46.1 47599 21955 46.1
First-Time, Internationally Educated 2407 888 36.9 2,805 1,062 37.9 3,046 1,135 37.3 3,286 1,386 42.2 11544 4471 38.7
Repeat, Internationally Educated 3,925 950 24.2 4,048 853 21.1 3,915 844 21.6 4,344 1,184 27.3 16232 3831 23.6
All Candidates 59,645 42,022 70.5 70,359 52,153 74.1 69,655 50,542 72.6 32,920 18,478 56.1 232,579 163,195 70.2
2016 NCLEX® EXAMINATION STATISTICS
®

8 2016 NCLEX® EXAMINATION STATISTICS
National Council of State Boards of Nursing, Inc. (NCSBN) | 2017
Table 2. Candidates Taking the NCLEX-RN® for Canadian Licensure/Registration, by Type of Candidate
NCLEX-RN® Examination: Jan. 1 – Dec. 31, 2016
Type of Candidate
Jan. 1 – March 31, 2016 April 1 – June 30, 2016 July 1 – Sept. 30, 2016 Oct. 1 – Dec. 31, 2016 Total Jan. 1 – Dec. 31, 2016
Candidates Passed % Candidates Passed % Candidates Passed % Candidates Passed % Candidates Passed %
First-Time, Canada-Educated
1,478 1,194 80.8 2,777 2,301 82.9 3,566 2,767 77.6 1,512 1,197 79.2 9333 7459 79.9
Repeat, Canada-Educated 561 358 63.8 580 375 64.7 610 373 61.1 828 539 65.1 2579 1645 63.8
First-Time, Internationally Educated
130 79 60.8 122 75 61.5 125 76 60.8 170 124 72.9 547 354 64.7
Repeat, Internationally Educated
52 27 51.9 51 33 64.7 58 35 60.3 58 35 60.3 219 130 59.4
All Candidates 2,221 1,658 74.7 3,530 2,784 78.9 4,359 3,251 74.6 2,568 1,895 73.8 12,678 9,588 75.6
Table 3. Summary Statistics for First-Time NCLEX-RN Candidates for U.S. Licensure and Canadian Licensure/Registration
NCLEX-RN® January – December 2016
Passing Standard1 0 logits
Estimated Decision Consistency2 0.90
Average Test Length3 124 items
Percent of Candidates Taking the Minimum Number of Items 49.0%
Percent of Candidates Taking the Maximum Number of Items 15.4%
Average Testing Time4 2 hours, 23 minutes
Percent of Candidates Taking the Maximum Amount of Time 1.6%
1 The NCLEX-RN passing standard scale uses logits as the unit of measurement. Logits is short for log-odds-units. These units have no inherent meaning with regard to nursing content and, in fact, have an arbitrary zero point, but logits are practical because the probability of a correct response can easily be computed when the candidate’s ability and the item’s difficulty are known. Typically, the logit range on the NCLEX-RN scale is from -2.00 (easy items or low ability candidates) to 2.00 (difficult items or high ability candidates).
2 Estimated Decision Consistency is an indicator of reliability. Conceptually, it is the proportion of pass-fail decisions that would remain the same if the same population were retested immediately after their first test (assuming no learning or fatigue effects) using a different set of items.
3 NCLEX-RN examinations consist of 75 to 265 items.
4 The standard amount of allotted testing time for the NCLEX-RN is 6 hours.
®
National Council of State Boards of Nursing, Inc. (NCSBN) | 2017
92016 NCLEX® EXAMINATION STATISTICS
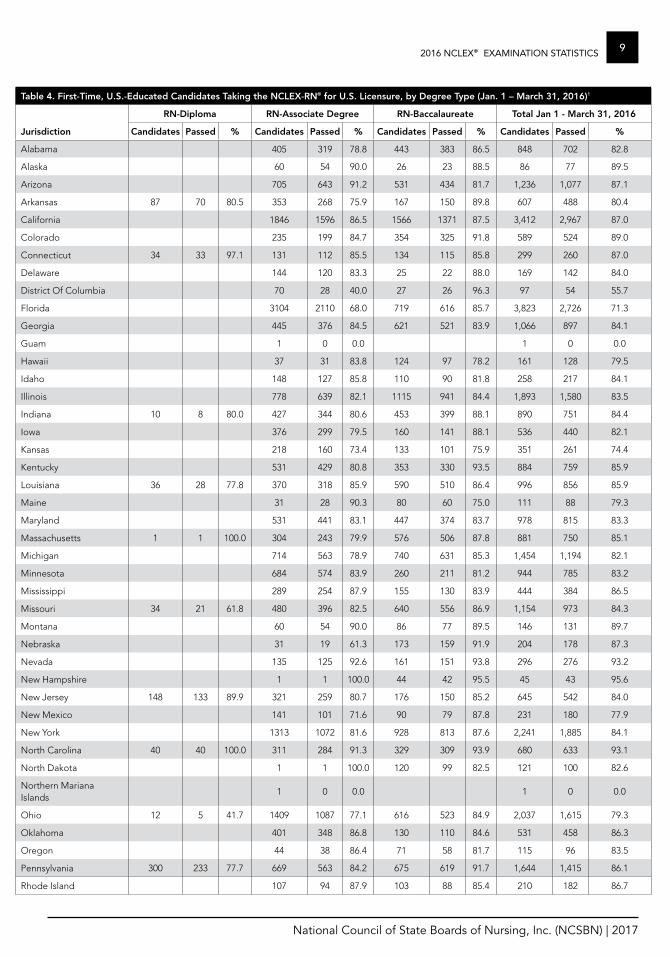
Table 4. First-Time, U.S.-Educated Candidates Taking the NCLEX-RN® for U.S. Licensure, by Degree Type (Jan. 1 – March 31, 2016)1
RN-Diploma RN-Associate Degree RN-Baccalaureate Total Jan 1 - March 31, 2016
Jurisdiction Candidates Passed % Candidates Passed % Candidates Passed % Candidates Passed %
Alabama 405 319 78.8 443 383 86.5 848 702 82.8
Alaska 60 54 90.0 26 23 88.5 86 77 89.5
Arizona 705 643 91.2 531 434 81.7 1,236 1,077 87.1
Arkansas 87 70 80.5 353 268 75.9 167 150 89.8 607 488 80.4
California 1846 1596 86.5 1566 1371 87.5 3,412 2,967 87.0
Colorado 235 199 84.7 354 325 91.8 589 524 89.0
Connecticut 34 33 97.1 131 112 85.5 134 115 85.8 299 260 87.0
Delaware 144 120 83.3 25 22 88.0 169 142 84.0
District Of Columbia 70 28 40.0 27 26 96.3 97 54 55.7
Florida 3104 2110 68.0 719 616 85.7 3,823 2,726 71.3
Georgia 445 376 84.5 621 521 83.9 1,066 897 84.1
Guam 1 0 0.0 1 0 0.0
Hawaii 37 31 83.8 124 97 78.2 161 128 79.5
Idaho 148 127 85.8 110 90 81.8 258 217 84.1
Illinois 778 639 82.1 1115 941 84.4 1,893 1,580 83.5
Indiana 10 8 80.0 427 344 80.6 453 399 88.1 890 751 84.4
Iowa 376 299 79.5 160 141 88.1 536 440 82.1
Kansas 218 160 73.4 133 101 75.9 351 261 74.4
Kentucky 531 429 80.8 353 330 93.5 884 759 85.9
Louisiana 36 28 77.8 370 318 85.9 590 510 86.4 996 856 85.9
Maine 31 28 90.3 80 60 75.0 111 88 79.3
Maryland 531 441 83.1 447 374 83.7 978 815 83.3
Massachusetts 1 1 100.0 304 243 79.9 576 506 87.8 881 750 85.1
Michigan 714 563 78.9 740 631 85.3 1,454 1,194 82.1
Minnesota 684 574 83.9 260 211 81.2 944 785 83.2
Mississippi 289 254 87.9 155 130 83.9 444 384 86.5
Missouri 34 21 61.8 480 396 82.5 640 556 86.9 1,154 973 84.3
Montana 60 54 90.0 86 77 89.5 146 131 89.7
Nebraska 31 19 61.3 173 159 91.9 204 178 87.3
Nevada 135 125 92.6 161 151 93.8 296 276 93.2
New Hampshire 1 1 100.0 44 42 95.5 45 43 95.6
New Jersey 148 133 89.9 321 259 80.7 176 150 85.2 645 542 84.0
New Mexico 141 101 71.6 90 79 87.8 231 180 77.9
New York 1313 1072 81.6 928 813 87.6 2,241 1,885 84.1
North Carolina 40 40 100.0 311 284 91.3 329 309 93.9 680 633 93.1
North Dakota 1 1 100.0 120 99 82.5 121 100 82.6
Northern Mariana Islands
1 0 0.0 1 0 0.0
Ohio 12 5 41.7 1409 1087 77.1 616 523 84.9 2,037 1,615 79.3
Oklahoma 401 348 86.8 130 110 84.6 531 458 86.3
Oregon 44 38 86.4 71 58 81.7 115 96 83.5
Pennsylvania 300 233 77.7 669 563 84.2 675 619 91.7 1,644 1,415 86.1
Rhode Island 107 94 87.9 103 88 85.4 210 182 86.7
®
National Council of State Boards of Nursing, Inc. (NCSBN) | 2017
10 2016 NCLEX® EXAMINATION STATISTICS
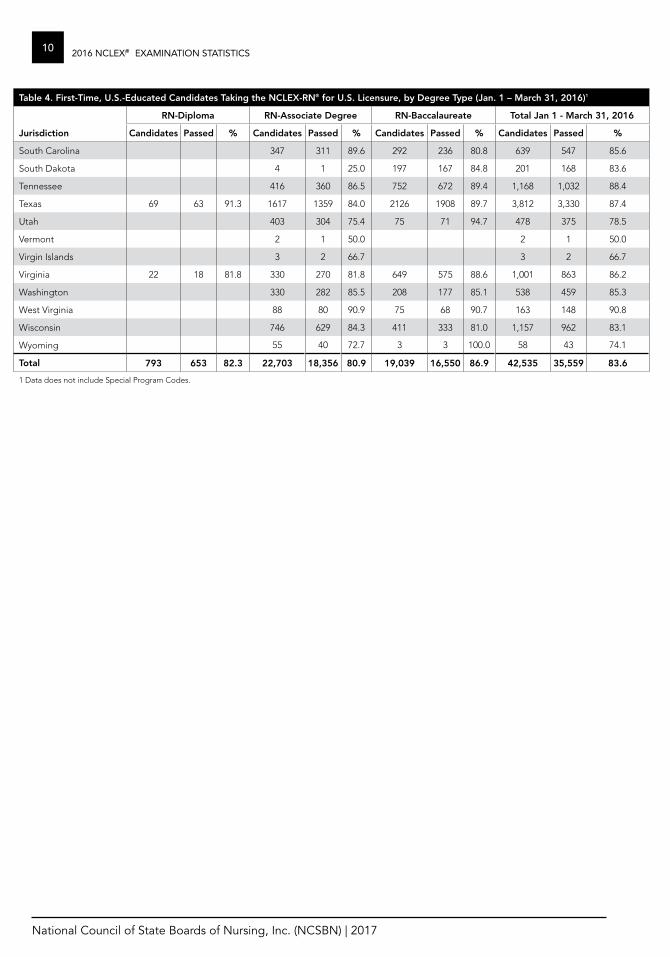
Table 4. First-Time, U.S.-Educated Candidates Taking the NCLEX-RN® for U.S. Licensure, by Degree Type (Jan. 1 – March 31, 2016)1
RN-Diploma RN-Associate Degree RN-Baccalaureate Total Jan 1 - March 31, 2016
Jurisdiction Candidates Passed % Candidates Passed % Candidates Passed % Candidates Passed %
South Carolina 347 311 89.6 292 236 80.8 639 547 85.6
South Dakota 4 1 25.0 197 167 84.8 201 168 83.6
Tennessee 416 360 86.5 752 672 89.4 1,168 1,032 88.4
Texas 69 63 91.3 1617 1359 84.0 2126 1908 89.7 3,812 3,330 87.4
Utah 403 304 75.4 75 71 94.7 478 375 78.5
Vermont 2 1 50.0 2 1 50.0
Virgin Islands 3 2 66.7 3 2 66.7
Virginia 22 18 81.8 330 270 81.8 649 575 88.6 1,001 863 86.2
Washington 330 282 85.5 208 177 85.1 538 459 85.3
West Virginia 88 80 90.9 75 68 90.7 163 148 90.8
Wisconsin 746 629 84.3 411 333 81.0 1,157 962 83.1
Wyoming 55 40 72.7 3 3 100.0 58 43 74.1
Total 793 653 82.3 22,703 18,356 80.9 19,039 16,550 86.9 42,535 35,559 83.6
1 Data does not include Special Program Codes.
®
National Council of State Boards of Nursing, Inc. (NCSBN) | 2017
112016 NCLEX® EXAMINATION STATISTICS
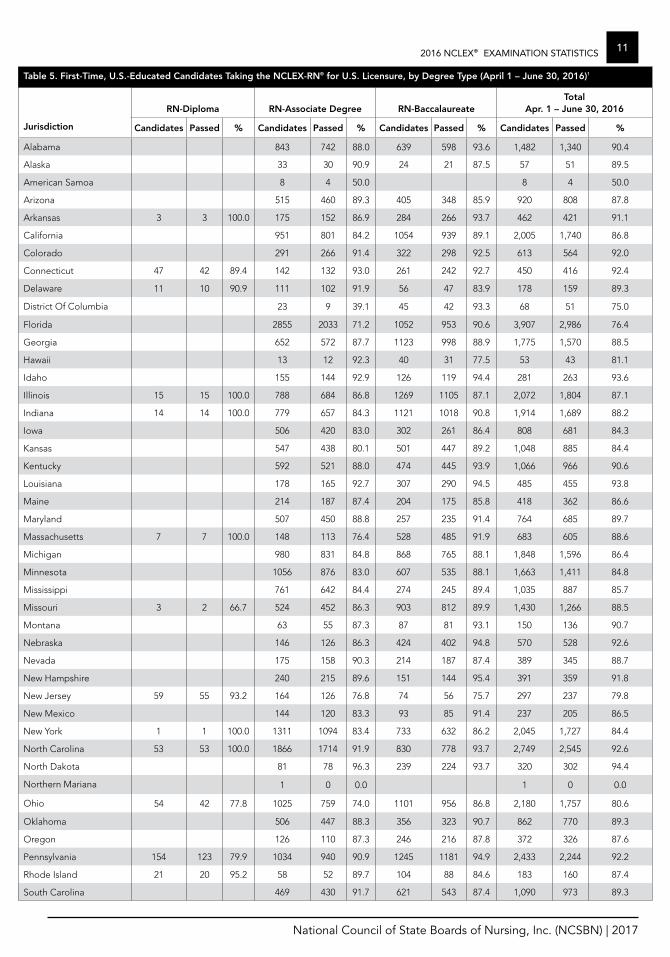
Table 5. First-Time, U.S.-Educated Candidates Taking the NCLEX-RN® for U.S. Licensure, by Degree Type (April 1 – June 30, 2016)1
RN-Diploma RN-Associate Degree RN-BaccalaureateTotal
Apr. 1 – June 30, 2016
Jurisdiction Candidates Passed % Candidates Passed % Candidates Passed % Candidates Passed %
Alabama 843 742 88.0 639 598 93.6 1,482 1,340 90.4
Alaska 33 30 90.9 24 21 87.5 57 51 89.5
American Samoa 8 4 50.0 8 4 50.0
Arizona 515 460 89.3 405 348 85.9 920 808 87.8
Arkansas 3 3 100.0 175 152 86.9 284 266 93.7 462 421 91.1
California 951 801 84.2 1054 939 89.1 2,005 1,740 86.8
Colorado 291 266 91.4 322 298 92.5 613 564 92.0
Connecticut 47 42 89.4 142 132 93.0 261 242 92.7 450 416 92.4
Delaware 11 10 90.9 111 102 91.9 56 47 83.9 178 159 89.3
District Of Columbia 23 9 39.1 45 42 93.3 68 51 75.0
Florida 2855 2033 71.2 1052 953 90.6 3,907 2,986 76.4
Georgia 652 572 87.7 1123 998 88.9 1,775 1,570 88.5
Hawaii 13 12 92.3 40 31 77.5 53 43 81.1
Idaho 155 144 92.9 126 119 94.4 281 263 93.6
Illinois 15 15 100.0 788 684 86.8 1269 1105 87.1 2,072 1,804 87.1
Indiana 14 14 100.0 779 657 84.3 1121 1018 90.8 1,914 1,689 88.2
Iowa 506 420 83.0 302 261 86.4 808 681 84.3
Kansas 547 438 80.1 501 447 89.2 1,048 885 84.4
Kentucky 592 521 88.0 474 445 93.9 1,066 966 90.6
Louisiana 178 165 92.7 307 290 94.5 485 455 93.8
Maine 214 187 87.4 204 175 85.8 418 362 86.6
Maryland 507 450 88.8 257 235 91.4 764 685 89.7
Massachusetts 7 7 100.0 148 113 76.4 528 485 91.9 683 605 88.6
Michigan 980 831 84.8 868 765 88.1 1,848 1,596 86.4
Minnesota 1056 876 83.0 607 535 88.1 1,663 1,411 84.8
Mississippi 761 642 84.4 274 245 89.4 1,035 887 85.7
Missouri 3 2 66.7 524 452 86.3 903 812 89.9 1,430 1,266 88.5
Montana 63 55 87.3 87 81 93.1 150 136 90.7
Nebraska 146 126 86.3 424 402 94.8 570 528 92.6
Nevada 175 158 90.3 214 187 87.4 389 345 88.7
New Hampshire 240 215 89.6 151 144 95.4 391 359 91.8
New Jersey 59 55 93.2 164 126 76.8 74 56 75.7 297 237 79.8
New Mexico 144 120 83.3 93 85 91.4 237 205 86.5
New York 1 1 100.0 1311 1094 83.4 733 632 86.2 2,045 1,727 84.4
North Carolina 53 53 100.0 1866 1714 91.9 830 778 93.7 2,749 2,545 92.6
North Dakota 81 78 96.3 239 224 93.7 320 302 94.4
Northern Mariana 1 0 0.0 1 0 0.0
Ohio 54 42 77.8 1025 759 74.0 1101 956 86.8 2,180 1,757 80.6
Oklahoma 506 447 88.3 356 323 90.7 862 770 89.3
Oregon 126 110 87.3 246 216 87.8 372 326 87.6
Pennsylvania 154 123 79.9 1034 940 90.9 1245 1181 94.9 2,433 2,244 92.2
Rhode Island 21 20 95.2 58 52 89.7 104 88 84.6 183 160 87.4
South Carolina 469 430 91.7 621 543 87.4 1,090 973 89.3
®
National Council of State Boards of Nursing, Inc. (NCSBN) | 2017
12 2016 NCLEX® EXAMINATION STATISTICS
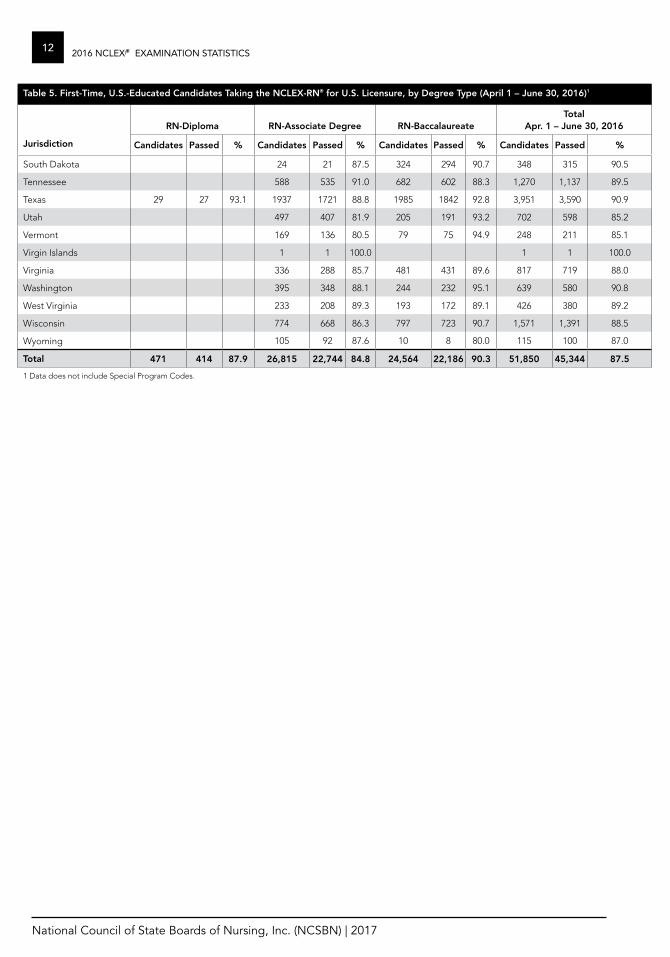
Table 5. First-Time, U.S.-Educated Candidates Taking the NCLEX-RN® for U.S. Licensure, by Degree Type (April 1 – June 30, 2016)1
RN-Diploma RN-Associate Degree RN-BaccalaureateTotal
Apr. 1 – June 30, 2016
Jurisdiction Candidates Passed % Candidates Passed % Candidates Passed % Candidates Passed %
South Dakota 24 21 87.5 324 294 90.7 348 315 90.5
Tennessee 588 535 91.0 682 602 88.3 1,270 1,137 89.5
Texas 29 27 93.1 1937 1721 88.8 1985 1842 92.8 3,951 3,590 90.9
Utah 497 407 81.9 205 191 93.2 702 598 85.2
Vermont 169 136 80.5 79 75 94.9 248 211 85.1
Virgin Islands 1 1 100.0 1 1 100.0
Virginia 336 288 85.7 481 431 89.6 817 719 88.0
Washington 395 348 88.1 244 232 95.1 639 580 90.8
West Virginia 233 208 89.3 193 172 89.1 426 380 89.2
Wisconsin 774 668 86.3 797 723 90.7 1,571 1,391 88.5
Wyoming 105 92 87.6 10 8 80.0 115 100 87.0
Total 471 414 87.9 26,815 22,744 84.8 24,564 22,186 90.3 51,850 45,344 87.5
1 Data does not include Special Program Codes.
®
National Council of State Boards of Nursing, Inc. (NCSBN) | 2017
132016 NCLEX® EXAMINATION STATISTICS
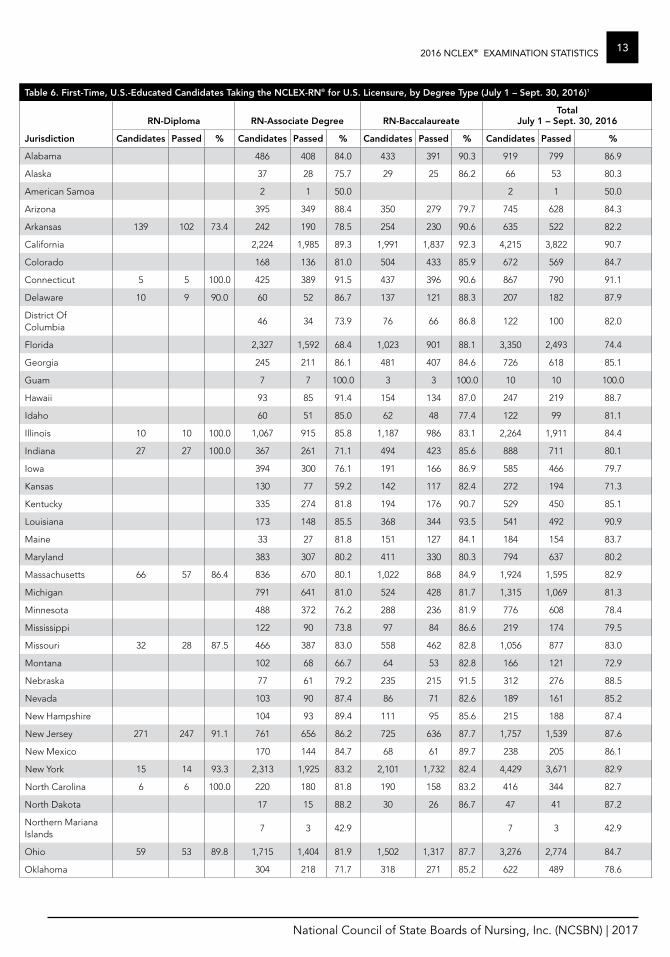
Table 6. First-Time, U.S.-Educated Candidates Taking the NCLEX-RN® for U.S. Licensure, by Degree Type (July 1 – Sept. 30, 2016)1
RN-Diploma RN-Associate Degree RN-BaccalaureateTotal
July 1 – Sept. 30, 2016
Jurisdiction Candidates Passed % Candidates Passed % Candidates Passed % Candidates Passed %
Alabama 486 408 84.0 433 391 90.3 919 799 86.9
Alaska 37 28 75.7 29 25 86.2 66 53 80.3
American Samoa 2 1 50.0 2 1 50.0
Arizona 395 349 88.4 350 279 79.7 745 628 84.3
Arkansas 139 102 73.4 242 190 78.5 254 230 90.6 635 522 82.2
California 2,224 1,985 89.3 1,991 1,837 92.3 4,215 3,822 90.7
Colorado 168 136 81.0 504 433 85.9 672 569 84.7
Connecticut 5 5 100.0 425 389 91.5 437 396 90.6 867 790 91.1
Delaware 10 9 90.0 60 52 86.7 137 121 88.3 207 182 87.9
District Of Columbia
46 34 73.9 76 66 86.8 122 100 82.0
Florida 2,327 1,592 68.4 1,023 901 88.1 3,350 2,493 74.4
Georgia 245 211 86.1 481 407 84.6 726 618 85.1
Guam 7 7 100.0 3 3 100.0 10 10 100.0
Hawaii 93 85 91.4 154 134 87.0 247 219 88.7
Idaho 60 51 85.0 62 48 77.4 122 99 81.1
Illinois 10 10 100.0 1,067 915 85.8 1,187 986 83.1 2,264 1,911 84.4
Indiana 27 27 100.0 367 261 71.1 494 423 85.6 888 711 80.1
Iowa 394 300 76.1 191 166 86.9 585 466 79.7
Kansas 130 77 59.2 142 117 82.4 272 194 71.3
Kentucky 335 274 81.8 194 176 90.7 529 450 85.1
Louisiana 173 148 85.5 368 344 93.5 541 492 90.9
Maine 33 27 81.8 151 127 84.1 184 154 83.7
Maryland 383 307 80.2 411 330 80.3 794 637 80.2
Massachusetts 66 57 86.4 836 670 80.1 1,022 868 84.9 1,924 1,595 82.9
Michigan 791 641 81.0 524 428 81.7 1,315 1,069 81.3
Minnesota 488 372 76.2 288 236 81.9 776 608 78.4
Mississippi 122 90 73.8 97 84 86.6 219 174 79.5
Missouri 32 28 87.5 466 387 83.0 558 462 82.8 1,056 877 83.0
Montana 102 68 66.7 64 53 82.8 166 121 72.9
Nebraska 77 61 79.2 235 215 91.5 312 276 88.5
Nevada 103 90 87.4 86 71 82.6 189 161 85.2
New Hampshire 104 93 89.4 111 95 85.6 215 188 87.4
New Jersey 271 247 91.1 761 656 86.2 725 636 87.7 1,757 1,539 87.6
New Mexico 170 144 84.7 68 61 89.7 238 205 86.1
New York 15 14 93.3 2,313 1,925 83.2 2,101 1,732 82.4 4,429 3,671 82.9
North Carolina 6 6 100.0 220 180 81.8 190 158 83.2 416 344 82.7
North Dakota 17 15 88.2 30 26 86.7 47 41 87.2
Northern Mariana Islands
7 3 42.9 7 3 42.9
Ohio 59 53 89.8 1,715 1,404 81.9 1,502 1,317 87.7 3,276 2,774 84.7
Oklahoma 304 218 71.7 318 271 85.2 622 489 78.6
®
National Council of State Boards of Nursing, Inc. (NCSBN) | 2017
14 2016 NCLEX® EXAMINATION STATISTICS
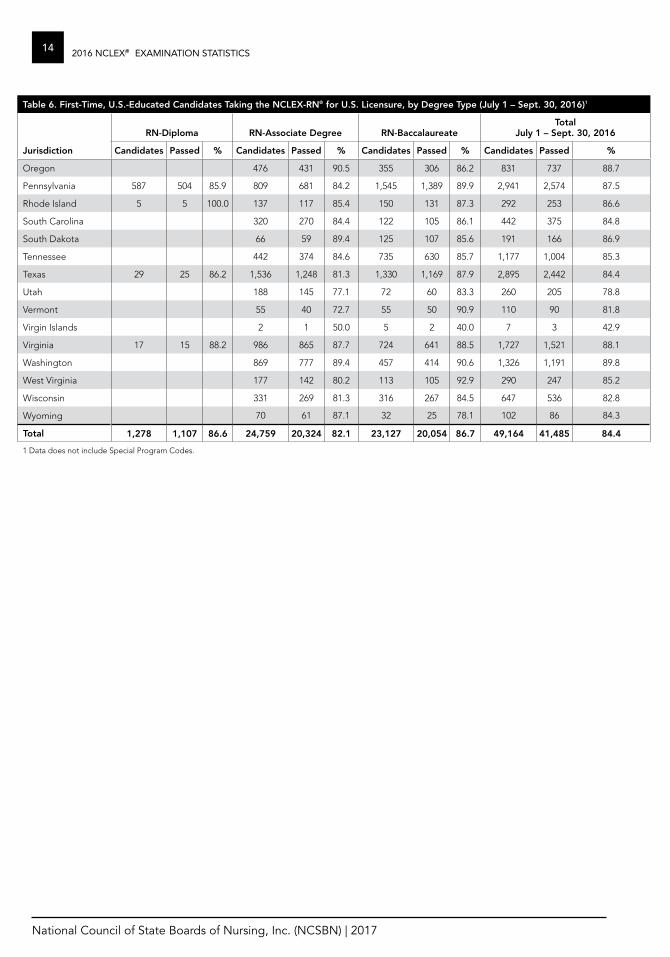
Table 6. First-Time, U.S.-Educated Candidates Taking the NCLEX-RN® for U.S. Licensure, by Degree Type (July 1 – Sept. 30, 2016)1
RN-Diploma RN-Associate Degree RN-BaccalaureateTotal
July 1 – Sept. 30, 2016
Jurisdiction Candidates Passed % Candidates Passed % Candidates Passed % Candidates Passed %
Oregon 476 431 90.5 355 306 86.2 831 737 88.7
Pennsylvania 587 504 85.9 809 681 84.2 1,545 1,389 89.9 2,941 2,574 87.5
Rhode Island 5 5 100.0 137 117 85.4 150 131 87.3 292 253 86.6
South Carolina 320 270 84.4 122 105 86.1 442 375 84.8
South Dakota 66 59 89.4 125 107 85.6 191 166 86.9
Tennessee 442 374 84.6 735 630 85.7 1,177 1,004 85.3
Texas 29 25 86.2 1,536 1,248 81.3 1,330 1,169 87.9 2,895 2,442 84.4
Utah 188 145 77.1 72 60 83.3 260 205 78.8
Vermont 55 40 72.7 55 50 90.9 110 90 81.8
Virgin Islands 2 1 50.0 5 2 40.0 7 3 42.9
Virginia 17 15 88.2 986 865 87.7 724 641 88.5 1,727 1,521 88.1
Washington 869 777 89.4 457 414 90.6 1,326 1,191 89.8
West Virginia 177 142 80.2 113 105 92.9 290 247 85.2
Wisconsin 331 269 81.3 316 267 84.5 647 536 82.8
Wyoming 70 61 87.1 32 25 78.1 102 86 84.3
Total 1,278 1,107 86.6 24,759 20,324 82.1 23,127 20,054 86.7 49,164 41,485 84.4
1 Data does not include Special Program Codes.
®
National Council of State Boards of Nursing, Inc. (NCSBN) | 2017
152016 NCLEX® EXAMINATION STATISTICS
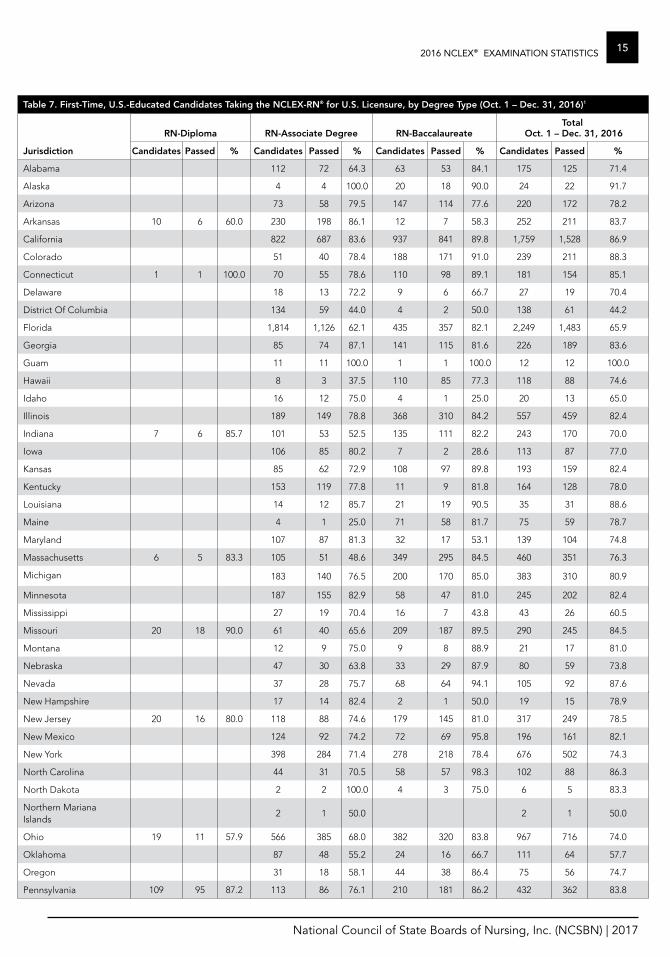
Table 7. First-Time, U.S.-Educated Candidates Taking the NCLEX-RN® for U.S. Licensure, by Degree Type (Oct. 1 – Dec. 31, 2016)1
RN-Diploma RN-Associate Degree RN-BaccalaureateTotal
Oct. 1 – Dec. 31, 2016
Jurisdiction Candidates Passed % Candidates Passed % Candidates Passed % Candidates Passed %
Alabama 112 72 64.3 63 53 84.1 175 125 71.4
Alaska 4 4 100.0 20 18 90.0 24 22 91.7
Arizona 73 58 79.5 147 114 77.6 220 172 78.2
Arkansas 10 6 60.0 230 198 86.1 12 7 58.3 252 211 83.7
California 822 687 83.6 937 841 89.8 1,759 1,528 86.9
Colorado 51 40 78.4 188 171 91.0 239 211 88.3
Connecticut 1 1 100.0 70 55 78.6 110 98 89.1 181 154 85.1
Delaware 18 13 72.2 9 6 66.7 27 19 70.4
District Of Columbia 134 59 44.0 4 2 50.0 138 61 44.2
Florida 1,814 1,126 62.1 435 357 82.1 2,249 1,483 65.9
Georgia 85 74 87.1 141 115 81.6 226 189 83.6
Guam 11 11 100.0 1 1 100.0 12 12 100.0
Hawaii 8 3 37.5 110 85 77.3 118 88 74.6
Idaho 16 12 75.0 4 1 25.0 20 13 65.0
Illinois 189 149 78.8 368 310 84.2 557 459 82.4
Indiana 7 6 85.7 101 53 52.5 135 111 82.2 243 170 70.0
Iowa 106 85 80.2 7 2 28.6 113 87 77.0
Kansas 85 62 72.9 108 97 89.8 193 159 82.4
Kentucky 153 119 77.8 11 9 81.8 164 128 78.0
Louisiana 14 12 85.7 21 19 90.5 35 31 88.6
Maine 4 1 25.0 71 58 81.7 75 59 78.7
Maryland 107 87 81.3 32 17 53.1 139 104 74.8
Massachusetts 6 5 83.3 105 51 48.6 349 295 84.5 460 351 76.3
Michigan 183 140 76.5 200 170 85.0 383 310 80.9
Minnesota 187 155 82.9 58 47 81.0 245 202 82.4
Mississippi 27 19 70.4 16 7 43.8 43 26 60.5
Missouri 20 18 90.0 61 40 65.6 209 187 89.5 290 245 84.5
Montana 12 9 75.0 9 8 88.9 21 17 81.0
Nebraska 47 30 63.8 33 29 87.9 80 59 73.8
Nevada 37 28 75.7 68 64 94.1 105 92 87.6
New Hampshire 17 14 82.4 2 1 50.0 19 15 78.9
New Jersey 20 16 80.0 118 88 74.6 179 145 81.0 317 249 78.5
New Mexico 124 92 74.2 72 69 95.8 196 161 82.1
New York 398 284 71.4 278 218 78.4 676 502 74.3
North Carolina 44 31 70.5 58 57 98.3 102 88 86.3
North Dakota 2 2 100.0 4 3 75.0 6 5 83.3
Northern Mariana Islands
2 1 50.0 2 1 50.0
Ohio 19 11 57.9 566 385 68.0 382 320 83.8 967 716 74.0
Oklahoma 87 48 55.2 24 16 66.7 111 64 57.7
Oregon 31 18 58.1 44 38 86.4 75 56 74.7
Pennsylvania 109 95 87.2 113 86 76.1 210 181 86.2 432 362 83.8
®
National Council of State Boards of Nursing, Inc. (NCSBN) | 2017
16 2016 NCLEX® EXAMINATION STATISTICS
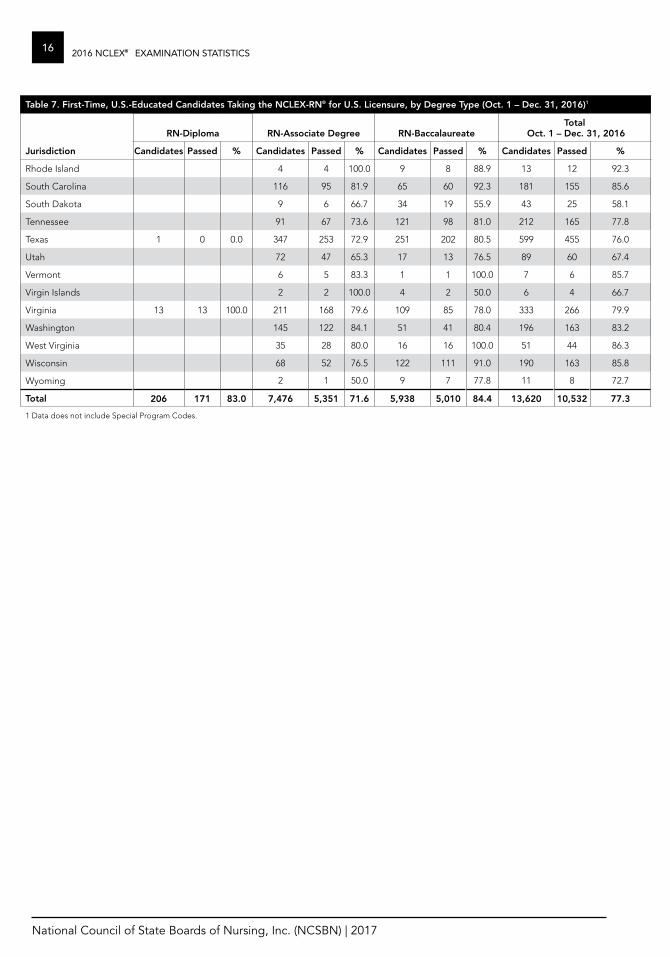
Table 7. First-Time, U.S.-Educated Candidates Taking the NCLEX-RN® for U.S. Licensure, by Degree Type (Oct. 1 – Dec. 31, 2016)1
RN-Diploma RN-Associate Degree RN-BaccalaureateTotal
Oct. 1 – Dec. 31, 2016
Jurisdiction Candidates Passed % Candidates Passed % Candidates Passed % Candidates Passed %
Rhode Island 4 4 100.0 9 8 88.9 13 12 92.3
South Carolina 116 95 81.9 65 60 92.3 181 155 85.6
South Dakota 9 6 66.7 34 19 55.9 43 25 58.1
Tennessee 91 67 73.6 121 98 81.0 212 165 77.8
Texas 1 0 0.0 347 253 72.9 251 202 80.5 599 455 76.0
Utah 72 47 65.3 17 13 76.5 89 60 67.4
Vermont 6 5 83.3 1 1 100.0 7 6 85.7
Virgin Islands 2 2 100.0 4 2 50.0 6 4 66.7
Virginia 13 13 100.0 211 168 79.6 109 85 78.0 333 266 79.9
Washington 145 122 84.1 51 41 80.4 196 163 83.2
West Virginia 35 28 80.0 16 16 100.0 51 44 86.3
Wisconsin 68 52 76.5 122 111 91.0 190 163 85.8
Wyoming 2 1 50.0 9 7 77.8 11 8 72.7
Total 206 171 83.0 7,476 5,351 71.6 5,938 5,010 84.4 13,620 10,532 77.3
1 Data does not include Special Program Codes.
®
172016 NCLEX® EXAMINATION STATISTICS
National Council of State Boards of Nursing, Inc. (NCSBN) | 2017
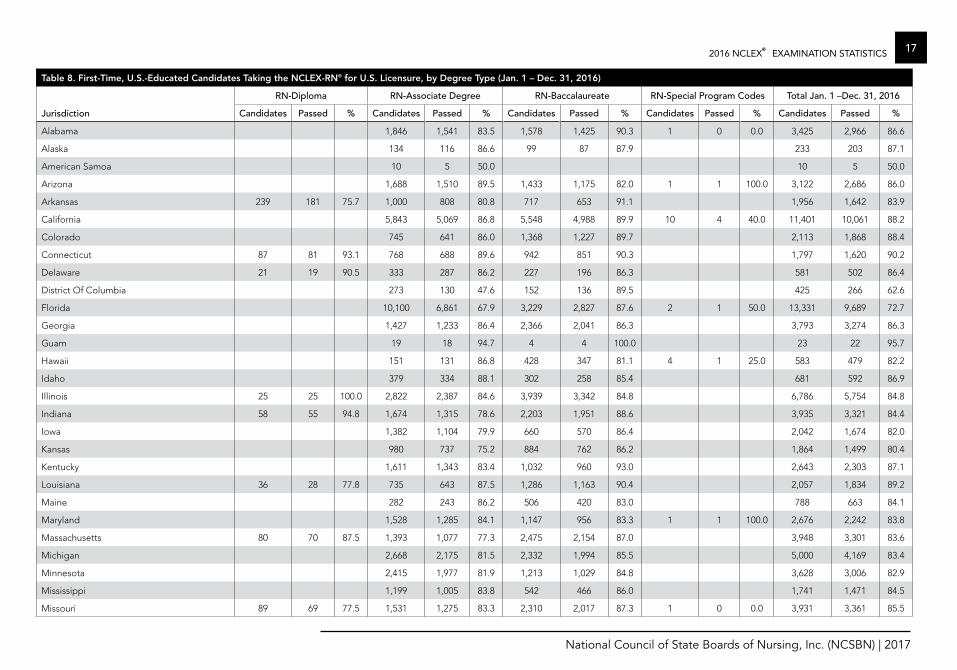
Table 8. First-Time, U.S.-Educated Candidates Taking the NCLEX-RN® for U.S. Licensure, by Degree Type (Jan. 1 – Dec. 31, 2016)
RN-Diploma RN-Associate Degree RN-Baccalaureate RN-Special Program Codes Total Jan. 1 –Dec. 31, 2016
Jurisdiction Candidates Passed % Candidates Passed % Candidates Passed % Candidates Passed % Candidates Passed %
Alabama 1,846 1,541 83.5 1,578 1,425 90.3 1 0 0.0 3,425 2,966 86.6
Alaska 134 116 86.6 99 87 87.9 233 203 87.1
American Samoa 10 5 50.0 10 5 50.0
Arizona 1,688 1,510 89.5 1,433 1,175 82.0 1 1 100.0 3,122 2,686 86.0
Arkansas 239 181 75.7 1,000 808 80.8 717 653 91.1 1,956 1,642 83.9
California 5,843 5,069 86.8 5,548 4,988 89.9 10 4 40.0 11,401 10,061 88.2
Colorado 745 641 86.0 1,368 1,227 89.7 2,113 1,868 88.4
Connecticut 87 81 93.1 768 688 89.6 942 851 90.3 1,797 1,620 90.2
Delaware 21 19 90.5 333 287 86.2 227 196 86.3 581 502 86.4
District Of Columbia 273 130 47.6 152 136 89.5 425 266 62.6
Florida 10,100 6,861 67.9 3,229 2,827 87.6 2 1 50.0 13,331 9,689 72.7
Georgia 1,427 1,233 86.4 2,366 2,041 86.3 3,793 3,274 86.3
Guam 19 18 94.7 4 4 100.0 23 22 95.7
Hawaii 151 131 86.8 428 347 81.1 4 1 25.0 583 479 82.2
Idaho 379 334 88.1 302 258 85.4 681 592 86.9
Illinois 25 25 100.0 2,822 2,387 84.6 3,939 3,342 84.8 6,786 5,754 84.8
Indiana 58 55 94.8 1,674 1,315 78.6 2,203 1,951 88.6 3,935 3,321 84.4
Iowa 1,382 1,104 79.9 660 570 86.4 2,042 1,674 82.0
Kansas 980 737 75.2 884 762 86.2 1,864 1,499 80.4
Kentucky 1,611 1,343 83.4 1,032 960 93.0 2,643 2,303 87.1
Louisiana 36 28 77.8 735 643 87.5 1,286 1,163 90.4 2,057 1,834 89.2
Maine 282 243 86.2 506 420 83.0 788 663 84.1
Maryland 1,528 1,285 84.1 1,147 956 83.3 1 1 100.0 2,676 2,242 83.8
Massachusetts 80 70 87.5 1,393 1,077 77.3 2,475 2,154 87.0 3,948 3,301 83.6
Michigan 2,668 2,175 81.5 2,332 1,994 85.5 5,000 4,169 83.4
Minnesota 2,415 1,977 81.9 1,213 1,029 84.8 3,628 3,006 82.9
Mississippi 1,199 1,005 83.8 542 466 86.0 1,741 1,471 84.5
Missouri 89 69 77.5 1,531 1,275 83.3 2,310 2,017 87.3 1 0 0.0 3,931 3,361 85.5
®

18 2016 NCLEX® EXAMINATION STATISTICS
National Council of State Boards of Nursing, Inc. (NCSBN) | 2017
Table 8. First-Time, U.S.-Educated Candidates Taking the NCLEX-RN® for U.S. Licensure, by Degree Type (Jan. 1 – Dec. 31, 2016)
RN-Diploma RN-Associate Degree RN-Baccalaureate RN-Special Program Codes Total Jan. 1 –Dec. 31, 2016
Jurisdiction Candidates Passed % Candidates Passed % Candidates Passed % Candidates Passed % Candidates Passed %
Montana 237 186 78.5 246 219 89.0 483 405 83.9
Nebraska 301 236 78.4 865 805 93.1 1,166 1,041 89.3
Nevada 450 401 89.1 529 473 89.4 979 874 89.3
New Hampshire 362 323 89.2 308 282 91.6 1 1 100.0 671 606 90.3
New Jersey 498 451 90.6 1,364 1,129 82.8 1,154 987 85.5 3,016 2,567 85.1
New Mexico 579 457 78.9 323 294 91.0 902 751 83.3
New York 16 15 93.8 5,335 4,375 82.0 4,040 3,395 84.0 2 0 0.0 9,393 7,785 82.9
North Carolina 99 99 100.0 2,441 2,209 90.5 1,407 1,302 92.5 3,947 3,610 91.5
North Dakota 101 96 95.0 393 352 89.6 494 448 90.7
Northern Mariana Islands 11 4 36.4 11 4 36.4
Ohio 144 111 77.1 4,715 3,635 77.1 3,601 3,116 86.5 2 2 100.0 8,462 6,864 81.1
Oklahoma 1,298 1,061 81.7 828 720 87.0 1 1 100.0 2,127 1,782 83.8
Oregon 677 597 88.2 716 618 86.3 1 0 0.0 1,394 1,215 87.2
Pennsylvania 1,150 955 83.0 2,625 2,270 86.5 3,675 3,370 91.7 7 6 85.7 7,457 6,601 88.5
Rhode Island 26 25 96.2 306 267 87.3 366 315 86.1 698 607 87.0
South Carolina 1,252 1,106 88.3 1,100 944 85.8 1 0 0.0 2,353 2,050 87.1
South Dakota 103 87 84.5 680 587 86.3 783 674 86.1
Tennessee 1,537 1,336 86.9 2,290 2,002 87.4 3,827 3,338 87.2
Texas 128 115 89.8 5,437 4,581 84.3 5,692 5,121 90.0 11,257 9,817 87.2
Utah 1,160 903 77.8 369 335 90.8 1,529 1,238 81.0
Vermont 232 182 78.4 135 126 93.3 367 308 83.9
Virgin Islands 8 6 75.0 9 4 44.4 17 10 58.8
Virginia 52 46 88.5 1,863 1,591 85.4 1,963 1,732 88.2 3,878 3,369 86.9
Washington 1,739 1,529 87.9 960 864 90.0 2,699 2,393 88.7
West Virginia 533 458 85.9 397 361 90.9 930 819 88.1
Wisconsin 1,919 1,618 84.3 1,646 1,434 87.1 3,565 3,052 85.6
Wyoming 232 194 83.6 54 43 79.6 286 237 82.9
Total 2,748 2,345 85.3 81,753 66,775 81.7 72,668 63,800 87.8 35 18 51.4 157,204 132,938 84.6
®
192016 NCLEX® EXAMINATION STATISTICS
National Council of State Boards of Nursing, Inc. (NCSBN) | 2017
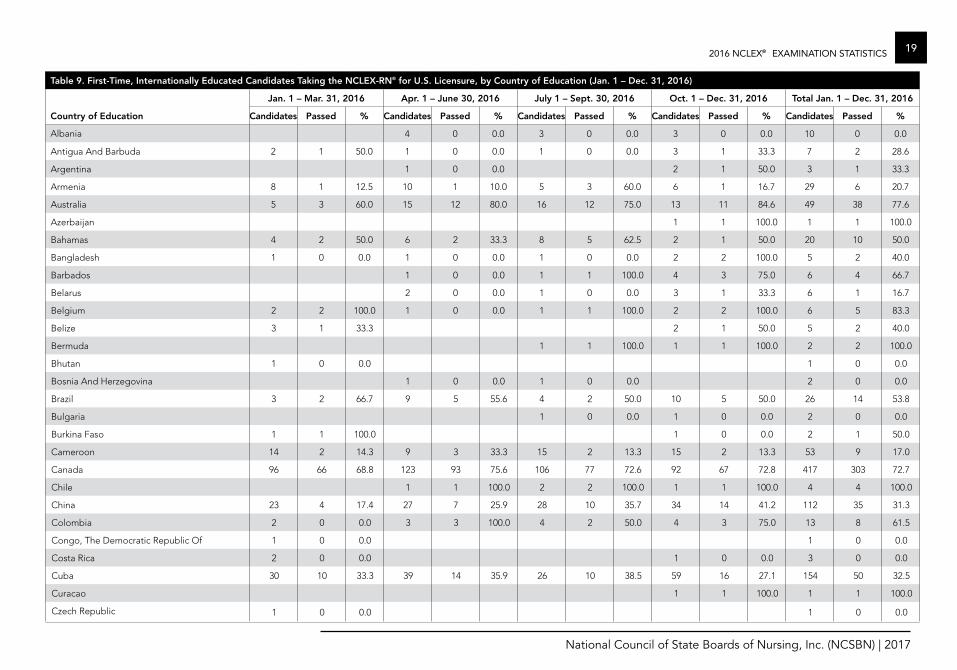
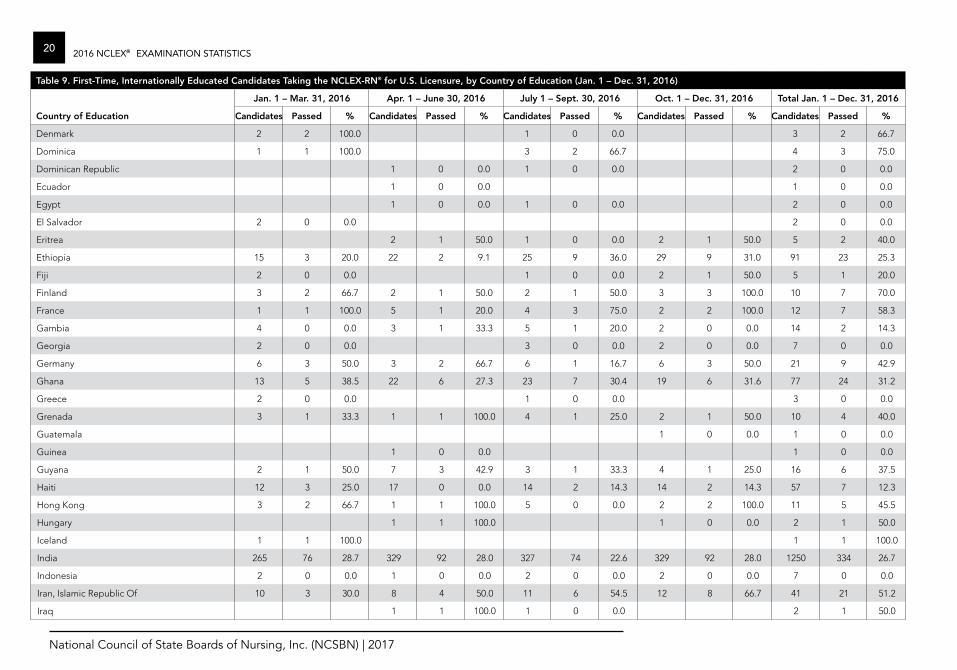
Table 9. First-Time, Internationally Educated Candidates Taking the NCLEX-RN® for U.S. Licensure, by Country of Education (Jan. 1 – Dec. 31, 2016)
Jan. 1 – Mar. 31, 2016 Apr. 1 – June 30, 2016 July 1 – Sept. 30, 2016 Oct. 1 – Dec. 31, 2016 Total Jan. 1 – Dec. 31, 2016
Country of Education Candidates Passed % Candidates Passed % Candidates Passed % Candidates Passed % Candidates Passed %
Albania 4 0 0.0 3 0 0.0 3 0 0.0 10 0 0.0
Antigua And Barbuda 2 1 50.0 1 0 0.0 1 0 0.0 3 1 33.3 7 2 28.6
Argentina 1 0 0.0 2 1 50.0 3 1 33.3
Armenia 8 1 12.5 10 1 10.0 5 3 60.0 6 1 16.7 29 6 20.7
Australia 5 3 60.0 15 12 80.0 16 12 75.0 13 11 84.6 49 38 77.6
Azerbaijan 1 1 100.0 1 1 100.0
Bahamas 4 2 50.0 6 2 33.3 8 5 62.5 2 1 50.0 20 10 50.0
Bangladesh 1 0 0.0 1 0 0.0 1 0 0.0 2 2 100.0 5 2 40.0
Barbados 1 0 0.0 1 1 100.0 4 3 75.0 6 4 66.7
Belarus 2 0 0.0 1 0 0.0 3 1 33.3 6 1 16.7
Belgium 2 2 100.0 1 0 0.0 1 1 100.0 2 2 100.0 6 5 83.3
Belize 3 1 33.3 2 1 50.0 5 2 40.0
Bermuda 1 1 100.0 1 1 100.0 2 2 100.0
Bhutan 1 0 0.0 1 0 0.0
Bosnia And Herzegovina 1 0 0.0 1 0 0.0 2 0 0.0
Brazil 3 2 66.7 9 5 55.6 4 2 50.0 10 5 50.0 26 14 53.8
Bulgaria 1 0 0.0 1 0 0.0 2 0 0.0
Burkina Faso 1 1 100.0 1 0 0.0 2 1 50.0
Cameroon 14 2 14.3 9 3 33.3 15 2 13.3 15 2 13.3 53 9 17.0
Canada 96 66 68.8 123 93 75.6 106 77 72.6 92 67 72.8 417 303 72.7
Chile 1 1 100.0 2 2 100.0 1 1 100.0 4 4 100.0
China 23 4 17.4 27 7 25.9 28 10 35.7 34 14 41.2 112 35 31.3
Colombia 2 0 0.0 3 3 100.0 4 2 50.0 4 3 75.0 13 8 61.5
Congo, The Democratic Republic Of 1 0 0.0 1 0 0.0
Costa Rica 2 0 0.0 1 0 0.0 3 0 0.0
Cuba 30 10 33.3 39 14 35.9 26 10 38.5 59 16 27.1 154 50 32.5
Curacao 1 1 100.0 1 1 100.0
Czech Republic 1 0 0.0 1 0 0.0
®
20 2016 NCLEX® EXAMINATION STATISTICS
National Council of State Boards of Nursing, Inc. (NCSBN) | 2017
Table 9. First-Time, Internationally Educated Candidates Taking the NCLEX-RN® for U.S. Licensure, by Country of Education (Jan. 1 – Dec. 31, 2016)
Jan. 1 – Mar. 31, 2016 Apr. 1 – June 30, 2016 July 1 – Sept. 30, 2016 Oct. 1 – Dec. 31, 2016 Total Jan. 1 – Dec. 31, 2016
Country of Education Candidates Passed % Candidates Passed % Candidates Passed % Candidates Passed % Candidates Passed %
Denmark 2 2 100.0 1 0 0.0 3 2 66.7
Dominica 1 1 100.0 3 2 66.7 4 3 75.0
Dominican Republic 1 0 0.0 1 0 0.0 2 0 0.0
Ecuador 1 0 0.0 1 0 0.0
Egypt 1 0 0.0 1 0 0.0 2 0 0.0
El Salvador 2 0 0.0 2 0 0.0
Eritrea 2 1 50.0 1 0 0.0 2 1 50.0 5 2 40.0
Ethiopia 15 3 20.0 22 2 9.1 25 9 36.0 29 9 31.0 91 23 25.3
Fiji 2 0 0.0 1 0 0.0 2 1 50.0 5 1 20.0
Finland 3 2 66.7 2 1 50.0 2 1 50.0 3 3 100.0 10 7 70.0
France 1 1 100.0 5 1 20.0 4 3 75.0 2 2 100.0 12 7 58.3
Gambia 4 0 0.0 3 1 33.3 5 1 20.0 2 0 0.0 14 2 14.3
Georgia 2 0 0.0 3 0 0.0 2 0 0.0 7 0 0.0
Germany 6 3 50.0 3 2 66.7 6 1 16.7 6 3 50.0 21 9 42.9
Ghana 13 5 38.5 22 6 27.3 23 7 30.4 19 6 31.6 77 24 31.2
Greece 2 0 0.0 1 0 0.0 3 0 0.0
Grenada 3 1 33.3 1 1 100.0 4 1 25.0 2 1 50.0 10 4 40.0
Guatemala 1 0 0.0 1 0 0.0
Guinea 1 0 0.0 1 0 0.0
Guyana 2 1 50.0 7 3 42.9 3 1 33.3 4 1 25.0 16 6 37.5
Haiti 12 3 25.0 17 0 0.0 14 2 14.3 14 2 14.3 57 7 12.3
Hong Kong 3 2 66.7 1 1 100.0 5 0 0.0 2 2 100.0 11 5 45.5
Hungary 1 1 100.0 1 0 0.0 2 1 50.0
Iceland 1 1 100.0 1 1 100.0
India 265 76 28.7 329 92 28.0 327 74 22.6 329 92 28.0 1250 334 26.7
Indonesia 2 0 0.0 1 0 0.0 2 0 0.0 2 0 0.0 7 0 0.0
Iran, Islamic Republic Of 10 3 30.0 8 4 50.0 11 6 54.5 12 8 66.7 41 21 51.2
Iraq 1 1 100.0 1 0 0.0 2 1 50.0
®
212016 NCLEX® EXAMINATION STATISTICS
National Council of State Boards of Nursing, Inc. (NCSBN) | 2017
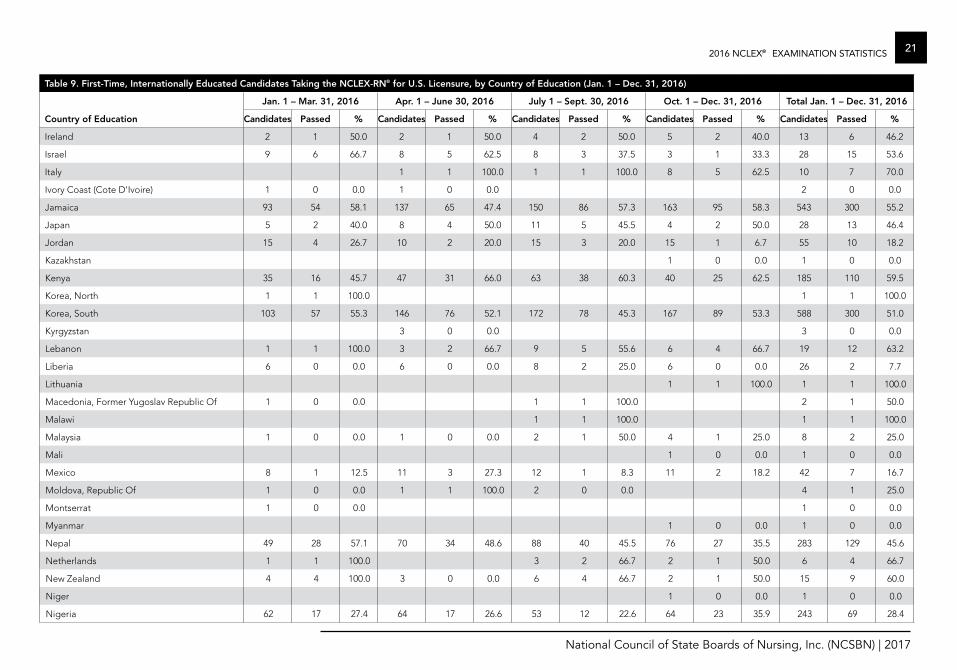
Table 9. First-Time, Internationally Educated Candidates Taking the NCLEX-RN® for U.S. Licensure, by Country of Education (Jan. 1 – Dec. 31, 2016)
Jan. 1 – Mar. 31, 2016 Apr. 1 – June 30, 2016 July 1 – Sept. 30, 2016 Oct. 1 – Dec. 31, 2016 Total Jan. 1 – Dec. 31, 2016
Country of Education Candidates Passed % Candidates Passed % Candidates Passed % Candidates Passed % Candidates Passed %
Ireland 2 1 50.0 2 1 50.0 4 2 50.0 5 2 40.0 13 6 46.2
Israel 9 6 66.7 8 5 62.5 8 3 37.5 3 1 33.3 28 15 53.6
Italy 1 1 100.0 1 1 100.0 8 5 62.5 10 7 70.0
Ivory Coast (Cote D'Ivoire) 1 0 0.0 1 0 0.0 2 0 0.0
Jamaica 93 54 58.1 137 65 47.4 150 86 57.3 163 95 58.3 543 300 55.2
Japan 5 2 40.0 8 4 50.0 11 5 45.5 4 2 50.0 28 13 46.4
Jordan 15 4 26.7 10 2 20.0 15 3 20.0 15 1 6.7 55 10 18.2
Kazakhstan 1 0 0.0 1 0 0.0
Kenya 35 16 45.7 47 31 66.0 63 38 60.3 40 25 62.5 185 110 59.5
Korea, North 1 1 100.0 1 1 100.0
Korea, South 103 57 55.3 146 76 52.1 172 78 45.3 167 89 53.3 588 300 51.0
Kyrgyzstan 3 0 0.0 3 0 0.0
Lebanon 1 1 100.0 3 2 66.7 9 5 55.6 6 4 66.7 19 12 63.2
Liberia 6 0 0.0 6 0 0.0 8 2 25.0 6 0 0.0 26 2 7.7
Lithuania 1 1 100.0 1 1 100.0
Macedonia, Former Yugoslav Republic Of 1 0 0.0 1 1 100.0 2 1 50.0
Malawi 1 1 100.0 1 1 100.0
Malaysia 1 0 0.0 1 0 0.0 2 1 50.0 4 1 25.0 8 2 25.0
Mali 1 0 0.0 1 0 0.0
Mexico 8 1 12.5 11 3 27.3 12 1 8.3 11 2 18.2 42 7 16.7
Moldova, Republic Of 1 0 0.0 1 1 100.0 2 0 0.0 4 1 25.0
Montserrat 1 0 0.0 1 0 0.0
Myanmar 1 0 0.0 1 0 0.0
Nepal 49 28 57.1 70 34 48.6 88 40 45.5 76 27 35.5 283 129 45.6
Netherlands 1 1 100.0 3 2 66.7 2 1 50.0 6 4 66.7
New Zealand 4 4 100.0 3 0 0.0 6 4 66.7 2 1 50.0 15 9 60.0
Niger 1 0 0.0 1 0 0.0
Nigeria 62 17 27.4 64 17 26.6 53 12 22.6 64 23 35.9 243 69 28.4
®
22 2016 NCLEX® EXAMINATION STATISTICS
National Council of State Boards of Nursing, Inc. (NCSBN) | 2017
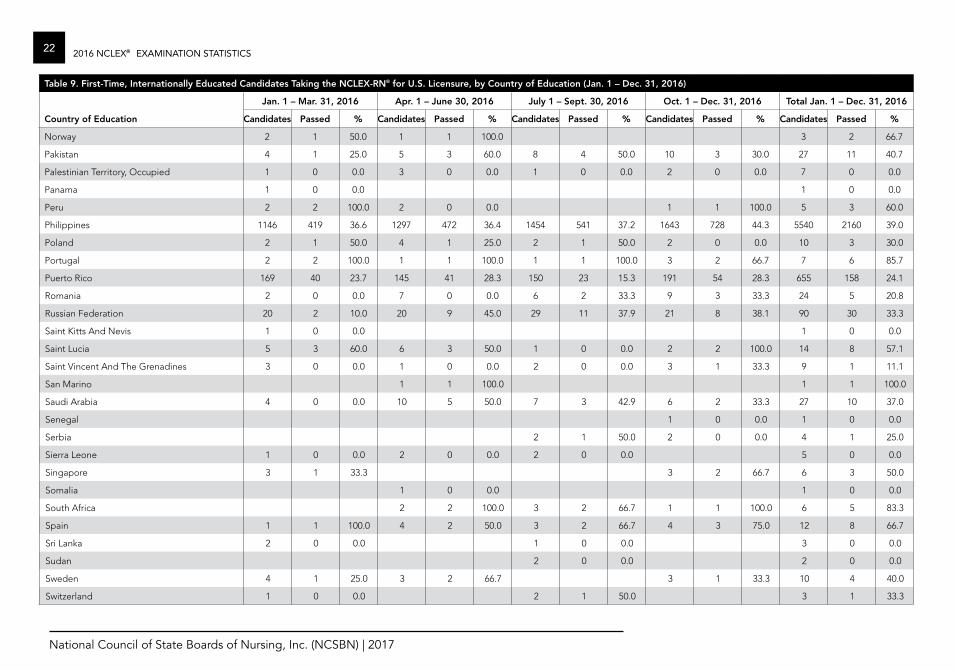
Table 9. First-Time, Internationally Educated Candidates Taking the NCLEX-RN® for U.S. Licensure, by Country of Education (Jan. 1 – Dec. 31, 2016)
Jan. 1 – Mar. 31, 2016 Apr. 1 – June 30, 2016 July 1 – Sept. 30, 2016 Oct. 1 – Dec. 31, 2016 Total Jan. 1 – Dec. 31, 2016
Country of Education Candidates Passed % Candidates Passed % Candidates Passed % Candidates Passed % Candidates Passed %
Norway 2 1 50.0 1 1 100.0 3 2 66.7
Pakistan 4 1 25.0 5 3 60.0 8 4 50.0 10 3 30.0 27 11 40.7
Palestinian Territory, Occupied 1 0 0.0 3 0 0.0 1 0 0.0 2 0 0.0 7 0 0.0
Panama 1 0 0.0 1 0 0.0
Peru 2 2 100.0 2 0 0.0 1 1 100.0 5 3 60.0
Philippines 1146 419 36.6 1297 472 36.4 1454 541 37.2 1643 728 44.3 5540 2160 39.0
Poland 2 1 50.0 4 1 25.0 2 1 50.0 2 0 0.0 10 3 30.0
Portugal 2 2 100.0 1 1 100.0 1 1 100.0 3 2 66.7 7 6 85.7
Puerto Rico 169 40 23.7 145 41 28.3 150 23 15.3 191 54 28.3 655 158 24.1
Romania 2 0 0.0 7 0 0.0 6 2 33.3 9 3 33.3 24 5 20.8
Russian Federation 20 2 10.0 20 9 45.0 29 11 37.9 21 8 38.1 90 30 33.3
Saint Kitts And Nevis 1 0 0.0 1 0 0.0
Saint Lucia 5 3 60.0 6 3 50.0 1 0 0.0 2 2 100.0 14 8 57.1
Saint Vincent And The Grenadines 3 0 0.0 1 0 0.0 2 0 0.0 3 1 33.3 9 1 11.1
San Marino 1 1 100.0 1 1 100.0
Saudi Arabia 4 0 0.0 10 5 50.0 7 3 42.9 6 2 33.3 27 10 37.0
Senegal 1 0 0.0 1 0 0.0
Serbia 2 1 50.0 2 0 0.0 4 1 25.0
Sierra Leone 1 0 0.0 2 0 0.0 2 0 0.0 5 0 0.0
Singapore 3 1 33.3 3 2 66.7 6 3 50.0
Somalia 1 0 0.0 1 0 0.0
South Africa 2 2 100.0 3 2 66.7 1 1 100.0 6 5 83.3
Spain 1 1 100.0 4 2 50.0 3 2 66.7 4 3 75.0 12 8 66.7
Sri Lanka 2 0 0.0 1 0 0.0 3 0 0.0
Sudan 2 0 0.0 2 0 0.0
Sweden 4 1 25.0 3 2 66.7 3 1 33.3 10 4 40.0
Switzerland 1 0 0.0 2 1 50.0 3 1 33.3
®

232016 NCLEX® EXAMINATION STATISTICS
National Council of State Boards of Nursing, Inc. (NCSBN) | 2017
Table 9. First-Time, Internationally Educated Candidates Taking the NCLEX-RN® for U.S. Licensure, by Country of Education (Jan. 1 – Dec. 31, 2016)
Jan. 1 – Mar. 31, 2016 Apr. 1 – June 30, 2016 July 1 – Sept. 30, 2016 Oct. 1 – Dec. 31, 2016 Total Jan. 1 – Dec. 31, 2016
Country of Education Candidates Passed % Candidates Passed % Candidates Passed % Candidates Passed % Candidates Passed %
Norway 2 1 50.0 1 1 100.0 3 2 66.7
Pakistan 4 1 25.0 5 3 60.0 8 4 50.0 10 3 30.0 27 11 40.7
Palestinian Territory, Occupied 1 0 0.0 3 0 0.0 1 0 0.0 2 0 0.0 7 0 0.0
Panama 1 0 0.0 1 0 0.0
Peru 2 2 100.0 2 0 0.0 1 1 100.0 5 3 60.0
Philippines 1146 419 36.6 1297 472 36.4 1454 541 37.2 1643 728 44.3 5540 2160 39.0
Poland 2 1 50.0 4 1 25.0 2 1 50.0 2 0 0.0 10 3 30.0
Portugal 2 2 100.0 1 1 100.0 1 1 100.0 3 2 66.7 7 6 85.7
Puerto Rico 169 40 23.7 145 41 28.3 150 23 15.3 191 54 28.3 655 158 24.1
Romania 2 0 0.0 7 0 0.0 6 2 33.3 9 3 33.3 24 5 20.8
Russian Federation 20 2 10.0 20 9 45.0 29 11 37.9 21 8 38.1 90 30 33.3
Saint Kitts And Nevis 1 0 0.0 1 0 0.0
Saint Lucia 5 3 60.0 6 3 50.0 1 0 0.0 2 2 100.0 14 8 57.1
Saint Vincent And The Grenadines 3 0 0.0 1 0 0.0 2 0 0.0 3 1 33.3 9 1 11.1
San Marino 1 1 100.0 1 1 100.0
Saudi Arabia 4 0 0.0 10 5 50.0 7 3 42.9 6 2 33.3 27 10 37.0
Senegal 1 0 0.0 1 0 0.0
Serbia 2 1 50.0 2 0 0.0 4 1 25.0
Sierra Leone 1 0 0.0 2 0 0.0 2 0 0.0 5 0 0.0
Singapore 3 1 33.3 3 2 66.7 6 3 50.0
Somalia 1 0 0.0 1 0 0.0
South Africa 2 2 100.0 3 2 66.7 1 1 100.0 6 5 83.3
Spain 1 1 100.0 4 2 50.0 3 2 66.7 4 3 75.0 12 8 66.7
Sri Lanka 2 0 0.0 1 0 0.0 3 0 0.0
Sudan 2 0 0.0 2 0 0.0
Sweden 4 1 25.0 3 2 66.7 3 1 33.3 10 4 40.0
Switzerland 1 0 0.0 2 1 50.0 3 1 33.3
Table 9. First-Time, Internationally Educated Candidates Taking the NCLEX-RN® for U.S. Licensure, by Country of Education (Jan. 1 – Dec. 31, 2016)
Jan. 1 – Mar. 31, 2016 Apr. 1 – June 30, 2016 July 1 – Sept. 30, 2016 Oct. 1 – Dec. 31, 2016 Total Jan. 1 – Dec. 31, 2016
Country of Education Candidates Passed % Candidates Passed % Candidates Passed % Candidates Passed % Candidates Passed %
Taiwan 14 2 14.3 19 7 36.8 25 5 20.0 32 9 28.1 90 23 25.6
Tajikistan 1 0 0.0 1 0 0.0
Tanzania, United Republic Of 1 0 0.0 1 0 0.0 1 0 0.0 3 0 0.0
Thailand 10 3 30.0 7 2 28.6 4 0 0.0 11 1 9.1 32 6 18.8
Togo 1 0 0.0 1 0 0.0
Trinidad And Tobago 1 1 100.0 5 3 60.0 9 4 44.4 8 4 50.0 23 12 52.2
Turkey 2 0 0.0 3 1 33.3 1 0 0.0 6 1 16.7
Uganda 1 1 100.0 6 2 33.3 7 3 42.9
Ukraine 11 1 9.1 7 0 0.0 12 2 16.7 10 2 20.0 40 5 12.5
United Arab Emirates 2 0 0.0 1 0 0.0 1 0 0.0 4 0 0.0
United Kingdom 30 14 46.7 26 7 26.9 22 7 31.8 22 11 50.0 100 39 39.0
United States Minor Outlying Islands 1 0 0.0 1 0 0.0
Uzbekistan 9 0 0.0 16 0 0.0 6 0 0.0 10 0 0.0 41 0 0.0
Venezuela 2 0 0.0 1 0 0.0 3 1 33.3 6 1 16.7
Western Sahara 1 0 0.0 1 0 0.0
Zambia 1 1 100.0 1 1 100.0
Zimbabwe 1 0 0.0 1 0 0.0 1 1 100.0 3 1 33.3
Total 2,407 888 36.9 2,805 1,062 37.9 3,046 1,135 37.3 3,286 1,386 42.2 11,544 4,471 38.7
®
24 2016 NCLEX® EXAMINATION STATISTICS
National Council of State Boards of Nursing, Inc. (NCSBN) | 2017
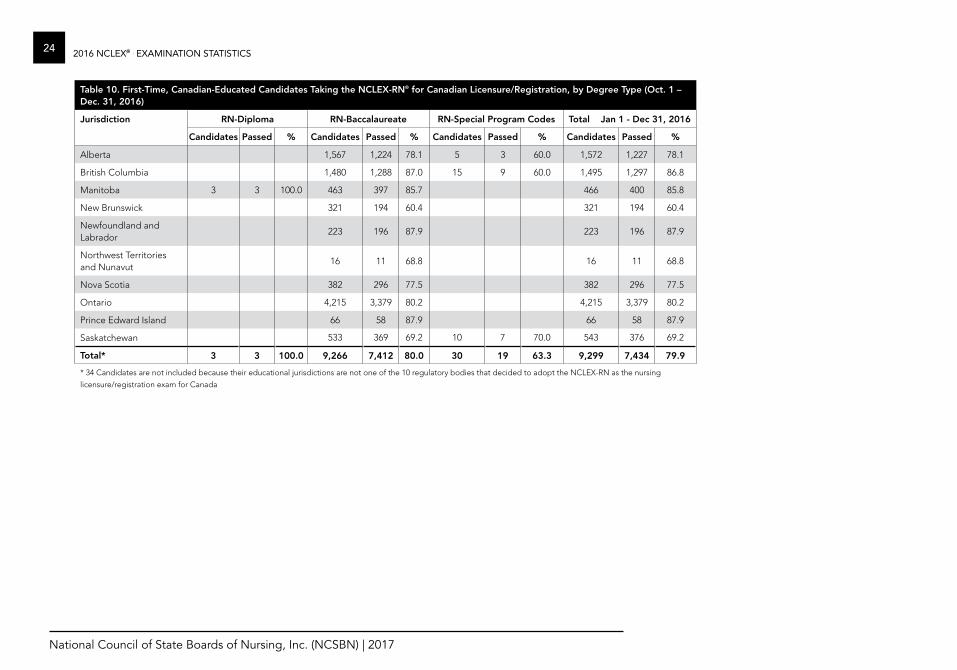
Table 10. First-Time, Canadian-Educated Candidates Taking the NCLEX-RN® for Canadian Licensure/Registration, by Degree Type (Oct. 1 – Dec. 31, 2016)
Jurisdiction RN-Diploma RN-Baccalaureate RN-Special Program Codes Total Jan 1 - Dec 31, 2016
Candidates Passed % Candidates Passed % Candidates Passed % Candidates Passed %
Alberta 1,567 1,224 78.1 5 3 60.0 1,572 1,227 78.1
British Columbia 1,480 1,288 87.0 15 9 60.0 1,495 1,297 86.8
Manitoba 3 3 100.0 463 397 85.7 466 400 85.8
New Brunswick 321 194 60.4 321 194 60.4
Newfoundland and Labrador
223 196 87.9 223 196 87.9
Northwest Territories and Nunavut
16 11 68.8 16 11 68.8
Nova Scotia 382 296 77.5 382 296 77.5
Ontario 4,215 3,379 80.2 4,215 3,379 80.2
Prince Edward Island 66 58 87.9 66 58 87.9
Saskatchewan 533 369 69.2 10 7 70.0 543 376 69.2
Total* 3 3 100.0 9,266 7,412 80.0 30 19 63.3 9,299 7,434 79.9
* 34 Candidates are not included because their educational jurisdictions are not one of the 10 regulatory bodies that decided to adopt the NCLEX-RN as the nursing
licensure/registration exam for Canada
®
252016 NCLEX® EXAMINATION STATISTICS
National Council of State Boards of Nursing, Inc. (NCSBN) | 2017
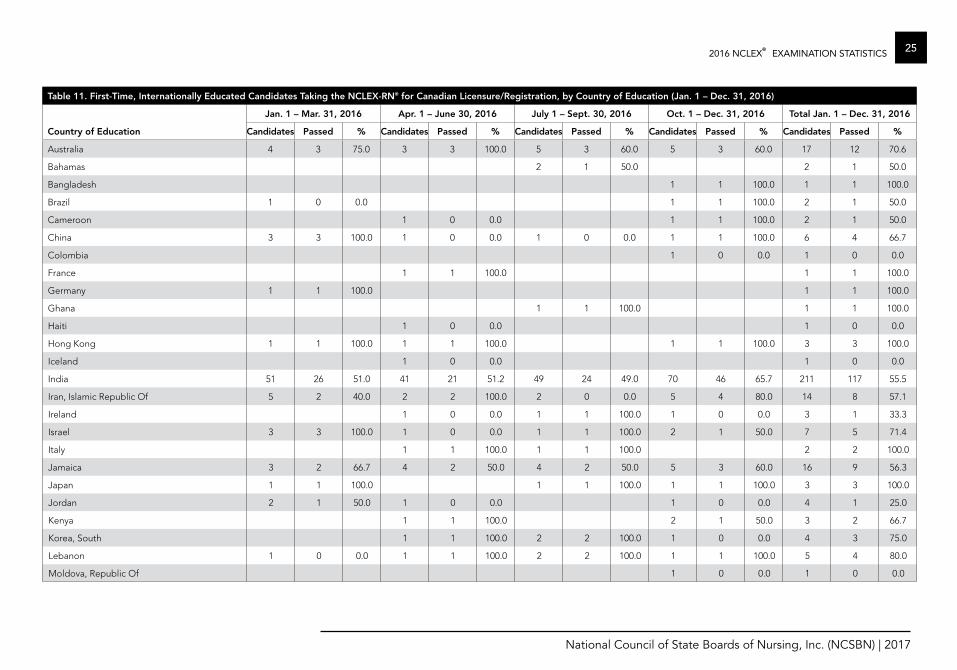
Table 11. First-Time, Internationally Educated Candidates Taking the NCLEX-RN® for Canadian Licensure/Registration, by Country of Education (Jan. 1 – Dec. 31, 2016)
Jan. 1 – Mar. 31, 2016 Apr. 1 – June 30, 2016 July 1 – Sept. 30, 2016 Oct. 1 – Dec. 31, 2016 Total Jan. 1 – Dec. 31, 2016
Country of Education Candidates Passed % Candidates Passed % Candidates Passed % Candidates Passed % Candidates Passed %
Australia 4 3 75.0 3 3 100.0 5 3 60.0 5 3 60.0 17 12 70.6
Bahamas 2 1 50.0 2 1 50.0
Bangladesh 1 1 100.0 1 1 100.0
Brazil 1 0 0.0 1 1 100.0 2 1 50.0
Cameroon 1 0 0.0 1 1 100.0 2 1 50.0
China 3 3 100.0 1 0 0.0 1 0 0.0 1 1 100.0 6 4 66.7
Colombia 1 0 0.0 1 0 0.0
France 1 1 100.0 1 1 100.0
Germany 1 1 100.0 1 1 100.0
Ghana 1 1 100.0 1 1 100.0
Haiti 1 0 0.0 1 0 0.0
Hong Kong 1 1 100.0 1 1 100.0 1 1 100.0 3 3 100.0
Iceland 1 0 0.0 1 0 0.0
India 51 26 51.0 41 21 51.2 49 24 49.0 70 46 65.7 211 117 55.5
Iran, Islamic Republic Of 5 2 40.0 2 2 100.0 2 0 0.0 5 4 80.0 14 8 57.1
Ireland 1 0 0.0 1 1 100.0 1 0 0.0 3 1 33.3
Israel 3 3 100.0 1 0 0.0 1 1 100.0 2 1 50.0 7 5 71.4
Italy 1 1 100.0 1 1 100.0 2 2 100.0
Jamaica 3 2 66.7 4 2 50.0 4 2 50.0 5 3 60.0 16 9 56.3
Japan 1 1 100.0 1 1 100.0 1 1 100.0 3 3 100.0
Jordan 2 1 50.0 1 0 0.0 1 0 0.0 4 1 25.0
Kenya 1 1 100.0 2 1 50.0 3 2 66.7
Korea, South 1 1 100.0 2 2 100.0 1 0 0.0 4 3 75.0
Lebanon 1 0 0.0 1 1 100.0 2 2 100.0 1 1 100.0 5 4 80.0
Moldova, Republic Of 1 0 0.0 1 0 0.0
®
26 2016 NCLEX® EXAMINATION STATISTICS
National Council of State Boards of Nursing, Inc. (NCSBN) | 2017
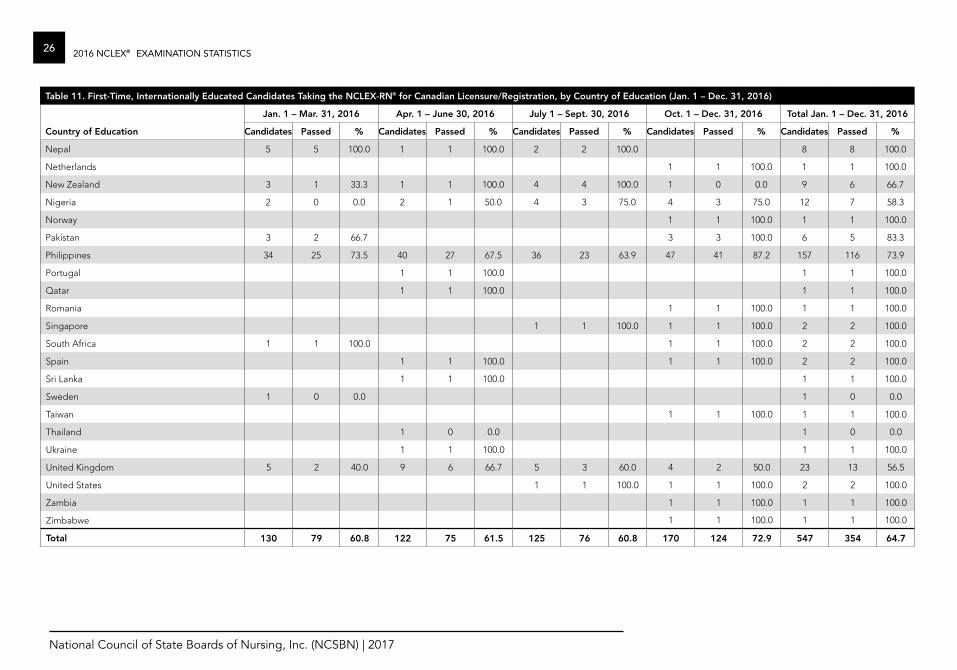
Table 11. First-Time, Internationally Educated Candidates Taking the NCLEX-RN® for Canadian Licensure/Registration, by Country of Education (Jan. 1 – Dec. 31, 2016)
Jan. 1 – Mar. 31, 2016 Apr. 1 – June 30, 2016 July 1 – Sept. 30, 2016 Oct. 1 – Dec. 31, 2016 Total Jan. 1 – Dec. 31, 2016
Country of Education Candidates Passed % Candidates Passed % Candidates Passed % Candidates Passed % Candidates Passed %
Nepal 5 5 100.0 1 1 100.0 2 2 100.0 8 8 100.0
Netherlands 1 1 100.0 1 1 100.0
New Zealand 3 1 33.3 1 1 100.0 4 4 100.0 1 0 0.0 9 6 66.7
Nigeria 2 0 0.0 2 1 50.0 4 3 75.0 4 3 75.0 12 7 58.3
Norway 1 1 100.0 1 1 100.0
Pakistan 3 2 66.7 3 3 100.0 6 5 83.3
Philippines 34 25 73.5 40 27 67.5 36 23 63.9 47 41 87.2 157 116 73.9
Portugal 1 1 100.0 1 1 100.0
Qatar 1 1 100.0 1 1 100.0
Romania 1 1 100.0 1 1 100.0
Singapore 1 1 100.0 1 1 100.0 2 2 100.0
South Africa 1 1 100.0 1 1 100.0 2 2 100.0
Spain 1 1 100.0 1 1 100.0 2 2 100.0
Sri Lanka 1 1 100.0 1 1 100.0
Sweden 1 0 0.0 1 0 0.0
Taiwan 1 1 100.0 1 1 100.0
Thailand 1 0 0.0 1 0 0.0
Ukraine 1 1 100.0 1 1 100.0
United Kingdom 5 2 40.0 9 6 66.7 5 3 60.0 4 2 50.0 23 13 56.5
United States 1 1 100.0 1 1 100.0 2 2 100.0
Zambia 1 1 100.0 1 1 100.0
Zimbabwe 1 1 100.0 1 1 100.0
Total 130 79 60.8 122 75 61.5 125 76 60.8 170 124 72.9 547 354 64.7
®
272016 NCLEX® EXAMINATION STATISTICS
National Council of State Boards of Nursing, Inc. (NCSBN) | 2017
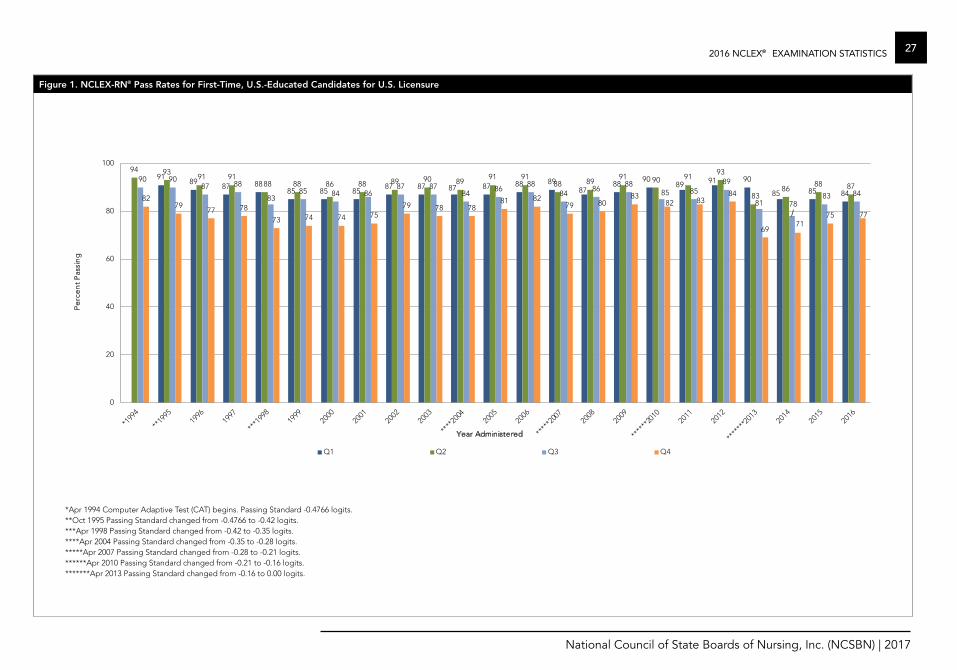
Figure 1. NCLEX-RN® Pass Rates for First-Time, U.S.-Educated Candidates for U.S. Licensure
*Apr 1994 Computer Adaptive Test (CAT) begins. Passing Standard -0.4766 logits.**Oct 1995 Passing Standard changed from -0.4766 to -0.42 logits.***Apr 1998 Passing Standard changed from -0.42 to -0.35 logits.****Apr 2004 Passing Standard changed from -0.35 to -0.28 logits.*****Apr 2007 Passing Standard changed from -0.28 to -0.21 logits.******Apr 2010 Passing Standard changed from -0.21 to -0.16 logits.*******Apr 2013 Passing Standard changed from -0.16 to 0.00 logits.
®
9189
87 8885 85 85
87 87 87 87 88 8987
8890
89 91 90
85 85 84
94 9391 91
88 88 86 88 89 90 8991 91
88 8991 90 91
93
8386
88 8790 90
87 88
8385 84 86
87 8784
8688
8486
8885 85
89
81 7883 84
8279
77 78
73 74 74 7579 78 78
81 8279 80
8382 83
84
6971
75 77
0
20
40
60
80
100
Pe
rce
nt
Pas
sin
g
Year Administered
Q1 Q2 Q3 Q4
28 2016 NCLEX® EXAMINATION STATISTICS
National Council of State Boards of Nursing, Inc. (NCSBN) | 2017
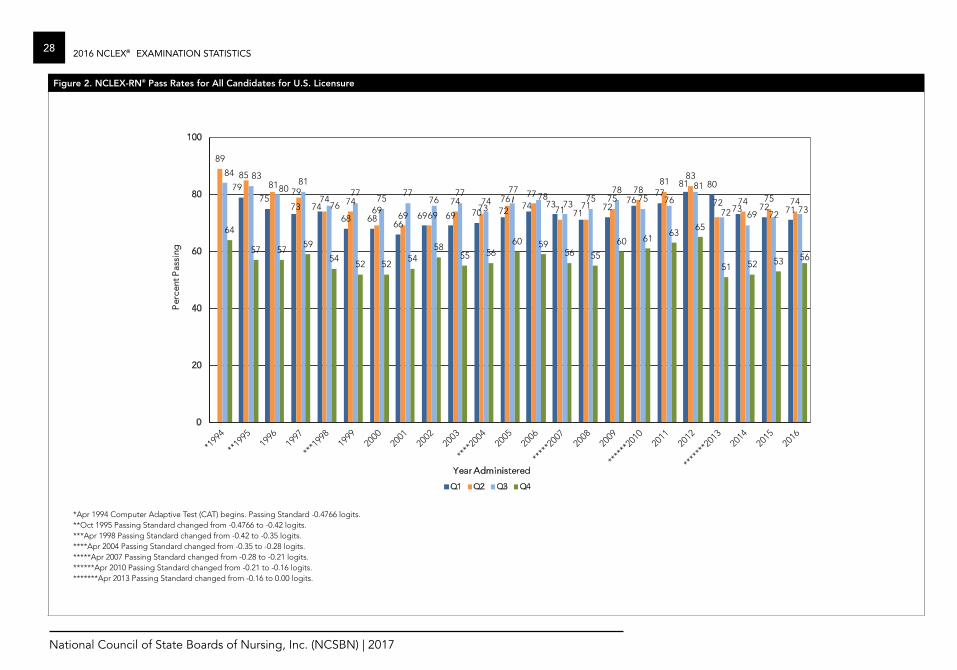
Figure 2. NCLEX-RN® Pass Rates for All Candidates for U.S. Licensure
®
*Apr 1994 Computer Adaptive Test (CAT) begins. Passing Standard -0.4766 logits.**Oct 1995 Passing Standard changed from -0.4766 to -0.42 logits.***Apr 1998 Passing Standard changed from -0.42 to -0.35 logits.****Apr 2004 Passing Standard changed from -0.35 to -0.28 logits.*****Apr 2007 Passing Standard changed from -0.28 to -0.21 logits.******Apr 2010 Passing Standard changed from -0.21 to -0.16 logits.*******Apr 2013 Passing Standard changed from -0.16 to 0.00 logits.
7975
73 7468 68
6669 69 70 72 74 73
7172
7677
81 80
73 72 71
89
8581
7974 74
6969 69
7473
76 77
71 7175
7881
83
72 74 75 74
84 8380
81
7677
7577
7677
7477
7873
7578
75 76
81
72 69 72 73
64
57 5759
5452 52
5458
55 5660 59
56 55
60 6163
65
51 52 53 56
0
20
40
60
80
100
Per
cent
Pas
sing
Year Administered
Q1 Q2 Q3 Q4
292016 NCLEX® EXAMINATION STATISTICS
National Council of State Boards of Nursing, Inc. (NCSBN) | 2017
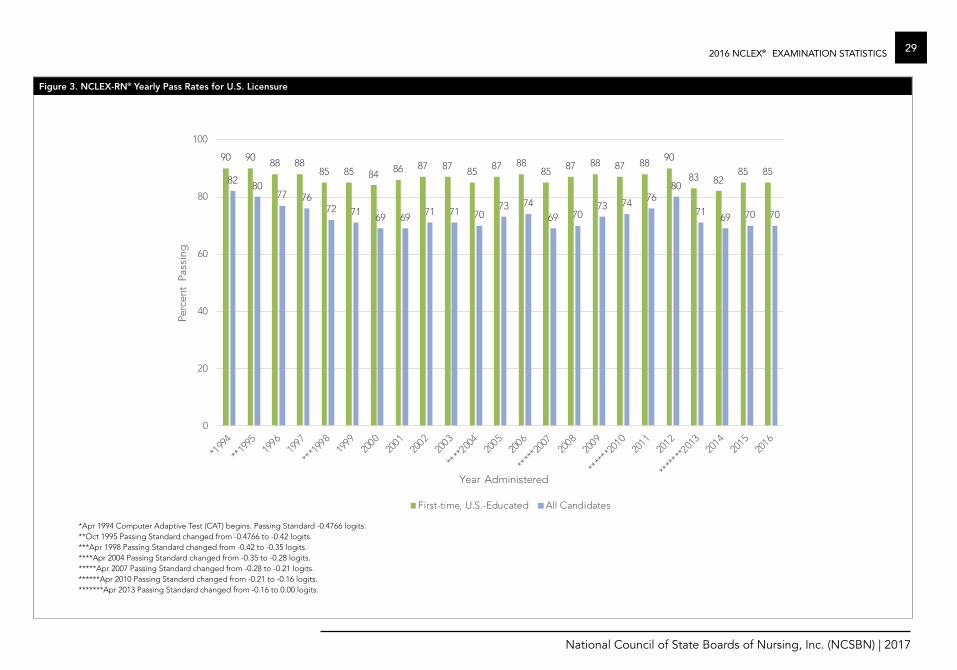
Figure 3. NCLEX-RN® Yearly Pass Rates for U.S. Licensure
*Apr 1994 Computer Adaptive Test (CAT) begins. Passing Standard -0.4766 logits.**Oct 1995 Passing Standard changed from -0.4766 to -0.42 logits.***Apr 1998 Passing Standard changed from -0.42 to -0.35 logits.****Apr 2004 Passing Standard changed from -0.35 to -0.28 logits.*****Apr 2007 Passing Standard changed from -0.28 to -0.21 logits.******Apr 2010 Passing Standard changed from -0.21 to -0.16 logits.*******Apr 2013 Passing Standard changed from -0.16 to 0.00 logits.
®
90 90 88 8885 85 84 86 87 87 85 87 88
85 87 88 87 88 90
83 8285 85
82 8077 76
72 71 69 69 71 71 7073 74
69 7073 74 76
80
71 69 70 70
0
20
40
60
80
100
Perc
ent
Pass
ing
Year Administered
First-time, U.S.-Educated All Candidates
30 2016 NCLEX® EXAMINATION STATISTICS
National Council of State Boards of Nursing, Inc. (NCSBN) | 2017
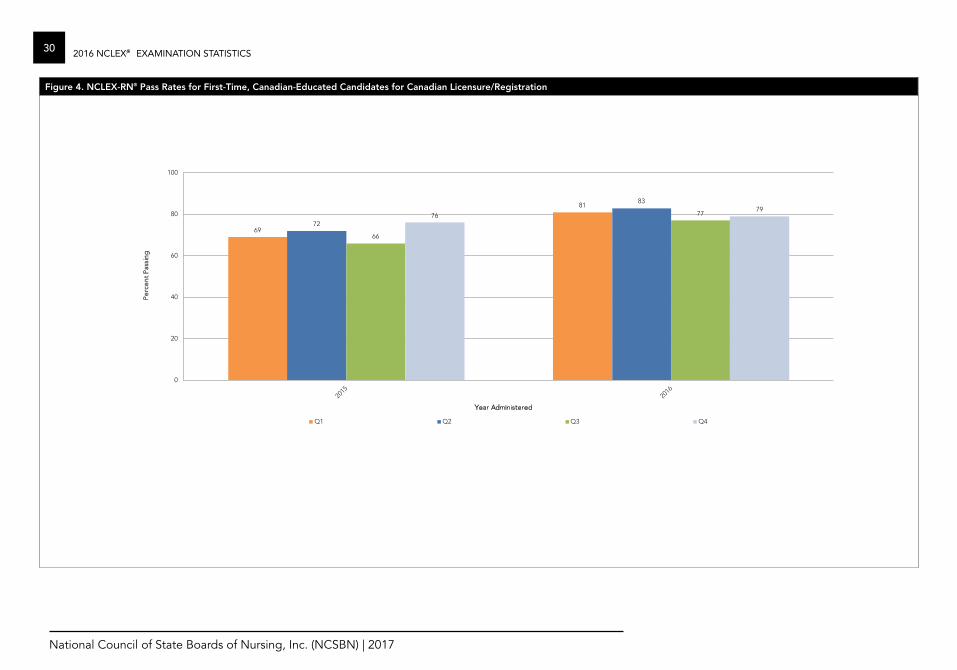
Figure 4. NCLEX-RN® Pass Rates for First-Time, Canadian-Educated Candidates for Canadian Licensure/Registration
69
81
72
83
66
777679
0
20
40
60
80
100
Pe
rce
nt
Pas
sin
g
Year Administered
Q1 Q2 Q3 Q4
®
312016 NCLEX® EXAMINATION STATISTICS
National Council of State Boards of Nursing, Inc. (NCSBN) | 2017
®
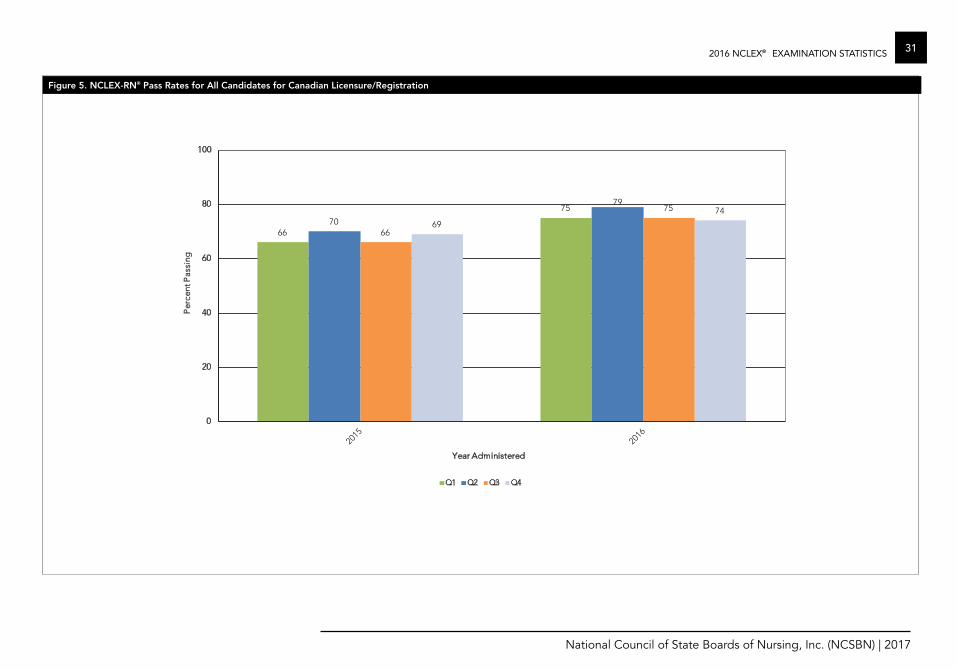
66
75
70
79
66
75
69
74
0
20
40
60
80
100
Per
cent
Pas
sing
Year Administered
Q1 Q2 Q3 Q4
Figure 5. NCLEX-RN® Pass Rates for All Candidates for Canadian Licensure/Registration
32 2016 NCLEX® EXAMINATION STATISTICS
National Council of State Boards of Nursing, Inc. (NCSBN) | 2017
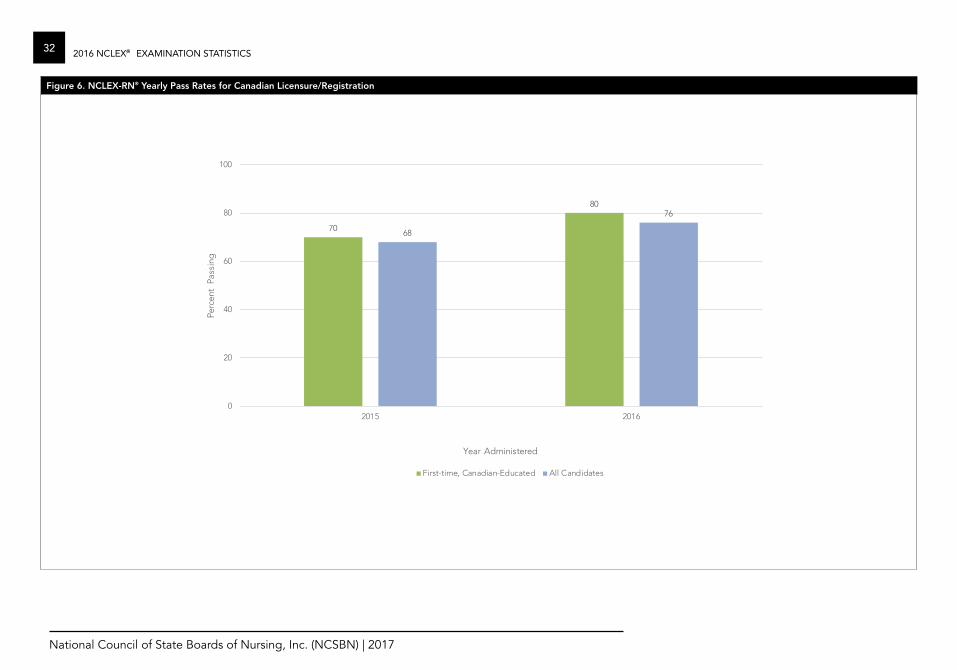
Figure 6. NCLEX-RN® Yearly Pass Rates for Canadian Licensure/Registration
®
70
80
68
76
0
20
40
60
80
100
2015 2016
Perc
ent
Pass
ing
Year Administered
First-time, Canadian-Educated All Candidates
332016 NCLEX® EXAMINATION STATISTICS
National Council of State Boards of Nursing, Inc. (NCSBN) | 2017
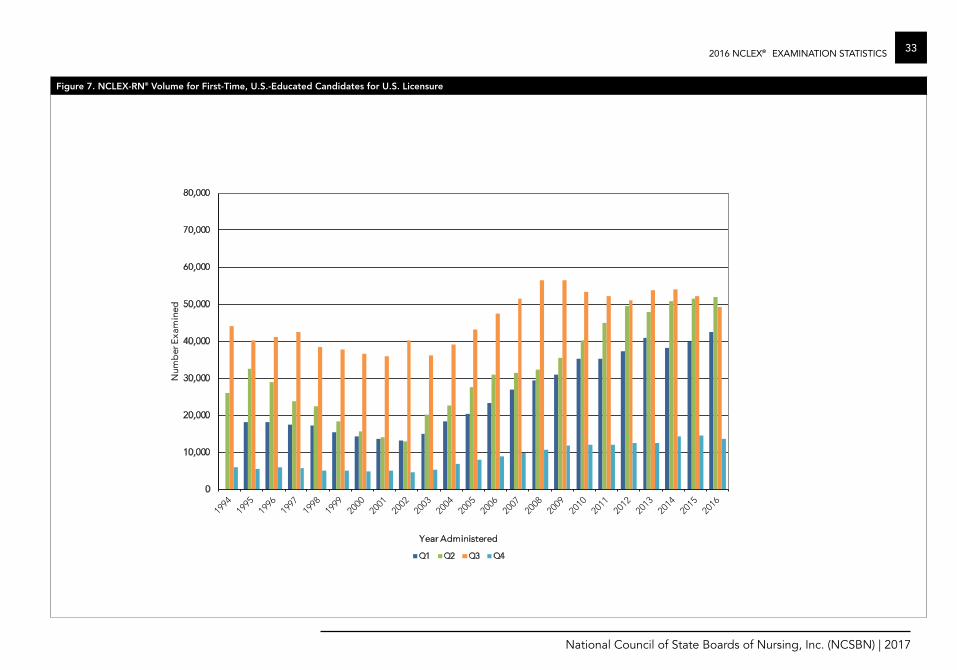
Figure 7. NCLEX-RN® Volume for First-Time, U.S.-Educated Candidates for U.S. Licensure
®
0
10,000
20,000
30,000
40,000
50,000
60,000
70,000
80,000
Num
ber
Exa
min
ed
Year Administered
Q1 Q2 Q3 Q4
34 2016 NCLEX® EXAMINATION STATISTICS
National Council of State Boards of Nursing, Inc. (NCSBN) | 2017
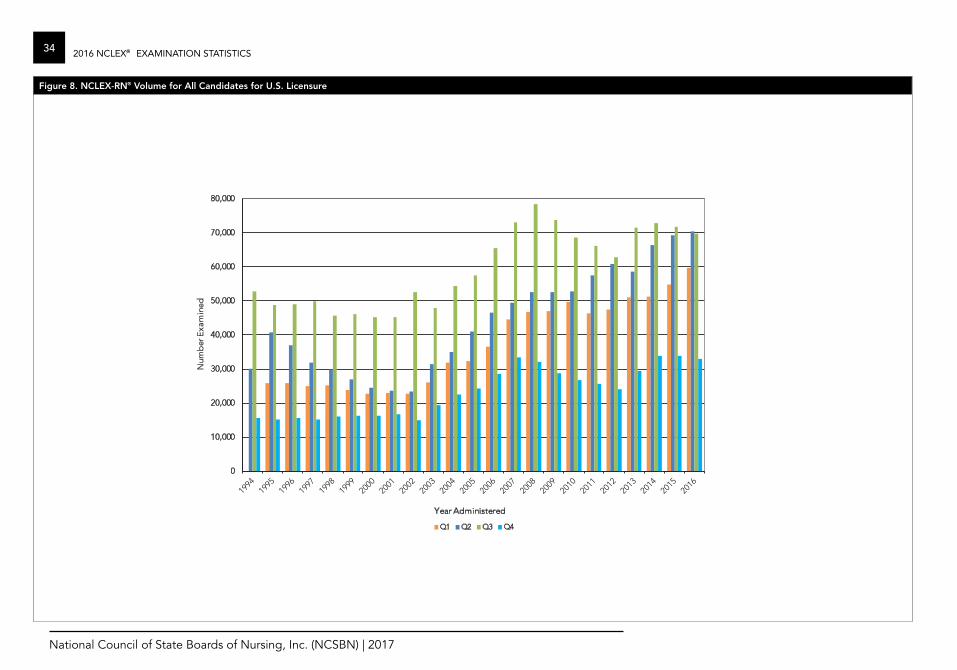
Figure 8. NCLEX-RN® Volume for All Candidates for U.S. Licensure
®
0
10,000
20,000
30,000
40,000
50,000
60,000
70,000
80,000N
umb
er E
xam
ined
Year Administered
Q1 Q2 Q3 Q4
352016 NCLEX® EXAMINATION STATISTICS
National Council of State Boards of Nursing, Inc. (NCSBN) | 2017
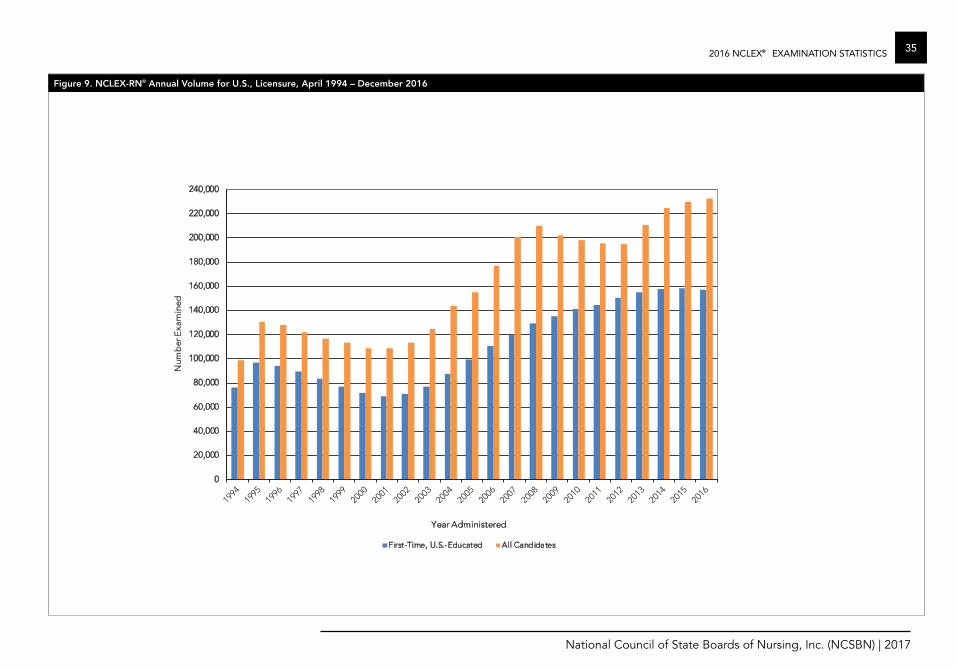
Figure 9. NCLEX-RN® Annual Volume for U.S., Licensure, April 1994 – December 2016
®
0
20,000
40,000
60,000
80,000
100,000
120,000
140,000
160,000
180,000
200,000
220,000
240,000N
umb
er E
xam
ined
Year Administered
First-Time, U.S.-Educated All Candidates
36 2016 NCLEX® EXAMINATION STATISTICS
National Council of State Boards of Nursing, Inc. (NCSBN) | 2017
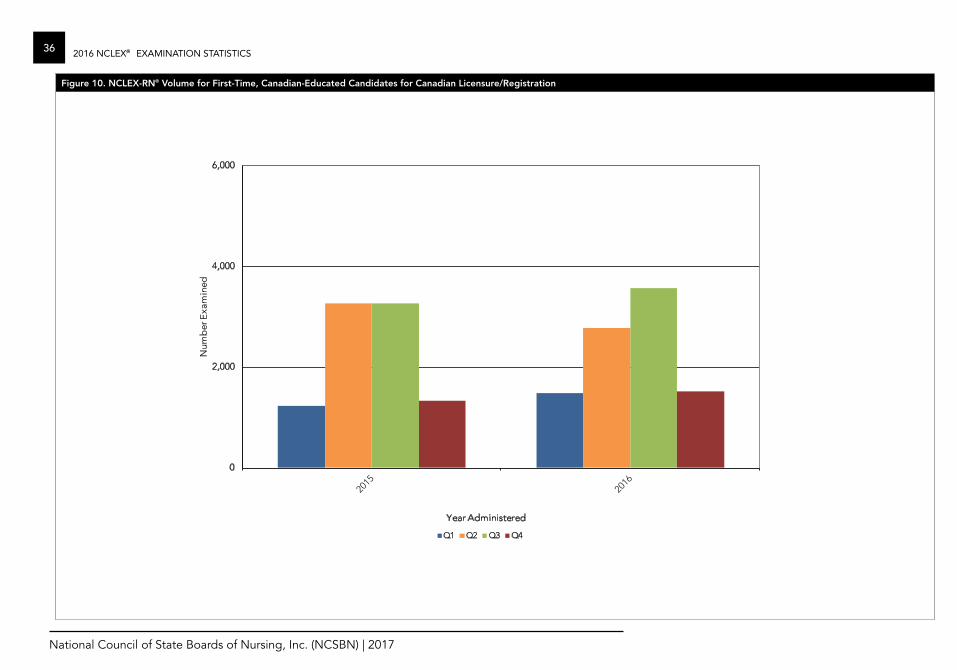
Figure 10. NCLEX-RN® Volume for First-Time, Canadian-Educated Candidates for Canadian Licensure/Registration
0
2,000
4,000
6,000
Num
ber
Exa
min
ed
Year Administered
Q1 Q2 Q3 Q4
®

372016 NCLEX® EXAMINATION STATISTICS
National Council of State Boards of Nursing, Inc. (NCSBN) | 2017
Figure 11. NCLEX-RN® Volume for All Candidates for Canadian Licensure/Registration
0
2000
4000
6000
Num
ber
Exa
min
ed
Year Administered
Q1 Q2 Q3 Q4
®
38 2016 NCLEX® EXAMINATION STATISTICS
National Council of State Boards of Nursing, Inc. (NCSBN) | 2017
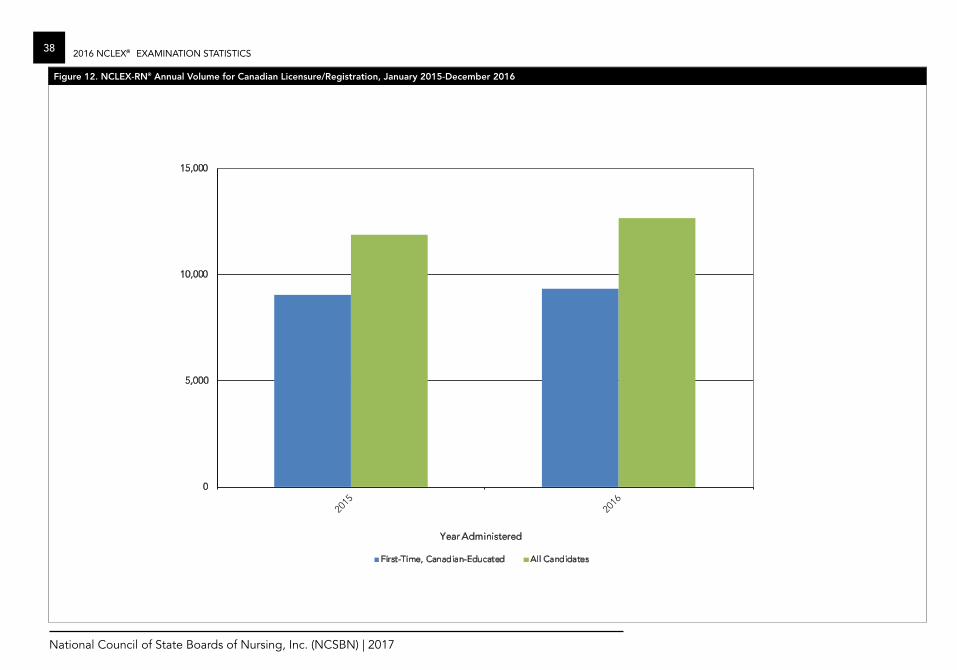
Figure 12. NCLEX-RN® Annual Volume for Canadian Licensure/Registration, January 2015-December 2016
0
5,000
10,000
15,000N
umb
er E
xam
ined
Year Administered
First-Time, Canadian-Educated All Candidates
®
392016 NCLEX® EXAMINATION STATISTICS
National Council of State Boards of Nursing, Inc. (NCSBN) | 2017
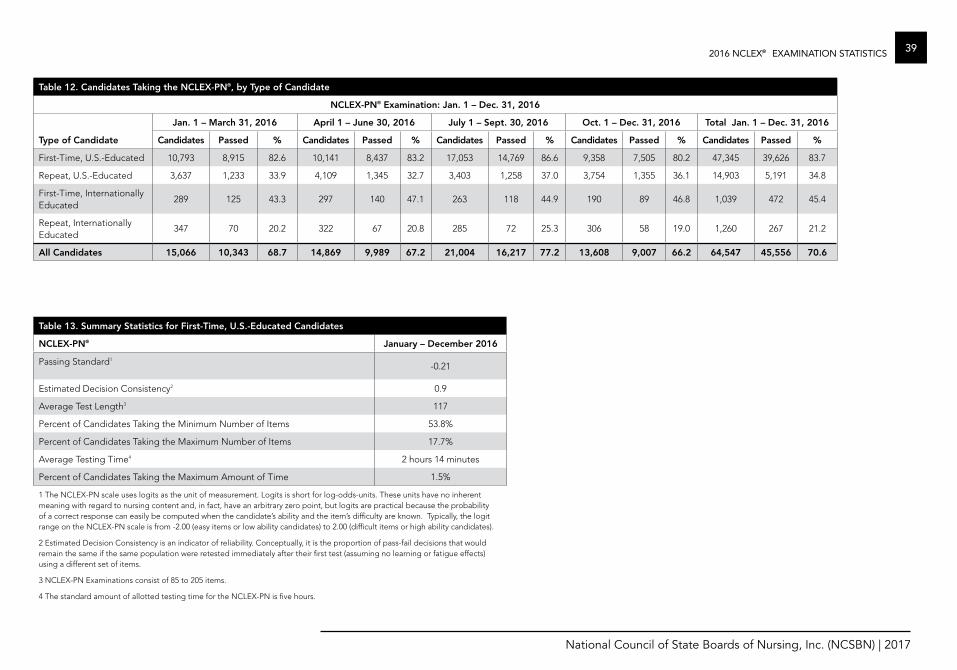
Table 12. Candidates Taking the NCLEX-PN®, by Type of Candidate
NCLEX-PN® Examination: Jan. 1 – Dec. 31, 2016
Type of Candidate
Jan. 1 – March 31, 2016 April 1 – June 30, 2016 July 1 – Sept. 30, 2016 Oct. 1 – Dec. 31, 2016 Total Jan. 1 – Dec. 31, 2016
Candidates Passed % Candidates Passed % Candidates Passed % Candidates Passed % Candidates Passed %
First-Time, U.S.-Educated 10,793 8,915 82.6 10,141 8,437 83.2 17,053 14,769 86.6 9,358 7,505 80.2 47,345 39,626 83.7
Repeat, U.S.-Educated 3,637 1,233 33.9 4,109 1,345 32.7 3,403 1,258 37.0 3,754 1,355 36.1 14,903 5,191 34.8
First-Time, Internationally Educated
289 125 43.3 297 140 47.1 263 118 44.9 190 89 46.8 1,039 472 45.4
Repeat, Internationally Educated
347 70 20.2 322 67 20.8 285 72 25.3 306 58 19.0 1,260 267 21.2
All Candidates 15,066 10,343 68.7 14,869 9,989 67.2 21,004 16,217 77.2 13,608 9,007 66.2 64,547 45,556 70.6
Table 13. Summary Statistics for First-Time, U.S.-Educated Candidates
NCLEX-PN® January – December 2016
Passing Standard1
-0.21
Estimated Decision Consistency2 0.9
Average Test Length3 117
Percent of Candidates Taking the Minimum Number of Items 53.8%
Percent of Candidates Taking the Maximum Number of Items 17.7%
Average Testing Time4 2 hours 14 minutes
Percent of Candidates Taking the Maximum Amount of Time 1.5%
1 The NCLEX-PN scale uses logits as the unit of measurement. Logits is short for log-odds-units. These units have no inherent meaning with regard to nursing content and, in fact, have an arbitrary zero point, but logits are practical because the probability of a correct response can easily be computed when the candidate’s ability and the item’s difficulty are known. Typically, the logit range on the NCLEX-PN scale is from -2.00 (easy items or low ability candidates) to 2.00 (difficult items or high ability candidates).
2 Estimated Decision Consistency is an indicator of reliability. Conceptually, it is the proportion of pass-fail decisions that would remain the same if the same population were retested immediately after their first test (assuming no learning or fatigue effects) using a different set of items.
3 NCLEX-PN Examinations consist of 85 to 205 items.
4 The standard amount of allotted testing time for the NCLEX-PN is five hours.
®
40 2016 NCLEX® EXAMINATION STATISTICS
National Council of State Boards of Nursing, Inc. (NCSBN) | 2017
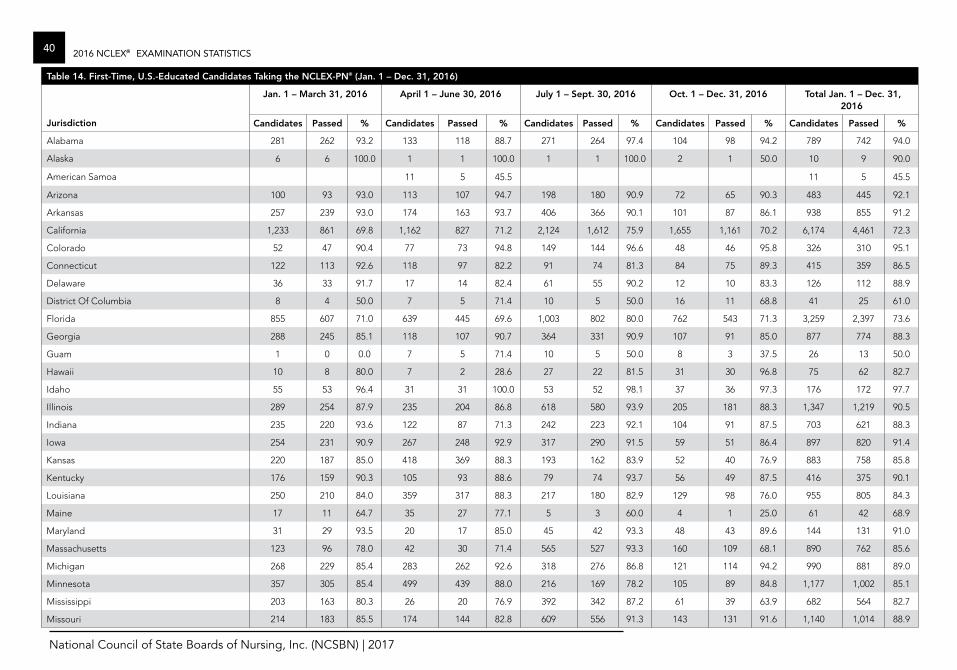
Table 14. First-Time, U.S.-Educated Candidates Taking the NCLEX-PN® (Jan. 1 – Dec. 31, 2016)
Jurisdiction
Jan. 1 – March 31, 2016 April 1 – June 30, 2016 July 1 – Sept. 30, 2016 Oct. 1 – Dec. 31, 2016 Total Jan. 1 – Dec. 31, 2016
Candidates Passed % Candidates Passed % Candidates Passed % Candidates Passed % Candidates Passed %
Alabama 281 262 93.2 133 118 88.7 271 264 97.4 104 98 94.2 789 742 94.0
Alaska 6 6 100.0 1 1 100.0 1 1 100.0 2 1 50.0 10 9 90.0
American Samoa 11 5 45.5 11 5 45.5
Arizona 100 93 93.0 113 107 94.7 198 180 90.9 72 65 90.3 483 445 92.1
Arkansas 257 239 93.0 174 163 93.7 406 366 90.1 101 87 86.1 938 855 91.2
California 1,233 861 69.8 1,162 827 71.2 2,124 1,612 75.9 1,655 1,161 70.2 6,174 4,461 72.3
Colorado 52 47 90.4 77 73 94.8 149 144 96.6 48 46 95.8 326 310 95.1
Connecticut 122 113 92.6 118 97 82.2 91 74 81.3 84 75 89.3 415 359 86.5
Delaware 36 33 91.7 17 14 82.4 61 55 90.2 12 10 83.3 126 112 88.9
District Of Columbia 8 4 50.0 7 5 71.4 10 5 50.0 16 11 68.8 41 25 61.0
Florida 855 607 71.0 639 445 69.6 1,003 802 80.0 762 543 71.3 3,259 2,397 73.6
Georgia 288 245 85.1 118 107 90.7 364 331 90.9 107 91 85.0 877 774 88.3
Guam 1 0 0.0 7 5 71.4 10 5 50.0 8 3 37.5 26 13 50.0
Hawaii 10 8 80.0 7 2 28.6 27 22 81.5 31 30 96.8 75 62 82.7
Idaho 55 53 96.4 31 31 100.0 53 52 98.1 37 36 97.3 176 172 97.7
Illinois 289 254 87.9 235 204 86.8 618 580 93.9 205 181 88.3 1,347 1,219 90.5
Indiana 235 220 93.6 122 87 71.3 242 223 92.1 104 91 87.5 703 621 88.3
Iowa 254 231 90.9 267 248 92.9 317 290 91.5 59 51 86.4 897 820 91.4
Kansas 220 187 85.0 418 369 88.3 193 162 83.9 52 40 76.9 883 758 85.8
Kentucky 176 159 90.3 105 93 88.6 79 74 93.7 56 49 87.5 416 375 90.1
Louisiana 250 210 84.0 359 317 88.3 217 180 82.9 129 98 76.0 955 805 84.3
Maine 17 11 64.7 35 27 77.1 5 3 60.0 4 1 25.0 61 42 68.9
Maryland 31 29 93.5 20 17 85.0 45 42 93.3 48 43 89.6 144 131 91.0
Massachusetts 123 96 78.0 42 30 71.4 565 527 93.3 160 109 68.1 890 762 85.6
Michigan 268 229 85.4 283 262 92.6 318 276 86.8 121 114 94.2 990 881 89.0
Minnesota 357 305 85.4 499 439 88.0 216 169 78.2 105 89 84.8 1,177 1,002 85.1
Mississippi 203 163 80.3 26 20 76.9 392 342 87.2 61 39 63.9 682 564 82.7
Missouri 214 183 85.5 174 144 82.8 609 556 91.3 143 131 91.6 1,140 1,014 88.9
®
412016 NCLEX® EXAMINATION STATISTICS
National Council of State Boards of Nursing, Inc. (NCSBN) | 2017
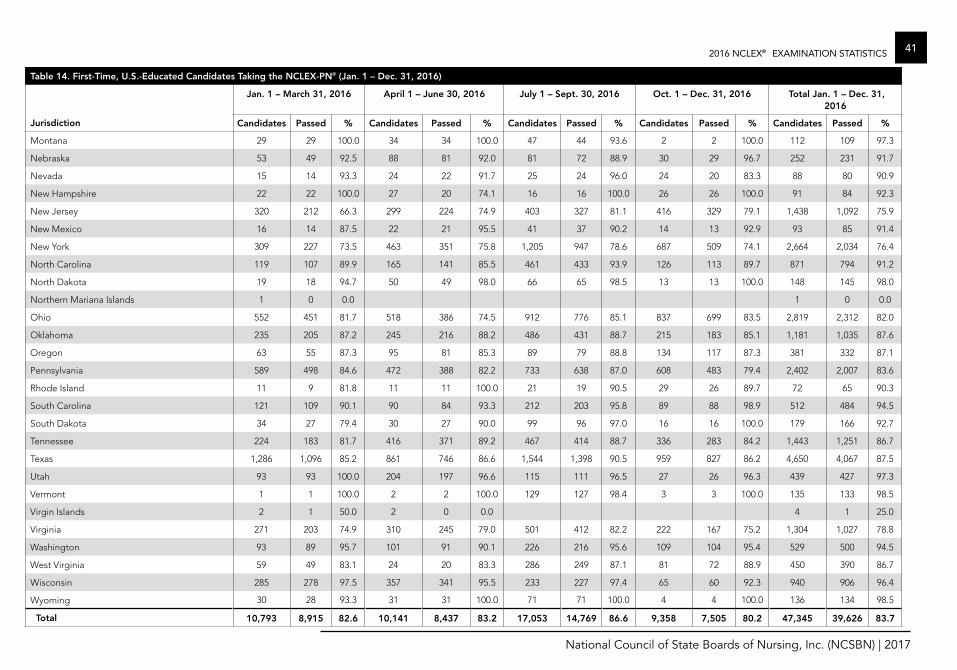
Table 14. First-Time, U.S.-Educated Candidates Taking the NCLEX-PN® (Jan. 1 – Dec. 31, 2016)
Jurisdiction
Jan. 1 – March 31, 2016 April 1 – June 30, 2016 July 1 – Sept. 30, 2016 Oct. 1 – Dec. 31, 2016 Total Jan. 1 – Dec. 31, 2016
Candidates Passed % Candidates Passed % Candidates Passed % Candidates Passed % Candidates Passed %
Montana 29 29 100.0 34 34 100.0 47 44 93.6 2 2 100.0 112 109 97.3
Nebraska 53 49 92.5 88 81 92.0 81 72 88.9 30 29 96.7 252 231 91.7
Nevada 15 14 93.3 24 22 91.7 25 24 96.0 24 20 83.3 88 80 90.9
New Hampshire 22 22 100.0 27 20 74.1 16 16 100.0 26 26 100.0 91 84 92.3
New Jersey 320 212 66.3 299 224 74.9 403 327 81.1 416 329 79.1 1,438 1,092 75.9
New Mexico 16 14 87.5 22 21 95.5 41 37 90.2 14 13 92.9 93 85 91.4
New York 309 227 73.5 463 351 75.8 1,205 947 78.6 687 509 74.1 2,664 2,034 76.4
North Carolina 119 107 89.9 165 141 85.5 461 433 93.9 126 113 89.7 871 794 91.2
North Dakota 19 18 94.7 50 49 98.0 66 65 98.5 13 13 100.0 148 145 98.0
Northern Mariana Islands 1 0 0.0 1 0 0.0
Ohio 552 451 81.7 518 386 74.5 912 776 85.1 837 699 83.5 2,819 2,312 82.0
Oklahoma 235 205 87.2 245 216 88.2 486 431 88.7 215 183 85.1 1,181 1,035 87.6
Oregon 63 55 87.3 95 81 85.3 89 79 88.8 134 117 87.3 381 332 87.1
Pennsylvania 589 498 84.6 472 388 82.2 733 638 87.0 608 483 79.4 2,402 2,007 83.6
Rhode Island 11 9 81.8 11 11 100.0 21 19 90.5 29 26 89.7 72 65 90.3
South Carolina 121 109 90.1 90 84 93.3 212 203 95.8 89 88 98.9 512 484 94.5
South Dakota 34 27 79.4 30 27 90.0 99 96 97.0 16 16 100.0 179 166 92.7
Tennessee 224 183 81.7 416 371 89.2 467 414 88.7 336 283 84.2 1,443 1,251 86.7
Texas 1,286 1,096 85.2 861 746 86.6 1,544 1,398 90.5 959 827 86.2 4,650 4,067 87.5
Utah 93 93 100.0 204 197 96.6 115 111 96.5 27 26 96.3 439 427 97.3
Vermont 1 1 100.0 2 2 100.0 129 127 98.4 3 3 100.0 135 133 98.5
Virgin Islands 2 1 50.0 2 0 0.0 4 1 25.0
Virginia 271 203 74.9 310 245 79.0 501 412 82.2 222 167 75.2 1,304 1,027 78.8
Washington 93 89 95.7 101 91 90.1 226 216 95.6 109 104 95.4 529 500 94.5
West Virginia 59 49 83.1 24 20 83.3 286 249 87.1 81 72 88.9 450 390 86.7
Wisconsin 285 278 97.5 357 341 95.5 233 227 97.4 65 60 92.3 940 906 96.4
Wyoming 30 28 93.3 31 31 100.0 71 71 100.0 4 4 100.0 136 134 98.5
Total 10,793 8,915 82.6 10,141 8,437 83.2 17,053 14,769 86.6 9,358 7,505 80.2 47,345 39,626 83.7
®

42 2016 NCLEX® EXAMINATION STATISTICS
National Council of State Boards of Nursing, Inc. (NCSBN) | 2017
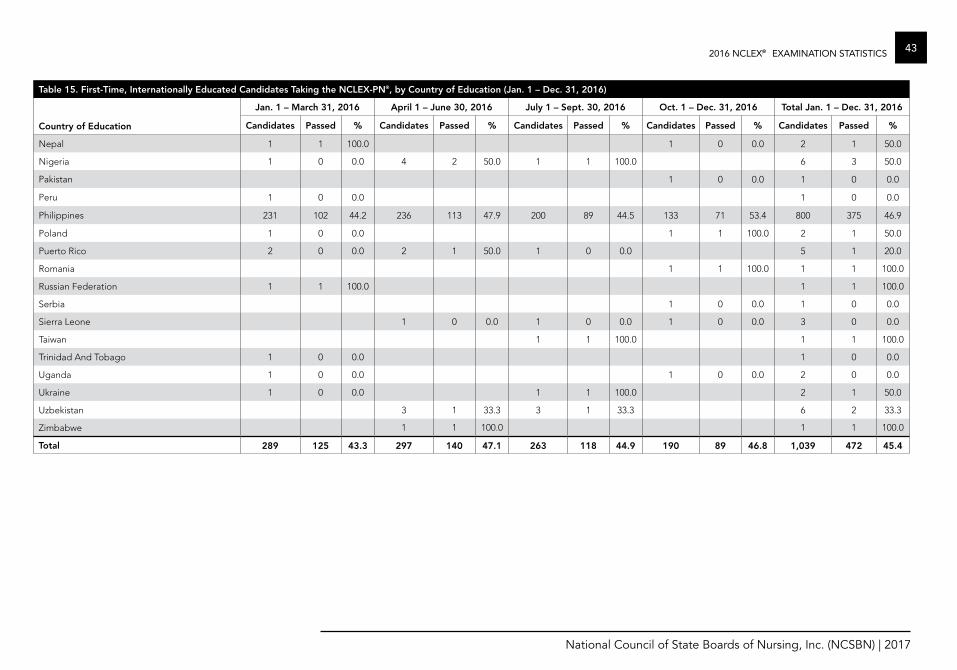
Table 15. First-Time, Internationally Educated Candidates Taking the NCLEX-PN®, by Country of Education (Jan. 1 – Dec. 31, 2016)
Country of Education
Jan. 1 – March 31, 2016 April 1 – June 30, 2016 July 1 – Sept. 30, 2016 Oct. 1 – Dec. 31, 2016 Total Jan. 1 – Dec. 31, 2016
Candidates Passed % Candidates Passed % Candidates Passed % Candidates Passed % Candidates Passed %
Albania 1 0 0.0 1 0 0.0 2 0 0.0
Australia 2 2 100.0 1 1 100.0 1 1 100.0 4 4 100.0
Belize 2 0 0.0 2 0 0.0
Bosnia And Herzegovina 1 1 100.0 1 1 100.0
Brazil 2 1 50.0 2 1 50.0
Cameroon 1 1 100.0 3 2 66.7 1 1 100.0 5 4 80.0
Canada 10 8 80.0 19 13 68.4 15 9 60.0 13 4 30.8 57 34 59.6
Chile 1 1 100.0 1 1 100.0
Cuba 4 0 0.0 5 0 0.0 5 2 40.0 1 0 0.0 15 2 13.3
Ecuador 1 0 0.0 1 0 0.0
Eritrea 1 0 0.0 1 0 0.0
Ethiopia 3 1 33.3 1 0 0.0 1 1 100.0 4 2 50.0 9 4 44.4
Gabon 1 0 0.0 1 0 0.0
Georgia 1 0 0.0 1 0 0.0
Ghana 1 0 0.0 2 1 50.0 3 2 66.7 6 3 50.0
Guyana 1 0 0.0 2 0 0.0 3 0 0.0
India 22 9 40.9 12 5 41.7 20 4 20.0 15 4 26.7 69 22 31.9
Indonesia 1 0 0.0 1 0 0.0 2 0 0.0
Ireland 1 1 100.0 1 1 100.0
Jamaica 1 1 100.0 3 3 100.0 5 0 0.0 9 4 44.4
Japan 1 1 100.0 1 1 100.0
Jordan 1 0 0.0 1 0 0.0
Kenya 1 0 0.0 1 0 0.0
Liberia 1 0 0.0 1 0 0.0
Lithuania 1 0 0.0 1 0 0.0 2 0 0.0
Mexico 1 0 0.0 3 1 33.3 4 1 25.0
Montserrat 1 1 100.0 1 1 100.0
®
432016 NCLEX® EXAMINATION STATISTICS
National Council of State Boards of Nursing, Inc. (NCSBN) | 2017
Table 15. First-Time, Internationally Educated Candidates Taking the NCLEX-PN®, by Country of Education (Jan. 1 – Dec. 31, 2016)
Country of Education
Jan. 1 – March 31, 2016 April 1 – June 30, 2016 July 1 – Sept. 30, 2016 Oct. 1 – Dec. 31, 2016 Total Jan. 1 – Dec. 31, 2016
Candidates Passed % Candidates Passed % Candidates Passed % Candidates Passed % Candidates Passed %
Nepal 1 1 100.0 1 0 0.0 2 1 50.0
Nigeria 1 0 0.0 4 2 50.0 1 1 100.0 6 3 50.0
Pakistan 1 0 0.0 1 0 0.0
Peru 1 0 0.0 1 0 0.0
Philippines 231 102 44.2 236 113 47.9 200 89 44.5 133 71 53.4 800 375 46.9
Poland 1 0 0.0 1 1 100.0 2 1 50.0
Puerto Rico 2 0 0.0 2 1 50.0 1 0 0.0 5 1 20.0
Romania 1 1 100.0 1 1 100.0
Russian Federation 1 1 100.0 1 1 100.0
Serbia 1 0 0.0 1 0 0.0
Sierra Leone 1 0 0.0 1 0 0.0 1 0 0.0 3 0 0.0
Taiwan 1 1 100.0 1 1 100.0
Trinidad And Tobago 1 0 0.0 1 0 0.0
Uganda 1 0 0.0 1 0 0.0 2 0 0.0
Ukraine 1 0 0.0 1 1 100.0 2 1 50.0
Uzbekistan 3 1 33.3 3 1 33.3 6 2 33.3
Zimbabwe 1 1 100.0 1 1 100.0
Total 289 125 43.3 297 140 47.1 263 118 44.9 190 89 46.8 1,039 472 45.4
®

44 2016 NCLEX® EXAMINATION STATISTICS
National Council of State Boards of Nursing, Inc. (NCSBN) | 2017
Figure 13. NCLEX-PN® Pass Rates for First-Time, U.S.-Educated Candidates
*Apr 1994 Computer Adaptive Test (CAT) begins. Passing Standard -0.56 logits. **Oct 1996 Passing Standard changed from -0.56 to -0.51 logits. ***Apr 1999 Passing Standard changed from -0.51 to -0.47 logits. ****Apr 2005 Passing Standard changed from -0.47 to -0.42 logits. *****Apr 2008 Passing Standard changed from -0.42 to -0.37 logits.******Apr 2011 Passing Standard changed from -0.37 to -0.27 logits. *******Apr 2014 Passing Standard changed from -0.27 to -0.21 logits
®
8991 90
8687
84 8684
8788 91
88 8785 84 86 88
84 84 84 81 83
9191
90 88 87 8583 85
8586 88 88 87 86
84 84 85 82 83 83 8180 83
91 92 9290 89
88 88 89 88 91 91 90 90 90 88 88 8987 87 88
84 848788 90
8886 85 84 83 84
87 87 8986 85 84 83
85 86
81 82 8178
81 80
0
20
40
60
80
100P
erc
en
t P
assi
ng
Year AdministeredQ1 Q2 Q3 Q4
452016 NCLEX® EXAMINATION STATISTICS
National Council of State Boards of Nursing, Inc. (NCSBN) | 2017
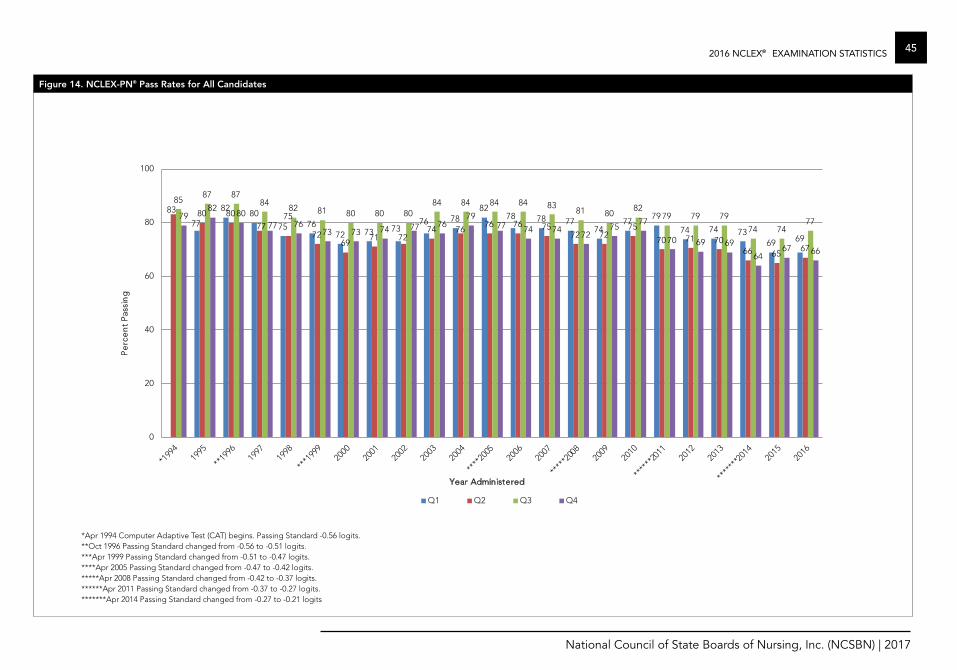
Figure 14. NCLEX-PN® Pass Rates for All Candidates
*Apr 1994 Computer Adaptive Test (CAT) begins. Passing Standard -0.56 logits. **Oct 1996 Passing Standard changed from -0.56 to -0.51 logits. ***Apr 1999 Passing Standard changed from -0.51 to -0.47 logits. ****Apr 2005 Passing Standard changed from -0.47 to -0.42 logits. *****Apr 2008 Passing Standard changed from -0.42 to -0.37 logits.******Apr 2011 Passing Standard changed from -0.37 to -0.27 logits. *******Apr 2014 Passing Standard changed from -0.27 to -0.21 logits
®
77
8280
75 7672 73 73
76 7882
78 78 7774
7779
74 74 7369 69
83 80 80
7775
7269
71 7274 76
76 76 7572 72
75
70 71 7066 65
67
8587 87
8482 81 80 80 80
84 84 84 84 8381 80
8279 79 79
74 7477
7982
8077 76
73 73 74 77 7679
77 74 7472
7577
70 69 69
6467 66
0
20
40
60
80
100
Pe
rce
nt
Pas
sin
g
Year Administered
Q1 Q2 Q3 Q4
46 2016 NCLEX® EXAMINATION STATISTICS
National Council of State Boards of Nursing, Inc. (NCSBN) | 2017
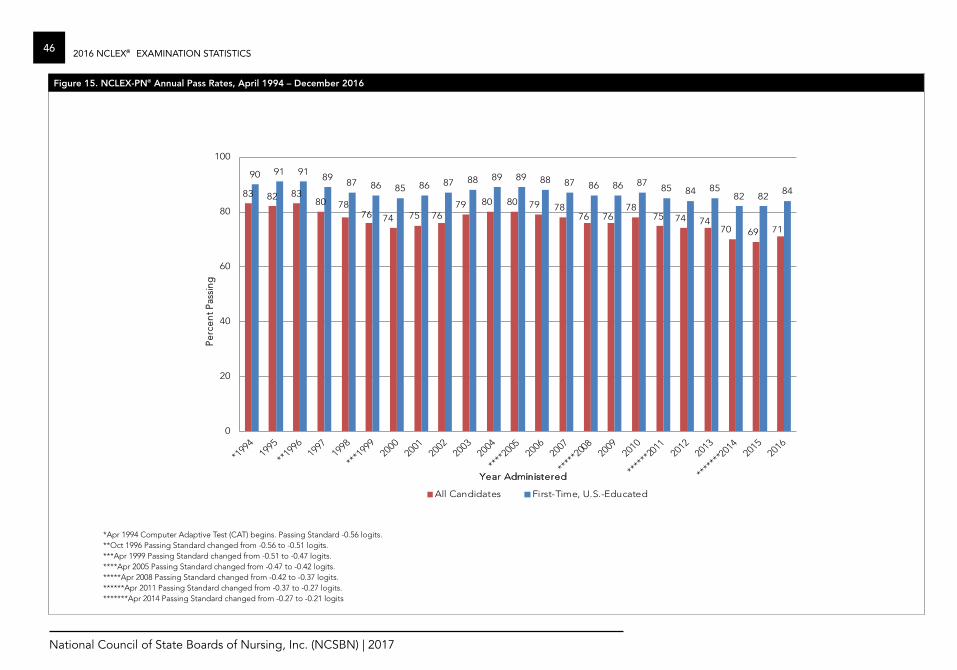
Figure 15. NCLEX-PN® Annual Pass Rates, April 1994 – December 2016
*Apr 1994 Computer Adaptive Test (CAT) begins. Passing Standard -0.56 logits. **Oct 1996 Passing Standard changed from -0.56 to -0.51 logits. ***Apr 1999 Passing Standard changed from -0.51 to -0.47 logits. ****Apr 2005 Passing Standard changed from -0.47 to -0.42 logits. *****Apr 2008 Passing Standard changed from -0.42 to -0.37 logits.******Apr 2011 Passing Standard changed from -0.37 to -0.27 logits. *******Apr 2014 Passing Standard changed from -0.27 to -0.21 logits
®
83 82 8380 78
76 74 75 7679 80 80 79 78
76 7678
75 74 7470 69 71
90 91 9189
87 86 85 86 87 88 89 89 88 87 86 86 8785 84 85
82 8284
0
20
40
60
80
100
Perc
ent P
assi
ng
Year Administered
All Candidates First-Time, U.S.-Educated
472016 NCLEX® EXAMINATION STATISTICS
National Council of State Boards of Nursing, Inc. (NCSBN) | 2017
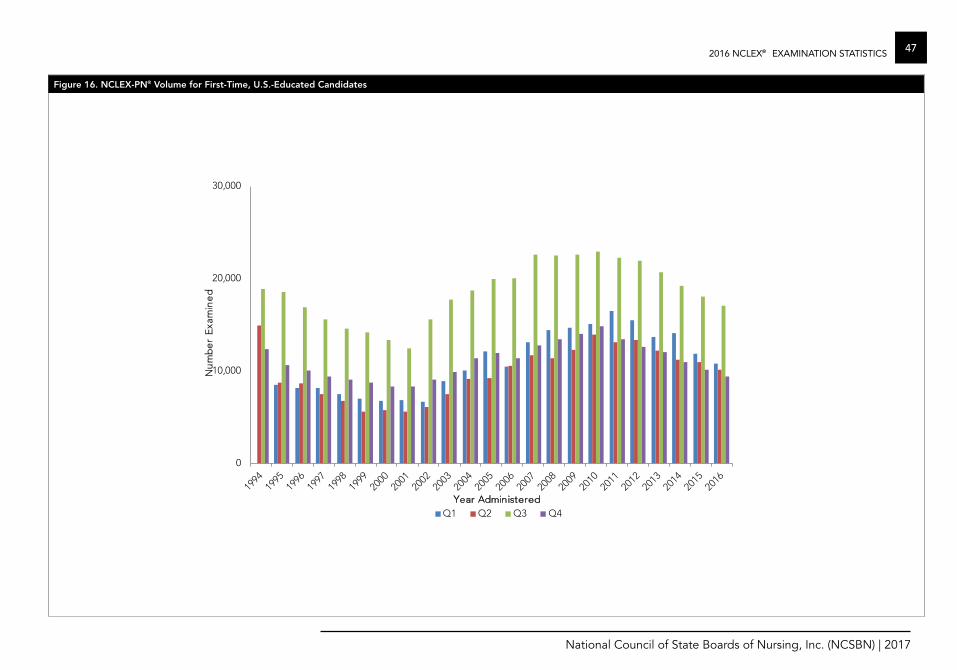
Figure 16. NCLEX-PN® Volume for First-Time, U.S.-Educated Candidates
®
0
10,000
20,000
30,000
Nu
mb
er
Exa
min
ed
Year AdministeredQ1 Q2 Q3 Q4
48 2016 NCLEX® EXAMINATION STATISTICS
National Council of State Boards of Nursing, Inc. (NCSBN) | 2017
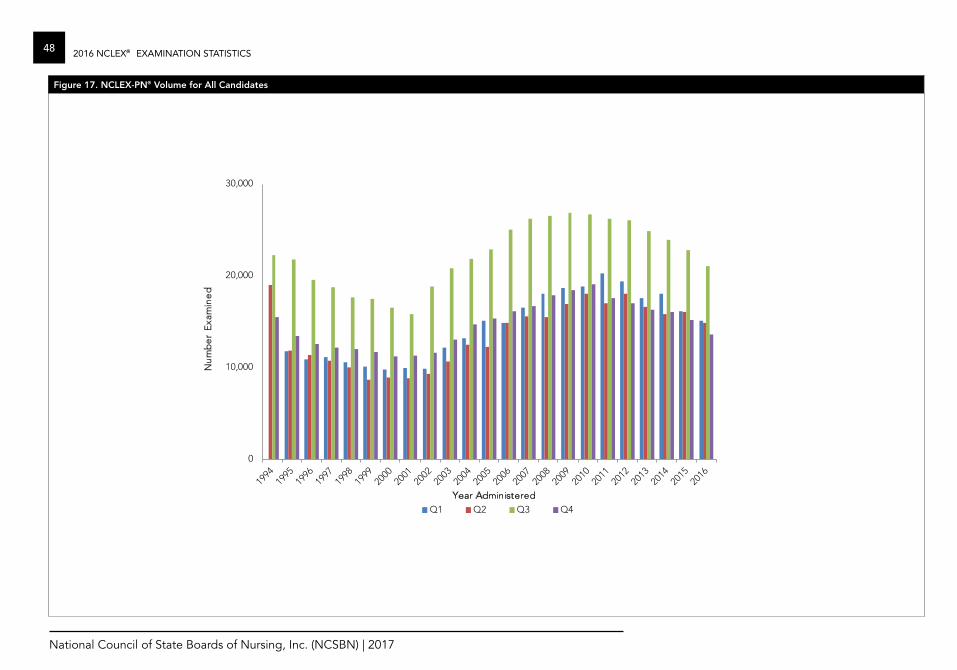
Figure 17. NCLEX-PN® Volume for All Candidates
®
0
10,000
20,000
30,000
Nu
mb
er
Exa
min
ed
Year AdministeredQ1 Q2 Q3 Q4
492016 NCLEX® EXAMINATION STATISTICS
National Council of State Boards of Nursing, Inc. (NCSBN) | 2017
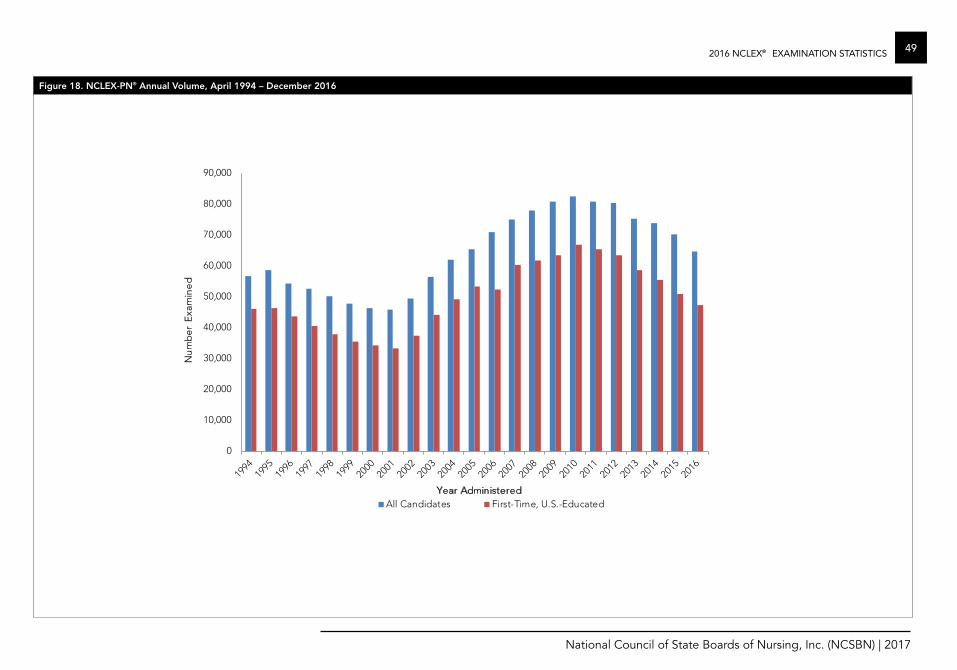
Figure 18. NCLEX-PN® Annual Volume, April 1994 – December 2016
®
0
10,000
20,000
30,000
40,000
50,000
60,000
70,000
80,000
90,000
Nu
mb
er
Exa
min
ed
Year AdministeredAll Candidates First-Time, U.S.-Educated
111 E. Wacker Drive, Suite 2900Chicago, IL 60601-4277312.525.3600312.279.1032 faxwww.ncsbn.org ISBN# 978-0-9903603-6-0