Embed Size (px)
Citation preview

NCSBN RESEARCH BRIEF
Volume 52 | April 2012
REVISED 2010 Nurse Licensee Volume and NCLEX® Examination Statistics

2010 Nurse Licensee Volume
and NCLEX® Examination Statistics
Ada Woo, PhDLindsey GrossWeiwei Liu, MS
National Council of State Boards of Nursing, Inc. (NCSBN®)

Mission Statement
The National Council of State Boards of Nursing (NCSBN®) provides education, service and research through collaborative leadership to promote evidence-based regulatory excellence for patient safety and public protection.
Copyright ©2011 National Council of State Boards of Nursing, Inc. (NCSBN®)
All rights reserved. NCSBN®, NCLEX®, NCLEX-RN®, NCLEX-PN®, NNAAP®, MACE®, Nursys® and TERCAP® are registered trademarks of NCSBN and this document may not be used, reproduced or disseminated to any third party without writ-ten permission from NCSBN.
Permission is granted to boards of nursing to use or reproduce all or parts of this document for licensure related purposes only. Nonprofit education programs have permission to use or reproduce all or parts of this document for educational purposes only. Use or reproduction of this document for commercial or for-profit use is strictly prohibited. Any authorized reproduction of this document shall display the notice: “Copyright by the National Council of State Boards of Nursing, Inc. All rights reserved.” Or, if a portion of the document is reproduced or incorporated in other materials, such written materials shall include the following credit: “Portions copyrighted by the National Council of State Boards of Nursing, Inc. All rights reserved.”
Address inquiries in writing to NCSBN Permissions, 111 E. Wacker Drive, Suite 2900, Chicago, IL 60601-4277. Suggested Citation: National Council of State Boards of Nursing. (2011). 2010 Nurse Licensee Volume and NCLEX® Examination Statistics. Chicago: Author.
Printed in the United States of America
ISBN# 978-0-9826465-8-8
National Council of State Boards of Nursing, Inc. (NCSBN) | 2011
iTABLE OF CONTENTS
TABLe of CoNTeNTS
List of Tables . . . . . . . . . . . . . . . . . . . . . . . . . . . . . . . . . . . . . . . . . . . . . . . . . . . . . . . . . . . . . . . . . ii
List of Figures . . . . . . . . . . . . . . . . . . . . . . . . . . . . . . . . . . . . . . . . . . . . . . . . . . . . . . . . . . . . . . . . iii
Introduction . . . . . . . . . . . . . . . . . . . . . . . . . . . . . . . . . . . . . . . . . . . . . . . . . . . . . . . . . . . . . . . . . . 1
Part I – 2010 Licensure Statistics . . . . . . . . . . . . . . . . . . . . . . . . . . . . . . . . . . . . . . . . . . . . . . . . . 3
Part II – 2010 NCLEX® Examination Statistics . . . . . . . . . . . . . . . . . . . . . . . . . . . . . . . . . . . . . . . 17
National Council of State Boards of Nursing, Inc. (NCSBN) | 2011
ii LIST OF TABLES
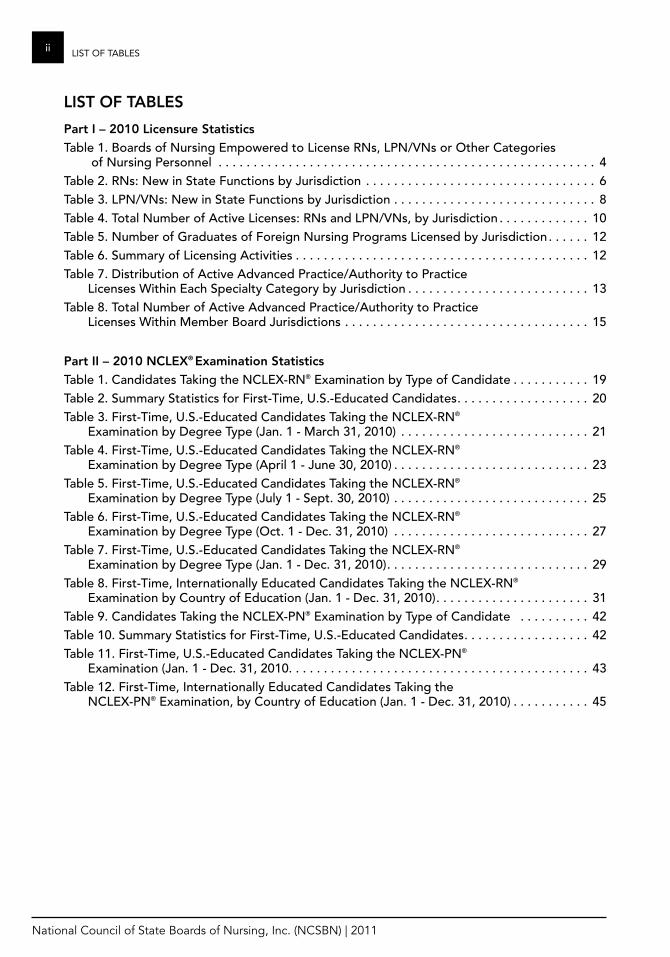
LIST of TABLeS
Part I – 2010 Licensure StatisticsTable 1. Boards of Nursing Empowered to License RNs, LPN/VNs or Other Categories
of Nursing Personnel . . . . . . . . . . . . . . . . . . . . . . . . . . . . . . . . . . . . . . . . . . . . . . . . . . . . . . 4Table 2. RNs: New in State Functions by Jurisdiction . . . . . . . . . . . . . . . . . . . . . . . . . . . . . . . . . 6Table 3. LPN/VNs: New in State Functions by Jurisdiction . . . . . . . . . . . . . . . . . . . . . . . . . . . . . 8Table 4. Total Number of Active Licenses: RNs and LPN/VNs, by Jurisdiction . . . . . . . . . . . . . 10Table 5. Number of Graduates of Foreign Nursing Programs Licensed by Jurisdiction . . . . . . 12Table 6. Summary of Licensing Activities . . . . . . . . . . . . . . . . . . . . . . . . . . . . . . . . . . . . . . . . . . 12Table 7. Distribution of Active Advanced Practice/Authority to Practice
Licenses Within Each Specialty Category by Jurisdiction . . . . . . . . . . . . . . . . . . . . . . . . . . 13Table 8. Total Number of Active Advanced Practice/Authority to Practice
Licenses Within Member Board Jurisdictions . . . . . . . . . . . . . . . . . . . . . . . . . . . . . . . . . . . 15
Part II – 2010 NCLeX® examination StatisticsTable 1. Candidates Taking the NCLEX-RN® Examination by Type of Candidate . . . . . . . . . . . 19Table 2. Summary Statistics for First-Time, U.S.-Educated Candidates . . . . . . . . . . . . . . . . . . . 20Table 3. First-Time, U.S.-Educated Candidates Taking the NCLEX-RN®
Examination by Degree Type (Jan. 1 - March 31, 2010) . . . . . . . . . . . . . . . . . . . . . . . . . . . 21Table 4. First-Time, U.S.-Educated Candidates Taking the NCLEX-RN®
Examination by Degree Type (April 1 - June 30, 2010) . . . . . . . . . . . . . . . . . . . . . . . . . . . . 23Table 5. First-Time, U.S.-Educated Candidates Taking the NCLEX-RN®
Examination by Degree Type (July 1 - Sept. 30, 2010) . . . . . . . . . . . . . . . . . . . . . . . . . . . . 25Table 6. First-Time, U.S.-Educated Candidates Taking the NCLEX-RN®
Examination by Degree Type (Oct. 1 - Dec. 31, 2010) . . . . . . . . . . . . . . . . . . . . . . . . . . . . 27Table 7. First-Time, U.S.-Educated Candidates Taking the NCLEX-RN®
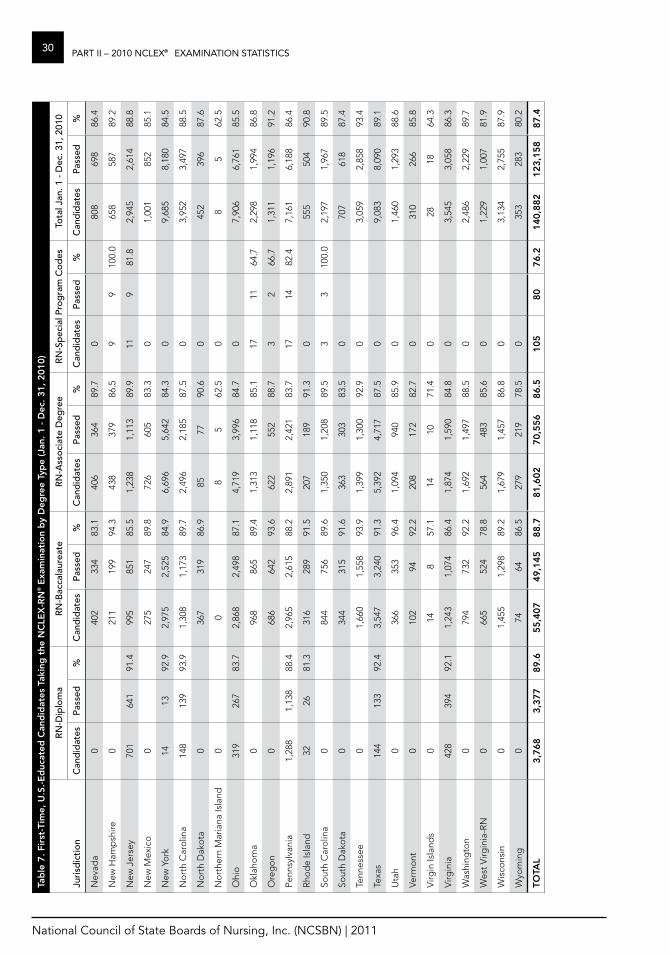
Examination by Degree Type (Jan. 1 - Dec. 31, 2010) . . . . . . . . . . . . . . . . . . . . . . . . . . . . . 29Table 8. First-Time, Internationally Educated Candidates Taking the NCLEX-RN®
Examination by Country of Education (Jan. 1 - Dec. 31, 2010) . . . . . . . . . . . . . . . . . . . . . . 31Table 9. Candidates Taking the NCLEX-PN® Examination by Type of Candidate . . . . . . . . . . 42Table 10. Summary Statistics for First-Time, U.S.-Educated Candidates . . . . . . . . . . . . . . . . . . 42Table 11. First-Time, U.S.-Educated Candidates Taking the NCLEX-PN®
Examination (Jan. 1 - Dec. 31, 2010. . . . . . . . . . . . . . . . . . . . . . . . . . . . . . . . . . . . . . . . . . . 43Table 12. First-Time, Internationally Educated Candidates Taking the
NCLEX-PN® Examination, by Country of Education (Jan. 1 - Dec. 31, 2010) . . . . . . . . . . . 45
National Council of State Boards of Nursing, Inc. (NCSBN) | 2011
iiiLIST OF FIGURES
LIST of fIGureS
Part I – 2010 Licensure StatisticsFigure 1. Total Number of Active Licenses: RNs and LPN/VNs - 2000-2010 . . . . . . . . . . . . . . . 16
Part II – 2010 NCLeX® examination StatisticsFigure 1. NCLEX-RN® Pass Rates for First-Time, U.S.-Educated Candidates . . . . . . . . . . . . . . 36Figure 2. NCLEX-RN® Pass Rates for All Candidates . . . . . . . . . . . . . . . . . . . . . . . . . . . . . . . . . 37Figure 3. NCLEX-RN® Annual Pass Rates, April 1994 - December 2010 . . . . . . . . . . . . . . . . . . 38Figure 4. NCLEX-RN® Volume for First-Time, U.S.-Educated Candidates . . . . . . . . . . . . . . . . . 39Figure 5. NCLEX-RN® Volume for All Candidates . . . . . . . . . . . . . . . . . . . . . . . . . . . . . . . . . . . 40Figure 6. NCLEX-RN® Annual Volume, April 1994 - December 2010 . . . . . . . . . . . . . . . . . . . . 41Figure 7. NCLEX-PN® Pass Rates for First-Time, U.S.-Educated Candidates . . . . . . . . . . . . . . 48Figure 8. NCLEX-PN® Pass Rates for All Candidates . . . . . . . . . . . . . . . . . . . . . . . . . . . . . . . . . 49Figure 9. NCLEX-PN® Annual Pass Rates, April 1994 - December 2010 . . . . . . . . . . . . . . . . . . 50Figure 10. NCLEX-PN® Volume for First-Time, U.S.-Educated Candidates . . . . . . . . . . . . . . . . 51Figure 11. NCLEX-PN® Volume for All Candidates . . . . . . . . . . . . . . . . . . . . . . . . . . . . . . . . . . 52Figure 12. NCLEX-PN® Annual Volume, April 1994 - December 2010 . . . . . . . . . . . . . . . . . . . 53

National Council of State Boards of Nursing, Inc. (NCSBN) | 2011
iv LIST OF TABLES

National Council of State Boards of Nursing, Inc. (NCSBN) | 2011
1INTRODUCTION
INTroDuCTIoNThe mission of the National Council of State Boards of Nursing (NCSBN®) is to provide leadership to advance regulatory excellence by assisting member boards, collectively and individually, and to promote safe and effective nursing practice in the interest of protecting public health and welfare.
NCSBN serves as a consultant, liaison, advocate and researcher to its members, and as an educational and informational resource to policy makers and the general public. This publication provides statistics on the licensing activities of NCSBN’s member boards and its two licensure examinations, the National Council Licensure Examination for Practical Nurses (NCLEX-PN®) and the National Council Licensure Examination for Registered Nurses (NCLEX-RN®).
Part I – Licensure Statistics
The data reported in Part I of this document include licensing statistics of the 60 state and territorial boards of nursing. The numbers of new licenses by endorsement and examination, as well as the total number of active licenses, are provided for each jurisdiction.
The data included in this publication provide licens-ing statistics for the period July 1, 2009, to June 30, 2010.
Part II – NCLeX® examination Statistics
The NCLEX-RN and NCLEX-PN examinations are administered on behalf of 59 of the 60 NCSBN member boards (excluding the Nebraska Advanced Practice Registered Nurse Board, which is not responsible for administering entry-level nurse licensure). The purpose of these examinations is to determine if a candidate possesses the minimum knowledge and abilities to provide entry-level nurs-ing care that is safe and effective.
Candidate performance on the NCLEX-RN and NCLEX-PN is summarized and reported by quar-ter and year. This publication provides a detailed breakdown of candidate performance for 2010, as well as historical data.

National Council of State Boards of Nursing, Inc. (NCSBN) | 2011
2 INTRODUCTION
National Council of State Boards of Nursing, Inc. (NCSBN) | 2011
3PART I – 2010 LICENSURE STATISTICS
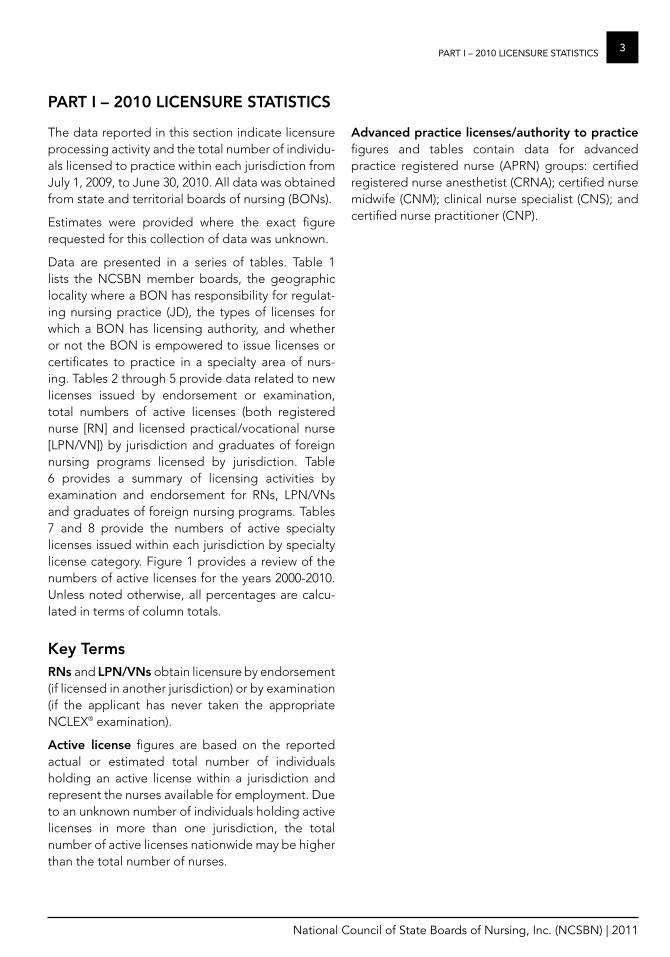
The data reported in this section indicate licensure processing activity and the total number of individu-als licensed to practice within each jurisdiction from July 1, 2009, to June 30, 2010. All data was obtained from state and territorial boards of nursing (BONs).
Estimates were provided where the exact figure requested for this collection of data was unknown.
Data are presented in a series of tables. Table 1 lists the NCSBN member boards, the geographic locality where a BON has responsibility for regulat-ing nursing practice (JD), the types of licenses for which a BON has licensing authority, and whether or not the BON is empowered to issue licenses or certificates to practice in a specialty area of nurs-ing. Tables 2 through 5 provide data related to new licenses issued by endorsement or examination, total numbers of active licenses (both registered nurse [RN] and licensed practical/vocational nurse [LPN/VN]) by jurisdiction and graduates of foreign nursing programs licensed by jurisdiction. Table 6 provides a summary of licensing activities by examination and endorsement for RNs, LPN/VNs and graduates of foreign nursing programs. Tables 7 and 8 provide the numbers of active specialty licenses issued within each jurisdiction by specialty license category. Figure 1 provides a review of the numbers of active licenses for the years 2000-2010. Unless noted otherwise, all percentages are calcu-lated in terms of column totals.
Key TermsrNs and LPN/VNs obtain licensure by endorsement (if licensed in another jurisdiction) or by examination (if the applicant has never taken the appropriate NCLEX® examination).
Active license figures are based on the reported actual or estimated total number of individuals holding an active license within a jurisdiction and represent the nurses available for employment. Due to an unknown number of individuals holding active licenses in more than one jurisdiction, the total number of active licenses nationwide may be higher than the total number of nurses.
Advanced practice licenses/authority to practice figures and tables contain data for advanced practice registered nurse (APRN) groups: certified registered nurse anesthetist (CRNA); certified nurse midwife (CNM); clinical nurse specialist (CNS); and certified nurse practitioner (CNP).
PArT I – 2010 LICeNSure STATISTICS

National Council of State Boards of Nursing, Inc. (NCSBN) | 2011
4 PART I – 2010 LICENSURE STATISTICS
Table 1. Boards of Nursing empowered to License rNs, LPN/VNs or other Categories of Nursing Personnel
JD BoN rN LPN/VNother Specialty
Groups
AK Alaska Board of Nursing YES YES YES
AL Alabama Board of Nursing YES YES YES
AR Arkansas State Board of Nursing YES YES YES
AS American Samoa Health Service Regulatory Board YES YES YES
AZ Arizona State Board of Nursing YES YES YES
CA-RN California Board of Registered Nursing YES NO YES
CA-VN California Board of Vocational Nurse and Psychiatric Technician Examiners NO YES NO
CO Colorado Board of Nursing YES YES YES
CT Connecticut Board of Examiners for Nursing YES YES YES
DC District of Columbia Board of Nursing YES YES YES
DE Delaware Board of Nursing YES YES YES
FL Florida Board of Nursing YES YES YES
GA-PN Georgia State Board of Licensed Practical Nurses NO YES NO
GA-RN Georgia Board of Nursing YES NO YES
GU Guam Board of Nurse Examiners YES YES YES
HI Hawaii Board of Nursing Professional and Vocational Licensing Division YES YES YES
IA Iowa Board of Nursing YES YES YES
ID Idaho Board of Nursing YES YES YES
IL Illinois Department of Professional Regulation YES YES YES
IN Indiana State Board of Nursing YES YES YES
KS Kansas State Board of Nursing YES YES YES
KY Kentucky Board of Nursing YES YES YES
LA-PN Louisiana State Board of Practical Nurse Examiners NO YES NO
LA-RN Louisiana State Board of Nursing YES NO YES
MA Massachusetts Board of Registration in Nursing YES YES YES
MD Maryland Board of Nursing YES YES YES
ME Maine State Board of Nursing YES YES YES
MI Michigan CIS/Bureau of Health Services YES YES YES
MN Minnesota Board of Nursing YES YES YES
MO Missouri State Board of Nursing YES YES YES
MP Northern Mariana Islands Commonwealth Board of Nurse Examiners YES YES YES
MS Mississippi Board of Nursing YES YES YES
MT Montana State Board of Nursing YES YES YES
NC North Carolina Board of Nursing YES YES YES
ND North Dakota Board of Nursing YES YES YES
NE Nebraska Health and Human Services System YES YES YES
NE-AP Nebraska Advanced Practice Registered Nurse Board NO NO YES
NH New Hampshire Board of Nursing YES YES YES
NJ New Jersey Board of Nursing YES YES YES
NM New Mexico Board of Nursing YES YES YES
NV Nevada State Board of Nursing YES YES YES
NY New York State Board for Nursing YES YES YES
OH Ohio Board of Nursing YES YES YES

National Council of State Boards of Nursing, Inc. (NCSBN) | 2011
5PART I – 2010 LICENSURE STATISTICS
Table 1. Boards of Nursing empowered to License rNs, LPN/VNs or other Categories of Nursing Personnel
JD BoN rN LPN/VNother Specialty
Groups
OK Oklahoma Board of Nursing YES YES YES
OR Oregon State Board of Nursing YES YES YES
PA Pennsylvania State Board of Nursing YES YES YES
RI Rhode Island Board of Nurse Registration and Nursing Education YES YES YES
SC South Carolina State Board of Nursing YES YES YES
SD South Dakota Board of Nursing YES YES YES
TN Tennessee State Board of Nursing YES YES YES
TX Texas Board of Nurse Examiners YES YES YES
UT Utah State Board of Nursing YES YES YES
VA Virginia Board of Nursing YES YES YES
VI Virgin Islands Board of Nurse Licensure YES YES YES
VT Vermont State Board of Nursing YES YES YES
WA Washington State Nursing Care Quality Assurance Commission YES YES YES
WI Wisconsin Department of Regulation and Licensing YES YES YES
WV-PN West Virginia State Board of Examiners for Licensed Practical Nurses NO YES NO
WV-RN West Virginia Board of Examiners for Registered Professional Nurses YES NO YES
WY Wyoming State Board of Nursing YES YES YES

National Council of State Boards of Nursing, Inc. (NCSBN) | 2011
6 PART I – 2010 LICENSURE STATISTICS
Table 2. rNs: New in State functions by Jurisdiction
JD
examination endorsement Total New in State
N % N % N %
AK 245 0.20 1,087 1.23 1,332 0.62
AL 3,526 2.88 1,420 1.61 4,946 2.30
AR 1,590 1.30 931 1.06 2,521 1.17
AS 3 0.00 5 0.01 8 0.00
AZ 3,096 2.53 2,562 2.91 5,658 2.63
CA-RN 15,097 12.31 8,272 9.40 23,369 10.86
CO 4,635 2.15
CT 1,503 1.23 1,387 1.58 2,890 1.34
DC 365 0.30 2,846 3.23 3,211 1.49
DE 474 0.39 792 0.90 1,266 0.59
FL 5,526 4.51 6,946 7.89 12,472 5.79
GA 3,654 2.98 2,845 3.23 6,499 3.02
GU 30 0.02 169 0.19 199 0.09
IA 1,755 1.43 1,080 1.23 2,835 1.32
ID 662 0.54 848 0.96 1,510 0.70
IL 4,584 3.74 1,778 2.02 6,400 2.97
KS 1,728 1.41 1,431 1.63 3,159 1.47
KY 2,451 2.00 1,112 1.26 3,563 1.66
LA-RN 2,555 2.08 1,248 1.42 3,803 1.77
MA 3,350 2.73 1,719 1.95 5,069 2.35
ME 519 0.42 768 0.87 1,287 0.60
MI 4,830 3.94 1,419 1.61 6,249 2.90
MN 3,315 2.70 2,724 3.09 6,039 2.81
MO 3,519 2.87 2,283 2.59 5,802 2.70
MS 1,082 0.88 460 0.52 1,542 0.72
MT 475 0.39 940 1.07 1,415 0.66
NC 4,418 3.60 2,996 3.40 7,414 3.44
ND 601 0.49 550 0.62 1,151 0.53
NE 978 0.80 710 0.81 1,688 0.78
NH 589 0.48 945 1.07 1,534 0.71
NJ 2,967 2.42 2,832 3.22 5,799 2.69
NM 1,673 1.36 470 0.53 2,143 1.00
NV 861 0.70 2,438 2.77 3,299 1.53
OH 8,094 6.60 2,379 2.70 10,473 4.86
OK 1,920 1.57 1,511 1.72 3,431 1.59
OR 1,463 1.19 1,828 2.08 3,291 1.53
PA 7,037 5.74 3,720 4.23 10,757 5.00
RI 418 0.34 635 0.72 1,053 0.49
TN 3,244 2.65 2,283 2.59 5,527 2.57
TX 9,702 7.91 6,705 7.62 16,407 7.62
VA 3,515 2.87 2,459 2.79 5,974 2.77
VT 2,073 1.69 903 1.03 2,976 1.38
National Council of State Boards of Nursing, Inc. (NCSBN) | 2011
7PART I – 2010 LICENSURE STATISTICS
Table 2. rNs: New in State functions by Jurisdiction
JD
examination endorsement Total New in State
N % N % N %
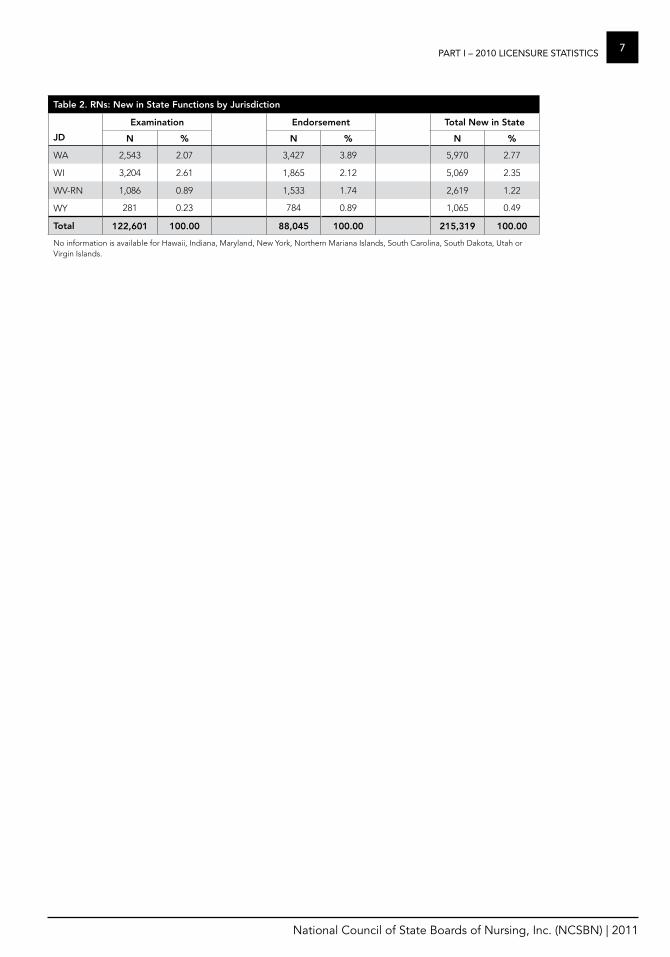
WA 2,543 2.07 3,427 3.89 5,970 2.77
WI 3,204 2.61 1,865 2.12 5,069 2.35
WV-RN 1,086 0.89 1,533 1.74 2,619 1.22
WY 281 0.23 784 0.89 1,065 0.49
Total 122,601 100.00 88,045 100.00 215,319 100.00
No information is available for Hawaii, Indiana, Maryland, New York, Northern Mariana Islands, South Carolina, South Dakota, Utah or Virgin Islands.
National Council of State Boards of Nursing, Inc. (NCSBN) | 2011
8 PART I – 2010 LICENSURE STATISTICS
Table 3. LPN/VNs: New in State functions by Jurisdiction
JD
examination endorsement Total New in State
N % N % N %
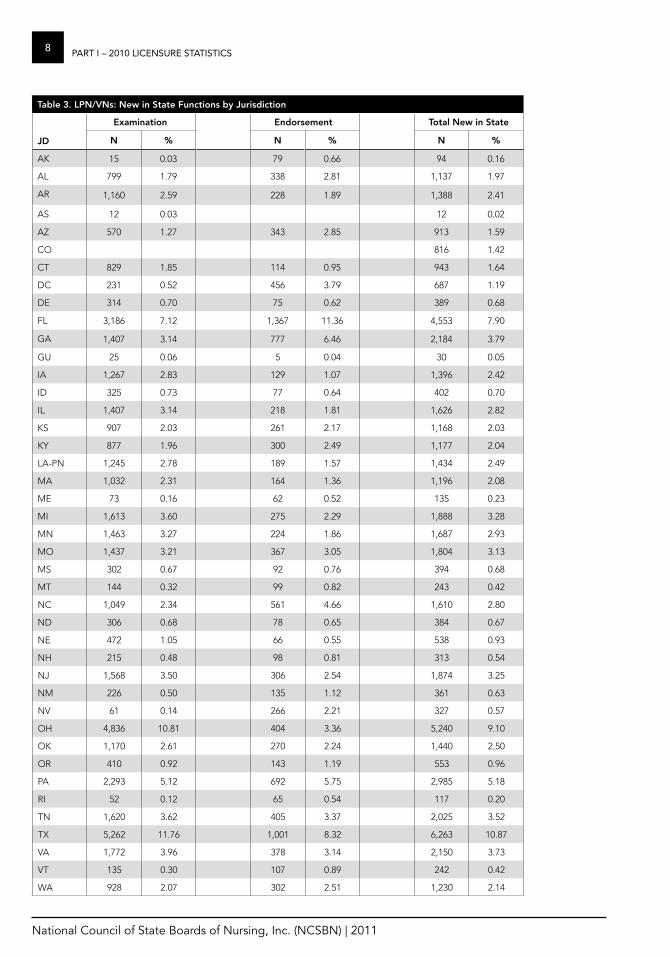
AK 15 0.03 79 0.66 94 0.16
AL 799 1.79 338 2.81 1,137 1.97
AR 1,160 2.59 228 1.89 1,388 2.41
AS 12 0.03 12 0.02
AZ 570 1.27 343 2.85 913 1.59
CO 816 1.42
CT 829 1.85 114 0.95 943 1.64
DC 231 0.52 456 3.79 687 1.19
DE 314 0.70 75 0.62 389 0.68
FL 3,186 7.12 1,367 11.36 4,553 7.90
GA 1,407 3.14 777 6.46 2,184 3.79
GU 25 0.06 5 0.04 30 0.05
IA 1,267 2.83 129 1.07 1,396 2.42
ID 325 0.73 77 0.64 402 0.70
IL 1,407 3.14 218 1.81 1,626 2.82
KS 907 2.03 261 2.17 1,168 2.03
KY 877 1.96 300 2.49 1,177 2.04
LA-PN 1,245 2.78 189 1.57 1,434 2.49
MA 1,032 2.31 164 1.36 1,196 2.08
ME 73 0.16 62 0.52 135 0.23
MI 1,613 3.60 275 2.29 1,888 3.28
MN 1,463 3.27 224 1.86 1,687 2.93
MO 1,437 3.21 367 3.05 1,804 3.13
MS 302 0.67 92 0.76 394 0.68
MT 144 0.32 99 0.82 243 0.42
NC 1,049 2.34 561 4.66 1,610 2.80
ND 306 0.68 78 0.65 384 0.67
NE 472 1.05 66 0.55 538 0.93
NH 215 0.48 98 0.81 313 0.54
NJ 1,568 3.50 306 2.54 1,874 3.25
NM 226 0.50 135 1.12 361 0.63
NV 61 0.14 266 2.21 327 0.57
OH 4,836 10.81 404 3.36 5,240 9.10
OK 1,170 2.61 270 2.24 1,440 2.50
OR 410 0.92 143 1.19 553 0.96
PA 2,293 5.12 692 5.75 2,985 5.18
RI 52 0.12 65 0.54 117 0.20
TN 1,620 3.62 405 3.37 2,025 3.52
TX 5,262 11.76 1,001 8.32 6,263 10.87
VA 1,772 3.96 378 3.14 2,150 3.73
VT 135 0.30 107 0.89 242 0.42
WA 928 2.07 302 2.51 1,230 2.14

National Council of State Boards of Nursing, Inc. (NCSBN) | 2011
9PART I – 2010 LICENSURE STATISTICS
Table 3. LPN/VNs: New in State functions by Jurisdiction
JD
examination endorsement Total New in State
N % N % N %
WI 1,193 2.67 180 1.50 1,373 2.38
WV-PN 414 0.93 268 2.23 682 1.18
WY 132 0.29 68 0.57 200 0.35
Total 44,754 100.00% 12,032 100.00% 57,603 100.00%
No information is available for California-VN, Hawaii, Indiana, Maryland, New York, Northern Mariana Islands, South Carolina, South Dakota, Utah or Virgin Islands.
National Council of State Boards of Nursing, Inc. (NCSBN) | 2011
10 PART I – 2010 LICENSURE STATISTICS
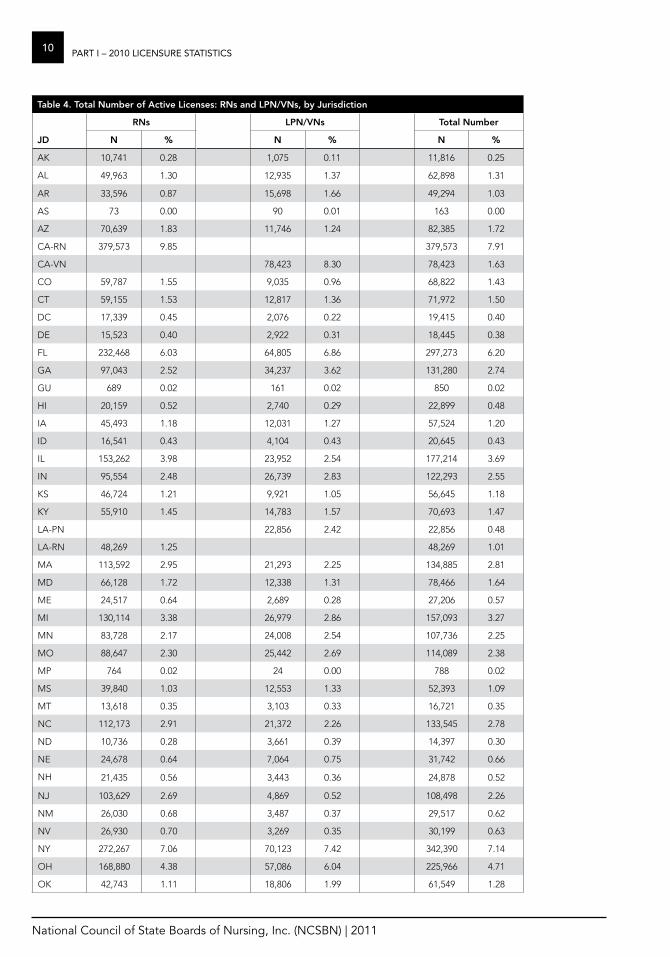
Table 4. Total Number of Active Licenses: rNs and LPN/VNs, by Jurisdiction
rNs LPN/VNs Total Number
JD N % N % N %
AK 10,741 0.28 1,075 0.11 11,816 0.25
AL 49,963 1.30 12,935 1.37 62,898 1.31
AR 33,596 0.87 15,698 1.66 49,294 1.03
AS 73 0.00 90 0.01 163 0.00
AZ 70,639 1.83 11,746 1.24 82,385 1.72
CA-RN 379,573 9.85 379,573 7.91
CA-VN 78,423 8.30 78,423 1.63
CO 59,787 1.55 9,035 0.96 68,822 1.43
CT 59,155 1.53 12,817 1.36 71,972 1.50
DC 17,339 0.45 2,076 0.22 19,415 0.40
DE 15,523 0.40 2,922 0.31 18,445 0.38
FL 232,468 6.03 64,805 6.86 297,273 6.20
GA 97,043 2.52 34,237 3.62 131,280 2.74
GU 689 0.02 161 0.02 850 0.02
HI 20,159 0.52 2,740 0.29 22,899 0.48
IA 45,493 1.18 12,031 1.27 57,524 1.20
ID 16,541 0.43 4,104 0.43 20,645 0.43
IL 153,262 3.98 23,952 2.54 177,214 3.69
IN 95,554 2.48 26,739 2.83 122,293 2.55
KS 46,724 1.21 9,921 1.05 56,645 1.18
KY 55,910 1.45 14,783 1.57 70,693 1.47
LA-PN 22,856 2.42 22,856 0.48
LA-RN 48,269 1.25 48,269 1.01
MA 113,592 2.95 21,293 2.25 134,885 2.81
MD 66,128 1.72 12,338 1.31 78,466 1.64
ME 24,517 0.64 2,689 0.28 27,206 0.57
MI 130,114 3.38 26,979 2.86 157,093 3.27
MN 83,728 2.17 24,008 2.54 107,736 2.25
MO 88,647 2.30 25,442 2.69 114,089 2.38
MP 764 0.02 24 0.00 788 0.02
MS 39,840 1.03 12,553 1.33 52,393 1.09
MT 13,618 0.35 3,103 0.33 16,721 0.35
NC 112,173 2.91 21,372 2.26 133,545 2.78
ND 10,736 0.28 3,661 0.39 14,397 0.30
NE 24,678 0.64 7,064 0.75 31,742 0.66
NH 21,435 0.56 3,443 0.36 24,878 0.52
NJ 103,629 2.69 4,869 0.52 108,498 2.26
NM 26,030 0.68 3,487 0.37 29,517 0.62
NV 26,930 0.70 3,269 0.35 30,199 0.63
NY 272,267 7.06 70,123 7.42 342,390 7.14
OH 168,880 4.38 57,086 6.04 225,966 4.71
OK 42,743 1.11 18,806 1.99 61,549 1.28

National Council of State Boards of Nursing, Inc. (NCSBN) | 2011
11PART I – 2010 LICENSURE STATISTICS
Table 4. Total Number of Active Licenses: rNs and LPN/VNs, by Jurisdiction
rNs LPN/VNs Total Number
JD N % N % N %
OR 45,715 1.19 4,091 0.43 49,806 1.04
PA 208,313 5.41 58,455 6.19 266,768 5.56
RI 16,749 0.43 2,058 0.22 18,807 0.39
SC 49,352 1.28 11,971 1.27 61,323 1.28
SD 12,636 0.33 2,227 0.24 14,863 0.31
TN 80,237 2.08 29,276 3.10 109,513 2.28
TX 229,798 5.96 90,905 9.62 320,703 6.68
UT 21,950 0.57 3,411 0.36 25,361 0.53
VA 95,529 2.48 31,557 3.34 127,086 2.65
VI 640 0.02 281 0.03 921 0.02
VT 10,322 0.27 2,178 0.23 12,500 0.26
WA 82,551 2.14 14,310 1.52 96,861 2.02
WI 83,806 2.17 83,806 1.75
WV-PN 7,554 0.80 7,554 0.16
WV-RN 28,218 0.73 28,218 0.59
WY 9,104 0.24 1,459 0.15 10,563 0.22
Total 3,853,870 100.00% 944,488 100.00% 4,798,3581 100.00%
1 Includes 260,145 total number of active licenses reported in 2009 for California-VN, Maryland, Northern Mariana Islands, South Carolina, South Dakota, Utah and Virgin Islands.

National Council of State Boards of Nursing, Inc. (NCSBN) | 2011
12 PART I – 2010 LICENSURE STATISTICS
Table 5. Number of Graduates of foreign Nursing Programs Licensed by Jurisdiction
JD
rN Graduates of foreign Nursing
Programs
LPN/VN Graduates of foreign Nursing
Programs
AL 3
AR 39
AS 5
AZ 70
CA-RN 4,356
CT 99 9
GA 24
GU 68
IA 1 1
ID 18 1
KY 13
LA-RN 22
ME 5
MN 270 7
MO 44 2
MT 12 12
NC 188 11
ND 12 1
NH 2
NJ 70
NM 725
NV 5 119
OK 31
OR 49 5
PA 167 7
RI 8
TX 1,539 49
VT 1,815
WV-PN 15
WV-RN 3
Total 9,663 239
Information provided by 29 jurisdictions
Table 6. Summary of Licensing Activities
New In State
RNs 215,319
LPN/VNs 57,603
Total 272,922
Active Licenses1
RNs 3,853,870
LPN/VNs 944,488
Total 4,798,358
Graduates of foreign Nursing Program2
RNs 9,663
LPN/VNs 239
Total 9,902
1 Includes 260,145 total number of active licenses reported in 2009 for California-VN, Maryland, Northern Mariana Islands, South Carolina, South Dakota, Utah and Virgin Islands.
2 Information provided by 29 jurisdictions.

National Council of State Boards of Nursing, Inc. (NCSBN) | 2011
13PART I – 2010 LICENSURE STATISTICS Ta
ble
7. D
istr
ibut
ion
of
Act
ive
Ad
vanc
ed P
ract
ice/
Aut
hori
ty t
o P
ract
ice
Lice
nses
Wit
hin
eac
h Sp
ecia
lty
Cat
ego
ry b
y Ju
risd
icti
on
JD
CN
S
APrN No Specific
Category Designation
CNP No Specialty Designation
Typ
es o
f N
urse
Pra
ctit
ione
rs
All CNPs
Total Active Licenses
CNM
CrNA
CNS
CNS-PSYCH
CNS NoN-PSYCH
AC
AH
CHP
CoL
eMr
fAM
fPN
Ger
Neo
WoM
PSY
SCH
other TypesN
NN
NN
NN
NN
NN
NN
NN
NN
NN
N
AK
7315
170
516
4438
427
818
6569
11,
615
AL
161,
370
124
3,03
44,
544
AR
2770
721
113
107
5912
2
60
1
7224
101
27
1,98
1
AS
1
1
1
1
4
AZ
205
572
4413
1
63
454
254
1,55
8
7015
218
417
4
3,86
1
CA
-RN
1,18
62,
008
436
2,52
6
6,58
061
094
883
150
5,10
429
514
480
015
083
21,7
51
CO
703
507
308
2,88
74,
405
CT
215
3,42
43,
639
DC
3875
3648
263
1
DE
3031
040
80
14
8510
1
32
21
3132
66
7
1,06
5
FL46
51,
844
578
2,18
73,
094
347
1,45
364
3
342,
959
21
218
631
219
810
770
14,7
97
GA
376
1,63
724
5
4,
126
6,38
4
GU
712
1
6
3
29
IA87
462
9849
112
181
729
4826
144
541
21,
993
ID31
364
40
58
8
1,
023
IL6,
608
6,60
8
IN13
7
3,02
6
3,16
3
KS
6983
816
945
372
193
160
51,
136
237
141
9766
43,
442
KY
981,
245
1714
1
11
326
014
5
1,
646
12
2819
330
3,
928
LA-R
N37
1,31
068
205
113
261
113
1
1,18
4
2015
998
58
3,62
7
MA
466
1,10
296
8
6,
200
8,73
6
ME
8241
011
722
1115
761
568
215
1461
130
9
1,65
9
MI
312
2,38
83,
810
6,51
0
MN
217
1,57
624
226
9
43
452
347
1,11
6
14
822
563
30
85,
006
MO
107
1,61
52
403
9063
148
21,
844
8120
827
760
175,
817

National Council of State Boards of Nursing, Inc. (NCSBN) | 2011
14 PART I – 2010 LICENSURE STATISTICSTa
ble
7. D
istr
ibut
ion
of
Act
ive
Ad
vanc
ed P
ract
ice/
Aut
hori
ty t
o P
ract
ice
Lice
nses
Wit
hin
eac
h Sp
ecia
lty
Cat
ego
ry b
y Ju
risd
icti
on
JD
CN
S
APrN No Specific
Category Designation
CNP No Specialty Designation
Typ
es o
f N
urse
Pra
ctit
ione
rs
All CNPs
Total Active Licenses
CNM
CrNA
CNS
CNS-PSYCH
CNS NoN-PSYCH
AC
AH
CHP
CoL
eMr
fAM
fPN
Ger
Neo
WoM
PSY
SCH
other Types
NN
NN
NN
NN
NN
NN
NN
NN
NN
NN
MS
3159
3
2,
485
1,89
279
5136
1,51
31
1542
5074
6,86
2
MT
4614
141
503
31
1
1
12
749
NC
205
2,31
135
1,00
0
405
124
771
373
2,07
2
104
173
174
943
327,
876
ND
1128
625
22
2
1211
324
14
726
10
375
3
NE
2653
610
190
61,
569
NH
1,50
31,
503
NJ
818
448
423
1,42
040
920
998
177
6129
77
185
5,26
3
NM
380
163
1,16
21,
705
NV
2313
46
338
4242
14
728
7121
798
NY
365
4,47
31,
601
5,42
4
435
232
1,11
61,
123
1022
515
,004
OH
319
2,35
61,
661
4,67
49,
010
OK
5756
424
71,
024
1,89
2
OR
470
188
3332
313
21,
072
4645
108
400
262
3,07
9
PA6,
944
6,94
4
RI
7323
611
96
2429
578
353
01,
085
TN13
02,
314
119
5,
525
8,08
8
TX37
73,
548
283
1,17
4
60
776
51,
051
10
94,
227
31
844
798
323
829
814
,164
VA23
61,
883
434
22
362
151
812
2,34
22
8514
332
698
6,92
3
VT
4966
208
77
19
0
98
42
7
WA
344
768
391
3657
222
6
1,
655
65
6529
441
4,
592
WI
3116
029
5460
2517
2740
3
WV-
RN
6141
4
73
13
3929
700
7
2352
2
101,
423
WY
1713
916
4
4
127
216
6
224
23
147
1
7,02
138
,620
800
3,61
09,
174
15,2
3347
,479
3,63
114
,308
8,00
250
181
40,4
1212
2,22
32,
573
5,85
03,
622
635,
490
8,44
721
6,80
1

National Council of State Boards of Nursing, Inc. (NCSBN) | 2011
15PART I – 2010 LICENSURE STATISTICS
Table 8. Total Number of Active Advanced Practice/Authority to Practice Licenses Within Member Board Jurisdictions
Abbreviation Category
Active Licenses
N %
CNM Certified Nurse Midwife 7,021 3.2
CRNA Certified Registered Nurse Anesthetist 38,620 17.3
CNS Clinical Nurse Specialist 800 0.4
CNS-PSYCHClinical Nurse Specialist - Psychiatry and/or Mental Health (including all its subspecialties)
3,610 1.6
CNS-NON-PSYCH Clinical Nurse Specialist - Non-Psychiatry 9,174 4.1
APRN APRN - no specific category desigation 15,233 7.0
Nurse Practitioners
AC Acute Care 3,631 1.6
AHP Adult Health 14,308 6.4
CHP Child Health/Pediatric 8,002 3.6
COL College Health 50 0.0
EMR Emergency 181 0.1
FAM Family 40,412 18.1
FPN Family Planning 12 0.0
GER Geriatric 2,223 1.0
NEO Neonatal 2,573 1.1
WOM Obstetrical and/or Gynecological and/or Women's Health 5,850 2.6
PSY Psychiatric and/or Mental Health 3,622 1.6
SCH School Health 63 0.0
NP Nurse Practitioner - no specialty designation 47,479 21.2
Other Other Types of Nurse Practitioners 5,490 2.5
All All Nurse Practitioners 8,447 3.9
Total 216,801 100.0%

National Council of State Boards of Nursing, Inc. (NCSBN) | 2011
16 PART I – 2010 LICENSURE STATISTICSfi
gur
e 1.
To
tal N
umb
er o
f A
ctiv
e Li
cens
es: r
Ns
and
LP
N/V
Ns
- 20
00-2
010
3,10
3,98
13,
103,
444
3,18
6,88
03,
210,
456
3,06
1,64
3
3,31
7,79
1
3,41
6,94
63,
495,
906
3,73
3,29
93,
780,
178
3,85
3,87
0
902,
154
876,
487
877,
748
885,
559
829,
619
901,
437
946,
260
948,
692
1,01
7,03
597
1,15
794
4,48
8
0
5000
00
1000
000
1500
000
2000
000
2500
000
3000
000
3500
000
4000
000
4500
000
2000
2001
2002
2003
2004
2005
2006
2007
2008
2009
2010
Number
RNYe
arLP
N/V
N
Number
Year
Number
LPN
/VN
National Council of State Boards of Nursing, Inc. (NCSBN) | 2011
17PART II – 2010 NCLEX® EXAMINATION STATISTICS
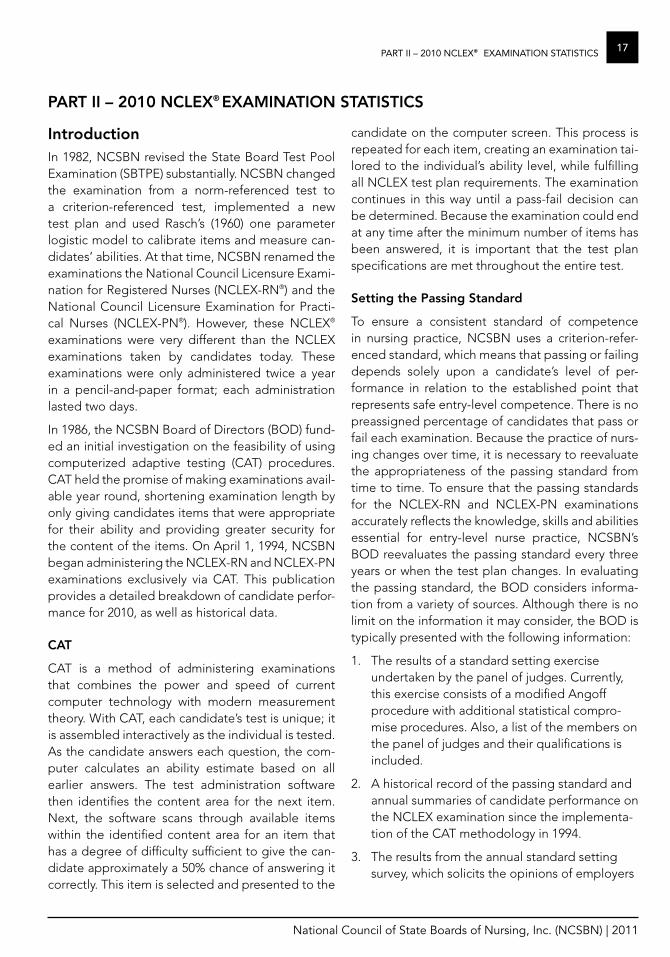
IntroductionIn 1982, NCSBN revised the State Board Test Pool Examination (SBTPE) substantially. NCSBN changed the examination from a norm-referenced test to a criterion-referenced test, implemented a new test plan and used Rasch’s (1960) one parameter logistic model to calibrate items and measure can-didates’ abilities. At that time, NCSBN renamed the examinations the National Council Licensure Exami-nation for Registered Nurses (NCLEX-RN®) and the National Council Licensure Examination for Practi-cal Nurses (NCLEX-PN®). However, these NCLEX® examinations were very different than the NCLEX examinations taken by candidates today. These examinations were only administered twice a year in a pencil-and-paper format; each administration lasted two days.
In 1986, the NCSBN Board of Directors (BOD) fund-ed an initial investigation on the feasibility of using computerized adaptive testing (CAT) procedures. CAT held the promise of making examinations avail-able year round, shortening examination length by only giving candidates items that were appropriate for their ability and providing greater security for the content of the items. On April 1, 1994, NCSBN began administering the NCLEX-RN and NCLEX-PN examinations exclusively via CAT. This publication provides a detailed breakdown of candidate perfor-mance for 2010, as well as historical data.
CAT
CAT is a method of administering examinations that combines the power and speed of current computer technology with modern measurement theory. With CAT, each candidate’s test is unique; it is assembled interactively as the individual is tested. As the candidate answers each question, the com-puter calculates an ability estimate based on all earlier answers. The test administration software then identifies the content area for the next item. Next, the software scans through available items within the identified content area for an item that has a degree of difficulty sufficient to give the can-didate approximately a 50% chance of answering it correctly. This item is selected and presented to the
candidate on the computer screen. This process is repeated for each item, creating an examination tai-lored to the individual’s ability level, while fulfilling all NCLEX test plan requirements. The examination continues in this way until a pass-fail decision can be determined. Because the examination could end at any time after the minimum number of items has been answered, it is important that the test plan specifications are met throughout the entire test.
Setting the Passing Standard
To ensure a consistent standard of competence in nursing practice, NCSBN uses a criterion-refer-enced standard, which means that passing or failing depends solely upon a candidate’s level of per-formance in relation to the established point that represents safe entry-level competence. There is no preassigned percentage of candidates that pass or fail each examination. Because the practice of nurs-ing changes over time, it is necessary to reevaluate the appropriateness of the passing standard from time to time. To ensure that the passing standards for the NCLEX-RN and NCLEX-PN examinations accurately reflects the knowledge, skills and abilities essential for entry-level nurse practice, NCSBN’s BOD reevaluates the passing standard every three years or when the test plan changes. In evaluating the passing standard, the BOD considers informa-tion from a variety of sources. Although there is no limit on the information it may consider, the BOD is typically presented with the following information:
1. The results of a standard setting exercise undertaken by the panel of judges. Currently, this exercise consists of a modified Angoff procedure with additional statistical compro-mise procedures. Also, a list of the members on the panel of judges and their qualifications is included.
2. A historical record of the passing standard and annual summaries of candidate performance on the NCLEX examination since the implementa-tion of the CAT methodology in 1994.
3. The results from the annual standard setting survey, which solicits the opinions of employers
PArT II – 2010 NCLeX® eXAMINATIoN STATISTICS
®

National Council of State Boards of Nursing, Inc. (NCSBN) | 2011
18 PART II – 2010 NCLEX® EXAMINATION STATISTICS
and educators regarding the competence of the current cohort of entry-level nurses.
4. Information detailing the educational readiness of high school graduates who expressed an interest in nursing.
In April 1998, the passing standard for the NCLEX-RN Examination increased from –0.42 logits to –0.35 logits. In April 2001, this standard was retained for another three years. In April 2004, the standard increased to –0.28 logits. In April 2007, the standard increased again to –0.21 logits. In 2010, the standard was revised to –0.16 logits.
The passing standard for the NCLEX-PN Examina-tion has experienced a similar increase over time. In April 1999, the passing standard for the NCLEX-PN Examination increased from –0.51 logits to –0.47 logits. In April 2002, this standard was retained for another three years. In April 2005, the NCLEX-PN passing standard increased from –0.47 to –0.42 logits. And in April 2008, the standard increased to –0.37 logits. It is important to note that the RN and PN standards are not directly comparable because they are based on different item pools and different scopes of practice.
Pass-fail Decisions
Candidate performance on the NCLEX examina-tions is reported only as a pass-fail decision. Scores are never reported. As a result, almost all the statis-tics presented here are pass rates or statistics based upon a pass-fail decision.
To make pass-fail decisions, the computer seeks to determine with 95% certainty whether the can-didate’s true ability is above or below the passing standard. To do this, three pieces of information must be known: the current person ability estimate, the precision of that estimate and the passing stan-dard. After the minimum number of items has been answered, the computer compares the candidate’s ability level to the standard required for passing. Candidates clearly above the passing standard pass. Candidates clearly below the passing standard fail.
If the candidate’s ability level is close enough to the passing standard that it is not clear which side of the passing standard his or her ability falls, the com-puter continues asking items. As more items are
answered, the candidate’s ability estimate becomes more precise. After each item, the candidate’s abil-ity level is recomputed, using all of the information (answers to all the items asked) available at that point. When it becomes clear on which side of the passing standard the candidate’s ability falls, the examination ends.
Some candidates’ abilities are very close to the passing standard. For these candidates, all items in the item pool might not provide enough informa-tion to be certain their ability is truly above or below the passing standard. These are the candidates who take the maximum number of items. Once the maximum number of items has been administered, the computer waives the 95% certainty requirement and makes a pass or fail decision based upon the candidate’s final ability estimate. If the candidate’s ability estimate is above the passing standard, the candidate passes. If not, he or she fails.
If an NCLEX examination ends because time runs out, then the computer does not have enough infor-mation to make a clear pass-fail decision; if it did, it would have stopped administering items. When the response patterns of people who ran out of time were investigated however; it was found that some had been performing consistently above the pass-ing standard and their ability level appeared to be above passing, although close to it. A mechanism is therefore provided for these candidates to pass. The key word here is “consistently.” If a candidate’s ability estimate has been consistently above the passing standard over the last 60 items, then he or she will pass, despite having run out of time.
®

National Council of State Boards of Nursing, Inc. (NCSBN) | 2011
19PART II – 2010 NCLEX® EXAMINATION STATISTICSTa
ble
1. C
and
idat
es T
akin
g t
he N
CLe
X-r
N® e
xam
inat
ion
by
Typ
e o
f C
and
idat
e1
NC
LeX
-rN
® e
xam
inat
ion:
Jan
. 1 -
Dec
.31,
201
0
Ja
n 1
- M
arch
31,
201
0A
pri
l 1 -
Jun
e 30
, 201
0Ju
ly 1
- S
ep 3
0, 2
010
oct
1 -
Dec
31,
201
0To
tal:
Jan
1 -
Dec
31,
201
0
Typ
e o
f C
and
idat
eC
and
idat
esP
asse
d%
Can
did
ates
Pas
sed
%C
and
idat
esP
asse
d%
Can
did
ates
Pas
sed
%C
and
idat
esP
asse
d%
Firs
t-T
ime,
U
.S.-
Ed
ucat
ed
Dip
lom
a96
789
092
.082
074
691
.01,
544
1,36
088
.143
738
187
.23,
768
3,37
789
.6
Bac
cala
urea
te
Deg
ree
13,1
8412
,016
91.1
16,0
5114
,749
91.9
21,5
4218
,497
85.9
4,63
03,
883
83.9
55,4
0749
,145
88.7
Ass
oci
ate
Deg
ree
21,0
7118
,769
89.1
23,3
5020
,824
89.2
30,2
3225
,407
84.0
6,94
95,
556
80.0
81,6
0270
,556
86.5
Spec
ial P
rog
ram
C
od
es
3526
74.3
2920
69.0
2015
75.0
2119
90.5
105
8076
.2
Tota
l Firs
t-T
ime,
U
.S.-
Ed
ucat
ed35
,257
31,7
0189
.940
,250
36,3
3990
.353
,338
45,2
7984
.912
,037
9,83
981
.714
0,88
212
3,15
887
.4
Rep
eat,
U.S
.-E
duc
ated
5,
356
2,93
354
.85,
222
2558
49.0
8,07
94,
570
56.6
8,05
44,
615
57.3
26,7
1114
,676
54.9
Firs
t-T
ime,
In
tern
atio
nally
Ed
ucat
ed
4,42
11,
946
44.0
3,61
41,
387
38.4
3,30
81,
159
35.0
3,05
61,
066
34.9
14,3
995,
558
38.6
Rep
eat,
Inte
rnat
iona
lly
Ed
ucat
ed
4,56
11,
174
25.7
3,68
169
618
.93,
876
747
19.3
3,66
770
519
.215
,785
3,32
221
.0
All
Can
did
ates
49,5
9537
,754
76.1
52,7
6740
,980
77.7
68,6
0151
,755
75.4
26,8
1416
,225
60.5
197,
777
146,
714
74.2
1 Pe
rfo
rman
ce o
f RN
Ed
ucat
iona
l Pro
gra
ms.
The
follo
win
g is
a s
umm
ary
of t
he 2
010
NC
LEX
pas
s ra
tes
for
U.S
. RN
ed
ucat
ion
pro
gra
ms
bas
ed u
po
n fir
st-t
ime
cand
idat
e p
erfo
rman
ce: I
n 20
10, 1
,894
U.S
. RN
pro
gra
ms
had
at
leas
t o
ne fi
rst-
time
cand
idat
e. T
he m
ean
pas
s ra
te fo
r th
ose
pro
gra
ms
was
86.
4% (S
D 1
2.4%
). W
hen
incl
udin
g o
nly
tho
se p
rog
ram
s w
ith a
t le
ast
ten
first
-tim
e ex
amin
ees
(N=
1,78
6) t
he m
ean
pas
s ra
te w
as 8
6.9%
(SD
10.
0%).
®
National Council of State Boards of Nursing, Inc. (NCSBN) | 2011
20 PART II – 2010 NCLEX® EXAMINATION STATISTICS
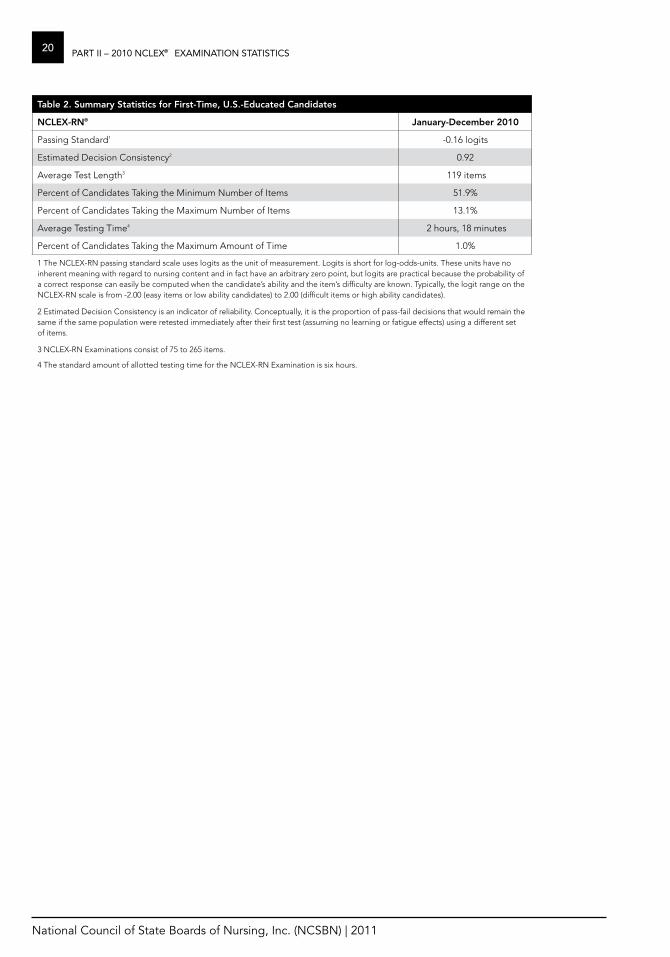
Table 2. Summary Statistics for first-Time, u.S.-educated Candidates
NCLeX-rN® January-December 2010
Passing Standard1 -0.16 logits
Estimated Decision Consistency2 0.92
Average Test Length3 119 items
Percent of Candidates Taking the Minimum Number of Items 51.9%
Percent of Candidates Taking the Maximum Number of Items 13.1%
Average Testing Time4 2 hours, 18 minutes
Percent of Candidates Taking the Maximum Amount of Time 1.0%
1 The NCLEX-RN passing standard scale uses logits as the unit of measurement. Logits is short for log-odds-units. These units have no inherent meaning with regard to nursing content and in fact have an arbitrary zero point, but logits are practical because the probability of a correct response can easily be computed when the candidate’s ability and the item’s difficulty are known. Typically, the logit range on the NCLEX-RN scale is from -2.00 (easy items or low ability candidates) to 2.00 (difficult items or high ability candidates).
2 Estimated Decision Consistency is an indicator of reliability. Conceptually, it is the proportion of pass-fail decisions that would remain the same if the same population were retested immediately after their first test (assuming no learning or fatigue effects) using a different set of items.
3 NCLEX-RN Examinations consist of 75 to 265 items.
4 The standard amount of allotted testing time for the NCLEX-RN Examination is six hours.
®

National Council of State Boards of Nursing, Inc. (NCSBN) | 2011
21PART II – 2010 NCLEX® EXAMINATION STATISTICS
Table 3. first-Time, u.S.-educated Candidates Taking the NCLeX-rN® examination by Degree Type (Jan. 1 - March 31, 2010)1
rN-Diploma rN-Baccalaureate rN-Associate DegreeTotal
Jan. 1 - Mar. 31, 2010
Jurisdiction Candidates Passed % Candidates Passed % Candidates Passed % Candidates Passed %
Alabama 0 259 236 91.1 372 299 80.4 631 535 84.8
Alaska 0 31 27 87.1 44 43 97.7 75 70 93.3
American Samoa 0 0 0 0
Arizona 0 283 258 91.2 756 680 90.0 1,039 938 90.3
Arkansas 175 155 88.6 72 68 94.4 320 278 86.9 567 501 88.4
California-RN 0 1,113 1,008 90.6 2,717 2,431 89.5 3,830 3,439 89.8
Colorado 0 295 278 94.2 255 227 89.0 550 505 91.8
Connecticut 78 71 91.0 66 61 92.4 48 44 91.7 192 176 91.7
Delaware 0 9 8 88.9 119 111 93.3 128 119 93.0
District of Columbia 0 49 49 100.0 27 17 63.0 76 66 86.8
Florida 0 385 354 92.0 1,765 1,596 90.4 2,150 1,950 90.7
Georgia-RN 0 405 375 92.6 391 361 92.3 796 736 92.5
Guam 0 1 1 100.0 5 4 80.0 6 5 83.3
Hawaii 0 151 141 93.4 63 56 88.9 214 197 92.1
Idaho 0 26 24 92.3 157 143 91.1 183 167 91.3
Illinois 0 570 531 93.2 694 631 90.9 1,264 1,162 91.9
Indiana 9 8 88.9 339 300 88.5 610 504 82.6 958 812 84.8
Iowa 0 128 111 86.7 358 312 87.2 486 423 87.0
Kansas 0 97 79 81.4 232 189 81.5 329 268 81.5
Kentucky 0 282 261 92.6 525 479 91.2 807 740 91.7
Louisiana-RN 34 32 94.1 519 484 93.3 366 349 95.4 919 865 94.1
Maine 0 98 84 85.7 22 22 100.0 120 106 88.3
Maryland 0 183 155 84.7 479 442 92.3 662 597 90.2
Massachusetts 0 433 388 89.6 357 335 93.8 790 723 91.5
Michigan 0 565 532 94.2 518 473 91.3 1,083 1,005 92.8
Minnesota 0 231 210 90.9 480 398 82.9 711 608 85.5
Mississippi 0 65 60 92.3 290 271 93.5 355 331 93.2
Missouri 21 21 100.0 375 342 91.2 482 424 88.0 878 787 89.6
Montana 0 83 76 91.6 20 18 90.0 103 94 91.3
Nebraska 0 305 283 92.8 16 13 81.3 321 296 92.2
Nevada 0 166 134 80.7 125 111 88.8 291 245 84.2
New Hampshire 0 30 29 96.7 0 30 29 96.7
New Jersey 178 167 93.8 76 64 84.2 354 325 91.8 608 556 91.4
New Mexico 0 101 94 93.1 200 163 81.5 301 257 85.4
New York 0 560 464 82.9 1,585 1,398 88.2 2,145 1,862 86.8
North Carolina 51 51 100.0 383 360 94.0 343 319 93.0 777 730 94.0
North Dakota 0 65 55 84.6 0 65 55 84.6
Northern Mariana Island 0 0 4 2 50.0 4 2 50.0
Ohio 93 84 90.3 401 356 88.8 1,206 1,026 85.1 1,700 1,466 86.2
Oklahoma 0 138 127 92.0 274 251 91.6 412 378 91.7
®

National Council of State Boards of Nursing, Inc. (NCSBN) | 2011
22 PART II – 2010 NCLEX® EXAMINATION STATISTICS
Table 3. first-Time, u.S.-educated Candidates Taking the NCLeX-rN® examination by Degree Type (Jan. 1 - March 31, 2010)1
rN-Diploma rN-Baccalaureate rN-Associate DegreeTotal
Jan. 1 - Mar. 31, 2010
Jurisdiction Candidates Passed % Candidates Passed % Candidates Passed % Candidates Passed %
Oregon 0 70 69 98.6 21 18 85.7 91 87 95.6
Pennsylvania 189 169 89.4 404 363 89.9 494 407 82.4 1,087 939 86.4
Rhode Island 2 2 100.0 108 103 95.4 73 72 98.6 183 177 96.7
South Carolina 0 210 185 88.1 359 320 89.1 569 505 88.8
South Dakota 0 81 69 85.2 44 39 88.6 125 108 86.4
Tennessee 0 561 545 97.2 367 345 94.0 928 890 95.9
Texas 57 54 94.7 1,304 1,229 94.3 1,582 1,429 90.3 2,943 2,712 92.2
Utah 0 72 69 95.8 273 247 90.5 345 316 91.6
Vermont 0 0 1 0 0.0 1 0 0.0
Virgin Islands 0 1 0 0.0 0 1 0 0.0
Virginia 80 76 95.0 387 336 86.8 254 223 87.8 721 635 88.1
Washington 0 177 158 89.3 296 263 88.9 473 421 89.0
West Virginia-RN 0 94 78 83.0 66 63 95.5 160 141 88.1
Wisconsin 0 376 344 91.5 615 561 91.2 991 905 91.3
Wyoming 0 1 1 100.0 47 37 78.7 48 38 79.2
ToTAL 967 890 92.0 13,184 12,016 91.1 21,071 18,769 89.1 35,222 31,675 89.9
1 Data does not include Special Program Codes.
®

National Council of State Boards of Nursing, Inc. (NCSBN) | 2011
23PART II – 2010 NCLEX® EXAMINATION STATISTICS
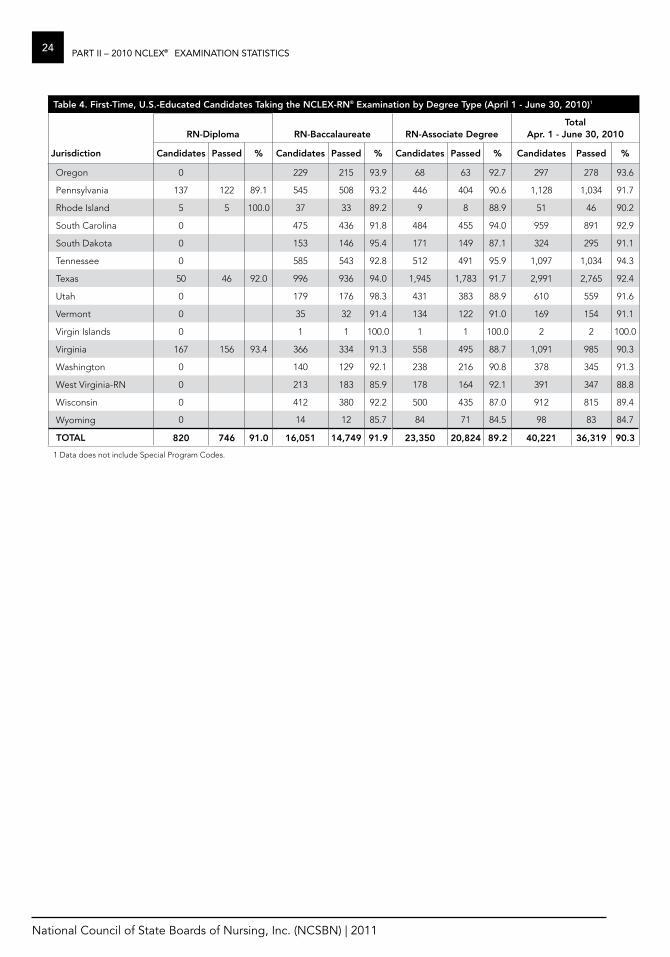
Table 4. first-Time, u.S.-educated Candidates Taking the NCLeX-rN® examination by Degree Type (April 1 - June 30, 2010)1
rN-Diploma rN-Baccalaureate rN-Associate DegreeTotal
Apr. 1 - June 30, 2010
Jurisdiction Candidates Passed % Candidates Passed % Candidates Passed % Candidates Passed %
Alabama 0 482 448 93.0 865 748 86.5 1,347 1,196 88.8
Alaska 0 25 24 96.0 18 17 94.4 43 41 95.4
American Samoa 0 0 0 0
Arizona 0 164 148 90.2 583 542 93.0 747 690 92.4
Arkansas 13 8 61.5 191 167 87.4 94 84 89.4 298 259 86.9
California-RN 0 775 698 90.1 1,330 1,196 89.9 2,105 1,894 90.0
Colorado 0 247 230 93.1 313 268 85.6 560 498 88.9
Connecticut 56 55 98.2 174 166 95.4 70 66 94.3 300 287 95.7
Delaware 19 19 100.0 41 33 80.5 61 50 82.0 121 102 84.3
District of Columbia 0 60 55 91.7 31 23 74.2 91 78 85.7
Florida 0 670 632 94.3 1,408 1,259 89.4 2,078 1,891 91.0
Georgia-RN 0 618 568 91.9 661 604 91.4 1,279 1,172 91.6
Guam 0 0 2 2 100.0 2 2 100.0
Hawaii 0 44 34 77.3 36 31 86.1 80 65 81.3
Idaho 0 63 57 90.5 125 121 96.8 188 178 94.7
Illinois 19 17 89.5 873 822 94.2 808 751 93.0 1,700 1,590 93.5
Indiana 4 4 100.0 649 591 91.1 623 515 82.7 1,276 1,110 87.0
Iowa 0 281 236 84.0 387 347 89.7 668 583 87.3
Kansas 0 466 425 91.2 611 503 82.3 1,077 928 86.2
Kentucky 0 303 287 94.7 741 658 88.8 1,044 945 90.5
Louisiana-RN 0 134 119 88.8 171 163 95.3 305 282 92.5
Maine 0 124 112 90.3 230 220 95.7 354 332 93.8
Maryland 0 162 151 93.2 403 351 87.1 565 502 88.9
Massachusetts 36 36 100.0 280 258 92.1 321 289 90.0 637 583 91.5
Michigan 0 326 292 89.6 614 560 91.2 940 852 90.6
Minnesota 0 447 417 93.3 902 811 89.9 1,349 1,228 91.0
Mississippi 0 202 175 86.6 628 552 87.9 830 727 87.6
Missouri 6 6 100.0 551 508 92.2 437 397 90.9 994 911 91.7
Montana 0 83 79 95.2 84 76 90.5 167 155 92.8
Nebraska 0 304 287 94.4 182 147 80.8 486 434 89.3
Nevada 0 114 100 87.7 92 85 92.4 206 185 89.8
New Hampshire 0 87 84 96.6 280 257 91.8 367 341 92.9
New Jersey 193 169 87.6 193 180 93.3 207 188 90.8 593 537 90.6
New Mexico 0 42 35 83.3 92 81 88.0 134 116 86.6
New York 0 518 469 90.5 1,068 884 82.8 1,586 1,353 85.3
North Carolina 43 41 95.4 593 543 91.6 1,601 1,433 89.5 2,237 2,017 90.2
North Dakota 0 241 221 91.7 51 49 96.1 292 270 92.5
Northern Mariana Island
0 0 1 0 0.0 1 0 0.0
Ohio 72 62 86.1 837 755 90.2 1,088 935 85.9 1,997 1,752 87.7
Oklahoma 0 307 279 90.9 372 321 86.3 679 600 88.4
®
National Council of State Boards of Nursing, Inc. (NCSBN) | 2011
24 PART II – 2010 NCLEX® EXAMINATION STATISTICS
Table 4. first-Time, u.S.-educated Candidates Taking the NCLeX-rN® examination by Degree Type (April 1 - June 30, 2010)1
rN-Diploma rN-Baccalaureate rN-Associate DegreeTotal
Apr. 1 - June 30, 2010
Jurisdiction Candidates Passed % Candidates Passed % Candidates Passed % Candidates Passed %
Oregon 0 229 215 93.9 68 63 92.7 297 278 93.6
Pennsylvania 137 122 89.1 545 508 93.2 446 404 90.6 1,128 1,034 91.7
Rhode Island 5 5 100.0 37 33 89.2 9 8 88.9 51 46 90.2
South Carolina 0 475 436 91.8 484 455 94.0 959 891 92.9
South Dakota 0 153 146 95.4 171 149 87.1 324 295 91.1
Tennessee 0 585 543 92.8 512 491 95.9 1,097 1,034 94.3
Texas 50 46 92.0 996 936 94.0 1,945 1,783 91.7 2,991 2,765 92.4
Utah 0 179 176 98.3 431 383 88.9 610 559 91.6
Vermont 0 35 32 91.4 134 122 91.0 169 154 91.1
Virgin Islands 0 1 1 100.0 1 1 100.0 2 2 100.0
Virginia 167 156 93.4 366 334 91.3 558 495 88.7 1,091 985 90.3
Washington 0 140 129 92.1 238 216 90.8 378 345 91.3
West Virginia-RN 0 213 183 85.9 178 164 92.1 391 347 88.8
Wisconsin 0 412 380 92.2 500 435 87.0 912 815 89.4
Wyoming 0 14 12 85.7 84 71 84.5 98 83 84.7
ToTAL 820 746 91.0 16,051 14,749 91.9 23,350 20,824 89.2 40,221 36,319 90.3
1 Data does not include Special Program Codes.
®

National Council of State Boards of Nursing, Inc. (NCSBN) | 2011
25PART II – 2010 NCLEX® EXAMINATION STATISTICS
Table 4. first-Time, u.S.-educated Candidates Taking the NCLeX-rN® examination by Degree Type (April 1 - June 30, 2010)1
rN-Diploma rN-Baccalaureate rN-Associate DegreeTotal
Apr. 1 - June 30, 2010
Jurisdiction Candidates Passed % Candidates Passed % Candidates Passed % Candidates Passed %
Oregon 0 229 215 93.9 68 63 92.7 297 278 93.6
Pennsylvania 137 122 89.1 545 508 93.2 446 404 90.6 1,128 1,034 91.7
Rhode Island 5 5 100.0 37 33 89.2 9 8 88.9 51 46 90.2
South Carolina 0 475 436 91.8 484 455 94.0 959 891 92.9
South Dakota 0 153 146 95.4 171 149 87.1 324 295 91.1
Tennessee 0 585 543 92.8 512 491 95.9 1,097 1,034 94.3
Texas 50 46 92.0 996 936 94.0 1,945 1,783 91.7 2,991 2,765 92.4
Utah 0 179 176 98.3 431 383 88.9 610 559 91.6
Vermont 0 35 32 91.4 134 122 91.0 169 154 91.1
Virgin Islands 0 1 1 100.0 1 1 100.0 2 2 100.0
Virginia 167 156 93.4 366 334 91.3 558 495 88.7 1,091 985 90.3
Washington 0 140 129 92.1 238 216 90.8 378 345 91.3
West Virginia-RN 0 213 183 85.9 178 164 92.1 391 347 88.8
Wisconsin 0 412 380 92.2 500 435 87.0 912 815 89.4
Wyoming 0 14 12 85.7 84 71 84.5 98 83 84.7
ToTAL 820 746 91.0 16,051 14,749 91.9 23,350 20,824 89.2 40,221 36,319 90.3
1 Data does not include Special Program Codes.
Table 5. first-Time, u.S.-educated Candidates Taking the NCLeX-rN® examination by Degree Type (July 1 - Sept. 30, 2010)1
rN-Diploma rN-Baccalaureate rN-Associate DegreeTotal
July 1 - Sept. 30, 2010
Jurisdiction Candidates Passed % Candidates Passed % Candidates Passed % Candidates Passed %
Alabama 0 497 429 86.3 689 561 81.4 1,186 990 83.5
Alaska 0 20 16 80.0 19 14 73.7 39 30 76.9
American Samoa 0 0 0 0
Arizona 0 260 226 86.9 590 522 88.5 850 748 88.0
Arkansas 104 82 78.9 269 204 75.8 297 240 80.8 670 526 78.5
California-RN 0 1,525 1,313 86.1 2,891 2,488 86.1 4,416 3,801 86.1
Colorado 0 326 300 92.0 223 185 83.0 549 485 88.3
Connecticut 5 5 100.0 349 315 90.3 351 308 87.8 705 628 89.1
Delaware 2 1 50.0 150 121 80.7 59 49 83.1 211 171 81.0
District of Columbia 0 111 95 85.6 22 14 63.6 133 109 82.0
Florida 0 952 816 85.7 1,537 1,321 86.0 2,489 2,137 85.9
Georgia-RN 0 410 352 85.9 369 311 84.3 779 663 85.1
Guam 0 1 1 100.0 14 14 100.0 15 15 100.0
Hawaii 0 144 111 77.1 58 44 75.9 202 155 76.7
Idaho 0 52 41 78.9 158 134 84.8 210 175 83.3
Illinois 0 834 712 85.4 1,302 1,086 83.4 2,136 1,798 84.2
Indiana 21 20 95.2 660 577 87.4 916 690 75.3 1,597 1,287 80.6
Iowa 0 216 176 81.5 552 442 80.1 768 618 80.5
Kansas 0 96 74 77.1 147 118 80.3 243 192 79.0
Kentucky 0 220 180 81.8 410 334 81.5 630 514 81.6
Louisiana-RN 0 579 508 87.7 342 304 88.9 921 812 88.2
Maine 0 106 84 79.3 52 47 90.4 158 131 82.9
Maryland 0 558 492 88.2 477 412 86.4 1,035 904 87.3
Massachusetts 30 30 100.0 981 848 86.4 752 654 87.0 1,763 1,532 86.9
Michigan 0 798 688 86.2 1,381 1,185 85.8 2,179 1,873 86.0
Minnesota 0 325 266 81.9 465 346 74.4 790 612 77.5
Mississippi 0 148 116 78.4 332 270 81.3 480 386 80.4
Missouri 20 18 90.0 677 575 84.9 563 482 85.6 1,260 1,075 85.3
Montana 0 45 37 82.2 71 56 78.9 116 93 80.2
Nebraska 0 147 131 89.1 145 115 79.3 292 246 84.3
Nevada 0 78 64 82.1 154 139 90.3 232 203 87.5
New Hampshire 0 93 85 91.4 136 108 79.4 229 193 84.3
New Jersey 295 273 92.5 509 426 83.7 585 523 89.4 1,389 1,222 88.0
New Mexico 0 83 77 92.8 266 225 84.6 349 302 86.5
New York 12 11 91.7 1,610 1,365 84.8 3,186 2,706 84.9 4,808 4,082 84.9
North Carolina 50 43 86.0 295 237 80.3 485 382 78.8 830 662 79.8
North Dakota 0 54 40 74.1 33 28 84.9 87 68 78.2
Northern Mariana Island
0 0 2 2 100.0 2 2 100.0
Ohio 123 97 78.9 1,263 1,056 83.6 1,758 1,470 83.6 3,144 2,623 83.4
Oklahoma 0 458 405 88.4 614 512 83.4 1,072 917 85.5
Oregon 0 350 323 92.3 505 446 88.3 855 769 89.9
®

National Council of State Boards of Nursing, Inc. (NCSBN) | 2011
26 PART II – 2010 NCLEX® EXAMINATION STATISTICS
Table 5. first-Time, u.S.-educated Candidates Taking the NCLeX-rN® examination by Degree Type (July 1 - Sept. 30, 2010)1
rN-Diploma rN-Baccalaureate rN-Associate DegreeTotal
July 1 - Sept. 30, 2010
Jurisdiction Candidates Passed % Candidates Passed % Candidates Passed % Candidates Passed %
Pennsylvania 732 652 89.1 1,630 1,415 86.8 1,691 1,417 83.8 4,053 3,484 86.0
Rhode Island 25 19 76.0 159 143 89.9 116 103 88.8 300 265 88.3
South Carolina 0 95 77 81.1 368 319 86.7 463 396 85.5
South Dakota 0 85 77 90.6 137 110 80.3 222 187 84.2
Tennessee 0 383 349 91.1 493 444 90.1 876 793 90.5
Texas 36 33 91.7 1,051 911 86.7 1,430 1,144 80.0 2,517 2,088 83.0
Utah 0 91 86 94.5 286 228 79.7 377 314 83.3
Vermont 0 63 59 93.7 72 49 68.1 135 108 80.0
Virgin Islands 0 12 7 58.3 12 9 75.0 24 16 66.7
Virginia 89 76 85.4 414 347 83.8 802 666 83.0 1,305 1,089 83.5
Washington 0 430 402 93.5 992 885 89.2 1,422 1,287 90.5
West Virginia-RN 0 248 193 77.8 296 238 80.4 544 431 79.2
Wisconsin 0 587 509 86.7 492 405 82.3 1,079 914 84.7
Wyoming 0 45 40 88.9 137 103 75.2 182 143 78.6
ToTAL 1,544 1,360 88.1 21,542 18,497 85.9 30,232 25,407 84.0 53,318 45,264 84.9
1 Data does not include Special Program Codes.
®

National Council of State Boards of Nursing, Inc. (NCSBN) | 2011
27PART II – 2010 NCLEX® EXAMINATION STATISTICS
Table 6. first-Time, u.S.-educated Candidates Taking the NCLeX-rN® examination by Degree Type (oct. 1 - Dec. 31, 2010)1
rN-Diploma rN-Baccalaureate rN-Associate DegreeTotal
oct. 1 - Dec. 31, 2010
Jurisdiction Candidates Passed % Candidates Passed % Candidates Passed % Candidates Passed %
Alabama 0 90 71 78.9 141 101 71.6 231 172 74.5
Alaska 0 25 23 92.0 7 5 71.4 32 28 87.5
American Samoa 0 0 0 0
Arizona 0 35 32 91.4 136 121 89.0 171 153 89.5
Arkansas 13 12 92.3 25 16 64.0 123 116 94.3 161 144 89.4
California-RN 0 415 344 82.9 577 453 78.5 992 797 80.3
Colorado 0 116 93 80.2 117 102 87.2 233 195 83.7
Connecticut 0 66 63 95.5 37 31 83.8 103 94 91.3
Delaware 0 7 6 85.7 15 14 93.3 22 20 90.9
District of Columbia
0 4 3 75.0 3 2 66.7 7 5 71.4
Florida 0 204 168 82.4 640 542 84.7 844 710 84.1
Georgia-RN 0 56 43 76.8 55 44 80.0 111 87 78.4
Guam 0 1 1 100.0 4 4 100.0 5 5 100.0
Hawaii 0 71 59 83.1 2 1 50.0 73 60 82.2
Idaho 0 4 4 100.0 41 32 78.1 45 36 80.0
Illinois 0 133 117 88.0 211 131 62.1 344 248 72.1
Indiana 10 7 70.0 61 48 78.7 179 115 64.3 250 170 68.0
Iowa 0 24 18 75.0 124 96 77.4 148 114 77.0
Kansas 0 84 77 91.7 126 113 89.7 210 190 90.5
Kentucky 0 48 39 81.3 203 170 83.7 251 209 83.3
Louisiana-RN 3 3 100.0 85 70 82.4 38 32 84.2 126 105 83.3
Maine 0 27 23 85.2 4 3 75.0 31 26 83.9
Maryland 0 34 23 67.7 64 58 90.6 98 81 82.7
Massachusetts 0 85 64 75.3 56 47 83.9 141 111 78.7
Michigan 0 342 300 87.7 369 308 83.5 711 608 85.5
Minnesota 0 27 18 66.7 51 37 72.6 78 55 70.5
Mississippi 0 22 15 68.2 30 25 83.3 52 40 76.9
Missouri 16 16 100.0 228 202 88.6 35 26 74.3 279 244 87.5
Montana 0 4 4 100.0 6 2 33.3 10 6 60.0
Nebraska 0 27 21 77.8 44 36 81.8 71 57 80.3
Nevada 0 44 36 81.8 35 29 82.9 79 65 82.3
New Hampshire 0 1 1 100.0 22 14 63.6 23 15 65.2
New Jersey 35 32 91.4 217 181 83.4 92 77 83.7 344 290 84.3
New Mexico 0 49 41 83.7 168 136 81.0 217 177 81.6
New York 2 2 100.0 287 227 79.1 857 654 76.3 1,146 883 77.1
North Carolina 4 4 100.0 37 33 89.2 67 51 76.1 108 88 81.5
North Dakota 0 7 3 42.9 1 0 0.0 8 3 37.5
Northern Mariana Island
0 0 1 1 100.0 1 1 100.0
Ohio 31 24 77.4 367 331 90.2 667 565 84.7 1,065 920 86.4
Oklahoma 0 65 54 83.1 53 34 64.2 118 88 74.6
®

National Council of State Boards of Nursing, Inc. (NCSBN) | 2011
28 PART II – 2010 NCLEX® EXAMINATION STATISTICS
Table 6. first-Time, u.S.-educated Candidates Taking the NCLeX-rN® examination by Degree Type (oct. 1 - Dec. 31, 2010)1
rN-Diploma rN-Baccalaureate rN-Associate DegreeTotal
oct. 1 - Dec. 31, 2010
Jurisdiction Candidates Passed % Candidates Passed % Candidates Passed % Candidates Passed %
Oregon 0 37 35 94.6 28 25 89.3 65 60 92.3
Pennsylvania 230 195 84.8 386 329 85.2 260 193 74.2 876 717 81.8
Rhode Island 0 12 10 83.3 9 6 66.7 21 16 76.2
South Carolina 0 64 58 90.6 139 114 82.0 203 172 84.7
South Dakota 0 25 23 92.0 11 5 45.5 36 28 77.8
Tennessee 0 131 121 92.4 27 20 74.1 158 141 89.2
Texas 1 196 164 83.7 435 361 83.0 632 525 83.1
Utah 0 24 22 91.7 104 82 78.9 128 104 81.3
Vermont 0 4 3 75.0 1 1 100.0 5 4 80.0
Virgin Islands 0 0 1 0 0.0 1 0 0.0
Virginia 92 86 93.5 76 57 75.0 260 206 79.2 428 349 81.5
Washington 0 47 43 91.5 166 133 80.1 213 176 82.6
West Virginia-RN 0 110 70 63.6 24 18 75.0 134 88 65.7
Wisconsin 0 80 65 81.3 72 56 77.8 152 121 79.6
Wyoming 0 14 11 78.6 11 8 72.7 25 19 76.0
ToTAL 437 381 87.2 4,630 3,883 83.9 6,949 5,556 80.0 12,016 9,820 81.7
1 Data does not include Special Program Codes.
®

National Council of State Boards of Nursing, Inc. (NCSBN) | 2011
29PART II – 2010 NCLEX® EXAMINATION STATISTICSTa
ble
7. f
irst
-Tim
e, u
.S.-
ed
ucat
ed C
and
idat
es T
akin
g t
he N
CLe
X-r
N®
exa
min
atio
n b
y D
egre
e Ty
pe
(Jan
. 1 -
Dec
. 31,
201
0)
RN
-Dip
lom
aR
N-B
acca
laur
eate
RN
-Ass
ocia
te D
egre
eR
N-S
pec
ial P
rog
ram
Cod
esTo
tal J
an. 1
- D
ec. 3
1, 2
010
Juri
sdic
tion
Can
did
ates
Pass
ed%
Can
did
ates
Pass
ed%
Can
did
ates
Pass
ed%
Can
did
ates
Pass
ed%
Can
did
ates
Pass
ed%
Ala
bam
a0
1,32
81,
184
89.2
2,06
71,
709
82.7
03,
395
2,89
385
.2
Ala
ska
010
190
89.1
8879
89.8
018
916
989
.4
Am
eric
an S
amo
a0
00
00
066
.7
Ariz
ona
074
266
489
.52,
065
1,86
590
.30
2,80
72,
529
90.1
Ark
ansa
s30
525
784
.355
745
581
.783
471
886
.10
1,69
61,
430
84.3
Cal
iforn
ia-R
N0
3,82
83,
363
87.9
7,51
56,
568
87.4
2822
78.6
11,3
719,
953
87.5
Co
lora
do
098
490
191
.690
878
286
.10
1,89
21,
683
89.0
Co
nnec
ticut
139
131
94.2
655
605
92.4
506
449
88.7
11
100.
01,
301
1,18
691
.2
Del
awar
e21
2095
.220
716
881
.225
422
488
.20
482
412
85.5
Dis
tric
t o
f Co
lum
bia
022
420
290
.283
5667
.50
307
258
84.0
Flo
rida
02,
211
1,97
089
.15,
350
4,71
888
.23
133
.37,
564
6,68
988
.4
Geo
rgia
-RN
01,
489
1,33
889
.91,
476
1,32
089
.40
2,96
52,
658
89.6
Gua
m0
33
100.
025
2496
.00
2827
96.4
Haw
aii
041
034
584
.115
913
283
.00
569
477
83.8
Idah
o0
145
126
86.9
481
430
89.4
062
655
688
.8
Illin
ois
1917
89.5
2,41
02,
182
90.5
3,01
52,
599
86.2
74
57.1
5,45
14,
802
88.1
Ind
iana
4439
88.6
1,70
91,
516
88.7
2,32
81,
824
78.4
04,
081
3,37
982
.8
Iow
a0
649
541
83.4
1,42
11,
197
84.2
02,
070
1,73
884
.0
Kan
sas
074
365
588
.21,
116
923
82.7
01,
859
1,57
884
.9
Ken
tuck
y0
853
767
89.9
1,87
91,
641
87.3
02,
732
2,40
888
.1
Loui
sian
a-R
N37
3594
.61,
317
1,18
189
.791
784
892
.50
2,27
12,
064
90.9
Mai
ne0
355
303
85.4
308
292
94.8
066
359
589
.7
Mar
ylan
d0
937
821
87.6
1,42
31,
263
88.8
11
100.
02,
361
2,08
588
.3
Mas
sach
uset
ts66
6610
0.0
1,77
91,
558
87.6
1,48
61,
325
89.2
03,
331
2,94
988
.5
Mic
hig
an0
2,03
11,
812
89.2
2,88
22,
526
87.6
43
75.0
4,91
74,
341
88.3
Min
neso
ta0
1,03
091
188
.41,
898
1,59
283
.90
2,92
82,
503
85.5
Mis
siss
ipp
i0
437
366
83.8
1,28
01,
118
87.3
01,
717
1,48
486
.4
Mis
sour
i63
6196
.81,
831
1,62
788
.91,
517
1,32
987
.61
00.
03,
412
3,01
788
.4
Mo
ntan
a0
215
196
91.2
181
152
84.0
039
634
887
.9
Neb
rask
a0
783
722
92.2
387
311
80.4
01,
170
1,03
388
.3
®
National Council of State Boards of Nursing, Inc. (NCSBN) | 2011
30 PART II – 2010 NCLEX® EXAMINATION STATISTICSTa
ble
7. f
irst
-Tim
e, u
.S.-
ed
ucat
ed C
and
idat
es T
akin
g t
he N
CLe
X-r
N®
exa
min
atio
n b
y D
egre
e Ty
pe
(Jan
. 1 -
Dec
. 31,
201
0)
RN
-Dip
lom
aR
N-B
acca
laur
eate
RN
-Ass
ocia
te D
egre
eR
N-S
pec
ial P
rog
ram
Cod
esTo
tal J
an. 1
- D
ec. 3
1, 2
010
Juri
sdic
tion
Can
did
ates
Pass
ed%
Can
did
ates
Pass
ed%
Can
did
ates
Pass
ed%
Can
did
ates
Pass
ed%
Can
did
ates
Pass
ed%
Nev
ada
040
233
483
.140
636
489
.70
808
698
86.4
New
Ham
psh
ire0
211
199
94.3
438
379
86.5
99
100.
065
858
789
.2
New
Jer
sey
701
641
91.4
995
851
85.5
1,23
81,
113
89.9
119
81.8
2,94
52,
614
88.8
New
Mex
ico
027
524
789
.872
660
583
.30
1,00
185
285
.1
New
Yo
rk14
1392
.92,
975
2,52
584
.96,
696
5,64
284
.30
9,68
58,
180
84.5
No
rth
Car
olin
a14
813
993
.91,
308
1,17
389
.72,
496
2,18
587
.50
3,95
23,
497
88.5
No
rth
Dak
ota
036
731
986
.985
7790
.60
452
396
87.6
No
rthe
rn M
aria
na Is
land
00
85
62.5
08
562
.5
Ohi
o31
926
783
.72,
868
2,49
887
.14,
719
3,99
684
.70
7,90
66,
761
85.5
Okl
aho
ma
096
886
589
.41,
313
1,11
885
.117
1164
.72,
298
1,99
486
.8
Ore
go
n0
686
642
93.6
622
552
88.7
32
66.7
1,31
11,
196
91.2
Penn
sylv
ania
1,28
81,
138
88.4
2,96
52,
615
88.2
2,89
12,
421
83.7
1714
82.4
7,16
16,
188
86.4
Rho
de
Isla
nd32
2681
.331
628
991
.520
718
991
.30
555
504
90.8
Sout
h C
aro
lina
084
475
689
.61,
350
1,20
889
.53
310
0.0
2,19
71,
967
89.5
Sout
h D
ako
ta0
344
315
91.6
363
303
83.5
070
761
887
.4
Tenn
esse
e0
1,66
01,
558
93.9
1,39
91,
300
92.9
03,
059
2,85
893
.4
Texa
s14
413
392
.43,
547
3,24
091
.35,
392
4,71
787
.50
9,08
38,
090
89.1
Uta
h0
366
353
96.4
1,09
494
085
.90
1,46
01,
293
88.6
Verm
ont
010
294
92.2
208
172
82.7
031
026
685
.8
Virg
in Is
land
s0
148
57.1
1410
71.4
028
1864
.3
Virg
inia
428
394
92.1
1,24
31,
074
86.4
1,87
41,
590
84.8
03,
545
3,05
886
.3
Was
hing
ton
079
473
292
.21,
692
1,49
788
.50
2,48
62,
229
89.7
Wes
t V
irgin
ia-R
N0
665
524
78.8
564
483
85.6
01,
229
1,00
781
.9
Wis
cons
in0
1,45
51,
298
89.2
1,67
91,
457
86.8
03,
134
2,75
587
.9
Wyo
min
g0
7464
86.5
279
219
78.5
035
328
380
.2
ToTA
L3,
768
3,37
789
.655
,407
49,1
4588
.781
,602
70,5
5686
.510
580
76.2
140,
882
123,
158
87.4
®

National Council of State Boards of Nursing, Inc. (NCSBN) | 2011
31PART II – 2010 NCLEX® EXAMINATION STATISTICSTa
ble
8. f
irst
-Tim
e, In
tern
atio
nally
ed
ucat
ed C
and
idat
es T
akin
g t
he N
CLe
X-r
N® e
xam
inat
ion
by
Co
untr
y o
f e
duc
atio
n (J
an. 1
- D
ec. 3
1, 2
010)
Jan.
1 -
Mar
. 31,
201
0A
pr.
1 -
June
30,
201
0Ju
ly 1
- S
ept.
30,
201
0o
ct. 1
- D
ec. 3
1, 2
010
Tota
l Jan
. 1 -
Dec
. 31,
201
0
Co
untr
y o
f e
duc
atio
nC
and
idat
esP
asse
d%
Can
did
ates
Pas
sed
%C
and
idat
esP
asse
d%
Can
did
ates
Pas
sed
%C
and
idat
esP
asse
d%
Alb
ania
4
00.
02
00.
03
266
.71
110
0.0
103
30.0
Ant
igua
and
Bar
bud
a
11
100.
01
00.
02
150
.0
Arg
entin
a
11
100.
01
00.
02
150
.0
Arm
enia
7
457
.18
00.
015
320
.09
111
.139
820
.5
Aus
tral
ia
1511
73.3
169
56.3
1212
100.
012
866
.755
4072
.7
Aus
tria
1
110
0.0
21
50.0
32
66.7
Aze
rbai
jan
2
150
.02
00.
04
125
.0
Bah
amas
2
00.
01
110
0.0
31
33.3
Ban
gla
des
h
30
0.0
30
0.0
Bar
bad
os
1
00.
01
00.
0
Bel
arus
6
233
.31
00.
01
110
0.0
42
50.0
125
41.7
Bel
ize
3
00.
02
150
.03
00.
08
112
.5
Ben
in
10
0.0
10
0.0
10
0.0
10
0.0
40
0.0
Bhu
tan
1
00.
01
00.
0
Bo
snia
and
Her
zeg
ovi
na
11
100.
01
110
0.0
20
0.0
21
50.0
63
50.0
Bra
zil
74
57.1
83
37.5
61
16.7
42
50.0
2510
40.0
Bul
gar
ia
11
100.
03
266
.73
266
.77
571
.4
Bur
kina
Fas
o
10
0.0
10
0.0
Cam
ero
on
6
233
.34
125
.04
125
.09
111
.123
521
.7
Can
ada
12
381
65.9
114
6758
.816
298
60.5
130
7658
.552
932
260
.9
Chi
le
11
100.
01
110
0.0
Chi
na
6530
46.2
3917
43.6
4619
41.3
3616
44.4
186
8244
.1
Co
lom
bia
6
350
.010
110
.04
375
.04
375
.024
1041
.7
Co
ngo
, The
Dem
ocr
atic
R
epub
lic o
f the
1
00.
01
00.
02
00.
0
Co
sta
Ric
a
20
0.0
20
0.0
11
100.
05
120
.0
Cro
atia
1
00.
01
00.
0
Cub
a
72
28.6
84
50.0
137
53.9
103
30.0
3816
42.1
Cze
ch R
epub
lic
11
100.
01
110
0.0
Den
mar
k
11
100.
01
110
0.0
22
100.
0
®

National Council of State Boards of Nursing, Inc. (NCSBN) | 2011
32 PART II – 2010 NCLEX® EXAMINATION STATISTICSTa
ble
8. f
irst
-Tim
e, In
tern
atio
nally
ed
ucat
ed C
and
idat
es T
akin
g t
he N
CLe
X-r
N® e
xam
inat
ion
by
Co
untr
y o
f e
duc
atio
n (J
an. 1
- D
ec. 3
1, 2
010)
Jan.
1 -
Mar
. 31,
201
0A
pr.
1 -
June
30,
201
0Ju
ly 1
- S
ept.
30,
201
0o
ct. 1
- D
ec. 3
1, 2
010
Tota
l Jan
. 1 -
Dec
. 31,
201
0
Co
untr
y o
f e
duc
atio
nC
and
idat
esP
asse
d%
Can
did
ates
Pas
sed
%C
and
idat
esP
asse
d%
Can
did
ates
Pas
sed
%C
and
idat
esP
asse
d%
Do
min
ica
1
110
0.0
20
0.0
31
33.3
Do
min
ican
Rep
ublic
1
110
0.0
21
50.0
10
0.0
10
0.0
52
40.0
Ecu
ado
r
10
0.0
21
50.0
31
33.3
Eg
ypt
3
133
.31
00.
01
00.
05
120
.0
El S
alva
do
r
11
100.
02
150
.01
00.
04
250
.0
Erit
rea
10
440
.01
00.
01
00.
03
266
.715
640
.0
Eth
iop
ia
216
28.6
153
20.0
203
15.0
164
25.0
7216
22.2
Fin
land
3
310
0.0
10
0.0
22
100.
01
00.
07
571
.4
Fra
nce
3
310
0.0
11
100.
02
150
.05
240
.011
763
.6
Gam
bia
1
00.
01
00.
02
00.
0
Geo
rgia
4
125
.05
00.
06
350
.02
00.
017
423
.5
Ger
man
y
115
45.5
85
62.5
125
41.7
43
75.0
3518
51.4
Gha
na
162
12.5
100
0.0
100
0.0
105
50.0
467
15.2
Gib
ralta
r
10
0.0
10
0.0
Gre
ece
1
110
0.0
11
100.
0
Gre
nad
a
10
0.0
10
0.0
20
0.0
Gui
nea
1
00.
01
00.
0
Guy
ana
3
133
.34
375
.02
210
0.0
96
66.7
Hai
ti
373
8.1
224
18.2
202
10.0
275
18.5
106
1413
.2
Ho
ndur
as
10
0.0
10
0.0
Ho
ng K
ong
2
150
.03
266
.75
360
.0
Hun
gar
y
22
100.
01
00.
01
00.
04
250
.0
Icel
and
2
210
0.0
22
100.
04
410
0.0
Ind
ia
264
8130
.723
371
30.5
227
5222
.922
756
24.7
951
260
27.3
Ind
one
sia
4
375
.02
00.
01
00.
05
120
.012
433
.3
Iran
, Isl
amic
Rep
ublic
of
125
41.7
83
37.5
127
58.3
83
37.5
4018
45.0
Irel
and
1
00.
02
210
0.0
33
100.
02
210
0.0
87
87.5
Isra
el
73
42.9
117
63.6
95
55.6
53
60.0
3218
56.3
Ital
y
10
0.0
42
50.0
52
40.0
Jam
aica
11
327
.312
433
.312
325
.017
635
.352
1630
.8
®

National Council of State Boards of Nursing, Inc. (NCSBN) | 2011
33PART II – 2010 NCLEX® EXAMINATION STATISTICSTa
ble
8. f
irst
-Tim
e, In
tern
atio
nally
ed
ucat
ed C
and
idat
es T
akin
g t
he N
CLe
X-r
N® e
xam
inat
ion
by
Co
untr
y o
f e
duc
atio
n (J
an. 1
- D
ec. 3
1, 2
010)
Jan.
1 -
Mar
. 31,
201
0A
pr.
1 -
June
30,
201
0Ju
ly 1
- S
ept.
30,
201
0o
ct. 1
- D
ec. 3
1, 2
010
Tota
l Jan
. 1 -
Dec
. 31,
201
0
Co
untr
y o
f e
duc
atio
nC
and
idat
esP
asse
d%
Can
did
ates
Pas
sed
%C
and
idat
esP
asse
d%
Can
did
ates
Pas
sed
%C
and
idat
esP
asse
d%
Jap
an
3315
45.5
211
4.8
1910
52.6
1610
62.5
8936
40.4
Jo
rdan
12
650
.011
436
.48
225
.010
330
.041
1536
.6
Kaz
akhs
tan
2
150
.01
110
0.0
32
66.7
Ken
ya
138
61.5
123
25.0
83
37.5
198
42.1
5222
42.3
Ko
rea,
No
rth
1
110
0.0
21
50.0
32
66.7
Ko
rea,
So
uth
30
020
066
.723
013
458
.318
011
765
.018
511
160
.089
556
262
.8
Kyr
gyz
stan
3
00.
01
00.
04
00.
0
Lat
via
1
110
0.0
11
100.
02
210
0.0
Leb
ano
n
32
66.7
20
0.0
43
75.0
30
0.0
125
41.7
Lib
eria
4
00.
03
00.
04
125
.01
00.
012
18.
3
Lith
uani
a
20
0.0
32
66.7
21
50.0
73
42.9
Mal
awi
10
0.0
10
0.0
Mal
aysi
a
10
0.0
10
0.0
10
0.0
21
50.0
51
20.0
Mau
ritiu
s
10
0.0
10
0.0
Mex
ico
17
423
.515
213
.39
333
.313
215
.454
1120
.4
Mo
ldo
va, R
epub
lic o
f 3
133
.31
00.
01
110
0.0
52
40.0
Mo
ngo
lia
10
0.0
11
100.
02
150
.0
Mo
rocc
o
10
0.0
10
0.0
Mya
nmar
1
110
0.0
11
100.
0
Nep
al
3723
62.2
217
33.3
125
41.7
133
23.1
8338
45.8
Net
herla
nds
1
00.
04
00.
01
00.
01
00.
07
00.
0
New
Zea
land
4
375
.03
266
.75
360
.010
550
.022
1359
.1
Nic
arag
ua
10
0.0
10
0.0
Nig
eria
65
1320
.043
818
.662
914
.568
1319
.123
843
18.1
No
rway
1
00.
03
266
.74
250
.0
Om
an
33
100.
03
310
0.0
Pak
ista
n
114
36.4
51
20.0
71
14.3
71
14.3
307
23.3
Pal
estin
ian
Terr
itory
, O
ccup
ied
1
00.
01
00.
0
Pan
ama
1
110
0.0
10
0.0
21
50.0
11
100.
05
360
.0
®

National Council of State Boards of Nursing, Inc. (NCSBN) | 2011
34 PART II – 2010 NCLEX® EXAMINATION STATISTICSTa
ble
8. f
irst
-Tim
e, In
tern
atio
nally
ed
ucat
ed C
and
idat
es T
akin
g t
he N
CLe
X-r
N® e
xam
inat
ion
by
Co
untr
y o
f e
duc
atio
n (J
an. 1
- D
ec. 3
1, 2
010)
Jan.
1 -
Mar
. 31,
201
0A
pr.
1 -
June
30,
201
0Ju
ly 1
- S
ept.
30,
201
0o
ct. 1
- D
ec. 3
1, 2
010
Tota
l Jan
. 1 -
Dec
. 31,
201
0
Co
untr
y o
f e
duc
atio
nC
and
idat
esP
asse
d%
Can
did
ates
Pas
sed
%C
and
idat
esP
asse
d%
Can
did
ates
Pas
sed
%C
and
idat
esP
asse
d%
Per
u
41
25.0
73
42.9
41
25.0
20
0.0
175
29.4
Phi
lipp
ines
28
9712
5243
.224
0992
838
.520
9969
633
.218
7862
233
.19,
283
3,49
837
.7
Po
land
18
633
.313
215
.414
642
.99
111
.154
1527
.8
Po
rtug
al
10
0.0
22
100.
03
133
.31
00.
07
342
.9
Pue
rto
Ric
o
103
6058
.338
615
.841
1024
.444
1329
.622
689
39.4
Qat
ar
10
0.0
10
0.0
Ro
man
ia
144
28.6
104
40.0
112
18.2
164
25.0
5114
27.5
Rus
sian
Fed
erat
ion
33
1236
.426
830
.829
620
.719
526
.310
731
29.0
Rw
and
a
11
100.
01
110
0.0
Sai
nt L
ucia
1
00.
01
110
0.0
21
50.0
Sau
di A
rab
ia
22
100.
05
00.
04
00.
04
125
.015
320
.0
Ser
bia
2
00.
01
00.
03
00.
0
Sie
rra
Leo
ne
101
10.0
101
10.0
80
0.0
30
0.0
312
6.5
Sin
gap
ore
2
210
0.0
10
0.0
20
0.0
52
40.0
So
uth
Afr
ica
2
210
0.0
11
100.
06
350
.03
266
.712
866
.7
Sp
ain
2
210
0.0
11
100.
02
210
0.0
55
100.
0
Sri
Lank
a
141
7.1
100
0.0
241
4.2
Sw
azila
nd
10
0.0
10
0.0
Sw
eden
3
266
.74
410
0.0
31
33.3
21
50.0
128
66.7
Sw
itzer
land
2
210
0.0
11
100.
03
310
0.0
Tai
wan
32
1443
.832
721
.919
421
.133
1030
.311
635
30.2
Taj
ikis
tan
1
00.
01
00.
02
00.
01
110
0.0
51
20.0
Tan
zani
a, U
nite
d R
epub
lic o
f 1
00.
01
00.
0
Tha
iland
17
423
.522
627
.314
214
.317
741
.270
1927
.1
To
go
1
00.
01
00.
0
To
nga
1
00.
01
00.
0
Trin
idad
and
To
bag
o
11
100.
03
266
.73
00.
07
342
.9
Tur
key
2
150
.01
110
0.0
51
20.0
10
0.0
93
33.3
Ug
and
a
72
28.6
10
0.0
20
0.0
102
20.0
Ukr
aine
19
1157
.922
522
.718
316
.715
533
.374
2432
.4
®
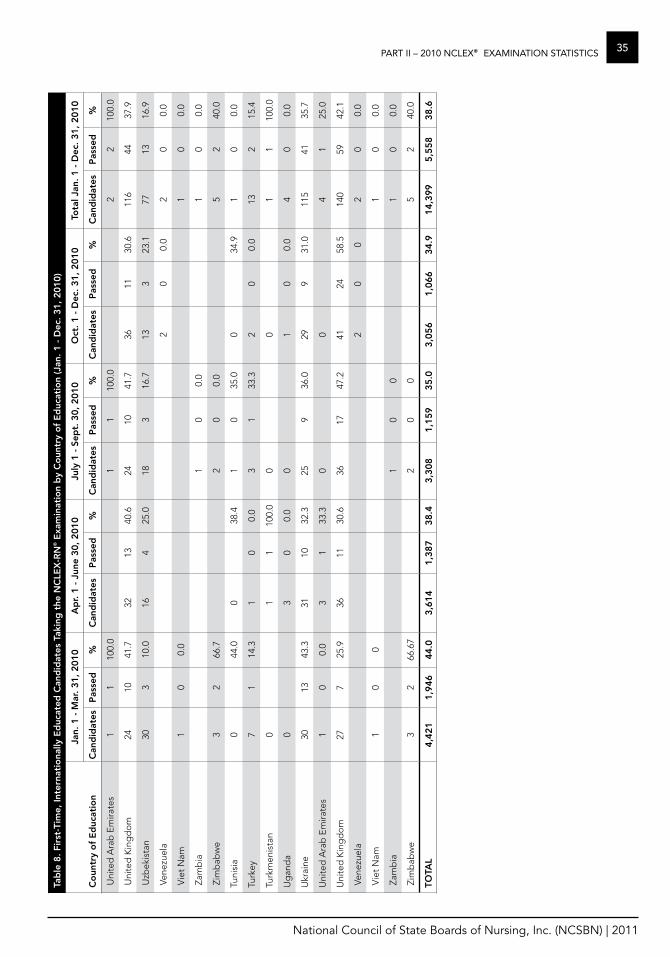
National Council of State Boards of Nursing, Inc. (NCSBN) | 2011
35PART II – 2010 NCLEX® EXAMINATION STATISTICSTa
ble
8. f
irst
-Tim
e, In
tern
atio
nally
ed
ucat
ed C
and
idat
es T
akin
g t
he N
CLe
X-r
N® e
xam
inat
ion
by
Co
untr
y o
f e
duc
atio
n (J
an. 1
- D
ec. 3
1, 2
010)
Jan.
1 -
Mar
. 31,
201
0A
pr.
1 -
June
30,
201
0Ju
ly 1
- S
ept.
30,
201
0o
ct. 1
- D
ec. 3
1, 2
010
Tota
l Jan
. 1 -
Dec
. 31,
201
0
Co
untr
y o
f e
duc
atio
nC
and
idat
esP
asse
d%
Can
did
ates
Pas
sed
%C
and
idat
esP
asse
d%
Can
did
ates
Pas
sed
%C
and
idat
esP
asse
d%
Uni
ted
Ara
b E
mira
tes
1
110
0.0
11
100.
02
210
0.0
Uni
ted
Kin
gd
om
24
1041
.732
1340
.624
1041
.736
1130
.611
644
37.9
Uzb
ekis
tan
30
310
.016
425
.018
316
.713
323
.177
1316
.9
Ven
ezue
la
20
0.0
20
0.0
Vie
t N
am
10
0.0
10
0.0
Zam
bia
1
00.
01
00.
0
Zim
bab
we
3
266
.72
00.
05
240
.0
Tuni
sia
0
44.0
038
.41
035
.00
34.9
10
0.0
Turk
ey
71
14.3
10
0.0
31
33.3
20
0.0
132
15.4
Turk
men
ista
n
01
110
0.0
00
11
100.
0
Ug
and
a
03
00.
00
10
0.0
40
0.0
Ukr
aine
30
1343
.331
1032
.325
936
.029
931
.011
541
35.7
Uni
ted
Ara
b E
mira
tes
1
00.
03
133
.30
04
125
.0
Uni
ted
Kin
gd
om
27
725
.936
1130
.636
1747
.241
2458
.514
059
42.1
Ven
ezue
la
20
02
00.
0
Vie
t N
am
10
01
00.
0
Zam
bia
1
00
10
0.0
Zim
bab
we
3
266
.67
20
05
240
.0
ToTA
L4,
421
1,94
644
.03,
614
1,38
738
.43,
308
1,15
935
.03,
056
1,06
634
.914
,399
5,55
838
.6
®

National Council of State Boards of Nursing, Inc. (NCSBN) | 2011
36 PART II – 2010 NCLEX® EXAMINATION STATISTICSfi
gur
e 1.
NC
LeX
-rN
® P
ass
rat
es f
or
firs
t-Ti
me,
u.S
.-e
duc
ated
Can
did
ates
9189
8788
8585
8587
8787
8788
8987
8890
9493
9191
8888
8688
8990
8991
9188
8991
9090
9087
8883
8584
8687
8784
8688
8486
8885
8279
7778
7374
7475
7978
7881
8279
8083
82
020406080
100
Percent Passing
Year
Adm
inis
tere
d
Jan
Apr
Jul
Oct
*Ap
r 19
94 C
om
put
er A
dap
tive
Test
(CA
T) b
egin
s. P
assi
ng S
tand
ard
-0.
4766
log
its.
**O
ct 1
995
Pass
ing
Sta
ndar
d c
hang
ed fr
om
-0.
4766
to
-0.
42 lo
gits
.**
*Ap
r 19
98 P
assi
ng S
tand
ard
cha
nged
fro
m -
0.42
to
-0.
35 lo
gits
.**
**A
pr
2004
Pas
sing
Sta
ndar
d c
hang
ed fr
om
-0.
35 t
o -
0.28
log
its.
****
*Ap
r 20
07 P
assi
ng S
tand
ard
cha
nged
fro
m -
0.28
to
-0.
21 lo
gits
.**
****
Ap
r 20
10 P
assi
ng S
tand
ard
cha
nged
fro
m -
0.21
to
-0.
16 lo
gits
.
®

National Council of State Boards of Nursing, Inc. (NCSBN) | 2011
37PART II – 2010 NCLEX® EXAMINATION STATISTICSfi
gur
e 2.
NC
LeX
-rN
® P
ass
rat
es f
or
All
Can
did
ates
7975
7374
6868
6669
6970
7274
7371
7276
8985
8179
7474
6969
6974
7376
77
7171
7578
8483
8081
7677
7577
7677
7477
7873
7578
75
64
5757
5954
5252
5458
5556
6059
5655
6061
020406080100
Percent Passing
Year
Adm
inis
tere
dJa
nA
prJu
lO
ct
®
*Ap
r 19
94 C
om
put
er A
dap
tive
Test
(CA
T) b
egin
s. P
assi
ng S
tand
ard
-0.
4766
log
its.
**O
ct 1
995
Pass
ing
Sta
ndar
d c
hang
ed fr
om
-0.
4766
to
-0.
42 lo
gits
.**
*Ap
r 19
98 P
assi
ng S
tand
ard
cha
nged
fro
m -
0.42
to
-0.
35 lo
gits
.**
**A
pr
2004
Pas
sing
Sta
ndar
d c
hang
ed fr
om
-0.
35 t
o -
0.28
log
its.
****
*Ap
r 20
07 P
assi
ng S
tand
ard
cha
nged
fro
m -
0.28
to
-0.
21 lo
gits
.**
****
Ap
r 20
10 P
assi
ng S
tand
ard
cha
nged
fro
m -
0.21
to
-0.
16 lo
gits
.

National Council of State Boards of Nursing, Inc. (NCSBN) | 2011
38 PART II – 2010 NCLEX® EXAMINATION STATISTICSfi
gur
e 3.
NC
LeX
-rN
® A
nnua
l Pas
s r
ates
, Ap
ril 1
994
- D
ecem
ber
201
0
8280
7776
7271
6969
7171
7073
7469
7073
74
9090
8888
8585
8486
8787
8587
8885
8788
87
020406080100
Percent Passing
Year
Adm
inis
tere
d
All
Cand
idat
esFi
rst-
Tim
e, U
.S.-E
duca
ted
®
*Ap
r 19
94 C
om
put
er A
dap
tive
Test
(CA
T) b
egin
s. P
assi
ng S
tand
ard
-0.
4766
log
its.
**O
ct 1
995
Pass
ing
Sta
ndar
d c
hang
ed fr
om
-0.
4766
to
-0.
42 lo
gits
.**
*Ap
r 19
98 P
assi
ng S
tand
ard
cha
nged
fro
m -
0.42
to
-0.
35 lo
gits
.**
**A
pr
2004
Pas
sing
Sta
ndar
d c
hang
ed fr
om
-0.
35 t
o -
0.28
log
its.
****
*Ap
r 20
07 P
assi
ng S
tand
ard
cha
nged
fro
m -
0.28
to
-0.
21 lo
gits
.**
****
Ap
r 20
10 P
assi
ng S
tand
ard
cha
nged
fro
m -
0.21
to
-0.
16 lo
gits
.

National Council of State Boards of Nursing, Inc. (NCSBN) | 2011
39PART II – 2010 NCLEX® EXAMINATION STATISTICSfi
gur
e 4.
NC
LeX
-rN
® V
olu
me
for
firs
t-Ti
me,
u.S
.-e
duc
ated
Can
did
ates
0
10,0
00
20,0
00
30,0
00
40,0
00
50,0
00
60,0
00
70,0
00
80,0
00
1994
1995
1996
1997
1998
1999
2000
2001
2002
2003
2004
2005
2006
2007
2008
2009
2010
Number Examined
Year
Adm
inis
tere
d
Jan
Apr
Jul
Oct
®

National Council of State Boards of Nursing, Inc. (NCSBN) | 2011
40 PART II – 2010 NCLEX® EXAMINATION STATISTICSfi
gur
e 5.
NC
LeX
-rN
® V
olu
me
for
All
Can
did
ates
0
10,0
00
20,0
00
30,0
00
40,0
00
50,0
00
60,0
00
70,0
00
80,0
00
1994
1995
1996
1997
1998
1999
2000
2001
2002
2003
2004
2005
2006
2007
2008
2009
2010
Number Examined
Year
Adm
inis
tere
d
Jan
Apr
Jul
Oct
®
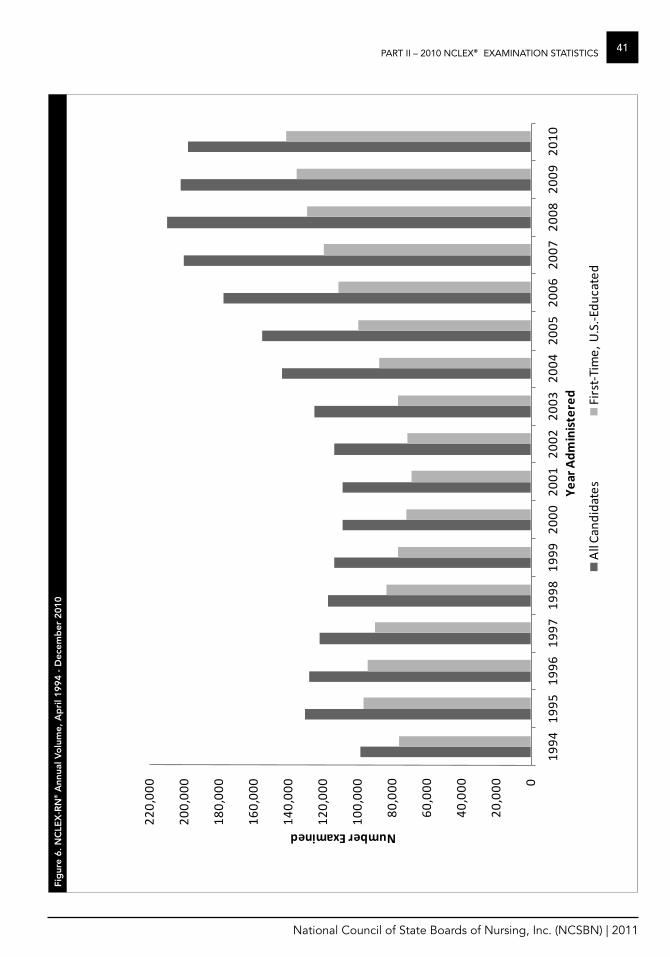
National Council of State Boards of Nursing, Inc. (NCSBN) | 2011
41PART II – 2010 NCLEX® EXAMINATION STATISTICSfi
gur
e 6.
NC
LeX
-rN
® A
nnua
l Vo
lum
e, A
pri
l 199
4 -
Dec
emb
er 2
010
0
20,0
00
40,0
00
60,0
00
80,0
00
100,
000
120,
000
140,
000
160,
000
180,
000
200,
000
220,
000
1994
1995
1996
1997
1998
1999
2000
2001
2002
2003
2004
2005
2006
2007
2008
2009
2010
Number Examined
Year
Adm
inis
tere
d
All
Cand
idat
esFi
rst-
Tim
e, U
.S.-E
duca
ted
®

National Council of State Boards of Nursing, Inc. (NCSBN) | 2011
42 PART II – 2010 NCLEX® EXAMINATION STATISTICSTa
ble
9. C
and
idat
es T
akin
g t
he N
CLe
X-P
N® e
xam
inat
ion
by
Typ
e o
f C
and
idat
e
NC
LeX
-PN
® e
xam
inat
ion:
Jan
. 1 -
Dec
. 31,
201
01
Typ
e o
f C
and
idat
e
Jan
1 -
Mar
ch 3
1, 2
010
Ap
ril 1
- J
une
30, 2
010
July
1 -
Sep
30,
201
0o
ct 1
- D
ec 3
1, 2
010
Tota
l Ja
n 1
- D
ec 3
1, 2
010
Can
did
ates
P
asse
d%
Can
did
ates
P
asse
d%
Can
did
ates
P
asse
d%
Can
did
ates
P
asse
d%
Can
did
ates
P
asse
d%
Firs
t-T
ime,
U.S
.-E
duc
ated
15
,093
13,0
2786
.313
,916
11,8
6285
.222
,951
2045
989
.114
,850
12,8
2386
.466
,810
58,1
7187
.1
Rep
eat,
U.S
.-E
duc
ated
3,
213
1,33
541
.63,
570
1,41
339
.63,
290
1228
37.3
3,72
51,
630
43.8
13,7
985,
606
40.6
Firs
t-T
ime,
Inte
rnat
iona
lly
Ed
ucat
ed
216
9142
.125
013
152
.422
310
346
.224
312
451
.093
244
948
.2
Rep
eat,
Inte
rnat
iona
lly
Ed
ucat
ed
267
5420
.226
162
23.8
207
3014
.522
960
26.2
964
206
21.4
All
Can
did
ates
18,7
8914
,507
77.2
17,9
9713
,468
74.8
26,6
7121
,820
81.8
19,0
4714
,637
76.9
82,5
0464
,432
78.1
1 Pe
rfo
rman
ce o
f PN
Ed
ucat
iona
l Pro
gra
ms.
The
follo
win
g is
a s
umm
ary
of t
he 2
010
NC
LEX
pas
s ra
tes
for
U.S
. PN
ed
ucat
ion
pro
gra
ms
bas
ed u
po
n fir
st-t
ime
cand
idat
e p
erfo
rman
ce: I
n 20
10 1
,658
U.S
. PN
pro
gra
ms
had
at
leas
t o
ne fi
rst-
time
cand
idat
e. T
he m
ean
pas
s ra
te fo
r th
ose
pro
gra
ms
was
87.
5% (S
D 1
7.8%
). W
hen
incl
udin
g o
nly
tho
se p
rog
ram
s w
ith a
t le
ast
ten
first
-tim
e ex
amin
ees
(N=
1,38
9), t
he m
ean
pas
s ra
te w
as 8
8.8%
(SD
13.
2%).
Tab
le 1
0. S
umm
ary
Stat
isti
cs f
or
firs
t-Ti
me,
u.S
.-e
duc
ated
Can
did
ates
NC
LeX
-PN
®
Janu
ary
- D
ecem
ber
201
0
Pass
ing
Sta
ndar
d1
-0.3
7
Est
imat
ed D
ecis
ion
Co
nsis
tenc
y20.
92
Ave
rag
e Te
st L
eng
th3
110
item
s
Perc
ent
of C
and
idat
es T
akin
g t
he M
inim
um N
umb
er o
f Ite
ms
60.8
%
Perc
ent
of C
and
idat
es T
akin
g t
he M
axim
um N
umb
er o
f Ite
ms
13.4
%
Ave
rag
e Te
stin
g T
ime4
Two
ho
urs,
six
min
utes
Perc
ent
of C
and
idat
es T
akin
g t
he M
axim
um A
mo
unt
of T
ime
0.9%
1 Th
e N
CLE
X-P
N s
cale
use
s lo
gits
as
the
unit
of m
easu
rem
ent.
Lo
gits
is s
hort
for
log
-od
ds-
units
. The
se u
nits
hav
e no
inhe
rent
m
eani
ng w
ith re
gar
d t
o n
ursi
ng c
ont
ent
and
, in
fact
, hav
e an
arb
itrar
y ze
ro p
oin
t, b
ut lo
gits
are
pra
ctic
al b
ecau
se t
he p
rob
abili
ty o
f a
corr
ect
resp
ons
e ca
n ea
sily
be
com
put
ed w
hen
the
cand
idat
e’s
abili
ty a
nd t
he it
em’s
diffi
culty
are
kno
wn.
Typ
ical
ly, t
he lo
git
rang
e o
n th
e N
CLE
X-P
N s
cale
is fr
om
-2.
00 (e
asy
item
s o
r lo
w a
bili
ty c
and
idat
es) t
o 2
.00
(diffi
cult
item
s o
r hi
gh
abili
ty c
and
idat
es).
2 E
stim
ated
Dec
isio
n C
ons
iste
ncy
is a
n in
dic
ato
r o
f rel
iab
ility
. Co
ncep
tual
ly, i
t is
the
pro
po
rtio
n o
f pas
s-fa
il d
ecis
ions
tha
t w
oul
d
rem
ain
the
sam
e if
the
sam
e p
op
ulat
ion
wer
e re
test
ed im
med
iate
ly a
fter
the
ir fir
st t
est
(ass
umin
g n
o le
arni
ng o
r fa
tigue
effe
cts)
us
ing
a d
iffer
ent
set
of i
tem
s. .
3 N
CLE
X-P
N e
xam
inat
ions
co
nsis
t o
f 85
to 2
05 it
ems.
4 Th
e st
and
ard
am
oun
t o
f allo
tted
tes
ting
tim
e fo
r th
e N
CLE
X-P
N E
xam
inat
ion
is fi
ve h
our
s.
®

National Council of State Boards of Nursing, Inc. (NCSBN) | 2011
43PART II – 2010 NCLEX® EXAMINATION STATISTICSTa
ble
11.
fir
st-T
ime,
u.S
.-e
duc
ated
Can
did
ates
Tak
ing
the
NC
LeX
-PN
® e
xam
inat
ion
(Jan
. 1 -
Dec
. 31,
201
0
Juri
sdic
tio
n
Jan
1 -
Mar
ch 3
1, 2
010
Ap
ril 1
- J
une
30, 2
010
July
1 -
Sep
30,
201
0o
ct 1
- D
ec 3
1, 2
010
Tota
l Jan
1 -
Dec
31,
201
0
Can
did
ates
P
asse
d%
Can
did
ates
P
asse
d%
Can
did
ates
P
asse
d%
Can
did
ates
P
asse
d%
Can
did
ates
P
asse
d%
Ala
bam
a
290
2
73
94.1
77
7
3
94.8
361
3
47
96.1
135
1
28
94.8
863
8
21
95.1
Ala
ska
5
4
80
.0 4
4
10
0.0
7
6
85.7
3
3
100.
0 1
9
17
89
.5
Am
eric
an S
amo
a
0
0
0.0
0
0
0.0
6
5
83.3
3
1
33.3
9
6
66.7
Ariz
ona
1
03
97
94
.2 1
20
116
96
.7 2
06
196
95
.2 1
10
105
95
.5 5
39
514
95
.4
Ark
ansa
s
296
2
72
91.9
160
1
49
93.1
549
5
14
93.6
158
1
44
91.1
1,1
63
1,0
79
92.8
Cal
iforn
ia −
VN
2
,337
1
,733
74
.2 2
,107
1
,521
72
.2 2
,212
1
,624
73
.4 2
,209
1
,665
75
.4 8
,865
6
,543
73
.8
Co
lora
do
8
3
75
90
.4 8
7
81
93
.1 2
12
189
89
.2 8
1
75
92
.6 4
63
420
90
.7
Co
nnec
ticut
3
21
294
91
.6 2
24
210
93
.8 2
25
201
89
.3 1
66
152
91
.6 9
36
857
91
.6
Del
awar
e
82
6
6
80.5
98
8
3
84.7
92
7
2
78.3
104
7
3
70.2
376
2
94
78.2
Dis
tric
t o
f Co
lum
bia
1
41
102
72
.3 1
39
108
77
.7 1
35
88
65
.2 1
18
94
79
.7 5
33
392
73
.6
Flo
rida
1
,020
8
80
86.3
1,0
07
868
86
.2 1
,161
1
,038
89
.4 9
67
846
87
.5 4
,155
3
,632
87
.4
Geo
rgia
− P
N
294
2
77
94.2
420
3
79
90.2
310
2
77
89.4
383
3
65
95.3
1,4
07
1,2
98
92.3
Gua
m
10
8
80
.0 1
7
16
94
.1 2
1
50
.0 1
1
10
0.0
30
2
6
86.7
Haw
aii
40
3
8
95.0
25
2
5
100.
0 5
4
54
10
0.0
19
1
7
89.5
138
1
34
97.1
Idah
o
55
4
9
89.1
52
4
7
90.4
110
1
06
96.4
50
4
8
96.0
267
2
50
93.6
Illin
ois
4
42
408
92
.3 2
18
191
87
.6 9
43
869
92
.2 3
61
316
87
.5 1
,964
1
,784
90
.8
Ind
iana
3
96
355
89
.7 2
27
187
82
.4 5
13
462
90
.1 3
17
250
78
.9 1
,453
1
,254
86
.3
Iow
a
260
2
42
93.1
295
2
78
94.2
643
6
22
96.7
167
1
58
94.6
1,3
65
1,3
00
95.2
Kan
sas
2
05
192
93
.7 3
70
347
93
.8 2
77
256
92
.4 1
38
132
95
.7 9
90
927
93
.6
Ken
tuck
y
336
3
17
94.4
241
2
24
93.0
306
2
81
91.8
264
2
45
92.8
1,1
47
1,0
67
93.0
Lo
uisi
ana
− P
N
525
4
50
85.7
416
3
70
88.9
269
2
37
88.1
144
1
37
95.1
1,3
54
1,1
94
88.2
Mai
ne
23
1
9
82.6
21
2
0
95.2
32
3
1
96.9
30
2
5
83.3
106
9
5
89.6
Mar
ylan
d
63
5
9
93.7
50
4
1
82.0
99
9
3
93.9
73
6
8
93.2
285
2
61
91.6
Mas
sach
uset
ts
110
9
9
90.0
25
2
0
80.0
652
6
22
95.4
77
6
9
89.6
864
8
10
93.8
Mic
hig
an
350
3
29
94.0
241
2
29
95.0
447
4
26
95.3
406
3
77
92.9
1,4
44
1,3
61
94.3
Min
neso
ta
429
3
93
91.6
469
4
36
93.0
583
5
37
92.1
150
1
29
86.0
1,6
31
1,4
95
91.7
Mis
siss
ipp
i 2
45
209
85
.3 6
4
45
70
.3 4
25
382
89
.9 8
9
77
86
.5 8
23
713
86
.6
Mis
sour
i 2
57
227
88
.3 1
66
146
88
.0 7
72
734
95
.1 2
13
193
90
.6 1
,408
1
,300
92
.3
Mo
ntan
a
55
5
5
100.
0 3
1
30
96
.8 3
9
39
10
0.0
6
6
100.
0 1
31
130
99
.2
Neb
rask
a
87
7
4
85.1
126
1
13
89.7
181
1
60
88.4
78
6
6
84.6
472
4
13
87.5
®

National Council of State Boards of Nursing, Inc. (NCSBN) | 2011
44 PART II – 2010 NCLEX® EXAMINATION STATISTICSTa
ble
11.
fir
st-T
ime,
u.S
.-e
duc
ated
Can
did
ates
Tak
ing
the
NC
LeX
-PN
® e
xam
inat
ion
(Jan
. 1 -
Dec
. 31,
201
0
Juri
sdic
tio
n
Jan
1 -
Mar
ch 3
1, 2
010
Ap
ril 1
- J
une
30, 2
010
July
1 -
Sep
30,
201
0o
ct 1
- D
ec 3
1, 2
010
Tota
l Jan
1 -
Dec
31,
201
0
Can
did
ates
P
asse
d%
Can
did
ates
P
asse
d%
Can
did
ates
P
asse
d%
Can
did
ates
P
asse
d%
Can
did
ates
P
asse
d%
Nev
ada
1
7
15
88
.2 5
4
80
.0 2
0
17
85
.0 3
3
10
0.0
45
3
9
86.7
New
Ham
psh
ire
75
6
5
86.7
122
1
09
89.3
54
4
8
88.9
33
2
2
66.7
284
2
44
85.9
New
Jer
sey
5
20
362
69
.6 7
19
475
66
.1 8
73
650
74
.5 8
23
636
77
.3 2
,935
2
,123
72
.3
New
Mex
ico
3
5
34
97
.1 4
0
40
10
0.0
82
7
8
95.1
31
3
1
100.
0 1
88
183
97
.3
New
Yo
rk
468
3
74
79.9
504
3
88
77.0
1,3
32
1,1
40
85.6
1,2
82
1,0
52
82.1
3,5
86
2,9
54
82.4
No
rth
Car
olin
a
185
1
73
93.5
129
1
23
95.4
561
5
43
96.8
191
1
79
93.7
1,0
66
1,0
18
95.5
No
rth
Dak
ota
1
5
14
93
.3 4
8
47
97
.9 9
7
96
99
.0 6
6
10
0.0
166
1
63
98.2
No
rthe
rn M
aria
na Is
land
4
1
25
.0 4
4
10
0.0
4
3
75.0
1
0
0.0
13
8
61
.5
Ohi
o
1,1
00
993
90
.3 1
,064
9
50
89.3
1,5
36
1,4
29
93.0
1,5
26
1,4
12
92.5
5,2
26
4,7
84
91.5
Okl
aho
ma
2
08
195
93
.8 2
16
197
91
.2 5
95
548
92
.1 2
36
214
90
.7 1
,255
1
,154
92
.0
Ore
go
n
37
3
6
97.3
84
7
6
90.5
187
1
81
96.8
111
1
09
98.2
419
4
02
95.9
Pen
nsyl
vani
a
544
4
77
87.7
432
3
75
86.8
653
6
07
93.0
714
6
68
93.6
2,3
43 2
,127
90
.8
Rho
de
Isla
nd
13
1
2
92.3
9
9
100.
0 3
3
10
0.0
23
2
1
91.3
48
4
5
93.8
So
uth
Car
olin
a
105
9
9
94.3
131
1
25
95.4
246
2
33
94.7
129
1
24
96.1
611
5
81
95.1
So
uth
Dak
ota
4
1
35
85
.4 1
7
13
76
.5 1
24
118
95
.2 1
7
16
94
.1 1
99
182
91
.5
Ten
ness
ee
297
2
76
92.9
509
4
81
94.5
530
5
12
96.6
370
3
37
91.1
1,7
06
1,6
06
94.1
Tex
as
1,3
92
1,2
48
89.7
918
8
00
87.2
203
1
182
0
89.6
128
8
112
7
87.5
5,6
29
4,9
95
88.7
Uta
h
136
1
36
100.
0 2
69
266
98
.9 1
31
129
98
.5 5
5
54
98
.2 5
91
585
99
.0
Ver
mo
nt
3
3
100.
0 4
4
10
0.0
155
1
54
99.4
6
5
83.3
168
1
66
98.8
Virg
in Is
land
s
2
1
50.0
9
4
44.4
3
0
0.0
10
4
40
.0 2
4
9
37.5
Virg
inia
5
29
398
75
.2 6
06
463
76
.4 7
59
593
78
.1 5
16
415
80
.4 2
,410
1
,869
77
.6
Was
hing
ton
1
31
126
96
.2 2
41
232
96
.3 4
09
388
94
.9 2
56
234
91
.4 1
,037
9
80
94.5
Wes
t V
irgin
ia −
PN
8
5
77
90
.6 3
7
29
78
.4 2
91
261
89
.7 7
9
70
88
.6 4
92
437
88
.8
Wis
cons
in
265
2
55
96.2
279
2
68
96.1
393
3
81
97.0
114
1
09
95.6
1,0
51
1,0
13
96.4
Wyo
min
g
26
2
6
100.
0 2
3
23
10
0.0
59
5
8
98.3
10
1
0
100.
0 1
18
117
99
.2
To
tal
15,
093
1
3,02
7
86.3
13,
916
1
1,86
2
85.2
22,
951
2
0,45
9
89.1
14,
850
1
2,82
3
86.4
66,
810
5
8,17
1
87.1
®
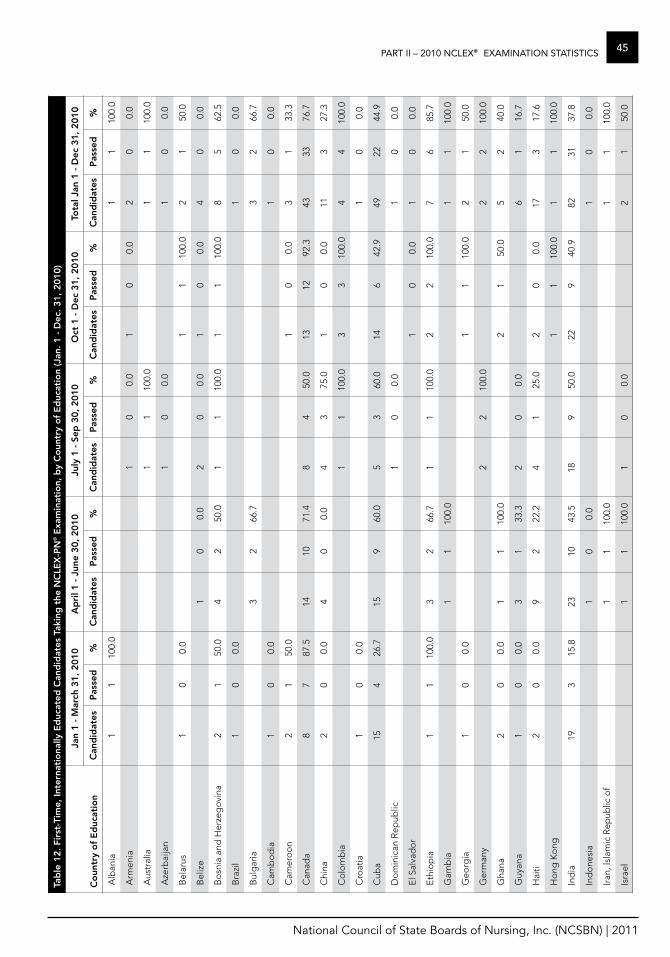
National Council of State Boards of Nursing, Inc. (NCSBN) | 2011
45PART II – 2010 NCLEX® EXAMINATION STATISTICSTa
ble
12.
fir
st-T
ime,
Inte
rnat
iona
lly e
duc
ated
Can
did
ates
Tak
ing
the
NC
LeX
-PN
® e
xam
inat
ion,
by
Co
untr
y o
f e
duc
atio
n (J
an. 1
- D
ec. 3
1, 2
010)
Co
untr
y o
f e
duc
atio
n
Jan
1 -
Mar
ch 3
1, 2
010
Ap
ril 1
- J
une
30, 2
010
July
1 -
Sep
30,
201
0o
ct 1
- D
ec 3
1, 2
010
Tota
l Jan
1 -
Dec
31,
201
0
Can
did
ates
P
asse
d%
Can
did
ates
P
asse
d%
Can
did
ates
P
asse
d%
Can
did
ates
P
asse
d%
Can
did
ates
P
asse
d%
Alb
ania
1
110
0.0
11
100.
0
Arm
enia
1
00.
01
00.
02
00.
0
Aus
tral
ia
11
100.
01
110
0.0
Aze
rbai
jan
1
00.
01
00.
0
Bel
arus
1
00.
01
110
0.0
21
50.0
Bel
ize
1
00.
02
00.
01
00.
04
00.
0
Bo
snia
and
Her
zeg
ovi
na
21
50.0
42
50.0
11
100.
01
110
0.0
85
62.5
Bra
zil
10
0.0
10
0.0
Bul
gar
ia
32
66.7
32
66.7
Cam
bo
dia
1
00.
01
00.
0
Cam
ero
on
2
150
.01
00.
03
133
.3
Can
ada
8
787
.514
1071
.48
450
.013
1292
.343
3376
.7
Chi
na
20
0.0
40
0.0
43
75.0
10
0.0
113
27.3
Co
lom
bia
1
110
0.0
33
100.
04
410
0.0
Cro
atia
1
00.
01
00.
0
Cub
a
154
26.7
159
60.0
53
60.0
146
42.9
4922
44.9
Do
min
ican
Rep
ublic
1
00.
01
00.
0
El S
alva
do
r
10
0.0
10
0.0
Eth
iop
ia
11
100.
03
266
.71
110
0.0
22
100.
07
685
.7
Gam
bia
1
110
0.0
11
100.
0
Geo
rgia
1
00.
01
110
0.0
21
50.0
Ger
man
y
22
100.
02
210
0.0
Gha
na
20
0.0
11
100.
02
150
.05
240
.0
Guy
ana
1
00.
03
133
.32
00.
06
116
.7
Hai
ti
20
0.0
92
22.2
41
25.0
20
0.0
173
17.6
Ho
ng K
ong
1
110
0.0
11
100.
0
Ind
ia
193
15.8
2310
43.5
189
50.0
229
40.9
8231
37.8
Ind
one
sia
1
00.
01
00.
0
Iran
, Isl
amic
Rep
ublic
of
11
100.
01
110
0.0
Isra
el
11
100.
01
00.
02
150
.0
®
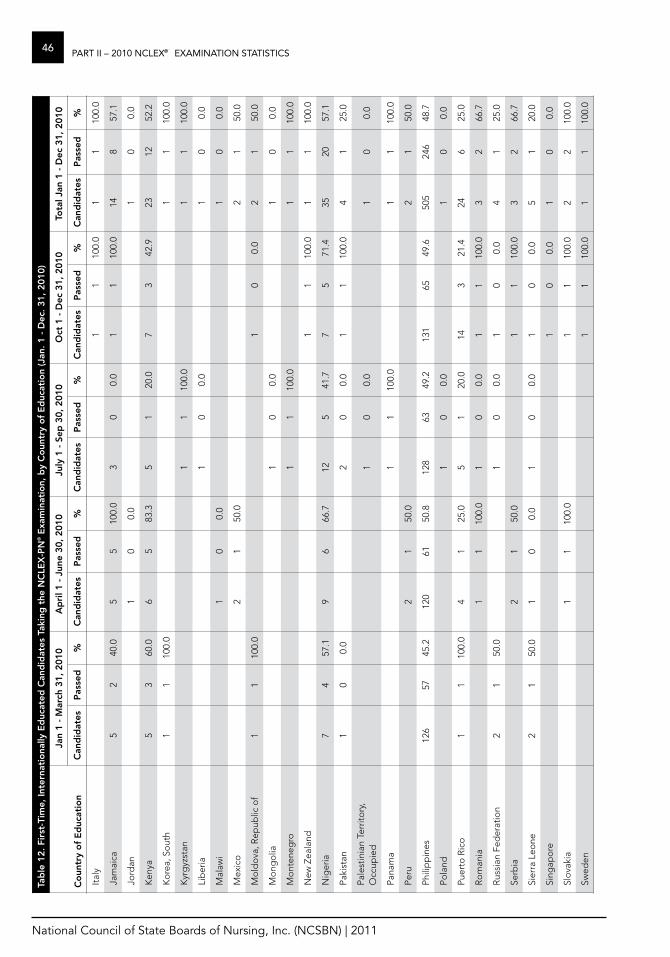
National Council of State Boards of Nursing, Inc. (NCSBN) | 2011
46 PART II – 2010 NCLEX® EXAMINATION STATISTICSTa
ble
12.
fir
st-T
ime,
Inte
rnat
iona
lly e
duc
ated
Can
did
ates
Tak
ing
the
NC
LeX
-PN
® e
xam
inat
ion,
by
Co
untr
y o
f e
duc
atio
n (J
an. 1
- D
ec. 3
1, 2
010)
Co
untr
y o
f e
duc
atio
n
Jan
1 -
Mar
ch 3
1, 2
010
Ap
ril 1
- J
une
30, 2
010
July
1 -
Sep
30,
201
0o
ct 1
- D
ec 3
1, 2
010
Tota
l Jan
1 -
Dec
31,
201
0
Can
did
ates
P
asse
d%
Can
did
ates
P
asse
d%
Can
did
ates
P
asse
d%
Can
did
ates
P
asse
d%
Can
did
ates
P
asse
d%
Ital
y
11
100.
01
110
0.0
Jam
aica
5
240
.05
510
0.0
30
0.0
11
100.
014
857
.1
Jo
rdan
1
00.
01
00.
0
Ken
ya
53
60.0
65
83.3
51
20.0
73
42.9
2312
52.2
Ko
rea,
So
uth
1
110
0.0
11
100.
0
Kyr
gyz
stan
1
110
0.0
11
100.
0
Lib
eria
1
00.
01
00.
0
Mal
awi
10
0.0
10
0.0
Mex
ico
2
150
.02
150
.0
Mo
ldo
va, R
epub
lic o
f 1
110
0.0
10
0.0
21
50.0
Mo
ngo
lia
10
0.0
10
0.0
Mo
nten
egro
1
110
0.0
11
100.
0
New
Zea
land
1
110
0.0
11
100.
0
Nig
eria
7
457
.19
666
.712
541
.77
571
.435
2057
.1
Pak
ista
n
10
0.0
20
0.0
11
100.
04
125
.0
Pal
estin
ian
Terr
itory
, O
ccup
ied
1
00.
01
00.
0
Pan
ama
1
110
0.0
11
100.
0
Per
u
21
50.0
21
50.0
Phi
lipp
ines
12
657
45.2
120
6150
.812
863
49.2
131
6549
.650
524
648
.7
Po
land
1
00.
01
00.
0
Pue
rto
Ric
o
11
100.
04
125
.05
120
.014
321
.424
625
.0
Ro
man
ia
11
100.
01
00.
01
110
0.0
32
66.7
Rus
sian
Fed
erat
ion
2
150
.01
00.
01
00.
04
125
.0
Ser
bia
2
150
.01
110
0.0
32
66.7
Sie
rra
Leo
ne
21
50.0
10
0.0
10
0.0
10
0.0
51
20.0
Sin
gap
ore
1
00.
01
00.
0
Slo
vaki
a
11
100.
01
110
0.0
22
100.
0
Sw
eden
1
110
0.0
11
100.
0
®
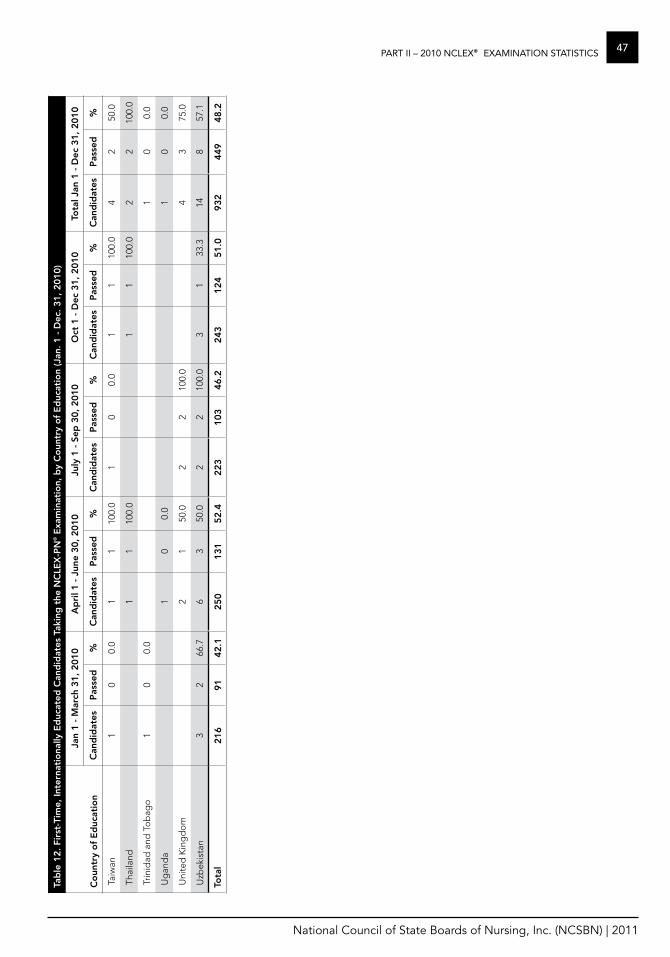
National Council of State Boards of Nursing, Inc. (NCSBN) | 2011
47PART II – 2010 NCLEX® EXAMINATION STATISTICSTa
ble
12.
fir
st-T
ime,
Inte
rnat
iona
lly e
duc
ated
Can
did
ates
Tak
ing
the
NC
LeX
-PN
® e
xam
inat
ion,
by
Co
untr
y o
f e
duc
atio
n (J
an. 1
- D
ec. 3
1, 2
010)
Co
untr
y o
f e
duc
atio
n
Jan
1 -
Mar
ch 3
1, 2
010
Ap
ril 1
- J
une
30, 2
010
July
1 -
Sep
30,
201
0o
ct 1
- D
ec 3
1, 2
010
Tota
l Jan
1 -
Dec
31,
201
0
Can
did
ates
P
asse
d%
Can
did
ates
P
asse
d%
Can
did
ates
P
asse
d%
Can
did
ates
P
asse
d%
Can
did
ates
P
asse
d%
Tai
wan
1
00.
01
110
0.0
10
0.0
11
100.
04
250
.0
Tha
iland
1
110
0.0
11
100.
02
210
0.0
Trin
idad
and
To
bag
o
10
0.0
10
0.0
Ug
and
a
10
0.0
10
0.0
Uni
ted
Kin
gd
om
2
150
.02
210
0.0
43
75.0
Uzb
ekis
tan
3
266
.76
350
.02
210
0.0
31
33.3
148
57.1
Tota
l21
691
42.1
250
131
52.4
223
103
46.2
243
124
51.0
932
449
48.2
®

National Council of State Boards of Nursing, Inc. (NCSBN) | 2011
48 PART II – 2010 NCLEX® EXAMINATION STATISTICSfi
gur
e 7.
NC
LeX
-PN
® P
ass
rat
es f
or
firs
t-Ti
me,
u.S
.-e
duc
ated
Can
did
ates
*Ap
r 19
94 C
om
put
er A
dap
tive
Test
(CA
T) b
egin
s. P
assi
ng S
tand
ard
-0.
56 lo
gits
.
**O
ct 1
996
Pass
ing
Sta
ndar
d c
hang
ed fr
om
-0.
56 t
o -
0.51
log
its.
**
*Ap
r 19
99 P
assi
ng S
tand
ard
cha
nged
fro
m -
0.51
to
-0.
47 lo
gits
.
****
Ap
r 20
05 P
assi
ng S
tand
ard
cha
nged
fro
m -
0.47
to
-0.
42 lo
gits
.
****
*Ap
r 20
08 P
assi
ng S
tand
ard
cha
nged
fro
m -
0.42
to
-0.
37 lo
gits
.
8991
90
8687
8486
8487
8891
8887
8584
8691
9190
8887
8583
8585
8688
8887
8684
8485
9192
9290
8988
8889
8891
9190
9090
8888
8988
9088
8685
8483
8487
8789
8685
8483
8586
020406080100
Percent Passing
Year
Adm
inis
tere
dJa
nA
prJu
lO
ct
®

National Council of State Boards of Nursing, Inc. (NCSBN) | 2011
49PART II – 2010 NCLEX® EXAMINATION STATISTICSfi
gur
e 8.
NC
LeX
-PN
® P
ass
rat
es f
or
All
Can
did
ates
77
8280
7576
7273
7376
7882
7878
7774
77
8380
8077
7572
6971
7274
7676
7675
7272
75
8587
8784
8281
8080
8084
8484
8483
8180
8279
8280
7776
7373
7477
7679
7774
7472
7577
020406080100
Percent Passing
Year
Adm
inis
tere
dJa
nA
prJu
lO
ct
®
*Ap
r 19
94 C
om
put
er A
dap
tive
Test
(CA
T) b
egin
s. P
assi
ng S
tand
ard
-0.
56 lo
gits
.
**O
ct 1
996
Pass
ing
Sta
ndar
d c
hang
ed fr
om
-0.
56 t
o -
0.51
log
its.
**
*Ap
r 19
99 P
assi
ng S
tand
ard
cha
nged
fro
m -
0.51
to
-0.
47 lo
gits
.
****
Ap
r 20
05 P
assi
ng S
tand
ard
cha
nged
fro
m -
0.47
to
-0.
42 lo
gits
.
****
*Ap
r 20
08 P
assi
ng S
tand
ard
cha
nged
fro
m -
0.42
to
-0.
37 lo
gits
.

National Council of State Boards of Nursing, Inc. (NCSBN) | 2011
50 PART II – 2010 NCLEX® EXAMINATION STATISTICSfi
gur
e 9.
NC
LeX
-PN
® A
nnua
l Pas
s r
ates
, Ap
ril 1
994
- D
ecem
ber
201
0
8382
8380
7876
7475
7679
8080
7978
7676
78
9091
9189
8786
8586
8788
8989
8887
8686
87
020406080100
Percent Passing
Year
Adm
inis
tere
dA
ll Ca
ndid
ates
Firs
t-Ti
me,
U.S
.-Edu
cate
d
®
*Ap
r. 19
94: C
om
put
er a
dap
tive
test
ing
(CA
T) b
egin
s. P
assi
ng S
tand
ard
is -
0.56
log
its.
**O
ct. 1
996:
Pas
sing
Sta
ndar
d c
hang
ed fr
om
-0.
56 t
o -
0.51
log
its.
**
*Ap
r.199
9: P
assi
ng S
tand
ard
cha
nged
fro
m -
0.51
to
-0.
47 lo
gits
.
**
**A
pr.
2005
: Pas
sing
Sta
ndar
d c
hang
ed fr
om
-0.
47 t
o -
0.42
log
its.
****
*Ap
r. 20
08: P
assi
ng S
tand
ard
cha
nged
fro
m -
0.42
to
-0.
37 lo
gits
.
.

National Council of State Boards of Nursing, Inc. (NCSBN) | 2011
51PART II – 2010 NCLEX® EXAMINATION STATISTICSfi
gur
e 10
. NC
LeX
-PN
® V
olu
me
for
firs
t-Ti
me,
u.S
.-e
duc
ated
Can
did
ates
0
10,0
00
20,0
00
30,0
00
40,0
00
50,0
00
60,0
00
70,0
00
80,0
00
1994
1995
1996
1997
1998
1999
2000
2001
2002
2003
2004
2005
2006
2007
2008
2009
2010
Number Examined
Year
Adm
inis
tere
d
Jan
Apr
Jul
Oct
®
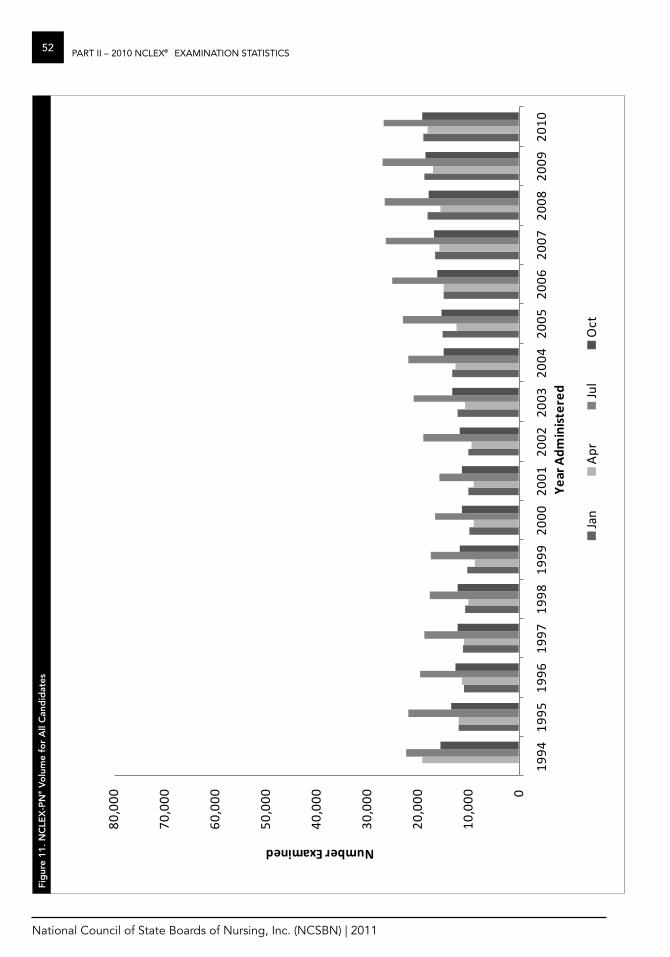
National Council of State Boards of Nursing, Inc. (NCSBN) | 2011
52 PART II – 2010 NCLEX® EXAMINATION STATISTICSfi
gur
e 11
. NC
LeX
-PN
® V
olu
me
for
All
Can
did
ates
0
10,0
00
20,0
00
30,0
00
40,0
00
50,0
00
60,0
00
70,0
00
80,0
00
1994
1995
1996
1997
1998
1999
2000
2001
2002
2003
2004
2005
2006
2007
2008
2009
2010
Number Examined
Year
Adm
inis
tere
d
Jan
Apr
Jul
Oct
®

National Council of State Boards of Nursing, Inc. (NCSBN) | 2011
53PART II – 2010 NCLEX® EXAMINATION STATISTICSfi
gur
e 12
. NC
LeX
-PN
® A
nnua
l Vo
lum
e, A
pri
l 199
4 -
Dec
emb
er 2
010
0
10,0
00
20,0
00
30,0
00
40,0
00
50,0
00
60,0
00
70,0
00
80,0
00
90,0
00
1994
1995
1996
1997
1998
1999
2000
2001
2002
2003
2004
2005
2006
2007
2008
2009
2010
Number Examined
Year
Adm
inis
tere
d
All
Cand
idat
esFi
rst-
Tim
e, U
.S.-E
duca
ted
®
111 E. Wacker Drive, Suite 2900Chicago, IL 60601-4277312.525.3600312.279.1032 faxwww.ncsbn.org ISBN# 978-0-9826465-8-8


![[RTF] Saunders Comprehensive Review for the NCLEX-RN® Examination, 5th Edition Pharmacology Test Bank MULTIPLE CHOICE 1. The nurse is caring for a client in labor. The nurse reviews](https://img.pdfslide.us/doc/110x75/5b4f8f3d7f8b9a346e8c82bb/rtf-saunders-comprehensive-review-for-the-nclex-rn-examination-5th-edition.jpg)