Embed Size (px)
Citation preview

Statistical Release 27 July 2017
National Travel Survey:England 2016
Results from the 2016 National Travel Survey show that in recent years there has been a trend of steadily falling trip rates. In 2016 people made nearly 15 trips a week on average (774 trips on average in the year) excluding short walks. This was 13% lower than 2002. People made an average of 954 trips in 2016 including short walks. This is an average of around 18 trips a week.
Average trip distance and time spent travelling for trips excluding short walks were also lower than in 2002. The average distance travelled (6,396 miles) was 10% lower than in 2002, and 3% lower than in 2015 but similar to the 2014 figure.
TripsAverage trips per person per year excluding short walks
886 trips
774 tripsV 13%
2002 2016Note: figures in charts exclude short walks
DistanceAverage distance travelled per year excluding short walks
7,104 miles
6,396milesV 10%
2002 2016
Most of the trips people made in 2016 were by car, either as a driver or a passenger (62%), or by walking (25%). 87% of all trips were accounted for by these modes of transport.
78% of the total distance people travelled in 2016 was by car, either as a driver or a passenger.
About this release
The National Travel
Survey is a household
survey of personal
travel by residents of
England travelling within
Great Britain, from data
collected via interviews
and a one week travel
diary.
The NTS is part of a
continuous survey that
began in 1988, following
ad-hoc surveys from the
1960s, which enables
analysis of patterns and
trends.
Some key uses of the
data include describing
patterns patterns, for
example how different
groups of people travel,
monitoring trends
in travel, including
sustainable modes;
assessing the potential
equality impacts of
transport policies on
different groups; and
contributing to evaluation
of the impact of policies.
RESPONSIBLE STATISTICIANS: Darren Stillwell - Claire Pini - John Cummings - Abbas Fazil
FURTHER INFORMATION: : [email protected]: 020 7944 3231 Public: 020 7944 3097 Email

National Travel Survey: England 2016 - Page 2
Index Page
Main results 3Introduction to the 2016 publication 4Accessing NTS data 4 Thank you 4Short walks experiment in 2016 5Impact of the change 5Comparability of data between 2016 and earlier years 5Presentation of results 6Long-term trends in trips, trip times and distance 7Trends in car availability 8Trends in driving licence holding 9Young drivers 10Non-drivers 10Recent trends in trips, trip times and distance 11Trends in driver and passenger miles 11Trends in household car mileage 12Trends in walking trips and miles 13Trends in cycling ownership, trips and miles 14Trends in public transport trips and miles 15Share of trips and distance travelled by mode 16Long distance trips 17Share of trips and distance travelled by purpose 18Infographic: how people travel - walking 19Infographic: how people travel - cycling 20Infographic: how people travel - car 21Infographic: how people travel - car [2] 22Infographic: how people travel - car [3] 23Infographic: how people travel - bus 24Infographic: how people travel - surface rail 25Infographic: how people travel - air 26Infographic: why people travel - shopping 27Infographic: why people travel - commuting 28Infographic: why people travel - business 29Infographic: why people travel - visiting friends 30Infographic: why people travel - other leisure 31Infographic: why people travel - education and escort education 32 Notes and background information 33

National Travel Survey England 2016 Main Results
2002 2016
886 trips
7,104 miles
355 hours
Average trips per person per year, excluding short walks
Trips [NTS0101]Average distance travelled per year, excluding short walks
Distance [NTS0101]Average time travelled per year, excluding short walks
Time [NTS0101]
2002 2016 2002 2016
774trips 13%
How we travelled [NTS0301, 0302]
Modal share Trips Distance
Why we travelled [NTS0401]
Car ownership [NTS0205] Licence holding [NTS0201]
The most common trip purposes were:
Shopping 19%
BANK
LIBRARY
Personal business 18%
Cycling [NTS0608, NTS0303, NTS0305]
of households owned at least one car
77%
32.4 millionlicence holders
73% of residents(17+) held a driving licence
80% 67%of males of females
People with access to a bicycle, by age (2014-2016)
Average cycling trips and distance per year
Gender [NTS0601, 0605]
927 9817,178
Women travelled more often than men, but men travelled further
trips per yeardistance(miles) 5,839
6,396 miles
10%
332 hours
6%
23%
43%
34%
83%71%
45%33%
41%50%
43%22%
5-1011-1617-2021-2930-3940-4950-59
60+
Other
25%
78%62%
3%
5%
2%
2%
4%
3%
10%
1%
4%
For further information:
Search ‘National
Travel Survey on
GOV.UK
020 7344 3097
2002 2016
39 miles
15 trips
18 trips
53 milesDistance
Trips
Estimates based on small sample sizes are subject to sampling variation and should be interpreted with caution.

National Travel Survey: England 2016 - Page 4
Introduction to the 2016 publication
The 2016 National Travel Survey (NTS) is the latest in a series of household surveys designed to provide a consistent source of data on personal travel behaviour across England.
This statistical release is the first of two publications this year based on National Travel Survey (NTS) data.
We have acted on two pieces of feedback from users in developing this publication. Firstly, that the data be released earlier and secondly that the statistical release is shorter.
On the first point, we are making the most recent data available in July for the first time. Secondly, this publication includes only some top level results but will allow users to have access to the published tables and data via the Data Service to do research earlier than usual. Due to the early release, we have only updated about half of the main tables for this first statistical release.
We will follow up with a longer statistical release with more detailed analysis and a complete set of tables later on in the year.
Users should also note the impact of the experiment on short walks that is described on page 5 and the impact this has on the comparability of data.
We always welcome feedback to help ensure that the survey meets the needs of users, and any feedback provided will help inform the future design and development of the survey.
Accessing NTS data
In addition to the published statistics described in this document together with accompanying statistical tables, the underlying dataset and guidance in analysing it can be accessed from the UK Data Service for users who wish to explore the data for themselves.
Thank you
The 2016 survey fieldwork, data input, coding and some analysis was carried out by the National Centre for Social Research. Special thanks are due to the project team, the coders and to all the interviewers and especially Alun Humphrey, Peter Cornick, and Katriina Lepanjuuri.
The help of the members of the public who gave their time to respond is gratefully acknowledged.
Further information about the NTS and its methodologyA range of supporting information is available which provides background to understand the source of the statistics presented in this publication, all available from the NTS collections page on GOV.UK.
What travel is included?The NTS only includes personal travel within Great Britain, by residents of private households in England, along the public highway, by rail or by air. Travel off-road, or for commerical purposes (to deliver goods or to convey a vehicle or passengers) is not included.
What is a trip?The basic unit of travel in the NTS is a trip, which is defined as a one-way course of travel with a single main purpose.
What is a stage?Trips consist of one or more stages. A new stage is defined when there is a change in the mode of transport.

National Travel Survey: England 2016 - Page 5
Short walks experiment in 2016 The data published here include the results of the experiment in 2016 to collect short walks (those walks of less than a mile in length) on day 1 for half of the sample, and day 7 for the other half of the sample. This is a significant methodological improvement, as previous research (see box opposite) has concluded that collecting short walks on day 7 results in an under-reporting of these types of trips.
The figures for 2016 have been weighted using the information from both samples to produce NTS results as if all the respondents for 2016 had reported short walks on day 1.
Impact of the change
A full description of the impact of this change in methodology is described in Annex T of the Technical Report. In terms of the headline findings for adults, the effect was substantial. Collecting details of short walks on day 1 of the travel week increased the reporting of the prevalence of short walks and the number of short walks reported. Some 25.9% of adult respondents reported taking at least one short walk when reporting on day 1 compared with 21.3% when reporting on day 7. The average number of walks reported by all adults was 0.71 on day 1 compared with 0.57 for day 7.
Comparability of data between 2016 and earlier years
The impact of this improvement in the methodology for capturing short walks has meant a break in the time series between 2015 and 2016 for total trips, total distance and total time and for walking trips, distance and time in this publication.
We will be reweighting data back to 2002 and will present revised data in a publication later in the year. Until this time, users should exercise caution when comparing 2016 with previous years for certain types of analyses.
We have made the decision to publish 2016 data for three reasons. Firstly, it represents the best data available at the present time for 2016. Secondly, time series excluding short walks; individual, household and vehicle analyses; and analyses solely for 2016 will be unaffected; and thirdly, we wanted users to have access to the data as soon as possible to conduct their own analysis.
Improved measurement of short walks in the NTSThe Department ran a consultation on the collection of short walk data in the NTS in 2014, and experiments during 2013 and 2015 which concluded that there is under-reporting of short walks in the NTS. In 2016, the NTS sample was split and this data has been used to develop weights to uplift the day 7 sample so that NTS results for 2016 will be published as if all short walks were collected on day 1.
In 2017, short walks for all respondents will be collected on day 1 of the travel diary.

National Travel Survey: England 2016 - Page 6
Presentation of results
So, with those points in mind, users should also note the following for the publication and the set of tables published here:
● Tables and analysis not trip-related (for example, tables on driving licence holding, household car access and household vehicles) are not affected.
● Any analyses based on 2016 only (i.e. cross-sectional analysis) uses figures that include the new short walks weighting as this represents our best estimate of travel behaviour in 2016.
● For time series tables, we have noted the breaks in the series and added additional rows to tables to show figures exclude short walks back to 2002, where possible.
● Time series analysis in this publication relating to totals and walks will use figures that exclude short walks. While modes of transport other than walking may be impacted by the reweighting, we have currently assumed they will not, and have produced time series in the same way as previous NTS publications.
We have made a couple of other changes to tables as follows:
● For tables that are broken down by mode of transport, we have used the same categories for each table as much as possible to provide consistency for users. Previously there had been different categories shown in different tables. While this means that there will be more missing values, it means users can compare specific modes of transport more easily across tables.
● Finally, we have removed the Great Britain time series data and the charts from spreadsheets to reduce the number of worksheets associated with each table. Workbooks will now only contain tables for England, and the time series data for England where relevant.
NTS standard errorsAs these statistics are derived from a sample survey resulting estimates can fluctuate as a result of sample variability. Therefore users should be careful when drawing conclusions, particularly from short-term changes.
A detailed report on standard errors for selected NTS variables (based on 2009 data) is available. This will be updated later this year.

National Travel Survey: England 2016 - Page 7
Long-term trends in trips, trip times and distance
The National Travel Survey has collected data on personal travel in a broadly consistent way since the 1970s, meaning it is a key source for monitoring trends in travel behaviour.
The average number of trips per person and total time spent travelling have remained broadly stable since the 1970s. What has changed over this period is the average distance travelled, which has grown as a result of increasing average trip lengths. This is largely the result of changes in how - not why - we travel, in particular increasing car availability and use.
1972/734,476 miles353 hours956 tripstravelled per person per year on average (GB residents)
20166,499 miles (+45%)
367 hours (+4%)
954 trips (<-0.5%)
travelled per person per year on average (England residents)
Chart 1: Trends in trips, distance travelled and time spent travelling: England 1972/73-2016 [NTS0101]
Index 1972/73 = 100
0
20
40
60
80
100
120
140
160
180
1975/76
1985/86
1995/97
2005 2016
Trips
Distance
Time
Note: due to improvements in methodology, there is an increase in short walks (and thus total trips) in 2016, compared to earlier years. See page 5 of this document.
Over 50 years of the NTSAlthough the time series presented here begins in 1972/73, the first NTS was carried out in 1965.
The 1965 survey had some notable differences - in particular, data on short walks were not collected and so results are not presented as part of the standard data tables.
To mark the 50th anniversary of the first NTS data collection, a factsheet including figures estimated from the 1965 survey is available on the NTS 2014 page.
Note on trend dataFigures from 1995 onwards are weighted, causing a one-off change in the NTS series. Data prior to 2002 are based on combined survey years (e.g. 1995/97) as the annual sample size was smaller.
Figures are for Great Britain residents to 1989, and England residents thereafter. The majority of the comparisons in this publication are not materially affected by this change.
For this time series analysis only, the 2016 figures include short walks (see page 5).
National Travel Survey: England 2016 - Page 8
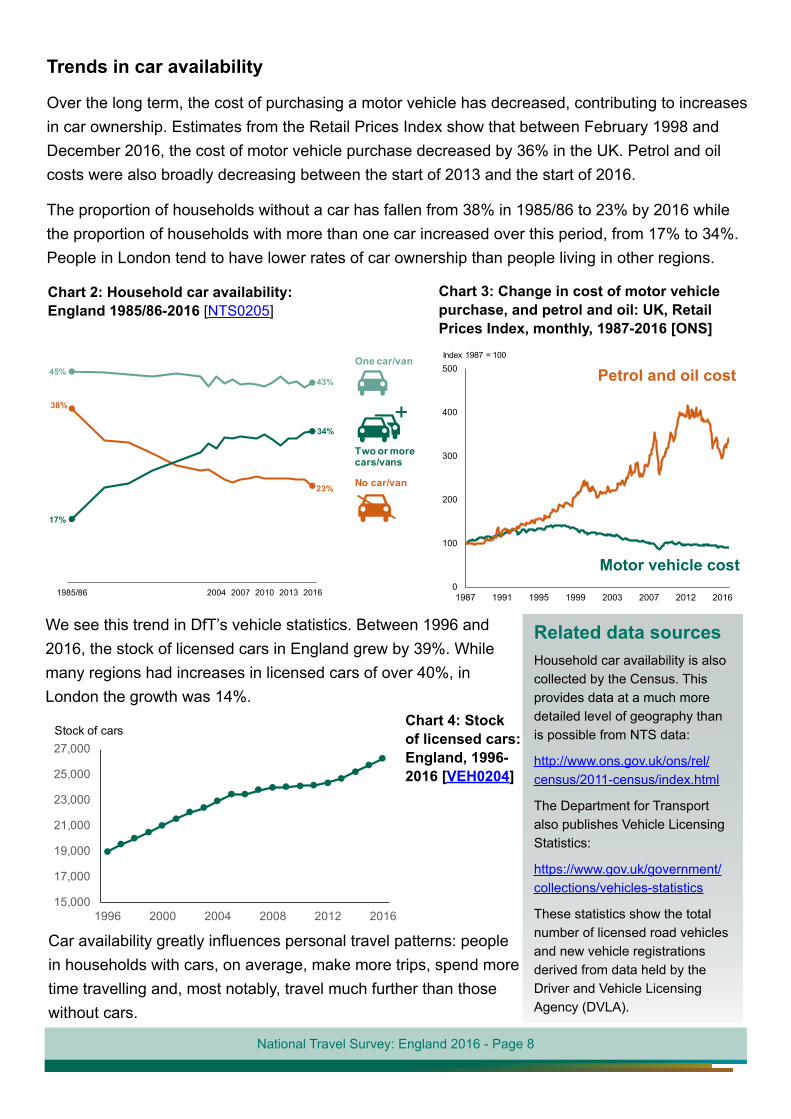
Trends in car availability
Over the long term, the cost of purchasing a motor vehicle has decreased, contributing to increases in car ownership. Estimates from the Retail Prices Index show that between February 1998 and December 2016, the cost of motor vehicle purchase decreased by 36% in the UK. Petrol and oil costs were also broadly decreasing between the start of 2013 and the start of 2016.
The proportion of households without a car has fallen from 38% in 1985/86 to 23% by 2016 while the proportion of households with more than one car increased over this period, from 17% to 34%. People in London tend to have lower rates of car ownership than people living in other regions.
Chart 2: Household car availability: England 1985/86-2016 [NTS0205]
45%43%
38%
23%
17%
34%
1985/86 2004 2007 2010 2013 2016
One car/van
Two or morecars/vans
No car/van
Chart 3: Change in cost of motor vehicle purchase, and petrol and oil: UK, Retail Prices Index, monthly, 1987-2016 [ONS]
0
100
200
300
400
500
1987 1991 1995 1999 2003 2007 2012 2016
Index 1987 = 100
Petrol and oil cost
Motor vehicle cost
We see this trend in DfT’s vehicle statistics. Between 1996 and 2016, the stock of licensed cars in England grew by 39%. While many regions had increases in licensed cars of over 40%, in London the growth was 14%.
Chart 4: Stock of licensed cars: England, 1996-2016 [VEH0204]
15,000
17,000
19,000
21,000
23,000
25,000
27,000
1996 2000 2004 2008 2012 2016
Stock of cars
Car availability greatly influences personal travel patterns: people in households with cars, on average, make more trips, spend more time travelling and, most notably, travel much further than those without cars.
Related data sourcesHousehold car availability is also collected by the Census. This provides data at a much more detailed level of geography than is possible from NTS data:
http://www.ons.gov.uk/ons/rel/census/2011-census/index.html
The Department for Transport also publishes Vehicle Licensing Statistics:
https://www.gov.uk/government/collections/vehicles-statistics
These statistics show the total number of licensed road vehicles and new vehicle registrations derived from data held by the Driver and Vehicle Licensing Agency (DVLA).

National Travel Survey: England 2016 - Page 9
Trends in driving licence holders
The increasing access to cars is also reflected by trends in driving licence holding. 73% of all adults aged 17+ in England held a full car driving licence in 2016. This was an increase from 48% in the mid 1970s, and represented over 32 million licence holders.
While over the long term licence holding among both men and women has increased, the rate of increase has been much greater for women. The proportion of males holding a licence has been flat since the early-1990s. For women it has continued to increase, reaching 67% in 2016, compared to 80% of men.Chart 5: Full car driving licence holders by gender: England 1975/76-2016 [NTS0201]
69%80%
29%
67%
1975/76 1985/86 1992/94 2002 2008 2012 2016
The increase in driving licence holding has been greatest among older age groups whereas the proportion of young adults (aged 17-20) with a full driving licence has decreased since the 1990s when it was highest for this age group.
Chart 6: Full car driving licence holders by age and gender: England 1975/76 and 2016 [NTS0201]
0%
20%
40%
60%
80%
100%
17-20 21-29 30-39 40-49 50-59 60-69 70+ 17-20 21-29 30-39 40-49 50-59 60-69 70+
1992/94
2016
2016
1992/94
Related data sourcesDfT publishes statistics about driving tests and instructors.
DVLA publishes a breakdown of licence holders by age and gender at http://data.gov.uk/dataset/driving-licence-data

National Travel Survey: England 2016 - Page 10
Young drivers
Young drivers play a huge role in the trends over time in the total number of licences as the most common age group for taking driving tests is 17-20. Around 46% of practical car test candidates were aged 17-20 in Great Britain in 2016/17. However, in recent years, both the proportion of the population in this age group has been decreasing (and projected to remain at a similar proportion until 2039) and the proportion of 17-20 year olds with a licence has decreased since the early 1990s for both men and women.Chart 7: Full car driving licence holders aged 17- Chart 8: Proportion of England population aged 20 by gender: England 1975/76-2016 [NTS0201] 17-20 England 1981-2039 [ONS]
36% 33%
20%
29%
1975/76 1985/86 1992/94 2002 2008 2012 2016
6.6%
5.5%4.9% 5.2%
4.8%
1981 1991 2001 2011 2016 2020 2030 2039
Non-drivers
Around 27% of adults did not not hold a full car driving licence in 2016. The NTS asked people aged 17 and over without a full or provisional licence and not currently learning what their main reason was for not learning to drive, and when they might learn, if at all.
Chart 9: Main reason for not learning to drive, by age: England, 2016 [NTS0203]
Chart 10: Estimated number of people who said they would never learn to drive, by age: England, 2016 [NTS0204]
0%
10%
20%
30%
40%
50%
60%
17-20 21-29 30-39 40-49 50-59 60+
Not interested in learning
0.1m 0.2m0.5m
0.7m1.0m
2.6m
0.0m
0.5m
1.0m
1.5m
2.0m
2.5m
3.0m
17-20 21-29 30-39 40-49 50-59 60+
Number of people
For all people aged 17 and over in this group, the two main reasons were people either not being interested, or the cost of learning, although the split between these two reasons varied significantly between age groups. Most people in the older age groups were not interested in learning, while cost of learning was the main reason for the younger age groups. A high proportion of older people also cited physical difficulties, safety concerns or nervousness as a main reason.
Around 7% of 17-20 year olds without a licence and not learning said they would “never” learn, while nearly all people aged 60 and over not learning said they would never learn. These figures would equate to around 80,000 17-20 year olds and over 2.5 million people aged 60+.

National Travel Survey: England 2016 - Page 11
Recent trends in trips, trip times and distance
In recent years there has been a falling trend in trip rates. In 2016, the average number of trips per person excluding short walks was 774 (around 15 trips per week), 13% lower than 2002. Including short walks, people made an average of 954 trips in 2016 - around 18 trips per week.
Average trip distance and time spent travelling for trips excluding short walks were also lower than in 2002. The average distance travelled (6,396 miles) was 10% lower than in 2002, and 3% lower than in 2015 but similar to the 2014 figure.
Chart 11: Trends in trips, distance travelled and time spent travelling: England 2002-2016 [NTS0101]
TimeAverage time travelled per year, excluding short walks
2002 2016
355 hours
332hoursV 6%
Average trips per person per year excluding short walks
TripsAverage distance travelled per year excluding short walks
Distance
2002 2016
886 trips
774 tripsV 13%
2002 2016
7,104 miles
6,396milesV 10%
Note: figures in charts exclude short walks
Trends in driver and passenger trips and miles
In 2016, 62% of trips were made by car, either as a driver or passenger. Since the mid-2000s, most of the fall in total trips has been due to fewer car trips. Over this period, average distance travelled by car per person has also fallen; this is explained largely by the fall in trips, with average trip length by car remaining fairly stable. However, in 2016, there was a small increase on 2015 figures in the average trips and average miles travelled as a car driver, but these were not significant.
Chart 12: Average number of trips per person per year as a car driver or passenger: England, 2002-2016 [NTS0303]
100
150
200
250
300
350
400
450
2002 2004 2006 2008 2010 2012 2014 2016
Trips per person per yearDriver
389 trips in 2016V 11% on 2002
Chart 13: Average miles per person per year as a car driver or passenger: England, 2002-2016 [NTS0305]
1,500
2,000
2,500
3,000
3,500
4,000
2002 2004 2006 2008 2010 2012 2014 2016
Miles per person per year
Driver3,289 miles in 2016
V 11% on 2002

National Travel Survey: England 2016 - Page 12
Trends in household car mileage
As well as personal mileage, the NTS asks households about their average yearly car mileage for each car they own. Trends in household car mileage are similar to the trend in miles driven per person per year.
The average annual mileage of a household car was 7,800 miles in 2016 a fall from 9,200 in 2002.
Company cars had an annual mileage more than double that of private cars (18,900 compared to 7,500) in 2016 but accounted for only 3% of total vehicles. The proportion of company cars has fallen from 6% in 2002, which could be linked to changes in how they are taxed.
Chart 14: Annual mileage of household cars by type of mileage: England, 2002-2016 [NTS0901]
0
2,000
4,000
6,000
8,000
10,000
2002 2004 2006 2008 2010 2012 2014 2016
Other privatemileage
Commuting mileage
Although the average annual mileage of household cars has decreased when compared to 2002, the average annual mileage for commuting has remained relatively stable, varying between 2,500 and 2,900 miles per year. Business mileage however has halved over this period.
The NTS can provide further information on annual car miles, for example, for cars of different ages, and for diesel cars compared to petrol cars.
Related data sourcesAggregate trends in road traffic are published in the Department’s traffic statistics available at: https://www.gov.uk/government/collections/road-traffic-statistics
Experimental statistics derived from vehicle odometer readers taken at annual MOT tests are also published by DfT as part of the vehicle statistics series.
Further analysis and forecastsA more detailed analysis of trends in car trips and mileage, which uses NTS data, can be found in the DfT publication ‘Understanding drivers of road travel’.
Road Use Statistics is a publication which draws together key results from DfT statistics, in particular road traffic statistics, National Travel Survey, vehicle licensing statistics, and road freight statistics to provide an overall picture of roads, vehicles and how people use roads.
DfT also publishes road traffic forecasts.
Further information about trends in personal travelThe statistical datasets published alongside this release provide a series of statistical tables containing further data. NTS01 presents trends in travel over time, and NTS02 covers driving licence holding and vehicle availability. Section NTS09 provides further data relating to household vehicles mileage
In addition, the NTS dataset contains a wide range of further details which facilitate more in-depth study.

National Travel Survey: England 2016 - Page 13
Trends in walking trips and miles
In this publication, we are not able to compare all walking trips between years up to 2015, and 2016. However, we are able to compare walks that were not short walks (i.e. those over a mile in length).
Chart 15: Average number of walking trips per Chart 16: Average walking miles per person per person per year excluding short walks: England, year excluding short walks: England, 2002-2016 2002-2016 [NTS0303] [NTS0305]
30
60
90
2002 2004 2006 2008 2010 2012 2014 2016
Trips per person per year
Walking (excl. short walks)
63 trips in 2016V 17% on 2002
60
80
100
120
140
2002 2004 2006 2008 2010 2012 2014 2016
Miles per person per year
Walking (excl. short walks)
95 miles in 2016V 19% on 2002
In 2016, people walked an average of 95 miles in longer walking trips (i.e. excluding short walks - see box opposite). This was a decrease of 19% on the 2002 figures. Similarly, the number of longer walking trips decreased by 17% over the same period. In 2016, including short walks, people walked an average of 198 miles, or around 4 miles per week.
The NTS also asks people to estimate how often they did a walk of more than 20 minutes. Around 65% of respondents said at least once a week.
Chart 17: Walking frequency (walks of 20 minutes or more): England, 2016 [NTS0312]
65% 11% 4% 21%
0% 20% 40% 60% 80% 100%
17% 16% 14% 14% 16% 19%24%
45%
0%
10%
20%
30%
40%
50%
60%
2-16 17-20 21-29 30-39 40-49 50-59 60-69 70+
Chart 18: Proportion of people walking for 20 minutes less than once a year or never:England, 2016 [NTS0312]
At least once a week
At least once a month
At least once a year
Less than once a year or never
Around 21% said less than once a year or never, but this varied by age. For age groups up to 50-59, less than 20% of respondents gave this answer, compared to 45% of people aged 70 and over.
What is a walk in NTS?A walk trip in the NTS is one where walking is the main mode in terms of distance. Walks under 50 yards and off the public highway are excluded. Walks over 50 yards but under 1 mile (“short walks”) were recorded on 7 of the travel diary for half of respondents, and for day 1 for the other half in 2016. See page 5 for more information. Distance figures include walks made as part of any trip.

National Travel Survey: England 2016 - Page 14
Trends in bicycle ownership, trips and miles
For the average 2014 to 2016 (see box), 43% of people owned a bicycle, or had use of one. This figure was broadly unchanged on the three years to 2015. Young children and children aged 11-16 had the highest rates of bicycle access at 83% and 71% respectively.
Chart 19: % of people with access to a bicycle: England, average of 2014-2016 [NTS0608]
83%71%
45%
33%41%
50%43%
22%
0%
20%
40%
60%
80%
100%
5-10 11-16 17-20 21-29 30-39 40-49 50-59 60+
Around 14% of those respondents cycled at least once a week, and 10% cycled at least once a month. 66% of respondents cycled less than once a year or never.
Chart 20: Cycling frequency: England, 2016 [NTS0313]
At least once a week
At least once a month
At least once a year
Less than once a year or never
14% 10% 10% 66%
0% 20% 40% 60% 80% 100%
Chart 21: Average number of cycling trips per person per year: England, 2002-2016 [NTS0303]
10
15
20
2002 2004 2006 2008 2010 2012 2014 2016
Trips per person per year
Cycling15 trips in 2016V 19% on 2002
Chart 22: Average cycling miles per person per year: England, 2002-2016 [NTS0305]
30
40
50
60
2002 2004 2006 2008 2010 2012 2014 2016
Miles per person per year
Cycling53 miles in 2016
Λ 37% on 2002
Overall, the broad trends in the average cycling distance travelled and the average number of cycling trips we saw to 2015 continued in 2016. Although the average number of miles cycled in 2016 (53 miles per person) was at the same level in 2015, this was 37% higher than in 2002. The number of trips in 2016 was 19% lower than in 2002. The relatively small number of cycling trips does mean that the series can be more volatile than some others.
What is a cycling trip in the NTS?A cycling trip in the NTS is one where cycling is the main mode in terms of distance. Distance figures include cycling stages made as part of any trip. The number of respondents using this mode is small, so results (particularly year-on-year variability) should be interpreted with caution.
Due to these small sample numbers, sometimes we average over more than one year to increase the reliability of the data
Related data sourcesDfT publishes statistics on walking at local area level as part of the annual Local Area Walking and Cycling statistics.

National Travel Survey: England 2016 - Page 15
Trends in public transport trips and miles
Trips trends by public and private modes have evolved differently in recent years. Earlier sections showed that walking (excluding short walks) and car trips have fallen consistently over time.
However, trends are different for public transport modes. Since 2002, surface rail trips have grown by 56% to 21 trips per person per year. Trips on London buses, that increased in the years from 2002 to 2010, were 7% lower in 2016 than in 2002 at 16 trips per person per year. There was a similar decrease for trips on the London Underground, and trips on other local buses (outside London) decreased by 23%.Chart 23: Trips per person per year by selected public modes: England, 2002-2016, index 2002=100 [NTS0303]
30
50
70
90
110
130
150
170
2002 2004 2006 2008 2010 2012 2014 2016
Surface railΛ 56%
Bus in LondonV 7%
Index: 2002 = 100 % change since 2002
There were similar trends for the average distance people travelled per year on public transport modes. The main drop was in buses in London that fell to a level similar (61 miles per person per year) to that in 2002. This followed a significant drop between 2015 and 2016 after an increase between 2014 and 2015.
While people made fewer trips on the London Underground than 2002, the average distance they travelled increased by 4% over the same period (around 10 miles per person per year).
Chart 24: Miles per person per year by selected public modes: England, 2002-2016, index 2002=100 [NTS0305]
30
50
70
90
110
130
150
170
2002 2004 2006 2008 2010 2012 2014 2016
Surface railΛ 23%
Bus in LondonV 5%
Index: 2002 = 100
% change since 2002
What are the public modes of transport in the NTS?Public modes of transport in the NTS are local bus in London, other local bus, non-local bus, surface rail (that includes the London Overground), London Underground, light rail, tram, taxi, domestic air and ferry.
Related data sourcesDfT publishes a range of statistics on public transport including:
Annual Bus Statistics
Rail Statistics
Light Rail and Tram
Statistics
Taxi Statistics

National Travel Survey: England 2016 - Page 16
Share of trips and distance travelled by modeThe National Travel Survey collects information on modes of travel for each trip and stage, from which we can analyse the share of trips, distance and time for each mode. The analysis uses figures for 2016 that include short walks.
The mode share depends whether trips or distance are considered. The modes accounting for most trips were car, either as a driver or a passenger (62%), and walking (25%). Therefore, in 2016, 87% of all trips were accounted for by only two modes: car and walking.Chart 25: Mode share of average number of trips and distance travelled: England, 2016 [NTS0303, NTS0305]
0% 10% 20% 30% 40% 50% 60%
Other
Surface Rail
Other local bus
Bus in London
Car / van passenger
Car / van driver
Bicycle
Walk (incl. shortwalks) Trips
Distance
Car, either as a driver or as a passenger, was also the most common mode for distance travelled, accounting for 78% of the total distance travelled in 2016. Walking accounted for a larger share of trips than of distance (25% compared to 3%) in 2016, because it is a mode which tends to be used for short distances. Conversely, surface rail travel accounted for a larger share of distance than trips (8% compared to 2%) being predominantly for longer distances.
Chart 26: Mode share of trips by main mode for different trip lengths: England, 2016 [NTS0308]
Walk Car/van Local bus Rail Other
0% 25% 50% 75% 100%
Under 1 mile
1 to under 5 miles
0% 25% 50% 75% 100%
5 to under 25 miles
25 miles and over
Walking was the most frequent mode used for very short distance trips: 80% of all trips under one mile were walks. For all other distance bands, the car was the most frequent mode of travel. Buses were mainly used for medium length trips, between 1 and 25 miles.
What are private modes?Private modes of transport are walk, bicycle, car, motorcycle, private hire buses, minibus, motorcaravan and dormobile.
What are public modes?Public modes of transport are local bus in London, other local bus, non-local bus, surface rail (that includes the London Overground), London Underground, light rail, tram, taxi, domestic air and ferry.

National Travel Survey: England 2016 - Page 17
Long distance tripsThe NTS shows how most trips are relatively short - in 2016, including short walks, 23% of trips were under 1 mile, and 68% under 5 miles. Again, this varies by mode of travel; nearly all walks are under 5 miles, compared with 56% of car driver trips and 9% of trips by surface rail.
However, the NTS can also look at long distance trips and how they are distributed.
Chart 27: Mode share of long distance trips for different trip lengths: England, average of 2012 to 2016 [NTS0317]
Car/van Air OtherRailBus
0%
20%
40%
60%
80%
100%
50 to under75 miles
75 to under100 miles
100 tounder 150
miles
150 tounder 250
miles
250 tounder 350
miles
350 milesand over
For trips up to 150 miles, around 80% were done by car in 2016, and for trips between 150 and 350 miles, over two-thirds were done by car. A broadly similar proportion of trips were done using rail for each of the distance groups shown. Only when the trip distance was 350 miles and over do trips using domestic flights become significant - around 30% of these trips were flown in 2016.
People make relatively few domestic flights compared to international flights. In 2016, 93% of respondents made a domestic flight less than once a year or never, but only 52% of respondents had not made an international flight in the last 12 months.
What is a flight in NTS?Domestic air relates to single way flights within Great Britain. International air refers to single way flights overseas.
Related data sourcesAviation statistics are published by DfT, available at https://www.gov.uk/government/collections/aviation-statistics.

National Travel Survey: England 2016 - Page 18
Share of trips and distance travelled by purpose
The subject of the National Travel Survey is personal travel - trips people make in order to reach a destination, with each trip having a single main purpose. Therefore the NTS provides a key source of information on why people travel.
Chart 28: Purpose share of average number of trips and distance travelled: England, 2016 [NTS0403, NTS0404]
12
3
19
18
15
15
17
5
10
11
14
19
20
21
% of trips % of distance
Other leisure
Personal businesand other escort
Shopping
Business
Education (incl. escort)
Commuting
Visiting friends
s
Shopping and personal business were the most common reasons for travelling and accounted for 19% and 18% of trips per person in 2016, but accounted for a smaller share of trip distance (11% and 14% respectively).
Other leisure - which includes holidays and day trips, sport and entertainment - accounts for the highest share of distance travelled per person at 21% (17% of trips).
Chart 29: Average trip length in miles by purpose: England, 2016 [NTS0405]
10.9
8.6
5.3
4.0
2.7
6.8
0 5 10 15 Miles
LeisureCommuting/business
Personal businessand other escort
Shopping
All
Education
Average trip lengths vary by for different purposes as well. Education trips were the shortest on average in 2016, at 2.7 miles. Leisure and commuting trips were longer on average at 8.6 miles and 10.9 miles respectively and generally as trips increase in distance, they are more likely to be for business or holiday purposes.
Comparing average trip length and time suggests education trips are slowest, which reflects the fact that a high proportion of these trips are made by walking.
Purpose of travel in the NTSThe purposes of travel used in this section can be summarised as follows:
` Commuting: trips from home to usual place of work or from usual workplace to home
` Business: personal trips in course of work
` Education: trips to school or college
` Shopping: trips to the shops or from shops to home
` Personal business: visits to services, medical consultations, etc.
` Visit friends: trips to visit friends, either at someone’s home or elsewhere
` Other leisure: mostly entertainment, sport, holidays and day trips
Escort trips are those made to accompany someone else e.g. taking a child to school is escort education.
For more details on trip purposes, please see Notes and definitions.

National Travel Survey: England 2016 - Page 19
How people travel - walking
walking trips per person per year on average in 2016243miles travelled walking per person per year on average198minutes per walking trip on average16
25% of trips
3% of distance
Trends (excluding short walks) [NTS0303, NTS0305] Purpose of walking [NTS0409]
Walking trips, by age and gender [NTS0601]
Rates of walking trips were greater for woman than men on average, with the greatest difference for those aged 30-39.
Related data sourcesDfT publishes statistics on walking at local area level as part of the annual Local Area Walking and Cycling statistics.
Top 5 purposes, as % of walking trips: 2016Trends in trips and distance from 2002 to 2016(index: 2002=100)
Trips per person per year, by age and gender: 2016
Walking was the second most common mode for trips, but accounted for a small share of distance, as walking trips tended to be shorter than average.
60
70
80
90
100
110
2002 2005 2010 2016
Distance19%
Trips17%
9%
17%
19%
21%
23%
Personalbusiness
Leisure
Shopping
Education(incl. escort)
Other (incl.just walk)
65% 11% 4% 21%
0% 20% 40% 60% 80% 100%
0
50
100
150
200
250
300
350
0-16 17-20 21-29 30-39 40-49 50-59 60-69 70+
All ages:
Men223 trips
Women262 trips
At least once a week
At least once a month
At least once a year
Less than once a year or never
What is a walk in NTS?A walk trip in the NTS is one where walking is the main mode in terms of distance. In 2016 short walks (those walks of less than a mile in length or less than 20 minutes duration) were recorded on day 1 for half of the sample, and day 7 for the other half of the sample. In previous years short walks have only been recorded on day 7 of the travel diary. Collecting short walks on day 1 of the travel week has increased the number of short walks reported which means a break in the time series between 2016 and earlier years. Figures on this factsheet which only refer to 2016 include short walks, however the trends in trips and distance chart exclude short walks so that figures are comparable across years. Distance figures include walks made as part of any trip. Walks under 50 yards, walks and off the public highway are excluded.
Frequency of walks of 20 minutes or more [NTS0312]
Over a third of people who walk for 20 minutes “less than once a year or never” had a mobility problem.

National Travel Survey: England 2016 - Page 20
How people travel - cycling
15 cycling trips per person per year on average in 2016
53 miles travelled cycling per person per year on average
24 minutes per cycling trip on average
2% of trips
1% of distance
Cycling accounted for a small share of trips and distance travelled.
Trends [NTS0303, NTS0305]Trends in trips and distance from 2002 to 2016 (index: 2002=100)
60708090
100110120130140150160
2002 2005 2010 2016
Since 2002:
Distance37%
Trips 19%
Frequency of cycling [NTS0313]
14% of people aged 5+ use a bicycle at least once a week
14% 10% 10% 66%
0% 20% 40% 60% 80% 100%
At least once a week
At least once a month
At least once a year
Less than once a year or never
Access to a bicycle [NTS0608]Proportion who own or have use of a bicycle, by age band: 2014-16 combined
83%
71%
45%
33%41%
50%43%
22%
0%
20%
40%
60%
80%
100%
5-10 11-16 17-20 21-29 30-39 40-49 50-59 60+
Cycling trips by age and gender [NTS0601]Trips per person per year, by age and gender: 2016
0
10
20
30
40
0-16 17-20 21-29 30-39 40-49 50-59 60-69 70+
All ages:
22 trips
7 trips
Men make more cycling trips than women at all ages, with the greatest difference for those aged 40-49.
What is a cycling trip in NTS?A cycling trip in the NTS is one where cycling is the main mode in terms of distance. Distance figures include cycling stages made as part of any trip. The number of respondents using this mode is small, so results (particularly year-on-year variability) should be interpreted with caution.
Related data sourcesDfT publishes statistics on cycling at local area level as part of the annual Local Area Walking and Cycling statistics.
Where people cycle [NTS0315] Where usually cycled in the last 12 months: 2016
35%
30%
24%
11%
Mainly on the roads
Mainly on pavement, cycle path or lanes
Mainly off the road (e.g. parks)
Variety of surfaces

National Travel Survey: England 2016 - Page 21
How people travel - cartrips made by car (driver or
591 passenger) per person per year on average in 2016
5,079 miles travelled by car per person per year on average
22 minutes per car driver trip on average
62% of trips
78% of distance
Frequency of private car use [NTS0313]
86% 7% 4% 4%
0% 20% 40% 60% 80% 100%
At least once a week
At least once a month
At least once a year
Less than once a year or never
Car (as a driver and as a passenger) was the most common mode for both trips and distance travelled, but car use has been falling in the last decade.
Trends in trips from 2002 to 2016(index: 2002=100)
Trends [NTS0303]
70
80
90
100
110
2002 2005 2010 2016
Since 2002:
Car driver11%
Car passenge16%
Trends in distance from 2002 to 2016 index: 2002=100)
NTS0305]
70
80
90
100
110
2002 2005 2010 2016
Since 2002:
Car driver11%
Car passenger15%
(
[
Car occupancy [NTS0906]
persons in the car on average for a car
driving stage
1.5
62%of car driving stages, where the driver is
alone in the car
Average number of car passengers by purpose: 2016
What is a car trip in NTS?Figures for car trips and distance presented here relate to both cars and vans.
Further informationIn addition to the figures presented here, the National Travel Survey collects statistics on household vehicles in the NTS09 tables, including annual mileage, type of car (company or private), and fuel type.
Related data sourcesStatistics on the volume of road traffic are available at: http://www.gov.uk/government/collections/road-traffic-statistics.
0 0.5 1
Business
Commu ing
Personal business
Shopping
Leisure
Holiday / day trip
Education
Passengers
r

National Travel Survey: England 2016 - Page 22
How people travel - car [2]
Car mileage, by age and gender [NTS0605]
0
2,000
4,000
6,000
8,000
0-16 17-20 21-29 30-39 40-49 50-59 60-69 70+
Passenger DriverCar mileage increased with age until 50-59 years old, and then decreased. Car drivers accounted for a larger share of total car mileage for all age groups except the youngest.
Distance travelled by car as a driver was lower for women, but women did more mileage as car passengers than men at nearly all age groups.
Distance travelled as a car driver in miles, by age and gender: 2016
0
2,000
4,000
6,000
8,000
0-16 17-20 21-29 30-39 40-49 50-59 60-69 70+
Distance travelled as a car passenger in miles, by age and ender: 2016
0
,000
,000
,000
,000
0-16 17-20 21-29 30-39 40-49 50-59 60-69 70+
g
2
4
6
8
Travel and personal car access [NTS0702]
Persons in households Persons in households without a car with a car
702 trips 1,008 tripsper person per year per person per year
2,836 miles 7,282 milesper person per year per person per year
Trips per person per year, by personal car access: 2016
0 100 200 300 400 500
Car / vandriver
Car / vanpassenger
Walk
Bus
Othertransport
Households witha car
Households withouta car
People living in households with a car made 1.4 times more trips and travelled 2.6 times further than people living in households without cars.
People who did not have access to a car in their household most often walked or travelled by bus. Car driving was the most frequent mode for people with a car in their household.

National Travel Survey: England 2016 - Page 23
How people travel - car [3]
Household car access [NTS0205, NTS0703]Household car availability, by household income quintile: 2016
0% 20% 40% 60% 80% 100%
Lowest real income level
Second level
Third level
Fourth level
Highest real income level
Household car availability: 2016
23%
43%
34%
Learning to drive [NTS0203, NTS0204] Among people who did not hold a driving licence, how soon they think they will learn to drive varied by age. Younger age groups were more inclined to say they will learn to drive in the near future.How soon non-licence holders think they will learn to drive, by age: 2016
Within the next 5 years Never
Within the next year In more than 5 years
0%
20%
40%
60%
80%
100%
17-20 21-29 30-39 40-49 50-59 60+
Driving licence holding in 2016 [NTS0201]
32.4 million estimated licence holders
73% of English residents aged 17+
Full car driving licence holders, by age and gender: 2016
0%
20%
40%
60%
80%
100%
17-20 21-29 30-39 40-49 50-59 60-69 70+
Main reason for not learning to drive, by age: 2016
0%
20%
40%
60%
80%
00%
17-20 21-29 30-39 40-49 50-59 60+* includes learning to drive, insurance, buying a car and other general motoring costs
Other
Physical difficulties/ health problems/ too old
Safety concerns
Not interested
Family / friends can drive me
Costs*
1Among people who did not hold a driving licence, the reasons for not learning to drive also varied by age.
For young people, costs were the main barrier for not learning to drive, whereas older age groups were more often not interested in driving, had safety concerns or physical difficulties.

National Travel Survey: England 2016 - Page 24
How people travel - bus
52 bus trips per person per year on average in 2016
291 miles travelled by bus per person per year on average
36 minutes per bus trip on average
5% of trips
4% of distance
Bus travel accounted for a small share of trips and distance. The bus was mainly used for medium length trips (1 to 25 miles).
Trends in trips per person per year from 2002 to 2016 (index: 2002=100)
Trends [NTS0303]
60
80
100
120
140
160
2002 2005 2010 2016
Bus in London
7%
Otherlocal bus
23%
Trends in distance per person per year from 2002 to 2016 (index 2002=100)
[NTS0305]
60
80
100
120
140
160
2002 2005 2010 2016
Bus in London
5%
O her local bus
15%
Trips and distances made by bus have decreased in the last 15 years. Trips made by buses in London have decreased by 7%, and trips on local buses outside London have decreased by 23%.
Frequency of local bus use [NTS0313]
26% 13% 14% 47%
0% 20% 40% 60% 80% 100%
At least once a week
At least once a month
At least once a year
Less than once a year or never
Trips per person per year by age and gender: 2016
Bus use by age and gender [NTS0601]
0
40
80
120
160
0-16 17-20 21-29 30-39 40-49 50-59 60-69
All ages:
60 trips
44 trips
of trips to school made by children aged 5-105%
27% of trips to school made by children aged 11-16
Private and local buses account for...
Trips to school [NTS0613]
Women made more bus trips than men at all ages.
What is a bus trip in the NTS?Local bus includes all local services, which can be split between bus in London and other local bus. Non-local bus includes express services, excursions and tours. Unless otherwise specified, bus refers to local and non-local bus.
Related data sourcesDfT publishes bus statistics, available at http://www.gov.uk/government/collections/bus-statistics.

National Travel Survey: England 2016 - Page 25
How people travel - Surface rail
surface rail trips per person per year on average in 201621miles travelled per person per year on average538minutes per surface rail trip on average76
of all trips of total distance
Surface rail accounts for a small share of trips, but a larger share of distance travelled, as rail
2% 8%
trips tend to be longer than average.
80
100
120
140
160
2002 2005 2010 2016
Since 2002:
Trips56%
Distance23%
Trends in trips and distance from 2002 to 2016(index: 2002=100)
Trends [NTS0303, NTS0305] Purpose of surface rail trips [NTS0409]
48% of surface rail trips are for commuting
23% of surface rail trips are for leisure
10% of surface rail trips are for business
Frequency of surface rail use [NTS0313]
8% 15% 37% 41%
0% 20% 40% 60% 80% 100%
At least once a week
At least once a month
At least once a year
Less than once a year or never
0
10
20
30
40
50
0-16 17-20 21-29 30-39 40-49 50-59 60-69 70+
All ages:
24 trips
18trips
Surface rail trips, by age and gender [NTS0601]Trips per person per year, by age and gender: 2016
Surface rail trip rates are higher for people aged 21-39, and men make more surface rail trips than women, on average.
Surface rail trips by income [NTS0705]Trips per person per year, by household income quintile: 2016
0 10 20 30 40 50
Lowest realincome level
Second level
Third level
Fourth level
Highest realincome level
People in the highest income level make nearly 4 times more surface rail trips than people in the lowest.
What is a surface rail trip?Surface rail includes National Rail and London Overground, but excludes London Underground, DLR, trams or light rail.
Related data sourcesRail statistics are published by the Office of Rail and Road, and by DfT Rail Statistics.

National Travel Survey: England 2016 - Page 26
How people travel - air
Frequency of domestic flights [NTS0313]
7%at leastonce a year
93%less than once a year or never
Frequency of use of domestic air: 2016
The proportion of people who travelled at least once a year by domestic air has decreased over the last decade from 9% to 7%.
Domestic air accounts for 30% of long distance trips of 350 miles and over.
Frequency of international flights [NTS0316]
% 20% 40% 60%
None
One
Two
Three
Four or more
0
Number of flights abroad in the last 12 months: 2016
52% of people made no international flights in the last 12 months. The figure in 2011 was 57%
International flights by income Number of flights abroad in the last 12 months, by household income quintile: 2016
0% 25% 50% 75% 100%
Lowest level
Second level
Third level
Fourth level
Highest real income level
None 1 2 3 4+
The proportion of people who took at least one international flight in the last 12 months increased with household income level, from 30% in the lowest quintile to 70% in the highest.
0%
20%
40%
60%
0-16 17-20 21-29 30-39 40-49 50-59 60-69 70 +
Percentage of people who made at least one flight abroad in the last 12 months, by age: 2016
International flights by age [NTS0316]
Younger and older age groups make fewer than average international flights abroad.
omestic air as share of long trips [NTS0317]ode share of long distance trips, by trip length: 2012-2016
0% 25% 50% 75% 100%
50 - 249 miles
250 - 349 miles
350 miles +
Car / van Bus Rail Air Other
DM
What is a flight in NTS?Domestic air relates to single way flights within Great Britain. International air refers to single way flights overseas.
Related data sourcesAviation statistics are published by DfT, available at https://www.gov.uk/government/collections/aviation-statistics.
National Travel Survey: England 2016 - Page 27
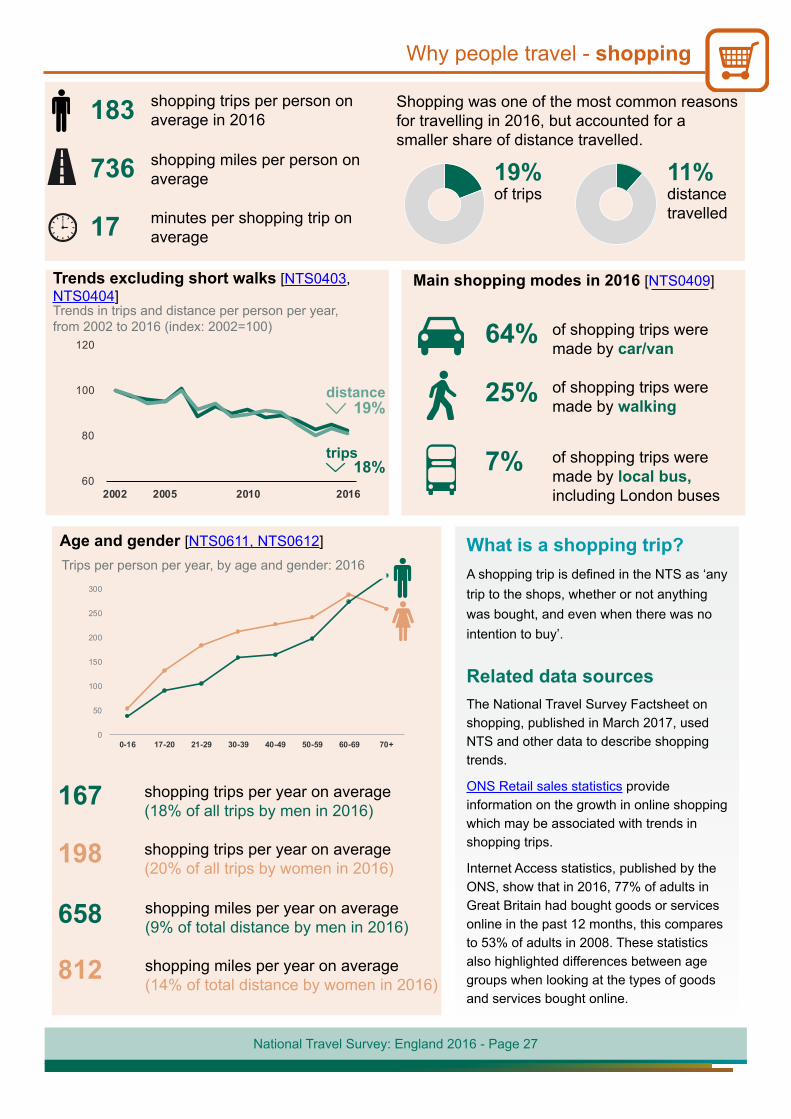
Why people travel - shopping
Shopping was one of the most common reasons for travelling in 2016, but accounted for a smaller share of distance travelled.
183 shopping trips per person onaverage in 2016
shopping miles per person on average
minutes per shopping trip on average
736
17
19% of trips distance
travelled
11%
60
80
100
120
2002 2005 2010 2016
distance19%
trips18%
Trends excluding short walks [NTS0403, NTS0404]Trends in trips and distance per person per year, from 2002 to 2016 (index: 2002=100)
Main shopping modes in 2016 [NTS0409]
64% of shopping trips weremade by car/van
25% of shopping trips weremade by walking
7% of shopping trips weremade by local bus, including London buses
Age and gender [NTS0611, NTS0612]
0
50
100
150
200
250
300
0-16 17-20 21-29 30-39 40-49 50-59 60-69 70+
Trips per person per year, by age and gender: 2016
167 shopping trips per year on average(18% of all trips by men in 2016)
198 shopping trips per year on average(20% of all trips by women in 2016)
658 shopping miles per year on average(9% of total distance by men in 2016)
812 shopping miles per year on average(14% of total distance by women in 2016)
What is a shopping trip?A shopping trip is defined in the NTS as ‘any trip to the shops, whether or not anything was bought, and even when there was no intention to buy’.
Related data sourcesThe National Travel Survey Factsheet on shopping, published in March 2017, used NTS and other data to describe shopping trends.
ONS Retail sales statistics provide information on the growth in online shopping which may be associated with trends in shopping trips.
Internet Access statistics, published by the ONS, show that in 2016, 77% of adults in Great Britain had bought goods or services online in the past 12 months, this compares to 53% of adults in 2008. These statistics also highlighted differences between age groups when looking at the types of goods and services bought online.
National Travel Survey: England 2016 - Page 28
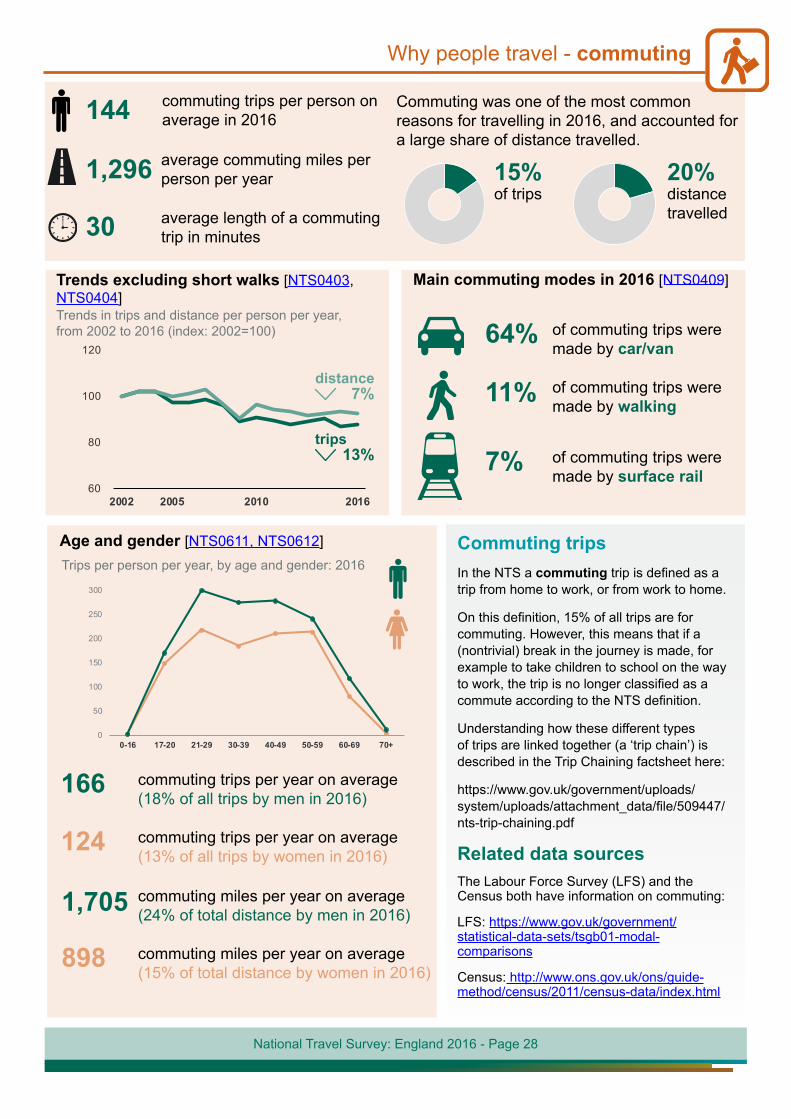
Why people travel - commuting
Commuting was one of the most common reasons for travelling in 2016, and accounted for a large share of distance travelled.
144 commuting trips per person onaverage in 2016
1,296 average commuting miles perperson per year
30 average length of a commuting trip in minutes
15% of trips
20% distance travelled
Trends excluding short walks [NTS0403, NTS0404]Trends in trips and distance per person per year, from 2002 to 2016 (index: 2002=100)
60
80
100
120
2002 2005 2010 2016
distance7%
trips13%
Main commuting modes in 2016 [NTS0409]
64% of commuting trips weremade by car/van
11% of commuting trips weremade by walking
7% of commuting trips weremade by surface rail
Age and gender [NTS0611, NTS0612]
0
50
100
150
200
250
300
0-16 17-20 21-29 30-39 40-49 50-59 60-69 70+
Trips per person per year, by age and gender: 2016
166 commuting trips per year on average(18% of all trips by men in 2016)
124 commuting trips per year on average(13% of all trips by women in 2016)
1,705 commuting miles per year on average(24% of total distance by men in 2016)
898 commuting miles per year on average(15% of total distance by women in 2016)
Commuting tripsIn the NTS a commuting trip is defined as a trip from home to work, or from work to home.
On this definition, 15% of all trips are for commuting. However, this means that if a (nontrivial) break in the journey is made, for example to take children to school on the way to work, the trip is no longer classified as a commute according to the NTS definition.
Understanding how these different types of trips are linked together (a ‘trip chain’) is described in the Trip Chaining factsheet here:
https://www.gov.uk/government/uploads/system/uploads/attachment_data/file/509447/nts-trip-chaining.pdf
Related data sourcesThe Labour Force Survey (LFS) and the Census both have information on commuting:
LFS: https://www.gov.uk/government/statistical-data-sets/tsgb01-modal-comparisons
Census: http://www.ons.gov.uk/ons/guide-method/census/2011/census-data/index.html

National Travel Survey: England 2016 - Page 29
Why people travel - business
Business was one of the least common reasons for travelling in 2016, but accounted for a larger share of distance travelled.
33 business trips per person onaverage in 2016
632 average business miles perperson per year
40 average length of a businesstrip in minutes
3% of trips
10% distance travelled
Trends excluding short walks [NTS0403, NTS0404]Trends in trips and distance per person per year, from 2002 to 2016 (index: 2002=100)
60
80
100
120
2002 2005 2010 2016
distance10%
trips7%
Main business modes in 2016 [NTS0409]
77% of business trips weremade by car/van
8% of business trips weremade by walking
6% of business trips weremade by surface rail
Age and gender [NTS0611, NTS0612]
0
10
20
30
40
50
60
70
80
0-16 17-20 21-29 30-39 40-49 50-59 60-69 70+
Trips per person per year, by age and gender: 2016
39 business trips per year on average(4% of all trips by men in 2016)
27 business trips per year on average(3% of all trips by women in 2016)
946 business miles per year on average(13% of total distance by men in 2016)
327 business miles per year on average(6% of total distance by women in 2016)
Difference between commuting and business tripsIn the NTS a commuting trip is defined as a trip from home to work, or from work to home.
Business trips are defined as those made in the course of work, provided that the purpose is to reach a destination - commercial travel (e.g. to deliver goods or convey a vehicle or passenger) is not included.
Figures here cover business trips only.
Related data sourcesThe Labour Force Survey (LFS) and the Census both have information on commuting:
LFS: https://www.gov.uk/government/statistical-
data-sets/tsgb01-modal-comparisons
Census: http://www.ons.gov.uk/ons/guide-
method/census/2011/census-data/index.html

National Travel Survey: England 2016 - Page 30
15% of trips
19% distance travelled
Why people travel - visiting friends
Visiting friends was a common reason for leisure travel, and accounted for a relatively large share of distance travelled.
140 trips to visit friends per personon average in 2016
1,232 average miles per person peryear visiting friends
25 average length of a trip to visitfriends in minutes
Trends excluding short walks [NTS0403, NTS0404]Trends in trips and distance per person per year, from 2002 to 2016 (index: 2002=100)
60
80
100
120
2002 2005 2010 2016
distance14%
trips 17%
Main modes used to visit friends in 2016 [NTS0409]
Age and gender [NTS0611, NTS0612]
0
20
40
60
80
100
120
140
160
180
0-16 17-20 21-29 30-39 40-49 50-59 60-69 70+
Trips per person per year, by age and gender: 2016
132 trips to visit friends per year on average(14% of all trips by men in 2016)
148 trips to visit friends per year on average(15% of all trips by women in 2016)
1,170 miles visting friends per year on average(16% of total distance by men in 2016)
1,292 miles visiting friends per year on average(22% of total distance by women in 2016)
68% of trips to visit friendswere made by car/van
20% of trips to visit friendswere made by walking
5% of trips to visit friendswere made by local bus, including London buses
Leisure trips in the NTSLeisure trips include trips to visit friends (at home or elsewhere), for entertainment, sport, and holidays and day trips (travel within Great Britain only). They also include walking trips which are made for no purpose other than to walk.
Related data sourcesThe Office for National Statistics publish statistics on tourism, which includes international travel by UK residents.
Sport England’s Active Lives Survey provides data about the sport and physical activities adults in England take part in and their attitudes to physical activity. In addition to sporting activities, the survey measures levels of walking, cycling and dance.
The Department for Culture, Media and Sport Taking Part Survey collects information on people’s engagement in different leisure activities such as art, museums, libraries, heritage and sport.

National Travel Survey: England 2016 - Page 31
Why people travel - other leisure
Other leisure includes entertainment, sport and holidays and accounted for a relatively large share of trips and distance in 2016.
163 trips for other leisure purposesper person on average in 2016
1,367 average miles per person per year for other leisure purposes
27 average trip length in minutes forother leisure purposes
17% of trips
21% distance travelled
60
80
100
120
2002 2005 2010 2016
distance4%
trips 7%
Trends excluding short walks [NTS0403, NTS0404]Trends in trips and distance per person per year, from 2002 to 2016 (index: 2002=100)
Main modes used for other leisure trips in 2016 [NTS0409]
of other leisure trips were made by car/van
49%
of other leisure trips were made by walking41%
of other leisure trips were made by local bus, including London buses
3%
Age and gender [NTS0611, NTS0612]
0
50
100
150
200
0-16 17-20 21-29 30-39 40-49 50-59 60-69 70+
Trips per person per year, by age and gender: 2016
159 trips to visit friends per year on average(17% of all trips by men in 2016)
168 trips to visit friends per year on average(17% of all trips by women in 2016)
1,458 miles per year visting friends on average(16% of total distance by men in 2016)
1,278 miles per year visiting friends on average(22% of total distance by women in 2016)
Leisure trips in the NTSLeisure trips include trips to visit friends (at home or elsewhere), for entertainment, sport, and holidays and day trips (travel within Great Britain only). They also include walking trips which are made for no purpose other than to walk.
Related data sourcesThe Office for National Statistics publish statistics on tourism, which includes international travel by UK residents.
Sport England’s Active Lives Survey provides data about the sport and physical activities adults in England take part in and their attitudes to physical activity. In addition to sporting activities, the survey measures levels of walking, cycling and dance.
The Department for Culture, Media and Sport Taking Part Survey collects information on people’s engagement in different leisure activities such as art, museums, libraries, heritage and sport.

National Travel Survey: England 2016 - Page 32
Why people travel - education and escort education
The share of trips for education, including escorting people to education, was higher than the share of distance in 2016 as trips to school tend to be relatively short.
117 trips for education (including escort)per person on average in 2016
321 average miles per person per yearfor education/escort education
17 average trip time in minutes foreducation/escort education
12% of trips
5% distance travelled
Trips and distance per person from 2002 to 2016(index: 2002=100), including escort education
Trends excluding short walks [NTS0403, NTS0404]
60
80
100
120
2002 2005 2010 2016
trips3%
distance1%
average length of an 3.2 miles education trip - shortest
of any main purpose
94% of 5-10 year olds areusually accompanied to school by an adult.
56% of 11-16 year olds areusually accompanied to school by an adult.
Age and gender [NTS0611, NTS0612]
0
50
100
150
200
250
300
0-16 17-20 21-29 30-39 40-49 50-59 60-69 70+
Trips per person per year, including escort by age and gender: 2016
99 education/escort trips per year on average(11% of all trips by men in 2016)
136 education/escort trips per year on average(14% of all trips by women in 2016)
304 miles per year for education/escort on average(4% of total distance by men in 2016)
338 miles per year for education/escort on average(6% of total distance by women in 2016)
Children’s main mode of travel to school by age group: 2016
Travel to school [NTS0613]
5-10 year olds
11-16year olds
other including rail and cycling
51% of primary school children walked to and from school in 2016. 27% of secondary school children took the bus.

National Travel Survey: England 2016 - Page 33
Notes and background information
This publication presents an overview of the National Travel Survey data. This section provides brief background notes and links to sources of further information.
Other topics covered by the NTS
In addition to the material covered in this publication, the National Travel Survey covers a range of topics, including the following, which are covered by the published NTS data tables:
► Daily and monthly trip patterns (tables NTS0504 - NTS0506)
► Motorcylists and household motorcycle ownership (tables NTS0610 and NTS0207)
► Concessionary bus travel (NTS0619 - NTS0621)
► Road safety - proportion of people involved in road accidents (NTS0623 - NTS0625)
► Accessibility of local services (NTS0801 - NTS0803)
► Working from home and deliveries of good and services (NTS0804 - NTS0806)
► Annual vehicle mileage, by type and age of vehicle (NTS0901 - NTS0904)
► Satellite navigation technology and vehicle parking (NTS0907 and NTS0908)
Detailed statistical tables
The National Travel Survey web page at: https://www.gov.uk/government/collections/national-travel-survey-statistics provides a set of results tables covering the topics presented in this release and the additional topics above. The full list of table sections is:
► Trends in personal travel (Tables NTS0101 to NTS0108)
► Driving licence holding and vehicle availability (Tables NTS0201 to NTS0208)
► How people travel (Tables NTS0301 to NTS0317)
► Why people travel (Tables NTS0401 to NTS0412)
► When people travel (Tables NTS0501 to NTS0506)
► Travel by age and gender (Tables NTS0601 to NTS0625)
► Travel by car availability, income, ethnic group, household type and NS-SEC (Tables NTS0701 to NTS0710)
► Accessibility (Tables NTS0801 to NTS0806)
► Vehicles (Tables NTS9901 to NTS9915)
► Travel by region and Rural-Urban Classification of residence (Tables NTS9901 to NTS9915)
Raw data
Raw data from the NTS is available from the UK Data Service for users to produce their own analysis. A dataset covering survey years 2002-2015 will be available as soon as possible.

National Travel Survey: England 2016 - Page 34
Related information
Other travel surveys in Great Britain. From January 2013, the coverage of the NTS changed to sample residents of England only. This change was agreed following a public consultation in 2011. Details of the consultation outcome can be found at: https://www.gov.uk/government/uploads/system/uploads/attachment data/file/230560/NTSconsultationSummaryofresponses.pdf
Related surveys carried out in other areas of Great Britain which cover similar topics (though do not use the same collection methods as NTS) include:
► Transport Scotland collect personal travel data for residents of Scotland using a one day travel diary in their Scottish Household Survey.
http://www.transportscotland.gov.uk/statistics/scottish-household-survey-travel-diary-results-all-editions
► In Northern Ireland data are collected via the Travel Survey for Northern Ireland, based on a similar methodology to the NTS (interview and 7-day travel diary):
https://www.infrastructure-ni.gov.uk/articles/travel-survey-northern-ireland
► The Welsh Government collect information on active travel as part of the National Survey for Wales, although this does not include a travel diary
http://gov.wales/statistics-and-research/national-survey/
► Within England, Transport for London conduct the London Travel Demand Survey for London residents which is much bigger than the London sample of the NTS (and uses a different data collection method)
tfl.gov.uk/corporate/publications-and-reports/london-travel-demand-survey
Other transport statistics. In addition to National Travel Survey statistics presented here, DfT and others publish a range of statistics related to modes of transport - as signposted throughout this document. Detailed comparisons between the NTS and other sources are not always possible because of differences in collection, coverage and measurement. However, where the NTS and other statistics refer to the same phenomenon, a degree of coherence between different sources can be observed over time, although year-on-year changes can vary.
The full range of statistics published by DfT can be found at https://www.gov.uk/government/organisations/department-for-transport/about/statistics

National Travel Survey: England 2016 - Page 35
Methodology notes
Strengths and limitations of the NTS: The NTS is a long-running survey which uses a high-quality methodology to collect a broad range of information on travel behaviours at the England level. The methodology has been broadly unchanged over several decades meaning that trends can be monitored. Figures are weighted to be representative of the population. However, like any statistical source, the NTS has its limitations. For example, as a sample survey resulting figures are estimates with associated sampling error. In addition, figures below national level require several years data to be combined, and figures for geographies below regional level cannot be published.
Survey methodology: Since 2002, the Department for Transport has commissioned the National Centre for Social Research (NatCen) as the contractor for the NTS. Full guidance on the methods used to conduct the survey, response rates, weighting methodology and survey materials can be found in the National Travel Survey Technical Report at: https://www.gov.uk/government/publications/national-travel-survey-2016
A ‘Notes and definitions’ document which includes background to the NTS, response rates, sample size and standard error information and a full list of definitions can be found at: https://www.gov.uk/government/publications/national-travel-survey-2016
Sample sizes are included in all the individual web tables. As estimates made from a sample survey depend upon the particular sample chosen, they generally differ from the true values for the population. This is not usually a problem when considering large samples but may give misleading information when considering data from small samples, such as cyclists in a particular age group.
A note explaining the methodology used to calculate the 2009 NTS standard errors and tables of standard errors for selected key statistics are published at: https://www.gov.uk/government/publications/nts-standard-error-guide
National Statistics are produced to high professional standards set out in the Code of Practice for Official Statistics. The National Travel Survey was assessed by the UK Statistics Authority against the Code of Practice and was confirmed as National Statistics in July 2011. Details of ministers and officials who receive pre-release access to these statistics up to 24 hours before release can be found in the pre-release access list at: https://www.gov.uk/government/publications/national-travel-survey-2016