Embed Size (px)
Citation preview
1
2016 LEGISLATIVE REPORT ON THE POSTSECONDARY PROGRESS AND SUCCESS
OF HIGH SCHOOL GRADUATES
March 4, 2016
1560 Broadway, Suite 1600Denver, Colorado 80204(303) 866-2723
LT. GOVERNOR JOSEPH GARCIA, EXECUTIVE DIRECTOR
2
Table of Contents
Introduction .......................................................................................................................................... 5
Part I. Postsecondary Enrollment ........................................................................................................ 7
Part II. First-Year College Students .................................................................................................. 16
Part III. Persistence Rates ................................................................................................................. 20
Part IV. Postsecondary Credential Attainment .................................................................................. 22
Conclusion ......................................................................................................................................... 24
Appendix A: District-Level Statistics ................................................................................................ 26
Appendix A B: Technical Information .............................................................................................. 35
List of Tables and Figures
Table 1: Summary Statistics for High School Graduates ................................................................. 7
Table 2: In-State and Out-of-State Enrollment Summary ................................................................ 8
Table 3: Enrollment by Top 10 Districts with Highest College-Going Rates .................................. 8
Table 4: Enrollment by Bottom 10 Districts with Lowest College-Going Rates ............................. 8
Table 5: Class Characteristics .......................................................................................................... 9
Figure 1: Enrollment Rates by Race/Ethnicity, 2009-2014 ............................................................. 10
Figure 2: Enrollment Rates by Gender and Income, 2009-2014 ..................................................... 11
Table 6: College Enrollment Details by Gender, Race/Ethnicity and Income .............................. 11
Figure 3: Enrollment Rates, by Race/Ethnicity for Different Income Levels ................................. 12
Figure 4: College Enrollment, by Race/Ethnicity and Institution Type .......................................... 13
Figure 5: College Enrollment, by Gender and Institution Type ...................................................... 13
Figure 6: Top States Where 2014 High School Graduates Attended College Outside of CO ........ 14
Figure 7: Enrollment In-State and Out-of-State ............................................................................... 14
Figure 8: Enrollment 2- and 4-Year Institutions ............................................................................. 14
Table 7: Enrollment by Most Attended Institutions for Class of 2014 .......................................... 15
Table 8: Summary of Pell Recipients, by High School Graduation Year ....................................... 16
Table 9: Pell Grant Recipients, by Gender and Race/Ethnicity ...................................................... 16
Table 10: Summary of Grade Point Averages, by High School Graduation Year ........................... 17
Table 11: Grade Point Averages, by Gender and Race/Ethnicity ...................................................... 17
Table 12: Summary of Credit Hour Accumulation, by High School Graduation Year .................... 18
Table 13: Credit Hour Accumulation, by Gender and Race/Ethnicity ............................................. 19
3
Figure 9: Types of Degrees 2014 High School Graduates are Pursuing .......................................... 19
Table 14: Persistence Rates, by High School Graduation Year ........................................................ 21
Table 15: Persistence Rates, by Gender and Race/Ethnicity ............................................................. 21
Table 16: Credential Attainment Rates, by High School Graduation Year ....................................... 22
Table 17: 2011 HS Graduates Credential Attainment Rates, by Gender and Race/Ethnicity ........... 23
Figure 10: 2011 HS Graduates Number of Credentials Awarded, by Credential Type ..................... 23

4
This report was prepared by The Colorado Department of Higher Education (CDHE) pursuant to
23-1-113 C.RS. For more information contact:
T. Luke Banaszak, Research Analyst, [email protected]
5
Introduction
Pursuant to statute (23-1-113 [9] C.R.S), the Colorado Department of Higher Education
(CDHE) is required to submit a report concerning the postsecondary academic progress and
success of the preceding six high school graduating classes. This report covers the high school
graduating classes of 2009, 2010, 2011, 2012, 2013 and 2014. This report has been submitted to
the Education Committees of the Senate and House of Representatives and to the State Board of
Education.
This report, the fifth of its kind, consists of four parts:
1. Postsecondary enrollment trends, including information on in-state and out-of-
state enrollment and institution type, disaggregated by ethnicity and gender.
2. Information on first-year college students in Colorado, including financial aid
status, average grade point average, credit accumulation and degree level,
disaggregated by ethnicity and gender.
3. First and second year retention rates.
4. Information on postsecondary credential attainment.
Highlights
55.8 percent of the 2014 high school graduating class enrolled in a postsecondary
institution in the fall immediately following graduation. The college-going rate is up half
a percentage point from last year, but is still three percentage points lower than the peak
in 2009.
In 2014, more female high school graduates (60%) enrolled in college than male
graduates (51%).
Asian and white high school graduates had the highest college-going rates in 2014—73
percent and 62 percent, respectively.
Compared to last year, enrollment rates increased for all racial/ethnic groups with the
exception of African American students.
Seventy-four percent of the 2014 cohort enrolled at a four-year institution (in- or out-of-
state) and 26 percent enrolled at a two-year college.
Hispanic students are the most likely to enroll at a two-year college, while Asian students
are the most likely to enroll at a four-year institution.
Of the 2014 graduates enrolling in college, 76 percent elected to attend a Colorado
college or university and 24 percent attended an out-of-state institution.
About 34 percent of first-year college students received a Federal Pell Grant in 2014.
6
At the end of the 2014-2015 academic year, the average cumulative grade point average
(GPA) for first-year college students in Colorado was 2.78, up from 2.76.
Of the 2014 high school graduates who enrolled in college immediately, approximately
75 percent had completed at least 20 credit hours by the end of their first year (spring
2015). The average completion was 30 credit hours, which meets the increasingly popular
standard that full-time status is defined by 15 hours per semester. About 25 percent had
completed more than 36 credit hours.
The first-year persistence rate for 2013 high schools graduates was 87 percent at four-
year institutions and 60 percent at two-year colleges. The second-year persistence rate for
2012 high school graduates pursuing a bachelor’s degree was approximately 87 percent.
These retention rates are better than national retention rate averages.
Four years after enrolling in college, over 28 percent of the 2011 high school graduating
cohort had earned at least one postsecondary credential.
Five years after enrolling in college, 46 percent of the 2010 high school graduating cohort
had earned at least one postsecondary credential, and 52.6 percent of the 2009 high
school graduating cohort had earned at least one postsecondary credential within six
years.
Approximately 64 percent of the credentials awarded during the 2011 cohort’s first four
years in college were bachelor’s degrees, 19 percent were associate degrees, and 17
percent were certificates.
Female students are significantly more likely to earn a credential than male students
within four years of enrolling in college. After four years, 32 percent of females from the
2011 cohort had earned some type of certificate or degree compared to 24 percent of
males.
5.7 percent of the Hispanic students in the 2011 cohort earned a credential within two
years of entering college compared to only 1.5 percent of African American students.
Four years after entering college, 32 percent of white students had earned at least one
postsecondary credential compared to 14.5 percent of African-American students, 21.6
percent of American Indian or Alaskan Native students and 20.9 percent of Hispanic
students.
7
Part I. Postsecondary Enrollment
Earning a postsecondary credential is increasingly necessary to be competitive for jobs in
today’s economy. It is estimated that by 2020, 74 percent of Colorado’s jobs will require some
form of postsecondary education.1 The path to earning a postsecondary certificate or degree
begins in the K-12 system. This report reviews how Colorado’s recent high school graduates
fared after finishing high school by asking questions such as: Who enrolled in college? In what
type of college did those students enroll? How successful were students in their first year of
college? How many degrees have been awarded? By answering these questions, Colorado’s K-
12 and higher education systems can better work together to ensure that all students have the
opportunity to transition seamlessly from high school into higher education.
Overview
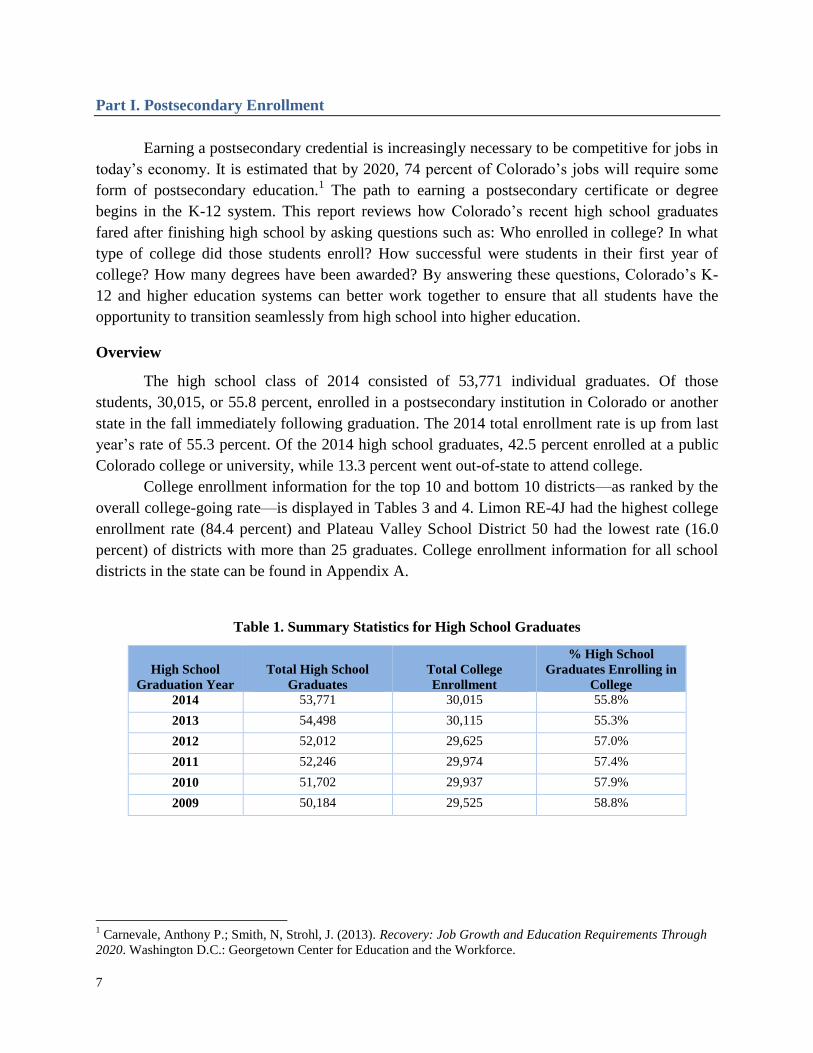
The high school class of 2014 consisted of 53,771 individual graduates. Of those
students, 30,015, or 55.8 percent, enrolled in a postsecondary institution in Colorado or another
state in the fall immediately following graduation. The 2014 total enrollment rate is up from last
year’s rate of 55.3 percent. Of the 2014 high school graduates, 42.5 percent enrolled at a public
Colorado college or university, while 13.3 percent went out-of-state to attend college.
College enrollment information for the top 10 and bottom 10 districts—as ranked by the
overall college-going rate—is displayed in Tables 3 and 4. Limon RE-4J had the highest college
enrollment rate (84.4 percent) and Plateau Valley School District 50 had the lowest rate (16.0
percent) of districts with more than 25 graduates. College enrollment information for all school
districts in the state can be found in Appendix A.
Table 1. Summary Statistics for High School Graduates
High School
Graduation Year
Total High School
Graduates
Total College
Enrollment
% High School
Graduates Enrolling in
College
2014 53,771 30,015 55.8%
2013 54,498 30,115 55.3%
2012 52,012 29,625 57.0%
2011 52,246 29,974 57.4%
2010 51,702 29,937 57.9%
2009 50,184 29,525 58.8%
1 Carnevale, Anthony P.; Smith, N, Strohl, J. (2013). Recovery: Job Growth and Education Requirements Through
2020. Washington D.C.: Georgetown Center for Education and the Workforce.
8
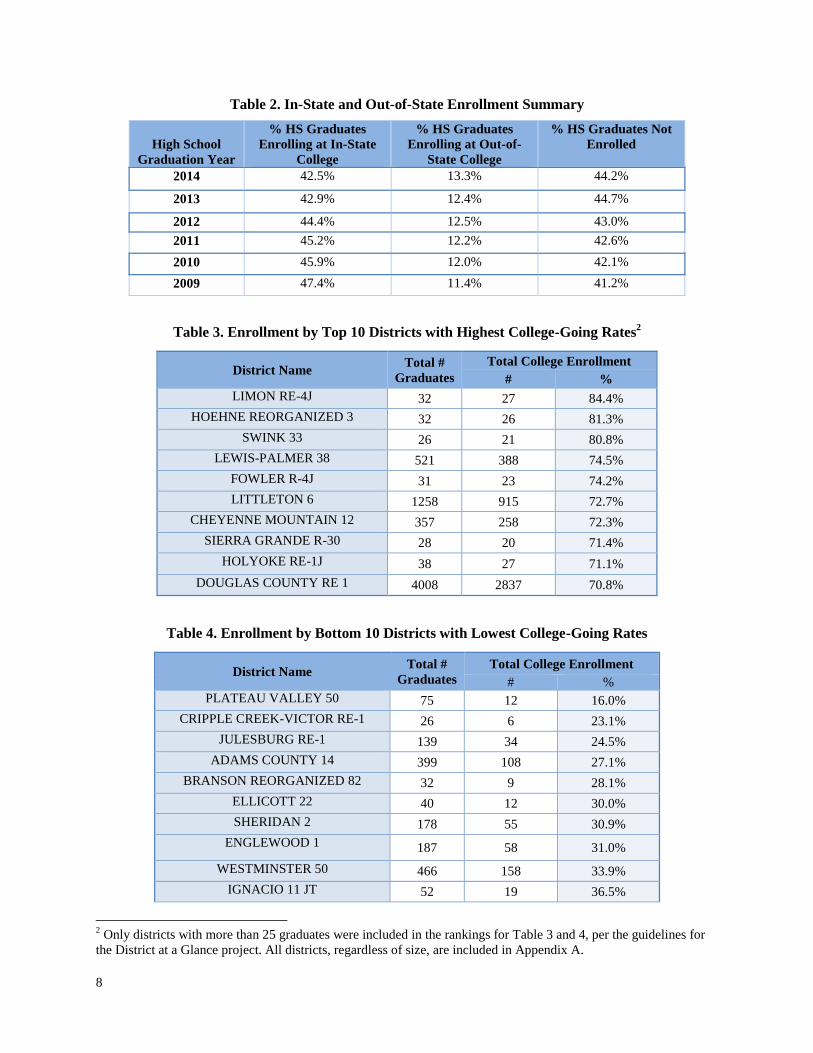
Table 2. In-State and Out-of-State Enrollment Summary
High School
Graduation Year
% HS Graduates
Enrolling at In-State
College
% HS Graduates
Enrolling at Out-of-
State College
% HS Graduates Not
Enrolled
2014 42.5% 13.3% 44.2%
2013 42.9% 12.4% 44.7%
2012 44.4% 12.5% 43.0%
2011 45.2% 12.2% 42.6%
2010 45.9% 12.0% 42.1%
2009 47.4% 11.4% 41.2%
Table 3. Enrollment by Top 10 Districts with Highest College-Going Rates2
District Name Total #
Graduates
Total College Enrollment
# %
LIMON RE-4J 32 27 84.4%
HOEHNE REORGANIZED 3 32 26 81.3%
SWINK 33 26 21 80.8%
LEWIS-PALMER 38 521 388 74.5%
FOWLER R-4J 31 23 74.2%
LITTLETON 6 1258 915 72.7%
CHEYENNE MOUNTAIN 12 357 258 72.3%
SIERRA GRANDE R-30 28 20 71.4%
HOLYOKE RE-1J 38 27 71.1%
DOUGLAS COUNTY RE 1 4008 2837 70.8%
Table 4. Enrollment by Bottom 10 Districts with Lowest College-Going Rates
District Name Total #
Graduates
Total College Enrollment
# %
PLATEAU VALLEY 50 75 12 16.0%
CRIPPLE CREEK-VICTOR RE-1 26 6 23.1%
JULESBURG RE-1 139 34 24.5%
ADAMS COUNTY 14 399 108 27.1%
BRANSON REORGANIZED 82 32 9 28.1%
ELLICOTT 22 40 12 30.0%
SHERIDAN 2 178 55 30.9%
ENGLEWOOD 1 187 58 31.0%
WESTMINSTER 50 466 158 33.9%
IGNACIO 11 JT 52 19 36.5%
2 Only districts with more than 25 graduates were included in the rankings for Table 3 and 4, per the guidelines for
the District at a Glance project. All districts, regardless of size, are included in Appendix A.
9
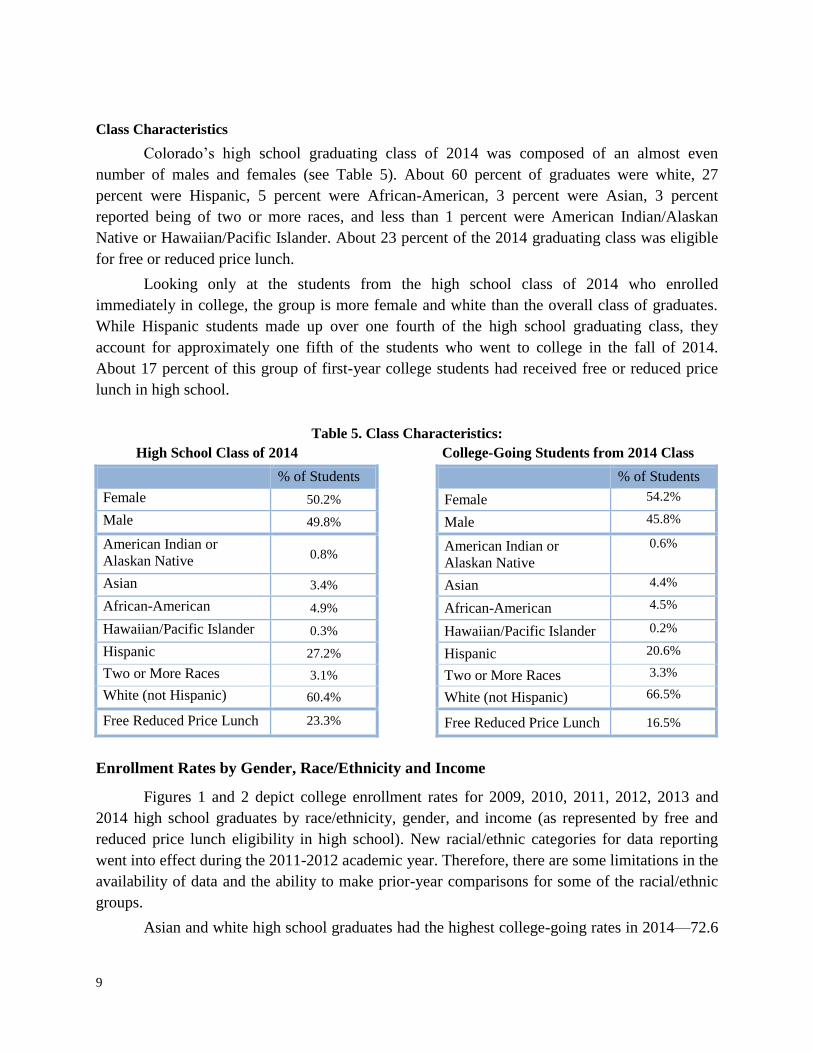
Class Characteristics
Colorado’s high school graduating class of 2014 was composed of an almost even
number of males and females (see Table 5). About 60 percent of graduates were white, 27
percent were Hispanic, 5 percent were African-American, 3 percent were Asian, 3 percent
reported being of two or more races, and less than 1 percent were American Indian/Alaskan
Native or Hawaiian/Pacific Islander. About 23 percent of the 2014 graduating class was eligible
for free or reduced price lunch.
Looking only at the students from the high school class of 2014 who enrolled
immediately in college, the group is more female and white than the overall class of graduates.
While Hispanic students made up over one fourth of the high school graduating class, they
account for approximately one fifth of the students who went to college in the fall of 2014.
About 17 percent of this group of first-year college students had received free or reduced price
lunch in high school.
Table 5. Class Characteristics:
High School Class of 2014 College-Going Students from 2014 Class
% of Students % of Students
Female 50.2% Female 54.2%
Male 49.8% Male 45.8%
American Indian or
Alaskan Native 0.8%
American Indian or
Alaskan Native
0.6%
Asian 3.4% Asian 4.4%
African-American 4.9% African-American 4.5%
Hawaiian/Pacific Islander 0.3% Hawaiian/Pacific Islander 0.2%
Hispanic 27.2% Hispanic 20.6%
Two or More Races 3.1% Two or More Races 3.3%
White (not Hispanic) 60.4% White (not Hispanic) 66.5%
Free Reduced Price Lunch 23.3% Free Reduced Price Lunch 16.5%
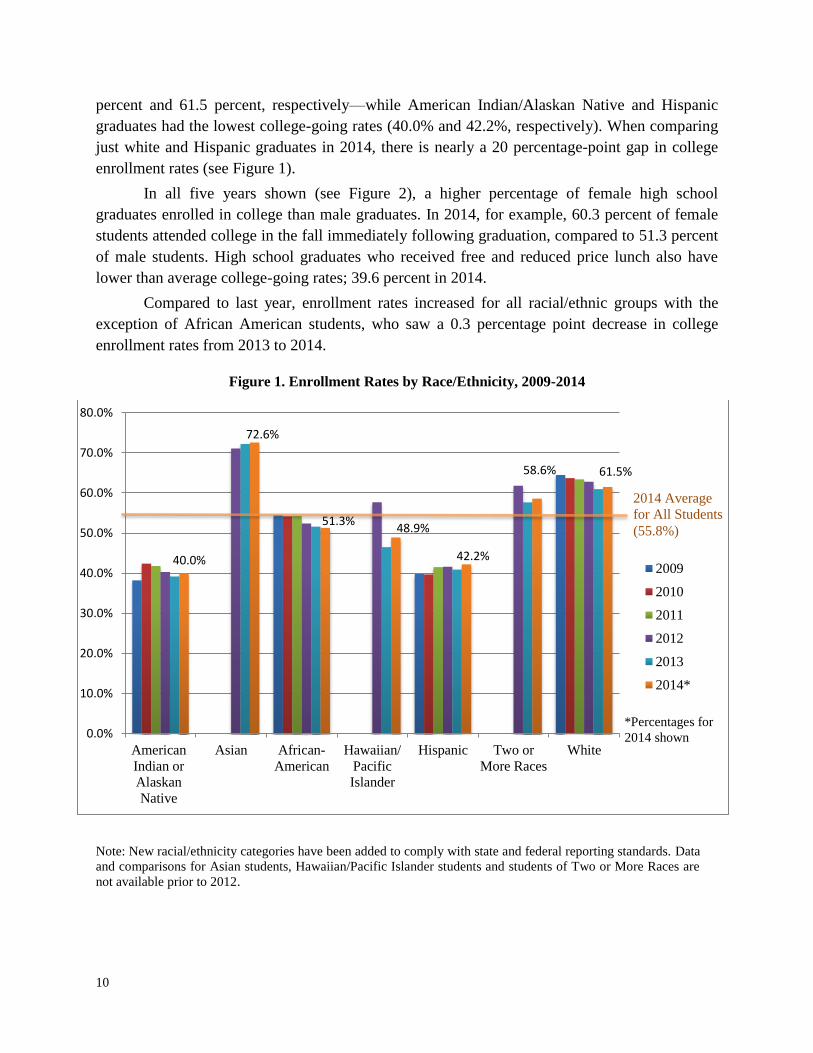
Enrollment Rates by Gender, Race/Ethnicity and Income
Figures 1 and 2 depict college enrollment rates for 2009, 2010, 2011, 2012, 2013 and
2014 high school graduates by race/ethnicity, gender, and income (as represented by free and
reduced price lunch eligibility in high school). New racial/ethnic categories for data reporting
went into effect during the 2011-2012 academic year. Therefore, there are some limitations in the
availability of data and the ability to make prior-year comparisons for some of the racial/ethnic
groups.
Asian and white high school graduates had the highest college-going rates in 2014—72.6
10
percent and 61.5 percent, respectively—while American Indian/Alaskan Native and Hispanic
graduates had the lowest college-going rates (40.0% and 42.2%, respectively). When comparing
just white and Hispanic graduates in 2014, there is nearly a 20 percentage-point gap in college
enrollment rates (see Figure 1).
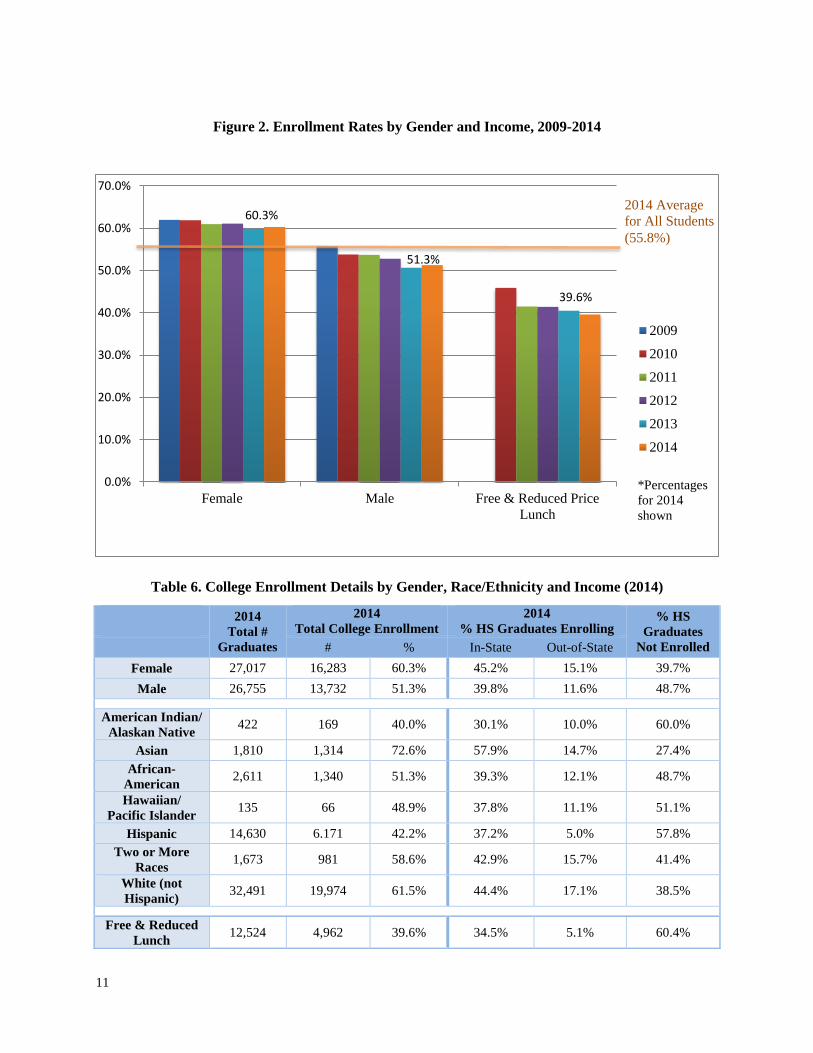
In all five years shown (see Figure 2), a higher percentage of female high school
graduates enrolled in college than male graduates. In 2014, for example, 60.3 percent of female
students attended college in the fall immediately following graduation, compared to 51.3 percent
of male students. High school graduates who received free and reduced price lunch also have
lower than average college-going rates; 39.6 percent in 2014.
Compared to last year, enrollment rates increased for all racial/ethnic groups with the
exception of African American students, who saw a 0.3 percentage point decrease in college
enrollment rates from 2013 to 2014.
Figure 1. Enrollment Rates by Race/Ethnicity, 2009-2014
Note: New racial/ethnicity categories have been added to comply with state and federal reporting standards. Data
and comparisons for Asian students, Hawaiian/Pacific Islander students and students of Two or More Races are
not available prior to 2012.
40.0%
72.6%
51.3% 48.9%
42.2%
58.6% 61.5%
0.0%
10.0%
20.0%
30.0%
40.0%
50.0%
60.0%
70.0%
80.0%
American
Indian or
Alaskan
Native
Asian African-
American
Hawaiian/
Pacific
Islander
Hispanic Two or
More Races
White
2009
2010
2011
2012
2013
2014*
2014 Average
for All Students
(55.8%)
*Percentages for
2014 shown
11
Figure 2. Enrollment Rates by Gender and Income, 2009-2014
Table 6. College Enrollment Details by Gender, Race/Ethnicity and Income (2014)
2014
Total #
Graduates
2014
Total College Enrollment
2014
% HS Graduates Enrolling % HS
Graduates
Not Enrolled # % In-State Out-of-State
Female 27,017 16,283 60.3% 45.2% 15.1% 39.7%
Male 26,755 13,732 51.3% 39.8% 11.6% 48.7%
American Indian/
Alaskan Native 422 169 40.0% 30.1% 10.0% 60.0%
Asian 1,810 1,314 72.6% 57.9% 14.7% 27.4%
African-
American 2,611 1,340 51.3% 39.3% 12.1% 48.7%
Hawaiian/
Pacific Islander 135 66 48.9% 37.8% 11.1% 51.1%
Hispanic 14,630 6.171 42.2% 37.2% 5.0% 57.8%
Two or More
Races 1,673 981 58.6% 42.9% 15.7% 41.4%
White (not
Hispanic) 32,491 19,974 61.5% 44.4% 17.1% 38.5%
Free & Reduced
Lunch 12,524 4,962 39.6% 34.5% 5.1% 60.4%
60.3%
51.3%
39.6%
0.0%
10.0%
20.0%
30.0%
40.0%
50.0%
60.0%
70.0%
Female Male Free & Reduced Price
Lunch
2009
2010
2011
2012
2013
2014
*Percentages
for 2014
shown
2014 Average
for All Students
(55.8%)
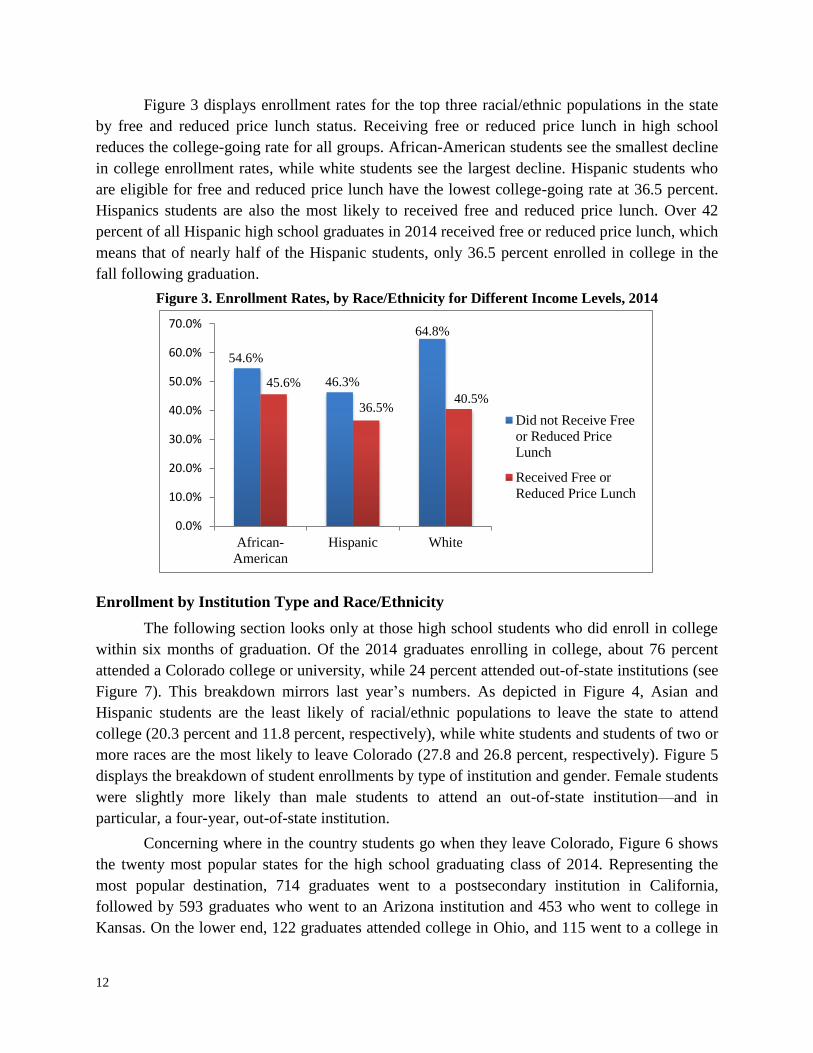
12
Figure 3 displays enrollment rates for the top three racial/ethnic populations in the state
by free and reduced price lunch status. Receiving free or reduced price lunch in high school
reduces the college-going rate for all groups. African-American students see the smallest decline
in college enrollment rates, while white students see the largest decline. Hispanic students who
are eligible for free and reduced price lunch have the lowest college-going rate at 36.5 percent.
Hispanics students are also the most likely to received free and reduced price lunch. Over 42
percent of all Hispanic high school graduates in 2014 received free or reduced price lunch, which
means that of nearly half of the Hispanic students, only 36.5 percent enrolled in college in the
fall following graduation.
Figure 3. Enrollment Rates, by Race/Ethnicity for Different Income Levels, 2014
Enrollment by Institution Type and Race/Ethnicity
The following section looks only at those high school students who did enroll in college
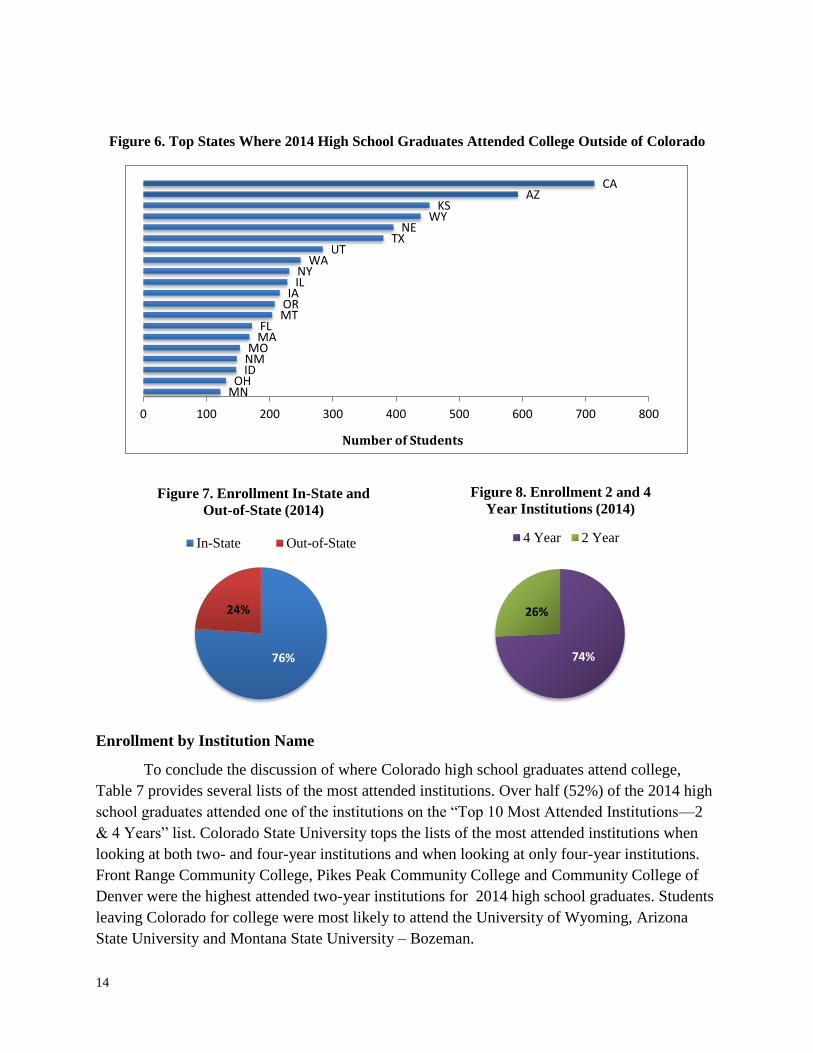
within six months of graduation. Of the 2014 graduates enrolling in college, about 76 percent
attended a Colorado college or university, while 24 percent attended out-of-state institutions (see
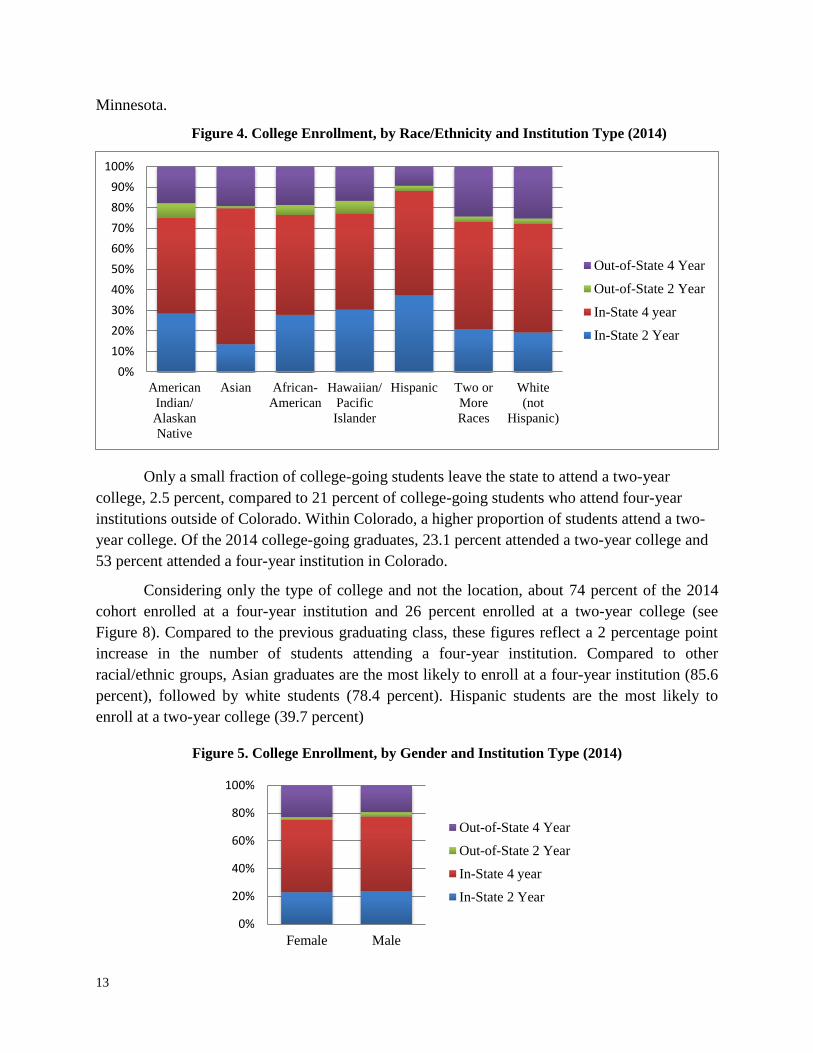
Figure 7). This breakdown mirrors last year’s numbers. As depicted in Figure 4, Asian and
Hispanic students are the least likely of racial/ethnic populations to leave the state to attend
college (20.3 percent and 11.8 percent, respectively), while white students and students of two or
more races are the most likely to leave Colorado (27.8 and 26.8 percent, respectively). Figure 5
displays the breakdown of student enrollments by type of institution and gender. Female students
were slightly more likely than male students to attend an out-of-state institution—and in
particular, a four-year, out-of-state institution.
Concerning where in the country students go when they leave Colorado, Figure 6 shows
the twenty most popular states for the high school graduating class of 2014. Representing the
most popular destination, 714 graduates went to a postsecondary institution in California,
followed by 593 graduates who went to an Arizona institution and 453 who went to college in
Kansas. On the lower end, 122 graduates attended college in Ohio, and 115 went to a college in
54.6%
46.3%
64.8%
45.6%
36.5% 40.5%
0.0%
10.0%
20.0%
30.0%
40.0%
50.0%
60.0%
70.0%
African-
American
Hispanic White
Did not Receive Free
or Reduced Price
Lunch
Received Free or
Reduced Price Lunch
13
Minnesota.
Figure 4. College Enrollment, by Race/Ethnicity and Institution Type (2014)
Only a small fraction of college-going students leave the state to attend a two-year
college, 2.5 percent, compared to 21 percent of college-going students who attend four-year
institutions outside of Colorado. Within Colorado, a higher proportion of students attend a two-
year college. Of the 2014 college-going graduates, 23.1 percent attended a two-year college and
53 percent attended a four-year institution in Colorado.
Considering only the type of college and not the location, about 74 percent of the 2014
cohort enrolled at a four-year institution and 26 percent enrolled at a two-year college (see
Figure 8). Compared to the previous graduating class, these figures reflect a 2 percentage point
increase in the number of students attending a four-year institution. Compared to other
racial/ethnic groups, Asian graduates are the most likely to enroll at a four-year institution (85.6
percent), followed by white students (78.4 percent). Hispanic students are the most likely to
enroll at a two-year college (39.7 percent)
Figure 5. College Enrollment, by Gender and Institution Type (2014)
0%
10%
20%
30%
40%
50%
60%
70%
80%
90%
100%
American
Indian/
Alaskan
Native
Asian African-
American
Hawaiian/
Pacific
Islander
Hispanic Two or
More
Races
White
(not
Hispanic)
Out-of-State 4 Year
Out-of-State 2 Year
In-State 4 year
In-State 2 Year
0%
20%
40%
60%
80%
100%
Female Male
Out-of-State 4 Year
Out-of-State 2 Year
In-State 4 year
In-State 2 Year
14
Figure 6. Top States Where 2014 High School Graduates Attended College Outside of Colorado
Enrollment by Institution Name
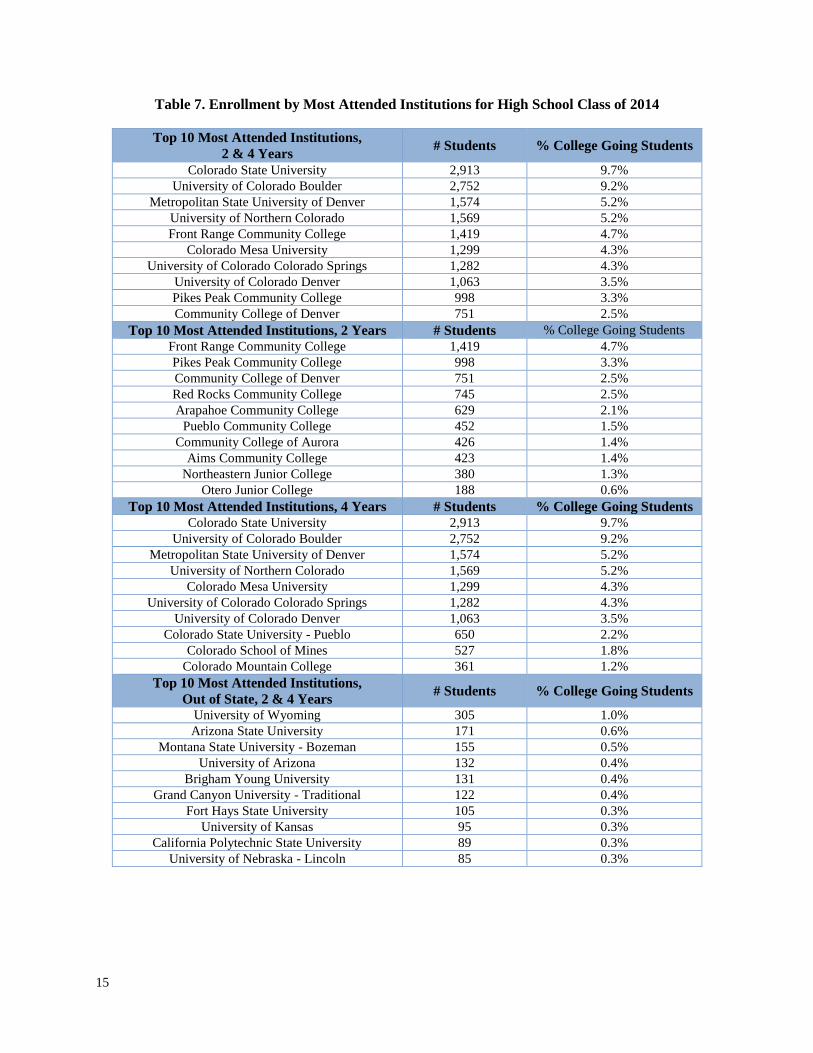
To conclude the discussion of where Colorado high school graduates attend college,
Table 7 provides several lists of the most attended institutions. Over half (52%) of the 2014 high
school graduates attended one of the institutions on the “Top 10 Most Attended Institutions—2
& 4 Years” list. Colorado State University tops the lists of the most attended institutions when
looking at both two- and four-year institutions and when looking at only four-year institutions.
Front Range Community College, Pikes Peak Community College and Community College of
Denver were the highest attended two-year institutions for 2014 high school graduates. Students
leaving Colorado for college were most likely to attend the University of Wyoming, Arizona
State University and Montana State University – Bozeman.
MN OH
ID NM MO
MA FL
MT OR IA
IL NY
WA UT
TX NE
WY KS
AZ CA
0 100 200 300 400 500 600 700 800
76%
24%
Figure 7. Enrollment In-State and
Out-of-State (2014)
In-State Out-of-State
74%
26%
Figure 8. Enrollment 2 and 4
Year Institutions (2014)
4 Year 2 Year
Number of Students
15
Table 7. Enrollment by Most Attended Institutions for High School Class of 2014
Top 10 Most Attended Institutions,
2 & 4 Years # Students % College Going Students
Colorado State University 2,913 9.7%
University of Colorado Boulder 2,752 9.2%
Metropolitan State University of Denver 1,574 5.2%
University of Northern Colorado 1,569 5.2%
Front Range Community College 1,419 4.7%
Colorado Mesa University 1,299 4.3%
University of Colorado Colorado Springs 1,282 4.3%
University of Colorado Denver 1,063 3.5%
Pikes Peak Community College 998 3.3%
Community College of Denver 751 2.5%
Top 10 Most Attended Institutions, 2 Years # Students % College Going Students
Front Range Community College 1,419 4.7%
Pikes Peak Community College 998 3.3%
Community College of Denver 751 2.5%
Red Rocks Community College 745 2.5%
Arapahoe Community College 629 2.1%
Pueblo Community College 452 1.5%
Community College of Aurora 426 1.4%
Aims Community College 423 1.4%
Northeastern Junior College 380 1.3%
Otero Junior College 188 0.6%
Top 10 Most Attended Institutions, 4 Years # Students % College Going Students
Colorado State University 2,913 9.7%
University of Colorado Boulder 2,752 9.2%
Metropolitan State University of Denver 1,574 5.2%
University of Northern Colorado 1,569 5.2%
Colorado Mesa University 1,299 4.3%
University of Colorado Colorado Springs 1,282 4.3%
University of Colorado Denver 1,063 3.5%
Colorado State University - Pueblo 650 2.2%
Colorado School of Mines 527 1.8%
Colorado Mountain College 361 1.2%
Top 10 Most Attended Institutions,
Out of State, 2 & 4 Years # Students % College Going Students
University of Wyoming 305 1.0%
Arizona State University 171 0.6%
Montana State University - Bozeman 155 0.5%
University of Arizona 132 0.4%
Brigham Young University 131 0.4%
Grand Canyon University - Traditional 122 0.4%
Fort Hays State University 105 0.3%
University of Kansas 95 0.3%
California Polytechnic State University 89 0.3%
University of Nebraska - Lincoln 85 0.3%
16
Part II. First-Year College Students
In this section, information about first-year college students, including financial aid
status, GPA, credit accumulation and degree level, is provided. This level of detail is only
available from the Colorado Department of Higher Education’s Student Unit Record Data
System (SURDS), which includes information from all public colleges and universities in the
state and the following private institutions: University of Denver, Regis University, and
Colorado Christian University.
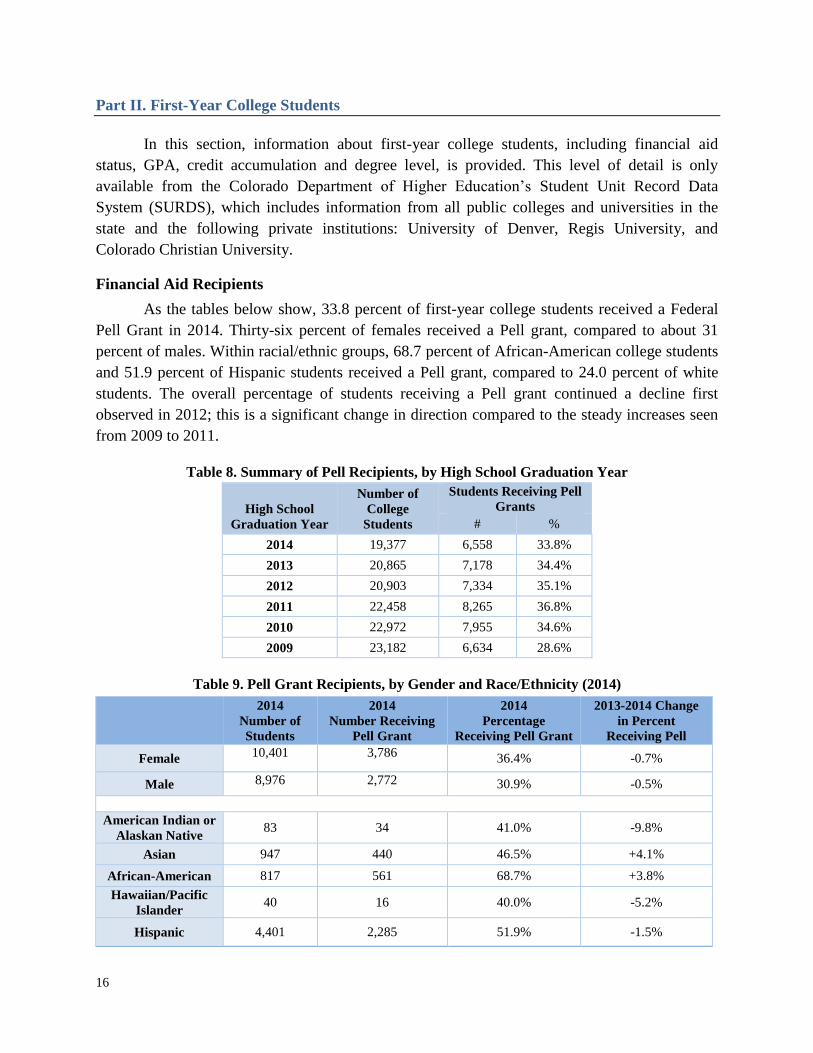
Financial Aid Recipients
As the tables below show, 33.8 percent of first-year college students received a Federal
Pell Grant in 2014. Thirty-six percent of females received a Pell grant, compared to about 31
percent of males. Within racial/ethnic groups, 68.7 percent of African-American college students
and 51.9 percent of Hispanic students received a Pell grant, compared to 24.0 percent of white
students. The overall percentage of students receiving a Pell grant continued a decline first
observed in 2012; this is a significant change in direction compared to the steady increases seen
from 2009 to 2011.
Table 8. Summary of Pell Recipients, by High School Graduation Year
High School
Graduation Year
Number of
College
Students
Students Receiving Pell
Grants
# %
2014 19,377 6,558 33.8%
2013 20,865 7,178 34.4%
2012 20,903 7,334 35.1%
2011 22,458 8,265 36.8%
2010 22,972 7,955 34.6%
2009 23,182 6,634 28.6%
Table 9. Pell Grant Recipients, by Gender and Race/Ethnicity (2014)
2014
Number of
Students
2014
Number Receiving
Pell Grant
2014
Percentage
Receiving Pell Grant
2013-2014 Change
in Percent
Receiving Pell
Female 10,401 3,786 36.4% -0.7%
Male 8,976 2,772 30.9% -0.5%
American Indian or
Alaskan Native 83 34 41.0% -9.8%
Asian 947 440 46.5% +4.1%
African-American 817 561 68.7% +3.8%
Hawaiian/Pacific
Islander 40 16 40.0% -5.2%
Hispanic 4,401 2,285 51.9% -1.5%
17
Two or More Races 602 222 36.9% +1.0%
White 12,487 3,000 24.0% -1.5%
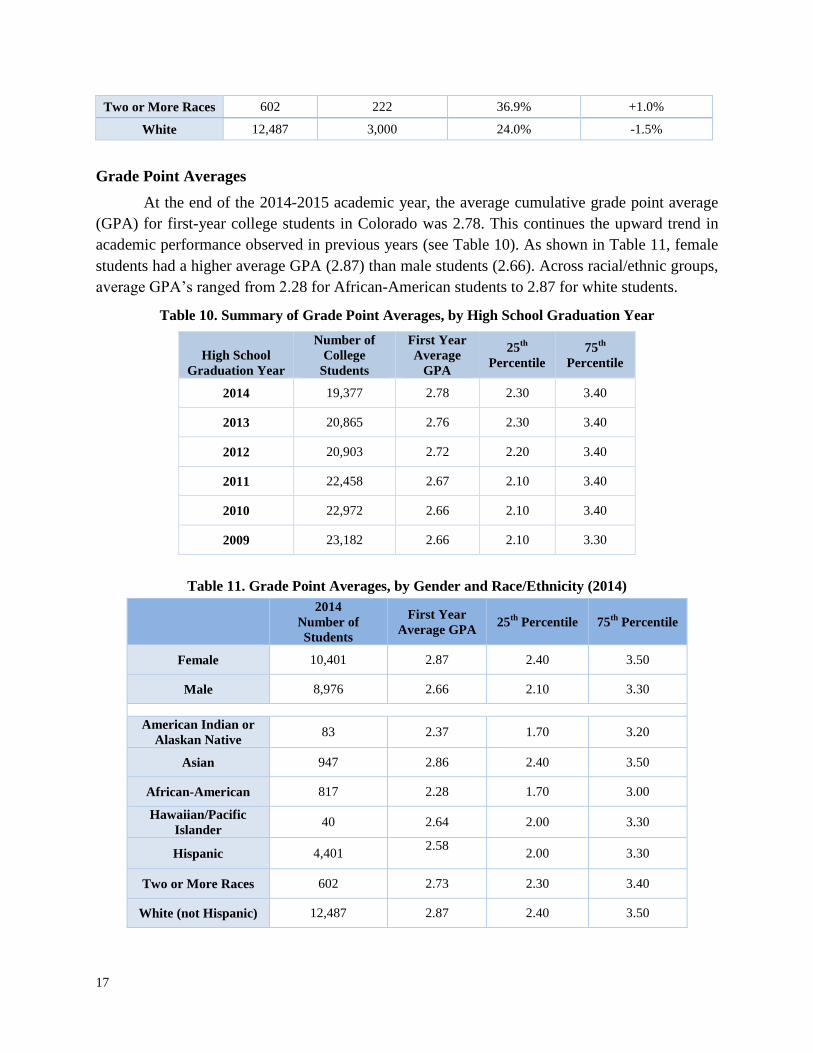
Grade Point Averages
At the end of the 2014-2015 academic year, the average cumulative grade point average
(GPA) for first-year college students in Colorado was 2.78. This continues the upward trend in
academic performance observed in previous years (see Table 10). As shown in Table 11, female
students had a higher average GPA (2.87) than male students (2.66). Across racial/ethnic groups,
average GPA’s ranged from 2.28 for African-American students to 2.87 for white students.
Table 10. Summary of Grade Point Averages, by High School Graduation Year
High School
Graduation Year
Number of
College
Students
First Year
Average
GPA
25th
Percentile
75th
Percentile
2014 19,377 2.78 2.30 3.40
2013 20,865 2.76 2.30 3.40
2012 20,903 2.72 2.20 3.40
2011 22,458 2.67 2.10 3.40
2010 22,972 2.66 2.10 3.40
2009 23,182 2.66 2.10 3.30
Table 11. Grade Point Averages, by Gender and Race/Ethnicity (2014)
2014
Number of
Students
First Year
Average GPA 25
th Percentile 75
th Percentile
Female 10,401 2.87 2.40 3.50
Male 8,976 2.66 2.10 3.30
American Indian or
Alaskan Native 83 2.37 1.70 3.20
Asian 947 2.86 2.40 3.50
African-American 817 2.28 1.70 3.00
Hawaiian/Pacific
Islander 40 2.64 2.00 3.30
Hispanic 4,401 2.58
2.00 3.30
Two or More Races 602 2.73 2.30 3.40
White (not Hispanic) 12,487 2.87 2.40 3.50
18
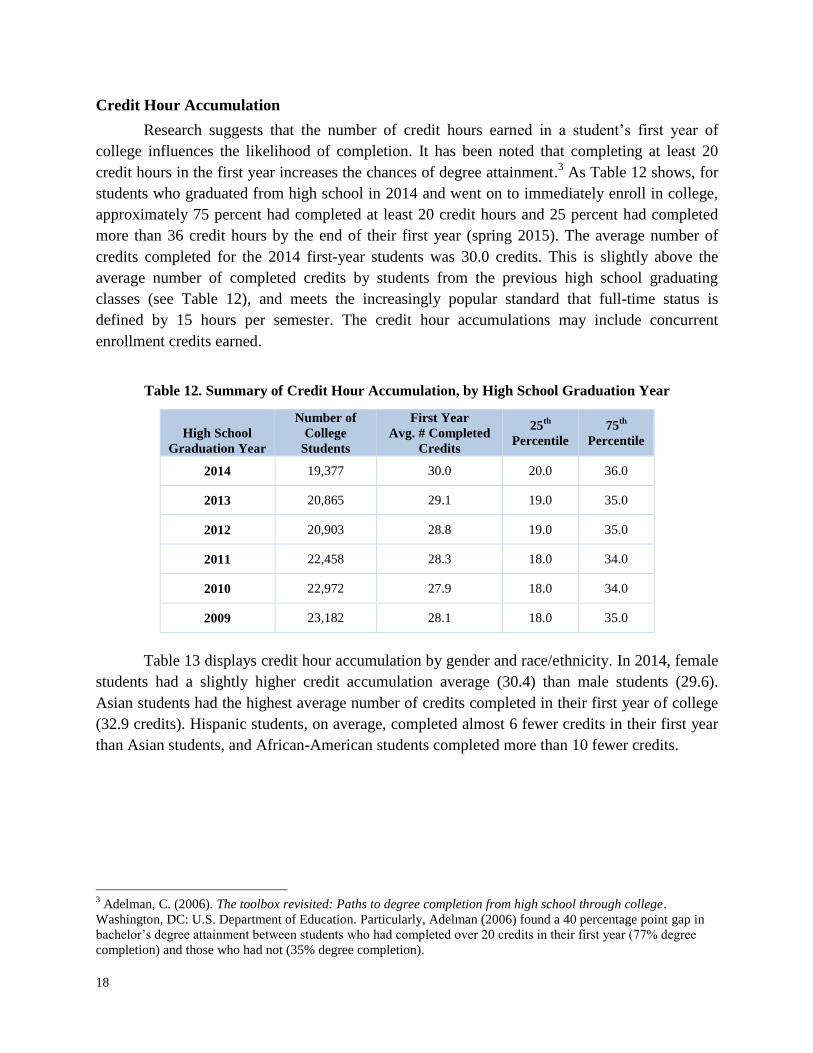
Credit Hour Accumulation
Research suggests that the number of credit hours earned in a student’s first year of
college influences the likelihood of completion. It has been noted that completing at least 20
credit hours in the first year increases the chances of degree attainment.3 As Table 12 shows, for
students who graduated from high school in 2014 and went on to immediately enroll in college,
approximately 75 percent had completed at least 20 credit hours and 25 percent had completed
more than 36 credit hours by the end of their first year (spring 2015). The average number of
credits completed for the 2014 first-year students was 30.0 credits. This is slightly above the
average number of completed credits by students from the previous high school graduating
classes (see Table 12), and meets the increasingly popular standard that full-time status is
defined by 15 hours per semester. The credit hour accumulations may include concurrent
enrollment credits earned.
Table 12. Summary of Credit Hour Accumulation, by High School Graduation Year
High School
Graduation Year
Number of
College
Students
First Year
Avg. # Completed
Credits
25th
Percentile
75th
Percentile
2014 19,377 30.0 20.0 36.0
2013 20,865 29.1 19.0 35.0
2012 20,903 28.8 19.0 35.0
2011 22,458 28.3 18.0 34.0
2010 22,972 27.9 18.0 34.0
2009 23,182 28.1 18.0 35.0
Table 13 displays credit hour accumulation by gender and race/ethnicity. In 2014, female
students had a slightly higher credit accumulation average (30.4) than male students (29.6).
Asian students had the highest average number of credits completed in their first year of college
(32.9 credits). Hispanic students, on average, completed almost 6 fewer credits in their first year
than Asian students, and African-American students completed more than 10 fewer credits.
3 Adelman, C. (2006). The toolbox revisited: Paths to degree completion from high school through college.
Washington, DC: U.S. Department of Education. Particularly, Adelman (2006) found a 40 percentage point gap in
bachelor’s degree attainment between students who had completed over 20 credits in their first year (77% degree
completion) and those who had not (35% degree completion).
19
Table 13. Credit Hour Accumulation, by Gender and Race/Ethnicity (2014)
2014
Number of
Students
First Year
Avg. # Completed
Credits
25th
Percentile 75th
Percentile
Female 10,401 30.4 21.0 37.0
Male 8,976 29.6 19.0 36.0
American Indian or
Alaskan Native 83 24.8 12.0 31.5
Asian 947 32.9 22.0 40.0
African-American 817 22.4 13.0 29.0
Hawaiian/Pacific
Islander 40 28.2 16.50 36.5
Hispanic 4,401 26.7 15.0 34.0
Two or More Races 602 29.9 21.0 36.0
White (not Hispanic) 12,487 31.5 22.0 38.0
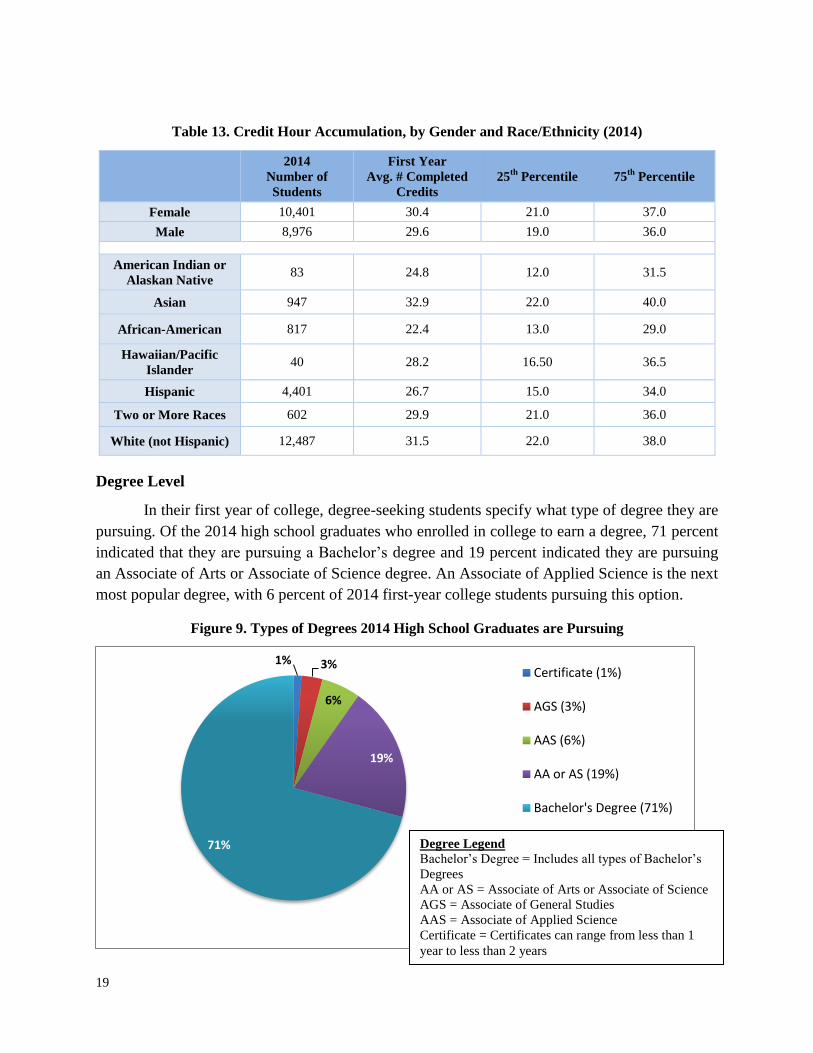
Degree Level
In their first year of college, degree-seeking students specify what type of degree they are
pursuing. Of the 2014 high school graduates who enrolled in college to earn a degree, 71 percent
indicated that they are pursuing a Bachelor’s degree and 19 percent indicated they are pursuing
an Associate of Arts or Associate of Science degree. An Associate of Applied Science is the next
most popular degree, with 6 percent of 2014 first-year college students pursuing this option.
Figure 9. Types of Degrees 2014 High School Graduates are Pursuing
1% 3%
6%
19%
71%
Certificate (1%)
AGS (3%)
AAS (6%)
AA or AS (19%)
Bachelor's Degree (71%)
Degree Legend
Bachelor’s Degree = Includes all types of Bachelor’s
Degrees
AA or AS = Associate of Arts or Associate of Science
AGS = Associate of General Studies
AAS = Associate of Applied Science
Certificate = Certificates can range from less than 1
year to less than 2 years
20
Part III. Persistence Rates
Unlike the previous section, which is limited in scope to students enrolled at Colorado
public institutions, part three encompasses all students. Using data from the National Student
Clearinghouse, the Department of Higher Education is able to track persistence rates for all
students, whether they are enrolled in Colorado, in another state, at a public institution or a
private one.
First-year persistence rates are important to consider because students are most likely to
drop out of college during or after their first year. The overall first-year persistence rate for the
high school graduating class of 2013 was 79.4 percent.4 This means that for all students who
graduated high school in spring 2013 and enrolled in college in fall 2013, 79.4 percent enrolled
for a second year of college in fall 2014. This number includes transfer students; as long as
students re-enrolled in college somewhere, they are included in the persistence rate. Colorado’s
persistence rates remain above national averages. The overall retention rate for the nation hovers
around 70 percent.5
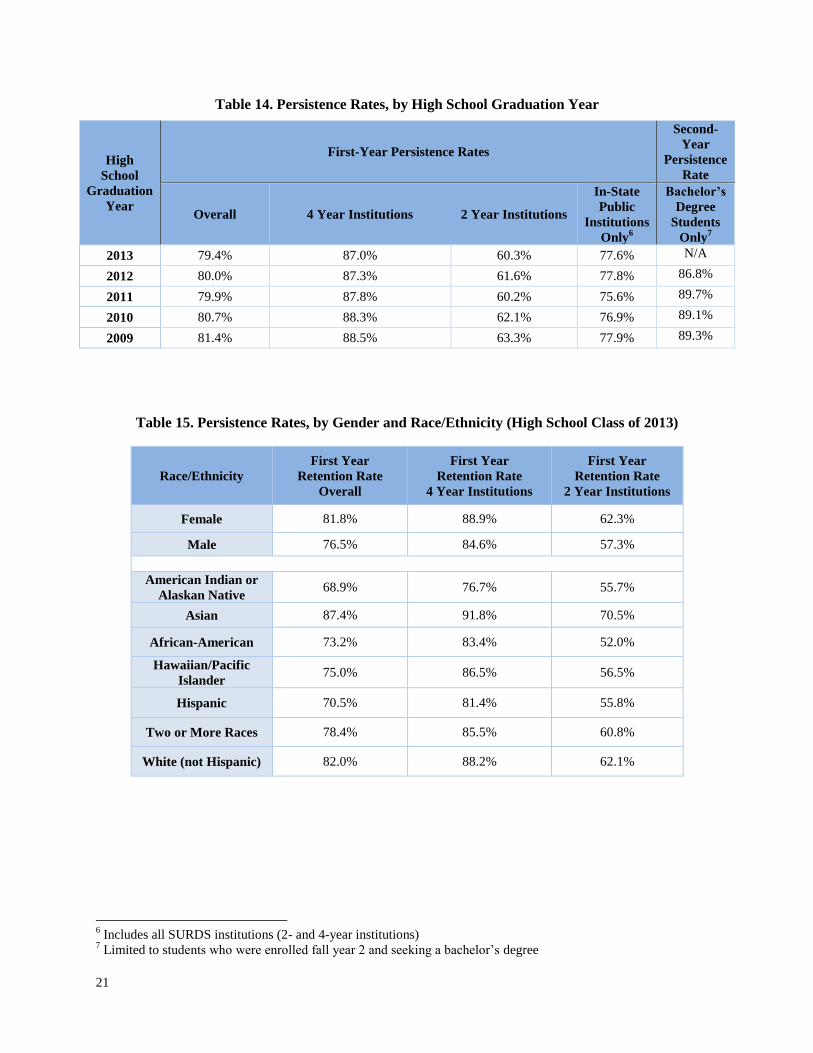
As Table 14 shows, the first-year retention rate at four-year institutions was 87.0 percent
for 2013 students. Comparatively, the retention rate at two-year colleges was 60.3 percent for the
same cohort of high school graduates. For all students from the 2012 graduating class seeking a
bachelor’s degree, the second-year retention rate was near 87 percent, which is slightly lower
than previous cohorts.
Retention rates for female students from the high school class of 2013 were 5.3
percentage points higher than retentions rates for male students (see Table 15). Compared to
other ethnic populations, Hispanic students had the lowest retention rates overall. The largest gap
in overall retention rates among racial/ethnic groups is between Asian and Hispanic students
(nearly 17 percentage points).
4 Retention rates are not yet available for students who were in their first year of college in the 2014-2015 academic
year. 5 U.S. Department of Education, National Center for Education Statistics, Integrated Postsecondary Education Data
System (IPEDS).
21
Table 14. Persistence Rates, by High School Graduation Year
High
School
Graduation
Year
First-Year Persistence Rates
Second-
Year
Persistence
Rate
Overall 4 Year Institutions 2 Year Institutions
In-State
Public
Institutions
Only6
Bachelor’s
Degree
Students
Only7
2013 79.4% 87.0% 60.3% 77.6% N/A
2012 80.0% 87.3% 61.6% 77.8% 86.8%
2011 79.9% 87.8% 60.2% 75.6% 89.7%
2010 80.7% 88.3% 62.1% 76.9% 89.1%
2009 81.4% 88.5% 63.3% 77.9% 89.3%
Table 15. Persistence Rates, by Gender and Race/Ethnicity (High School Class of 2013)
Race/Ethnicity
First Year
Retention Rate
Overall
First Year
Retention Rate
4 Year Institutions
First Year
Retention Rate
2 Year Institutions
Female 81.8% 88.9% 62.3%
Male 76.5% 84.6% 57.3%
American Indian or
Alaskan Native 68.9% 76.7% 55.7%
Asian 87.4% 91.8% 70.5%
African-American 73.2% 83.4% 52.0%
Hawaiian/Pacific
Islander 75.0% 86.5% 56.5%
Hispanic 70.5% 81.4% 55.8%
Two or More Races 78.4% 85.5% 60.8%
White (not Hispanic) 82.0% 88.2% 62.1%
6 Includes all SURDS institutions (2- and 4-year institutions)
7 Limited to students who were enrolled fall year 2 and seeking a bachelor’s degree
22
Part IV. Postsecondary Credential Attainment
In this section, information about postsecondary credential attainment is provided. This
level of detail is only available from the Colorado Department of Higher Education’s Student
Unit Record Data System (SURDS) dating back to the high school graduating class of 2009.
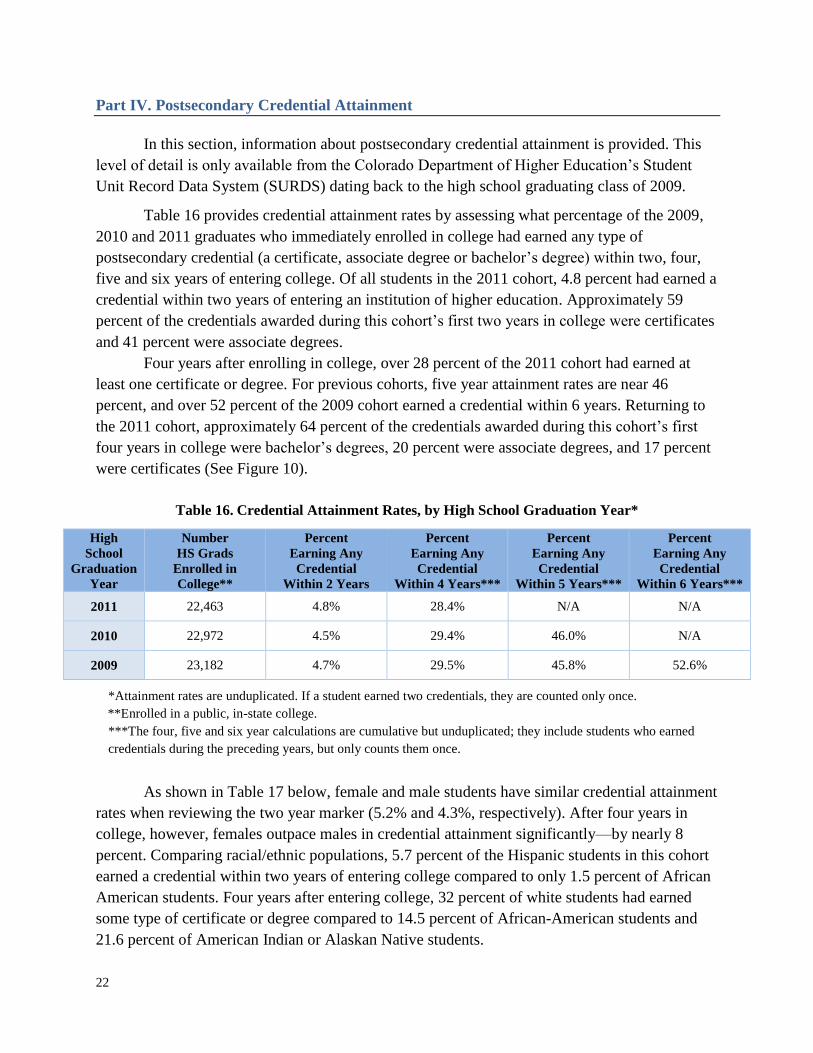
Table 16 provides credential attainment rates by assessing what percentage of the 2009,
2010 and 2011 graduates who immediately enrolled in college had earned any type of
postsecondary credential (a certificate, associate degree or bachelor’s degree) within two, four,
five and six years of entering college. Of all students in the 2011 cohort, 4.8 percent had earned a
credential within two years of entering an institution of higher education. Approximately 59
percent of the credentials awarded during this cohort’s first two years in college were certificates
and 41 percent were associate degrees.
Four years after enrolling in college, over 28 percent of the 2011 cohort had earned at
least one certificate or degree. For previous cohorts, five year attainment rates are near 46
percent, and over 52 percent of the 2009 cohort earned a credential within 6 years. Returning to
the 2011 cohort, approximately 64 percent of the credentials awarded during this cohort’s first
four years in college were bachelor’s degrees, 20 percent were associate degrees, and 17 percent
were certificates (See Figure 10).
Table 16. Credential Attainment Rates, by High School Graduation Year*
High
School
Graduation
Year
Number
HS Grads
Enrolled in
College**
Percent
Earning Any
Credential
Within 2 Years
Percent
Earning Any
Credential
Within 4 Years***
Percent
Earning Any
Credential
Within 5 Years***
Percent
Earning Any
Credential
Within 6 Years***
2011 22,463 4.8% 28.4% N/A N/A
2010 22,972 4.5% 29.4% 46.0% N/A
2009 23,182 4.7% 29.5% 45.8% 52.6%
*Attainment rates are unduplicated. If a student earned two credentials, they are counted only once.
**Enrolled in a public, in-state college.
***The four, five and six year calculations are cumulative but unduplicated; they include students who earned
credentials during the preceding years, but only counts them once.
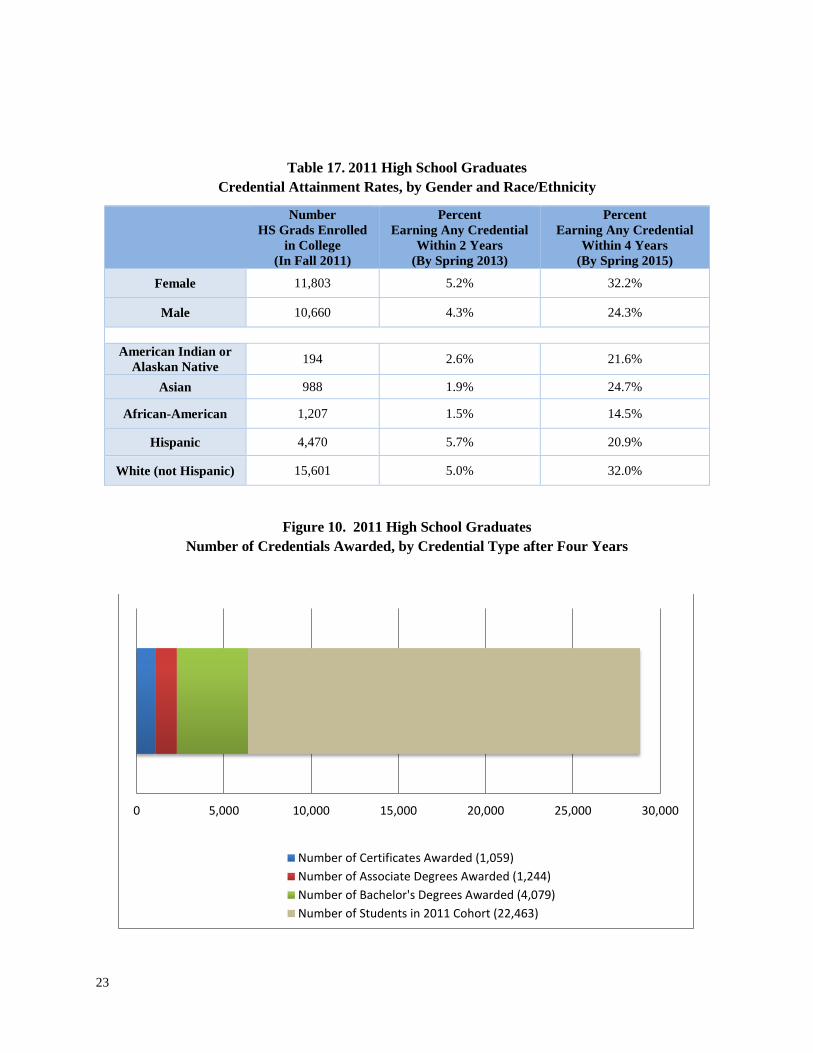
As shown in Table 17 below, female and male students have similar credential attainment
rates when reviewing the two year marker (5.2% and 4.3%, respectively). After four years in
college, however, females outpace males in credential attainment significantly—by nearly 8
percent. Comparing racial/ethnic populations, 5.7 percent of the Hispanic students in this cohort
earned a credential within two years of entering college compared to only 1.5 percent of African
American students. Four years after entering college, 32 percent of white students had earned
some type of certificate or degree compared to 14.5 percent of African-American students and
21.6 percent of American Indian or Alaskan Native students.
23
Table 17. 2011 High School Graduates
Credential Attainment Rates, by Gender and Race/Ethnicity
Number
HS Grads Enrolled
in College
(In Fall 2011)
Percent
Earning Any Credential
Within 2 Years
(By Spring 2013)
Percent
Earning Any Credential
Within 4 Years
(By Spring 2015)
Female 11,803 5.2% 32.2%
Male 10,660 4.3% 24.3%
American Indian or
Alaskan Native 194 2.6% 21.6%
Asian 988 1.9% 24.7%
African-American 1,207 1.5% 14.5%
Hispanic 4,470 5.7% 20.9%
White (not Hispanic) 15,601 5.0% 32.0%
Figure 10. 2011 High School Graduates
Number of Credentials Awarded, by Credential Type after Four Years
0 5,000 10,000 15,000 20,000 25,000 30,000
Number of Certificates Awarded (1,059)
Number of Associate Degrees Awarded (1,244)
Number of Bachelor's Degrees Awarded (4,079)
Number of Students in 2011 Cohort (22,463)
24
Conclusion
This report is intended to summarize and identify trends in postsecondary education for
six cohorts of Colorado high school graduates, with particular attention paid to the most recent.
The report tracks the 2009, 2010, 2011, 2012, 2013 and 2014 high school graduating classes and
describes student enrollment and progress following graduation. The data are disaggregated by
gender and race/ethnicity to further identify patterns.
This version of the Postsecondary Progress and Outcomes Report represents the first full
version of the document in which six graduating classes are analyzed per the report’s governing
statute. Data availability had previously limited the number of graduating classes that could be
included. In reviewing all six of these graduating classes, the most recent, 2014, is the first
cohort whose enrollment rate increased from the previous year. Previously, all graduating classes
included in this report had a lower enrollment rate than their previous year. This prolonged
downward trend followed an all-time high for enrollment rates in 2009 at the peak of the most
recent recession. While this positive change in the direction of enrollment rates is encouraging, it
is imperative that efforts to raise enrollment continue. Individuals who enroll in a postsecondary
institution, and ultimately earn a college credential, on average tend to earn higher salaries, lead
healthier lives, and be more engaged in civil society.
In highlighting the positive turnaround of Colorado’s enrollment trends and the long-term
benefits of postsecondary education, it would be remiss to not acknowledge the educational
disparities that exist across race/ethnicity groups. For example, postsecondary enrollment for
Hispanic students is nearly 20 percentage points below white students, and, after their first year
of college, African-American students, on average, earn nearly 10 fewer credits than white
students. A significant portion of Colorado’s Higher Education Master Plan is dedicated to
addressing educational gaps such as these. As Colorado’s demographics continue to change and
labor markets increasingly demand quality postsecondary credentials, ensuring the state’s future
economic prosperity requires that these educational gaps be highlighted and strategically
addressed.
About this Report
The Colorado Department of Higher Education and the Colorado Department of
Education have collaborated to provide this information with the intent that high schools and
colleges can use these data to better evaluate their programs and policies and so that the state can
better align the K-12 and higher education systems. To make this information easily accessible to
the public, CDHE created a searchable database and individualized district profiles. The project,
known as District at a Glance, is housed on CDHE’s website at
http://highered.colorado.gov/Data/DistrictHSSummary.aspx.
This work is a part of the ongoing implementation of the Colorado Achievement Plan for

25
Kids (CAP4K), which includes a series of initiatives aimed at ensuring that all students are
prepared to move seamlessly from high school into higher education and then into the workforce.
Information on statewide P-20 initiatives, including District at a Glance, Graduation Guidelines,
Concurrent Enrollment, Colorado Academic Standards, educator preparation and more, can be
found on the CDHE website at http://highered.colorado.gov/Academics/P20/.
26
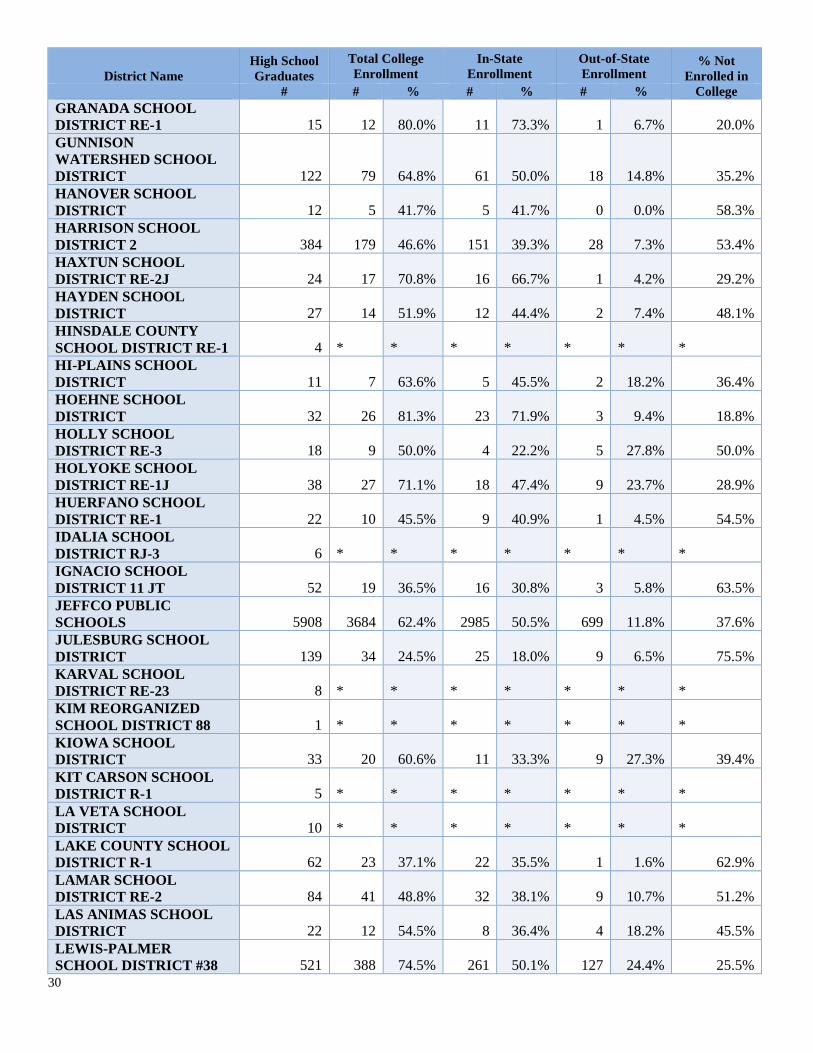
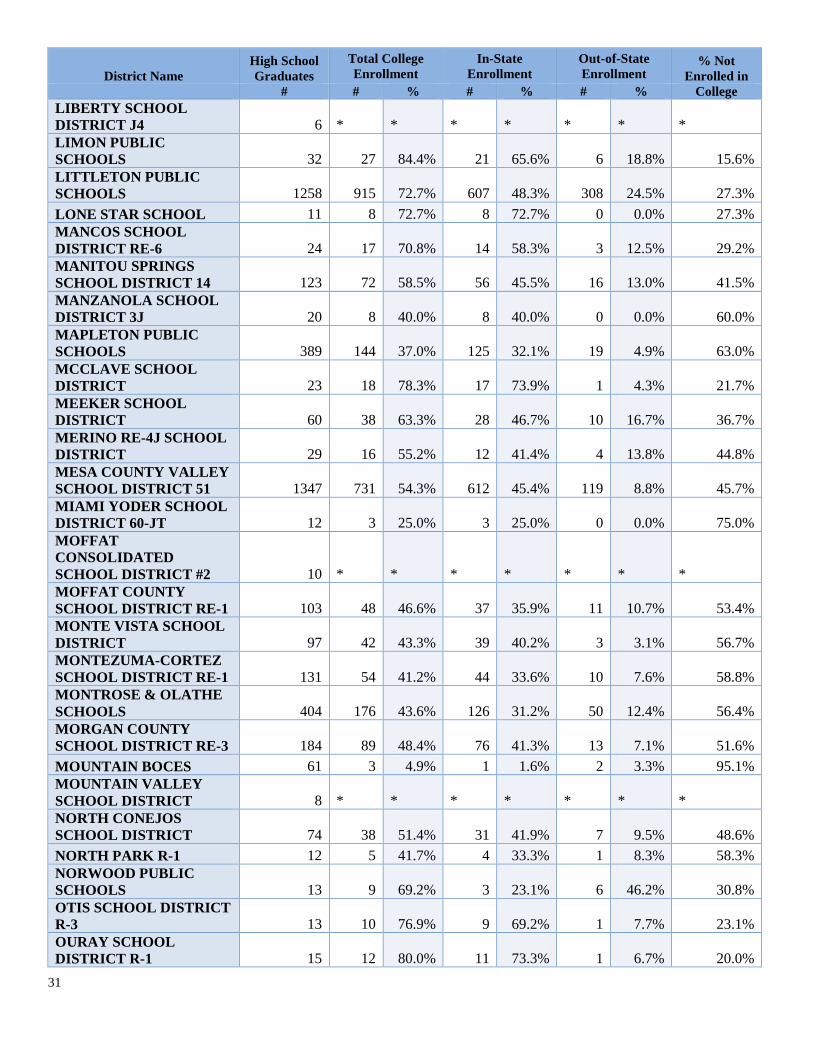
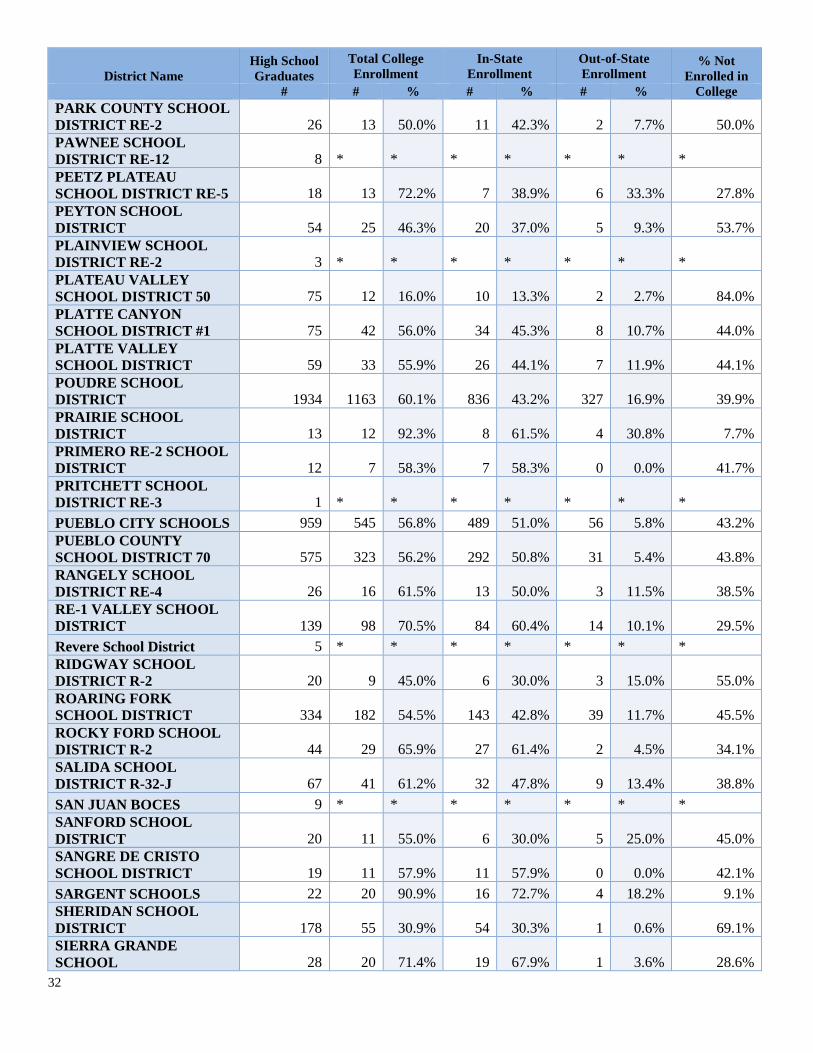
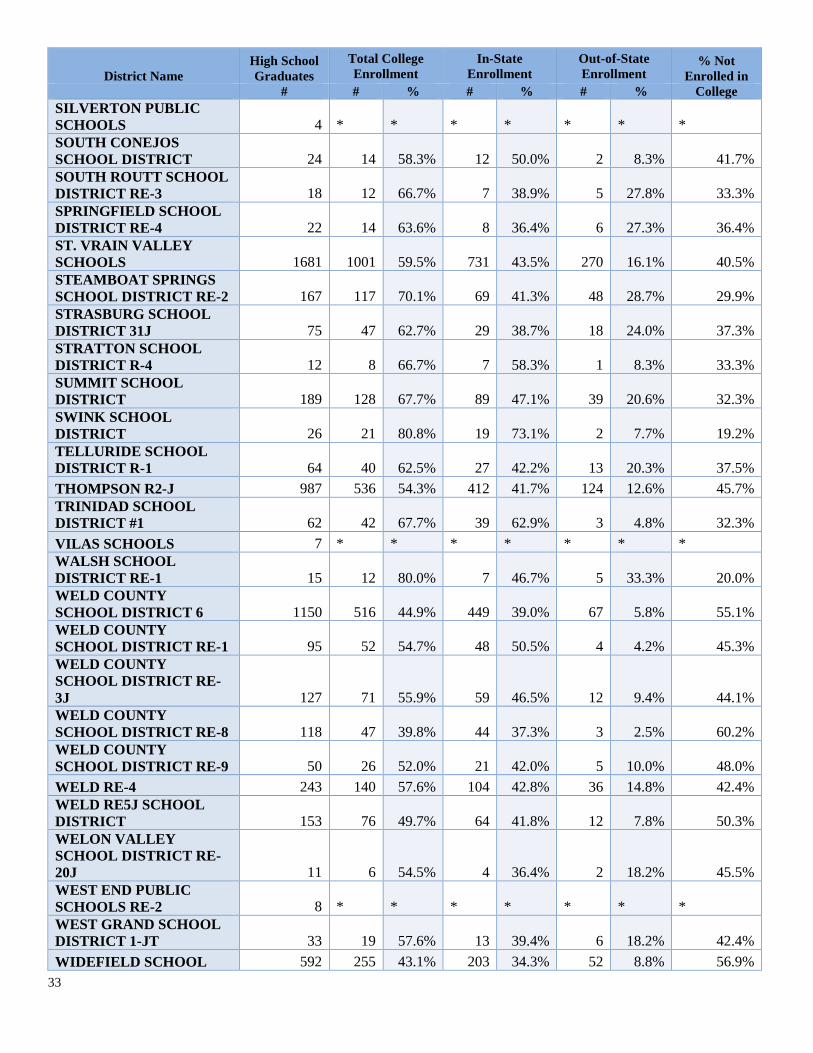
Appendix A: District-Level Statistics
27
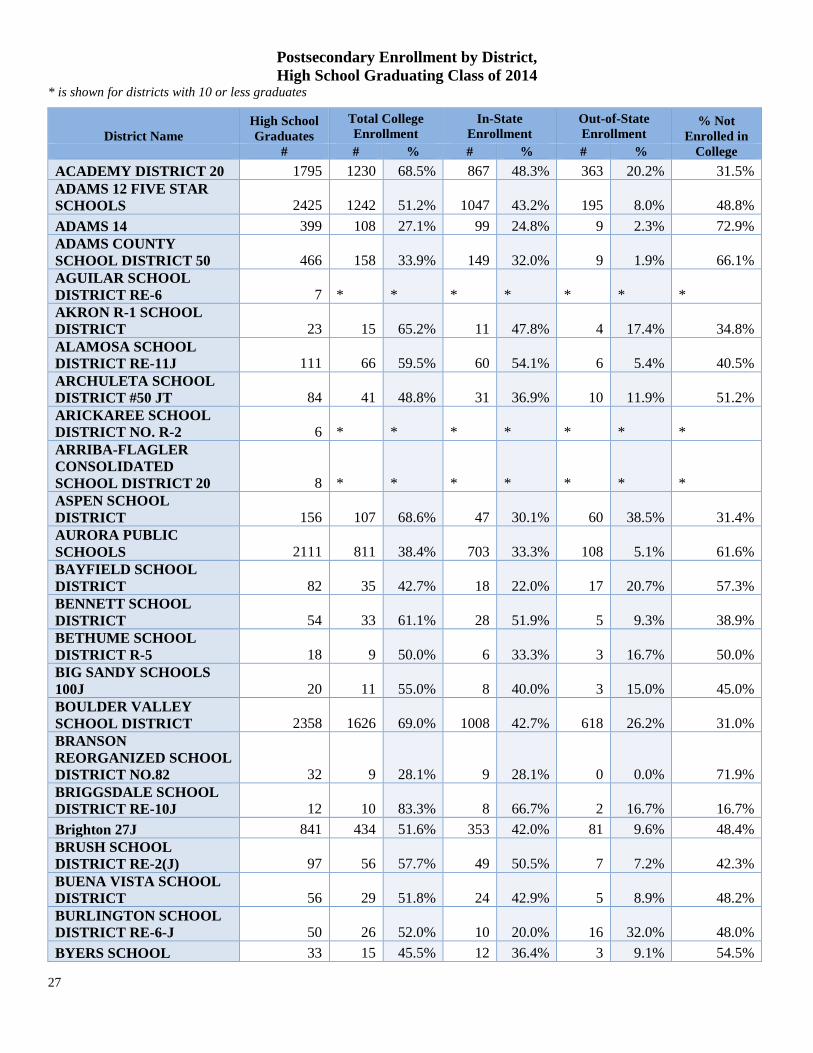
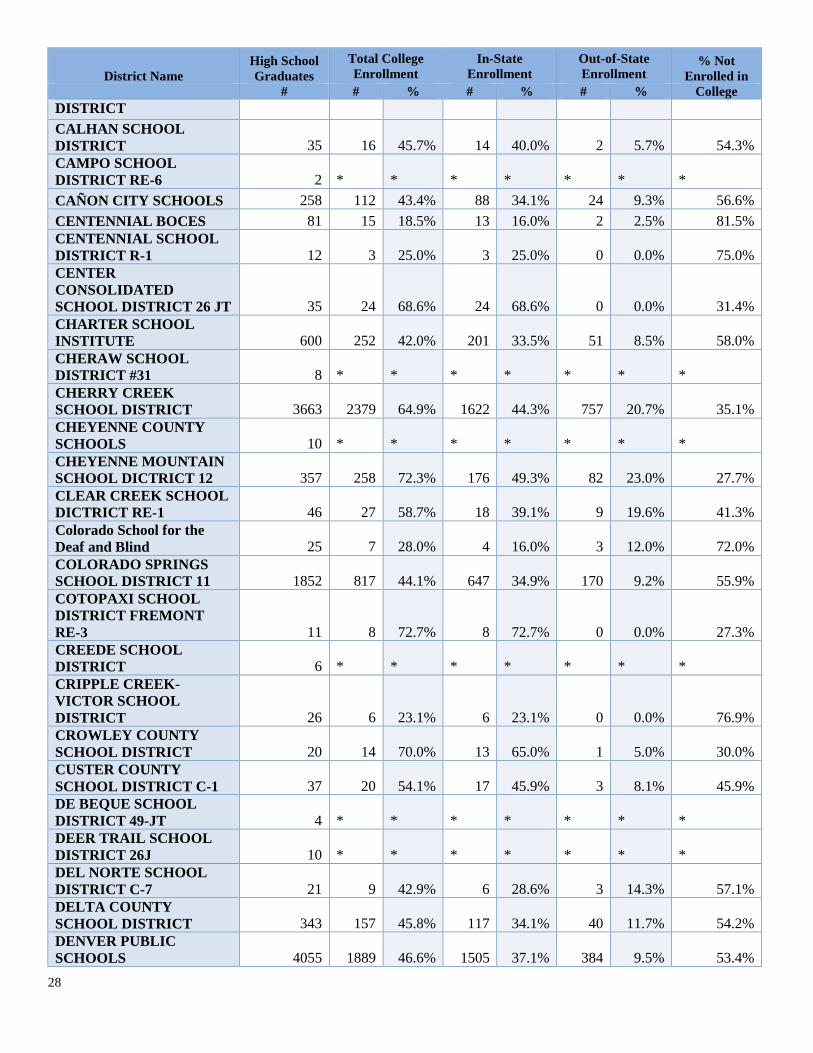
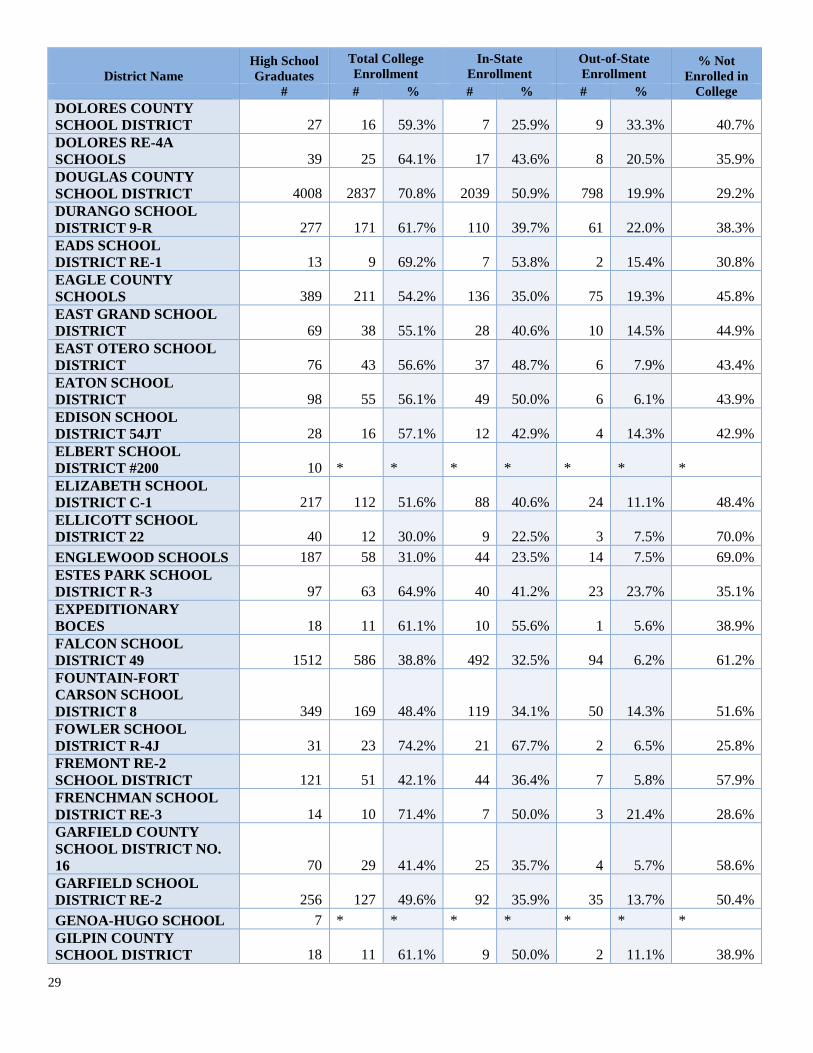
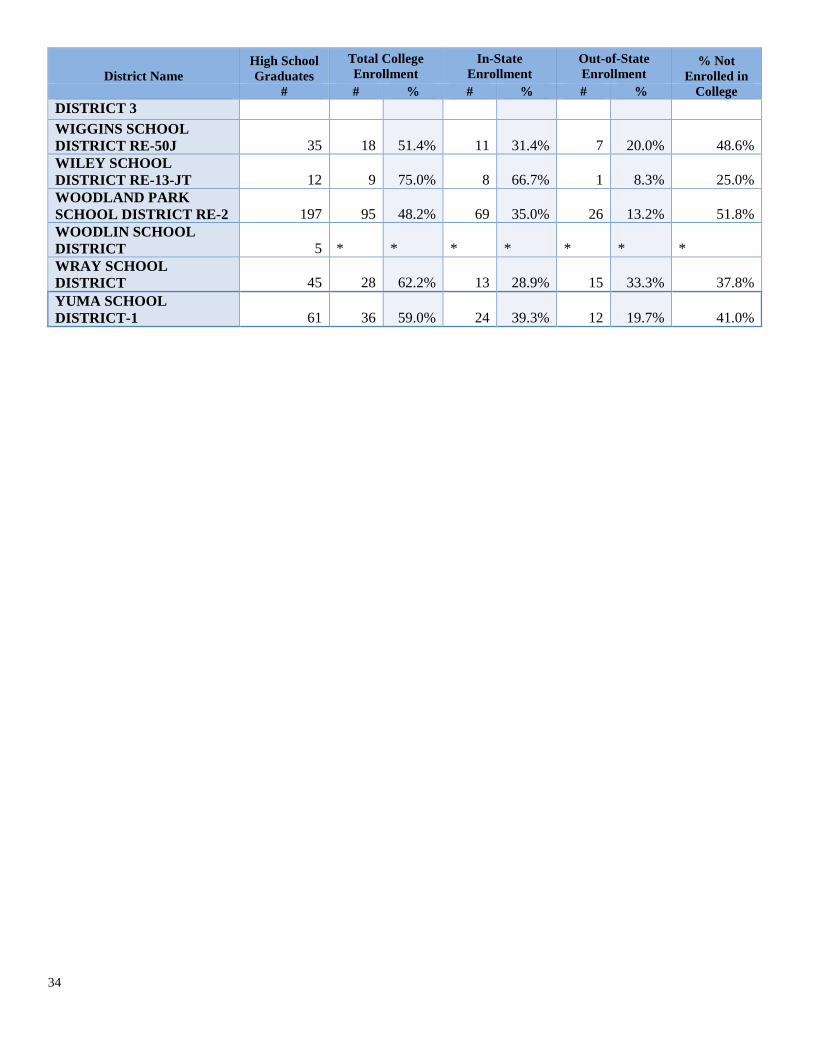
Postsecondary Enrollment by District,
High School Graduating Class of 2014 * is shown for districts with 10 or less graduates
District Name
High School
Graduates
Total College
Enrollment
In-State
Enrollment
Out-of-State
Enrollment % Not
Enrolled in
# # % # % # % College
ACADEMY DISTRICT 20 1795 1230 68.5% 867 48.3% 363 20.2% 31.5%
ADAMS 12 FIVE STAR
SCHOOLS 2425 1242 51.2% 1047 43.2% 195 8.0% 48.8%
ADAMS 14 399 108 27.1% 99 24.8% 9 2.3% 72.9%
ADAMS COUNTY
SCHOOL DISTRICT 50 466 158 33.9% 149 32.0% 9 1.9% 66.1%
AGUILAR SCHOOL
DISTRICT RE-6 7 * * * * * * *
AKRON R-1 SCHOOL
DISTRICT 23 15 65.2% 11 47.8% 4 17.4% 34.8%
ALAMOSA SCHOOL
DISTRICT RE-11J 111 66 59.5% 60 54.1% 6 5.4% 40.5%
ARCHULETA SCHOOL
DISTRICT #50 JT 84 41 48.8% 31 36.9% 10 11.9% 51.2%
ARICKAREE SCHOOL
DISTRICT NO. R-2 6 * * * * * * *
ARRIBA-FLAGLER
CONSOLIDATED
SCHOOL DISTRICT 20 8 * * * * * * *
ASPEN SCHOOL
DISTRICT 156 107 68.6% 47 30.1% 60 38.5% 31.4%
AURORA PUBLIC
SCHOOLS 2111 811 38.4% 703 33.3% 108 5.1% 61.6%
BAYFIELD SCHOOL
DISTRICT 82 35 42.7% 18 22.0% 17 20.7% 57.3%
BENNETT SCHOOL
DISTRICT 54 33 61.1% 28 51.9% 5 9.3% 38.9%
BETHUME SCHOOL
DISTRICT R-5 18 9 50.0% 6 33.3% 3 16.7% 50.0%
BIG SANDY SCHOOLS
100J 20 11 55.0% 8 40.0% 3 15.0% 45.0%
BOULDER VALLEY
SCHOOL DISTRICT 2358 1626 69.0% 1008 42.7% 618 26.2% 31.0%
BRANSON
REORGANIZED SCHOOL
DISTRICT NO.82 32 9 28.1% 9 28.1% 0 0.0% 71.9%
BRIGGSDALE SCHOOL
DISTRICT RE-10J 12 10 83.3% 8 66.7% 2 16.7% 16.7%
Brighton 27J 841 434 51.6% 353 42.0% 81 9.6% 48.4%
BRUSH SCHOOL
DISTRICT RE-2(J) 97 56 57.7% 49 50.5% 7 7.2% 42.3%
BUENA VISTA SCHOOL
DISTRICT 56 29 51.8% 24 42.9% 5 8.9% 48.2%
BURLINGTON SCHOOL
DISTRICT RE-6-J 50 26 52.0% 10 20.0% 16 32.0% 48.0%
BYERS SCHOOL 33 15 45.5% 12 36.4% 3 9.1% 54.5%
28
District Name
High School
Graduates
Total College
Enrollment
In-State
Enrollment
Out-of-State
Enrollment % Not
Enrolled in
# # % # % # % College
DISTRICT
CALHAN SCHOOL
DISTRICT 35 16 45.7% 14 40.0% 2 5.7% 54.3%
CAMPO SCHOOL
DISTRICT RE-6 2 * * * * * * *
CAÑON CITY SCHOOLS 258 112 43.4% 88 34.1% 24 9.3% 56.6%
CENTENNIAL BOCES 81 15 18.5% 13 16.0% 2 2.5% 81.5%
CENTENNIAL SCHOOL
DISTRICT R-1 12 3 25.0% 3 25.0% 0 0.0% 75.0%
CENTER
CONSOLIDATED
SCHOOL DISTRICT 26 JT 35 24 68.6% 24 68.6% 0 0.0% 31.4%
CHARTER SCHOOL
INSTITUTE 600 252 42.0% 201 33.5% 51 8.5% 58.0%
CHERAW SCHOOL
DISTRICT #31 8 * * * * * * *
CHERRY CREEK
SCHOOL DISTRICT 3663 2379 64.9% 1622 44.3% 757 20.7% 35.1%
CHEYENNE COUNTY
SCHOOLS 10 * * * * * * *
CHEYENNE MOUNTAIN
SCHOOL DICTRICT 12 357 258 72.3% 176 49.3% 82 23.0% 27.7%
CLEAR CREEK SCHOOL
DICTRICT RE-1 46 27 58.7% 18 39.1% 9 19.6% 41.3%
Colorado School for the
Deaf and Blind 25 7 28.0% 4 16.0% 3 12.0% 72.0%
COLORADO SPRINGS
SCHOOL DISTRICT 11 1852 817 44.1% 647 34.9% 170 9.2% 55.9%
COTOPAXI SCHOOL
DISTRICT FREMONT
RE-3 11 8 72.7% 8 72.7% 0 0.0% 27.3%
CREEDE SCHOOL
DISTRICT 6 * * * * * * *
CRIPPLE CREEK-
VICTOR SCHOOL
DISTRICT 26 6 23.1% 6 23.1% 0 0.0% 76.9%
CROWLEY COUNTY
SCHOOL DISTRICT 20 14 70.0% 13 65.0% 1 5.0% 30.0%
CUSTER COUNTY
SCHOOL DISTRICT C-1 37 20 54.1% 17 45.9% 3 8.1% 45.9%
DE BEQUE SCHOOL
DISTRICT 49-JT 4 * * * * * * *
DEER TRAIL SCHOOL
DISTRICT 26J 10 * * * * * * *
DEL NORTE SCHOOL
DISTRICT C-7 21 9 42.9% 6 28.6% 3 14.3% 57.1%
DELTA COUNTY
SCHOOL DISTRICT 343 157 45.8% 117 34.1% 40 11.7% 54.2%
DENVER PUBLIC
SCHOOLS 4055 1889 46.6% 1505 37.1% 384 9.5% 53.4%
29
District Name
High School
Graduates
Total College
Enrollment
In-State
Enrollment
Out-of-State
Enrollment % Not
Enrolled in
# # % # % # % College
DOLORES COUNTY
SCHOOL DISTRICT 27 16 59.3% 7 25.9% 9 33.3% 40.7%
DOLORES RE-4A
SCHOOLS 39 25 64.1% 17 43.6% 8 20.5% 35.9%
DOUGLAS COUNTY
SCHOOL DISTRICT 4008 2837 70.8% 2039 50.9% 798 19.9% 29.2%
DURANGO SCHOOL
DISTRICT 9-R 277 171 61.7% 110 39.7% 61 22.0% 38.3%
EADS SCHOOL
DISTRICT RE-1 13 9 69.2% 7 53.8% 2 15.4% 30.8%
EAGLE COUNTY
SCHOOLS 389 211 54.2% 136 35.0% 75 19.3% 45.8%
EAST GRAND SCHOOL
DISTRICT 69 38 55.1% 28 40.6% 10 14.5% 44.9%
EAST OTERO SCHOOL
DISTRICT 76 43 56.6% 37 48.7% 6 7.9% 43.4%
EATON SCHOOL
DISTRICT 98 55 56.1% 49 50.0% 6 6.1% 43.9%
EDISON SCHOOL
DISTRICT 54JT 28 16 57.1% 12 42.9% 4 14.3% 42.9%
ELBERT SCHOOL
DISTRICT #200 10 * * * * * * *
ELIZABETH SCHOOL
DISTRICT C-1 217 112 51.6% 88 40.6% 24 11.1% 48.4%
ELLICOTT SCHOOL
DISTRICT 22 40 12 30.0% 9 22.5% 3 7.5% 70.0%
ENGLEWOOD SCHOOLS 187 58 31.0% 44 23.5% 14 7.5% 69.0%
ESTES PARK SCHOOL
DISTRICT R-3 97 63 64.9% 40 41.2% 23 23.7% 35.1%
EXPEDITIONARY
BOCES 18 11 61.1% 10 55.6% 1 5.6% 38.9%
FALCON SCHOOL
DISTRICT 49 1512 586 38.8% 492 32.5% 94 6.2% 61.2%
FOUNTAIN-FORT
CARSON SCHOOL
DISTRICT 8 349 169 48.4% 119 34.1% 50 14.3% 51.6%
FOWLER SCHOOL
DISTRICT R-4J 31 23 74.2% 21 67.7% 2 6.5% 25.8%
FREMONT RE-2
SCHOOL DISTRICT 121 51 42.1% 44 36.4% 7 5.8% 57.9%
FRENCHMAN SCHOOL
DISTRICT RE-3 14 10 71.4% 7 50.0% 3 21.4% 28.6%
GARFIELD COUNTY
SCHOOL DISTRICT NO.
16 70 29 41.4% 25 35.7% 4 5.7% 58.6%
GARFIELD SCHOOL
DISTRICT RE-2 256 127 49.6% 92 35.9% 35 13.7% 50.4%
GENOA-HUGO SCHOOL 7 * * * * * * *
GILPIN COUNTY
SCHOOL DISTRICT 18 11 61.1% 9 50.0% 2 11.1% 38.9%
30
District Name
High School
Graduates
Total College
Enrollment
In-State
Enrollment
Out-of-State
Enrollment % Not
Enrolled in
# # % # % # % College
GRANADA SCHOOL
DISTRICT RE-1 15 12 80.0% 11 73.3% 1 6.7% 20.0%
GUNNISON
WATERSHED SCHOOL
DISTRICT 122 79 64.8% 61 50.0% 18 14.8% 35.2%
HANOVER SCHOOL
DISTRICT 12 5 41.7% 5 41.7% 0 0.0% 58.3%
HARRISON SCHOOL
DISTRICT 2 384 179 46.6% 151 39.3% 28 7.3% 53.4%
HAXTUN SCHOOL
DISTRICT RE-2J 24 17 70.8% 16 66.7% 1 4.2% 29.2%
HAYDEN SCHOOL
DISTRICT 27 14 51.9% 12 44.4% 2 7.4% 48.1%
HINSDALE COUNTY
SCHOOL DISTRICT RE-1 4 * * * * * * *
HI-PLAINS SCHOOL
DISTRICT 11 7 63.6% 5 45.5% 2 18.2% 36.4%
HOEHNE SCHOOL
DISTRICT 32 26 81.3% 23 71.9% 3 9.4% 18.8%
HOLLY SCHOOL
DISTRICT RE-3 18 9 50.0% 4 22.2% 5 27.8% 50.0%
HOLYOKE SCHOOL
DISTRICT RE-1J 38 27 71.1% 18 47.4% 9 23.7% 28.9%
HUERFANO SCHOOL
DISTRICT RE-1 22 10 45.5% 9 40.9% 1 4.5% 54.5%
IDALIA SCHOOL
DISTRICT RJ-3 6 * * * * * * *
IGNACIO SCHOOL
DISTRICT 11 JT 52 19 36.5% 16 30.8% 3 5.8% 63.5%
JEFFCO PUBLIC
SCHOOLS 5908 3684 62.4% 2985 50.5% 699 11.8% 37.6%
JULESBURG SCHOOL
DISTRICT 139 34 24.5% 25 18.0% 9 6.5% 75.5%
KARVAL SCHOOL
DISTRICT RE-23 8 * * * * * * *
KIM REORGANIZED
SCHOOL DISTRICT 88 1 * * * * * * *
KIOWA SCHOOL
DISTRICT 33 20 60.6% 11 33.3% 9 27.3% 39.4%
KIT CARSON SCHOOL
DISTRICT R-1 5 * * * * * * *
LA VETA SCHOOL
DISTRICT 10 * * * * * * *
LAKE COUNTY SCHOOL
DISTRICT R-1 62 23 37.1% 22 35.5% 1 1.6% 62.9%
LAMAR SCHOOL
DISTRICT RE-2 84 41 48.8% 32 38.1% 9 10.7% 51.2%
LAS ANIMAS SCHOOL
DISTRICT 22 12 54.5% 8 36.4% 4 18.2% 45.5%
LEWIS-PALMER
SCHOOL DISTRICT #38 521 388 74.5% 261 50.1% 127 24.4% 25.5%
31
District Name
High School
Graduates
Total College
Enrollment
In-State
Enrollment
Out-of-State
Enrollment % Not
Enrolled in
# # % # % # % College
LIBERTY SCHOOL
DISTRICT J4 6 * * * * * * *
LIMON PUBLIC
SCHOOLS 32 27 84.4% 21 65.6% 6 18.8% 15.6%
LITTLETON PUBLIC
SCHOOLS 1258 915 72.7% 607 48.3% 308 24.5% 27.3%
LONE STAR SCHOOL 11 8 72.7% 8 72.7% 0 0.0% 27.3%
MANCOS SCHOOL
DISTRICT RE-6 24 17 70.8% 14 58.3% 3 12.5% 29.2%
MANITOU SPRINGS
SCHOOL DISTRICT 14 123 72 58.5% 56 45.5% 16 13.0% 41.5%
MANZANOLA SCHOOL
DISTRICT 3J 20 8 40.0% 8 40.0% 0 0.0% 60.0%
MAPLETON PUBLIC
SCHOOLS 389 144 37.0% 125 32.1% 19 4.9% 63.0%
MCCLAVE SCHOOL
DISTRICT 23 18 78.3% 17 73.9% 1 4.3% 21.7%
MEEKER SCHOOL
DISTRICT 60 38 63.3% 28 46.7% 10 16.7% 36.7%
MERINO RE-4J SCHOOL
DISTRICT 29 16 55.2% 12 41.4% 4 13.8% 44.8%
MESA COUNTY VALLEY
SCHOOL DISTRICT 51 1347 731 54.3% 612 45.4% 119 8.8% 45.7%
MIAMI YODER SCHOOL
DISTRICT 60-JT 12 3 25.0% 3 25.0% 0 0.0% 75.0%
MOFFAT
CONSOLIDATED
SCHOOL DISTRICT #2 10 * * * * * * *
MOFFAT COUNTY
SCHOOL DISTRICT RE-1 103 48 46.6% 37 35.9% 11 10.7% 53.4%
MONTE VISTA SCHOOL
DISTRICT 97 42 43.3% 39 40.2% 3 3.1% 56.7%
MONTEZUMA-CORTEZ
SCHOOL DISTRICT RE-1 131 54 41.2% 44 33.6% 10 7.6% 58.8%
MONTROSE & OLATHE
SCHOOLS 404 176 43.6% 126 31.2% 50 12.4% 56.4%
MORGAN COUNTY
SCHOOL DISTRICT RE-3 184 89 48.4% 76 41.3% 13 7.1% 51.6%
MOUNTAIN BOCES 61 3 4.9% 1 1.6% 2 3.3% 95.1%
MOUNTAIN VALLEY
SCHOOL DISTRICT 8 * * * * * * *
NORTH CONEJOS
SCHOOL DISTRICT 74 38 51.4% 31 41.9% 7 9.5% 48.6%
NORTH PARK R-1 12 5 41.7% 4 33.3% 1 8.3% 58.3%
NORWOOD PUBLIC
SCHOOLS 13 9 69.2% 3 23.1% 6 46.2% 30.8%
OTIS SCHOOL DISTRICT
R-3 13 10 76.9% 9 69.2% 1 7.7% 23.1%
OURAY SCHOOL
DISTRICT R-1 15 12 80.0% 11 73.3% 1 6.7% 20.0%
32
District Name
High School
Graduates
Total College
Enrollment
In-State
Enrollment
Out-of-State
Enrollment % Not
Enrolled in
# # % # % # % College
PARK COUNTY SCHOOL
DISTRICT RE-2 26 13 50.0% 11 42.3% 2 7.7% 50.0%
PAWNEE SCHOOL
DISTRICT RE-12 8 * * * * * * *
PEETZ PLATEAU
SCHOOL DISTRICT RE-5 18 13 72.2% 7 38.9% 6 33.3% 27.8%
PEYTON SCHOOL
DISTRICT 54 25 46.3% 20 37.0% 5 9.3% 53.7%
PLAINVIEW SCHOOL
DISTRICT RE-2 3 * * * * * * *
PLATEAU VALLEY
SCHOOL DISTRICT 50 75 12 16.0% 10 13.3% 2 2.7% 84.0%
PLATTE CANYON
SCHOOL DISTRICT #1 75 42 56.0% 34 45.3% 8 10.7% 44.0%
PLATTE VALLEY
SCHOOL DISTRICT 59 33 55.9% 26 44.1% 7 11.9% 44.1%
POUDRE SCHOOL
DISTRICT 1934 1163 60.1% 836 43.2% 327 16.9% 39.9%
PRAIRIE SCHOOL
DISTRICT 13 12 92.3% 8 61.5% 4 30.8% 7.7%
PRIMERO RE-2 SCHOOL
DISTRICT 12 7 58.3% 7 58.3% 0 0.0% 41.7%
PRITCHETT SCHOOL
DISTRICT RE-3 1 * * * * * * *
PUEBLO CITY SCHOOLS 959 545 56.8% 489 51.0% 56 5.8% 43.2%
PUEBLO COUNTY
SCHOOL DISTRICT 70 575 323 56.2% 292 50.8% 31 5.4% 43.8%
RANGELY SCHOOL
DISTRICT RE-4 26 16 61.5% 13 50.0% 3 11.5% 38.5%
RE-1 VALLEY SCHOOL
DISTRICT 139 98 70.5% 84 60.4% 14 10.1% 29.5%
Revere School District 5 * * * * * * *
RIDGWAY SCHOOL
DISTRICT R-2 20 9 45.0% 6 30.0% 3 15.0% 55.0%
ROARING FORK
SCHOOL DISTRICT 334 182 54.5% 143 42.8% 39 11.7% 45.5%
ROCKY FORD SCHOOL
DISTRICT R-2 44 29 65.9% 27 61.4% 2 4.5% 34.1%
SALIDA SCHOOL
DISTRICT R-32-J 67 41 61.2% 32 47.8% 9 13.4% 38.8%
SAN JUAN BOCES 9 * * * * * * *
SANFORD SCHOOL
DISTRICT 20 11 55.0% 6 30.0% 5 25.0% 45.0%
SANGRE DE CRISTO
SCHOOL DISTRICT 19 11 57.9% 11 57.9% 0 0.0% 42.1%
SARGENT SCHOOLS 22 20 90.9% 16 72.7% 4 18.2% 9.1%
SHERIDAN SCHOOL
DISTRICT 178 55 30.9% 54 30.3% 1 0.6% 69.1%
SIERRA GRANDE
SCHOOL 28 20 71.4% 19 67.9% 1 3.6% 28.6%
33
District Name
High School
Graduates
Total College
Enrollment
In-State
Enrollment
Out-of-State
Enrollment % Not
Enrolled in
# # % # % # % College
SILVERTON PUBLIC
SCHOOLS 4 * * * * * * *
SOUTH CONEJOS
SCHOOL DISTRICT 24 14 58.3% 12 50.0% 2 8.3% 41.7%
SOUTH ROUTT SCHOOL
DISTRICT RE-3 18 12 66.7% 7 38.9% 5 27.8% 33.3%
SPRINGFIELD SCHOOL
DISTRICT RE-4 22 14 63.6% 8 36.4% 6 27.3% 36.4%
ST. VRAIN VALLEY
SCHOOLS 1681 1001 59.5% 731 43.5% 270 16.1% 40.5%
STEAMBOAT SPRINGS
SCHOOL DISTRICT RE-2 167 117 70.1% 69 41.3% 48 28.7% 29.9%
STRASBURG SCHOOL
DISTRICT 31J 75 47 62.7% 29 38.7% 18 24.0% 37.3%
STRATTON SCHOOL
DISTRICT R-4 12 8 66.7% 7 58.3% 1 8.3% 33.3%
SUMMIT SCHOOL
DISTRICT 189 128 67.7% 89 47.1% 39 20.6% 32.3%
SWINK SCHOOL
DISTRICT 26 21 80.8% 19 73.1% 2 7.7% 19.2%
TELLURIDE SCHOOL
DISTRICT R-1 64 40 62.5% 27 42.2% 13 20.3% 37.5%
THOMPSON R2-J 987 536 54.3% 412 41.7% 124 12.6% 45.7%
TRINIDAD SCHOOL
DISTRICT #1 62 42 67.7% 39 62.9% 3 4.8% 32.3%
VILAS SCHOOLS 7 * * * * * * *
WALSH SCHOOL
DISTRICT RE-1 15 12 80.0% 7 46.7% 5 33.3% 20.0%
WELD COUNTY
SCHOOL DISTRICT 6 1150 516 44.9% 449 39.0% 67 5.8% 55.1%
WELD COUNTY
SCHOOL DISTRICT RE-1 95 52 54.7% 48 50.5% 4 4.2% 45.3%
WELD COUNTY
SCHOOL DISTRICT RE-
3J 127 71 55.9% 59 46.5% 12 9.4% 44.1%
WELD COUNTY
SCHOOL DISTRICT RE-8 118 47 39.8% 44 37.3% 3 2.5% 60.2%
WELD COUNTY
SCHOOL DISTRICT RE-9 50 26 52.0% 21 42.0% 5 10.0% 48.0%
WELD RE-4 243 140 57.6% 104 42.8% 36 14.8% 42.4%
WELD RE5J SCHOOL
DISTRICT 153 76 49.7% 64 41.8% 12 7.8% 50.3%
WELON VALLEY
SCHOOL DISTRICT RE-
20J 11 6 54.5% 4 36.4% 2 18.2% 45.5%
WEST END PUBLIC
SCHOOLS RE-2 8 * * * * * * *
WEST GRAND SCHOOL
DISTRICT 1-JT 33 19 57.6% 13 39.4% 6 18.2% 42.4%
WIDEFIELD SCHOOL 592 255 43.1% 203 34.3% 52 8.8% 56.9%
34
District Name
High School
Graduates
Total College
Enrollment
In-State
Enrollment
Out-of-State
Enrollment % Not
Enrolled in
# # % # % # % College
DISTRICT 3
WIGGINS SCHOOL
DISTRICT RE-50J 35 18 51.4% 11 31.4% 7 20.0% 48.6%
WILEY SCHOOL
DISTRICT RE-13-JT 12 9 75.0% 8 66.7% 1 8.3% 25.0%
WOODLAND PARK
SCHOOL DISTRICT RE-2 197 95 48.2% 69 35.0% 26 13.2% 51.8%
WOODLIN SCHOOL
DISTRICT 5 * * * * * * *
WRAY SCHOOL
DISTRICT 45 28 62.2% 13 28.9% 15 33.3% 37.8%
YUMA SCHOOL
DISTRICT-1 61 36 59.0% 24 39.3% 12 19.7% 41.0%
35
Appendix B: Technical Information
Methodology and Data
The nature of this report requires data from both the DHE and the Colorado Department
of Education (CDE). Data between these two state agencies began to be connected with the
introduction of the State Assigned Student ID (SASID). Because of this linkage requirement,
data are currently available dating back to the 2009 high school graduating class. The academic
years referred to in the report coincide with the following fall entry into college of the high
school graduates. For example, the 2014 high school graduates tracked in this report enrolled in
college in fall 2015. Please note that the report on the 2010 high school graduates (published in
2012) calculated college matriculation by considering high school graduates who enrolled in
college within 18 months of graduating. This year’s report continues the methodology that was
used in last year’s report and calculates college matriculation based upon those students who
enrolled in college in the fall immediately following high school graduation.
Numerous national organizations, such as the National Center for Higher Education
Management Statistics, and several states, including Tennessee, Texas, and West Virginia,
follow a 6 month reporting period to define college-going rates. The majority of students who
attend college do so immediately following high school graduation. The college going-rate,
therefore, can been seen as an indicator of both the accessibility of and the value of college.
Upon high school graduation, students are confronted with several choices including attending
college, entering the workforce, or joining the military. Measuring how many students choose to
enroll immediately in college reflects how attending college ranks among other post-high school
options. Further, looking at college-going rates for different ethnic/racial groups and for low-
income students can provide insight into college access issues.
Data Collection: Data were collected through the DHE Student Unit Record Data System
(SURDS), and SASIDs were obtained from CDE. Additionally, data from the National Student
Clearinghouse (NSC) were linked to provide out-of-state enrollment information, as well as
information on private institutions in Colorado not included in SURDS.
Report Format: The report presents information in four parts:
1. Postsecondary enrollment trends, including information on in-state and out-of-
state enrollment and institution type, disaggregated by ethnicity and gender.
2. Information on first-year college students in Colorado, including financial aid
status, average grade point average, credit accumulation and degree level,
disaggregated by ethnicity and gender.
3. First and second year retention rates.
4. Postsecondary credential attainment information.
36
Data Limitations: Data in part two of the report are limited to schools included in
SURDS (i.e., all public Colorado colleges and universities, plus Colorado Christian
University, Regis University, and the University of Denver). Future reports will be able
to track college matriculation in Colorado into an additional 50 degree granting private
institutions.
Contact Information
For more information, please contact:
T. Luke Banaszak, Research and Data Management Analyst,