Embed Size (px)
Citation preview
Issue Brief: Racial/Ethnic Equity in Postsecondary Education & Training
December 2019
This brief was prepared by Amy G. Cox, Elizabeth Martinez, Olga Levadnaya, Vern Mayfield, Betsy Simpkins, and Shiyan Tao of the Oregon Higher Education Coordinating Commission. December 2019.
255 Capitol Street NE, Sa lem, OR 97310
www.oregon.gov/HigherEd
The pay-off of postsecondary education Education and training beyond high school are associated
with many positive outcomes, including higher earnings and
job security, civic engagement, and upward mobility.1 Yet
Oregonians vary in their likelihood of accessing, affording,
and completing a postsecondary education, and some of the
largest variations are across racial/ethnic groups. This research brief describes these disparities to help
organizations, policymakers, and practitioners identify paths to improvement.
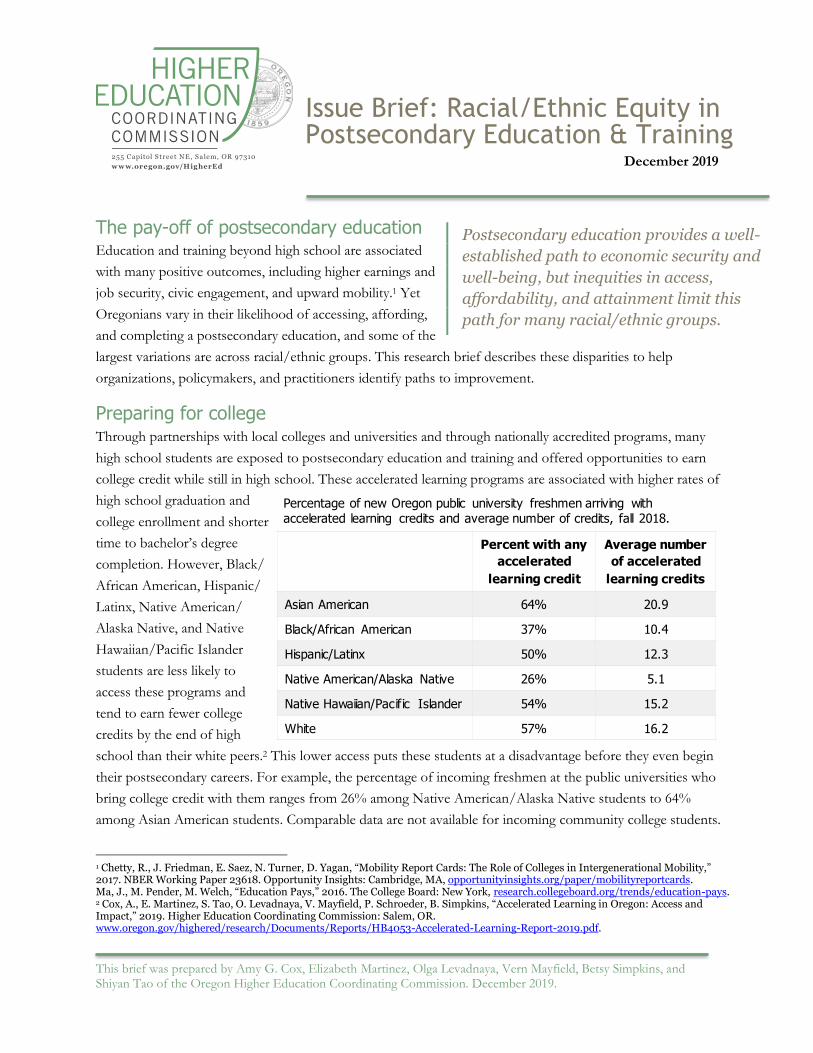
Preparing for college Through partnerships with local colleges and universities and through nationally accredited programs, many
high school students are exposed to postsecondary education and training and offered opportunities to earn
college credit while still in high school. These accelerated learning programs are associated with higher rates of
high school graduation and
college enrollment and shorter
time to bachelor’s degree
completion. However, Black/
African American, Hispanic/
Latinx, Native American/
Alaska Native, and Native
Hawaiian/Pacific Islander
students are less likely to
access these programs and
tend to earn fewer college
credits by the end of high
school than their white peers.2 This lower access puts these students at a disadvantage before they even begin
their postsecondary careers. For example, the percentage of incoming freshmen at the public universities who
bring college credit with them ranges from 26% among Native American/Alaska Native students to 64%
among Asian American students. Comparable data are not available for incoming community college students.
1 Chetty, R., J. Friedman, E. Saez, N. Turner, D. Yagan, “Mobility Report Cards: The Role of Colleges in Intergenerational Mobility,” 2017. NBER Working Paper 23618. Opportunity Insights: Cambridge, MA, opportunityinsights.org/paper/mobilityreportcards. Ma, J., M. Pender, M. Welch, “Education Pays,” 2016. The College Board: New York, research.collegeboard.org/trends/education-pays. 2 Cox, A., E. Martinez, S. Tao, O. Levadnaya, V. Mayfield, P. Schroeder, B. Simpkins, “Accelerated Learning in Oregon: Access and Impact,” 2019. Higher Education Coordinating Commission: Salem, OR. www.oregon.gov/highered/research/Documents/Reports/HB4053-Accelerated-Learning-Report-2019.pdf.
Postsecondary education provides a well-
established path to economic security and
well-being, but inequities in access,
affordability, and attainment limit this
path for many racial/ethnic groups.
Percent with any
accelerated
learning credit
Average number
of accelerated
learning credits
Asian American 64% 20.9
Black/African American 37% 10.4
Hispanic/Latinx 50% 12.3
Native American/Alaska Native 26% 5.1
Native Hawaiian/Pacific Islander 54% 15.2
White 57% 16.2
Percentage of new Oregon public university freshmen arriving with accelerated learning credits and average number of credits, fall 2018.
Racial/Ethnic Equity in Postsecondary Education & Training
2
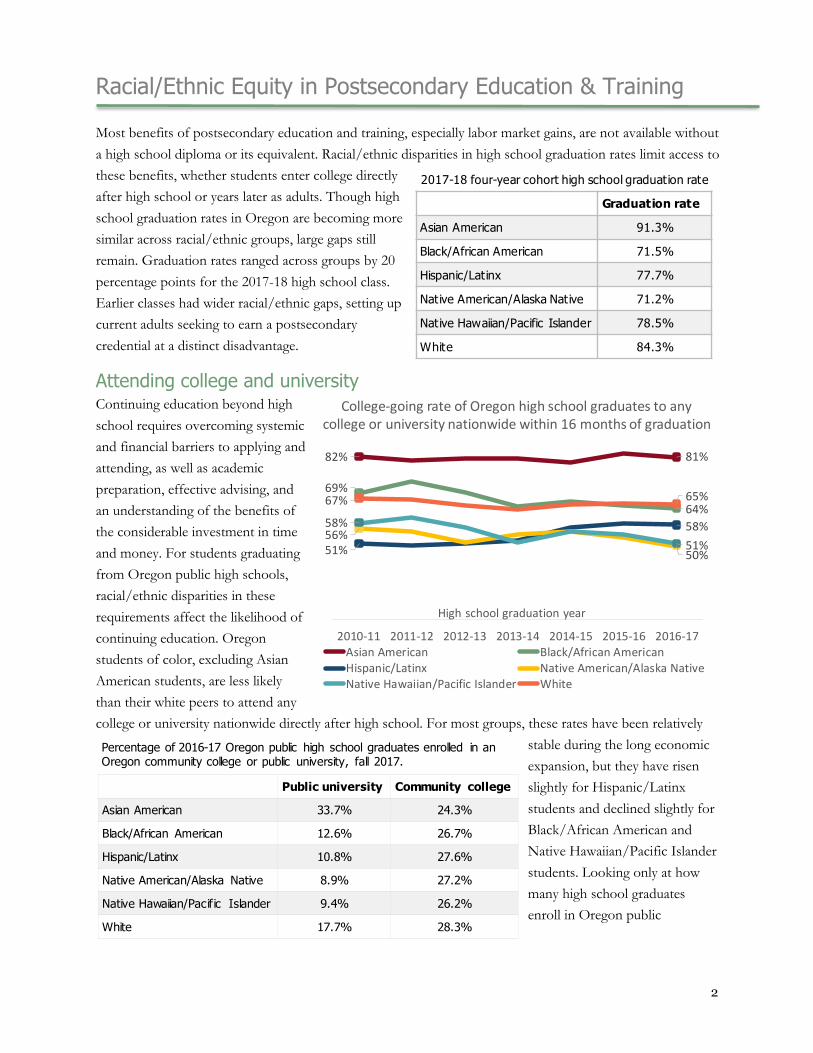
Most benefits of postsecondary education and training, especially labor market gains, are not available without
a high school diploma or its equivalent. Racial/ethnic disparities in high school graduation rates limit access to
these benefits, whether students enter college directly
after high school or years later as adults. Though high
school graduation rates in Oregon are becoming more
similar across racial/ethnic groups, large gaps still
remain. Graduation rates ranged across groups by 20
percentage points for the 2017-18 high school class.
Earlier classes had wider racial/ethnic gaps, setting up
current adults seeking to earn a postsecondary
credential at a distinct disadvantage.
Attending college and university
Continuing education beyond high
school requires overcoming systemic
and financial barriers to applying and
attending, as well as academic
preparation, effective advising, and
an understanding of the benefits of
the considerable investment in time
and money. For students graduating
from Oregon public high schools,
racial/ethnic disparities in these
requirements affect the likelihood of
continuing education. Oregon
students of color, excluding Asian
American students, are less likely
than their white peers to attend any
college or university nationwide directly after high school. For most groups, these rates have been relatively
stable during the long economic
expansion, but they have risen
slightly for Hispanic/Latinx
students and declined slightly for
Black/African American and
Native Hawaiian/Pacific Islander
students. Looking only at how
many high school graduates
enroll in Oregon public
Public university Community college
Asian American 33.7% 24.3%
Black/African American 12.6% 26.7%
Hispanic/Latinx 10.8% 27.6%
Native American/Alaska Native 8.9% 27.2%
Native Hawaiian/Pacific Islander 9.4% 26.2%
White 17.7% 28.3%
Percentage of 2016-17 Oregon public high school graduates enrolled in an Oregon community college or public university, fall 2017.
Graduation rate
Asian American 91.3%
Black/African American 71.5%
Hispanic/Latinx 77.7%
Native American/Alaska Native 71.2%
Native Hawaiian/Pacific Islander 78.5%
White 84.3%
2017-18 four-year cohort high school graduation rate
82% 81%
69%
64%
51%
58%56%
50%
58%
51%
67% 65%
2010-11 2011-12 2012-13 2013-14 2014-15 2015-16 2016-17Asian American Black/African AmericanHispanic/Latinx Native American/Alaska NativeNative Hawaiian/Pacific Islander White
High school graduation year
College-going rate of Oregon high school graduates to any college or university nationwide within 16 months of graduation

Racial/Ethnic Equity in Postsecondary Education & Training
3
institutions, we see similar gaps at the public universities and much less disparity at the community colleges.3
Affording school Once in school, almost half of Oregon students at a community college or public university face unaffordable
costs of education.4 Even after accounting for federal and state grants, students’ expected family
contributions, and an assumption of students’ earnings, 42% of students face college expenses that exceed
these sources of support. Asian American and Hispanic/Latinx students are even more likely to incur
unaffordable costs, with 53% and 47% of these students, respectively, unable to meet projected expenses.
Racial/ethnic gaps in the affordabilty of postsecondary education persist over time and across sectors, though
unaffordability rates and racial/ethnic gaps are highest at public universities.
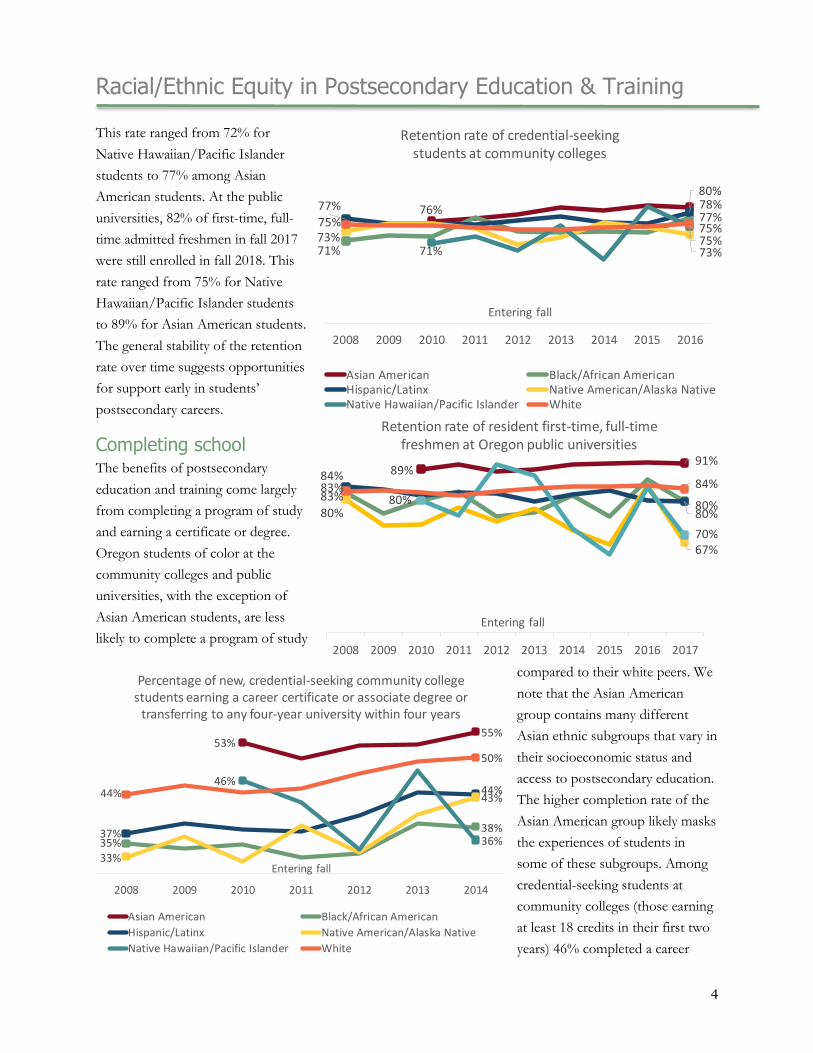
Continuing in school Enrolling in a program of study or training is only the beginning of earning a postsecondary credential. All
degrees and most career certificates require more than a year of full-time coursework. Students may not
return to complete a postsecondary degree or certificate for a variety of reasons, including financial need,
social support, academic challenge, and competing requirements or obligations outside of school. The
percentage of students returning to a second year of school, called the retention rate, is one indicator of the
obstacles students face. This percentage has remained relatively stable over time but is lower for most
students of color compared to their white counterparts at public universities. At the community colleges,
retention is more similar across racial/ethnic groups, with about three-fourths of credential-seeking students
(those completing at least 18 credits in their first two years) who began in fall 2016 still enrolled in fall 2017.
3 See Cox, A., E. Martinez, S. Tao, B. Rajaram, B. Simpkins, O. Levadnaya, V. Mayfield, A. Keir, D. Crews, “Senate Bill 81 (2015): The Oregon Promise – Report from Year Three,” 2018. Higher Education Coordinating Commission: Salem, OR. https://www.oregon.gov/highered/research/Documents/Reports/SB-81-Oregon-Promise-2018.pdf. Correction to data in report. 4 Among those who file a Free Application for Federal Student Aid or an Oregon Student Aid Application.
50%
36%
43%
39%35%
40%
54%
40%44%
37%39% 39%
53%
40%
47%
38% 40% 40%
Asian American Black/ AfricanAmerican
Hispanic/Latinx Native American/Alaska Native
Native Hawaiian/Pacific Islander
White
Light color = 2017 Medium color = 2018 Dark color = 2019
Percentage of Oregon students in community colleges and public universities who cannot meet expenses with expected resources
Racial/Ethnic Equity in Postsecondary Education & Training
4
This rate ranged from 72% for
Native Hawaiian/Pacific Islander
students to 77% among Asian
American students. At the public
universities, 82% of first-time, full-
time admitted freshmen in fall 2017
were still enrolled in fall 2018. This
rate ranged from 75% for Native
Hawaiian/Pacific Islander students
to 89% for Asian American students.
The general stability of the retention
rate over time suggests opportunities
for support early in students’
postsecondary careers.
Completing school The benefits of postsecondary
education and training come largely
from completing a program of study
and earning a certificate or degree.
Oregon students of color at the
community colleges and public
universities, with the exception of
Asian American students, are less
likely to complete a program of study
compared to their white peers. We
note that the Asian American
group contains many different
Asian ethnic subgroups that vary in
their socioeconomic status and
access to postsecondary education.
The higher completion rate of the
Asian American group likely masks
the experiences of students in
some of these subgroups. Among
credential-seeking students at
community colleges (those earning
at least 18 credits in their first two
years) 46% completed a career
53%55%
35%38%37%
44%
33%
43%
46%
36%
44%
50%
2008 2009 2010 2011 2012 2013 2014
Asian American Black/African American
Hispanic/Latinx Native American/Alaska Native
Native Hawaiian/Pacific Islander White
Entering fall
Percentage of new, credential-seeking community college students earning a career certificate or associate degree or
transferring to any four-year university within four years
89%91%
83%80%
84%
80%80%
67%
80%
70%
83% 84%
2008 2009 2010 2011 2012 2013 2014 2015 2016 2017
Entering fall
Retention rate of resident first-time, full-time freshmen at Oregon public universities
76%
80%
71%
77%77% 78%
73%73%71%75%
75% 75%
2008 2009 2010 2011 2012 2013 2014 2015 2016
Asian American Black/African AmericanHispanic/Latinx Native American/Alaska NativeNative Hawaiian/Pacific Islander White
Entering fall
Retention rate of credential-seeking students at community colleges

Racial/Ethnic Equity in Postsecondary Education & Training
5
certificate or associate degree or transferred to any four-year university (nationwide) within four years. This
completion and transfer rate is lowest among Black/African American and Native American/Alaska Native
students (at 36% and 38%,
respectively) and highest among
Asian American and white students
(at 55% and 50%, respectively). At
the public universities, 65% of first-
time, full-time admitted, Oregon
freshmen completed a bachelor’s
degree within six years. The
graduation rate is lowest among
Native Hawaiian/Pacific Islander
and Native American/Alaska Native
students (at 38% and 43%,
respectively) and highest among
Asian American and white students
(at 74% and 66%, respectively).
Another measure of completion is the time needed to complete a degree, which has financial impacts on
educational costs and on the opportunity costs of lost wages. We measure time to completion with the
median number of years taken to complete an associate degree at the community colleges and a bachelor’s
degree at the public universities.5 Because the time to completion has not changed appreciably over time, or,
in the case of small groups, changes every year, we show the average result for the last three years. Across
racial/ethnic groups, the time to
completion ranges by almost a full
year. At the community colleges,
Hispanic/Latinx, Native Hawaiian/
Pacific Islander, and white students
tend to have shorter times to
completion than other students. In
contrast, at the public universities,
Hispanic/Latinx students, along
with Black/African American
students, tend to have longer times
than their peers.
5 For university students, shows median time between undergraduate admission and degree completion for first-time freshmen, excluding students who complete after 9 years. For community college students, shows median time between first enrollment at any Oregon community college after high school and receipt of associate degree for 2017-18 first-time graduates (excluding high school students).
3.5
4.2
3.7
4.7
3.3
4.7
3.8
4.4
2.9
4.4
3.3
4.1
Associate
Bachelor's
Median time to degree in years
Asian American Black/African AmericanHispanic/Latinx Native American/Alaska NativeNative Hawaiian/Pacific Islander White

Racial/Ethnic Equity in Postsecondary Education & Training
6
Earnings Graduates face racial/ethnic
disparities in the paid labor force
as well. For those employed in
Oregon five years after graduation,
median annual earnings were
$38,238 for associate degree
graduates and $45,785 for
bachelor’s degree graduates in
2018. Earnings were lower,
however, for Black/African
American, Hispanic/Latinx, Native
American/Alaska Native, and
Native Hawaiian/Pacific Islander
graduates in both groups. Among
both associate and bachelor’s
degree graduates, the lowest
earnings were among Native
Hawaiian/Pacific Islander
graduates, and they were about
$5,000 lower than the earnings of
white graduates.
Overall educational attainment The compounding effects of barriers to access, affordability, continuation, and completion also contribute to
racial/ethnic gaps in the educational attainment of all adults in Oregon. The percentage of Oregon adults
20%
40%
40%
40-40-20 GOAL
Bachelor’s or
advanced degree
Associate degree or
certificate (est.)
Some college, no
credential
High school diploma or
equivalent
Less than high
school13% 12%
35%
16% 13%6%
12% 20%
20%
24% 24%
19%
10%
22%
14%
25%22%
20%14%
21%
15% 21%24%
19%
52%
26%15% 14% 16%
35%
AsianAmerican
Black/AfricanAmerican
Hispanic/Latinx
NativeAmerican/
AlaskaNative
NativeHawaiian/
PacificIslander
White
Educational attainment of all Oregonians age 25 and older
$40,517
$45,785 $44,003
$51,145
$39,109
$42,482 $40,543
$44,848
$36,544
$42,432
$40,405 $41,137
$40,620
$45,805
2016 2017 2018 2019
Median earnings of public university graduates five years after earning a bachelor’s degree
$39,172
$41,239
$32,488 $33,975
$34,911 $35,890
$31,231
$36,340
$32,630 $33,345
$35,256
$38,671
2017 2018 2019
Asian American Black/African AmericanHispanic/Latinx Native American/Alaska NativeNative Hawaiian/Pacific Islander White
Median earnings of community college completers five years after earning a degree or certificate
Racial/Ethnic Equity in Postsecondary Education & Training
7
with a postsecondary degree or certificate varies from about two-thirds of Asian Americans to about one-
third of Hispanic/Latinx, and Native American/Alaska Native adults. This includes those who completed
postsecondary credentials in other states and those who did not complete postsecondary credentials.
Stakeholders in postsecondary education and training must prioritize work that addresses the racial/ethnic
equity gaps described in this brief to meet Oregon’s ambitious 40-40-20 goal for all groups.
Main takeaways This research brief presents multiple measures of postsecondary education and training by race/ethnicity. We
examine early access to college credits, subsequent college enrollment, affordability, retention, graduation, time
to completion, post-graduate earnings, and overall adult attainment, and we find different results for students
in different racial/ethnic groups. Though we lack data on students’ underlying experiences that would clarify
reasons for these differences, the data shown here do point to areas for action and continued investigation.
Asian American students are most likely to earn college credit during high school and to continue their
education into postsecondary. Once in college or university, however, they are the most likely to face costs
that are unaffordable. Asian American students also realize high rates of retention and completion. While this
group comprises many subgroups who range in the barriers they face, the results here suggest that
affordability is an important avenue for supporting Asian American students.
Black/African American students have less access to accelerated learning in high school but have higher rates
of college enrollment than many other groups. Once in college, they face unaffordable costs at typical rates.
Those at the public universities have slightly below average retention and at both the community colleges and
the universities, they experience lower than average completion rates. These results suggest that expanding
access to accelerated learning and providing the transformative experiences necessary to complete a certificate
or degree are some of the primary pathways to supporting Black/African American students.
Hispanic/Latinx students earn fewer college credits during high school and face more barriers to continuing
their education into college or university, compared to many other racial/ethnic groups, and they are more
likely than most groups to face unaffordable costs. Those who do enroll in postsecondary have relatively
strong retention but are less likely to complete their program of study than many other groups. Key routes to
supporting Hispanic/Latinx students appear to be in strengthening the transition to college, increasing the
financial resources available, and providing the experiences needed to complete a certificate or degree.
Native American/Alaska Native students have among the lowest rates of accelerated learning and of
continuing into postsecondary. While they are no more likely than students overall to face unaffordable costs,
those enrolled at a public university face significant obstacles to staying in school. Native American/Alaska
Native students experience the lowest graduation rates as well. Opportunities for support include expanding
accelerated learning access, facilitating the transition to postsecondary, and providing college and university
students the cultural resources and other substantive experiences needed to complete their credentials.
Native Hawaiian/Pacific Islander students have about as much access as white students to accelerated
learning, but their college-going rates are lower. In college or university, they are about as likely to face
Racial/Ethnic Equity in Postsecondary Education & Training
8
unaffordable costs as other groups, but they experience lower than average retention and completion rates.
Support for Native Hawaiian/Pacific Islander students may involve strengthening the transition from high
school to postsecondary and expanding their experiences in college and university to enable completion.
White students have relatively high rates of accelerated learning and of continuing their education past high
school. They face typical rates of unaffordability and experience strong rates of retention and consistently
high rates of completion. They do not appear as underserved as most students of color, though we note that
this group, like Asian Americans, includes many ethnic subgroups, some of whom face significant barriers.
Finally, we note that students’ experiences and the unique barriers that students of color face are not discrete,
as the separate measures and charts in this research brief may imply. Rather, such experiences interact and
multiply. Students entering postsecondary with years of academic preparation, cultural engagement, and
societal support from previous schooling enter and sustain through postsecondary very differently than those
who enter college or university with a history of underperforming schools, a disengaged curriculum, and
structural inequities. These differences all too often persist through college and university, magnifying as they
do so. But they do not have to. Structural investments in culturally responsive systems of support, financial
aid, and community engagement, combined with continued coordination across the K-12, community college,
and public university sectors, can shift student trajectories to the more equitable outcomes we seek.
What are we doing with this information?
A number of ongoing programs and initiatives address the racial/ethnic gaps in Oregon postsecondary education and
training and aim for racial/ethnic equity for all Oregonians. Some of these include:
HECC Equity Advisory Council – agency, college, and university staff are identifying areas and best practices
for improving racial/ethnic equity on campus
Implementing cultural competency at all community colleges and public universities – institutions are
working with student, agency, and other leaders to implement House Bill 2864 (2017), which requires all
campuses to institute diversity, equity, and inclusion standards for an inclusive campus culture
Talent, Innovation, and Equity project – agency, community, and institution leaders are collaborating on
innovative ways to increase attainment among Black/African American, Hispanic/Latinx, Native
American/Alaska Native, and Native Hawaiian/Pacific Islander learners
Adult Learner Advisory Council – state, education, and business leaders are identifying priority areas and
actions to increase educational attainment among adult learners, with a focus on underrepresented
racial/ethnic groups
Transfer Pathways (from HB 2998) – agency and institution staff are smoothing the pathway from community
college to public university, with implications for students of color who are more likely to transfer
Public university evaluations and funding distribution – agency staff evaluate each public university and
distribute a part of legislatively-allocated funding to them to prioritize the success of students from
underrepresented racial/ethnic groups
How can we improve this research brief? Contact the HECC Office of Research and Data at [email protected].