Embed Size (px)
Citation preview

2016 Kansas Crime Index
Prepared by:
Kansas Incident Based Repor�ng Unit
1620 SW Tyler
Topeka, Kansas 66612
2
Summary of Findings For Calendar Year 2016
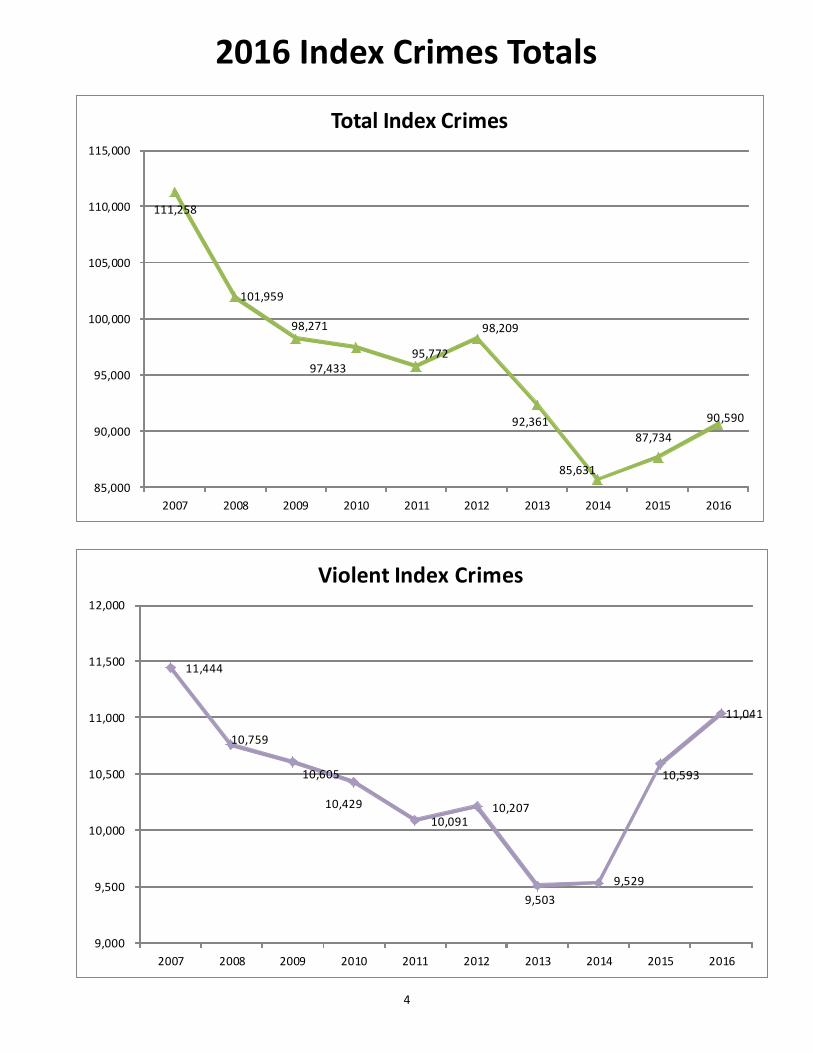
Total Index Crimes: Total index crimes are 5.6% below the 10-yr average. The total crime index for Kansas is
30.6 offenses per 1,000 people. Total index crimes have been declining despite a very minor 3.3% increase in
2016. Note the heavy dependence that property index crime plays on the total index crime.
Violent Index Crime: Violent index crimes are 5.9% above the 10-yr average. The violent crime index for
Kansas is 3.7 offenses per 1,000 people. There was a 4.2% increase in 2016 over 2015. Between 2009 and 2014
these totals have been below the average. MIP agencies saw a significant increase as Non-MIP agencies have
seen li6le movement the past three years. Note the heavy dependence that aggravated assault/ba6ery plays
on the violent index crime totals.
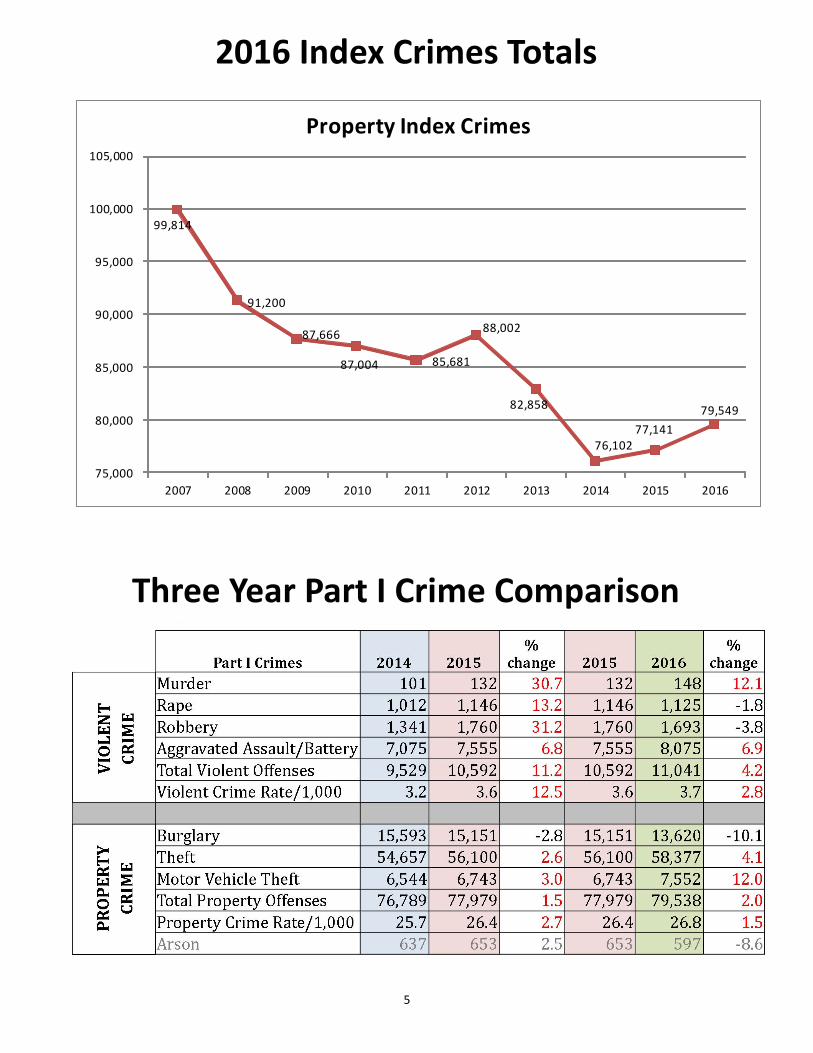
Property Index Crimes: Property index crimes are 7.0% below the 10-yr average. Property index crimes have
declined considerably since 2007, yet a minor 3.1% increase was seen in 2016. This is s�ll the third lowest total
in the past 10 years. This increase can be seen from MIP agencies as Non-MIP agencies have remained stable.
Note the heavy dependence that the9/larceny plays on the property index crime totals.
Most In Popula!on (MIP) vs Non-Most in Popula!on (Non-MIP): MIP agencies are those with a popula�on
over 100,000. In Kansas there are five MIPs (Olathe, Overland Park, Wichita, Topeka, and Kansas City). MIP
agencies make up 36.9% of the popula�on but account for 57.9% of the violent index crimes, 51.0% of the
property index crimes, and 51.9% of the total index crimes.
Non-MIP agencies saw a decline in violent and property crimes in 2016 while MIP agencies saw an increase in
both.
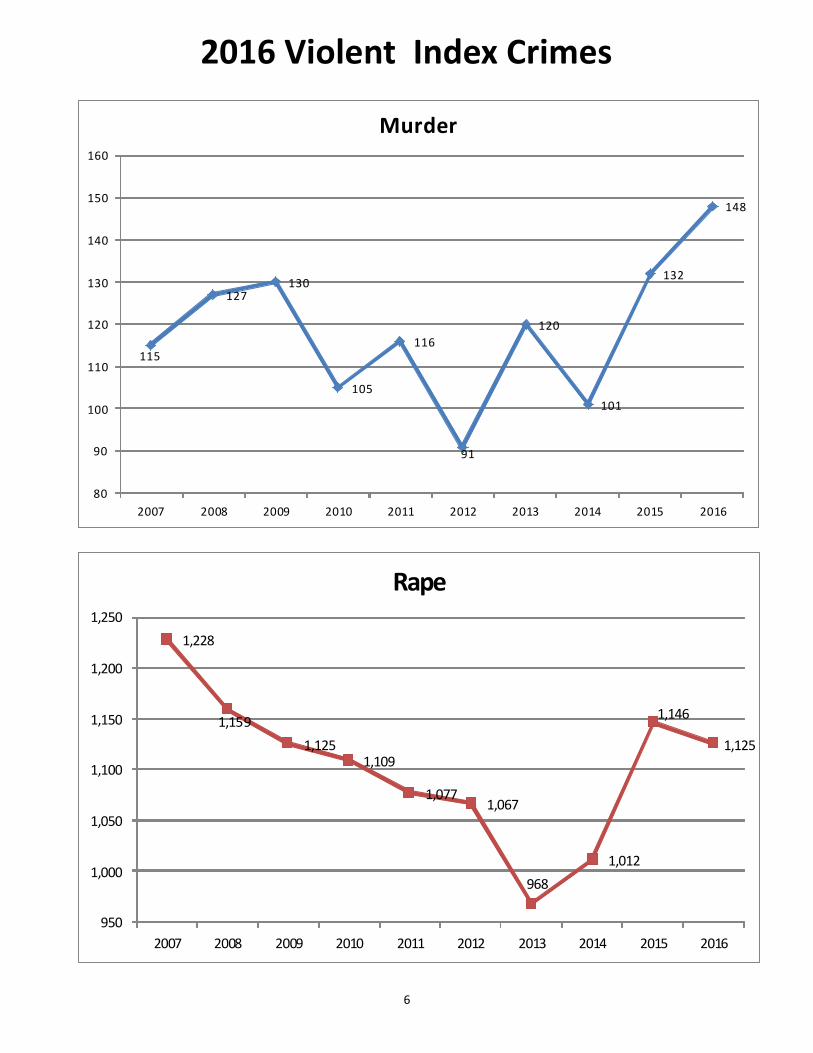
Murder: Murders are 24.4% above the 10-yr average. While 2016 saw the largest number of murders in the
ten year period, 14.3% of those involved mul�ple murders in single incidents. This is a higher percentage than
previous years. In 2015, 9.9% of the �me there were mul�ple vic�ms per incident, and in 2014, mul�ple
murders occurred only 8.9% of the �me.
Finding a common circumstance is difficult as 38.1% of the reports indicated “unknown circumstance.” Also,
22.4% of the murders listed an unknown suspect. MIP agencies saw a significant increase in total murders as
Non-MIP agencies saw a slight decline.
Domes�c violence murders have averaged between 25-30% in recent years. In 2016 DV homicides fell to
12.9% of the total.
Rape: Rapes are 2.1% above the 10-yr average. Reported rapes began a steady decline in 2008. In 2014 there
was a slight up�ck followed by an even larger increase in 2015. While 2016 saw a modest decline, the
numbers are s�ll higher than the average.
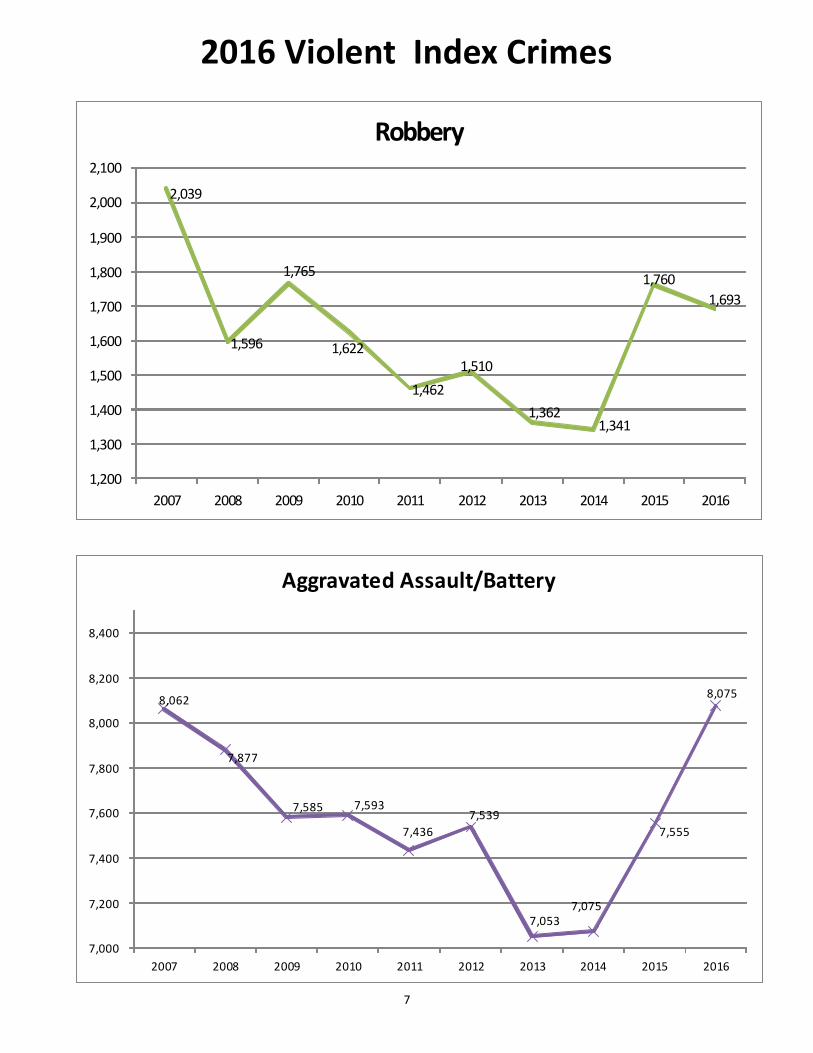
Robbery: Robberies are 4.8% above the 10-yr average. Historically, robbery offenses have been unpredictable.
2015 saw a 31.3% rise but was s�ll only 1% above the average. Meanwhile, 2016 saw a 3.8% drop from 2015.
Robberies have been right at or below the average since 2008.
3
Summary of Findings For Calendar Year 2016
Aggravated Assault/Ba,ery: Aggravated assaults and ba6eries are 6.5% above the 10-yr average. Historically
aggravated assault/ba6ery offenses have only modest changes from year to year. The years 2015 and 2016
each saw a 6.8% increase. This was primarily due to an increase from the MIP ci�es. Non-MIP ci�es have seen
a decline in this category.
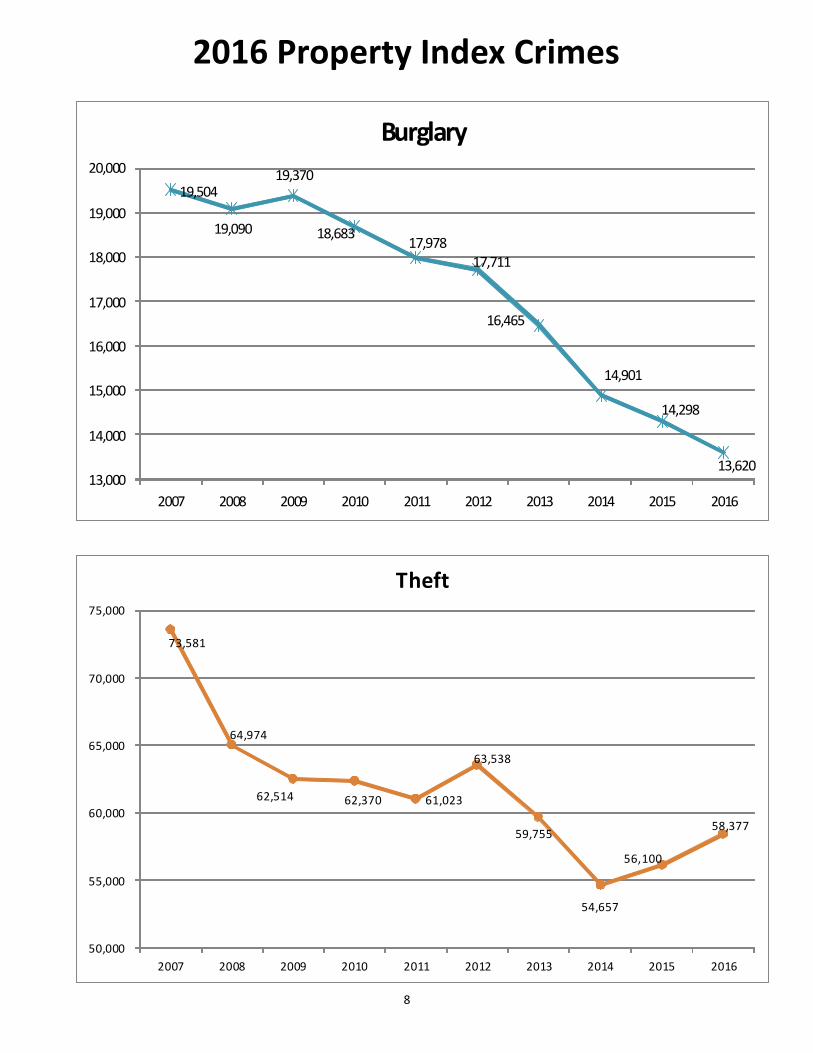
Burglary: Burglaries are 20.6% below the 10-yr average. Burglary has been on a steady decline since 2011.
Criminologists have explained this decline on several fronts. Primarily the decline in resale value of typical
stolen merchandise, such as electronics, does not make it profitable.
Larceny/The0: Larceny/the9s are 5.4% below the 10-yr average. The9 offenses have generally been declining
since 2008 with occasional moderate increases. In 2016, there appears to be similar increases however it is s�ll
the third lowest total behind 2014 and 2015.
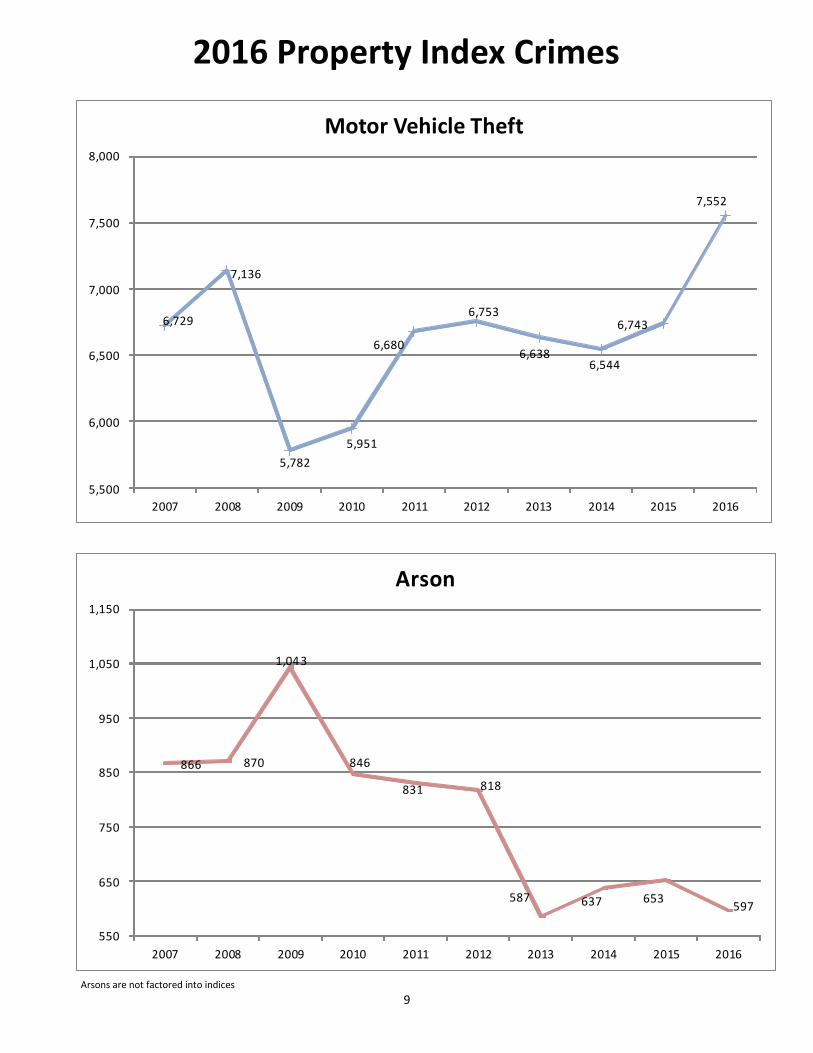
Motor Vehicle The0: Motor vehicle the9s are 13.6% above the 10-yr average. 2016 was the first year since
2006 where motor vehicle the9 has been above the 10-yr average. Criminologists believe motor vehicle the9
is replacing burglary as the main crime of opportunity due to a higher monetary return and lower probability
of geFng caught or injured.
Arson: Arsons are 23.0% below the 10-yr average. The number of arsons reported for each jurisdic�on is
included in this report. However, arson figures are not calculated into violent or property indices and are
meant to stand on their own.
New Statutes: There were no new statutes that had any known effect on the number of reported index
crimes.
4
111,258
101,959
98,271
97,433
95,772
98,209
92,361
85,631
87,734
90,590
85,000
90,000
95,000
100,000
105,000
110,000
115,000
2007 2008 2009 2010 2011 2012 2013 2014 2015 2016
Total Index Crimes
2016 Index Crimes Totals
11,444
10,759
10,605
10,429
10,091 10,207
9,503
9,529
10,593
11,041
9,000
9,500
10,000
10,500
11,000
11,500
12,000
2007 2008 2009 2010 2011 2012 2013 2014 2015 2016
Violent Index Crimes
5
2016 Index Crimes Totals
99,814
91,200
87,666
87,004 85,681
88,002
82,858
76,102
77,141
79,549
75,000
80,000
85,000
90,000
95,000
100,000
105,000
2007 2008 2009 2010 2011 2012 2013 2014 2015 2016
Property Index Crimes
Three Year Part I Crime Comparison
6
115
127130
105
116
91
120
101
132
148
80
90
100
110
120
130
140
150
160
2007 2008 2009 2010 2011 2012 2013 2014 2015 2016
Murder
1,228
1,159
1,125 1,109
1,077 1,067
968
1,012
1,146
1,125
950
1,000
1,050
1,100
1,150
1,200
1,250
2007 2008 2009 2010 2011 2012 2013 2014 2015 2016
Rape
2016 Violent Index Crimes
7
2,039
1,596
1,765
1,622
1,462
1,510
1,362 1,341
1,760
1,693
1,200
1,300
1,400
1,500
1,600
1,700
1,800
1,900
2,000
2,100
2007 2008 2009 2010 2011 2012 2013 2014 2015 2016
Robbery
8,062
7,877
7,585 7,593
7,436
7,539
7,053
7,075
7,555
8,075
7,000
7,200
7,400
7,600
7,800
8,000
8,200
8,400
2007 2008 2009 2010 2011 2012 2013 2014 2015 2016
Aggravated Assault/Battery
2016 Violent Index Crimes
8
19,504
19,090
19,370
18,683 17,978
17,711
16,465
14,901
14,298
13,620 13,000
14,000
15,000
16,000
17,000
18,000
19,000
20,000
2007 2008 2009 2010 2011 2012 2013 2014 2015 2016
Burglary
73,581
64,974
62,514 62,370 61,023
63,538
59,755
54,657
56,100
58,377
50,000
55,000
60,000
65,000
70,000
75,000
2007 2008 2009 2010 2011 2012 2013 2014 2015 2016
Theft
2016 Property Index Crimes
9
6,729
7,136
5,782
5,951
6,680
6,753
6,638 6,544
6,743
7,552
5,500
6,000
6,500
7,000
7,500
8,000
2007 2008 2009 2010 2011 2012 2013 2014 2015 2016
Motor Vehicle Theft
866 870
1,043
846
831 818
587 637 653597
550
650
750
850
950
1,050
1,150
2007 2008 2009 2010 2011 2012 2013 2014 2015 2016
Arson
Arsons are not factored into indices
2016 Property Index Crimes
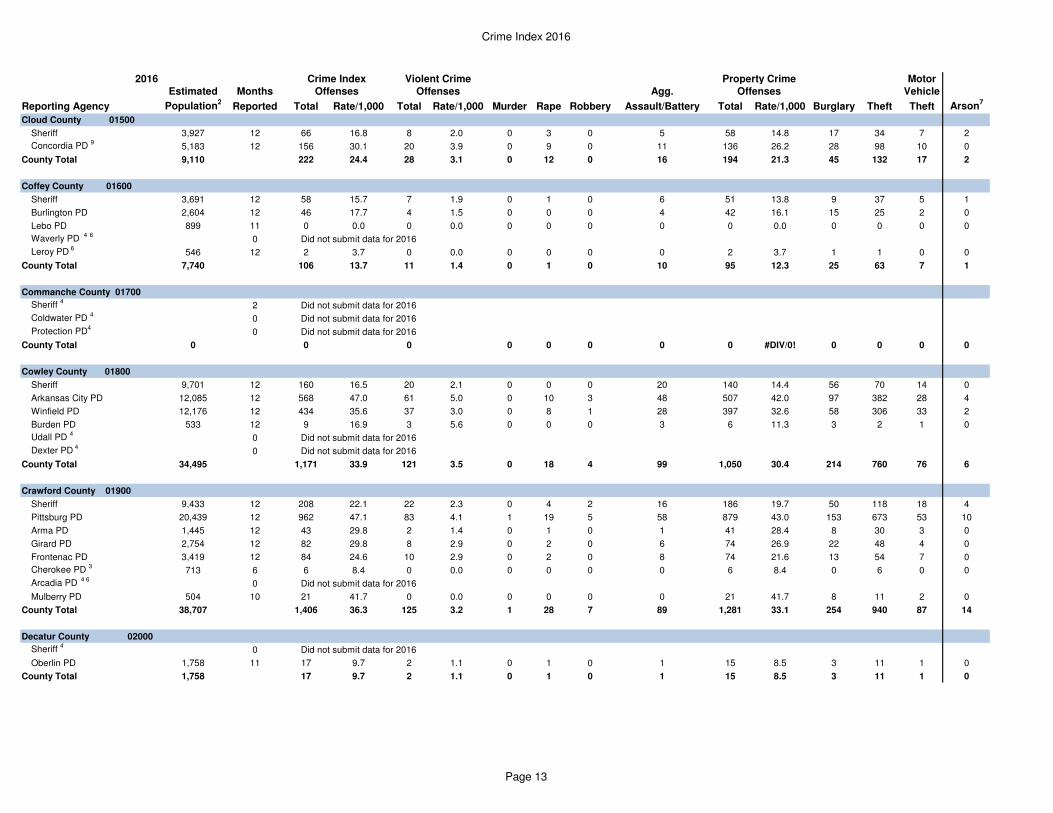
Crime Index 2016
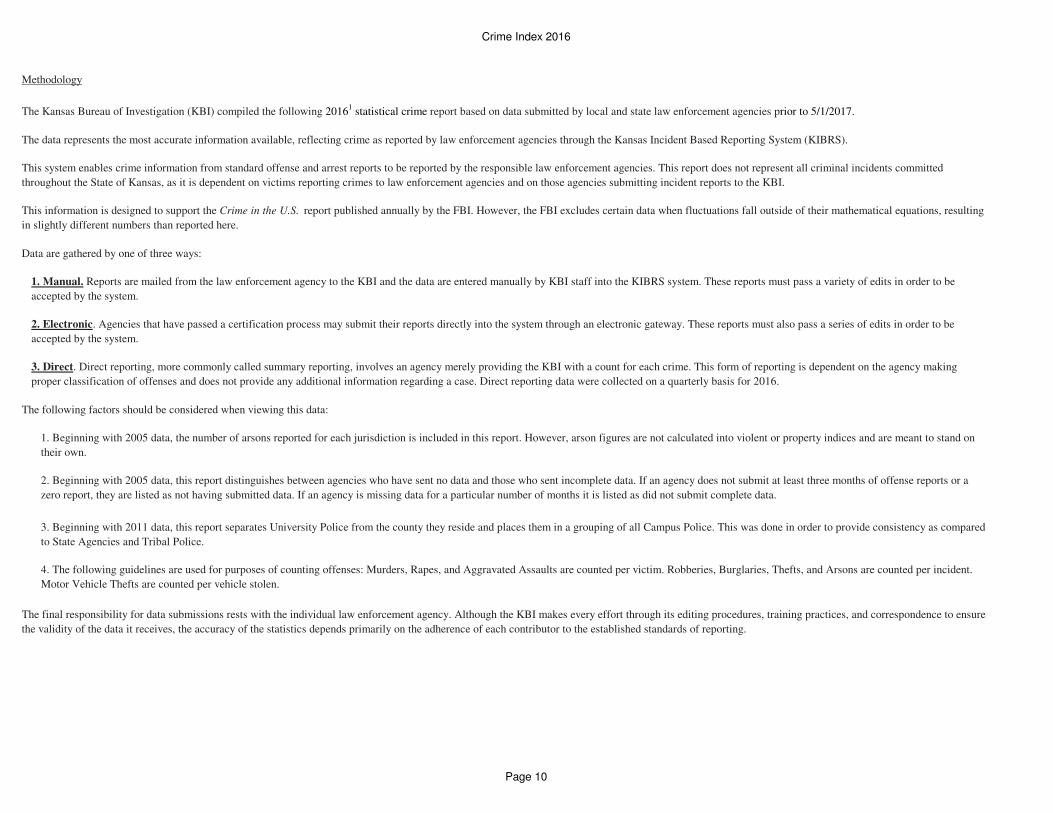
Methodology
The Kansas Bureau of Investigation (KBI) compiled the following 20161 statistical crime report based on data submitted by local and state law enforcement agencies prior to 5/1/2017.
The data represents the most accurate information available, reflecting crime as reported by law enforcement agencies through the Kansas Incident Based Reporting System (KIBRS).
Data are gathered by one of three ways:
The following factors should be considered when viewing this data:
2. Beginning with 2005 data, this report distinguishes between agencies who have sent no data and those who sent incomplete data. If an agency does not submit at least three months of offense reports or a
zero report, they are listed as not having submitted data. If an agency is missing data for a particular number of months it is listed as did not submit complete data.
3. Beginning with 2011 data, this report separates University Police from the county they reside and places them in a grouping of all Campus Police. This was done in order to provide consistency as compared
to State Agencies and Tribal Police.
4. The following guidelines are used for purposes of counting offenses: Murders, Rapes, and Aggravated Assaults are counted per victim. Robberies, Burglaries, Thefts, and Arsons are counted per incident.
Motor Vehicle Thefts are counted per vehicle stolen.
The final responsibility for data submissions rests with the individual law enforcement agency. Although the KBI makes every effort through its editing procedures, training practices, and correspondence to ensure
the validity of the data it receives, the accuracy of the statistics depends primarily on the adherence of each contributor to the established standards of reporting.
1. Beginning with 2005 data, the number of arsons reported for each jurisdiction is included in this report. However, arson figures are not calculated into violent or property indices and are meant to stand on
their own.
This system enables crime information from standard offense and arrest reports to be reported by the responsible law enforcement agencies. This report does not represent all criminal incidents committed
throughout the State of Kansas, as it is dependent on victims reporting crimes to law enforcement agencies and on those agencies submitting incident reports to the KBI.
This information is designed to support the Crime in the U.S. report published annually by the FBI. However, the FBI excludes certain data when fluctuations fall outside of their mathematical equations, resulting
in slightly different numbers than reported here.
1. Manual. Reports are mailed from the law enforcement agency to the KBI and the data are entered manually by KBI staff into the KIBRS system. These reports must pass a variety of edits in order to be
accepted by the system.
2. Electronic. Agencies that have passed a certification process may submit their reports directly into the system through an electronic gateway. These reports must also pass a series of edits in order to be
accepted by the system.
3. Direct. Direct reporting, more commonly called summary reporting, involves an agency merely providing the KBI with a count for each crime. This form of reporting is dependent on the agency making
proper classification of offenses and does not provide any additional information regarding a case. Direct reporting data were collected on a quarterly basis for 2016.
Page 10
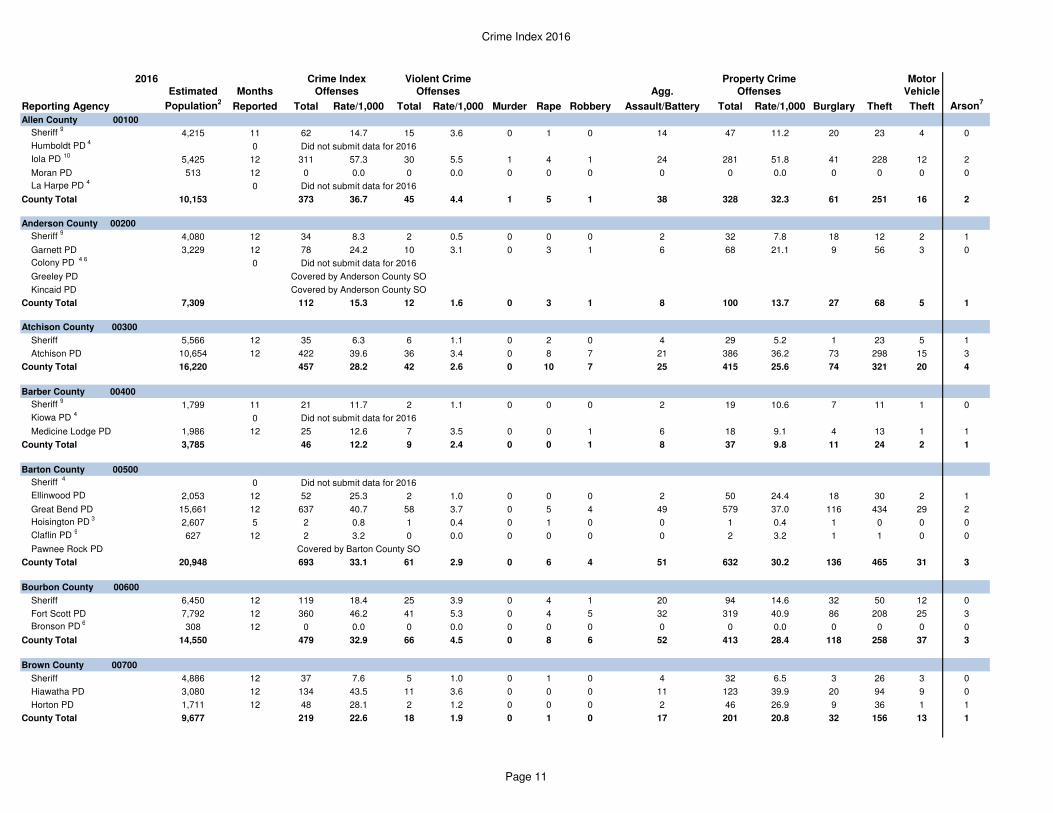
Crime Index 2016
2016 Motor
Estimated Months Agg. Vehicle
Reporting Agency Population2
Reported Total Rate/1,000 Total Rate/1,000 Murder Rape Robbery Assault/Battery Total Rate/1,000 Burglary Theft Theft Arson7
Allen County 00100
Sheriff 9
4,215 11 62 14.7 15 3.6 0 1 0 14 47 11.2 20 23 4 0
Humboldt PD 4
0 Did not submit data for 2016
Iola PD 10
5,425 12 311 57.3 30 5.5 1 4 1 24 281 51.8 41 228 12 2
Moran PD 513 12 0 0.0 0 0.0 0 0 0 0 0 0.0 0 0 0 0
La Harpe PD 4
0 Did not submit data for 2016
County Total 10,153 373 36.7 45 4.4 1 5 1 38 328 32.3 61 251 16 2
Anderson County 00200
Sheriff 9
4,080 12 34 8.3 2 0.5 0 0 0 2 32 7.8 18 12 2 1
Garnett PD 3,229 12 78 24.2 10 3.1 0 3 1 6 68 21.1 9 56 3 0
Colony PD 4 6
0 Did not submit data for 2016
Greeley PD Covered by Anderson County SO
Kincaid PD Covered by Anderson County SO
County Total 7,309 112 15.3 12 1.6 0 3 1 8 100 13.7 27 68 5 1
Atchison County 00300
Sheriff 5,566 12 35 6.3 6 1.1 0 2 0 4 29 5.2 1 23 5 1
Atchison PD 10,654 12 422 39.6 36 3.4 0 8 7 21 386 36.2 73 298 15 3
County Total 16,220 457 28.2 42 2.6 0 10 7 25 415 25.6 74 321 20 4
Barber County 00400
Sheriff 9
1,799 11 21 11.7 2 1.1 0 0 0 2 19 10.6 7 11 1 0
Kiowa PD 4
0 Did not submit data for 2016
Medicine Lodge PD 1,986 12 25 12.6 7 3.5 0 0 1 6 18 9.1 4 13 1 1
County Total 3,785 46 12.2 9 2.4 0 0 1 8 37 9.8 11 24 2 1
Barton County 00500
Sheriff 4
0 Did not submit data for 2016
Ellinwood PD 2,053 12 52 25.3 2 1.0 0 0 0 2 50 24.4 18 30 2 1
Great Bend PD 15,661 12 637 40.7 58 3.7 0 5 4 49 579 37.0 116 434 29 2
Hoisington PD 3
2,607 5 2 0.8 1 0.4 0 1 0 0 1 0.4 1 0 0 0
Claflin PD 9
627 12 2 3.2 0 0.0 0 0 0 0 2 3.2 1 1 0 0
Pawnee Rock PD Covered by Barton County SO
County Total 20,948 693 33.1 61 2.9 0 6 4 51 632 30.2 136 465 31 3
Bourbon County 00600
Sheriff 6,450 12 119 18.4 25 3.9 0 4 1 20 94 14.6 32 50 12 0
Fort Scott PD 7,792 12 360 46.2 41 5.3 0 4 5 32 319 40.9 86 208 25 3
Bronson PD 6
308 12 0 0.0 0 0.0 0 0 0 0 0 0.0 0 0 0 0
County Total 14,550 479 32.9 66 4.5 0 8 6 52 413 28.4 118 258 37 3
Brown County 00700
Sheriff 4,886 12 37 7.6 5 1.0 0 1 0 4 32 6.5 3 26 3 0
Hiawatha PD 3,080 12 134 43.5 11 3.6 0 0 0 11 123 39.9 20 94 9 0
Horton PD 1,711 12 48 28.1 2 1.2 0 0 0 2 46 26.9 9 36 1 1
County Total 9,677 219 22.6 18 1.9 0 1 0 17 201 20.8 32 156 13 1
Offenses Offenses Offenses
Crime Index Violent Crime Property Crime
Page 11
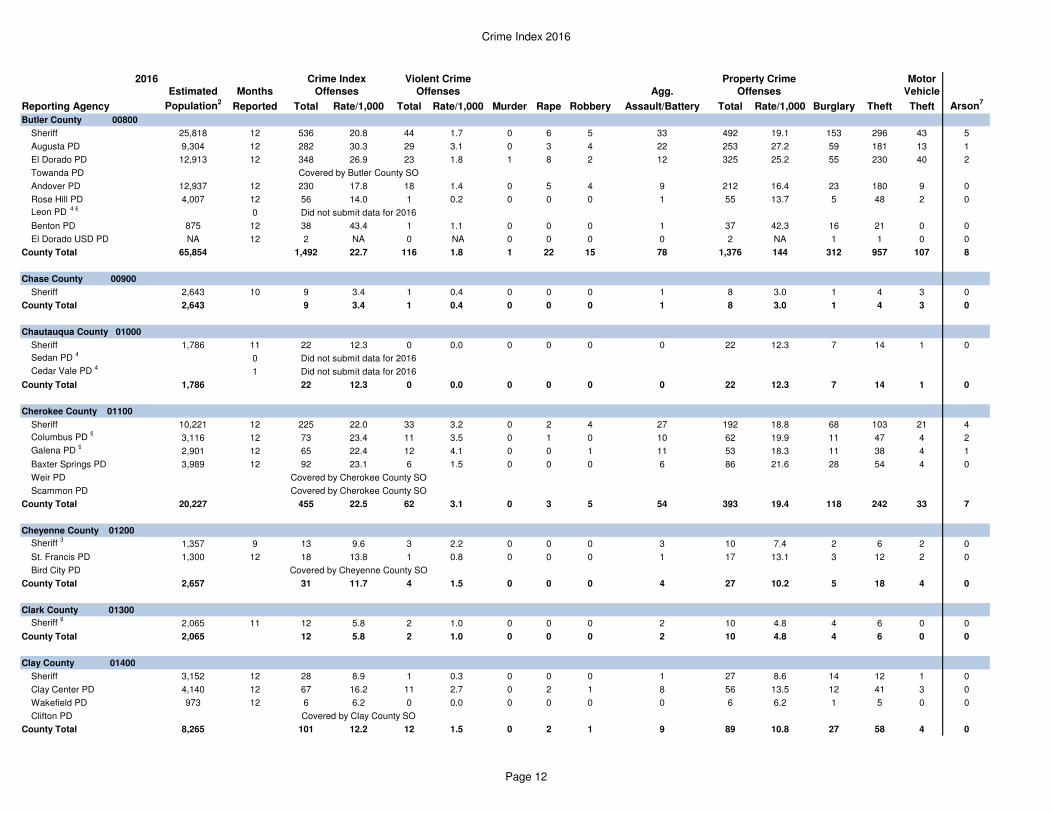
Crime Index 2016
2016 Motor
Estimated Months Agg. Vehicle
Reporting Agency Population2
Reported Total Rate/1,000 Total Rate/1,000 Murder Rape Robbery Assault/Battery Total Rate/1,000 Burglary Theft Theft Arson7
Offenses Offenses Offenses
Crime Index Violent Crime Property Crime
Butler County 00800
Sheriff 25,818 12 536 20.8 44 1.7 0 6 5 33 492 19.1 153 296 43 5
Augusta PD 9,304 12 282 30.3 29 3.1 0 3 4 22 253 27.2 59 181 13 1
El Dorado PD 12,913 12 348 26.9 23 1.8 1 8 2 12 325 25.2 55 230 40 2
Towanda PD Covered by Butler County SO
Andover PD 12,937 12 230 17.8 18 1.4 0 5 4 9 212 16.4 23 180 9 0
Rose Hill PD 4,007 12 56 14.0 1 0.2 0 0 0 1 55 13.7 5 48 2 0
Leon PD 4 6
0 Did not submit data for 2016
Benton PD 875 12 38 43.4 1 1.1 0 0 0 1 37 42.3 16 21 0 0
El Dorado USD PD NA 12 2 NA 0 NA 0 0 0 0 2 NA 1 1 0 0
County Total 65,854 1,492 22.7 116 1.8 1 22 15 78 1,376 144 312 957 107 8
Chase County 00900
Sheriff 2,643 10 9 3.4 1 0.4 0 0 0 1 8 3.0 1 4 3 0
County Total 2,643 9 3.4 1 0.4 0 0 0 1 8 3.0 1 4 3 0
Chautauqua County 01000
Sheriff 1,786 11 22 12.3 0 0.0 0 0 0 0 22 12.3 7 14 1 0
Sedan PD 4
0 Did not submit data for 2016
Cedar Vale PD 4
1 Did not submit data for 2016
County Total 1,786 22 12.3 0 0.0 0 0 0 0 22 12.3 7 14 1 0
Cherokee County 01100
Sheriff 10,221 12 225 22.0 33 3.2 0 2 4 27 192 18.8 68 103 21 4
Columbus PD 9
3,116 12 73 23.4 11 3.5 0 1 0 10 62 19.9 11 47 4 2
Galena PD 9
2,901 12 65 22.4 12 4.1 0 0 1 11 53 18.3 11 38 4 1
Baxter Springs PD 3,989 12 92 23.1 6 1.5 0 0 0 6 86 21.6 28 54 4 0
Weir PD Covered by Cherokee County SO
Scammon PD Covered by Cherokee County SO
County Total 20,227 455 22.5 62 3.1 0 3 5 54 393 19.4 118 242 33 7
Cheyenne County 01200
Sheriff 3
1,357 9 13 9.6 3 2.2 0 0 0 3 10 7.4 2 6 2 0
St. Francis PD 1,300 12 18 13.8 1 0.8 0 0 0 1 17 13.1 3 12 2 0
Bird City PD Covered by Cheyenne County SO
County Total 2,657 31 11.7 4 1.5 0 0 0 4 27 10.2 5 18 4 0
Clark County 01300
Sheriff 9
2,065 11 12 5.8 2 1.0 0 0 0 2 10 4.8 4 6 0 0
County Total 2,065 12 5.8 2 1.0 0 0 0 2 10 4.8 4 6 0 0
Clay County 01400
Sheriff 3,152 12 28 8.9 1 0.3 0 0 0 1 27 8.6 14 12 1 0
Clay Center PD 4,140 12 67 16.2 11 2.7 0 2 1 8 56 13.5 12 41 3 0
Wakefield PD 973 12 6 6.2 0 0.0 0 0 0 0 6 6.2 1 5 0 0
Clifton PD Covered by Clay County SO
County Total 8,265 101 12.2 12 1.5 0 2 1 9 89 10.8 27 58 4 0
Page 12
Crime Index 2016
2016 Motor
Estimated Months Agg. Vehicle
Reporting Agency Population2
Reported Total Rate/1,000 Total Rate/1,000 Murder Rape Robbery Assault/Battery Total Rate/1,000 Burglary Theft Theft Arson7
Offenses Offenses Offenses
Crime Index Violent Crime Property Crime
Cloud County 01500
Sheriff 3,927 12 66 16.8 8 2.0 0 3 0 5 58 14.8 17 34 7 2
Concordia PD 9
5,183 12 156 30.1 20 3.9 0 9 0 11 136 26.2 28 98 10 0
County Total 9,110 222 24.4 28 3.1 0 12 0 16 194 21.3 45 132 17 2
Coffey County 01600
Sheriff 3,691 12 58 15.7 7 1.9 0 1 0 6 51 13.8 9 37 5 1
Burlington PD 2,604 12 46 17.7 4 1.5 0 0 0 4 42 16.1 15 25 2 0
Lebo PD 899 11 0 0.0 0 0.0 0 0 0 0 0 0.0 0 0 0 0
Waverly PD 4
6
0 Did not submit data for 2016
Leroy PD 6
546 12 2 3.7 0 0.0 0 0 0 0 2 3.7 1 1 0 0
County Total 7,740 106 13.7 11 1.4 0 1 0 10 95 12.3 25 63 7 1
Commanche County 01700
Sheriff 4
2 Did not submit data for 2016
Coldwater PD 4
0 Did not submit data for 2016
Protection PD4
0 Did not submit data for 2016
County Total 0 0 0 0 0 0 0 0 #DIV/0! 0 0 0 0
Cowley County 01800
Sheriff 9,701 12 160 16.5 20 2.1 0 0 0 20 140 14.4 56 70 14 0
Arkansas City PD 12,085 12 568 47.0 61 5.0 0 10 3 48 507 42.0 97 382 28 4
Winfield PD 12,176 12 434 35.6 37 3.0 0 8 1 28 397 32.6 58 306 33 2
Burden PD 533 12 9 16.9 3 5.6 0 0 0 3 6 11.3 3 2 1 0
Udall PD 4
0 Did not submit data for 2016
Dexter PD 4
0 Did not submit data for 2016
County Total 34,495 1,171 33.9 121 3.5 0 18 4 99 1,050 30.4 214 760 76 6
Crawford County 01900
Sheriff 9,433 12 208 22.1 22 2.3 0 4 2 16 186 19.7 50 118 18 4
Pittsburg PD 20,439 12 962 47.1 83 4.1 1 19 5 58 879 43.0 153 673 53 10
Arma PD 1,445 12 43 29.8 2 1.4 0 1 0 1 41 28.4 8 30 3 0
Girard PD 2,754 12 82 29.8 8 2.9 0 2 0 6 74 26.9 22 48 4 0
Frontenac PD 3,419 12 84 24.6 10 2.9 0 2 0 8 74 21.6 13 54 7 0
Cherokee PD 3
713 6 6 8.4 0 0.0 0 0 0 0 6 8.4 0 6 0 0
Arcadia PD 4 6
0 Did not submit data for 2016
Mulberry PD 504 10 21 41.7 0 0.0 0 0 0 0 21 41.7 8 11 2 0
County Total 38,707 1,406 36.3 125 3.2 1 28 7 89 1,281 33.1 254 940 87 14
Decatur County 02000
Sheriff 4
0 Did not submit data for 2016
Oberlin PD 1,758 11 17 9.7 2 1.1 0 1 0 1 15 8.5 3 11 1 0
County Total 1,758 17 9.7 2 1.1 0 1 0 1 15 8.5 3 11 1 0
Page 13
Crime Index 2016
2016 Motor
Estimated Months Agg. Vehicle
Reporting Agency Population2
Reported Total Rate/1,000 Total Rate/1,000 Murder Rape Robbery Assault/Battery Total Rate/1,000 Burglary Theft Theft Arson7
Offenses Offenses Offenses
Crime Index Violent Crime Property Crime
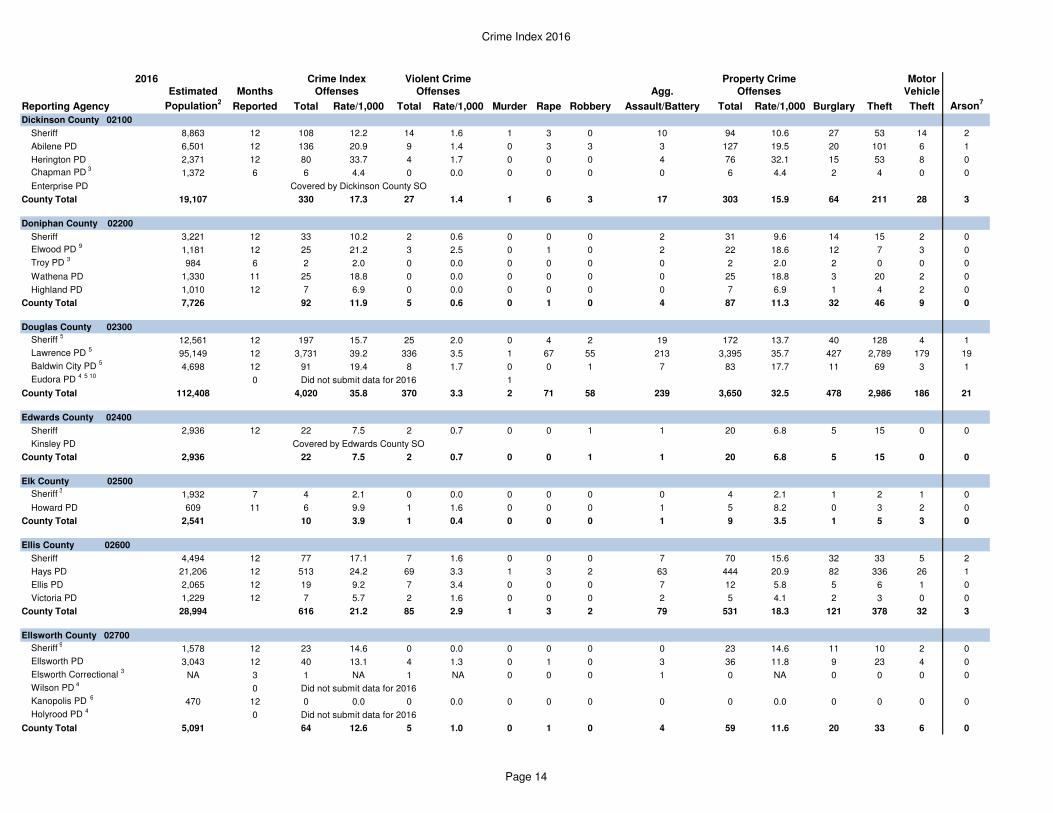
Dickinson County 02100
Sheriff 8,863 12 108 12.2 14 1.6 1 3 0 10 94 10.6 27 53 14 2
Abilene PD 6,501 12 136 20.9 9 1.4 0 3 3 3 127 19.5 20 101 6 1
Herington PD 2,371 12 80 33.7 4 1.7 0 0 0 4 76 32.1 15 53 8 0
Chapman PD 3
1,372 6 6 4.4 0 0.0 0 0 0 0 6 4.4 2 4 0 0
Enterprise PD Covered by Dickinson County SO
County Total 19,107 330 17.3 27 1.4 1 6 3 17 303 15.9 64 211 28 3
Doniphan County 02200
Sheriff 3,221 12 33 10.2 2 0.6 0 0 0 2 31 9.6 14 15 2 0
Elwood PD 9
1,181 12 25 21.2 3 2.5 0 1 0 2 22 18.6 12 7 3 0
Troy PD 3
984 6 2 2.0 0 0.0 0 0 0 0 2 2.0 2 0 0 0
Wathena PD 1,330 11 25 18.8 0 0.0 0 0 0 0 25 18.8 3 20 2 0
Highland PD 1,010 12 7 6.9 0 0.0 0 0 0 0 7 6.9 1 4 2 0
County Total 7,726 92 11.9 5 0.6 0 1 0 4 87 11.3 32 46 9 0
Douglas County 02300
Sheriff 5
12,561 12 197 15.7 25 2.0 0 4 2 19 172 13.7 40 128 4 1
Lawrence PD 5
95,149 12 3,731 39.2 336 3.5 1 67 55 213 3,395 35.7 427 2,789 179 19
Baldwin City PD 5
4,698 12 91 19.4 8 1.7 0 0 1 7 83 17.7 11 69 3 1
Eudora PD 4 5 10
0 Did not submit data for 2016 1
County Total 112,408 4,020 35.8 370 3.3 2 71 58 239 3,650 32.5 478 2,986 186 21
Edwards County 02400
Sheriff 2,936 12 22 7.5 2 0.7 0 0 1 1 20 6.8 5 15 0 0
Kinsley PD Covered by Edwards County SO
County Total 2,936 22 7.5 2 0.7 0 0 1 1 20 6.8 5 15 0 0
Elk County 02500
Sheriff 3
1,932 7 4 2.1 0 0.0 0 0 0 0 4 2.1 1 2 1 0
Howard PD 609 11 6 9.9 1 1.6 0 0 0 1 5 8.2 0 3 2 0
County Total 2,541 10 3.9 1 0.4 0 0 0 1 9 3.5 1 5 3 0
Ellis County 02600
Sheriff 4,494 12 77 17.1 7 1.6 0 0 0 7 70 15.6 32 33 5 2
Hays PD 21,206 12 513 24.2 69 3.3 1 3 2 63 444 20.9 82 336 26 1
Ellis PD 2,065 12 19 9.2 7 3.4 0 0 0 7 12 5.8 5 6 1 0
Victoria PD 1,229 12 7 5.7 2 1.6 0 0 0 2 5 4.1 2 3 0 0
County Total 28,994 616 21.2 85 2.9 1 3 2 79 531 18.3 121 378 32 3
Ellsworth County 02700
Sheriff 9
1,578 12 23 14.6 0 0.0 0 0 0 0 23 14.6 11 10 2 0
Ellsworth PD 3,043 12 40 13.1 4 1.3 0 1 0 3 36 11.8 9 23 4 0
Elsworth Correctional 3
NA 3 1 NA 1 NA 0 0 0 1 0 NA 0 0 0 0
Wilson PD 4
0 Did not submit data for 2016
Kanopolis PD 6
470 12 0 0.0 0 0.0 0 0 0 0 0 0.0 0 0 0 0
Holyrood PD 4
0 Did not submit data for 2016
County Total 5,091 64 12.6 5 1.0 0 1 0 4 59 11.6 20 33 6 0
Page 14
Crime Index 2016
2016 Motor
Estimated Months Agg. Vehicle
Reporting Agency Population2
Reported Total Rate/1,000 Total Rate/1,000 Murder Rape Robbery Assault/Battery Total Rate/1,000 Burglary Theft Theft Arson7
Offenses Offenses Offenses
Crime Index Violent Crime Property Crime
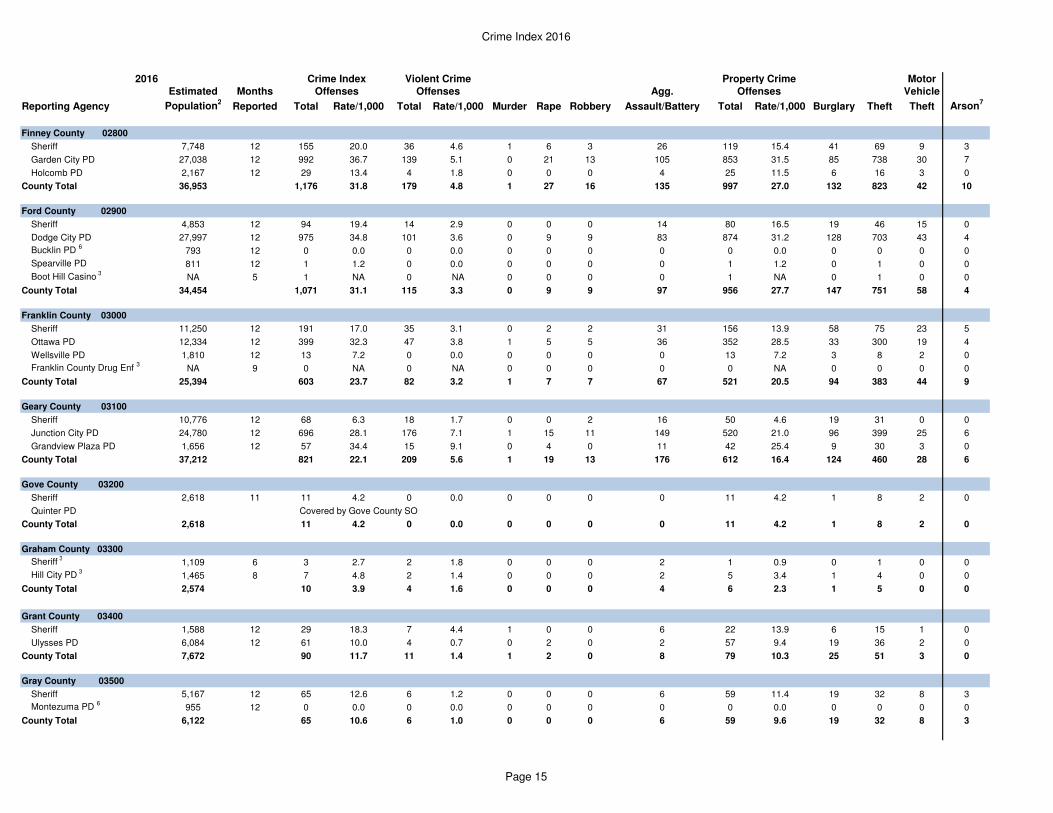
Finney County 02800
Sheriff 7,748 12 155 20.0 36 4.6 1 6 3 26 119 15.4 41 69 9 3
Garden City PD 27,038 12 992 36.7 139 5.1 0 21 13 105 853 31.5 85 738 30 7
Holcomb PD 2,167 12 29 13.4 4 1.8 0 0 0 4 25 11.5 6 16 3 0
County Total 36,953 1,176 31.8 179 4.8 1 27 16 135 997 27.0 132 823 42 10
Ford County 02900
Sheriff 4,853 12 94 19.4 14 2.9 0 0 0 14 80 16.5 19 46 15 0
Dodge City PD 27,997 12 975 34.8 101 3.6 0 9 9 83 874 31.2 128 703 43 4
Bucklin PD 6
793 12 0 0.0 0 0.0 0 0 0 0 0 0.0 0 0 0 0
Spearville PD 811 12 1 1.2 0 0.0 0 0 0 0 1 1.2 0 1 0 0
Boot Hill Casino 3
NA 5 1 NA 0 NA 0 0 0 0 1 NA 0 1 0 0
County Total 34,454 1,071 31.1 115 3.3 0 9 9 97 956 27.7 147 751 58 4
Franklin County 03000
Sheriff 11,250 12 191 17.0 35 3.1 0 2 2 31 156 13.9 58 75 23 5
Ottawa PD 12,334 12 399 32.3 47 3.8 1 5 5 36 352 28.5 33 300 19 4
Wellsville PD 1,810 12 13 7.2 0 0.0 0 0 0 0 13 7.2 3 8 2 0
Franklin County Drug Enf 3
NA 9 0 NA 0 NA 0 0 0 0 0 NA 0 0 0 0
County Total 25,394 603 23.7 82 3.2 1 7 7 67 521 20.5 94 383 44 9
Geary County 03100
Sheriff 10,776 12 68 6.3 18 1.7 0 0 2 16 50 4.6 19 31 0 0
Junction City PD 24,780 12 696 28.1 176 7.1 1 15 11 149 520 21.0 96 399 25 6
Grandview Plaza PD 1,656 12 57 34.4 15 9.1 0 4 0 11 42 25.4 9 30 3 0
County Total 37,212 821 22.1 209 5.6 1 19 13 176 612 16.4 124 460 28 6
Gove County 03200
Sheriff 2,618 11 11 4.2 0 0.0 0 0 0 0 11 4.2 1 8 2 0
Quinter PD Covered by Gove County SO
County Total 2,618 11 4.2 0 0.0 0 0 0 0 11 4.2 1 8 2 0
Graham County 03300
Sheriff 3
1,109 6 3 2.7 2 1.8 0 0 0 2 1 0.9 0 1 0 0
Hill City PD 3
1,465 8 7 4.8 2 1.4 0 0 0 2 5 3.4 1 4 0 0
County Total 2,574 10 3.9 4 1.6 0 0 0 4 6 2.3 1 5 0 0
Grant County 03400
Sheriff 1,588 12 29 18.3 7 4.4 1 0 0 6 22 13.9 6 15 1 0
Ulysses PD 6,084 12 61 10.0 4 0.7 0 2 0 2 57 9.4 19 36 2 0
County Total 7,672 90 11.7 11 1.4 1 2 0 8 79 10.3 25 51 3 0
Gray County 03500
Sheriff 5,167 12 65 12.6 6 1.2 0 0 0 6 59 11.4 19 32 8 3
Montezuma PD 6
955 12 0 0.0 0 0.0 0 0 0 0 0 0.0 0 0 0 0
County Total 6,122 65 10.6 6 1.0 0 0 0 6 59 9.6 19 32 8 3
Page 15
Crime Index 2016
2016 Motor
Estimated Months Agg. Vehicle
Reporting Agency Population2
Reported Total Rate/1,000 Total Rate/1,000 Murder Rape Robbery Assault/Battery Total Rate/1,000 Burglary Theft Theft Arson7
Offenses Offenses Offenses
Crime Index Violent Crime Property Crime
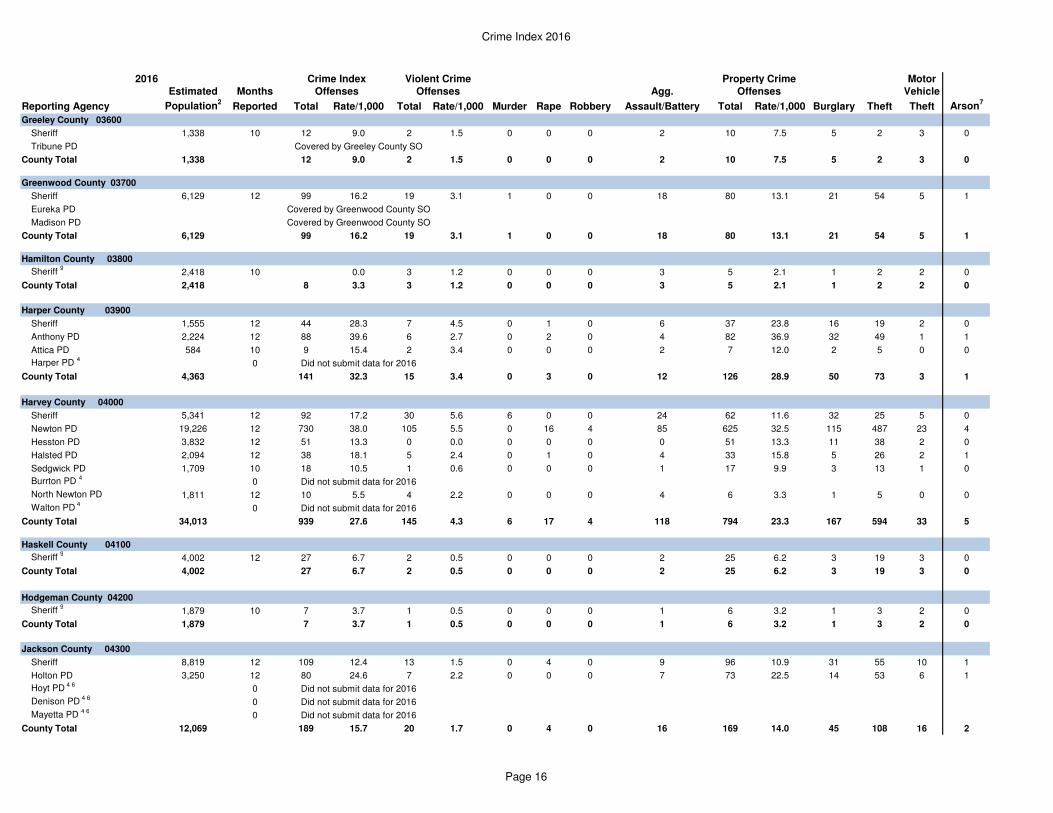
Greeley County 03600
Sheriff 1,338 10 12 9.0 2 1.5 0 0 0 2 10 7.5 5 2 3 0
Tribune PD Covered by Greeley County SO
County Total 1,338 12 9.0 2 1.5 0 0 0 2 10 7.5 5 2 3 0
Greenwood County 03700
Sheriff 6,129 12 99 16.2 19 3.1 1 0 0 18 80 13.1 21 54 5 1
Eureka PD Covered by Greenwood County SO
Madison PD Covered by Greenwood County SO
County Total 6,129 99 16.2 19 3.1 1 0 0 18 80 13.1 21 54 5 1
Hamilton County 03800
Sheriff 9
2,418 10 0.0 3 1.2 0 0 0 3 5 2.1 1 2 2 0
County Total 2,418 8 3.3 3 1.2 0 0 0 3 5 2.1 1 2 2 0
Harper County 03900
Sheriff 1,555 12 44 28.3 7 4.5 0 1 0 6 37 23.8 16 19 2 0
Anthony PD 2,224 12 88 39.6 6 2.7 0 2 0 4 82 36.9 32 49 1 1
Attica PD 584 10 9 15.4 2 3.4 0 0 0 2 7 12.0 2 5 0 0
Harper PD 4
0 Did not submit data for 2016
County Total 4,363 141 32.3 15 3.4 0 3 0 12 126 28.9 50 73 3 1
Harvey County 04000
Sheriff 5,341 12 92 17.2 30 5.6 6 0 0 24 62 11.6 32 25 5 0
Newton PD 19,226 12 730 38.0 105 5.5 0 16 4 85 625 32.5 115 487 23 4
Hesston PD 3,832 12 51 13.3 0 0.0 0 0 0 0 51 13.3 11 38 2 0
Halsted PD 2,094 12 38 18.1 5 2.4 0 1 0 4 33 15.8 5 26 2 1
Sedgwick PD 1,709 10 18 10.5 1 0.6 0 0 0 1 17 9.9 3 13 1 0
Burrton PD 4
0 Did not submit data for 2016
North Newton PD 1,811 12 10 5.5 4 2.2 0 0 0 4 6 3.3 1 5 0 0
Walton PD 4
0 Did not submit data for 2016
County Total 34,013 939 27.6 145 4.3 6 17 4 118 794 23.3 167 594 33 5
Haskell County 04100
Sheriff 9
4,002 12 27 6.7 2 0.5 0 0 0 2 25 6.2 3 19 3 0
County Total 4,002 27 6.7 2 0.5 0 0 0 2 25 6.2 3 19 3 0
Hodgeman County 04200
Sheriff 9
1,879 10 7 3.7 1 0.5 0 0 0 1 6 3.2 1 3 2 0
County Total 1,879 7 3.7 1 0.5 0 0 0 1 6 3.2 1 3 2 0
Jackson County 04300
Sheriff 8,819 12 109 12.4 13 1.5 0 4 0 9 96 10.9 31 55 10 1
Holton PD 3,250 12 80 24.6 7 2.2 0 0 0 7 73 22.5 14 53 6 1
Hoyt PD 4 6
0 Did not submit data for 2016
Denison PD 4 6
0 Did not submit data for 2016
Mayetta PD 4 6
0 Did not submit data for 2016
County Total 12,069 189 15.7 20 1.7 0 4 0 16 169 14.0 45 108 16 2
Page 16
Crime Index 2016
2016 Motor
Estimated Months Agg. Vehicle
Reporting Agency Population2
Reported Total Rate/1,000 Total Rate/1,000 Murder Rape Robbery Assault/Battery Total Rate/1,000 Burglary Theft Theft Arson7
Offenses Offenses Offenses
Crime Index Violent Crime Property Crime
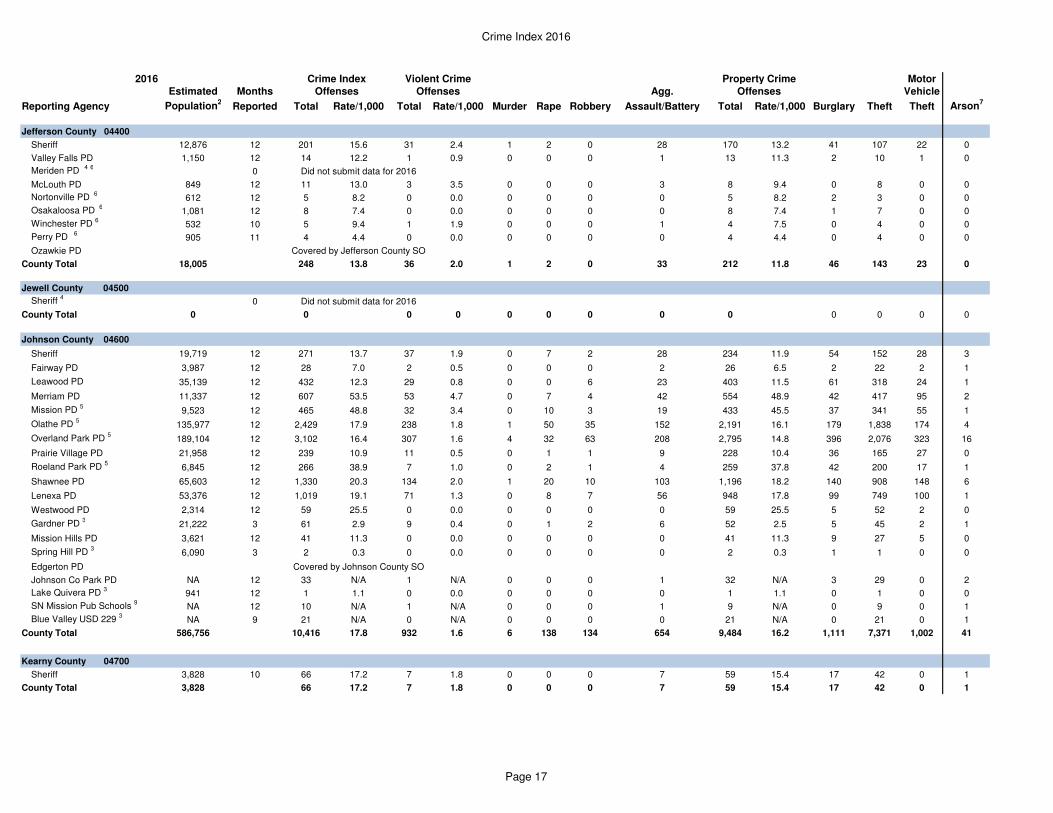
Jefferson County 04400
Sheriff 12,876 12 201 15.6 31 2.4 1 2 0 28 170 13.2 41 107 22 0
Valley Falls PD 1,150 12 14 12.2 1 0.9 0 0 0 1 13 11.3 2 10 1 0
Meriden PD 4 6
0 Did not submit data for 2016
McLouth PD 849 12 11 13.0 3 3.5 0 0 0 3 8 9.4 0 8 0 0
Nortonville PD 6
612 12 5 8.2 0 0.0 0 0 0 0 5 8.2 2 3 0 0
Osakaloosa PD 6
1,081 12 8 7.4 0 0.0 0 0 0 0 8 7.4 1 7 0 0
Winchester PD 6
532 10 5 9.4 1 1.9 0 0 0 1 4 7.5 0 4 0 0
Perry PD 6
905 11 4 4.4 0 0.0 0 0 0 0 4 4.4 0 4 0 0
Ozawkie PD Covered by Jefferson County SO
County Total 18,005 248 13.8 36 2.0 1 2 0 33 212 11.8 46 143 23 0
Jewell County 04500
Sheriff 4
0 Did not submit data for 2016
County Total 0 0 0 0 0 0 0 0 0 0 0 0 0
Johnson County 04600
Sheriff 19,719 12 271 13.7 37 1.9 0 7 2 28 234 11.9 54 152 28 3
Fairway PD 3,987 12 28 7.0 2 0.5 0 0 0 2 26 6.5 2 22 2 1
Leawood PD 35,139 12 432 12.3 29 0.8 0 0 6 23 403 11.5 61 318 24 1
Merriam PD 11,337 12 607 53.5 53 4.7 0 7 4 42 554 48.9 42 417 95 2
Mission PD 5
9,523 12 465 48.8 32 3.4 0 10 3 19 433 45.5 37 341 55 1
Olathe PD 5
135,977 12 2,429 17.9 238 1.8 1 50 35 152 2,191 16.1 179 1,838 174 4
Overland Park PD 5
189,104 12 3,102 16.4 307 1.6 4 32 63 208 2,795 14.8 396 2,076 323 16
Prairie Village PD 21,958 12 239 10.9 11 0.5 0 1 1 9 228 10.4 36 165 27 0
Roeland Park PD 5
6,845 12 266 38.9 7 1.0 0 2 1 4 259 37.8 42 200 17 1
Shawnee PD 65,603 12 1,330 20.3 134 2.0 1 20 10 103 1,196 18.2 140 908 148 6
Lenexa PD 53,376 12 1,019 19.1 71 1.3 0 8 7 56 948 17.8 99 749 100 1
Westwood PD 2,314 12 59 25.5 0 0.0 0 0 0 0 59 25.5 5 52 2 0
Gardner PD 3
21,222 3 61 2.9 9 0.4 0 1 2 6 52 2.5 5 45 2 1
Mission Hills PD 3,621 12 41 11.3 0 0.0 0 0 0 0 41 11.3 9 27 5 0
Spring Hill PD 3
6,090 3 2 0.3 0 0.0 0 0 0 0 2 0.3 1 1 0 0
Edgerton PD Covered by Johnson County SO
Johnson Co Park PD NA 12 33 N/A 1 N/A 0 0 0 1 32 N/A 3 29 0 2
Lake Quivera PD 3
941 12 1 1.1 0 0.0 0 0 0 0 1 1.1 0 1 0 0
SN Mission Pub Schools 9
NA 12 10 N/A 1 N/A 0 0 0 1 9 N/A 0 9 0 1
Blue Valley USD 229 3
NA 9 21 N/A 0 N/A 0 0 0 0 21 N/A 0 21 0 1
County Total 586,756 10,416 17.8 932 1.6 6 138 134 654 9,484 16.2 1,111 7,371 1,002 41
Kearny County 04700
Sheriff 3,828 10 66 17.2 7 1.8 0 0 0 7 59 15.4 17 42 0 1
County Total 3,828 66 17.2 7 1.8 0 0 0 7 59 15.4 17 42 0 1
Page 17
Crime Index 2016
2016 Motor
Estimated Months Agg. Vehicle
Reporting Agency Population2
Reported Total Rate/1,000 Total Rate/1,000 Murder Rape Robbery Assault/Battery Total Rate/1,000 Burglary Theft Theft Arson7
Offenses Offenses Offenses
Crime Index Violent Crime Property Crime
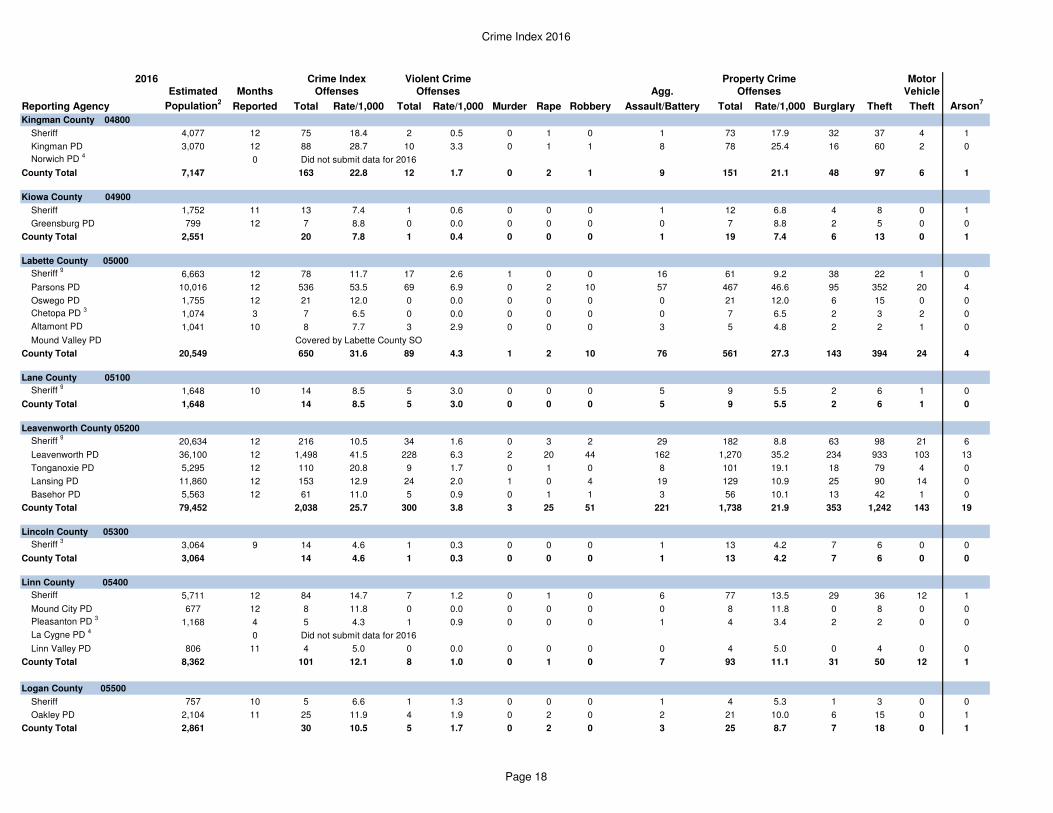
Kingman County 04800
Sheriff 4,077 12 75 18.4 2 0.5 0 1 0 1 73 17.9 32 37 4 1
Kingman PD 3,070 12 88 28.7 10 3.3 0 1 1 8 78 25.4 16 60 2 0
Norwich PD 4
0 Did not submit data for 2016
County Total 7,147 163 22.8 12 1.7 0 2 1 9 151 21.1 48 97 6 1
Kiowa County 04900
Sheriff 1,752 11 13 7.4 1 0.6 0 0 0 1 12 6.8 4 8 0 1
Greensburg PD 799 12 7 8.8 0 0.0 0 0 0 0 7 8.8 2 5 0 0
County Total 2,551 20 7.8 1 0.4 0 0 0 1 19 7.4 6 13 0 1
Labette County 05000
Sheriff 9
6,663 12 78 11.7 17 2.6 1 0 0 16 61 9.2 38 22 1 0
Parsons PD 10,016 12 536 53.5 69 6.9 0 2 10 57 467 46.6 95 352 20 4
Oswego PD 1,755 12 21 12.0 0 0.0 0 0 0 0 21 12.0 6 15 0 0
Chetopa PD 3
1,074 3 7 6.5 0 0.0 0 0 0 0 7 6.5 2 3 2 0
Altamont PD 1,041 10 8 7.7 3 2.9 0 0 0 3 5 4.8 2 2 1 0
Mound Valley PD Covered by Labette County SO
County Total 20,549 650 31.6 89 4.3 1 2 10 76 561 27.3 143 394 24 4
Lane County 05100
Sheriff 9
1,648 10 14 8.5 5 3.0 0 0 0 5 9 5.5 2 6 1 0
County Total 1,648 14 8.5 5 3.0 0 0 0 5 9 5.5 2 6 1 0
Leavenworth County 05200
Sheriff 9
20,634 12 216 10.5 34 1.6 0 3 2 29 182 8.8 63 98 21 6
Leavenworth PD 36,100 12 1,498 41.5 228 6.3 2 20 44 162 1,270 35.2 234 933 103 13
Tonganoxie PD 5,295 12 110 20.8 9 1.7 0 1 0 8 101 19.1 18 79 4 0
Lansing PD 11,860 12 153 12.9 24 2.0 1 0 4 19 129 10.9 25 90 14 0
Basehor PD 5,563 12 61 11.0 5 0.9 0 1 1 3 56 10.1 13 42 1 0
County Total 79,452 2,038 25.7 300 3.8 3 25 51 221 1,738 21.9 353 1,242 143 19
Lincoln County 05300
Sheriff 3
3,064 9 14 4.6 1 0.3 0 0 0 1 13 4.2 7 6 0 0
County Total 3,064 14 4.6 1 0.3 0 0 0 1 13 4.2 7 6 0 0
Linn County 05400
Sheriff 5,711 12 84 14.7 7 1.2 0 1 0 6 77 13.5 29 36 12 1
Mound City PD 677 12 8 11.8 0 0.0 0 0 0 0 8 11.8 0 8 0 0
Pleasanton PD 3
1,168 4 5 4.3 1 0.9 0 0 0 1 4 3.4 2 2 0 0
La Cygne PD 4
0 Did not submit data for 2016
Linn Valley PD 806 11 4 5.0 0 0.0 0 0 0 0 4 5.0 0 4 0 0
County Total 8,362 101 12.1 8 1.0 0 1 0 7 93 11.1 31 50 12 1
Logan County 05500
Sheriff 757 10 5 6.6 1 1.3 0 0 0 1 4 5.3 1 3 0 0
Oakley PD 2,104 11 25 11.9 4 1.9 0 2 0 2 21 10.0 6 15 0 1
County Total 2,861 30 10.5 5 1.7 0 2 0 3 25 8.7 7 18 0 1
Page 18
Crime Index 2016
2016 Motor
Estimated Months Agg. Vehicle
Reporting Agency Population2
Reported Total Rate/1,000 Total Rate/1,000 Murder Rape Robbery Assault/Battery Total Rate/1,000 Burglary Theft Theft Arson7
Offenses Offenses Offenses
Crime Index Violent Crime Property Crime
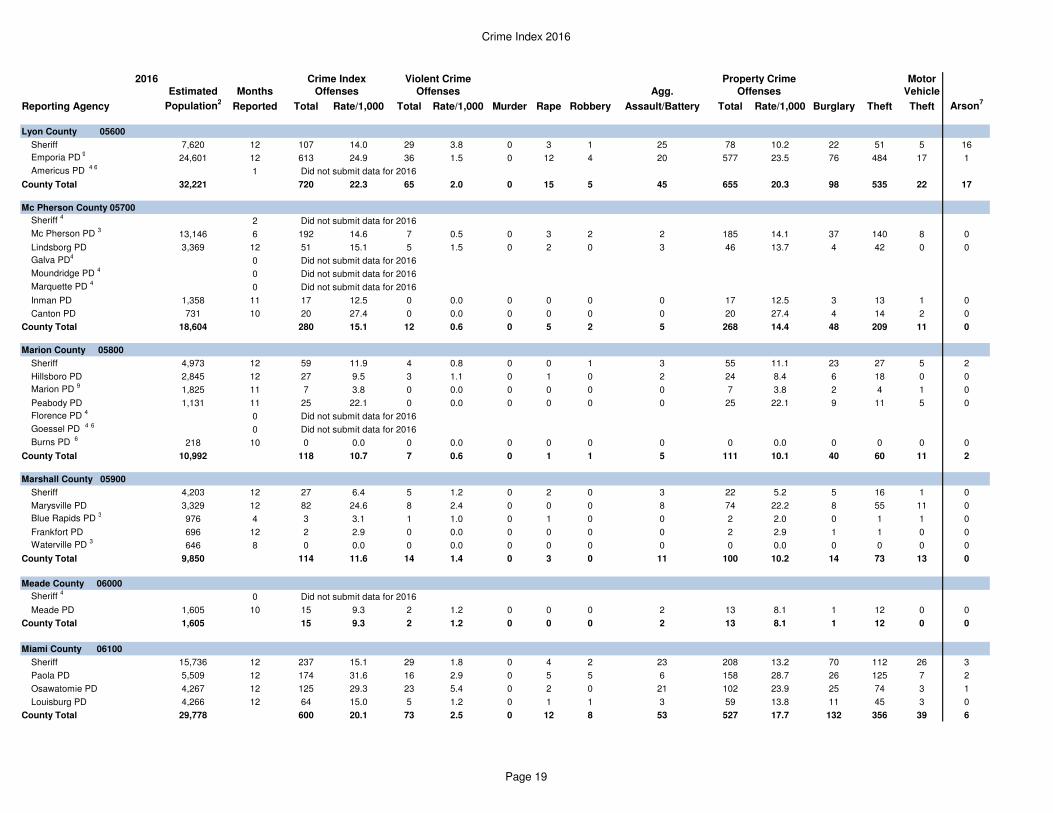
Lyon County 05600
Sheriff 7,620 12 107 14.0 29 3.8 0 3 1 25 78 10.2 22 51 5 16
Emporia PD 9
24,601 12 613 24.9 36 1.5 0 12 4 20 577 23.5 76 484 17 1
Americus PD 4 6
1 Did not submit data for 2016
County Total 32,221 720 22.3 65 2.0 0 15 5 45 655 20.3 98 535 22 17
Mc Pherson County 05700
Sheriff 4
2 Did not submit data for 2016
Mc Pherson PD 3
13,146 6 192 14.6 7 0.5 0 3 2 2 185 14.1 37 140 8 0
Lindsborg PD 3,369 12 51 15.1 5 1.5 0 2 0 3 46 13.7 4 42 0 0
Galva PD4
0 Did not submit data for 2016
Moundridge PD 4
0 Did not submit data for 2016
Marquette PD 4
0 Did not submit data for 2016
Inman PD 1,358 11 17 12.5 0 0.0 0 0 0 0 17 12.5 3 13 1 0
Canton PD 731 10 20 27.4 0 0.0 0 0 0 0 20 27.4 4 14 2 0
County Total 18,604 280 15.1 12 0.6 0 5 2 5 268 14.4 48 209 11 0
Marion County 05800
Sheriff 4,973 12 59 11.9 4 0.8 0 0 1 3 55 11.1 23 27 5 2
Hillsboro PD 2,845 12 27 9.5 3 1.1 0 1 0 2 24 8.4 6 18 0 0
Marion PD 9
1,825 11 7 3.8 0 0.0 0 0 0 0 7 3.8 2 4 1 0
Peabody PD 1,131 11 25 22.1 0 0.0 0 0 0 0 25 22.1 9 11 5 0
Florence PD 4
0 Did not submit data for 2016
Goessel PD 4 6
0 Did not submit data for 2016
Burns PD 6
218 10 0 0.0 0 0.0 0 0 0 0 0 0.0 0 0 0 0
County Total 10,992 118 10.7 7 0.6 0 1 1 5 111 10.1 40 60 11 2
Marshall County 05900
Sheriff 4,203 12 27 6.4 5 1.2 0 2 0 3 22 5.2 5 16 1 0
Marysville PD 3,329 12 82 24.6 8 2.4 0 0 0 8 74 22.2 8 55 11 0
Blue Rapids PD 3
976 4 3 3.1 1 1.0 0 1 0 0 2 2.0 0 1 1 0
Frankfort PD 696 12 2 2.9 0 0.0 0 0 0 0 2 2.9 1 1 0 0
Waterville PD 3
646 8 0 0.0 0 0.0 0 0 0 0 0 0.0 0 0 0 0
County Total 9,850 114 11.6 14 1.4 0 3 0 11 100 10.2 14 73 13 0
Meade County 06000
Sheriff 4
0 Did not submit data for 2016
Meade PD 1,605 10 15 9.3 2 1.2 0 0 0 2 13 8.1 1 12 0 0
County Total 1,605 15 9.3 2 1.2 0 0 0 2 13 8.1 1 12 0 0
Miami County 06100
Sheriff 15,736 12 237 15.1 29 1.8 0 4 2 23 208 13.2 70 112 26 3
Paola PD 5,509 12 174 31.6 16 2.9 0 5 5 6 158 28.7 26 125 7 2
Osawatomie PD 4,267 12 125 29.3 23 5.4 0 2 0 21 102 23.9 25 74 3 1
Louisburg PD 4,266 12 64 15.0 5 1.2 0 1 1 3 59 13.8 11 45 3 0
County Total 29,778 600 20.1 73 2.5 0 12 8 53 527 17.7 132 356 39 6
Page 19
Crime Index 2016
2016 Motor
Estimated Months Agg. Vehicle
Reporting Agency Population2
Reported Total Rate/1,000 Total Rate/1,000 Murder Rape Robbery Assault/Battery Total Rate/1,000 Burglary Theft Theft Arson7
Offenses Offenses Offenses
Crime Index Violent Crime Property Crime
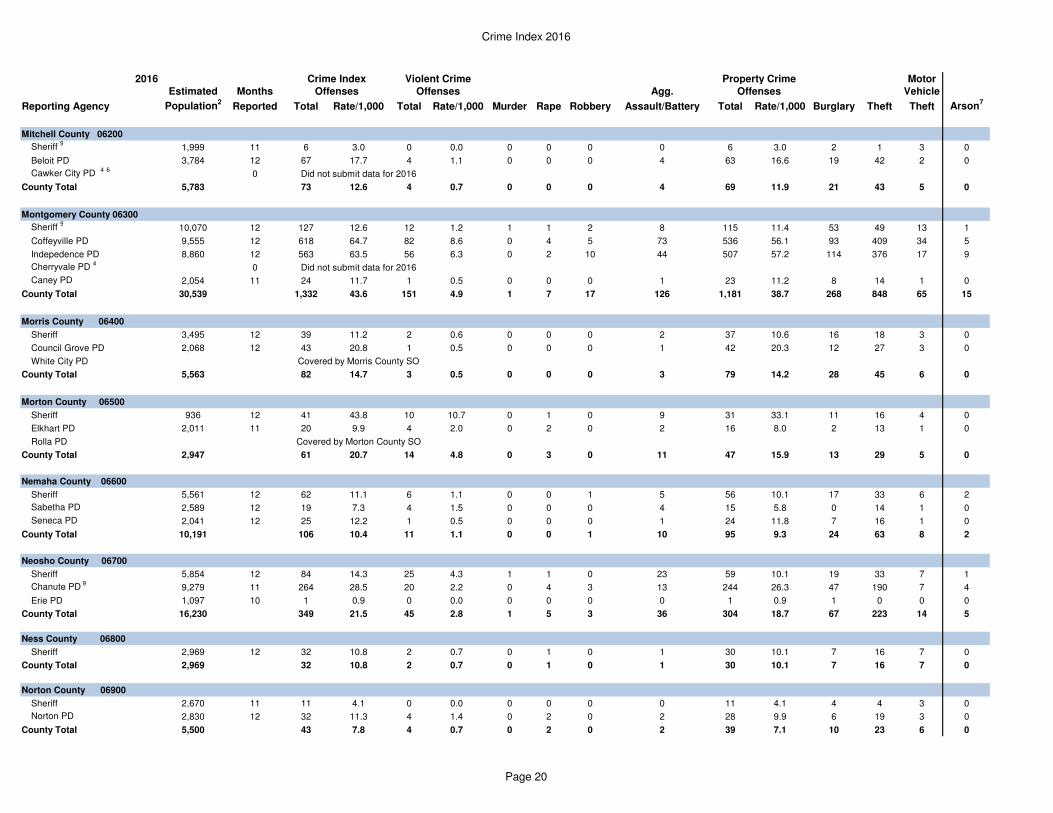
Mitchell County 06200
Sheriff 9
1,999 11 6 3.0 0 0.0 0 0 0 0 6 3.0 2 1 3 0
Beloit PD 3,784 12 67 17.7 4 1.1 0 0 0 4 63 16.6 19 42 2 0
Cawker City PD 4 6
0 Did not submit data for 2016
County Total 5,783 73 12.6 4 0.7 0 0 0 4 69 11.9 21 43 5 0
Montgomery County 06300
Sheriff 9
10,070 12 127 12.6 12 1.2 1 1 2 8 115 11.4 53 49 13 1
Coffeyville PD 9,555 12 618 64.7 82 8.6 0 4 5 73 536 56.1 93 409 34 5
Indepedence PD 8,860 12 563 63.5 56 6.3 0 2 10 44 507 57.2 114 376 17 9
Cherryvale PD 4
0 Did not submit data for 2016
Caney PD 2,054 11 24 11.7 1 0.5 0 0 0 1 23 11.2 8 14 1 0
County Total 30,539 1,332 43.6 151 4.9 1 7 17 126 1,181 38.7 268 848 65 15
Morris County 06400
Sheriff 3,495 12 39 11.2 2 0.6 0 0 0 2 37 10.6 16 18 3 0
Council Grove PD 2,068 12 43 20.8 1 0.5 0 0 0 1 42 20.3 12 27 3 0
White City PD Covered by Morris County SO
County Total 5,563 82 14.7 3 0.5 0 0 0 3 79 14.2 28 45 6 0
Morton County 06500
Sheriff 936 12 41 43.8 10 10.7 0 1 0 9 31 33.1 11 16 4 0
Elkhart PD 2,011 11 20 9.9 4 2.0 0 2 0 2 16 8.0 2 13 1 0
Rolla PD Covered by Morton County SO
County Total 2,947 61 20.7 14 4.8 0 3 0 11 47 15.9 13 29 5 0
Nemaha County 06600
Sheriff 5,561 12 62 11.1 6 1.1 0 0 1 5 56 10.1 17 33 6 2
Sabetha PD 2,589 12 19 7.3 4 1.5 0 0 0 4 15 5.8 0 14 1 0
Seneca PD 2,041 12 25 12.2 1 0.5 0 0 0 1 24 11.8 7 16 1 0
County Total 10,191 106 10.4 11 1.1 0 0 1 10 95 9.3 24 63 8 2
Neosho County 06700
Sheriff 5,854 12 84 14.3 25 4.3 1 1 0 23 59 10.1 19 33 7 1
Chanute PD 9
9,279 11 264 28.5 20 2.2 0 4 3 13 244 26.3 47 190 7 4
Erie PD 1,097 10 1 0.9 0 0.0 0 0 0 0 1 0.9 1 0 0 0
County Total 16,230 349 21.5 45 2.8 1 5 3 36 304 18.7 67 223 14 5
Ness County 06800
Sheriff 2,969 12 32 10.8 2 0.7 0 1 0 1 30 10.1 7 16 7 0
County Total 2,969 32 10.8 2 0.7 0 1 0 1 30 10.1 7 16 7 0
Norton County 06900
Sheriff 2,670 11 11 4.1 0 0.0 0 0 0 0 11 4.1 4 4 3 0
Norton PD 2,830 12 32 11.3 4 1.4 0 2 0 2 28 9.9 6 19 3 0
County Total 5,500 43 7.8 4 0.7 0 2 0 2 39 7.1 10 23 6 0
Page 20
Crime Index 2016
2016 Motor
Estimated Months Agg. Vehicle
Reporting Agency Population2
Reported Total Rate/1,000 Total Rate/1,000 Murder Rape Robbery Assault/Battery Total Rate/1,000 Burglary Theft Theft Arson7
Offenses Offenses Offenses
Crime Index Violent Crime Property Crime
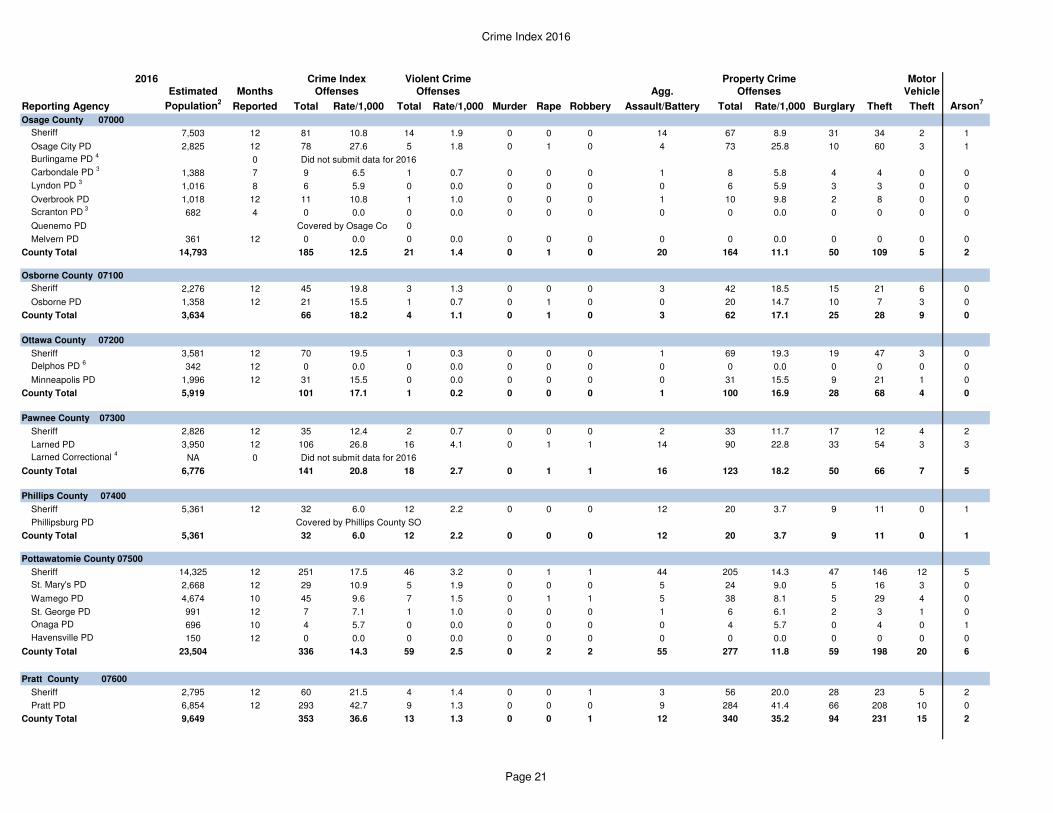
Osage County 07000
Sheriff 7,503 12 81 10.8 14 1.9 0 0 0 14 67 8.9 31 34 2 1
Osage City PD 2,825 12 78 27.6 5 1.8 0 1 0 4 73 25.8 10 60 3 1
Burlingame PD 4
0 Did not submit data for 2016
Carbondale PD 3
1,388 7 9 6.5 1 0.7 0 0 0 1 8 5.8 4 4 0 0
Lyndon PD 3
1,016 8 6 5.9 0 0.0 0 0 0 0 6 5.9 3 3 0 0
Overbrook PD 1,018 12 11 10.8 1 1.0 0 0 0 1 10 9.8 2 8 0 0
Scranton PD 3
682 4 0 0.0 0 0.0 0 0 0 0 0 0.0 0 0 0 0
Quenemo PD Covered by Osage County SO0
Melvern PD 361 12 0 0.0 0 0.0 0 0 0 0 0 0.0 0 0 0 0
County Total 14,793 185 12.5 21 1.4 0 1 0 20 164 11.1 50 109 5 2
Osborne County 07100
Sheriff 2,276 12 45 19.8 3 1.3 0 0 0 3 42 18.5 15 21 6 0
Osborne PD 1,358 12 21 15.5 1 0.7 0 1 0 0 20 14.7 10 7 3 0
County Total 3,634 66 18.2 4 1.1 0 1 0 3 62 17.1 25 28 9 0
Ottawa County 07200
Sheriff 3,581 12 70 19.5 1 0.3 0 0 0 1 69 19.3 19 47 3 0
Delphos PD 6
342 12 0 0.0 0 0.0 0 0 0 0 0 0.0 0 0 0 0
Minneapolis PD 1,996 12 31 15.5 0 0.0 0 0 0 0 31 15.5 9 21 1 0
County Total 5,919 101 17.1 1 0.2 0 0 0 1 100 16.9 28 68 4 0
Pawnee County 07300
Sheriff 2,826 12 35 12.4 2 0.7 0 0 0 2 33 11.7 17 12 4 2
Larned PD 3,950 12 106 26.8 16 4.1 0 1 1 14 90 22.8 33 54 3 3
Larned Correctional 4
NA 0 Did not submit data for 2016
County Total 6,776 141 20.8 18 2.7 0 1 1 16 123 18.2 50 66 7 5
Phillips County 07400
Sheriff 5,361 12 32 6.0 12 2.2 0 0 0 12 20 3.7 9 11 0 1
Phillipsburg PD Covered by Phillips County SO
County Total 5,361 32 6.0 12 2.2 0 0 0 12 20 3.7 9 11 0 1
Pottawatomie County 07500
Sheriff 14,325 12 251 17.5 46 3.2 0 1 1 44 205 14.3 47 146 12 5
St. Mary's PD 2,668 12 29 10.9 5 1.9 0 0 0 5 24 9.0 5 16 3 0
Wamego PD 4,674 10 45 9.6 7 1.5 0 1 1 5 38 8.1 5 29 4 0
St. George PD 991 12 7 7.1 1 1.0 0 0 0 1 6 6.1 2 3 1 0
Onaga PD 696 10 4 5.7 0 0.0 0 0 0 0 4 5.7 0 4 0 1
Havensville PD 150 12 0 0.0 0 0.0 0 0 0 0 0 0.0 0 0 0 0
County Total 23,504 336 14.3 59 2.5 0 2 2 55 277 11.8 59 198 20 6
Pratt County 07600
Sheriff 2,795 12 60 21.5 4 1.4 0 0 1 3 56 20.0 28 23 5 2
Pratt PD 6,854 12 293 42.7 9 1.3 0 0 0 9 284 41.4 66 208 10 0
County Total 9,649 353 36.6 13 1.3 0 0 1 12 340 35.2 94 231 15 2
Page 21
Crime Index 2016
2016 Motor
Estimated Months Agg. Vehicle
Reporting Agency Population2
Reported Total Rate/1,000 Total Rate/1,000 Murder Rape Robbery Assault/Battery Total Rate/1,000 Burglary Theft Theft Arson7
Offenses Offenses Offenses
Crime Index Violent Crime Property Crime
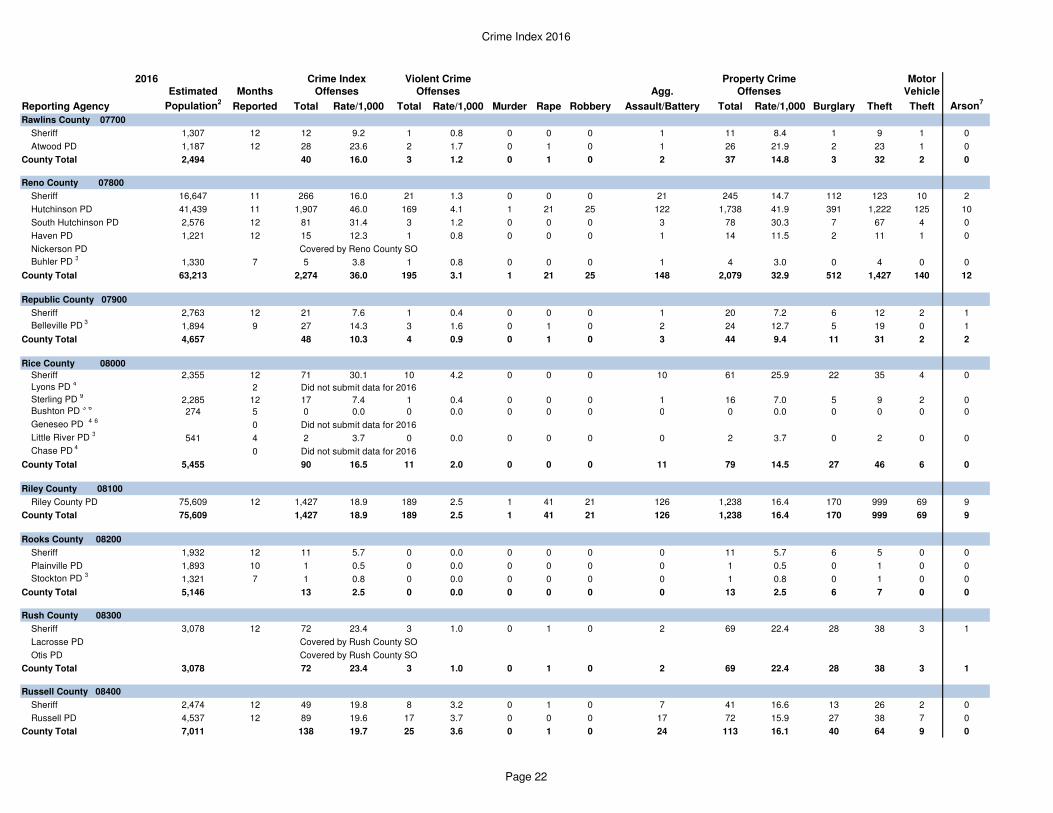
Rawlins County 07700
Sheriff 1,307 12 12 9.2 1 0.8 0 0 0 1 11 8.4 1 9 1 0
Atwood PD 1,187 12 28 23.6 2 1.7 0 1 0 1 26 21.9 2 23 1 0
County Total 2,494 40 16.0 3 1.2 0 1 0 2 37 14.8 3 32 2 0
Reno County 07800
Sheriff 16,647 11 266 16.0 21 1.3 0 0 0 21 245 14.7 112 123 10 2
Hutchinson PD 41,439 11 1,907 46.0 169 4.1 1 21 25 122 1,738 41.9 391 1,222 125 10
South Hutchinson PD 2,576 12 81 31.4 3 1.2 0 0 0 3 78 30.3 7 67 4 0
Haven PD 1,221 12 15 12.3 1 0.8 0 0 0 1 14 11.5 2 11 1 0
Nickerson PD Covered by Reno County SO
Buhler PD 3
1,330 7 5 3.8 1 0.8 0 0 0 1 4 3.0 0 4 0 0
County Total 63,213 2,274 36.0 195 3.1 1 21 25 148 2,079 32.9 512 1,427 140 12
Republic County 07900
Sheriff 2,763 12 21 7.6 1 0.4 0 0 0 1 20 7.2 6 12 2 1
Belleville PD 3
1,894 9 27 14.3 3 1.6 0 1 0 2 24 12.7 5 19 0 1
County Total 4,657 48 10.3 4 0.9 0 1 0 3 44 9.4 11 31 2 2
Rice County 08000
Sheriff 2,355 12 71 30.1 10 4.2 0 0 0 10 61 25.9 22 35 4 0
Lyons PD 4
2 Did not submit data for 2016
Sterling PD 9
2,285 12 17 7.4 1 0.4 0 0 0 1 16 7.0 5 9 2 0
Bushton PD 3 6
274 5 0 0.0 0 0.0 0 0 0 0 0 0.0 0 0 0 0
Geneseo PD 4 6
0 Did not submit data for 2016
Little River PD 3
541 4 2 3.7 0 0.0 0 0 0 0 2 3.7 0 2 0 0
Chase PD 4
0 Did not submit data for 2016
County Total 5,455 90 16.5 11 2.0 0 0 0 11 79 14.5 27 46 6 0
Riley County 08100
Riley County PD 75,609 12 1,427 18.9 189 2.5 1 41 21 126 1,238 16.4 170 999 69 9
County Total 75,609 1,427 18.9 189 2.5 1 41 21 126 1,238 16.4 170 999 69 9
Rooks County 08200
Sheriff 1,932 12 11 5.7 0 0.0 0 0 0 0 11 5.7 6 5 0 0
Plainville PD 1,893 10 1 0.5 0 0.0 0 0 0 0 1 0.5 0 1 0 0
Stockton PD 3
1,321 7 1 0.8 0 0.0 0 0 0 0 1 0.8 0 1 0 0
County Total 5,146 13 2.5 0 0.0 0 0 0 0 13 2.5 6 7 0 0
Rush County 08300
Sheriff 3,078 12 72 23.4 3 1.0 0 1 0 2 69 22.4 28 38 3 1
Lacrosse PD Covered by Rush County SO
Otis PD Covered by Rush County SO
County Total 3,078 72 23.4 3 1.0 0 1 0 2 69 22.4 28 38 3 1
Russell County 08400
Sheriff 2,474 12 49 19.8 8 3.2 0 1 0 7 41 16.6 13 26 2 0
Russell PD 4,537 12 89 19.6 17 3.7 0 0 0 17 72 15.9 27 38 7 0
County Total 7,011 138 19.7 25 3.6 0 1 0 24 113 16.1 40 64 9 0
Page 22
Crime Index 2016
2016 Motor
Estimated Months Agg. Vehicle
Reporting Agency Population2
Reported Total Rate/1,000 Total Rate/1,000 Murder Rape Robbery Assault/Battery Total Rate/1,000 Burglary Theft Theft Arson7
Offenses Offenses Offenses
Crime Index Violent Crime Property Crime
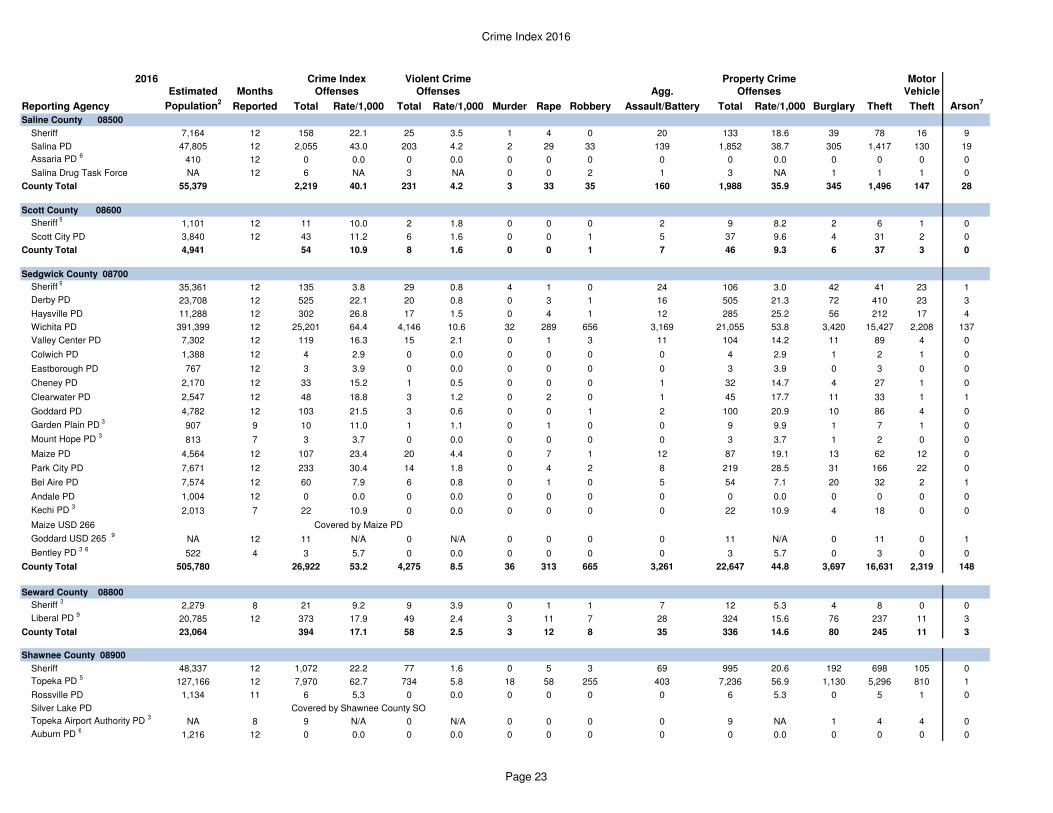
Saline County 08500
Sheriff 7,164 12 158 22.1 25 3.5 1 4 0 20 133 18.6 39 78 16 9
Salina PD 47,805 12 2,055 43.0 203 4.2 2 29 33 139 1,852 38.7 305 1,417 130 19
Assaria PD 6
410 12 0 0.0 0 0.0 0 0 0 0 0 0.0 0 0 0 0
Salina Drug Task Force NA 12 6 NA 3 NA 0 0 2 1 3 NA 1 1 1 0
County Total 55,379 2,219 40.1 231 4.2 3 33 35 160 1,988 35.9 345 1,496 147 28
Scott County 08600
Sheriff 9
1,101 12 11 10.0 2 1.8 0 0 0 2 9 8.2 2 6 1 0
Scott City PD 3,840 12 43 11.2 6 1.6 0 0 1 5 37 9.6 4 31 2 0
County Total 4,941 54 10.9 8 1.6 0 0 1 7 46 9.3 6 37 3 0
Sedgwick County 08700
Sheriff 9
35,361 12 135 3.8 29 0.8 4 1 0 24 106 3.0 42 41 23 1
Derby PD 23,708 12 525 22.1 20 0.8 0 3 1 16 505 21.3 72 410 23 3
Haysville PD 11,288 12 302 26.8 17 1.5 0 4 1 12 285 25.2 56 212 17 4
Wichita PD 391,399 12 25,201 64.4 4,146 10.6 32 289 656 3,169 21,055 53.8 3,420 15,427 2,208 137
Valley Center PD 7,302 12 119 16.3 15 2.1 0 1 3 11 104 14.2 11 89 4 0
Colwich PD 1,388 12 4 2.9 0 0.0 0 0 0 0 4 2.9 1 2 1 0
Eastborough PD 767 12 3 3.9 0 0.0 0 0 0 0 3 3.9 0 3 0 0
Cheney PD 2,170 12 33 15.2 1 0.5 0 0 0 1 32 14.7 4 27 1 0
Clearwater PD 2,547 12 48 18.8 3 1.2 0 2 0 1 45 17.7 11 33 1 1
Goddard PD 4,782 12 103 21.5 3 0.6 0 0 1 2 100 20.9 10 86 4 0
Garden Plain PD 3
907 9 10 11.0 1 1.1 0 1 0 0 9 9.9 1 7 1 0
Mount Hope PD 3
813 7 3 3.7 0 0.0 0 0 0 0 3 3.7 1 2 0 0
Maize PD 4,564 12 107 23.4 20 4.4 0 7 1 12 87 19.1 13 62 12 0
Park City PD 7,671 12 233 30.4 14 1.8 0 4 2 8 219 28.5 31 166 22 0
Bel Aire PD 7,574 12 60 7.9 6 0.8 0 1 0 5 54 7.1 20 32 2 1
Andale PD 1,004 12 0 0.0 0 0.0 0 0 0 0 0 0.0 0 0 0 0
Kechi PD 3
2,013 7 22 10.9 0 0.0 0 0 0 0 22 10.9 4 18 0 0
Maize USD 266 Covered by Maize PD
Goddard USD 265 9
NA 12 11 N/A 0 N/A 0 0 0 0 11 N/A 0 11 0 1
Bentley PD 3 6
522 4 3 5.7 0 0.0 0 0 0 0 3 5.7 0 3 0 0
County Total 505,780 26,922 53.2 4,275 8.5 36 313 665 3,261 22,647 44.8 3,697 16,631 2,319 148
Seward County 08800
Sheriff 3
2,279 8 21 9.2 9 3.9 0 1 1 7 12 5.3 4 8 0 0
Liberal PD 9
20,785 12 373 17.9 49 2.4 3 11 7 28 324 15.6 76 237 11 3
County Total 23,064 394 17.1 58 2.5 3 12 8 35 336 14.6 80 245 11 3
Shawnee County 08900
Sheriff 48,337 12 1,072 22.2 77 1.6 0 5 3 69 995 20.6 192 698 105 0
Topeka PD 5
127,166 12 7,970 62.7 734 5.8 18 58 255 403 7,236 56.9 1,130 5,296 810 1
Rossville PD 1,134 11 6 5.3 0 0.0 0 0 0 0 6 5.3 0 5 1 0
Silver Lake PD Covered by Shawnee County SO
Topeka Airport Authority PD 3
NA 8 9 N/A 0 N/A 0 0 0 0 9 NA 1 4 4 0
Auburn PD 6
1,216 12 0 0.0 0 0.0 0 0 0 0 0 0.0 0 0 0 0
Page 23
Crime Index 2016
2016 Motor
Estimated Months Agg. Vehicle
Reporting Agency Population2
Reported Total Rate/1,000 Total Rate/1,000 Murder Rape Robbery Assault/Battery Total Rate/1,000 Burglary Theft Theft Arson7
Offenses Offenses Offenses
Crime Index Violent Crime Property Crime
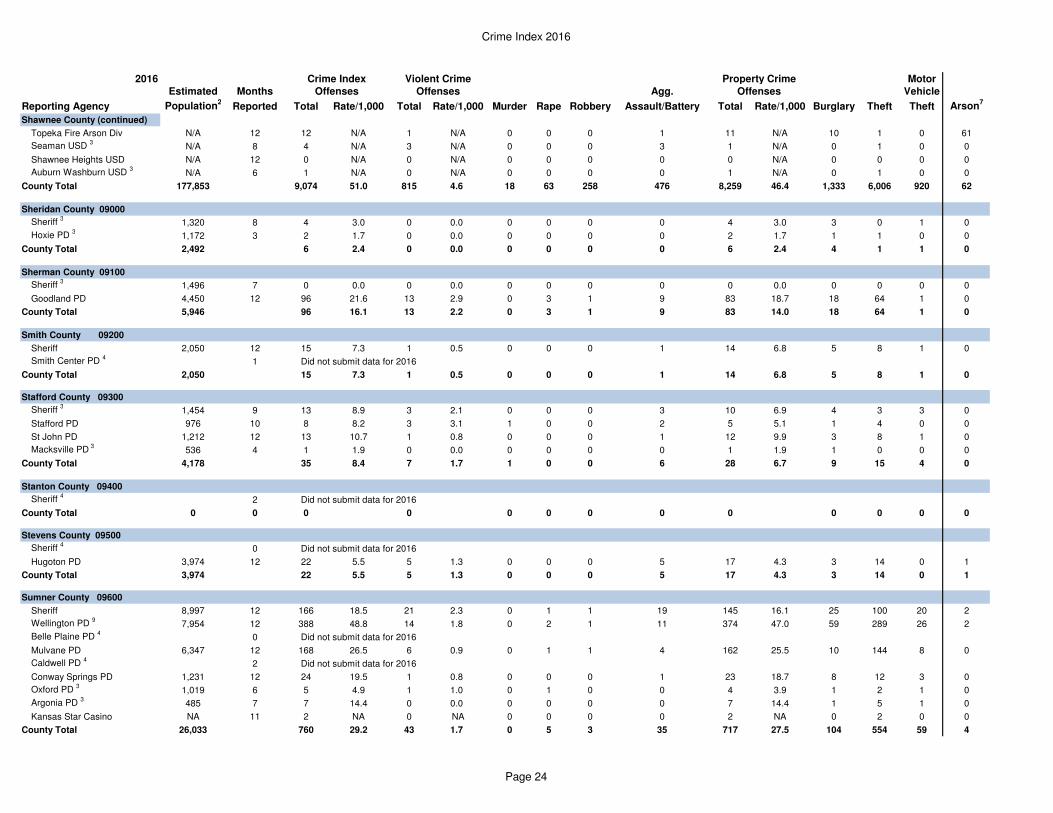
Shawnee County (continued)
Topeka Fire Arson Div N/A 12 12 N/A 1 N/A 0 0 0 1 11 N/A 10 1 0 61
Seaman USD 3
N/A 8 4 N/A 3 N/A 0 0 0 3 1 N/A 0 1 0 0
Shawnee Heights USD N/A 12 0 N/A 0 N/A 0 0 0 0 0 N/A 0 0 0 0
Auburn Washburn USD 3
N/A 6 1 N/A 0 N/A 0 0 0 0 1 N/A 0 1 0 0
County Total 177,853 9,074 51.0 815 4.6 18 63 258 476 8,259 46.4 1,333 6,006 920 62
Sheridan County 09000
Sheriff 3
1,320 8 4 3.0 0 0.0 0 0 0 0 4 3.0 3 0 1 0
Hoxie PD 3
1,172 3 2 1.7 0 0.0 0 0 0 0 2 1.7 1 1 0 0
County Total 2,492 6 2.4 0 0.0 0 0 0 0 6 2.4 4 1 1 0
Sherman County 09100
Sheriff 3
1,496 7 0 0.0 0 0.0 0 0 0 0 0 0.0 0 0 0 0
Goodland PD 4,450 12 96 21.6 13 2.9 0 3 1 9 83 18.7 18 64 1 0
County Total 5,946 96 16.1 13 2.2 0 3 1 9 83 14.0 18 64 1 0
Smith County 09200
Sheriff 2,050 12 15 7.3 1 0.5 0 0 0 1 14 6.8 5 8 1 0
Smith Center PD 4
1 Did not submit data for 2016
County Total 2,050 15 7.3 1 0.5 0 0 0 1 14 6.8 5 8 1 0
Stafford County 09300
Sheriff 3
1,454 9 13 8.9 3 2.1 0 0 0 3 10 6.9 4 3 3 0
Stafford PD 976 10 8 8.2 3 3.1 1 0 0 2 5 5.1 1 4 0 0
St John PD 1,212 12 13 10.7 1 0.8 0 0 0 1 12 9.9 3 8 1 0
Macksville PD 3
536 4 1 1.9 0 0.0 0 0 0 0 1 1.9 1 0 0 0
County Total 4,178 35 8.4 7 1.7 1 0 0 6 28 6.7 9 15 4 0
Stanton County 09400
Sheriff 4
2 Did not submit data for 2016
County Total 0 0 0 0 0 0 0 0 0 0 0 0 0
Stevens County 09500
Sheriff 4
0 Did not submit data for 2016
Hugoton PD 3,974 12 22 5.5 5 1.3 0 0 0 5 17 4.3 3 14 0 1
County Total 3,974 22 5.5 5 1.3 0 0 0 5 17 4.3 3 14 0 1
Sumner County 09600
Sheriff 8,997 12 166 18.5 21 2.3 0 1 1 19 145 16.1 25 100 20 2
Wellington PD 9
7,954 12 388 48.8 14 1.8 0 2 1 11 374 47.0 59 289 26 2
Belle Plaine PD 4
0 Did not submit data for 2016
Mulvane PD 6,347 12 168 26.5 6 0.9 0 1 1 4 162 25.5 10 144 8 0
Caldwell PD 4
2 Did not submit data for 2016
Conway Springs PD 1,231 12 24 19.5 1 0.8 0 0 0 1 23 18.7 8 12 3 0
Oxford PD 3
1,019 6 5 4.9 1 1.0 0 1 0 0 4 3.9 1 2 1 0
Argonia PD 3
485 7 7 14.4 0 0.0 0 0 0 0 7 14.4 1 5 1 0
Kansas Star Casino NA 11 2 NA 0 NA 0 0 0 0 2 NA 0 2 0 0
County Total 26,033 760 29.2 43 1.7 0 5 3 35 717 27.5 104 554 59 4
Page 24
Crime Index 2016
2016 Motor
Estimated Months Agg. Vehicle
Reporting Agency Population2
Reported Total Rate/1,000 Total Rate/1,000 Murder Rape Robbery Assault/Battery Total Rate/1,000 Burglary Theft Theft Arson7
Offenses Offenses Offenses
Crime Index Violent Crime Property Crime
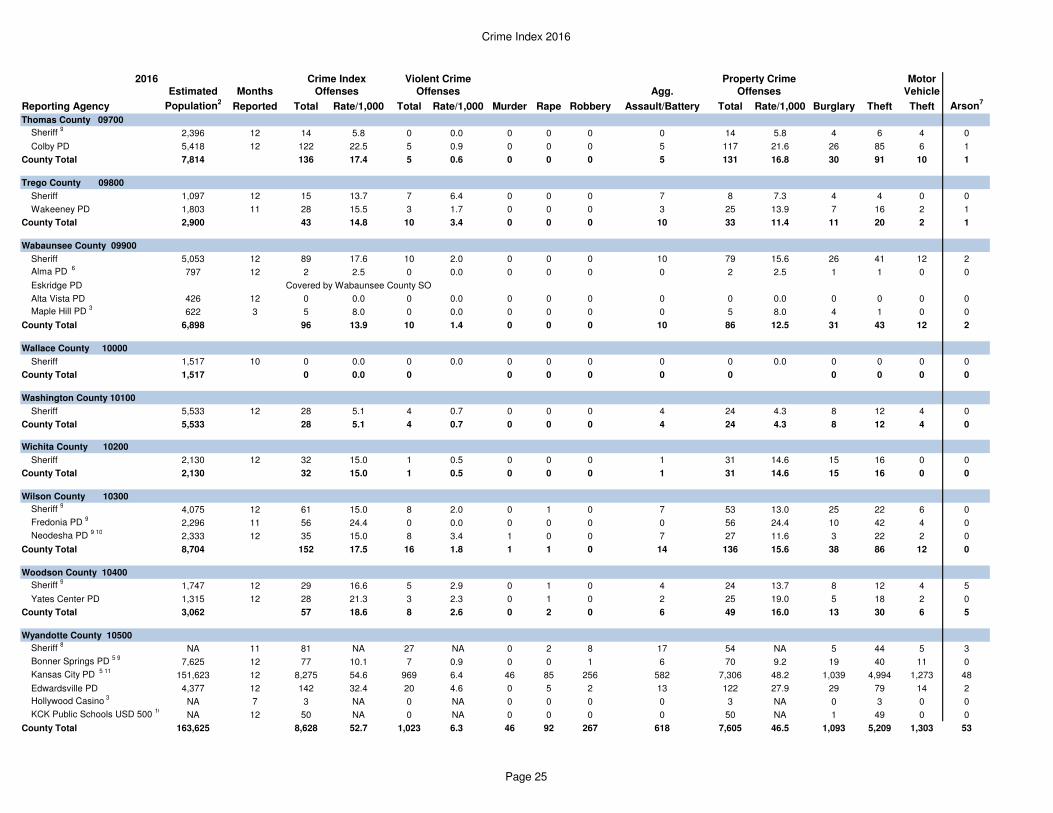
Thomas County 09700
Sheriff 9
2,396 12 14 5.8 0 0.0 0 0 0 0 14 5.8 4 6 4 0
Colby PD 5,418 12 122 22.5 5 0.9 0 0 0 5 117 21.6 26 85 6 1
County Total 7,814 136 17.4 5 0.6 0 0 0 5 131 16.8 30 91 10 1
Trego County 09800
Sheriff 1,097 12 15 13.7 7 6.4 0 0 0 7 8 7.3 4 4 0 0
Wakeeney PD 1,803 11 28 15.5 3 1.7 0 0 0 3 25 13.9 7 16 2 1
County Total 2,900 43 14.8 10 3.4 0 0 0 10 33 11.4 11 20 2 1
Wabaunsee County 09900
Sheriff 5,053 12 89 17.6 10 2.0 0 0 0 10 79 15.6 26 41 12 2
Alma PD 6
797 12 2 2.5 0 0.0 0 0 0 0 2 2.5 1 1 0 0
Eskridge PD Covered by Wabaunsee County SO
Alta Vista PD 426 12 0 0.0 0 0.0 0 0 0 0 0 0.0 0 0 0 0
Maple Hill PD 3
622 3 5 8.0 0 0.0 0 0 0 0 5 8.0 4 1 0 0
County Total 6,898 96 13.9 10 1.4 0 0 0 10 86 12.5 31 43 12 2
Wallace County 10000
Sheriff 1,517 10 0 0.0 0 0.0 0 0 0 0 0 0.0 0 0 0 0
County Total 1,517 0 0.0 0 0 0 0 0 0 0 0 0 0
Washington County 10100
Sheriff 5,533 12 28 5.1 4 0.7 0 0 0 4 24 4.3 8 12 4 0
County Total 5,533 28 5.1 4 0.7 0 0 0 4 24 4.3 8 12 4 0
Wichita County 10200
Sheriff 2,130 12 32 15.0 1 0.5 0 0 0 1 31 14.6 15 16 0 0
County Total 2,130 32 15.0 1 0.5 0 0 0 1 31 14.6 15 16 0 0
Wilson County 10300
Sheriff 9
4,075 12 61 15.0 8 2.0 0 1 0 7 53 13.0 25 22 6 0
Fredonia PD 9
2,296 11 56 24.4 0 0.0 0 0 0 0 56 24.4 10 42 4 0
Neodesha PD 9 10
2,333 12 35 15.0 8 3.4 1 0 0 7 27 11.6 3 22 2 0
County Total 8,704 152 17.5 16 1.8 1 1 0 14 136 15.6 38 86 12 0
Woodson County 10400
Sheriff 9
1,747 12 29 16.6 5 2.9 0 1 0 4 24 13.7 8 12 4 5
Yates Center PD 1,315 12 28 21.3 3 2.3 0 1 0 2 25 19.0 5 18 2 0
County Total 3,062 57 18.6 8 2.6 0 2 0 6 49 16.0 13 30 6 5
Wyandotte County 10500
Sheriff 8
NA 11 81 NA 27 NA 0 2 8 17 54 NA 5 44 5 3
Bonner Springs PD 5 9
7,625 12 77 10.1 7 0.9 0 0 1 6 70 9.2 19 40 11 0
Kansas City PD 5 11
151,623 12 8,275 54.6 969 6.4 46 85 256 582 7,306 48.2 1,039 4,994 1,273 48
Edwardsville PD 4,377 12 142 32.4 20 4.6 0 5 2 13 122 27.9 29 79 14 2
Hollywood Casino 3
NA 7 3 NA 0 NA 0 0 0 0 3 NA 0 3 0 0
KCK Public Schools USD 500 10
NA 12 50 NA 0 NA 0 0 0 0 50 NA 1 49 0 0
County Total 163,625 8,628 52.7 1,023 6.3 46 92 267 618 7,605 46.5 1,093 5,209 1,303 53
Page 25
Crime Index 2016
2016 Motor
Estimated Months Agg. Vehicle
Reporting Agency Population2
Reported Total Rate/1,000 Total Rate/1,000 Murder Rape Robbery Assault/Battery Total Rate/1,000 Burglary Theft Theft Arson7
Offenses Offenses Offenses
Crime Index Violent Crime Property Crime
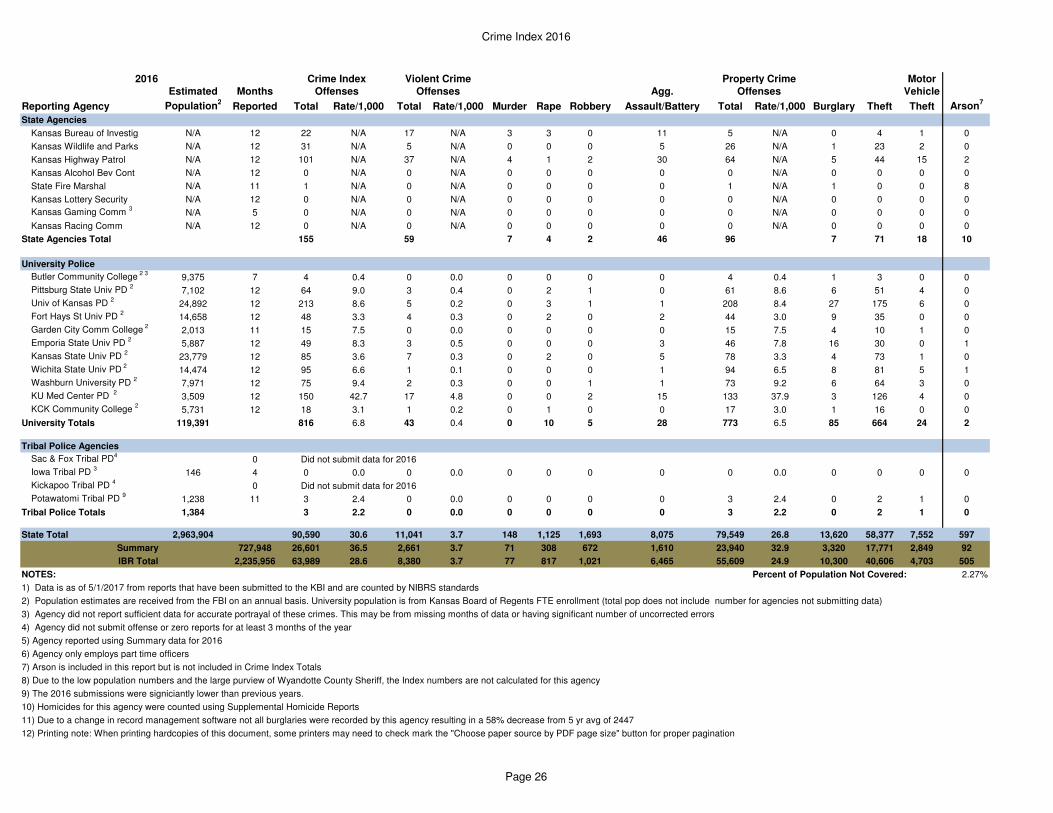
State Agencies
Kansas Bureau of Investig N/A 12 22 N/A 17 N/A 3 3 0 11 5 N/A 0 4 1 0
Kansas Wildlife and Parks N/A 12 31 N/A 5 N/A 0 0 0 5 26 N/A 1 23 2 0
Kansas Highway Patrol N/A 12 101 N/A 37 N/A 4 1 2 30 64 N/A 5 44 15 2
Kansas Alcohol Bev Cont N/A 12 0 N/A 0 N/A 0 0 0 0 0 N/A 0 0 0 0
State Fire Marshal N/A 11 1 N/A 0 N/A 0 0 0 0 1 N/A 1 0 0 8
Kansas Lottery Security N/A 12 0 N/A 0 N/A 0 0 0 0 0 N/A 0 0 0 0
Kansas Gaming Comm 3
N/A 5 0 N/A 0 N/A 0 0 0 0 0 N/A 0 0 0 0
Kansas Racing Comm N/A 12 0 N/A 0 N/A 0 0 0 0 0 N/A 0 0 0 0
State Agencies Total 155 59 7 4 2 46 96 7 71 18 10
University Police
Butler Community College 2 3
9,375 7 4 0.4 0 0.0 0 0 0 0 4 0.4 1 3 0 0
Pittsburg State Univ PD 2
7,102 12 64 9.0 3 0.4 0 2 1 0 61 8.6 6 51 4 0
Univ of Kansas PD 2
24,892 12 213 8.6 5 0.2 0 3 1 1 208 8.4 27 175 6 0
Fort Hays St Univ PD 2
14,658 12 48 3.3 4 0.3 0 2 0 2 44 3.0 9 35 0 0
Garden City Comm College 2
2,013 11 15 7.5 0 0.0 0 0 0 0 15 7.5 4 10 1 0
Emporia State Univ PD 2
5,887 12 49 8.3 3 0.5 0 0 0 3 46 7.8 16 30 0 1
Kansas State Univ PD 2
23,779 12 85 3.6 7 0.3 0 2 0 5 78 3.3 4 73 1 0
Wichita State Univ PD 2
14,474 12 95 6.6 1 0.1 0 0 0 1 94 6.5 8 81 5 1
Washburn University PD 2
7,971 12 75 9.4 2 0.3 0 0 1 1 73 9.2 6 64 3 0
KU Med Center PD 2
3,509 12 150 42.7 17 4.8 0 0 2 15 133 37.9 3 126 4 0
KCK Community College 2
5,731 12 18 3.1 1 0.2 0 1 0 0 17 3.0 1 16 0 0
University Totals 119,391 816 6.8 43 0.4 0 10 5 28 773 6.5 85 664 24 2
Tribal Police Agencies
Sac & Fox Tribal PD4
0 Did not submit data for 2016
Iowa Tribal PD 3
146 4 0 0.0 0 0.0 0 0 0 0 0 0.0 0 0 0 0
Kickapoo Tribal PD 4
0 Did not submit data for 2016
Potawatomi Tribal PD 9
1,238 11 3 2.4 0 0.0 0 0 0 0 3 2.4 0 2 1 0
Tribal Police Totals 1,384 3 2.2 0 0.0 0 0 0 0 3 2.2 0 2 1 0
State Total 2,963,904 90,590 30.6 11,041 3.7 148 1,125 1,693 8,075 79,549 26.8 13,620 58,377 7,552 597
Summary 727,948 26,601 36.5 2,661 3.7 71 308 672 1,610 23,940 32.9 3,320 17,771 2,849 92
IBR Total 2,235,956 63,989 28.6 8,380 3.7 77 817 1,021 6,465 55,609 24.9 10,300 40,606 4,703 505
NOTES: Percent of Population Not Covered: 2.27%
1) Data is as of 5/1/2017 from reports that have been submitted to the KBI and are counted by NIBRS standards
2) Population estimates are received from the FBI on an annual basis. University population is from Kansas Board of Regents FTE enrollment (total pop does not include number for agencies not submitting data)
3) Agency did not report sufficient data for accurate portrayal of these crimes. This may be from missing months of data or having significant number of uncorrected errors
4) Agency did not submit offense or zero reports for at least 3 months of the year
5) Agency reported using Summary data for 2016
6) Agency only employs part time officers
7) Arson is included in this report but is not included in Crime Index Totals
8) Due to the low population numbers and the large purview of Wyandotte County Sheriff, the Index numbers are not calculated for this agency
9) The 2016 submissions were signiciantly lower than previous years.
10) Homicides for this agency were counted using Supplemental Homicide Reports
11) Due to a change in record management software not all burglaries were recorded by this agency resulting in a 58% decrease from 5 yr avg of 2447
12) Printing note: When printing hardcopies of this document, some printers may need to check mark the "Choose paper source by PDF page size" button for proper pagination
Page 26