Embed Size (px)
Citation preview

2016 DrillboticsPhase 1 – Design Competition
Colorado School of MinesJade Gearhart, Patrick Ogilvie, Daniel Lamas, Zach Cosper and Reed Baker
To watch HD video presentation go to: https://youtu.be/s0bMNN7hekY

Outline:
Abstract
Design Notes
Key Features
Control System Architecture
Data Handling and Display
Specifications of Sensors and Instrumentation
Cost Estimate and Funding Plan
Engineering Drawings

Abstract
Drillbotics 2015-2016 competition phase 1, Colorado School of Mines design submittal
Objectives/scope: The drillbotics competition has provided a goal to design and build anautomated drilling rig that will safely and quickly drill through a material. All while recordingdrilling parameters continuously during the process. There are a variety of design constraintsassociated with the competition, along with current inefficacies in industry.
Methods Procedures, Processes: During the design phase, much research was needed to be doneon drilling and automation. After the foundation was established, the team created an overalldesign for the automated drilling rig. The specific components were divided among the group,including the, sensors, the drilling algorithm, each of the subsystems, calculations and thecreation of the design model.
Results, Observations, Conclusions: The design for this year’s competition incorporates amodular design with connecting bolts to the wooden table top, along with wheels allows for longdistance and short distance mobility. Using a pneumatic hoisting system allows for a controlledand continuous applied force on bit, with quick reaction times. A closed loop circulation systemusing mineral oil is similar to real world rig designs, cleaning the hole and lubricating the bit.Using a variety of sensors to measure weight on bit, rate of penetration, speed, torque, blockheight, vibration frequency and inclination, as input parameters will allow the automated drill tobe able to follow a drilling algorithm to effectively drill through the material safe, quick, andstraight.
Presented is a full design for a micro automated drilling rig, accommodating the competitionregulations.

Design Notes
Time dedication and Faculty/Staff involvementHaving this project as the senior design project gives two, three hour scheduled time to workeach week. We also have the assistance of a few faculty members. We have weekly meetingswith our faculty advisor, in the mechanical engineering department. One of our consultants onthe project is a teacher in the Petroleum Engineering Department at Mines. We’ve met with ahandful of times throughout the semester. Another consultant is a teacher in the mechanicalengineering department. We have met with him three times in the first semester.
Design DecisionsUsing pros and cons lists lead to a decision of which type of system to use. The following tablesrepresent these lists, the asterisks indicate the type of system or sensor that was ultimately chosenfor the automated drill.
Hoisting SystemType Pros Cons
Hydraulics Increased control Fluid motion
Cost of all necessary parts Complexity
Gear and Chain Simple Cost the least
Less fluid motion depending ongear size
Pneumatics* Allows applied continuous force Good reaction time
Cost of all the components
Circulation SystemType Pros Cons
Water Cost efficient Easily accessible
Not the most efficient lubricant
Mineral water* Cost efficient too -if donated Different viscosities available More efficient at cleaning down
hole
May have a limited amount tocycle through the system
Need a component to clean thefluid
Air No need to clean the air Need a component to compressair
SensorsType Pros Cons
Rotary EcoderFor:Speed/DepthTracking
Record the angular position of theshaft and relate it to position orspeed
Must be integrated into thephysical system so that when thedrill string is rotating, the shaftof the encoder is too
Direction is unknown
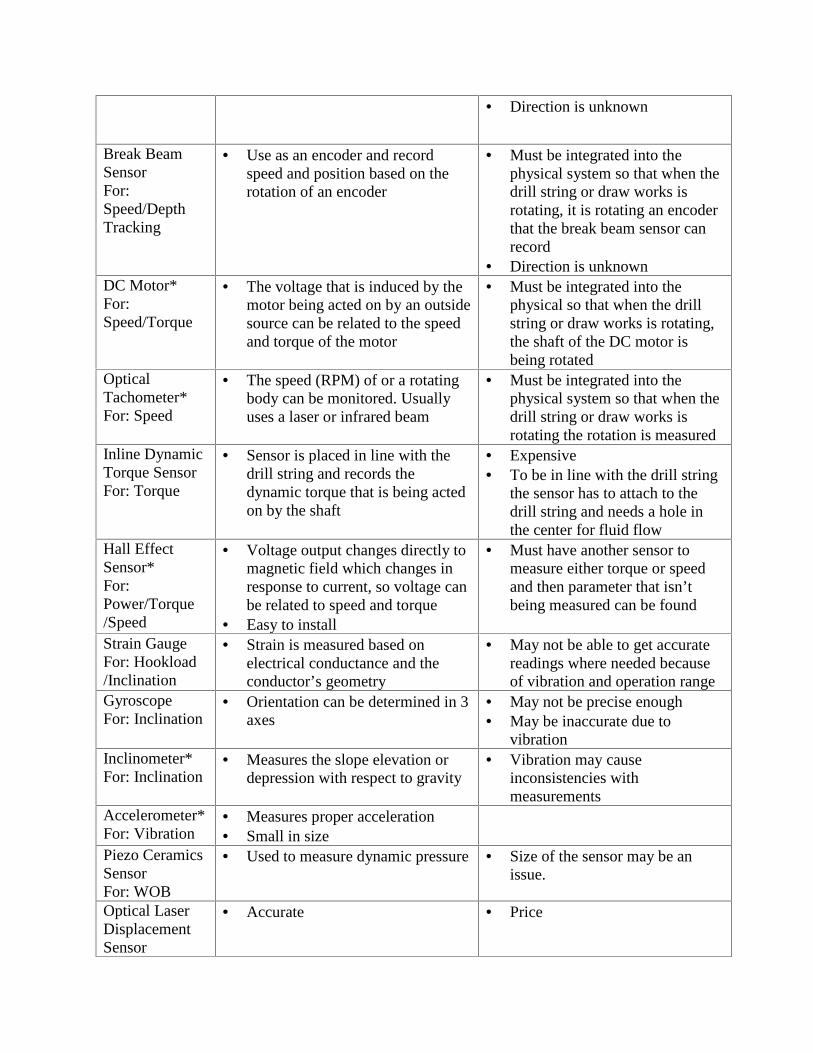
Break BeamSensorFor:Speed/DepthTracking
Use as an encoder and recordspeed and position based on therotation of an encoder
Must be integrated into thephysical system so that when thedrill string or draw works isrotating, it is rotating an encoderthat the break beam sensor canrecord
Direction is unknownDC Motor*For:Speed/Torque
The voltage that is induced by themotor being acted on by an outsidesource can be related to the speedand torque of the motor
Must be integrated into thephysical so that when the drillstring or draw works is rotating,the shaft of the DC motor isbeing rotated
OpticalTachometer*For: Speed
The speed (RPM) of or a rotatingbody can be monitored. Usuallyuses a laser or infrared beam
Must be integrated into thephysical system so that when thedrill string or draw works isrotating the rotation is measured
Inline DynamicTorque SensorFor: Torque
Sensor is placed in line with thedrill string and records thedynamic torque that is being actedon by the shaft
Expensive To be in line with the drill string
the sensor has to attach to thedrill string and needs a hole inthe center for fluid flow
Hall EffectSensor*For:Power/Torque/Speed
Voltage output changes directly tomagnetic field which changes inresponse to current, so voltage canbe related to speed and torque
Easy to install
Must have another sensor tomeasure either torque or speedand then parameter that isn’tbeing measured can be found
Strain GaugeFor: Hookload/Inclination
Strain is measured based onelectrical conductance and theconductor’s geometry
May not be able to get accuratereadings where needed becauseof vibration and operation range
GyroscopeFor: Inclination
Orientation can be determined in 3axes
May not be precise enough May be inaccurate due to
vibrationInclinometer*For: Inclination
Measures the slope elevation ordepression with respect to gravity
Vibration may causeinconsistencies withmeasurements
Accelerometer*For: Vibration
Measures proper acceleration Small in size
Piezo CeramicsSensorFor: WOB
Used to measure dynamic pressure Size of the sensor may be anissue.
Optical LaserDisplacementSensor
Accurate Price

For: Depth
Data AcquisitionType Pros Cons
Arduino Less expensive Have to configure for LabVIEWNationalInstruments
Run LabVIEW from start More expensive
Zigbee*(Sparkfun XBee)
Wireless communication Size
Need some sort of power source.(Battery)
Risk mitigationOne of the main points of risk that we may encounter is when we start to build our design. Goingfrom the design model to the real machine causes several problems. For instance, we may thinkthat using one method will give us some result, but in real life it doesn’t so we would have toredesign that part. Therefore, we decided that in order to mitigate the potential for redesign, weadded a redesign section of the work breakdown structure called iteration. We have accountedfor other areas of risk that may become more apparent during the construction but cannot bepredicted now, by adding more time than we think necessary for several areas of high risk, suchas the communication between sensor and instrument panel giving that 5 days, but allowing timefor testing so that it may take more time to complete.
Projected contruction timline:Each sub task is assigned to a member of theteam. Obtaining all parts includes thematerials in the cost table . These materialsmay be ordered directly from themanufacturer, built in house, or sent to bemachined. For example the swivle may needto be cusom made. This process may takequite some time, so it is the first task. Theautomation is seperated from the rig intitallyfor time efficency as some the sensor partsmay be easier acessable, the contruction ofmay be quicker. Testing the automated rig iskey to success during judging.Having thesytem built in time to give us the oppurtunityto have at least three weeks of testing anditterating is a major goal.
Figure 1 Construction timeline

Key Features
1. Our rig is attached to a table and has a modular allowing us to detach it for long distancetransportation. The table has wheels at the end of each leg allowing us to wheel it fromlocation to location and is small enough to fit through typical doorways. Mobility is agoal for the rig because it will enable the automated rig to be able to possibly be used foreducational purposes, similar to the Colorado School of Mines micro drilling rig used asa teaching aid for petroleum students.
2. Our Hoisting system utilizes pneumatics to push and pull on the drill bit. It also allows usto monitor the WOB, apply continuous force, and have millisecond reaction times.
3. We have a closed loop circulating system utilizing the better viscosity and cuttingtransport of mineral oil to lubricate the bit and clean the hole.
4. We are using a top drive rotary system to turn the bit. The 1/6 HP gear motor uses avariable frequency drive to optimize the rotating speed and the torque of the bit.
5. Near the drill bit we are using several sensors to monitor the parameters of the drillingsystem providing an accurate and continuous measurement of weight-on-bit (WOB),vibration, inclination, torque, and block height.
6. Those parameters are then relayed to our data acquisition system, along with our data, tomonitor and present real time data using LabVIEW.
Figure 2 Gantt Diagram of Construction timeline

Control System Architecture
The drilling algorithm will be coded in LabVIEW, and will contain a multitude of inputparameters to provide greater flexibility of the system without modification to the underlyingalgorithm. These input parameters will be entered prior to the start of the drilling process andwill be tweaked through testing and systematic trial and error.
The automated drilling algorithm will begin with an initial “new hole” process designed to drill apredetermined distance to provide bit stability before initializing The Drill Off Test (DOT)process. Before describing the DOT, let’s first review 3 parallel processes running in thebackground that will intervene and control outputs in certain situations.
The critical limit process will prevent failures by shutting the rotary motor and quickly pickingup off bottom. The process will reference a table of predetermined Maximums for a variety ofvariables. We believe Torque will be the controlling factor in this system.
The second background process will be the Data Quality Assurance process. Where possible wehave added redundancy in measuring specific parameters, and this will process the signaloutputs, compare to corresponding data and predetermined acceptable value range, identifyfaulty data readings and adjust or substitute variables so the automated drilling does not halt inthe event of one sensor failure.
The third background process will analyze the table containing real-time drilling data andidentify specific drilling dysfunctions based on trends and patterns. This process will alsointervene to adjust set-point parameters as needed in attempt to mitigate the inefficiency.
And finally we have the Drill Off Test, the heart of the optimization process. The DOT isdesigned similar to an active drill off test used in the field today. Prior to drilling, we will createan array of different operating parameters specified period of time, and the average performanceinformation exported to a table. The test will continue until a critical limit is reached or itcompletes all given scenarios, at which point it will sort the ROP in Table X in descending order,and export the parameters to an array that dictates the set points. The rig will drill ahead at thisset point until 1) ROP changes by X %, at which point it will restart the DOT process, 2) acritical limit is reached prompting new set point parameters, or 3) it is time to make a connectionand add a new joint of pipe.
See figure 30 for a visual reference of the drilling algorithm.

Data Handling and Display
Using a LabVIEW set up like the one shown below [Figure 3] on a computer monitor, all sensoroutput will be clearly displaced to the user. Torque, Vibrational Frequency, RPM, Weight-on-but(WOB) and Block height will all be displayed on graphs and indicators, and degree ofinculcation will be displayed on a gauge and block height will be displayed on a slider. Figures2-6 are wiring diagrams to show how the sensors will connect with the Data acquisition center,feeding into the LabVIEW program.
Figure 3 Lab View display screen
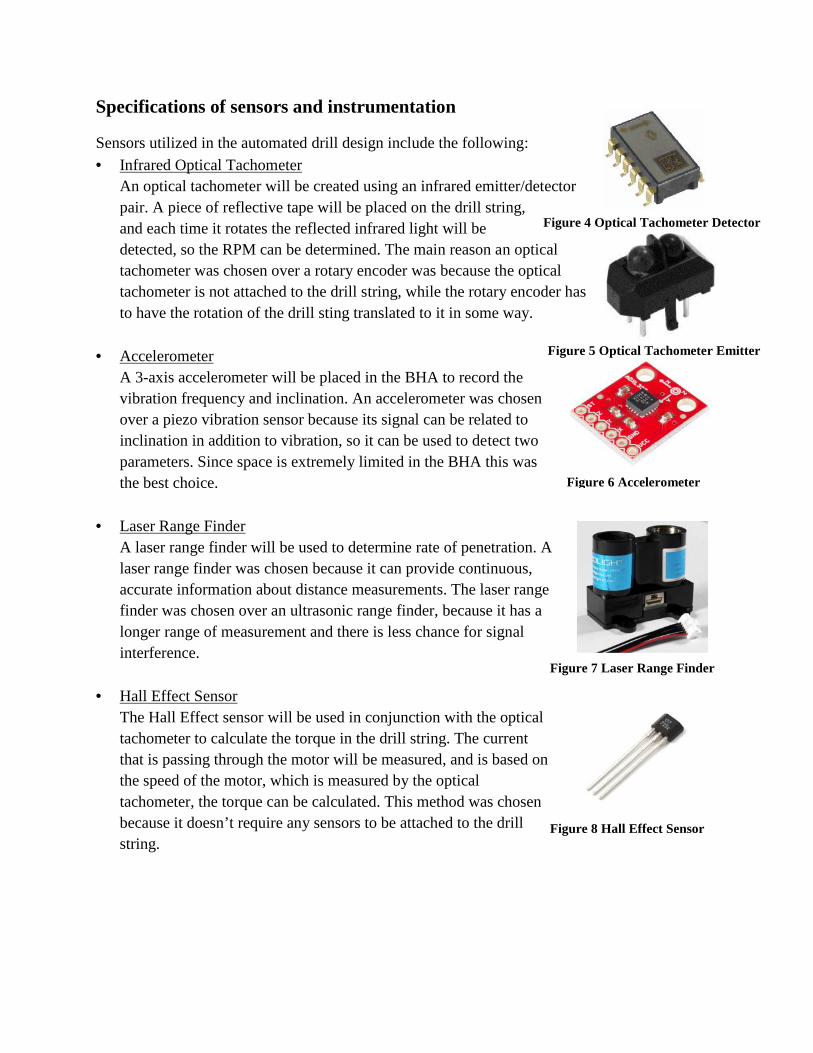
Specifications of sensors and instrumentation
Sensors utilized in the automated drill design include the following: Infrared Optical Tachometer
An optical tachometer will be created using an infrared emitter/detectorpair. A piece of reflective tape will be placed on the drill string,and each time it rotates the reflected infrared light will bedetected, so the RPM can be determined. The main reason an opticaltachometer was chosen over a rotary encoder was because the opticaltachometer is not attached to the drill string, while the rotary encoder hasto have the rotation of the drill sting translated to it in some way.
AccelerometerA 3-axis accelerometer will be placed in the BHA to record thevibration frequency and inclination. An accelerometer was chosenover a piezo vibration sensor because its signal can be related toinclination in addition to vibration, so it can be used to detect twoparameters. Since space is extremely limited in the BHA this wasthe best choice.
Laser Range FinderA laser range finder will be used to determine rate of penetration. Alaser range finder was chosen because it can provide continuous,accurate information about distance measurements. The laser rangefinder was chosen over an ultrasonic range finder, because it has alonger range of measurement and there is less chance for signalinterference.
Hall Effect SensorThe Hall Effect sensor will be used in conjunction with the opticaltachometer to calculate the torque in the drill string. The currentthat is passing through the motor will be measured, and is based onthe speed of the motor, which is measured by the opticaltachometer, the torque can be calculated. This method was chosenbecause it doesn’t require any sensors to be attached to the drillstring.
Figure 4 Optical Tachometer Detector
Figure 5 Optical Tachometer Emitter
Figure 6 Accelerometer
Figure 7 Laser Range Finder
Figure 8 Hall Effect Sensor

Load CellA load cell will be used to determine weight on bit. A load cell waschosen, because the weight on bit can accurately be determinedwith very little signal manipulation. Also, the load can bedetermined in both tension and compression.
XbeeTwo Xbee modules will be used to communicate downholeinformation about the vibration frequency and inclination to thesurface. The Xbee module was chosen because it is a low powerconsumption, reliable way to transmit data anddoes so at a maximum frequency of 2.4 GHz.Also, the size of the module and the potential touse the drill string as an antenna were factors inthe choice of the Xbee.
Gear Motor:Part number: GM3349Description: .2/.25HP, 1400RPM, 3PH, 50/60HZ,K-1, 2524M AC right angle motor
Weight: 16lbFrequency: 50-60HzGear ratio: 5:1Output speed: 279-340rpmOutput torque: 36 in-lbSpeed: 1700-1400rpmVoltage: 230V
Variable Frequency Drive:Part number: GS1-10P2
Pneumatic System:
ActuatorPart number SR-3136-D2” Bore3 ft. strokeDouble acting
Figure 11 Gear Motor
Figure 12 Variable Frequency Drive
Figure 13 Actuator
Figure 9 Load Cell
Figure 10 Xbee modules

Air compressorCampbell Hausfeld 1-Gallon Pancake Air Compressor w/Inflation KitPart number: FP202825ft recoil hose1 gallon capacity.39 CFM @ 90psi, .51CFM @ 40psiMax psi = 90Input Voltage = 120 V AC<1 HP
Electro-Pneumatic RegulatorPart number: ITV1000/2000/3000Controls air pressure in proportion to an electric signal.Available in MPa, kgf/cm², bar, PSI, and kPa units.Pressure range of 0.005 to 0.9MPa.Available port sizes 1/4 and 3/8.
Circulation System Hypro Roller Pump
Part number: 4001C (4001C-A)150 psi and 6.7 gpm with a 1.1HP motor at 1800 RPMMax. Fluid temperature: 140°F/60°CHousing: Cast Iron (C)Rollers: Super Rollers standard [Poly (T3) and Teflon® (T2)]Shaft Seals: Viton standardWeight: 5 lbs./2.3 kg Motor Attachment
L3510 motor from Baldor1HP, 1725RPM, 1PH
Figure 16 Hypro Roller Pump
Figure 14 Air Compressor
Figure 15 Electro-Pneumatic Regulator
Figure 17 Motor for pump

Cost estimate and funding plan
Item Part number/ specification CostMotor GM 3349 848.00Variable Frequency Drive GS1-10P2 99.00Actuator SR-3136-D 187.00Air compressor FP2028 78.00Pneumatic Regulator ITV1000/2000/3000 300.00Electro-pneumatic DirectionalControl Valves
TBD ~300.00
Hypro Roller Pump 4001C (4001C-A) 117.15Motor for Hypro Pump L3510 motor from Baldor 541.00Inclinometer 551-1000-1-ND (DigiKey)
SCA103T-DO4-1 (Manufacturer)63.62
IR emitter/ Phototransistor 551-1000-1-ND (DigiKey)SCA103T-DO4-1 (Manufacturer)
1.26
Hall Effect Sensor 751-1034-5-ND (DigiKey)TCRT5000L (Manufacturer)
.95
Accelerometer COM-09312 (Sparkfun)US1881 (Manufacturer)
17.95
Instrumentation Amplifier 595-INA125P (Mouser)INA125P (Manufacturer)
6.12
Load Cell SEN-09269 (Sparkfun)ADXL335 (Manufacturer)
56.95
Laser Rangefinder SEN-13332 ROHS (Sparkfun)TAS606 (Manufacturer)
114.89
Xbee wire Antenna -Series 1 RB-pli-03 (Manufacturer)WRL-08665 ROHS (Sparkfun)
24.95
Xbee Explorer USB 802.15.4 (Manufacturer)WRL-11812 ROHS (Sparkfun)
24.95
DAQ NI USB-6341 1209.00Arduino Pro Mini DEV-11113 ROHS 9.95FTDI Breakout DEV-09716 ROHS 14.95Mini USB Cable CAB-11301 ROHS 3.95Hookup Wire (100 ft) 581148 9.47Solder TBD 5.70Prototype Board (5 pack) 53571 7.99Reflective Tape ¼-5-3430 3.49Jumper Wire TBD 9.99Polymer Lithium Ion Battery PRT-00731 ROHS 6.95LiPo Charger PRT-10217 ROHS 7.95Resistor (10k Ohm) COM-08374 ROHS 0.25Resistor (1k Ohm) COM-08980 ROHS 0.25Resistor (150 Ohm) TBD 0.25Steel 3x3x3/8 square tube- 4 ft. x4legs 324.96

Plywood table top 15/32” x 4’x8’ 16.05Wheels 203661087 Homedepot x4 55.88Computer TBD ~400Mineral Oil $100/5 gallons 100Paint Indoor/outdoor 50Team t-shirts TBD 250Hoses TBD 50Swivel Custom Made ~500Unexpected expenses TBD 2000
Total projected cost: $7,818.82
Funding PlanDonor AmountCSM College of Engineering and Computational Sciences $5000CSM College of Earth Resource Sciences and Engineering $5000Various Companies TBD if need be
Total projected funding: $10,000.00
Engineering Drawings1. Table top surface2. Top plate3. Table Leg4. Pipe Guide5. I-beam support6. String support7. Swivel8. Bottom hole assembly (BHA)9. Filter10. Fluid return11. Top drive motor
Figure 18Figure 19Figure 20Figure 21Figure 22Figure 23Figure 24Figure 25Figure 26Figure 27Figure 28 and Figure 29

Figure 18 Table Top Surface

Figure 19 Top Plate

Figure 20 Table Leg

Figure 21 Pipe Guide

Figure 22 I-Beam Support

Figure 23 String Support

Figure 24 Swivel

Figure 25 Bottom Hole Assembly (BHA)

Figure 26 Filter
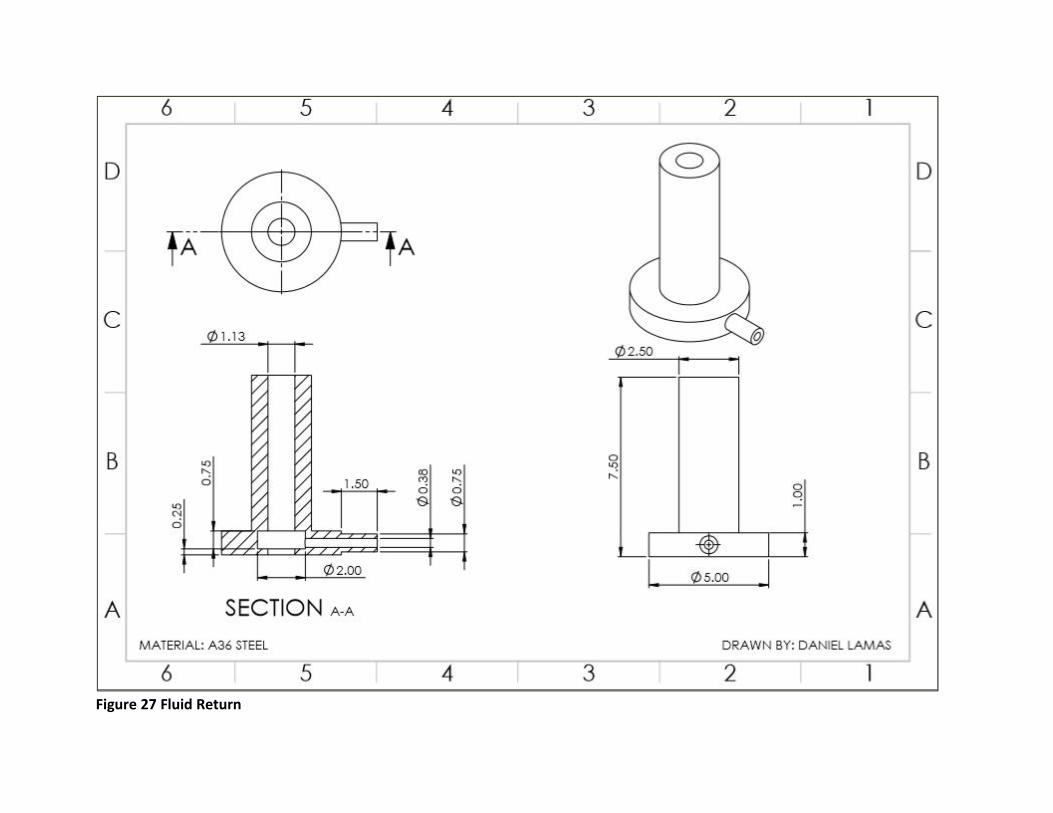
Figure 27 Fluid Return

Figure 28 Top Drive Motor

Figure 29 Top Drive Motor [Section View]

Figure 30 Drilling Algorithm

Figure 31 Load cell wiring diagram
Figure 32 Laser Range Finder Wiring Diagram

Figure 33 Optical Tachometer Wiring Diagram
Figure 34 Accelerometer Wiring Diagram

Figure 35 Hall Effect Sensor Wiring Diagram
References and Citations:Figure Website[4][5] Optical tachometer http://www.digikey.com/product-
search/en?keywords=opto%20trans%2015mm%20refl%20pcb[6]Accelerometer https://www.sparkfun.com/products/9836[7]Laser Rangefinder Laser http://www.robotshop.com/en/lidar-lite-2-laser-rangefinder-
pulsedlight.html#Supplier Product Code[8]Hall Effect Sensor https://www.sparkfun.com/products/9312[9]Load Cell https://www.sparkfun.com/products/1333Inclinometer http://www.digikey.com/product-search/en/sensors-
transducers/inclinometers/1966770[10] Xbee wire Antenna https://www.sparkfun.com/products/8665[10] Xbee Explorer USB https://www.sparkfun.com/products/11812[11] Gear Motor http://www.baldor.com/catalog/GM3349#tab=%22nameplate%22[12] Variable FrequencyDrive
http://www.automationdirect.com/static/specs/driveselection.pdf
[13] Actuator http://www.bimba.com/Products-and-Cad/Actuators/Inch/Round-Line/Non-Repairable/Original-Line-Cylinder/
[14] Air Compressor http://www.aircompressorsdirect.com/Campbell-Hausfeld-FP2028-Air-Compressor/p544.html
[15] Electro-pnumaticregulator
http://www.smcusa.com/top-navigation/cad-models.aspx/127735
[16] Hypro Pump http://www.sprayerdepot.com/Shop-by-Category/Roller-Pumps/4001C[17] Motor attachment http://www.baldor.com/catalog/L3510#tab=%22specs%22Pricing and pictures*