Embed Size (px)
Citation preview

PENNSYLVANIA
AND COUNTY
HEALTH
PROFILES
2016 Report
Pennsylvania Health Profile
Click the County or Commonwealth name to access the profile.
Elk
Tioga
York
Erie
Potter
Centre
Berks
Bradford
Butler
Lycoming
Bedford
Pike
Warren
Clinton
McKean
Clearfield
Somerset
Crawford
Indiana
Luzerne
Wayne
Blair
Fayette
Perry
Lancaster
Mercer
Bucks
ChesterFranklin
Clarion
Cambria
Monroe
Schuylkill
Greene
Venango
Huntingdon
Allegheny
Westmoreland
Adams
Washington
Jefferson
Fulton
Dauphin
Forest
Mifflin
Armstrong
Beaver
Susquehanna
Sullivan
Juniata
CarbonUnion
Columbia
Lehigh
Snyder
Cumberland
CameronWyoming
Lebanon
Lawrence
Montgomery
Lackawanna
NorthumberlandNorthampton
Delaware
Montour
Philadelphia

PennsylvaniaHealth Profile 2016
Demographic Data (2014)
% Population Change 2010 to 2014 0.7
Median Age of the Population (2010-2014) 40.4
% Population Aged 65 and Over 16.7
Population per Square Mile 285.8
% Population with Income Below Poverty Level (2010-2014) 13.5
Per Capita Personal Income $47,679
% Labor Force Unemployed - Annual Average 5.9
% Population Eligible for Medical Assistance 17.6
Estimated Population by Age and Sex (2014)
Age Total Male Female Age Total Male Female
All Ages 12,787,209
Under 5 715,084
5-14 1,507,711
15-24 1,704,507
25-34 1,640,158
6,253,817
365,552
770,624
867,591
829,259
6,533,392
349,532
737,087
836,916
810,899
35-44 1,512,781
45-54 1,804,769
55-64 1,767,678
65-74 1,152,669
75+ 981,852
753,551
889,285
859,653
537,315
380,987
759,230
915,484
908,025
615,354
600,865
Estimated Population by Race and Hispanic Origin (2014)
White 10,598,587 Black 1,484,746 Other Races 277,753 Hispanic (any race) 838,823
Natality and Reported Pregnancies^ (2014 Residents)
Crude Birth Rate11.1
Average Annual General58.4
% Low Birth Weight 8.3
% Prenatal Care in 1st Trimester 71.9
% Births to Mothers Under 18 1.5
7.2
76.6
1.0
13.3
57.2
3.1
Per 1,000 Population
Fertility Rate* (2012-2014)
All Races White Black
All Ages 174,100
Under 15 201
15-17 3,035
142,113
95
2,080
1,223
1
27
30,764
105
928
Age of WomanReported
PregnanciesLive
BirthsFetal
DeathsInduced
Abortions
Outcome
Age of WomanReported
PregnanciesLive
BirthsFetal
DeathsInduced
Abortions
Outcome
18-19 8,082
20-29 90,168
30 and Over 72,243
5,752
70,814
63,003
63
589
541
2,267
18,765
8,699
All Ages* 59.0
Under 15** 0.3
15-17 9.1
72.3
0.5
13.3
Age of Woman Birth Rate Reported Pregnancy Rate Age of Woman Birth Rate Reported Pregnancy Rate
18-19 31.7
20-29 83.8
30 and Over** 39.8
44.6
106.6
45.6
^Live births, fetal deaths of 16+ weeks gestation, and induced abortions performed in-state. Notes: All ages includes any unknown ages. All rates per 1,000.*All Ages includes female population ages 15-44. ** Under 15 includes female population ages 10-14; 30 and Over includes female population ages 30-49.
Hispanic
9.2
60.8
3.7
(of any race)
Asian/PI* 426,123
7.7
70.7
0.3
Asian / Pacific
General Notes: Crude and age-adjusted rates based on less than 10 events are considered statistically unreliable and are not displayed (ND), unless otherwise noted. Starting in 2013, race of resident was derived from multiple race selections. A person is Multi-Race if they identify as more than one race. Prior to 2013, race of resident was derived from a single race designation.
Morbidity (2012-2014 Residents)
Reported Incidence and Average Annual Rate (per 100,000) for Selected Notifiable Diseases (2012-2014)
HIV 4,039 10.5
Syphilis 1,496 3.9
Tuberculosis 657 1.7
Total Rate
Chlamydia 157,583 411.2
Giardiasis 2,135 5.6
Gonorrhea 41,974 109.5
Hepatitis: Type A 163 0.4
Total Rate
Lyme Disease 18,424 48.1
Salmonellosis 4,786 12.5
Total Rate
Campylobacteriosis 4,397 11.5 Hep. B* Acute 179 0.5
Shigellosis 483 1.3
*Hepatitis: Type B **Meningococcal Disease
Meningococcal** 63 0.2
Pertussis 3,391 8.8
Hep. B* Chronic 5,394 14.1
Chickenpox 2,480 6.5
Islander
Multi-Race 233,611
*Asian/Pacific Islander
Note: Communicable diseases with demographic counts of 1 to 4 are displayed as "< 5" to avoid potential identification of cases within certain geographic areas.
Multi - Race
9.6
62.3
4.3

Pennsylvania PAGE 2
Mortality (2014 Residents)
Selected Major Causes of Death, Number and Average Annual Age-Adjusted Death Rate* (2012-2014)
Number of Resident Deaths 127,773
Crude Death Rate per 1,000 10.0
Age-Adjusted Death Rate per 1,000 7.5
Number of Infant Deaths (< 1 Year of Age) 850 452 259 104
AllRaces BlackWhite
Hispanic(any race)
Infant Mortality Rate per 1,000 Live Births 6.0 4.5 13.2 7.2
Average Annual Infant Mortality Rate (2012-2014) 6.6 4.9 13.7 7.6
Cause Total Rate
Diseases of Heart 93,238
Cancer 85,603
Stroke 19,547
C.L.R.D.** 19,590
Accidents 18,996
176.1
170.9
36.8
38.1
44.7
Cause Total Rate
Influenza/Pneumonia 7,691
Diabetes Mellitus 11,250
Septicemia 6,509
Nephritis/Nephrosis 8,270
Alzheimer's Disease 10,212
14.4
22.2
12.8
15.7
18.1
* Per 100,000 2000 U.S. standardmillion population. Age-adjusted rates
** Chronic Lower Respiratory Disease
Selected Leading Causes of Death, Number by Age Group (2014)
Under 5 Years of Age 5-24 Years of Age 25-44 Years of Age 45-64 Years of Age 65 Years and Older
Perinatal Conditions 487
Birth Defects 142
Accidents 55
Assault (Homicide) 19
Accidents 618
Assault (Homicide) 187
Suicide 186
Cancer 96
Diseases of Heart 40
Accidents 1,638
Cancer 567
Suicide 495
Diseases of Heart 467
Assault (Homicide) 275
Cancer 7,122
Diseases of Heart 4,471
Accidents 1,750
Suicide 797
Diabetes Mellitus 784
Diseases of Heart 26,183
Cancer 20,758
Stroke 5,739
C.L.R.D.** 5,607
Alzheimer's Disease 3,447
TOTAL 976 TOTAL 1,347 TOTAL 4,689 TOTAL 22,284 TOTAL 98,466
Note: Total includes all other causes.
Asian/PI*
19
3.1
*Asian/Pacific Islander ^ NA = Multi-Race data not available before 2013.
are only comparable if the samestandard million population was usedin the calculation.
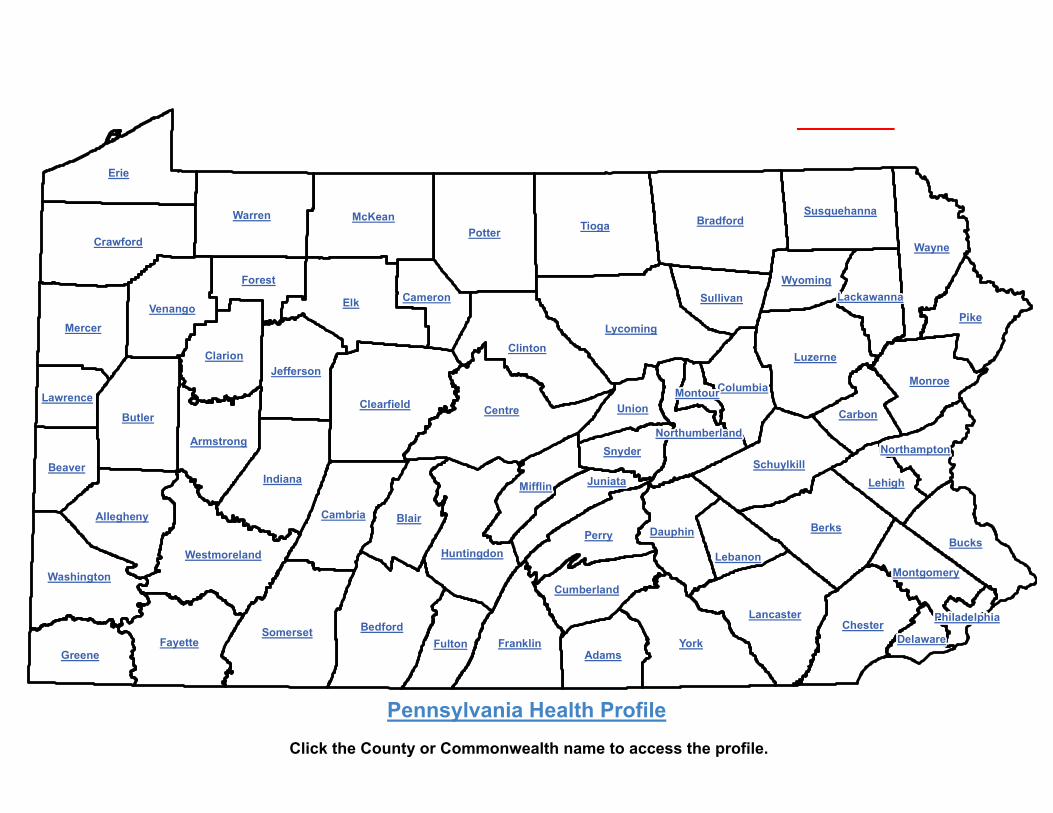
Invasive Cancer Incidence and Average Annual Age-Adjusted Rates* for Major Sites by Sex
All Sites 115,170 531.5
Prostate 26,049 112.9
Lung and Bronchus 16,742 77.6
Colon and Rectum 10,632 49.7
Male FemaleTotal Rate Total Rate
Female Breast 32,186 129.0
116,139 456.5
14,913 55.5
10,149 37.5
*Per 100,000 2000 U.S. standard million population. Age-adjusted rates are only comparable if the same standard million population was used in the calculation.
- -
- -
Male FemaleTotal Rate Total Rate
Non-Hodgkin Lymphoma 5,442 25.7
Melanoma of the Skin 5,870 27.8
4,616 17.5
8,407 32.1
4,272 18.3
Corpus and Uterus, NOS - -
Urinary Bladder 9,223
Kidney and Renal Pelvis 4,854 22.5
43.7 3,060
2,978
11.0
11.7
Notes: All in situ cases, except for urinary bladder, are excluded. Age-adjusted rates based on less than 20 events are statistically unreliable and are not displayed (ND).
Cancer Incidence (2011-2013 Residents)
Adult Behavioral Health Risk Factors (2012-2014)[Includes: All Counties]
General Notes: Crude and age-adjusted rates based on less than 10 events are considered statistically unreliable and are not displayed (ND), unless otherwise noted. Starting in 2013, race of resident was derived from multiple race selections. A person is Multi-Race if they identify as more than one race. Prior to 2013, race of resident was derived from a single race designation.
Percent (CI)Risk Factors
Fair or poor general health:
Obese:
Overweight (includes obese):
No health insurance (ages 18-64):
Visited a doctor in the past 2 yearsfor a routine check-up:
Percent (CI)Risk Factors
Ever told they have diabetes: Currently has asthma:
Current smoker:
Ever tested for HIV (ages 18-64):
Needed to see a doctor but couldnot due to cost in the past year:
17
30
(16 - 17)
(29 - 30)
65 (64 - 65)
15 (14 - 16)
83 (83 - 84)
10 10(10 - 11) (9 - 10)
21 (20 - 22)
38 (37 - 39)
12 (12 - 13)
Notes: Data are based on 2012-2014 annual sample surveys of Pennsylvania adults. CI= 95% Confidence Interval.
Additional state or county/regional data are available at www.statistics.health.pa.gov.
^In situ, benign, and uncertain neoplasms
Multi- Race
31
6.8
NA2.8 ^

Pennsylvania PAGE 3
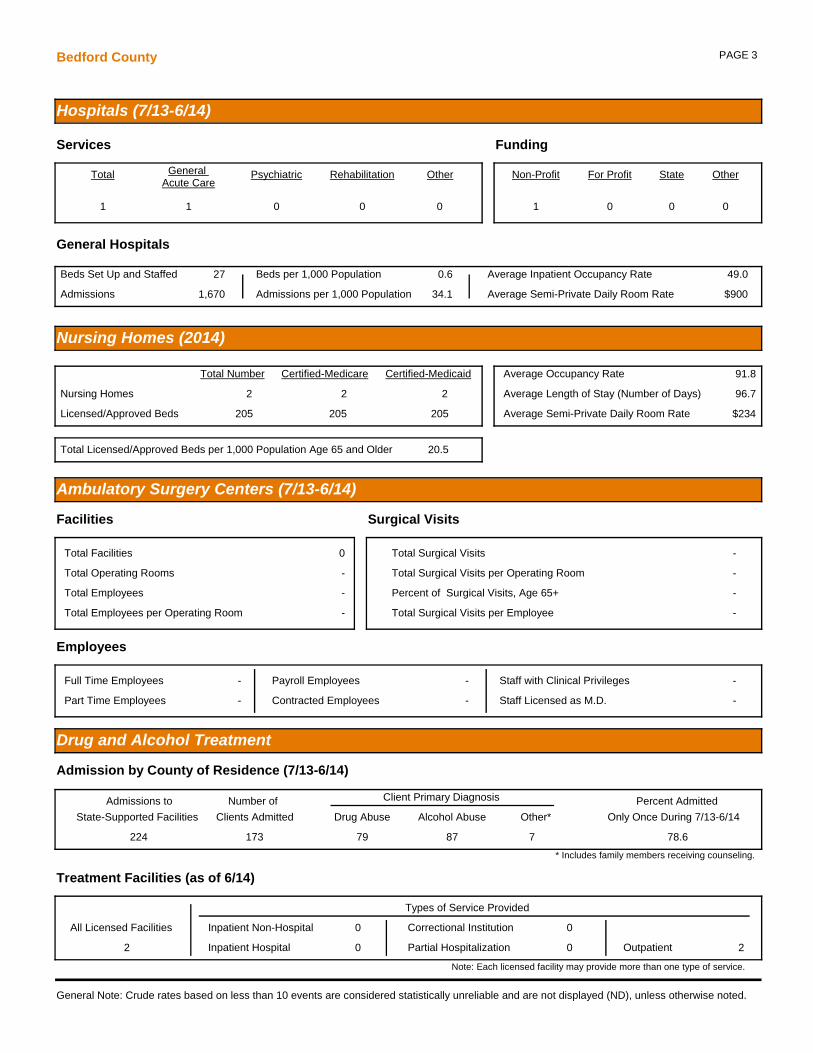
Hospitals (7/13-6/14)
Total General Acute Care
Psychiatric Rehabilitation
247 157 26 19
General Hospitals
Beds Set Up and Staffed 32,525
Admissions 1,494,119
Beds per 1,000 Population 2.5
Admissions per 1,000 Population 116.8
Average Inpatient Occupancy Rate 62.2
Nursing Homes (2014)
Total Number Certified-Medicare Certified-Medicaid
Nursing Homes
Licensed/Approved Beds
701 694 626
88,063 86,636 84,077
41.3
Average Occupancy Rate 91.1
Average Length of Stay (Number of Days) 139.2
$302
Total Licensed/Approved Beds per 1,000 Population Age 65 and Older
Average Semi-Private Daily Room Rate
Drug and Alcohol Treatment
Admissions to Client Primary Diagnosis
Drug Abuse Alcohol Abuse Other*
Percent Admitted
Only Once During 7/13-6/14
55,767 24,990 11,937 1,996 71.7
* Includes family members receiving counseling.
All Licensed Facilities Inpatient Non-Hospital
Inpatient Hospital Partial Hospitalization Outpatient692
172
16 113 541
Note: Each licensed facility may provide more than one type of service.
State-Supported Facilities
Types of Service Provided
Number of
Clients Admitted
38,923
Admission by County of Residence (7/13-6/14)
Treatment Facilities (as of 6/14)
Correctional Institution 0
General Note: Crude rates based on less than 10 events are considered statistically unreliable and are not displayed (ND), unless otherwise noted.
Services Funding
Other
45
Non-Profit
154
For Profit
78
State
7
Other
8
Ambulatory Surgery Centers (7/13-6/14)
Employees
Part Time Employees 3,967
Full Time Employees 5,079
Contracted Employees 1,940
Payroll Employees 7,106 Staff with Clinical Privileges 9,059
Total Surgical Visits per Employee 110.1
Total Facilities 297 Total Surgical Visits 996,263
Percent of Surgical Visits, Age 65+ 37.2
Total Operating Rooms 667 Total Surgical Visits per Operating Room 1,493.6
Facilities Surgical Visits
Staff Licensed as M.D. 6,768
Total Employees per Operating Room 13.6
Average Semi-Private Daily Room Rate $1,801
Total Employees 9,046

PAGE 4Pennsylvania
Pennsylvania Health Care Workforce (2013-2014)
Notes: Only health care employees renewing their license in 2013-2014 were surveyed.The "Estimated Number" and "Percent of Workforce Intending to Remain in Profession for 6 or More Years" used to compute each "% Change from Previous Survey Year" are adjusted based on the response rates for the previous and current survey results. The survey results are available every two years. Numbers and percentages pertain to county of employment.Percentages based on less than six responses are considered statistically unreliable and are not displayed (ND).Registered Nurses and Licensed Practical Nurses are not comparable to previous survey period, so some data is not available (DNA).
Licensed Practical Nurses (2014) 33,936 DNA 82.2% DNA
Physicians (2014) 35,066
Dentists (2013) 7,252
Registered Nurses (2012/2013) 155,068 DNA 83.0% DNA
1.7% 71.5% -1.2%
1.1% 75.8% -2.8%
Estimated Number
Percent Changefrom Previous
Survey
Difference in Percent from
Previous Survey
Percent of WorkforceIntending to Remain in
Profession for 6 or More Years
Injury Hospitalizations (2014)
Injury Hospitalizations and Median Charges by Age and Sex
Injury Hospitalizations and Median Charges by Type of Payor
Injury Hospitalizations and Median Charges by Mechanism/Intent and Sex
0-4 5-14 15-24 25-44 45-64 65 and Older
Male - Total
Male - Median Charges
Female - Total
Female - Median Charges
UnintentionalMotor Vehicle All Poisonings Unintentional Falls
Unintentional Fire/Flame or Hot Object/Substance All Firearm All Other Injuries
Male - Total
Male - Median Charges
Female - Total
Female - Median Charges
Medicare Medicaid Other Government Commercial / Private Blue Cross Uninsured
Total Hospitalizations
Median Charges
All Ages
66,314 1,158 1,294 5,623 12,159 20,395 25,685
$38,452.63 $25,202.66 $30,065.60 $36,357.50 $36,320.00 $40,359.85 $39,926.79
70,661 898 948 3,328 7,762 15,723 42,002
$34,346.81 $22,850.40 $23,119.63 $22,398.68 $27,526.53 $35,770.25 $36,377.00
Note: Median charges not displayed (ND) for occurrences less than 10.
4,24274,727 21,201 15,04420,2901,018
$28,288.83 $37,224.85 $35,265.75 $32,230.70 $38,042.96 $32,604.43
19,854
25,986
3,598
5,598
7,951
7,046
38,493
25,548
648
1,043
117
1,093
$34,071.98
$38,621.82
$49,876.17
$56,997.32
$19,656.87
$21,791.18
$36,498.00
$39,273.73
$36,872.22
$40,240.50
$66,694.50
$90,565.90
Disclaimer: Injury data used in this report were provided to the Pennsylvania Department of Health by the Pennsylvania Health Care Cost Containment Council. The Pennsylvania Health Care Cost Containment Council specifically disclaims responsibility for any interpretations or conclusions. Contents may be republished or reproduced whole or in part, with attribution.

Adams CountyHealth Profile 2016
Demographic Data (2014)
% Population Change 2010 to 2014 0.3
Median Age of the Population (2010-2014) 42.4
% Population Aged 65 and Over 18.3
Population per Square Mile 196.1
% Population with Income Below Poverty Level (2010-2014) 9.9
Per Capita Personal Income $42,776
% Labor Force Unemployed - Annual Average 4.6
% Population Eligible for Medical Assistance 11.9
Estimated Population by Age and Sex (2014)
Age Total Male Female Age Total Male Female
All Ages 101,714
Under 5 5,159
5-14 11,925
15-24 13,836
25-34 10,636
50,115
2,715
6,045
6,965
5,426
51,599
2,444
5,880
6,871
5,210
35-44 11,584
45-54 15,263
55-64 14,726
65-74 10,487
75+ 8,098
5,774
7,548
7,219
5,001
3,422
5,810
7,715
7,507
5,486
4,676
Natality and Reported Pregnancies^ (2014 Residents)
Crude Birth Rate9.9
Average Annual General54.0
% Low Birth Weight 8.3
% Prenatal Care in 1st Trimester 76.0
% Births to Mothers Under 18 1.5
8.0
77.9
1.5
ND
ND
ND
Per 1,000 Population
Fertility Rate* (2012-2014)
All Races White Black
All Ages 1,070
Under 15 2
15-17 17
1,002
2
13
8
0
1
60
0
3
Age of WomanReported
PregnanciesLive
BirthsFetal
DeathsInduced
Abortions
Outcome
Age of WomanReported
PregnanciesLive
BirthsFetal
DeathsInduced
Abortions
Outcome
18-19 60
20-29 590
30 and Over 400
56
549
381
1
3
3
3
38
16
All Ages* 56.0
Under 15** ND
15-17 6.8
59.8
ND
8.9
Age of Woman Birth Rate Reported Pregnancy Rate Age of Woman Birth Rate Reported Pregnancy Rate
18-19 35.4
20-29 91.9
30 and Over** 31.3
37.9
98.8
32.9
^Live births, fetal deaths of 16+ weeks gestation, and induced abortions performed in-state. Notes: All ages includes any unknown ages. All rates per 1,000.*All Ages includes female population ages 15-44. ** Under 15 includes female population ages 10-14; 30 and Over includes female population ages 30-49.
Hispanic
ND
60.0
ND
(of any race)
ND
90.9
ND
Asian / Pacific
General Notes: Crude and age-adjusted rates based on less than 10 events are considered statistically unreliable and are not displayed (ND), unless otherwise noted. Starting in 2013, race of resident was derived from multiple race selections. A person is Multi-Race if they identify as more than one race. Prior to 2013, race of resident was derived from a single race designation.
Morbidity (2012-2014 Residents)
Reported Incidence and Average Annual Rate (per 100,000) for Selected Notifiable Diseases (2012-2014)
HIV 14 4.6
Syphilis 2 ND
Tuberculosis < 5 ND
Total Rate
Chlamydia 616 202.1
Giardiasis 13 4.3
Gonorrhea 73 24.0
Hepatitis: Type A 0 ND
Total Rate
Lyme Disease 200 65.6
Salmonellosis 46 15.1
Total Rate
Campylobacteriosis 39 12.8 Hep. B* Acute < 5 ND
Shigellosis 6 ND
*Hepatitis: Type B **Meningococcal Disease
Meningococcal** 0 ND
Pertussis 9 ND
Hep. B* Chronic 16 5.3
Chickenpox 7 ND
Islander
Note: Communicable diseases with demographic counts of 1 to 4 are displayed as "< 5" to avoid potential identification of cases within certain geographic areas.
Multi - Race
ND
70.0
ND

Adams County PAGE 2
Mortality (2014 Residents)
Selected Major Causes of Death, Number and Average Annual Age-Adjusted Death Rate* (2012-2014)
Number of Resident Deaths 981
Crude Death Rate per 1,000 9.6
Age-Adjusted Death Rate per 1,000 6.9
Number of Infant Deaths (< 1 Year of Age) 8 6 1 1
AllRaces BlackWhite
Hispanic(any race)
Infant Mortality Rate per 1,000 Live Births ND ND ND ND
Average Annual Infant Mortality Rate (2012-2014) 4.1 4.0 ND ND
Cause Total Rate
Diseases of Heart 728
Cancer 719
Stroke 154
C.L.R.D.** 152
Accidents 112
168.4
173.0
35.5
36.2
30.8
Cause Total Rate
Influenza/Pneumonia 69
Diabetes Mellitus 87
Septicemia 32
Nephritis/Nephrosis 71
Alzheimer's Disease 134
16.1
20.2
7.4
16.7
30.1
* Per 100,000 2000 U.S. standardmillion population. Age-adjusted rates
** Chronic Lower Respiratory Disease
Selected Leading Causes of Death, Number by Age Group (2014)
Under 5 Years of Age 5-24 Years of Age 25-44 Years of Age 45-64 Years of Age 65 Years and Older
Perinatal Conditions 4
Birth Defects 2
Accidents 6 Cancer 5
Diseases of Heart 5
Accidents 2
Cancer 72
Diseases of Heart 23
Accidents 14
Diabetes Mellitus 7
C.L.R.D.** 5
Diseases of Heart 194
Cancer 182
Stroke 54
Alzheimer's Disease 47
C.L.R.D.** 45
TOTAL 11 TOTAL 7 TOTAL 20 TOTAL 154 TOTAL 789
Note: Total includes all other causes.
Asian/PI*
0
ND
*Asian/Pacific Islander ^ NA = Multi-Race data not available before 2013.
are only comparable if the samestandard million population was usedin the calculation.
Invasive Cancer Incidence and Average Annual Age-Adjusted Rates* for Major Sites by Sex
All Sites 897 483.3
Prostate 188 97.4
Lung and Bronchus 127 67.3
Colon and Rectum 72 40.4
Male FemaleTotal Rate Total Rate
Female Breast 251 120.9
929 454.2
128 58.5
79 36.4
*Per 100,000 2000 U.S. standard million population. Age-adjusted rates are only comparable if the same standard million population was used in the calculation.
- -
- -
Male FemaleTotal Rate Total Rate
Non-Hodgkin Lymphoma 45 24.5
Melanoma of the Skin 57 30.2
38 18.8
53 26.2
48 25.8
Corpus and Uterus, NOS - -
Urinary Bladder 79
Kidney and Renal Pelvis 32 18.4
42.2 22
23
9.9
11.4
Notes: All in situ cases, except for urinary bladder, are excluded. Age-adjusted rates based on less than 20 events are statistically unreliable and are not displayed (ND).
Cancer Incidence (2011-2013 Residents)
Adult Behavioral Health Risk Factors (2012-2014)[Includes: Adams, Franklin, and Fulton Counties]
General Notes: Crude and age-adjusted rates based on less than 10 events are considered statistically unreliable and are not displayed (ND), unless otherwise noted. Starting in 2013, race of resident was derived from multiple race selections. A person is Multi-Race if they identify as more than one race. Prior to 2013, race of resident was derived from a single race designation.
Percent (CI)Risk Factors
Fair or poor general health:
Obese:
Overweight (includes obese):
No health insurance (ages 18-64):
Visited a doctor in the past 2 yearsfor a routine check-up:
Percent (CI)Risk Factors
Ever told they have diabetes: Currently has asthma:
Current smoker:
Ever tested for HIV (ages 18-64):
Needed to see a doctor but couldnot due to cost in the past year:
18
33
(15 - 21)
(29 - 37)
67 (63 - 72)
19 (15 - 25)
80 (76 - 83)
12 10(10 - 15) (7 - 13)
17 (14 - 21)
27 (22 - 32)
9 (7 - 12)
Notes: Data are based on 2012-2014 annual sample surveys of Pennsylvania adults. CI= 95% Confidence Interval.
Additional state or county/regional data are available at www.statistics.health.pa.gov.
^In situ, benign, and uncertain neoplasms
Multi- Race
1
ND
NAND ^

Adams County PAGE 3
Hospitals (7/13-6/14)
Total General Acute Care
Psychiatric Rehabilitation
1 1 0 0
General Hospitals
Beds Set Up and Staffed 76
Admissions 5,061
Beds per 1,000 Population 0.7
Admissions per 1,000 Population 49.8
Average Inpatient Occupancy Rate 63.6
Nursing Homes (2014)
Total Number Certified-Medicare Certified-Medicaid
Nursing Homes
Licensed/Approved Beds
6 6 6
817 817 817
44.0
Average Occupancy Rate 93.3
Average Length of Stay (Number of Days) 152.1
$289
Total Licensed/Approved Beds per 1,000 Population Age 65 and Older
Average Semi-Private Daily Room Rate
Drug and Alcohol Treatment
Admissions to Client Primary Diagnosis
Drug Abuse Alcohol Abuse Other*
Percent Admitted
Only Once During 7/13-6/14
205 93 64 2 79.2
* Includes family members receiving counseling.
All Licensed Facilities Inpatient Non-Hospital
Inpatient Hospital Partial Hospitalization Outpatient2
0
0 0 2
Note: Each licensed facility may provide more than one type of service.
State-Supported Facilities
Types of Service Provided
Number of
Clients Admitted
159
Admission by County of Residence (7/13-6/14)
Treatment Facilities (as of 6/14)
Correctional Institution 0
General Note: Crude rates based on less than 10 events are considered statistically unreliable and are not displayed (ND), unless otherwise noted.
Services Funding
Other
0
Non-Profit
1
For Profit
0
State
0
Other
0
Ambulatory Surgery Centers (7/13-6/14)
Employees
Part Time Employees 19
Full Time Employees 13
Contracted Employees 18
Payroll Employees 14 Staff with Clinical Privileges 27
Total Surgical Visits per Employee 117.7
Total Facilities 1 Total Surgical Visits 3,765
Percent of Surgical Visits, Age 65+ 44.0
Total Operating Rooms 2 Total Surgical Visits per Operating Room 1,882.5
Facilities Surgical Visits
Staff Licensed as M.D. 13
Total Employees per Operating Room 16.0
Average Semi-Private Daily Room Rate $733
Total Employees 32

PAGE 4Adams County
Pennsylvania Health Care Workforce (2013-2014)
Notes: Only health care employees renewing their license in 2013-2014 were surveyed.The "Estimated Number" and "Percent of Workforce Intending to Remain in Profession for 6 or More Years" used to compute each "% Change from Previous Survey Year" are adjusted based on the response rates for the previous and current survey results. The survey results are available every two years. Numbers and percentages pertain to county of employment.Percentages based on less than six responses are considered statistically unreliable and are not displayed (ND).Registered Nurses and Licensed Practical Nurses are not comparable to previous survey period, so some data is not available (DNA).
Licensed Practical Nurses (2014) 300 DNA 78.6% DNA
Physicians (2014) 143
Dentists (2013) 39
Registered Nurses (2012/2013) 618 DNA 82.1% DNA
9.8% 67.8% -10.0%
11.5% 79.4% 2.0%
Estimated Number
Percent Changefrom Previous
Survey
Difference in Percent from
Previous Survey
Percent of WorkforceIntending to Remain in
Profession for 6 or More Years
Injury Hospitalizations (2014)
Injury Hospitalizations and Median Charges by Age and Sex
Injury Hospitalizations and Median Charges by Type of Payor
Injury Hospitalizations and Median Charges by Mechanism/Intent and Sex
0-4 5-14 15-24 25-44 45-64 65 and Older
Male - Total
Male - Median Charges
Female - Total
Female - Median Charges
UnintentionalMotor Vehicle All Poisonings Unintentional Falls
Unintentional Fire/Flame or Hot Object/Substance All Firearm All Other Injuries
Male - Total
Male - Median Charges
Female - Total
Female - Median Charges
Medicare Medicaid Other Government Commercial / Private Blue Cross Uninsured
Total Hospitalizations
Median Charges
All Ages
403 7 10 32 57 124 173
$21,776.00 ND $21,052.75 $20,121.58 $15,956.34 $23,544.72 $22,929.50
409 6 3 21 42 87 250
$20,633.75 ND ND $15,332.50 $14,231.13 $20,910.75 $23,083.84
Note: Median charges not displayed (ND) for occurrences less than 10.
33446 57 8917116
$19,326.75 $22,946.16 $20,366.78 $19,134.77 $20,910.75 $19,244.66
80
127
42
47
42
34
242
190
2
4
1
1
$18,515.85
$21,593.55
$31,904.01
$24,223.75
$12,730.52
$12,905.10
$23,542.11
$23,191.89
ND
ND
ND
ND
Disclaimer: Injury data used in this report were provided to the Pennsylvania Department of Health by the Pennsylvania Health Care Cost Containment Council. The Pennsylvania Health Care Cost Containment Council specifically disclaims responsibility for any interpretations or conclusions. Contents may be republished or reproduced whole or in part, with attribution.

Allegheny CountyHealth Profile 2016
Demographic Data (2014)
% Population Change 2010 to 2014 0.6
Median Age of the Population (2010-2014) 41.0
% Population Aged 65 and Over 17.4
Population per Square Mile 1,686.5
% Population with Income Below Poverty Level (2010-2014) 12.9
Per Capita Personal Income $53,976
% Labor Force Unemployed - Annual Average 5.4
% Population Eligible for Medical Assistance 15.7
Estimated Population by Age and Sex (2014)
Age Total Male Female Age Total Male Female
All Ages 1,231,255
Under 5 64,859
5-14 128,548
15-24 155,025
25-34 183,895
593,416
33,045
65,616
77,735
93,139
637,839
31,814
62,932
77,290
90,756
35-44 140,767
45-54 165,926
55-64 178,438
65-74 110,186
75+ 103,611
70,279
80,093
85,266
49,506
38,737
70,488
85,833
93,172
60,680
64,874
Estimated Population by Race (2014)
White 997,557 Black 164,611 Other Races 26,381
Natality and Reported Pregnancies^ (2014 Residents)
Crude Birth Rate10.8
Average Annual General55.5
% Low Birth Weight 7.7
% Prenatal Care in 1st Trimester 88.7
% Births to Mothers Under 18 1.2
6.4
90.0
0.4
12.5
86.2
3.9
Per 1,000 Population
Fertility Rate* (2012-2014)
All Races White Black
All Ages 16,714
Under 15 27
15-17 251
13,292
8
145
93
0
1
3,329
19
105
Age of WomanReported
PregnanciesLive
BirthsFetal
DeathsInduced
Abortions
Outcome
Age of WomanReported
PregnanciesLive
BirthsFetal
DeathsInduced
Abortions
Outcome
18-19 614
20-29 7,928
30 and Over 7,878
373
5,903
6,847
4
40
48
237
1,985
983
All Ages* 55.7
Under 15** ND
15-17 7.2
70.1
0.8
12.5
Age of Woman Birth Rate Reported Pregnancy Rate Age of Woman Birth Rate Reported Pregnancy Rate
18-19 22.5
20-29 65.7
30 and Over** 45.2
37.0
88.2
52.0
^Live births, fetal deaths of 16+ weeks gestation, and induced abortions performed in-state. Notes: All ages includes any unknown ages. All rates per 1,000.*All Ages includes female population ages 15-44. ** Under 15 includes female population ages 10-14; 30 and Over includes female population ages 30-49.
Hispanic
7.4
82.0
ND
(of any race)
Asian/PI* 42,706
8.2
90.2
ND
Asian / Pacific
General Notes: Crude and age-adjusted rates based on less than 10 events are considered statistically unreliable and are not displayed (ND), unless otherwise noted. Starting in 2013, race of resident was derived from multiple race selections. A person is Multi-Race if they identify as more than one race. Prior to 2013, race of resident was derived from a single race designation.
Morbidity (2012-2014 Residents)
Reported Incidence and Average Annual Rate (per 100,000) for Selected Notifiable Diseases (2012-2014)
HIV 380 10.3
Syphilis 151 4.1
Tuberculosis 52 1.4
Total Rate
Chlamydia 18,249 494.3
Giardiasis 247 6.7
Gonorrhea 6,646 180.0
Hepatitis: Type A 15 0.4
Total Rate
Lyme Disease 864 23.4
Salmonellosis 342 9.3
Total Rate
Campylobacteriosis 349 9.5 Hep. B* Acute 28 0.8
Shigellosis 54 1.5
*Hepatitis: Type B **Meningococcal Disease
Meningococcal** < 5 ND
Pertussis 428 11.6
Hep. B* Chronic 283 7.7
Chickenpox 187 5.1
Islander
Multi-Race 24,409
*Asian/Pacific Islander
Note: Communicable diseases with demographic counts of 1 to 4 are displayed as "< 5" to avoid potential identification of cases within certain geographic areas.
Multi - Race
8.5
73.0
3.6

Allegheny County PAGE 2
Mortality (2014 Residents)
Selected Major Causes of Death, Number and Average Annual Age-Adjusted Death Rate* (2012-2014)
Number of Resident Deaths 13,505
Crude Death Rate per 1,000 11.0
Age-Adjusted Death Rate per 1,000 7.6
Number of Infant Deaths (< 1 Year of Age) 75 26 30 3
AllRaces BlackWhite
Hispanic(any race)
Infant Mortality Rate per 1,000 Live Births 5.6 2.7 11.8 ND
Average Annual Infant Mortality Rate (2012-2014) 6.0 3.6 11.5 ND
Cause Total Rate
Diseases of Heart 10,261
Cancer 9,069
Stroke 1,991
C.L.R.D.** 1,997
Accidents 2,034
184.1
177.1
35.4
37.4
46.4
Cause Total Rate
Influenza/Pneumonia 918
Diabetes Mellitus 1,003
Septicemia 663
Nephritis/Nephrosis 821
Alzheimer's Disease 1,184
16.3
19.1
12.6
14.9
18.7
* Per 100,000 2000 U.S. standardmillion population. Age-adjusted rates
** Chronic Lower Respiratory Disease
Selected Leading Causes of Death, Number by Age Group (2014)
Under 5 Years of Age 5-24 Years of Age 25-44 Years of Age 45-64 Years of Age 65 Years and Older
Perinatal Conditions 43
Birth Defects 9
Assault (Homicide) 5
Diseases of Heart 2
Stroke 2
Accidents 43
Assault (Homicide) 43
Cancer 13
Suicide 12
Diseases of Heart 5
Accidents 180
Cancer 51
Diseases of Heart 45
Assault (Homicide) 43
Suicide 41
Cancer 726
Diseases of Heart 545
Accidents 171
Liver Dis./Cirrhosis 103
C.L.R.D.** 80
Diseases of Heart 2,886
Cancer 2,205
C.L.R.D.** 586
Stroke 566
Alzheimer's Disease 446
TOTAL 86 TOTAL 141 TOTAL 476 TOTAL 2,319 TOTAL 10,483
Note: Total includes all other causes.
Asian/PI*
2
ND
*Asian/Pacific Islander ^ NA = Multi-Race data not available before 2013.
are only comparable if the samestandard million population was usedin the calculation.
Invasive Cancer Incidence and Average Annual Age-Adjusted Rates* for Major Sites by Sex
All Sites 11,230 532.5
Prostate 2,459 110.4
Lung and Bronchus 1,699 80.8
Colon and Rectum 1,036 49.5
Male FemaleTotal Rate Total Rate
Female Breast 3,458 135.2
12,498 476.3
1,772 63.4
1,009 35.4
*Per 100,000 2000 U.S. standard million population. Age-adjusted rates are only comparable if the same standard million population was used in the calculation.
- -
- -
Male FemaleTotal Rate Total Rate
Non-Hodgkin Lymphoma 510 24.8
Melanoma of the Skin 458 22.3
513 18.7
805 30.0
383 16.5
Corpus and Uterus, NOS - -
Urinary Bladder 951
Kidney and Renal Pelvis 420 20.5
45.1 350
308
12.0
11.9
Notes: All in situ cases, except for urinary bladder, are excluded. Age-adjusted rates based on less than 20 events are statistically unreliable and are not displayed (ND).
Cancer Incidence (2011-2013 Residents)
Adult Behavioral Health Risk Factors (2012-2014)[Includes: Allegheny County Only]
General Notes: Crude and age-adjusted rates based on less than 10 events are considered statistically unreliable and are not displayed (ND), unless otherwise noted. Starting in 2013, race of resident was derived from multiple race selections. A person is Multi-Race if they identify as more than one race. Prior to 2013, race of resident was derived from a single race designation.
Percent (CI)Risk Factors
Fair or poor general health:
Obese:
Overweight (includes obese):
No health insurance (ages 18-64):
Visited a doctor in the past 2 yearsfor a routine check-up:
Percent (CI)Risk Factors
Ever told they have diabetes: Currently has asthma:
Current smoker:
Ever tested for HIV (ages 18-64):
Needed to see a doctor but couldnot due to cost in the past year:
15
26
(14 - 17)
(25 - 28)
63 (61 - 65)
12 (11 - 14)
85 (83 - 86)
10 9(9 - 11) (8 - 10)
21 (19 - 23)
38 (36 - 41)
11 (10 - 12)
Notes: Data are based on 2012-2014 annual sample surveys of Pennsylvania adults. CI= 95% Confidence Interval.
Additional state or county/regional data are available at www.statistics.health.pa.gov.
^In situ, benign, and uncertain neoplasms
Multi- Race
2
ND
NAND ^

Allegheny County PAGE 3
Hospitals (7/13-6/14)
Total General Acute Care
Psychiatric Rehabilitation
29 14 1 3
General Hospitals
Beds Set Up and Staffed 5,197
Admissions 219,722
Beds per 1,000 Population 4.2
Admissions per 1,000 Population 178.5
Average Inpatient Occupancy Rate 66.8
Nursing Homes (2014)
Total Number Certified-Medicare Certified-Medicaid
Nursing Homes
Licensed/Approved Beds
61 61 53
7,782 7,763 7,439
36.4
Average Occupancy Rate 88.7
Average Length of Stay (Number of Days) 95.7
$298
Total Licensed/Approved Beds per 1,000 Population Age 65 and Older
Average Semi-Private Daily Room Rate
Drug and Alcohol Treatment
Admissions to Client Primary Diagnosis
Drug Abuse Alcohol Abuse Other*
Percent Admitted
Only Once During 7/13-6/14
6,289 3,115 1,411 96 76.9
* Includes family members receiving counseling.
All Licensed Facilities Inpatient Non-Hospital
Inpatient Hospital Partial Hospitalization Outpatient70
18
1 22 55
Note: Each licensed facility may provide more than one type of service.
State-Supported Facilities
Types of Service Provided
Number of
Clients Admitted
4,622
Admission by County of Residence (7/13-6/14)
Treatment Facilities (as of 6/14)
Correctional Institution 0
General Note: Crude rates based on less than 10 events are considered statistically unreliable and are not displayed (ND), unless otherwise noted.
Services Funding
Other
11
Non-Profit
18
For Profit
10
State
0
Other
1
Ambulatory Surgery Centers (7/13-6/14)
Employees
Part Time Employees 568
Full Time Employees 603
Contracted Employees 291
Payroll Employees 880 Staff with Clinical Privileges 1,163
Total Surgical Visits per Employee 98.0
Total Facilities 32 Total Surgical Visits 114,754
Percent of Surgical Visits, Age 65+ 36.8
Total Operating Rooms 81 Total Surgical Visits per Operating Room 1,416.7
Facilities Surgical Visits
Staff Licensed as M.D. 878
Total Employees per Operating Room 14.5
Average Semi-Private Daily Room Rate $1,195
Total Employees 1,171

PAGE 4Allegheny County
Pennsylvania Health Care Workforce (2013-2014)
Notes: Only health care employees renewing their license in 2013-2014 were surveyed.The "Estimated Number" and "Percent of Workforce Intending to Remain in Profession for 6 or More Years" used to compute each "% Change from Previous Survey Year" are adjusted based on the response rates for the previous and current survey results. The survey results are available every two years. Numbers and percentages pertain to county of employment.Percentages based on less than six responses are considered statistically unreliable and are not displayed (ND).Registered Nurses and Licensed Practical Nurses are not comparable to previous survey period, so some data is not available (DNA).
Licensed Practical Nurses (2014) 2,290 DNA 85.8% DNA
Physicians (2014) 5,591
Dentists (2013) 972
Registered Nurses (2012/2013) 25,413 DNA 82.5% DNA
-0.3% 70.4% -1.3%
2.3% 77.0% -2.2%
Estimated Number
Percent Changefrom Previous
Survey
Difference in Percent from
Previous Survey
Percent of WorkforceIntending to Remain in
Profession for 6 or More Years
Injury Hospitalizations (2014)
Injury Hospitalizations and Median Charges by Age and Sex
Injury Hospitalizations and Median Charges by Type of Payor
Injury Hospitalizations and Median Charges by Mechanism/Intent and Sex
0-4 5-14 15-24 25-44 45-64 65 and Older
Male - Total
Male - Median Charges
Female - Total
Female - Median Charges
UnintentionalMotor Vehicle All Poisonings Unintentional Falls
Unintentional Fire/Flame or Hot Object/Substance All Firearm All Other Injuries
Male - Total
Male - Median Charges
Female - Total
Female - Median Charges
Medicare Medicaid Other Government Commercial / Private Blue Cross Uninsured
Total Hospitalizations
Median Charges
All Ages
6,738 80 91 513 1,130 2,147 2,777
$36,976.84 $21,006.00 $24,403.75 $39,038.71 $35,460.50 $38,593.00 $37,867.75
7,839 60 74 303 814 1,787 4,801
$33,226.25 $19,694.38 $24,316.99 $26,172.53 $27,891.00 $34,302.03 $34,100.50
Note: Median charges not displayed (ND) for occurrences less than 10.
5578,076 1,897 1,6472,30262
$32,601.25 $35,783.68 $32,955.00 $30,865.00 $38,297.01 $36,805.77
2,134
2,431
373
461
695
584
4,548
3,021
76
104
13
137
$33,023.38
$38,305.25
$49,365.00
$56,677.00
$16,026.75
$16,416.50
$34,831.22
$37,328.00
$33,412.88
$34,958.87
$148,914.84
$68,217.53
Disclaimer: Injury data used in this report were provided to the Pennsylvania Department of Health by the Pennsylvania Health Care Cost Containment Council. The Pennsylvania Health Care Cost Containment Council specifically disclaims responsibility for any interpretations or conclusions. Contents may be republished or reproduced whole or in part, with attribution.

Armstrong CountyHealth Profile 2016
Demographic Data (2014)
% Population Change 2010 to 2014 -1.7
Median Age of the Population (2010-2014) 45.2
% Population Aged 65 and Over 20.1
Population per Square Mile 103.8
% Population with Income Below Poverty Level (2010-2014) 13.3
Per Capita Personal Income $40,683
% Labor Force Unemployed - Annual Average 6.5
% Population Eligible for Medical Assistance 18.9
Estimated Population by Age and Sex (2014)
Age Total Male Female Age Total Male Female
All Ages 67,785
Under 5 3,401
5-14 7,453
15-24 7,479
25-34 7,055
33,589
1,748
3,779
3,879
3,589
34,196
1,653
3,674
3,600
3,466
35-44 7,916
45-54 10,184
55-64 10,654
65-74 7,364
75+ 6,279
3,975
5,157
5,426
3,518
2,518
3,941
5,027
5,228
3,846
3,761
Natality and Reported Pregnancies^ (2014 Residents)
Crude Birth Rate9.1
Average Annual General59.3
% Low Birth Weight 7.7
% Prenatal Care in 1st Trimester 57.2
% Births to Mothers Under 18 1.9
7.7
57.3
1.8
ND
ND
ND
Per 1,000 Population
Fertility Rate* (2012-2014)
All Races White Black
All Ages 681
Under 15 2
15-17 12
617
1
11
5
0
0
59
1
1
Age of WomanReported
PregnanciesLive
BirthsFetal
DeathsInduced
Abortions
Outcome
Age of WomanReported
PregnanciesLive
BirthsFetal
DeathsInduced
Abortions
Outcome
18-19 40
20-29 393
30 and Over 233
36
352
216
0
3
2
4
38
15
All Ages* 56.1
Under 15** ND
15-17 9.9
61.9
ND
10.8
Age of Woman Birth Rate Reported Pregnancy Rate Age of Woman Birth Rate Reported Pregnancy Rate
18-19 52.7
20-29 102.4
30 and Over** 26.6
58.6
114.4
28.7
^Live births, fetal deaths of 16+ weeks gestation, and induced abortions performed in-state. Notes: All ages includes any unknown ages. All rates per 1,000.*All Ages includes female population ages 15-44. ** Under 15 includes female population ages 10-14; 30 and Over includes female population ages 30-49.
Hispanic
ND
ND
ND
(of any race)
ND
ND
ND
Asian / Pacific
General Notes: Crude and age-adjusted rates based on less than 10 events are considered statistically unreliable and are not displayed (ND), unless otherwise noted. Starting in 2013, race of resident was derived from multiple race selections. A person is Multi-Race if they identify as more than one race. Prior to 2013, race of resident was derived from a single race designation.
Morbidity (2012-2014 Residents)
Reported Incidence and Average Annual Rate (per 100,000) for Selected Notifiable Diseases (2012-2014)
HIV 3 ND
Syphilis 0 ND
Tuberculosis < 5 ND
Total Rate
Chlamydia 398 194.8
Giardiasis 29 14.2
Gonorrhea 47 23.0
Hepatitis: Type A < 5 ND
Total Rate
Lyme Disease 546 267.3
Salmonellosis 17 8.3
Total Rate
Campylobacteriosis 26 12.7 Hep. B* Acute 0 ND
Shigellosis < 5 ND
*Hepatitis: Type B **Meningococcal Disease
Meningococcal** 0 ND
Pertussis 14 6.9
Hep. B* Chronic < 5 ND
Chickenpox < 5 ND
Islander
Note: Communicable diseases with demographic counts of 1 to 4 are displayed as "< 5" to avoid potential identification of cases within certain geographic areas.
Multi - Race
ND
ND
ND
Armstrong County PAGE 2
Mortality (2014 Residents)
Selected Major Causes of Death, Number and Average Annual Age-Adjusted Death Rate* (2012-2014)
Number of Resident Deaths 830
Crude Death Rate per 1,000 12.2
Age-Adjusted Death Rate per 1,000 8.0
Number of Infant Deaths (< 1 Year of Age) 2 2 0 0
AllRaces BlackWhite
Hispanic(any race)
Infant Mortality Rate per 1,000 Live Births ND ND ND ND
Average Annual Infant Mortality Rate (2012-2014) 6.1 5.7 ND ND
Cause Total Rate
Diseases of Heart 609
Cancer 540
Stroke 139
C.L.R.D.** 135
Accidents 141
184.7
170.5
42.8
42.0
64.0
Cause Total Rate
Influenza/Pneumonia 61
Diabetes Mellitus 95
Septicemia 38
Nephritis/Nephrosis 56
Alzheimer's Disease 81
18.2
29.0
11.2
17.8
23.2
* Per 100,000 2000 U.S. standardmillion population. Age-adjusted rates
** Chronic Lower Respiratory Disease
Selected Leading Causes of Death, Number by Age Group (2014)
Under 5 Years of Age 5-24 Years of Age 25-44 Years of Age 45-64 Years of Age 65 Years and Older
Perinatal Conditions 2 Accidents 5 Accidents 10
Diseases of Heart 4
Cancer 3
Suicide 2
Cancer 46
Diseases of Heart 27
Accidents 15
Liver Dis./Cirrhosis 7
Diseases of Heart 180
Cancer 132
C.L.R.D.** 38
Stroke 29
Influenza/Pneumonia 25
TOTAL 2 TOTAL 10 TOTAL 30 TOTAL 140 TOTAL 648
Note: Total includes all other causes.
Asian/PI*
0
ND
*Asian/Pacific Islander ^ NA = Multi-Race data not available before 2013.
are only comparable if the samestandard million population was usedin the calculation.
Invasive Cancer Incidence and Average Annual Age-Adjusted Rates* for Major Sites by Sex
All Sites 693 509.2
Prostate 143 98.0
Lung and Bronchus 117 84.2
Colon and Rectum 80 58.8
Male FemaleTotal Rate Total Rate
Female Breast 207 135.0
716 462.7
95 58.6
65 39.0
*Per 100,000 2000 U.S. standard million population. Age-adjusted rates are only comparable if the same standard million population was used in the calculation.
- -
- -
Male FemaleTotal Rate Total Rate
Non-Hodgkin Lymphoma 40 30.4
Melanoma of the Skin 29 21.2
27 15.3
46 28.7
33 26.2
Corpus and Uterus, NOS - -
Urinary Bladder 54
Kidney and Renal Pelvis 21 15.8
39.5 13
20
ND
13.2
Notes: All in situ cases, except for urinary bladder, are excluded. Age-adjusted rates based on less than 20 events are statistically unreliable and are not displayed (ND).
Cancer Incidence (2011-2013 Residents)
Adult Behavioral Health Risk Factors (2012-2014)[Includes: Indiana, Cambria, Somerset, and Armstrong Counties]
General Notes: Crude and age-adjusted rates based on less than 10 events are considered statistically unreliable and are not displayed (ND), unless otherwise noted. Starting in 2013, race of resident was derived from multiple race selections. A person is Multi-Race if they identify as more than one race. Prior to 2013, race of resident was derived from a single race designation.
Percent (CI)Risk Factors
Fair or poor general health:
Obese:
Overweight (includes obese):
No health insurance (ages 18-64):
Visited a doctor in the past 2 yearsfor a routine check-up:
Percent (CI)Risk Factors
Ever told they have diabetes: Currently has asthma:
Current smoker:
Ever tested for HIV (ages 18-64):
Needed to see a doctor but couldnot due to cost in the past year:
21
37
(18 - 24)
(33 - 40)
69 (65 - 72)
13 (11 - 16)
83 (80 - 86)
11 8(9 - 13) (6 - 10)
22 (19 - 25)
25 (22 - 29)
11 (9 - 13)
Notes: Data are based on 2012-2014 annual sample surveys of Pennsylvania adults. CI= 95% Confidence Interval.
Additional state or county/regional data are available at www.statistics.health.pa.gov.
^In situ, benign, and uncertain neoplasms
Multi- Race
0
ND
NAND ^

Armstrong County PAGE 3
Hospitals (7/13-6/14)
Total General Acute Care
Psychiatric Rehabilitation
1 1 0 0
General Hospitals
Beds Set Up and Staffed 148
Admissions 4,889
Beds per 1,000 Population 2.2
Admissions per 1,000 Population 72.1
Average Inpatient Occupancy Rate 41.7
Nursing Homes (2014)
Total Number Certified-Medicare Certified-Medicaid
Nursing Homes
Licensed/Approved Beds
4 4 3
366 366 349
26.8
Average Occupancy Rate 82.8
Average Length of Stay (Number of Days) 102.8
$215
Total Licensed/Approved Beds per 1,000 Population Age 65 and Older
Average Semi-Private Daily Room Rate
Drug and Alcohol Treatment
Admissions to Client Primary Diagnosis
Drug Abuse Alcohol Abuse Other*
Percent Admitted
Only Once During 7/13-6/14
868 299 209 20 64.8
* Includes family members receiving counseling.
All Licensed Facilities Inpatient Non-Hospital
Inpatient Hospital Partial Hospitalization Outpatient5
2
0 1 4
Note: Each licensed facility may provide more than one type of service.
State-Supported Facilities
Types of Service Provided
Number of
Clients Admitted
528
Admission by County of Residence (7/13-6/14)
Treatment Facilities (as of 6/14)
Correctional Institution 0
General Note: Crude rates based on less than 10 events are considered statistically unreliable and are not displayed (ND), unless otherwise noted.
Services Funding
Other
0
Non-Profit
1
For Profit
0
State
0
Other
0
Ambulatory Surgery Centers (7/13-6/14)
Employees
Part Time Employees -
Full Time Employees -
Contracted Employees -
Payroll Employees - Staff with Clinical Privileges -
Total Surgical Visits per Employee -
Total Facilities 0 Total Surgical Visits -
Percent of Surgical Visits, Age 65+ -
Total Operating Rooms - Total Surgical Visits per Operating Room -
Facilities Surgical Visits
Staff Licensed as M.D. -
Total Employees per Operating Room -
Average Semi-Private Daily Room Rate -
Total Employees -

PAGE 4Armstrong County
Pennsylvania Health Care Workforce (2013-2014)
Notes: Only health care employees renewing their license in 2013-2014 were surveyed.The "Estimated Number" and "Percent of Workforce Intending to Remain in Profession for 6 or More Years" used to compute each "% Change from Previous Survey Year" are adjusted based on the response rates for the previous and current survey results. The survey results are available every two years. Numbers and percentages pertain to county of employment.Percentages based on less than six responses are considered statistically unreliable and are not displayed (ND).Registered Nurses and Licensed Practical Nurses are not comparable to previous survey period, so some data is not available (DNA).
Licensed Practical Nurses (2014) 148 DNA 72.7% DNA
Physicians (2014) 92
Dentists (2013) 26
Registered Nurses (2012/2013) 508 DNA 82.1% DNA
13.4% 78.9% -3.2%
5.6% 60.9% -7.3%
Estimated Number
Percent Changefrom Previous
Survey
Difference in Percent from
Previous Survey
Percent of WorkforceIntending to Remain in
Profession for 6 or More Years
Injury Hospitalizations (2014)
Injury Hospitalizations and Median Charges by Age and Sex
Injury Hospitalizations and Median Charges by Type of Payor
Injury Hospitalizations and Median Charges by Mechanism/Intent and Sex
0-4 5-14 15-24 25-44 45-64 65 and Older
Male - Total
Male - Median Charges
Female - Total
Female - Median Charges
UnintentionalMotor Vehicle All Poisonings Unintentional Falls
Unintentional Fire/Flame or Hot Object/Substance All Firearm All Other Injuries
Male - Total
Male - Median Charges
Female - Total
Female - Median Charges
Medicare Medicaid Other Government Commercial / Private Blue Cross Uninsured
Total Hospitalizations
Median Charges
All Ages
382 6 6 39 80 105 146
$35,066.00 ND ND $48,435.25 $43,969.63 $32,730.75 $32,082.16
348 0 6 17 40 87 198
$25,685.20 - ND $12,043.85 $17,984.42 $30,494.00 $26,215.56
Note: Median charges not displayed (ND) for occurrences less than 10.
16409 90 841256
$54,543.62 $26,630.54 $23,553.57 $20,460.24 $54,847.00 ND
109
176
24
51
28
26
184
121
3
6
0
2
$18,330.06
$32,352.18
$52,550.96
$93,201.50
$14,063.81
$30,489.35
$27,913.25
$28,596.45
ND
ND
-
ND
Disclaimer: Injury data used in this report were provided to the Pennsylvania Department of Health by the Pennsylvania Health Care Cost Containment Council. The Pennsylvania Health Care Cost Containment Council specifically disclaims responsibility for any interpretations or conclusions. Contents may be republished or reproduced whole or in part, with attribution.
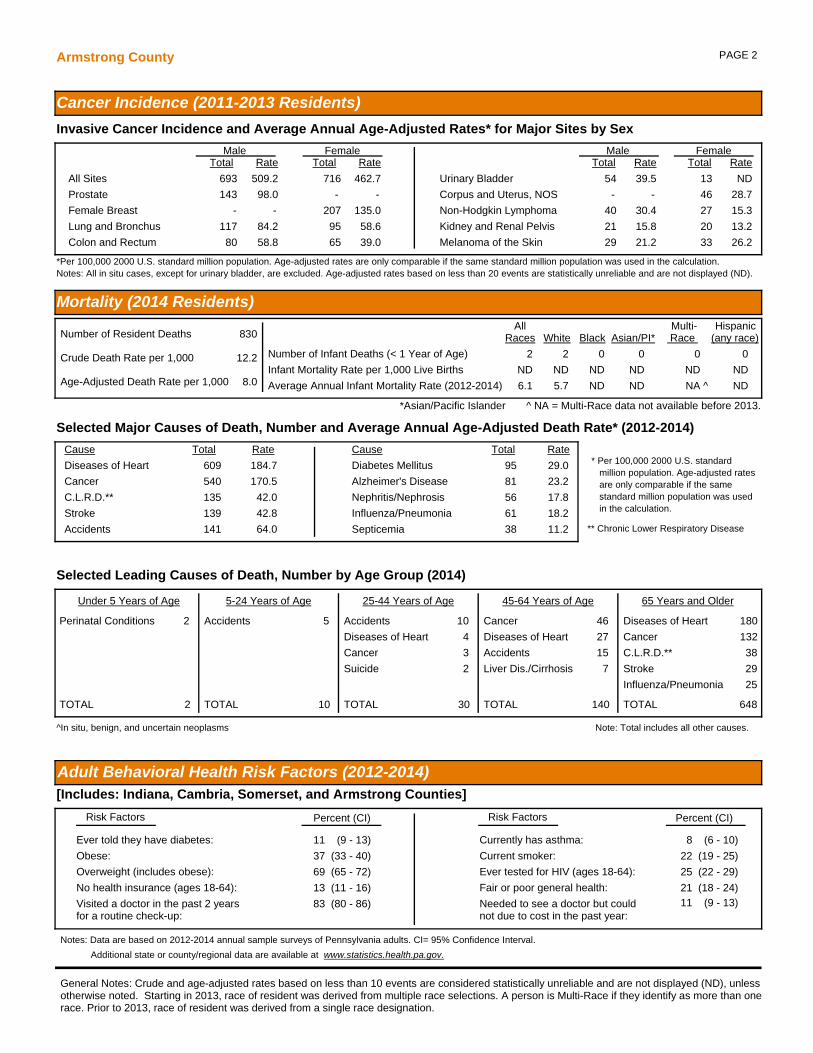
Beaver CountyHealth Profile 2016
Demographic Data (2014)
% Population Change 2010 to 2014 -0.7
Median Age of the Population (2010-2014) 44.7
% Population Aged 65 and Over 19.7
Population per Square Mile 389.7
% Population with Income Below Poverty Level (2010-2014) 12.1
Per Capita Personal Income $41,084
% Labor Force Unemployed - Annual Average 6.5
% Population Eligible for Medical Assistance 17.5
Estimated Population by Age and Sex (2014)
Age Total Male Female Age Total Male Female
All Ages 169,392
Under 5 8,687
5-14 18,680
15-24 19,485
25-34 19,206
82,005
4,436
9,585
9,981
9,707
87,387
4,251
9,095
9,504
9,499
35-44 18,860
45-54 24,695
55-64 26,427
65-74 17,243
75+ 16,109
9,306
12,027
12,751
8,021
6,191
9,554
12,668
13,676
9,222
9,918
Natality and Reported Pregnancies^ (2014 Residents)
Crude Birth Rate10.5
Average Annual General60.5
% Low Birth Weight 7.5
% Prenatal Care in 1st Trimester 74.9
% Births to Mothers Under 18 1.0
7.6
75.9
1.0
10.5
67.9
ND
Per 1,000 Population
Fertility Rate* (2012-2014)
All Races White Black
All Ages 2,038
Under 15 2
15-17 29
1,784
1
16
20
0
0
234
1
13
Age of WomanReported
PregnanciesLive
BirthsFetal
DeathsInduced
Abortions
Outcome
Age of WomanReported
PregnanciesLive
BirthsFetal
DeathsInduced
Abortions
Outcome
18-19 96
20-29 1,101
30 and Over 801
78
935
745
0
15
5
18
151
51
All Ages* 62.5
Under 15** ND
15-17 5.7
71.4
ND
10.4
Age of Woman Birth Rate Reported Pregnancy Rate Age of Woman Birth Rate Reported Pregnancy Rate
18-19 41.7
20-29 98.5
30 and Over** 37.1
51.3
116.0
39.9
^Live births, fetal deaths of 16+ weeks gestation, and induced abortions performed in-state. Notes: All ages includes any unknown ages. All rates per 1,000.*All Ages includes female population ages 15-44. ** Under 15 includes female population ages 10-14; 30 and Over includes female population ages 30-49.
Hispanic
ND
66.7
ND
(of any race)
ND
ND
ND
Asian / Pacific
General Notes: Crude and age-adjusted rates based on less than 10 events are considered statistically unreliable and are not displayed (ND), unless otherwise noted. Starting in 2013, race of resident was derived from multiple race selections. A person is Multi-Race if they identify as more than one race. Prior to 2013, race of resident was derived from a single race designation.
Morbidity (2012-2014 Residents)
Reported Incidence and Average Annual Rate (per 100,000) for Selected Notifiable Diseases (2012-2014)
HIV 16 3.1
Syphilis 4 ND
Tuberculosis 5 ND
Total Rate
Chlamydia 1,538 301.7
Giardiasis 40 7.8
Gonorrhea 525 103.0
Hepatitis: Type A < 5 ND
Total Rate
Lyme Disease 164 32.2
Salmonellosis 52 10.2
Total Rate
Campylobacteriosis 64 12.6 Hep. B* Acute < 5 ND
Shigellosis < 5 ND
*Hepatitis: Type B **Meningococcal Disease
Meningococcal** 0 ND
Pertussis 8 ND
Hep. B* Chronic 21 4.1
Chickenpox 18 3.5
Islander
Note: Communicable diseases with demographic counts of 1 to 4 are displayed as "< 5" to avoid potential identification of cases within certain geographic areas.
Multi - Race
ND
67.3
ND

Beaver County PAGE 2
Mortality (2014 Residents)
Selected Major Causes of Death, Number and Average Annual Age-Adjusted Death Rate* (2012-2014)
Number of Resident Deaths 2,092
Crude Death Rate per 1,000 12.4
Age-Adjusted Death Rate per 1,000 7.9
Number of Infant Deaths (< 1 Year of Age) 14 4 4 1
AllRaces BlackWhite
Hispanic(any race)
Infant Mortality Rate per 1,000 Live Births 7.8 ND ND ND
Average Annual Infant Mortality Rate (2012-2014) 7.1 3.8 22.9 ND
Cause Total Rate
Diseases of Heart 1,526
Cancer 1,381
Stroke 325
C.L.R.D.** 320
Accidents 306
186.0
176.0
38.9
39.4
52.2
Cause Total Rate
Influenza/Pneumonia 138
Diabetes Mellitus 170
Septicemia 85
Nephritis/Nephrosis 156
Alzheimer's Disease 251
16.2
21.2
11.0
18.4
27.1
* Per 100,000 2000 U.S. standardmillion population. Age-adjusted rates
** Chronic Lower Respiratory Disease
Selected Leading Causes of Death, Number by Age Group (2014)
Under 5 Years of Age 5-24 Years of Age 25-44 Years of Age 45-64 Years of Age 65 Years and Older
Perinatal Conditions 11
Accidents 2
Accidents 9 Accidents 22
Suicide 15
Diseases of Heart 7
Septicemia 3
Cancer 113
Diseases of Heart 74
Accidents 18
Stroke 16
C.L.R.D.** 13
Diseases of Heart 424
Cancer 342
C.L.R.D.** 92
Alzheimer's Disease 86
Stroke 84
TOTAL 18 TOTAL 15 TOTAL 66 TOTAL 337 TOTAL 1,655
Note: Total includes all other causes.
Asian/PI*
0
ND
*Asian/Pacific Islander ^ NA = Multi-Race data not available before 2013.
are only comparable if the samestandard million population was usedin the calculation.
Invasive Cancer Incidence and Average Annual Age-Adjusted Rates* for Major Sites by Sex
All Sites 1,737 532.4
Prostate 314 88.5
Lung and Bronchus 316 96.3
Colon and Rectum 141 42.9
Male FemaleTotal Rate Total Rate
Female Breast 531 143.8
1,800 466.7
268 65.2
163 39.2
*Per 100,000 2000 U.S. standard million population. Age-adjusted rates are only comparable if the same standard million population was used in the calculation.
- -
- -
Male FemaleTotal Rate Total Rate
Non-Hodgkin Lymphoma 89 27.5
Melanoma of the Skin 51 16.3
82 17.7
117 29.2
47 14.4
Corpus and Uterus, NOS - -
Urinary Bladder 171
Kidney and Renal Pelvis 76 23.8
52.8 53
34
12.0
8.3
Notes: All in situ cases, except for urinary bladder, are excluded. Age-adjusted rates based on less than 20 events are statistically unreliable and are not displayed (ND).
Cancer Incidence (2011-2013 Residents)
Adult Behavioral Health Risk Factors (2012-2014)[Includes: Beaver and Butler Counties]
General Notes: Crude and age-adjusted rates based on less than 10 events are considered statistically unreliable and are not displayed (ND), unless otherwise noted. Starting in 2013, race of resident was derived from multiple race selections. A person is Multi-Race if they identify as more than one race. Prior to 2013, race of resident was derived from a single race designation.
Percent (CI)Risk Factors
Fair or poor general health:
Obese:
Overweight (includes obese):
No health insurance (ages 18-64):
Visited a doctor in the past 2 yearsfor a routine check-up:
Percent (CI)Risk Factors
Ever told they have diabetes: Currently has asthma:
Current smoker:
Ever tested for HIV (ages 18-64):
Needed to see a doctor but couldnot due to cost in the past year:
15
28
(13 - 18)
(25 - 31)
66 (62 - 70)
12 (9 - 16)
83 (80 - 86)
11 9(9 - 14) (7 - 11)
18 (15 - 21)
28 (24 - 32)
10 (8 - 12)
Notes: Data are based on 2012-2014 annual sample surveys of Pennsylvania adults. CI= 95% Confidence Interval.
Additional state or county/regional data are available at www.statistics.health.pa.gov.
^In situ, benign, and uncertain neoplasms
Multi- Race
1
ND
NAND ^

Beaver County PAGE 3
Hospitals (7/13-6/14)
Total General Acute Care
Psychiatric Rehabilitation
2 1 0 0
General Hospitals
Beds Set Up and Staffed 297
Admissions 14,062
Beds per 1,000 Population 1.8
Admissions per 1,000 Population 83.0
Average Inpatient Occupancy Rate 57.8
Nursing Homes (2014)
Total Number Certified-Medicare Certified-Medicaid
Nursing Homes
Licensed/Approved Beds
6 6 6
1,198 1,198 1,198
35.9
Average Occupancy Rate 85.1
Average Length of Stay (Number of Days) 151.9
$329
Total Licensed/Approved Beds per 1,000 Population Age 65 and Older
Average Semi-Private Daily Room Rate
Drug and Alcohol Treatment
Admissions to Client Primary Diagnosis
Drug Abuse Alcohol Abuse Other*
Percent Admitted
Only Once During 7/13-6/14
1,575 598 362 27 66.0
* Includes family members receiving counseling.
All Licensed Facilities Inpatient Non-Hospital
Inpatient Hospital Partial Hospitalization Outpatient10
5
0 2 7
Note: Each licensed facility may provide more than one type of service.
State-Supported Facilities
Types of Service Provided
Number of
Clients Admitted
987
Admission by County of Residence (7/13-6/14)
Treatment Facilities (as of 6/14)
Correctional Institution 0
General Note: Crude rates based on less than 10 events are considered statistically unreliable and are not displayed (ND), unless otherwise noted.
Services Funding
Other
1
Non-Profit
1
For Profit
1
State
0
Other
0
Ambulatory Surgery Centers (7/13-6/14)
Employees
Part Time Employees 6
Full Time Employees 25
Contracted Employees 0
Payroll Employees 31 Staff with Clinical Privileges 9
Total Surgical Visits per Employee 145.5
Total Facilities 1 Total Surgical Visits 4,509
Percent of Surgical Visits, Age 65+ 34.3
Total Operating Rooms 0 Total Surgical Visits per Operating Room -
Facilities Surgical Visits
Staff Licensed as M.D. 7
Total Employees per Operating Room -
Average Semi-Private Daily Room Rate $820
Total Employees 31

PAGE 4Beaver County
Pennsylvania Health Care Workforce (2013-2014)
Notes: Only health care employees renewing their license in 2013-2014 were surveyed.The "Estimated Number" and "Percent of Workforce Intending to Remain in Profession for 6 or More Years" used to compute each "% Change from Previous Survey Year" are adjusted based on the response rates for the previous and current survey results. The survey results are available every two years. Numbers and percentages pertain to county of employment.Percentages based on less than six responses are considered statistically unreliable and are not displayed (ND).Registered Nurses and Licensed Practical Nurses are not comparable to previous survey period, so some data is not available (DNA).
Licensed Practical Nurses (2014) 273 DNA 84.3% DNA
Physicians (2014) 241
Dentists (2013) 76
Registered Nurses (2012/2013) 1,534 DNA 80.1% DNA
-0.6% 70.7% -1.2%
1.0% 74.2% -9.1%
Estimated Number
Percent Changefrom Previous
Survey
Difference in Percent from
Previous Survey
Percent of WorkforceIntending to Remain in
Profession for 6 or More Years
Injury Hospitalizations (2014)
Injury Hospitalizations and Median Charges by Age and Sex
Injury Hospitalizations and Median Charges by Type of Payor
Injury Hospitalizations and Median Charges by Mechanism/Intent and Sex
0-4 5-14 15-24 25-44 45-64 65 and Older
Male - Total
Male - Median Charges
Female - Total
Female - Median Charges
UnintentionalMotor Vehicle All Poisonings Unintentional Falls
Unintentional Fire/Flame or Hot Object/Substance All Firearm All Other Injuries
Male - Total
Male - Median Charges
Female - Total
Female - Median Charges
Medicare Medicaid Other Government Commercial / Private Blue Cross Uninsured
Total Hospitalizations
Median Charges
All Ages
794 10 15 77 154 234 304
$24,426.75 $24,829.50 $35,671.92 $33,584.55 $26,074.22 $27,649.73 $21,864.94
866 7 8 45 98 217 491
$17,442.69 ND ND $12,703.00 $12,657.95 $17,764.00 $18,432.75
Note: Median charges not displayed (ND) for occurrences less than 10.
62912 201 18128122
$13,062.75 $19,230.28 $23,974.23 $18,363.00 $28,546.00 $20,881.32
193
318
34
71
125
79
502
300
11
17
1
9
$16,962.25
$29,507.72
$64,058.88
$70,683.00
$9,311.00
$8,952.54
$18,400.22
$20,554.55
$84,190.90
$45,166.25
ND
ND
Disclaimer: Injury data used in this report were provided to the Pennsylvania Department of Health by the Pennsylvania Health Care Cost Containment Council. The Pennsylvania Health Care Cost Containment Council specifically disclaims responsibility for any interpretations or conclusions. Contents may be republished or reproduced whole or in part, with attribution.

Bedford CountyHealth Profile 2016
Demographic Data (2014)
% Population Change 2010 to 2014 -1.6
Median Age of the Population (2010-2014) 44.6
% Population Aged 65 and Over 20.5
Population per Square Mile 48.4
% Population with Income Below Poverty Level (2010-2014) 13.5
Per Capita Personal Income $35,330
% Labor Force Unemployed - Annual Average 6.6
% Population Eligible for Medical Assistance 18.6
Estimated Population by Age and Sex (2014)
Age Total Male Female Age Total Male Female
All Ages 48,946
Under 5 2,470
5-14 5,711
15-24 5,511
25-34 4,837
24,408
1,211
2,973
2,909
2,486
24,538
1,259
2,738
2,602
2,351
35-44 5,769
45-54 7,288
55-64 7,350
65-74 5,391
75+ 4,619
2,878
3,715
3,670
2,627
1,939
2,891
3,573
3,680
2,764
2,680
Natality and Reported Pregnancies^ (2014 Residents)
Crude Birth Rate9.3
Average Annual General59.5
% Low Birth Weight 4.6
% Prenatal Care in 1st Trimester 73.8
% Births to Mothers Under 18 ND
4.5
74.3
ND
ND
ND
ND
Per 1,000 Population
Fertility Rate* (2012-2014)
All Races White Black
All Ages 474
Under 15 0
15-17 9
456
0
6
3
0
1
15
0
2
Age of WomanReported
PregnanciesLive
BirthsFetal
DeathsInduced
Abortions
Outcome
Age of WomanReported
PregnanciesLive
BirthsFetal
DeathsInduced
Abortions
Outcome
18-19 30
20-29 293
30 and Over 141
26
284
139
0
2
0
4
7
2
All Ages* 58.1
Under 15** ND
15-17 ND
60.4
ND
ND
Age of Woman Birth Rate Reported Pregnancy Rate Age of Woman Birth Rate Reported Pregnancy Rate
18-19 50.6
20-29 118.8
30 and Over** 24.2
58.4
122.5
24.5
^Live births, fetal deaths of 16+ weeks gestation, and induced abortions performed in-state. Notes: All ages includes any unknown ages. All rates per 1,000.*All Ages includes female population ages 15-44. ** Under 15 includes female population ages 10-14; 30 and Over includes female population ages 30-49.
Hispanic
ND
ND
ND
(of any race)
ND
ND
ND
Asian / Pacific
General Notes: Crude and age-adjusted rates based on less than 10 events are considered statistically unreliable and are not displayed (ND), unless otherwise noted. Starting in 2013, race of resident was derived from multiple race selections. A person is Multi-Race if they identify as more than one race. Prior to 2013, race of resident was derived from a single race designation.
Morbidity (2012-2014 Residents)
Reported Incidence and Average Annual Rate (per 100,000) for Selected Notifiable Diseases (2012-2014)
HIV 6 ND
Syphilis 2 ND
Tuberculosis < 5 ND
Total Rate
Chlamydia 148 100.5
Giardiasis 13 8.8
Gonorrhea 11 7.5
Hepatitis: Type A 0 ND
Total Rate
Lyme Disease 168 114.0
Salmonellosis 23 15.6
Total Rate
Campylobacteriosis 33 22.4 Hep. B* Acute < 5 ND
Shigellosis 0 ND
*Hepatitis: Type B **Meningococcal Disease
Meningococcal** 0 ND
Pertussis 8 ND
Hep. B* Chronic 7 ND
Chickenpox 14 9.5
Islander
Note: Communicable diseases with demographic counts of 1 to 4 are displayed as "< 5" to avoid potential identification of cases within certain geographic areas.
Multi - Race
ND
ND
ND

Bedford County PAGE 2
Mortality (2014 Residents)
Selected Major Causes of Death, Number and Average Annual Age-Adjusted Death Rate* (2012-2014)
Number of Resident Deaths 587
Crude Death Rate per 1,000 12.0
Age-Adjusted Death Rate per 1,000 8.0
Number of Infant Deaths (< 1 Year of Age) 0 0 0 0
AllRaces BlackWhite
Hispanic(any race)
Infant Mortality Rate per 1,000 Live Births ND ND ND ND
Average Annual Infant Mortality Rate (2012-2014) ND ND ND ND
Cause Total Rate
Diseases of Heart 398
Cancer 332
Stroke 93
C.L.R.D.** 93
Accidents 105
173.9
148.3
40.4
40.3
66.7
Cause Total Rate
Influenza/Pneumonia 59
Diabetes Mellitus 53
Septicemia 22
Nephritis/Nephrosis 28
Alzheimer's Disease 68
26.4
24.9
9.8
12.3
28.4
* Per 100,000 2000 U.S. standardmillion population. Age-adjusted rates
** Chronic Lower Respiratory Disease
Selected Leading Causes of Death, Number by Age Group (2014)
Under 5 Years of Age 5-24 Years of Age 25-44 Years of Age 45-64 Years of Age 65 Years and Older
Accidents 4 Accidents 13
Diseases of Heart 3
Suicide 2
Cancer 42
Diseases of Heart 13
Accidents 7
Diseases of Heart 114
Cancer 88
C.L.R.D.** 32
Stroke 25
Atherosclerosis 21
TOTAL 0 TOTAL 5 TOTAL 29 TOTAL 98 TOTAL 455
Note: Total includes all other causes.
Asian/PI*
0
ND
*Asian/Pacific Islander ^ NA = Multi-Race data not available before 2013.
are only comparable if the samestandard million population was usedin the calculation.
Invasive Cancer Incidence and Average Annual Age-Adjusted Rates* for Major Sites by Sex
All Sites 516 509.1
Prostate 118 108.9
Lung and Bronchus 63 62.1
Colon and Rectum 64 63.8
Male FemaleTotal Rate Total Rate
Female Breast 135 129.3
463 429.7
43 35.6
41 35.6
*Per 100,000 2000 U.S. standard million population. Age-adjusted rates are only comparable if the same standard million population was used in the calculation.
- -
- -
Male FemaleTotal Rate Total Rate
Non-Hodgkin Lymphoma 20 19.5
Melanoma of the Skin 34 34.4
20 17.8
25 20.9
12 ND
Corpus and Uterus, NOS - -
Urinary Bladder 44
Kidney and Renal Pelvis 22 22.6
43.1 20
9
17.3
ND
Notes: All in situ cases, except for urinary bladder, are excluded. Age-adjusted rates based on less than 20 events are statistically unreliable and are not displayed (ND).
Cancer Incidence (2011-2013 Residents)
Adult Behavioral Health Risk Factors (2012-2014)[Includes: Bedford, Blair, Huntingdon, Juniata, and Mifflin Counties]
General Notes: Crude and age-adjusted rates based on less than 10 events are considered statistically unreliable and are not displayed (ND), unless otherwise noted. Starting in 2013, race of resident was derived from multiple race selections. A person is Multi-Race if they identify as more than one race. Prior to 2013, race of resident was derived from a single race designation.
Percent (CI)Risk Factors
Fair or poor general health:
Obese:
Overweight (includes obese):
No health insurance (ages 18-64):
Visited a doctor in the past 2 yearsfor a routine check-up:
Percent (CI)Risk Factors
Ever told they have diabetes: Currently has asthma:
Current smoker:
Ever tested for HIV (ages 18-64):
Needed to see a doctor but couldnot due to cost in the past year:
20
35
(17 - 23)
(31 - 39)
68 (64 - 72)
18 (14 - 22)
82 (79 - 85)
12 12(10 - 15) (9 - 14)
24 (21 - 28)
34 (29 - 38)
12 (9 - 15)
Notes: Data are based on 2012-2014 annual sample surveys of Pennsylvania adults. CI= 95% Confidence Interval.
Additional state or county/regional data are available at www.statistics.health.pa.gov.
^In situ, benign, and uncertain neoplasms
Multi- Race
0
ND
NAND ^
Bedford County PAGE 3
Hospitals (7/13-6/14)
Total General Acute Care
Psychiatric Rehabilitation
1 1 0 0
General Hospitals
Beds Set Up and Staffed 27
Admissions 1,670
Beds per 1,000 Population 0.6
Admissions per 1,000 Population 34.1
Average Inpatient Occupancy Rate 49.0
Nursing Homes (2014)
Total Number Certified-Medicare Certified-Medicaid
Nursing Homes
Licensed/Approved Beds
2 2 2
205 205 205
20.5
Average Occupancy Rate 91.8
Average Length of Stay (Number of Days) 96.7
$234
Total Licensed/Approved Beds per 1,000 Population Age 65 and Older
Average Semi-Private Daily Room Rate
Drug and Alcohol Treatment
Admissions to Client Primary Diagnosis
Drug Abuse Alcohol Abuse Other*
Percent Admitted
Only Once During 7/13-6/14
224 79 87 7 78.6
* Includes family members receiving counseling.
All Licensed Facilities Inpatient Non-Hospital
Inpatient Hospital Partial Hospitalization Outpatient2
0
0 0 2
Note: Each licensed facility may provide more than one type of service.
State-Supported Facilities
Types of Service Provided
Number of
Clients Admitted
173
Admission by County of Residence (7/13-6/14)
Treatment Facilities (as of 6/14)
Correctional Institution 0
General Note: Crude rates based on less than 10 events are considered statistically unreliable and are not displayed (ND), unless otherwise noted.
Services Funding
Other
0
Non-Profit
1
For Profit
0
State
0
Other
0
Ambulatory Surgery Centers (7/13-6/14)
Employees
Part Time Employees -
Full Time Employees -
Contracted Employees -
Payroll Employees - Staff with Clinical Privileges -
Total Surgical Visits per Employee -
Total Facilities 0 Total Surgical Visits -
Percent of Surgical Visits, Age 65+ -
Total Operating Rooms - Total Surgical Visits per Operating Room -
Facilities Surgical Visits
Staff Licensed as M.D. -
Total Employees per Operating Room -
Average Semi-Private Daily Room Rate $900
Total Employees -

PAGE 4Bedford County
Pennsylvania Health Care Workforce (2013-2014)
Notes: Only health care employees renewing their license in 2013-2014 were surveyed.The "Estimated Number" and "Percent of Workforce Intending to Remain in Profession for 6 or More Years" used to compute each "% Change from Previous Survey Year" are adjusted based on the response rates for the previous and current survey results. The survey results are available every two years. Numbers and percentages pertain to county of employment.Percentages based on less than six responses are considered statistically unreliable and are not displayed (ND).Registered Nurses and Licensed Practical Nurses are not comparable to previous survey period, so some data is not available (DNA).
Licensed Practical Nurses (2014) 87 DNA 79.0% DNA
Physicians (2014) 43
Dentists (2013) 13
Registered Nurses (2012/2013) 260 DNA 80.2% DNA
-15.3% 57.1% -0.6%
-29.8% 54.5% -20.5%
Estimated Number
Percent Changefrom Previous
Survey
Difference in Percent from
Previous Survey
Percent of WorkforceIntending to Remain in
Profession for 6 or More Years
Injury Hospitalizations (2014)
Injury Hospitalizations and Median Charges by Age and Sex
Injury Hospitalizations and Median Charges by Type of Payor
Injury Hospitalizations and Median Charges by Mechanism/Intent and Sex
0-4 5-14 15-24 25-44 45-64 65 and Older
Male - Total
Male - Median Charges
Female - Total
Female - Median Charges
UnintentionalMotor Vehicle All Poisonings Unintentional Falls
Unintentional Fire/Flame or Hot Object/Substance All Firearm All Other Injuries
Male - Total
Male - Median Charges
Female - Total
Female - Median Charges
Medicare Medicaid Other Government Commercial / Private Blue Cross Uninsured
Total Hospitalizations
Median Charges
All Ages
177 2 4 16 38 45 72
$24,136.90 ND ND $21,654.02 $30,792.85 $22,725.76 $21,706.87
189 3 1 7 18 39 121
$21,523.40 ND ND ND $20,180.74 $18,995.88 $23,419.92
Note: Median charges not displayed (ND) for occurrences less than 10.
12209 47 23714
$22,312.95 $21,982.75 $22,231.50 $20,207.14 $26,326.51 ND
55
63
17
23
18
14
99
74
0
2
0
1
$19,394.41
$23,885.80
$26,966.00
$30,921.07
$12,758.40
$7,204.68
$23,419.92
$23,701.65
-
ND
-
ND
Disclaimer: Injury data used in this report were provided to the Pennsylvania Department of Health by the Pennsylvania Health Care Cost Containment Council. The Pennsylvania Health Care Cost Containment Council specifically disclaims responsibility for any interpretations or conclusions. Contents may be republished or reproduced whole or in part, with attribution.

Berks CountyHealth Profile 2016
Demographic Data (2014)
% Population Change 2010 to 2014 0.5
Median Age of the Population (2010-2014) 39.7
% Population Aged 65 and Over 15.9
Population per Square Mile 483.0
% Population with Income Below Poverty Level (2010-2014) 14.3
Per Capita Personal Income $42,856
% Labor Force Unemployed - Annual Average 5.5
% Population Eligible for Medical Assistance 18.2
Estimated Population by Age and Sex (2014)
Age Total Male Female Age Total Male Female
All Ages 413,691
Under 5 24,331
5-14 53,236
15-24 57,887
25-34 49,137
203,372
12,361
27,201
29,572
24,480
210,319
11,970
26,035
28,315
24,657
35-44 49,149
45-54 60,132
55-64 54,074
65-74 35,523
75+ 30,222
24,263
29,685
26,910
16,686
12,214
24,886
30,447
27,164
18,837
18,008
Estimated Population by Race and Hispanic Origin (2014)
White 367,015 Black 27,760 Other Races 18,916 Hispanic (any race) 77,274
Natality and Reported Pregnancies^ (2014 Residents)
Crude Birth Rate11.8
Average Annual General62.0
% Low Birth Weight 8.3
% Prenatal Care in 1st Trimester 79.0
% Births to Mothers Under 18 2.0
7.8
82.8
0.8
10.5
67.5
4.1
Per 1,000 Population
Fertility Rate* (2012-2014)
All Races White Black
All Ages 5,871
Under 15 8
15-17 121
4,886
5
93
42
0
2
943
3
26
Age of WomanReported
PregnanciesLive
BirthsFetal
DeathsInduced
Abortions
Outcome
Age of WomanReported
PregnanciesLive
BirthsFetal
DeathsInduced
Abortions
Outcome
18-19 319
20-29 3,259
30 and Over 2,148
255
2,640
1,877
3
21
16
61
598
255
All Ages* 62.8
Under 15** ND
15-17 11.7
75.4
ND
15.3
Age of Woman Birth Rate Reported Pregnancy Rate Age of Woman Birth Rate Reported Pregnancy Rate
18-19 39.0
20-29 100.0
30 and Over** 36.3
48.8
123.4
41.6
^Live births, fetal deaths of 16+ weeks gestation, and induced abortions performed in-state. Notes: All ages includes any unknown ages. All rates per 1,000.*All Ages includes female population ages 15-44. ** Under 15 includes female population ages 10-14; 30 and Over includes female population ages 30-49.
Hispanic
9.6
73.5
4.1
(of any race)
ND
77.5
ND
Asian / Pacific
General Notes: Crude and age-adjusted rates based on less than 10 events are considered statistically unreliable and are not displayed (ND), unless otherwise noted. Starting in 2013, race of resident was derived from multiple race selections. A person is Multi-Race if they identify as more than one race. Prior to 2013, race of resident was derived from a single race designation.
Morbidity (2012-2014 Residents)
Reported Incidence and Average Annual Rate (per 100,000) for Selected Notifiable Diseases (2012-2014)
HIV 111 8.9
Syphilis 15 1.2
Tuberculosis 19 1.5
Total Rate
Chlamydia 4,837 389.9
Giardiasis 52 4.2
Gonorrhea 720 58.0
Hepatitis: Type A 5 ND
Total Rate
Lyme Disease 194 15.6
Salmonellosis 197 15.9
Total Rate
Campylobacteriosis 59 4.8 Hep. B* Acute < 5 ND
Shigellosis 22 1.8
*Hepatitis: Type B **Meningococcal Disease
Meningococcal** 5 ND
Pertussis 96 7.7
Hep. B* Chronic 188 15.2
Chickenpox 62 5.0
Islander
Note: Communicable diseases with demographic counts of 1 to 4 are displayed as "< 5" to avoid potential identification of cases within certain geographic areas.
Multi - Race
11.2
70.8
7.3

Berks County PAGE 2
Mortality (2014 Residents)
Selected Major Causes of Death, Number and Average Annual Age-Adjusted Death Rate* (2012-2014)
Number of Resident Deaths 3,723
Crude Death Rate per 1,000 9.0
Age-Adjusted Death Rate per 1,000 7.0
Number of Infant Deaths (< 1 Year of Age) 36 24 7 14
AllRaces BlackWhite
Hispanic(any race)
Infant Mortality Rate per 1,000 Live Births 7.4 7.4 ND 8.9
Average Annual Infant Mortality Rate (2012-2014) 6.5 6.3 22.6 7.4
Cause Total Rate
Diseases of Heart 2,714
Cancer 2,487
Stroke 815
C.L.R.D.** 606
Accidents 502
165.7
161.0
49.4
38.1
36.7
Cause Total Rate
Influenza/Pneumonia 211
Diabetes Mellitus 327
Septicemia 196
Nephritis/Nephrosis 246
Alzheimer's Disease 250
12.5
20.9
12.4
14.8
14.7
* Per 100,000 2000 U.S. standardmillion population. Age-adjusted rates
** Chronic Lower Respiratory Disease
Selected Leading Causes of Death, Number by Age Group (2014)
Under 5 Years of Age 5-24 Years of Age 25-44 Years of Age 45-64 Years of Age 65 Years and Older
Perinatal Conditions 21
Birth Defects 5
Accidents 4
Cancer 3
Accidents 18
Suicide 9
Assault (Homicide) 4
Birth Defects 2
Cancer 2
Accidents 35
Cancer 30
Suicide 16
Diseases of Heart 15
Assault (Homicide) 6
Cancer 213
Diseases of Heart 116
Accidents 48
Liver Dis./Cirrhosis 22
Suicide 22
Diseases of Heart 785
Cancer 624
Stroke 249
C.L.R.D.** 162
Diabetes Mellitus 78
TOTAL 42 TOTAL 40 TOTAL 133 TOTAL 613 TOTAL 2,895
Note: Total includes all other causes.
Asian/PI*
0
ND
*Asian/Pacific Islander ^ NA = Multi-Race data not available before 2013.
are only comparable if the samestandard million population was usedin the calculation.
Invasive Cancer Incidence and Average Annual Age-Adjusted Rates* for Major Sites by Sex
All Sites 3,584 523.9
Prostate 796 110.8
Lung and Bronchus 518 76.1
Colon and Rectum 311 46.0
Male FemaleTotal Rate Total Rate
Female Breast 995 129.3
3,510 448.6
464 57.1
301 35.6
*Per 100,000 2000 U.S. standard million population. Age-adjusted rates are only comparable if the same standard million population was used in the calculation.
- -
- -
Male FemaleTotal Rate Total Rate
Non-Hodgkin Lymphoma 181 27.0
Melanoma of the Skin 187 27.8
155 19.2
237 29.3
151 20.8
Corpus and Uterus, NOS - -
Urinary Bladder 304
Kidney and Renal Pelvis 158 23.1
45.8 94
84
11.1
10.8
Notes: All in situ cases, except for urinary bladder, are excluded. Age-adjusted rates based on less than 20 events are statistically unreliable and are not displayed (ND).
Cancer Incidence (2011-2013 Residents)
Adult Behavioral Health Risk Factors (2012-2014)[Includes: Berks and Schuylkill Counties]
General Notes: Crude and age-adjusted rates based on less than 10 events are considered statistically unreliable and are not displayed (ND), unless otherwise noted. Starting in 2013, race of resident was derived from multiple race selections. A person is Multi-Race if they identify as more than one race. Prior to 2013, race of resident was derived from a single race designation.
Percent (CI)Risk Factors
Fair or poor general health:
Obese:
Overweight (includes obese):
No health insurance (ages 18-64):
Visited a doctor in the past 2 yearsfor a routine check-up:
Percent (CI)Risk Factors
Ever told they have diabetes: Currently has asthma:
Current smoker:
Ever tested for HIV (ages 18-64):
Needed to see a doctor but couldnot due to cost in the past year:
18
33
(15 - 21)
(30 - 37)
65 (61 - 69)
15 (12 - 19)
80 (76 - 83)
11 11(9 - 13) (9 - 13)
23 (20 - 26)
38 (33 - 43)
14 (11 - 17)
Notes: Data are based on 2012-2014 annual sample surveys of Pennsylvania adults. CI= 95% Confidence Interval.
Additional state or county/regional data are available at www.statistics.health.pa.gov.
^In situ, benign, and uncertain neoplasms
Multi- Race
2
ND
NAND ^

Berks County PAGE 3
Hospitals (7/13-6/14)
Total General Acute Care
Psychiatric Rehabilitation
6 2 2 1
General Hospitals
Beds Set Up and Staffed 823
Admissions 37,808
Beds per 1,000 Population 2.0
Admissions per 1,000 Population 91.4
Average Inpatient Occupancy Rate 62.7
Nursing Homes (2014)
Total Number Certified-Medicare Certified-Medicaid
Nursing Homes
Licensed/Approved Beds
15 15 13
2,399 2,399 2,269
36.5
Average Occupancy Rate 96.1
Average Length of Stay (Number of Days) 150.5
$331
Total Licensed/Approved Beds per 1,000 Population Age 65 and Older
Average Semi-Private Daily Room Rate
Drug and Alcohol Treatment
Admissions to Client Primary Diagnosis
Drug Abuse Alcohol Abuse Other*
Percent Admitted
Only Once During 7/13-6/14
2,049 895 548 43 72.0
* Includes family members receiving counseling.
All Licensed Facilities Inpatient Non-Hospital
Inpatient Hospital Partial Hospitalization Outpatient18
6
0 2 12
Note: Each licensed facility may provide more than one type of service.
State-Supported Facilities
Types of Service Provided
Number of
Clients Admitted
1,486
Admission by County of Residence (7/13-6/14)
Treatment Facilities (as of 6/14)
Correctional Institution 0
General Note: Crude rates based on less than 10 events are considered statistically unreliable and are not displayed (ND), unless otherwise noted.
Services Funding
Other
1
Non-Profit
2
For Profit
3
State
1
Other
0
Ambulatory Surgery Centers (7/13-6/14)
Employees
Part Time Employees 194
Full Time Employees 181
Contracted Employees 79
Payroll Employees 296 Staff with Clinical Privileges 131
Total Surgical Visits per Employee 123.7
Total Facilities 12 Total Surgical Visits 46,370
Percent of Surgical Visits, Age 65+ 42.2
Total Operating Rooms 25 Total Surgical Visits per Operating Room 1,854.8
Facilities Surgical Visits
Staff Licensed as M.D. 104
Total Employees per Operating Room 15.0
Average Semi-Private Daily Room Rate $1,885
Total Employees 375

PAGE 4Berks County
Pennsylvania Health Care Workforce (2013-2014)
Notes: Only health care employees renewing their license in 2013-2014 were surveyed.The "Estimated Number" and "Percent of Workforce Intending to Remain in Profession for 6 or More Years" used to compute each "% Change from Previous Survey Year" are adjusted based on the response rates for the previous and current survey results. The survey results are available every two years. Numbers and percentages pertain to county of employment.Percentages based on less than six responses are considered statistically unreliable and are not displayed (ND).Registered Nurses and Licensed Practical Nurses are not comparable to previous survey period, so some data is not available (DNA).
Licensed Practical Nurses (2014) 1,023 DNA 81.5% DNA
Physicians (2014) 842
Dentists (2013) 179
Registered Nurses (2012/2013) 4,116 DNA 84.1% DNA
-3.7% 72.9% -0.2%
0.1% 75.6% -1.6%
Estimated Number
Percent Changefrom Previous
Survey
Difference in Percent from
Previous Survey
Percent of WorkforceIntending to Remain in
Profession for 6 or More Years
Injury Hospitalizations (2014)
Injury Hospitalizations and Median Charges by Age and Sex
Injury Hospitalizations and Median Charges by Type of Payor
Injury Hospitalizations and Median Charges by Mechanism/Intent and Sex
0-4 5-14 15-24 25-44 45-64 65 and Older
Male - Total
Male - Median Charges
Female - Total
Female - Median Charges
UnintentionalMotor Vehicle All Poisonings Unintentional Falls
Unintentional Fire/Flame or Hot Object/Substance All Firearm All Other Injuries
Male - Total
Male - Median Charges
Female - Total
Female - Median Charges
Medicare Medicaid Other Government Commercial / Private Blue Cross Uninsured
Total Hospitalizations
Median Charges
All Ages
2,364 44 43 211 402 677 987
$35,143.56 $12,196.26 $18,139.00 $29,457.43 $30,199.43 $35,887.60 $38,219.59
2,423 40 25 114 266 533 1,445
$31,724.60 $16,192.16 $22,913.88 $19,249.56 $24,783.48 $31,385.86 $34,484.46
Note: Median charges not displayed (ND) for occurrences less than 10.
1712,567 578 63580621
$23,226.85 $35,402.07 $26,360.89 $31,527.13 $34,657.74 $32,625.27
813
1,084
138
206
276
213
1,178
805
18
33
0
23
$31,854.72
$34,160.32
$38,775.11
$50,245.17
$15,824.59
$19,067.93
$34,837.09
$36,970.32
$38,524.00
$39,880.59
-
$45,690.06
Disclaimer: Injury data used in this report were provided to the Pennsylvania Department of Health by the Pennsylvania Health Care Cost Containment Council. The Pennsylvania Health Care Cost Containment Council specifically disclaims responsibility for any interpretations or conclusions. Contents may be republished or reproduced whole or in part, with attribution.

Blair CountyHealth Profile 2016
Demographic Data (2014)
% Population Change 2010 to 2014 -0.9
Median Age of the Population (2010-2014) 42.6
% Population Aged 65 and Over 19.3
Population per Square Mile 239.5
% Population with Income Below Poverty Level (2010-2014) 14.2
Per Capita Personal Income $38,336
% Labor Force Unemployed - Annual Average 5.7
% Population Eligible for Medical Assistance 21.2
Estimated Population by Age and Sex (2014)
Age Total Male Female Age Total Male Female
All Ages 125,955
Under 5 6,958
5-14 14,576
15-24 15,555
25-34 14,302
61,404
3,498
7,576
8,074
7,187
64,551
3,460
7,000
7,481
7,115
35-44 14,657
45-54 17,090
55-64 18,457
65-74 12,884
75+ 11,476
7,281
8,470
8,970
5,996
4,352
7,376
8,620
9,487
6,888
7,124
Natality and Reported Pregnancies^ (2014 Residents)
Crude Birth Rate10.6
Average Annual General61.1
% Low Birth Weight 7.6
% Prenatal Care in 1st Trimester 77.3
% Births to Mothers Under 18 2.0
7.6
78.0
1.8
ND
60.0
ND
Per 1,000 Population
Fertility Rate* (2012-2014)
All Races White Black
All Ages 1,429
Under 15 2
15-17 28
1,330
0
27
11
0
0
88
2
1
Age of WomanReported
PregnanciesLive
BirthsFetal
DeathsInduced
Abortions
Outcome
Age of WomanReported
PregnanciesLive
BirthsFetal
DeathsInduced
Abortions
Outcome
18-19 90
20-29 804
30 and Over 496
78
746
470
0
7
4
12
51
22
All Ages* 60.5
Under 15** ND
15-17 14.3
65.0
ND
14.8
Age of Woman Birth Rate Reported Pregnancy Rate Age of Woman Birth Rate Reported Pregnancy Rate
18-19 44.3
20-29 100.6
30 and Over** 31.4
51.1
108.5
33.1
^Live births, fetal deaths of 16+ weeks gestation, and induced abortions performed in-state. Notes: All ages includes any unknown ages. All rates per 1,000.*All Ages includes female population ages 15-44. ** Under 15 includes female population ages 10-14; 30 and Over includes female population ages 30-49.
Hispanic
ND
68.4
ND
(of any race)
ND
ND
ND
Asian / Pacific
General Notes: Crude and age-adjusted rates based on less than 10 events are considered statistically unreliable and are not displayed (ND), unless otherwise noted. Starting in 2013, race of resident was derived from multiple race selections. A person is Multi-Race if they identify as more than one race. Prior to 2013, race of resident was derived from a single race designation.
Morbidity (2012-2014 Residents)
Reported Incidence and Average Annual Rate (per 100,000) for Selected Notifiable Diseases (2012-2014)
HIV 10 2.6
Syphilis 1 ND
Tuberculosis 0 ND
Total Rate
Chlamydia 1,027 270.7
Giardiasis 23 6.1
Gonorrhea 132 34.8
Hepatitis: Type A 0 ND
Total Rate
Lyme Disease 241 63.5
Salmonellosis 58 15.3
Total Rate
Campylobacteriosis 25 6.6 Hep. B* Acute < 5 ND
Shigellosis 0 ND
*Hepatitis: Type B **Meningococcal Disease
Meningococcal** < 5 ND
Pertussis 45 11.9
Hep. B* Chronic 21 5.5
Chickenpox 26 6.9
Islander
Note: Communicable diseases with demographic counts of 1 to 4 are displayed as "< 5" to avoid potential identification of cases within certain geographic areas.
Multi - Race
ND
69.0
ND

Blair County PAGE 2
Mortality (2014 Residents)
Selected Major Causes of Death, Number and Average Annual Age-Adjusted Death Rate* (2012-2014)
Number of Resident Deaths 1,491
Crude Death Rate per 1,000 11.8
Age-Adjusted Death Rate per 1,000 7.8
Number of Infant Deaths (< 1 Year of Age) 10 9 0 0
AllRaces BlackWhite
Hispanic(any race)
Infant Mortality Rate per 1,000 Live Births 7.5 ND ND ND
Average Annual Infant Mortality Rate (2012-2014) 6.6 6.5 ND ND
Cause Total Rate
Diseases of Heart 1,192
Cancer 928
Stroke 238
C.L.R.D.** 240
Accidents 208
199.8
167.7
39.0
42.3
47.8
Cause Total Rate
Influenza/Pneumonia 87
Diabetes Mellitus 143
Septicemia 72
Nephritis/Nephrosis 93
Alzheimer's Disease 128
14.5
25.2
12.0
16.0
19.7
* Per 100,000 2000 U.S. standardmillion population. Age-adjusted rates
** Chronic Lower Respiratory Disease
Selected Leading Causes of Death, Number by Age Group (2014)
Under 5 Years of Age 5-24 Years of Age 25-44 Years of Age 45-64 Years of Age 65 Years and Older
Perinatal Conditions 4
Birth Defects 2
Accidents 6 Accidents 16
Cancer 7
Diseases of Heart 5
Suicide 5
Liver Dis./Cirrhosis 2
Cancer 80
Diseases of Heart 38
Accidents 14
Diabetes Mellitus 8
C.L.R.D.** 7
Diseases of Heart 315
Cancer 196
C.L.R.D.** 80
Stroke 61
Diabetes Mellitus 39
TOTAL 12 TOTAL 8 TOTAL 42 TOTAL 223 TOTAL 1,206
Note: Total includes all other causes.
Asian/PI*
0
ND
*Asian/Pacific Islander ^ NA = Multi-Race data not available before 2013.
are only comparable if the samestandard million population was usedin the calculation.
Invasive Cancer Incidence and Average Annual Age-Adjusted Rates* for Major Sites by Sex
All Sites 1,264 535.9
Prostate 229 91.4
Lung and Bronchus 174 71.9
Colon and Rectum 141 62.8
Male FemaleTotal Rate Total Rate
Female Breast 315 115.3
1,249 446.4
155 52.6
139 45.7
*Per 100,000 2000 U.S. standard million population. Age-adjusted rates are only comparable if the same standard million population was used in the calculation.
- -
- -
Male FemaleTotal Rate Total Rate
Non-Hodgkin Lymphoma 58 24.6
Melanoma of the Skin 69 29.4
63 20.8
85 30.0
36 14.6
Corpus and Uterus, NOS - -
Urinary Bladder 114
Kidney and Renal Pelvis 47 20.9
49.1 30
38
9.3
13.8
Notes: All in situ cases, except for urinary bladder, are excluded. Age-adjusted rates based on less than 20 events are statistically unreliable and are not displayed (ND).
Cancer Incidence (2011-2013 Residents)
Adult Behavioral Health Risk Factors (2012-2014)[Includes: Bedford, Blair, Huntingdon, Juniata, and Mifflin Counties]
General Notes: Crude and age-adjusted rates based on less than 10 events are considered statistically unreliable and are not displayed (ND), unless otherwise noted. Starting in 2013, race of resident was derived from multiple race selections. A person is Multi-Race if they identify as more than one race. Prior to 2013, race of resident was derived from a single race designation.
Percent (CI)Risk Factors
Fair or poor general health:
Obese:
Overweight (includes obese):
No health insurance (ages 18-64):
Visited a doctor in the past 2 yearsfor a routine check-up:
Percent (CI)Risk Factors
Ever told they have diabetes: Currently has asthma:
Current smoker:
Ever tested for HIV (ages 18-64):
Needed to see a doctor but couldnot due to cost in the past year:
20
35
(17 - 23)
(31 - 39)
68 (64 - 72)
18 (14 - 22)
82 (79 - 85)
12 12(10 - 15) (9 - 14)
24 (21 - 28)
34 (29 - 38)
12 (9 - 15)
Notes: Data are based on 2012-2014 annual sample surveys of Pennsylvania adults. CI= 95% Confidence Interval.
Additional state or county/regional data are available at www.statistics.health.pa.gov.
^In situ, benign, and uncertain neoplasms
Multi- Race
1
ND
NAND ^

Blair County PAGE 3
Hospitals (7/13-6/14)
Total General Acute Care
Psychiatric Rehabilitation
5 3 0 1
General Hospitals
Beds Set Up and Staffed 408
Admissions 20,196
Beds per 1,000 Population 3.2
Admissions per 1,000 Population 160.3
Average Inpatient Occupancy Rate 61.1
Nursing Homes (2014)
Total Number Certified-Medicare Certified-Medicaid
Nursing Homes
Licensed/Approved Beds
10 9 10
1,474 1,135 1,474
60.5
Average Occupancy Rate 88.8
Average Length of Stay (Number of Days) 226.5
$265
Total Licensed/Approved Beds per 1,000 Population Age 65 and Older
Average Semi-Private Daily Room Rate
Drug and Alcohol Treatment
Admissions to Client Primary Diagnosis
Drug Abuse Alcohol Abuse Other*
Percent Admitted
Only Once During 7/13-6/14
1,053 476 303 59 82.0
* Includes family members receiving counseling.
All Licensed Facilities Inpatient Non-Hospital
Inpatient Hospital Partial Hospitalization Outpatient15
5
0 4 11
Note: Each licensed facility may provide more than one type of service.
State-Supported Facilities
Types of Service Provided
Number of
Clients Admitted
838
Admission by County of Residence (7/13-6/14)
Treatment Facilities (as of 6/14)
Correctional Institution 0
General Note: Crude rates based on less than 10 events are considered statistically unreliable and are not displayed (ND), unless otherwise noted.
Services Funding
Other
1
Non-Profit
3
For Profit
1
State
0
Other
1
Ambulatory Surgery Centers (7/13-6/14)
Employees
Part Time Employees 69
Full Time Employees 107
Contracted Employees 42
Payroll Employees 134 Staff with Clinical Privileges 137
Total Surgical Visits per Employee 126.2
Total Facilities 7 Total Surgical Visits 22,219
Percent of Surgical Visits, Age 65+ 35.9
Total Operating Rooms 15 Total Surgical Visits per Operating Room 1,481.3
Facilities Surgical Visits
Staff Licensed as M.D. 93
Total Employees per Operating Room 11.7
Average Semi-Private Daily Room Rate $831
Total Employees 176

PAGE 4Blair County
Pennsylvania Health Care Workforce (2013-2014)
Notes: Only health care employees renewing their license in 2013-2014 were surveyed.The "Estimated Number" and "Percent of Workforce Intending to Remain in Profession for 6 or More Years" used to compute each "% Change from Previous Survey Year" are adjusted based on the response rates for the previous and current survey results. The survey results are available every two years. Numbers and percentages pertain to county of employment.Percentages based on less than six responses are considered statistically unreliable and are not displayed (ND).Registered Nurses and Licensed Practical Nurses are not comparable to previous survey period, so some data is not available (DNA).
Licensed Practical Nurses (2014) 708 DNA 86.5% DNA
Physicians (2014) 305
Dentists (2013) 63
Registered Nurses (2012/2013) 2,043 DNA 81.9% DNA
-3.1% 77.3% 4.2%
10.8% 67.3% -2.7%
Estimated Number
Percent Changefrom Previous
Survey
Difference in Percent from
Previous Survey
Percent of WorkforceIntending to Remain in
Profession for 6 or More Years
Injury Hospitalizations (2014)
Injury Hospitalizations and Median Charges by Age and Sex
Injury Hospitalizations and Median Charges by Type of Payor
Injury Hospitalizations and Median Charges by Mechanism/Intent and Sex
0-4 5-14 15-24 25-44 45-64 65 and Older
Male - Total
Male - Median Charges
Female - Total
Female - Median Charges
UnintentionalMotor Vehicle All Poisonings Unintentional Falls
Unintentional Fire/Flame or Hot Object/Substance All Firearm All Other Injuries
Male - Total
Male - Median Charges
Female - Total
Female - Median Charges
Medicare Medicaid Other Government Commercial / Private Blue Cross Uninsured
Total Hospitalizations
Median Charges
All Ages
629 4 9 50 115 197 254
$25,917.51 ND ND $23,554.83 $19,606.89 $26,287.35 $28,347.00
771 6 11 36 82 182 454
$25,407.02 ND $22,668.50 $14,819.88 $17,322.47 $26,212.66 $27,121.90
Note: Median charges not displayed (ND) for occurrences less than 10.
23811 244 10019319
$14,417.00 $26,809.28 $20,268.79 $19,769.06 $30,244.96 $27,295.00
199
217
39
67
109
80
417
253
5
7
2
5
$21,341.32
$24,146.73
$55,174.46
$35,682.89
$13,295.43
$12,219.93
$28,414.95
$27,788.72
ND
ND
ND
ND
Disclaimer: Injury data used in this report were provided to the Pennsylvania Department of Health by the Pennsylvania Health Care Cost Containment Council. The Pennsylvania Health Care Cost Containment Council specifically disclaims responsibility for any interpretations or conclusions. Contents may be republished or reproduced whole or in part, with attribution.

Bradford CountyHealth Profile 2016
Demographic Data (2014)
% Population Change 2010 to 2014 -1.3
Median Age of the Population (2010-2014) 43.8
% Population Aged 65 and Over 19.6
Population per Square Mile 53.8
% Population with Income Below Poverty Level (2010-2014) 13.2
Per Capita Personal Income $38,448
% Labor Force Unemployed - Annual Average 5.4
% Population Eligible for Medical Assistance 17.4
Estimated Population by Age and Sex (2014)
Age Total Male Female Age Total Male Female
All Ages 61,784
Under 5 3,683
5-14 7,607
15-24 6,969
25-34 6,526
30,591
1,841
3,886
3,599
3,243
31,193
1,842
3,721
3,370
3,283
35-44 6,659
45-54 9,083
55-64 9,169
65-74 6,833
75+ 5,255
3,300
4,539
4,567
3,367
2,249
3,359
4,544
4,602
3,466
3,006
Natality and Reported Pregnancies^ (2014 Residents)
Crude Birth Rate11.9
Average Annual General70.4
% Low Birth Weight 6.2
% Prenatal Care in 1st Trimester 81.3
% Births to Mothers Under 18 ND
6.2
81.4
ND
ND
ND
ND
Per 1,000 Population
Fertility Rate* (2012-2014)
All Races White Black
All Ages 749
Under 15 0
15-17 9
738
0
9
7
0
0
4
0
0
Age of WomanReported
PregnanciesLive
BirthsFetal
DeathsInduced
Abortions
Outcome
Age of WomanReported
PregnanciesLive
BirthsFetal
DeathsInduced
Abortions
Outcome
18-19 46
20-29 475
30 and Over 218
45
467
216
1
6
0
0
2
2
All Ages* 73.7
Under 15** ND
15-17 ND
74.8
ND
ND
Age of Woman Birth Rate Reported Pregnancy Rate Age of Woman Birth Rate Reported Pregnancy Rate
18-19 65.6
20-29 144.6
30 and Over** 30.5
67.1
147.1
30.8
^Live births, fetal deaths of 16+ weeks gestation, and induced abortions performed in-state. Notes: All ages includes any unknown ages. All rates per 1,000.*All Ages includes female population ages 15-44. ** Under 15 includes female population ages 10-14; 30 and Over includes female population ages 30-49.
Hispanic
ND
ND
ND
(of any race)
ND
ND
ND
Asian / Pacific
General Notes: Crude and age-adjusted rates based on less than 10 events are considered statistically unreliable and are not displayed (ND), unless otherwise noted. Starting in 2013, race of resident was derived from multiple race selections. A person is Multi-Race if they identify as more than one race. Prior to 2013, race of resident was derived from a single race designation.
Morbidity (2012-2014 Residents)
Reported Incidence and Average Annual Rate (per 100,000) for Selected Notifiable Diseases (2012-2014)
HIV 2 ND
Syphilis 1 ND
Tuberculosis 0 ND
Total Rate
Chlamydia 337 180.3
Giardiasis 19 10.2
Gonorrhea 50 26.8
Hepatitis: Type A 0 ND
Total Rate
Lyme Disease 241 129.0
Salmonellosis 33 17.7
Total Rate
Campylobacteriosis 63 33.7 Hep. B* Acute 0 ND
Shigellosis 0 ND
*Hepatitis: Type B **Meningococcal Disease
Meningococcal** < 5 ND
Pertussis 22 11.8
Hep. B* Chronic 6 ND
Chickenpox 17 9.1
Islander
Note: Communicable diseases with demographic counts of 1 to 4 are displayed as "< 5" to avoid potential identification of cases within certain geographic areas.
Multi - Race
ND
ND
ND

Bradford County PAGE 2
Mortality (2014 Residents)
Selected Major Causes of Death, Number and Average Annual Age-Adjusted Death Rate* (2012-2014)
Number of Resident Deaths 687
Crude Death Rate per 1,000 11.1
Age-Adjusted Death Rate per 1,000 7.8
Number of Infant Deaths (< 1 Year of Age) 6 6 0 1
AllRaces BlackWhite
Hispanic(any race)
Infant Mortality Rate per 1,000 Live Births ND ND ND ND
Average Annual Infant Mortality Rate (2012-2014) 6.5 6.2 ND ND
Cause Total Rate
Diseases of Heart 448
Cancer 493
Stroke 82
C.L.R.D.** 129
Accidents 97
163.1
183.3
30.0
47.4
45.6
Cause Total Rate
Influenza/Pneumonia 34
Diabetes Mellitus 77
Septicemia 29
Nephritis/Nephrosis 40
Alzheimer's Disease 57
12.1
30.0
10.4
14.9
20.0
* Per 100,000 2000 U.S. standardmillion population. Age-adjusted rates
** Chronic Lower Respiratory Disease
Selected Leading Causes of Death, Number by Age Group (2014)
Under 5 Years of Age 5-24 Years of Age 25-44 Years of Age 45-64 Years of Age 65 Years and Older
Perinatal Conditions 3 Accidents 2
Cancer 2
Suicide 2
Accidents 5
Cancer 5
Diseases of Heart 5
Diabetes Mellitus 3
Suicide 3
Cancer 48
Diseases of Heart 22
Accidents 10
Diseases of Heart 126
Cancer 121
C.L.R.D.** 41
Stroke 28
Diabetes Mellitus 22
TOTAL 8 TOTAL 8 TOTAL 27 TOTAL 125 TOTAL 519
Note: Total includes all other causes.
Asian/PI*
0
ND
*Asian/Pacific Islander ^ NA = Multi-Race data not available before 2013.
are only comparable if the samestandard million population was usedin the calculation.
Invasive Cancer Incidence and Average Annual Age-Adjusted Rates* for Major Sites by Sex
All Sites 647 520.6
Prostate 139 101.5
Lung and Bronchus 115 89.2
Colon and Rectum 46 38.5
Male FemaleTotal Rate Total Rate
Female Breast 159 122.5
640 490.8
79 56.6
66 48.8
*Per 100,000 2000 U.S. standard million population. Age-adjusted rates are only comparable if the same standard million population was used in the calculation.
- -
- -
Male FemaleTotal Rate Total Rate
Non-Hodgkin Lymphoma 34 29.5
Melanoma of the Skin 49 40.8
25 20.1
53 39.2
26 23.2
Corpus and Uterus, NOS - -
Urinary Bladder 42
Kidney and Renal Pelvis 30 25.4
32.9 22
18
14.9
ND
Notes: All in situ cases, except for urinary bladder, are excluded. Age-adjusted rates based on less than 20 events are statistically unreliable and are not displayed (ND).
Cancer Incidence (2011-2013 Residents)
Adult Behavioral Health Risk Factors (2012-2014)[Includes: Bradford, Sullivan, Tioga, Lycoming, Clinton, and Potter Counties]
General Notes: Crude and age-adjusted rates based on less than 10 events are considered statistically unreliable and are not displayed (ND), unless otherwise noted. Starting in 2013, race of resident was derived from multiple race selections. A person is Multi-Race if they identify as more than one race. Prior to 2013, race of resident was derived from a single race designation.
Percent (CI)Risk Factors
Fair or poor general health:
Obese:
Overweight (includes obese):
No health insurance (ages 18-64):
Visited a doctor in the past 2 yearsfor a routine check-up:
Percent (CI)Risk Factors
Ever told they have diabetes: Currently has asthma:
Current smoker:
Ever tested for HIV (ages 18-64):
Needed to see a doctor but couldnot due to cost in the past year:
18
32
(15 - 20)
(29 - 35)
67 (63 - 70)
13 (11 - 16)
85 (82 - 87)
10 10(9 - 12) (8 - 12)
22 (20 - 25)
34 (30 - 38)
9 (7 - 11)
Notes: Data are based on 2012-2014 annual sample surveys of Pennsylvania adults. CI= 95% Confidence Interval.
Additional state or county/regional data are available at www.statistics.health.pa.gov.
^In situ, benign, and uncertain neoplasms
Multi- Race
0
ND
NAND ^

Bradford County PAGE 3
Hospitals (7/13-6/14)
Total General Acute Care
Psychiatric Rehabilitation
3 3 0 0
General Hospitals
Beds Set Up and Staffed 312
Admissions 15,750
Beds per 1,000 Population 5.0
Admissions per 1,000 Population 254.9
Average Inpatient Occupancy Rate 66.8
Nursing Homes (2014)
Total Number Certified-Medicare Certified-Medicaid
Nursing Homes
Licensed/Approved Beds
3 3 3
318 318 318
26.3
Average Occupancy Rate 87.4
Average Length of Stay (Number of Days) 133.5
$260
Total Licensed/Approved Beds per 1,000 Population Age 65 and Older
Average Semi-Private Daily Room Rate
Drug and Alcohol Treatment
Admissions to Client Primary Diagnosis
Drug Abuse Alcohol Abuse Other*
Percent Admitted
Only Once During 7/13-6/14
180 83 50 6 74.8
* Includes family members receiving counseling.
All Licensed Facilities Inpatient Non-Hospital
Inpatient Hospital Partial Hospitalization Outpatient3
0
0 2 3
Note: Each licensed facility may provide more than one type of service.
State-Supported Facilities
Types of Service Provided
Number of
Clients Admitted
139
Admission by County of Residence (7/13-6/14)
Treatment Facilities (as of 6/14)
Correctional Institution 0
General Note: Crude rates based on less than 10 events are considered statistically unreliable and are not displayed (ND), unless otherwise noted.
Services Funding
Other
0
Non-Profit
3
For Profit
0
State
0
Other
0
Ambulatory Surgery Centers (7/13-6/14)
Employees
Part Time Employees 8
Full Time Employees 30
Contracted Employees 0
Payroll Employees 38 Staff with Clinical Privileges 6
Total Surgical Visits per Employee 167.4
Total Facilities 1 Total Surgical Visits 6,363
Percent of Surgical Visits, Age 65+ 38.0
Total Operating Rooms 0 Total Surgical Visits per Operating Room -
Facilities Surgical Visits
Staff Licensed as M.D. 6
Total Employees per Operating Room -
Average Semi-Private Daily Room Rate $1,148
Total Employees 38

PAGE 4Bradford County
Pennsylvania Health Care Workforce (2013-2014)
Notes: Only health care employees renewing their license in 2013-2014 were surveyed.The "Estimated Number" and "Percent of Workforce Intending to Remain in Profession for 6 or More Years" used to compute each "% Change from Previous Survey Year" are adjusted based on the response rates for the previous and current survey results. The survey results are available every two years. Numbers and percentages pertain to county of employment.Percentages based on less than six responses are considered statistically unreliable and are not displayed (ND).Registered Nurses and Licensed Practical Nurses are not comparable to previous survey period, so some data is not available (DNA).
Licensed Practical Nurses (2014) 295 DNA 83.1% DNA
Physicians (2014) 221
Dentists (2013) 28
Registered Nurses (2012/2013) 890 DNA 80.3% DNA
8.9% 59.9% 2.2%
25.2% 58.3% 0.4%
Estimated Number
Percent Changefrom Previous
Survey
Difference in Percent from
Previous Survey
Percent of WorkforceIntending to Remain in
Profession for 6 or More Years
Injury Hospitalizations (2014)
Injury Hospitalizations and Median Charges by Age and Sex
Injury Hospitalizations and Median Charges by Type of Payor
Injury Hospitalizations and Median Charges by Mechanism/Intent and Sex
0-4 5-14 15-24 25-44 45-64 65 and Older
Male - Total
Male - Median Charges
Female - Total
Female - Median Charges
UnintentionalMotor Vehicle All Poisonings Unintentional Falls
Unintentional Fire/Flame or Hot Object/Substance All Firearm All Other Injuries
Male - Total
Male - Median Charges
Female - Total
Female - Median Charges
Medicare Medicaid Other Government Commercial / Private Blue Cross Uninsured
Total Hospitalizations
Median Charges
All Ages
359 6 11 25 82 92 143
$25,808.25 ND $34,701.71 $20,018.00 $15,927.63 $28,008.38 $26,984.95
353 2 5 22 40 73 211
$23,272.89 ND ND $14,605.38 $15,328.38 $24,870.25 $24,692.75
Note: Median charges not displayed (ND) for occurrences less than 10.
36365 94 7612910
$13,252.25 $25,549.00 $19,578.25 $23,227.91 $28,276.25 $21,743.75
75
133
22
45
45
49
206
127
5
5
0
0
$18,207.58
$23,337.82
$42,117.35
$46,466.50
$11,371.50
$13,610.30
$25,520.13
$26,607.63
ND
ND
-
-
Disclaimer: Injury data used in this report were provided to the Pennsylvania Department of Health by the Pennsylvania Health Care Cost Containment Council. The Pennsylvania Health Care Cost Containment Council specifically disclaims responsibility for any interpretations or conclusions. Contents may be republished or reproduced whole or in part, with attribution.

Bucks CountyHealth Profile 2016
Demographic Data (2014)
% Population Change 2010 to 2014 0.2
Median Age of the Population (2010-2014) 42.6
% Population Aged 65 and Over 16.7
Population per Square Mile 1,037.0
% Population with Income Below Poverty Level (2010-2014) 5.9
Per Capita Personal Income $62,514
% Labor Force Unemployed - Annual Average 5.3
% Population Eligible for Medical Assistance 9.4
Estimated Population by Age and Sex (2014)
Age Total Male Female Age Total Male Female
All Ages 626,685
Under 5 30,876
5-14 76,902
15-24 76,283
25-34 68,494
307,325
15,736
39,486
39,245
34,428
319,360
15,140
37,416
37,038
34,066
35-44 74,453
45-54 101,270
55-64 93,887
65-74 57,422
75+ 47,098
36,689
49,450
46,507
27,174
18,610
37,764
51,820
47,380
30,248
28,488
Estimated Population by Race and Hispanic Origin (2014)
White 560,403 Black 25,709 Other Races 11,387 Hispanic (any race) 30,683
Natality and Reported Pregnancies^ (2014 Residents)
Crude Birth Rate9.6
Average Annual General52.3
% Low Birth Weight 8.7
% Prenatal Care in 1st Trimester 75.8
% Births to Mothers Under 18 0.5
8.6
79.4
0.4
9.3
54.4
ND
Per 1,000 Population
Fertility Rate* (2012-2014)
All Races White Black
All Ages 7,166
Under 15 2
15-17 50
6,041
2
26
43
0
0
1,082
0
24
Age of WomanReported
PregnanciesLive
BirthsFetal
DeathsInduced
Abortions
Outcome
Age of WomanReported
PregnanciesLive
BirthsFetal
DeathsInduced
Abortions
Outcome
18-19 209
20-29 2,957
30 and Over 3,935
139
2,332
3,529
0
16
27
70
609
379
All Ages* 55.5
Under 15** ND
15-17 2.1
65.8
ND
4.0
Age of Woman Birth Rate Reported Pregnancy Rate Age of Woman Birth Rate Reported Pregnancy Rate
18-19 19.9
20-29 68.5
30 and Over** 44.4
30.0
86.9
49.5
^Live births, fetal deaths of 16+ weeks gestation, and induced abortions performed in-state. Notes: All ages includes any unknown ages. All rates per 1,000.*All Ages includes female population ages 15-44. ** Under 15 includes female population ages 10-14; 30 and Over includes female population ages 30-49.
Hispanic
7.1
54.6
ND
(of any race)
Asian/PI* 29,186
11.5
77.9
ND
Asian / Pacific
General Notes: Crude and age-adjusted rates based on less than 10 events are considered statistically unreliable and are not displayed (ND), unless otherwise noted. Starting in 2013, race of resident was derived from multiple race selections. A person is Multi-Race if they identify as more than one race. Prior to 2013, race of resident was derived from a single race designation.
Morbidity (2012-2014 Residents)
Reported Incidence and Average Annual Rate (per 100,000) for Selected Notifiable Diseases (2012-2014)
HIV 116 6.2
Syphilis 36 1.9
Tuberculosis 23 1.2
Total Rate
Chlamydia 3,389 180.2
Giardiasis 75 4.0
Gonorrhea 609 32.4
Hepatitis: Type A 10 0.5
Total Rate
Lyme Disease 1,005 53.4
Salmonellosis 277 14.7
Total Rate
Campylobacteriosis 255 13.6 Hep. B* Acute 9 ND
Shigellosis 16 0.9
*Hepatitis: Type B **Meningococcal Disease
Meningococcal** < 5 ND
Pertussis 266 14.1
Hep. B* Chronic 352 18.7
Chickenpox 149 7.9
Islander
*Asian/Pacific Islander
Note: Communicable diseases with demographic counts of 1 to 4 are displayed as "< 5" to avoid potential identification of cases within certain geographic areas.
Multi - Race
ND
58.4
ND
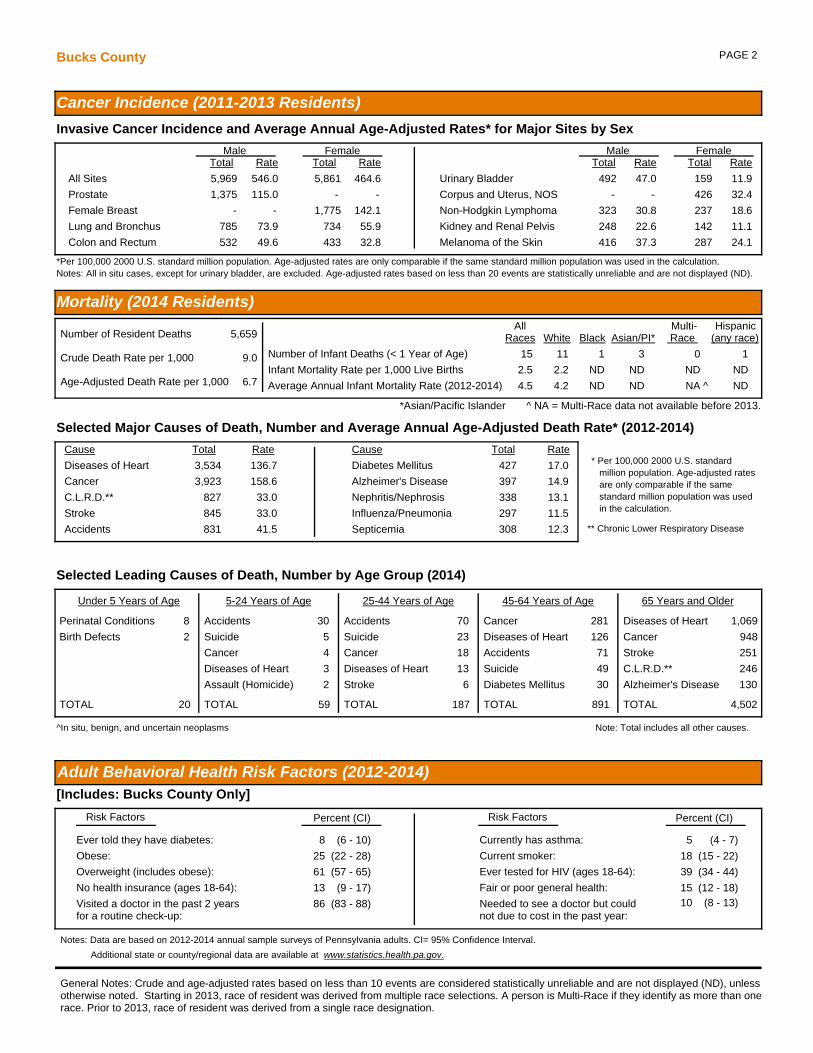
Bucks County PAGE 2
Mortality (2014 Residents)
Selected Major Causes of Death, Number and Average Annual Age-Adjusted Death Rate* (2012-2014)
Number of Resident Deaths 5,659
Crude Death Rate per 1,000 9.0
Age-Adjusted Death Rate per 1,000 6.7
Number of Infant Deaths (< 1 Year of Age) 15 11 1 1
AllRaces BlackWhite
Hispanic(any race)
Infant Mortality Rate per 1,000 Live Births 2.5 2.2 ND ND
Average Annual Infant Mortality Rate (2012-2014) 4.5 4.2 ND ND
Cause Total Rate
Diseases of Heart 3,534
Cancer 3,923
Stroke 845
C.L.R.D.** 827
Accidents 831
136.7
158.6
33.0
33.0
41.5
Cause Total Rate
Influenza/Pneumonia 297
Diabetes Mellitus 427
Septicemia 308
Nephritis/Nephrosis 338
Alzheimer's Disease 397
11.5
17.0
12.3
13.1
14.9
* Per 100,000 2000 U.S. standardmillion population. Age-adjusted rates
** Chronic Lower Respiratory Disease
Selected Leading Causes of Death, Number by Age Group (2014)
Under 5 Years of Age 5-24 Years of Age 25-44 Years of Age 45-64 Years of Age 65 Years and Older
Perinatal Conditions 8
Birth Defects 2
Accidents 30
Suicide 5
Cancer 4
Diseases of Heart 3
Assault (Homicide) 2
Accidents 70
Suicide 23
Cancer 18
Diseases of Heart 13
Stroke 6
Cancer 281
Diseases of Heart 126
Accidents 71
Suicide 49
Diabetes Mellitus 30
Diseases of Heart 1,069
Cancer 948
Stroke 251
C.L.R.D.** 246
Alzheimer's Disease 130
TOTAL 20 TOTAL 59 TOTAL 187 TOTAL 891 TOTAL 4,502
Note: Total includes all other causes.
Asian/PI*
3
ND
*Asian/Pacific Islander ^ NA = Multi-Race data not available before 2013.
are only comparable if the samestandard million population was usedin the calculation.
Invasive Cancer Incidence and Average Annual Age-Adjusted Rates* for Major Sites by Sex
All Sites 5,969 546.0
Prostate 1,375 115.0
Lung and Bronchus 785 73.9
Colon and Rectum 532 49.6
Male FemaleTotal Rate Total Rate
Female Breast 1,775 142.1
5,861 464.6
734 55.9
433 32.8
*Per 100,000 2000 U.S. standard million population. Age-adjusted rates are only comparable if the same standard million population was used in the calculation.
- -
- -
Male FemaleTotal Rate Total Rate
Non-Hodgkin Lymphoma 323 30.8
Melanoma of the Skin 416 37.3
237 18.6
426 32.4
287 24.1
Corpus and Uterus, NOS - -
Urinary Bladder 492
Kidney and Renal Pelvis 248 22.6
47.0 159
142
11.9
11.1
Notes: All in situ cases, except for urinary bladder, are excluded. Age-adjusted rates based on less than 20 events are statistically unreliable and are not displayed (ND).
Cancer Incidence (2011-2013 Residents)
Adult Behavioral Health Risk Factors (2012-2014)[Includes: Bucks County Only]
General Notes: Crude and age-adjusted rates based on less than 10 events are considered statistically unreliable and are not displayed (ND), unless otherwise noted. Starting in 2013, race of resident was derived from multiple race selections. A person is Multi-Race if they identify as more than one race. Prior to 2013, race of resident was derived from a single race designation.
Percent (CI)Risk Factors
Fair or poor general health:
Obese:
Overweight (includes obese):
No health insurance (ages 18-64):
Visited a doctor in the past 2 yearsfor a routine check-up:
Percent (CI)Risk Factors
Ever told they have diabetes: Currently has asthma:
Current smoker:
Ever tested for HIV (ages 18-64):
Needed to see a doctor but couldnot due to cost in the past year:
15
25
(12 - 18)
(22 - 28)
61 (57 - 65)
13 (9 - 17)
86 (83 - 88)
8 5(6 - 10) (4 - 7)
18 (15 - 22)
39 (34 - 44)
10 (8 - 13)
Notes: Data are based on 2012-2014 annual sample surveys of Pennsylvania adults. CI= 95% Confidence Interval.
Additional state or county/regional data are available at www.statistics.health.pa.gov.
^In situ, benign, and uncertain neoplasms
Multi- Race
0
ND
NAND ^

Bucks County PAGE 3
Hospitals (7/13-6/14)
Total General Acute Care
Psychiatric Rehabilitation
8 6 1 0
General Hospitals
Beds Set Up and Staffed 958
Admissions 52,036
Beds per 1,000 Population 1.5
Admissions per 1,000 Population 83.0
Average Inpatient Occupancy Rate 65.0
Nursing Homes (2014)
Total Number Certified-Medicare Certified-Medicaid
Nursing Homes
Licensed/Approved Beds
32 32 28
3,672 3,672 3,400
35.1
Average Occupancy Rate 93.0
Average Length of Stay (Number of Days) 146.6
$357
Total Licensed/Approved Beds per 1,000 Population Age 65 and Older
Average Semi-Private Daily Room Rate
Drug and Alcohol Treatment
Admissions to Client Primary Diagnosis
Drug Abuse Alcohol Abuse Other*
Percent Admitted
Only Once During 7/13-6/14
3,270 1,180 349 220 54.6
* Includes family members receiving counseling.
All Licensed Facilities Inpatient Non-Hospital
Inpatient Hospital Partial Hospitalization Outpatient30
7
0 13 26
Note: Each licensed facility may provide more than one type of service.
State-Supported Facilities
Types of Service Provided
Number of
Clients Admitted
1,749
Admission by County of Residence (7/13-6/14)
Treatment Facilities (as of 6/14)
Correctional Institution 0
General Note: Crude rates based on less than 10 events are considered statistically unreliable and are not displayed (ND), unless otherwise noted.
Services Funding
Other
1
Non-Profit
4
For Profit
4
State
0
Other
0
Ambulatory Surgery Centers (7/13-6/14)
Employees
Part Time Employees 231
Full Time Employees 208
Contracted Employees 80
Payroll Employees 359 Staff with Clinical Privileges 349
Total Surgical Visits per Employee 132.2
Total Facilities 19 Total Surgical Visits 58,051
Percent of Surgical Visits, Age 65+ 39.4
Total Operating Rooms 32 Total Surgical Visits per Operating Room 1,814.1
Facilities Surgical Visits
Staff Licensed as M.D. 246
Total Employees per Operating Room 13.7
Average Semi-Private Daily Room Rate $2,970
Total Employees 439

PAGE 4Bucks County
Pennsylvania Health Care Workforce (2013-2014)
Notes: Only health care employees renewing their license in 2013-2014 were surveyed.The "Estimated Number" and "Percent of Workforce Intending to Remain in Profession for 6 or More Years" used to compute each "% Change from Previous Survey Year" are adjusted based on the response rates for the previous and current survey results. The survey results are available every two years. Numbers and percentages pertain to county of employment.Percentages based on less than six responses are considered statistically unreliable and are not displayed (ND).Registered Nurses and Licensed Practical Nurses are not comparable to previous survey period, so some data is not available (DNA).
Licensed Practical Nurses (2014) 1,028 DNA 85.0% DNA
Physicians (2014) 1,327
Dentists (2013) 443
Registered Nurses (2012/2013) 6,054 DNA 83.8% DNA
5.0% 76.3% -1.6%
-0.9% 78.8% -1.7%
Estimated Number
Percent Changefrom Previous
Survey
Difference in Percent from
Previous Survey
Percent of WorkforceIntending to Remain in
Profession for 6 or More Years
Injury Hospitalizations (2014)
Injury Hospitalizations and Median Charges by Age and Sex
Injury Hospitalizations and Median Charges by Type of Payor
Injury Hospitalizations and Median Charges by Mechanism/Intent and Sex
0-4 5-14 15-24 25-44 45-64 65 and Older
Male - Total
Male - Median Charges
Female - Total
Female - Median Charges
UnintentionalMotor Vehicle All Poisonings Unintentional Falls
Unintentional Fire/Flame or Hot Object/Substance All Firearm All Other Injuries
Male - Total
Male - Median Charges
Female - Total
Female - Median Charges
Medicare Medicaid Other Government Commercial / Private Blue Cross Uninsured
Total Hospitalizations
Median Charges
All Ages
2,940 48 86 216 411 904 1,275
$40,527.50 $30,021.50 $29,479.23 $33,914.38 $34,317.96 $39,960.44 $46,143.16
3,349 35 62 138 301 719 2,094
$40,187.37 $25,652.00 $38,776.00 $25,338.25 $27,732.85 $37,690.85 $44,820.41
Note: Median charges not displayed (ND) for occurrences less than 10.
1423,616 596 97493721
$29,468.10 $43,901.86 $34,080.36 $35,061.95 $38,021.29 $28,220.82
872
1,083
157
215
355
317
1,938
1,282
25
36
2
7
$42,113.50
$41,128.92
$43,607.69
$51,074.00
$23,823.00
$26,373.25
$42,842.49
$43,270.35
$22,577.52
$70,094.74
ND
ND
Disclaimer: Injury data used in this report were provided to the Pennsylvania Department of Health by the Pennsylvania Health Care Cost Containment Council. The Pennsylvania Health Care Cost Containment Council specifically disclaims responsibility for any interpretations or conclusions. Contents may be republished or reproduced whole or in part, with attribution.

Butler CountyHealth Profile 2016
Demographic Data (2014)
% Population Change 2010 to 2014 1.1
Median Age of the Population (2010-2014) 42.4
% Population Aged 65 and Over 17.0
Population per Square Mile 235.8
% Population with Income Below Poverty Level (2010-2014) 8.9
Per Capita Personal Income $49,004
% Labor Force Unemployed - Annual Average 5.1
% Population Eligible for Medical Assistance 11.2
Estimated Population by Age and Sex (2014)
Age Total Male Female Age Total Male Female
All Ages 185,943
Under 5 9,225
5-14 22,042
15-24 23,858
25-34 20,686
91,768
4,679
11,210
12,199
10,594
94,175
4,546
10,832
11,659
10,092
35-44 22,432
45-54 28,736
55-64 27,397
65-74 17,136
75+ 14,431
11,228
14,280
13,733
8,190
5,655
11,204
14,456
13,664
8,946
8,776
Natality and Reported Pregnancies^ (2014 Residents)
Crude Birth Rate9.6
Average Annual General53.6
% Low Birth Weight 6.6
% Prenatal Care in 1st Trimester 79.9
% Births to Mothers Under 18 ND
6.7
79.9
ND
ND
86.7
ND
Per 1,000 Population
Fertility Rate* (2012-2014)
All Races White Black
All Ages 1,980
Under 15 0
15-17 12
1,783
0
8
14
0
1
183
0
3
Age of WomanReported
PregnanciesLive
BirthsFetal
DeathsInduced
Abortions
Outcome
Age of WomanReported
PregnanciesLive
BirthsFetal
DeathsInduced
Abortions
Outcome
18-19 65
20-29 947
30 and Over 955
56
835
883
0
4
9
9
108
63
All Ages* 54.1
Under 15** ND
15-17 ND
60.1
ND
3.4
Age of Woman Birth Rate Reported Pregnancy Rate Age of Woman Birth Rate Reported Pregnancy Rate
18-19 19.9
20-29 80.1
30 and Over** 38.1
23.1
90.8
41.2
^Live births, fetal deaths of 16+ weeks gestation, and induced abortions performed in-state. Notes: All ages includes any unknown ages. All rates per 1,000.*All Ages includes female population ages 15-44. ** Under 15 includes female population ages 10-14; 30 and Over includes female population ages 30-49.
Hispanic
ND
65.6
ND
(of any race)
ND
93.9
ND
Asian / Pacific
General Notes: Crude and age-adjusted rates based on less than 10 events are considered statistically unreliable and are not displayed (ND), unless otherwise noted. Starting in 2013, race of resident was derived from multiple race selections. A person is Multi-Race if they identify as more than one race. Prior to 2013, race of resident was derived from a single race designation.
Morbidity (2012-2014 Residents)
Reported Incidence and Average Annual Rate (per 100,000) for Selected Notifiable Diseases (2012-2014)
HIV 12 2.2
Syphilis 6 ND
Tuberculosis < 5 ND
Total Rate
Chlamydia 910 163.6
Giardiasis 56 10.1
Gonorrhea 101 18.2
Hepatitis: Type A < 5 ND
Total Rate
Lyme Disease 984 176.9
Salmonellosis 56 10.1
Total Rate
Campylobacteriosis 43 7.7 Hep. B* Acute < 5 ND
Shigellosis < 5 ND
*Hepatitis: Type B **Meningococcal Disease
Meningococcal** < 5 ND
Pertussis 33 5.9
Hep. B* Chronic 22 4.0
Chickenpox 40 7.2
Islander
Note: Communicable diseases with demographic counts of 1 to 4 are displayed as "< 5" to avoid potential identification of cases within certain geographic areas.
Multi - Race
ND
64.3
ND

Butler County PAGE 2
Mortality (2014 Residents)
Selected Major Causes of Death, Number and Average Annual Age-Adjusted Death Rate* (2012-2014)
Number of Resident Deaths 1,897
Crude Death Rate per 1,000 10.2
Age-Adjusted Death Rate per 1,000 7.4
Number of Infant Deaths (< 1 Year of Age) 7 7 0 0
AllRaces BlackWhite
Hispanic(any race)
Infant Mortality Rate per 1,000 Live Births ND ND ND ND
Average Annual Infant Mortality Rate (2012-2014) 5.6 5.3 ND ND
Cause Total Rate
Diseases of Heart 1,388
Cancer 1,186
Stroke 312
C.L.R.D.** 331
Accidents 275
174.9
161.3
39.3
44.1
45.5
Cause Total Rate
Influenza/Pneumonia 118
Diabetes Mellitus 167
Septicemia 87
Nephritis/Nephrosis 126
Alzheimer's Disease 191
14.6
22.5
11.5
15.5
22.8
* Per 100,000 2000 U.S. standardmillion population. Age-adjusted rates
** Chronic Lower Respiratory Disease
Selected Leading Causes of Death, Number by Age Group (2014)
Under 5 Years of Age 5-24 Years of Age 25-44 Years of Age 45-64 Years of Age 65 Years and Older
Perinatal Conditions 3
Birth Defects 2
Accidents 9
Suicide 3
Accidents 26
Suicide 7
Cancer 6
Diseases of Heart 6
Cancer 78
Diseases of Heart 47
Accidents 27
Diabetes Mellitus 15
Liver Dis./Cirrhosis 12
Diseases of Heart 421
Cancer 293
C.L.R.D.** 96
Stroke 83
Alzheimer's Disease 73
TOTAL 9 TOTAL 16 TOTAL 59 TOTAL 263 TOTAL 1,550
Note: Total includes all other causes.
Asian/PI*
0
ND
*Asian/Pacific Islander ^ NA = Multi-Race data not available before 2013.
are only comparable if the samestandard million population was usedin the calculation.
Invasive Cancer Incidence and Average Annual Age-Adjusted Rates* for Major Sites by Sex
All Sites 1,753 538.2
Prostate 469 134.2
Lung and Bronchus 223 69.7
Colon and Rectum 182 58.8
Male FemaleTotal Rate Total Rate
Female Breast 516 142.6
1,666 456.7
188 49.1
146 37.2
*Per 100,000 2000 U.S. standard million population. Age-adjusted rates are only comparable if the same standard million population was used in the calculation.
- -
- -
Male FemaleTotal Rate Total Rate
Non-Hodgkin Lymphoma 95 29.3
Melanoma of the Skin 99 30.0
67 18.3
102 27.3
59 19.3
Corpus and Uterus, NOS - -
Urinary Bladder 124
Kidney and Renal Pelvis 67 20.9
38.5 39
37
9.7
9.3
Notes: All in situ cases, except for urinary bladder, are excluded. Age-adjusted rates based on less than 20 events are statistically unreliable and are not displayed (ND).
Cancer Incidence (2011-2013 Residents)
Adult Behavioral Health Risk Factors (2012-2014)[Includes: Beaver and Butler Counties]
General Notes: Crude and age-adjusted rates based on less than 10 events are considered statistically unreliable and are not displayed (ND), unless otherwise noted. Starting in 2013, race of resident was derived from multiple race selections. A person is Multi-Race if they identify as more than one race. Prior to 2013, race of resident was derived from a single race designation.
Percent (CI)Risk Factors
Fair or poor general health:
Obese:
Overweight (includes obese):
No health insurance (ages 18-64):
Visited a doctor in the past 2 yearsfor a routine check-up:
Percent (CI)Risk Factors
Ever told they have diabetes: Currently has asthma:
Current smoker:
Ever tested for HIV (ages 18-64):
Needed to see a doctor but couldnot due to cost in the past year:
15
28
(13 - 18)
(25 - 31)
66 (62 - 70)
12 (9 - 16)
83 (80 - 86)
11 9(9 - 14) (7 - 11)
18 (15 - 21)
28 (24 - 32)
10 (8 - 12)
Notes: Data are based on 2012-2014 annual sample surveys of Pennsylvania adults. CI= 95% Confidence Interval.
Additional state or county/regional data are available at www.statistics.health.pa.gov.
^In situ, benign, and uncertain neoplasms
Multi- Race
0
ND
NAND ^

Butler County PAGE 3
Hospitals (7/13-6/14)
Total General Acute Care
Psychiatric Rehabilitation
1 1 0 0
General Hospitals
Beds Set Up and Staffed 263
Admissions 11,204
Beds per 1,000 Population 1.4
Admissions per 1,000 Population 60.3
Average Inpatient Occupancy Rate 54.8
Nursing Homes (2014)
Total Number Certified-Medicare Certified-Medicaid
Nursing Homes
Licensed/Approved Beds
13 13 12
1,495 1,495 1,470
47.4
Average Occupancy Rate 89.2
Average Length of Stay (Number of Days) 115.2
$319
Total Licensed/Approved Beds per 1,000 Population Age 65 and Older
Average Semi-Private Daily Room Rate
Drug and Alcohol Treatment
Admissions to Client Primary Diagnosis
Drug Abuse Alcohol Abuse Other*
Percent Admitted
Only Once During 7/13-6/14
897 376 109 45 55.8
* Includes family members receiving counseling.
All Licensed Facilities Inpatient Non-Hospital
Inpatient Hospital Partial Hospitalization Outpatient11
3
1 2 8
Note: Each licensed facility may provide more than one type of service.
State-Supported Facilities
Types of Service Provided
Number of
Clients Admitted
530
Admission by County of Residence (7/13-6/14)
Treatment Facilities (as of 6/14)
Correctional Institution 0
General Note: Crude rates based on less than 10 events are considered statistically unreliable and are not displayed (ND), unless otherwise noted.
Services Funding
Other
0
Non-Profit
1
For Profit
0
State
0
Other
0
Ambulatory Surgery Centers (7/13-6/14)
Employees
Part Time Employees 63
Full Time Employees 24
Contracted Employees 36
Payroll Employees 51 Staff with Clinical Privileges 53
Total Surgical Visits per Employee 137.8
Total Facilities 2 Total Surgical Visits 11,990
Percent of Surgical Visits, Age 65+ 46.5
Total Operating Rooms 6 Total Surgical Visits per Operating Room 1,998.3
Facilities Surgical Visits
Staff Licensed as M.D. 42
Total Employees per Operating Room 14.5
Average Semi-Private Daily Room Rate $1,475
Total Employees 87

PAGE 4Butler County
Pennsylvania Health Care Workforce (2013-2014)
Notes: Only health care employees renewing their license in 2013-2014 were surveyed.The "Estimated Number" and "Percent of Workforce Intending to Remain in Profession for 6 or More Years" used to compute each "% Change from Previous Survey Year" are adjusted based on the response rates for the previous and current survey results. The survey results are available every two years. Numbers and percentages pertain to county of employment.Percentages based on less than six responses are considered statistically unreliable and are not displayed (ND).Registered Nurses and Licensed Practical Nurses are not comparable to previous survey period, so some data is not available (DNA).
Licensed Practical Nurses (2014) 482 DNA 78.5% DNA
Physicians (2014) 277
Dentists (2013) 109
Registered Nurses (2012/2013) 1,832 DNA 81.4% DNA
7.5% 74.6% -2.5%
4.9% 81.1% -3.7%
Estimated Number
Percent Changefrom Previous
Survey
Difference in Percent from
Previous Survey
Percent of WorkforceIntending to Remain in
Profession for 6 or More Years
Injury Hospitalizations (2014)
Injury Hospitalizations and Median Charges by Age and Sex
Injury Hospitalizations and Median Charges by Type of Payor
Injury Hospitalizations and Median Charges by Mechanism/Intent and Sex
0-4 5-14 15-24 25-44 45-64 65 and Older
Male - Total
Male - Median Charges
Female - Total
Female - Median Charges
UnintentionalMotor Vehicle All Poisonings Unintentional Falls
Unintentional Fire/Flame or Hot Object/Substance All Firearm All Other Injuries
Male - Total
Male - Median Charges
Female - Total
Female - Median Charges
Medicare Medicaid Other Government Commercial / Private Blue Cross Uninsured
Total Hospitalizations
Median Charges
All Ages
912 12 16 70 149 269 396
$33,957.50 $21,401.88 $24,713.02 $28,211.55 $23,242.00 $37,217.00 $37,729.81
989 11 12 48 113 208 597
$32,135.85 $21,451.75 $17,897.25 $19,123.75 $27,206.00 $32,742.79 $33,072.95
Note: Median charges not displayed (ND) for occurrences less than 10.
481,065 199 22932133
$21,395.25 $33,337.56 $21,585.36 $25,521.04 $43,609.00 $33,794.85
250
384
87
70
85
56
562
372
4
20
1
10
$24,571.73
$28,238.27
$49,763.98
$64,188.13
$15,099.50
$14,017.72
$34,930.92
$39,172.38
ND
$27,936.83
ND
$64,601.00
Disclaimer: Injury data used in this report were provided to the Pennsylvania Department of Health by the Pennsylvania Health Care Cost Containment Council. The Pennsylvania Health Care Cost Containment Council specifically disclaims responsibility for any interpretations or conclusions. Contents may be republished or reproduced whole or in part, with attribution.

Cambria CountyHealth Profile 2016
Demographic Data (2014)
% Population Change 2010 to 2014 -4.1
Median Age of the Population (2010-2014) 44.1
% Population Aged 65 and Over 20.4
Population per Square Mile 200.1
% Population with Income Below Poverty Level (2010-2014) 14.9
Per Capita Personal Income $37,536
% Labor Force Unemployed - Annual Average 7.0
% Population Eligible for Medical Assistance 19.8
Estimated Population by Age and Sex (2014)
Age Total Male Female Age Total Male Female
All Ages 137,732
Under 5 6,797
5-14 15,086
15-24 17,492
25-34 14,371
67,722
3,514
7,677
9,031
7,398
70,010
3,283
7,409
8,461
6,973
35-44 15,517
45-54 18,676
55-64 21,726
65-74 14,500
75+ 13,567
7,908
9,460
10,781
6,902
5,051
7,609
9,216
10,945
7,598
8,516
Natality and Reported Pregnancies^ (2014 Residents)
Crude Birth Rate9.4
Average Annual General55.8
% Low Birth Weight 9.3
% Prenatal Care in 1st Trimester 80.6
% Births to Mothers Under 18 2.0
8.9
82.1
1.9
14.5
64.5
ND
Per 1,000 Population
Fertility Rate* (2012-2014)
All Races White Black
All Ages 1,422
Under 15 1
15-17 30
1,300
1
25
5
0
0
117
0
5
Age of WomanReported
PregnanciesLive
BirthsFetal
DeathsInduced
Abortions
Outcome
Age of WomanReported
PregnanciesLive
BirthsFetal
DeathsInduced
Abortions
Outcome
18-19 73
20-29 814
30 and Over 497
61
748
458
0
4
1
12
62
38
All Ages* 56.4
Under 15** ND
15-17 11.5
61.7
ND
13.8
Age of Woman Birth Rate Reported Pregnancy Rate Age of Woman Birth Rate Reported Pregnancy Rate
18-19 30.1
20-29 96.4
30 and Over** 29.8
36.0
105.0
32.4
^Live births, fetal deaths of 16+ weeks gestation, and induced abortions performed in-state. Notes: All ages includes any unknown ages. All rates per 1,000.*All Ages includes female population ages 15-44. ** Under 15 includes female population ages 10-14; 30 and Over includes female population ages 30-49.
Hispanic
ND
ND
ND
(of any race)
ND
ND
ND
Asian / Pacific
General Notes: Crude and age-adjusted rates based on less than 10 events are considered statistically unreliable and are not displayed (ND), unless otherwise noted. Starting in 2013, race of resident was derived from multiple race selections. A person is Multi-Race if they identify as more than one race. Prior to 2013, race of resident was derived from a single race designation.
Morbidity (2012-2014 Residents)
Reported Incidence and Average Annual Rate (per 100,000) for Selected Notifiable Diseases (2012-2014)
HIV 20 4.8
Syphilis 3 ND
Tuberculosis 5 ND
Total Rate
Chlamydia 957 228.0
Giardiasis 31 7.4
Gonorrhea 182 43.4
Hepatitis: Type A < 5 ND
Total Rate
Lyme Disease 188 44.8
Salmonellosis 52 12.4
Total Rate
Campylobacteriosis 30 7.1 Hep. B* Acute 0 ND
Shigellosis < 5 ND
*Hepatitis: Type B **Meningococcal Disease
Meningococcal** < 5 ND
Pertussis 45 10.7
Hep. B* Chronic 29 6.9
Chickenpox 33 7.9
Islander
Note: Communicable diseases with demographic counts of 1 to 4 are displayed as "< 5" to avoid potential identification of cases within certain geographic areas.
Multi - Race
ND
72.2
ND

Cambria County PAGE 2
Mortality (2014 Residents)
Selected Major Causes of Death, Number and Average Annual Age-Adjusted Death Rate* (2012-2014)
Number of Resident Deaths 1,776
Crude Death Rate per 1,000 12.9
Age-Adjusted Death Rate per 1,000 8.0
Number of Infant Deaths (< 1 Year of Age) 8 6 1 0
AllRaces BlackWhite
Hispanic(any race)
Infant Mortality Rate per 1,000 Live Births ND ND ND ND
Average Annual Infant Mortality Rate (2012-2014) 5.9 5.3 ND ND
Cause Total Rate
Diseases of Heart 1,398
Cancer 1,040
Stroke 236
C.L.R.D.** 279
Accidents 300
197.9
160.5
33.3
40.3
62.9
Cause Total Rate
Influenza/Pneumonia 96
Diabetes Mellitus 122
Septicemia 103
Nephritis/Nephrosis 169
Alzheimer's Disease 179
13.6
18.1
15.4
23.5
22.8
* Per 100,000 2000 U.S. standardmillion population. Age-adjusted rates
** Chronic Lower Respiratory Disease
Selected Leading Causes of Death, Number by Age Group (2014)
Under 5 Years of Age 5-24 Years of Age 25-44 Years of Age 45-64 Years of Age 65 Years and Older
Perinatal Conditions 5
Birth Defects 2
Accidents 7
Suicide 4
Assault (Homicide) 2
Accidents 17
Diseases of Heart 8
Cancer 6
Assault (Homicide) 4
Suicide 4
Cancer 81
Diseases of Heart 59
Accidents 26
C.L.R.D.** 16
Suicide 14
Diseases of Heart 395
Cancer 249
C.L.R.D.** 91
Stroke 76
Alzheimer's Disease 51
TOTAL 8 TOTAL 18 TOTAL 51 TOTAL 299 TOTAL 1,400
Note: Total includes all other causes.
Asian/PI*
0
ND
*Asian/Pacific Islander ^ NA = Multi-Race data not available before 2013.
are only comparable if the samestandard million population was usedin the calculation.
Invasive Cancer Incidence and Average Annual Age-Adjusted Rates* for Major Sites by Sex
All Sites 1,524 549.9
Prostate 337 112.5
Lung and Bronchus 202 73.2
Colon and Rectum 169 59.4
Male FemaleTotal Rate Total Rate
Female Breast 352 113.9
1,432 453.1
171 50.4
163 46.0
*Per 100,000 2000 U.S. standard million population. Age-adjusted rates are only comparable if the same standard million population was used in the calculation.
- -
- -
Male FemaleTotal Rate Total Rate
Non-Hodgkin Lymphoma 60 22.3
Melanoma of the Skin 78 28.7
69 20.0
102 32.3
38 16.1
Corpus and Uterus, NOS - -
Urinary Bladder 135
Kidney and Renal Pelvis 50 19.5
49.3 51
44
14.9
13.2
Notes: All in situ cases, except for urinary bladder, are excluded. Age-adjusted rates based on less than 20 events are statistically unreliable and are not displayed (ND).
Cancer Incidence (2011-2013 Residents)
Adult Behavioral Health Risk Factors (2012-2014)[Includes: Indiana, Cambria, Somerset, and Armstrong Counties]
General Notes: Crude and age-adjusted rates based on less than 10 events are considered statistically unreliable and are not displayed (ND), unless otherwise noted. Starting in 2013, race of resident was derived from multiple race selections. A person is Multi-Race if they identify as more than one race. Prior to 2013, race of resident was derived from a single race designation.
Percent (CI)Risk Factors
Fair or poor general health:
Obese:
Overweight (includes obese):
No health insurance (ages 18-64):
Visited a doctor in the past 2 yearsfor a routine check-up:
Percent (CI)Risk Factors
Ever told they have diabetes: Currently has asthma:
Current smoker:
Ever tested for HIV (ages 18-64):
Needed to see a doctor but couldnot due to cost in the past year:
21
37
(18 - 24)
(33 - 40)
69 (65 - 72)
13 (11 - 16)
83 (80 - 86)
11 8(9 - 13) (6 - 10)
22 (19 - 25)
25 (22 - 29)
11 (9 - 13)
Notes: Data are based on 2012-2014 annual sample surveys of Pennsylvania adults. CI= 95% Confidence Interval.
Additional state or county/regional data are available at www.statistics.health.pa.gov.
^In situ, benign, and uncertain neoplasms
Multi- Race
1
ND
NAND ^

Cambria County PAGE 3
Hospitals (7/13-6/14)
Total General Acute Care
Psychiatric Rehabilitation
4 2 0 1
General Hospitals
Beds Set Up and Staffed 481
Admissions 20,681
Beds per 1,000 Population 3.5
Admissions per 1,000 Population 150.2
Average Inpatient Occupancy Rate 58.4
Nursing Homes (2014)
Total Number Certified-Medicare Certified-Medicaid
Nursing Homes
Licensed/Approved Beds
9 9 8
941 941 911
33.5
Average Occupancy Rate 88.7
Average Length of Stay (Number of Days) 124.7
$239
Total Licensed/Approved Beds per 1,000 Population Age 65 and Older
Average Semi-Private Daily Room Rate
Drug and Alcohol Treatment
Admissions to Client Primary Diagnosis
Drug Abuse Alcohol Abuse Other*
Percent Admitted
Only Once During 7/13-6/14
1,455 677 232 11 63.0
* Includes family members receiving counseling.
All Licensed Facilities Inpatient Non-Hospital
Inpatient Hospital Partial Hospitalization Outpatient10
3
0 2 8
Note: Each licensed facility may provide more than one type of service.
State-Supported Facilities
Types of Service Provided
Number of
Clients Admitted
920
Admission by County of Residence (7/13-6/14)
Treatment Facilities (as of 6/14)
Correctional Institution 0
General Note: Crude rates based on less than 10 events are considered statistically unreliable and are not displayed (ND), unless otherwise noted.
Services Funding
Other
1
Non-Profit
3
For Profit
1
State
0
Other
0
Ambulatory Surgery Centers (7/13-6/14)
Employees
Part Time Employees 20
Full Time Employees 83
Contracted Employees 3
Payroll Employees 100 Staff with Clinical Privileges 88
Total Surgical Visits per Employee 97.4
Total Facilities 3 Total Surgical Visits 10,031
Percent of Surgical Visits, Age 65+ 45.7
Total Operating Rooms 11 Total Surgical Visits per Operating Room 911.9
Facilities Surgical Visits
Staff Licensed as M.D. 55
Total Employees per Operating Room 9.4
Average Semi-Private Daily Room Rate $775
Total Employees 103
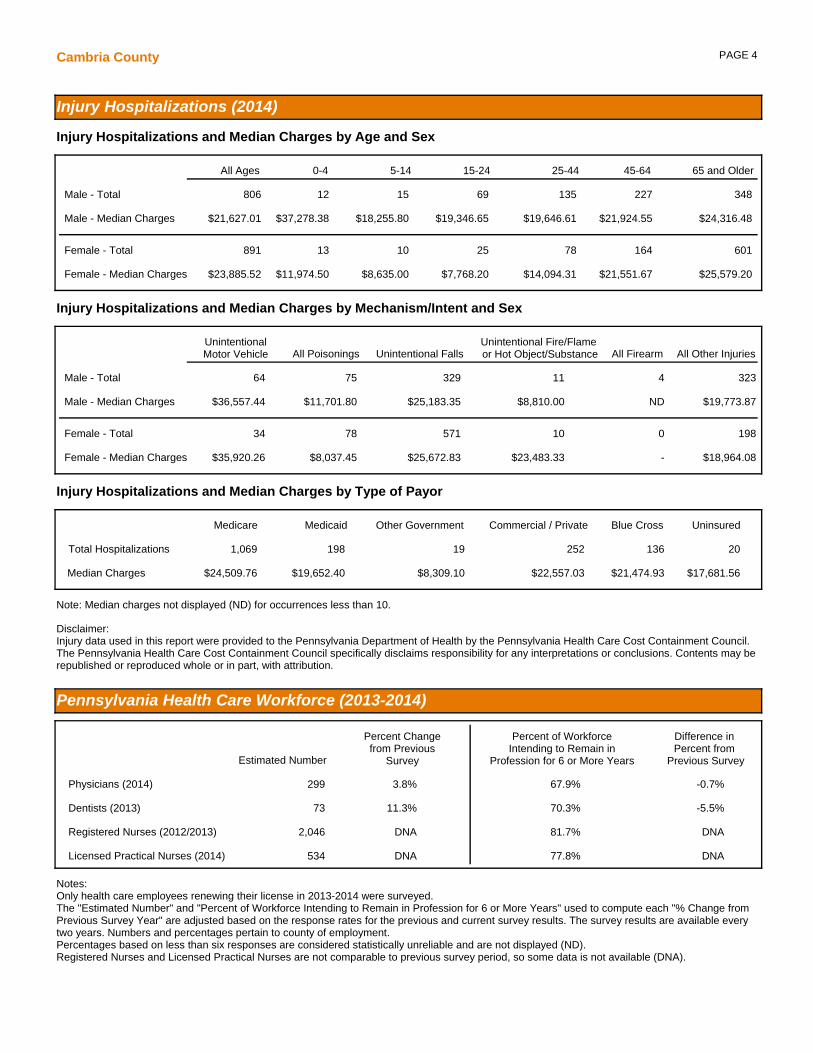
PAGE 4Cambria County
Pennsylvania Health Care Workforce (2013-2014)
Notes: Only health care employees renewing their license in 2013-2014 were surveyed.The "Estimated Number" and "Percent of Workforce Intending to Remain in Profession for 6 or More Years" used to compute each "% Change from Previous Survey Year" are adjusted based on the response rates for the previous and current survey results. The survey results are available every two years. Numbers and percentages pertain to county of employment.Percentages based on less than six responses are considered statistically unreliable and are not displayed (ND).Registered Nurses and Licensed Practical Nurses are not comparable to previous survey period, so some data is not available (DNA).
Licensed Practical Nurses (2014) 534 DNA 77.8% DNA
Physicians (2014) 299
Dentists (2013) 73
Registered Nurses (2012/2013) 2,046 DNA 81.7% DNA
3.8% 67.9% -0.7%
11.3% 70.3% -5.5%
Estimated Number
Percent Changefrom Previous
Survey
Difference in Percent from
Previous Survey
Percent of WorkforceIntending to Remain in
Profession for 6 or More Years
Injury Hospitalizations (2014)
Injury Hospitalizations and Median Charges by Age and Sex
Injury Hospitalizations and Median Charges by Type of Payor
Injury Hospitalizations and Median Charges by Mechanism/Intent and Sex
0-4 5-14 15-24 25-44 45-64 65 and Older
Male - Total
Male - Median Charges
Female - Total
Female - Median Charges
UnintentionalMotor Vehicle All Poisonings Unintentional Falls
Unintentional Fire/Flame or Hot Object/Substance All Firearm All Other Injuries
Male - Total
Male - Median Charges
Female - Total
Female - Median Charges
Medicare Medicaid Other Government Commercial / Private Blue Cross Uninsured
Total Hospitalizations
Median Charges
All Ages
806 12 15 69 135 227 348
$21,627.01 $37,278.38 $18,255.80 $19,346.65 $19,646.61 $21,924.55 $24,316.48
891 13 10 25 78 164 601
$23,885.52 $11,974.50 $8,635.00 $7,768.20 $14,094.31 $21,551.67 $25,579.20
Note: Median charges not displayed (ND) for occurrences less than 10.
201,069 198 13625219
$17,681.56 $24,509.76 $19,652.40 $21,474.93 $22,557.03 $8,309.10
198
323
34
64
78
75
571
329
10
11
0
4
$18,964.08
$19,773.87
$35,920.26
$36,557.44
$8,037.45
$11,701.80
$25,672.83
$25,183.35
$23,483.33
$8,810.00
-
ND
Disclaimer: Injury data used in this report were provided to the Pennsylvania Department of Health by the Pennsylvania Health Care Cost Containment Council. The Pennsylvania Health Care Cost Containment Council specifically disclaims responsibility for any interpretations or conclusions. Contents may be republished or reproduced whole or in part, with attribution.

Cameron CountyHealth Profile 2016
Demographic Data (2014)
% Population Change 2010 to 2014 -5.5
Median Age of the Population (2010-2014) 49.5
% Population Aged 65 and Over 23.8
Population per Square Mile 12.1
% Population with Income Below Poverty Level (2010-2014) 12.8
Per Capita Personal Income $41,153
% Labor Force Unemployed - Annual Average 7.1
% Population Eligible for Medical Assistance 23.8
Estimated Population by Age and Sex (2014)
Age Total Male Female Age Total Male Female
All Ages 4,805
Under 5 221
5-14 453
15-24 500
25-34 436
2,380
115
241
236
232
2,425
106
212
264
204
35-44 481
45-54 723
55-64 847
65-74 665
75+ 479
251
369
416
350
170
230
354
431
315
309
Natality and Reported Pregnancies^ (2014 Residents)
Crude Birth Rate11.9
Average Annual General70.7
% Low Birth Weight ND
% Prenatal Care in 1st Trimester 77.8
% Births to Mothers Under 18 ND
ND
79.2
ND
ND
ND
ND
Per 1,000 Population
Fertility Rate* (2012-2014)
All Races White Black
All Ages 58
Under 15 0
15-17 0
57
0
0
0
0
0
1
0
0
Age of WomanReported
PregnanciesLive
BirthsFetal
DeathsInduced
Abortions
Outcome
Age of WomanReported
PregnanciesLive
BirthsFetal
DeathsInduced
Abortions
Outcome
18-19 7
20-29 33
30 and Over 18
7
33
17
0
0
0
0
0
1
All Ages* 81.7
Under 15** ND
15-17 ND
83.1
ND
ND
Age of Woman Birth Rate Reported Pregnancy Rate Age of Woman Birth Rate Reported Pregnancy Rate
18-19 ND
20-29 154.9
30 and Over** 34.3
ND
154.9
36.4
^Live births, fetal deaths of 16+ weeks gestation, and induced abortions performed in-state. Notes: All ages includes any unknown ages. All rates per 1,000.*All Ages includes female population ages 15-44. ** Under 15 includes female population ages 10-14; 30 and Over includes female population ages 30-49.
Hispanic
ND
ND
ND
(of any race)
ND
ND
ND
Asian / Pacific
General Notes: Crude and age-adjusted rates based on less than 10 events are considered statistically unreliable and are not displayed (ND), unless otherwise noted. Starting in 2013, race of resident was derived from multiple race selections. A person is Multi-Race if they identify as more than one race. Prior to 2013, race of resident was derived from a single race designation.
Morbidity (2012-2014 Residents)
Reported Incidence and Average Annual Rate (per 100,000) for Selected Notifiable Diseases (2012-2014)
HIV 0 ND
Syphilis 0 ND
Tuberculosis 0 ND
Total Rate
Chlamydia 35 239.2
Giardiasis < 5 ND
Gonorrhea 0 ND
Hepatitis: Type A 0 ND
Total Rate
Lyme Disease 60 410.1
Salmonellosis < 5 ND
Total Rate
Campylobacteriosis < 5 ND Hep. B* Acute < 5 ND
Shigellosis 0 ND
*Hepatitis: Type B **Meningococcal Disease
Meningococcal** 0 ND
Pertussis < 5 ND
Hep. B* Chronic < 5 ND
Chickenpox < 5 ND
Islander
Note: Communicable diseases with demographic counts of 1 to 4 are displayed as "< 5" to avoid potential identification of cases within certain geographic areas.
Multi - Race
ND
ND
ND

Cameron County PAGE 2
Mortality (2014 Residents)
Selected Major Causes of Death, Number and Average Annual Age-Adjusted Death Rate* (2012-2014)
Number of Resident Deaths 53
Crude Death Rate per 1,000 11.0
Age-Adjusted Death Rate per 1,000 6.1
Number of Infant Deaths (< 1 Year of Age) 0 0 0 0
AllRaces BlackWhite
Hispanic(any race)
Infant Mortality Rate per 1,000 Live Births ND ND ND ND
Average Annual Infant Mortality Rate (2012-2014) ND ND ND ND
Cause Total Rate
Diseases of Heart 36
Cancer 32
Stroke 9
C.L.R.D.** 9
Accidents 10
135.8
119.4
ND
ND
41.1
Cause Total Rate
Influenza/Pneumonia 4
Diabetes Mellitus 8
Septicemia 3
Nephritis/Nephrosis 7
Alzheimer's Disease 8
ND
ND
ND
ND
ND
* Per 100,000 2000 U.S. standardmillion population. Age-adjusted rates
** Chronic Lower Respiratory Disease
Selected Leading Causes of Death, Number by Age Group (2014)
Under 5 Years of Age 5-24 Years of Age 25-44 Years of Age 45-64 Years of Age 65 Years and Older
Diseases of Heart 2 Cancer 9
Diseases of Heart 7
Alzheimer's Disease 4
C.L.R.D.** 3
TOTAL 0 TOTAL 0 TOTAL 1 TOTAL 11 TOTAL 41
Note: Total includes all other causes.
Asian/PI*
0
ND
*Asian/Pacific Islander ^ NA = Multi-Race data not available before 2013.
are only comparable if the samestandard million population was usedin the calculation.
Invasive Cancer Incidence and Average Annual Age-Adjusted Rates* for Major Sites by Sex
All Sites 66 578.6
Prostate 22 178.6
Lung and Bronchus 8 ND
Colon and Rectum 11 ND
Male FemaleTotal Rate Total Rate
Female Breast 20 174.1
54 494.2
5 ND
6 ND
*Per 100,000 2000 U.S. standard million population. Age-adjusted rates are only comparable if the same standard million population was used in the calculation.
- -
- -
Male FemaleTotal Rate Total Rate
Non-Hodgkin Lymphoma 3 ND
Melanoma of the Skin 2 ND
4 ND
3 ND
2 ND
Corpus and Uterus, NOS - -
Urinary Bladder 4
Kidney and Renal Pelvis 2 ND
ND 2
0
ND
ND
Notes: All in situ cases, except for urinary bladder, are excluded. Age-adjusted rates based on less than 20 events are statistically unreliable and are not displayed (ND).
Cancer Incidence (2011-2013 Residents)
Adult Behavioral Health Risk Factors (2012-2014)[Includes: Forest, Elk, Cameron, Clearfield, Jefferson, Clarion, McKean, and Warren Counties]
General Notes: Crude and age-adjusted rates based on less than 10 events are considered statistically unreliable and are not displayed (ND), unless otherwise noted. Starting in 2013, race of resident was derived from multiple race selections. A person is Multi-Race if they identify as more than one race. Prior to 2013, race of resident was derived from a single race designation.
Percent (CI)Risk Factors
Fair or poor general health:
Obese:
Overweight (includes obese):
No health insurance (ages 18-64):
Visited a doctor in the past 2 yearsfor a routine check-up:
Percent (CI)Risk Factors
Ever told they have diabetes: Currently has asthma:
Current smoker:
Ever tested for HIV (ages 18-64):
Needed to see a doctor but couldnot due to cost in the past year:
20
33
(17 - 22)
(30 - 36)
69 (66 - 72)
15 (12 - 18)
84 (81 - 86)
12 11(10 - 14) (9 - 13)
23 (21 - 26)
29 (26 - 33)
10 (8 - 12)
Notes: Data are based on 2012-2014 annual sample surveys of Pennsylvania adults. CI= 95% Confidence Interval.
Additional state or county/regional data are available at www.statistics.health.pa.gov.
^In situ, benign, and uncertain neoplasms
Multi- Race
0
ND
NAND ^

Cameron County PAGE 3
Hospitals (7/13-6/14)
Total General Acute Care
Psychiatric Rehabilitation
0 0 0 0
General Hospitals
Beds Set Up and Staffed -
Admissions -
Beds per 1,000 Population -
Admissions per 1,000 Population -
Average Inpatient Occupancy Rate -
Nursing Homes (2014)
Total Number Certified-Medicare Certified-Medicaid
Nursing Homes
Licensed/Approved Beds
1 1 1
40 40 40
35.0
Average Occupancy Rate 87.6
Average Length of Stay (Number of Days) 183.2
$180
Total Licensed/Approved Beds per 1,000 Population Age 65 and Older
Average Semi-Private Daily Room Rate
Drug and Alcohol Treatment
Admissions to Client Primary Diagnosis
Drug Abuse Alcohol Abuse Other*
Percent Admitted
Only Once During 7/13-6/14
66 37 15 1 81.1
* Includes family members receiving counseling.
All Licensed Facilities Inpatient Non-Hospital
Inpatient Hospital Partial Hospitalization Outpatient1
0
0 0 1
Note: Each licensed facility may provide more than one type of service.
State-Supported Facilities
Types of Service Provided
Number of
Clients Admitted
53
Admission by County of Residence (7/13-6/14)
Treatment Facilities (as of 6/14)
Correctional Institution 0
General Note: Crude rates based on less than 10 events are considered statistically unreliable and are not displayed (ND), unless otherwise noted.
Services Funding
Other
0
Non-Profit
0
For Profit
0
State
0
Other
0
Ambulatory Surgery Centers (7/13-6/14)
Employees
Part Time Employees -
Full Time Employees -
Contracted Employees -
Payroll Employees - Staff with Clinical Privileges -
Total Surgical Visits per Employee -
Total Facilities 0 Total Surgical Visits -
Percent of Surgical Visits, Age 65+ -
Total Operating Rooms - Total Surgical Visits per Operating Room -
Facilities Surgical Visits
Staff Licensed as M.D. -
Total Employees per Operating Room -
Average Semi-Private Daily Room Rate -
Total Employees -

PAGE 4Cameron County
Pennsylvania Health Care Workforce (2013-2014)
Notes: Only health care employees renewing their license in 2013-2014 were surveyed.The "Estimated Number" and "Percent of Workforce Intending to Remain in Profession for 6 or More Years" used to compute each "% Change from Previous Survey Year" are adjusted based on the response rates for the previous and current survey results. The survey results are available every two years. Numbers and percentages pertain to county of employment.Percentages based on less than six responses are considered statistically unreliable and are not displayed (ND).Registered Nurses and Licensed Practical Nurses are not comparable to previous survey period, so some data is not available (DNA).
Licensed Practical Nurses (2014) 19 DNA 71.9% DNA
Physicians (2014) ND
Dentists (2013) ND
Registered Nurses (2012/2013) 11 DNA 80.0% DNA
ND ND ND
ND ND ND
Estimated Number
Percent Changefrom Previous
Survey
Difference in Percent from
Previous Survey
Percent of WorkforceIntending to Remain in
Profession for 6 or More Years
Injury Hospitalizations (2014)
Injury Hospitalizations and Median Charges by Age and Sex
Injury Hospitalizations and Median Charges by Type of Payor
Injury Hospitalizations and Median Charges by Mechanism/Intent and Sex
0-4 5-14 15-24 25-44 45-64 65 and Older
Male - Total
Male - Median Charges
Female - Total
Female - Median Charges
UnintentionalMotor Vehicle All Poisonings Unintentional Falls
Unintentional Fire/Flame or Hot Object/Substance All Firearm All Other Injuries
Male - Total
Male - Median Charges
Female - Total
Female - Median Charges
Medicare Medicaid Other Government Commercial / Private Blue Cross Uninsured
Total Hospitalizations
Median Charges
All Ages
34 1 0 1 5 13 14
$40,592.68 ND - ND ND $18,129.45 $44,802.15
34 0 1 1 2 7 23
$20,232.44 - ND ND ND ND $19,528.13
Note: Median charges not displayed (ND) for occurrences less than 10.
244 11 380
ND $22,718.57 $36,613.71 ND ND -
8
16
3
2
1
2
20
12
2
2
0
0
ND
$21,888.75
ND
ND
ND
ND
$22,718.57
$41,149.74
ND
ND
-
-
Disclaimer: Injury data used in this report were provided to the Pennsylvania Department of Health by the Pennsylvania Health Care Cost Containment Council. The Pennsylvania Health Care Cost Containment Council specifically disclaims responsibility for any interpretations or conclusions. Contents may be republished or reproduced whole or in part, with attribution.

Carbon CountyHealth Profile 2016
Demographic Data (2014)
% Population Change 2010 to 2014 -1.2
Median Age of the Population (2010-2014) 44.8
% Population Aged 65 and Over 19.7
Population per Square Mile 168.9
% Population with Income Below Poverty Level (2010-2014) 11.1
Per Capita Personal Income $38,866
% Labor Force Unemployed - Annual Average 7.1
% Population Eligible for Medical Assistance 15.7
Estimated Population by Age and Sex (2014)
Age Total Male Female Age Total Male Female
All Ages 64,441
Under 5 2,994
5-14 7,360
15-24 6,794
25-34 7,037
31,903
1,506
3,717
3,541
3,559
32,538
1,488
3,643
3,253
3,478
35-44 7,630
45-54 9,881
55-64 10,080
65-74 7,157
75+ 5,508
3,868
4,975
5,008
3,519
2,210
3,762
4,906
5,072
3,638
3,298
Natality and Reported Pregnancies^ (2014 Residents)
Crude Birth Rate9.0
Average Annual General54.2
% Low Birth Weight 8.3
% Prenatal Care in 1st Trimester 78.0
% Births to Mothers Under 18 ND
8.7
78.9
ND
ND
ND
ND
Per 1,000 Population
Fertility Rate* (2012-2014)
All Races White Black
All Ages 670
Under 15 1
15-17 10
582
1
5
5
0
0
83
0
5
Age of WomanReported
PregnanciesLive
BirthsFetal
DeathsInduced
Abortions
Outcome
Age of WomanReported
PregnanciesLive
BirthsFetal
DeathsInduced
Abortions
Outcome
18-19 39
20-29 379
30 and Over 241
31
331
214
0
2
3
8
46
24
All Ages* 55.5
Under 15** ND
15-17 ND
63.9
ND
9.3
Age of Woman Birth Rate Reported Pregnancy Rate Age of Woman Birth Rate Reported Pregnancy Rate
18-19 49.7
20-29 102.1
30 and Over** 26.9
62.5
116.9
30.3
^Live births, fetal deaths of 16+ weeks gestation, and induced abortions performed in-state. Notes: All ages includes any unknown ages. All rates per 1,000.*All Ages includes female population ages 15-44. ** Under 15 includes female population ages 10-14; 30 and Over includes female population ages 30-49.
Hispanic
ND
61.3
ND
(of any race)
ND
ND
ND
Asian / Pacific
General Notes: Crude and age-adjusted rates based on less than 10 events are considered statistically unreliable and are not displayed (ND), unless otherwise noted. Starting in 2013, race of resident was derived from multiple race selections. A person is Multi-Race if they identify as more than one race. Prior to 2013, race of resident was derived from a single race designation.
Morbidity (2012-2014 Residents)
Reported Incidence and Average Annual Rate (per 100,000) for Selected Notifiable Diseases (2012-2014)
HIV 17 8.8
Syphilis 2 ND
Tuberculosis < 5 ND
Total Rate
Chlamydia 242 124.6
Giardiasis < 5 ND
Gonorrhea 34 17.5
Hepatitis: Type A < 5 ND
Total Rate
Lyme Disease 143 73.6
Salmonellosis 12 6.2
Total Rate
Campylobacteriosis 9 ND Hep. B* Acute 0 ND
Shigellosis 0 ND
*Hepatitis: Type B **Meningococcal Disease
Meningococcal** 0 ND
Pertussis 12 6.2
Hep. B* Chronic 13 6.7
Chickenpox < 5 ND
Islander
Note: Communicable diseases with demographic counts of 1 to 4 are displayed as "< 5" to avoid potential identification of cases within certain geographic areas.
Multi - Race
ND
ND
ND

Carbon County PAGE 2
Mortality (2014 Residents)
Selected Major Causes of Death, Number and Average Annual Age-Adjusted Death Rate* (2012-2014)
Number of Resident Deaths 770
Crude Death Rate per 1,000 11.9
Age-Adjusted Death Rate per 1,000 8.2
Number of Infant Deaths (< 1 Year of Age) 3 2 0 1
AllRaces BlackWhite
Hispanic(any race)
Infant Mortality Rate per 1,000 Live Births ND ND ND ND
Average Annual Infant Mortality Rate (2012-2014) ND ND ND ND
Cause Total Rate
Diseases of Heart 555
Cancer 543
Stroke 100
C.L.R.D.** 131
Accidents 124
190.4
191.5
35.8
44.7
57.5
Cause Total Rate
Influenza/Pneumonia 36
Diabetes Mellitus 95
Septicemia 45
Nephritis/Nephrosis 49
Alzheimer's Disease 55
11.9
32.9
15.5
16.6
18.3
* Per 100,000 2000 U.S. standardmillion population. Age-adjusted rates
** Chronic Lower Respiratory Disease
Selected Leading Causes of Death, Number by Age Group (2014)
Under 5 Years of Age 5-24 Years of Age 25-44 Years of Age 45-64 Years of Age 65 Years and Older
Accidents 8
Cancer 2
Accidents 9
Suicide 6
Cancer 3
Cancer 35
Diseases of Heart 27
Accidents 9
Diabetes Mellitus 8
Influenza/Pneumonia 5
Cancer 140
Diseases of Heart 140
C.L.R.D.** 46
Diabetes Mellitus 28
Stroke 26
TOTAL 3 TOTAL 10 TOTAL 29 TOTAL 127 TOTAL 601
Note: Total includes all other causes.
Asian/PI*
0
ND
*Asian/Pacific Islander ^ NA = Multi-Race data not available before 2013.
are only comparable if the samestandard million population was usedin the calculation.
Invasive Cancer Incidence and Average Annual Age-Adjusted Rates* for Major Sites by Sex
All Sites 671 523.0
Prostate 148 108.1
Lung and Bronchus 106 81.9
Colon and Rectum 57 44.0
Male FemaleTotal Rate Total Rate
Female Breast 164 115.6
661 469.8
91 58.6
58 37.6
*Per 100,000 2000 U.S. standard million population. Age-adjusted rates are only comparable if the same standard million population was used in the calculation.
- -
- -
Male FemaleTotal Rate Total Rate
Non-Hodgkin Lymphoma 27 21.5
Melanoma of the Skin 32 26.7
30 18.7
54 37.8
23 19.8
Corpus and Uterus, NOS - -
Urinary Bladder 65
Kidney and Renal Pelvis 27 20.3
51.3 17
19
ND
ND
Notes: All in situ cases, except for urinary bladder, are excluded. Age-adjusted rates based on less than 20 events are statistically unreliable and are not displayed (ND).
Cancer Incidence (2011-2013 Residents)
Adult Behavioral Health Risk Factors (2012-2014)[Includes: Carbon, Lehigh, and Northampton Counties]
General Notes: Crude and age-adjusted rates based on less than 10 events are considered statistically unreliable and are not displayed (ND), unless otherwise noted. Starting in 2013, race of resident was derived from multiple race selections. A person is Multi-Race if they identify as more than one race. Prior to 2013, race of resident was derived from a single race designation.
Percent (CI)Risk Factors
Fair or poor general health:
Obese:
Overweight (includes obese):
No health insurance (ages 18-64):
Visited a doctor in the past 2 yearsfor a routine check-up:
Percent (CI)Risk Factors
Ever told they have diabetes: Currently has asthma:
Current smoker:
Ever tested for HIV (ages 18-64):
Needed to see a doctor but couldnot due to cost in the past year:
18
29
(16 - 21)
(27 - 32)
66 (63 - 69)
13 (11 - 16)
82 (80 - 84)
11 12(9 - 13) (10 - 14)
21 (19 - 24)
40 (36 - 44)
13 (11 - 15)
Notes: Data are based on 2012-2014 annual sample surveys of Pennsylvania adults. CI= 95% Confidence Interval.
Additional state or county/regional data are available at www.statistics.health.pa.gov.
^In situ, benign, and uncertain neoplasms
Multi- Race
0
ND
NAND ^

Carbon County PAGE 3
Hospitals (7/13-6/14)
Total General Acute Care
Psychiatric Rehabilitation
2 2 0 0
General Hospitals
Beds Set Up and Staffed 150
Admissions 5,076
Beds per 1,000 Population 2.3
Admissions per 1,000 Population 78.8
Average Inpatient Occupancy Rate 50.2
Nursing Homes (2014)
Total Number Certified-Medicare Certified-Medicaid
Nursing Homes
Licensed/Approved Beds
3 3 3
433 433 433
34.2
Average Occupancy Rate 94.4
Average Length of Stay (Number of Days) 117.1
$222
Total Licensed/Approved Beds per 1,000 Population Age 65 and Older
Average Semi-Private Daily Room Rate
Drug and Alcohol Treatment
Admissions to Client Primary Diagnosis
Drug Abuse Alcohol Abuse Other*
Percent Admitted
Only Once During 7/13-6/14
523 296 89 2 77.3
* Includes family members receiving counseling.
All Licensed Facilities Inpatient Non-Hospital
Inpatient Hospital Partial Hospitalization Outpatient2
0
0 0 2
Note: Each licensed facility may provide more than one type of service.
State-Supported Facilities
Types of Service Provided
Number of
Clients Admitted
387
Admission by County of Residence (7/13-6/14)
Treatment Facilities (as of 6/14)
Correctional Institution 0
General Note: Crude rates based on less than 10 events are considered statistically unreliable and are not displayed (ND), unless otherwise noted.
Services Funding
Other
0
Non-Profit
2
For Profit
0
State
0
Other
0
Ambulatory Surgery Centers (7/13-6/14)
Employees
Part Time Employees 0
Full Time Employees 13
Contracted Employees 6
Payroll Employees 7 Staff with Clinical Privileges 2
Total Surgical Visits per Employee 100.8
Total Facilities 1 Total Surgical Visits 1,311
Percent of Surgical Visits, Age 65+ 37.0
Total Operating Rooms 1 Total Surgical Visits per Operating Room 1,311.0
Facilities Surgical Visits
Staff Licensed as M.D. 2
Total Employees per Operating Room 13.0
Average Semi-Private Daily Room Rate $1,372
Total Employees 13
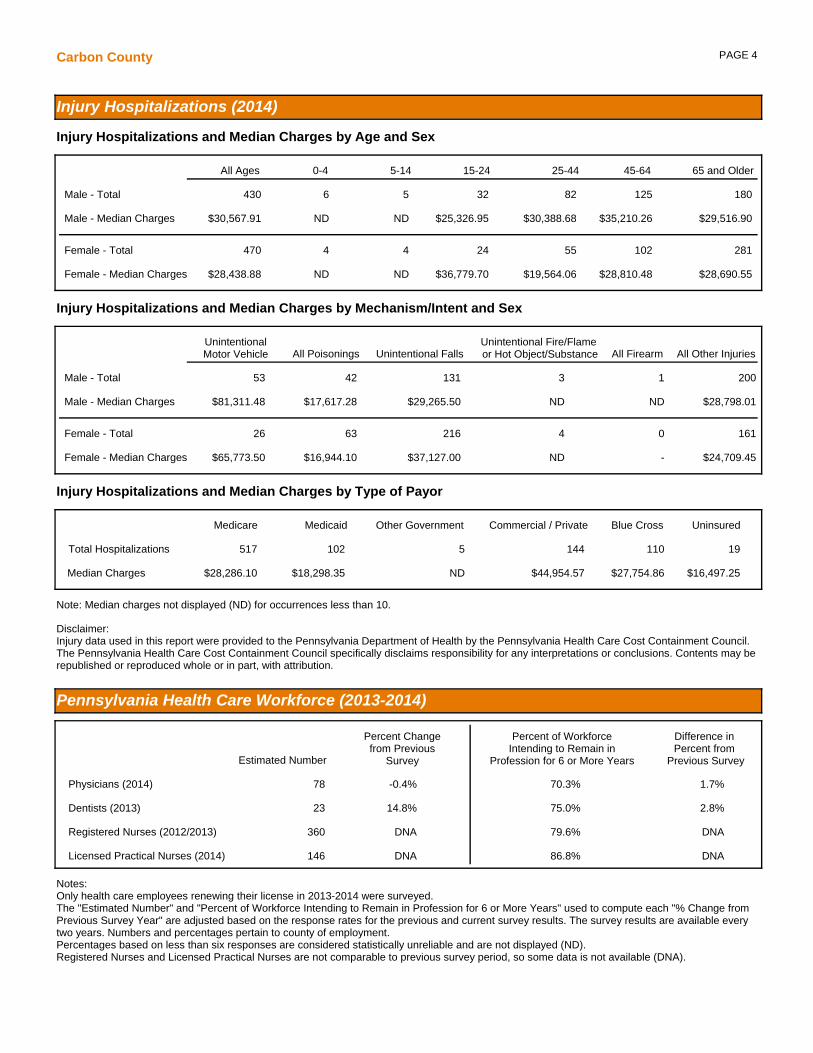
PAGE 4Carbon County
Pennsylvania Health Care Workforce (2013-2014)
Notes: Only health care employees renewing their license in 2013-2014 were surveyed.The "Estimated Number" and "Percent of Workforce Intending to Remain in Profession for 6 or More Years" used to compute each "% Change from Previous Survey Year" are adjusted based on the response rates for the previous and current survey results. The survey results are available every two years. Numbers and percentages pertain to county of employment.Percentages based on less than six responses are considered statistically unreliable and are not displayed (ND).Registered Nurses and Licensed Practical Nurses are not comparable to previous survey period, so some data is not available (DNA).
Licensed Practical Nurses (2014) 146 DNA 86.8% DNA
Physicians (2014) 78
Dentists (2013) 23
Registered Nurses (2012/2013) 360 DNA 79.6% DNA
-0.4% 70.3% 1.7%
14.8% 75.0% 2.8%
Estimated Number
Percent Changefrom Previous
Survey
Difference in Percent from
Previous Survey
Percent of WorkforceIntending to Remain in
Profession for 6 or More Years
Injury Hospitalizations (2014)
Injury Hospitalizations and Median Charges by Age and Sex
Injury Hospitalizations and Median Charges by Type of Payor
Injury Hospitalizations and Median Charges by Mechanism/Intent and Sex
0-4 5-14 15-24 25-44 45-64 65 and Older
Male - Total
Male - Median Charges
Female - Total
Female - Median Charges
UnintentionalMotor Vehicle All Poisonings Unintentional Falls
Unintentional Fire/Flame or Hot Object/Substance All Firearm All Other Injuries
Male - Total
Male - Median Charges
Female - Total
Female - Median Charges
Medicare Medicaid Other Government Commercial / Private Blue Cross Uninsured
Total Hospitalizations
Median Charges
All Ages
430 6 5 32 82 125 180
$30,567.91 ND ND $25,326.95 $30,388.68 $35,210.26 $29,516.90
470 4 4 24 55 102 281
$28,438.88 ND ND $36,779.70 $19,564.06 $28,810.48 $28,690.55
Note: Median charges not displayed (ND) for occurrences less than 10.
19517 102 1101445
$16,497.25 $28,286.10 $18,298.35 $27,754.86 $44,954.57 ND
161
200
26
53
63
42
216
131
4
3
0
1
$24,709.45
$28,798.01
$65,773.50
$81,311.48
$16,944.10
$17,617.28
$37,127.00
$29,265.50
ND
ND
-
ND
Disclaimer: Injury data used in this report were provided to the Pennsylvania Department of Health by the Pennsylvania Health Care Cost Containment Council. The Pennsylvania Health Care Cost Containment Council specifically disclaims responsibility for any interpretations or conclusions. Contents may be republished or reproduced whole or in part, with attribution.

Centre CountyHealth Profile 2016
Demographic Data (2014)
% Population Change 2010 to 2014 3.1
Median Age of the Population (2010-2014) 29.7
% Population Aged 65 and Over 12.4
Population per Square Mile 143.0
% Population with Income Below Poverty Level (2010-2014) 20.3
Per Capita Personal Income $39,973
% Labor Force Unemployed - Annual Average 4.3
% Population Eligible for Medical Assistance 7.5
Estimated Population by Age and Sex (2014)
Age Total Male Female Age Total Male Female
All Ages 158,742
Under 5 6,526
5-14 13,661
15-24 45,601
25-34 21,577
83,222
3,373
6,900
24,671
12,268
75,520
3,153
6,761
20,930
9,309
35-44 16,505
45-54 18,080
55-64 17,033
65-74 10,893
75+ 8,866
9,038
9,411
8,681
5,225
3,655
7,467
8,669
8,352
5,668
5,211
Natality and Reported Pregnancies^ (2014 Residents)
Crude Birth Rate8.3
Average Annual General34.1
% Low Birth Weight 6.7
% Prenatal Care in 1st Trimester 79.6
% Births to Mothers Under 18 ND
6.9
80.3
ND
ND
72.2
ND
Per 1,000 Population
Fertility Rate* (2012-2014)
All Races White Black
All Ages 1,482
Under 15 0
15-17 3
1,312
0
3
10
0
0
160
0
0
Age of WomanReported
PregnanciesLive
BirthsFetal
DeathsInduced
Abortions
Outcome
Age of WomanReported
PregnanciesLive
BirthsFetal
DeathsInduced
Abortions
Outcome
18-19 40
20-29 724
30 and Over 715
23
619
667
0
2
8
17
103
40
All Ages* 34.8
Under 15** ND
15-17 ND
39.3
ND
ND
Age of Woman Birth Rate Reported Pregnancy Rate Age of Woman Birth Rate Reported Pregnancy Rate
18-19 4.1
20-29 33.4
30 and Over** 42.9
7.2
39.1
46.0
^Live births, fetal deaths of 16+ weeks gestation, and induced abortions performed in-state. Notes: All ages includes any unknown ages. All rates per 1,000.*All Ages includes female population ages 15-44. ** Under 15 includes female population ages 10-14; 30 and Over includes female population ages 30-49.
Hispanic
ND
71.4
ND
(of any race)
ND
78.1
ND
Asian / Pacific
General Notes: Crude and age-adjusted rates based on less than 10 events are considered statistically unreliable and are not displayed (ND), unless otherwise noted. Starting in 2013, race of resident was derived from multiple race selections. A person is Multi-Race if they identify as more than one race. Prior to 2013, race of resident was derived from a single race designation.
Morbidity (2012-2014 Residents)
Reported Incidence and Average Annual Rate (per 100,000) for Selected Notifiable Diseases (2012-2014)
HIV 26 5.5
Syphilis 8 ND
Tuberculosis < 5 ND
Total Rate
Chlamydia 1,270 270.6
Giardiasis 36 7.7
Gonorrhea 228 48.6
Hepatitis: Type A < 5 ND
Total Rate
Lyme Disease 466 99.3
Salmonellosis 57 12.1
Total Rate
Campylobacteriosis 136 29.0 Hep. B* Acute 0 ND
Shigellosis < 5 ND
*Hepatitis: Type B **Meningococcal Disease
Meningococcal** 0 ND
Pertussis 39 8.3
Hep. B* Chronic 107 22.8
Chickenpox 40 8.5
Islander
Note: Communicable diseases with demographic counts of 1 to 4 are displayed as "< 5" to avoid potential identification of cases within certain geographic areas.
Multi - Race
ND
76.0
ND

Centre County PAGE 2
Mortality (2014 Residents)
Selected Major Causes of Death, Number and Average Annual Age-Adjusted Death Rate* (2012-2014)
Number of Resident Deaths 874
Crude Death Rate per 1,000 5.5
Age-Adjusted Death Rate per 1,000 5.5
Number of Infant Deaths (< 1 Year of Age) 5 4 0 0
AllRaces BlackWhite
Hispanic(any race)
Infant Mortality Rate per 1,000 Live Births ND ND ND ND
Average Annual Infant Mortality Rate (2012-2014) 4.7 4.2 ND ND
Cause Total Rate
Diseases of Heart 748
Cancer 641
Stroke 135
C.L.R.D.** 128
Accidents 139
160.9
139.1
28.3
27.5
30.7
Cause Total Rate
Influenza/Pneumonia 83
Diabetes Mellitus 52
Septicemia 39
Nephritis/Nephrosis 50
Alzheimer's Disease 71
17.4
11.1
8.2
10.5
14.6
* Per 100,000 2000 U.S. standardmillion population. Age-adjusted rates
** Chronic Lower Respiratory Disease
Selected Leading Causes of Death, Number by Age Group (2014)
Under 5 Years of Age 5-24 Years of Age 25-44 Years of Age 45-64 Years of Age 65 Years and Older
Birth Defects 3
Perinatal Conditions 2
Accidents 6
Cancer 2
Suicide 2
Accidents 13
Cancer 3
Diseases of Heart 3
HIV Disease 2
Cancer 47
Diseases of Heart 36
Accidents 8
Suicide 6
Diseases of Heart 205
Cancer 164
Stroke 38
C.L.R.D.** 36
TOTAL 6 TOTAL 11 TOTAL 30 TOTAL 125 TOTAL 702
Note: Total includes all other causes.
Asian/PI*
1
ND
*Asian/Pacific Islander ^ NA = Multi-Race data not available before 2013.
are only comparable if the samestandard million population was usedin the calculation.
Invasive Cancer Incidence and Average Annual Age-Adjusted Rates* for Major Sites by Sex
All Sites 1,041 499.1
Prostate 261 117.1
Lung and Bronchus 142 68.8
Colon and Rectum 85 41.9
Male FemaleTotal Rate Total Rate
Female Breast 314 143.3
966 424.5
94 39.9
77 31.2
*Per 100,000 2000 U.S. standard million population. Age-adjusted rates are only comparable if the same standard million population was used in the calculation.
- -
- -
Male FemaleTotal Rate Total Rate
Non-Hodgkin Lymphoma 61 28.5
Melanoma of the Skin 91 45.9
35 14.7
76 33.2
65 28.4
Corpus and Uterus, NOS - -
Urinary Bladder 71
Kidney and Renal Pelvis 34 16.7
36.4 20
24
8.8
10.8
Notes: All in situ cases, except for urinary bladder, are excluded. Age-adjusted rates based on less than 20 events are statistically unreliable and are not displayed (ND).
Cancer Incidence (2011-2013 Residents)
Adult Behavioral Health Risk Factors (2012-2014)[Includes: Centre, Columbia, Montour, Northumberland, Snyder, and Union Counties]
General Notes: Crude and age-adjusted rates based on less than 10 events are considered statistically unreliable and are not displayed (ND), unless otherwise noted. Starting in 2013, race of resident was derived from multiple race selections. A person is Multi-Race if they identify as more than one race. Prior to 2013, race of resident was derived from a single race designation.
Percent (CI)Risk Factors
Fair or poor general health:
Obese:
Overweight (includes obese):
No health insurance (ages 18-64):
Visited a doctor in the past 2 yearsfor a routine check-up:
Percent (CI)Risk Factors
Ever told they have diabetes: Currently has asthma:
Current smoker:
Ever tested for HIV (ages 18-64):
Needed to see a doctor but couldnot due to cost in the past year:
14
31
(12 - 16)
(28 - 34)
61 (58 - 64)
13 (11 - 16)
82 (80 - 85)
10 10(8 - 11) (9 - 12)
18 (16 - 20)
27 (24 - 31)
9 (7 - 11)
Notes: Data are based on 2012-2014 annual sample surveys of Pennsylvania adults. CI= 95% Confidence Interval.
Additional state or county/regional data are available at www.statistics.health.pa.gov.
^In situ, benign, and uncertain neoplasms
Multi- Race
0
ND
NAND ^

Centre County PAGE 3
Hospitals (7/13-6/14)
Total General Acute Care
Psychiatric Rehabilitation
3 1 1 1
General Hospitals
Beds Set Up and Staffed 207
Admissions 11,874
Beds per 1,000 Population 1.3
Admissions per 1,000 Population 74.8
Average Inpatient Occupancy Rate 62.6
Nursing Homes (2014)
Total Number Certified-Medicare Certified-Medicaid
Nursing Homes
Licensed/Approved Beds
6 6 3
706 706 517
35.7
Average Occupancy Rate 90.6
Average Length of Stay (Number of Days) 199.5
$245
Total Licensed/Approved Beds per 1,000 Population Age 65 and Older
Average Semi-Private Daily Room Rate
Drug and Alcohol Treatment
Admissions to Client Primary Diagnosis
Drug Abuse Alcohol Abuse Other*
Percent Admitted
Only Once During 7/13-6/14
598 228 242 17 83.2
* Includes family members receiving counseling.
All Licensed Facilities Inpatient Non-Hospital
Inpatient Hospital Partial Hospitalization Outpatient10
1
0 0 9
Note: Each licensed facility may provide more than one type of service.
State-Supported Facilities
Types of Service Provided
Number of
Clients Admitted
487
Admission by County of Residence (7/13-6/14)
Treatment Facilities (as of 6/14)
Correctional Institution 0
General Note: Crude rates based on less than 10 events are considered statistically unreliable and are not displayed (ND), unless otherwise noted.
Services Funding
Other
0
Non-Profit
1
For Profit
2
State
0
Other
0
Ambulatory Surgery Centers (7/13-6/14)
Employees
Part Time Employees 37
Full Time Employees 155
Contracted Employees 7
Payroll Employees 185 Staff with Clinical Privileges 129
Total Surgical Visits per Employee 86.0
Total Facilities 4 Total Surgical Visits 16,517
Percent of Surgical Visits, Age 65+ 30.0
Total Operating Rooms 11 Total Surgical Visits per Operating Room 1,501.5
Facilities Surgical Visits
Staff Licensed as M.D. 99
Total Employees per Operating Room 17.5
Average Semi-Private Daily Room Rate $1,330
Total Employees 192

PAGE 4Centre County
Pennsylvania Health Care Workforce (2013-2014)
Notes: Only health care employees renewing their license in 2013-2014 were surveyed.The "Estimated Number" and "Percent of Workforce Intending to Remain in Profession for 6 or More Years" used to compute each "% Change from Previous Survey Year" are adjusted based on the response rates for the previous and current survey results. The survey results are available every two years. Numbers and percentages pertain to county of employment.Percentages based on less than six responses are considered statistically unreliable and are not displayed (ND).Registered Nurses and Licensed Practical Nurses are not comparable to previous survey period, so some data is not available (DNA).
Licensed Practical Nurses (2014) 565 DNA 86.5% DNA
Physicians (2014) 365
Dentists (2013) 73
Registered Nurses (2012/2013) 1,287 DNA 81.2% DNA
3.7% 71.3% -3.3%
3.5% 78.1% -13.9%
Estimated Number
Percent Changefrom Previous
Survey
Difference in Percent from
Previous Survey
Percent of WorkforceIntending to Remain in
Profession for 6 or More Years
Injury Hospitalizations (2014)
Injury Hospitalizations and Median Charges by Age and Sex
Injury Hospitalizations and Median Charges by Type of Payor
Injury Hospitalizations and Median Charges by Mechanism/Intent and Sex
0-4 5-14 15-24 25-44 45-64 65 and Older
Male - Total
Male - Median Charges
Female - Total
Female - Median Charges
UnintentionalMotor Vehicle All Poisonings Unintentional Falls
Unintentional Fire/Flame or Hot Object/Substance All Firearm All Other Injuries
Male - Total
Male - Median Charges
Female - Total
Female - Median Charges
Medicare Medicaid Other Government Commercial / Private Blue Cross Uninsured
Total Hospitalizations
Median Charges
All Ages
547 11 12 63 81 144 236
$32,832.35 $18,286.40 $33,660.01 $25,918.00 $23,889.30 $34,260.40 $35,555.05
680 3 2 52 68 129 426
$32,472.98 ND ND $11,590.46 $23,717.00 $38,975.70 $35,739.20
Note: Median charges not displayed (ND) for occurrences less than 10.
43724 110 14319513
$23,174.75 $35,055.63 $23,880.00 $23,778.05 $36,677.45 $14,517.20
213
226
29
49
79
52
356
212
3
8
0
0
$33,450.80
$32,100.40
$50,150.40
$50,017.47
$14,456.45
$15,643.00
$34,615.48
$35,032.23
ND
ND
-
-
Disclaimer: Injury data used in this report were provided to the Pennsylvania Department of Health by the Pennsylvania Health Care Cost Containment Council. The Pennsylvania Health Care Cost Containment Council specifically disclaims responsibility for any interpretations or conclusions. Contents may be republished or reproduced whole or in part, with attribution.
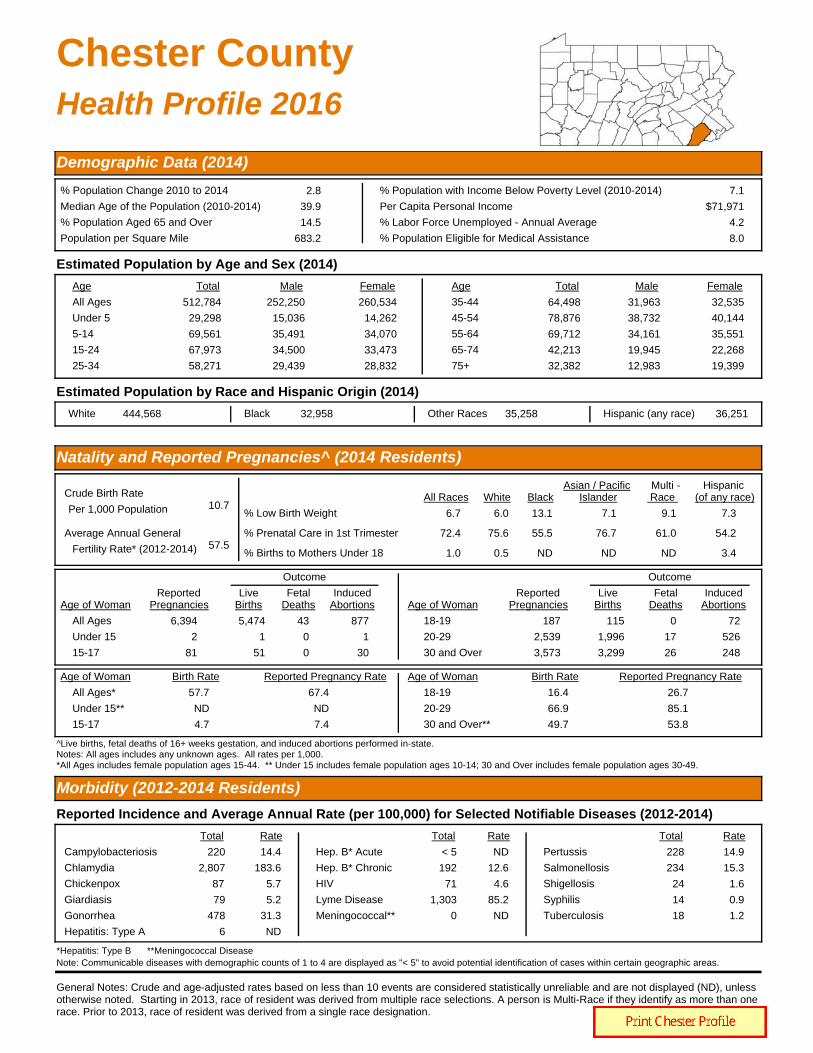
Chester CountyHealth Profile 2016
Demographic Data (2014)
% Population Change 2010 to 2014 2.8
Median Age of the Population (2010-2014) 39.9
% Population Aged 65 and Over 14.5
Population per Square Mile 683.2
% Population with Income Below Poverty Level (2010-2014) 7.1
Per Capita Personal Income $71,971
% Labor Force Unemployed - Annual Average 4.2
% Population Eligible for Medical Assistance 8.0
Estimated Population by Age and Sex (2014)
Age Total Male Female Age Total Male Female
All Ages 512,784
Under 5 29,298
5-14 69,561
15-24 67,973
25-34 58,271
252,250
15,036
35,491
34,500
29,439
260,534
14,262
34,070
33,473
28,832
35-44 64,498
45-54 78,876
55-64 69,712
65-74 42,213
75+ 32,382
31,963
38,732
34,161
19,945
12,983
32,535
40,144
35,551
22,268
19,399
Estimated Population by Race and Hispanic Origin (2014)
White 444,568 Black 32,958 Other Races 35,258 Hispanic (any race) 36,251
Natality and Reported Pregnancies^ (2014 Residents)
Crude Birth Rate10.7
Average Annual General57.5
% Low Birth Weight 6.7
% Prenatal Care in 1st Trimester 72.4
% Births to Mothers Under 18 1.0
6.0
75.6
0.5
13.1
55.5
ND
Per 1,000 Population
Fertility Rate* (2012-2014)
All Races White Black
All Ages 6,394
Under 15 2
15-17 81
5,474
1
51
43
0
0
877
1
30
Age of WomanReported
PregnanciesLive
BirthsFetal
DeathsInduced
Abortions
Outcome
Age of WomanReported
PregnanciesLive
BirthsFetal
DeathsInduced
Abortions
Outcome
18-19 187
20-29 2,539
30 and Over 3,573
115
1,996
3,299
0
17
26
72
526
248
All Ages* 57.7
Under 15** ND
15-17 4.7
67.4
ND
7.4
Age of Woman Birth Rate Reported Pregnancy Rate Age of Woman Birth Rate Reported Pregnancy Rate
18-19 16.4
20-29 66.9
30 and Over** 49.7
26.7
85.1
53.8
^Live births, fetal deaths of 16+ weeks gestation, and induced abortions performed in-state. Notes: All ages includes any unknown ages. All rates per 1,000.*All Ages includes female population ages 15-44. ** Under 15 includes female population ages 10-14; 30 and Over includes female population ages 30-49.
Hispanic
7.3
54.2
3.4
(of any race)
7.1
76.7
ND
Asian / Pacific
General Notes: Crude and age-adjusted rates based on less than 10 events are considered statistically unreliable and are not displayed (ND), unless otherwise noted. Starting in 2013, race of resident was derived from multiple race selections. A person is Multi-Race if they identify as more than one race. Prior to 2013, race of resident was derived from a single race designation.
Morbidity (2012-2014 Residents)
Reported Incidence and Average Annual Rate (per 100,000) for Selected Notifiable Diseases (2012-2014)
HIV 71 4.6
Syphilis 14 0.9
Tuberculosis 18 1.2
Total Rate
Chlamydia 2,807 183.6
Giardiasis 79 5.2
Gonorrhea 478 31.3
Hepatitis: Type A 6 ND
Total Rate
Lyme Disease 1,303 85.2
Salmonellosis 234 15.3
Total Rate
Campylobacteriosis 220 14.4 Hep. B* Acute < 5 ND
Shigellosis 24 1.6
*Hepatitis: Type B **Meningococcal Disease
Meningococcal** 0 ND
Pertussis 228 14.9
Hep. B* Chronic 192 12.6
Chickenpox 87 5.7
Islander
Note: Communicable diseases with demographic counts of 1 to 4 are displayed as "< 5" to avoid potential identification of cases within certain geographic areas.
Multi - Race
9.1
61.0
ND

Chester County PAGE 2
Mortality (2014 Residents)
Selected Major Causes of Death, Number and Average Annual Age-Adjusted Death Rate* (2012-2014)
Number of Resident Deaths 3,749
Crude Death Rate per 1,000 7.3
Age-Adjusted Death Rate per 1,000 6.2
Number of Infant Deaths (< 1 Year of Age) 21 12 5 3
AllRaces BlackWhite
Hispanic(any race)
Infant Mortality Rate per 1,000 Live Births 3.8 2.8 ND ND
Average Annual Infant Mortality Rate (2012-2014) 4.5 3.8 13.7 7.9
Cause Total Rate
Diseases of Heart 2,713
Cancer 2,718
Stroke 566
C.L.R.D.** 513
Accidents 548
150.0
152.8
31.1
29.6
34.0
Cause Total Rate
Influenza/Pneumonia 217
Diabetes Mellitus 205
Septicemia 149
Nephritis/Nephrosis 215
Alzheimer's Disease 275
11.9
11.6
8.4
12.1
15.0
* Per 100,000 2000 U.S. standardmillion population. Age-adjusted rates
** Chronic Lower Respiratory Disease
Selected Leading Causes of Death, Number by Age Group (2014)
Under 5 Years of Age 5-24 Years of Age 25-44 Years of Age 45-64 Years of Age 65 Years and Older
Perinatal Conditions 14
Birth Defects 4
Accidents 2
Accidents 26
Suicide 8
Birth Defects 3
Accidents 48
Diseases of Heart 17
Cancer 13
Suicide 8
Assault (Homicide) 4
Cancer 217
Diseases of Heart 102
Accidents 56
Suicide 26
Stroke 24
Diseases of Heart 793
Cancer 687
Stroke 181
C.L.R.D.** 148
Alzheimer's Disease 85
TOTAL 28 TOTAL 43 TOTAL 116 TOTAL 603 TOTAL 2,959
Note: Total includes all other causes.
Asian/PI*
0
ND
*Asian/Pacific Islander ^ NA = Multi-Race data not available before 2013.
are only comparable if the samestandard million population was usedin the calculation.
Invasive Cancer Incidence and Average Annual Age-Adjusted Rates* for Major Sites by Sex
All Sites 4,232 529.0
Prostate 1,069 122.5
Lung and Bronchus 464 59.2
Colon and Rectum 308 39.1
Male FemaleTotal Rate Total Rate
Female Breast 1,215 133.3
4,062 444.6
418 45.2
302 32.1
*Per 100,000 2000 U.S. standard million population. Age-adjusted rates are only comparable if the same standard million population was used in the calculation.
- -
- -
Male FemaleTotal Rate Total Rate
Non-Hodgkin Lymphoma 214 26.9
Melanoma of the Skin 317 41.2
150 16.1
281 28.9
217 24.3
Corpus and Uterus, NOS - -
Urinary Bladder 325
Kidney and Renal Pelvis 183 22.6
44.5 99
82
10.0
8.9
Notes: All in situ cases, except for urinary bladder, are excluded. Age-adjusted rates based on less than 20 events are statistically unreliable and are not displayed (ND).
Cancer Incidence (2011-2013 Residents)
Adult Behavioral Health Risk Factors (2012-2014)[Includes: Chester County Only]
General Notes: Crude and age-adjusted rates based on less than 10 events are considered statistically unreliable and are not displayed (ND), unless otherwise noted. Starting in 2013, race of resident was derived from multiple race selections. A person is Multi-Race if they identify as more than one race. Prior to 2013, race of resident was derived from a single race designation.
Percent (CI)Risk Factors
Fair or poor general health:
Obese:
Overweight (includes obese):
No health insurance (ages 18-64):
Visited a doctor in the past 2 yearsfor a routine check-up:
Percent (CI)Risk Factors
Ever told they have diabetes: Currently has asthma:
Current smoker:
Ever tested for HIV (ages 18-64):
Needed to see a doctor but couldnot due to cost in the past year:
10
21
(8 - 14)
(18 - 25)
57 (52 - 61)
11 (8 - 14)
84 (81 - 87)
9 7(6 - 12) (5 - 10)
14 (11 - 18)
35 (30 - 40)
9 (7 - 12)
Notes: Data are based on 2012-2014 annual sample surveys of Pennsylvania adults. CI= 95% Confidence Interval.
Additional state or county/regional data are available at www.statistics.health.pa.gov.
^In situ, benign, and uncertain neoplasms
Multi- Race
1
ND
NAND ^

Chester County PAGE 3
Hospitals (7/13-6/14)
Total General Acute Care
Psychiatric Rehabilitation
10 5 2 1
General Hospitals
Beds Set Up and Staffed 805
Admissions 43,814
Beds per 1,000 Population 1.6
Admissions per 1,000 Population 85.4
Average Inpatient Occupancy Rate 62.6
Nursing Homes (2014)
Total Number Certified-Medicare Certified-Medicaid
Nursing Homes
Licensed/Approved Beds
23 21 14
2,523 2,319 2,037
33.8
Average Occupancy Rate 89.2
Average Length of Stay (Number of Days) 101.9
$322
Total Licensed/Approved Beds per 1,000 Population Age 65 and Older
Average Semi-Private Daily Room Rate
Drug and Alcohol Treatment
Admissions to Client Primary Diagnosis
Drug Abuse Alcohol Abuse Other*
Percent Admitted
Only Once During 7/13-6/14
1,401 632 373 39 75.2
* Includes family members receiving counseling.
All Licensed Facilities Inpatient Non-Hospital
Inpatient Hospital Partial Hospitalization Outpatient20
5
0 4 16
Note: Each licensed facility may provide more than one type of service.
State-Supported Facilities
Types of Service Provided
Number of
Clients Admitted
1,044
Admission by County of Residence (7/13-6/14)
Treatment Facilities (as of 6/14)
Correctional Institution 0
General Note: Crude rates based on less than 10 events are considered statistically unreliable and are not displayed (ND), unless otherwise noted.
Services Funding
Other
2
Non-Profit
5
For Profit
4
State
0
Other
1
Ambulatory Surgery Centers (7/13-6/14)
Employees
Part Time Employees 201
Full Time Employees 190
Contracted Employees 99
Payroll Employees 292 Staff with Clinical Privileges 340
Total Surgical Visits per Employee 104.1
Total Facilities 12 Total Surgical Visits 40,694
Percent of Surgical Visits, Age 65+ 26.6
Total Operating Rooms 26 Total Surgical Visits per Operating Room 1,565.2
Facilities Surgical Visits
Staff Licensed as M.D. 241
Total Employees per Operating Room 15.0
Average Semi-Private Daily Room Rate $3,319
Total Employees 391

PAGE 4Chester County
Pennsylvania Health Care Workforce (2013-2014)
Notes: Only health care employees renewing their license in 2013-2014 were surveyed.The "Estimated Number" and "Percent of Workforce Intending to Remain in Profession for 6 or More Years" used to compute each "% Change from Previous Survey Year" are adjusted based on the response rates for the previous and current survey results. The survey results are available every two years. Numbers and percentages pertain to county of employment.Percentages based on less than six responses are considered statistically unreliable and are not displayed (ND).Registered Nurses and Licensed Practical Nurses are not comparable to previous survey period, so some data is not available (DNA).
Licensed Practical Nurses (2014) 1,010 DNA 81.8% DNA
Physicians (2014) 1,016
Dentists (2013) 325
Registered Nurses (2012/2013) 5,048 DNA 83.2% DNA
1.0% 76.8% -0.8%
13.2% 83.7% 4.3%
Estimated Number
Percent Changefrom Previous
Survey
Difference in Percent from
Previous Survey
Percent of WorkforceIntending to Remain in
Profession for 6 or More Years
Injury Hospitalizations (2014)
Injury Hospitalizations and Median Charges by Age and Sex
Injury Hospitalizations and Median Charges by Type of Payor
Injury Hospitalizations and Median Charges by Mechanism/Intent and Sex
0-4 5-14 15-24 25-44 45-64 65 and Older
Male - Total
Male - Median Charges
Female - Total
Female - Median Charges
UnintentionalMotor Vehicle All Poisonings Unintentional Falls
Unintentional Fire/Flame or Hot Object/Substance All Firearm All Other Injuries
Male - Total
Male - Median Charges
Female - Total
Female - Median Charges
Medicare Medicaid Other Government Commercial / Private Blue Cross Uninsured
Total Hospitalizations
Median Charges
All Ages
2,184 27 33 179 324 631 990
$44,456.68 $27,492.00 $31,784.00 $34,443.00 $38,892.40 $44,537.00 $50,279.65
2,435 19 20 96 211 493 1,596
$45,020.00 $25,514.00 $30,616.00 $39,722.50 $33,326.50 $43,628.42 $47,393.00
Note: Median charges not displayed (ND) for occurrences less than 10.
992,686 331 69973126
$36,644.00 $48,120.62 $42,804.10 $39,703.00 $39,459.00 $62,294.05
754
904
122
178
202
176
1,342
884
15
28
0
14
$43,368.50
$44,491.36
$59,261.50
$48,086.00
$27,070.95
$33,000.50
$48,002.51
$45,995.78
$103,226.54
$53,142.42
-
$98,006.50
Disclaimer: Injury data used in this report were provided to the Pennsylvania Department of Health by the Pennsylvania Health Care Cost Containment Council. The Pennsylvania Health Care Cost Containment Council specifically disclaims responsibility for any interpretations or conclusions. Contents may be republished or reproduced whole or in part, with attribution.
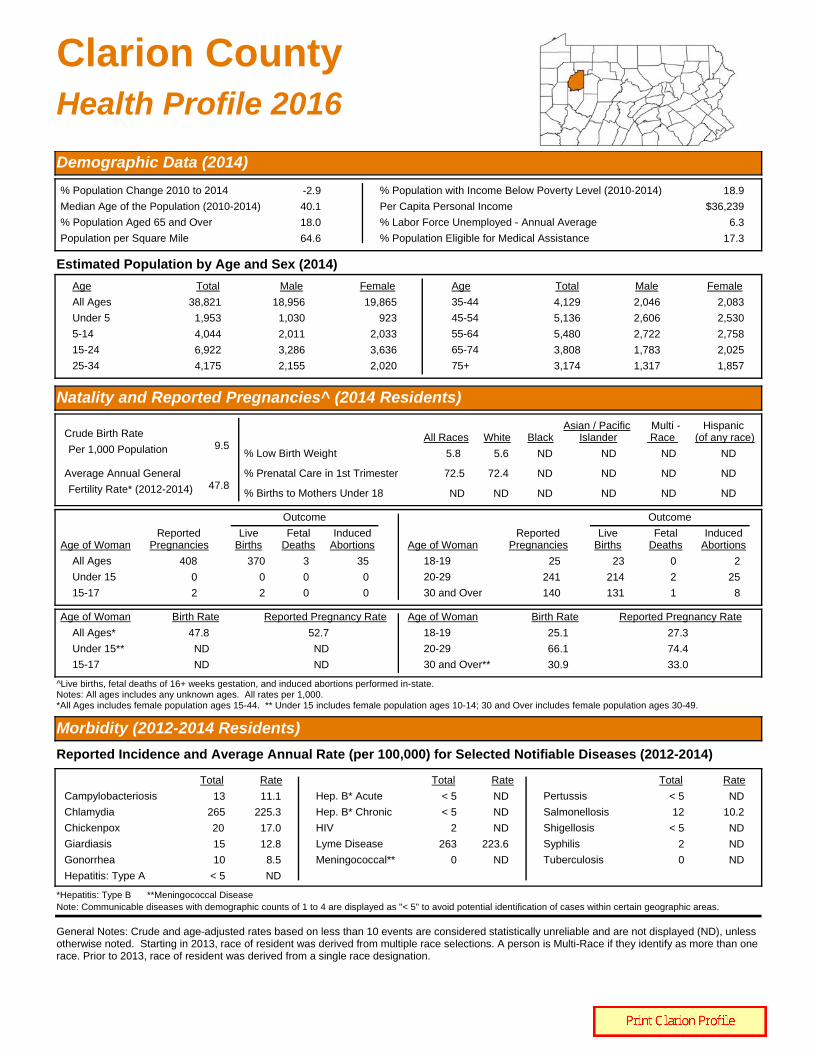
Clarion CountyHealth Profile 2016
Demographic Data (2014)
% Population Change 2010 to 2014 -2.9
Median Age of the Population (2010-2014) 40.1
% Population Aged 65 and Over 18.0
Population per Square Mile 64.6
% Population with Income Below Poverty Level (2010-2014) 18.9
Per Capita Personal Income $36,239
% Labor Force Unemployed - Annual Average 6.3
% Population Eligible for Medical Assistance 17.3
Estimated Population by Age and Sex (2014)
Age Total Male Female Age Total Male Female
All Ages 38,821
Under 5 1,953
5-14 4,044
15-24 6,922
25-34 4,175
18,956
1,030
2,011
3,286
2,155
19,865
923
2,033
3,636
2,020
35-44 4,129
45-54 5,136
55-64 5,480
65-74 3,808
75+ 3,174
2,046
2,606
2,722
1,783
1,317
2,083
2,530
2,758
2,025
1,857
Natality and Reported Pregnancies^ (2014 Residents)
Crude Birth Rate9.5
Average Annual General47.8
% Low Birth Weight 5.8
% Prenatal Care in 1st Trimester 72.5
% Births to Mothers Under 18 ND
5.6
72.4
ND
ND
ND
ND
Per 1,000 Population
Fertility Rate* (2012-2014)
All Races White Black
All Ages 408
Under 15 0
15-17 2
370
0
2
3
0
0
35
0
0
Age of WomanReported
PregnanciesLive
BirthsFetal
DeathsInduced
Abortions
Outcome
Age of WomanReported
PregnanciesLive
BirthsFetal
DeathsInduced
Abortions
Outcome
18-19 25
20-29 241
30 and Over 140
23
214
131
0
2
1
2
25
8
All Ages* 47.8
Under 15** ND
15-17 ND
52.7
ND
ND
Age of Woman Birth Rate Reported Pregnancy Rate Age of Woman Birth Rate Reported Pregnancy Rate
18-19 25.1
20-29 66.1
30 and Over** 30.9
27.3
74.4
33.0
^Live births, fetal deaths of 16+ weeks gestation, and induced abortions performed in-state. Notes: All ages includes any unknown ages. All rates per 1,000.*All Ages includes female population ages 15-44. ** Under 15 includes female population ages 10-14; 30 and Over includes female population ages 30-49.
Hispanic
ND
ND
ND
(of any race)
ND
ND
ND
Asian / Pacific
General Notes: Crude and age-adjusted rates based on less than 10 events are considered statistically unreliable and are not displayed (ND), unless otherwise noted. Starting in 2013, race of resident was derived from multiple race selections. A person is Multi-Race if they identify as more than one race. Prior to 2013, race of resident was derived from a single race designation.
Morbidity (2012-2014 Residents)
Reported Incidence and Average Annual Rate (per 100,000) for Selected Notifiable Diseases (2012-2014)
HIV 2 ND
Syphilis 2 ND
Tuberculosis 0 ND
Total Rate
Chlamydia 265 225.3
Giardiasis 15 12.8
Gonorrhea 10 8.5
Hepatitis: Type A < 5 ND
Total Rate
Lyme Disease 263 223.6
Salmonellosis 12 10.2
Total Rate
Campylobacteriosis 13 11.1 Hep. B* Acute < 5 ND
Shigellosis < 5 ND
*Hepatitis: Type B **Meningococcal Disease
Meningococcal** 0 ND
Pertussis < 5 ND
Hep. B* Chronic < 5 ND
Chickenpox 20 17.0
Islander
Note: Communicable diseases with demographic counts of 1 to 4 are displayed as "< 5" to avoid potential identification of cases within certain geographic areas.
Multi - Race
ND
ND
ND

Clarion County PAGE 2
Mortality (2014 Residents)
Selected Major Causes of Death, Number and Average Annual Age-Adjusted Death Rate* (2012-2014)
Number of Resident Deaths 437
Crude Death Rate per 1,000 11.3
Age-Adjusted Death Rate per 1,000 8.3
Number of Infant Deaths (< 1 Year of Age) 1 1 0 0
AllRaces BlackWhite
Hispanic(any race)
Infant Mortality Rate per 1,000 Live Births ND ND ND ND
Average Annual Infant Mortality Rate (2012-2014) ND ND ND ND
Cause Total Rate
Diseases of Heart 307
Cancer 288
Stroke 78
C.L.R.D.** 89
Accidents 61
192.9
183.6
48.5
55.1
50.6
Cause Total Rate
Influenza/Pneumonia 20
Diabetes Mellitus 52
Septicemia 17
Nephritis/Nephrosis 23
Alzheimer's Disease 45
12.6
33.3
10.8
14.2
27.7
* Per 100,000 2000 U.S. standardmillion population. Age-adjusted rates
** Chronic Lower Respiratory Disease
Selected Leading Causes of Death, Number by Age Group (2014)
Under 5 Years of Age 5-24 Years of Age 25-44 Years of Age 45-64 Years of Age 65 Years and Older
Accidents 2 Accidents 8
Cancer 3
Diabetes Mellitus 2
Diseases of Heart 2
Suicide 2
Cancer 24
Diseases of Heart 18
C.L.R.D.** 5
Diabetes Mellitus 3
Suicide 3
Cancer 80
Diseases of Heart 68
C.L.R.D.** 33
Stroke 27
Alzheimer's Disease 14
TOTAL 1 TOTAL 2 TOTAL 18 TOTAL 71 TOTAL 345
Note: Total includes all other causes.
Asian/PI*
0
ND
*Asian/Pacific Islander ^ NA = Multi-Race data not available before 2013.
are only comparable if the samestandard million population was usedin the calculation.
Invasive Cancer Incidence and Average Annual Age-Adjusted Rates* for Major Sites by Sex
All Sites 393 550.4
Prostate 87 113.4
Lung and Bronchus 55 76.2
Colon and Rectum 44 64.0
Male FemaleTotal Rate Total Rate
Female Breast 78 100.2
326 417.3
29 33.6
37 41.1
*Per 100,000 2000 U.S. standard million population. Age-adjusted rates are only comparable if the same standard million population was used in the calculation.
- -
- -
Male FemaleTotal Rate Total Rate
Non-Hodgkin Lymphoma 20 28.2
Melanoma of the Skin 18 ND
11 ND
31 39.1
11 ND
Corpus and Uterus, NOS - -
Urinary Bladder 38
Kidney and Renal Pelvis 17 ND
54.1 13
9
ND
ND
Notes: All in situ cases, except for urinary bladder, are excluded. Age-adjusted rates based on less than 20 events are statistically unreliable and are not displayed (ND).
Cancer Incidence (2011-2013 Residents)
Adult Behavioral Health Risk Factors (2012-2014)[Includes: Forest, Elk, Cameron, Clearfield, Jefferson, Clarion, McKean, and Warren Counties]
General Notes: Crude and age-adjusted rates based on less than 10 events are considered statistically unreliable and are not displayed (ND), unless otherwise noted. Starting in 2013, race of resident was derived from multiple race selections. A person is Multi-Race if they identify as more than one race. Prior to 2013, race of resident was derived from a single race designation.
Percent (CI)Risk Factors
Fair or poor general health:
Obese:
Overweight (includes obese):
No health insurance (ages 18-64):
Visited a doctor in the past 2 yearsfor a routine check-up:
Percent (CI)Risk Factors
Ever told they have diabetes: Currently has asthma:
Current smoker:
Ever tested for HIV (ages 18-64):
Needed to see a doctor but couldnot due to cost in the past year:
20
33
(17 - 22)
(30 - 36)
69 (66 - 72)
15 (12 - 18)
84 (81 - 86)
12 11(10 - 14) (9 - 13)
23 (21 - 26)
29 (26 - 33)
10 (8 - 12)
Notes: Data are based on 2012-2014 annual sample surveys of Pennsylvania adults. CI= 95% Confidence Interval.
Additional state or county/regional data are available at www.statistics.health.pa.gov.
^In situ, benign, and uncertain neoplasms
Multi- Race
0
ND
NAND ^

Clarion County PAGE 3
Hospitals (7/13-6/14)
Total General Acute Care
Psychiatric Rehabilitation
2 1 1 0
General Hospitals
Beds Set Up and Staffed 77
Admissions 1,882
Beds per 1,000 Population 2.0
Admissions per 1,000 Population 48.5
Average Inpatient Occupancy Rate 25.9
Nursing Homes (2014)
Total Number Certified-Medicare Certified-Medicaid
Nursing Homes
Licensed/Approved Beds
3 3 3
323 323 323
46.3
Average Occupancy Rate 77.9
Average Length of Stay (Number of Days) 143.4
$237
Total Licensed/Approved Beds per 1,000 Population Age 65 and Older
Average Semi-Private Daily Room Rate
Drug and Alcohol Treatment
Admissions to Client Primary Diagnosis
Drug Abuse Alcohol Abuse Other*
Percent Admitted
Only Once During 7/13-6/14
462 166 137 2 68.5
* Includes family members receiving counseling.
All Licensed Facilities Inpatient Non-Hospital
Inpatient Hospital Partial Hospitalization Outpatient1
0
0 1 1
Note: Each licensed facility may provide more than one type of service.
State-Supported Facilities
Types of Service Provided
Number of
Clients Admitted
305
Admission by County of Residence (7/13-6/14)
Treatment Facilities (as of 6/14)
Correctional Institution 0
General Note: Crude rates based on less than 10 events are considered statistically unreliable and are not displayed (ND), unless otherwise noted.
Services Funding
Other
0
Non-Profit
1
For Profit
1
State
0
Other
0
Ambulatory Surgery Centers (7/13-6/14)
Employees
Part Time Employees -
Full Time Employees -
Contracted Employees -
Payroll Employees - Staff with Clinical Privileges -
Total Surgical Visits per Employee -
Total Facilities 0 Total Surgical Visits -
Percent of Surgical Visits, Age 65+ -
Total Operating Rooms - Total Surgical Visits per Operating Room -
Facilities Surgical Visits
Staff Licensed as M.D. -
Total Employees per Operating Room -
Average Semi-Private Daily Room Rate $790
Total Employees -

PAGE 4Clarion County
Pennsylvania Health Care Workforce (2013-2014)
Notes: Only health care employees renewing their license in 2013-2014 were surveyed.The "Estimated Number" and "Percent of Workforce Intending to Remain in Profession for 6 or More Years" used to compute each "% Change from Previous Survey Year" are adjusted based on the response rates for the previous and current survey results. The survey results are available every two years. Numbers and percentages pertain to county of employment.Percentages based on less than six responses are considered statistically unreliable and are not displayed (ND).Registered Nurses and Licensed Practical Nurses are not comparable to previous survey period, so some data is not available (DNA).
Licensed Practical Nurses (2014) 190 DNA 84.4% DNA
Physicians (2014) 60
Dentists (2013) 13
Registered Nurses (2012/2013) 331 DNA 81.8% DNA
8.9% 75.5% -4.1%
-9.8% 63.6% -19.7%
Estimated Number
Percent Changefrom Previous
Survey
Difference in Percent from
Previous Survey
Percent of WorkforceIntending to Remain in
Profession for 6 or More Years
Injury Hospitalizations (2014)
Injury Hospitalizations and Median Charges by Age and Sex
Injury Hospitalizations and Median Charges by Type of Payor
Injury Hospitalizations and Median Charges by Mechanism/Intent and Sex
0-4 5-14 15-24 25-44 45-64 65 and Older
Male - Total
Male - Median Charges
Female - Total
Female - Median Charges
UnintentionalMotor Vehicle All Poisonings Unintentional Falls
Unintentional Fire/Flame or Hot Object/Substance All Firearm All Other Injuries
Male - Total
Male - Median Charges
Female - Total
Female - Median Charges
Medicare Medicaid Other Government Commercial / Private Blue Cross Uninsured
Total Hospitalizations
Median Charges
All Ages
203 4 1 21 33 62 82
$26,549.84 ND ND $23,476.50 $40,799.00 $38,593.04 $23,635.68
197 0 5 10 11 39 132
$16,996.77 - ND $14,032.41 $19,886.37 $16,996.77 $18,666.60
Note: Median charges not displayed (ND) for occurrences less than 10.
5231 39 39703
ND $17,834.55 $47,991.22 $21,413.00 $39,664.38 ND
52
102
14
20
10
8
119
67
2
4
0
2
$15,644.33
$22,768.25
$77,842.29
$80,443.14
$11,817.98
ND
$16,924.00
$38,902.38
ND
ND
-
ND
Disclaimer: Injury data used in this report were provided to the Pennsylvania Department of Health by the Pennsylvania Health Care Cost Containment Council. The Pennsylvania Health Care Cost Containment Council specifically disclaims responsibility for any interpretations or conclusions. Contents may be republished or reproduced whole or in part, with attribution.

Clearfield CountyHealth Profile 2016
Demographic Data (2014)
% Population Change 2010 to 2014 -0.6
Median Age of the Population (2010-2014) 43.3
% Population Aged 65 and Over 18.9
Population per Square Mile 70.9
% Population with Income Below Poverty Level (2010-2014) 15.0
Per Capita Personal Income $38,245
% Labor Force Unemployed - Annual Average 7.2
% Population Eligible for Medical Assistance 20.9
Estimated Population by Age and Sex (2014)
Age Total Male Female Age Total Male Female
All Ages 81,191
Under 5 3,782
5-14 8,543
15-24 9,479
25-34 9,599
42,463
1,937
4,389
5,268
5,656
38,728
1,845
4,154
4,211
3,943
35-44 10,382
45-54 12,451
55-64 11,631
65-74 8,277
75+ 7,047
5,774
6,731
5,952
4,001
2,755
4,608
5,720
5,679
4,276
4,292
Natality and Reported Pregnancies^ (2014 Residents)
Crude Birth Rate9.2
Average Annual General57.7
% Low Birth Weight 7.3
% Prenatal Care in 1st Trimester 74.6
% Births to Mothers Under 18 1.7
7.2
74.8
1.6
ND
ND
ND
Per 1,000 Population
Fertility Rate* (2012-2014)
All Races White Black
All Ages 804
Under 15 1
15-17 16
750
1
12
10
0
0
44
0
4
Age of WomanReported
PregnanciesLive
BirthsFetal
DeathsInduced
Abortions
Outcome
Age of WomanReported
PregnanciesLive
BirthsFetal
DeathsInduced
Abortions
Outcome
18-19 38
20-29 499
30 and Over 247
31
469
234
1
4
5
6
26
8
All Ages* 58.8
Under 15** ND
15-17 9.7
63.0
ND
12.9
Age of Woman Birth Rate Reported Pregnancy Rate Age of Woman Birth Rate Reported Pregnancy Rate
18-19 35.6
20-29 115.4
30 and Over** 25.2
43.6
122.8
26.6
^Live births, fetal deaths of 16+ weeks gestation, and induced abortions performed in-state. Notes: All ages includes any unknown ages. All rates per 1,000.*All Ages includes female population ages 15-44. ** Under 15 includes female population ages 10-14; 30 and Over includes female population ages 30-49.
Hispanic
ND
ND
ND
(of any race)
ND
ND
ND
Asian / Pacific
General Notes: Crude and age-adjusted rates based on less than 10 events are considered statistically unreliable and are not displayed (ND), unless otherwise noted. Starting in 2013, race of resident was derived from multiple race selections. A person is Multi-Race if they identify as more than one race. Prior to 2013, race of resident was derived from a single race designation.
Morbidity (2012-2014 Residents)
Reported Incidence and Average Annual Rate (per 100,000) for Selected Notifiable Diseases (2012-2014)
HIV 3 ND
Syphilis 2 ND
Tuberculosis < 5 ND
Total Rate
Chlamydia 385 158.1
Giardiasis 28 11.5
Gonorrhea 28 11.5
Hepatitis: Type A < 5 ND
Total Rate
Lyme Disease 850 349.0
Salmonellosis 25 10.3
Total Rate
Campylobacteriosis 21 8.6 Hep. B* Acute < 5 ND
Shigellosis < 5 ND
*Hepatitis: Type B **Meningococcal Disease
Meningococcal** < 5 ND
Pertussis 14 5.7
Hep. B* Chronic 55 22.6
Chickenpox 14 5.7
Islander
Note: Communicable diseases with demographic counts of 1 to 4 are displayed as "< 5" to avoid potential identification of cases within certain geographic areas.
Multi - Race
ND
ND
ND

Clearfield County PAGE 2
Mortality (2014 Residents)
Selected Major Causes of Death, Number and Average Annual Age-Adjusted Death Rate* (2012-2014)
Number of Resident Deaths 912
Crude Death Rate per 1,000 11.2
Age-Adjusted Death Rate per 1,000 7.6
Number of Infant Deaths (< 1 Year of Age) 0 0 0 0
AllRaces BlackWhite
Hispanic(any race)
Infant Mortality Rate per 1,000 Live Births ND ND ND ND
Average Annual Infant Mortality Rate (2012-2014) 4.5 ND ND ND
Cause Total Rate
Diseases of Heart 673
Cancer 622
Stroke 121
C.L.R.D.** 196
Accidents 136
179.9
175.7
32.6
53.8
50.5
Cause Total Rate
Influenza/Pneumonia 55
Diabetes Mellitus 134
Septicemia 39
Nephritis/Nephrosis 63
Alzheimer's Disease 69
15.5
38.5
11.1
16.4
17.7
* Per 100,000 2000 U.S. standardmillion population. Age-adjusted rates
** Chronic Lower Respiratory Disease
Selected Leading Causes of Death, Number by Age Group (2014)
Under 5 Years of Age 5-24 Years of Age 25-44 Years of Age 45-64 Years of Age 65 Years and Older
Accidents 4 Accidents 14
Cancer 4
Suicide 3
Influenza/Pneumonia 2
Cancer 55
Diseases of Heart 36
Suicide 11
Diabetes Mellitus 9
C.L.R.D.** 7
Diseases of Heart 201
Cancer 143
C.L.R.D.** 47
Stroke 41
Diabetes Mellitus 38
TOTAL 0 TOTAL 6 TOTAL 33 TOTAL 163 TOTAL 709
Note: Total includes all other causes.
Asian/PI*
0
ND
*Asian/Pacific Islander ^ NA = Multi-Race data not available before 2013.
are only comparable if the samestandard million population was usedin the calculation.
Invasive Cancer Incidence and Average Annual Age-Adjusted Rates* for Major Sites by Sex
All Sites 796 512.6
Prostate 200 121.1
Lung and Bronchus 119 76.2
Colon and Rectum 78 51.3
Male FemaleTotal Rate Total Rate
Female Breast 178 108.3
722 417.9
85 45.2
75 38.5
*Per 100,000 2000 U.S. standard million population. Age-adjusted rates are only comparable if the same standard million population was used in the calculation.
- -
- -
Male FemaleTotal Rate Total Rate
Non-Hodgkin Lymphoma 30 20.2
Melanoma of the Skin 38 25.3
29 16.4
52 29.0
19 ND
Corpus and Uterus, NOS - -
Urinary Bladder 52
Kidney and Renal Pelvis 38 23.9
33.3 14
21
ND
12.6
Notes: All in situ cases, except for urinary bladder, are excluded. Age-adjusted rates based on less than 20 events are statistically unreliable and are not displayed (ND).
Cancer Incidence (2011-2013 Residents)
Adult Behavioral Health Risk Factors (2012-2014)[Includes: Forest, Elk, Cameron, Clearfield, Jefferson, Clarion, McKean, and Warren Counties]
General Notes: Crude and age-adjusted rates based on less than 10 events are considered statistically unreliable and are not displayed (ND), unless otherwise noted. Starting in 2013, race of resident was derived from multiple race selections. A person is Multi-Race if they identify as more than one race. Prior to 2013, race of resident was derived from a single race designation.
Percent (CI)Risk Factors
Fair or poor general health:
Obese:
Overweight (includes obese):
No health insurance (ages 18-64):
Visited a doctor in the past 2 yearsfor a routine check-up:
Percent (CI)Risk Factors
Ever told they have diabetes: Currently has asthma:
Current smoker:
Ever tested for HIV (ages 18-64):
Needed to see a doctor but couldnot due to cost in the past year:
20
33
(17 - 22)
(30 - 36)
69 (66 - 72)
15 (12 - 18)
84 (81 - 86)
12 11(10 - 14) (9 - 13)
23 (21 - 26)
29 (26 - 33)
10 (8 - 12)
Notes: Data are based on 2012-2014 annual sample surveys of Pennsylvania adults. CI= 95% Confidence Interval.
Additional state or county/regional data are available at www.statistics.health.pa.gov.
^In situ, benign, and uncertain neoplasms
Multi- Race
0
ND
NAND ^

Clearfield County PAGE 3
Hospitals (7/13-6/14)
Total General Acute Care
Psychiatric Rehabilitation
2 2 0 0
General Hospitals
Beds Set Up and Staffed 274
Admissions 10,613
Beds per 1,000 Population 3.4
Admissions per 1,000 Population 130.7
Average Inpatient Occupancy Rate 47.1
Nursing Homes (2014)
Total Number Certified-Medicare Certified-Medicaid
Nursing Homes
Licensed/Approved Beds
4 4 4
671 671 671
43.8
Average Occupancy Rate 94.3
Average Length of Stay (Number of Days) 156.6
$232
Total Licensed/Approved Beds per 1,000 Population Age 65 and Older
Average Semi-Private Daily Room Rate
Drug and Alcohol Treatment
Admissions to Client Primary Diagnosis
Drug Abuse Alcohol Abuse Other*
Percent Admitted
Only Once During 7/13-6/14
489 241 108 9 71.8
* Includes family members receiving counseling.
All Licensed Facilities Inpatient Non-Hospital
Inpatient Hospital Partial Hospitalization Outpatient6
0
0 0 6
Note: Each licensed facility may provide more than one type of service.
State-Supported Facilities
Types of Service Provided
Number of
Clients Admitted
358
Admission by County of Residence (7/13-6/14)
Treatment Facilities (as of 6/14)
Correctional Institution 0
General Note: Crude rates based on less than 10 events are considered statistically unreliable and are not displayed (ND), unless otherwise noted.
Services Funding
Other
0
Non-Profit
2
For Profit
0
State
0
Other
0
Ambulatory Surgery Centers (7/13-6/14)
Employees
Part Time Employees -
Full Time Employees -
Contracted Employees -
Payroll Employees - Staff with Clinical Privileges -
Total Surgical Visits per Employee -
Total Facilities 0 Total Surgical Visits -
Percent of Surgical Visits, Age 65+ -
Total Operating Rooms - Total Surgical Visits per Operating Room -
Facilities Surgical Visits
Staff Licensed as M.D. -
Total Employees per Operating Room -
Average Semi-Private Daily Room Rate $610
Total Employees -

PAGE 4Clearfield County
Pennsylvania Health Care Workforce (2013-2014)
Notes: Only health care employees renewing their license in 2013-2014 were surveyed.The "Estimated Number" and "Percent of Workforce Intending to Remain in Profession for 6 or More Years" used to compute each "% Change from Previous Survey Year" are adjusted based on the response rates for the previous and current survey results. The survey results are available every two years. Numbers and percentages pertain to county of employment.Percentages based on less than six responses are considered statistically unreliable and are not displayed (ND).Registered Nurses and Licensed Practical Nurses are not comparable to previous survey period, so some data is not available (DNA).
Licensed Practical Nurses (2014) 363 DNA 82.6% DNA
Physicians (2014) 162
Dentists (2013) 32
Registered Nurses (2012/2013) 909 DNA 84.0% DNA
-6.6% 60.2% -12.1%
60.7% 85.7% 2.4%
Estimated Number
Percent Changefrom Previous
Survey
Difference in Percent from
Previous Survey
Percent of WorkforceIntending to Remain in
Profession for 6 or More Years
Injury Hospitalizations (2014)
Injury Hospitalizations and Median Charges by Age and Sex
Injury Hospitalizations and Median Charges by Type of Payor
Injury Hospitalizations and Median Charges by Mechanism/Intent and Sex
0-4 5-14 15-24 25-44 45-64 65 and Older
Male - Total
Male - Median Charges
Female - Total
Female - Median Charges
UnintentionalMotor Vehicle All Poisonings Unintentional Falls
Unintentional Fire/Flame or Hot Object/Substance All Firearm All Other Injuries
Male - Total
Male - Median Charges
Female - Total
Female - Median Charges
Medicare Medicaid Other Government Commercial / Private Blue Cross Uninsured
Total Hospitalizations
Median Charges
All Ages
387 6 9 41 57 141 133
$25,949.69 ND ND $28,058.72 $30,705.99 $25,441.09 $23,629.65
431 2 10 21 36 110 252
$24,105.59 ND $21,127.17 $17,821.70 $17,860.33 $22,915.93 $25,288.39
Note: Median charges not displayed (ND) for occurrences less than 10.
11461 132 711338
$14,095.10 $24,606.45 $21,505.28 $24,726.81 $32,120.50 ND
130
151
23
56
30
34
241
131
5
14
2
1
$22,403.78
$23,645.67
$45,949.95
$39,317.19
$8,348.13
$10,277.69
$25,643.64
$25,949.69
ND
$28,906.19
ND
ND
Disclaimer: Injury data used in this report were provided to the Pennsylvania Department of Health by the Pennsylvania Health Care Cost Containment Council. The Pennsylvania Health Care Cost Containment Council specifically disclaims responsibility for any interpretations or conclusions. Contents may be republished or reproduced whole or in part, with attribution.

Clinton CountyHealth Profile 2016
Demographic Data (2014)
% Population Change 2010 to 2014 1.3
Median Age of the Population (2010-2014) 38.4
% Population Aged 65 and Over 17.2
Population per Square Mile 44.8
% Population with Income Below Poverty Level (2010-2014) 16.9
Per Capita Personal Income $35,917
% Labor Force Unemployed - Annual Average 7.3
% Population Eligible for Medical Assistance 18.0
Estimated Population by Age and Sex (2014)
Age Total Male Female Age Total Male Female
All Ages 39,745
Under 5 2,192
5-14 4,516
15-24 7,720
25-34 4,242
19,456
1,101
2,283
3,647
2,300
20,289
1,091
2,233
4,073
1,942
35-44 4,278
45-54 4,865
55-64 5,083
65-74 3,697
75+ 3,152
2,150
2,437
2,481
1,767
1,290
2,128
2,428
2,602
1,930
1,862
Natality and Reported Pregnancies^ (2014 Residents)
Crude Birth Rate10.3
Average Annual General52.2
% Low Birth Weight 5.4
% Prenatal Care in 1st Trimester 62.3
% Births to Mothers Under 18 ND
5.6
61.4
ND
ND
ND
ND
Per 1,000 Population
Fertility Rate* (2012-2014)
All Races White Black
All Ages 458
Under 15 0
15-17 5
411
0
5
4
0
0
43
0
0
Age of WomanReported
PregnanciesLive
BirthsFetal
DeathsInduced
Abortions
Outcome
Age of WomanReported
PregnanciesLive
BirthsFetal
DeathsInduced
Abortions
Outcome
18-19 23
20-29 265
30 and Over 164
18
235
152
1
0
3
4
30
9
All Ages* 50.5
Under 15** ND
15-17 ND
56.2
ND
ND
Age of Woman Birth Rate Reported Pregnancy Rate Age of Woman Birth Rate Reported Pregnancy Rate
18-19 17.8
20-29 71.8
30 and Over** 35.4
22.7
80.9
38.2
^Live births, fetal deaths of 16+ weeks gestation, and induced abortions performed in-state. Notes: All ages includes any unknown ages. All rates per 1,000.*All Ages includes female population ages 15-44. ** Under 15 includes female population ages 10-14; 30 and Over includes female population ages 30-49.
Hispanic
ND
ND
ND
(of any race)
ND
ND
ND
Asian / Pacific
General Notes: Crude and age-adjusted rates based on less than 10 events are considered statistically unreliable and are not displayed (ND), unless otherwise noted. Starting in 2013, race of resident was derived from multiple race selections. A person is Multi-Race if they identify as more than one race. Prior to 2013, race of resident was derived from a single race designation.
Morbidity (2012-2014 Residents)
Reported Incidence and Average Annual Rate (per 100,000) for Selected Notifiable Diseases (2012-2014)
HIV 4 ND
Syphilis 1 ND
Tuberculosis 0 ND
Total Rate
Chlamydia 247 207.2
Giardiasis 8 ND
Gonorrhea 13 10.9
Hepatitis: Type A 0 ND
Total Rate
Lyme Disease 127 106.5
Salmonellosis 17 14.3
Total Rate
Campylobacteriosis 7 ND Hep. B* Acute 0 ND
Shigellosis 0 ND
*Hepatitis: Type B **Meningococcal Disease
Meningococcal** 0 ND
Pertussis 0 ND
Hep. B* Chronic < 5 ND
Chickenpox 8 ND
Islander
Note: Communicable diseases with demographic counts of 1 to 4 are displayed as "< 5" to avoid potential identification of cases within certain geographic areas.
Multi - Race
ND
ND
ND

Clinton County PAGE 2
Mortality (2014 Residents)
Selected Major Causes of Death, Number and Average Annual Age-Adjusted Death Rate* (2012-2014)
Number of Resident Deaths 398
Crude Death Rate per 1,000 10.0
Age-Adjusted Death Rate per 1,000 7.6
Number of Infant Deaths (< 1 Year of Age) 0 0 0 0
AllRaces BlackWhite
Hispanic(any race)
Infant Mortality Rate per 1,000 Live Births ND ND ND ND
Average Annual Infant Mortality Rate (2012-2014) ND ND ND ND
Cause Total Rate
Diseases of Heart 305
Cancer 306
Stroke 63
C.L.R.D.** 62
Accidents 70
190.6
199.8
40.0
38.0
56.4
Cause Total Rate
Influenza/Pneumonia 17
Diabetes Mellitus 34
Septicemia 19
Nephritis/Nephrosis 31
Alzheimer's Disease 46
11.2
21.7
12.2
19.5
27.3
* Per 100,000 2000 U.S. standardmillion population. Age-adjusted rates
** Chronic Lower Respiratory Disease
Selected Leading Causes of Death, Number by Age Group (2014)
Under 5 Years of Age 5-24 Years of Age 25-44 Years of Age 45-64 Years of Age 65 Years and Older
Accidents 3 Accidents 6 Cancer 25
Diseases of Heart 9
Stroke 6
Accidents 4
Diseases of Heart 93
Cancer 71
C.L.R.D.** 25
Alzheimer's Disease 21
Stroke 17
TOTAL 1 TOTAL 5 TOTAL 9 TOTAL 65 TOTAL 318
Note: Total includes all other causes.
Asian/PI*
0
ND
*Asian/Pacific Islander ^ NA = Multi-Race data not available before 2013.
are only comparable if the samestandard million population was usedin the calculation.
Invasive Cancer Incidence and Average Annual Age-Adjusted Rates* for Major Sites by Sex
All Sites 355 511.5
Prostate 66 88.3
Lung and Bronchus 57 80.8
Colon and Rectum 37 55.6
Male FemaleTotal Rate Total Rate
Female Breast 89 123.5
361 480.3
37 44.6
44 50.7
*Per 100,000 2000 U.S. standard million population. Age-adjusted rates are only comparable if the same standard million population was used in the calculation.
- -
- -
Male FemaleTotal Rate Total Rate
Non-Hodgkin Lymphoma 16 ND
Melanoma of the Skin 14 ND
19 ND
33 43.5
6 ND
Corpus and Uterus, NOS - -
Urinary Bladder 36
Kidney and Renal Pelvis 11 ND
51.5 9
12
ND
ND
Notes: All in situ cases, except for urinary bladder, are excluded. Age-adjusted rates based on less than 20 events are statistically unreliable and are not displayed (ND).
Cancer Incidence (2011-2013 Residents)
Adult Behavioral Health Risk Factors (2012-2014)[Includes: Bradford, Sullivan, Tioga, Lycoming, Clinton, and Potter Counties]
General Notes: Crude and age-adjusted rates based on less than 10 events are considered statistically unreliable and are not displayed (ND), unless otherwise noted. Starting in 2013, race of resident was derived from multiple race selections. A person is Multi-Race if they identify as more than one race. Prior to 2013, race of resident was derived from a single race designation.
Percent (CI)Risk Factors
Fair or poor general health:
Obese:
Overweight (includes obese):
No health insurance (ages 18-64):
Visited a doctor in the past 2 yearsfor a routine check-up:
Percent (CI)Risk Factors
Ever told they have diabetes: Currently has asthma:
Current smoker:
Ever tested for HIV (ages 18-64):
Needed to see a doctor but couldnot due to cost in the past year:
18
32
(15 - 20)
(29 - 35)
67 (63 - 70)
13 (11 - 16)
85 (82 - 87)
10 10(9 - 12) (8 - 12)
22 (20 - 25)
34 (30 - 38)
9 (7 - 11)
Notes: Data are based on 2012-2014 annual sample surveys of Pennsylvania adults. CI= 95% Confidence Interval.
Additional state or county/regional data are available at www.statistics.health.pa.gov.
^In situ, benign, and uncertain neoplasms
Multi- Race
0
ND
NAND ^

Clinton County PAGE 3
Hospitals (7/13-6/14)
Total General Acute Care
Psychiatric Rehabilitation
2 1 0 0
General Hospitals
Beds Set Up and Staffed 47
Admissions 1,168
Beds per 1,000 Population 1.2
Admissions per 1,000 Population 29.4
Average Inpatient Occupancy Rate 23.6
Nursing Homes (2014)
Total Number Certified-Medicare Certified-Medicaid
Nursing Homes
Licensed/Approved Beds
3 3 3
279 279 279
40.7
Average Occupancy Rate 85.5
Average Length of Stay (Number of Days) 606.6
$221
Total Licensed/Approved Beds per 1,000 Population Age 65 and Older
Average Semi-Private Daily Room Rate
Drug and Alcohol Treatment
Admissions to Client Primary Diagnosis
Drug Abuse Alcohol Abuse Other*
Percent Admitted
Only Once During 7/13-6/14
139 68 34 2 76.0
* Includes family members receiving counseling.
All Licensed Facilities Inpatient Non-Hospital
Inpatient Hospital Partial Hospitalization Outpatient1
0
0 0 1
Note: Each licensed facility may provide more than one type of service.
State-Supported Facilities
Types of Service Provided
Number of
Clients Admitted
104
Admission by County of Residence (7/13-6/14)
Treatment Facilities (as of 6/14)
Correctional Institution 0
General Note: Crude rates based on less than 10 events are considered statistically unreliable and are not displayed (ND), unless otherwise noted.
Services Funding
Other
1
Non-Profit
1
For Profit
1
State
0
Other
0
Ambulatory Surgery Centers (7/13-6/14)
Employees
Part Time Employees -
Full Time Employees -
Contracted Employees -
Payroll Employees - Staff with Clinical Privileges -
Total Surgical Visits per Employee -
Total Facilities 0 Total Surgical Visits -
Percent of Surgical Visits, Age 65+ -
Total Operating Rooms - Total Surgical Visits per Operating Room -
Facilities Surgical Visits
Staff Licensed as M.D. -
Total Employees per Operating Room -
Average Semi-Private Daily Room Rate $1,653
Total Employees -

PAGE 4Clinton County
Pennsylvania Health Care Workforce (2013-2014)
Notes: Only health care employees renewing their license in 2013-2014 were surveyed.The "Estimated Number" and "Percent of Workforce Intending to Remain in Profession for 6 or More Years" used to compute each "% Change from Previous Survey Year" are adjusted based on the response rates for the previous and current survey results. The survey results are available every two years. Numbers and percentages pertain to county of employment.Percentages based on less than six responses are considered statistically unreliable and are not displayed (ND).Registered Nurses and Licensed Practical Nurses are not comparable to previous survey period, so some data is not available (DNA).
Licensed Practical Nurses (2014) 151 DNA 88.5% DNA
Physicians (2014) 46
Dentists (2013) 15
Registered Nurses (2012/2013) 155 DNA 80.1% DNA
-1.5% 68.4% 8.9%
6.6% 61.5% 3.2%
Estimated Number
Percent Changefrom Previous
Survey
Difference in Percent from
Previous Survey
Percent of WorkforceIntending to Remain in
Profession for 6 or More Years
Injury Hospitalizations (2014)
Injury Hospitalizations and Median Charges by Age and Sex
Injury Hospitalizations and Median Charges by Type of Payor
Injury Hospitalizations and Median Charges by Mechanism/Intent and Sex
0-4 5-14 15-24 25-44 45-64 65 and Older
Male - Total
Male - Median Charges
Female - Total
Female - Median Charges
UnintentionalMotor Vehicle All Poisonings Unintentional Falls
Unintentional Fire/Flame or Hot Object/Substance All Firearm All Other Injuries
Male - Total
Male - Median Charges
Female - Total
Female - Median Charges
Medicare Medicaid Other Government Commercial / Private Blue Cross Uninsured
Total Hospitalizations
Median Charges
All Ages
155 2 2 18 20 44 69
$36,007.66 ND ND $65,868.38 $24,495.89 $31,492.06 $36,285.50
151 1 4 2 7 33 104
$36,618.00 ND ND ND ND $37,531.11 $36,121.45
Note: Median charges not displayed (ND) for occurrences less than 10.
12184 28 24571
$33,596.34 $34,331.83 $28,483.05 $33,149.52 $51,633.08 ND
42
64
8
16
8
11
91
60
1
3
1
1
$34,279.99
$33,732.68
ND
$51,992.58
ND
$17,327.79
$37,018.50
$36,928.60
ND
ND
ND
ND
Disclaimer: Injury data used in this report were provided to the Pennsylvania Department of Health by the Pennsylvania Health Care Cost Containment Council. The Pennsylvania Health Care Cost Containment Council specifically disclaims responsibility for any interpretations or conclusions. Contents may be republished or reproduced whole or in part, with attribution.

Columbia CountyHealth Profile 2016
Demographic Data (2014)
% Population Change 2010 to 2014 -0.3
Median Age of the Population (2010-2014) 39.8
% Population Aged 65 and Over 17.2
Population per Square Mile 138.9
% Population with Income Below Poverty Level (2010-2014) 15.8
Per Capita Personal Income $36,209
% Labor Force Unemployed - Annual Average 6.2
% Population Eligible for Medical Assistance 14.9
Estimated Population by Age and Sex (2014)
Age Total Male Female Age Total Male Female
All Ages 67,122
Under 5 3,088
5-14 6,892
15-24 13,306
25-34 7,064
32,404
1,586
3,548
6,133
3,660
34,718
1,502
3,344
7,173
3,404
35-44 7,137
45-54 8,866
55-64 9,242
65-74 6,337
75+ 5,190
3,592
4,393
4,510
2,977
2,005
3,545
4,473
4,732
3,360
3,185
Natality and Reported Pregnancies^ (2014 Residents)
Crude Birth Rate9.1
Average Annual General43.7
% Low Birth Weight 8.2
% Prenatal Care in 1st Trimester 81.0
% Births to Mothers Under 18 ND
7.9
81.5
ND
ND
ND
ND
Per 1,000 Population
Fertility Rate* (2012-2014)
All Races White Black
All Ages 709
Under 15 2
15-17 12
612
1
7
7
0
0
90
1
5
Age of WomanReported
PregnanciesLive
BirthsFetal
DeathsInduced
Abortions
Outcome
Age of WomanReported
PregnanciesLive
BirthsFetal
DeathsInduced
Abortions
Outcome
18-19 36
20-29 404
30 and Over 254
29
346
228
0
3
4
7
55
22
All Ages* 43.3
Under 15** ND
15-17 ND
50.2
ND
11.4
Age of Woman Birth Rate Reported Pregnancy Rate Age of Woman Birth Rate Reported Pregnancy Rate
18-19 14.1
20-29 60.0
30 and Over** 31.3
17.5
70.1
34.8
^Live births, fetal deaths of 16+ weeks gestation, and induced abortions performed in-state. Notes: All ages includes any unknown ages. All rates per 1,000.*All Ages includes female population ages 15-44. ** Under 15 includes female population ages 10-14; 30 and Over includes female population ages 30-49.
Hispanic
ND
68.4
ND
(of any race)
ND
ND
ND
Asian / Pacific
General Notes: Crude and age-adjusted rates based on less than 10 events are considered statistically unreliable and are not displayed (ND), unless otherwise noted. Starting in 2013, race of resident was derived from multiple race selections. A person is Multi-Race if they identify as more than one race. Prior to 2013, race of resident was derived from a single race designation.
Morbidity (2012-2014 Residents)
Reported Incidence and Average Annual Rate (per 100,000) for Selected Notifiable Diseases (2012-2014)
HIV 8 ND
Syphilis 5 ND
Tuberculosis < 5 ND
Total Rate
Chlamydia 519 258.5
Giardiasis 17 8.5
Gonorrhea 46 22.9
Hepatitis: Type A 0 ND
Total Rate
Lyme Disease 232 115.5
Salmonellosis 16 8.0
Total Rate
Campylobacteriosis 31 15.4 Hep. B* Acute < 5 ND
Shigellosis < 5 ND
*Hepatitis: Type B **Meningococcal Disease
Meningococcal** 0 ND
Pertussis 7 ND
Hep. B* Chronic 15 7.5
Chickenpox 14 7.0
Islander
Note: Communicable diseases with demographic counts of 1 to 4 are displayed as "< 5" to avoid potential identification of cases within certain geographic areas.
Multi - Race
ND
ND
ND

Columbia County PAGE 2
Mortality (2014 Residents)
Selected Major Causes of Death, Number and Average Annual Age-Adjusted Death Rate* (2012-2014)
Number of Resident Deaths 703
Crude Death Rate per 1,000 10.5
Age-Adjusted Death Rate per 1,000 7.9
Number of Infant Deaths (< 1 Year of Age) 2 1 1 1
AllRaces BlackWhite
Hispanic(any race)
Infant Mortality Rate per 1,000 Live Births ND ND ND ND
Average Annual Infant Mortality Rate (2012-2014) 5.4 ND ND ND
Cause Total Rate
Diseases of Heart 582
Cancer 426
Stroke 109
C.L.R.D.** 100
Accidents 97
213.7
163.0
39.9
36.9
42.1
Cause Total Rate
Influenza/Pneumonia 42
Diabetes Mellitus 50
Septicemia 34
Nephritis/Nephrosis 50
Alzheimer's Disease 32
15.1
18.9
12.6
17.6
11.2
* Per 100,000 2000 U.S. standardmillion population. Age-adjusted rates
** Chronic Lower Respiratory Disease
Selected Leading Causes of Death, Number by Age Group (2014)
Under 5 Years of Age 5-24 Years of Age 25-44 Years of Age 45-64 Years of Age 65 Years and Older
Perinatal Conditions 2 Cancer 3 Accidents 7
Diseases of Heart 5
Suicide 4
Cancer 2
Diabetes Mellitus 2
Cancer 31
Diseases of Heart 22
Accidents 12
C.L.R.D.** 3
Liver Dis./Cirrhosis 3
Diseases of Heart 179
Cancer 114
C.L.R.D.** 37
Stroke 33
TOTAL 3 TOTAL 7 TOTAL 25 TOTAL 102 TOTAL 566
Note: Total includes all other causes.
Asian/PI*
0
ND
*Asian/Pacific Islander ^ NA = Multi-Race data not available before 2013.
are only comparable if the samestandard million population was usedin the calculation.
Invasive Cancer Incidence and Average Annual Age-Adjusted Rates* for Major Sites by Sex
All Sites 639 557.1
Prostate 141 114.1
Lung and Bronchus 87 73.9
Colon and Rectum 51 43.9
Male FemaleTotal Rate Total Rate
Female Breast 174 130.2
658 495.0
51 36.6
51 36.5
*Per 100,000 2000 U.S. standard million population. Age-adjusted rates are only comparable if the same standard million population was used in the calculation.
- -
- -
Male FemaleTotal Rate Total Rate
Non-Hodgkin Lymphoma 30 26.9
Melanoma of the Skin 32 29.8
38 25.6
55 43.9
26 21.7
Corpus and Uterus, NOS - -
Urinary Bladder 49
Kidney and Renal Pelvis 29 24.4
42.0 16
14
ND
ND
Notes: All in situ cases, except for urinary bladder, are excluded. Age-adjusted rates based on less than 20 events are statistically unreliable and are not displayed (ND).
Cancer Incidence (2011-2013 Residents)
Adult Behavioral Health Risk Factors (2012-2014)[Includes: Centre, Columbia, Montour, Northumberland, Snyder, and Union Counties]
General Notes: Crude and age-adjusted rates based on less than 10 events are considered statistically unreliable and are not displayed (ND), unless otherwise noted. Starting in 2013, race of resident was derived from multiple race selections. A person is Multi-Race if they identify as more than one race. Prior to 2013, race of resident was derived from a single race designation.
Percent (CI)Risk Factors
Fair or poor general health:
Obese:
Overweight (includes obese):
No health insurance (ages 18-64):
Visited a doctor in the past 2 yearsfor a routine check-up:
Percent (CI)Risk Factors
Ever told they have diabetes: Currently has asthma:
Current smoker:
Ever tested for HIV (ages 18-64):
Needed to see a doctor but couldnot due to cost in the past year:
14
31
(12 - 16)
(28 - 34)
61 (58 - 64)
13 (11 - 16)
82 (80 - 85)
10 10(8 - 11) (9 - 12)
18 (16 - 20)
27 (24 - 31)
9 (7 - 11)
Notes: Data are based on 2012-2014 annual sample surveys of Pennsylvania adults. CI= 95% Confidence Interval.
Additional state or county/regional data are available at www.statistics.health.pa.gov.
^In situ, benign, and uncertain neoplasms
Multi- Race
0
ND
NAND ^

Columbia County PAGE 3
Hospitals (7/13-6/14)
Total General Acute Care
Psychiatric Rehabilitation
2 2 0 0
General Hospitals
Beds Set Up and Staffed 173
Admissions 3,993
Beds per 1,000 Population 2.6
Admissions per 1,000 Population 59.5
Average Inpatient Occupancy Rate 26.2
Nursing Homes (2014)
Total Number Certified-Medicare Certified-Medicaid
Nursing Homes
Licensed/Approved Beds
5 5 5
685 685 685
59.4
Average Occupancy Rate 82.5
Average Length of Stay (Number of Days) 188.7
$226
Total Licensed/Approved Beds per 1,000 Population Age 65 and Older
Average Semi-Private Daily Room Rate
Drug and Alcohol Treatment
Admissions to Client Primary Diagnosis
Drug Abuse Alcohol Abuse Other*
Percent Admitted
Only Once During 7/13-6/14
174 81 15 1 43.3
* Includes family members receiving counseling.
All Licensed Facilities Inpatient Non-Hospital
Inpatient Hospital Partial Hospitalization Outpatient4
0
0 0 4
Note: Each licensed facility may provide more than one type of service.
State-Supported Facilities
Types of Service Provided
Number of
Clients Admitted
97
Admission by County of Residence (7/13-6/14)
Treatment Facilities (as of 6/14)
Correctional Institution 0
General Note: Crude rates based on less than 10 events are considered statistically unreliable and are not displayed (ND), unless otherwise noted.
Services Funding
Other
0
Non-Profit
1
For Profit
1
State
0
Other
0
Ambulatory Surgery Centers (7/13-6/14)
Employees
Part Time Employees 10
Full Time Employees 10
Contracted Employees 5
Payroll Employees 15 Staff with Clinical Privileges 14
Total Surgical Visits per Employee 85.0
Total Facilities 1 Total Surgical Visits 1,700
Percent of Surgical Visits, Age 65+ 23.5
Total Operating Rooms 1 Total Surgical Visits per Operating Room 1,700.0
Facilities Surgical Visits
Staff Licensed as M.D. 7
Total Employees per Operating Room 20.0
Average Semi-Private Daily Room Rate $1,739
Total Employees 20

PAGE 4Columbia County
Pennsylvania Health Care Workforce (2013-2014)
Notes: Only health care employees renewing their license in 2013-2014 were surveyed.The "Estimated Number" and "Percent of Workforce Intending to Remain in Profession for 6 or More Years" used to compute each "% Change from Previous Survey Year" are adjusted based on the response rates for the previous and current survey results. The survey results are available every two years. Numbers and percentages pertain to county of employment.Percentages based on less than six responses are considered statistically unreliable and are not displayed (ND).Registered Nurses and Licensed Practical Nurses are not comparable to previous survey period, so some data is not available (DNA).
Licensed Practical Nurses (2014) 266 DNA 84.6% DNA
Physicians (2014) 92
Dentists (2013) 25
Registered Nurses (2012/2013) 565 DNA 81.7% DNA
3.5% 71.1% -5.2%
-12.9% 72.7% -11.9%
Estimated Number
Percent Changefrom Previous
Survey
Difference in Percent from
Previous Survey
Percent of WorkforceIntending to Remain in
Profession for 6 or More Years
Injury Hospitalizations (2014)
Injury Hospitalizations and Median Charges by Age and Sex
Injury Hospitalizations and Median Charges by Type of Payor
Injury Hospitalizations and Median Charges by Mechanism/Intent and Sex
0-4 5-14 15-24 25-44 45-64 65 and Older
Male - Total
Male - Median Charges
Female - Total
Female - Median Charges
UnintentionalMotor Vehicle All Poisonings Unintentional Falls
Unintentional Fire/Flame or Hot Object/Substance All Firearm All Other Injuries
Male - Total
Male - Median Charges
Female - Total
Female - Median Charges
Medicare Medicaid Other Government Commercial / Private Blue Cross Uninsured
Total Hospitalizations
Median Charges
All Ages
279 3 0 26 60 86 104
$41,514.79 ND - $37,588.98 $39,244.83 $44,781.72 $41,342.44
346 6 4 22 44 80 190
$43,318.71 ND ND $17,166.25 $34,385.67 $39,955.26 $47,544.38
Note: Median charges not displayed (ND) for occurrences less than 10.
9325 91 661288
ND $44,470.26 $34,525.86 $40,691.83 $44,884.10 ND
106
106
26
42
41
27
170
98
2
3
1
3
$34,849.75
$35,628.43
$78,130.31
$45,615.77
$21,624.85
$19,617.36
$48,293.26
$48,474.93
ND
ND
ND
ND
Disclaimer: Injury data used in this report were provided to the Pennsylvania Department of Health by the Pennsylvania Health Care Cost Containment Council. The Pennsylvania Health Care Cost Containment Council specifically disclaims responsibility for any interpretations or conclusions. Contents may be republished or reproduced whole or in part, with attribution.

Crawford CountyHealth Profile 2016
Demographic Data (2014)
% Population Change 2010 to 2014 -1.8
Median Age of the Population (2010-2014) 42.1
% Population Aged 65 and Over 18.3
Population per Square Mile 86.1
% Population with Income Below Poverty Level (2010-2014) 15.6
Per Capita Personal Income $35,046
% Labor Force Unemployed - Annual Average 5.8
% Population Eligible for Medical Assistance 19.4
Estimated Population by Age and Sex (2014)
Age Total Male Female Age Total Male Female
All Ages 87,175
Under 5 4,766
5-14 10,513
15-24 11,714
25-34 9,376
42,626
2,444
5,388
5,889
4,607
44,549
2,322
5,125
5,825
4,769
35-44 9,696
45-54 12,156
55-64 12,966
65-74 9,309
75+ 6,679
4,657
5,901
6,370
4,504
2,866
5,039
6,255
6,596
4,805
3,813
Natality and Reported Pregnancies^ (2014 Residents)
Crude Birth Rate11.6
Average Annual General60.6
% Low Birth Weight 7.1
% Prenatal Care in 1st Trimester 66.6
% Births to Mothers Under 18 1.8
7.2
66.4
1.6
ND
ND
ND
Per 1,000 Population
Fertility Rate* (2012-2014)
All Races White Black
All Ages 1,070
Under 15 0
15-17 18
1,013
0
18
6
0
0
51
0
0
Age of WomanReported
PregnanciesLive
BirthsFetal
DeathsInduced
Abortions
Outcome
Age of WomanReported
PregnanciesLive
BirthsFetal
DeathsInduced
Abortions
Outcome
18-19 34
20-29 646
30 and Over 371
33
610
351
0
3
3
1
33
17
All Ages* 64.8
Under 15** ND
15-17 11.4
68.4
ND
11.4
Age of Woman Birth Rate Reported Pregnancy Rate Age of Woman Birth Rate Reported Pregnancy Rate
18-19 23.8
20-29 117.2
30 and Over** 33.8
24.5
124.1
35.7
^Live births, fetal deaths of 16+ weeks gestation, and induced abortions performed in-state. Notes: All ages includes any unknown ages. All rates per 1,000.*All Ages includes female population ages 15-44. ** Under 15 includes female population ages 10-14; 30 and Over includes female population ages 30-49.
Hispanic
ND
ND
ND
(of any race)
ND
ND
ND
Asian / Pacific
General Notes: Crude and age-adjusted rates based on less than 10 events are considered statistically unreliable and are not displayed (ND), unless otherwise noted. Starting in 2013, race of resident was derived from multiple race selections. A person is Multi-Race if they identify as more than one race. Prior to 2013, race of resident was derived from a single race designation.
Morbidity (2012-2014 Residents)
Reported Incidence and Average Annual Rate (per 100,000) for Selected Notifiable Diseases (2012-2014)
HIV 8 ND
Syphilis 2 ND
Tuberculosis < 5 ND
Total Rate
Chlamydia 605 230.8
Giardiasis 33 12.6
Gonorrhea 51 19.5
Hepatitis: Type A < 5 ND
Total Rate
Lyme Disease 33 12.6
Salmonellosis 29 11.1
Total Rate
Campylobacteriosis 16 6.1 Hep. B* Acute < 5 ND
Shigellosis < 5 ND
*Hepatitis: Type B **Meningococcal Disease
Meningococcal** 0 ND
Pertussis 10 3.8
Hep. B* Chronic 17 6.5
Chickenpox 31 11.8
Islander
Note: Communicable diseases with demographic counts of 1 to 4 are displayed as "< 5" to avoid potential identification of cases within certain geographic areas.
Multi - Race
ND
79.2
ND

Crawford County PAGE 2
Mortality (2014 Residents)
Selected Major Causes of Death, Number and Average Annual Age-Adjusted Death Rate* (2012-2014)
Number of Resident Deaths 972
Crude Death Rate per 1,000 11.1
Age-Adjusted Death Rate per 1,000 8.3
Number of Infant Deaths (< 1 Year of Age) 1 1 0 0
AllRaces BlackWhite
Hispanic(any race)
Infant Mortality Rate per 1,000 Live Births ND ND ND ND
Average Annual Infant Mortality Rate (2012-2014) 5.2 4.8 ND ND
Cause Total Rate
Diseases of Heart 687
Cancer 624
Stroke 181
C.L.R.D.** 187
Accidents 146
191.0
175.7
51.0
52.0
53.6
Cause Total Rate
Influenza/Pneumonia 75
Diabetes Mellitus 93
Septicemia 38
Nephritis/Nephrosis 57
Alzheimer's Disease 174
21.0
26.3
10.8
15.9
48.6
* Per 100,000 2000 U.S. standardmillion population. Age-adjusted rates
** Chronic Lower Respiratory Disease
Selected Leading Causes of Death, Number by Age Group (2014)
Under 5 Years of Age 5-24 Years of Age 25-44 Years of Age 45-64 Years of Age 65 Years and Older
Accidents 5
Suicide 2
Accidents 11
Cancer 4
Liver Dis./Cirrhosis 2
Cancer 52
Diseases of Heart 27
Accidents 17
Stroke 8
Suicide 8
Diseases of Heart 189
Cancer 134
Alzheimer's Disease 58
Stroke 55
C.L.R.D.** 54
TOTAL 2 TOTAL 10 TOTAL 24 TOTAL 158 TOTAL 778
Note: Total includes all other causes.
Asian/PI*
0
ND
*Asian/Pacific Islander ^ NA = Multi-Race data not available before 2013.
are only comparable if the samestandard million population was usedin the calculation.
Invasive Cancer Incidence and Average Annual Age-Adjusted Rates* for Major Sites by Sex
All Sites 895 542.3
Prostate 230 127.5
Lung and Bronchus 137 82.7
Colon and Rectum 101 63.7
Male FemaleTotal Rate Total Rate
Female Breast 230 130.9
810 450.9
97 50.4
90 47.0
*Per 100,000 2000 U.S. standard million population. Age-adjusted rates are only comparable if the same standard million population was used in the calculation.
- -
- -
Male FemaleTotal Rate Total Rate
Non-Hodgkin Lymphoma 48 30.9
Melanoma of the Skin 35 21.1
32 17.2
60 30.8
28 15.6
Corpus and Uterus, NOS - -
Urinary Bladder 55
Kidney and Renal Pelvis 33 20.1
33.3 19
25
ND
12.5
Notes: All in situ cases, except for urinary bladder, are excluded. Age-adjusted rates based on less than 20 events are statistically unreliable and are not displayed (ND).
Cancer Incidence (2011-2013 Residents)
Adult Behavioral Health Risk Factors (2012-2014)[Includes: Crawford, Lawrence, Mercer, and Venango Counties]
General Notes: Crude and age-adjusted rates based on less than 10 events are considered statistically unreliable and are not displayed (ND), unless otherwise noted. Starting in 2013, race of resident was derived from multiple race selections. A person is Multi-Race if they identify as more than one race. Prior to 2013, race of resident was derived from a single race designation.
Percent (CI)Risk Factors
Fair or poor general health:
Obese:
Overweight (includes obese):
No health insurance (ages 18-64):
Visited a doctor in the past 2 yearsfor a routine check-up:
Percent (CI)Risk Factors
Ever told they have diabetes: Currently has asthma:
Current smoker:
Ever tested for HIV (ages 18-64):
Needed to see a doctor but couldnot due to cost in the past year:
17
35
(15 - 20)
(32 - 38)
66 (63 - 70)
16 (13 - 20)
83 (80 - 85)
13 10(11 - 15) (8 - 12)
24 (21 - 27)
28 (25 - 32)
13 (11 - 16)
Notes: Data are based on 2012-2014 annual sample surveys of Pennsylvania adults. CI= 95% Confidence Interval.
Additional state or county/regional data are available at www.statistics.health.pa.gov.
^In situ, benign, and uncertain neoplasms
Multi- Race
0
ND
NAND ^

Crawford County PAGE 3
Hospitals (7/13-6/14)
Total General Acute Care
Psychiatric Rehabilitation
2 2 0 0
General Hospitals
Beds Set Up and Staffed 238
Admissions 7,501
Beds per 1,000 Population 2.7
Admissions per 1,000 Population 86.0
Average Inpatient Occupancy Rate 39.0
Nursing Homes (2014)
Total Number Certified-Medicare Certified-Medicaid
Nursing Homes
Licensed/Approved Beds
6 6 5
830 830 798
51.9
Average Occupancy Rate 92.8
Average Length of Stay (Number of Days) 185.3
$226
Total Licensed/Approved Beds per 1,000 Population Age 65 and Older
Average Semi-Private Daily Room Rate
Drug and Alcohol Treatment
Admissions to Client Primary Diagnosis
Drug Abuse Alcohol Abuse Other*
Percent Admitted
Only Once During 7/13-6/14
495 194 166 0 74.7
* Includes family members receiving counseling.
All Licensed Facilities Inpatient Non-Hospital
Inpatient Hospital Partial Hospitalization Outpatient5
0
1 0 5
Note: Each licensed facility may provide more than one type of service.
State-Supported Facilities
Types of Service Provided
Number of
Clients Admitted
360
Admission by County of Residence (7/13-6/14)
Treatment Facilities (as of 6/14)
Correctional Institution 0
General Note: Crude rates based on less than 10 events are considered statistically unreliable and are not displayed (ND), unless otherwise noted.
Services Funding
Other
0
Non-Profit
2
For Profit
0
State
0
Other
0
Ambulatory Surgery Centers (7/13-6/14)
Employees
Part Time Employees -
Full Time Employees -
Contracted Employees -
Payroll Employees - Staff with Clinical Privileges -
Total Surgical Visits per Employee -
Total Facilities 0 Total Surgical Visits -
Percent of Surgical Visits, Age 65+ -
Total Operating Rooms - Total Surgical Visits per Operating Room -
Facilities Surgical Visits
Staff Licensed as M.D. -
Total Employees per Operating Room -
Average Semi-Private Daily Room Rate $841
Total Employees -

PAGE 4Crawford County
Pennsylvania Health Care Workforce (2013-2014)
Notes: Only health care employees renewing their license in 2013-2014 were surveyed.The "Estimated Number" and "Percent of Workforce Intending to Remain in Profession for 6 or More Years" used to compute each "% Change from Previous Survey Year" are adjusted based on the response rates for the previous and current survey results. The survey results are available every two years. Numbers and percentages pertain to county of employment.Percentages based on less than six responses are considered statistically unreliable and are not displayed (ND).Registered Nurses and Licensed Practical Nurses are not comparable to previous survey period, so some data is not available (DNA).
Licensed Practical Nurses (2014) 389 DNA 83.0% DNA
Physicians (2014) 152
Dentists (2013) 34
Registered Nurses (2012/2013) 708 DNA 80.2% DNA
1.6% 72.8% 4.1%
-6.9% 70.0% -2.7%
Estimated Number
Percent Changefrom Previous
Survey
Difference in Percent from
Previous Survey
Percent of WorkforceIntending to Remain in
Profession for 6 or More Years
Injury Hospitalizations (2014)
Injury Hospitalizations and Median Charges by Age and Sex
Injury Hospitalizations and Median Charges by Type of Payor
Injury Hospitalizations and Median Charges by Mechanism/Intent and Sex
0-4 5-14 15-24 25-44 45-64 65 and Older
Male - Total
Male - Median Charges
Female - Total
Female - Median Charges
UnintentionalMotor Vehicle All Poisonings Unintentional Falls
Unintentional Fire/Flame or Hot Object/Substance All Firearm All Other Injuries
Male - Total
Male - Median Charges
Female - Total
Female - Median Charges
Medicare Medicaid Other Government Commercial / Private Blue Cross Uninsured
Total Hospitalizations
Median Charges
All Ages
456 7 18 41 69 150 171
$27,769.99 ND $19,868.13 $23,908.31 $38,963.25 $31,744.62 $24,487.40
482 4 8 44 61 100 265
$21,923.38 ND ND $8,656.00 $19,201.96 $22,361.44 $25,645.35
Note: Median charges not displayed (ND) for occurrences less than 10.
26433 100 15519818
$19,813.89 $25,913.10 $26,177.73 $21,246.59 $24,628.03 $19,010.66
140
183
29
49
44
41
266
174
3
7
0
2
$17,002.59
$25,885.00
$30,415.60
$62,097.55
$9,320.76
$12,458.75
$26,530.88
$27,157.38
ND
ND
-
ND
Disclaimer: Injury data used in this report were provided to the Pennsylvania Department of Health by the Pennsylvania Health Care Cost Containment Council. The Pennsylvania Health Care Cost Containment Council specifically disclaims responsibility for any interpretations or conclusions. Contents may be republished or reproduced whole or in part, with attribution.

Cumberland CountyHealth Profile 2016
Demographic Data (2014)
% Population Change 2010 to 2014 3.5
Median Age of the Population (2010-2014) 40.7
% Population Aged 65 and Over 17.0
Population per Square Mile 446.9
% Population with Income Below Poverty Level (2010-2014) 8.7
Per Capita Personal Income $48,137
% Labor Force Unemployed - Annual Average 4.5
% Population Eligible for Medical Assistance 10.0
Estimated Population by Age and Sex (2014)
Age Total Male Female Age Total Male Female
All Ages 243,762
Under 5 12,857
5-14 27,955
15-24 33,266
25-34 31,592
120,519
6,541
14,265
16,764
16,616
123,243
6,316
13,690
16,502
14,976
35-44 29,776
45-54 34,077
55-64 32,684
65-74 22,652
75+ 18,903
15,353
17,127
15,864
10,601
7,388
14,423
16,950
16,820
12,051
11,515
Natality and Reported Pregnancies^ (2014 Residents)
Crude Birth Rate10.8
Average Annual General56.6
% Low Birth Weight 6.4
% Prenatal Care in 1st Trimester 72.5
% Births to Mothers Under 18 1.2
6.2
74.1
0.9
12.5
54.5
ND
Per 1,000 Population
Fertility Rate* (2012-2014)
All Races White Black
All Ages 3,012
Under 15 4
15-17 36
2,630
1
30
22
0
1
360
3
5
Age of WomanReported
PregnanciesLive
BirthsFetal
DeathsInduced
Abortions
Outcome
Age of WomanReported
PregnanciesLive
BirthsFetal
DeathsInduced
Abortions
Outcome
18-19 99
20-29 1,537
30 and Over 1,327
67
1,324
1,199
0
10
11
32
203
117
All Ages* 57.3
Under 15** ND
15-17 6.9
65.6
ND
8.3
Age of Woman Birth Rate Reported Pregnancy Rate Age of Woman Birth Rate Reported Pregnancy Rate
18-19 16.3
20-29 84.7
30 and Over** 40.2
24.1
98.3
44.5
^Live births, fetal deaths of 16+ weeks gestation, and induced abortions performed in-state. Notes: All ages includes any unknown ages. All rates per 1,000.*All Ages includes female population ages 15-44. ** Under 15 includes female population ages 10-14; 30 and Over includes female population ages 30-49.
Hispanic
ND
63.6
ND
(of any race)
7.2
75.0
ND
Asian / Pacific
General Notes: Crude and age-adjusted rates based on less than 10 events are considered statistically unreliable and are not displayed (ND), unless otherwise noted. Starting in 2013, race of resident was derived from multiple race selections. A person is Multi-Race if they identify as more than one race. Prior to 2013, race of resident was derived from a single race designation.
Morbidity (2012-2014 Residents)
Reported Incidence and Average Annual Rate (per 100,000) for Selected Notifiable Diseases (2012-2014)
HIV 35 4.8
Syphilis 17 2.3
Tuberculosis 12 1.7
Total Rate
Chlamydia 1,852 255.9
Giardiasis 19 2.6
Gonorrhea 350 48.4
Hepatitis: Type A < 5 ND
Total Rate
Lyme Disease 409 56.5
Salmonellosis 69 9.5
Total Rate
Campylobacteriosis 80 11.1 Hep. B* Acute 5 ND
Shigellosis 6 ND
*Hepatitis: Type B **Meningococcal Disease
Meningococcal** 0 ND
Pertussis 65 9.0
Hep. B* Chronic 115 15.9
Chickenpox 48 6.6
Islander
Note: Communicable diseases with demographic counts of 1 to 4 are displayed as "< 5" to avoid potential identification of cases within certain geographic areas.
Multi - Race
ND
65.6
ND

Cumberland County PAGE 2
Mortality (2014 Residents)
Selected Major Causes of Death, Number and Average Annual Age-Adjusted Death Rate* (2012-2014)
Number of Resident Deaths 2,216
Crude Death Rate per 1,000 9.1
Age-Adjusted Death Rate per 1,000 6.7
Number of Infant Deaths (< 1 Year of Age) 14 12 2 1
AllRaces BlackWhite
Hispanic(any race)
Infant Mortality Rate per 1,000 Live Births 5.3 5.5 ND ND
Average Annual Infant Mortality Rate (2012-2014) 4.5 4.4 ND ND
Cause Total Rate
Diseases of Heart 1,852
Cancer 1,405
Stroke 357
C.L.R.D.** 347
Accidents 251
181.2
147.5
35.1
35.9
31.3
Cause Total Rate
Influenza/Pneumonia 186
Diabetes Mellitus 166
Septicemia 120
Nephritis/Nephrosis 135
Alzheimer's Disease 148
18.0
17.4
12.0
13.5
14.0
* Per 100,000 2000 U.S. standardmillion population. Age-adjusted rates
** Chronic Lower Respiratory Disease
Selected Leading Causes of Death, Number by Age Group (2014)
Under 5 Years of Age 5-24 Years of Age 25-44 Years of Age 45-64 Years of Age 65 Years and Older
Perinatal Conditions 5
Birth Defects 4
Accidents 2
Accidents 8
Suicide 3
Accidents 25
Cancer 13
Suicide 12
Diseases of Heart 7
Cancer 95
Diseases of Heart 69
Accidents 25
Suicide 15
Stroke 14
Diseases of Heart 546
Cancer 353
C.L.R.D.** 105
Stroke 98
TOTAL 16 TOTAL 17 TOTAL 69 TOTAL 319 TOTAL 1,795
Note: Total includes all other causes.
Asian/PI*
0
ND
*Asian/Pacific Islander ^ NA = Multi-Race data not available before 2013.
are only comparable if the samestandard million population was usedin the calculation.
Invasive Cancer Incidence and Average Annual Age-Adjusted Rates* for Major Sites by Sex
All Sites 1,937 472.2
Prostate 345 78.0
Lung and Bronchus 266 66.0
Colon and Rectum 196 47.7
Male FemaleTotal Rate Total Rate
Female Breast 628 133.2
2,097 436.0
219 42.9
204 40.6
*Per 100,000 2000 U.S. standard million population. Age-adjusted rates are only comparable if the same standard million population was used in the calculation.
- -
- -
Male FemaleTotal Rate Total Rate
Non-Hodgkin Lymphoma 114 28.4
Melanoma of the Skin 139 33.2
79 15.0
149 30.2
107 24.6
Corpus and Uterus, NOS - -
Urinary Bladder 152
Kidney and Renal Pelvis 93 23.6
37.1 68
61
13.3
12.3
Notes: All in situ cases, except for urinary bladder, are excluded. Age-adjusted rates based on less than 20 events are statistically unreliable and are not displayed (ND).
Cancer Incidence (2011-2013 Residents)
Adult Behavioral Health Risk Factors (2012-2014)[Includes: Cumberland and Perry Counties]
General Notes: Crude and age-adjusted rates based on less than 10 events are considered statistically unreliable and are not displayed (ND), unless otherwise noted. Starting in 2013, race of resident was derived from multiple race selections. A person is Multi-Race if they identify as more than one race. Prior to 2013, race of resident was derived from a single race designation.
Percent (CI)Risk Factors
Fair or poor general health:
Obese:
Overweight (includes obese):
No health insurance (ages 18-64):
Visited a doctor in the past 2 yearsfor a routine check-up:
Percent (CI)Risk Factors
Ever told they have diabetes: Currently has asthma:
Current smoker:
Ever tested for HIV (ages 18-64):
Needed to see a doctor but couldnot due to cost in the past year:
12
31
(10 - 15)
(27 - 35)
63 (59 - 67)
15 (11 - 19)
80 (76 - 83)
10 10(8 - 12) (8 - 13)
21 (17 - 25)
33 (28 - 38)
10 (7 - 13)
Notes: Data are based on 2012-2014 annual sample surveys of Pennsylvania adults. CI= 95% Confidence Interval.
Additional state or county/regional data are available at www.statistics.health.pa.gov.
^In situ, benign, and uncertain neoplasms
Multi- Race
0
ND
NAND ^

Cumberland County PAGE 3
Hospitals (7/13-6/14)
Total General Acute Care
Psychiatric Rehabilitation
5 2 0 1
General Hospitals
Beds Set Up and Staffed 394
Admissions 17,404
Beds per 1,000 Population 1.6
Admissions per 1,000 Population 71.4
Average Inpatient Occupancy Rate 58.4
Nursing Homes (2014)
Total Number Certified-Medicare Certified-Medicaid
Nursing Homes
Licensed/Approved Beds
17 17 16
2,056 2,056 2,008
49.5
Average Occupancy Rate 88.1
Average Length of Stay (Number of Days) 142.1
$329
Total Licensed/Approved Beds per 1,000 Population Age 65 and Older
Average Semi-Private Daily Room Rate
Drug and Alcohol Treatment
Admissions to Client Primary Diagnosis
Drug Abuse Alcohol Abuse Other*
Percent Admitted
Only Once During 7/13-6/14
825 332 248 28 73.2
* Includes family members receiving counseling.
All Licensed Facilities Inpatient Non-Hospital
Inpatient Hospital Partial Hospitalization Outpatient9
0
0 1 9
Note: Each licensed facility may provide more than one type of service.
State-Supported Facilities
Types of Service Provided
Number of
Clients Admitted
608
Admission by County of Residence (7/13-6/14)
Treatment Facilities (as of 6/14)
Correctional Institution 0
General Note: Crude rates based on less than 10 events are considered statistically unreliable and are not displayed (ND), unless otherwise noted.
Services Funding
Other
2
Non-Profit
1
For Profit
4
State
0
Other
0
Ambulatory Surgery Centers (7/13-6/14)
Employees
Part Time Employees 101
Full Time Employees 174
Contracted Employees 38
Payroll Employees 237 Staff with Clinical Privileges 379
Total Surgical Visits per Employee 141.3
Total Facilities 11 Total Surgical Visits 38,856
Percent of Surgical Visits, Age 65+ 35.2
Total Operating Rooms 17 Total Surgical Visits per Operating Room 2,285.6
Facilities Surgical Visits
Staff Licensed as M.D. 278
Total Employees per Operating Room 16.2
Average Semi-Private Daily Room Rate $1,018
Total Employees 275

PAGE 4Cumberland County
Pennsylvania Health Care Workforce (2013-2014)
Notes: Only health care employees renewing their license in 2013-2014 were surveyed.The "Estimated Number" and "Percent of Workforce Intending to Remain in Profession for 6 or More Years" used to compute each "% Change from Previous Survey Year" are adjusted based on the response rates for the previous and current survey results. The survey results are available every two years. Numbers and percentages pertain to county of employment.Percentages based on less than six responses are considered statistically unreliable and are not displayed (ND).Registered Nurses and Licensed Practical Nurses are not comparable to previous survey period, so some data is not available (DNA).
Licensed Practical Nurses (2014) 674 DNA 84.4% DNA
Physicians (2014) 563
Dentists (2013) 133
Registered Nurses (2012/2013) 2,198 DNA 81.4% DNA
-5.9% 70.2% -3.5%
-9.4% 73.3% -6.7%
Estimated Number
Percent Changefrom Previous
Survey
Difference in Percent from
Previous Survey
Percent of WorkforceIntending to Remain in
Profession for 6 or More Years
Injury Hospitalizations (2014)
Injury Hospitalizations and Median Charges by Age and Sex
Injury Hospitalizations and Median Charges by Type of Payor
Injury Hospitalizations and Median Charges by Mechanism/Intent and Sex
0-4 5-14 15-24 25-44 45-64 65 and Older
Male - Total
Male - Median Charges
Female - Total
Female - Median Charges
UnintentionalMotor Vehicle All Poisonings Unintentional Falls
Unintentional Fire/Flame or Hot Object/Substance All Firearm All Other Injuries
Male - Total
Male - Median Charges
Female - Total
Female - Median Charges
Medicare Medicaid Other Government Commercial / Private Blue Cross Uninsured
Total Hospitalizations
Median Charges
All Ages
915 17 12 63 128 226 469
$31,274.30 $25,601.25 $29,309.30 $38,552.85 $24,568.80 $31,994.46 $31,710.50
1,118 11 6 31 126 212 732
$27,502.70 $7,710.00 ND $16,535.33 $21,765.45 $27,139.41 $28,554.75
Note: Median charges not displayed (ND) for occurrences less than 10.
541,195 157 30430516
$21,502.77 $29,054.28 $26,405.30 $24,510.55 $35,877.35 $38,418.33
304
327
36
80
106
77
661
410
9
14
2
7
$27,117.76
$29,129.14
$47,280.83
$52,700.88
$13,734.21
$16,637.69
$29,021.20
$32,431.66
ND
$21,422.65
ND
ND
Disclaimer: Injury data used in this report were provided to the Pennsylvania Department of Health by the Pennsylvania Health Care Cost Containment Council. The Pennsylvania Health Care Cost Containment Council specifically disclaims responsibility for any interpretations or conclusions. Contents may be republished or reproduced whole or in part, with attribution.

Dauphin CountyHealth Profile 2016
Demographic Data (2014)
% Population Change 2010 to 2014 1.3
Median Age of the Population (2010-2014) 39.4
% Population Aged 65 and Over 15.3
Population per Square Mile 517.0
% Population with Income Below Poverty Level (2010-2014) 13.6
Per Capita Personal Income $45,453
% Labor Force Unemployed - Annual Average 5.4
% Population Eligible for Medical Assistance 18.3
Estimated Population by Age and Sex (2014)
Age Total Male Female Age Total Male Female
All Ages 271,453
Under 5 16,806
5-14 33,662
15-24 33,382
25-34 36,827
131,500
8,517
17,133
16,897
18,187
139,953
8,289
16,529
16,485
18,640
35-44 32,791
45-54 38,311
55-64 38,170
65-74 23,285
75+ 18,219
16,198
18,584
18,294
10,783
6,907
16,593
19,727
19,876
12,502
11,312
Estimated Population by Race (2014)
White 201,069 Black 50,798 Other Races 19,586
Natality and Reported Pregnancies^ (2014 Residents)
Crude Birth Rate13.0
Average Annual General66.8
% Low Birth Weight 8.8
% Prenatal Care in 1st Trimester 71.5
% Births to Mothers Under 18 2.0
6.5
78.1
0.9
14.0
60.7
3.7
Per 1,000 Population
Fertility Rate* (2012-2014)
All Races White Black
All Ages 4,294
Under 15 2
15-17 85
3,541
2
69
34
0
0
719
0
16
Age of WomanReported
PregnanciesLive
BirthsFetal
DeathsInduced
Abortions
Outcome
Age of WomanReported
PregnanciesLive
BirthsFetal
DeathsInduced
Abortions
Outcome
18-19 216
20-29 2,355
30 and Over 1,621
162
1,877
1,416
4
21
9
50
457
196
All Ages* 68.5
Under 15** ND
15-17 14.0
83.0
ND
17.3
Age of Woman Birth Rate Reported Pregnancy Rate Age of Woman Birth Rate Reported Pregnancy Rate
18-19 53.2
20-29 104.5
30 and Over** 40.5
70.9
131.1
46.3
^Live births, fetal deaths of 16+ weeks gestation, and induced abortions performed in-state. Notes: All ages includes any unknown ages. All rates per 1,000.*All Ages includes female population ages 15-44. ** Under 15 includes female population ages 10-14; 30 and Over includes female population ages 30-49.
Hispanic
9.1
65.2
4.3
(of any race)
9.8
67.4
ND
Asian / Pacific
General Notes: Crude and age-adjusted rates based on less than 10 events are considered statistically unreliable and are not displayed (ND), unless otherwise noted. Starting in 2013, race of resident was derived from multiple race selections. A person is Multi-Race if they identify as more than one race. Prior to 2013, race of resident was derived from a single race designation.
Morbidity (2012-2014 Residents)
Reported Incidence and Average Annual Rate (per 100,000) for Selected Notifiable Diseases (2012-2014)
HIV 111 13.7
Syphilis 46 5.7
Tuberculosis 23 2.8
Total Rate
Chlamydia 4,472 550.7
Giardiasis 23 2.8
Gonorrhea 1,430 176.1
Hepatitis: Type A 5 ND
Total Rate
Lyme Disease 414 51.0
Salmonellosis 70 8.6
Total Rate
Campylobacteriosis 78 9.6 Hep. B* Acute < 5 ND
Shigellosis 14 1.7
*Hepatitis: Type B **Meningococcal Disease
Meningococcal** < 5 ND
Pertussis 40 4.9
Hep. B* Chronic 177 21.8
Chickenpox 48 5.9
Islander
Note: Communicable diseases with demographic counts of 1 to 4 are displayed as "< 5" to avoid potential identification of cases within certain geographic areas.
Multi - Race
11.5
62.9
4.6

Dauphin County PAGE 2
Mortality (2014 Residents)
Selected Major Causes of Death, Number and Average Annual Age-Adjusted Death Rate* (2012-2014)
Number of Resident Deaths 2,404
Crude Death Rate per 1,000 8.9
Age-Adjusted Death Rate per 1,000 7.2
Number of Infant Deaths (< 1 Year of Age) 21 4 16 0
AllRaces BlackWhite
Hispanic(any race)
Infant Mortality Rate per 1,000 Live Births 5.9 ND 21.7 ND
Average Annual Infant Mortality Rate (2012-2014) 7.6 3.1 19.8 ND
Cause Total Rate
Diseases of Heart 1,899
Cancer 1,573
Stroke 314
C.L.R.D.** 338
Accidents 318
190.3
159.8
31.6
34.7
36.3
Cause Total Rate
Influenza/Pneumonia 190
Diabetes Mellitus 171
Septicemia 164
Nephritis/Nephrosis 185
Alzheimer's Disease 139
19.0
17.2
16.7
18.9
14.3
* Per 100,000 2000 U.S. standardmillion population. Age-adjusted rates
** Chronic Lower Respiratory Disease
Selected Leading Causes of Death, Number by Age Group (2014)
Under 5 Years of Age 5-24 Years of Age 25-44 Years of Age 45-64 Years of Age 65 Years and Older
Perinatal Conditions 13
Birth Defects 2
Accidents 12
Assault (Homicide) 8
Suicide 6
Cancer 4
Accidents 24
Cancer 13
Diseases of Heart 11
Suicide 10
Assault (Homicide) 9
Cancer 157
Diseases of Heart 101
Accidents 40
Liver Dis./Cirrhosis 21
Suicide 18
Diseases of Heart 504
Cancer 350
Stroke 99
C.L.R.D.** 84
TOTAL 24 TOTAL 30 TOTAL 90 TOTAL 503 TOTAL 1,757
Note: Total includes all other causes.
Asian/PI*
0
ND
*Asian/Pacific Islander ^ NA = Multi-Race data not available before 2013.
are only comparable if the samestandard million population was usedin the calculation.
Invasive Cancer Incidence and Average Annual Age-Adjusted Rates* for Major Sites by Sex
All Sites 2,119 491.1
Prostate 464 99.0
Lung and Bronchus 326 77.5
Colon and Rectum 189 44.5
Male FemaleTotal Rate Total Rate
Female Breast 617 118.8
2,274 437.9
321 60.4
212 39.0
*Per 100,000 2000 U.S. standard million population. Age-adjusted rates are only comparable if the same standard million population was used in the calculation.
- -
- -
Male FemaleTotal Rate Total Rate
Non-Hodgkin Lymphoma 93 22.7
Melanoma of the Skin 138 32.9
82 15.1
171 32.1
95 20.1
Corpus and Uterus, NOS - -
Urinary Bladder 158
Kidney and Renal Pelvis 108 24.2
38.9 39
60
6.9
12.0
Notes: All in situ cases, except for urinary bladder, are excluded. Age-adjusted rates based on less than 20 events are statistically unreliable and are not displayed (ND).
Cancer Incidence (2011-2013 Residents)
Adult Behavioral Health Risk Factors (2012-2014)[Includes: Dauphin and Lebanon Counties]
General Notes: Crude and age-adjusted rates based on less than 10 events are considered statistically unreliable and are not displayed (ND), unless otherwise noted. Starting in 2013, race of resident was derived from multiple race selections. A person is Multi-Race if they identify as more than one race. Prior to 2013, race of resident was derived from a single race designation.
Percent (CI)Risk Factors
Fair or poor general health:
Obese:
Overweight (includes obese):
No health insurance (ages 18-64):
Visited a doctor in the past 2 yearsfor a routine check-up:
Percent (CI)Risk Factors
Ever told they have diabetes: Currently has asthma:
Current smoker:
Ever tested for HIV (ages 18-64):
Needed to see a doctor but couldnot due to cost in the past year:
16
32
(13 - 18)
(28 - 35)
67 (63 - 70)
19 (15 - 23)
82 (78 - 85)
11 9(9 - 13) (7 - 11)
19 (16 - 23)
34 (30 - 39)
12 (10 - 16)
Notes: Data are based on 2012-2014 annual sample surveys of Pennsylvania adults. CI= 95% Confidence Interval.
Additional state or county/regional data are available at www.statistics.health.pa.gov.
^In situ, benign, and uncertain neoplasms
Multi- Race
0
ND
NAND ^

Dauphin County PAGE 3
Hospitals (7/13-6/14)
Total General Acute Care
Psychiatric Rehabilitation
5 2 1 1
General Hospitals
Beds Set Up and Staffed 1,164
Admissions 59,246
Beds per 1,000 Population 4.3
Admissions per 1,000 Population 218.3
Average Inpatient Occupancy Rate 76.2
Nursing Homes (2014)
Total Number Certified-Medicare Certified-Medicaid
Nursing Homes
Licensed/Approved Beds
11 11 10
1,517 1,517 1,495
36.6
Average Occupancy Rate 90.2
Average Length of Stay (Number of Days) 127.5
$268
Total Licensed/Approved Beds per 1,000 Population Age 65 and Older
Average Semi-Private Daily Room Rate
Drug and Alcohol Treatment
Admissions to Client Primary Diagnosis
Drug Abuse Alcohol Abuse Other*
Percent Admitted
Only Once During 7/13-6/14
916 520 195 66 86.3
* Includes family members receiving counseling.
All Licensed Facilities Inpatient Non-Hospital
Inpatient Hospital Partial Hospitalization Outpatient21
7
0 0 14
Note: Each licensed facility may provide more than one type of service.
State-Supported Facilities
Types of Service Provided
Number of
Clients Admitted
781
Admission by County of Residence (7/13-6/14)
Treatment Facilities (as of 6/14)
Correctional Institution 0
General Note: Crude rates based on less than 10 events are considered statistically unreliable and are not displayed (ND), unless otherwise noted.
Services Funding
Other
1
Non-Profit
3
For Profit
2
State
0
Other
0
Ambulatory Surgery Centers (7/13-6/14)
Employees
Part Time Employees 116
Full Time Employees 151
Contracted Employees 66
Payroll Employees 201 Staff with Clinical Privileges 254
Total Surgical Visits per Employee 154.3
Total Facilities 10 Total Surgical Visits 41,209
Percent of Surgical Visits, Age 65+ 36.9
Total Operating Rooms 22 Total Surgical Visits per Operating Room 1,873.1
Facilities Surgical Visits
Staff Licensed as M.D. 227
Total Employees per Operating Room 12.1
Average Semi-Private Daily Room Rate $1,753
Total Employees 267

PAGE 4Dauphin County
Pennsylvania Health Care Workforce (2013-2014)
Notes: Only health care employees renewing their license in 2013-2014 were surveyed.The "Estimated Number" and "Percent of Workforce Intending to Remain in Profession for 6 or More Years" used to compute each "% Change from Previous Survey Year" are adjusted based on the response rates for the previous and current survey results. The survey results are available every two years. Numbers and percentages pertain to county of employment.Percentages based on less than six responses are considered statistically unreliable and are not displayed (ND).Registered Nurses and Licensed Practical Nurses are not comparable to previous survey period, so some data is not available (DNA).
Licensed Practical Nurses (2014) 759 DNA 86.5% DNA
Physicians (2014) 1,271
Dentists (2013) 162
Registered Nurses (2012/2013) 5,174 DNA 83.1% DNA
3.6% 71.1% -0.4%
3.8% 75.2% -3.1%
Estimated Number
Percent Changefrom Previous
Survey
Difference in Percent from
Previous Survey
Percent of WorkforceIntending to Remain in
Profession for 6 or More Years
Injury Hospitalizations (2014)
Injury Hospitalizations and Median Charges by Age and Sex
Injury Hospitalizations and Median Charges by Type of Payor
Injury Hospitalizations and Median Charges by Mechanism/Intent and Sex
0-4 5-14 15-24 25-44 45-64 65 and Older
Male - Total
Male - Median Charges
Female - Total
Female - Median Charges
UnintentionalMotor Vehicle All Poisonings Unintentional Falls
Unintentional Fire/Flame or Hot Object/Substance All Firearm All Other Injuries
Male - Total
Male - Median Charges
Female - Total
Female - Median Charges
Medicare Medicaid Other Government Commercial / Private Blue Cross Uninsured
Total Hospitalizations
Median Charges
All Ages
1,049 18 16 93 230 341 351
$26,013.80 $15,434.30 $22,207.20 $26,434.25 $20,590.03 $29,870.66 $26,441.16
1,118 22 6 51 141 289 609
$21,709.48 $23,334.65 ND $12,557.40 $18,610.82 $21,363.51 $23,149.70
Note: Median charges not displayed (ND) for occurrences less than 10.
1071,047 343 33331720
$15,518.36 $23,093.70 $16,140.06 $22,432.40 $34,760.00 $26,311.78
241
343
52
113
178
163
620
388
21
17
6
25
$20,742.95
$24,974.71
$54,304.43
$57,126.85
$12,480.12
$11,691.80
$23,132.80
$26,907.80
$28,878.56
$21,242.72
ND
$80,480.75
Disclaimer: Injury data used in this report were provided to the Pennsylvania Department of Health by the Pennsylvania Health Care Cost Containment Council. The Pennsylvania Health Care Cost Containment Council specifically disclaims responsibility for any interpretations or conclusions. Contents may be republished or reproduced whole or in part, with attribution.

Delaware CountyHealth Profile 2016
Demographic Data (2014)
% Population Change 2010 to 2014 0.7
Median Age of the Population (2010-2014) 38.9
% Population Aged 65 and Over 15.0
Population per Square Mile 3,062.2
% Population with Income Below Poverty Level (2010-2014) 10.5
Per Capita Personal Income $55,313
% Labor Force Unemployed - Annual Average 5.5
% Population Eligible for Medical Assistance 15.8
Estimated Population by Age and Sex (2014)
Age Total Male Female Age Total Male Female
All Ages 562,960
Under 5 33,741
5-14 69,818
15-24 80,703
25-34 71,906
270,321
17,175
35,481
41,087
35,260
292,639
16,566
34,337
39,616
36,646
35-44 66,656
45-54 79,337
55-64 76,096
65-74 44,019
75+ 40,684
32,062
38,069
36,139
19,913
15,135
34,594
41,268
39,957
24,106
25,549
Estimated Population by Race (2014)
White 400,313 Black 119,506 Other Races 12,307
Natality and Reported Pregnancies^ (2014 Residents)
Crude Birth Rate12.0
Average Annual General59.9
% Low Birth Weight 9.3
% Prenatal Care in 1st Trimester 61.1
% Births to Mothers Under 18 1.1
8.0
72.4
0.5
13.4
43.2
2.3
Per 1,000 Population
Fertility Rate* (2012-2014)
All Races White Black
All Ages 8,428
Under 15 11
15-17 111
6,750
5
67
67
0
0
1,611
6
44
Age of WomanReported
PregnanciesLive
BirthsFetal
DeathsInduced
Abortions
Outcome
Age of WomanReported
PregnanciesLive
BirthsFetal
DeathsInduced
Abortions
Outcome
18-19 320
20-29 3,783
30 and Over 4,181
194
2,777
3,685
1
29
37
125
977
459
All Ages* 60.9
Under 15** ND
15-17 6.2
76.0
0.6
10.2
Age of Woman Birth Rate Reported Pregnancy Rate Age of Woman Birth Rate Reported Pregnancy Rate
18-19 21.4
20-29 72.5
30 and Over** 51.1
35.4
98.8
58.0
^Live births, fetal deaths of 16+ weeks gestation, and induced abortions performed in-state. Notes: All ages includes any unknown ages. All rates per 1,000.*All Ages includes female population ages 15-44. ** Under 15 includes female population ages 10-14; 30 and Over includes female population ages 30-49.
Hispanic
7.7
46.4
ND
(of any race)
Asian/PI* 30,834
6.3
53.3
ND
Asian / Pacific
General Notes: Crude and age-adjusted rates based on less than 10 events are considered statistically unreliable and are not displayed (ND), unless otherwise noted. Starting in 2013, race of resident was derived from multiple race selections. A person is Multi-Race if they identify as more than one race. Prior to 2013, race of resident was derived from a single race designation.
Morbidity (2012-2014 Residents)
Reported Incidence and Average Annual Rate (per 100,000) for Selected Notifiable Diseases (2012-2014)
HIV 240 14.2
Syphilis 58 3.4
Tuberculosis 34 2.0
Total Rate
Chlamydia 8,188 485.6
Giardiasis 58 3.4
Gonorrhea 2,023 120.0
Hepatitis: Type A 6 ND
Total Rate
Lyme Disease 532 31.6
Salmonellosis 237 14.1
Total Rate
Campylobacteriosis 173 10.3 Hep. B* Acute 5 ND
Shigellosis 31 1.8
*Hepatitis: Type B **Meningococcal Disease
Meningococcal** < 5 ND
Pertussis 239 14.2
Hep. B* Chronic 743 44.1
Chickenpox 49 2.9
Islander
*Asian/Pacific Islander
Note: Communicable diseases with demographic counts of 1 to 4 are displayed as "< 5" to avoid potential identification of cases within certain geographic areas.
Multi - Race
6.7
44.1
4.4

Delaware County PAGE 2
Mortality (2014 Residents)
Selected Major Causes of Death, Number and Average Annual Age-Adjusted Death Rate* (2012-2014)
Number of Resident Deaths 5,333
Crude Death Rate per 1,000 9.5
Age-Adjusted Death Rate per 1,000 7.4
Number of Infant Deaths (< 1 Year of Age) 60 28 24 1
AllRaces BlackWhite
Hispanic(any race)
Infant Mortality Rate per 1,000 Live Births 8.9 7.0 13.4 ND
Average Annual Infant Mortality Rate (2012-2014) 8.7 5.4 15.4 ND
Cause Total Rate
Diseases of Heart 3,923
Cancer 3,732
Stroke 858
C.L.R.D.** 884
Accidents 744
173.2
178.6
37.4
41.4
40.5
Cause Total Rate
Influenza/Pneumonia 400
Diabetes Mellitus 369
Septicemia 238
Nephritis/Nephrosis 341
Alzheimer's Disease 325
17.4
17.6
11.1
15.2
13.5
* Per 100,000 2000 U.S. standardmillion population. Age-adjusted rates
** Chronic Lower Respiratory Disease
Selected Leading Causes of Death, Number by Age Group (2014)
Under 5 Years of Age 5-24 Years of Age 25-44 Years of Age 45-64 Years of Age 65 Years and Older
Perinatal Conditions 36
Birth Defects 9
Accidents 3
Septicemia 2
Assault (Homicide) 19
Accidents 17
Suicide 8
Cancer 5
Diseases of Heart 2
Accidents 74
Suicide 24
Cancer 23
Diseases of Heart 22
Assault (Homicide) 20
Cancer 322
Diseases of Heart 171
Accidents 75
Suicide 48
Liver Dis./Cirrhosis 34
Diseases of Heart 1,096
Cancer 888
C.L.R.D.** 267
Stroke 259
Influenza/Pneumonia 108
TOTAL 66 TOTAL 60 TOTAL 230 TOTAL 950 TOTAL 4,026
Note: Total includes all other causes.
Asian/PI*
3
ND
*Asian/Pacific Islander ^ NA = Multi-Race data not available before 2013.
are only comparable if the samestandard million population was usedin the calculation.
Invasive Cancer Incidence and Average Annual Age-Adjusted Rates* for Major Sites by Sex
All Sites 4,912 561.5
Prostate 1,223 132.2
Lung and Bronchus 628 73.4
Colon and Rectum 457 53.5
Male FemaleTotal Rate Total Rate
Female Breast 1,480 139.5
5,142 471.6
688 59.7
453 38.9
*Per 100,000 2000 U.S. standard million population. Age-adjusted rates are only comparable if the same standard million population was used in the calculation.
- -
- -
Male FemaleTotal Rate Total Rate
Non-Hodgkin Lymphoma 214 25.5
Melanoma of the Skin 288 34.2
177 15.8
345 30.9
241 23.7
Corpus and Uterus, NOS - -
Urinary Bladder 369
Kidney and Renal Pelvis 212 23.8
44.0 135
114
11.4
10.8
Notes: All in situ cases, except for urinary bladder, are excluded. Age-adjusted rates based on less than 20 events are statistically unreliable and are not displayed (ND).
Cancer Incidence (2011-2013 Residents)
Adult Behavioral Health Risk Factors (2012-2014)[Includes: Delaware County Only]
General Notes: Crude and age-adjusted rates based on less than 10 events are considered statistically unreliable and are not displayed (ND), unless otherwise noted. Starting in 2013, race of resident was derived from multiple race selections. A person is Multi-Race if they identify as more than one race. Prior to 2013, race of resident was derived from a single race designation.
Percent (CI)Risk Factors
Fair or poor general health:
Obese:
Overweight (includes obese):
No health insurance (ages 18-64):
Visited a doctor in the past 2 yearsfor a routine check-up:
Percent (CI)Risk Factors
Ever told they have diabetes: Currently has asthma:
Current smoker:
Ever tested for HIV (ages 18-64):
Needed to see a doctor but couldnot due to cost in the past year:
14
23
(11 - 17)
(19 - 27)
58 (54 - 62)
12 (9 - 15)
86 (83 - 89)
8 8(6 - 11) (6 - 11)
19 (16 - 23)
48 (43 - 53)
11 (9 - 14)
Notes: Data are based on 2012-2014 annual sample surveys of Pennsylvania adults. CI= 95% Confidence Interval.
Additional state or county/regional data are available at www.statistics.health.pa.gov.
^In situ, benign, and uncertain neoplasms
Multi- Race
4
ND
NAND ^

Delaware County PAGE 3
Hospitals (7/13-6/14)
Total General Acute Care
Psychiatric Rehabilitation
5 4 0 0
General Hospitals
Beds Set Up and Staffed 950
Admissions 48,973
Beds per 1,000 Population 1.7
Admissions per 1,000 Population 87.0
Average Inpatient Occupancy Rate 65.5
Nursing Homes (2014)
Total Number Certified-Medicare Certified-Medicaid
Nursing Homes
Licensed/Approved Beds
29 29 19
4,323 4,136 3,568
51.0
Average Occupancy Rate 89.8
Average Length of Stay (Number of Days) 109.4
$352
Total Licensed/Approved Beds per 1,000 Population Age 65 and Older
Average Semi-Private Daily Room Rate
Drug and Alcohol Treatment
Admissions to Client Primary Diagnosis
Drug Abuse Alcohol Abuse Other*
Percent Admitted
Only Once During 7/13-6/14
3,046 1,155 334 341 56.4
* Includes family members receiving counseling.
All Licensed Facilities Inpatient Non-Hospital
Inpatient Hospital Partial Hospitalization Outpatient21
3
0 2 19
Note: Each licensed facility may provide more than one type of service.
State-Supported Facilities
Types of Service Provided
Number of
Clients Admitted
1,830
Admission by County of Residence (7/13-6/14)
Treatment Facilities (as of 6/14)
Correctional Institution 0
General Note: Crude rates based on less than 10 events are considered statistically unreliable and are not displayed (ND), unless otherwise noted.
Services Funding
Other
1
Non-Profit
4
For Profit
1
State
0
Other
0
Ambulatory Surgery Centers (7/13-6/14)
Employees
Part Time Employees 130
Full Time Employees 374
Contracted Employees 68
Payroll Employees 436 Staff with Clinical Privileges 301
Total Surgical Visits per Employee 69.7
Total Facilities 18 Total Surgical Visits 35,138
Percent of Surgical Visits, Age 65+ 33.8
Total Operating Rooms 41 Total Surgical Visits per Operating Room 857.0
Facilities Surgical Visits
Staff Licensed as M.D. 233
Total Employees per Operating Room 12.3
Average Semi-Private Daily Room Rate $4,606
Total Employees 504

PAGE 4Delaware County
Pennsylvania Health Care Workforce (2013-2014)
Notes: Only health care employees renewing their license in 2013-2014 were surveyed.The "Estimated Number" and "Percent of Workforce Intending to Remain in Profession for 6 or More Years" used to compute each "% Change from Previous Survey Year" are adjusted based on the response rates for the previous and current survey results. The survey results are available every two years. Numbers and percentages pertain to county of employment.Percentages based on less than six responses are considered statistically unreliable and are not displayed (ND).Registered Nurses and Licensed Practical Nurses are not comparable to previous survey period, so some data is not available (DNA).
Licensed Practical Nurses (2014) 1,080 DNA 82.5% DNA
Physicians (2014) 1,351
Dentists (2013) 373
Registered Nurses (2012/2013) 5,822 DNA 81.8% DNA
-1.7% 71.5% -3.7%
-1.8% 75.1% -5.2%
Estimated Number
Percent Changefrom Previous
Survey
Difference in Percent from
Previous Survey
Percent of WorkforceIntending to Remain in
Profession for 6 or More Years
Injury Hospitalizations (2014)
Injury Hospitalizations and Median Charges by Age and Sex
Injury Hospitalizations and Median Charges by Type of Payor
Injury Hospitalizations and Median Charges by Mechanism/Intent and Sex
0-4 5-14 15-24 25-44 45-64 65 and Older
Male - Total
Male - Median Charges
Female - Total
Female - Median Charges
UnintentionalMotor Vehicle All Poisonings Unintentional Falls
Unintentional Fire/Flame or Hot Object/Substance All Firearm All Other Injuries
Male - Total
Male - Median Charges
Female - Total
Female - Median Charges
Medicare Medicaid Other Government Commercial / Private Blue Cross Uninsured
Total Hospitalizations
Median Charges
All Ages
3,380 69 63 314 611 1,036 1,287
$62,143.60 $19,816.00 $32,815.00 $54,677.00 $56,089.00 $61,704.00 $71,302.00
3,524 64 52 149 349 800 2,110
$59,989.03 $26,006.00 $29,349.00 $37,289.00 $45,772.00 $68,537.50 $63,634.50
Note: Median charges not displayed (ND) for occurrences less than 10.
2003,714 1,031 97784667
$49,072.00 $67,837.00 $56,629.00 $48,466.98 $55,689.40 $68,771.00
1,107
1,386
136
188
387
396
1,846
1,238
33
64
15
108
$58,220.25
$61,388.00
$69,963.00
$79,252.28
$42,655.00
$43,190.88
$63,574.27
$64,168.09
$62,537.00
$60,993.00
$99,859.00
$103,959.50
Disclaimer: Injury data used in this report were provided to the Pennsylvania Department of Health by the Pennsylvania Health Care Cost Containment Council. The Pennsylvania Health Care Cost Containment Council specifically disclaims responsibility for any interpretations or conclusions. Contents may be republished or reproduced whole or in part, with attribution.

Elk CountyHealth Profile 2016
Demographic Data (2014)
% Population Change 2010 to 2014 -2.4
Median Age of the Population (2010-2014) 45.9
% Population Aged 65 and Over 20.5
Population per Square Mile 37.7
% Population with Income Below Poverty Level (2010-2014) 10.3
Per Capita Personal Income $42,290
% Labor Force Unemployed - Annual Average 5.2
% Population Eligible for Medical Assistance 16.4
Estimated Population by Age and Sex (2014)
Age Total Male Female Age Total Male Female
All Ages 31,194
Under 5 1,521
5-14 3,478
15-24 3,417
25-34 2,962
15,624
800
1,780
1,769
1,596
15,570
721
1,698
1,648
1,366
35-44 3,453
45-54 5,045
55-64 4,938
65-74 3,301
75+ 3,079
1,714
2,576
2,565
1,611
1,213
1,739
2,469
2,373
1,690
1,866
Natality and Reported Pregnancies^ (2014 Residents)
Crude Birth Rate9.2
Average Annual General60.1
% Low Birth Weight 7.3
% Prenatal Care in 1st Trimester 73.6
% Births to Mothers Under 18 ND
7.1
73.2
ND
ND
ND
ND
Per 1,000 Population
Fertility Rate* (2012-2014)
All Races White Black
All Ages 308
Under 15 0
15-17 5
288
0
5
2
0
0
18
0
0
Age of WomanReported
PregnanciesLive
BirthsFetal
DeathsInduced
Abortions
Outcome
Age of WomanReported
PregnanciesLive
BirthsFetal
DeathsInduced
Abortions
Outcome
18-19 17
20-29 186
30 and Over 100
17
173
93
0
0
2
0
13
5
All Ages* 60.6
Under 15** ND
15-17 ND
64.8
ND
ND
Age of Woman Birth Rate Reported Pregnancy Rate Age of Woman Birth Rate Reported Pregnancy Rate
18-19 60.7
20-29 124.6
30 and Over** 25.2
60.7
133.9
27.1
^Live births, fetal deaths of 16+ weeks gestation, and induced abortions performed in-state. Notes: All ages includes any unknown ages. All rates per 1,000.*All Ages includes female population ages 15-44. ** Under 15 includes female population ages 10-14; 30 and Over includes female population ages 30-49.
Hispanic
ND
ND
ND
(of any race)
ND
ND
ND
Asian / Pacific
General Notes: Crude and age-adjusted rates based on less than 10 events are considered statistically unreliable and are not displayed (ND), unless otherwise noted. Starting in 2013, race of resident was derived from multiple race selections. A person is Multi-Race if they identify as more than one race. Prior to 2013, race of resident was derived from a single race designation.
Morbidity (2012-2014 Residents)
Reported Incidence and Average Annual Rate (per 100,000) for Selected Notifiable Diseases (2012-2014)
HIV 1 ND
Syphilis 0 ND
Tuberculosis 0 ND
Total Rate
Chlamydia 134 142.2
Giardiasis 7 ND
Gonorrhea 13 13.8
Hepatitis: Type A < 5 ND
Total Rate
Lyme Disease 262 278.1
Salmonellosis 10 10.6
Total Rate
Campylobacteriosis < 5 ND Hep. B* Acute 0 ND
Shigellosis 0 ND
*Hepatitis: Type B **Meningococcal Disease
Meningococcal** < 5 ND
Pertussis < 5 ND
Hep. B* Chronic < 5 ND
Chickenpox 11 11.7
Islander
Note: Communicable diseases with demographic counts of 1 to 4 are displayed as "< 5" to avoid potential identification of cases within certain geographic areas.
Multi - Race
ND
ND
ND

Elk County PAGE 2
Mortality (2014 Residents)
Selected Major Causes of Death, Number and Average Annual Age-Adjusted Death Rate* (2012-2014)
Number of Resident Deaths 370
Crude Death Rate per 1,000 11.9
Age-Adjusted Death Rate per 1,000 7.6
Number of Infant Deaths (< 1 Year of Age) 1 1 0 0
AllRaces BlackWhite
Hispanic(any race)
Infant Mortality Rate per 1,000 Live Births ND ND ND ND
Average Annual Infant Mortality Rate (2012-2014) ND ND ND ND
Cause Total Rate
Diseases of Heart 239
Cancer 270
Stroke 49
C.L.R.D.** 70
Accidents 71
153.1
179.9
29.1
44.8
71.5
Cause Total Rate
Influenza/Pneumonia 25
Diabetes Mellitus 39
Septicemia 16
Nephritis/Nephrosis 37
Alzheimer's Disease 74
16.5
24.6
10.9
22.3
42.1
* Per 100,000 2000 U.S. standardmillion population. Age-adjusted rates
** Chronic Lower Respiratory Disease
Selected Leading Causes of Death, Number by Age Group (2014)
Under 5 Years of Age 5-24 Years of Age 25-44 Years of Age 45-64 Years of Age 65 Years and Older
Accidents 4 Accidents 6
Suicide 4
Diseases of Heart 2
Cancer 19
Diseases of Heart 7
Essential Hypertensi 3
Diseases of Heart 66
Cancer 65
Alzheimer's Disease 30
Stroke 21
C.L.R.D.** 15
TOTAL 1 TOTAL 5 TOTAL 16 TOTAL 48 TOTAL 300
Note: Total includes all other causes.
Asian/PI*
0
ND
*Asian/Pacific Islander ^ NA = Multi-Race data not available before 2013.
are only comparable if the samestandard million population was usedin the calculation.
Invasive Cancer Incidence and Average Annual Age-Adjusted Rates* for Major Sites by Sex
All Sites 366 557.5
Prostate 122 171.0
Lung and Bronchus 45 68.7
Colon and Rectum 42 63.0
Male FemaleTotal Rate Total Rate
Female Breast 107 155.5
335 485.7
46 56.1
27 36.6
*Per 100,000 2000 U.S. standard million population. Age-adjusted rates are only comparable if the same standard million population was used in the calculation.
- -
- -
Male FemaleTotal Rate Total Rate
Non-Hodgkin Lymphoma 11 ND
Melanoma of the Skin 10 ND
10 ND
19 ND
14 ND
Corpus and Uterus, NOS - -
Urinary Bladder 30
Kidney and Renal Pelvis 8 ND
45.4 9
5
ND
ND
Notes: All in situ cases, except for urinary bladder, are excluded. Age-adjusted rates based on less than 20 events are statistically unreliable and are not displayed (ND).
Cancer Incidence (2011-2013 Residents)
Adult Behavioral Health Risk Factors (2012-2014)[Includes: Forest, Elk, Cameron, Clearfield, Jefferson, Clarion, McKean, and Warren Counties]
General Notes: Crude and age-adjusted rates based on less than 10 events are considered statistically unreliable and are not displayed (ND), unless otherwise noted. Starting in 2013, race of resident was derived from multiple race selections. A person is Multi-Race if they identify as more than one race. Prior to 2013, race of resident was derived from a single race designation.
Percent (CI)Risk Factors
Fair or poor general health:
Obese:
Overweight (includes obese):
No health insurance (ages 18-64):
Visited a doctor in the past 2 yearsfor a routine check-up:
Percent (CI)Risk Factors
Ever told they have diabetes: Currently has asthma:
Current smoker:
Ever tested for HIV (ages 18-64):
Needed to see a doctor but couldnot due to cost in the past year:
20
33
(17 - 22)
(30 - 36)
69 (66 - 72)
15 (12 - 18)
84 (81 - 86)
12 11(10 - 14) (9 - 13)
23 (21 - 26)
29 (26 - 33)
10 (8 - 12)
Notes: Data are based on 2012-2014 annual sample surveys of Pennsylvania adults. CI= 95% Confidence Interval.
Additional state or county/regional data are available at www.statistics.health.pa.gov.
^In situ, benign, and uncertain neoplasms
Multi- Race
0
ND
NAND ^

Elk County PAGE 3
Hospitals (7/13-6/14)
Total General Acute Care
Psychiatric Rehabilitation
1 1 0 0
General Hospitals
Beds Set Up and Staffed 75
Admissions 2,506
Beds per 1,000 Population 2.4
Admissions per 1,000 Population 80.3
Average Inpatient Occupancy Rate 41.7
Nursing Homes (2014)
Total Number Certified-Medicare Certified-Medicaid
Nursing Homes
Licensed/Approved Beds
2 2 2
258 258 258
40.4
Average Occupancy Rate 94.9
Average Length of Stay (Number of Days) 253.8
$185
Total Licensed/Approved Beds per 1,000 Population Age 65 and Older
Average Semi-Private Daily Room Rate
Drug and Alcohol Treatment
Admissions to Client Primary Diagnosis
Drug Abuse Alcohol Abuse Other*
Percent Admitted
Only Once During 7/13-6/14
160 87 42 5 84.3
* Includes family members receiving counseling.
All Licensed Facilities Inpatient Non-Hospital
Inpatient Hospital Partial Hospitalization Outpatient2
0
0 0 2
Note: Each licensed facility may provide more than one type of service.
State-Supported Facilities
Types of Service Provided
Number of
Clients Admitted
134
Admission by County of Residence (7/13-6/14)
Treatment Facilities (as of 6/14)
Correctional Institution 0
General Note: Crude rates based on less than 10 events are considered statistically unreliable and are not displayed (ND), unless otherwise noted.
Services Funding
Other
0
Non-Profit
1
For Profit
0
State
0
Other
0
Ambulatory Surgery Centers (7/13-6/14)
Employees
Part Time Employees 3
Full Time Employees 12
Contracted Employees 0
Payroll Employees 15 Staff with Clinical Privileges 6
Total Surgical Visits per Employee 126.1
Total Facilities 1 Total Surgical Visits 1,891
Percent of Surgical Visits, Age 65+ 52.5
Total Operating Rooms 3 Total Surgical Visits per Operating Room 630.3
Facilities Surgical Visits
Staff Licensed as M.D. 4
Total Employees per Operating Room 5.0
Average Semi-Private Daily Room Rate -
Total Employees 15

PAGE 4Elk County
Pennsylvania Health Care Workforce (2013-2014)
Notes: Only health care employees renewing their license in 2013-2014 were surveyed.The "Estimated Number" and "Percent of Workforce Intending to Remain in Profession for 6 or More Years" used to compute each "% Change from Previous Survey Year" are adjusted based on the response rates for the previous and current survey results. The survey results are available every two years. Numbers and percentages pertain to county of employment.Percentages based on less than six responses are considered statistically unreliable and are not displayed (ND).Registered Nurses and Licensed Practical Nurses are not comparable to previous survey period, so some data is not available (DNA).
Licensed Practical Nurses (2014) 120 DNA 86.3% DNA
Physicians (2014) 50
Dentists (2013) 10
Registered Nurses (2012/2013) 290 DNA 81.4% DNA
-5.0% 43.9% -15.7%
3.3% 88.9% 11.1%
Estimated Number
Percent Changefrom Previous
Survey
Difference in Percent from
Previous Survey
Percent of WorkforceIntending to Remain in
Profession for 6 or More Years
Injury Hospitalizations (2014)
Injury Hospitalizations and Median Charges by Age and Sex
Injury Hospitalizations and Median Charges by Type of Payor
Injury Hospitalizations and Median Charges by Mechanism/Intent and Sex
0-4 5-14 15-24 25-44 45-64 65 and Older
Male - Total
Male - Median Charges
Female - Total
Female - Median Charges
UnintentionalMotor Vehicle All Poisonings Unintentional Falls
Unintentional Fire/Flame or Hot Object/Substance All Firearm All Other Injuries
Male - Total
Male - Median Charges
Female - Total
Female - Median Charges
Medicare Medicaid Other Government Commercial / Private Blue Cross Uninsured
Total Hospitalizations
Median Charges
All Ages
195 0 3 18 43 56 75
$18,064.00 - ND $16,837.09 $23,621.00 $19,494.78 $17,261.25
257 2 6 13 28 50 158
$18,727.53 ND ND $12,239.15 $19,756.83 $28,406.33 $18,656.73
Note: Median charges not displayed (ND) for occurrences less than 10.
16262 49 62612
$9,203.35 $17,955.75 $17,138.05 $19,113.23 $49,595.00 ND
74
97
12
15
24
16
146
65
1
2
0
0
$15,623.72
$16,822.80
$41,625.65
$57,035.90
$12,797.89
$10,869.35
$21,963.23
$17,935.99
ND
ND
-
-
Disclaimer: Injury data used in this report were provided to the Pennsylvania Department of Health by the Pennsylvania Health Care Cost Containment Council. The Pennsylvania Health Care Cost Containment Council specifically disclaims responsibility for any interpretations or conclusions. Contents may be republished or reproduced whole or in part, with attribution.

Erie CountyHealth Profile 2016
Demographic Data (2014)
% Population Change 2010 to 2014 -0.8
Median Age of the Population (2010-2014) 38.7
% Population Aged 65 and Over 15.8
Population per Square Mile 348.4
% Population with Income Below Poverty Level (2010-2014) 16.7
Per Capita Personal Income $38,200
% Labor Force Unemployed - Annual Average 6.2
% Population Eligible for Medical Assistance 22.9
Estimated Population by Age and Sex (2014)
Age Total Male Female Age Total Male Female
All Ages 278,443
Under 5 16,044
5-14 33,940
15-24 40,493
25-34 36,035
137,351
8,144
17,514
20,608
18,396
141,092
7,900
16,426
19,885
17,639
35-44 31,471
45-54 37,415
55-64 39,120
65-74 23,858
75+ 20,067
15,699
18,637
19,213
11,352
7,788
15,772
18,778
19,907
12,506
12,279
Estimated Population by Race (2014)
White 246,455 Black 21,087 Other Races 10,901
Natality and Reported Pregnancies^ (2014 Residents)
Crude Birth Rate11.4
Average Annual General58.4
% Low Birth Weight 8.3
% Prenatal Care in 1st Trimester 77.8
% Births to Mothers Under 18 2.7
7.2
81.8
1.9
12.7
66.6
5.2
Per 1,000 Population
Fertility Rate* (2012-2014)
All Races White Black
All Ages 3,350
Under 15 5
15-17 90
3,165
3
82
25
0
2
160
2
6
Age of WomanReported
PregnanciesLive
BirthsFetal
DeathsInduced
Abortions
Outcome
Age of WomanReported
PregnanciesLive
BirthsFetal
DeathsInduced
Abortions
Outcome
18-19 198
20-29 1,843
30 and Over 1,198
183
1,726
1,155
2
15
6
13
102
37
All Ages* 59.4
Under 15** ND
15-17 16.4
62.9
ND
18.0
Age of Woman Birth Rate Reported Pregnancy Rate Age of Woman Birth Rate Reported Pregnancy Rate
18-19 38.0
20-29 88.5
30 and Over** 35.2
41.2
94.5
36.5
^Live births, fetal deaths of 16+ weeks gestation, and induced abortions performed in-state. Notes: All ages includes any unknown ages. All rates per 1,000.*All Ages includes female population ages 15-44. ** Under 15 includes female population ages 10-14; 30 and Over includes female population ages 30-49.
Hispanic
9.0
74.9
6.1
(of any race)
9.6
57.6
ND
Asian / Pacific
General Notes: Crude and age-adjusted rates based on less than 10 events are considered statistically unreliable and are not displayed (ND), unless otherwise noted. Starting in 2013, race of resident was derived from multiple race selections. A person is Multi-Race if they identify as more than one race. Prior to 2013, race of resident was derived from a single race designation.
Morbidity (2012-2014 Residents)
Reported Incidence and Average Annual Rate (per 100,000) for Selected Notifiable Diseases (2012-2014)
HIV 36 4.3
Syphilis 27 3.2
Tuberculosis 25 3.0
Total Rate
Chlamydia 3,847 458.3
Giardiasis 139 16.6
Gonorrhea 966 115.1
Hepatitis: Type A 5 ND
Total Rate
Lyme Disease 94 11.2
Salmonellosis 64 7.6
Total Rate
Campylobacteriosis 60 7.1 Hep. B* Acute < 5 ND
Shigellosis < 5 ND
*Hepatitis: Type B **Meningococcal Disease
Meningococcal** < 5 ND
Pertussis 32 3.8
Hep. B* Chronic 50 6.0
Chickenpox 52 6.2
Islander
Note: Communicable diseases with demographic counts of 1 to 4 are displayed as "< 5" to avoid potential identification of cases within certain geographic areas.
Multi - Race
9.5
69.6
6.6

Erie County PAGE 2
Mortality (2014 Residents)
Selected Major Causes of Death, Number and Average Annual Age-Adjusted Death Rate* (2012-2014)
Number of Resident Deaths 2,839
Crude Death Rate per 1,000 10.2
Age-Adjusted Death Rate per 1,000 8.0
Number of Infant Deaths (< 1 Year of Age) 17 8 3 1
AllRaces BlackWhite
Hispanic(any race)
Infant Mortality Rate per 1,000 Live Births 5.4 ND ND ND
Average Annual Infant Mortality Rate (2012-2014) 6.8 6.0 ND ND
Cause Total Rate
Diseases of Heart 2,059
Cancer 1,906
Stroke 458
C.L.R.D.** 503
Accidents 367
186.2
182.3
41.6
47.0
42.1
Cause Total Rate
Influenza/Pneumonia 146
Diabetes Mellitus 309
Septicemia 108
Nephritis/Nephrosis 219
Alzheimer's Disease 233
12.9
29.4
10.2
19.6
19.4
* Per 100,000 2000 U.S. standardmillion population. Age-adjusted rates
** Chronic Lower Respiratory Disease
Selected Leading Causes of Death, Number by Age Group (2014)
Under 5 Years of Age 5-24 Years of Age 25-44 Years of Age 45-64 Years of Age 65 Years and Older
Perinatal Conditions 14
Accidents 3
Accidents 17
Suicide 7
Assault (Homicide) 6
Cancer 3
Accidents 37
Suicide 17
Cancer 13
Diseases of Heart 8
Cancer 188
Diseases of Heart 97
Accidents 39
Diabetes Mellitus 29
C.L.R.D.** 25
Diseases of Heart 551
Cancer 443
Stroke 150
C.L.R.D.** 128
Diabetes Mellitus 85
TOTAL 23 TOTAL 37 TOTAL 117 TOTAL 538 TOTAL 2,124
Note: Total includes all other causes.
Asian/PI*
2
ND
*Asian/Pacific Islander ^ NA = Multi-Race data not available before 2013.
are only comparable if the samestandard million population was usedin the calculation.
Invasive Cancer Incidence and Average Annual Age-Adjusted Rates* for Major Sites by Sex
All Sites 2,354 507.0
Prostate 622 125.6
Lung and Bronchus 346 74.0
Colon and Rectum 203 45.6
Male FemaleTotal Rate Total Rate
Female Breast 677 128.8
2,365 445.5
323 57.9
167 29.7
*Per 100,000 2000 U.S. standard million population. Age-adjusted rates are only comparable if the same standard million population was used in the calculation.
- -
- -
Male FemaleTotal Rate Total Rate
Non-Hodgkin Lymphoma 91 19.4
Melanoma of the Skin 73 16.3
109 20.4
151 27.6
70 14.6
Corpus and Uterus, NOS - -
Urinary Bladder 196
Kidney and Renal Pelvis 92 19.6
43.8 62
70
11.1
12.8
Notes: All in situ cases, except for urinary bladder, are excluded. Age-adjusted rates based on less than 20 events are statistically unreliable and are not displayed (ND).
Cancer Incidence (2011-2013 Residents)
Adult Behavioral Health Risk Factors (2012-2014)[Includes: Erie County Only]
General Notes: Crude and age-adjusted rates based on less than 10 events are considered statistically unreliable and are not displayed (ND), unless otherwise noted. Starting in 2013, race of resident was derived from multiple race selections. A person is Multi-Race if they identify as more than one race. Prior to 2013, race of resident was derived from a single race designation.
Percent (CI)Risk Factors
Fair or poor general health:
Obese:
Overweight (includes obese):
No health insurance (ages 18-64):
Visited a doctor in the past 2 yearsfor a routine check-up:
Percent (CI)Risk Factors
Ever told they have diabetes: Currently has asthma:
Current smoker:
Ever tested for HIV (ages 18-64):
Needed to see a doctor but couldnot due to cost in the past year:
18
31
(15 - 21)
(28 - 35)
68 (65 - 72)
12 (9 - 15)
85 (82 - 87)
12 8(10 - 14) (7 - 11)
25 (21 - 28)
32 (28 - 36)
13 (11 - 16)
Notes: Data are based on 2012-2014 annual sample surveys of Pennsylvania adults. CI= 95% Confidence Interval.
Additional state or county/regional data are available at www.statistics.health.pa.gov.
^In situ, benign, and uncertain neoplasms
Multi- Race
0
ND
NAND ^

Erie County PAGE 3
Hospitals (7/13-6/14)
Total General Acute Care
Psychiatric Rehabilitation
7 4 0 1
General Hospitals
Beds Set Up and Staffed 859
Admissions 38,374
Beds per 1,000 Population 3.1
Admissions per 1,000 Population 137.8
Average Inpatient Occupancy Rate 61.9
Nursing Homes (2014)
Total Number Certified-Medicare Certified-Medicaid
Nursing Homes
Licensed/Approved Beds
21 20 20
2,250 2,104 2,226
51.2
Average Occupancy Rate 92.6
Average Length of Stay (Number of Days) 134.4
$273
Total Licensed/Approved Beds per 1,000 Population Age 65 and Older
Average Semi-Private Daily Room Rate
Drug and Alcohol Treatment
Admissions to Client Primary Diagnosis
Drug Abuse Alcohol Abuse Other*
Percent Admitted
Only Once During 7/13-6/14
2,067 859 418 20 64.9
* Includes family members receiving counseling.
All Licensed Facilities Inpatient Non-Hospital
Inpatient Hospital Partial Hospitalization Outpatient21
6
2 1 15
Note: Each licensed facility may provide more than one type of service.
State-Supported Facilities
Types of Service Provided
Number of
Clients Admitted
1,297
Admission by County of Residence (7/13-6/14)
Treatment Facilities (as of 6/14)
Correctional Institution 0
General Note: Crude rates based on less than 10 events are considered statistically unreliable and are not displayed (ND), unless otherwise noted.
Services Funding
Other
2
Non-Profit
4
For Profit
2
State
0
Other
1
Ambulatory Surgery Centers (7/13-6/14)
Employees
Part Time Employees 121
Full Time Employees 176
Contracted Employees 31
Payroll Employees 266 Staff with Clinical Privileges 229
Total Surgical Visits per Employee 136.1
Total Facilities 6 Total Surgical Visits 40,408
Percent of Surgical Visits, Age 65+ 31.4
Total Operating Rooms 19 Total Surgical Visits per Operating Room 2,126.7
Facilities Surgical Visits
Staff Licensed as M.D. 141
Total Employees per Operating Room 15.6
Average Semi-Private Daily Room Rate $1,443
Total Employees 297

PAGE 4Erie County
Pennsylvania Health Care Workforce (2013-2014)
Notes: Only health care employees renewing their license in 2013-2014 were surveyed.The "Estimated Number" and "Percent of Workforce Intending to Remain in Profession for 6 or More Years" used to compute each "% Change from Previous Survey Year" are adjusted based on the response rates for the previous and current survey results. The survey results are available every two years. Numbers and percentages pertain to county of employment.Percentages based on less than six responses are considered statistically unreliable and are not displayed (ND).Registered Nurses and Licensed Practical Nurses are not comparable to previous survey period, so some data is not available (DNA).
Licensed Practical Nurses (2014) 1,038 DNA 84.8% DNA
Physicians (2014) 742
Dentists (2013) 146
Registered Nurses (2012/2013) 3,666 DNA 83.5% DNA
3.3% 66.8% -6.4%
-2.8% 76.4% -5.4%
Estimated Number
Percent Changefrom Previous
Survey
Difference in Percent from
Previous Survey
Percent of WorkforceIntending to Remain in
Profession for 6 or More Years
Injury Hospitalizations (2014)
Injury Hospitalizations and Median Charges by Age and Sex
Injury Hospitalizations and Median Charges by Type of Payor
Injury Hospitalizations and Median Charges by Mechanism/Intent and Sex
0-4 5-14 15-24 25-44 45-64 65 and Older
Male - Total
Male - Median Charges
Female - Total
Female - Median Charges
UnintentionalMotor Vehicle All Poisonings Unintentional Falls
Unintentional Fire/Flame or Hot Object/Substance All Firearm All Other Injuries
Male - Total
Male - Median Charges
Female - Total
Female - Median Charges
Medicare Medicaid Other Government Commercial / Private Blue Cross Uninsured
Total Hospitalizations
Median Charges
All Ages
1,364 14 29 136 297 429 459
$36,719.05 $33,206.25 $22,121.25 $32,432.73 $30,481.37 $38,581.33 $42,863.25
1,415 15 20 92 192 332 764
$33,443.75 $20,041.25 $13,693.83 $15,402.70 $24,414.43 $35,329.92 $38,364.83
Note: Median charges not displayed (ND) for occurrences less than 10.
921,398 395 26361613
$29,756.69 $37,606.94 $32,577.10 $31,343.25 $35,475.00 $20,003.74
397
548
73
135
195
153
730
489
18
21
2
18
$25,979.80
$32,639.93
$52,277.90
$70,100.31
$19,133.32
$19,051.00
$40,226.77
$40,115.65
$18,310.31
$21,820.85
ND
$63,568.03
Disclaimer: Injury data used in this report were provided to the Pennsylvania Department of Health by the Pennsylvania Health Care Cost Containment Council. The Pennsylvania Health Care Cost Containment Council specifically disclaims responsibility for any interpretations or conclusions. Contents may be republished or reproduced whole or in part, with attribution.

Fayette CountyHealth Profile 2016
Demographic Data (2014)
% Population Change 2010 to 2014 -1.8
Median Age of the Population (2010-2014) 44.0
% Population Aged 65 and Over 19.4
Population per Square Mile 169.7
% Population with Income Below Poverty Level (2010-2014) 19.0
Per Capita Personal Income $37,055
% Labor Force Unemployed - Annual Average 7.9
% Population Eligible for Medical Assistance 26.1
Estimated Population by Age and Sex (2014)
Age Total Male Female Age Total Male Female
All Ages 134,086
Under 5 6,679
5-14 14,583
15-24 15,210
25-34 15,285
66,103
3,397
7,424
7,873
8,101
67,983
3,282
7,159
7,337
7,184
35-44 16,097
45-54 19,288
55-64 20,873
65-74 14,148
75+ 11,923
8,097
9,653
10,323
6,715
4,520
8,000
9,635
10,550
7,433
7,403
Natality and Reported Pregnancies^ (2014 Residents)
Crude Birth Rate10.4
Average Annual General60.9
% Low Birth Weight 8.8
% Prenatal Care in 1st Trimester 79.7
% Births to Mothers Under 18 2.3
8.4
80.5
2.1
14.9
75.4
ND
Per 1,000 Population
Fertility Rate* (2012-2014)
All Races White Black
All Ages 1,572
Under 15 0
15-17 37
1,394
0
32
8
0
0
170
0
5
Age of WomanReported
PregnanciesLive
BirthsFetal
DeathsInduced
Abortions
Outcome
Age of WomanReported
PregnanciesLive
BirthsFetal
DeathsInduced
Abortions
Outcome
18-19 116
20-29 941
30 and Over 475
98
828
433
2
4
2
16
109
40
All Ages* 61.9
Under 15** ND
15-17 14.0
69.8
ND
16.2
Age of Woman Birth Rate Reported Pregnancy Rate Age of Woman Birth Rate Reported Pregnancy Rate
18-19 70.6
20-29 114.3
30 and Over** 26.8
83.6
129.9
29.4
^Live births, fetal deaths of 16+ weeks gestation, and induced abortions performed in-state. Notes: All ages includes any unknown ages. All rates per 1,000.*All Ages includes female population ages 15-44. ** Under 15 includes female population ages 10-14; 30 and Over includes female population ages 30-49.
Hispanic
ND
57.1
ND
(of any race)
ND
ND
ND
Asian / Pacific
General Notes: Crude and age-adjusted rates based on less than 10 events are considered statistically unreliable and are not displayed (ND), unless otherwise noted. Starting in 2013, race of resident was derived from multiple race selections. A person is Multi-Race if they identify as more than one race. Prior to 2013, race of resident was derived from a single race designation.
Morbidity (2012-2014 Residents)
Reported Incidence and Average Annual Rate (per 100,000) for Selected Notifiable Diseases (2012-2014)
HIV 19 4.7
Syphilis 7 ND
Tuberculosis < 5 ND
Total Rate
Chlamydia 840 207.5
Giardiasis 15 3.7
Gonorrhea 224 55.3
Hepatitis: Type A < 5 ND
Total Rate
Lyme Disease 25 6.2
Salmonellosis 64 15.8
Total Rate
Campylobacteriosis 37 9.1 Hep. B* Acute < 5 ND
Shigellosis < 5 ND
*Hepatitis: Type B **Meningococcal Disease
Meningococcal** 0 ND
Pertussis 31 7.7
Hep. B* Chronic 17 4.2
Chickenpox 52 12.8
Islander
Note: Communicable diseases with demographic counts of 1 to 4 are displayed as "< 5" to avoid potential identification of cases within certain geographic areas.
Multi - Race
ND
74.4
ND

Fayette County PAGE 2
Mortality (2014 Residents)
Selected Major Causes of Death, Number and Average Annual Age-Adjusted Death Rate* (2012-2014)
Number of Resident Deaths 1,745
Crude Death Rate per 1,000 13.0
Age-Adjusted Death Rate per 1,000 8.6
Number of Infant Deaths (< 1 Year of Age) 14 12 1 0
AllRaces BlackWhite
Hispanic(any race)
Infant Mortality Rate per 1,000 Live Births 10.0 9.5 ND ND
Average Annual Infant Mortality Rate (2012-2014) 7.0 5.8 ND ND
Cause Total Rate
Diseases of Heart 1,392
Cancer 1,121
Stroke 256
C.L.R.D.** 314
Accidents 253
216.4
186.8
39.3
50.0
55.4
Cause Total Rate
Influenza/Pneumonia 81
Diabetes Mellitus 178
Septicemia 97
Nephritis/Nephrosis 100
Alzheimer's Disease 188
13.0
29.1
16.7
15.6
26.8
* Per 100,000 2000 U.S. standardmillion population. Age-adjusted rates
** Chronic Lower Respiratory Disease
Selected Leading Causes of Death, Number by Age Group (2014)
Under 5 Years of Age 5-24 Years of Age 25-44 Years of Age 45-64 Years of Age 65 Years and Older
Perinatal Conditions 5
Birth Defects 3
Influenza/Pneumonia 3
Accidents 11
Assault (Homicide) 2
Suicide 2
Accidents 23
Suicide 10
Cancer 8
Diseases of Heart 3
Liver Dis./Cirrhosis 3
Cancer 82
Diseases of Heart 70
Accidents 35
C.L.R.D.** 18
Diabetes Mellitus 10
Diseases of Heart 392
Cancer 251
C.L.R.D.** 90
Stroke 75
Alzheimer's Disease 70
TOTAL 15 TOTAL 17 TOTAL 60 TOTAL 313 TOTAL 1,340
Note: Total includes all other causes.
Asian/PI*
0
ND
*Asian/Pacific Islander ^ NA = Multi-Race data not available before 2013.
are only comparable if the samestandard million population was usedin the calculation.
Invasive Cancer Incidence and Average Annual Age-Adjusted Rates* for Major Sites by Sex
All Sites 1,337 510.9
Prostate 234 81.8
Lung and Bronchus 247 95.0
Colon and Rectum 155 59.6
Male FemaleTotal Rate Total Rate
Female Breast 354 117.7
1,321 442.4
181 57.7
116 34.8
*Per 100,000 2000 U.S. standard million population. Age-adjusted rates are only comparable if the same standard million population was used in the calculation.
- -
- -
Male FemaleTotal Rate Total Rate
Non-Hodgkin Lymphoma 55 21.2
Melanoma of the Skin 37 15.4
57 18.1
96 30.9
18 ND
Corpus and Uterus, NOS - -
Urinary Bladder 128
Kidney and Renal Pelvis 65 24.9
50.2 31
36
9.7
12.8
Notes: All in situ cases, except for urinary bladder, are excluded. Age-adjusted rates based on less than 20 events are statistically unreliable and are not displayed (ND).
Cancer Incidence (2011-2013 Residents)
Adult Behavioral Health Risk Factors (2012-2014)[Includes: Fayette, Greene, and Washington Counties]
General Notes: Crude and age-adjusted rates based on less than 10 events are considered statistically unreliable and are not displayed (ND), unless otherwise noted. Starting in 2013, race of resident was derived from multiple race selections. A person is Multi-Race if they identify as more than one race. Prior to 2013, race of resident was derived from a single race designation.
Percent (CI)Risk Factors
Fair or poor general health:
Obese:
Overweight (includes obese):
No health insurance (ages 18-64):
Visited a doctor in the past 2 yearsfor a routine check-up:
Percent (CI)Risk Factors
Ever told they have diabetes: Currently has asthma:
Current smoker:
Ever tested for HIV (ages 18-64):
Needed to see a doctor but couldnot due to cost in the past year:
22
33
(19 - 25)
(30 - 37)
67 (63 - 70)
16 (13 - 20)
83 (80 - 86)
15 11(12 - 17) (9 - 14)
25 (22 - 28)
30 (26 - 35)
13 (11 - 16)
Notes: Data are based on 2012-2014 annual sample surveys of Pennsylvania adults. CI= 95% Confidence Interval.
Additional state or county/regional data are available at www.statistics.health.pa.gov.
^In situ, benign, and uncertain neoplasms
Multi- Race
1
ND
NAND ^

Fayette County PAGE 3
Hospitals (7/13-6/14)
Total General Acute Care
Psychiatric Rehabilitation
2 2 0 0
General Hospitals
Beds Set Up and Staffed 207
Admissions 11,564
Beds per 1,000 Population 1.5
Admissions per 1,000 Population 86.2
Average Inpatient Occupancy Rate 58.9
Nursing Homes (2014)
Total Number Certified-Medicare Certified-Medicaid
Nursing Homes
Licensed/Approved Beds
7 7 7
672 672 672
25.8
Average Occupancy Rate 89.4
Average Length of Stay (Number of Days) 118.3
$245
Total Licensed/Approved Beds per 1,000 Population Age 65 and Older
Average Semi-Private Daily Room Rate
Drug and Alcohol Treatment
Admissions to Client Primary Diagnosis
Drug Abuse Alcohol Abuse Other*
Percent Admitted
Only Once During 7/13-6/14
735 342 210 4 75.5
* Includes family members receiving counseling.
All Licensed Facilities Inpatient Non-Hospital
Inpatient Hospital Partial Hospitalization Outpatient12
3
0 1 9
Note: Each licensed facility may provide more than one type of service.
State-Supported Facilities
Types of Service Provided
Number of
Clients Admitted
556
Admission by County of Residence (7/13-6/14)
Treatment Facilities (as of 6/14)
Correctional Institution 0
General Note: Crude rates based on less than 10 events are considered statistically unreliable and are not displayed (ND), unless otherwise noted.
Services Funding
Other
0
Non-Profit
2
For Profit
0
State
0
Other
0
Ambulatory Surgery Centers (7/13-6/14)
Employees
Part Time Employees 4
Full Time Employees 26
Contracted Employees 8
Payroll Employees 22 Staff with Clinical Privileges 10
Total Surgical Visits per Employee 223.3
Total Facilities 1 Total Surgical Visits 6,698
Percent of Surgical Visits, Age 65+ 38.0
Total Operating Rooms 0 Total Surgical Visits per Operating Room -
Facilities Surgical Visits
Staff Licensed as M.D. 7
Total Employees per Operating Room -
Average Semi-Private Daily Room Rate $788
Total Employees 30
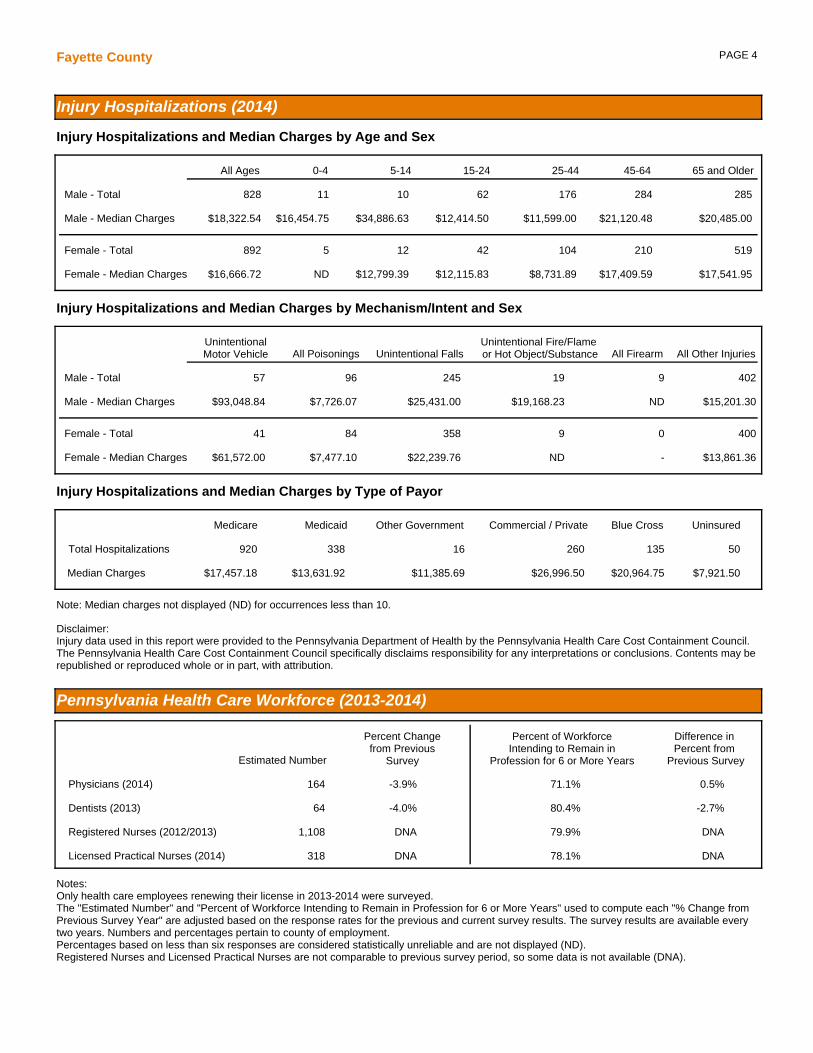
PAGE 4Fayette County
Pennsylvania Health Care Workforce (2013-2014)
Notes: Only health care employees renewing their license in 2013-2014 were surveyed.The "Estimated Number" and "Percent of Workforce Intending to Remain in Profession for 6 or More Years" used to compute each "% Change from Previous Survey Year" are adjusted based on the response rates for the previous and current survey results. The survey results are available every two years. Numbers and percentages pertain to county of employment.Percentages based on less than six responses are considered statistically unreliable and are not displayed (ND).Registered Nurses and Licensed Practical Nurses are not comparable to previous survey period, so some data is not available (DNA).
Licensed Practical Nurses (2014) 318 DNA 78.1% DNA
Physicians (2014) 164
Dentists (2013) 64
Registered Nurses (2012/2013) 1,108 DNA 79.9% DNA
-3.9% 71.1% 0.5%
-4.0% 80.4% -2.7%
Estimated Number
Percent Changefrom Previous
Survey
Difference in Percent from
Previous Survey
Percent of WorkforceIntending to Remain in
Profession for 6 or More Years
Injury Hospitalizations (2014)
Injury Hospitalizations and Median Charges by Age and Sex
Injury Hospitalizations and Median Charges by Type of Payor
Injury Hospitalizations and Median Charges by Mechanism/Intent and Sex
0-4 5-14 15-24 25-44 45-64 65 and Older
Male - Total
Male - Median Charges
Female - Total
Female - Median Charges
UnintentionalMotor Vehicle All Poisonings Unintentional Falls
Unintentional Fire/Flame or Hot Object/Substance All Firearm All Other Injuries
Male - Total
Male - Median Charges
Female - Total
Female - Median Charges
Medicare Medicaid Other Government Commercial / Private Blue Cross Uninsured
Total Hospitalizations
Median Charges
All Ages
828 11 10 62 176 284 285
$18,322.54 $16,454.75 $34,886.63 $12,414.50 $11,599.00 $21,120.48 $20,485.00
892 5 12 42 104 210 519
$16,666.72 ND $12,799.39 $12,115.83 $8,731.89 $17,409.59 $17,541.95
Note: Median charges not displayed (ND) for occurrences less than 10.
50920 338 13526016
$7,921.50 $17,457.18 $13,631.92 $20,964.75 $26,996.50 $11,385.69
400
402
41
57
84
96
358
245
9
19
0
9
$13,861.36
$15,201.30
$61,572.00
$93,048.84
$7,477.10
$7,726.07
$22,239.76
$25,431.00
ND
$19,168.23
-
ND
Disclaimer: Injury data used in this report were provided to the Pennsylvania Department of Health by the Pennsylvania Health Care Cost Containment Council. The Pennsylvania Health Care Cost Containment Council specifically disclaims responsibility for any interpretations or conclusions. Contents may be republished or reproduced whole or in part, with attribution.
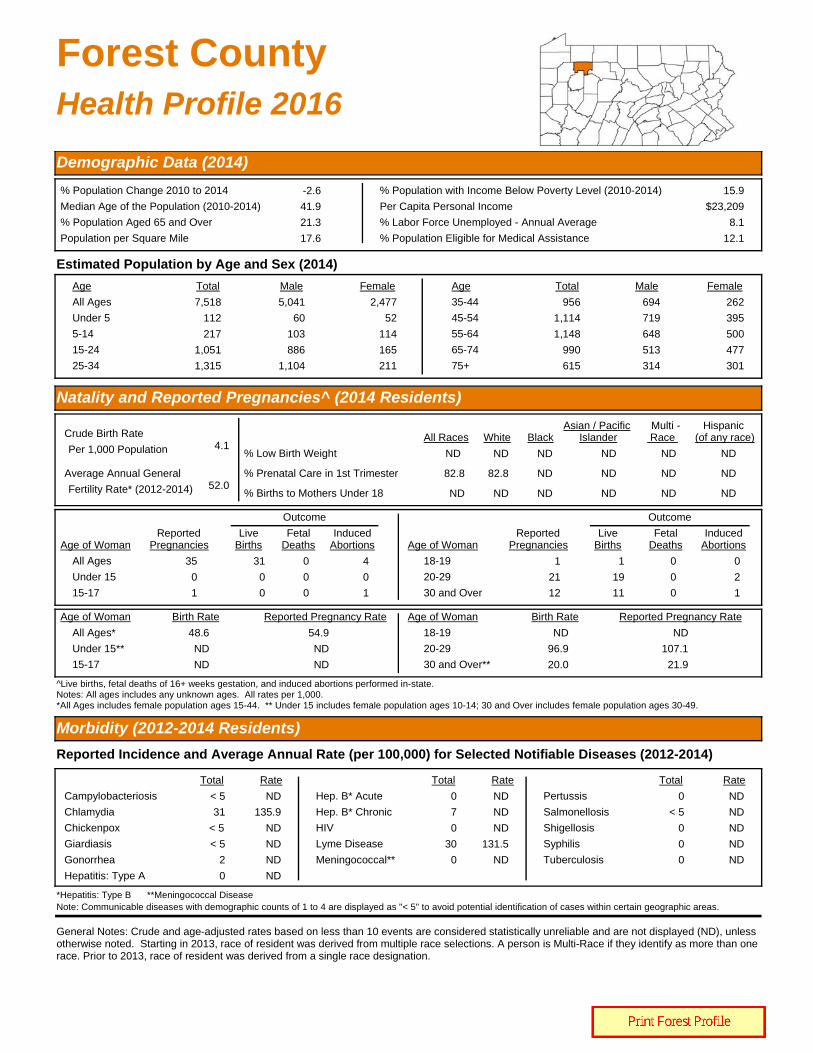
Forest CountyHealth Profile 2016
Demographic Data (2014)
% Population Change 2010 to 2014 -2.6
Median Age of the Population (2010-2014) 41.9
% Population Aged 65 and Over 21.3
Population per Square Mile 17.6
% Population with Income Below Poverty Level (2010-2014) 15.9
Per Capita Personal Income $23,209
% Labor Force Unemployed - Annual Average 8.1
% Population Eligible for Medical Assistance 12.1
Estimated Population by Age and Sex (2014)
Age Total Male Female Age Total Male Female
All Ages 7,518
Under 5 112
5-14 217
15-24 1,051
25-34 1,315
5,041
60
103
886
1,104
2,477
52
114
165
211
35-44 956
45-54 1,114
55-64 1,148
65-74 990
75+ 615
694
719
648
513
314
262
395
500
477
301
Natality and Reported Pregnancies^ (2014 Residents)
Crude Birth Rate4.1
Average Annual General52.0
% Low Birth Weight ND
% Prenatal Care in 1st Trimester 82.8
% Births to Mothers Under 18 ND
ND
82.8
ND
ND
ND
ND
Per 1,000 Population
Fertility Rate* (2012-2014)
All Races White Black
All Ages 35
Under 15 0
15-17 1
31
0
0
0
0
0
4
0
1
Age of WomanReported
PregnanciesLive
BirthsFetal
DeathsInduced
Abortions
Outcome
Age of WomanReported
PregnanciesLive
BirthsFetal
DeathsInduced
Abortions
Outcome
18-19 1
20-29 21
30 and Over 12
1
19
11
0
0
0
0
2
1
All Ages* 48.6
Under 15** ND
15-17 ND
54.9
ND
ND
Age of Woman Birth Rate Reported Pregnancy Rate Age of Woman Birth Rate Reported Pregnancy Rate
18-19 ND
20-29 96.9
30 and Over** 20.0
ND
107.1
21.9
^Live births, fetal deaths of 16+ weeks gestation, and induced abortions performed in-state. Notes: All ages includes any unknown ages. All rates per 1,000.*All Ages includes female population ages 15-44. ** Under 15 includes female population ages 10-14; 30 and Over includes female population ages 30-49.
Hispanic
ND
ND
ND
(of any race)
ND
ND
ND
Asian / Pacific
General Notes: Crude and age-adjusted rates based on less than 10 events are considered statistically unreliable and are not displayed (ND), unless otherwise noted. Starting in 2013, race of resident was derived from multiple race selections. A person is Multi-Race if they identify as more than one race. Prior to 2013, race of resident was derived from a single race designation.
Morbidity (2012-2014 Residents)
Reported Incidence and Average Annual Rate (per 100,000) for Selected Notifiable Diseases (2012-2014)
HIV 0 ND
Syphilis 0 ND
Tuberculosis 0 ND
Total Rate
Chlamydia 31 135.9
Giardiasis < 5 ND
Gonorrhea 2 ND
Hepatitis: Type A 0 ND
Total Rate
Lyme Disease 30 131.5
Salmonellosis < 5 ND
Total Rate
Campylobacteriosis < 5 ND Hep. B* Acute 0 ND
Shigellosis 0 ND
*Hepatitis: Type B **Meningococcal Disease
Meningococcal** 0 ND
Pertussis 0 ND
Hep. B* Chronic 7 ND
Chickenpox < 5 ND
Islander
Note: Communicable diseases with demographic counts of 1 to 4 are displayed as "< 5" to avoid potential identification of cases within certain geographic areas.
Multi - Race
ND
ND
ND

Forest County PAGE 2
Mortality (2014 Residents)
Selected Major Causes of Death, Number and Average Annual Age-Adjusted Death Rate* (2012-2014)
Number of Resident Deaths 89
Crude Death Rate per 1,000 11.8
Age-Adjusted Death Rate per 1,000 8.5
Number of Infant Deaths (< 1 Year of Age) 0 0 0 0
AllRaces BlackWhite
Hispanic(any race)
Infant Mortality Rate per 1,000 Live Births ND ND ND ND
Average Annual Infant Mortality Rate (2012-2014) ND ND ND ND
Cause Total Rate
Diseases of Heart 61
Cancer 67
Stroke 13
C.L.R.D.** 24
Accidents 16
200.6
208.2
46.6
68.8
54.1
Cause Total Rate
Influenza/Pneumonia 5
Diabetes Mellitus 8
Septicemia 4
Nephritis/Nephrosis 6
Alzheimer's Disease 6
ND
ND
ND
ND
ND
* Per 100,000 2000 U.S. standardmillion population. Age-adjusted rates
** Chronic Lower Respiratory Disease
Selected Leading Causes of Death, Number by Age Group (2014)
Under 5 Years of Age 5-24 Years of Age 25-44 Years of Age 45-64 Years of Age 65 Years and Older
Cancer 9
Diseases of Heart 7
Diabetes Mellitus 2
Diseases of Heart 18
Cancer 15
C.L.R.D.** 5
Stroke 5
TOTAL 0 TOTAL 0 TOTAL 1 TOTAL 24 TOTAL 64
Note: Total includes all other causes.
Asian/PI*
0
ND
*Asian/Pacific Islander ^ NA = Multi-Race data not available before 2013.
are only comparable if the samestandard million population was usedin the calculation.
Invasive Cancer Incidence and Average Annual Age-Adjusted Rates* for Major Sites by Sex
All Sites 77 431.1
Prostate 18 ND
Lung and Bronchus 9 ND
Colon and Rectum 7 ND
Male FemaleTotal Rate Total Rate
Female Breast 15 ND
57 467.0
13 ND
4 ND
*Per 100,000 2000 U.S. standard million population. Age-adjusted rates are only comparable if the same standard million population was used in the calculation.
- -
- -
Male FemaleTotal Rate Total Rate
Non-Hodgkin Lymphoma 4 ND
Melanoma of the Skin 3 ND
2 ND
3 ND
2 ND
Corpus and Uterus, NOS - -
Urinary Bladder 6
Kidney and Renal Pelvis 3 ND
ND 1
1
ND
ND
Notes: All in situ cases, except for urinary bladder, are excluded. Age-adjusted rates based on less than 20 events are statistically unreliable and are not displayed (ND).
Cancer Incidence (2011-2013 Residents)
Adult Behavioral Health Risk Factors (2012-2014)[Includes: Forest, Elk, Cameron, Clearfield, Jefferson, Clarion, McKean, and Warren Counties]
General Notes: Crude and age-adjusted rates based on less than 10 events are considered statistically unreliable and are not displayed (ND), unless otherwise noted. Starting in 2013, race of resident was derived from multiple race selections. A person is Multi-Race if they identify as more than one race. Prior to 2013, race of resident was derived from a single race designation.
Percent (CI)Risk Factors
Fair or poor general health:
Obese:
Overweight (includes obese):
No health insurance (ages 18-64):
Visited a doctor in the past 2 yearsfor a routine check-up:
Percent (CI)Risk Factors
Ever told they have diabetes: Currently has asthma:
Current smoker:
Ever tested for HIV (ages 18-64):
Needed to see a doctor but couldnot due to cost in the past year:
20
33
(17 - 22)
(30 - 36)
69 (66 - 72)
15 (12 - 18)
84 (81 - 86)
12 11(10 - 14) (9 - 13)
23 (21 - 26)
29 (26 - 33)
10 (8 - 12)
Notes: Data are based on 2012-2014 annual sample surveys of Pennsylvania adults. CI= 95% Confidence Interval.
Additional state or county/regional data are available at www.statistics.health.pa.gov.
^In situ, benign, and uncertain neoplasms
Multi- Race
0
ND
NAND ^

Forest County PAGE 3
Hospitals (7/13-6/14)
Total General Acute Care
Psychiatric Rehabilitation
0 0 0 0
General Hospitals
Beds Set Up and Staffed -
Admissions -
Beds per 1,000 Population -
Admissions per 1,000 Population -
Average Inpatient Occupancy Rate -
Nursing Homes (2014)
Total Number Certified-Medicare Certified-Medicaid
Nursing Homes
Licensed/Approved Beds
1 1 1
100 100 100
62.3
Average Occupancy Rate 94.0
Average Length of Stay (Number of Days) 237.1
$220
Total Licensed/Approved Beds per 1,000 Population Age 65 and Older
Average Semi-Private Daily Room Rate
Drug and Alcohol Treatment
Admissions to Client Primary Diagnosis
Drug Abuse Alcohol Abuse Other*
Percent Admitted
Only Once During 7/13-6/14
32 10 15 0 76.0
* Includes family members receiving counseling.
All Licensed Facilities Inpatient Non-Hospital
Inpatient Hospital Partial Hospitalization Outpatient3
1
0 0 2
Note: Each licensed facility may provide more than one type of service.
State-Supported Facilities
Types of Service Provided
Number of
Clients Admitted
25
Admission by County of Residence (7/13-6/14)
Treatment Facilities (as of 6/14)
Correctional Institution 0
General Note: Crude rates based on less than 10 events are considered statistically unreliable and are not displayed (ND), unless otherwise noted.
Services Funding
Other
0
Non-Profit
0
For Profit
0
State
0
Other
0
Ambulatory Surgery Centers (7/13-6/14)
Employees
Part Time Employees -
Full Time Employees -
Contracted Employees -
Payroll Employees - Staff with Clinical Privileges -
Total Surgical Visits per Employee -
Total Facilities 0 Total Surgical Visits -
Percent of Surgical Visits, Age 65+ -
Total Operating Rooms - Total Surgical Visits per Operating Room -
Facilities Surgical Visits
Staff Licensed as M.D. -
Total Employees per Operating Room -
Average Semi-Private Daily Room Rate -
Total Employees -

PAGE 4Forest County
Pennsylvania Health Care Workforce (2013-2014)
Notes: Only health care employees renewing their license in 2013-2014 were surveyed.The "Estimated Number" and "Percent of Workforce Intending to Remain in Profession for 6 or More Years" used to compute each "% Change from Previous Survey Year" are adjusted based on the response rates for the previous and current survey results. The survey results are available every two years. Numbers and percentages pertain to county of employment.Percentages based on less than six responses are considered statistically unreliable and are not displayed (ND).Registered Nurses and Licensed Practical Nurses are not comparable to previous survey period, so some data is not available (DNA).
Licensed Practical Nurses (2014) 34 DNA 87.2% DNA
Physicians (2014) ND
Dentists (2013) ND
Registered Nurses (2012/2013) 26 DNA 62.5% DNA
ND ND ND
ND ND ND
Estimated Number
Percent Changefrom Previous
Survey
Difference in Percent from
Previous Survey
Percent of WorkforceIntending to Remain in
Profession for 6 or More Years
Injury Hospitalizations (2014)
Injury Hospitalizations and Median Charges by Age and Sex
Injury Hospitalizations and Median Charges by Type of Payor
Injury Hospitalizations and Median Charges by Mechanism/Intent and Sex
0-4 5-14 15-24 25-44 45-64 65 and Older
Male - Total
Male - Median Charges
Female - Total
Female - Median Charges
UnintentionalMotor Vehicle All Poisonings Unintentional Falls
Unintentional Fire/Flame or Hot Object/Substance All Firearm All Other Injuries
Male - Total
Male - Median Charges
Female - Total
Female - Median Charges
Medicare Medicaid Other Government Commercial / Private Blue Cross Uninsured
Total Hospitalizations
Median Charges
All Ages
53 0 1 3 9 15 25
$26,309.75 - ND ND ND $41,362.75 $16,303.90
48 0 2 3 4 17 22
$16,586.88 - ND ND ND $16,657.71 $18,815.00
Note: Median charges not displayed (ND) for occurrences less than 10.
052 16 9202
- $17,817.50 $17,881.89 ND $34,248.57 ND
19
24
3
4
7
2
19
22
0
0
0
1
$16,657.71
$26,788.00
ND
ND
ND
ND
$16,516.05
$32,667.89
-
-
-
ND
Disclaimer: Injury data used in this report were provided to the Pennsylvania Department of Health by the Pennsylvania Health Care Cost Containment Council. The Pennsylvania Health Care Cost Containment Council specifically disclaims responsibility for any interpretations or conclusions. Contents may be republished or reproduced whole or in part, with attribution.

Franklin CountyHealth Profile 2016
Demographic Data (2014)
% Population Change 2010 to 2014 2.2
Median Age of the Population (2010-2014) 40.6
% Population Aged 65 and Over 18.2
Population per Square Mile 198.0
% Population with Income Below Poverty Level (2010-2014) 11.6
Per Capita Personal Income $39,972
% Labor Force Unemployed - Annual Average 5.5
% Population Eligible for Medical Assistance 14.1
Estimated Population by Age and Sex (2014)
Age Total Male Female Age Total Male Female
All Ages 152,892
Under 5 9,288
5-14 19,568
15-24 18,223
25-34 17,928
74,971
4,771
10,008
9,250
8,823
77,921
4,517
9,560
8,973
9,105
35-44 18,664
45-54 21,185
55-64 20,226
65-74 15,227
75+ 12,583
9,334
10,601
9,777
7,198
5,209
9,330
10,584
10,449
8,029
7,374
Natality and Reported Pregnancies^ (2014 Residents)
Crude Birth Rate11.6
Average Annual General64.0
% Low Birth Weight 7.0
% Prenatal Care in 1st Trimester 75.6
% Births to Mothers Under 18 1.3
7.2
76.3
1.1
ND
66.7
ND
Per 1,000 Population
Fertility Rate* (2012-2014)
All Races White Black
All Ages 1,812
Under 15 1
15-17 24
1,766
1
21
12
0
0
34
0
3
Age of WomanReported
PregnanciesLive
BirthsFetal
DeathsInduced
Abortions
Outcome
Age of WomanReported
PregnanciesLive
BirthsFetal
DeathsInduced
Abortions
Outcome
18-19 74
20-29 1,044
30 and Over 663
69
1,018
651
0
8
4
5
18
8
All Ages* 64.4
Under 15** ND
15-17 7.4
66.1
ND
8.4
Age of Woman Birth Rate Reported Pregnancy Rate Age of Woman Birth Rate Reported Pregnancy Rate
18-19 38.6
20-29 114.8
30 and Over** 34.3
41.4
117.7
35.0
^Live births, fetal deaths of 16+ weeks gestation, and induced abortions performed in-state. Notes: All ages includes any unknown ages. All rates per 1,000.*All Ages includes female population ages 15-44. ** Under 15 includes female population ages 10-14; 30 and Over includes female population ages 30-49.
Hispanic
7.3
71.1
ND
(of any race)
ND
76.5
ND
Asian / Pacific
General Notes: Crude and age-adjusted rates based on less than 10 events are considered statistically unreliable and are not displayed (ND), unless otherwise noted. Starting in 2013, race of resident was derived from multiple race selections. A person is Multi-Race if they identify as more than one race. Prior to 2013, race of resident was derived from a single race designation.
Morbidity (2012-2014 Residents)
Reported Incidence and Average Annual Rate (per 100,000) for Selected Notifiable Diseases (2012-2014)
HIV 18 3.9
Syphilis 8 ND
Tuberculosis 5 ND
Total Rate
Chlamydia 1,052 230.6
Giardiasis 14 3.1
Gonorrhea 205 44.9
Hepatitis: Type A < 5 ND
Total Rate
Lyme Disease 174 38.1
Salmonellosis 60 13.2
Total Rate
Campylobacteriosis 118 25.9 Hep. B* Acute 0 ND
Shigellosis < 5 ND
*Hepatitis: Type B **Meningococcal Disease
Meningococcal** < 5 ND
Pertussis 5 ND
Hep. B* Chronic 22 4.8
Chickenpox 33 7.2
Islander
Note: Communicable diseases with demographic counts of 1 to 4 are displayed as "< 5" to avoid potential identification of cases within certain geographic areas.
Multi - Race
ND
72.1
ND

Franklin County PAGE 2
Mortality (2014 Residents)
Selected Major Causes of Death, Number and Average Annual Age-Adjusted Death Rate* (2012-2014)
Number of Resident Deaths 1,512
Crude Death Rate per 1,000 9.9
Age-Adjusted Death Rate per 1,000 7.1
Number of Infant Deaths (< 1 Year of Age) 8 7 1 1
AllRaces BlackWhite
Hispanic(any race)
Infant Mortality Rate per 1,000 Live Births ND ND ND ND
Average Annual Infant Mortality Rate (2012-2014) 5.1 4.9 ND ND
Cause Total Rate
Diseases of Heart 967
Cancer 974
Stroke 209
C.L.R.D.** 239
Accidents 200
149.4
155.8
31.9
36.6
37.7
Cause Total Rate
Influenza/Pneumonia 87
Diabetes Mellitus 194
Septicemia 84
Nephritis/Nephrosis 75
Alzheimer's Disease 134
13.5
30.0
13.0
12.0
19.5
* Per 100,000 2000 U.S. standardmillion population. Age-adjusted rates
** Chronic Lower Respiratory Disease
Selected Leading Causes of Death, Number by Age Group (2014)
Under 5 Years of Age 5-24 Years of Age 25-44 Years of Age 45-64 Years of Age 65 Years and Older
Perinatal Conditions 5 Accidents 7
Assault (Homicide) 2
Accidents 14
Suicide 9
Cancer 5
Cancer 87
Diseases of Heart 42
Accidents 23
Diabetes Mellitus 12
Suicide 12
Diseases of Heart 297
Cancer 253
Stroke 76
C.L.R.D.** 73
Alzheimer's Disease 49
TOTAL 10 TOTAL 14 TOTAL 48 TOTAL 258 TOTAL 1,182
Note: Total includes all other causes.
Asian/PI*
0
ND
*Asian/Pacific Islander ^ NA = Multi-Race data not available before 2013.
are only comparable if the samestandard million population was usedin the calculation.
Invasive Cancer Incidence and Average Annual Age-Adjusted Rates* for Major Sites by Sex
All Sites 1,343 497.0
Prostate 273 95.2
Lung and Bronchus 192 68.8
Colon and Rectum 140 53.0
Male FemaleTotal Rate Total Rate
Female Breast 311 103.7
1,172 378.9
153 46.6
132 39.6
*Per 100,000 2000 U.S. standard million population. Age-adjusted rates are only comparable if the same standard million population was used in the calculation.
- -
- -
Male FemaleTotal Rate Total Rate
Non-Hodgkin Lymphoma 76 28.4
Melanoma of the Skin 91 33.9
44 13.1
86 27.9
55 19.9
Corpus and Uterus, NOS - -
Urinary Bladder 102
Kidney and Renal Pelvis 59 22.1
37.6 31
42
9.8
14.1
Notes: All in situ cases, except for urinary bladder, are excluded. Age-adjusted rates based on less than 20 events are statistically unreliable and are not displayed (ND).
Cancer Incidence (2011-2013 Residents)
Adult Behavioral Health Risk Factors (2012-2014)[Includes: Adams, Franklin, and Fulton Counties]
General Notes: Crude and age-adjusted rates based on less than 10 events are considered statistically unreliable and are not displayed (ND), unless otherwise noted. Starting in 2013, race of resident was derived from multiple race selections. A person is Multi-Race if they identify as more than one race. Prior to 2013, race of resident was derived from a single race designation.
Percent (CI)Risk Factors
Fair or poor general health:
Obese:
Overweight (includes obese):
No health insurance (ages 18-64):
Visited a doctor in the past 2 yearsfor a routine check-up:
Percent (CI)Risk Factors
Ever told they have diabetes: Currently has asthma:
Current smoker:
Ever tested for HIV (ages 18-64):
Needed to see a doctor but couldnot due to cost in the past year:
18
33
(15 - 21)
(29 - 37)
67 (63 - 72)
19 (15 - 25)
80 (76 - 83)
12 10(10 - 15) (7 - 13)
17 (14 - 21)
27 (22 - 32)
9 (7 - 12)
Notes: Data are based on 2012-2014 annual sample surveys of Pennsylvania adults. CI= 95% Confidence Interval.
Additional state or county/regional data are available at www.statistics.health.pa.gov.
^In situ, benign, and uncertain neoplasms
Multi- Race
0
ND
NAND ^

Franklin County PAGE 3
Hospitals (7/13-6/14)
Total General Acute Care
Psychiatric Rehabilitation
3 2 0 0
General Hospitals
Beds Set Up and Staffed 312
Admissions 14,377
Beds per 1,000 Population 2.0
Admissions per 1,000 Population 94.0
Average Inpatient Occupancy Rate 51.9
Nursing Homes (2014)
Total Number Certified-Medicare Certified-Medicaid
Nursing Homes
Licensed/Approved Beds
7 7 7
966 966 966
34.7
Average Occupancy Rate 92.8
Average Length of Stay (Number of Days) 223.8
$333
Total Licensed/Approved Beds per 1,000 Population Age 65 and Older
Average Semi-Private Daily Room Rate
Drug and Alcohol Treatment
Admissions to Client Primary Diagnosis
Drug Abuse Alcohol Abuse Other*
Percent Admitted
Only Once During 7/13-6/14
545 195 140 24 66.0
* Includes family members receiving counseling.
All Licensed Facilities Inpatient Non-Hospital
Inpatient Hospital Partial Hospitalization Outpatient8
1
0 0 8
Note: Each licensed facility may provide more than one type of service.
State-Supported Facilities
Types of Service Provided
Number of
Clients Admitted
359
Admission by County of Residence (7/13-6/14)
Treatment Facilities (as of 6/14)
Correctional Institution 0
General Note: Crude rates based on less than 10 events are considered statistically unreliable and are not displayed (ND), unless otherwise noted.
Services Funding
Other
1
Non-Profit
2
For Profit
1
State
0
Other
0
Ambulatory Surgery Centers (7/13-6/14)
Employees
Part Time Employees 43
Full Time Employees 29
Contracted Employees 15
Payroll Employees 57 Staff with Clinical Privileges 81
Total Surgical Visits per Employee 138.6
Total Facilities 3 Total Surgical Visits 9,979
Percent of Surgical Visits, Age 65+ 45.5
Total Operating Rooms 5 Total Surgical Visits per Operating Room 1,995.8
Facilities Surgical Visits
Staff Licensed as M.D. 68
Total Employees per Operating Room 14.4
Average Semi-Private Daily Room Rate $1,536
Total Employees 72

PAGE 4Franklin County
Pennsylvania Health Care Workforce (2013-2014)
Notes: Only health care employees renewing their license in 2013-2014 were surveyed.The "Estimated Number" and "Percent of Workforce Intending to Remain in Profession for 6 or More Years" used to compute each "% Change from Previous Survey Year" are adjusted based on the response rates for the previous and current survey results. The survey results are available every two years. Numbers and percentages pertain to county of employment.Percentages based on less than six responses are considered statistically unreliable and are not displayed (ND).Registered Nurses and Licensed Practical Nurses are not comparable to previous survey period, so some data is not available (DNA).
Licensed Practical Nurses (2014) 508 DNA 85.1% DNA
Physicians (2014) 272
Dentists (2013) 57
Registered Nurses (2012/2013) 1,158 DNA 83.5% DNA
7.5% 70.5% 3.1%
DNA 68.0% DNA
Estimated Number
Percent Changefrom Previous
Survey
Difference in Percent from
Previous Survey
Percent of WorkforceIntending to Remain in
Profession for 6 or More Years
Injury Hospitalizations (2014)
Injury Hospitalizations and Median Charges by Age and Sex
Injury Hospitalizations and Median Charges by Type of Payor
Injury Hospitalizations and Median Charges by Mechanism/Intent and Sex
0-4 5-14 15-24 25-44 45-64 65 and Older
Male - Total
Male - Median Charges
Female - Total
Female - Median Charges
UnintentionalMotor Vehicle All Poisonings Unintentional Falls
Unintentional Fire/Flame or Hot Object/Substance All Firearm All Other Injuries
Male - Total
Male - Median Charges
Female - Total
Female - Median Charges
Medicare Medicaid Other Government Commercial / Private Blue Cross Uninsured
Total Hospitalizations
Median Charges
All Ages
598 18 3 36 73 170 298
$25,427.34 $17,685.30 ND $35,022.95 $27,306.97 $26,780.42 $24,655.76
738 6 9 37 64 128 494
$26,533.29 ND ND $19,049.15 $17,574.14 $26,074.91 $27,511.75
Note: Median charges not displayed (ND) for occurrences less than 10.
33857 131 1271817
$23,387.50 $25,947.01 $20,723.75 $29,391.80 $31,514.28 ND
181
204
37
55
99
61
417
269
4
8
0
1
$24,283.59
$27,146.95
$40,653.46
$38,179.31
$16,472.00
$17,888.18
$29,064.10
$25,451.10
ND
ND
-
ND
Disclaimer: Injury data used in this report were provided to the Pennsylvania Department of Health by the Pennsylvania Health Care Cost Containment Council. The Pennsylvania Health Care Cost Containment Council specifically disclaims responsibility for any interpretations or conclusions. Contents may be republished or reproduced whole or in part, with attribution.
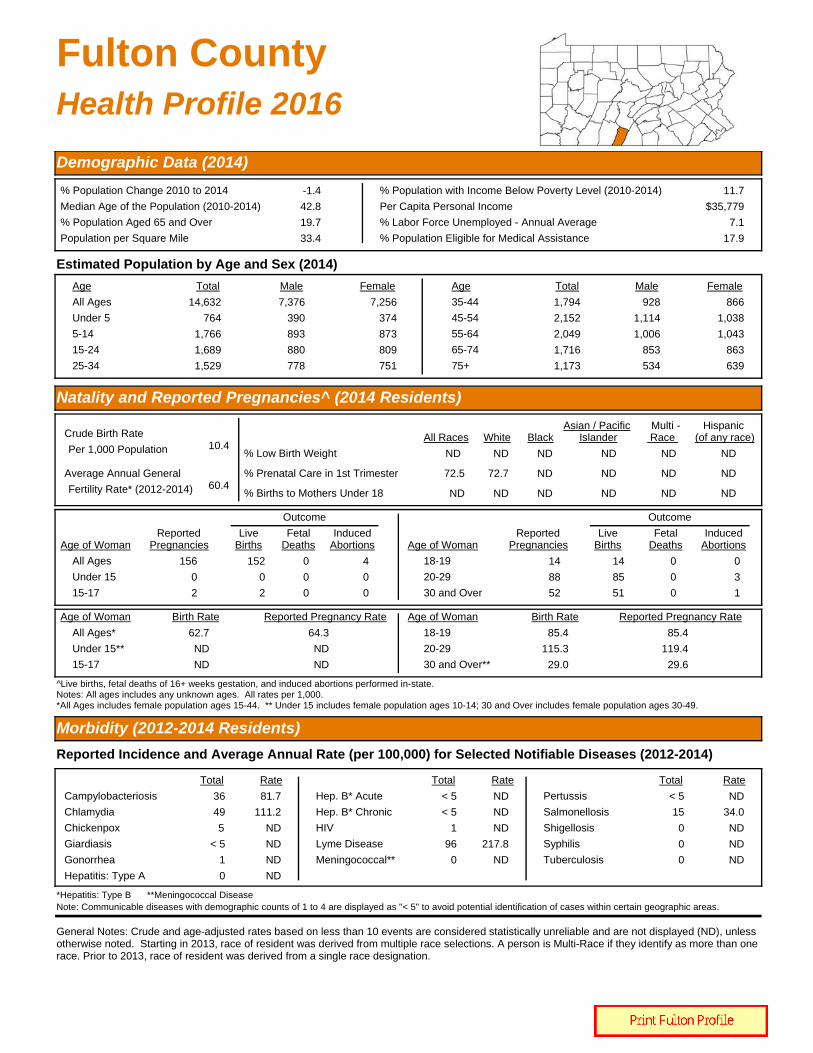
Fulton CountyHealth Profile 2016
Demographic Data (2014)
% Population Change 2010 to 2014 -1.4
Median Age of the Population (2010-2014) 42.8
% Population Aged 65 and Over 19.7
Population per Square Mile 33.4
% Population with Income Below Poverty Level (2010-2014) 11.7
Per Capita Personal Income $35,779
% Labor Force Unemployed - Annual Average 7.1
% Population Eligible for Medical Assistance 17.9
Estimated Population by Age and Sex (2014)
Age Total Male Female Age Total Male Female
All Ages 14,632
Under 5 764
5-14 1,766
15-24 1,689
25-34 1,529
7,376
390
893
880
778
7,256
374
873
809
751
35-44 1,794
45-54 2,152
55-64 2,049
65-74 1,716
75+ 1,173
928
1,114
1,006
853
534
866
1,038
1,043
863
639
Natality and Reported Pregnancies^ (2014 Residents)
Crude Birth Rate10.4
Average Annual General60.4
% Low Birth Weight ND
% Prenatal Care in 1st Trimester 72.5
% Births to Mothers Under 18 ND
ND
72.7
ND
ND
ND
ND
Per 1,000 Population
Fertility Rate* (2012-2014)
All Races White Black
All Ages 156
Under 15 0
15-17 2
152
0
2
0
0
0
4
0
0
Age of WomanReported
PregnanciesLive
BirthsFetal
DeathsInduced
Abortions
Outcome
Age of WomanReported
PregnanciesLive
BirthsFetal
DeathsInduced
Abortions
Outcome
18-19 14
20-29 88
30 and Over 52
14
85
51
0
0
0
0
3
1
All Ages* 62.7
Under 15** ND
15-17 ND
64.3
ND
ND
Age of Woman Birth Rate Reported Pregnancy Rate Age of Woman Birth Rate Reported Pregnancy Rate
18-19 85.4
20-29 115.3
30 and Over** 29.0
85.4
119.4
29.6
^Live births, fetal deaths of 16+ weeks gestation, and induced abortions performed in-state. Notes: All ages includes any unknown ages. All rates per 1,000.*All Ages includes female population ages 15-44. ** Under 15 includes female population ages 10-14; 30 and Over includes female population ages 30-49.
Hispanic
ND
ND
ND
(of any race)
ND
ND
ND
Asian / Pacific
General Notes: Crude and age-adjusted rates based on less than 10 events are considered statistically unreliable and are not displayed (ND), unless otherwise noted. Starting in 2013, race of resident was derived from multiple race selections. A person is Multi-Race if they identify as more than one race. Prior to 2013, race of resident was derived from a single race designation.
Morbidity (2012-2014 Residents)
Reported Incidence and Average Annual Rate (per 100,000) for Selected Notifiable Diseases (2012-2014)
HIV 1 ND
Syphilis 0 ND
Tuberculosis 0 ND
Total Rate
Chlamydia 49 111.2
Giardiasis < 5 ND
Gonorrhea 1 ND
Hepatitis: Type A 0 ND
Total Rate
Lyme Disease 96 217.8
Salmonellosis 15 34.0
Total Rate
Campylobacteriosis 36 81.7 Hep. B* Acute < 5 ND
Shigellosis 0 ND
*Hepatitis: Type B **Meningococcal Disease
Meningococcal** 0 ND
Pertussis < 5 ND
Hep. B* Chronic < 5 ND
Chickenpox 5 ND
Islander
Note: Communicable diseases with demographic counts of 1 to 4 are displayed as "< 5" to avoid potential identification of cases within certain geographic areas.
Multi - Race
ND
ND
ND

Fulton County PAGE 2
Mortality (2014 Residents)
Selected Major Causes of Death, Number and Average Annual Age-Adjusted Death Rate* (2012-2014)
Number of Resident Deaths 148
Crude Death Rate per 1,000 10.1
Age-Adjusted Death Rate per 1,000 7.9
Number of Infant Deaths (< 1 Year of Age) 3 3 0 0
AllRaces BlackWhite
Hispanic(any race)
Infant Mortality Rate per 1,000 Live Births ND ND ND ND
Average Annual Infant Mortality Rate (2012-2014) ND ND ND ND
Cause Total Rate
Diseases of Heart 119
Cancer 108
Stroke 25
C.L.R.D.** 18
Accidents 21
203.9
174.1
42.3
29.2
51.4
Cause Total Rate
Influenza/Pneumonia 11
Diabetes Mellitus 19
Septicemia 11
Nephritis/Nephrosis 6
Alzheimer's Disease 6
20.2
33.0
17.8
ND
ND
* Per 100,000 2000 U.S. standardmillion population. Age-adjusted rates
** Chronic Lower Respiratory Disease
Selected Leading Causes of Death, Number by Age Group (2014)
Under 5 Years of Age 5-24 Years of Age 25-44 Years of Age 45-64 Years of Age 65 Years and Older
Accidents 2 Accidents 3 Cancer 13
Diseases of Heart 5
Septicemia 3
Diseases of Heart 30
Cancer 25
Diabetes Mellitus 8
Stroke 7
C.L.R.D.** 5
TOTAL 3 TOTAL 2 TOTAL 7 TOTAL 26 TOTAL 110
Note: Total includes all other causes.
Asian/PI*
0
ND
*Asian/Pacific Islander ^ NA = Multi-Race data not available before 2013.
are only comparable if the samestandard million population was usedin the calculation.
Invasive Cancer Incidence and Average Annual Age-Adjusted Rates* for Major Sites by Sex
All Sites 143 498.5
Prostate 24 77.6
Lung and Bronchus 21 67.8
Colon and Rectum 9 ND
Male FemaleTotal Rate Total Rate
Female Breast 40 134.3
143 471.1
13 ND
14 ND
*Per 100,000 2000 U.S. standard million population. Age-adjusted rates are only comparable if the same standard million population was used in the calculation.
- -
- -
Male FemaleTotal Rate Total Rate
Non-Hodgkin Lymphoma 8 ND
Melanoma of the Skin 12 ND
9 ND
8 ND
5 ND
Corpus and Uterus, NOS - -
Urinary Bladder 14
Kidney and Renal Pelvis 7 ND
ND 5
5
ND
ND
Notes: All in situ cases, except for urinary bladder, are excluded. Age-adjusted rates based on less than 20 events are statistically unreliable and are not displayed (ND).
Cancer Incidence (2011-2013 Residents)
Adult Behavioral Health Risk Factors (2012-2014)[Includes: Adams, Franklin, and Fulton Counties]
General Notes: Crude and age-adjusted rates based on less than 10 events are considered statistically unreliable and are not displayed (ND), unless otherwise noted. Starting in 2013, race of resident was derived from multiple race selections. A person is Multi-Race if they identify as more than one race. Prior to 2013, race of resident was derived from a single race designation.
Percent (CI)Risk Factors
Fair or poor general health:
Obese:
Overweight (includes obese):
No health insurance (ages 18-64):
Visited a doctor in the past 2 yearsfor a routine check-up:
Percent (CI)Risk Factors
Ever told they have diabetes: Currently has asthma:
Current smoker:
Ever tested for HIV (ages 18-64):
Needed to see a doctor but couldnot due to cost in the past year:
18
33
(15 - 21)
(29 - 37)
67 (63 - 72)
19 (15 - 25)
80 (76 - 83)
12 10(10 - 15) (7 - 13)
17 (14 - 21)
27 (22 - 32)
9 (7 - 12)
Notes: Data are based on 2012-2014 annual sample surveys of Pennsylvania adults. CI= 95% Confidence Interval.
Additional state or county/regional data are available at www.statistics.health.pa.gov.
^In situ, benign, and uncertain neoplasms
Multi- Race
0
ND
NAND ^

Fulton County PAGE 3
Hospitals (7/13-6/14)
Total General Acute Care
Psychiatric Rehabilitation
1 1 0 0
General Hospitals
Beds Set Up and Staffed 21
Admissions 810
Beds per 1,000 Population 1.4
Admissions per 1,000 Population 55.4
Average Inpatient Occupancy Rate 49.2
Nursing Homes (2014)
Total Number Certified-Medicare Certified-Medicaid
Nursing Homes
Licensed/Approved Beds
1 1 1
67 67 67
23.2
Average Occupancy Rate 98.5
Average Length of Stay (Number of Days) 394.4
$265
Total Licensed/Approved Beds per 1,000 Population Age 65 and Older
Average Semi-Private Daily Room Rate
Drug and Alcohol Treatment
Admissions to Client Primary Diagnosis
Drug Abuse Alcohol Abuse Other*
Percent Admitted
Only Once During 7/13-6/14
59 32 12 4 79.2
* Includes family members receiving counseling.
All Licensed Facilities Inpatient Non-Hospital
Inpatient Hospital Partial Hospitalization Outpatient1
0
0 0 1
Note: Each licensed facility may provide more than one type of service.
State-Supported Facilities
Types of Service Provided
Number of
Clients Admitted
48
Admission by County of Residence (7/13-6/14)
Treatment Facilities (as of 6/14)
Correctional Institution 0
General Note: Crude rates based on less than 10 events are considered statistically unreliable and are not displayed (ND), unless otherwise noted.
Services Funding
Other
0
Non-Profit
1
For Profit
0
State
0
Other
0
Ambulatory Surgery Centers (7/13-6/14)
Employees
Part Time Employees -
Full Time Employees -
Contracted Employees -
Payroll Employees - Staff with Clinical Privileges -
Total Surgical Visits per Employee -
Total Facilities 0 Total Surgical Visits -
Percent of Surgical Visits, Age 65+ -
Total Operating Rooms - Total Surgical Visits per Operating Room -
Facilities Surgical Visits
Staff Licensed as M.D. -
Total Employees per Operating Room -
Average Semi-Private Daily Room Rate $1,415
Total Employees -

PAGE 4Fulton County
Pennsylvania Health Care Workforce (2013-2014)
Notes: Only health care employees renewing their license in 2013-2014 were surveyed.The "Estimated Number" and "Percent of Workforce Intending to Remain in Profession for 6 or More Years" used to compute each "% Change from Previous Survey Year" are adjusted based on the response rates for the previous and current survey results. The survey results are available every two years. Numbers and percentages pertain to county of employment.Percentages based on less than six responses are considered statistically unreliable and are not displayed (ND).Registered Nurses and Licensed Practical Nurses are not comparable to previous survey period, so some data is not available (DNA).
Licensed Practical Nurses (2014) 49 DNA 81.7% DNA
Physicians (2014) 10
Dentists (2013) ND
Registered Nurses (2012/2013) 67 DNA 85.2% DNA
-33.0% 62.5% -14.4%
ND ND DNA
Estimated Number
Percent Changefrom Previous
Survey
Difference in Percent from
Previous Survey
Percent of WorkforceIntending to Remain in
Profession for 6 or More Years
Injury Hospitalizations (2014)
Injury Hospitalizations and Median Charges by Age and Sex
Injury Hospitalizations and Median Charges by Type of Payor
Injury Hospitalizations and Median Charges by Mechanism/Intent and Sex
0-4 5-14 15-24 25-44 45-64 65 and Older
Male - Total
Male - Median Charges
Female - Total
Female - Median Charges
UnintentionalMotor Vehicle All Poisonings Unintentional Falls
Unintentional Fire/Flame or Hot Object/Substance All Firearm All Other Injuries
Male - Total
Male - Median Charges
Female - Total
Female - Median Charges
Medicare Medicaid Other Government Commercial / Private Blue Cross Uninsured
Total Hospitalizations
Median Charges
All Ages
64 0 4 6 16 12 26
$26,442.08 - ND ND $18,094.75 $16,911.41 $27,066.68
69 1 0 0 6 16 46
$19,829.18 ND - - ND $19,888.39 $19,661.25
Note: Median charges not displayed (ND) for occurrences less than 10.
184 13 13220
ND $21,090.36 $36,643.20 $23,083.10 $28,879.51 -
15
23
5
10
6
5
42
25
1
0
0
1
$27,649.39
$18,666.41
ND
$48,578.35
ND
ND
$19,108.96
$26,824.80
ND
-
-
ND
Disclaimer: Injury data used in this report were provided to the Pennsylvania Department of Health by the Pennsylvania Health Care Cost Containment Council. The Pennsylvania Health Care Cost Containment Council specifically disclaims responsibility for any interpretations or conclusions. Contents may be republished or reproduced whole or in part, with attribution.

Greene CountyHealth Profile 2016
Demographic Data (2014)
% Population Change 2010 to 2014 -2.2
Median Age of the Population (2010-2014) 41.7
% Population Aged 65 and Over 17.1
Population per Square Mile 65.7
% Population with Income Below Poverty Level (2010-2014) 14.5
Per Capita Personal Income $43,047
% Labor Force Unemployed - Annual Average 5.6
% Population Eligible for Medical Assistance 20.0
Estimated Population by Age and Sex (2014)
Age Total Male Female Age Total Male Female
All Ages 37,843
Under 5 1,852
5-14 4,087
15-24 5,106
25-34 4,576
19,637
963
2,126
2,685
2,621
18,206
889
1,961
2,421
1,955
35-44 4,899
45-54 5,319
55-64 5,548
65-74 3,723
75+ 2,733
2,705
2,836
2,805
1,830
1,066
2,194
2,483
2,743
1,893
1,667
Natality and Reported Pregnancies^ (2014 Residents)
Crude Birth Rate10.3
Average Annual General56.8
% Low Birth Weight 9.5
% Prenatal Care in 1st Trimester 76.1
% Births to Mothers Under 18 ND
9.7
76.5
ND
ND
ND
ND
Per 1,000 Population
Fertility Rate* (2012-2014)
All Races White Black
All Ages 436
Under 15 1
15-17 11
389
0
9
2
0
0
45
1
2
Age of WomanReported
PregnanciesLive
BirthsFetal
DeathsInduced
Abortions
Outcome
Age of WomanReported
PregnanciesLive
BirthsFetal
DeathsInduced
Abortions
Outcome
18-19 30
20-29 258
30 and Over 135
27
228
124
0
1
1
3
29
10
All Ages* 59.2
Under 15** ND
15-17 ND
66.4
ND
19.5
Age of Woman Birth Rate Reported Pregnancy Rate Age of Woman Birth Rate Reported Pregnancy Rate
18-19 45.8
20-29 100.3
30 and Over** 28.6
50.9
113.5
31.1
^Live births, fetal deaths of 16+ weeks gestation, and induced abortions performed in-state. Notes: All ages includes any unknown ages. All rates per 1,000.*All Ages includes female population ages 15-44. ** Under 15 includes female population ages 10-14; 30 and Over includes female population ages 30-49.
Hispanic
ND
ND
ND
(of any race)
ND
ND
ND
Asian / Pacific
General Notes: Crude and age-adjusted rates based on less than 10 events are considered statistically unreliable and are not displayed (ND), unless otherwise noted. Starting in 2013, race of resident was derived from multiple race selections. A person is Multi-Race if they identify as more than one race. Prior to 2013, race of resident was derived from a single race designation.
Morbidity (2012-2014 Residents)
Reported Incidence and Average Annual Rate (per 100,000) for Selected Notifiable Diseases (2012-2014)
HIV 4 ND
Syphilis 0 ND
Tuberculosis 0 ND
Total Rate
Chlamydia 207 182.0
Giardiasis 9 ND
Gonorrhea 14 12.3
Hepatitis: Type A 0 ND
Total Rate
Lyme Disease 11 9.7
Salmonellosis 15 13.2
Total Rate
Campylobacteriosis 12 10.5 Hep. B* Acute < 5 ND
Shigellosis 0 ND
*Hepatitis: Type B **Meningococcal Disease
Meningococcal** 0 ND
Pertussis < 5 ND
Hep. B* Chronic 10 8.8
Chickenpox 14 12.3
Islander
Note: Communicable diseases with demographic counts of 1 to 4 are displayed as "< 5" to avoid potential identification of cases within certain geographic areas.
Multi - Race
ND
ND
ND

Greene County PAGE 2
Mortality (2014 Residents)
Selected Major Causes of Death, Number and Average Annual Age-Adjusted Death Rate* (2012-2014)
Number of Resident Deaths 389
Crude Death Rate per 1,000 10.3
Age-Adjusted Death Rate per 1,000 8.0
Number of Infant Deaths (< 1 Year of Age) 4 4 0 0
AllRaces BlackWhite
Hispanic(any race)
Infant Mortality Rate per 1,000 Live Births ND ND ND ND
Average Annual Infant Mortality Rate (2012-2014) ND ND ND ND
Cause Total Rate
Diseases of Heart 310
Cancer 279
Stroke 40
C.L.R.D.** 119
Accidents 84
203.8
185.1
25.9
78.5
67.3
Cause Total Rate
Influenza/Pneumonia 28
Diabetes Mellitus 29
Septicemia 10
Nephritis/Nephrosis 34
Alzheimer's Disease 33
19.3
20.2
6.6
22.5
21.4
* Per 100,000 2000 U.S. standardmillion population. Age-adjusted rates
** Chronic Lower Respiratory Disease
Selected Leading Causes of Death, Number by Age Group (2014)
Under 5 Years of Age 5-24 Years of Age 25-44 Years of Age 45-64 Years of Age 65 Years and Older
Accidents 7 Accidents 5
Cancer 3
Diseases of Heart 3
Cancer 26
Diseases of Heart 14
Accidents 8
C.L.R.D.** 4
Suicide 4
Diseases of Heart 80
Cancer 55
C.L.R.D.** 31
Alzheimer's Disease 14
TOTAL 4 TOTAL 8 TOTAL 16 TOTAL 70 TOTAL 291
Note: Total includes all other causes.
Asian/PI*
0
ND
*Asian/Pacific Islander ^ NA = Multi-Race data not available before 2013.
are only comparable if the samestandard million population was usedin the calculation.
Invasive Cancer Incidence and Average Annual Age-Adjusted Rates* for Major Sites by Sex
All Sites 355 514.3
Prostate 47 63.5
Lung and Bronchus 67 97.9
Colon and Rectum 42 62.0
Male FemaleTotal Rate Total Rate
Female Breast 92 124.0
387 524.5
60 74.2
42 57.7
*Per 100,000 2000 U.S. standard million population. Age-adjusted rates are only comparable if the same standard million population was used in the calculation.
- -
- -
Male FemaleTotal Rate Total Rate
Non-Hodgkin Lymphoma 16 ND
Melanoma of the Skin 12 ND
16 ND
32 44.5
11 ND
Corpus and Uterus, NOS - -
Urinary Bladder 26
Kidney and Renal Pelvis 15 ND
38.8 9
19
ND
ND
Notes: All in situ cases, except for urinary bladder, are excluded. Age-adjusted rates based on less than 20 events are statistically unreliable and are not displayed (ND).
Cancer Incidence (2011-2013 Residents)
Adult Behavioral Health Risk Factors (2012-2014)[Includes: Fayette, Greene, and Washington Counties]
General Notes: Crude and age-adjusted rates based on less than 10 events are considered statistically unreliable and are not displayed (ND), unless otherwise noted. Starting in 2013, race of resident was derived from multiple race selections. A person is Multi-Race if they identify as more than one race. Prior to 2013, race of resident was derived from a single race designation.
Percent (CI)Risk Factors
Fair or poor general health:
Obese:
Overweight (includes obese):
No health insurance (ages 18-64):
Visited a doctor in the past 2 yearsfor a routine check-up:
Percent (CI)Risk Factors
Ever told they have diabetes: Currently has asthma:
Current smoker:
Ever tested for HIV (ages 18-64):
Needed to see a doctor but couldnot due to cost in the past year:
22
33
(19 - 25)
(30 - 37)
67 (63 - 70)
16 (13 - 20)
83 (80 - 86)
15 11(12 - 17) (9 - 14)
25 (22 - 28)
30 (26 - 35)
13 (11 - 16)
Notes: Data are based on 2012-2014 annual sample surveys of Pennsylvania adults. CI= 95% Confidence Interval.
Additional state or county/regional data are available at www.statistics.health.pa.gov.
^In situ, benign, and uncertain neoplasms
Multi- Race
0
ND
NAND ^

Greene County PAGE 3
Hospitals (7/13-6/14)
Total General Acute Care
Psychiatric Rehabilitation
1 1 0 0
General Hospitals
Beds Set Up and Staffed 49
Admissions 2,105
Beds per 1,000 Population 1.3
Admissions per 1,000 Population 55.6
Average Inpatient Occupancy Rate 59.7
Nursing Homes (2014)
Total Number Certified-Medicare Certified-Medicaid
Nursing Homes
Licensed/Approved Beds
2 2 2
232 232 232
35.9
Average Occupancy Rate 86.0
Average Length of Stay (Number of Days) 154.7
$229
Total Licensed/Approved Beds per 1,000 Population Age 65 and Older
Average Semi-Private Daily Room Rate
Drug and Alcohol Treatment
Admissions to Client Primary Diagnosis
Drug Abuse Alcohol Abuse Other*
Percent Admitted
Only Once During 7/13-6/14
60 33 7 0 55.0
* Includes family members receiving counseling.
All Licensed Facilities Inpatient Non-Hospital
Inpatient Hospital Partial Hospitalization Outpatient2
0
0 0 2
Note: Each licensed facility may provide more than one type of service.
State-Supported Facilities
Types of Service Provided
Number of
Clients Admitted
40
Admission by County of Residence (7/13-6/14)
Treatment Facilities (as of 6/14)
Correctional Institution 0
General Note: Crude rates based on less than 10 events are considered statistically unreliable and are not displayed (ND), unless otherwise noted.
Services Funding
Other
0
Non-Profit
0
For Profit
1
State
0
Other
0
Ambulatory Surgery Centers (7/13-6/14)
Employees
Part Time Employees -
Full Time Employees -
Contracted Employees -
Payroll Employees - Staff with Clinical Privileges -
Total Surgical Visits per Employee -
Total Facilities 0 Total Surgical Visits -
Percent of Surgical Visits, Age 65+ -
Total Operating Rooms - Total Surgical Visits per Operating Room -
Facilities Surgical Visits
Staff Licensed as M.D. -
Total Employees per Operating Room -
Average Semi-Private Daily Room Rate -
Total Employees -

PAGE 4Greene County
Pennsylvania Health Care Workforce (2013-2014)
Notes: Only health care employees renewing their license in 2013-2014 were surveyed.The "Estimated Number" and "Percent of Workforce Intending to Remain in Profession for 6 or More Years" used to compute each "% Change from Previous Survey Year" are adjusted based on the response rates for the previous and current survey results. The survey results are available every two years. Numbers and percentages pertain to county of employment.Percentages based on less than six responses are considered statistically unreliable and are not displayed (ND).Registered Nurses and Licensed Practical Nurses are not comparable to previous survey period, so some data is not available (DNA).
Licensed Practical Nurses (2014) 98 DNA 88.9% DNA
Physicians (2014) 39
Dentists (2013) 15
Registered Nurses (2012/2013) 238 DNA 71.4% DNA
-5.8% 71.9% 4.3%
-0.5% 69.2% -7.7%
Estimated Number
Percent Changefrom Previous
Survey
Difference in Percent from
Previous Survey
Percent of WorkforceIntending to Remain in
Profession for 6 or More Years
Injury Hospitalizations (2014)
Injury Hospitalizations and Median Charges by Age and Sex
Injury Hospitalizations and Median Charges by Type of Payor
Injury Hospitalizations and Median Charges by Mechanism/Intent and Sex
0-4 5-14 15-24 25-44 45-64 65 and Older
Male - Total
Male - Median Charges
Female - Total
Female - Median Charges
UnintentionalMotor Vehicle All Poisonings Unintentional Falls
Unintentional Fire/Flame or Hot Object/Substance All Firearm All Other Injuries
Male - Total
Male - Median Charges
Female - Total
Female - Median Charges
Medicare Medicaid Other Government Commercial / Private Blue Cross Uninsured
Total Hospitalizations
Median Charges
All Ages
125 1 1 10 33 38 42
$13,718.31 ND ND $9,260.25 $12,357.41 $17,331.96 $10,658.90
149 2 0 3 25 31 88
$14,349.71 ND - ND $10,265.00 $13,550.95 $15,526.23
Note: Median charges not displayed (ND) for occurrences less than 10.
9147 51 19352
ND $13,208.53 $15,198.00 $13,425.46 $24,036.25 ND
53
60
6
3
15
25
75
35
0
2
0
0
$13,144.03
$14,135.91
ND
ND
$8,622.93
$8,560.28
$16,577.00
$21,496.00
-
ND
-
-
Disclaimer: Injury data used in this report were provided to the Pennsylvania Department of Health by the Pennsylvania Health Care Cost Containment Council. The Pennsylvania Health Care Cost Containment Council specifically disclaims responsibility for any interpretations or conclusions. Contents may be republished or reproduced whole or in part, with attribution.

Huntingdon CountyHealth Profile 2016
Demographic Data (2014)
% Population Change 2010 to 2014 -0.4
Median Age of the Population (2010-2014) 42.4
% Population Aged 65 and Over 18.7
Population per Square Mile 52.3
% Population with Income Below Poverty Level (2010-2014) 13.7
Per Capita Personal Income $34,653
% Labor Force Unemployed - Annual Average 7.9
% Population Eligible for Medical Assistance 17.8
Estimated Population by Age and Sex (2014)
Age Total Male Female Age Total Male Female
All Ages 45,750
Under 5 2,079
5-14 4,959
15-24 5,964
25-34 5,624
24,302
1,092
2,464
3,174
3,461
21,448
987
2,495
2,790
2,163
35-44 5,704
45-54 6,540
55-64 6,315
65-74 4,881
75+ 3,684
3,331
3,639
3,194
2,428
1,519
2,373
2,901
3,121
2,453
2,165
Natality and Reported Pregnancies^ (2014 Residents)
Crude Birth Rate10.0
Average Annual General60.0
% Low Birth Weight 8.5
% Prenatal Care in 1st Trimester 78.9
% Births to Mothers Under 18 2.2
8.0
79.9
2.3
ND
ND
ND
Per 1,000 Population
Fertility Rate* (2012-2014)
All Races White Black
All Ages 481
Under 15 0
15-17 11
458
0
10
4
0
0
19
0
1
Age of WomanReported
PregnanciesLive
BirthsFetal
DeathsInduced
Abortions
Outcome
Age of WomanReported
PregnanciesLive
BirthsFetal
DeathsInduced
Abortions
Outcome
18-19 30
20-29 273
30 and Over 166
28
264
155
0
1
3
2
8
8
All Ages* 62.5
Under 15** ND
15-17 13.4
65.7
ND
14.7
Age of Woman Birth Rate Reported Pregnancy Rate Age of Woman Birth Rate Reported Pregnancy Rate
18-19 41.1
20-29 107.3
30 and Over** 32.4
44.0
110.9
34.7
^Live births, fetal deaths of 16+ weeks gestation, and induced abortions performed in-state. Notes: All ages includes any unknown ages. All rates per 1,000.*All Ages includes female population ages 15-44. ** Under 15 includes female population ages 10-14; 30 and Over includes female population ages 30-49.
Hispanic
ND
ND
ND
(of any race)
ND
ND
ND
Asian / Pacific
General Notes: Crude and age-adjusted rates based on less than 10 events are considered statistically unreliable and are not displayed (ND), unless otherwise noted. Starting in 2013, race of resident was derived from multiple race selections. A person is Multi-Race if they identify as more than one race. Prior to 2013, race of resident was derived from a single race designation.
Morbidity (2012-2014 Residents)
Reported Incidence and Average Annual Rate (per 100,000) for Selected Notifiable Diseases (2012-2014)
HIV 2 ND
Syphilis 4 ND
Tuberculosis < 5 ND
Total Rate
Chlamydia 262 190.7
Giardiasis < 5 ND
Gonorrhea 17 12.4
Hepatitis: Type A < 5 ND
Total Rate
Lyme Disease 165 120.1
Salmonellosis 12 8.7
Total Rate
Campylobacteriosis 13 9.5 Hep. B* Acute 0 ND
Shigellosis < 5 ND
*Hepatitis: Type B **Meningococcal Disease
Meningococcal** < 5 ND
Pertussis 0 ND
Hep. B* Chronic < 5 ND
Chickenpox 7 ND
Islander
Note: Communicable diseases with demographic counts of 1 to 4 are displayed as "< 5" to avoid potential identification of cases within certain geographic areas.
Multi - Race
ND
73.3
ND

Huntingdon County PAGE 2
Mortality (2014 Residents)
Selected Major Causes of Death, Number and Average Annual Age-Adjusted Death Rate* (2012-2014)
Number of Resident Deaths 441
Crude Death Rate per 1,000 9.6
Age-Adjusted Death Rate per 1,000 7.0
Number of Infant Deaths (< 1 Year of Age) 2 2 0 0
AllRaces BlackWhite
Hispanic(any race)
Infant Mortality Rate per 1,000 Live Births ND ND ND ND
Average Annual Infant Mortality Rate (2012-2014) ND ND ND ND
Cause Total Rate
Diseases of Heart 307
Cancer 300
Stroke 78
C.L.R.D.** 74
Accidents 96
165.2
161.5
42.6
39.5
60.2
Cause Total Rate
Influenza/Pneumonia 25
Diabetes Mellitus 38
Septicemia 20
Nephritis/Nephrosis 38
Alzheimer's Disease 44
14.3
20.6
11.0
19.9
23.6
* Per 100,000 2000 U.S. standardmillion population. Age-adjusted rates
** Chronic Lower Respiratory Disease
Selected Leading Causes of Death, Number by Age Group (2014)
Under 5 Years of Age 5-24 Years of Age 25-44 Years of Age 45-64 Years of Age 65 Years and Older
Perinatal Conditions 2 Accidents 3 Accidents 5
Cancer 4
Suicide 3
Cancer 25
Accidents 11
Diseases of Heart 9
Stroke 5
Suicide 5
Diseases of Heart 97
Cancer 68
Accidents 20
C.L.R.D.** 19
Stroke 19
TOTAL 2 TOTAL 4 TOTAL 14 TOTAL 82 TOTAL 339
Note: Total includes all other causes.
Asian/PI*
0
ND
*Asian/Pacific Islander ^ NA = Multi-Race data not available before 2013.
are only comparable if the samestandard million population was usedin the calculation.
Invasive Cancer Incidence and Average Annual Age-Adjusted Rates* for Major Sites by Sex
All Sites 381 435.3
Prostate 86 92.1
Lung and Bronchus 60 68.7
Colon and Rectum 33 38.6
Male FemaleTotal Rate Total Rate
Female Breast 100 109.5
384 443.0
48 50.6
29 31.2
*Per 100,000 2000 U.S. standard million population. Age-adjusted rates are only comparable if the same standard million population was used in the calculation.
- -
- -
Male FemaleTotal Rate Total Rate
Non-Hodgkin Lymphoma 21 24.4
Melanoma of the Skin 14 ND
27 30.2
29 31.6
10 ND
Corpus and Uterus, NOS - -
Urinary Bladder 25
Kidney and Renal Pelvis 19 ND
30.1 10
12
ND
ND
Notes: All in situ cases, except for urinary bladder, are excluded. Age-adjusted rates based on less than 20 events are statistically unreliable and are not displayed (ND).
Cancer Incidence (2011-2013 Residents)
Adult Behavioral Health Risk Factors (2012-2014)[Includes: Bedford, Blair, Huntingdon, Juniata, and Mifflin Counties]
General Notes: Crude and age-adjusted rates based on less than 10 events are considered statistically unreliable and are not displayed (ND), unless otherwise noted. Starting in 2013, race of resident was derived from multiple race selections. A person is Multi-Race if they identify as more than one race. Prior to 2013, race of resident was derived from a single race designation.
Percent (CI)Risk Factors
Fair or poor general health:
Obese:
Overweight (includes obese):
No health insurance (ages 18-64):
Visited a doctor in the past 2 yearsfor a routine check-up:
Percent (CI)Risk Factors
Ever told they have diabetes: Currently has asthma:
Current smoker:
Ever tested for HIV (ages 18-64):
Needed to see a doctor but couldnot due to cost in the past year:
20
35
(17 - 23)
(31 - 39)
68 (64 - 72)
18 (14 - 22)
82 (79 - 85)
12 12(10 - 15) (9 - 14)
24 (21 - 28)
34 (29 - 38)
12 (9 - 15)
Notes: Data are based on 2012-2014 annual sample surveys of Pennsylvania adults. CI= 95% Confidence Interval.
Additional state or county/regional data are available at www.statistics.health.pa.gov.
^In situ, benign, and uncertain neoplasms
Multi- Race
0
ND
NAND ^

Huntingdon County PAGE 3
Hospitals (7/13-6/14)
Total General Acute Care
Psychiatric Rehabilitation
1 1 0 0
General Hospitals
Beds Set Up and Staffed 70
Admissions 1,819
Beds per 1,000 Population 1.5
Admissions per 1,000 Population 39.8
Average Inpatient Occupancy Rate 26.3
Nursing Homes (2014)
Total Number Certified-Medicare Certified-Medicaid
Nursing Homes
Licensed/Approved Beds
2 2 2
189 189 189
22.1
Average Occupancy Rate 74.3
Average Length of Stay (Number of Days) 123.7
$292
Total Licensed/Approved Beds per 1,000 Population Age 65 and Older
Average Semi-Private Daily Room Rate
Drug and Alcohol Treatment
Admissions to Client Primary Diagnosis
Drug Abuse Alcohol Abuse Other*
Percent Admitted
Only Once During 7/13-6/14
266 118 68 31 84.8
* Includes family members receiving counseling.
All Licensed Facilities Inpatient Non-Hospital
Inpatient Hospital Partial Hospitalization Outpatient1
0
0 0 1
Note: Each licensed facility may provide more than one type of service.
State-Supported Facilities
Types of Service Provided
Number of
Clients Admitted
217
Admission by County of Residence (7/13-6/14)
Treatment Facilities (as of 6/14)
Correctional Institution 0
General Note: Crude rates based on less than 10 events are considered statistically unreliable and are not displayed (ND), unless otherwise noted.
Services Funding
Other
0
Non-Profit
1
For Profit
0
State
0
Other
0
Ambulatory Surgery Centers (7/13-6/14)
Employees
Part Time Employees -
Full Time Employees -
Contracted Employees -
Payroll Employees - Staff with Clinical Privileges -
Total Surgical Visits per Employee -
Total Facilities 0 Total Surgical Visits -
Percent of Surgical Visits, Age 65+ -
Total Operating Rooms - Total Surgical Visits per Operating Room -
Facilities Surgical Visits
Staff Licensed as M.D. -
Total Employees per Operating Room -
Average Semi-Private Daily Room Rate $702
Total Employees -

PAGE 4Huntingdon County
Pennsylvania Health Care Workforce (2013-2014)
Notes: Only health care employees renewing their license in 2013-2014 were surveyed.The "Estimated Number" and "Percent of Workforce Intending to Remain in Profession for 6 or More Years" used to compute each "% Change from Previous Survey Year" are adjusted based on the response rates for the previous and current survey results. The survey results are available every two years. Numbers and percentages pertain to county of employment.Percentages based on less than six responses are considered statistically unreliable and are not displayed (ND).Registered Nurses and Licensed Practical Nurses are not comparable to previous survey period, so some data is not available (DNA).
Licensed Practical Nurses (2014) 200 DNA 83.0% DNA
Physicians (2014) 46
Dentists (2013) 18
Registered Nurses (2012/2013) 262 DNA 80.3% DNA
-3.8% 65.8% 7.6%
-8.2% 56.3% -10.4%
Estimated Number
Percent Changefrom Previous
Survey
Difference in Percent from
Previous Survey
Percent of WorkforceIntending to Remain in
Profession for 6 or More Years
Injury Hospitalizations (2014)
Injury Hospitalizations and Median Charges by Age and Sex
Injury Hospitalizations and Median Charges by Type of Payor
Injury Hospitalizations and Median Charges by Mechanism/Intent and Sex
0-4 5-14 15-24 25-44 45-64 65 and Older
Male - Total
Male - Median Charges
Female - Total
Female - Median Charges
UnintentionalMotor Vehicle All Poisonings Unintentional Falls
Unintentional Fire/Flame or Hot Object/Substance All Firearm All Other Injuries
Male - Total
Male - Median Charges
Female - Total
Female - Median Charges
Medicare Medicaid Other Government Commercial / Private Blue Cross Uninsured
Total Hospitalizations
Median Charges
All Ages
215 3 7 22 44 68 71
$22,460.05 ND ND $26,666.37 $18,566.00 $26,249.51 $19,114.95
220 4 3 15 28 43 127
$21,347.83 ND ND $13,288.57 $11,544.42 $18,441.82 $23,465.62
Note: Median charges not displayed (ND) for occurrences less than 10.
12230 55 58726
$5,987.63 $21,468.82 $14,443.24 $24,987.71 $23,557.50 ND
52
87
8
26
40
24
115
72
4
6
1
0
$24,167.04
$27,427.88
ND
$32,598.22
$6,209.11
$7,530.76
$24,064.75
$19,462.16
ND
ND
ND
-
Disclaimer: Injury data used in this report were provided to the Pennsylvania Department of Health by the Pennsylvania Health Care Cost Containment Council. The Pennsylvania Health Care Cost Containment Council specifically disclaims responsibility for any interpretations or conclusions. Contents may be republished or reproduced whole or in part, with attribution.
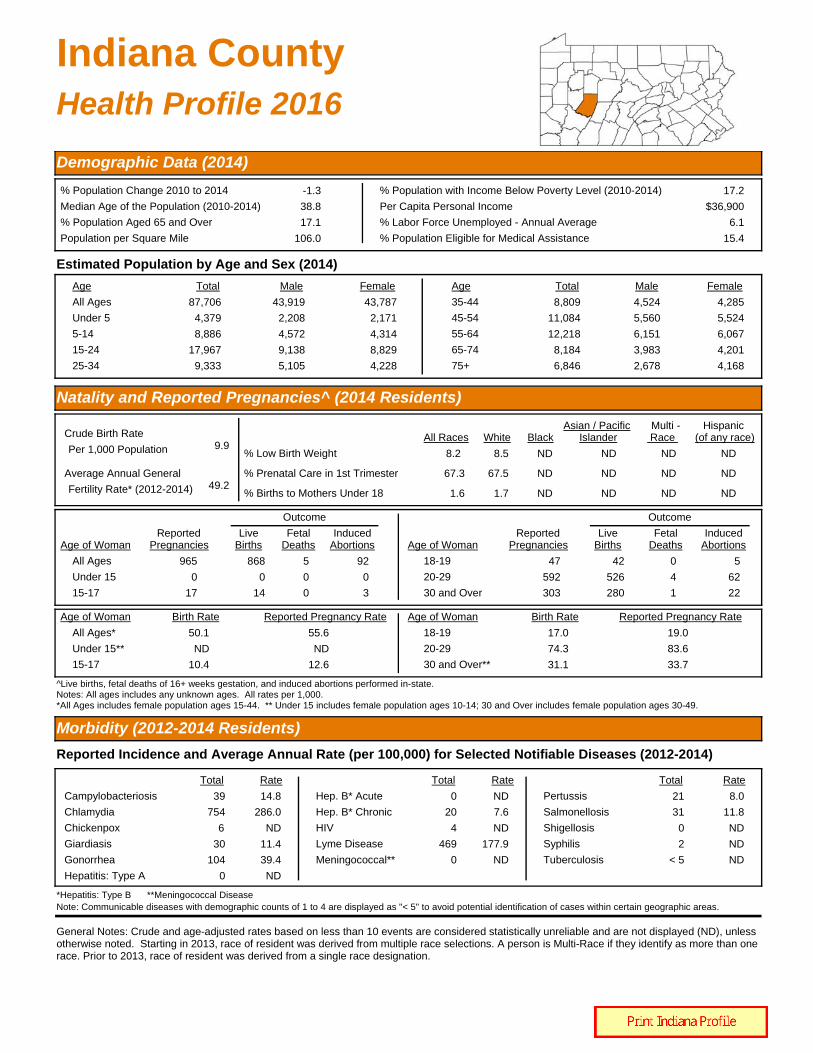
Indiana CountyHealth Profile 2016
Demographic Data (2014)
% Population Change 2010 to 2014 -1.3
Median Age of the Population (2010-2014) 38.8
% Population Aged 65 and Over 17.1
Population per Square Mile 106.0
% Population with Income Below Poverty Level (2010-2014) 17.2
Per Capita Personal Income $36,900
% Labor Force Unemployed - Annual Average 6.1
% Population Eligible for Medical Assistance 15.4
Estimated Population by Age and Sex (2014)
Age Total Male Female Age Total Male Female
All Ages 87,706
Under 5 4,379
5-14 8,886
15-24 17,967
25-34 9,333
43,919
2,208
4,572
9,138
5,105
43,787
2,171
4,314
8,829
4,228
35-44 8,809
45-54 11,084
55-64 12,218
65-74 8,184
75+ 6,846
4,524
5,560
6,151
3,983
2,678
4,285
5,524
6,067
4,201
4,168
Natality and Reported Pregnancies^ (2014 Residents)
Crude Birth Rate9.9
Average Annual General49.2
% Low Birth Weight 8.2
% Prenatal Care in 1st Trimester 67.3
% Births to Mothers Under 18 1.6
8.5
67.5
1.7
ND
ND
ND
Per 1,000 Population
Fertility Rate* (2012-2014)
All Races White Black
All Ages 965
Under 15 0
15-17 17
868
0
14
5
0
0
92
0
3
Age of WomanReported
PregnanciesLive
BirthsFetal
DeathsInduced
Abortions
Outcome
Age of WomanReported
PregnanciesLive
BirthsFetal
DeathsInduced
Abortions
Outcome
18-19 47
20-29 592
30 and Over 303
42
526
280
0
4
1
5
62
22
All Ages* 50.1
Under 15** ND
15-17 10.4
55.6
ND
12.6
Age of Woman Birth Rate Reported Pregnancy Rate Age of Woman Birth Rate Reported Pregnancy Rate
18-19 17.0
20-29 74.3
30 and Over** 31.1
19.0
83.6
33.7
^Live births, fetal deaths of 16+ weeks gestation, and induced abortions performed in-state. Notes: All ages includes any unknown ages. All rates per 1,000.*All Ages includes female population ages 15-44. ** Under 15 includes female population ages 10-14; 30 and Over includes female population ages 30-49.
Hispanic
ND
ND
ND
(of any race)
ND
ND
ND
Asian / Pacific
General Notes: Crude and age-adjusted rates based on less than 10 events are considered statistically unreliable and are not displayed (ND), unless otherwise noted. Starting in 2013, race of resident was derived from multiple race selections. A person is Multi-Race if they identify as more than one race. Prior to 2013, race of resident was derived from a single race designation.
Morbidity (2012-2014 Residents)
Reported Incidence and Average Annual Rate (per 100,000) for Selected Notifiable Diseases (2012-2014)
HIV 4 ND
Syphilis 2 ND
Tuberculosis < 5 ND
Total Rate
Chlamydia 754 286.0
Giardiasis 30 11.4
Gonorrhea 104 39.4
Hepatitis: Type A 0 ND
Total Rate
Lyme Disease 469 177.9
Salmonellosis 31 11.8
Total Rate
Campylobacteriosis 39 14.8 Hep. B* Acute 0 ND
Shigellosis 0 ND
*Hepatitis: Type B **Meningococcal Disease
Meningococcal** 0 ND
Pertussis 21 8.0
Hep. B* Chronic 20 7.6
Chickenpox 6 ND
Islander
Note: Communicable diseases with demographic counts of 1 to 4 are displayed as "< 5" to avoid potential identification of cases within certain geographic areas.
Multi - Race
ND
ND
ND

Indiana County PAGE 2
Mortality (2014 Residents)
Selected Major Causes of Death, Number and Average Annual Age-Adjusted Death Rate* (2012-2014)
Number of Resident Deaths 885
Crude Death Rate per 1,000 10.1
Age-Adjusted Death Rate per 1,000 7.6
Number of Infant Deaths (< 1 Year of Age) 9 9 0 0
AllRaces BlackWhite
Hispanic(any race)
Infant Mortality Rate per 1,000 Live Births ND ND ND ND
Average Annual Infant Mortality Rate (2012-2014) 10.0 10.2 ND ND
Cause Total Rate
Diseases of Heart 618
Cancer 507
Stroke 139
C.L.R.D.** 118
Accidents 158
168.8
147.8
38.2
32.8
58.7
Cause Total Rate
Influenza/Pneumonia 68
Diabetes Mellitus 76
Septicemia 60
Nephritis/Nephrosis 59
Alzheimer's Disease 62
18.6
21.5
16.7
16.4
16.2
* Per 100,000 2000 U.S. standardmillion population. Age-adjusted rates
** Chronic Lower Respiratory Disease
Selected Leading Causes of Death, Number by Age Group (2014)
Under 5 Years of Age 5-24 Years of Age 25-44 Years of Age 45-64 Years of Age 65 Years and Older
Birth Defects 4
Accidents 2
Perinatal Conditions 2
Accidents 3 Accidents 12
Cancer 5
Suicide 3
Diseases of Heart 2
Cancer 37
Diseases of Heart 36
Accidents 9
Diabetes Mellitus 8
Diseases of Heart 171
Cancer 141
C.L.R.D.** 42
Stroke 42
Influenza/Pneumonia 23
TOTAL 10 TOTAL 7 TOTAL 31 TOTAL 142 TOTAL 695
Note: Total includes all other causes.
Asian/PI*
0
ND
*Asian/Pacific Islander ^ NA = Multi-Race data not available before 2013.
are only comparable if the samestandard million population was usedin the calculation.
Invasive Cancer Incidence and Average Annual Age-Adjusted Rates* for Major Sites by Sex
All Sites 717 469.3
Prostate 171 102.7
Lung and Bronchus 102 67.7
Colon and Rectum 77 52.4
Male FemaleTotal Rate Total Rate
Female Breast 177 106.1
653 380.8
89 47.4
58 31.1
*Per 100,000 2000 U.S. standard million population. Age-adjusted rates are only comparable if the same standard million population was used in the calculation.
- -
- -
Male FemaleTotal Rate Total Rate
Non-Hodgkin Lymphoma 30 20.1
Melanoma of the Skin 32 22.7
25 12.7
52 27.8
18 ND
Corpus and Uterus, NOS - -
Urinary Bladder 76
Kidney and Renal Pelvis 35 22.0
50.3 21
17
12.3
ND
Notes: All in situ cases, except for urinary bladder, are excluded. Age-adjusted rates based on less than 20 events are statistically unreliable and are not displayed (ND).
Cancer Incidence (2011-2013 Residents)
Adult Behavioral Health Risk Factors (2012-2014)[Includes: Indiana, Cambria, Somerset, and Armstrong Counties]
General Notes: Crude and age-adjusted rates based on less than 10 events are considered statistically unreliable and are not displayed (ND), unless otherwise noted. Starting in 2013, race of resident was derived from multiple race selections. A person is Multi-Race if they identify as more than one race. Prior to 2013, race of resident was derived from a single race designation.
Percent (CI)Risk Factors
Fair or poor general health:
Obese:
Overweight (includes obese):
No health insurance (ages 18-64):
Visited a doctor in the past 2 yearsfor a routine check-up:
Percent (CI)Risk Factors
Ever told they have diabetes: Currently has asthma:
Current smoker:
Ever tested for HIV (ages 18-64):
Needed to see a doctor but couldnot due to cost in the past year:
21
37
(18 - 24)
(33 - 40)
69 (65 - 72)
13 (11 - 16)
83 (80 - 86)
11 8(9 - 13) (6 - 10)
22 (19 - 25)
25 (22 - 29)
11 (9 - 13)
Notes: Data are based on 2012-2014 annual sample surveys of Pennsylvania adults. CI= 95% Confidence Interval.
Additional state or county/regional data are available at www.statistics.health.pa.gov.
^In situ, benign, and uncertain neoplasms
Multi- Race
0
ND
NAND ^

Indiana County PAGE 3
Hospitals (7/13-6/14)
Total General Acute Care
Psychiatric Rehabilitation
1 1 0 0
General Hospitals
Beds Set Up and Staffed 164
Admissions 7,166
Beds per 1,000 Population 1.9
Admissions per 1,000 Population 81.7
Average Inpatient Occupancy Rate 53.2
Nursing Homes (2014)
Total Number Certified-Medicare Certified-Medicaid
Nursing Homes
Licensed/Approved Beds
5 5 5
487 487 487
32.4
Average Occupancy Rate 88.8
Average Length of Stay (Number of Days) 105.1
$222
Total Licensed/Approved Beds per 1,000 Population Age 65 and Older
Average Semi-Private Daily Room Rate
Drug and Alcohol Treatment
Admissions to Client Primary Diagnosis
Drug Abuse Alcohol Abuse Other*
Percent Admitted
Only Once During 7/13-6/14
1,090 411 306 15 69.1
* Includes family members receiving counseling.
All Licensed Facilities Inpatient Non-Hospital
Inpatient Hospital Partial Hospitalization Outpatient4
1
0 1 3
Note: Each licensed facility may provide more than one type of service.
State-Supported Facilities
Types of Service Provided
Number of
Clients Admitted
732
Admission by County of Residence (7/13-6/14)
Treatment Facilities (as of 6/14)
Correctional Institution 0
General Note: Crude rates based on less than 10 events are considered statistically unreliable and are not displayed (ND), unless otherwise noted.
Services Funding
Other
0
Non-Profit
1
For Profit
0
State
0
Other
0
Ambulatory Surgery Centers (7/13-6/14)
Employees
Part Time Employees 24
Full Time Employees 19
Contracted Employees 7
Payroll Employees 36 Staff with Clinical Privileges 29
Total Surgical Visits per Employee 94.7
Total Facilities 2 Total Surgical Visits 4,072
Percent of Surgical Visits, Age 65+ 37.1
Total Operating Rooms 5 Total Surgical Visits per Operating Room 814.4
Facilities Surgical Visits
Staff Licensed as M.D. 20
Total Employees per Operating Room 8.6
Average Semi-Private Daily Room Rate $759
Total Employees 43

PAGE 4Indiana County
Pennsylvania Health Care Workforce (2013-2014)
Notes: Only health care employees renewing their license in 2013-2014 were surveyed.The "Estimated Number" and "Percent of Workforce Intending to Remain in Profession for 6 or More Years" used to compute each "% Change from Previous Survey Year" are adjusted based on the response rates for the previous and current survey results. The survey results are available every two years. Numbers and percentages pertain to county of employment.Percentages based on less than six responses are considered statistically unreliable and are not displayed (ND).Registered Nurses and Licensed Practical Nurses are not comparable to previous survey period, so some data is not available (DNA).
Licensed Practical Nurses (2014) 253 DNA 78.5% DNA
Physicians (2014) 120
Dentists (2013) 29
Registered Nurses (2012/2013) 739 DNA 81.9% DNA
-6.3% 73.7% 2.4%
-13.0% 64.0% -1.5%
Estimated Number
Percent Changefrom Previous
Survey
Difference in Percent from
Previous Survey
Percent of WorkforceIntending to Remain in
Profession for 6 or More Years
Injury Hospitalizations (2014)
Injury Hospitalizations and Median Charges by Age and Sex
Injury Hospitalizations and Median Charges by Type of Payor
Injury Hospitalizations and Median Charges by Mechanism/Intent and Sex
0-4 5-14 15-24 25-44 45-64 65 and Older
Male - Total
Male - Median Charges
Female - Total
Female - Median Charges
UnintentionalMotor Vehicle All Poisonings Unintentional Falls
Unintentional Fire/Flame or Hot Object/Substance All Firearm All Other Injuries
Male - Total
Male - Median Charges
Female - Total
Female - Median Charges
Medicare Medicaid Other Government Commercial / Private Blue Cross Uninsured
Total Hospitalizations
Median Charges
All Ages
518 12 8 40 76 150 232
$22,091.35 $20,699.88 ND $40,649.35 $20,088.24 $25,470.60 $20,436.06
548 3 2 24 52 116 351
$18,863.18 ND ND $8,075.56 $15,794.63 $19,211.46 $20,185.85
Note: Median charges not displayed (ND) for occurrences less than 10.
18645 124 1161575
$20,494.00 $20,546.48 $15,001.71 $23,007.36 $25,146.44 ND
147
234
25
46
54
41
319
189
3
4
0
4
$19,533.57
$21,571.35
$41,986.00
$43,590.50
$9,241.72
$9,360.12
$21,148.19
$20,761.51
ND
ND
-
ND
Disclaimer: Injury data used in this report were provided to the Pennsylvania Department of Health by the Pennsylvania Health Care Cost Containment Council. The Pennsylvania Health Care Cost Containment Council specifically disclaims responsibility for any interpretations or conclusions. Contents may be republished or reproduced whole or in part, with attribution.
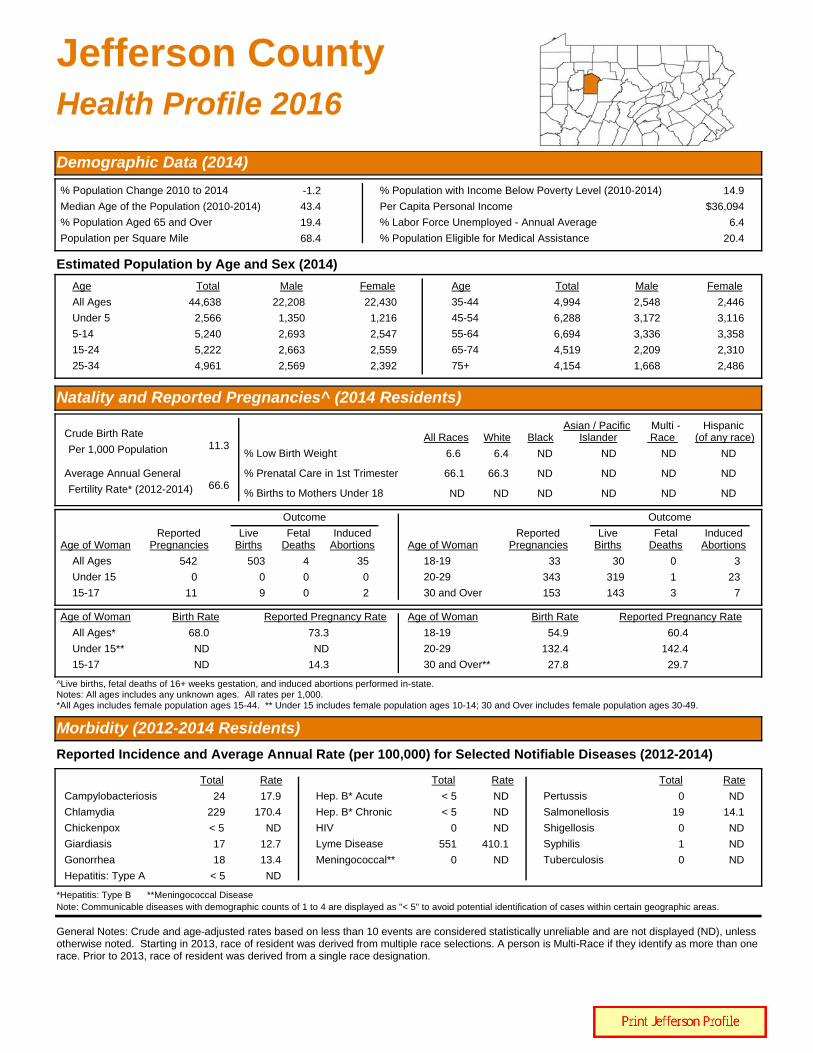
Jefferson CountyHealth Profile 2016
Demographic Data (2014)
% Population Change 2010 to 2014 -1.2
Median Age of the Population (2010-2014) 43.4
% Population Aged 65 and Over 19.4
Population per Square Mile 68.4
% Population with Income Below Poverty Level (2010-2014) 14.9
Per Capita Personal Income $36,094
% Labor Force Unemployed - Annual Average 6.4
% Population Eligible for Medical Assistance 20.4
Estimated Population by Age and Sex (2014)
Age Total Male Female Age Total Male Female
All Ages 44,638
Under 5 2,566
5-14 5,240
15-24 5,222
25-34 4,961
22,208
1,350
2,693
2,663
2,569
22,430
1,216
2,547
2,559
2,392
35-44 4,994
45-54 6,288
55-64 6,694
65-74 4,519
75+ 4,154
2,548
3,172
3,336
2,209
1,668
2,446
3,116
3,358
2,310
2,486
Natality and Reported Pregnancies^ (2014 Residents)
Crude Birth Rate11.3
Average Annual General66.6
% Low Birth Weight 6.6
% Prenatal Care in 1st Trimester 66.1
% Births to Mothers Under 18 ND
6.4
66.3
ND
ND
ND
ND
Per 1,000 Population
Fertility Rate* (2012-2014)
All Races White Black
All Ages 542
Under 15 0
15-17 11
503
0
9
4
0
0
35
0
2
Age of WomanReported
PregnanciesLive
BirthsFetal
DeathsInduced
Abortions
Outcome
Age of WomanReported
PregnanciesLive
BirthsFetal
DeathsInduced
Abortions
Outcome
18-19 33
20-29 343
30 and Over 153
30
319
143
0
1
3
3
23
7
All Ages* 68.0
Under 15** ND
15-17 ND
73.3
ND
14.3
Age of Woman Birth Rate Reported Pregnancy Rate Age of Woman Birth Rate Reported Pregnancy Rate
18-19 54.9
20-29 132.4
30 and Over** 27.8
60.4
142.4
29.7
^Live births, fetal deaths of 16+ weeks gestation, and induced abortions performed in-state. Notes: All ages includes any unknown ages. All rates per 1,000.*All Ages includes female population ages 15-44. ** Under 15 includes female population ages 10-14; 30 and Over includes female population ages 30-49.
Hispanic
ND
ND
ND
(of any race)
ND
ND
ND
Asian / Pacific
General Notes: Crude and age-adjusted rates based on less than 10 events are considered statistically unreliable and are not displayed (ND), unless otherwise noted. Starting in 2013, race of resident was derived from multiple race selections. A person is Multi-Race if they identify as more than one race. Prior to 2013, race of resident was derived from a single race designation.
Morbidity (2012-2014 Residents)
Reported Incidence and Average Annual Rate (per 100,000) for Selected Notifiable Diseases (2012-2014)
HIV 0 ND
Syphilis 1 ND
Tuberculosis 0 ND
Total Rate
Chlamydia 229 170.4
Giardiasis 17 12.7
Gonorrhea 18 13.4
Hepatitis: Type A < 5 ND
Total Rate
Lyme Disease 551 410.1
Salmonellosis 19 14.1
Total Rate
Campylobacteriosis 24 17.9 Hep. B* Acute < 5 ND
Shigellosis 0 ND
*Hepatitis: Type B **Meningococcal Disease
Meningococcal** 0 ND
Pertussis 0 ND
Hep. B* Chronic < 5 ND
Chickenpox < 5 ND
Islander
Note: Communicable diseases with demographic counts of 1 to 4 are displayed as "< 5" to avoid potential identification of cases within certain geographic areas.
Multi - Race
ND
ND
ND

Jefferson County PAGE 2
Mortality (2014 Residents)
Selected Major Causes of Death, Number and Average Annual Age-Adjusted Death Rate* (2012-2014)
Number of Resident Deaths 560
Crude Death Rate per 1,000 12.5
Age-Adjusted Death Rate per 1,000 8.3
Number of Infant Deaths (< 1 Year of Age) 5 5 0 0
AllRaces BlackWhite
Hispanic(any race)
Infant Mortality Rate per 1,000 Live Births ND ND ND ND
Average Annual Infant Mortality Rate (2012-2014) 8.0 8.2 ND ND
Cause Total Rate
Diseases of Heart 408
Cancer 374
Stroke 95
C.L.R.D.** 105
Accidents 70
192.9
188.6
43.5
50.0
47.9
Cause Total Rate
Influenza/Pneumonia 35
Diabetes Mellitus 59
Septicemia 26
Nephritis/Nephrosis 55
Alzheimer's Disease 53
17.4
29.0
12.8
26.1
22.7
* Per 100,000 2000 U.S. standardmillion population. Age-adjusted rates
** Chronic Lower Respiratory Disease
Selected Leading Causes of Death, Number by Age Group (2014)
Under 5 Years of Age 5-24 Years of Age 25-44 Years of Age 45-64 Years of Age 65 Years and Older
Perinatal Conditions 3 Accidents 2
Suicide 2
Accidents 8
Suicide 3
Diseases of Heart 2
Cancer 41
Diseases of Heart 21
Accidents 4
C.L.R.D.** 4
Diseases of Heart 102
Cancer 87
Stroke 29
Alzheimer's Disease 24
C.L.R.D.** 23
TOTAL 5 TOTAL 5 TOTAL 19 TOTAL 97 TOTAL 434
Note: Total includes all other causes.
Asian/PI*
0
ND
*Asian/Pacific Islander ^ NA = Multi-Race data not available before 2013.
are only comparable if the samestandard million population was usedin the calculation.
Invasive Cancer Incidence and Average Annual Age-Adjusted Rates* for Major Sites by Sex
All Sites 514 578.2
Prostate 143 153.8
Lung and Bronchus 76 83.8
Colon and Rectum 51 55.7
Male FemaleTotal Rate Total Rate
Female Breast 95 97.5
409 411.4
50 49.0
42 38.9
*Per 100,000 2000 U.S. standard million population. Age-adjusted rates are only comparable if the same standard million population was used in the calculation.
- -
- -
Male FemaleTotal Rate Total Rate
Non-Hodgkin Lymphoma 18 ND
Melanoma of the Skin 16 ND
12 ND
31 30.9
22 27.8
Corpus and Uterus, NOS - -
Urinary Bladder 39
Kidney and Renal Pelvis 23 26.9
42.8 15
14
ND
ND
Notes: All in situ cases, except for urinary bladder, are excluded. Age-adjusted rates based on less than 20 events are statistically unreliable and are not displayed (ND).
Cancer Incidence (2011-2013 Residents)
Adult Behavioral Health Risk Factors (2012-2014)[Includes: Forest, Elk, Cameron, Clearfield, Jefferson, Clarion, McKean, and Warren Counties]
General Notes: Crude and age-adjusted rates based on less than 10 events are considered statistically unreliable and are not displayed (ND), unless otherwise noted. Starting in 2013, race of resident was derived from multiple race selections. A person is Multi-Race if they identify as more than one race. Prior to 2013, race of resident was derived from a single race designation.
Percent (CI)Risk Factors
Fair or poor general health:
Obese:
Overweight (includes obese):
No health insurance (ages 18-64):
Visited a doctor in the past 2 yearsfor a routine check-up:
Percent (CI)Risk Factors
Ever told they have diabetes: Currently has asthma:
Current smoker:
Ever tested for HIV (ages 18-64):
Needed to see a doctor but couldnot due to cost in the past year:
20
33
(17 - 22)
(30 - 36)
69 (66 - 72)
15 (12 - 18)
84 (81 - 86)
12 11(10 - 14) (9 - 13)
23 (21 - 26)
29 (26 - 33)
10 (8 - 12)
Notes: Data are based on 2012-2014 annual sample surveys of Pennsylvania adults. CI= 95% Confidence Interval.
Additional state or county/regional data are available at www.statistics.health.pa.gov.
^In situ, benign, and uncertain neoplasms
Multi- Race
0
ND
NAND ^

Jefferson County PAGE 3
Hospitals (7/13-6/14)
Total General Acute Care
Psychiatric Rehabilitation
2 2 0 0
General Hospitals
Beds Set Up and Staffed 79
Admissions 2,450
Beds per 1,000 Population 1.8
Admissions per 1,000 Population 54.9
Average Inpatient Occupancy Rate 37.1
Nursing Homes (2014)
Total Number Certified-Medicare Certified-Medicaid
Nursing Homes
Licensed/Approved Beds
4 4 4
375 375 375
43.2
Average Occupancy Rate 88.9
Average Length of Stay (Number of Days) 165.0
$211
Total Licensed/Approved Beds per 1,000 Population Age 65 and Older
Average Semi-Private Daily Room Rate
Drug and Alcohol Treatment
Admissions to Client Primary Diagnosis
Drug Abuse Alcohol Abuse Other*
Percent Admitted
Only Once During 7/13-6/14
257 132 59 2 71.0
* Includes family members receiving counseling.
All Licensed Facilities Inpatient Non-Hospital
Inpatient Hospital Partial Hospitalization Outpatient1
0
0 0 1
Note: Each licensed facility may provide more than one type of service.
State-Supported Facilities
Types of Service Provided
Number of
Clients Admitted
193
Admission by County of Residence (7/13-6/14)
Treatment Facilities (as of 6/14)
Correctional Institution 0
General Note: Crude rates based on less than 10 events are considered statistically unreliable and are not displayed (ND), unless otherwise noted.
Services Funding
Other
0
Non-Profit
2
For Profit
0
State
0
Other
0
Ambulatory Surgery Centers (7/13-6/14)
Employees
Part Time Employees 25
Full Time Employees 10
Contracted Employees 13
Payroll Employees 22 Staff with Clinical Privileges 4
Total Surgical Visits per Employee 90.1
Total Facilities 1 Total Surgical Visits 3,155
Percent of Surgical Visits, Age 65+ 75.2
Total Operating Rooms 2 Total Surgical Visits per Operating Room 1,577.5
Facilities Surgical Visits
Staff Licensed as M.D. 3
Total Employees per Operating Room 17.5
Average Semi-Private Daily Room Rate $562
Total Employees 35

PAGE 4Jefferson County
Pennsylvania Health Care Workforce (2013-2014)
Notes: Only health care employees renewing their license in 2013-2014 were surveyed.The "Estimated Number" and "Percent of Workforce Intending to Remain in Profession for 6 or More Years" used to compute each "% Change from Previous Survey Year" are adjusted based on the response rates for the previous and current survey results. The survey results are available every two years. Numbers and percentages pertain to county of employment.Percentages based on less than six responses are considered statistically unreliable and are not displayed (ND).Registered Nurses and Licensed Practical Nurses are not comparable to previous survey period, so some data is not available (DNA).
Licensed Practical Nurses (2014) 216 DNA 79.1% DNA
Physicians (2014) 56
Dentists (2013) 15
Registered Nurses (2012/2013) 388 DNA 81.6% DNA
-8.9% 58.7% -12.2%
6.6% 53.8% -29.5%
Estimated Number
Percent Changefrom Previous
Survey
Difference in Percent from
Previous Survey
Percent of WorkforceIntending to Remain in
Profession for 6 or More Years
Injury Hospitalizations (2014)
Injury Hospitalizations and Median Charges by Age and Sex
Injury Hospitalizations and Median Charges by Type of Payor
Injury Hospitalizations and Median Charges by Mechanism/Intent and Sex
0-4 5-14 15-24 25-44 45-64 65 and Older
Male - Total
Male - Median Charges
Female - Total
Female - Median Charges
UnintentionalMotor Vehicle All Poisonings Unintentional Falls
Unintentional Fire/Flame or Hot Object/Substance All Firearm All Other Injuries
Male - Total
Male - Median Charges
Female - Total
Female - Median Charges
Medicare Medicaid Other Government Commercial / Private Blue Cross Uninsured
Total Hospitalizations
Median Charges
All Ages
289 3 5 26 48 85 122
$27,302.38 ND ND $40,277.13 $25,708.13 $39,772.20 $22,559.55
263 4 3 16 21 57 162
$20,292.60 ND ND $21,621.40 $20,055.68 $25,159.71 $19,292.61
Note: Median charges not displayed (ND) for occurrences less than 10.
21307 60 561003
$29,187.44 $21,240.71 $20,277.50 $20,045.33 $29,803.33 ND
85
136
22
33
20
16
135
97
0
3
1
4
$15,618.00
$20,585.40
$39,517.84
$60,618.38
$13,317.90
$14,878.20
$18,727.15
$34,042.00
-
ND
ND
ND
Disclaimer: Injury data used in this report were provided to the Pennsylvania Department of Health by the Pennsylvania Health Care Cost Containment Council. The Pennsylvania Health Care Cost Containment Council specifically disclaims responsibility for any interpretations or conclusions. Contents may be republished or reproduced whole or in part, with attribution.

Juniata CountyHealth Profile 2016
Demographic Data (2014)
% Population Change 2010 to 2014 0.6
Median Age of the Population (2010-2014) 42.4
% Population Aged 65 and Over 19.8
Population per Square Mile 63.4
% Population with Income Below Poverty Level (2010-2014) 12.4
Per Capita Personal Income $36,607
% Labor Force Unemployed - Annual Average 5.6
% Population Eligible for Medical Assistance 14.0
Estimated Population by Age and Sex (2014)
Age Total Male Female Age Total Male Female
All Ages 24,796
Under 5 1,365
5-14 3,235
15-24 2,803
25-34 2,705
12,369
686
1,678
1,417
1,376
12,427
679
1,557
1,386
1,329
35-44 2,907
45-54 3,493
55-64 3,370
65-74 2,654
75+ 2,264
1,480
1,784
1,691
1,332
925
1,427
1,709
1,679
1,322
1,339
Natality and Reported Pregnancies^ (2014 Residents)
Crude Birth Rate11.1
Average Annual General64.6
% Low Birth Weight 6.5
% Prenatal Care in 1st Trimester 63.6
% Births to Mothers Under 18 ND
6.9
62.5
ND
ND
ND
ND
Per 1,000 Population
Fertility Rate* (2012-2014)
All Races White Black
All Ages 290
Under 15 0
15-17 4
275
0
4
2
0
0
13
0
0
Age of WomanReported
PregnanciesLive
BirthsFetal
DeathsInduced
Abortions
Outcome
Age of WomanReported
PregnanciesLive
BirthsFetal
DeathsInduced
Abortions
Outcome
18-19 13
20-29 170
30 and Over 103
12
158
101
0
2
0
1
10
2
All Ages* 66.4
Under 15** ND
15-17 ND
70.0
ND
ND
Age of Woman Birth Rate Reported Pregnancy Rate Age of Woman Birth Rate Reported Pregnancy Rate
18-19 44.9
20-29 118.6
30 and Over** 35.0
48.7
127.6
35.7
^Live births, fetal deaths of 16+ weeks gestation, and induced abortions performed in-state. Notes: All ages includes any unknown ages. All rates per 1,000.*All Ages includes female population ages 15-44. ** Under 15 includes female population ages 10-14; 30 and Over includes female population ages 30-49.
Hispanic
ND
76.9
ND
(of any race)
ND
ND
ND
Asian / Pacific
General Notes: Crude and age-adjusted rates based on less than 10 events are considered statistically unreliable and are not displayed (ND), unless otherwise noted. Starting in 2013, race of resident was derived from multiple race selections. A person is Multi-Race if they identify as more than one race. Prior to 2013, race of resident was derived from a single race designation.
Morbidity (2012-2014 Residents)
Reported Incidence and Average Annual Rate (per 100,000) for Selected Notifiable Diseases (2012-2014)
HIV 1 ND
Syphilis 0 ND
Tuberculosis < 5 ND
Total Rate
Chlamydia 92 123.5
Giardiasis 6 ND
Gonorrhea 13 17.5
Hepatitis: Type A 0 ND
Total Rate
Lyme Disease 92 123.5
Salmonellosis 20 26.9
Total Rate
Campylobacteriosis 33 44.3 Hep. B* Acute 0 ND
Shigellosis 0 ND
*Hepatitis: Type B **Meningococcal Disease
Meningococcal** 0 ND
Pertussis 5 ND
Hep. B* Chronic 5 ND
Chickenpox 0 ND
Islander
Note: Communicable diseases with demographic counts of 1 to 4 are displayed as "< 5" to avoid potential identification of cases within certain geographic areas.
Multi - Race
ND
ND
ND

Juniata County PAGE 2
Mortality (2014 Residents)
Selected Major Causes of Death, Number and Average Annual Age-Adjusted Death Rate* (2012-2014)
Number of Resident Deaths 242
Crude Death Rate per 1,000 9.8
Age-Adjusted Death Rate per 1,000 6.7
Number of Infant Deaths (< 1 Year of Age) 2 2 0 0
AllRaces BlackWhite
Hispanic(any race)
Infant Mortality Rate per 1,000 Live Births ND ND ND ND
Average Annual Infant Mortality Rate (2012-2014) 13.7 ND ND ND
Cause Total Rate
Diseases of Heart 177
Cancer 178
Stroke 30
C.L.R.D.** 61
Accidents 43
159.2
163.4
27.4
51.8
51.4
Cause Total Rate
Influenza/Pneumonia 13
Diabetes Mellitus 26
Septicemia 6
Nephritis/Nephrosis 10
Alzheimer's Disease 22
11.4
22.9
ND
8.7
18.6
* Per 100,000 2000 U.S. standardmillion population. Age-adjusted rates
** Chronic Lower Respiratory Disease
Selected Leading Causes of Death, Number by Age Group (2014)
Under 5 Years of Age 5-24 Years of Age 25-44 Years of Age 45-64 Years of Age 65 Years and Older
Perinatal Conditions 2 Accidents 6
Diseases of Heart 2
Cancer 16
Diabetes Mellitus 5
Diseases of Heart 5
C.L.R.D.** 4
Accidents 3
Cancer 52
Diseases of Heart 47
Stroke 11
C.L.R.D.** 10
TOTAL 2 TOTAL 1 TOTAL 11 TOTAL 37 TOTAL 191
Note: Total includes all other causes.
Asian/PI*
0
ND
*Asian/Pacific Islander ^ NA = Multi-Race data not available before 2013.
are only comparable if the samestandard million population was usedin the calculation.
Invasive Cancer Incidence and Average Annual Age-Adjusted Rates* for Major Sites by Sex
All Sites 214 467.3
Prostate 28 55.6
Lung and Bronchus 38 79.3
Colon and Rectum 21 45.2
Male FemaleTotal Rate Total Rate
Female Breast 53 107.1
214 434.5
19 ND
11 ND
*Per 100,000 2000 U.S. standard million population. Age-adjusted rates are only comparable if the same standard million population was used in the calculation.
- -
- -
Male FemaleTotal Rate Total Rate
Non-Hodgkin Lymphoma 14 ND
Melanoma of the Skin 16 ND
8 ND
25 49.3
15 ND
Corpus and Uterus, NOS - -
Urinary Bladder 24
Kidney and Renal Pelvis 11 ND
51.6 7
6
ND
ND
Notes: All in situ cases, except for urinary bladder, are excluded. Age-adjusted rates based on less than 20 events are statistically unreliable and are not displayed (ND).
Cancer Incidence (2011-2013 Residents)
Adult Behavioral Health Risk Factors (2012-2014)[Includes: Bedford, Blair, Huntingdon, Juniata, and Mifflin Counties]
General Notes: Crude and age-adjusted rates based on less than 10 events are considered statistically unreliable and are not displayed (ND), unless otherwise noted. Starting in 2013, race of resident was derived from multiple race selections. A person is Multi-Race if they identify as more than one race. Prior to 2013, race of resident was derived from a single race designation.
Percent (CI)Risk Factors
Fair or poor general health:
Obese:
Overweight (includes obese):
No health insurance (ages 18-64):
Visited a doctor in the past 2 yearsfor a routine check-up:
Percent (CI)Risk Factors
Ever told they have diabetes: Currently has asthma:
Current smoker:
Ever tested for HIV (ages 18-64):
Needed to see a doctor but couldnot due to cost in the past year:
20
35
(17 - 23)
(31 - 39)
68 (64 - 72)
18 (14 - 22)
82 (79 - 85)
12 12(10 - 15) (9 - 14)
24 (21 - 28)
34 (29 - 38)
12 (9 - 15)
Notes: Data are based on 2012-2014 annual sample surveys of Pennsylvania adults. CI= 95% Confidence Interval.
Additional state or county/regional data are available at www.statistics.health.pa.gov.
^In situ, benign, and uncertain neoplasms
Multi- Race
0
ND
NAND ^

Juniata County PAGE 3
Hospitals (7/13-6/14)
Total General Acute Care
Psychiatric Rehabilitation
0 0 0 0
General Hospitals
Beds Set Up and Staffed -
Admissions -
Beds per 1,000 Population -
Admissions per 1,000 Population -
Average Inpatient Occupancy Rate -
Nursing Homes (2014)
Total Number Certified-Medicare Certified-Medicaid
Nursing Homes
Licensed/Approved Beds
3 3 3
229 229 229
46.6
Average Occupancy Rate 91.6
Average Length of Stay (Number of Days) 157.4
$247
Total Licensed/Approved Beds per 1,000 Population Age 65 and Older
Average Semi-Private Daily Room Rate
Drug and Alcohol Treatment
Admissions to Client Primary Diagnosis
Drug Abuse Alcohol Abuse Other*
Percent Admitted
Only Once During 7/13-6/14
31 10 3 14 88.9
* Includes family members receiving counseling.
All Licensed Facilities Inpatient Non-Hospital
Inpatient Hospital Partial Hospitalization Outpatient1
0
0 0 1
Note: Each licensed facility may provide more than one type of service.
State-Supported Facilities
Types of Service Provided
Number of
Clients Admitted
27
Admission by County of Residence (7/13-6/14)
Treatment Facilities (as of 6/14)
Correctional Institution 0
General Note: Crude rates based on less than 10 events are considered statistically unreliable and are not displayed (ND), unless otherwise noted.
Services Funding
Other
0
Non-Profit
0
For Profit
0
State
0
Other
0
Ambulatory Surgery Centers (7/13-6/14)
Employees
Part Time Employees -
Full Time Employees -
Contracted Employees -
Payroll Employees - Staff with Clinical Privileges -
Total Surgical Visits per Employee -
Total Facilities 0 Total Surgical Visits -
Percent of Surgical Visits, Age 65+ -
Total Operating Rooms - Total Surgical Visits per Operating Room -
Facilities Surgical Visits
Staff Licensed as M.D. -
Total Employees per Operating Room -
Average Semi-Private Daily Room Rate -
Total Employees -

PAGE 4Juniata County
Pennsylvania Health Care Workforce (2013-2014)
Notes: Only health care employees renewing their license in 2013-2014 were surveyed.The "Estimated Number" and "Percent of Workforce Intending to Remain in Profession for 6 or More Years" used to compute each "% Change from Previous Survey Year" are adjusted based on the response rates for the previous and current survey results. The survey results are available every two years. Numbers and percentages pertain to county of employment.Percentages based on less than six responses are considered statistically unreliable and are not displayed (ND).Registered Nurses and Licensed Practical Nurses are not comparable to previous survey period, so some data is not available (DNA).
Licensed Practical Nurses (2014) 70 DNA 82.5% DNA
Physicians (2014) 12
Dentists (2013) ND
Registered Nurses (2012/2013) 52 DNA 70.2% DNA
-1.0% 80.0% 16.4%
ND ND ND
Estimated Number
Percent Changefrom Previous
Survey
Difference in Percent from
Previous Survey
Percent of WorkforceIntending to Remain in
Profession for 6 or More Years
Injury Hospitalizations (2014)
Injury Hospitalizations and Median Charges by Age and Sex
Injury Hospitalizations and Median Charges by Type of Payor
Injury Hospitalizations and Median Charges by Mechanism/Intent and Sex
0-4 5-14 15-24 25-44 45-64 65 and Older
Male - Total
Male - Median Charges
Female - Total
Female - Median Charges
UnintentionalMotor Vehicle All Poisonings Unintentional Falls
Unintentional Fire/Flame or Hot Object/Substance All Firearm All Other Injuries
Male - Total
Male - Median Charges
Female - Total
Female - Median Charges
Medicare Medicaid Other Government Commercial / Private Blue Cross Uninsured
Total Hospitalizations
Median Charges
All Ages
106 1 1 8 20 22 54
$26,342.81 ND ND ND $30,259.38 $33,420.96 $20,900.27
99 1 1 4 11 22 60
$27,135.44 ND ND ND $68,628.26 $27,271.31 $27,109.45
Note: Median charges not displayed (ND) for occurrences less than 10.
4120 21 33270
ND $23,962.10 $18,165.46 $35,966.85 $68,628.26 -
25
36
7
16
10
7
56
46
1
1
0
0
$31,653.96
$34,190.51
ND
$78,086.08
$9,789.10
ND
$25,658.30
$18,523.21
ND
ND
-
-
Disclaimer: Injury data used in this report were provided to the Pennsylvania Department of Health by the Pennsylvania Health Care Cost Containment Council. The Pennsylvania Health Care Cost Containment Council specifically disclaims responsibility for any interpretations or conclusions. Contents may be republished or reproduced whole or in part, with attribution.

Lackawanna CountyHealth Profile 2016
Demographic Data (2014)
% Population Change 2010 to 2014 -0.8
Median Age of the Population (2010-2014) 42.3
% Population Aged 65 and Over 18.8
Population per Square Mile 463.4
% Population with Income Below Poverty Level (2010-2014) 14.2
Per Capita Personal Income $41,187
% Labor Force Unemployed - Annual Average 6.6
% Population Eligible for Medical Assistance 19.7
Estimated Population by Age and Sex (2014)
Age Total Male Female Age Total Male Female
All Ages 212,719
Under 5 11,093
5-14 23,922
15-24 27,870
25-34 26,216
102,785
5,606
12,281
13,907
13,209
109,934
5,487
11,641
13,963
13,007
35-44 24,243
45-54 29,533
55-64 29,935
65-74 20,998
75+ 18,909
12,013
14,485
14,609
9,839
6,836
12,230
15,048
15,326
11,159
12,073
Natality and Reported Pregnancies^ (2014 Residents)
Crude Birth Rate10.4
Average Annual General54.8
% Low Birth Weight 9.1
% Prenatal Care in 1st Trimester 72.7
% Births to Mothers Under 18 1.5
8.7
76.1
1.0
14.1
48.1
ND
Per 1,000 Population
Fertility Rate* (2012-2014)
All Races White Black
All Ages 2,506
Under 15 4
15-17 42
2,209
2
31
11
0
2
286
2
9
Age of WomanReported
PregnanciesLive
BirthsFetal
DeathsInduced
Abortions
Outcome
Age of WomanReported
PregnanciesLive
BirthsFetal
DeathsInduced
Abortions
Outcome
18-19 117
20-29 1,274
30 and Over 1,063
91
1,099
980
2
5
2
24
170
81
All Ages* 56.4
Under 15** ND
15-17 8.7
63.9
ND
11.7
Age of Woman Birth Rate Reported Pregnancy Rate Age of Woman Birth Rate Reported Pregnancy Rate
18-19 28.6
20-29 78.5
30 and Over** 38.4
36.7
91.0
41.7
^Live births, fetal deaths of 16+ weeks gestation, and induced abortions performed in-state. Notes: All ages includes any unknown ages. All rates per 1,000.*All Ages includes female population ages 15-44. ** Under 15 includes female population ages 10-14; 30 and Over includes female population ages 30-49.
Hispanic
13.6
62.1
ND
(of any race)
ND
55.3
ND
Asian / Pacific
General Notes: Crude and age-adjusted rates based on less than 10 events are considered statistically unreliable and are not displayed (ND), unless otherwise noted. Starting in 2013, race of resident was derived from multiple race selections. A person is Multi-Race if they identify as more than one race. Prior to 2013, race of resident was derived from a single race designation.
Morbidity (2012-2014 Residents)
Reported Incidence and Average Annual Rate (per 100,000) for Selected Notifiable Diseases (2012-2014)
HIV 37 5.8
Syphilis 3 ND
Tuberculosis 9 ND
Total Rate
Chlamydia 1,085 169.2
Giardiasis 26 4.1
Gonorrhea 174 27.1
Hepatitis: Type A 0 ND
Total Rate
Lyme Disease 171 26.7
Salmonellosis 52 8.1
Total Rate
Campylobacteriosis 74 11.5 Hep. B* Acute < 5 ND
Shigellosis 6 ND
*Hepatitis: Type B **Meningococcal Disease
Meningococcal** < 5 ND
Pertussis 11 1.7
Hep. B* Chronic 73 11.4
Chickenpox 7 ND
Islander
Note: Communicable diseases with demographic counts of 1 to 4 are displayed as "< 5" to avoid potential identification of cases within certain geographic areas.
Multi - Race
ND
65.9
ND

Lackawanna County PAGE 2
Mortality (2014 Residents)
Selected Major Causes of Death, Number and Average Annual Age-Adjusted Death Rate* (2012-2014)
Number of Resident Deaths 2,614
Crude Death Rate per 1,000 12.3
Age-Adjusted Death Rate per 1,000 8.3
Number of Infant Deaths (< 1 Year of Age) 16 12 3 1
AllRaces BlackWhite
Hispanic(any race)
Infant Mortality Rate per 1,000 Live Births 7.2 6.7 ND ND
Average Annual Infant Mortality Rate (2012-2014) 6.6 5.7 ND ND
Cause Total Rate
Diseases of Heart 2,225
Cancer 1,637
Stroke 352
C.L.R.D.** 406
Accidents 329
219.0
178.5
34.1
42.7
47.6
Cause Total Rate
Influenza/Pneumonia 157
Diabetes Mellitus 252
Septicemia 173
Nephritis/Nephrosis 214
Alzheimer's Disease 231
15.1
27.3
17.7
20.9
20.9
* Per 100,000 2000 U.S. standardmillion population. Age-adjusted rates
** Chronic Lower Respiratory Disease
Selected Leading Causes of Death, Number by Age Group (2014)
Under 5 Years of Age 5-24 Years of Age 25-44 Years of Age 45-64 Years of Age 65 Years and Older
Perinatal Conditions 6
Birth Defects 5
Accidents 2
Accidents 9
Cancer 2
Accidents 30
Cancer 15
Diseases of Heart 10
Suicide 9
Diabetes Mellitus 5
Cancer 135
Diseases of Heart 83
Accidents 25
Diabetes Mellitus 22
Suicide 20
Diseases of Heart 619
Cancer 386
C.L.R.D.** 116
Stroke 95
Alzheimer's Disease 72
TOTAL 18 TOTAL 18 TOTAL 91 TOTAL 434 TOTAL 2,053
Note: Total includes all other causes.
Asian/PI*
0
ND
*Asian/Pacific Islander ^ NA = Multi-Race data not available before 2013.
are only comparable if the samestandard million population was usedin the calculation.
Invasive Cancer Incidence and Average Annual Age-Adjusted Rates* for Major Sites by Sex
All Sites 2,088 535.3
Prostate 456 109.0
Lung and Bronchus 352 89.8
Colon and Rectum 192 49.8
Male FemaleTotal Rate Total Rate
Female Breast 551 125.1
2,040 448.3
258 54.8
190 38.4
*Per 100,000 2000 U.S. standard million population. Age-adjusted rates are only comparable if the same standard million population was used in the calculation.
- -
- -
Male FemaleTotal Rate Total Rate
Non-Hodgkin Lymphoma 79 20.4
Melanoma of the Skin 77 21.1
66 13.4
164 34.6
58 13.3
Corpus and Uterus, NOS - -
Urinary Bladder 186
Kidney and Renal Pelvis 83 21.5
48.3 55
50
10.6
10.8
Notes: All in situ cases, except for urinary bladder, are excluded. Age-adjusted rates based on less than 20 events are statistically unreliable and are not displayed (ND).
Cancer Incidence (2011-2013 Residents)
Adult Behavioral Health Risk Factors (2012-2014)[Includes: Lackawanna, Luzerne, and Wyoming Counties]
General Notes: Crude and age-adjusted rates based on less than 10 events are considered statistically unreliable and are not displayed (ND), unless otherwise noted. Starting in 2013, race of resident was derived from multiple race selections. A person is Multi-Race if they identify as more than one race. Prior to 2013, race of resident was derived from a single race designation.
Percent (CI)Risk Factors
Fair or poor general health:
Obese:
Overweight (includes obese):
No health insurance (ages 18-64):
Visited a doctor in the past 2 yearsfor a routine check-up:
Percent (CI)Risk Factors
Ever told they have diabetes: Currently has asthma:
Current smoker:
Ever tested for HIV (ages 18-64):
Needed to see a doctor but couldnot due to cost in the past year:
18
31
(16 - 20)
(28 - 34)
67 (63 - 70)
16 (13 - 20)
86 (83 - 89)
11 10(9 - 13) (8 - 12)
24 (21 - 27)
35 (31 - 39)
14 (11 - 17)
Notes: Data are based on 2012-2014 annual sample surveys of Pennsylvania adults. CI= 95% Confidence Interval.
Additional state or county/regional data are available at www.statistics.health.pa.gov.
^In situ, benign, and uncertain neoplasms
Multi- Race
0
ND
NAND ^

Lackawanna County PAGE 3
Hospitals (7/13-6/14)
Total General Acute Care
Psychiatric Rehabilitation
5 3 1 1
General Hospitals
Beds Set Up and Staffed 676
Admissions 30,393
Beds per 1,000 Population 3.2
Admissions per 1,000 Population 142.9
Average Inpatient Occupancy Rate 57.9
Nursing Homes (2014)
Total Number Certified-Medicare Certified-Medicaid
Nursing Homes
Licensed/Approved Beds
19 19 17
2,423 2,423 2,346
60.7
Average Occupancy Rate 91.1
Average Length of Stay (Number of Days) 148.2
$281
Total Licensed/Approved Beds per 1,000 Population Age 65 and Older
Average Semi-Private Daily Room Rate
Drug and Alcohol Treatment
Admissions to Client Primary Diagnosis
Drug Abuse Alcohol Abuse Other*
Percent Admitted
Only Once During 7/13-6/14
1,364 602 424 13 78.4
* Includes family members receiving counseling.
All Licensed Facilities Inpatient Non-Hospital
Inpatient Hospital Partial Hospitalization Outpatient9
2
0 3 8
Note: Each licensed facility may provide more than one type of service.
State-Supported Facilities
Types of Service Provided
Number of
Clients Admitted
1,039
Admission by County of Residence (7/13-6/14)
Treatment Facilities (as of 6/14)
Correctional Institution 0
General Note: Crude rates based on less than 10 events are considered statistically unreliable and are not displayed (ND), unless otherwise noted.
Services Funding
Other
0
Non-Profit
2
For Profit
2
State
1
Other
0
Ambulatory Surgery Centers (7/13-6/14)
Employees
Part Time Employees 74
Full Time Employees 82
Contracted Employees 19
Payroll Employees 137 Staff with Clinical Privileges 157
Total Surgical Visits per Employee 184.0
Total Facilities 6 Total Surgical Visits 28,699
Percent of Surgical Visits, Age 65+ 44.1
Total Operating Rooms 17 Total Surgical Visits per Operating Room 1,688.2
Facilities Surgical Visits
Staff Licensed as M.D. 91
Total Employees per Operating Room 9.2
Average Semi-Private Daily Room Rate $1,938
Total Employees 156
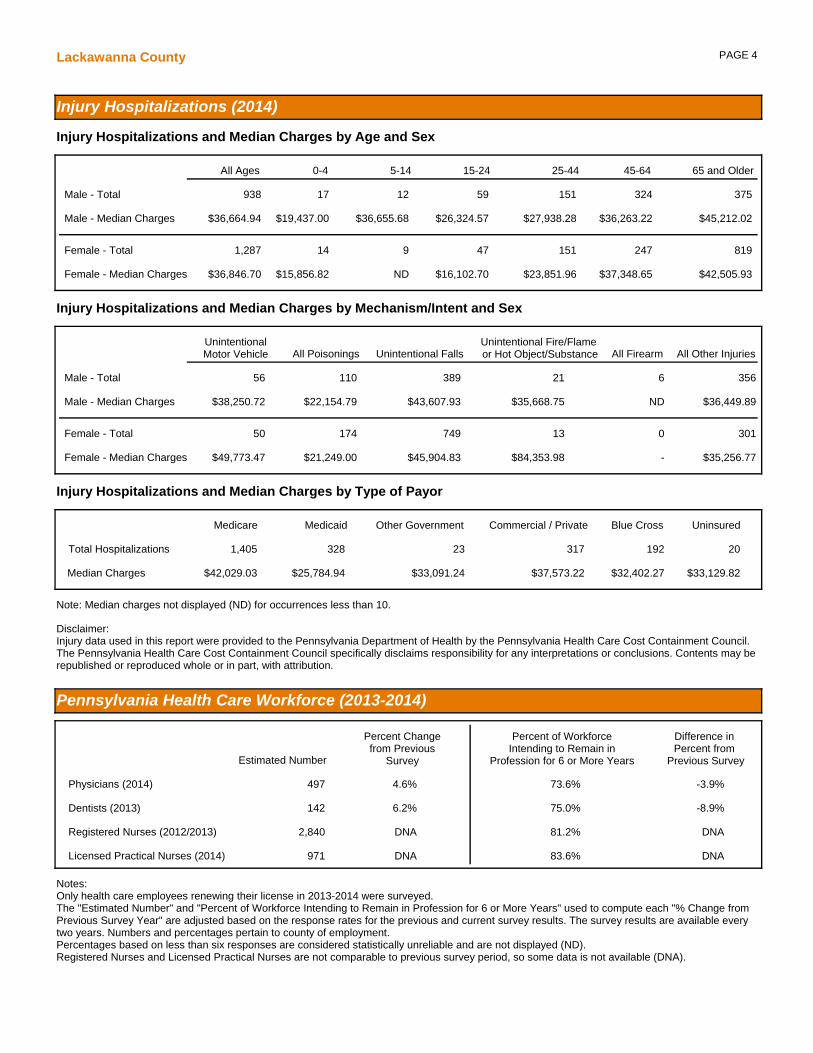
PAGE 4Lackawanna County
Pennsylvania Health Care Workforce (2013-2014)
Notes: Only health care employees renewing their license in 2013-2014 were surveyed.The "Estimated Number" and "Percent of Workforce Intending to Remain in Profession for 6 or More Years" used to compute each "% Change from Previous Survey Year" are adjusted based on the response rates for the previous and current survey results. The survey results are available every two years. Numbers and percentages pertain to county of employment.Percentages based on less than six responses are considered statistically unreliable and are not displayed (ND).Registered Nurses and Licensed Practical Nurses are not comparable to previous survey period, so some data is not available (DNA).
Licensed Practical Nurses (2014) 971 DNA 83.6% DNA
Physicians (2014) 497
Dentists (2013) 142
Registered Nurses (2012/2013) 2,840 DNA 81.2% DNA
4.6% 73.6% -3.9%
6.2% 75.0% -8.9%
Estimated Number
Percent Changefrom Previous
Survey
Difference in Percent from
Previous Survey
Percent of WorkforceIntending to Remain in
Profession for 6 or More Years
Injury Hospitalizations (2014)
Injury Hospitalizations and Median Charges by Age and Sex
Injury Hospitalizations and Median Charges by Type of Payor
Injury Hospitalizations and Median Charges by Mechanism/Intent and Sex
0-4 5-14 15-24 25-44 45-64 65 and Older
Male - Total
Male - Median Charges
Female - Total
Female - Median Charges
UnintentionalMotor Vehicle All Poisonings Unintentional Falls
Unintentional Fire/Flame or Hot Object/Substance All Firearm All Other Injuries
Male - Total
Male - Median Charges
Female - Total
Female - Median Charges
Medicare Medicaid Other Government Commercial / Private Blue Cross Uninsured
Total Hospitalizations
Median Charges
All Ages
938 17 12 59 151 324 375
$36,664.94 $19,437.00 $36,655.68 $26,324.57 $27,938.28 $36,263.22 $45,212.02
1,287 14 9 47 151 247 819
$36,846.70 $15,856.82 ND $16,102.70 $23,851.96 $37,348.65 $42,505.93
Note: Median charges not displayed (ND) for occurrences less than 10.
201,405 328 19231723
$33,129.82 $42,029.03 $25,784.94 $32,402.27 $37,573.22 $33,091.24
301
356
50
56
174
110
749
389
13
21
0
6
$35,256.77
$36,449.89
$49,773.47
$38,250.72
$21,249.00
$22,154.79
$45,904.83
$43,607.93
$84,353.98
$35,668.75
-
ND
Disclaimer: Injury data used in this report were provided to the Pennsylvania Department of Health by the Pennsylvania Health Care Cost Containment Council. The Pennsylvania Health Care Cost Containment Council specifically disclaims responsibility for any interpretations or conclusions. Contents may be republished or reproduced whole or in part, with attribution.

Lancaster CountyHealth Profile 2016
Demographic Data (2014)
% Population Change 2010 to 2014 2.7
Median Age of the Population (2010-2014) 38.3
% Population Aged 65 and Over 16.4
Population per Square Mile 565.1
% Population with Income Below Poverty Level (2010-2014) 10.6
Per Capita Personal Income $41,712
% Labor Force Unemployed - Annual Average 4.6
% Population Eligible for Medical Assistance 14.1
Estimated Population by Age and Sex (2014)
Age Total Male Female Age Total Male Female
All Ages 533,320
Under 5 35,061
5-14 71,913
15-24 71,614
25-34 67,464
260,847
18,032
36,711
36,075
33,592
272,473
17,029
35,202
35,539
33,872
35-44 61,113
45-54 70,758
55-64 68,012
65-74 45,942
75+ 41,443
30,214
34,686
33,003
21,711
16,823
30,899
36,072
35,009
24,231
24,620
Estimated Population by Hispanic Origin (2014)
Hispanic (any race) 52,299
Natality and Reported Pregnancies^ (2014 Residents)
Crude Birth Rate13.5
Average Annual General70.9
% Low Birth Weight 7.3
% Prenatal Care in 1st Trimester 61.8
% Births to Mothers Under 18 1.3
6.6
61.5
0.7
12.7
60.9
3.5
Per 1,000 Population
Fertility Rate* (2012-2014)
All Races White Black
All Ages 7,853
Under 15 5
15-17 107
7,193
3
93
61
0
1
599
2
13
Age of WomanReported
PregnanciesLive
BirthsFetal
DeathsInduced
Abortions
Outcome
Age of WomanReported
PregnanciesLive
BirthsFetal
DeathsInduced
Abortions
Outcome
18-19 257
20-29 4,424
30 and Over 3,039
206
4,045
2,825
2
28
30
49
351
184
All Ages* 71.7
Under 15** ND
15-17 8.9
78.3
ND
10.2
Age of Woman Birth Rate Reported Pregnancy Rate Age of Woman Birth Rate Reported Pregnancy Rate
18-19 27.2
20-29 114.8
30 and Over** 44.2
33.9
125.6
47.6
^Live births, fetal deaths of 16+ weeks gestation, and induced abortions performed in-state. Notes: All ages includes any unknown ages. All rates per 1,000.*All Ages includes female population ages 15-44. ** Under 15 includes female population ages 10-14; 30 and Over includes female population ages 30-49.
Hispanic
9.9
65.7
5.3
(of any race)
9.8
63.3
ND
Asian / Pacific
General Notes: Crude and age-adjusted rates based on less than 10 events are considered statistically unreliable and are not displayed (ND), unless otherwise noted. Starting in 2013, race of resident was derived from multiple race selections. A person is Multi-Race if they identify as more than one race. Prior to 2013, race of resident was derived from a single race designation.
Morbidity (2012-2014 Residents)
Reported Incidence and Average Annual Rate (per 100,000) for Selected Notifiable Diseases (2012-2014)
HIV 92 5.8
Syphilis 31 2.0
Tuberculosis 22 1.4
Total Rate
Chlamydia 3,425 215.4
Giardiasis 56 3.5
Gonorrhea 766 48.2
Hepatitis: Type A 5 ND
Total Rate
Lyme Disease 176 11.1
Salmonellosis 131 8.2
Total Rate
Campylobacteriosis 305 19.2 Hep. B* Acute < 5 ND
Shigellosis 10 0.6
*Hepatitis: Type B **Meningococcal Disease
Meningococcal** < 5 ND
Pertussis 121 7.6
Hep. B* Chronic 237 14.9
Chickenpox 142 8.9
Islander
Note: Communicable diseases with demographic counts of 1 to 4 are displayed as "< 5" to avoid potential identification of cases within certain geographic areas.
Multi - Race
9.7
63.5
3.9

Lancaster County PAGE 2
Mortality (2014 Residents)
Selected Major Causes of Death, Number and Average Annual Age-Adjusted Death Rate* (2012-2014)
Number of Resident Deaths 4,793
Crude Death Rate per 1,000 9.0
Age-Adjusted Death Rate per 1,000 6.6
Number of Infant Deaths (< 1 Year of Age) 53 39 5 7
AllRaces BlackWhite
Hispanic(any race)
Infant Mortality Rate per 1,000 Live Births 7.4 6.7 ND ND
Average Annual Infant Mortality Rate (2012-2014) 6.7 6.0 13.9 9.4
Cause Total Rate
Diseases of Heart 3,454
Cancer 3,149
Stroke 817
C.L.R.D.** 644
Accidents 687
155.6
155.3
36.4
30.4
38.9
Cause Total Rate
Influenza/Pneumonia 253
Diabetes Mellitus 398
Septicemia 183
Nephritis/Nephrosis 354
Alzheimer's Disease 605
10.9
18.9
8.7
16.1
25.2
* Per 100,000 2000 U.S. standardmillion population. Age-adjusted rates
** Chronic Lower Respiratory Disease
Selected Leading Causes of Death, Number by Age Group (2014)
Under 5 Years of Age 5-24 Years of Age 25-44 Years of Age 45-64 Years of Age 65 Years and Older
Perinatal Conditions 27
Birth Defects 17
Accidents 4
Accidents 35
Cancer 7
Suicide 7
Diseases of Heart 3
Accidents 45
Cancer 24
Diseases of Heart 16
Suicide 14
Assault (Homicide) 8
Cancer 251
Diseases of Heart 133
Accidents 55
Diabetes Mellitus 33
Suicide 27
Diseases of Heart 968
Cancer 773
Stroke 265
Alzheimer's Disease 241
C.L.R.D.** 183
TOTAL 59 TOTAL 60 TOTAL 147 TOTAL 697 TOTAL 3,830
Note: Total includes all other causes.
Asian/PI*
0
ND
*Asian/Pacific Islander ^ NA = Multi-Race data not available before 2013.
are only comparable if the samestandard million population was usedin the calculation.
Invasive Cancer Incidence and Average Annual Age-Adjusted Rates* for Major Sites by Sex
All Sites 4,164 473.3
Prostate 905 97.9
Lung and Bronchus 528 59.6
Colon and Rectum 381 43.5
Male FemaleTotal Rate Total Rate
Female Breast 1,231 125.5
4,292 426.8
458 42.1
330 31.8
*Per 100,000 2000 U.S. standard million population. Age-adjusted rates are only comparable if the same standard million population was used in the calculation.
- -
- -
Male FemaleTotal Rate Total Rate
Non-Hodgkin Lymphoma 226 26.3
Melanoma of the Skin 268 31.4
175 17.4
375 36.5
170 18.6
Corpus and Uterus, NOS - -
Urinary Bladder 333
Kidney and Renal Pelvis 172 19.5
38.6 97
93
8.6
9.3
Notes: All in situ cases, except for urinary bladder, are excluded. Age-adjusted rates based on less than 20 events are statistically unreliable and are not displayed (ND).
Cancer Incidence (2011-2013 Residents)
Adult Behavioral Health Risk Factors (2012-2014)[Includes: Lancaster County Only]
General Notes: Crude and age-adjusted rates based on less than 10 events are considered statistically unreliable and are not displayed (ND), unless otherwise noted. Starting in 2013, race of resident was derived from multiple race selections. A person is Multi-Race if they identify as more than one race. Prior to 2013, race of resident was derived from a single race designation.
Percent (CI)Risk Factors
Fair or poor general health:
Obese:
Overweight (includes obese):
No health insurance (ages 18-64):
Visited a doctor in the past 2 yearsfor a routine check-up:
Percent (CI)Risk Factors
Ever told they have diabetes: Currently has asthma:
Current smoker:
Ever tested for HIV (ages 18-64):
Needed to see a doctor but couldnot due to cost in the past year:
18
27
(15 - 21)
(23 - 31)
64 (59 - 68)
18 (14 - 22)
76 (72 - 80)
9 11(7 - 12) (8 - 15)
18 (15 - 22)
32 (28 - 37)
13 (10 - 17)
Notes: Data are based on 2012-2014 annual sample surveys of Pennsylvania adults. CI= 95% Confidence Interval.
Additional state or county/regional data are available at www.statistics.health.pa.gov.
^In situ, benign, and uncertain neoplasms
Multi- Race
2
ND
NAND ^

Lancaster County PAGE 3
Hospitals (7/13-6/14)
Total General Acute Care
Psychiatric Rehabilitation
5 4 0 1
General Hospitals
Beds Set Up and Staffed 1,122
Admissions 45,390
Beds per 1,000 Population 2.1
Admissions per 1,000 Population 85.1
Average Inpatient Occupancy Rate 50.1
Nursing Homes (2014)
Total Number Certified-Medicare Certified-Medicaid
Nursing Homes
Licensed/Approved Beds
31 31 29
4,046 4,046 3,763
46.3
Average Occupancy Rate 94.0
Average Length of Stay (Number of Days) 241.4
$305
Total Licensed/Approved Beds per 1,000 Population Age 65 and Older
Average Semi-Private Daily Room Rate
Drug and Alcohol Treatment
Admissions to Client Primary Diagnosis
Drug Abuse Alcohol Abuse Other*
Percent Admitted
Only Once During 7/13-6/14
3,326 1,423 705 38 68.9
* Includes family members receiving counseling.
All Licensed Facilities Inpatient Non-Hospital
Inpatient Hospital Partial Hospitalization Outpatient24
8
0 2 18
Note: Each licensed facility may provide more than one type of service.
State-Supported Facilities
Types of Service Provided
Number of
Clients Admitted
2,166
Admission by County of Residence (7/13-6/14)
Treatment Facilities (as of 6/14)
Correctional Institution 0
General Note: Crude rates based on less than 10 events are considered statistically unreliable and are not displayed (ND), unless otherwise noted.
Services Funding
Other
0
Non-Profit
2
For Profit
3
State
0
Other
0
Ambulatory Surgery Centers (7/13-6/14)
Employees
Part Time Employees 151
Full Time Employees 244
Contracted Employees 97
Payroll Employees 298 Staff with Clinical Privileges 333
Total Surgical Visits per Employee 117.8
Total Facilities 10 Total Surgical Visits 46,538
Percent of Surgical Visits, Age 65+ 33.9
Total Operating Rooms 26 Total Surgical Visits per Operating Room 1,789.9
Facilities Surgical Visits
Staff Licensed as M.D. 242
Total Employees per Operating Room 15.2
Average Semi-Private Daily Room Rate $1,384
Total Employees 395

PAGE 4Lancaster County
Pennsylvania Health Care Workforce (2013-2014)
Notes: Only health care employees renewing their license in 2013-2014 were surveyed.The "Estimated Number" and "Percent of Workforce Intending to Remain in Profession for 6 or More Years" used to compute each "% Change from Previous Survey Year" are adjusted based on the response rates for the previous and current survey results. The survey results are available every two years. Numbers and percentages pertain to county of employment.Percentages based on less than six responses are considered statistically unreliable and are not displayed (ND).Registered Nurses and Licensed Practical Nurses are not comparable to previous survey period, so some data is not available (DNA).
Licensed Practical Nurses (2014) 2,129 DNA 81.2% DNA
Physicians (2014) 1,007
Dentists (2013) 266
Registered Nurses (2012/2013) 4,904 DNA 82.7% DNA
3.9% 74.7% -1.4%
8.3% 76.7% -4.8%
Estimated Number
Percent Changefrom Previous
Survey
Difference in Percent from
Previous Survey
Percent of WorkforceIntending to Remain in
Profession for 6 or More Years
Injury Hospitalizations (2014)
Injury Hospitalizations and Median Charges by Age and Sex
Injury Hospitalizations and Median Charges by Type of Payor
Injury Hospitalizations and Median Charges by Mechanism/Intent and Sex
0-4 5-14 15-24 25-44 45-64 65 and Older
Male - Total
Male - Median Charges
Female - Total
Female - Median Charges
UnintentionalMotor Vehicle All Poisonings Unintentional Falls
Unintentional Fire/Flame or Hot Object/Substance All Firearm All Other Injuries
Male - Total
Male - Median Charges
Female - Total
Female - Median Charges
Medicare Medicaid Other Government Commercial / Private Blue Cross Uninsured
Total Hospitalizations
Median Charges
All Ages
2,230 48 39 197 379 595 972
$32,376.80 $17,417.63 $24,740.30 $23,428.15 $27,084.25 $35,064.15 $34,434.67
2,377 34 27 114 266 498 1,438
$30,479.30 $18,184.55 $18,825.70 $18,429.60 $24,691.13 $31,501.09 $32,464.25
Note: Median charges not displayed (ND) for occurrences less than 10.
2342,564 459 43477936
$21,742.90 $33,145.15 $27,089.95 $26,891.42 $32,923.60 $21,026.09
644
869
157
239
245
219
1,308
851
19
33
4
19
$30,422.55
$33,704.52
$34,078.25
$38,958.00
$17,266.60
$16,674.65
$32,427.83
$32,881.39
$50,947.95
$52,331.45
ND
$67,225.10
Disclaimer: Injury data used in this report were provided to the Pennsylvania Department of Health by the Pennsylvania Health Care Cost Containment Council. The Pennsylvania Health Care Cost Containment Council specifically disclaims responsibility for any interpretations or conclusions. Contents may be republished or reproduced whole or in part, with attribution.

Lawrence CountyHealth Profile 2016
Demographic Data (2014)
% Population Change 2010 to 2014 -2.6
Median Age of the Population (2010-2014) 44.2
% Population Aged 65 and Over 19.9
Population per Square Mile 247.8
% Population with Income Below Poverty Level (2010-2014) 14.5
Per Capita Personal Income $38,322
% Labor Force Unemployed - Annual Average 6.2
% Population Eligible for Medical Assistance 20.0
Estimated Population by Age and Sex (2014)
Age Total Male Female Age Total Male Female
All Ages 88,771
Under 5 4,753
5-14 10,042
15-24 10,914
25-34 9,239
42,917
2,357
5,010
5,603
4,650
45,854
2,396
5,032
5,311
4,589
35-44 9,985
45-54 12,284
55-64 13,857
65-74 8,982
75+ 8,715
4,955
6,027
6,769
4,201
3,345
5,030
6,257
7,088
4,781
5,370
Natality and Reported Pregnancies^ (2014 Residents)
Crude Birth Rate10.6
Average Annual General61.5
% Low Birth Weight 9.9
% Prenatal Care in 1st Trimester 67.8
% Births to Mothers Under 18 2.2
9.3
70.2
1.8
ND
55.6
ND
Per 1,000 Population
Fertility Rate* (2012-2014)
All Races White Black
All Ages 1,048
Under 15 2
15-17 23
944
1
20
8
0
0
96
1
3
Age of WomanReported
PregnanciesLive
BirthsFetal
DeathsInduced
Abortions
Outcome
Age of WomanReported
PregnanciesLive
BirthsFetal
DeathsInduced
Abortions
Outcome
18-19 56
20-29 587
30 and Over 379
44
525
353
0
5
3
12
57
23
All Ages* 63.2
Under 15** ND
15-17 13.2
70.2
ND
15.2
Age of Woman Birth Rate Reported Pregnancy Rate Age of Woman Birth Rate Reported Pregnancy Rate
18-19 38.1
20-29 108.4
30 and Over** 34.4
48.5
121.2
36.9
^Live births, fetal deaths of 16+ weeks gestation, and induced abortions performed in-state. Notes: All ages includes any unknown ages. All rates per 1,000.*All Ages includes female population ages 15-44. ** Under 15 includes female population ages 10-14; 30 and Over includes female population ages 30-49.
Hispanic
ND
ND
ND
(of any race)
ND
ND
ND
Asian / Pacific
General Notes: Crude and age-adjusted rates based on less than 10 events are considered statistically unreliable and are not displayed (ND), unless otherwise noted. Starting in 2013, race of resident was derived from multiple race selections. A person is Multi-Race if they identify as more than one race. Prior to 2013, race of resident was derived from a single race designation.
Morbidity (2012-2014 Residents)
Reported Incidence and Average Annual Rate (per 100,000) for Selected Notifiable Diseases (2012-2014)
HIV 9 ND
Syphilis 0 ND
Tuberculosis 0 ND
Total Rate
Chlamydia 819 305.6
Giardiasis 15 5.6
Gonorrhea 170 63.4
Hepatitis: Type A 0 ND
Total Rate
Lyme Disease 37 13.8
Salmonellosis 34 12.7
Total Rate
Campylobacteriosis 37 13.8 Hep. B* Acute < 5 ND
Shigellosis < 5 ND
*Hepatitis: Type B **Meningococcal Disease
Meningococcal** 0 ND
Pertussis < 5 ND
Hep. B* Chronic 19 7.1
Chickenpox 42 15.7
Islander
Note: Communicable diseases with demographic counts of 1 to 4 are displayed as "< 5" to avoid potential identification of cases within certain geographic areas.
Multi - Race
ND
43.5
ND

Lawrence County PAGE 2
Mortality (2014 Residents)
Selected Major Causes of Death, Number and Average Annual Age-Adjusted Death Rate* (2012-2014)
Number of Resident Deaths 1,214
Crude Death Rate per 1,000 13.7
Age-Adjusted Death Rate per 1,000 8.6
Number of Infant Deaths (< 1 Year of Age) 2 1 0 0
AllRaces BlackWhite
Hispanic(any race)
Infant Mortality Rate per 1,000 Live Births ND ND ND ND
Average Annual Infant Mortality Rate (2012-2014) 7.2 6.1 ND ND
Cause Total Rate
Diseases of Heart 856
Cancer 741
Stroke 168
C.L.R.D.** 177
Accidents 185
187.5
177.4
34.9
40.4
59.2
Cause Total Rate
Influenza/Pneumonia 81
Diabetes Mellitus 142
Septicemia 68
Nephritis/Nephrosis 84
Alzheimer's Disease 89
17.0
33.6
15.0
19.0
17.2
* Per 100,000 2000 U.S. standardmillion population. Age-adjusted rates
** Chronic Lower Respiratory Disease
Selected Leading Causes of Death, Number by Age Group (2014)
Under 5 Years of Age 5-24 Years of Age 25-44 Years of Age 45-64 Years of Age 65 Years and Older
Perinatal Conditions 2 Accidents 3
Suicide 3
Accidents 18
Cancer 6
Suicide 6
Assault (Homicide) 3
Diseases of Heart 3
Cancer 58
Diseases of Heart 42
Accidents 23
Diabetes Mellitus 12
Diseases of Heart 270
Cancer 185
C.L.R.D.** 50
Stroke 47
Diabetes Mellitus 38
TOTAL 3 TOTAL 10 TOTAL 50 TOTAL 198 TOTAL 953
Note: Total includes all other causes.
Asian/PI*
0
ND
*Asian/Pacific Islander ^ NA = Multi-Race data not available before 2013.
are only comparable if the samestandard million population was usedin the calculation.
Invasive Cancer Incidence and Average Annual Age-Adjusted Rates* for Major Sites by Sex
All Sites 911 521.2
Prostate 194 104.5
Lung and Bronchus 150 83.9
Colon and Rectum 77 44.2
Male FemaleTotal Rate Total Rate
Female Breast 265 130.9
914 454.6
133 58.8
75 31.3
*Per 100,000 2000 U.S. standard million population. Age-adjusted rates are only comparable if the same standard million population was used in the calculation.
- -
- -
Male FemaleTotal Rate Total Rate
Non-Hodgkin Lymphoma 41 24.3
Melanoma of the Skin 38 23.5
31 14.4
62 31.1
23 13.1
Corpus and Uterus, NOS - -
Urinary Bladder 66
Kidney and Renal Pelvis 46 26.6
37.1 23
21
10.1
11.9
Notes: All in situ cases, except for urinary bladder, are excluded. Age-adjusted rates based on less than 20 events are statistically unreliable and are not displayed (ND).
Cancer Incidence (2011-2013 Residents)
Adult Behavioral Health Risk Factors (2012-2014)[Includes: Crawford, Lawrence, Mercer, and Venango Counties]
General Notes: Crude and age-adjusted rates based on less than 10 events are considered statistically unreliable and are not displayed (ND), unless otherwise noted. Starting in 2013, race of resident was derived from multiple race selections. A person is Multi-Race if they identify as more than one race. Prior to 2013, race of resident was derived from a single race designation.
Percent (CI)Risk Factors
Fair or poor general health:
Obese:
Overweight (includes obese):
No health insurance (ages 18-64):
Visited a doctor in the past 2 yearsfor a routine check-up:
Percent (CI)Risk Factors
Ever told they have diabetes: Currently has asthma:
Current smoker:
Ever tested for HIV (ages 18-64):
Needed to see a doctor but couldnot due to cost in the past year:
17
35
(15 - 20)
(32 - 38)
66 (63 - 70)
16 (13 - 20)
83 (80 - 85)
13 10(11 - 15) (8 - 12)
24 (21 - 27)
28 (25 - 32)
13 (11 - 16)
Notes: Data are based on 2012-2014 annual sample surveys of Pennsylvania adults. CI= 95% Confidence Interval.
Additional state or county/regional data are available at www.statistics.health.pa.gov.
^In situ, benign, and uncertain neoplasms
Multi- Race
0
ND
NAND ^

Lawrence County PAGE 3
Hospitals (7/13-6/14)
Total General Acute Care
Psychiatric Rehabilitation
2 2 0 0
General Hospitals
Beds Set Up and Staffed 280
Admissions 9,542
Beds per 1,000 Population 3.2
Admissions per 1,000 Population 107.5
Average Inpatient Occupancy Rate 45.6
Nursing Homes (2014)
Total Number Certified-Medicare Certified-Medicaid
Nursing Homes
Licensed/Approved Beds
9 9 8
796 796 776
45.0
Average Occupancy Rate 89.3
Average Length of Stay (Number of Days) 178.3
$254
Total Licensed/Approved Beds per 1,000 Population Age 65 and Older
Average Semi-Private Daily Room Rate
Drug and Alcohol Treatment
Admissions to Client Primary Diagnosis
Drug Abuse Alcohol Abuse Other*
Percent Admitted
Only Once During 7/13-6/14
906 418 173 32 69.5
* Includes family members receiving counseling.
All Licensed Facilities Inpatient Non-Hospital
Inpatient Hospital Partial Hospitalization Outpatient6
1
0 0 5
Note: Each licensed facility may provide more than one type of service.
State-Supported Facilities
Types of Service Provided
Number of
Clients Admitted
623
Admission by County of Residence (7/13-6/14)
Treatment Facilities (as of 6/14)
Correctional Institution 0
General Note: Crude rates based on less than 10 events are considered statistically unreliable and are not displayed (ND), unless otherwise noted.
Services Funding
Other
0
Non-Profit
2
For Profit
0
State
0
Other
0
Ambulatory Surgery Centers (7/13-6/14)
Employees
Part Time Employees 4
Full Time Employees 4
Contracted Employees 1
Payroll Employees 7 Staff with Clinical Privileges 10
Total Surgical Visits per Employee 120.8
Total Facilities 1 Total Surgical Visits 966
Percent of Surgical Visits, Age 65+ 68.4
Total Operating Rooms 2 Total Surgical Visits per Operating Room 483.0
Facilities Surgical Visits
Staff Licensed as M.D. 4
Total Employees per Operating Room 4.0
Average Semi-Private Daily Room Rate $718
Total Employees 8

PAGE 4Lawrence County
Pennsylvania Health Care Workforce (2013-2014)
Notes: Only health care employees renewing their license in 2013-2014 were surveyed.The "Estimated Number" and "Percent of Workforce Intending to Remain in Profession for 6 or More Years" used to compute each "% Change from Previous Survey Year" are adjusted based on the response rates for the previous and current survey results. The survey results are available every two years. Numbers and percentages pertain to county of employment.Percentages based on less than six responses are considered statistically unreliable and are not displayed (ND).Registered Nurses and Licensed Practical Nurses are not comparable to previous survey period, so some data is not available (DNA).
Licensed Practical Nurses (2014) 285 DNA 82.9% DNA
Physicians (2014) 117
Dentists (2013) 48
Registered Nurses (2012/2013) 897 DNA 77.1% DNA
-6.7% 54.2% -14.6%
-5.4% 73.8% -12.9%
Estimated Number
Percent Changefrom Previous
Survey
Difference in Percent from
Previous Survey
Percent of WorkforceIntending to Remain in
Profession for 6 or More Years
Injury Hospitalizations (2014)
Injury Hospitalizations and Median Charges by Age and Sex
Injury Hospitalizations and Median Charges by Type of Payor
Injury Hospitalizations and Median Charges by Mechanism/Intent and Sex
0-4 5-14 15-24 25-44 45-64 65 and Older
Male - Total
Male - Median Charges
Female - Total
Female - Median Charges
UnintentionalMotor Vehicle All Poisonings Unintentional Falls
Unintentional Fire/Flame or Hot Object/Substance All Firearm All Other Injuries
Male - Total
Male - Median Charges
Female - Total
Female - Median Charges
Medicare Medicaid Other Government Commercial / Private Blue Cross Uninsured
Total Hospitalizations
Median Charges
All Ages
529 7 12 43 73 153 241
$23,774.93 ND $17,288.99 $29,214.76 $25,283.00 $22,515.00 $25,085.48
617 9 11 13 45 126 413
$18,340.26 ND $10,872.20 $10,164.70 $15,802.27 $18,580.09 $19,955.62
Note: Median charges not displayed (ND) for occurrences less than 10.
34710 151 911546
$32,197.83 $21,085.20 $18,598.58 $21,331.24 $24,316.00 ND
166
239
12
22
51
37
383
214
5
12
0
5
$20,405.45
$21,268.80
$73,535.70
$67,820.00
$9,907.75
$16,003.00
$19,251.45
$25,684.56
ND
$13,228.24
-
ND
Disclaimer: Injury data used in this report were provided to the Pennsylvania Department of Health by the Pennsylvania Health Care Cost Containment Council. The Pennsylvania Health Care Cost Containment Council specifically disclaims responsibility for any interpretations or conclusions. Contents may be republished or reproduced whole or in part, with attribution.
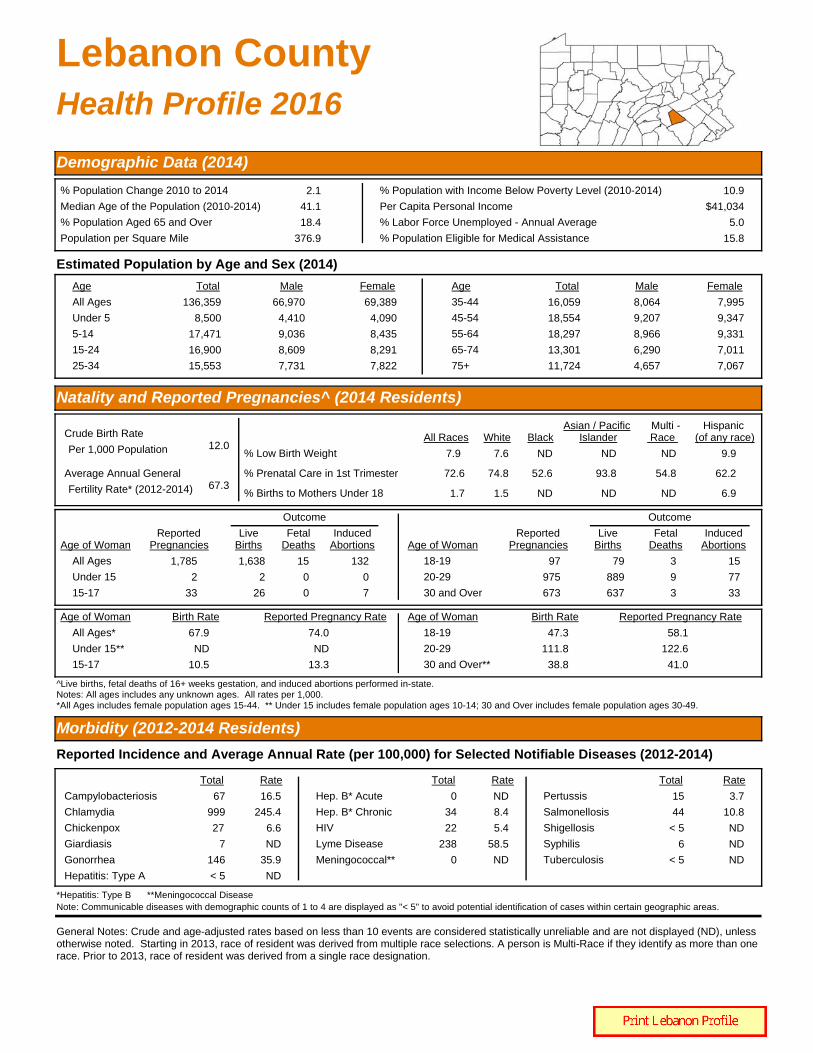
Lebanon CountyHealth Profile 2016
Demographic Data (2014)
% Population Change 2010 to 2014 2.1
Median Age of the Population (2010-2014) 41.1
% Population Aged 65 and Over 18.4
Population per Square Mile 376.9
% Population with Income Below Poverty Level (2010-2014) 10.9
Per Capita Personal Income $41,034
% Labor Force Unemployed - Annual Average 5.0
% Population Eligible for Medical Assistance 15.8
Estimated Population by Age and Sex (2014)
Age Total Male Female Age Total Male Female
All Ages 136,359
Under 5 8,500
5-14 17,471
15-24 16,900
25-34 15,553
66,970
4,410
9,036
8,609
7,731
69,389
4,090
8,435
8,291
7,822
35-44 16,059
45-54 18,554
55-64 18,297
65-74 13,301
75+ 11,724
8,064
9,207
8,966
6,290
4,657
7,995
9,347
9,331
7,011
7,067
Natality and Reported Pregnancies^ (2014 Residents)
Crude Birth Rate12.0
Average Annual General67.3
% Low Birth Weight 7.9
% Prenatal Care in 1st Trimester 72.6
% Births to Mothers Under 18 1.7
7.6
74.8
1.5
ND
52.6
ND
Per 1,000 Population
Fertility Rate* (2012-2014)
All Races White Black
All Ages 1,785
Under 15 2
15-17 33
1,638
2
26
15
0
0
132
0
7
Age of WomanReported
PregnanciesLive
BirthsFetal
DeathsInduced
Abortions
Outcome
Age of WomanReported
PregnanciesLive
BirthsFetal
DeathsInduced
Abortions
Outcome
18-19 97
20-29 975
30 and Over 673
79
889
637
3
9
3
15
77
33
All Ages* 67.9
Under 15** ND
15-17 10.5
74.0
ND
13.3
Age of Woman Birth Rate Reported Pregnancy Rate Age of Woman Birth Rate Reported Pregnancy Rate
18-19 47.3
20-29 111.8
30 and Over** 38.8
58.1
122.6
41.0
^Live births, fetal deaths of 16+ weeks gestation, and induced abortions performed in-state. Notes: All ages includes any unknown ages. All rates per 1,000.*All Ages includes female population ages 15-44. ** Under 15 includes female population ages 10-14; 30 and Over includes female population ages 30-49.
Hispanic
9.9
62.2
6.9
(of any race)
ND
93.8
ND
Asian / Pacific
General Notes: Crude and age-adjusted rates based on less than 10 events are considered statistically unreliable and are not displayed (ND), unless otherwise noted. Starting in 2013, race of resident was derived from multiple race selections. A person is Multi-Race if they identify as more than one race. Prior to 2013, race of resident was derived from a single race designation.
Morbidity (2012-2014 Residents)
Reported Incidence and Average Annual Rate (per 100,000) for Selected Notifiable Diseases (2012-2014)
HIV 22 5.4
Syphilis 6 ND
Tuberculosis < 5 ND
Total Rate
Chlamydia 999 245.4
Giardiasis 7 ND
Gonorrhea 146 35.9
Hepatitis: Type A < 5 ND
Total Rate
Lyme Disease 238 58.5
Salmonellosis 44 10.8
Total Rate
Campylobacteriosis 67 16.5 Hep. B* Acute 0 ND
Shigellosis < 5 ND
*Hepatitis: Type B **Meningococcal Disease
Meningococcal** 0 ND
Pertussis 15 3.7
Hep. B* Chronic 34 8.4
Chickenpox 27 6.6
Islander
Note: Communicable diseases with demographic counts of 1 to 4 are displayed as "< 5" to avoid potential identification of cases within certain geographic areas.
Multi - Race
ND
54.8
ND

Lebanon County PAGE 2
Mortality (2014 Residents)
Selected Major Causes of Death, Number and Average Annual Age-Adjusted Death Rate* (2012-2014)
Number of Resident Deaths 1,316
Crude Death Rate per 1,000 9.7
Age-Adjusted Death Rate per 1,000 6.6
Number of Infant Deaths (< 1 Year of Age) 8 7 1 0
AllRaces BlackWhite
Hispanic(any race)
Infant Mortality Rate per 1,000 Live Births ND ND ND ND
Average Annual Infant Mortality Rate (2012-2014) 6.8 5.3 ND 12.1
Cause Total Rate
Diseases of Heart 998
Cancer 946
Stroke 278
C.L.R.D.** 242
Accidents 173
164.9
165.4
43.5
40.6
36.1
Cause Total Rate
Influenza/Pneumonia 99
Diabetes Mellitus 89
Septicemia 62
Nephritis/Nephrosis 88
Alzheimer's Disease 97
16.0
14.7
11.1
14.8
14.4
* Per 100,000 2000 U.S. standardmillion population. Age-adjusted rates
** Chronic Lower Respiratory Disease
Selected Leading Causes of Death, Number by Age Group (2014)
Under 5 Years of Age 5-24 Years of Age 25-44 Years of Age 45-64 Years of Age 65 Years and Older
Perinatal Conditions 3
Birth Defects 2
Accidents 6
Birth Defects 2
Cancer 2
Suicide 2
Accidents 13
Cancer 7
Suicide 4
Diseases of Heart 2
Cancer 77
Diseases of Heart 54
Accidents 12
C.L.R.D.** 12
Stroke 11
Diseases of Heart 277
Cancer 235
Stroke 55
C.L.R.D.** 54
Alzheimer's Disease 32
TOTAL 10 TOTAL 16 TOTAL 33 TOTAL 225 TOTAL 1,032
Note: Total includes all other causes.
Asian/PI*
0
ND
*Asian/Pacific Islander ^ NA = Multi-Race data not available before 2013.
are only comparable if the samestandard million population was usedin the calculation.
Invasive Cancer Incidence and Average Annual Age-Adjusted Rates* for Major Sites by Sex
All Sites 1,205 490.6
Prostate 249 97.3
Lung and Bronchus 216 85.9
Colon and Rectum 104 41.8
Male FemaleTotal Rate Total Rate
Female Breast 361 128.4
1,251 446.1
155 50.2
105 34.4
*Per 100,000 2000 U.S. standard million population. Age-adjusted rates are only comparable if the same standard million population was used in the calculation.
- -
- -
Male FemaleTotal Rate Total Rate
Non-Hodgkin Lymphoma 59 24.5
Melanoma of the Skin 71 29.5
40 13.7
103 36.5
43 17.8
Corpus and Uterus, NOS - -
Urinary Bladder 103
Kidney and Renal Pelvis 46 20.0
41.1 36
49
11.3
19.6
Notes: All in situ cases, except for urinary bladder, are excluded. Age-adjusted rates based on less than 20 events are statistically unreliable and are not displayed (ND).
Cancer Incidence (2011-2013 Residents)
Adult Behavioral Health Risk Factors (2012-2014)[Includes: Dauphin and Lebanon Counties]
General Notes: Crude and age-adjusted rates based on less than 10 events are considered statistically unreliable and are not displayed (ND), unless otherwise noted. Starting in 2013, race of resident was derived from multiple race selections. A person is Multi-Race if they identify as more than one race. Prior to 2013, race of resident was derived from a single race designation.
Percent (CI)Risk Factors
Fair or poor general health:
Obese:
Overweight (includes obese):
No health insurance (ages 18-64):
Visited a doctor in the past 2 yearsfor a routine check-up:
Percent (CI)Risk Factors
Ever told they have diabetes: Currently has asthma:
Current smoker:
Ever tested for HIV (ages 18-64):
Needed to see a doctor but couldnot due to cost in the past year:
16
32
(13 - 18)
(28 - 35)
67 (63 - 70)
19 (15 - 23)
82 (78 - 85)
11 9(9 - 13) (7 - 11)
19 (16 - 23)
34 (30 - 39)
12 (10 - 16)
Notes: Data are based on 2012-2014 annual sample surveys of Pennsylvania adults. CI= 95% Confidence Interval.
Additional state or county/regional data are available at www.statistics.health.pa.gov.
^In situ, benign, and uncertain neoplasms
Multi- Race
0
ND
NAND ^

Lebanon County PAGE 3
Hospitals (7/13-6/14)
Total General Acute Care
Psychiatric Rehabilitation
3 1 1 0
General Hospitals
Beds Set Up and Staffed 164
Admissions 7,067
Beds per 1,000 Population 1.2
Admissions per 1,000 Population 51.8
Average Inpatient Occupancy Rate 53.9
Nursing Homes (2014)
Total Number Certified-Medicare Certified-Medicaid
Nursing Homes
Licensed/Approved Beds
12 12 11
1,207 1,207 1,188
48.2
Average Occupancy Rate 93.0
Average Length of Stay (Number of Days) 197.7
$293
Total Licensed/Approved Beds per 1,000 Population Age 65 and Older
Average Semi-Private Daily Room Rate
Drug and Alcohol Treatment
Admissions to Client Primary Diagnosis
Drug Abuse Alcohol Abuse Other*
Percent Admitted
Only Once During 7/13-6/14
534 233 130 5 72.6
* Includes family members receiving counseling.
All Licensed Facilities Inpatient Non-Hospital
Inpatient Hospital Partial Hospitalization Outpatient6
2
0 0 5
Note: Each licensed facility may provide more than one type of service.
State-Supported Facilities
Types of Service Provided
Number of
Clients Admitted
368
Admission by County of Residence (7/13-6/14)
Treatment Facilities (as of 6/14)
Correctional Institution 0
General Note: Crude rates based on less than 10 events are considered statistically unreliable and are not displayed (ND), unless otherwise noted.
Services Funding
Other
1
Non-Profit
2
For Profit
0
State
0
Other
1
Ambulatory Surgery Centers (7/13-6/14)
Employees
Part Time Employees 86
Full Time Employees 31
Contracted Employees 57
Payroll Employees 60 Staff with Clinical Privileges 32
Total Surgical Visits per Employee 91.2
Total Facilities 3 Total Surgical Visits 10,668
Percent of Surgical Visits, Age 65+ 22.2
Total Operating Rooms 8 Total Surgical Visits per Operating Room 1,333.5
Facilities Surgical Visits
Staff Licensed as M.D. 29
Total Employees per Operating Room 14.6
Average Semi-Private Daily Room Rate $617
Total Employees 117

PAGE 4Lebanon County
Pennsylvania Health Care Workforce (2013-2014)
Notes: Only health care employees renewing their license in 2013-2014 were surveyed.The "Estimated Number" and "Percent of Workforce Intending to Remain in Profession for 6 or More Years" used to compute each "% Change from Previous Survey Year" are adjusted based on the response rates for the previous and current survey results. The survey results are available every two years. Numbers and percentages pertain to county of employment.Percentages based on less than six responses are considered statistically unreliable and are not displayed (ND).Registered Nurses and Licensed Practical Nurses are not comparable to previous survey period, so some data is not available (DNA).
Licensed Practical Nurses (2014) 578 DNA 79.6% DNA
Physicians (2014) 294
Dentists (2013) 59
Registered Nurses (2012/2013) 1,079 DNA 78.0% DNA
5.8% 64.9% -3.8%
12.6% 66.7% -7.2%
Estimated Number
Percent Changefrom Previous
Survey
Difference in Percent from
Previous Survey
Percent of WorkforceIntending to Remain in
Profession for 6 or More Years
Injury Hospitalizations (2014)
Injury Hospitalizations and Median Charges by Age and Sex
Injury Hospitalizations and Median Charges by Type of Payor
Injury Hospitalizations and Median Charges by Mechanism/Intent and Sex
0-4 5-14 15-24 25-44 45-64 65 and Older
Male - Total
Male - Median Charges
Female - Total
Female - Median Charges
UnintentionalMotor Vehicle All Poisonings Unintentional Falls
Unintentional Fire/Flame or Hot Object/Substance All Firearm All Other Injuries
Male - Total
Male - Median Charges
Female - Total
Female - Median Charges
Medicare Medicaid Other Government Commercial / Private Blue Cross Uninsured
Total Hospitalizations
Median Charges
All Ages
515 16 6 46 96 125 226
$35,922.50 $21,649.48 ND $40,217.95 $32,537.43 $36,309.40 $37,997.35
567 8 8 24 43 110 374
$32,834.60 ND ND $16,645.03 $34,150.90 $32,532.90 $33,333.20
Note: Median charges not displayed (ND) for occurrences less than 10.
38590 100 14019914
$29,293.08 $34,153.65 $25,988.17 $30,061.65 $43,966.27 $29,904.82
122
158
44
72
52
62
342
206
6
11
1
6
$26,304.28
$32,079.50
$43,439.35
$49,355.30
$17,628.70
$20,217.35
$34,226.58
$34,824.90
ND
$26,117.13
ND
ND
Disclaimer: Injury data used in this report were provided to the Pennsylvania Department of Health by the Pennsylvania Health Care Cost Containment Council. The Pennsylvania Health Care Cost Containment Council specifically disclaims responsibility for any interpretations or conclusions. Contents may be republished or reproduced whole or in part, with attribution.

Lehigh CountyHealth Profile 2016
Demographic Data (2014)
% Population Change 2010 to 2014 2.4
Median Age of the Population (2010-2014) 39.5
% Population Aged 65 and Over 16.0
Population per Square Mile 1,036.7
% Population with Income Below Poverty Level (2010-2014) 13.4
Per Capita Personal Income $45,211
% Labor Force Unemployed - Annual Average 6.1
% Population Eligible for Medical Assistance 18.7
Estimated Population by Age and Sex (2014)
Age Total Male Female Age Total Male Female
All Ages 357,823
Under 5 21,189
5-14 45,817
15-24 46,844
25-34 45,605
174,210
10,834
23,515
23,425
22,624
183,613
10,355
22,302
23,419
22,981
35-44 44,334
45-54 50,462
55-64 46,299
65-74 30,503
75+ 26,770
22,120
24,738
22,474
14,094
10,386
22,214
25,724
23,825
16,409
16,384
Estimated Population by Race and Hispanic Origin (2014)
White 303,146 Black 30,140 Other Races 24,537 Hispanic (any race) 76,842
Natality and Reported Pregnancies^ (2014 Residents)
Crude Birth Rate11.7
Average Annual General60.6
% Low Birth Weight 8.5
% Prenatal Care in 1st Trimester 74.2
% Births to Mothers Under 18 1.9
7.3
79.9
0.9
14.8
58.8
ND
Per 1,000 Population
Fertility Rate* (2012-2014)
All Races White Black
All Ages 5,095
Under 15 2
15-17 110
4,180
0
78
23
0
2
892
2
30
Age of WomanReported
PregnanciesLive
BirthsFetal
DeathsInduced
Abortions
Outcome
Age of WomanReported
PregnanciesLive
BirthsFetal
DeathsInduced
Abortions
Outcome
18-19 269
20-29 2,627
30 and Over 2,079
205
2,082
1,807
1
11
9
63
534
263
All Ages* 60.9
Under 15** ND
15-17 11.3
74.3
ND
16.0
Age of Woman Birth Rate Reported Pregnancy Rate Age of Woman Birth Rate Reported Pregnancy Rate
18-19 42.7
20-29 90.2
30 and Over** 39.1
56.0
113.8
45.0
^Live births, fetal deaths of 16+ weeks gestation, and induced abortions performed in-state. Notes: All ages includes any unknown ages. All rates per 1,000.*All Ages includes female population ages 15-44. ** Under 15 includes female population ages 10-14; 30 and Over includes female population ages 30-49.
Hispanic
9.4
66.3
4.1
(of any race)
6.9
78.7
ND
Asian / Pacific
General Notes: Crude and age-adjusted rates based on less than 10 events are considered statistically unreliable and are not displayed (ND), unless otherwise noted. Starting in 2013, race of resident was derived from multiple race selections. A person is Multi-Race if they identify as more than one race. Prior to 2013, race of resident was derived from a single race designation.
Morbidity (2012-2014 Residents)
Reported Incidence and Average Annual Rate (per 100,000) for Selected Notifiable Diseases (2012-2014)
HIV 128 12.0
Syphilis 28 2.6
Tuberculosis 9 ND
Total Rate
Chlamydia 4,307 403.2
Giardiasis 47 4.4
Gonorrhea 735 68.8
Hepatitis: Type A 14 1.3
Total Rate
Lyme Disease 430 40.3
Salmonellosis 137 12.8
Total Rate
Campylobacteriosis 88 8.2 Hep. B* Acute < 5 ND
Shigellosis 8 ND
*Hepatitis: Type B **Meningococcal Disease
Meningococcal** < 5 ND
Pertussis 105 9.8
Hep. B* Chronic 274 25.7
Chickenpox 43 4.0
Islander
Note: Communicable diseases with demographic counts of 1 to 4 are displayed as "< 5" to avoid potential identification of cases within certain geographic areas.
Multi - Race
5.8
69.9
5.2
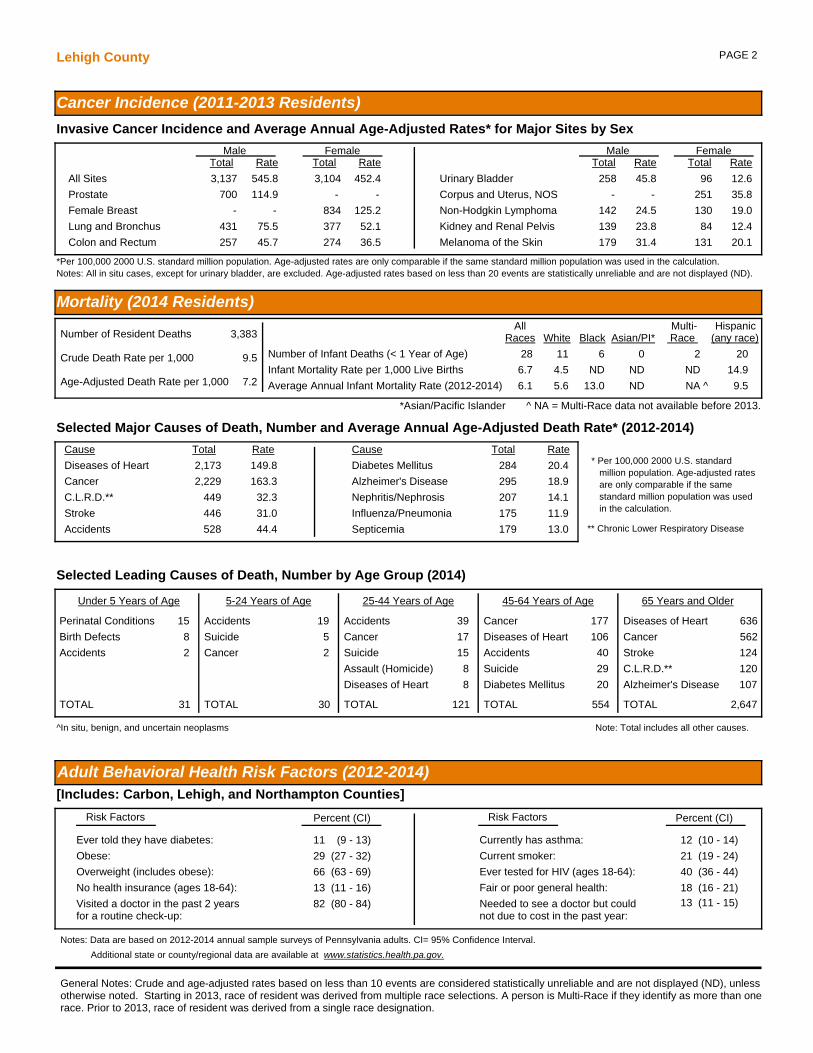
Lehigh County PAGE 2
Mortality (2014 Residents)
Selected Major Causes of Death, Number and Average Annual Age-Adjusted Death Rate* (2012-2014)
Number of Resident Deaths 3,383
Crude Death Rate per 1,000 9.5
Age-Adjusted Death Rate per 1,000 7.2
Number of Infant Deaths (< 1 Year of Age) 28 11 6 20
AllRaces BlackWhite
Hispanic(any race)
Infant Mortality Rate per 1,000 Live Births 6.7 4.5 ND 14.9
Average Annual Infant Mortality Rate (2012-2014) 6.1 5.6 13.0 9.5
Cause Total Rate
Diseases of Heart 2,173
Cancer 2,229
Stroke 446
C.L.R.D.** 449
Accidents 528
149.8
163.3
31.0
32.3
44.4
Cause Total Rate
Influenza/Pneumonia 175
Diabetes Mellitus 284
Septicemia 179
Nephritis/Nephrosis 207
Alzheimer's Disease 295
11.9
20.4
13.0
14.1
18.9
* Per 100,000 2000 U.S. standardmillion population. Age-adjusted rates
** Chronic Lower Respiratory Disease
Selected Leading Causes of Death, Number by Age Group (2014)
Under 5 Years of Age 5-24 Years of Age 25-44 Years of Age 45-64 Years of Age 65 Years and Older
Perinatal Conditions 15
Birth Defects 8
Accidents 2
Accidents 19
Suicide 5
Cancer 2
Accidents 39
Cancer 17
Suicide 15
Assault (Homicide) 8
Diseases of Heart 8
Cancer 177
Diseases of Heart 106
Accidents 40
Suicide 29
Diabetes Mellitus 20
Diseases of Heart 636
Cancer 562
Stroke 124
C.L.R.D.** 120
Alzheimer's Disease 107
TOTAL 31 TOTAL 30 TOTAL 121 TOTAL 554 TOTAL 2,647
Note: Total includes all other causes.
Asian/PI*
0
ND
*Asian/Pacific Islander ^ NA = Multi-Race data not available before 2013.
are only comparable if the samestandard million population was usedin the calculation.
Invasive Cancer Incidence and Average Annual Age-Adjusted Rates* for Major Sites by Sex
All Sites 3,137 545.8
Prostate 700 114.9
Lung and Bronchus 431 75.5
Colon and Rectum 257 45.7
Male FemaleTotal Rate Total Rate
Female Breast 834 125.2
3,104 452.4
377 52.1
274 36.5
*Per 100,000 2000 U.S. standard million population. Age-adjusted rates are only comparable if the same standard million population was used in the calculation.
- -
- -
Male FemaleTotal Rate Total Rate
Non-Hodgkin Lymphoma 142 24.5
Melanoma of the Skin 179 31.4
130 19.0
251 35.8
131 20.1
Corpus and Uterus, NOS - -
Urinary Bladder 258
Kidney and Renal Pelvis 139 23.8
45.8 96
84
12.6
12.4
Notes: All in situ cases, except for urinary bladder, are excluded. Age-adjusted rates based on less than 20 events are statistically unreliable and are not displayed (ND).
Cancer Incidence (2011-2013 Residents)
Adult Behavioral Health Risk Factors (2012-2014)[Includes: Carbon, Lehigh, and Northampton Counties]
General Notes: Crude and age-adjusted rates based on less than 10 events are considered statistically unreliable and are not displayed (ND), unless otherwise noted. Starting in 2013, race of resident was derived from multiple race selections. A person is Multi-Race if they identify as more than one race. Prior to 2013, race of resident was derived from a single race designation.
Percent (CI)Risk Factors
Fair or poor general health:
Obese:
Overweight (includes obese):
No health insurance (ages 18-64):
Visited a doctor in the past 2 yearsfor a routine check-up:
Percent (CI)Risk Factors
Ever told they have diabetes: Currently has asthma:
Current smoker:
Ever tested for HIV (ages 18-64):
Needed to see a doctor but couldnot due to cost in the past year:
18
29
(16 - 21)
(27 - 32)
66 (63 - 69)
13 (11 - 16)
82 (80 - 84)
11 12(9 - 13) (10 - 14)
21 (19 - 24)
40 (36 - 44)
13 (11 - 15)
Notes: Data are based on 2012-2014 annual sample surveys of Pennsylvania adults. CI= 95% Confidence Interval.
Additional state or county/regional data are available at www.statistics.health.pa.gov.
^In situ, benign, and uncertain neoplasms
Multi- Race
2
ND
NAND ^

Lehigh County PAGE 3
Hospitals (7/13-6/14)
Total General Acute Care
Psychiatric Rehabilitation
8 5 1 1
General Hospitals
Beds Set Up and Staffed 1,658
Admissions 83,700
Beds per 1,000 Population 4.6
Admissions per 1,000 Population 233.9
Average Inpatient Occupancy Rate 64.2
Nursing Homes (2014)
Total Number Certified-Medicare Certified-Medicaid
Nursing Homes
Licensed/Approved Beds
16 16 14
2,742 2,742 2,668
47.9
Average Occupancy Rate 92.8
Average Length of Stay (Number of Days) 132.4
$498
Total Licensed/Approved Beds per 1,000 Population Age 65 and Older
Average Semi-Private Daily Room Rate
Drug and Alcohol Treatment
Admissions to Client Primary Diagnosis
Drug Abuse Alcohol Abuse Other*
Percent Admitted
Only Once During 7/13-6/14
1,603 696 330 53 67.1
* Includes family members receiving counseling.
All Licensed Facilities Inpatient Non-Hospital
Inpatient Hospital Partial Hospitalization Outpatient17
4
0 2 14
Note: Each licensed facility may provide more than one type of service.
State-Supported Facilities
Types of Service Provided
Number of
Clients Admitted
1,079
Admission by County of Residence (7/13-6/14)
Treatment Facilities (as of 6/14)
Correctional Institution 0
General Note: Crude rates based on less than 10 events are considered statistically unreliable and are not displayed (ND), unless otherwise noted.
Services Funding
Other
1
Non-Profit
7
For Profit
1
State
0
Other
0
Ambulatory Surgery Centers (7/13-6/14)
Employees
Part Time Employees 101
Full Time Employees 162
Contracted Employees 29
Payroll Employees 234 Staff with Clinical Privileges 1,674
Total Surgical Visits per Employee 143.4
Total Facilities 9 Total Surgical Visits 37,716
Percent of Surgical Visits, Age 65+ 41.0
Total Operating Rooms 22 Total Surgical Visits per Operating Room 1,714.4
Facilities Surgical Visits
Staff Licensed as M.D. 1,250
Total Employees per Operating Room 12.0
Average Semi-Private Daily Room Rate $3,509
Total Employees 263

PAGE 4Lehigh County
Pennsylvania Health Care Workforce (2013-2014)
Notes: Only health care employees renewing their license in 2013-2014 were surveyed.The "Estimated Number" and "Percent of Workforce Intending to Remain in Profession for 6 or More Years" used to compute each "% Change from Previous Survey Year" are adjusted based on the response rates for the previous and current survey results. The survey results are available every two years. Numbers and percentages pertain to county of employment.Percentages based on less than six responses are considered statistically unreliable and are not displayed (ND).Registered Nurses and Licensed Practical Nurses are not comparable to previous survey period, so some data is not available (DNA).
Licensed Practical Nurses (2014) 816 DNA 81.5% DNA
Physicians (2014) 1,456
Dentists (2013) 243
Registered Nurses (2012/2013) 6,327 DNA 84.5% DNA
5.4% 76.5% -1.0%
-0.2% 78.8% -1.7%
Estimated Number
Percent Changefrom Previous
Survey
Difference in Percent from
Previous Survey
Percent of WorkforceIntending to Remain in
Profession for 6 or More Years
Injury Hospitalizations (2014)
Injury Hospitalizations and Median Charges by Age and Sex
Injury Hospitalizations and Median Charges by Type of Payor
Injury Hospitalizations and Median Charges by Mechanism/Intent and Sex
0-4 5-14 15-24 25-44 45-64 65 and Older
Male - Total
Male - Median Charges
Female - Total
Female - Median Charges
UnintentionalMotor Vehicle All Poisonings Unintentional Falls
Unintentional Fire/Flame or Hot Object/Substance All Firearm All Other Injuries
Male - Total
Male - Median Charges
Female - Total
Female - Median Charges
Medicare Medicaid Other Government Commercial / Private Blue Cross Uninsured
Total Hospitalizations
Median Charges
All Ages
1,821 34 33 176 332 545 701
$48,387.32 $19,994.03 $32,489.86 $38,148.58 $41,992.95 $51,745.67 $58,465.12
2,043 28 40 104 216 422 1,233
$46,852.98 $22,080.34 $21,323.57 $25,349.66 $34,930.10 $42,908.10 $55,143.83
Note: Median charges not displayed (ND) for occurrences less than 10.
1802,135 514 42857224
$34,068.33 $53,466.20 $36,295.32 $42,301.22 $52,229.92 $51,678.15
524
672
115
148
199
195
1,177
768
24
22
4
16
$40,916.48
$43,827.82
$71,114.75
$69,140.43
$27,755.60
$29,116.43
$53,638.26
$56,282.47
$32,687.66
$23,395.29
ND
$81,081.55
Disclaimer: Injury data used in this report were provided to the Pennsylvania Department of Health by the Pennsylvania Health Care Cost Containment Council. The Pennsylvania Health Care Cost Containment Council specifically disclaims responsibility for any interpretations or conclusions. Contents may be republished or reproduced whole or in part, with attribution.

Luzerne CountyHealth Profile 2016
Demographic Data (2014)
% Population Change 2010 to 2014 -0.7
Median Age of the Population (2010-2014) 42.9
% Population Aged 65 and Over 19.0
Population per Square Mile 358.1
% Population with Income Below Poverty Level (2010-2014) 16.3
Per Capita Personal Income $39,760
% Labor Force Unemployed - Annual Average 7.4
% Population Eligible for Medical Assistance 20.5
Estimated Population by Age and Sex (2014)
Age Total Male Female Age Total Male Female
All Ages 318,829
Under 5 15,972
5-14 34,988
15-24 40,954
25-34 38,158
157,038
8,198
17,944
21,134
20,060
161,791
7,774
17,044
19,820
18,098
35-44 37,528
45-54 46,176
55-64 44,629
65-74 31,842
75+ 28,582
18,999
23,415
21,936
14,998
10,354
18,529
22,761
22,693
16,844
18,228
Estimated Population by Hispanic Origin (2014)
Hispanic (any race) 28,925
Natality and Reported Pregnancies^ (2014 Residents)
Crude Birth Rate9.9
Average Annual General55.3
% Low Birth Weight 8.2
% Prenatal Care in 1st Trimester 69.0
% Births to Mothers Under 18 1.8
7.5
73.2
1.3
14.3
52.3
ND
Per 1,000 Population
Fertility Rate* (2012-2014)
All Races White Black
All Ages 3,661
Under 15 3
15-17 65
3,168
3
54
33
0
1
460
0
10
Age of WomanReported
PregnanciesLive
BirthsFetal
DeathsInduced
Abortions
Outcome
Age of WomanReported
PregnanciesLive
BirthsFetal
DeathsInduced
Abortions
Outcome
18-19 214
20-29 2,028
30 and Over 1,341
168
1,731
1,202
5
20
7
41
277
132
All Ages* 56.1
Under 15** ND
15-17 9.9
64.9
ND
11.9
Age of Woman Birth Rate Reported Pregnancy Rate Age of Woman Birth Rate Reported Pregnancy Rate
18-19 39.8
20-29 89.0
30 and Over** 31.4
50.8
104.2
35.1
^Live births, fetal deaths of 16+ weeks gestation, and induced abortions performed in-state. Notes: All ages includes any unknown ages. All rates per 1,000.*All Ages includes female population ages 15-44. ** Under 15 includes female population ages 10-14; 30 and Over includes female population ages 30-49.
Hispanic
9.2
58.5
4.2
(of any race)
ND
54.0
ND
Asian / Pacific
General Notes: Crude and age-adjusted rates based on less than 10 events are considered statistically unreliable and are not displayed (ND), unless otherwise noted. Starting in 2013, race of resident was derived from multiple race selections. A person is Multi-Race if they identify as more than one race. Prior to 2013, race of resident was derived from a single race designation.
Morbidity (2012-2014 Residents)
Reported Incidence and Average Annual Rate (per 100,000) for Selected Notifiable Diseases (2012-2014)
HIV 50 5.2
Syphilis 11 1.1
Tuberculosis 10 1.0
Total Rate
Chlamydia 2,478 258.1
Giardiasis 40 4.2
Gonorrhea 469 48.9
Hepatitis: Type A 9 ND
Total Rate
Lyme Disease 377 39.3
Salmonellosis 79 8.2
Total Rate
Campylobacteriosis 68 7.1 Hep. B* Acute 36 3.8
Shigellosis 12 1.3
*Hepatitis: Type B **Meningococcal Disease
Meningococcal** < 5 ND
Pertussis 23 2.4
Hep. B* Chronic 112 11.7
Chickenpox 45 4.7
Islander
Note: Communicable diseases with demographic counts of 1 to 4 are displayed as "< 5" to avoid potential identification of cases within certain geographic areas.
Multi - Race
ND
54.1
ND

Luzerne County PAGE 2
Mortality (2014 Residents)
Selected Major Causes of Death, Number and Average Annual Age-Adjusted Death Rate* (2012-2014)
Number of Resident Deaths 4,001
Crude Death Rate per 1,000 12.5
Age-Adjusted Death Rate per 1,000 8.4
Number of Infant Deaths (< 1 Year of Age) 13 4 4 5
AllRaces BlackWhite
Hispanic(any race)
Infant Mortality Rate per 1,000 Live Births 4.1 ND ND ND
Average Annual Infant Mortality Rate (2012-2014) 7.1 5.4 23.3 10.5
Cause Total Rate
Diseases of Heart 3,184
Cancer 2,569
Stroke 419
C.L.R.D.** 620
Accidents 488
204.6
184.9
28.1
42.0
46.2
Cause Total Rate
Influenza/Pneumonia 199
Diabetes Mellitus 521
Septicemia 188
Nephritis/Nephrosis 253
Alzheimer's Disease 270
12.6
36.0
13.7
16.8
16.3
* Per 100,000 2000 U.S. standardmillion population. Age-adjusted rates
** Chronic Lower Respiratory Disease
Selected Leading Causes of Death, Number by Age Group (2014)
Under 5 Years of Age 5-24 Years of Age 25-44 Years of Age 45-64 Years of Age 65 Years and Older
Perinatal Conditions 10 Accidents 12
Suicide 5
Cancer 3
Accidents 43
Suicide 14
Cancer 12
Diseases of Heart 7
Cancer 185
Diseases of Heart 87
Accidents 44
Diabetes Mellitus 27
Suicide 26
Diseases of Heart 919
Cancer 661
C.L.R.D.** 173
Diabetes Mellitus 158
Stroke 130
TOTAL 13 TOTAL 30 TOTAL 123 TOTAL 663 TOTAL 3,172
Note: Total includes all other causes.
Asian/PI*
0
ND
*Asian/Pacific Islander ^ NA = Multi-Race data not available before 2013.
are only comparable if the samestandard million population was usedin the calculation.
Invasive Cancer Incidence and Average Annual Age-Adjusted Rates* for Major Sites by Sex
All Sites 3,256 554.3
Prostate 643 102.4
Lung and Bronchus 495 84.2
Colon and Rectum 361 63.3
Male FemaleTotal Rate Total Rate
Female Breast 820 121.3
3,317 477.6
421 56.6
315 40.4
*Per 100,000 2000 U.S. standard million population. Age-adjusted rates are only comparable if the same standard million population was used in the calculation.
- -
- -
Male FemaleTotal Rate Total Rate
Non-Hodgkin Lymphoma 167 28.5
Melanoma of the Skin 146 25.1
142 19.0
273 38.8
82 13.4
Corpus and Uterus, NOS - -
Urinary Bladder 251
Kidney and Renal Pelvis 111 19.0
43.9 101
83
13.2
12.2
Notes: All in situ cases, except for urinary bladder, are excluded. Age-adjusted rates based on less than 20 events are statistically unreliable and are not displayed (ND).
Cancer Incidence (2011-2013 Residents)
Adult Behavioral Health Risk Factors (2012-2014)[Includes: Lackawanna, Luzerne, and Wyoming Counties]
General Notes: Crude and age-adjusted rates based on less than 10 events are considered statistically unreliable and are not displayed (ND), unless otherwise noted. Starting in 2013, race of resident was derived from multiple race selections. A person is Multi-Race if they identify as more than one race. Prior to 2013, race of resident was derived from a single race designation.
Percent (CI)Risk Factors
Fair or poor general health:
Obese:
Overweight (includes obese):
No health insurance (ages 18-64):
Visited a doctor in the past 2 yearsfor a routine check-up:
Percent (CI)Risk Factors
Ever told they have diabetes: Currently has asthma:
Current smoker:
Ever tested for HIV (ages 18-64):
Needed to see a doctor but couldnot due to cost in the past year:
18
31
(16 - 20)
(28 - 34)
67 (63 - 70)
16 (13 - 20)
86 (83 - 89)
11 10(9 - 13) (8 - 12)
24 (21 - 27)
35 (31 - 39)
14 (11 - 17)
Notes: Data are based on 2012-2014 annual sample surveys of Pennsylvania adults. CI= 95% Confidence Interval.
Additional state or county/regional data are available at www.statistics.health.pa.gov.
^In situ, benign, and uncertain neoplasms
Multi- Race
2
ND
NAND ^

Luzerne County PAGE 3
Hospitals (7/13-6/14)
Total General Acute Care
Psychiatric Rehabilitation
6 3 1 1
General Hospitals
Beds Set Up and Staffed 789
Admissions 37,191
Beds per 1,000 Population 2.5
Admissions per 1,000 Population 116.6
Average Inpatient Occupancy Rate 63.3
Nursing Homes (2014)
Total Number Certified-Medicare Certified-Medicaid
Nursing Homes
Licensed/Approved Beds
25 25 24
2,772 2,772 2,747
45.9
Average Occupancy Rate 90.0
Average Length of Stay (Number of Days) 166.3
$290
Total Licensed/Approved Beds per 1,000 Population Age 65 and Older
Average Semi-Private Daily Room Rate
Drug and Alcohol Treatment
Admissions to Client Primary Diagnosis
Drug Abuse Alcohol Abuse Other*
Percent Admitted
Only Once During 7/13-6/14
857 325 170 53 58.8
* Includes family members receiving counseling.
All Licensed Facilities Inpatient Non-Hospital
Inpatient Hospital Partial Hospitalization Outpatient17
7
1 4 10
Note: Each licensed facility may provide more than one type of service.
State-Supported Facilities
Types of Service Provided
Number of
Clients Admitted
548
Admission by County of Residence (7/13-6/14)
Treatment Facilities (as of 6/14)
Correctional Institution 0
General Note: Crude rates based on less than 10 events are considered statistically unreliable and are not displayed (ND), unless otherwise noted.
Services Funding
Other
1
Non-Profit
3
For Profit
2
State
0
Other
1
Ambulatory Surgery Centers (7/13-6/14)
Employees
Part Time Employees 204
Full Time Employees 338
Contracted Employees 76
Payroll Employees 466 Staff with Clinical Privileges 492
Total Surgical Visits per Employee 57.0
Total Facilities 12 Total Surgical Visits 30,884
Percent of Surgical Visits, Age 65+ 44.1
Total Operating Rooms 31 Total Surgical Visits per Operating Room 996.3
Facilities Surgical Visits
Staff Licensed as M.D. 388
Total Employees per Operating Room 17.5
Average Semi-Private Daily Room Rate $1,378
Total Employees 542

PAGE 4Luzerne County
Pennsylvania Health Care Workforce (2013-2014)
Notes: Only health care employees renewing their license in 2013-2014 were surveyed.The "Estimated Number" and "Percent of Workforce Intending to Remain in Profession for 6 or More Years" used to compute each "% Change from Previous Survey Year" are adjusted based on the response rates for the previous and current survey results. The survey results are available every two years. Numbers and percentages pertain to county of employment.Percentages based on less than six responses are considered statistically unreliable and are not displayed (ND).Registered Nurses and Licensed Practical Nurses are not comparable to previous survey period, so some data is not available (DNA).
Licensed Practical Nurses (2014) 1,253 DNA 85.1% DNA
Physicians (2014) 700
Dentists (2013) 175
Registered Nurses (2012/2013) 3,974 DNA 79.9% DNA
-2.0% 70.5% -1.5%
2.7% 76.3% 5.6%
Estimated Number
Percent Changefrom Previous
Survey
Difference in Percent from
Previous Survey
Percent of WorkforceIntending to Remain in
Profession for 6 or More Years
Injury Hospitalizations (2014)
Injury Hospitalizations and Median Charges by Age and Sex
Injury Hospitalizations and Median Charges by Type of Payor
Injury Hospitalizations and Median Charges by Mechanism/Intent and Sex
0-4 5-14 15-24 25-44 45-64 65 and Older
Male - Total
Male - Median Charges
Female - Total
Female - Median Charges
UnintentionalMotor Vehicle All Poisonings Unintentional Falls
Unintentional Fire/Flame or Hot Object/Substance All Firearm All Other Injuries
Male - Total
Male - Median Charges
Female - Total
Female - Median Charges
Medicare Medicaid Other Government Commercial / Private Blue Cross Uninsured
Total Hospitalizations
Median Charges
All Ages
1,551 28 21 124 276 459 643
$45,733.41 $33,073.76 $30,534.24 $42,394.91 $45,386.26 $49,502.81 $44,699.76
1,918 12 17 47 150 397 1,295
$42,346.04 $19,651.34 $27,789.07 $23,154.70 $36,934.27 $45,939.81 $43,302.04
Note: Median charges not displayed (ND) for occurrences less than 10.
332,111 420 32246760
$42,122.30 $43,302.04 $44,313.02 $44,243.65 $46,873.31 $63,741.24
446
556
74
128
182
143
1,196
663
18
42
2
19
$39,469.79
$45,911.71
$58,860.09
$62,353.62
$26,579.90
$28,388.30
$45,213.81
$47,192.53
$36,350.17
$50,923.89
ND
$97,331.54
Disclaimer: Injury data used in this report were provided to the Pennsylvania Department of Health by the Pennsylvania Health Care Cost Containment Council. The Pennsylvania Health Care Cost Containment Council specifically disclaims responsibility for any interpretations or conclusions. Contents may be republished or reproduced whole or in part, with attribution.

Lycoming CountyHealth Profile 2016
Demographic Data (2014)
% Population Change 2010 to 2014 0.3
Median Age of the Population (2010-2014) 41.3
% Population Aged 65 and Over 17.5
Population per Square Mile 94.8
% Population with Income Below Poverty Level (2010-2014) 14.8
Per Capita Personal Income $39,766
% Labor Force Unemployed - Annual Average 6.2
% Population Eligible for Medical Assistance 17.8
Estimated Population by Age and Sex (2014)
Age Total Male Female Age Total Male Female
All Ages 116,508
Under 5 6,574
5-14 13,397
15-24 15,778
25-34 14,838
57,313
3,439
6,755
8,425
7,516
59,195
3,135
6,642
7,353
7,322
35-44 12,937
45-54 15,991
55-64 16,569
65-74 10,938
75+ 9,486
6,324
7,732
8,220
5,129
3,773
6,613
8,259
8,349
5,809
5,713
Natality and Reported Pregnancies^ (2014 Residents)
Crude Birth Rate11.2
Average Annual General60.5
% Low Birth Weight 8.6
% Prenatal Care in 1st Trimester 73.6
% Births to Mothers Under 18 1.7
7.9
74.8
1.4
19.2
60.3
ND
Per 1,000 Population
Fertility Rate* (2012-2014)
All Races White Black
All Ages 1,446
Under 15 2
15-17 24
1,309
2
20
10
0
0
127
0
4
Age of WomanReported
PregnanciesLive
BirthsFetal
DeathsInduced
Abortions
Outcome
Age of WomanReported
PregnanciesLive
BirthsFetal
DeathsInduced
Abortions
Outcome
18-19 77
20-29 834
30 and Over 505
65
751
467
1
7
2
11
76
36
All Ages* 61.5
Under 15** ND
15-17 10.3
67.9
ND
12.4
Age of Woman Birth Rate Reported Pregnancy Rate Age of Woman Birth Rate Reported Pregnancy Rate
18-19 40.9
20-29 98.6
30 and Over** 33.3
48.5
109.5
36.0
^Live births, fetal deaths of 16+ weeks gestation, and induced abortions performed in-state. Notes: All ages includes any unknown ages. All rates per 1,000.*All Ages includes female population ages 15-44. ** Under 15 includes female population ages 10-14; 30 and Over includes female population ages 30-49.
Hispanic
ND
72.7
ND
(of any race)
ND
ND
ND
Asian / Pacific
General Notes: Crude and age-adjusted rates based on less than 10 events are considered statistically unreliable and are not displayed (ND), unless otherwise noted. Starting in 2013, race of resident was derived from multiple race selections. A person is Multi-Race if they identify as more than one race. Prior to 2013, race of resident was derived from a single race designation.
Morbidity (2012-2014 Residents)
Reported Incidence and Average Annual Rate (per 100,000) for Selected Notifiable Diseases (2012-2014)
HIV 14 4.0
Syphilis 16 4.6
Tuberculosis < 5 ND
Total Rate
Chlamydia 1,323 377.5
Giardiasis 68 19.4
Gonorrhea 197 56.2
Hepatitis: Type A < 5 ND
Total Rate
Lyme Disease 331 94.5
Salmonellosis 49 14.0
Total Rate
Campylobacteriosis 34 9.7 Hep. B* Acute < 5 ND
Shigellosis 0 ND
*Hepatitis: Type B **Meningococcal Disease
Meningococcal** < 5 ND
Pertussis 5 ND
Hep. B* Chronic 26 7.4
Chickenpox 25 7.1
Islander
Note: Communicable diseases with demographic counts of 1 to 4 are displayed as "< 5" to avoid potential identification of cases within certain geographic areas.
Multi - Race
ND
72.1
ND
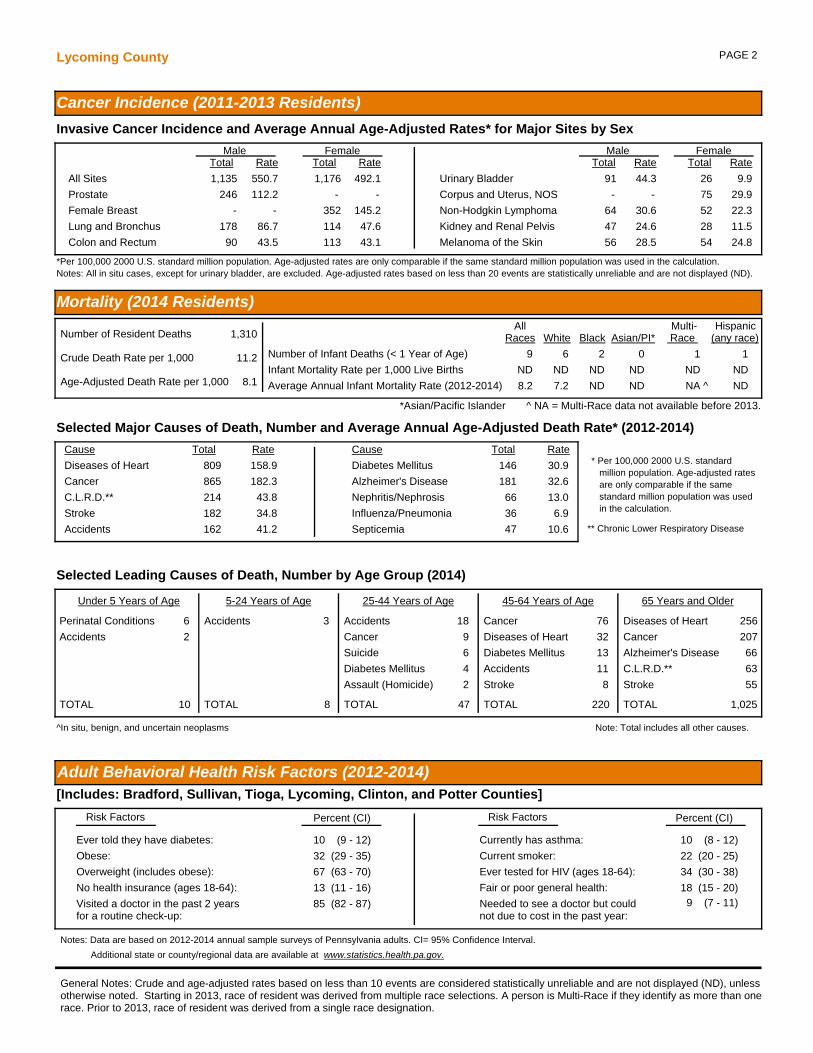
Lycoming County PAGE 2
Mortality (2014 Residents)
Selected Major Causes of Death, Number and Average Annual Age-Adjusted Death Rate* (2012-2014)
Number of Resident Deaths 1,310
Crude Death Rate per 1,000 11.2
Age-Adjusted Death Rate per 1,000 8.1
Number of Infant Deaths (< 1 Year of Age) 9 6 2 1
AllRaces BlackWhite
Hispanic(any race)
Infant Mortality Rate per 1,000 Live Births ND ND ND ND
Average Annual Infant Mortality Rate (2012-2014) 8.2 7.2 ND ND
Cause Total Rate
Diseases of Heart 809
Cancer 865
Stroke 182
C.L.R.D.** 214
Accidents 162
158.9
182.3
34.8
43.8
41.2
Cause Total Rate
Influenza/Pneumonia 36
Diabetes Mellitus 146
Septicemia 47
Nephritis/Nephrosis 66
Alzheimer's Disease 181
6.9
30.9
10.6
13.0
32.6
* Per 100,000 2000 U.S. standardmillion population. Age-adjusted rates
** Chronic Lower Respiratory Disease
Selected Leading Causes of Death, Number by Age Group (2014)
Under 5 Years of Age 5-24 Years of Age 25-44 Years of Age 45-64 Years of Age 65 Years and Older
Perinatal Conditions 6
Accidents 2
Accidents 3 Accidents 18
Cancer 9
Suicide 6
Diabetes Mellitus 4
Assault (Homicide) 2
Cancer 76
Diseases of Heart 32
Diabetes Mellitus 13
Accidents 11
Stroke 8
Diseases of Heart 256
Cancer 207
Alzheimer's Disease 66
C.L.R.D.** 63
Stroke 55
TOTAL 10 TOTAL 8 TOTAL 47 TOTAL 220 TOTAL 1,025
Note: Total includes all other causes.
Asian/PI*
0
ND
*Asian/Pacific Islander ^ NA = Multi-Race data not available before 2013.
are only comparable if the samestandard million population was usedin the calculation.
Invasive Cancer Incidence and Average Annual Age-Adjusted Rates* for Major Sites by Sex
All Sites 1,135 550.7
Prostate 246 112.2
Lung and Bronchus 178 86.7
Colon and Rectum 90 43.5
Male FemaleTotal Rate Total Rate
Female Breast 352 145.2
1,176 492.1
114 47.6
113 43.1
*Per 100,000 2000 U.S. standard million population. Age-adjusted rates are only comparable if the same standard million population was used in the calculation.
- -
- -
Male FemaleTotal Rate Total Rate
Non-Hodgkin Lymphoma 64 30.6
Melanoma of the Skin 56 28.5
52 22.3
75 29.9
54 24.8
Corpus and Uterus, NOS - -
Urinary Bladder 91
Kidney and Renal Pelvis 47 24.6
44.3 26
28
9.9
11.5
Notes: All in situ cases, except for urinary bladder, are excluded. Age-adjusted rates based on less than 20 events are statistically unreliable and are not displayed (ND).
Cancer Incidence (2011-2013 Residents)
Adult Behavioral Health Risk Factors (2012-2014)[Includes: Bradford, Sullivan, Tioga, Lycoming, Clinton, and Potter Counties]
General Notes: Crude and age-adjusted rates based on less than 10 events are considered statistically unreliable and are not displayed (ND), unless otherwise noted. Starting in 2013, race of resident was derived from multiple race selections. A person is Multi-Race if they identify as more than one race. Prior to 2013, race of resident was derived from a single race designation.
Percent (CI)Risk Factors
Fair or poor general health:
Obese:
Overweight (includes obese):
No health insurance (ages 18-64):
Visited a doctor in the past 2 yearsfor a routine check-up:
Percent (CI)Risk Factors
Ever told they have diabetes: Currently has asthma:
Current smoker:
Ever tested for HIV (ages 18-64):
Needed to see a doctor but couldnot due to cost in the past year:
18
32
(15 - 20)
(29 - 35)
67 (63 - 70)
13 (11 - 16)
85 (82 - 87)
10 10(9 - 12) (8 - 12)
22 (20 - 25)
34 (30 - 38)
9 (7 - 11)
Notes: Data are based on 2012-2014 annual sample surveys of Pennsylvania adults. CI= 95% Confidence Interval.
Additional state or county/regional data are available at www.statistics.health.pa.gov.
^In situ, benign, and uncertain neoplasms
Multi- Race
1
ND
NAND ^

Lycoming County PAGE 3
Hospitals (7/13-6/14)
Total General Acute Care
Psychiatric Rehabilitation
4 3 1 0
General Hospitals
Beds Set Up and Staffed 253
Admissions 13,338
Beds per 1,000 Population 2.2
Admissions per 1,000 Population 114.5
Average Inpatient Occupancy Rate 66.7
Nursing Homes (2014)
Total Number Certified-Medicare Certified-Medicaid
Nursing Homes
Licensed/Approved Beds
8 8 8
1,084 1,084 1,084
53.1
Average Occupancy Rate 92.1
Average Length of Stay (Number of Days) 182.9
$268
Total Licensed/Approved Beds per 1,000 Population Age 65 and Older
Average Semi-Private Daily Room Rate
Drug and Alcohol Treatment
Admissions to Client Primary Diagnosis
Drug Abuse Alcohol Abuse Other*
Percent Admitted
Only Once During 7/13-6/14
722 249 132 114 68.9
* Includes family members receiving counseling.
All Licensed Facilities Inpatient Non-Hospital
Inpatient Hospital Partial Hospitalization Outpatient6
0
0 2 5
Note: Each licensed facility may provide more than one type of service.
State-Supported Facilities
Types of Service Provided
Number of
Clients Admitted
495
Admission by County of Residence (7/13-6/14)
Treatment Facilities (as of 6/14)
Correctional Institution 0
General Note: Crude rates based on less than 10 events are considered statistically unreliable and are not displayed (ND), unless otherwise noted.
Services Funding
Other
0
Non-Profit
4
For Profit
0
State
0
Other
0
Ambulatory Surgery Centers (7/13-6/14)
Employees
Part Time Employees 7
Full Time Employees 18
Contracted Employees 6
Payroll Employees 19 Staff with Clinical Privileges 4
Total Surgical Visits per Employee 159.5
Total Facilities 2 Total Surgical Visits 3,988
Percent of Surgical Visits, Age 65+ 38.6
Total Operating Rooms 3 Total Surgical Visits per Operating Room 1,329.3
Facilities Surgical Visits
Staff Licensed as M.D. 4
Total Employees per Operating Room 8.3
Average Semi-Private Daily Room Rate $848
Total Employees 25

PAGE 4Lycoming County
Pennsylvania Health Care Workforce (2013-2014)
Notes: Only health care employees renewing their license in 2013-2014 were surveyed.The "Estimated Number" and "Percent of Workforce Intending to Remain in Profession for 6 or More Years" used to compute each "% Change from Previous Survey Year" are adjusted based on the response rates for the previous and current survey results. The survey results are available every two years. Numbers and percentages pertain to county of employment.Percentages based on less than six responses are considered statistically unreliable and are not displayed (ND).Registered Nurses and Licensed Practical Nurses are not comparable to previous survey period, so some data is not available (DNA).
Licensed Practical Nurses (2014) 515 DNA 81.2% DNA
Physicians (2014) 238
Dentists (2013) 53
Registered Nurses (2012/2013) 1,285 DNA 82.6% DNA
-5.1% 68.4% 7.5%
5.6% 73.9% -1.1%
Estimated Number
Percent Changefrom Previous
Survey
Difference in Percent from
Previous Survey
Percent of WorkforceIntending to Remain in
Profession for 6 or More Years
Injury Hospitalizations (2014)
Injury Hospitalizations and Median Charges by Age and Sex
Injury Hospitalizations and Median Charges by Type of Payor
Injury Hospitalizations and Median Charges by Mechanism/Intent and Sex
0-4 5-14 15-24 25-44 45-64 65 and Older
Male - Total
Male - Median Charges
Female - Total
Female - Median Charges
UnintentionalMotor Vehicle All Poisonings Unintentional Falls
Unintentional Fire/Flame or Hot Object/Substance All Firearm All Other Injuries
Male - Total
Male - Median Charges
Female - Total
Female - Median Charges
Medicare Medicaid Other Government Commercial / Private Blue Cross Uninsured
Total Hospitalizations
Median Charges
All Ages
524 12 8 47 88 151 218
$27,361.47 $18,622.00 ND $28,073.71 $23,049.51 $29,712.08 $30,135.40
595 11 5 23 47 123 386
$28,893.79 $18,476.74 ND $35,349.10 $27,899.51 $29,965.14 $28,666.75
Note: Median charges not displayed (ND) for occurrences less than 10.
29644 136 9620510
$10,949.84 $27,950.55 $22,546.54 $28,233.13 $35,995.71 $20,444.05
166
185
29
54
44
53
346
219
7
8
3
5
$31,794.94
$28,774.00
$48,160.80
$51,020.16
$12,182.51
$7,227.40
$28,224.50
$27,634.39
ND
ND
ND
ND
Disclaimer: Injury data used in this report were provided to the Pennsylvania Department of Health by the Pennsylvania Health Care Cost Containment Council. The Pennsylvania Health Care Cost Containment Council specifically disclaims responsibility for any interpretations or conclusions. Contents may be republished or reproduced whole or in part, with attribution.
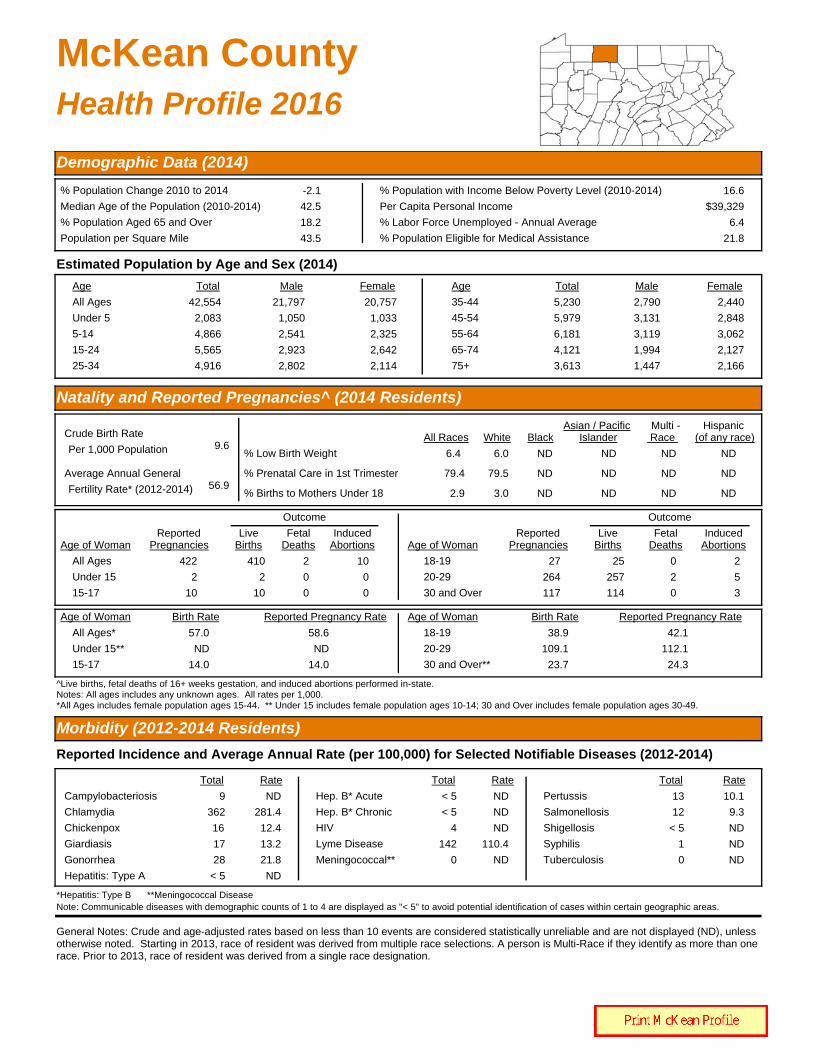
McKean CountyHealth Profile 2016
Demographic Data (2014)
% Population Change 2010 to 2014 -2.1
Median Age of the Population (2010-2014) 42.5
% Population Aged 65 and Over 18.2
Population per Square Mile 43.5
% Population with Income Below Poverty Level (2010-2014) 16.6
Per Capita Personal Income $39,329
% Labor Force Unemployed - Annual Average 6.4
% Population Eligible for Medical Assistance 21.8
Estimated Population by Age and Sex (2014)
Age Total Male Female Age Total Male Female
All Ages 42,554
Under 5 2,083
5-14 4,866
15-24 5,565
25-34 4,916
21,797
1,050
2,541
2,923
2,802
20,757
1,033
2,325
2,642
2,114
35-44 5,230
45-54 5,979
55-64 6,181
65-74 4,121
75+ 3,613
2,790
3,131
3,119
1,994
1,447
2,440
2,848
3,062
2,127
2,166
Natality and Reported Pregnancies^ (2014 Residents)
Crude Birth Rate9.6
Average Annual General56.9
% Low Birth Weight 6.4
% Prenatal Care in 1st Trimester 79.4
% Births to Mothers Under 18 2.9
6.0
79.5
3.0
ND
ND
ND
Per 1,000 Population
Fertility Rate* (2012-2014)
All Races White Black
All Ages 422
Under 15 2
15-17 10
410
2
10
2
0
0
10
0
0
Age of WomanReported
PregnanciesLive
BirthsFetal
DeathsInduced
Abortions
Outcome
Age of WomanReported
PregnanciesLive
BirthsFetal
DeathsInduced
Abortions
Outcome
18-19 27
20-29 264
30 and Over 117
25
257
114
0
2
0
2
5
3
All Ages* 57.0
Under 15** ND
15-17 14.0
58.6
ND
14.0
Age of Woman Birth Rate Reported Pregnancy Rate Age of Woman Birth Rate Reported Pregnancy Rate
18-19 38.9
20-29 109.1
30 and Over** 23.7
42.1
112.1
24.3
^Live births, fetal deaths of 16+ weeks gestation, and induced abortions performed in-state. Notes: All ages includes any unknown ages. All rates per 1,000.*All Ages includes female population ages 15-44. ** Under 15 includes female population ages 10-14; 30 and Over includes female population ages 30-49.
Hispanic
ND
ND
ND
(of any race)
ND
ND
ND
Asian / Pacific
General Notes: Crude and age-adjusted rates based on less than 10 events are considered statistically unreliable and are not displayed (ND), unless otherwise noted. Starting in 2013, race of resident was derived from multiple race selections. A person is Multi-Race if they identify as more than one race. Prior to 2013, race of resident was derived from a single race designation.
Morbidity (2012-2014 Residents)
Reported Incidence and Average Annual Rate (per 100,000) for Selected Notifiable Diseases (2012-2014)
HIV 4 ND
Syphilis 1 ND
Tuberculosis 0 ND
Total Rate
Chlamydia 362 281.4
Giardiasis 17 13.2
Gonorrhea 28 21.8
Hepatitis: Type A < 5 ND
Total Rate
Lyme Disease 142 110.4
Salmonellosis 12 9.3
Total Rate
Campylobacteriosis 9 ND Hep. B* Acute < 5 ND
Shigellosis < 5 ND
*Hepatitis: Type B **Meningococcal Disease
Meningococcal** 0 ND
Pertussis 13 10.1
Hep. B* Chronic < 5 ND
Chickenpox 16 12.4
Islander
Note: Communicable diseases with demographic counts of 1 to 4 are displayed as "< 5" to avoid potential identification of cases within certain geographic areas.
Multi - Race
ND
ND
ND

McKean County PAGE 2
Mortality (2014 Residents)
Selected Major Causes of Death, Number and Average Annual Age-Adjusted Death Rate* (2012-2014)
Number of Resident Deaths 475
Crude Death Rate per 1,000 11.2
Age-Adjusted Death Rate per 1,000 7.9
Number of Infant Deaths (< 1 Year of Age) 3 3 0 0
AllRaces BlackWhite
Hispanic(any race)
Infant Mortality Rate per 1,000 Live Births ND ND ND ND
Average Annual Infant Mortality Rate (2012-2014) ND ND ND ND
Cause Total Rate
Diseases of Heart 493
Cancer 269
Stroke 62
C.L.R.D.** 92
Accidents 62
261.8
150.8
31.2
49.3
46.1
Cause Total Rate
Influenza/Pneumonia 33
Diabetes Mellitus 43
Septicemia 26
Nephritis/Nephrosis 42
Alzheimer's Disease 21
17.2
23.3
14.4
23.7
10.9
* Per 100,000 2000 U.S. standardmillion population. Age-adjusted rates
** Chronic Lower Respiratory Disease
Selected Leading Causes of Death, Number by Age Group (2014)
Under 5 Years of Age 5-24 Years of Age 25-44 Years of Age 45-64 Years of Age 65 Years and Older
Birth Defects 2 Accidents 3 Accidents 6
Cancer 2
Nephritis/Nephrosis 2
Cancer 25
Diseases of Heart 19
Diseases of Heart 121
Cancer 69
C.L.R.D.** 32
Stroke 15
TOTAL 3 TOTAL 4 TOTAL 16 TOTAL 83 TOTAL 369
Note: Total includes all other causes.
Asian/PI*
0
ND
*Asian/Pacific Islander ^ NA = Multi-Race data not available before 2013.
are only comparable if the samestandard million population was usedin the calculation.
Invasive Cancer Incidence and Average Annual Age-Adjusted Rates* for Major Sites by Sex
All Sites 397 489.8
Prostate 89 101.7
Lung and Bronchus 64 80.7
Colon and Rectum 39 49.0
Male FemaleTotal Rate Total Rate
Female Breast 105 127.5
387 455.2
57 60.9
36 37.2
*Per 100,000 2000 U.S. standard million population. Age-adjusted rates are only comparable if the same standard million population was used in the calculation.
- -
- -
Male FemaleTotal Rate Total Rate
Non-Hodgkin Lymphoma 15 ND
Melanoma of the Skin 15 ND
15 ND
24 31.6
17 ND
Corpus and Uterus, NOS - -
Urinary Bladder 28
Kidney and Renal Pelvis 15 ND
36.0 15
8
ND
ND
Notes: All in situ cases, except for urinary bladder, are excluded. Age-adjusted rates based on less than 20 events are statistically unreliable and are not displayed (ND).
Cancer Incidence (2011-2013 Residents)
Adult Behavioral Health Risk Factors (2012-2014)[Includes: Forest, Elk, Cameron, Clearfield, Jefferson, Clarion, McKean, and Warren Counties]
General Notes: Crude and age-adjusted rates based on less than 10 events are considered statistically unreliable and are not displayed (ND), unless otherwise noted. Starting in 2013, race of resident was derived from multiple race selections. A person is Multi-Race if they identify as more than one race. Prior to 2013, race of resident was derived from a single race designation.
Percent (CI)Risk Factors
Fair or poor general health:
Obese:
Overweight (includes obese):
No health insurance (ages 18-64):
Visited a doctor in the past 2 yearsfor a routine check-up:
Percent (CI)Risk Factors
Ever told they have diabetes: Currently has asthma:
Current smoker:
Ever tested for HIV (ages 18-64):
Needed to see a doctor but couldnot due to cost in the past year:
20
33
(17 - 22)
(30 - 36)
69 (66 - 72)
15 (12 - 18)
84 (81 - 86)
12 11(10 - 14) (9 - 13)
23 (21 - 26)
29 (26 - 33)
10 (8 - 12)
Notes: Data are based on 2012-2014 annual sample surveys of Pennsylvania adults. CI= 95% Confidence Interval.
Additional state or county/regional data are available at www.statistics.health.pa.gov.
^In situ, benign, and uncertain neoplasms
Multi- Race
0
ND
NAND ^

McKean County PAGE 3
Hospitals (7/13-6/14)
Total General Acute Care
Psychiatric Rehabilitation
2 2 0 0
General Hospitals
Beds Set Up and Staffed 118
Admissions 3,780
Beds per 1,000 Population 2.8
Admissions per 1,000 Population 88.8
Average Inpatient Occupancy Rate 40.6
Nursing Homes (2014)
Total Number Certified-Medicare Certified-Medicaid
Nursing Homes
Licensed/Approved Beds
6 6 6
586 586 586
75.8
Average Occupancy Rate 90.6
Average Length of Stay (Number of Days) 217.9
$211
Total Licensed/Approved Beds per 1,000 Population Age 65 and Older
Average Semi-Private Daily Room Rate
Drug and Alcohol Treatment
Admissions to Client Primary Diagnosis
Drug Abuse Alcohol Abuse Other*
Percent Admitted
Only Once During 7/13-6/14
375 161 156 6 87.0
* Includes family members receiving counseling.
All Licensed Facilities Inpatient Non-Hospital
Inpatient Hospital Partial Hospitalization Outpatient6
1
1 0 5
Note: Each licensed facility may provide more than one type of service.
State-Supported Facilities
Types of Service Provided
Number of
Clients Admitted
323
Admission by County of Residence (7/13-6/14)
Treatment Facilities (as of 6/14)
Correctional Institution 0
General Note: Crude rates based on less than 10 events are considered statistically unreliable and are not displayed (ND), unless otherwise noted.
Services Funding
Other
0
Non-Profit
2
For Profit
0
State
0
Other
0
Ambulatory Surgery Centers (7/13-6/14)
Employees
Part Time Employees -
Full Time Employees -
Contracted Employees -
Payroll Employees - Staff with Clinical Privileges -
Total Surgical Visits per Employee -
Total Facilities 0 Total Surgical Visits -
Percent of Surgical Visits, Age 65+ -
Total Operating Rooms - Total Surgical Visits per Operating Room -
Facilities Surgical Visits
Staff Licensed as M.D. -
Total Employees per Operating Room -
Average Semi-Private Daily Room Rate $669
Total Employees -

PAGE 4McKean County
Pennsylvania Health Care Workforce (2013-2014)
Notes: Only health care employees renewing their license in 2013-2014 were surveyed.The "Estimated Number" and "Percent of Workforce Intending to Remain in Profession for 6 or More Years" used to compute each "% Change from Previous Survey Year" are adjusted based on the response rates for the previous and current survey results. The survey results are available every two years. Numbers and percentages pertain to county of employment.Percentages based on less than six responses are considered statistically unreliable and are not displayed (ND).Registered Nurses and Licensed Practical Nurses are not comparable to previous survey period, so some data is not available (DNA).
Licensed Practical Nurses (2014) 195 DNA 84.5% DNA
Physicians (2014) 53
Dentists (2013) 16
Registered Nurses (2012/2013) 361 DNA 84.2% DNA
-0.2% 59.1% -1.3%
-5.4% 71.4% -1.9%
Estimated Number
Percent Changefrom Previous
Survey
Difference in Percent from
Previous Survey
Percent of WorkforceIntending to Remain in
Profession for 6 or More Years
Injury Hospitalizations (2014)
Injury Hospitalizations and Median Charges by Age and Sex
Injury Hospitalizations and Median Charges by Type of Payor
Injury Hospitalizations and Median Charges by Mechanism/Intent and Sex
0-4 5-14 15-24 25-44 45-64 65 and Older
Male - Total
Male - Median Charges
Female - Total
Female - Median Charges
UnintentionalMotor Vehicle All Poisonings Unintentional Falls
Unintentional Fire/Flame or Hot Object/Substance All Firearm All Other Injuries
Male - Total
Male - Median Charges
Female - Total
Female - Median Charges
Medicare Medicaid Other Government Commercial / Private Blue Cross Uninsured
Total Hospitalizations
Median Charges
All Ages
167 1 4 19 25 45 73
$23,231.96 ND ND $26,593.85 $30,634.29 $27,891.45 $19,325.05
177 2 3 10 30 34 98
$17,889.17 ND ND $7,709.39 $13,009.69 $28,239.89 $19,778.90
Note: Median charges not displayed (ND) for occurrences less than 10.
7203 36 35585
ND $18,729.38 $13,630.30 $27,502.31 $32,584.83 ND
53
73
8
22
27
11
87
59
2
0
0
2
$15,830.45
$21,512.04
ND
$48,920.05
$7,919.98
$12,783.09
$21,363.63
$23,230.23
ND
-
-
ND
Disclaimer: Injury data used in this report were provided to the Pennsylvania Department of Health by the Pennsylvania Health Care Cost Containment Council. The Pennsylvania Health Care Cost Containment Council specifically disclaims responsibility for any interpretations or conclusions. Contents may be republished or reproduced whole or in part, with attribution.

Mercer CountyHealth Profile 2016
Demographic Data (2014)
% Population Change 2010 to 2014 -1.5
Median Age of the Population (2010-2014) 43.6
% Population Aged 65 and Over 19.8
Population per Square Mile 170.8
% Population with Income Below Poverty Level (2010-2014) 14.0
Per Capita Personal Income $36,023
% Labor Force Unemployed - Annual Average 5.9
% Population Eligible for Medical Assistance 20.2
Estimated Population by Age and Sex (2014)
Age Total Male Female Age Total Male Female
All Ages 114,884
Under 5 5,650
5-14 13,003
15-24 16,133
25-34 11,778
56,541
2,888
6,524
8,565
6,019
58,343
2,762
6,479
7,568
5,759
35-44 12,581
45-54 15,929
55-64 17,010
65-74 11,699
75+ 11,101
6,328
8,035
8,356
5,446
4,380
6,253
7,894
8,654
6,253
6,721
Natality and Reported Pregnancies^ (2014 Residents)
Crude Birth Rate10.3
Average Annual General57.9
% Low Birth Weight 6.8
% Prenatal Care in 1st Trimester 68.5
% Births to Mothers Under 18 1.9
6.3
69.0
1.6
ND
66.7
ND
Per 1,000 Population
Fertility Rate* (2012-2014)
All Races White Black
All Ages 1,290
Under 15 0
15-17 26
1,181
0
22
13
0
0
96
0
4
Age of WomanReported
PregnanciesLive
BirthsFetal
DeathsInduced
Abortions
Outcome
Age of WomanReported
PregnanciesLive
BirthsFetal
DeathsInduced
Abortions
Outcome
18-19 75
20-29 726
30 and Over 463
67
661
431
1
5
7
7
60
25
All Ages* 60.3
Under 15** ND
15-17 10.5
65.9
ND
12.4
Age of Woman Birth Rate Reported Pregnancy Rate Age of Woman Birth Rate Reported Pregnancy Rate
18-19 40.2
20-29 99.3
30 and Over** 33.5
45.0
109.0
36.0
^Live births, fetal deaths of 16+ weeks gestation, and induced abortions performed in-state. Notes: All ages includes any unknown ages. All rates per 1,000.*All Ages includes female population ages 15-44. ** Under 15 includes female population ages 10-14; 30 and Over includes female population ages 30-49.
Hispanic
ND
ND
ND
(of any race)
ND
66.7
ND
Asian / Pacific
General Notes: Crude and age-adjusted rates based on less than 10 events are considered statistically unreliable and are not displayed (ND), unless otherwise noted. Starting in 2013, race of resident was derived from multiple race selections. A person is Multi-Race if they identify as more than one race. Prior to 2013, race of resident was derived from a single race designation.
Morbidity (2012-2014 Residents)
Reported Incidence and Average Annual Rate (per 100,000) for Selected Notifiable Diseases (2012-2014)
HIV 5 ND
Syphilis 0 ND
Tuberculosis < 5 ND
Total Rate
Chlamydia 1,206 348.8
Giardiasis 45 13.0
Gonorrhea 212 61.3
Hepatitis: Type A 0 ND
Total Rate
Lyme Disease 47 13.6
Salmonellosis 38 11.0
Total Rate
Campylobacteriosis 33 9.5 Hep. B* Acute < 5 ND
Shigellosis < 5 ND
*Hepatitis: Type B **Meningococcal Disease
Meningococcal** < 5 ND
Pertussis 32 9.3
Hep. B* Chronic 16 4.6
Chickenpox 30 8.7
Islander
Note: Communicable diseases with demographic counts of 1 to 4 are displayed as "< 5" to avoid potential identification of cases within certain geographic areas.
Multi - Race
ND
66.7
ND

Mercer County PAGE 2
Mortality (2014 Residents)
Selected Major Causes of Death, Number and Average Annual Age-Adjusted Death Rate* (2012-2014)
Number of Resident Deaths 1,355
Crude Death Rate per 1,000 11.8
Age-Adjusted Death Rate per 1,000 7.4
Number of Infant Deaths (< 1 Year of Age) 8 8 0 0
AllRaces BlackWhite
Hispanic(any race)
Infant Mortality Rate per 1,000 Live Births ND ND ND ND
Average Annual Infant Mortality Rate (2012-2014) 7.0 6.0 ND ND
Cause Total Rate
Diseases of Heart 1,057
Cancer 870
Stroke 227
C.L.R.D.** 228
Accidents 195
178.7
167.9
38.5
41.4
52.3
Cause Total Rate
Influenza/Pneumonia 85
Diabetes Mellitus 126
Septicemia 75
Nephritis/Nephrosis 69
Alzheimer's Disease 176
14.1
23.4
13.1
12.2
26.4
* Per 100,000 2000 U.S. standardmillion population. Age-adjusted rates
** Chronic Lower Respiratory Disease
Selected Leading Causes of Death, Number by Age Group (2014)
Under 5 Years of Age 5-24 Years of Age 25-44 Years of Age 45-64 Years of Age 65 Years and Older
Perinatal Conditions 7 Accidents 9
Suicide 2
Accidents 18
Suicide 11
Diseases of Heart 3
Cancer 2
Liver Dis./Cirrhosis 2
Cancer 80
Diseases of Heart 39
Accidents 20
C.L.R.D.** 10
Diseases of Heart 300
Cancer 194
Stroke 67
Alzheimer's Disease 61
C.L.R.D.** 60
TOTAL 9 TOTAL 15 TOTAL 44 TOTAL 223 TOTAL 1,064
Note: Total includes all other causes.
Asian/PI*
0
ND
*Asian/Pacific Islander ^ NA = Multi-Race data not available before 2013.
are only comparable if the samestandard million population was usedin the calculation.
Invasive Cancer Incidence and Average Annual Age-Adjusted Rates* for Major Sites by Sex
All Sites 1,210 544.7
Prostate 297 128.1
Lung and Bronchus 191 85.2
Colon and Rectum 126 56.1
Male FemaleTotal Rate Total Rate
Female Breast 355 143.4
1,152 463.7
136 49.2
103 37.0
*Per 100,000 2000 U.S. standard million population. Age-adjusted rates are only comparable if the same standard million population was used in the calculation.
- -
- -
Male FemaleTotal Rate Total Rate
Non-Hodgkin Lymphoma 48 20.7
Melanoma of the Skin 62 28.5
39 14.2
94 37.6
38 18.2
Corpus and Uterus, NOS - -
Urinary Bladder 96
Kidney and Renal Pelvis 38 17.6
43.0 29
30
9.8
12.0
Notes: All in situ cases, except for urinary bladder, are excluded. Age-adjusted rates based on less than 20 events are statistically unreliable and are not displayed (ND).
Cancer Incidence (2011-2013 Residents)
Adult Behavioral Health Risk Factors (2012-2014)[Includes: Crawford, Lawrence, Mercer, and Venango Counties]
General Notes: Crude and age-adjusted rates based on less than 10 events are considered statistically unreliable and are not displayed (ND), unless otherwise noted. Starting in 2013, race of resident was derived from multiple race selections. A person is Multi-Race if they identify as more than one race. Prior to 2013, race of resident was derived from a single race designation.
Percent (CI)Risk Factors
Fair or poor general health:
Obese:
Overweight (includes obese):
No health insurance (ages 18-64):
Visited a doctor in the past 2 yearsfor a routine check-up:
Percent (CI)Risk Factors
Ever told they have diabetes: Currently has asthma:
Current smoker:
Ever tested for HIV (ages 18-64):
Needed to see a doctor but couldnot due to cost in the past year:
17
35
(15 - 20)
(32 - 38)
66 (63 - 70)
16 (13 - 20)
83 (80 - 85)
13 10(11 - 15) (8 - 12)
24 (21 - 27)
28 (25 - 32)
13 (11 - 16)
Notes: Data are based on 2012-2014 annual sample surveys of Pennsylvania adults. CI= 95% Confidence Interval.
Additional state or county/regional data are available at www.statistics.health.pa.gov.
^In situ, benign, and uncertain neoplasms
Multi- Race
0
ND
NAND ^

Mercer County PAGE 3
Hospitals (7/13-6/14)
Total General Acute Care
Psychiatric Rehabilitation
4 4 0 0
General Hospitals
Beds Set Up and Staffed 477
Admissions 17,151
Beds per 1,000 Population 4.2
Admissions per 1,000 Population 149.3
Average Inpatient Occupancy Rate 43.4
Nursing Homes (2014)
Total Number Certified-Medicare Certified-Medicaid
Nursing Homes
Licensed/Approved Beds
13 13 11
1,123 1,123 1,065
49.3
Average Occupancy Rate 93.8
Average Length of Stay (Number of Days) 141.6
$242
Total Licensed/Approved Beds per 1,000 Population Age 65 and Older
Average Semi-Private Daily Room Rate
Drug and Alcohol Treatment
Admissions to Client Primary Diagnosis
Drug Abuse Alcohol Abuse Other*
Percent Admitted
Only Once During 7/13-6/14
493 239 139 4 79.6
* Includes family members receiving counseling.
All Licensed Facilities Inpatient Non-Hospital
Inpatient Hospital Partial Hospitalization Outpatient7
1
0 0 6
Note: Each licensed facility may provide more than one type of service.
State-Supported Facilities
Types of Service Provided
Number of
Clients Admitted
382
Admission by County of Residence (7/13-6/14)
Treatment Facilities (as of 6/14)
Correctional Institution 0
General Note: Crude rates based on less than 10 events are considered statistically unreliable and are not displayed (ND), unless otherwise noted.
Services Funding
Other
0
Non-Profit
2
For Profit
2
State
0
Other
0
Ambulatory Surgery Centers (7/13-6/14)
Employees
Part Time Employees -
Full Time Employees -
Contracted Employees -
Payroll Employees - Staff with Clinical Privileges -
Total Surgical Visits per Employee -
Total Facilities 0 Total Surgical Visits -
Percent of Surgical Visits, Age 65+ -
Total Operating Rooms - Total Surgical Visits per Operating Room -
Facilities Surgical Visits
Staff Licensed as M.D. -
Total Employees per Operating Room -
Average Semi-Private Daily Room Rate $936
Total Employees -

PAGE 4Mercer County
Pennsylvania Health Care Workforce (2013-2014)
Notes: Only health care employees renewing their license in 2013-2014 were surveyed.The "Estimated Number" and "Percent of Workforce Intending to Remain in Profession for 6 or More Years" used to compute each "% Change from Previous Survey Year" are adjusted based on the response rates for the previous and current survey results. The survey results are available every two years. Numbers and percentages pertain to county of employment.Percentages based on less than six responses are considered statistically unreliable and are not displayed (ND).Registered Nurses and Licensed Practical Nurses are not comparable to previous survey period, so some data is not available (DNA).
Licensed Practical Nurses (2014) 500 DNA 82.2% DNA
Physicians (2014) 270
Dentists (2013) 57
Registered Nurses (2012/2013) 1,349 DNA 81.3% DNA
0.7% 65.8% -1.7%
-7.4% 78.0% 5.3%
Estimated Number
Percent Changefrom Previous
Survey
Difference in Percent from
Previous Survey
Percent of WorkforceIntending to Remain in
Profession for 6 or More Years
Injury Hospitalizations (2014)
Injury Hospitalizations and Median Charges by Age and Sex
Injury Hospitalizations and Median Charges by Type of Payor
Injury Hospitalizations and Median Charges by Mechanism/Intent and Sex
0-4 5-14 15-24 25-44 45-64 65 and Older
Male - Total
Male - Median Charges
Female - Total
Female - Median Charges
UnintentionalMotor Vehicle All Poisonings Unintentional Falls
Unintentional Fire/Flame or Hot Object/Substance All Firearm All Other Injuries
Male - Total
Male - Median Charges
Female - Total
Female - Median Charges
Medicare Medicaid Other Government Commercial / Private Blue Cross Uninsured
Total Hospitalizations
Median Charges
All Ages
672 4 11 52 117 175 313
$26,737.00 ND $23,177.75 $21,466.93 $15,494.30 $37,733.00 $27,426.50
864 2 15 36 90 187 534
$22,911.93 ND $12,265.55 $10,659.09 $13,624.38 $23,356.00 $25,122.88
Note: Median charges not displayed (ND) for occurrences less than 10.
41957 187 10722814
$19,732.75 $24,950.00 $20,480.75 $20,721.55 $23,823.78 $42,460.43
286
295
27
34
94
57
447
273
10
11
0
2
$20,476.58
$27,959.75
$35,378.75
$37,325.75
$12,306.88
$11,172.93
$25,768.00
$27,349.30
$20,481.03
$66,068.00
-
ND
Disclaimer: Injury data used in this report were provided to the Pennsylvania Department of Health by the Pennsylvania Health Care Cost Containment Council. The Pennsylvania Health Care Cost Containment Council specifically disclaims responsibility for any interpretations or conclusions. Contents may be republished or reproduced whole or in part, with attribution.

Mifflin CountyHealth Profile 2016
Demographic Data (2014)
% Population Change 2010 to 2014 -0.3
Median Age of the Population (2010-2014) 43.3
% Population Aged 65 and Over 20.3
Population per Square Mile 113.3
% Population with Income Below Poverty Level (2010-2014) 15.8
Per Capita Personal Income $33,621
% Labor Force Unemployed - Annual Average 6.4
% Population Eligible for Medical Assistance 20.1
Estimated Population by Age and Sex (2014)
Age Total Male Female Age Total Male Female
All Ages 46,552
Under 5 2,778
5-14 5,934
15-24 5,241
25-34 5,007
22,879
1,435
3,064
2,686
2,524
23,673
1,343
2,870
2,555
2,483
35-44 5,230
45-54 6,569
55-64 6,342
65-74 5,088
75+ 4,363
2,580
3,261
3,133
2,395
1,801
2,650
3,308
3,209
2,693
2,562
Natality and Reported Pregnancies^ (2014 Residents)
Crude Birth Rate11.8
Average Annual General72.9
% Low Birth Weight 4.7
% Prenatal Care in 1st Trimester 66.7
% Births to Mothers Under 18 ND
4.7
66.8
ND
ND
ND
ND
Per 1,000 Population
Fertility Rate* (2012-2014)
All Races White Black
All Ages 586
Under 15 0
15-17 7
549
0
7
4
0
0
33
0
0
Age of WomanReported
PregnanciesLive
BirthsFetal
DeathsInduced
Abortions
Outcome
Age of WomanReported
PregnanciesLive
BirthsFetal
DeathsInduced
Abortions
Outcome
18-19 29
20-29 384
30 and Over 164
26
360
154
0
2
2
3
22
8
All Ages* 71.4
Under 15** ND
15-17 ND
76.2
ND
ND
Age of Woman Birth Rate Reported Pregnancy Rate Age of Woman Birth Rate Reported Pregnancy Rate
18-19 49.9
20-29 146.6
30 and Over** 28.0
55.7
156.4
29.8
^Live births, fetal deaths of 16+ weeks gestation, and induced abortions performed in-state. Notes: All ages includes any unknown ages. All rates per 1,000.*All Ages includes female population ages 15-44. ** Under 15 includes female population ages 10-14; 30 and Over includes female population ages 30-49.
Hispanic
ND
ND
ND
(of any race)
ND
ND
ND
Asian / Pacific
General Notes: Crude and age-adjusted rates based on less than 10 events are considered statistically unreliable and are not displayed (ND), unless otherwise noted. Starting in 2013, race of resident was derived from multiple race selections. A person is Multi-Race if they identify as more than one race. Prior to 2013, race of resident was derived from a single race designation.
Morbidity (2012-2014 Residents)
Reported Incidence and Average Annual Rate (per 100,000) for Selected Notifiable Diseases (2012-2014)
HIV 2 ND
Syphilis 0 ND
Tuberculosis 0 ND
Total Rate
Chlamydia 375 268.0
Giardiasis 15 10.7
Gonorrhea 13 9.3
Hepatitis: Type A < 5 ND
Total Rate
Lyme Disease 150 107.2
Salmonellosis 25 17.9
Total Rate
Campylobacteriosis 81 57.9 Hep. B* Acute < 5 ND
Shigellosis 0 ND
*Hepatitis: Type B **Meningococcal Disease
Meningococcal** 0 ND
Pertussis < 5 ND
Hep. B* Chronic 14 10.0
Chickenpox < 5 ND
Islander
Note: Communicable diseases with demographic counts of 1 to 4 are displayed as "< 5" to avoid potential identification of cases within certain geographic areas.
Multi - Race
ND
ND
ND

Mifflin County PAGE 2
Mortality (2014 Residents)
Selected Major Causes of Death, Number and Average Annual Age-Adjusted Death Rate* (2012-2014)
Number of Resident Deaths 533
Crude Death Rate per 1,000 11.4
Age-Adjusted Death Rate per 1,000 7.4
Number of Infant Deaths (< 1 Year of Age) 3 3 0 0
AllRaces BlackWhite
Hispanic(any race)
Infant Mortality Rate per 1,000 Live Births ND ND ND ND
Average Annual Infant Mortality Rate (2012-2014) 8.8 9.2 ND ND
Cause Total Rate
Diseases of Heart 380
Cancer 357
Stroke 81
C.L.R.D.** 123
Accidents 79
169.5
173.1
35.9
56.3
47.8
Cause Total Rate
Influenza/Pneumonia 35
Diabetes Mellitus 41
Septicemia 21
Nephritis/Nephrosis 24
Alzheimer's Disease 39
15.5
20.0
10.3
11.0
17.0
* Per 100,000 2000 U.S. standardmillion population. Age-adjusted rates
** Chronic Lower Respiratory Disease
Selected Leading Causes of Death, Number by Age Group (2014)
Under 5 Years of Age 5-24 Years of Age 25-44 Years of Age 45-64 Years of Age 65 Years and Older
Accidents 2 Accidents 5
Cancer 3
Cancer 30
Diseases of Heart 15
C.L.R.D.** 6
Accidents 5
Diabetes Mellitus 5
Diseases of Heart 123
Cancer 103
C.L.R.D.** 42
Stroke 28
Accidents 12
TOTAL 4 TOTAL 5 TOTAL 12 TOTAL 81 TOTAL 431
Note: Total includes all other causes.
Asian/PI*
0
ND
*Asian/Pacific Islander ^ NA = Multi-Race data not available before 2013.
are only comparable if the samestandard million population was usedin the calculation.
Invasive Cancer Incidence and Average Annual Age-Adjusted Rates* for Major Sites by Sex
All Sites 456 511.1
Prostate 82 87.2
Lung and Bronchus 90 96.1
Colon and Rectum 43 46.7
Male FemaleTotal Rate Total Rate
Female Breast 131 127.8
440 439.4
59 54.0
37 35.4
*Per 100,000 2000 U.S. standard million population. Age-adjusted rates are only comparable if the same standard million population was used in the calculation.
- -
- -
Male FemaleTotal Rate Total Rate
Non-Hodgkin Lymphoma 14 ND
Melanoma of the Skin 19 ND
19 ND
22 18.6
21 24.1
Corpus and Uterus, NOS - -
Urinary Bladder 44
Kidney and Renal Pelvis 17 ND
49.9 13
8
ND
ND
Notes: All in situ cases, except for urinary bladder, are excluded. Age-adjusted rates based on less than 20 events are statistically unreliable and are not displayed (ND).
Cancer Incidence (2011-2013 Residents)
Adult Behavioral Health Risk Factors (2012-2014)[Includes: Bedford, Blair, Huntingdon, Juniata, and Mifflin Counties]
General Notes: Crude and age-adjusted rates based on less than 10 events are considered statistically unreliable and are not displayed (ND), unless otherwise noted. Starting in 2013, race of resident was derived from multiple race selections. A person is Multi-Race if they identify as more than one race. Prior to 2013, race of resident was derived from a single race designation.
Percent (CI)Risk Factors
Fair or poor general health:
Obese:
Overweight (includes obese):
No health insurance (ages 18-64):
Visited a doctor in the past 2 yearsfor a routine check-up:
Percent (CI)Risk Factors
Ever told they have diabetes: Currently has asthma:
Current smoker:
Ever tested for HIV (ages 18-64):
Needed to see a doctor but couldnot due to cost in the past year:
20
35
(17 - 23)
(31 - 39)
68 (64 - 72)
18 (14 - 22)
82 (79 - 85)
12 12(10 - 15) (9 - 14)
24 (21 - 28)
34 (29 - 38)
12 (9 - 15)
Notes: Data are based on 2012-2014 annual sample surveys of Pennsylvania adults. CI= 95% Confidence Interval.
Additional state or county/regional data are available at www.statistics.health.pa.gov.
^In situ, benign, and uncertain neoplasms
Multi- Race
0
ND
NAND ^

Mifflin County PAGE 3
Hospitals (7/13-6/14)
Total General Acute Care
Psychiatric Rehabilitation
1 1 0 0
General Hospitals
Beds Set Up and Staffed 123
Admissions 4,943
Beds per 1,000 Population 2.6
Admissions per 1,000 Population 106.2
Average Inpatient Occupancy Rate 42.0
Nursing Homes (2014)
Total Number Certified-Medicare Certified-Medicaid
Nursing Homes
Licensed/Approved Beds
4 4 4
417 417 417
44.1
Average Occupancy Rate 96.5
Average Length of Stay (Number of Days) 210.8
$240
Total Licensed/Approved Beds per 1,000 Population Age 65 and Older
Average Semi-Private Daily Room Rate
Drug and Alcohol Treatment
Admissions to Client Primary Diagnosis
Drug Abuse Alcohol Abuse Other*
Percent Admitted
Only Once During 7/13-6/14
53 22 11 9 78.6
* Includes family members receiving counseling.
All Licensed Facilities Inpatient Non-Hospital
Inpatient Hospital Partial Hospitalization Outpatient3
1
0 1 2
Note: Each licensed facility may provide more than one type of service.
State-Supported Facilities
Types of Service Provided
Number of
Clients Admitted
42
Admission by County of Residence (7/13-6/14)
Treatment Facilities (as of 6/14)
Correctional Institution 0
General Note: Crude rates based on less than 10 events are considered statistically unreliable and are not displayed (ND), unless otherwise noted.
Services Funding
Other
0
Non-Profit
1
For Profit
0
State
0
Other
0
Ambulatory Surgery Centers (7/13-6/14)
Employees
Part Time Employees 21
Full Time Employees 19
Contracted Employees 3
Payroll Employees 37 Staff with Clinical Privileges 4
Total Surgical Visits per Employee 133.6
Total Facilities 2 Total Surgical Visits 5,343
Percent of Surgical Visits, Age 65+ 45.2
Total Operating Rooms 5 Total Surgical Visits per Operating Room 1,068.6
Facilities Surgical Visits
Staff Licensed as M.D. 4
Total Employees per Operating Room 8.0
Average Semi-Private Daily Room Rate $751
Total Employees 40

PAGE 4Mifflin County
Pennsylvania Health Care Workforce (2013-2014)
Notes: Only health care employees renewing their license in 2013-2014 were surveyed.The "Estimated Number" and "Percent of Workforce Intending to Remain in Profession for 6 or More Years" used to compute each "% Change from Previous Survey Year" are adjusted based on the response rates for the previous and current survey results. The survey results are available every two years. Numbers and percentages pertain to county of employment.Percentages based on less than six responses are considered statistically unreliable and are not displayed (ND).Registered Nurses and Licensed Practical Nurses are not comparable to previous survey period, so some data is not available (DNA).
Licensed Practical Nurses (2014) 272 DNA 87.0% DNA
Physicians (2014) 79
Dentists (2013) 15
Registered Nurses (2012/2013) 387 DNA 85.3% DNA
5.6% 56.9% -4.3%
6.6% 69.2% 10.9%
Estimated Number
Percent Changefrom Previous
Survey
Difference in Percent from
Previous Survey
Percent of WorkforceIntending to Remain in
Profession for 6 or More Years
Injury Hospitalizations (2014)
Injury Hospitalizations and Median Charges by Age and Sex
Injury Hospitalizations and Median Charges by Type of Payor
Injury Hospitalizations and Median Charges by Mechanism/Intent and Sex
0-4 5-14 15-24 25-44 45-64 65 and Older
Male - Total
Male - Median Charges
Female - Total
Female - Median Charges
UnintentionalMotor Vehicle All Poisonings Unintentional Falls
Unintentional Fire/Flame or Hot Object/Substance All Firearm All Other Injuries
Male - Total
Male - Median Charges
Female - Total
Female - Median Charges
Medicare Medicaid Other Government Commercial / Private Blue Cross Uninsured
Total Hospitalizations
Median Charges
All Ages
213 2 5 18 37 71 80
$25,893.23 ND ND $19,195.13 $28,703.27 $24,072.41 $23,215.36
277 3 5 15 34 44 176
$20,650.19 ND ND $11,775.46 $14,796.64 $22,286.61 $21,721.51
Note: Median charges not displayed (ND) for occurrences less than 10.
14290 67 42752
$33,476.85 $20,075.79 $13,103.42 $30,880.73 $39,998.50 ND
67
79
12
24
32
15
164
89
2
4
0
2
$25,544.98
$33,667.98
$58,922.21
$46,886.20
$11,044.20
$11,092.69
$20,959.31
$19,587.30
ND
ND
-
ND
Disclaimer: Injury data used in this report were provided to the Pennsylvania Department of Health by the Pennsylvania Health Care Cost Containment Council. The Pennsylvania Health Care Cost Containment Council specifically disclaims responsibility for any interpretations or conclusions. Contents may be republished or reproduced whole or in part, with attribution.
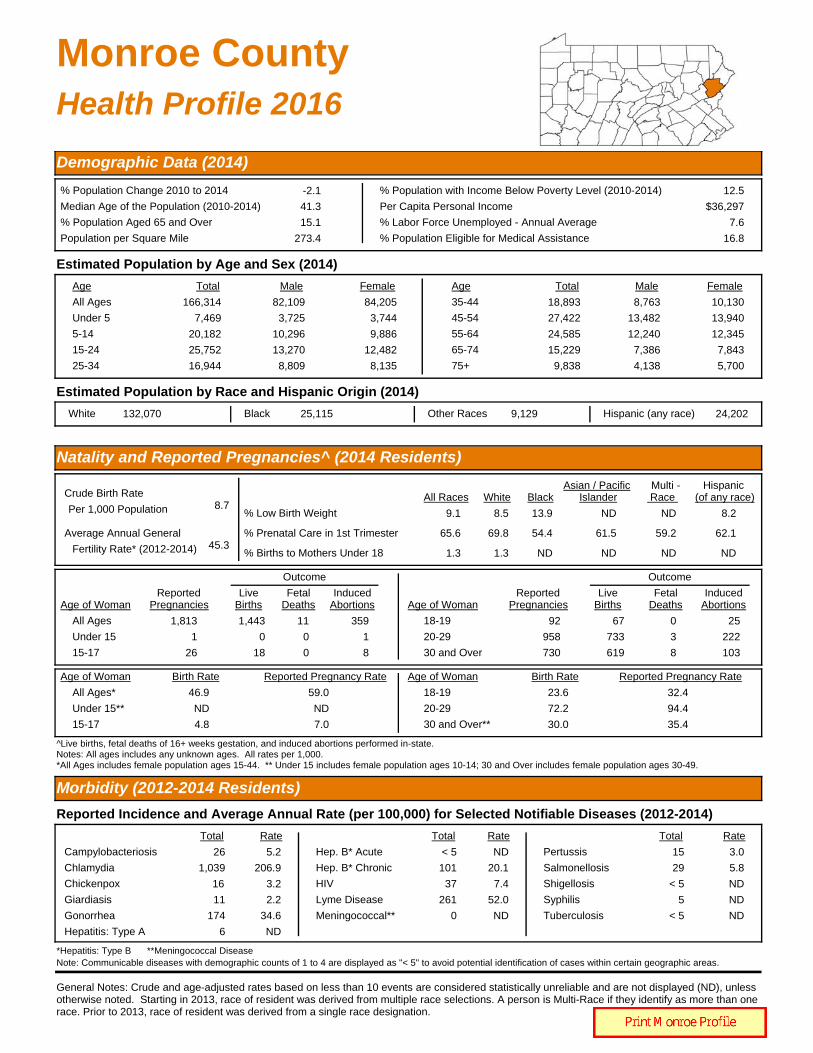
Monroe CountyHealth Profile 2016
Demographic Data (2014)
% Population Change 2010 to 2014 -2.1
Median Age of the Population (2010-2014) 41.3
% Population Aged 65 and Over 15.1
Population per Square Mile 273.4
% Population with Income Below Poverty Level (2010-2014) 12.5
Per Capita Personal Income $36,297
% Labor Force Unemployed - Annual Average 7.6
% Population Eligible for Medical Assistance 16.8
Estimated Population by Age and Sex (2014)
Age Total Male Female Age Total Male Female
All Ages 166,314
Under 5 7,469
5-14 20,182
15-24 25,752
25-34 16,944
82,109
3,725
10,296
13,270
8,809
84,205
3,744
9,886
12,482
8,135
35-44 18,893
45-54 27,422
55-64 24,585
65-74 15,229
75+ 9,838
8,763
13,482
12,240
7,386
4,138
10,130
13,940
12,345
7,843
5,700
Estimated Population by Race and Hispanic Origin (2014)
White 132,070 Black 25,115 Other Races 9,129 Hispanic (any race) 24,202
Natality and Reported Pregnancies^ (2014 Residents)
Crude Birth Rate8.7
Average Annual General45.3
% Low Birth Weight 9.1
% Prenatal Care in 1st Trimester 65.6
% Births to Mothers Under 18 1.3
8.5
69.8
1.3
13.9
54.4
ND
Per 1,000 Population
Fertility Rate* (2012-2014)
All Races White Black
All Ages 1,813
Under 15 1
15-17 26
1,443
0
18
11
0
0
359
1
8
Age of WomanReported
PregnanciesLive
BirthsFetal
DeathsInduced
Abortions
Outcome
Age of WomanReported
PregnanciesLive
BirthsFetal
DeathsInduced
Abortions
Outcome
18-19 92
20-29 958
30 and Over 730
67
733
619
0
3
8
25
222
103
All Ages* 46.9
Under 15** ND
15-17 4.8
59.0
ND
7.0
Age of Woman Birth Rate Reported Pregnancy Rate Age of Woman Birth Rate Reported Pregnancy Rate
18-19 23.6
20-29 72.2
30 and Over** 30.0
32.4
94.4
35.4
^Live births, fetal deaths of 16+ weeks gestation, and induced abortions performed in-state. Notes: All ages includes any unknown ages. All rates per 1,000.*All Ages includes female population ages 15-44. ** Under 15 includes female population ages 10-14; 30 and Over includes female population ages 30-49.
Hispanic
8.2
62.1
ND
(of any race)
ND
61.5
ND
Asian / Pacific
General Notes: Crude and age-adjusted rates based on less than 10 events are considered statistically unreliable and are not displayed (ND), unless otherwise noted. Starting in 2013, race of resident was derived from multiple race selections. A person is Multi-Race if they identify as more than one race. Prior to 2013, race of resident was derived from a single race designation.
Morbidity (2012-2014 Residents)
Reported Incidence and Average Annual Rate (per 100,000) for Selected Notifiable Diseases (2012-2014)
HIV 37 7.4
Syphilis 5 ND
Tuberculosis < 5 ND
Total Rate
Chlamydia 1,039 206.9
Giardiasis 11 2.2
Gonorrhea 174 34.6
Hepatitis: Type A 6 ND
Total Rate
Lyme Disease 261 52.0
Salmonellosis 29 5.8
Total Rate
Campylobacteriosis 26 5.2 Hep. B* Acute < 5 ND
Shigellosis < 5 ND
*Hepatitis: Type B **Meningococcal Disease
Meningococcal** 0 ND
Pertussis 15 3.0
Hep. B* Chronic 101 20.1
Chickenpox 16 3.2
Islander
Note: Communicable diseases with demographic counts of 1 to 4 are displayed as "< 5" to avoid potential identification of cases within certain geographic areas.
Multi - Race
ND
59.2
ND

Monroe County PAGE 2
Mortality (2014 Residents)
Selected Major Causes of Death, Number and Average Annual Age-Adjusted Death Rate* (2012-2014)
Number of Resident Deaths 1,333
Crude Death Rate per 1,000 8.0
Age-Adjusted Death Rate per 1,000 7.2
Number of Infant Deaths (< 1 Year of Age) 10 9 1 3
AllRaces BlackWhite
Hispanic(any race)
Infant Mortality Rate per 1,000 Live Births 6.9 ND ND ND
Average Annual Infant Mortality Rate (2012-2014) 7.5 6.4 ND ND
Cause Total Rate
Diseases of Heart 849
Cancer 1,034
Stroke 151
C.L.R.D.** 253
Accidents 222
156.9
176.1
28.0
46.1
43.3
Cause Total Rate
Influenza/Pneumonia 60
Diabetes Mellitus 179
Septicemia 53
Nephritis/Nephrosis 83
Alzheimer's Disease 88
11.3
31.9
9.3
15.7
17.9
* Per 100,000 2000 U.S. standardmillion population. Age-adjusted rates
** Chronic Lower Respiratory Disease
Selected Leading Causes of Death, Number by Age Group (2014)
Under 5 Years of Age 5-24 Years of Age 25-44 Years of Age 45-64 Years of Age 65 Years and Older
Perinatal Conditions 7 Accidents 15
Suicide 3
Cancer 2
Accidents 16
Suicide 9
Diseases of Heart 8
Cancer 7
Cancer 110
Diseases of Heart 53
Accidents 24
Diabetes Mellitus 13
Suicide 13
Cancer 232
Diseases of Heart 224
C.L.R.D.** 58
Stroke 47
Diabetes Mellitus 43
TOTAL 12 TOTAL 23 TOTAL 61 TOTAL 290 TOTAL 947
Note: Total includes all other causes.
Asian/PI*
0
ND
*Asian/Pacific Islander ^ NA = Multi-Race data not available before 2013.
are only comparable if the samestandard million population was usedin the calculation.
Invasive Cancer Incidence and Average Annual Age-Adjusted Rates* for Major Sites by Sex
All Sites 1,440 509.0
Prostate 321 107.9
Lung and Bronchus 240 87.6
Colon and Rectum 128 46.1
Male FemaleTotal Rate Total Rate
Female Breast 369 116.1
1,294 415.4
185 58.8
109 35.6
*Per 100,000 2000 U.S. standard million population. Age-adjusted rates are only comparable if the same standard million population was used in the calculation.
- -
- -
Male FemaleTotal Rate Total Rate
Non-Hodgkin Lymphoma 67 23.9
Melanoma of the Skin 42 15.8
35 11.4
96 28.2
52 18.0
Corpus and Uterus, NOS - -
Urinary Bladder 112
Kidney and Renal Pelvis 67 23.1
41.5 36
26
11.5
7.7
Notes: All in situ cases, except for urinary bladder, are excluded. Age-adjusted rates based on less than 20 events are statistically unreliable and are not displayed (ND).
Cancer Incidence (2011-2013 Residents)
Adult Behavioral Health Risk Factors (2012-2014)[Includes: Pike, Monroe, Susquehanna, and Wayne Counties]
General Notes: Crude and age-adjusted rates based on less than 10 events are considered statistically unreliable and are not displayed (ND), unless otherwise noted. Starting in 2013, race of resident was derived from multiple race selections. A person is Multi-Race if they identify as more than one race. Prior to 2013, race of resident was derived from a single race designation.
Percent (CI)Risk Factors
Fair or poor general health:
Obese:
Overweight (includes obese):
No health insurance (ages 18-64):
Visited a doctor in the past 2 yearsfor a routine check-up:
Percent (CI)Risk Factors
Ever told they have diabetes: Currently has asthma:
Current smoker:
Ever tested for HIV (ages 18-64):
Needed to see a doctor but couldnot due to cost in the past year:
21
31
(17 - 26)
(27 - 35)
68 (64 - 71)
18 (14 - 24)
82 (77 - 86)
9 13(7 - 11) (9 - 17)
25 (20 - 30)
33 (28 - 38)
14 (11 - 18)
Notes: Data are based on 2012-2014 annual sample surveys of Pennsylvania adults. CI= 95% Confidence Interval.
Additional state or county/regional data are available at www.statistics.health.pa.gov.
^In situ, benign, and uncertain neoplasms
Multi- Race
0
ND
NAND ^

Monroe County PAGE 3
Hospitals (7/13-6/14)
Total General Acute Care
Psychiatric Rehabilitation
1 1 0 0
General Hospitals
Beds Set Up and Staffed 235
Admissions 11,175
Beds per 1,000 Population 1.4
Admissions per 1,000 Population 67.2
Average Inpatient Occupancy Rate 57.5
Nursing Homes (2014)
Total Number Certified-Medicare Certified-Medicaid
Nursing Homes
Licensed/Approved Beds
4 4 4
510 510 510
20.3
Average Occupancy Rate 93.3
Average Length of Stay (Number of Days) 111.5
$280
Total Licensed/Approved Beds per 1,000 Population Age 65 and Older
Average Semi-Private Daily Room Rate
Drug and Alcohol Treatment
Admissions to Client Primary Diagnosis
Drug Abuse Alcohol Abuse Other*
Percent Admitted
Only Once During 7/13-6/14
372 201 68 10 72.8
* Includes family members receiving counseling.
All Licensed Facilities Inpatient Non-Hospital
Inpatient Hospital Partial Hospitalization Outpatient9
2
0 3 8
Note: Each licensed facility may provide more than one type of service.
State-Supported Facilities
Types of Service Provided
Number of
Clients Admitted
279
Admission by County of Residence (7/13-6/14)
Treatment Facilities (as of 6/14)
Correctional Institution 0
General Note: Crude rates based on less than 10 events are considered statistically unreliable and are not displayed (ND), unless otherwise noted.
Services Funding
Other
0
Non-Profit
1
For Profit
0
State
0
Other
0
Ambulatory Surgery Centers (7/13-6/14)
Employees
Part Time Employees 16
Full Time Employees 46
Contracted Employees 4
Payroll Employees 58 Staff with Clinical Privileges 100
Total Surgical Visits per Employee 119.6
Total Facilities 2 Total Surgical Visits 7,415
Percent of Surgical Visits, Age 65+ 46.4
Total Operating Rooms 7 Total Surgical Visits per Operating Room 1,059.3
Facilities Surgical Visits
Staff Licensed as M.D. 80
Total Employees per Operating Room 8.9
Average Semi-Private Daily Room Rate $1,620
Total Employees 62

PAGE 4Monroe County
Pennsylvania Health Care Workforce (2013-2014)
Notes: Only health care employees renewing their license in 2013-2014 were surveyed.The "Estimated Number" and "Percent of Workforce Intending to Remain in Profession for 6 or More Years" used to compute each "% Change from Previous Survey Year" are adjusted based on the response rates for the previous and current survey results. The survey results are available every two years. Numbers and percentages pertain to county of employment.Percentages based on less than six responses are considered statistically unreliable and are not displayed (ND).Registered Nurses and Licensed Practical Nurses are not comparable to previous survey period, so some data is not available (DNA).
Licensed Practical Nurses (2014) 349 DNA 84.0% DNA
Physicians (2014) 231
Dentists (2013) 62
Registered Nurses (2012/2013) 1,033 DNA 82.2% DNA
0.9% 71.1% -0.2%
17.0% 75.9% 7.8%
Estimated Number
Percent Changefrom Previous
Survey
Difference in Percent from
Previous Survey
Percent of WorkforceIntending to Remain in
Profession for 6 or More Years
Injury Hospitalizations (2014)
Injury Hospitalizations and Median Charges by Age and Sex
Injury Hospitalizations and Median Charges by Type of Payor
Injury Hospitalizations and Median Charges by Mechanism/Intent and Sex
0-4 5-14 15-24 25-44 45-64 65 and Older
Male - Total
Male - Median Charges
Female - Total
Female - Median Charges
UnintentionalMotor Vehicle All Poisonings Unintentional Falls
Unintentional Fire/Flame or Hot Object/Substance All Firearm All Other Injuries
Male - Total
Male - Median Charges
Female - Total
Female - Median Charges
Medicare Medicaid Other Government Commercial / Private Blue Cross Uninsured
Total Hospitalizations
Median Charges
All Ages
734 12 12 79 138 209 284
$34,948.15 $29,656.61 $28,469.88 $26,877.95 $30,643.79 $41,989.75 $35,531.12
710 12 10 51 76 178 383
$32,186.58 $17,010.67 $19,889.48 $14,228.97 $18,999.54 $38,412.98 $35,524.13
Note: Median charges not displayed (ND) for occurrences less than 10.
63747 178 15929011
$23,016.46 $35,886.11 $28,286.92 $29,958.67 $36,469.09 $55,751.79
232
286
45
89
111
84
313
257
8
13
1
5
$32,534.98
$37,619.61
$52,160.00
$48,492.20
$16,526.00
$15,232.39
$37,014.78
$35,993.57
ND
$50,740.26
ND
ND
Disclaimer: Injury data used in this report were provided to the Pennsylvania Department of Health by the Pennsylvania Health Care Cost Containment Council. The Pennsylvania Health Care Cost Containment Council specifically disclaims responsibility for any interpretations or conclusions. Contents may be republished or reproduced whole or in part, with attribution.

Montgomery CountyHealth Profile 2016
Demographic Data (2014)
% Population Change 2010 to 2014 2.1
Median Age of the Population (2010-2014) 41.0
% Population Aged 65 and Over 16.4
Population per Square Mile 1,691.1
% Population with Income Below Poverty Level (2010-2014) 6.4
Per Capita Personal Income $75,835
% Labor Force Unemployed - Annual Average 4.7
% Population Eligible for Medical Assistance 9.8
Estimated Population by Age and Sex (2014)
Age Total Male Female Age Total Male Female
All Ages 816,857
Under 5 45,813
5-14 101,579
15-24 97,831
25-34 101,813
397,160
23,526
51,907
49,311
51,406
419,697
22,287
49,672
48,520
50,407
35-44 102,674
45-54 121,877
55-64 111,423
65-74 70,323
75+ 63,524
50,826
59,366
53,824
32,581
24,413
51,848
62,511
57,599
37,742
39,111
Estimated Population by Race and Hispanic Origin (2014)
White 661,334 Black 77,124 Other Races 17,439 Hispanic (any race) 38,881
Natality and Reported Pregnancies^ (2014 Residents)
Crude Birth Rate10.8
Average Annual General58.6
% Low Birth Weight 7.5
% Prenatal Care in 1st Trimester 77.3
% Births to Mothers Under 18 0.6
6.6
82.6
0.3
11.1
58.5
2.2
Per 1,000 Population
Fertility Rate* (2012-2014)
All Races White Black
All Ages 10,610
Under 15 7
15-17 88
8,845
3
52
76
0
0
1,689
4
36
Age of WomanReported
PregnanciesLive
BirthsFetal
DeathsInduced
Abortions
Outcome
Age of WomanReported
PregnanciesLive
BirthsFetal
DeathsInduced
Abortions
Outcome
18-19 271
20-29 4,090
30 and Over 6,139
159
3,134
5,482
2
30
44
110
926
613
All Ages* 58.7
Under 15** ND
15-17 3.2
70.4
ND
5.4
Age of Woman Birth Rate Reported Pregnancy Rate Age of Woman Birth Rate Reported Pregnancy Rate
18-19 16.9
20-29 66.0
30 and Over** 51.1
28.8
86.2
57.2
^Live births, fetal deaths of 16+ weeks gestation, and induced abortions performed in-state. Notes: All ages includes any unknown ages. All rates per 1,000.*All Ages includes female population ages 15-44. ** Under 15 includes female population ages 10-14; 30 and Over includes female population ages 30-49.
Hispanic
7.6
52.8
2.0
(of any race)
Asian/PI* 60,960
8.6
75.0
ND
Asian / Pacific
General Notes: Crude and age-adjusted rates based on less than 10 events are considered statistically unreliable and are not displayed (ND), unless otherwise noted. Starting in 2013, race of resident was derived from multiple race selections. A person is Multi-Race if they identify as more than one race. Prior to 2013, race of resident was derived from a single race designation.
Morbidity (2012-2014 Residents)
Reported Incidence and Average Annual Rate (per 100,000) for Selected Notifiable Diseases (2012-2014)
HIV 157 6.4
Syphilis 53 2.2
Tuberculosis 58 2.4
Total Rate
Chlamydia 5,584 229.1
Giardiasis 108 4.4
Gonorrhea 1,015 41.6
Hepatitis: Type A 8 ND
Total Rate
Lyme Disease 940 38.6
Salmonellosis 365 15.0
Total Rate
Campylobacteriosis 307 12.6 Hep. B* Acute < 5 ND
Shigellosis 25 1.0
*Hepatitis: Type B **Meningococcal Disease
Meningococcal** 5 ND
Pertussis 405 16.6
Hep. B* Chronic 623 25.6
Chickenpox 177 7.3
Islander
*Asian/Pacific Islander
Note: Communicable diseases with demographic counts of 1 to 4 are displayed as "< 5" to avoid potential identification of cases within certain geographic areas.
Multi - Race
10.6
62.9
ND

Montgomery County PAGE 2
Mortality (2014 Residents)
Selected Major Causes of Death, Number and Average Annual Age-Adjusted Death Rate* (2012-2014)
Number of Resident Deaths 7,352
Crude Death Rate per 1,000 9.0
Age-Adjusted Death Rate per 1,000 6.5
Number of Infant Deaths (< 1 Year of Age) 34 16 13 6
AllRaces BlackWhite
Hispanic(any race)
Infant Mortality Rate per 1,000 Live Births 3.8 2.5 16.7 ND
Average Annual Infant Mortality Rate (2012-2014) 4.7 3.7 14.0 7.8
Cause Total Rate
Diseases of Heart 5,048
Cancer 4,939
Stroke 1,560
C.L.R.D.** 990
Accidents 1,041
143.6
154.2
44.0
29.8
36.5
Cause Total Rate
Influenza/Pneumonia 440
Diabetes Mellitus 530
Septicemia 355
Nephritis/Nephrosis 448
Alzheimer's Disease 499
12.7
16.4
10.8
13.1
13.6
* Per 100,000 2000 U.S. standardmillion population. Age-adjusted rates
** Chronic Lower Respiratory Disease
Selected Leading Causes of Death, Number by Age Group (2014)
Under 5 Years of Age 5-24 Years of Age 25-44 Years of Age 45-64 Years of Age 65 Years and Older
Perinatal Conditions 24
Septicemia 3
Birth Defects 2
Diseases of Heart 2
Accidents 33
Suicide 13
Assault (Homicide) 4
Cancer 3
Birth Defects 2
Accidents 75
Cancer 31
Suicide 26
Diseases of Heart 16
Cancer 383
Diseases of Heart 181
Accidents 79
Suicide 56
Stroke 39
Diseases of Heart 1,503
Cancer 1,257
Stroke 487
C.L.R.D.** 300
Accidents 171
TOTAL 38 TOTAL 62 TOTAL 210 TOTAL 1,110 TOTAL 5,932
Note: Total includes all other causes.
Asian/PI*
1
ND
*Asian/Pacific Islander ^ NA = Multi-Race data not available before 2013.
are only comparable if the samestandard million population was usedin the calculation.
Invasive Cancer Incidence and Average Annual Age-Adjusted Rates* for Major Sites by Sex
All Sites 7,156 529.8
Prostate 1,767 123.9
Lung and Bronchus 856 63.8
Colon and Rectum 594 44.0
Male FemaleTotal Rate Total Rate
Female Breast 2,197 139.5
7,447 461.4
819 48.1
636 37.0
*Per 100,000 2000 U.S. standard million population. Age-adjusted rates are only comparable if the same standard million population was used in the calculation.
- -
- -
Male FemaleTotal Rate Total Rate
Non-Hodgkin Lymphoma 360 27.2
Melanoma of the Skin 528 40.0
315 19.0
537 32.0
397 25.9
Corpus and Uterus, NOS - -
Urinary Bladder 604
Kidney and Renal Pelvis 291 21.2
45.6 173
162
9.8
9.6
Notes: All in situ cases, except for urinary bladder, are excluded. Age-adjusted rates based on less than 20 events are statistically unreliable and are not displayed (ND).
Cancer Incidence (2011-2013 Residents)
Adult Behavioral Health Risk Factors (2012-2014)[Includes: Montgomery County Only]
General Notes: Crude and age-adjusted rates based on less than 10 events are considered statistically unreliable and are not displayed (ND), unless otherwise noted. Starting in 2013, race of resident was derived from multiple race selections. A person is Multi-Race if they identify as more than one race. Prior to 2013, race of resident was derived from a single race designation.
Percent (CI)Risk Factors
Fair or poor general health:
Obese:
Overweight (includes obese):
No health insurance (ages 18-64):
Visited a doctor in the past 2 yearsfor a routine check-up:
Percent (CI)Risk Factors
Ever told they have diabetes: Currently has asthma:
Current smoker:
Ever tested for HIV (ages 18-64):
Needed to see a doctor but couldnot due to cost in the past year:
11
24
(9 - 13)
(22 - 28)
62 (59 - 65)
10 (8 - 13)
84 (82 - 87)
7 9(5 - 8) (7 - 11)
16 (14 - 19)
40 (36 - 44)
10 (8 - 12)
Notes: Data are based on 2012-2014 annual sample surveys of Pennsylvania adults. CI= 95% Confidence Interval.
Additional state or county/regional data are available at www.statistics.health.pa.gov.
^In situ, benign, and uncertain neoplasms
Multi- Race
1
ND
NAND ^

Montgomery County PAGE 3
Hospitals (7/13-6/14)
Total General Acute Care
Psychiatric Rehabilitation
15 9 4 0
General Hospitals
Beds Set Up and Staffed 2,028
Admissions 98,321
Beds per 1,000 Population 2.5
Admissions per 1,000 Population 120.4
Average Inpatient Occupancy Rate 59.4
Nursing Homes (2014)
Total Number Certified-Medicare Certified-Medicaid
Nursing Homes
Licensed/Approved Beds
59 59 48
6,998 6,998 6,364
52.3
Average Occupancy Rate 92.4
Average Length of Stay (Number of Days) 121.0
$371
Total Licensed/Approved Beds per 1,000 Population Age 65 and Older
Average Semi-Private Daily Room Rate
Drug and Alcohol Treatment
Admissions to Client Primary Diagnosis
Drug Abuse Alcohol Abuse Other*
Percent Admitted
Only Once During 7/13-6/14
1,750 681 253 173 61.2
* Includes family members receiving counseling.
All Licensed Facilities Inpatient Non-Hospital
Inpatient Hospital Partial Hospitalization Outpatient35
7
2 3 28
Note: Each licensed facility may provide more than one type of service.
State-Supported Facilities
Types of Service Provided
Number of
Clients Admitted
1,107
Admission by County of Residence (7/13-6/14)
Treatment Facilities (as of 6/14)
Correctional Institution 0
General Note: Crude rates based on less than 10 events are considered statistically unreliable and are not displayed (ND), unless otherwise noted.
Services Funding
Other
2
Non-Profit
9
For Profit
5
State
1
Other
0
Ambulatory Surgery Centers (7/13-6/14)
Employees
Part Time Employees 429
Full Time Employees 496
Contracted Employees 266
Payroll Employees 659 Staff with Clinical Privileges 1,041
Total Surgical Visits per Employee 113.4
Total Facilities 31 Total Surgical Visits 104,856
Percent of Surgical Visits, Age 65+ 37.5
Total Operating Rooms 61 Total Surgical Visits per Operating Room 1,719.0
Facilities Surgical Visits
Staff Licensed as M.D. 812
Total Employees per Operating Room 15.2
Average Semi-Private Daily Room Rate $3,195
Total Employees 925

PAGE 4Montgomery County
Pennsylvania Health Care Workforce (2013-2014)
Notes: Only health care employees renewing their license in 2013-2014 were surveyed.The "Estimated Number" and "Percent of Workforce Intending to Remain in Profession for 6 or More Years" used to compute each "% Change from Previous Survey Year" are adjusted based on the response rates for the previous and current survey results. The survey results are available every two years. Numbers and percentages pertain to county of employment.Percentages based on less than six responses are considered statistically unreliable and are not displayed (ND).Registered Nurses and Licensed Practical Nurses are not comparable to previous survey period, so some data is not available (DNA).
Licensed Practical Nurses (2014) 1,419 DNA 82.2% DNA
Physicians (2014) 2,690
Dentists (2013) 700
Registered Nurses (2012/2013) 11,413 DNA 83.4% DNA
2.2% 75.5% -1.0%
4.2% 76.1% -5.0%
Estimated Number
Percent Changefrom Previous
Survey
Difference in Percent from
Previous Survey
Percent of WorkforceIntending to Remain in
Profession for 6 or More Years
Injury Hospitalizations (2014)
Injury Hospitalizations and Median Charges by Age and Sex
Injury Hospitalizations and Median Charges by Type of Payor
Injury Hospitalizations and Median Charges by Mechanism/Intent and Sex
0-4 5-14 15-24 25-44 45-64 65 and Older
Male - Total
Male - Median Charges
Female - Total
Female - Median Charges
UnintentionalMotor Vehicle All Poisonings Unintentional Falls
Unintentional Fire/Flame or Hot Object/Substance All Firearm All Other Injuries
Male - Total
Male - Median Charges
Female - Total
Female - Median Charges
Medicare Medicaid Other Government Commercial / Private Blue Cross Uninsured
Total Hospitalizations
Median Charges
All Ages
3,803 65 78 244 485 1,066 1,865
$50,001.75 $26,958.00 $32,052.50 $38,512.90 $41,904.75 $52,005.83 $54,079.73
4,266 55 66 160 358 868 2,759
$46,029.40 $26,590.00 $32,452.00 $30,486.68 $32,547.38 $44,268.03 $50,038.75
Note: Median charges not displayed (ND) for occurrences less than 10.
1354,915 790 1,0551,11234
$30,297.04 $50,845.33 $42,393.46 $38,830.74 $44,945.50 $48,140.38
1,270
1,507
166
263
439
300
2,372
1,660
16
45
3
28
$47,879.60
$54,804.52
$58,054.70
$58,909.20
$25,778.34
$27,391.43
$48,307.07
$50,065.55
$71,142.79
$37,012.20
ND
$92,913.90
Disclaimer: Injury data used in this report were provided to the Pennsylvania Department of Health by the Pennsylvania Health Care Cost Containment Council. The Pennsylvania Health Care Cost Containment Council specifically disclaims responsibility for any interpretations or conclusions. Contents may be republished or reproduced whole or in part, with attribution.

Montour CountyHealth Profile 2016
Demographic Data (2014)
% Population Change 2010 to 2014 2.0
Median Age of the Population (2010-2014) 43.8
% Population Aged 65 and Over 19.7
Population per Square Mile 143.1
% Population with Income Below Poverty Level (2010-2014) 10.6
Per Capita Personal Income $54,521
% Labor Force Unemployed - Annual Average 4.7
% Population Eligible for Medical Assistance 13.8
Estimated Population by Age and Sex (2014)
Age Total Male Female Age Total Male Female
All Ages 18,641
Under 5 1,093
5-14 2,100
15-24 1,983
25-34 2,391
8,903
552
1,097
999
1,182
9,738
541
1,003
984
1,209
35-44 2,007
45-54 2,648
55-64 2,750
65-74 1,815
75+ 1,854
977
1,296
1,310
854
636
1,030
1,352
1,440
961
1,218
Natality and Reported Pregnancies^ (2014 Residents)
Crude Birth Rate11.8
Average Annual General64.9
% Low Birth Weight 8.2
% Prenatal Care in 1st Trimester 62.7
% Births to Mothers Under 18 ND
7.5
61.8
ND
ND
ND
ND
Per 1,000 Population
Fertility Rate* (2012-2014)
All Races White Black
All Ages 234
Under 15 0
15-17 4
220
0
4
1
0
0
13
0
0
Age of WomanReported
PregnanciesLive
BirthsFetal
DeathsInduced
Abortions
Outcome
Age of WomanReported
PregnanciesLive
BirthsFetal
DeathsInduced
Abortions
Outcome
18-19 9
20-29 122
30 and Over 98
9
114
92
0
0
1
0
8
5
All Ages* 68.3
Under 15** ND
15-17 ND
72.6
ND
ND
Age of Woman Birth Rate Reported Pregnancy Rate Age of Woman Birth Rate Reported Pregnancy Rate
18-19 ND
20-29 100.7
30 and Over** 41.3
ND
107.8
44.0
^Live births, fetal deaths of 16+ weeks gestation, and induced abortions performed in-state. Notes: All ages includes any unknown ages. All rates per 1,000.*All Ages includes female population ages 15-44. ** Under 15 includes female population ages 10-14; 30 and Over includes female population ages 30-49.
Hispanic
ND
ND
ND
(of any race)
ND
ND
ND
Asian / Pacific
General Notes: Crude and age-adjusted rates based on less than 10 events are considered statistically unreliable and are not displayed (ND), unless otherwise noted. Starting in 2013, race of resident was derived from multiple race selections. A person is Multi-Race if they identify as more than one race. Prior to 2013, race of resident was derived from a single race designation.
Morbidity (2012-2014 Residents)
Reported Incidence and Average Annual Rate (per 100,000) for Selected Notifiable Diseases (2012-2014)
HIV 0 ND
Syphilis 1 ND
Tuberculosis 0 ND
Total Rate
Chlamydia 127 228.7
Giardiasis 6 ND
Gonorrhea 12 21.6
Hepatitis: Type A 0 ND
Total Rate
Lyme Disease 79 142.2
Salmonellosis 6 ND
Total Rate
Campylobacteriosis 9 ND Hep. B* Acute 0 ND
Shigellosis < 5 ND
*Hepatitis: Type B **Meningococcal Disease
Meningococcal** 0 ND
Pertussis < 5 ND
Hep. B* Chronic 5 ND
Chickenpox < 5 ND
Islander
Note: Communicable diseases with demographic counts of 1 to 4 are displayed as "< 5" to avoid potential identification of cases within certain geographic areas.
Multi - Race
ND
ND
ND

Montour County PAGE 2
Mortality (2014 Residents)
Selected Major Causes of Death, Number and Average Annual Age-Adjusted Death Rate* (2012-2014)
Number of Resident Deaths 240
Crude Death Rate per 1,000 12.9
Age-Adjusted Death Rate per 1,000 8.1
Number of Infant Deaths (< 1 Year of Age) 1 1 0 0
AllRaces BlackWhite
Hispanic(any race)
Infant Mortality Rate per 1,000 Live Births ND ND ND ND
Average Annual Infant Mortality Rate (2012-2014) ND ND ND ND
Cause Total Rate
Diseases of Heart 139
Cancer 139
Stroke 31
C.L.R.D.** 41
Accidents 42
148.9
171.0
29.1
45.4
62.2
Cause Total Rate
Influenza/Pneumonia 28
Diabetes Mellitus 15
Septicemia 13
Nephritis/Nephrosis 18
Alzheimer's Disease 39
29.1
16.4
13.9
19.8
34.7
* Per 100,000 2000 U.S. standardmillion population. Age-adjusted rates
** Chronic Lower Respiratory Disease
Selected Leading Causes of Death, Number by Age Group (2014)
Under 5 Years of Age 5-24 Years of Age 25-44 Years of Age 45-64 Years of Age 65 Years and Older
Accidents 4 Accidents 2
Cancer 2
Cancer 17
Diseases of Heart 5
C.L.R.D.** 3
Liver Dis./Cirrhosis 3
Influenza/Pneumonia 2
Diseases of Heart 40
Cancer 30
Stroke 14
C.L.R.D.** 13
Alzheimer's Disease 12
TOTAL 1 TOTAL 4 TOTAL 7 TOTAL 39 TOTAL 189
Note: Total includes all other causes.
Asian/PI*
0
ND
*Asian/Pacific Islander ^ NA = Multi-Race data not available before 2013.
are only comparable if the samestandard million population was usedin the calculation.
Invasive Cancer Incidence and Average Annual Age-Adjusted Rates* for Major Sites by Sex
All Sites 202 586.0
Prostate 55 151.3
Lung and Bronchus 26 74.8
Colon and Rectum 14 ND
Male FemaleTotal Rate Total Rate
Female Breast 50 117.4
191 459.2
23 54.5
22 50.1
*Per 100,000 2000 U.S. standard million population. Age-adjusted rates are only comparable if the same standard million population was used in the calculation.
- -
- -
Male FemaleTotal Rate Total Rate
Non-Hodgkin Lymphoma 13 ND
Melanoma of the Skin 17 ND
8 ND
21 47.4
4 ND
Corpus and Uterus, NOS - -
Urinary Bladder 13
Kidney and Renal Pelvis 9 ND
ND 1
3
ND
ND
Notes: All in situ cases, except for urinary bladder, are excluded. Age-adjusted rates based on less than 20 events are statistically unreliable and are not displayed (ND).
Cancer Incidence (2011-2013 Residents)
Adult Behavioral Health Risk Factors (2012-2014)[Includes: Centre, Columbia, Montour, Northumberland, Snyder, and Union Counties]
General Notes: Crude and age-adjusted rates based on less than 10 events are considered statistically unreliable and are not displayed (ND), unless otherwise noted. Starting in 2013, race of resident was derived from multiple race selections. A person is Multi-Race if they identify as more than one race. Prior to 2013, race of resident was derived from a single race designation.
Percent (CI)Risk Factors
Fair or poor general health:
Obese:
Overweight (includes obese):
No health insurance (ages 18-64):
Visited a doctor in the past 2 yearsfor a routine check-up:
Percent (CI)Risk Factors
Ever told they have diabetes: Currently has asthma:
Current smoker:
Ever tested for HIV (ages 18-64):
Needed to see a doctor but couldnot due to cost in the past year:
14
31
(12 - 16)
(28 - 34)
61 (58 - 64)
13 (11 - 16)
82 (80 - 85)
10 10(8 - 11) (9 - 12)
18 (16 - 20)
27 (24 - 31)
9 (7 - 11)
Notes: Data are based on 2012-2014 annual sample surveys of Pennsylvania adults. CI= 95% Confidence Interval.
Additional state or county/regional data are available at www.statistics.health.pa.gov.
^In situ, benign, and uncertain neoplasms
Multi- Race
0
ND
NAND ^

Montour County PAGE 3
Hospitals (7/13-6/14)
Total General Acute Care
Psychiatric Rehabilitation
4 1 1 1
General Hospitals
Beds Set Up and Staffed 519
Admissions 28,722
Beds per 1,000 Population 27.8
Admissions per 1,000 Population 1,540.8
Average Inpatient Occupancy Rate 75.0
Nursing Homes (2014)
Total Number Certified-Medicare Certified-Medicaid
Nursing Homes
Licensed/Approved Beds
2 2 2
262 262 262
71.4
Average Occupancy Rate 90.7
Average Length of Stay (Number of Days) 196.0
$296
Total Licensed/Approved Beds per 1,000 Population Age 65 and Older
Average Semi-Private Daily Room Rate
Drug and Alcohol Treatment
Admissions to Client Primary Diagnosis
Drug Abuse Alcohol Abuse Other*
Percent Admitted
Only Once During 7/13-6/14
21 12 3 1 68.8
* Includes family members receiving counseling.
All Licensed Facilities Inpatient Non-Hospital
Inpatient Hospital Partial Hospitalization Outpatient1
0
0 0 1
Note: Each licensed facility may provide more than one type of service.
State-Supported Facilities
Types of Service Provided
Number of
Clients Admitted
16
Admission by County of Residence (7/13-6/14)
Treatment Facilities (as of 6/14)
Correctional Institution 0
General Note: Crude rates based on less than 10 events are considered statistically unreliable and are not displayed (ND), unless otherwise noted.
Services Funding
Other
1
Non-Profit
1
For Profit
2
State
1
Other
0
Ambulatory Surgery Centers (7/13-6/14)
Employees
Part Time Employees 15
Full Time Employees 72
Contracted Employees 0
Payroll Employees 87 Staff with Clinical Privileges 100
Total Surgical Visits per Employee 99.1
Total Facilities 2 Total Surgical Visits 8,620
Percent of Surgical Visits, Age 65+ 25.8
Total Operating Rooms 7 Total Surgical Visits per Operating Room 1,231.4
Facilities Surgical Visits
Staff Licensed as M.D. 85
Total Employees per Operating Room 12.4
Average Semi-Private Daily Room Rate $1,257
Total Employees 87
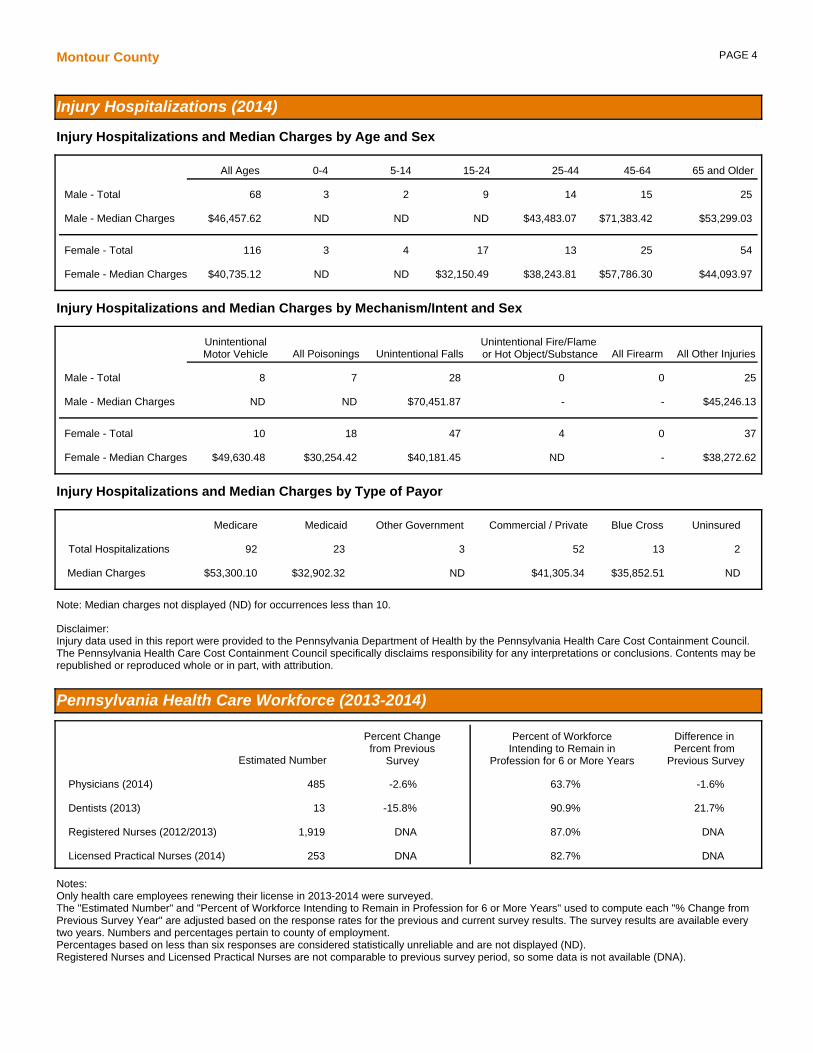
PAGE 4Montour County
Pennsylvania Health Care Workforce (2013-2014)
Notes: Only health care employees renewing their license in 2013-2014 were surveyed.The "Estimated Number" and "Percent of Workforce Intending to Remain in Profession for 6 or More Years" used to compute each "% Change from Previous Survey Year" are adjusted based on the response rates for the previous and current survey results. The survey results are available every two years. Numbers and percentages pertain to county of employment.Percentages based on less than six responses are considered statistically unreliable and are not displayed (ND).Registered Nurses and Licensed Practical Nurses are not comparable to previous survey period, so some data is not available (DNA).
Licensed Practical Nurses (2014) 253 DNA 82.7% DNA
Physicians (2014) 485
Dentists (2013) 13
Registered Nurses (2012/2013) 1,919 DNA 87.0% DNA
-2.6% 63.7% -1.6%
-15.8% 90.9% 21.7%
Estimated Number
Percent Changefrom Previous
Survey
Difference in Percent from
Previous Survey
Percent of WorkforceIntending to Remain in
Profession for 6 or More Years
Injury Hospitalizations (2014)
Injury Hospitalizations and Median Charges by Age and Sex
Injury Hospitalizations and Median Charges by Type of Payor
Injury Hospitalizations and Median Charges by Mechanism/Intent and Sex
0-4 5-14 15-24 25-44 45-64 65 and Older
Male - Total
Male - Median Charges
Female - Total
Female - Median Charges
UnintentionalMotor Vehicle All Poisonings Unintentional Falls
Unintentional Fire/Flame or Hot Object/Substance All Firearm All Other Injuries
Male - Total
Male - Median Charges
Female - Total
Female - Median Charges
Medicare Medicaid Other Government Commercial / Private Blue Cross Uninsured
Total Hospitalizations
Median Charges
All Ages
68 3 2 9 14 15 25
$46,457.62 ND ND ND $43,483.07 $71,383.42 $53,299.03
116 3 4 17 13 25 54
$40,735.12 ND ND $32,150.49 $38,243.81 $57,786.30 $44,093.97
Note: Median charges not displayed (ND) for occurrences less than 10.
292 23 13523
ND $53,300.10 $32,902.32 $35,852.51 $41,305.34 ND
37
25
10
8
18
7
47
28
4
0
0
0
$38,272.62
$45,246.13
$49,630.48
ND
$30,254.42
ND
$40,181.45
$70,451.87
ND
-
-
-
Disclaimer: Injury data used in this report were provided to the Pennsylvania Department of Health by the Pennsylvania Health Care Cost Containment Council. The Pennsylvania Health Care Cost Containment Council specifically disclaims responsibility for any interpretations or conclusions. Contents may be republished or reproduced whole or in part, with attribution.
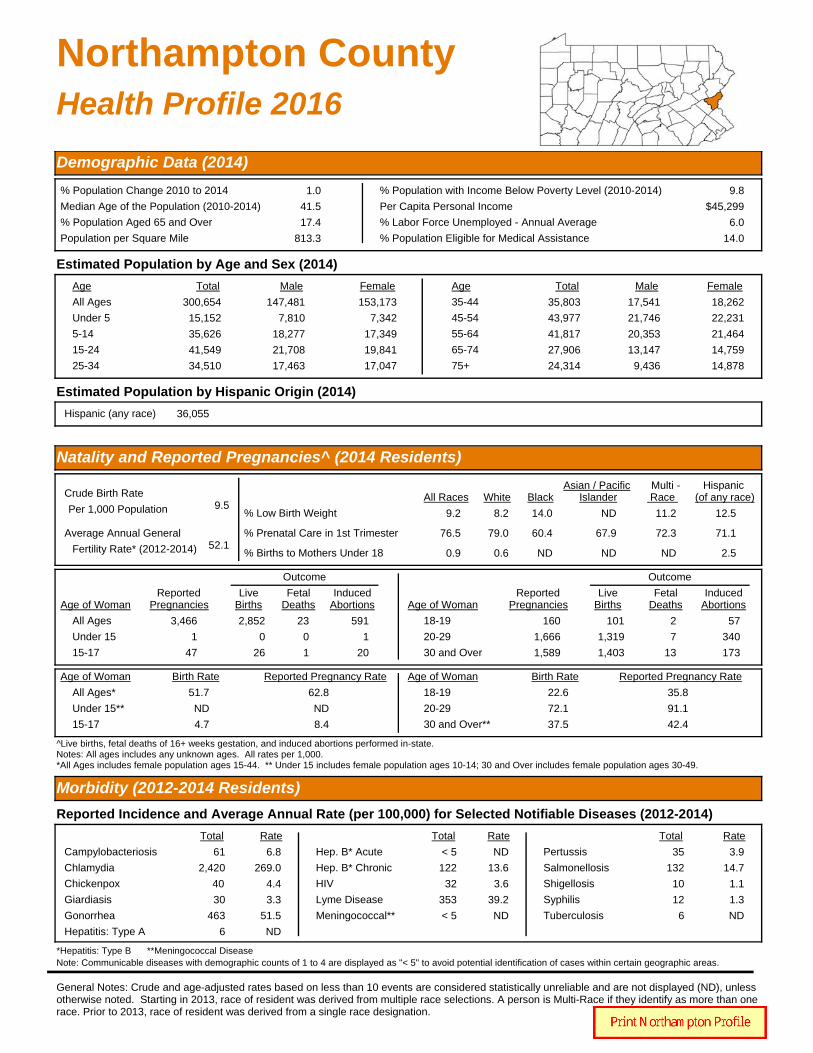
Northampton CountyHealth Profile 2016
Demographic Data (2014)
% Population Change 2010 to 2014 1.0
Median Age of the Population (2010-2014) 41.5
% Population Aged 65 and Over 17.4
Population per Square Mile 813.3
% Population with Income Below Poverty Level (2010-2014) 9.8
Per Capita Personal Income $45,299
% Labor Force Unemployed - Annual Average 6.0
% Population Eligible for Medical Assistance 14.0
Estimated Population by Age and Sex (2014)
Age Total Male Female Age Total Male Female
All Ages 300,654
Under 5 15,152
5-14 35,626
15-24 41,549
25-34 34,510
147,481
7,810
18,277
21,708
17,463
153,173
7,342
17,349
19,841
17,047
35-44 35,803
45-54 43,977
55-64 41,817
65-74 27,906
75+ 24,314
17,541
21,746
20,353
13,147
9,436
18,262
22,231
21,464
14,759
14,878
Estimated Population by Hispanic Origin (2014)
Hispanic (any race) 36,055
Natality and Reported Pregnancies^ (2014 Residents)
Crude Birth Rate9.5
Average Annual General52.1
% Low Birth Weight 9.2
% Prenatal Care in 1st Trimester 76.5
% Births to Mothers Under 18 0.9
8.2
79.0
0.6
14.0
60.4
ND
Per 1,000 Population
Fertility Rate* (2012-2014)
All Races White Black
All Ages 3,466
Under 15 1
15-17 47
2,852
0
26
23
0
1
591
1
20
Age of WomanReported
PregnanciesLive
BirthsFetal
DeathsInduced
Abortions
Outcome
Age of WomanReported
PregnanciesLive
BirthsFetal
DeathsInduced
Abortions
Outcome
18-19 160
20-29 1,666
30 and Over 1,589
101
1,319
1,403
2
7
13
57
340
173
All Ages* 51.7
Under 15** ND
15-17 4.7
62.8
ND
8.4
Age of Woman Birth Rate Reported Pregnancy Rate Age of Woman Birth Rate Reported Pregnancy Rate
18-19 22.6
20-29 72.1
30 and Over** 37.5
35.8
91.1
42.4
^Live births, fetal deaths of 16+ weeks gestation, and induced abortions performed in-state. Notes: All ages includes any unknown ages. All rates per 1,000.*All Ages includes female population ages 15-44. ** Under 15 includes female population ages 10-14; 30 and Over includes female population ages 30-49.
Hispanic
12.5
71.1
2.5
(of any race)
ND
67.9
ND
Asian / Pacific
General Notes: Crude and age-adjusted rates based on less than 10 events are considered statistically unreliable and are not displayed (ND), unless otherwise noted. Starting in 2013, race of resident was derived from multiple race selections. A person is Multi-Race if they identify as more than one race. Prior to 2013, race of resident was derived from a single race designation.
Morbidity (2012-2014 Residents)
Reported Incidence and Average Annual Rate (per 100,000) for Selected Notifiable Diseases (2012-2014)
HIV 32 3.6
Syphilis 12 1.3
Tuberculosis 6 ND
Total Rate
Chlamydia 2,420 269.0
Giardiasis 30 3.3
Gonorrhea 463 51.5
Hepatitis: Type A 6 ND
Total Rate
Lyme Disease 353 39.2
Salmonellosis 132 14.7
Total Rate
Campylobacteriosis 61 6.8 Hep. B* Acute < 5 ND
Shigellosis 10 1.1
*Hepatitis: Type B **Meningococcal Disease
Meningococcal** < 5 ND
Pertussis 35 3.9
Hep. B* Chronic 122 13.6
Chickenpox 40 4.4
Islander
Note: Communicable diseases with demographic counts of 1 to 4 are displayed as "< 5" to avoid potential identification of cases within certain geographic areas.
Multi - Race
11.2
72.3
ND

Northampton County PAGE 2
Mortality (2014 Residents)
Selected Major Causes of Death, Number and Average Annual Age-Adjusted Death Rate* (2012-2014)
Number of Resident Deaths 2,947
Crude Death Rate per 1,000 9.8
Age-Adjusted Death Rate per 1,000 6.8
Number of Infant Deaths (< 1 Year of Age) 16 13 2 1
AllRaces BlackWhite
Hispanic(any race)
Infant Mortality Rate per 1,000 Live Births 5.6 6.1 ND ND
Average Annual Infant Mortality Rate (2012-2014) 6.5 5.5 ND 6.9
Cause Total Rate
Diseases of Heart 2,100
Cancer 2,043
Stroke 373
C.L.R.D.** 357
Accidents 366
155.6
167.6
28.5
27.7
35.2
Cause Total Rate
Influenza/Pneumonia 147
Diabetes Mellitus 251
Septicemia 140
Nephritis/Nephrosis 144
Alzheimer's Disease 184
10.9
19.9
10.9
10.9
12.9
* Per 100,000 2000 U.S. standardmillion population. Age-adjusted rates
** Chronic Lower Respiratory Disease
Selected Leading Causes of Death, Number by Age Group (2014)
Under 5 Years of Age 5-24 Years of Age 25-44 Years of Age 45-64 Years of Age 65 Years and Older
Perinatal Conditions 7
Birth Defects 6
Accidents 8
Suicide 7
Cancer 2
Diseases of Heart 2
Accidents 25
Cancer 17
Suicide 12
Diseases of Heart 6
Liver Dis./Cirrhosis 4
Cancer 161
Diseases of Heart 85
Suicide 23
Accidents 22
Diseases of Heart 651
Cancer 519
Stroke 111
C.L.R.D.** 104
Alzheimer's Disease 75
TOTAL 17 TOTAL 23 TOTAL 78 TOTAL 438 TOTAL 2,391
Note: Total includes all other causes.
Asian/PI*
0
ND
*Asian/Pacific Islander ^ NA = Multi-Race data not available before 2013.
are only comparable if the samestandard million population was usedin the calculation.
Invasive Cancer Incidence and Average Annual Age-Adjusted Rates* for Major Sites by Sex
All Sites 3,066 596.6
Prostate 723 133.7
Lung and Bronchus 432 84.6
Colon and Rectum 258 49.8
Male FemaleTotal Rate Total Rate
Female Breast 808 135.7
2,907 477.2
316 47.8
224 34.5
*Per 100,000 2000 U.S. standard million population. Age-adjusted rates are only comparable if the same standard million population was used in the calculation.
- -
- -
Male FemaleTotal Rate Total Rate
Non-Hodgkin Lymphoma 143 27.3
Melanoma of the Skin 173 34.8
117 18.1
241 39.6
122 21.6
Corpus and Uterus, NOS - -
Urinary Bladder 294
Kidney and Renal Pelvis 148 29.6
57.6 89
84
13.4
13.1
Notes: All in situ cases, except for urinary bladder, are excluded. Age-adjusted rates based on less than 20 events are statistically unreliable and are not displayed (ND).
Cancer Incidence (2011-2013 Residents)
Adult Behavioral Health Risk Factors (2012-2014)[Includes: Carbon, Lehigh, and Northampton Counties]
General Notes: Crude and age-adjusted rates based on less than 10 events are considered statistically unreliable and are not displayed (ND), unless otherwise noted. Starting in 2013, race of resident was derived from multiple race selections. A person is Multi-Race if they identify as more than one race. Prior to 2013, race of resident was derived from a single race designation.
Percent (CI)Risk Factors
Fair or poor general health:
Obese:
Overweight (includes obese):
No health insurance (ages 18-64):
Visited a doctor in the past 2 yearsfor a routine check-up:
Percent (CI)Risk Factors
Ever told they have diabetes: Currently has asthma:
Current smoker:
Ever tested for HIV (ages 18-64):
Needed to see a doctor but couldnot due to cost in the past year:
18
29
(16 - 21)
(27 - 32)
66 (63 - 69)
13 (11 - 16)
82 (80 - 84)
11 12(9 - 13) (10 - 14)
21 (19 - 24)
40 (36 - 44)
13 (11 - 15)
Notes: Data are based on 2012-2014 annual sample surveys of Pennsylvania adults. CI= 95% Confidence Interval.
Additional state or county/regional data are available at www.statistics.health.pa.gov.
^In situ, benign, and uncertain neoplasms
Multi- Race
0
ND
NAND ^

Northampton County PAGE 3
Hospitals (7/13-6/14)
Total General Acute Care
Psychiatric Rehabilitation
3 3 0 0
General Hospitals
Beds Set Up and Staffed 306
Admissions 13,917
Beds per 1,000 Population 1.0
Admissions per 1,000 Population 46.3
Average Inpatient Occupancy Rate 51.3
Nursing Homes (2014)
Total Number Certified-Medicare Certified-Medicaid
Nursing Homes
Licensed/Approved Beds
13 13 10
2,053 2,053 1,831
39.3
Average Occupancy Rate 90.0
Average Length of Stay (Number of Days) 125.0
$309
Total Licensed/Approved Beds per 1,000 Population Age 65 and Older
Average Semi-Private Daily Room Rate
Drug and Alcohol Treatment
Admissions to Client Primary Diagnosis
Drug Abuse Alcohol Abuse Other*
Percent Admitted
Only Once During 7/13-6/14
945 425 244 37 74.9
* Includes family members receiving counseling.
All Licensed Facilities Inpatient Non-Hospital
Inpatient Hospital Partial Hospitalization Outpatient5
0
0 2 5
Note: Each licensed facility may provide more than one type of service.
State-Supported Facilities
Types of Service Provided
Number of
Clients Admitted
706
Admission by County of Residence (7/13-6/14)
Treatment Facilities (as of 6/14)
Correctional Institution 0
General Note: Crude rates based on less than 10 events are considered statistically unreliable and are not displayed (ND), unless otherwise noted.
Services Funding
Other
0
Non-Profit
1
For Profit
2
State
0
Other
0
Ambulatory Surgery Centers (7/13-6/14)
Employees
Part Time Employees 53
Full Time Employees 76
Contracted Employees 16
Payroll Employees 113 Staff with Clinical Privileges 136
Total Surgical Visits per Employee 150.5
Total Facilities 6 Total Surgical Visits 19,416
Percent of Surgical Visits, Age 65+ 27.3
Total Operating Rooms 12 Total Surgical Visits per Operating Room 1,618.0
Facilities Surgical Visits
Staff Licensed as M.D. 109
Total Employees per Operating Room 10.8
Average Semi-Private Daily Room Rate $3,944
Total Employees 129
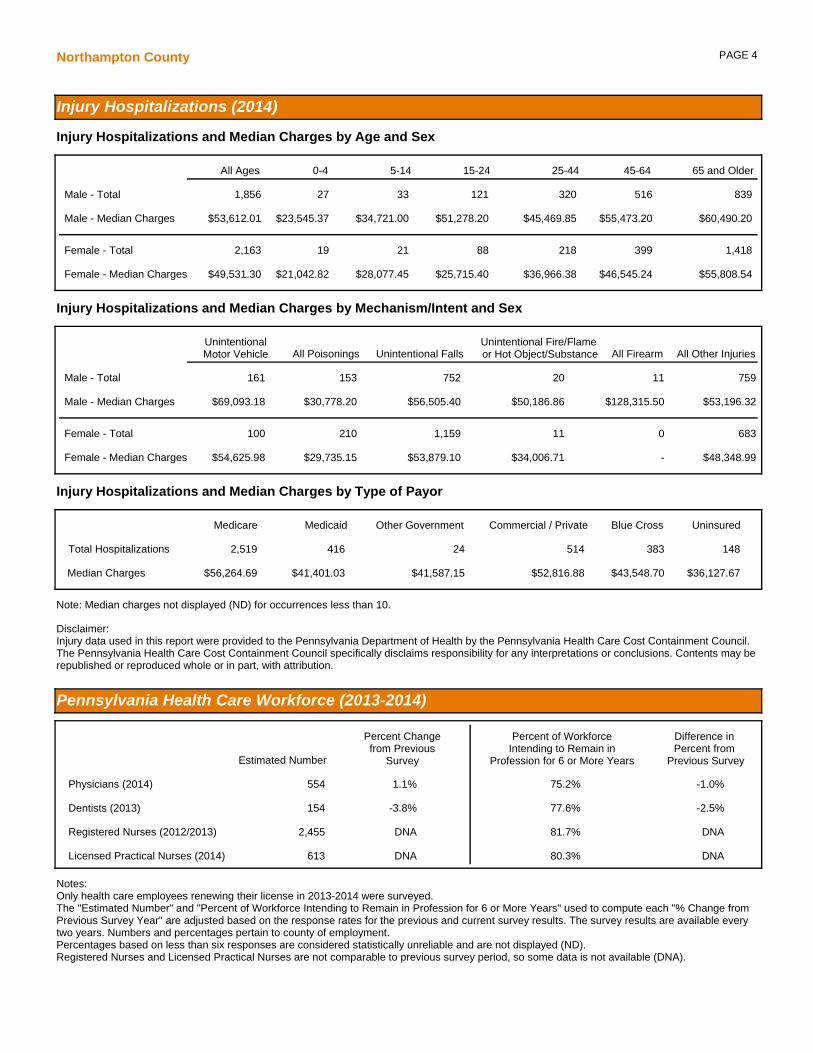
PAGE 4Northampton County
Pennsylvania Health Care Workforce (2013-2014)
Notes: Only health care employees renewing their license in 2013-2014 were surveyed.The "Estimated Number" and "Percent of Workforce Intending to Remain in Profession for 6 or More Years" used to compute each "% Change from Previous Survey Year" are adjusted based on the response rates for the previous and current survey results. The survey results are available every two years. Numbers and percentages pertain to county of employment.Percentages based on less than six responses are considered statistically unreliable and are not displayed (ND).Registered Nurses and Licensed Practical Nurses are not comparable to previous survey period, so some data is not available (DNA).
Licensed Practical Nurses (2014) 613 DNA 80.3% DNA
Physicians (2014) 554
Dentists (2013) 154
Registered Nurses (2012/2013) 2,455 DNA 81.7% DNA
1.1% 75.2% -1.0%
-3.8% 77.6% -2.5%
Estimated Number
Percent Changefrom Previous
Survey
Difference in Percent from
Previous Survey
Percent of WorkforceIntending to Remain in
Profession for 6 or More Years
Injury Hospitalizations (2014)
Injury Hospitalizations and Median Charges by Age and Sex
Injury Hospitalizations and Median Charges by Type of Payor
Injury Hospitalizations and Median Charges by Mechanism/Intent and Sex
0-4 5-14 15-24 25-44 45-64 65 and Older
Male - Total
Male - Median Charges
Female - Total
Female - Median Charges
UnintentionalMotor Vehicle All Poisonings Unintentional Falls
Unintentional Fire/Flame or Hot Object/Substance All Firearm All Other Injuries
Male - Total
Male - Median Charges
Female - Total
Female - Median Charges
Medicare Medicaid Other Government Commercial / Private Blue Cross Uninsured
Total Hospitalizations
Median Charges
All Ages
1,856 27 33 121 320 516 839
$53,612.01 $23,545.37 $34,721.00 $51,278.20 $45,469.85 $55,473.20 $60,490.20
2,163 19 21 88 218 399 1,418
$49,531.30 $21,042.82 $28,077.45 $25,715.40 $36,966.38 $46,545.24 $55,808.54
Note: Median charges not displayed (ND) for occurrences less than 10.
1482,519 416 38351424
$36,127.67 $56,264.69 $41,401.03 $43,548.70 $52,816.88 $41,587.15
683
759
100
161
210
153
1,159
752
11
20
0
11
$48,348.99
$53,196.32
$54,625.98
$69,093.18
$29,735.15
$30,778.20
$53,879.10
$56,505.40
$34,006.71
$50,186.86
-
$128,315.50
Disclaimer: Injury data used in this report were provided to the Pennsylvania Department of Health by the Pennsylvania Health Care Cost Containment Council. The Pennsylvania Health Care Cost Containment Council specifically disclaims responsibility for any interpretations or conclusions. Contents may be republished or reproduced whole or in part, with attribution.

Northumberland CountyHealth Profile 2016
Demographic Data (2014)
% Population Change 2010 to 2014 -0.6
Median Age of the Population (2010-2014) 43.6
% Population Aged 65 and Over 19.7
Population per Square Mile 205.0
% Population with Income Below Poverty Level (2010-2014) 14.2
Per Capita Personal Income $36,172
% Labor Force Unemployed - Annual Average 6.7
% Population Eligible for Medical Assistance 18.7
Estimated Population by Age and Sex (2014)
Age Total Male Female Age Total Male Female
All Ages 93,944
Under 5 4,999
5-14 10,499
15-24 10,310
25-34 11,322
47,194
2,558
5,382
5,556
6,076
46,750
2,441
5,117
4,754
5,246
35-44 11,089
45-54 13,385
55-64 13,846
65-74 9,860
75+ 8,634
5,832
6,908
6,886
4,657
3,339
5,257
6,477
6,960
5,203
5,295
Natality and Reported Pregnancies^ (2014 Residents)
Crude Birth Rate10.3
Average Annual General62.8
% Low Birth Weight 8.5
% Prenatal Care in 1st Trimester 69.0
% Births to Mothers Under 18 2.3
8.5
70.4
2.3
ND
ND
ND
Per 1,000 Population
Fertility Rate* (2012-2014)
All Races White Black
All Ages 1,053
Under 15 2
15-17 21
968
2
20
10
0
0
75
0
1
Age of WomanReported
PregnanciesLive
BirthsFetal
DeathsInduced
Abortions
Outcome
Age of WomanReported
PregnanciesLive
BirthsFetal
DeathsInduced
Abortions
Outcome
18-19 58
20-29 634
30 and Over 331
50
580
309
1
6
3
7
48
19
All Ages* 63.4
Under 15** ND
15-17 14.6
69.0
ND
15.3
Age of Woman Birth Rate Reported Pregnancy Rate Age of Woman Birth Rate Reported Pregnancy Rate
18-19 54.7
20-29 113.7
30 and Over** 28.5
63.5
124.3
30.5
^Live births, fetal deaths of 16+ weeks gestation, and induced abortions performed in-state. Notes: All ages includes any unknown ages. All rates per 1,000.*All Ages includes female population ages 15-44. ** Under 15 includes female population ages 10-14; 30 and Over includes female population ages 30-49.
Hispanic
ND
43.5
ND
(of any race)
ND
ND
ND
Asian / Pacific
General Notes: Crude and age-adjusted rates based on less than 10 events are considered statistically unreliable and are not displayed (ND), unless otherwise noted. Starting in 2013, race of resident was derived from multiple race selections. A person is Multi-Race if they identify as more than one race. Prior to 2013, race of resident was derived from a single race designation.
Morbidity (2012-2014 Residents)
Reported Incidence and Average Annual Rate (per 100,000) for Selected Notifiable Diseases (2012-2014)
HIV 6 ND
Syphilis 6 ND
Tuberculosis < 5 ND
Total Rate
Chlamydia 600 212.4
Giardiasis 8 ND
Gonorrhea 34 12.0
Hepatitis: Type A < 5 ND
Total Rate
Lyme Disease 131 46.4
Salmonellosis 30 10.6
Total Rate
Campylobacteriosis 29 10.3 Hep. B* Acute 0 ND
Shigellosis < 5 ND
*Hepatitis: Type B **Meningococcal Disease
Meningococcal** < 5 ND
Pertussis 5 ND
Hep. B* Chronic 21 7.4
Chickenpox 9 ND
Islander
Note: Communicable diseases with demographic counts of 1 to 4 are displayed as "< 5" to avoid potential identification of cases within certain geographic areas.
Multi - Race
ND
ND
ND

Northumberland County PAGE 2
Mortality (2014 Residents)
Selected Major Causes of Death, Number and Average Annual Age-Adjusted Death Rate* (2012-2014)
Number of Resident Deaths 1,142
Crude Death Rate per 1,000 12.2
Age-Adjusted Death Rate per 1,000 7.8
Number of Infant Deaths (< 1 Year of Age) 7 7 0 0
AllRaces BlackWhite
Hispanic(any race)
Infant Mortality Rate per 1,000 Live Births ND ND ND ND
Average Annual Infant Mortality Rate (2012-2014) 6.6 6.2 ND ND
Cause Total Rate
Diseases of Heart 938
Cancer 738
Stroke 163
C.L.R.D.** 200
Accidents 138
208.9
173.1
34.9
45.1
42.7
Cause Total Rate
Influenza/Pneumonia 87
Diabetes Mellitus 89
Septicemia 73
Nephritis/Nephrosis 89
Alzheimer's Disease 97
18.2
21.0
17.0
18.8
19.4
* Per 100,000 2000 U.S. standardmillion population. Age-adjusted rates
** Chronic Lower Respiratory Disease
Selected Leading Causes of Death, Number by Age Group (2014)
Under 5 Years of Age 5-24 Years of Age 25-44 Years of Age 45-64 Years of Age 65 Years and Older
Birth Defects 5 Accidents 5 Accidents 9
Diseases of Heart 7
Suicide 4
Cancer 2
Cancer 67
Diseases of Heart 57
Accidents 9
Suicide 9
Diabetes Mellitus 7
Diseases of Heart 280
Cancer 155
C.L.R.D.** 61
Stroke 35
Nephritis/Nephrosis 33
TOTAL 8 TOTAL 10 TOTAL 32 TOTAL 195 TOTAL 897
Note: Total includes all other causes.
Asian/PI*
0
ND
*Asian/Pacific Islander ^ NA = Multi-Race data not available before 2013.
are only comparable if the samestandard million population was usedin the calculation.
Invasive Cancer Incidence and Average Annual Age-Adjusted Rates* for Major Sites by Sex
All Sites 1,024 552.7
Prostate 230 116.4
Lung and Bronchus 170 90.6
Colon and Rectum 75 41.3
Male FemaleTotal Rate Total Rate
Female Breast 239 120.7
896 443.9
110 50.4
79 36.3
*Per 100,000 2000 U.S. standard million population. Age-adjusted rates are only comparable if the same standard million population was used in the calculation.
- -
- -
Male FemaleTotal Rate Total Rate
Non-Hodgkin Lymphoma 51 29.4
Melanoma of the Skin 34 17.6
38 17.0
64 30.9
38 23.1
Corpus and Uterus, NOS - -
Urinary Bladder 97
Kidney and Renal Pelvis 45 23.1
53.7 17
29
ND
14.5
Notes: All in situ cases, except for urinary bladder, are excluded. Age-adjusted rates based on less than 20 events are statistically unreliable and are not displayed (ND).
Cancer Incidence (2011-2013 Residents)
Adult Behavioral Health Risk Factors (2012-2014)[Includes: Centre, Columbia, Montour, Northumberland, Snyder, and Union Counties]
General Notes: Crude and age-adjusted rates based on less than 10 events are considered statistically unreliable and are not displayed (ND), unless otherwise noted. Starting in 2013, race of resident was derived from multiple race selections. A person is Multi-Race if they identify as more than one race. Prior to 2013, race of resident was derived from a single race designation.
Percent (CI)Risk Factors
Fair or poor general health:
Obese:
Overweight (includes obese):
No health insurance (ages 18-64):
Visited a doctor in the past 2 yearsfor a routine check-up:
Percent (CI)Risk Factors
Ever told they have diabetes: Currently has asthma:
Current smoker:
Ever tested for HIV (ages 18-64):
Needed to see a doctor but couldnot due to cost in the past year:
14
31
(12 - 16)
(28 - 34)
61 (58 - 64)
13 (11 - 16)
82 (80 - 85)
10 10(8 - 11) (9 - 12)
18 (16 - 20)
27 (24 - 31)
9 (7 - 11)
Notes: Data are based on 2012-2014 annual sample surveys of Pennsylvania adults. CI= 95% Confidence Interval.
Additional state or county/regional data are available at www.statistics.health.pa.gov.
^In situ, benign, and uncertain neoplasms
Multi- Race
0
ND
NAND ^

Northumberland County PAGE 3
Hospitals (7/13-6/14)
Total General Acute Care
Psychiatric Rehabilitation
1 1 0 0
General Hospitals
Beds Set Up and Staffed 49
Admissions 1,249
Beds per 1,000 Population 0.5
Admissions per 1,000 Population 13.3
Average Inpatient Occupancy Rate 33.2
Nursing Homes (2014)
Total Number Certified-Medicare Certified-Medicaid
Nursing Homes
Licensed/Approved Beds
9 9 8
1,016 1,016 1,001
54.9
Average Occupancy Rate 89.7
Average Length of Stay (Number of Days) 163.8
$285
Total Licensed/Approved Beds per 1,000 Population Age 65 and Older
Average Semi-Private Daily Room Rate
Drug and Alcohol Treatment
Admissions to Client Primary Diagnosis
Drug Abuse Alcohol Abuse Other*
Percent Admitted
Only Once During 7/13-6/14
207 94 37 2 56.4
* Includes family members receiving counseling.
All Licensed Facilities Inpatient Non-Hospital
Inpatient Hospital Partial Hospitalization Outpatient5
0
0 0 5
Note: Each licensed facility may provide more than one type of service.
State-Supported Facilities
Types of Service Provided
Number of
Clients Admitted
133
Admission by County of Residence (7/13-6/14)
Treatment Facilities (as of 6/14)
Correctional Institution 0
General Note: Crude rates based on less than 10 events are considered statistically unreliable and are not displayed (ND), unless otherwise noted.
Services Funding
Other
0
Non-Profit
0
For Profit
1
State
0
Other
0
Ambulatory Surgery Centers (7/13-6/14)
Employees
Part Time Employees -
Full Time Employees -
Contracted Employees -
Payroll Employees - Staff with Clinical Privileges -
Total Surgical Visits per Employee -
Total Facilities 0 Total Surgical Visits -
Percent of Surgical Visits, Age 65+ -
Total Operating Rooms - Total Surgical Visits per Operating Room -
Facilities Surgical Visits
Staff Licensed as M.D. -
Total Employees per Operating Room -
Average Semi-Private Daily Room Rate $966
Total Employees -

PAGE 4Northumberland County
Pennsylvania Health Care Workforce (2013-2014)
Notes: Only health care employees renewing their license in 2013-2014 were surveyed.The "Estimated Number" and "Percent of Workforce Intending to Remain in Profession for 6 or More Years" used to compute each "% Change from Previous Survey Year" are adjusted based on the response rates for the previous and current survey results. The survey results are available every two years. Numbers and percentages pertain to county of employment.Percentages based on less than six responses are considered statistically unreliable and are not displayed (ND).Registered Nurses and Licensed Practical Nurses are not comparable to previous survey period, so some data is not available (DNA).
Licensed Practical Nurses (2014) 415 DNA 78.3% DNA
Physicians (2014) 68
Dentists (2013) 31
Registered Nurses (2012/2013) 593 DNA 78.7% DNA
-4.7% 75.0% 4.7%
-6.1% 55.6% -23.8%
Estimated Number
Percent Changefrom Previous
Survey
Difference in Percent from
Previous Survey
Percent of WorkforceIntending to Remain in
Profession for 6 or More Years
Injury Hospitalizations (2014)
Injury Hospitalizations and Median Charges by Age and Sex
Injury Hospitalizations and Median Charges by Type of Payor
Injury Hospitalizations and Median Charges by Mechanism/Intent and Sex
0-4 5-14 15-24 25-44 45-64 65 and Older
Male - Total
Male - Median Charges
Female - Total
Female - Median Charges
UnintentionalMotor Vehicle All Poisonings Unintentional Falls
Unintentional Fire/Flame or Hot Object/Substance All Firearm All Other Injuries
Male - Total
Male - Median Charges
Female - Total
Female - Median Charges
Medicare Medicaid Other Government Commercial / Private Blue Cross Uninsured
Total Hospitalizations
Median Charges
All Ages
505 12 11 40 86 151 205
$48,309.76 $14,131.97 $48,833.26 $40,337.44 $39,001.94 $53,619.04 $50,253.27
491 3 7 28 53 102 298
$45,026.26 ND ND $32,056.84 $39,646.60 $44,056.16 $49,844.21
Note: Median charges not displayed (ND) for occurrences less than 10.
12558 138 7519715
$18,523.31 $46,953.98 $28,827.17 $38,402.22 $59,268.34 $86,839.00
121
200
31
60
61
51
275
184
2
9
1
1
$44,730.60
$41,707.71
$52,087.78
$87,598.76
$20,821.81
$24,814.37
$51,179.00
$50,693.52
ND
ND
ND
ND
Disclaimer: Injury data used in this report were provided to the Pennsylvania Department of Health by the Pennsylvania Health Care Cost Containment Council. The Pennsylvania Health Care Cost Containment Council specifically disclaims responsibility for any interpretations or conclusions. Contents may be republished or reproduced whole or in part, with attribution.

Perry CountyHealth Profile 2016
Demographic Data (2014)
% Population Change 2010 to 2014 -0.7
Median Age of the Population (2010-2014) 41.5
% Population Aged 65 and Over 15.9
Population per Square Mile 82.8
% Population with Income Below Poverty Level (2010-2014) 9.7
Per Capita Personal Income $38,135
% Labor Force Unemployed - Annual Average 5.2
% Population Eligible for Medical Assistance 12.9
Estimated Population by Age and Sex (2014)
Age Total Male Female Age Total Male Female
All Ages 45,634
Under 5 2,691
5-14 5,496
15-24 5,496
25-34 5,087
22,941
1,402
2,867
2,863
2,584
22,693
1,289
2,629
2,633
2,503
35-44 5,639
45-54 6,955
55-64 7,025
65-74 4,468
75+ 2,777
2,822
3,530
3,510
2,254
1,109
2,817
3,425
3,515
2,214
1,668
Natality and Reported Pregnancies^ (2014 Residents)
Crude Birth Rate12.2
Average Annual General67.3
% Low Birth Weight 6.4
% Prenatal Care in 1st Trimester 68.8
% Births to Mothers Under 18 1.8
6.2
69.3
ND
ND
ND
ND
Per 1,000 Population
Fertility Rate* (2012-2014)
All Races White Black
All Ages 609
Under 15 0
15-17 11
559
0
10
8
0
0
42
0
1
Age of WomanReported
PregnanciesLive
BirthsFetal
DeathsInduced
Abortions
Outcome
Age of WomanReported
PregnanciesLive
BirthsFetal
DeathsInduced
Abortions
Outcome
18-19 31
20-29 369
30 and Over 198
25
341
183
0
6
2
6
22
13
All Ages* 70.3
Under 15** ND
15-17 12.1
76.6
ND
13.3
Age of Woman Birth Rate Reported Pregnancy Rate Age of Woman Birth Rate Reported Pregnancy Rate
18-19 50.5
20-29 134.4
30 and Over** 31.8
62.6
145.4
34.4
^Live births, fetal deaths of 16+ weeks gestation, and induced abortions performed in-state. Notes: All ages includes any unknown ages. All rates per 1,000.*All Ages includes female population ages 15-44. ** Under 15 includes female population ages 10-14; 30 and Over includes female population ages 30-49.
Hispanic
ND
58.8
ND
(of any race)
ND
ND
ND
Asian / Pacific
General Notes: Crude and age-adjusted rates based on less than 10 events are considered statistically unreliable and are not displayed (ND), unless otherwise noted. Starting in 2013, race of resident was derived from multiple race selections. A person is Multi-Race if they identify as more than one race. Prior to 2013, race of resident was derived from a single race designation.
Morbidity (2012-2014 Residents)
Reported Incidence and Average Annual Rate (per 100,000) for Selected Notifiable Diseases (2012-2014)
HIV 4 ND
Syphilis 4 ND
Tuberculosis < 5 ND
Total Rate
Chlamydia 263 192.1
Giardiasis < 5 ND
Gonorrhea 19 13.9
Hepatitis: Type A 0 ND
Total Rate
Lyme Disease 89 65.0
Salmonellosis 11 8.0
Total Rate
Campylobacteriosis 17 12.4 Hep. B* Acute 0 ND
Shigellosis < 5 ND
*Hepatitis: Type B **Meningococcal Disease
Meningococcal** < 5 ND
Pertussis < 5 ND
Hep. B* Chronic 18 13.1
Chickenpox 5 ND
Islander
Note: Communicable diseases with demographic counts of 1 to 4 are displayed as "< 5" to avoid potential identification of cases within certain geographic areas.
Multi - Race
ND
55.6
ND

Perry County PAGE 2
Mortality (2014 Residents)
Selected Major Causes of Death, Number and Average Annual Age-Adjusted Death Rate* (2012-2014)
Number of Resident Deaths 443
Crude Death Rate per 1,000 9.7
Age-Adjusted Death Rate per 1,000 8.4
Number of Infant Deaths (< 1 Year of Age) 5 5 0 0
AllRaces BlackWhite
Hispanic(any race)
Infant Mortality Rate per 1,000 Live Births ND ND ND ND
Average Annual Infant Mortality Rate (2012-2014) 8.6 7.7 ND ND
Cause Total Rate
Diseases of Heart 306
Cancer 301
Stroke 45
C.L.R.D.** 79
Accidents 69
194.7
176.1
30.1
49.2
49.6
Cause Total Rate
Influenza/Pneumonia 47
Diabetes Mellitus 52
Septicemia 22
Nephritis/Nephrosis 28
Alzheimer's Disease 39
31.6
32.2
14.7
18.3
26.8
* Per 100,000 2000 U.S. standardmillion population. Age-adjusted rates
** Chronic Lower Respiratory Disease
Selected Leading Causes of Death, Number by Age Group (2014)
Under 5 Years of Age 5-24 Years of Age 25-44 Years of Age 45-64 Years of Age 65 Years and Older
Perinatal Conditions 3 Accidents 3 Accidents 7
Cancer 4
Diseases of Heart 2
Cancer 36
Diseases of Heart 16
Accidents 8
Diseases of Heart 84
Cancer 64
C.L.R.D.** 23
Alzheimer's Disease 14
TOTAL 5 TOTAL 6 TOTAL 19 TOTAL 90 TOTAL 323
Note: Total includes all other causes.
Asian/PI*
0
ND
*Asian/Pacific Islander ^ NA = Multi-Race data not available before 2013.
are only comparable if the samestandard million population was usedin the calculation.
Invasive Cancer Incidence and Average Annual Age-Adjusted Rates* for Major Sites by Sex
All Sites 419 513.8
Prostate 69 72.7
Lung and Bronchus 66 82.0
Colon and Rectum 41 52.1
Male FemaleTotal Rate Total Rate
Female Breast 101 115.0
392 448.5
47 50.9
27 30.6
*Per 100,000 2000 U.S. standard million population. Age-adjusted rates are only comparable if the same standard million population was used in the calculation.
- -
- -
Male FemaleTotal Rate Total Rate
Non-Hodgkin Lymphoma 28 36.6
Melanoma of the Skin 28 33.1
17 ND
44 47.0
20 22.4
Corpus and Uterus, NOS - -
Urinary Bladder 27
Kidney and Renal Pelvis 14 ND
33.0 8
10
ND
ND
Notes: All in situ cases, except for urinary bladder, are excluded. Age-adjusted rates based on less than 20 events are statistically unreliable and are not displayed (ND).
Cancer Incidence (2011-2013 Residents)
Adult Behavioral Health Risk Factors (2012-2014)[Includes: Cumberland and Perry Counties]
General Notes: Crude and age-adjusted rates based on less than 10 events are considered statistically unreliable and are not displayed (ND), unless otherwise noted. Starting in 2013, race of resident was derived from multiple race selections. A person is Multi-Race if they identify as more than one race. Prior to 2013, race of resident was derived from a single race designation.
Percent (CI)Risk Factors
Fair or poor general health:
Obese:
Overweight (includes obese):
No health insurance (ages 18-64):
Visited a doctor in the past 2 yearsfor a routine check-up:
Percent (CI)Risk Factors
Ever told they have diabetes: Currently has asthma:
Current smoker:
Ever tested for HIV (ages 18-64):
Needed to see a doctor but couldnot due to cost in the past year:
12
31
(10 - 15)
(27 - 35)
63 (59 - 67)
15 (11 - 19)
80 (76 - 83)
10 10(8 - 12) (8 - 13)
21 (17 - 25)
33 (28 - 38)
10 (7 - 13)
Notes: Data are based on 2012-2014 annual sample surveys of Pennsylvania adults. CI= 95% Confidence Interval.
Additional state or county/regional data are available at www.statistics.health.pa.gov.
^In situ, benign, and uncertain neoplasms
Multi- Race
0
ND
NAND ^

Perry County PAGE 3
Hospitals (7/13-6/14)
Total General Acute Care
Psychiatric Rehabilitation
0 0 0 0
General Hospitals
Beds Set Up and Staffed -
Admissions -
Beds per 1,000 Population -
Admissions per 1,000 Population -
Average Inpatient Occupancy Rate -
Nursing Homes (2014)
Total Number Certified-Medicare Certified-Medicaid
Nursing Homes
Licensed/Approved Beds
3 3 3
243 243 243
33.5
Average Occupancy Rate 94.6
Average Length of Stay (Number of Days) 113.7
$233
Total Licensed/Approved Beds per 1,000 Population Age 65 and Older
Average Semi-Private Daily Room Rate
Drug and Alcohol Treatment
Admissions to Client Primary Diagnosis
Drug Abuse Alcohol Abuse Other*
Percent Admitted
Only Once During 7/13-6/14
274 112 62 25 68.8
* Includes family members receiving counseling.
All Licensed Facilities Inpatient Non-Hospital
Inpatient Hospital Partial Hospitalization Outpatient1
0
0 0 1
Note: Each licensed facility may provide more than one type of service.
State-Supported Facilities
Types of Service Provided
Number of
Clients Admitted
199
Admission by County of Residence (7/13-6/14)
Treatment Facilities (as of 6/14)
Correctional Institution 0
General Note: Crude rates based on less than 10 events are considered statistically unreliable and are not displayed (ND), unless otherwise noted.
Services Funding
Other
0
Non-Profit
0
For Profit
0
State
0
Other
0
Ambulatory Surgery Centers (7/13-6/14)
Employees
Part Time Employees -
Full Time Employees -
Contracted Employees -
Payroll Employees - Staff with Clinical Privileges -
Total Surgical Visits per Employee -
Total Facilities 0 Total Surgical Visits -
Percent of Surgical Visits, Age 65+ -
Total Operating Rooms - Total Surgical Visits per Operating Room -
Facilities Surgical Visits
Staff Licensed as M.D. -
Total Employees per Operating Room -
Average Semi-Private Daily Room Rate -
Total Employees -
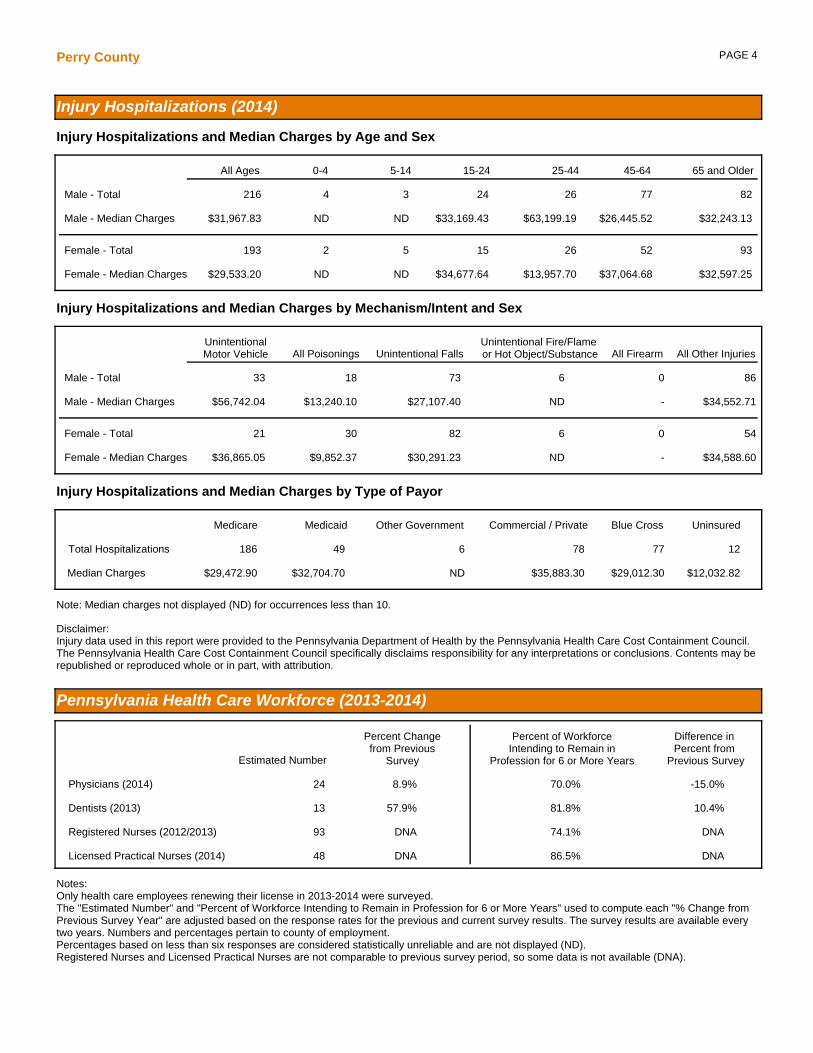
PAGE 4Perry County
Pennsylvania Health Care Workforce (2013-2014)
Notes: Only health care employees renewing their license in 2013-2014 were surveyed.The "Estimated Number" and "Percent of Workforce Intending to Remain in Profession for 6 or More Years" used to compute each "% Change from Previous Survey Year" are adjusted based on the response rates for the previous and current survey results. The survey results are available every two years. Numbers and percentages pertain to county of employment.Percentages based on less than six responses are considered statistically unreliable and are not displayed (ND).Registered Nurses and Licensed Practical Nurses are not comparable to previous survey period, so some data is not available (DNA).
Licensed Practical Nurses (2014) 48 DNA 86.5% DNA
Physicians (2014) 24
Dentists (2013) 13
Registered Nurses (2012/2013) 93 DNA 74.1% DNA
8.9% 70.0% -15.0%
57.9% 81.8% 10.4%
Estimated Number
Percent Changefrom Previous
Survey
Difference in Percent from
Previous Survey
Percent of WorkforceIntending to Remain in
Profession for 6 or More Years
Injury Hospitalizations (2014)
Injury Hospitalizations and Median Charges by Age and Sex
Injury Hospitalizations and Median Charges by Type of Payor
Injury Hospitalizations and Median Charges by Mechanism/Intent and Sex
0-4 5-14 15-24 25-44 45-64 65 and Older
Male - Total
Male - Median Charges
Female - Total
Female - Median Charges
UnintentionalMotor Vehicle All Poisonings Unintentional Falls
Unintentional Fire/Flame or Hot Object/Substance All Firearm All Other Injuries
Male - Total
Male - Median Charges
Female - Total
Female - Median Charges
Medicare Medicaid Other Government Commercial / Private Blue Cross Uninsured
Total Hospitalizations
Median Charges
All Ages
216 4 3 24 26 77 82
$31,967.83 ND ND $33,169.43 $63,199.19 $26,445.52 $32,243.13
193 2 5 15 26 52 93
$29,533.20 ND ND $34,677.64 $13,957.70 $37,064.68 $32,597.25
Note: Median charges not displayed (ND) for occurrences less than 10.
12186 49 77786
$12,032.82 $29,472.90 $32,704.70 $29,012.30 $35,883.30 ND
54
86
21
33
30
18
82
73
6
6
0
0
$34,588.60
$34,552.71
$36,865.05
$56,742.04
$9,852.37
$13,240.10
$30,291.23
$27,107.40
ND
ND
-
-
Disclaimer: Injury data used in this report were provided to the Pennsylvania Department of Health by the Pennsylvania Health Care Cost Containment Council. The Pennsylvania Health Care Cost Containment Council specifically disclaims responsibility for any interpretations or conclusions. Contents may be republished or reproduced whole or in part, with attribution.

Philadelphia CountyHealth Profile 2016
Demographic Data (2014)
% Population Change 2010 to 2014 2.2
Median Age of the Population (2010-2014) 33.6
% Population Aged 65 and Over 12.5
Population per Square Mile 11,635.3
% Population with Income Below Poverty Level (2010-2014) 26.7
Per Capita Personal Income $42,617
% Labor Force Unemployed - Annual Average 8.1
% Population Eligible for Medical Assistance 33.9
Estimated Population by Age and Sex (2014)
Age Total Male Female Age Total Male Female
All Ages 1,560,297
Under 5 110,126
5-14 183,242
15-24 230,259
25-34 283,087
737,777
56,000
93,211
113,052
136,032
822,520
54,126
90,031
117,207
147,055
35-44 190,770
45-54 190,198
55-64 177,300
65-74 107,574
75+ 87,741
91,446
90,336
80,689
45,699
31,312
99,324
99,862
96,611
61,875
56,429
Estimated Population by Race and Hispanic Origin (2014)
White 706,530 Black 688,054 Other Races 51,532 Hispanic (any race) 212,703
Natality and Reported Pregnancies^ (2014 Residents)
Crude Birth Rate14.3
Average Annual General62.2
% Low Birth Weight 10.7
% Prenatal Care in 1st Trimester 56.4
% Births to Mothers Under 18 2.5
7.4
68.1
0.7
13.7
49.7
3.3
Per 1,000 Population
Fertility Rate* (2012-2014)
All Races White Black
All Ages 35,338
Under 15 72
15-17 939
22,379
27
520
258
1
7
12,701
44
412
Age of WomanReported
PregnanciesLive
BirthsFetal
DeathsInduced
Abortions
Outcome
Age of WomanReported
PregnanciesLive
BirthsFetal
DeathsInduced
Abortions
Outcome
18-19 2,146
20-29 19,690
30 and Over 12,431
1,238
11,549
8,987
17
127
104
891
8,014
3,340
All Ages* 61.6
Under 15** 0.6
15-17 20.9
97.2
1.7
37.7
Age of Woman Birth Rate Reported Pregnancy Rate Age of Woman Birth Rate Reported Pregnancy Rate
18-19 49.0
20-29 77.8
30 and Over** 42.1
85.0
132.7
58.2
^Live births, fetal deaths of 16+ weeks gestation, and induced abortions performed in-state. Notes: All ages includes any unknown ages. All rates per 1,000.*All Ages includes female population ages 15-44. ** Under 15 includes female population ages 10-14; 30 and Over includes female population ages 30-49.
Hispanic
9.5
51.8
4.3
(of any race)
Asian/PI* 114,181
6.7
60.7
0.7
Asian / Pacific
General Notes: Crude and age-adjusted rates based on less than 10 events are considered statistically unreliable and are not displayed (ND), unless otherwise noted. Starting in 2013, race of resident was derived from multiple race selections. A person is Multi-Race if they identify as more than one race. Prior to 2013, race of resident was derived from a single race designation.
Morbidity (2012-2014 Residents)
Reported Incidence and Average Annual Rate (per 100,000) for Selected Notifiable Diseases (2012-2014)
HIV 1,959 42.0
Syphilis 855 18.3
Tuberculosis 253 5.4
Total Rate
Chlamydia 59,308 1272.4
Giardiasis 207 4.4
Gonorrhea 19,557 419.6
Hepatitis: Type A 14 0.3
Total Rate
Lyme Disease 381 8.2
Salmonellosis 828 17.8
Total Rate
Campylobacteriosis 419 9.0 Hep. B* Acute 16 0.3
Shigellosis 182 3.9
*Hepatitis: Type B **Meningococcal Disease
Meningococcal** 11 0.2
Pertussis 486 10.4
Hep. B* Chronic 739 15.9
Chickenpox 403 8.6
Islander
Multi-Race 38,669
*Asian/Pacific Islander
Note: Communicable diseases with demographic counts of 1 to 4 are displayed as "< 5" to avoid potential identification of cases within certain geographic areas.
Multi - Race
10.9
53.3
4.1

Philadelphia County PAGE 2
Mortality (2014 Residents)
Selected Major Causes of Death, Number and Average Annual Age-Adjusted Death Rate* (2012-2014)
Number of Resident Deaths 13,923
Crude Death Rate per 1,000 8.9
Age-Adjusted Death Rate per 1,000 8.6
Number of Infant Deaths (< 1 Year of Age) 177 25 118 22
AllRaces BlackWhite
Hispanic(any race)
Infant Mortality Rate per 1,000 Live Births 7.9 3.9 12.1 5.6
Average Annual Infant Mortality Rate (2012-2014) 9.2 4.7 13.2 5.9
Cause Total Rate
Diseases of Heart 10,088
Cancer 9,584
Stroke 2,040
C.L.R.D.** 1,809
Accidents 2,472
207.7
201.5
42.1
38.0
52.3
Cause Total Rate
Influenza/Pneumonia 709
Diabetes Mellitus 1,136
Septicemia 964
Nephritis/Nephrosis 954
Alzheimer's Disease 530
14.7
23.9
20.1
19.9
10.4
* Per 100,000 2000 U.S. standardmillion population. Age-adjusted rates
** Chronic Lower Respiratory Disease
Selected Leading Causes of Death, Number by Age Group (2014)
Under 5 Years of Age 5-24 Years of Age 25-44 Years of Age 45-64 Years of Age 65 Years and Older
Perinatal Conditions 106
Birth Defects 24
Accidents 8
Diseases of Heart 4
InSi/Ben/Unc Npsm^ 3
Accidents 70
Assault (Homicide) 70
Suicide 23
Cancer 13
Diseases of Heart 9
Accidents 276
Assault (Homicide) 118
Diseases of Heart 102
Cancer 82
Suicide 51
Cancer 909
Diseases of Heart 795
Accidents 307
Stroke 140
Diabetes Mellitus 111
Diseases of Heart 2,522
Cancer 2,184
Stroke 532
C.L.R.D.** 462
Diabetes Mellitus 249
TOTAL 195 TOTAL 218 TOTAL 852 TOTAL 3,367 TOTAL 9,284
Note: Total includes all other causes.
Asian/PI*
6
ND
*Asian/Pacific Islander ^ NA = Multi-Race data not available before 2013.
are only comparable if the samestandard million population was usedin the calculation.
Invasive Cancer Incidence and Average Annual Age-Adjusted Rates* for Major Sites by Sex
All Sites 12,026 601.3
Prostate 3,015 144.7
Lung and Bronchus 1,814 94.4
Colon and Rectum 1,132 58.3
Male FemaleTotal Rate Total Rate
Female Breast 3,223 123.3
12,673 474.6
1,912 70.5
1,120 41.1
*Per 100,000 2000 U.S. standard million population. Age-adjusted rates are only comparable if the same standard million population was used in the calculation.
- -
- -
Male FemaleTotal Rate Total Rate
Non-Hodgkin Lymphoma 496 24.9
Melanoma of the Skin 303 15.8
443 16.4
912 33.3
197 7.4
Corpus and Uterus, NOS - -
Urinary Bladder 729
Kidney and Renal Pelvis 588 28.8
39.3 301
385
10.7
14.6
Notes: All in situ cases, except for urinary bladder, are excluded. Age-adjusted rates based on less than 20 events are statistically unreliable and are not displayed (ND).
Cancer Incidence (2011-2013 Residents)
Adult Behavioral Health Risk Factors (2012-2014)[Includes: Philadelphia County Only]
General Notes: Crude and age-adjusted rates based on less than 10 events are considered statistically unreliable and are not displayed (ND), unless otherwise noted. Starting in 2013, race of resident was derived from multiple race selections. A person is Multi-Race if they identify as more than one race. Prior to 2013, race of resident was derived from a single race designation.
Percent (CI)Risk Factors
Fair or poor general health:
Obese:
Overweight (includes obese):
No health insurance (ages 18-64):
Visited a doctor in the past 2 yearsfor a routine check-up:
Percent (CI)Risk Factors
Ever told they have diabetes: Currently has asthma:
Current smoker:
Ever tested for HIV (ages 18-64):
Needed to see a doctor but couldnot due to cost in the past year:
22
31
(20 - 23)
(29 - 33)
65 (63 - 67)
22 (20 - 24)
84 (83 - 86)
12 12(11 - 13) (11 - 14)
24 (22 - 26)
64 (61 - 66)
19 (18 - 21)
Notes: Data are based on 2012-2014 annual sample surveys of Pennsylvania adults. CI= 95% Confidence Interval.
Additional state or county/regional data are available at www.statistics.health.pa.gov.
^In situ, benign, and uncertain neoplasms
Multi- Race
2
ND
NA4.4 ^

Philadelphia County PAGE 3
Hospitals (7/13-6/14)
Total General Acute Care
Psychiatric Rehabilitation
30 16 4 1
General Hospitals
Beds Set Up and Staffed 5,520
Admissions 262,959
Beds per 1,000 Population 3.5
Admissions per 1,000 Population 168.5
Average Inpatient Occupancy Rate 71.8
Nursing Homes (2014)
Total Number Certified-Medicare Certified-Medicaid
Nursing Homes
Licensed/Approved Beds
47 45 43
7,656 7,243 7,516
39.2
Average Occupancy Rate 92.7
Average Length of Stay (Number of Days) 139.0
$342
Total Licensed/Approved Beds per 1,000 Population Age 65 and Older
Average Semi-Private Daily Room Rate
Drug and Alcohol Treatment
Admissions to Client Primary Diagnosis
Drug Abuse Alcohol Abuse Other*
Percent Admitted
Only Once During 7/13-6/14
2,738 1,864 531 124 92.8
* Includes family members receiving counseling.
All Licensed Facilities Inpatient Non-Hospital
Inpatient Hospital Partial Hospitalization Outpatient116
37
5 10 79
Note: Each licensed facility may provide more than one type of service.
State-Supported Facilities
Types of Service Provided
Number of
Clients Admitted
2,519
Admission by County of Residence (7/13-6/14)
Treatment Facilities (as of 6/14)
Correctional Institution 0
General Note: Crude rates based on less than 10 events are considered statistically unreliable and are not displayed (ND), unless otherwise noted.
Services Funding
Other
9
Non-Profit
17
For Profit
11
State
0
Other
2
Ambulatory Surgery Centers (7/13-6/14)
Employees
Part Time Employees 346
Full Time Employees 327
Contracted Employees 259
Payroll Employees 414 Staff with Clinical Privileges 387
Total Surgical Visits per Employee 93.8
Total Facilities 24 Total Surgical Visits 63,150
Percent of Surgical Visits, Age 65+ 32.6
Total Operating Rooms 45 Total Surgical Visits per Operating Room 1,403.3
Facilities Surgical Visits
Staff Licensed as M.D. 313
Total Employees per Operating Room 15.0
Average Semi-Private Daily Room Rate $3,491
Total Employees 673
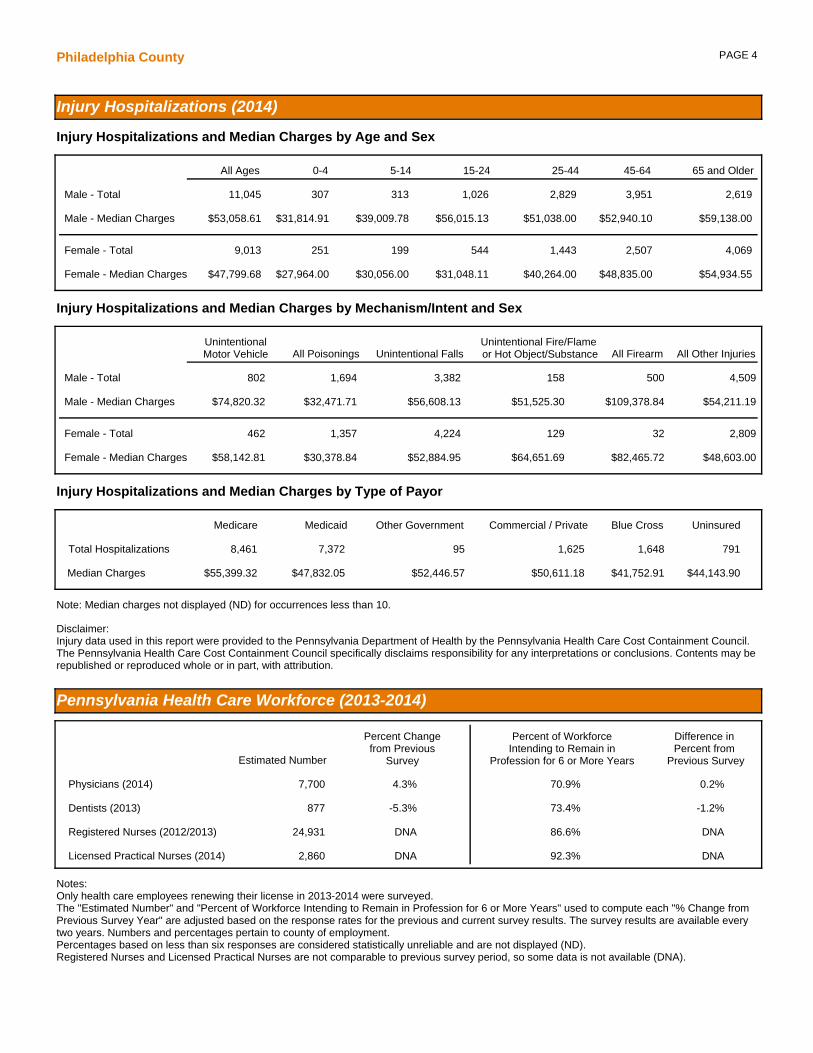
PAGE 4Philadelphia County
Pennsylvania Health Care Workforce (2013-2014)
Notes: Only health care employees renewing their license in 2013-2014 were surveyed.The "Estimated Number" and "Percent of Workforce Intending to Remain in Profession for 6 or More Years" used to compute each "% Change from Previous Survey Year" are adjusted based on the response rates for the previous and current survey results. The survey results are available every two years. Numbers and percentages pertain to county of employment.Percentages based on less than six responses are considered statistically unreliable and are not displayed (ND).Registered Nurses and Licensed Practical Nurses are not comparable to previous survey period, so some data is not available (DNA).
Licensed Practical Nurses (2014) 2,860 DNA 92.3% DNA
Physicians (2014) 7,700
Dentists (2013) 877
Registered Nurses (2012/2013) 24,931 DNA 86.6% DNA
4.3% 70.9% 0.2%
-5.3% 73.4% -1.2%
Estimated Number
Percent Changefrom Previous
Survey
Difference in Percent from
Previous Survey
Percent of WorkforceIntending to Remain in
Profession for 6 or More Years
Injury Hospitalizations (2014)
Injury Hospitalizations and Median Charges by Age and Sex
Injury Hospitalizations and Median Charges by Type of Payor
Injury Hospitalizations and Median Charges by Mechanism/Intent and Sex
0-4 5-14 15-24 25-44 45-64 65 and Older
Male - Total
Male - Median Charges
Female - Total
Female - Median Charges
UnintentionalMotor Vehicle All Poisonings Unintentional Falls
Unintentional Fire/Flame or Hot Object/Substance All Firearm All Other Injuries
Male - Total
Male - Median Charges
Female - Total
Female - Median Charges
Medicare Medicaid Other Government Commercial / Private Blue Cross Uninsured
Total Hospitalizations
Median Charges
All Ages
11,045 307 313 1,026 2,829 3,951 2,619
$53,058.61 $31,814.91 $39,009.78 $56,015.13 $51,038.00 $52,940.10 $59,138.00
9,013 251 199 544 1,443 2,507 4,069
$47,799.68 $27,964.00 $30,056.00 $31,048.11 $40,264.00 $48,835.00 $54,934.55
Note: Median charges not displayed (ND) for occurrences less than 10.
7918,461 7,372 1,6481,62595
$44,143.90 $55,399.32 $47,832.05 $41,752.91 $50,611.18 $52,446.57
2,809
4,509
462
802
1,357
1,694
4,224
3,382
129
158
32
500
$48,603.00
$54,211.19
$58,142.81
$74,820.32
$30,378.84
$32,471.71
$52,884.95
$56,608.13
$64,651.69
$51,525.30
$82,465.72
$109,378.84
Disclaimer: Injury data used in this report were provided to the Pennsylvania Department of Health by the Pennsylvania Health Care Cost Containment Council. The Pennsylvania Health Care Cost Containment Council specifically disclaims responsibility for any interpretations or conclusions. Contents may be republished or reproduced whole or in part, with attribution.

Pike CountyHealth Profile 2016
Demographic Data (2014)
% Population Change 2010 to 2014 -2.1
Median Age of the Population (2010-2014) 45.3
% Population Aged 65 and Over 20.3
Population per Square Mile 103.1
% Population with Income Below Poverty Level (2010-2014) 9.8
Per Capita Personal Income $39,078
% Labor Force Unemployed - Annual Average 7.6
% Population Eligible for Medical Assistance 14.3
Estimated Population by Age and Sex (2014)
Age Total Male Female Age Total Male Female
All Ages 56,191
Under 5 2,123
5-14 6,514
15-24 7,039
25-34 4,848
28,205
1,062
3,361
3,778
2,497
27,986
1,061
3,153
3,261
2,351
35-44 6,126
45-54 9,391
55-64 8,719
65-74 6,983
75+ 4,448
3,008
4,637
4,373
3,384
2,105
3,118
4,754
4,346
3,599
2,343
Natality and Reported Pregnancies^ (2014 Residents)
Crude Birth Rate7.2
Average Annual General42.3
% Low Birth Weight 9.3
% Prenatal Care in 1st Trimester 65.5
% Births to Mothers Under 18 ND
7.6
68.9
ND
ND
ND
ND
Per 1,000 Population
Fertility Rate* (2012-2014)
All Races White Black
All Ages 444
Under 15 0
15-17 4
407
0
4
3
0
0
34
0
0
Age of WomanReported
PregnanciesLive
BirthsFetal
DeathsInduced
Abortions
Outcome
Age of WomanReported
PregnanciesLive
BirthsFetal
DeathsInduced
Abortions
Outcome
18-19 15
20-29 229
30 and Over 195
9
205
188
0
3
0
6
21
7
All Ages* 46.6
Under 15** ND
15-17 ND
50.9
ND
ND
Age of Woman Birth Rate Reported Pregnancy Rate Age of Woman Birth Rate Reported Pregnancy Rate
18-19 ND
20-29 77.9
30 and Over** 28.8
22.5
87.1
29.9
^Live births, fetal deaths of 16+ weeks gestation, and induced abortions performed in-state. Notes: All ages includes any unknown ages. All rates per 1,000.*All Ages includes female population ages 15-44. ** Under 15 includes female population ages 10-14; 30 and Over includes female population ages 30-49.
Hispanic
ND
51.2
ND
(of any race)
ND
ND
ND
Asian / Pacific
General Notes: Crude and age-adjusted rates based on less than 10 events are considered statistically unreliable and are not displayed (ND), unless otherwise noted. Starting in 2013, race of resident was derived from multiple race selections. A person is Multi-Race if they identify as more than one race. Prior to 2013, race of resident was derived from a single race designation.
Morbidity (2012-2014 Residents)
Reported Incidence and Average Annual Rate (per 100,000) for Selected Notifiable Diseases (2012-2014)
HIV 21 12.4
Syphilis 1 ND
Tuberculosis < 5 ND
Total Rate
Chlamydia 161 94.9
Giardiasis 8 ND
Gonorrhea 17 10.0
Hepatitis: Type A < 5 ND
Total Rate
Lyme Disease 103 60.7
Salmonellosis 12 7.1
Total Rate
Campylobacteriosis 23 13.6 Hep. B* Acute < 5 ND
Shigellosis 0 ND
*Hepatitis: Type B **Meningococcal Disease
Meningococcal** 0 ND
Pertussis 7 ND
Hep. B* Chronic 27 15.9
Chickenpox 0 ND
Islander
Note: Communicable diseases with demographic counts of 1 to 4 are displayed as "< 5" to avoid potential identification of cases within certain geographic areas.
Multi - Race
ND
ND
ND

Pike County PAGE 2
Mortality (2014 Residents)
Selected Major Causes of Death, Number and Average Annual Age-Adjusted Death Rate* (2012-2014)
Number of Resident Deaths 387
Crude Death Rate per 1,000 6.9
Age-Adjusted Death Rate per 1,000 5.1
Number of Infant Deaths (< 1 Year of Age) 2 2 0 0
AllRaces BlackWhite
Hispanic(any race)
Infant Mortality Rate per 1,000 Live Births ND ND ND ND
Average Annual Infant Mortality Rate (2012-2014) ND ND ND ND
Cause Total Rate
Diseases of Heart 301
Cancer 328
Stroke 41
C.L.R.D.** 67
Accidents 72
135.6
134.1
19.1
28.6
38.6
Cause Total Rate
Influenza/Pneumonia 16
Diabetes Mellitus 46
Septicemia 23
Nephritis/Nephrosis 25
Alzheimer's Disease 29
7.6
19.5
10.2
11.8
14.0
* Per 100,000 2000 U.S. standardmillion population. Age-adjusted rates
** Chronic Lower Respiratory Disease
Selected Leading Causes of Death, Number by Age Group (2014)
Under 5 Years of Age 5-24 Years of Age 25-44 Years of Age 45-64 Years of Age 65 Years and Older
Accidents 2
Suicide 2
Accidents 5
Cancer 2
Cancer 24
Diseases of Heart 11
Accidents 9
Diabetes Mellitus 7
Suicide 6
Cancer 74
Diseases of Heart 74
C.L.R.D.** 16
Stroke 13
TOTAL 3 TOTAL 6 TOTAL 13 TOTAL 77 TOTAL 288
Note: Total includes all other causes.
Asian/PI*
0
ND
*Asian/Pacific Islander ^ NA = Multi-Race data not available before 2013.
are only comparable if the samestandard million population was usedin the calculation.
Invasive Cancer Incidence and Average Annual Age-Adjusted Rates* for Major Sites by Sex
All Sites 525 452.1
Prostate 107 83.0
Lung and Bronchus 79 64.1
Colon and Rectum 41 37.5
Male FemaleTotal Rate Total Rate
Female Breast 119 100.3
485 412.9
74 59.2
47 40.1
*Per 100,000 2000 U.S. standard million population. Age-adjusted rates are only comparable if the same standard million population was used in the calculation.
- -
- -
Male FemaleTotal Rate Total Rate
Non-Hodgkin Lymphoma 23 21.8
Melanoma of the Skin 22 17.9
12 ND
35 27.3
13 ND
Corpus and Uterus, NOS - -
Urinary Bladder 48
Kidney and Renal Pelvis 22 19.7
40.4 10
11
ND
ND
Notes: All in situ cases, except for urinary bladder, are excluded. Age-adjusted rates based on less than 20 events are statistically unreliable and are not displayed (ND).
Cancer Incidence (2011-2013 Residents)
Adult Behavioral Health Risk Factors (2012-2014)[Includes: Pike, Monroe, Susquehanna, and Wayne Counties]
General Notes: Crude and age-adjusted rates based on less than 10 events are considered statistically unreliable and are not displayed (ND), unless otherwise noted. Starting in 2013, race of resident was derived from multiple race selections. A person is Multi-Race if they identify as more than one race. Prior to 2013, race of resident was derived from a single race designation.
Percent (CI)Risk Factors
Fair or poor general health:
Obese:
Overweight (includes obese):
No health insurance (ages 18-64):
Visited a doctor in the past 2 yearsfor a routine check-up:
Percent (CI)Risk Factors
Ever told they have diabetes: Currently has asthma:
Current smoker:
Ever tested for HIV (ages 18-64):
Needed to see a doctor but couldnot due to cost in the past year:
21
31
(17 - 26)
(27 - 35)
68 (64 - 71)
18 (14 - 24)
82 (77 - 86)
9 13(7 - 11) (9 - 17)
25 (20 - 30)
33 (28 - 38)
14 (11 - 18)
Notes: Data are based on 2012-2014 annual sample surveys of Pennsylvania adults. CI= 95% Confidence Interval.
Additional state or county/regional data are available at www.statistics.health.pa.gov.
^In situ, benign, and uncertain neoplasms
Multi- Race
0
ND
NAND ^

Pike County PAGE 3
Hospitals (7/13-6/14)
Total General Acute Care
Psychiatric Rehabilitation
0 0 0 0
General Hospitals
Beds Set Up and Staffed -
Admissions -
Beds per 1,000 Population -
Admissions per 1,000 Population -
Average Inpatient Occupancy Rate -
Nursing Homes (2014)
Total Number Certified-Medicare Certified-Medicaid
Nursing Homes
Licensed/Approved Beds
2 2 2
110 110 110
9.6
Average Occupancy Rate 90.9
Average Length of Stay (Number of Days) 118.1
$290
Total Licensed/Approved Beds per 1,000 Population Age 65 and Older
Average Semi-Private Daily Room Rate
Drug and Alcohol Treatment
Admissions to Client Primary Diagnosis
Drug Abuse Alcohol Abuse Other*
Percent Admitted
Only Once During 7/13-6/14
255 146 64 1 85.8
* Includes family members receiving counseling.
All Licensed Facilities Inpatient Non-Hospital
Inpatient Hospital Partial Hospitalization Outpatient1
0
0 0 1
Note: Each licensed facility may provide more than one type of service.
State-Supported Facilities
Types of Service Provided
Number of
Clients Admitted
211
Admission by County of Residence (7/13-6/14)
Treatment Facilities (as of 6/14)
Correctional Institution 0
General Note: Crude rates based on less than 10 events are considered statistically unreliable and are not displayed (ND), unless otherwise noted.
Services Funding
Other
0
Non-Profit
0
For Profit
0
State
0
Other
0
Ambulatory Surgery Centers (7/13-6/14)
Employees
Part Time Employees -
Full Time Employees -
Contracted Employees -
Payroll Employees - Staff with Clinical Privileges -
Total Surgical Visits per Employee -
Total Facilities 0 Total Surgical Visits -
Percent of Surgical Visits, Age 65+ -
Total Operating Rooms - Total Surgical Visits per Operating Room -
Facilities Surgical Visits
Staff Licensed as M.D. -
Total Employees per Operating Room -
Average Semi-Private Daily Room Rate -
Total Employees -

PAGE 4Pike County
Pennsylvania Health Care Workforce (2013-2014)
Notes: Only health care employees renewing their license in 2013-2014 were surveyed.The "Estimated Number" and "Percent of Workforce Intending to Remain in Profession for 6 or More Years" used to compute each "% Change from Previous Survey Year" are adjusted based on the response rates for the previous and current survey results. The survey results are available every two years. Numbers and percentages pertain to county of employment.Percentages based on less than six responses are considered statistically unreliable and are not displayed (ND).Registered Nurses and Licensed Practical Nurses are not comparable to previous survey period, so some data is not available (DNA).
Licensed Practical Nurses (2014) 55 DNA 79.2% DNA
Physicians (2014) 23
Dentists (2013) 14
Registered Nurses (2012/2013) 88 DNA 82.5% DNA
-6.0% 78.9% 24.4%
-13.9% 91.7% 6.0%
Estimated Number
Percent Changefrom Previous
Survey
Difference in Percent from
Previous Survey
Percent of WorkforceIntending to Remain in
Profession for 6 or More Years
Injury Hospitalizations (2014)
Injury Hospitalizations and Median Charges by Age and Sex
Injury Hospitalizations and Median Charges by Type of Payor
Injury Hospitalizations and Median Charges by Mechanism/Intent and Sex
0-4 5-14 15-24 25-44 45-64 65 and Older
Male - Total
Male - Median Charges
Female - Total
Female - Median Charges
UnintentionalMotor Vehicle All Poisonings Unintentional Falls
Unintentional Fire/Flame or Hot Object/Substance All Firearm All Other Injuries
Male - Total
Male - Median Charges
Female - Total
Female - Median Charges
Medicare Medicaid Other Government Commercial / Private Blue Cross Uninsured
Total Hospitalizations
Median Charges
All Ages
136 1 1 6 25 48 55
$44,728.70 ND ND ND $44,234.48 $61,815.45 $38,592.92
128 2 1 7 19 41 58
$30,824.78 ND ND ND $26,386.93 $34,276.90 $30,696.42
Note: Median charges not displayed (ND) for occurrences less than 10.
9150 26 21643
ND $33,680.63 $26,329.68 $55,132.58 $43,199.86 ND
41
57
15
20
24
9
47
48
1
2
0
0
$30,525.15
$44,753.22
$45,171.15
$73,493.62
$18,938.65
ND
$32,619.81
$42,305.05
ND
ND
-
-
Disclaimer: Injury data used in this report were provided to the Pennsylvania Department of Health by the Pennsylvania Health Care Cost Containment Council. The Pennsylvania Health Care Cost Containment Council specifically disclaims responsibility for any interpretations or conclusions. Contents may be republished or reproduced whole or in part, with attribution.

Potter CountyHealth Profile 2016
Demographic Data (2014)
% Population Change 2010 to 2014 -1.4
Median Age of the Population (2010-2014) 45.5
% Population Aged 65 and Over 21.8
Population per Square Mile 15.9
% Population with Income Below Poverty Level (2010-2014) 14.4
Per Capita Personal Income $35,867
% Labor Force Unemployed - Annual Average 7.4
% Population Eligible for Medical Assistance 19.3
Estimated Population by Age and Sex (2014)
Age Total Male Female Age Total Male Female
All Ages 17,206
Under 5 961
5-14 2,032
15-24 1,907
25-34 1,675
8,610
480
1,054
1,016
871
8,596
481
978
891
804
35-44 1,755
45-54 2,434
55-64 2,691
65-74 2,106
75+ 1,645
890
1,208
1,358
1,029
704
865
1,226
1,333
1,077
941
Natality and Reported Pregnancies^ (2014 Residents)
Crude Birth Rate10.9
Average Annual General72.4
% Low Birth Weight 7.0
% Prenatal Care in 1st Trimester 83.7
% Births to Mothers Under 18 ND
7.3
84.2
ND
ND
ND
ND
Per 1,000 Population
Fertility Rate* (2012-2014)
All Races White Black
All Ages 189
Under 15 0
15-17 4
187
0
4
1
0
0
1
0
0
Age of WomanReported
PregnanciesLive
BirthsFetal
DeathsInduced
Abortions
Outcome
Age of WomanReported
PregnanciesLive
BirthsFetal
DeathsInduced
Abortions
Outcome
18-19 17
20-29 108
30 and Over 60
17
108
58
0
0
1
0
0
1
All Ages* 73.0
Under 15** ND
15-17 ND
73.8
ND
ND
Age of Woman Birth Rate Reported Pregnancy Rate Age of Woman Birth Rate Reported Pregnancy Rate
18-19 107.6
20-29 129.5
30 and Over** 32.0
107.6
129.5
33.1
^Live births, fetal deaths of 16+ weeks gestation, and induced abortions performed in-state. Notes: All ages includes any unknown ages. All rates per 1,000.*All Ages includes female population ages 15-44. ** Under 15 includes female population ages 10-14; 30 and Over includes female population ages 30-49.
Hispanic
ND
ND
ND
(of any race)
ND
ND
ND
Asian / Pacific
General Notes: Crude and age-adjusted rates based on less than 10 events are considered statistically unreliable and are not displayed (ND), unless otherwise noted. Starting in 2013, race of resident was derived from multiple race selections. A person is Multi-Race if they identify as more than one race. Prior to 2013, race of resident was derived from a single race designation.
Morbidity (2012-2014 Residents)
Reported Incidence and Average Annual Rate (per 100,000) for Selected Notifiable Diseases (2012-2014)
HIV 1 ND
Syphilis 0 ND
Tuberculosis 0 ND
Total Rate
Chlamydia 94 179.8
Giardiasis 7 ND
Gonorrhea 0 ND
Hepatitis: Type A 0 ND
Total Rate
Lyme Disease 56 107.1
Salmonellosis 6 ND
Total Rate
Campylobacteriosis 6 ND Hep. B* Acute 0 ND
Shigellosis < 5 ND
*Hepatitis: Type B **Meningococcal Disease
Meningococcal** 0 ND
Pertussis 47 89.9
Hep. B* Chronic 5 ND
Chickenpox 0 ND
Islander
Note: Communicable diseases with demographic counts of 1 to 4 are displayed as "< 5" to avoid potential identification of cases within certain geographic areas.
Multi - Race
ND
ND
ND

Potter County PAGE 2
Mortality (2014 Residents)
Selected Major Causes of Death, Number and Average Annual Age-Adjusted Death Rate* (2012-2014)
Number of Resident Deaths 198
Crude Death Rate per 1,000 11.5
Age-Adjusted Death Rate per 1,000 7.3
Number of Infant Deaths (< 1 Year of Age) 2 2 0 0
AllRaces BlackWhite
Hispanic(any race)
Infant Mortality Rate per 1,000 Live Births ND ND ND ND
Average Annual Infant Mortality Rate (2012-2014) ND ND ND ND
Cause Total Rate
Diseases of Heart 122
Cancer 162
Stroke 29
C.L.R.D.** 32
Accidents 26
145.0
192.5
32.8
37.3
43.4
Cause Total Rate
Influenza/Pneumonia 11
Diabetes Mellitus 22
Septicemia 16
Nephritis/Nephrosis 16
Alzheimer's Disease 5
12.0
26.1
18.5
17.5
ND
* Per 100,000 2000 U.S. standardmillion population. Age-adjusted rates
** Chronic Lower Respiratory Disease
Selected Leading Causes of Death, Number by Age Group (2014)
Under 5 Years of Age 5-24 Years of Age 25-44 Years of Age 45-64 Years of Age 65 Years and Older
Cancer 8
Diseases of Heart 6
Diseases of Heart 41
Cancer 31
Stroke 12
C.L.R.D.** 8
Diabetes Mellitus 7
TOTAL 3 TOTAL 0 TOTAL 5 TOTAL 25 TOTAL 165
Note: Total includes all other causes.
Asian/PI*
0
ND
*Asian/Pacific Islander ^ NA = Multi-Race data not available before 2013.
are only comparable if the samestandard million population was usedin the calculation.
Invasive Cancer Incidence and Average Annual Age-Adjusted Rates* for Major Sites by Sex
All Sites 224 577.7
Prostate 52 124.2
Lung and Bronchus 37 90.9
Colon and Rectum 24 64.9
Male FemaleTotal Rate Total Rate
Female Breast 43 118.2
164 426.4
33 77.5
23 53.0
*Per 100,000 2000 U.S. standard million population. Age-adjusted rates are only comparable if the same standard million population was used in the calculation.
- -
- -
Male FemaleTotal Rate Total Rate
Non-Hodgkin Lymphoma 9 ND
Melanoma of the Skin 17 ND
6 ND
11 ND
9 ND
Corpus and Uterus, NOS - -
Urinary Bladder 11
Kidney and Renal Pelvis 8 ND
ND 3
3
ND
ND
Notes: All in situ cases, except for urinary bladder, are excluded. Age-adjusted rates based on less than 20 events are statistically unreliable and are not displayed (ND).
Cancer Incidence (2011-2013 Residents)
Adult Behavioral Health Risk Factors (2012-2014)[Includes: Bradford, Sullivan, Tioga, Lycoming, Clinton, and Potter Counties]
General Notes: Crude and age-adjusted rates based on less than 10 events are considered statistically unreliable and are not displayed (ND), unless otherwise noted. Starting in 2013, race of resident was derived from multiple race selections. A person is Multi-Race if they identify as more than one race. Prior to 2013, race of resident was derived from a single race designation.
Percent (CI)Risk Factors
Fair or poor general health:
Obese:
Overweight (includes obese):
No health insurance (ages 18-64):
Visited a doctor in the past 2 yearsfor a routine check-up:
Percent (CI)Risk Factors
Ever told they have diabetes: Currently has asthma:
Current smoker:
Ever tested for HIV (ages 18-64):
Needed to see a doctor but couldnot due to cost in the past year:
18
32
(15 - 20)
(29 - 35)
67 (63 - 70)
13 (11 - 16)
85 (82 - 87)
10 10(9 - 12) (8 - 12)
22 (20 - 25)
34 (30 - 38)
9 (7 - 11)
Notes: Data are based on 2012-2014 annual sample surveys of Pennsylvania adults. CI= 95% Confidence Interval.
Additional state or county/regional data are available at www.statistics.health.pa.gov.
^In situ, benign, and uncertain neoplasms
Multi- Race
0
ND
NAND ^

Potter County PAGE 3
Hospitals (7/13-6/14)
Total General Acute Care
Psychiatric Rehabilitation
1 1 0 0
General Hospitals
Beds Set Up and Staffed 35
Admissions 1,824
Beds per 1,000 Population 2.0
Admissions per 1,000 Population 106.0
Average Inpatient Occupancy Rate 62.9
Nursing Homes (2014)
Total Number Certified-Medicare Certified-Medicaid
Nursing Homes
Licensed/Approved Beds
2 2 2
170 170 170
45.3
Average Occupancy Rate 83.8
Average Length of Stay (Number of Days) 105.7
$259
Total Licensed/Approved Beds per 1,000 Population Age 65 and Older
Average Semi-Private Daily Room Rate
Drug and Alcohol Treatment
Admissions to Client Primary Diagnosis
Drug Abuse Alcohol Abuse Other*
Percent Admitted
Only Once During 7/13-6/14
93 42 38 0 88.8
* Includes family members receiving counseling.
All Licensed Facilities Inpatient Non-Hospital
Inpatient Hospital Partial Hospitalization Outpatient1
0
0 0 1
Note: Each licensed facility may provide more than one type of service.
State-Supported Facilities
Types of Service Provided
Number of
Clients Admitted
80
Admission by County of Residence (7/13-6/14)
Treatment Facilities (as of 6/14)
Correctional Institution 0
General Note: Crude rates based on less than 10 events are considered statistically unreliable and are not displayed (ND), unless otherwise noted.
Services Funding
Other
0
Non-Profit
1
For Profit
0
State
0
Other
0
Ambulatory Surgery Centers (7/13-6/14)
Employees
Part Time Employees -
Full Time Employees -
Contracted Employees -
Payroll Employees - Staff with Clinical Privileges -
Total Surgical Visits per Employee -
Total Facilities 0 Total Surgical Visits -
Percent of Surgical Visits, Age 65+ -
Total Operating Rooms - Total Surgical Visits per Operating Room -
Facilities Surgical Visits
Staff Licensed as M.D. -
Total Employees per Operating Room -
Average Semi-Private Daily Room Rate -
Total Employees -

PAGE 4Potter County
Pennsylvania Health Care Workforce (2013-2014)
Notes: Only health care employees renewing their license in 2013-2014 were surveyed.The "Estimated Number" and "Percent of Workforce Intending to Remain in Profession for 6 or More Years" used to compute each "% Change from Previous Survey Year" are adjusted based on the response rates for the previous and current survey results. The survey results are available every two years. Numbers and percentages pertain to county of employment.Percentages based on less than six responses are considered statistically unreliable and are not displayed (ND).Registered Nurses and Licensed Practical Nurses are not comparable to previous survey period, so some data is not available (DNA).
Licensed Practical Nurses (2014) 56 DNA 85.0% DNA
Physicians (2014) 26
Dentists (2013) ND
Registered Nurses (2012/2013) 192 DNA 85.7% DNA
-0.6% 42.9% -13.7%
ND ND ND
Estimated Number
Percent Changefrom Previous
Survey
Difference in Percent from
Previous Survey
Percent of WorkforceIntending to Remain in
Profession for 6 or More Years
Injury Hospitalizations (2014)
Injury Hospitalizations and Median Charges by Age and Sex
Injury Hospitalizations and Median Charges by Type of Payor
Injury Hospitalizations and Median Charges by Mechanism/Intent and Sex
0-4 5-14 15-24 25-44 45-64 65 and Older
Male - Total
Male - Median Charges
Female - Total
Female - Median Charges
UnintentionalMotor Vehicle All Poisonings Unintentional Falls
Unintentional Fire/Flame or Hot Object/Substance All Firearm All Other Injuries
Male - Total
Male - Median Charges
Female - Total
Female - Median Charges
Medicare Medicaid Other Government Commercial / Private Blue Cross Uninsured
Total Hospitalizations
Median Charges
All Ages
66 1 1 5 6 10 43
$18,350.15 ND ND ND ND $35,003.13 $17,971.75
66 0 1 2 8 21 34
$18,233.68 - ND ND ND $16,827.59 $17,421.25
Note: Median charges not displayed (ND) for occurrences less than 10.
583 11 9231
ND $16,960.76 $16,093.44 ND $35,453.25 ND
13
26
7
5
6
8
38
25
2
2
0
0
$16,827.59
$23,834.34
ND
ND
ND
ND
$16,480.40
$18,728.55
ND
ND
-
-
Disclaimer: Injury data used in this report were provided to the Pennsylvania Department of Health by the Pennsylvania Health Care Cost Containment Council. The Pennsylvania Health Care Cost Containment Council specifically disclaims responsibility for any interpretations or conclusions. Contents may be republished or reproduced whole or in part, with attribution.

Schuylkill CountyHealth Profile 2016
Demographic Data (2014)
% Population Change 2010 to 2014 -1.7
Median Age of the Population (2010-2014) 43.6
% Population Aged 65 and Over 19.3
Population per Square Mile 187.2
% Population with Income Below Poverty Level (2010-2014) 13.4
Per Capita Personal Income $37,839
% Labor Force Unemployed - Annual Average 7.1
% Population Eligible for Medical Assistance 18.8
Estimated Population by Age and Sex (2014)
Age Total Male Female Age Total Male Female
All Ages 145,797
Under 5 6,914
5-14 16,501
15-24 15,881
25-34 17,085
74,544
3,606
8,537
8,472
9,531
71,253
3,308
7,964
7,409
7,554
35-44 18,290
45-54 21,757
55-64 21,182
65-74 14,994
75+ 13,193
9,910
11,471
10,709
7,175
5,133
8,380
10,286
10,473
7,819
8,060
Natality and Reported Pregnancies^ (2014 Residents)
Crude Birth Rate9.4
Average Annual General57.1
% Low Birth Weight 6.5
% Prenatal Care in 1st Trimester 75.2
% Births to Mothers Under 18 2.1
6.0
76.8
2.0
ND
59.1
ND
Per 1,000 Population
Fertility Rate* (2012-2014)
All Races White Black
All Ages 1,568
Under 15 1
15-17 31
1,373
1
28
17
0
0
178
0
3
Age of WomanReported
PregnanciesLive
BirthsFetal
DeathsInduced
Abortions
Outcome
Age of WomanReported
PregnanciesLive
BirthsFetal
DeathsInduced
Abortions
Outcome
18-19 69
20-29 882
30 and Over 581
56
774
510
1
7
9
12
101
62
All Ages* 58.8
Under 15** ND
15-17 11.7
67.2
ND
13.0
Age of Woman Birth Rate Reported Pregnancy Rate Age of Woman Birth Rate Reported Pregnancy Rate
18-19 41.1
20-29 105.5
30 and Over** 29.6
50.7
120.2
33.7
^Live births, fetal deaths of 16+ weeks gestation, and induced abortions performed in-state. Notes: All ages includes any unknown ages. All rates per 1,000.*All Ages includes female population ages 15-44. ** Under 15 includes female population ages 10-14; 30 and Over includes female population ages 30-49.
Hispanic
ND
50.0
ND
(of any race)
ND
ND
ND
Asian / Pacific
General Notes: Crude and age-adjusted rates based on less than 10 events are considered statistically unreliable and are not displayed (ND), unless otherwise noted. Starting in 2013, race of resident was derived from multiple race selections. A person is Multi-Race if they identify as more than one race. Prior to 2013, race of resident was derived from a single race designation.
Morbidity (2012-2014 Residents)
Reported Incidence and Average Annual Rate (per 100,000) for Selected Notifiable Diseases (2012-2014)
HIV 15 3.4
Syphilis 6 ND
Tuberculosis < 5 ND
Total Rate
Chlamydia 727 165.3
Giardiasis < 5 ND
Gonorrhea 56 12.7
Hepatitis: Type A < 5 ND
Total Rate
Lyme Disease 69 15.7
Salmonellosis 40 9.1
Total Rate
Campylobacteriosis 29 6.6 Hep. B* Acute 6 ND
Shigellosis < 5 ND
*Hepatitis: Type B **Meningococcal Disease
Meningococcal** < 5 ND
Pertussis 36 8.2
Hep. B* Chronic 53 12.1
Chickenpox 23 5.2
Islander
Note: Communicable diseases with demographic counts of 1 to 4 are displayed as "< 5" to avoid potential identification of cases within certain geographic areas.
Multi - Race
ND
ND
ND
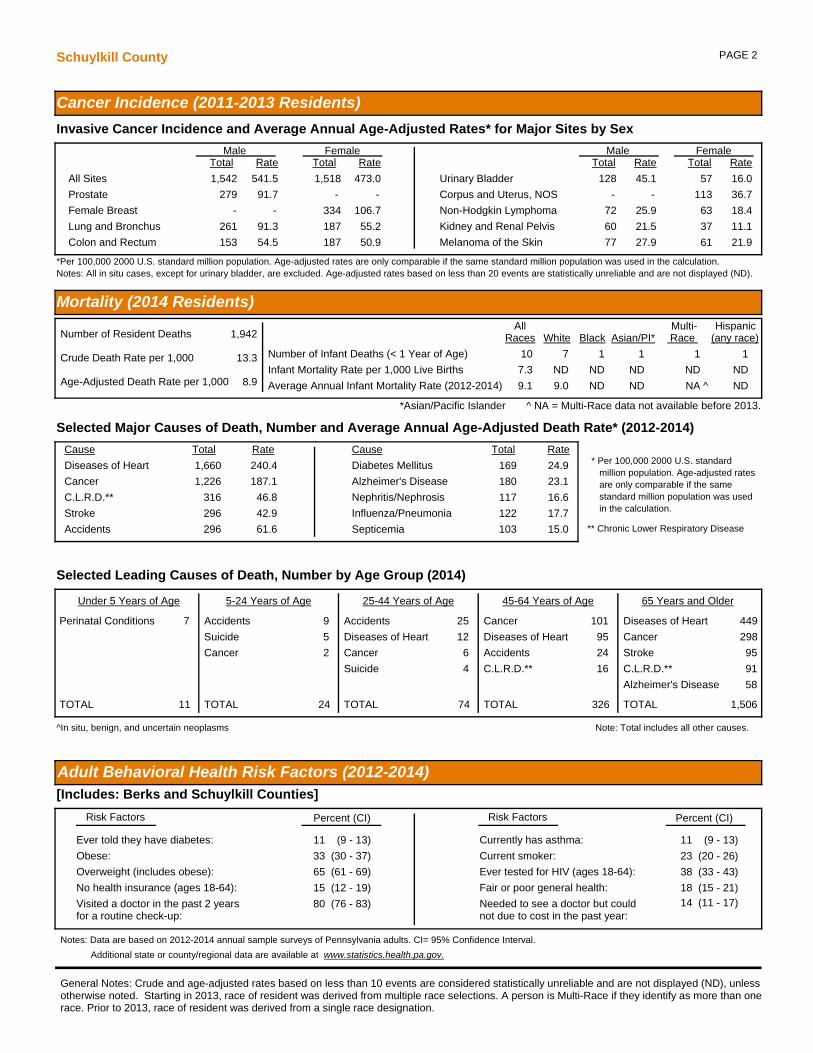
Schuylkill County PAGE 2
Mortality (2014 Residents)
Selected Major Causes of Death, Number and Average Annual Age-Adjusted Death Rate* (2012-2014)
Number of Resident Deaths 1,942
Crude Death Rate per 1,000 13.3
Age-Adjusted Death Rate per 1,000 8.9
Number of Infant Deaths (< 1 Year of Age) 10 7 1 1
AllRaces BlackWhite
Hispanic(any race)
Infant Mortality Rate per 1,000 Live Births 7.3 ND ND ND
Average Annual Infant Mortality Rate (2012-2014) 9.1 9.0 ND ND
Cause Total Rate
Diseases of Heart 1,660
Cancer 1,226
Stroke 296
C.L.R.D.** 316
Accidents 296
240.4
187.1
42.9
46.8
61.6
Cause Total Rate
Influenza/Pneumonia 122
Diabetes Mellitus 169
Septicemia 103
Nephritis/Nephrosis 117
Alzheimer's Disease 180
17.7
24.9
15.0
16.6
23.1
* Per 100,000 2000 U.S. standardmillion population. Age-adjusted rates
** Chronic Lower Respiratory Disease
Selected Leading Causes of Death, Number by Age Group (2014)
Under 5 Years of Age 5-24 Years of Age 25-44 Years of Age 45-64 Years of Age 65 Years and Older
Perinatal Conditions 7 Accidents 9
Suicide 5
Cancer 2
Accidents 25
Diseases of Heart 12
Cancer 6
Suicide 4
Cancer 101
Diseases of Heart 95
Accidents 24
C.L.R.D.** 16
Diseases of Heart 449
Cancer 298
Stroke 95
C.L.R.D.** 91
Alzheimer's Disease 58
TOTAL 11 TOTAL 24 TOTAL 74 TOTAL 326 TOTAL 1,506
Note: Total includes all other causes.
Asian/PI*
1
ND
*Asian/Pacific Islander ^ NA = Multi-Race data not available before 2013.
are only comparable if the samestandard million population was usedin the calculation.
Invasive Cancer Incidence and Average Annual Age-Adjusted Rates* for Major Sites by Sex
All Sites 1,542 541.5
Prostate 279 91.7
Lung and Bronchus 261 91.3
Colon and Rectum 153 54.5
Male FemaleTotal Rate Total Rate
Female Breast 334 106.7
1,518 473.0
187 55.2
187 50.9
*Per 100,000 2000 U.S. standard million population. Age-adjusted rates are only comparable if the same standard million population was used in the calculation.
- -
- -
Male FemaleTotal Rate Total Rate
Non-Hodgkin Lymphoma 72 25.9
Melanoma of the Skin 77 27.9
63 18.4
113 36.7
61 21.9
Corpus and Uterus, NOS - -
Urinary Bladder 128
Kidney and Renal Pelvis 60 21.5
45.1 57
37
16.0
11.1
Notes: All in situ cases, except for urinary bladder, are excluded. Age-adjusted rates based on less than 20 events are statistically unreliable and are not displayed (ND).
Cancer Incidence (2011-2013 Residents)
Adult Behavioral Health Risk Factors (2012-2014)[Includes: Berks and Schuylkill Counties]
General Notes: Crude and age-adjusted rates based on less than 10 events are considered statistically unreliable and are not displayed (ND), unless otherwise noted. Starting in 2013, race of resident was derived from multiple race selections. A person is Multi-Race if they identify as more than one race. Prior to 2013, race of resident was derived from a single race designation.
Percent (CI)Risk Factors
Fair or poor general health:
Obese:
Overweight (includes obese):
No health insurance (ages 18-64):
Visited a doctor in the past 2 yearsfor a routine check-up:
Percent (CI)Risk Factors
Ever told they have diabetes: Currently has asthma:
Current smoker:
Ever tested for HIV (ages 18-64):
Needed to see a doctor but couldnot due to cost in the past year:
18
33
(15 - 21)
(30 - 37)
65 (61 - 69)
15 (12 - 19)
80 (76 - 83)
11 11(9 - 13) (9 - 13)
23 (20 - 26)
38 (33 - 43)
14 (11 - 17)
Notes: Data are based on 2012-2014 annual sample surveys of Pennsylvania adults. CI= 95% Confidence Interval.
Additional state or county/regional data are available at www.statistics.health.pa.gov.
^In situ, benign, and uncertain neoplasms
Multi- Race
1
ND
NAND ^

Schuylkill County PAGE 3
Hospitals (7/13-6/14)
Total General Acute Care
Psychiatric Rehabilitation
3 3 0 0
General Hospitals
Beds Set Up and Staffed 332
Admissions 11,549
Beds per 1,000 Population 2.3
Admissions per 1,000 Population 79.2
Average Inpatient Occupancy Rate 47.6
Nursing Homes (2014)
Total Number Certified-Medicare Certified-Medicaid
Nursing Homes
Licensed/Approved Beds
13 13 13
1,631 1,631 1,631
57.9
Average Occupancy Rate 89.9
Average Length of Stay (Number of Days) 200.6
$285
Total Licensed/Approved Beds per 1,000 Population Age 65 and Older
Average Semi-Private Daily Room Rate
Drug and Alcohol Treatment
Admissions to Client Primary Diagnosis
Drug Abuse Alcohol Abuse Other*
Percent Admitted
Only Once During 7/13-6/14
768 441 137 14 78.4
* Includes family members receiving counseling.
All Licensed Facilities Inpatient Non-Hospital
Inpatient Hospital Partial Hospitalization Outpatient8
3
0 0 5
Note: Each licensed facility may provide more than one type of service.
State-Supported Facilities
Types of Service Provided
Number of
Clients Admitted
592
Admission by County of Residence (7/13-6/14)
Treatment Facilities (as of 6/14)
Correctional Institution 0
General Note: Crude rates based on less than 10 events are considered statistically unreliable and are not displayed (ND), unless otherwise noted.
Services Funding
Other
0
Non-Profit
3
For Profit
0
State
0
Other
0
Ambulatory Surgery Centers (7/13-6/14)
Employees
Part Time Employees 60
Full Time Employees 29
Contracted Employees 22
Payroll Employees 67 Staff with Clinical Privileges 56
Total Surgical Visits per Employee 127.1
Total Facilities 5 Total Surgical Visits 11,315
Percent of Surgical Visits, Age 65+ 36.4
Total Operating Rooms 8 Total Surgical Visits per Operating Room 1,414.4
Facilities Surgical Visits
Staff Licensed as M.D. 47
Total Employees per Operating Room 11.1
Average Semi-Private Daily Room Rate $1,191
Total Employees 89

PAGE 4Schuylkill County
Pennsylvania Health Care Workforce (2013-2014)
Notes: Only health care employees renewing their license in 2013-2014 were surveyed.The "Estimated Number" and "Percent of Workforce Intending to Remain in Profession for 6 or More Years" used to compute each "% Change from Previous Survey Year" are adjusted based on the response rates for the previous and current survey results. The survey results are available every two years. Numbers and percentages pertain to county of employment.Percentages based on less than six responses are considered statistically unreliable and are not displayed (ND).Registered Nurses and Licensed Practical Nurses are not comparable to previous survey period, so some data is not available (DNA).
Licensed Practical Nurses (2014) 594 DNA 80.0% DNA
Physicians (2014) 176
Dentists (2013) 59
Registered Nurses (2012/2013) 1,059 DNA 80.5% DNA
-7.1% 75.2% -0.7%
14.8% 74.5% -5.5%
Estimated Number
Percent Changefrom Previous
Survey
Difference in Percent from
Previous Survey
Percent of WorkforceIntending to Remain in
Profession for 6 or More Years
Injury Hospitalizations (2014)
Injury Hospitalizations and Median Charges by Age and Sex
Injury Hospitalizations and Median Charges by Type of Payor
Injury Hospitalizations and Median Charges by Mechanism/Intent and Sex
0-4 5-14 15-24 25-44 45-64 65 and Older
Male - Total
Male - Median Charges
Female - Total
Female - Median Charges
UnintentionalMotor Vehicle All Poisonings Unintentional Falls
Unintentional Fire/Flame or Hot Object/Substance All Firearm All Other Injuries
Male - Total
Male - Median Charges
Female - Total
Female - Median Charges
Medicare Medicaid Other Government Commercial / Private Blue Cross Uninsured
Total Hospitalizations
Median Charges
All Ages
855 13 26 85 154 241 336
$29,383.75 $17,635.00 $39,239.65 $17,363.00 $22,996.71 $34,209.38 $28,879.81
973 5 20 50 90 193 615
$25,839.25 ND $21,632.23 $10,160.33 $18,435.22 $29,232.91 $27,081.42
Note: Median charges not displayed (ND) for occurrences less than 10.
44987 167 20441020
$12,223.95 $26,799.70 $36,207.90 $26,137.15 $28,739.43 $23,303.18
247
324
62
87
104
92
549
329
9
15
2
8
$24,590.05
$29,144.59
$52,724.31
$65,208.45
$11,085.82
$11,200.52
$26,904.19
$29,185.32
ND
$21,986.98
ND
ND
Disclaimer: Injury data used in this report were provided to the Pennsylvania Department of Health by the Pennsylvania Health Care Cost Containment Council. The Pennsylvania Health Care Cost Containment Council specifically disclaims responsibility for any interpretations or conclusions. Contents may be republished or reproduced whole or in part, with attribution.

Snyder CountyHealth Profile 2016
Demographic Data (2014)
% Population Change 2010 to 2014 1.6
Median Age of the Population (2010-2014) 39.4
% Population Aged 65 and Over 16.6
Population per Square Mile 122.7
% Population with Income Below Poverty Level (2010-2014) 11.0
Per Capita Personal Income $36,084
% Labor Force Unemployed - Annual Average 5.2
% Population Eligible for Medical Assistance 14.5
Estimated Population by Age and Sex (2014)
Age Total Male Female Age Total Male Female
All Ages 40,323
Under 5 2,249
5-14 5,069
15-24 6,358
25-34 4,541
19,914
1,187
2,632
3,185
2,323
20,409
1,062
2,437
3,173
2,218
35-44 4,564
45-54 5,498
55-64 5,332
65-74 3,695
75+ 3,017
2,262
2,736
2,667
1,730
1,192
2,302
2,762
2,665
1,965
1,825
Natality and Reported Pregnancies^ (2014 Residents)
Crude Birth Rate11.5
Average Annual General61.0
% Low Birth Weight 7.6
% Prenatal Care in 1st Trimester 56.5
% Births to Mothers Under 18 3.0
6.6
57.5
2.7
ND
ND
ND
Per 1,000 Population
Fertility Rate* (2012-2014)
All Races White Black
All Ages 485
Under 15 2
15-17 12
462
2
12
6
0
0
17
0
0
Age of WomanReported
PregnanciesLive
BirthsFetal
DeathsInduced
Abortions
Outcome
Age of WomanReported
PregnanciesLive
BirthsFetal
DeathsInduced
Abortions
Outcome
18-19 26
20-29 278
30 and Over 167
24
266
158
0
3
3
2
9
6
All Ages* 60.1
Under 15** ND
15-17 17.1
63.0
ND
17.1
Age of Woman Birth Rate Reported Pregnancy Rate Age of Woman Birth Rate Reported Pregnancy Rate
18-19 27.7
20-29 96.2
30 and Over** 33.8
30.0
100.6
35.8
^Live births, fetal deaths of 16+ weeks gestation, and induced abortions performed in-state. Notes: All ages includes any unknown ages. All rates per 1,000.*All Ages includes female population ages 15-44. ** Under 15 includes female population ages 10-14; 30 and Over includes female population ages 30-49.
Hispanic
ND
ND
ND
(of any race)
ND
ND
ND
Asian / Pacific
General Notes: Crude and age-adjusted rates based on less than 10 events are considered statistically unreliable and are not displayed (ND), unless otherwise noted. Starting in 2013, race of resident was derived from multiple race selections. A person is Multi-Race if they identify as more than one race. Prior to 2013, race of resident was derived from a single race designation.
Morbidity (2012-2014 Residents)
Reported Incidence and Average Annual Rate (per 100,000) for Selected Notifiable Diseases (2012-2014)
HIV 1 ND
Syphilis 1 ND
Tuberculosis < 5 ND
Total Rate
Chlamydia 192 160.2
Giardiasis 11 9.2
Gonorrhea 16 13.3
Hepatitis: Type A 0 ND
Total Rate
Lyme Disease 87 72.6
Salmonellosis 25 20.9
Total Rate
Campylobacteriosis 10 8.3 Hep. B* Acute 0 ND
Shigellosis 0 ND
*Hepatitis: Type B **Meningococcal Disease
Meningococcal** 0 ND
Pertussis 11 9.2
Hep. B* Chronic 9 ND
Chickenpox < 5 ND
Islander
Note: Communicable diseases with demographic counts of 1 to 4 are displayed as "< 5" to avoid potential identification of cases within certain geographic areas.
Multi - Race
ND
ND
ND

Snyder County PAGE 2
Mortality (2014 Residents)
Selected Major Causes of Death, Number and Average Annual Age-Adjusted Death Rate* (2012-2014)
Number of Resident Deaths 341
Crude Death Rate per 1,000 8.5
Age-Adjusted Death Rate per 1,000 6.4
Number of Infant Deaths (< 1 Year of Age) 1 1 0 0
AllRaces BlackWhite
Hispanic(any race)
Infant Mortality Rate per 1,000 Live Births ND ND ND ND
Average Annual Infant Mortality Rate (2012-2014) ND ND ND ND
Cause Total Rate
Diseases of Heart 251
Cancer 254
Stroke 44
C.L.R.D.** 84
Accidents 52
161.2
166.5
27.9
54.0
37.4
Cause Total Rate
Influenza/Pneumonia 33
Diabetes Mellitus 36
Septicemia 15
Nephritis/Nephrosis 33
Alzheimer's Disease 24
21.0
23.4
9.5
19.9
14.5
* Per 100,000 2000 U.S. standardmillion population. Age-adjusted rates
** Chronic Lower Respiratory Disease
Selected Leading Causes of Death, Number by Age Group (2014)
Under 5 Years of Age 5-24 Years of Age 25-44 Years of Age 45-64 Years of Age 65 Years and Older
Diseases of Heart 17
Cancer 16
Cancer 62
Diseases of Heart 60
C.L.R.D.** 20
Accidents 14
TOTAL 1 TOTAL 2 TOTAL 3 TOTAL 67 TOTAL 268
Note: Total includes all other causes.
Asian/PI*
0
ND
*Asian/Pacific Islander ^ NA = Multi-Race data not available before 2013.
are only comparable if the samestandard million population was usedin the calculation.
Invasive Cancer Incidence and Average Annual Age-Adjusted Rates* for Major Sites by Sex
All Sites 348 514.5
Prostate 78 104.6
Lung and Bronchus 54 77.6
Colon and Rectum 29 43.9
Male FemaleTotal Rate Total Rate
Female Breast 95 124.8
331 435.1
27 32.5
25 32.1
*Per 100,000 2000 U.S. standard million population. Age-adjusted rates are only comparable if the same standard million population was used in the calculation.
- -
- -
Male FemaleTotal Rate Total Rate
Non-Hodgkin Lymphoma 20 32.4
Melanoma of the Skin 20 31.0
22 27.6
32 43.0
18 ND
Corpus and Uterus, NOS - -
Urinary Bladder 23
Kidney and Renal Pelvis 12 ND
36.5 6
7
ND
ND
Notes: All in situ cases, except for urinary bladder, are excluded. Age-adjusted rates based on less than 20 events are statistically unreliable and are not displayed (ND).
Cancer Incidence (2011-2013 Residents)
Adult Behavioral Health Risk Factors (2012-2014)[Includes: Centre, Columbia, Montour, Northumberland, Snyder, and Union Counties]
General Notes: Crude and age-adjusted rates based on less than 10 events are considered statistically unreliable and are not displayed (ND), unless otherwise noted. Starting in 2013, race of resident was derived from multiple race selections. A person is Multi-Race if they identify as more than one race. Prior to 2013, race of resident was derived from a single race designation.
Percent (CI)Risk Factors
Fair or poor general health:
Obese:
Overweight (includes obese):
No health insurance (ages 18-64):
Visited a doctor in the past 2 yearsfor a routine check-up:
Percent (CI)Risk Factors
Ever told they have diabetes: Currently has asthma:
Current smoker:
Ever tested for HIV (ages 18-64):
Needed to see a doctor but couldnot due to cost in the past year:
14
31
(12 - 16)
(28 - 34)
61 (58 - 64)
13 (11 - 16)
82 (80 - 85)
10 10(8 - 11) (9 - 12)
18 (16 - 20)
27 (24 - 31)
9 (7 - 11)
Notes: Data are based on 2012-2014 annual sample surveys of Pennsylvania adults. CI= 95% Confidence Interval.
Additional state or county/regional data are available at www.statistics.health.pa.gov.
^In situ, benign, and uncertain neoplasms
Multi- Race
0
ND
NAND ^

Snyder County PAGE 3
Hospitals (7/13-6/14)
Total General Acute Care
Psychiatric Rehabilitation
0 0 0 0
General Hospitals
Beds Set Up and Staffed -
Admissions -
Beds per 1,000 Population -
Admissions per 1,000 Population -
Average Inpatient Occupancy Rate -
Nursing Homes (2014)
Total Number Certified-Medicare Certified-Medicaid
Nursing Homes
Licensed/Approved Beds
1 1 1
159 159 159
23.7
Average Occupancy Rate 97.8
Average Length of Stay (Number of Days) 105.7
$262
Total Licensed/Approved Beds per 1,000 Population Age 65 and Older
Average Semi-Private Daily Room Rate
Drug and Alcohol Treatment
Admissions to Client Primary Diagnosis
Drug Abuse Alcohol Abuse Other*
Percent Admitted
Only Once During 7/13-6/14
79 43 18 0 75.4
* Includes family members receiving counseling.
All Licensed Facilities Inpatient Non-Hospital
Inpatient Hospital Partial Hospitalization Outpatient3
2
0 0 1
Note: Each licensed facility may provide more than one type of service.
State-Supported Facilities
Types of Service Provided
Number of
Clients Admitted
61
Admission by County of Residence (7/13-6/14)
Treatment Facilities (as of 6/14)
Correctional Institution 0
General Note: Crude rates based on less than 10 events are considered statistically unreliable and are not displayed (ND), unless otherwise noted.
Services Funding
Other
0
Non-Profit
0
For Profit
0
State
0
Other
0
Ambulatory Surgery Centers (7/13-6/14)
Employees
Part Time Employees -
Full Time Employees -
Contracted Employees -
Payroll Employees - Staff with Clinical Privileges -
Total Surgical Visits per Employee -
Total Facilities 0 Total Surgical Visits -
Percent of Surgical Visits, Age 65+ -
Total Operating Rooms - Total Surgical Visits per Operating Room -
Facilities Surgical Visits
Staff Licensed as M.D. -
Total Employees per Operating Room -
Average Semi-Private Daily Room Rate -
Total Employees -

PAGE 4Snyder County
Pennsylvania Health Care Workforce (2013-2014)
Notes: Only health care employees renewing their license in 2013-2014 were surveyed.The "Estimated Number" and "Percent of Workforce Intending to Remain in Profession for 6 or More Years" used to compute each "% Change from Previous Survey Year" are adjusted based on the response rates for the previous and current survey results. The survey results are available every two years. Numbers and percentages pertain to county of employment.Percentages based on less than six responses are considered statistically unreliable and are not displayed (ND).Registered Nurses and Licensed Practical Nurses are not comparable to previous survey period, so some data is not available (DNA).
Licensed Practical Nurses (2014) 168 DNA 83.5% DNA
Physicians (2014) 23
Dentists (2013) 14
Registered Nurses (2012/2013) 133 DNA 83.5% DNA
8.9% 52.6% -21.1%
-19.0% 66.7% -33.3%
Estimated Number
Percent Changefrom Previous
Survey
Difference in Percent from
Previous Survey
Percent of WorkforceIntending to Remain in
Profession for 6 or More Years
Injury Hospitalizations (2014)
Injury Hospitalizations and Median Charges by Age and Sex
Injury Hospitalizations and Median Charges by Type of Payor
Injury Hospitalizations and Median Charges by Mechanism/Intent and Sex
0-4 5-14 15-24 25-44 45-64 65 and Older
Male - Total
Male - Median Charges
Female - Total
Female - Median Charges
UnintentionalMotor Vehicle All Poisonings Unintentional Falls
Unintentional Fire/Flame or Hot Object/Substance All Firearm All Other Injuries
Male - Total
Male - Median Charges
Female - Total
Female - Median Charges
Medicare Medicaid Other Government Commercial / Private Blue Cross Uninsured
Total Hospitalizations
Median Charges
All Ages
120 1 2 11 13 37 56
$47,262.23 ND ND $31,824.85 $43,432.24 $58,064.26 $47,262.23
160 2 2 10 20 24 102
$35,570.52 ND ND $37,414.68 $39,416.23 $41,402.96 $33,849.89
Note: Median charges not displayed (ND) for occurrences less than 10.
5172 26 19553
ND $36,717.06 $25,709.84 $58,447.91 $45,039.89 ND
41
48
13
21
17
10
88
36
1
4
0
1
$39,466.72
$54,556.76
$41,400.70
$63,791.32
$21,684.65
$14,091.60
$35,020.20
$39,427.31
ND
ND
-
ND
Disclaimer: Injury data used in this report were provided to the Pennsylvania Department of Health by the Pennsylvania Health Care Cost Containment Council. The Pennsylvania Health Care Cost Containment Council specifically disclaims responsibility for any interpretations or conclusions. Contents may be republished or reproduced whole or in part, with attribution.

Somerset CountyHealth Profile 2016
Demographic Data (2014)
% Population Change 2010 to 2014 -2.0
Median Age of the Population (2010-2014) 44.9
% Population Aged 65 and Over 20.4
Population per Square Mile 70.9
% Population with Income Below Poverty Level (2010-2014) 12.7
Per Capita Personal Income $35,615
% Labor Force Unemployed - Annual Average 7.3
% Population Eligible for Medical Assistance 16.3
Estimated Population by Age and Sex (2014)
Age Total Male Female Age Total Male Female
All Ages 76,218
Under 5 3,391
5-14 7,938
15-24 8,321
25-34 8,610
39,554
1,672
4,005
4,583
5,012
36,664
1,719
3,933
3,738
3,598
35-44 9,375
45-54 11,204
55-64 11,858
65-74 8,171
75+ 7,350
5,205
6,001
6,127
4,048
2,901
4,170
5,203
5,731
4,123
4,449
Natality and Reported Pregnancies^ (2014 Residents)
Crude Birth Rate9.4
Average Annual General58.5
% Low Birth Weight 7.7
% Prenatal Care in 1st Trimester 75.4
% Births to Mothers Under 18 2.5
7.7
75.2
2.5
ND
ND
ND
Per 1,000 Population
Fertility Rate* (2012-2014)
All Races White Black
All Ages 761
Under 15 1
15-17 19
715
1
17
7
0
0
39
0
2
Age of WomanReported
PregnanciesLive
BirthsFetal
DeathsInduced
Abortions
Outcome
Age of WomanReported
PregnanciesLive
BirthsFetal
DeathsInduced
Abortions
Outcome
18-19 36
20-29 435
30 and Over 268
33
409
253
1
3
3
2
23
12
All Ages* 62.1
Under 15** ND
15-17 14.2
66.1
ND
15.9
Age of Woman Birth Rate Reported Pregnancy Rate Age of Woman Birth Rate Reported Pregnancy Rate
18-19 44.7
20-29 115.0
30 and Over** 30.1
48.8
122.3
31.9
^Live births, fetal deaths of 16+ weeks gestation, and induced abortions performed in-state. Notes: All ages includes any unknown ages. All rates per 1,000.*All Ages includes female population ages 15-44. ** Under 15 includes female population ages 10-14; 30 and Over includes female population ages 30-49.
Hispanic
ND
ND
ND
(of any race)
ND
ND
ND
Asian / Pacific
General Notes: Crude and age-adjusted rates based on less than 10 events are considered statistically unreliable and are not displayed (ND), unless otherwise noted. Starting in 2013, race of resident was derived from multiple race selections. A person is Multi-Race if they identify as more than one race. Prior to 2013, race of resident was derived from a single race designation.
Morbidity (2012-2014 Residents)
Reported Incidence and Average Annual Rate (per 100,000) for Selected Notifiable Diseases (2012-2014)
HIV 6 ND
Syphilis 3 ND
Tuberculosis 0 ND
Total Rate
Chlamydia 253 110.1
Giardiasis 19 8.3
Gonorrhea 18 7.8
Hepatitis: Type A < 5 ND
Total Rate
Lyme Disease 39 17.0
Salmonellosis 30 13.1
Total Rate
Campylobacteriosis 44 19.2 Hep. B* Acute 0 ND
Shigellosis < 5 ND
*Hepatitis: Type B **Meningococcal Disease
Meningococcal** 0 ND
Pertussis 39 17.0
Hep. B* Chronic 29 12.6
Chickenpox 23 10.0
Islander
Note: Communicable diseases with demographic counts of 1 to 4 are displayed as "< 5" to avoid potential identification of cases within certain geographic areas.
Multi - Race
ND
ND
ND
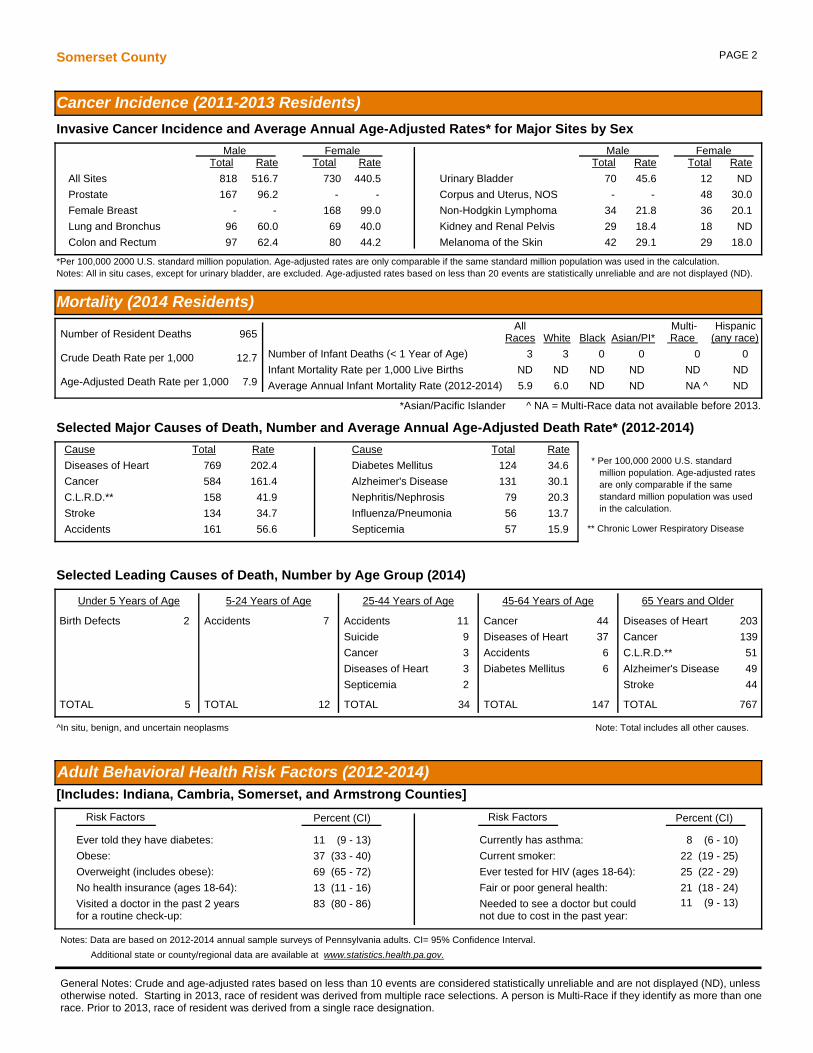
Somerset County PAGE 2
Mortality (2014 Residents)
Selected Major Causes of Death, Number and Average Annual Age-Adjusted Death Rate* (2012-2014)
Number of Resident Deaths 965
Crude Death Rate per 1,000 12.7
Age-Adjusted Death Rate per 1,000 7.9
Number of Infant Deaths (< 1 Year of Age) 3 3 0 0
AllRaces BlackWhite
Hispanic(any race)
Infant Mortality Rate per 1,000 Live Births ND ND ND ND
Average Annual Infant Mortality Rate (2012-2014) 5.9 6.0 ND ND
Cause Total Rate
Diseases of Heart 769
Cancer 584
Stroke 134
C.L.R.D.** 158
Accidents 161
202.4
161.4
34.7
41.9
56.6
Cause Total Rate
Influenza/Pneumonia 56
Diabetes Mellitus 124
Septicemia 57
Nephritis/Nephrosis 79
Alzheimer's Disease 131
13.7
34.6
15.9
20.3
30.1
* Per 100,000 2000 U.S. standardmillion population. Age-adjusted rates
** Chronic Lower Respiratory Disease
Selected Leading Causes of Death, Number by Age Group (2014)
Under 5 Years of Age 5-24 Years of Age 25-44 Years of Age 45-64 Years of Age 65 Years and Older
Birth Defects 2 Accidents 7 Accidents 11
Suicide 9
Cancer 3
Diseases of Heart 3
Septicemia 2
Cancer 44
Diseases of Heart 37
Accidents 6
Diabetes Mellitus 6
Diseases of Heart 203
Cancer 139
C.L.R.D.** 51
Alzheimer's Disease 49
Stroke 44
TOTAL 5 TOTAL 12 TOTAL 34 TOTAL 147 TOTAL 767
Note: Total includes all other causes.
Asian/PI*
0
ND
*Asian/Pacific Islander ^ NA = Multi-Race data not available before 2013.
are only comparable if the samestandard million population was usedin the calculation.
Invasive Cancer Incidence and Average Annual Age-Adjusted Rates* for Major Sites by Sex
All Sites 818 516.7
Prostate 167 96.2
Lung and Bronchus 96 60.0
Colon and Rectum 97 62.4
Male FemaleTotal Rate Total Rate
Female Breast 168 99.0
730 440.5
69 40.0
80 44.2
*Per 100,000 2000 U.S. standard million population. Age-adjusted rates are only comparable if the same standard million population was used in the calculation.
- -
- -
Male FemaleTotal Rate Total Rate
Non-Hodgkin Lymphoma 34 21.8
Melanoma of the Skin 42 29.1
36 20.1
48 30.0
29 18.0
Corpus and Uterus, NOS - -
Urinary Bladder 70
Kidney and Renal Pelvis 29 18.4
45.6 12
18
ND
ND
Notes: All in situ cases, except for urinary bladder, are excluded. Age-adjusted rates based on less than 20 events are statistically unreliable and are not displayed (ND).
Cancer Incidence (2011-2013 Residents)
Adult Behavioral Health Risk Factors (2012-2014)[Includes: Indiana, Cambria, Somerset, and Armstrong Counties]
General Notes: Crude and age-adjusted rates based on less than 10 events are considered statistically unreliable and are not displayed (ND), unless otherwise noted. Starting in 2013, race of resident was derived from multiple race selections. A person is Multi-Race if they identify as more than one race. Prior to 2013, race of resident was derived from a single race designation.
Percent (CI)Risk Factors
Fair or poor general health:
Obese:
Overweight (includes obese):
No health insurance (ages 18-64):
Visited a doctor in the past 2 yearsfor a routine check-up:
Percent (CI)Risk Factors
Ever told they have diabetes: Currently has asthma:
Current smoker:
Ever tested for HIV (ages 18-64):
Needed to see a doctor but couldnot due to cost in the past year:
21
37
(18 - 24)
(33 - 40)
69 (65 - 72)
13 (11 - 16)
83 (80 - 86)
11 8(9 - 13) (6 - 10)
22 (19 - 25)
25 (22 - 29)
11 (9 - 13)
Notes: Data are based on 2012-2014 annual sample surveys of Pennsylvania adults. CI= 95% Confidence Interval.
Additional state or county/regional data are available at www.statistics.health.pa.gov.
^In situ, benign, and uncertain neoplasms
Multi- Race
0
ND
NAND ^

Somerset County PAGE 3
Hospitals (7/13-6/14)
Total General Acute Care
Psychiatric Rehabilitation
3 3 0 0
General Hospitals
Beds Set Up and Staffed 177
Admissions 5,145
Beds per 1,000 Population 2.3
Admissions per 1,000 Population 67.5
Average Inpatient Occupancy Rate 35.5
Nursing Homes (2014)
Total Number Certified-Medicare Certified-Medicaid
Nursing Homes
Licensed/Approved Beds
6 6 6
663 663 663
42.7
Average Occupancy Rate 90.8
Average Length of Stay (Number of Days) 212.5
$211
Total Licensed/Approved Beds per 1,000 Population Age 65 and Older
Average Semi-Private Daily Room Rate
Drug and Alcohol Treatment
Admissions to Client Primary Diagnosis
Drug Abuse Alcohol Abuse Other*
Percent Admitted
Only Once During 7/13-6/14
768 254 173 35 64.1
* Includes family members receiving counseling.
All Licensed Facilities Inpatient Non-Hospital
Inpatient Hospital Partial Hospitalization Outpatient2
1
0 1 2
Note: Each licensed facility may provide more than one type of service.
State-Supported Facilities
Types of Service Provided
Number of
Clients Admitted
462
Admission by County of Residence (7/13-6/14)
Treatment Facilities (as of 6/14)
Correctional Institution 0
General Note: Crude rates based on less than 10 events are considered statistically unreliable and are not displayed (ND), unless otherwise noted.
Services Funding
Other
0
Non-Profit
3
For Profit
0
State
0
Other
0
Ambulatory Surgery Centers (7/13-6/14)
Employees
Part Time Employees -
Full Time Employees -
Contracted Employees -
Payroll Employees - Staff with Clinical Privileges -
Total Surgical Visits per Employee -
Total Facilities 0 Total Surgical Visits -
Percent of Surgical Visits, Age 65+ -
Total Operating Rooms - Total Surgical Visits per Operating Room -
Facilities Surgical Visits
Staff Licensed as M.D. -
Total Employees per Operating Room -
Average Semi-Private Daily Room Rate $842
Total Employees -
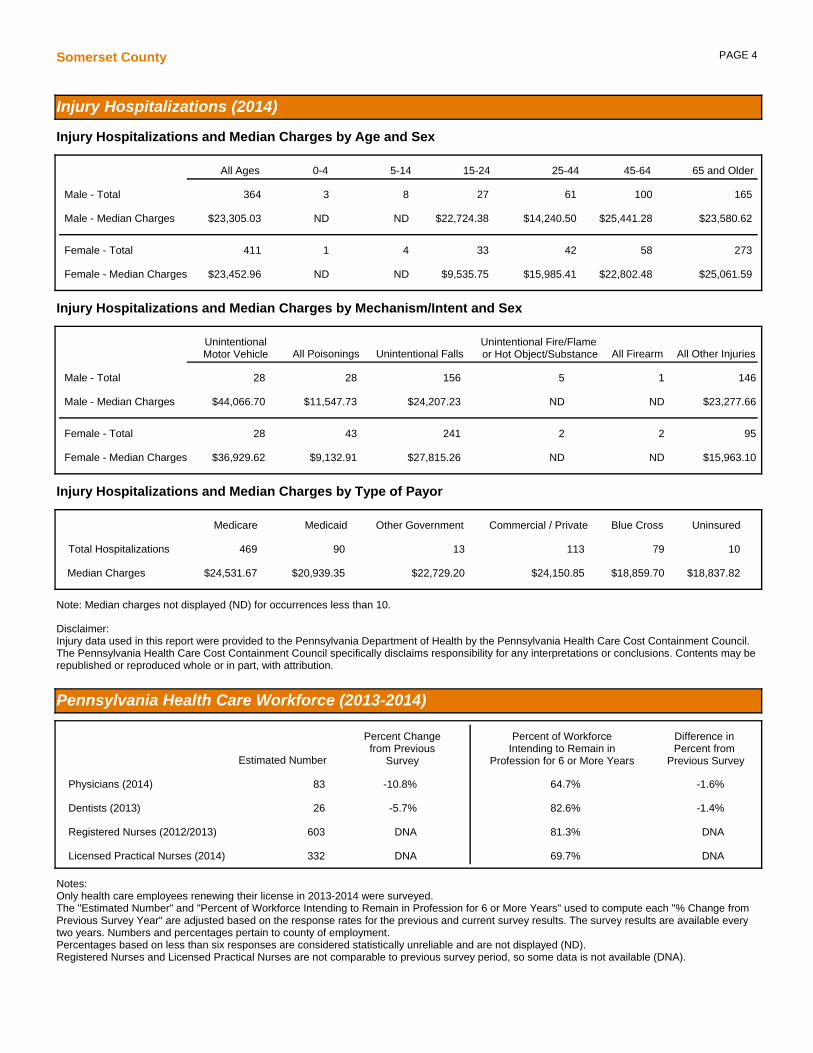
PAGE 4Somerset County
Pennsylvania Health Care Workforce (2013-2014)
Notes: Only health care employees renewing their license in 2013-2014 were surveyed.The "Estimated Number" and "Percent of Workforce Intending to Remain in Profession for 6 or More Years" used to compute each "% Change from Previous Survey Year" are adjusted based on the response rates for the previous and current survey results. The survey results are available every two years. Numbers and percentages pertain to county of employment.Percentages based on less than six responses are considered statistically unreliable and are not displayed (ND).Registered Nurses and Licensed Practical Nurses are not comparable to previous survey period, so some data is not available (DNA).
Licensed Practical Nurses (2014) 332 DNA 69.7% DNA
Physicians (2014) 83
Dentists (2013) 26
Registered Nurses (2012/2013) 603 DNA 81.3% DNA
-10.8% 64.7% -1.6%
-5.7% 82.6% -1.4%
Estimated Number
Percent Changefrom Previous
Survey
Difference in Percent from
Previous Survey
Percent of WorkforceIntending to Remain in
Profession for 6 or More Years
Injury Hospitalizations (2014)
Injury Hospitalizations and Median Charges by Age and Sex
Injury Hospitalizations and Median Charges by Type of Payor
Injury Hospitalizations and Median Charges by Mechanism/Intent and Sex
0-4 5-14 15-24 25-44 45-64 65 and Older
Male - Total
Male - Median Charges
Female - Total
Female - Median Charges
UnintentionalMotor Vehicle All Poisonings Unintentional Falls
Unintentional Fire/Flame or Hot Object/Substance All Firearm All Other Injuries
Male - Total
Male - Median Charges
Female - Total
Female - Median Charges
Medicare Medicaid Other Government Commercial / Private Blue Cross Uninsured
Total Hospitalizations
Median Charges
All Ages
364 3 8 27 61 100 165
$23,305.03 ND ND $22,724.38 $14,240.50 $25,441.28 $23,580.62
411 1 4 33 42 58 273
$23,452.96 ND ND $9,535.75 $15,985.41 $22,802.48 $25,061.59
Note: Median charges not displayed (ND) for occurrences less than 10.
10469 90 7911313
$18,837.82 $24,531.67 $20,939.35 $18,859.70 $24,150.85 $22,729.20
95
146
28
28
43
28
241
156
2
5
2
1
$15,963.10
$23,277.66
$36,929.62
$44,066.70
$9,132.91
$11,547.73
$27,815.26
$24,207.23
ND
ND
ND
ND
Disclaimer: Injury data used in this report were provided to the Pennsylvania Department of Health by the Pennsylvania Health Care Cost Containment Council. The Pennsylvania Health Care Cost Containment Council specifically disclaims responsibility for any interpretations or conclusions. Contents may be republished or reproduced whole or in part, with attribution.

Sullivan CountyHealth Profile 2016
Demographic Data (2014)
% Population Change 2010 to 2014 -1.4
Median Age of the Population (2010-2014) 51.4
% Population Aged 65 and Over 26.9
Population per Square Mile 14.1
% Population with Income Below Poverty Level (2010-2014) 14.8
Per Capita Personal Income $37,752
% Labor Force Unemployed - Annual Average 6.1
% Population Eligible for Medical Assistance 15.3
Estimated Population by Age and Sex (2014)
Age Total Male Female Age Total Male Female
All Ages 6,339
Under 5 218
5-14 373
15-24 802
25-34 558
3,317
117
190
511
297
3,022
101
183
291
261
35-44 599
45-54 917
55-64 1,165
65-74 945
75+ 762
326
457
626
455
338
273
460
539
490
424
Natality and Reported Pregnancies^ (2014 Residents)
Crude Birth Rate6.6
Average Annual General57.1
% Low Birth Weight ND
% Prenatal Care in 1st Trimester 82.9
% Births to Mothers Under 18 ND
ND
82.9
ND
ND
ND
ND
Per 1,000 Population
Fertility Rate* (2012-2014)
All Races White Black
All Ages 46
Under 15 0
15-17 1
42
0
1
0
0
0
4
0
0
Age of WomanReported
PregnanciesLive
BirthsFetal
DeathsInduced
Abortions
Outcome
Age of WomanReported
PregnanciesLive
BirthsFetal
DeathsInduced
Abortions
Outcome
18-19 0
20-29 30
30 and Over 14
0
29
11
0
0
0
0
1
3
All Ages* 50.9
Under 15** ND
15-17 ND
55.8
ND
ND
Age of Woman Birth Rate Reported Pregnancy Rate Age of Woman Birth Rate Reported Pregnancy Rate
18-19 ND
20-29 97.6
30 and Over** 19.2
ND
101.0
24.4
^Live births, fetal deaths of 16+ weeks gestation, and induced abortions performed in-state. Notes: All ages includes any unknown ages. All rates per 1,000.*All Ages includes female population ages 15-44. ** Under 15 includes female population ages 10-14; 30 and Over includes female population ages 30-49.
Hispanic
ND
ND
ND
(of any race)
ND
ND
ND
Asian / Pacific
General Notes: Crude and age-adjusted rates based on less than 10 events are considered statistically unreliable and are not displayed (ND), unless otherwise noted. Starting in 2013, race of resident was derived from multiple race selections. A person is Multi-Race if they identify as more than one race. Prior to 2013, race of resident was derived from a single race designation.
Morbidity (2012-2014 Residents)
Reported Incidence and Average Annual Rate (per 100,000) for Selected Notifiable Diseases (2012-2014)
HIV 1 ND
Syphilis 0 ND
Tuberculosis 0 ND
Total Rate
Chlamydia 111 579.6
Giardiasis < 5 ND
Gonorrhea 26 135.8
Hepatitis: Type A 0 ND
Total Rate
Lyme Disease 14 73.1
Salmonellosis < 5 ND
Total Rate
Campylobacteriosis 6 ND Hep. B* Acute 0 ND
Shigellosis 0 ND
*Hepatitis: Type B **Meningococcal Disease
Meningococcal** 0 ND
Pertussis < 5 ND
Hep. B* Chronic 0 ND
Chickenpox 0 ND
Islander
Note: Communicable diseases with demographic counts of 1 to 4 are displayed as "< 5" to avoid potential identification of cases within certain geographic areas.
Multi - Race
ND
ND
ND

Sullivan County PAGE 2
Mortality (2014 Residents)
Selected Major Causes of Death, Number and Average Annual Age-Adjusted Death Rate* (2012-2014)
Number of Resident Deaths 99
Crude Death Rate per 1,000 15.6
Age-Adjusted Death Rate per 1,000 8.4
Number of Infant Deaths (< 1 Year of Age) 0 0 0 0
AllRaces BlackWhite
Hispanic(any race)
Infant Mortality Rate per 1,000 Live Births ND ND ND ND
Average Annual Infant Mortality Rate (2012-2014) ND ND ND ND
Cause Total Rate
Diseases of Heart 60
Cancer 60
Stroke 12
C.L.R.D.** 19
Accidents 16
175.3
169.4
31.7
54.6
59.5
Cause Total Rate
Influenza/Pneumonia 5
Diabetes Mellitus 19
Septicemia 5
Nephritis/Nephrosis 6
Alzheimer's Disease 8
ND
55.9
ND
ND
ND
* Per 100,000 2000 U.S. standardmillion population. Age-adjusted rates
** Chronic Lower Respiratory Disease
Selected Leading Causes of Death, Number by Age Group (2014)
Under 5 Years of Age 5-24 Years of Age 25-44 Years of Age 45-64 Years of Age 65 Years and Older
Accidents 3
C.L.R.D.** 3
Cancer 3
Diseases of Heart 18
Cancer 15
Accidents 5
C.L.R.D.** 4
Diabetes Mellitus 4
TOTAL 0 TOTAL 1 TOTAL 1 TOTAL 18 TOTAL 79
Note: Total includes all other causes.
Asian/PI*
0
ND
*Asian/Pacific Islander ^ NA = Multi-Race data not available before 2013.
are only comparable if the samestandard million population was usedin the calculation.
Invasive Cancer Incidence and Average Annual Age-Adjusted Rates* for Major Sites by Sex
All Sites 96 574.4
Prostate 24 134.9
Lung and Bronchus 15 ND
Colon and Rectum 9 ND
Male FemaleTotal Rate Total Rate
Female Breast 30 172.2
101 603.8
14 ND
4 ND
*Per 100,000 2000 U.S. standard million population. Age-adjusted rates are only comparable if the same standard million population was used in the calculation.
- -
- -
Male FemaleTotal Rate Total Rate
Non-Hodgkin Lymphoma 8 ND
Melanoma of the Skin 4 ND
2 ND
10 ND
3 ND
Corpus and Uterus, NOS - -
Urinary Bladder 7
Kidney and Renal Pelvis 3 ND
ND 4
2
ND
ND
Notes: All in situ cases, except for urinary bladder, are excluded. Age-adjusted rates based on less than 20 events are statistically unreliable and are not displayed (ND).
Cancer Incidence (2011-2013 Residents)
Adult Behavioral Health Risk Factors (2012-2014)[Includes: Bradford, Sullivan, Tioga, Lycoming, Clinton, and Potter Counties]
General Notes: Crude and age-adjusted rates based on less than 10 events are considered statistically unreliable and are not displayed (ND), unless otherwise noted. Starting in 2013, race of resident was derived from multiple race selections. A person is Multi-Race if they identify as more than one race. Prior to 2013, race of resident was derived from a single race designation.
Percent (CI)Risk Factors
Fair or poor general health:
Obese:
Overweight (includes obese):
No health insurance (ages 18-64):
Visited a doctor in the past 2 yearsfor a routine check-up:
Percent (CI)Risk Factors
Ever told they have diabetes: Currently has asthma:
Current smoker:
Ever tested for HIV (ages 18-64):
Needed to see a doctor but couldnot due to cost in the past year:
18
32
(15 - 20)
(29 - 35)
67 (63 - 70)
13 (11 - 16)
85 (82 - 87)
10 10(9 - 12) (8 - 12)
22 (20 - 25)
34 (30 - 38)
9 (7 - 11)
Notes: Data are based on 2012-2014 annual sample surveys of Pennsylvania adults. CI= 95% Confidence Interval.
Additional state or county/regional data are available at www.statistics.health.pa.gov.
^In situ, benign, and uncertain neoplasms
Multi- Race
0
ND
NAND ^

Sullivan County PAGE 3
Hospitals (7/13-6/14)
Total General Acute Care
Psychiatric Rehabilitation
0 0 0 0
General Hospitals
Beds Set Up and Staffed -
Admissions -
Beds per 1,000 Population -
Admissions per 1,000 Population -
Average Inpatient Occupancy Rate -
Nursing Homes (2014)
Total Number Certified-Medicare Certified-Medicaid
Nursing Homes
Licensed/Approved Beds
2 2 2
187 187 187
109.5
Average Occupancy Rate 96.6
Average Length of Stay (Number of Days) 262.0
$277
Total Licensed/Approved Beds per 1,000 Population Age 65 and Older
Average Semi-Private Daily Room Rate
Drug and Alcohol Treatment
Admissions to Client Primary Diagnosis
Drug Abuse Alcohol Abuse Other*
Percent Admitted
Only Once During 7/13-6/14
6 2 1 1 50.0
* Includes family members receiving counseling.
All Licensed Facilities Inpatient Non-Hospital
Inpatient Hospital Partial Hospitalization Outpatient1
0
0 0 1
Note: Each licensed facility may provide more than one type of service.
State-Supported Facilities
Types of Service Provided
Number of
Clients Admitted
4
Admission by County of Residence (7/13-6/14)
Treatment Facilities (as of 6/14)
Correctional Institution 0
General Note: Crude rates based on less than 10 events are considered statistically unreliable and are not displayed (ND), unless otherwise noted.
Services Funding
Other
0
Non-Profit
0
For Profit
0
State
0
Other
0
Ambulatory Surgery Centers (7/13-6/14)
Employees
Part Time Employees -
Full Time Employees -
Contracted Employees -
Payroll Employees - Staff with Clinical Privileges -
Total Surgical Visits per Employee -
Total Facilities 0 Total Surgical Visits -
Percent of Surgical Visits, Age 65+ -
Total Operating Rooms - Total Surgical Visits per Operating Room -
Facilities Surgical Visits
Staff Licensed as M.D. -
Total Employees per Operating Room -
Average Semi-Private Daily Room Rate -
Total Employees -

PAGE 4Sullivan County
Pennsylvania Health Care Workforce (2013-2014)
Notes: Only health care employees renewing their license in 2013-2014 were surveyed.The "Estimated Number" and "Percent of Workforce Intending to Remain in Profession for 6 or More Years" used to compute each "% Change from Previous Survey Year" are adjusted based on the response rates for the previous and current survey results. The survey results are available every two years. Numbers and percentages pertain to county of employment.Percentages based on less than six responses are considered statistically unreliable and are not displayed (ND).Registered Nurses and Licensed Practical Nurses are not comparable to previous survey period, so some data is not available (DNA).
Licensed Practical Nurses (2014) 35 DNA 77.3% DNA
Physicians (2014) ND
Dentists (2013) ND
Registered Nurses (2012/2013) 37 DNA 73.5% DNA
ND ND ND
ND ND ND
Estimated Number
Percent Changefrom Previous
Survey
Difference in Percent from
Previous Survey
Percent of WorkforceIntending to Remain in
Profession for 6 or More Years
Injury Hospitalizations (2014)
Injury Hospitalizations and Median Charges by Age and Sex
Injury Hospitalizations and Median Charges by Type of Payor
Injury Hospitalizations and Median Charges by Mechanism/Intent and Sex
0-4 5-14 15-24 25-44 45-64 65 and Older
Male - Total
Male - Median Charges
Female - Total
Female - Median Charges
UnintentionalMotor Vehicle All Poisonings Unintentional Falls
Unintentional Fire/Flame or Hot Object/Substance All Firearm All Other Injuries
Male - Total
Male - Median Charges
Female - Total
Female - Median Charges
Medicare Medicaid Other Government Commercial / Private Blue Cross Uninsured
Total Hospitalizations
Median Charges
All Ages
49 0 2 5 4 14 24
$27,525.75 - ND ND ND $39,056.75 $18,583.23
52 1 0 2 2 18 29
$28,034.35 ND - ND ND $29,416.03 $24,656.25
Note: Median charges not displayed (ND) for occurrences less than 10.
367 12 6121
ND $23,686.75 $32,250.75 ND $116,649.50 ND
17
17
3
2
7
6
25
22
0
2
0
0
$24,090.50
$27,525.75
ND
ND
ND
ND
$32,806.25
$20,883.44
-
ND
-
-
Disclaimer: Injury data used in this report were provided to the Pennsylvania Department of Health by the Pennsylvania Health Care Cost Containment Council. The Pennsylvania Health Care Cost Containment Council specifically disclaims responsibility for any interpretations or conclusions. Contents may be republished or reproduced whole or in part, with attribution.

Susquehanna CountyHealth Profile 2016
Demographic Data (2014)
% Population Change 2010 to 2014 -3.3
Median Age of the Population (2010-2014) 45.9
% Population Aged 65 and Over 20.0
Population per Square Mile 50.9
% Population with Income Below Poverty Level (2010-2014) 12.7
Per Capita Personal Income $37,459
% Labor Force Unemployed - Annual Average 5.9
% Population Eligible for Medical Assistance 14.5
Estimated Population by Age and Sex (2014)
Age Total Male Female Age Total Male Female
All Ages 41,920
Under 5 2,032
5-14 4,634
15-24 4,754
25-34 4,169
21,131
1,057
2,358
2,522
2,144
20,789
975
2,276
2,232
2,025
35-44 4,467
45-54 6,508
55-64 6,964
65-74 4,912
75+ 3,480
2,275
3,297
3,533
2,424
1,521
2,192
3,211
3,431
2,488
1,959
Natality and Reported Pregnancies^ (2014 Residents)
Crude Birth Rate8.5
Average Annual General57.9
% Low Birth Weight 9.6
% Prenatal Care in 1st Trimester 66.6
% Births to Mothers Under 18 ND
9.8
66.9
ND
ND
ND
ND
Per 1,000 Population
Fertility Rate* (2012-2014)
All Races White Black
All Ages 364
Under 15 1
15-17 4
356
1
4
1
0
0
7
0
0
Age of WomanReported
PregnanciesLive
BirthsFetal
DeathsInduced
Abortions
Outcome
Age of WomanReported
PregnanciesLive
BirthsFetal
DeathsInduced
Abortions
Outcome
18-19 12
20-29 215
30 and Over 131
11
212
127
0
0
1
1
3
3
All Ages* 55.2
Under 15** ND
15-17 ND
56.4
ND
ND
Age of Woman Birth Rate Reported Pregnancy Rate Age of Woman Birth Rate Reported Pregnancy Rate
18-19 24.7
20-29 100.9
30 and Over** 27.3
27.0
102.3
28.1
^Live births, fetal deaths of 16+ weeks gestation, and induced abortions performed in-state. Notes: All ages includes any unknown ages. All rates per 1,000.*All Ages includes female population ages 15-44. ** Under 15 includes female population ages 10-14; 30 and Over includes female population ages 30-49.
Hispanic
ND
ND
ND
(of any race)
ND
ND
ND
Asian / Pacific
General Notes: Crude and age-adjusted rates based on less than 10 events are considered statistically unreliable and are not displayed (ND), unless otherwise noted. Starting in 2013, race of resident was derived from multiple race selections. A person is Multi-Race if they identify as more than one race. Prior to 2013, race of resident was derived from a single race designation.
Morbidity (2012-2014 Residents)
Reported Incidence and Average Annual Rate (per 100,000) for Selected Notifiable Diseases (2012-2014)
HIV 3 ND
Syphilis 1 ND
Tuberculosis 0 ND
Total Rate
Chlamydia 136 107.2
Giardiasis 8 ND
Gonorrhea 13 10.2
Hepatitis: Type A < 5 ND
Total Rate
Lyme Disease 128 100.9
Salmonellosis 10 7.9
Total Rate
Campylobacteriosis 15 11.8 Hep. B* Acute < 5 ND
Shigellosis 0 ND
*Hepatitis: Type B **Meningococcal Disease
Meningococcal** 0 ND
Pertussis 7 ND
Hep. B* Chronic 6 ND
Chickenpox 7 ND
Islander
Note: Communicable diseases with demographic counts of 1 to 4 are displayed as "< 5" to avoid potential identification of cases within certain geographic areas.
Multi - Race
ND
ND
ND

Susquehanna County PAGE 2
Mortality (2014 Residents)
Selected Major Causes of Death, Number and Average Annual Age-Adjusted Death Rate* (2012-2014)
Number of Resident Deaths 437
Crude Death Rate per 1,000 10.4
Age-Adjusted Death Rate per 1,000 7.4
Number of Infant Deaths (< 1 Year of Age) 2 2 0 0
AllRaces BlackWhite
Hispanic(any race)
Infant Mortality Rate per 1,000 Live Births ND ND ND ND
Average Annual Infant Mortality Rate (2012-2014) ND ND ND ND
Cause Total Rate
Diseases of Heart 344
Cancer 276
Stroke 51
C.L.R.D.** 84
Accidents 79
187.1
151.8
28.2
45.3
64.0
Cause Total Rate
Influenza/Pneumonia 19
Diabetes Mellitus 62
Septicemia 24
Nephritis/Nephrosis 28
Alzheimer's Disease 41
10.9
34.1
13.6
15.3
22.7
* Per 100,000 2000 U.S. standardmillion population. Age-adjusted rates
** Chronic Lower Respiratory Disease
Selected Leading Causes of Death, Number by Age Group (2014)
Under 5 Years of Age 5-24 Years of Age 25-44 Years of Age 45-64 Years of Age 65 Years and Older
Accidents 4 Accidents 7
Suicide 5
Diseases of Heart 3
Cancer 2
Diabetes Mellitus 2
Cancer 23
Diseases of Heart 17
Accidents 10
Diabetes Mellitus 5
Diseases of Heart 92
Cancer 66
C.L.R.D.** 30
Diabetes Mellitus 16
TOTAL 2 TOTAL 5 TOTAL 22 TOTAL 74 TOTAL 334
Note: Total includes all other causes.
Asian/PI*
0
ND
*Asian/Pacific Islander ^ NA = Multi-Race data not available before 2013.
are only comparable if the samestandard million population was usedin the calculation.
Invasive Cancer Incidence and Average Annual Age-Adjusted Rates* for Major Sites by Sex
All Sites 443 489.2
Prostate 115 112.4
Lung and Bronchus 70 75.4
Colon and Rectum 41 45.9
Male FemaleTotal Rate Total Rate
Female Breast 93 105.9
382 429.9
38 36.1
24 27.2
*Per 100,000 2000 U.S. standard million population. Age-adjusted rates are only comparable if the same standard million population was used in the calculation.
- -
- -
Male FemaleTotal Rate Total Rate
Non-Hodgkin Lymphoma 13 ND
Melanoma of the Skin 25 26.6
14 ND
35 39.0
18 ND
Corpus and Uterus, NOS - -
Urinary Bladder 35
Kidney and Renal Pelvis 16 ND
40.7 14
12
ND
ND
Notes: All in situ cases, except for urinary bladder, are excluded. Age-adjusted rates based on less than 20 events are statistically unreliable and are not displayed (ND).
Cancer Incidence (2011-2013 Residents)
Adult Behavioral Health Risk Factors (2012-2014)[Includes: Pike, Monroe, Susquehanna, and Wayne Counties]
General Notes: Crude and age-adjusted rates based on less than 10 events are considered statistically unreliable and are not displayed (ND), unless otherwise noted. Starting in 2013, race of resident was derived from multiple race selections. A person is Multi-Race if they identify as more than one race. Prior to 2013, race of resident was derived from a single race designation.
Percent (CI)Risk Factors
Fair or poor general health:
Obese:
Overweight (includes obese):
No health insurance (ages 18-64):
Visited a doctor in the past 2 yearsfor a routine check-up:
Percent (CI)Risk Factors
Ever told they have diabetes: Currently has asthma:
Current smoker:
Ever tested for HIV (ages 18-64):
Needed to see a doctor but couldnot due to cost in the past year:
21
31
(17 - 26)
(27 - 35)
68 (64 - 71)
18 (14 - 24)
82 (77 - 86)
9 13(7 - 11) (9 - 17)
25 (20 - 30)
33 (28 - 38)
14 (11 - 18)
Notes: Data are based on 2012-2014 annual sample surveys of Pennsylvania adults. CI= 95% Confidence Interval.
Additional state or county/regional data are available at www.statistics.health.pa.gov.
^In situ, benign, and uncertain neoplasms
Multi- Race
0
ND
NAND ^

Susquehanna County PAGE 3
Hospitals (7/13-6/14)
Total General Acute Care
Psychiatric Rehabilitation
2 2 0 0
General Hospitals
Beds Set Up and Staffed 46
Admissions 1,696
Beds per 1,000 Population 1.1
Admissions per 1,000 Population 40.5
Average Inpatient Occupancy Rate 42.5
Nursing Homes (2014)
Total Number Certified-Medicare Certified-Medicaid
Nursing Homes
Licensed/Approved Beds
3 3 3
253 253 253
30.1
Average Occupancy Rate 87.2
Average Length of Stay (Number of Days) 173.8
$241
Total Licensed/Approved Beds per 1,000 Population Age 65 and Older
Average Semi-Private Daily Room Rate
Drug and Alcohol Treatment
Admissions to Client Primary Diagnosis
Drug Abuse Alcohol Abuse Other*
Percent Admitted
Only Once During 7/13-6/14
125 58 25 2 68.2
* Includes family members receiving counseling.
All Licensed Facilities Inpatient Non-Hospital
Inpatient Hospital Partial Hospitalization Outpatient3
0
0 0 3
Note: Each licensed facility may provide more than one type of service.
State-Supported Facilities
Types of Service Provided
Number of
Clients Admitted
85
Admission by County of Residence (7/13-6/14)
Treatment Facilities (as of 6/14)
Correctional Institution 0
General Note: Crude rates based on less than 10 events are considered statistically unreliable and are not displayed (ND), unless otherwise noted.
Services Funding
Other
0
Non-Profit
2
For Profit
0
State
0
Other
0
Ambulatory Surgery Centers (7/13-6/14)
Employees
Part Time Employees -
Full Time Employees -
Contracted Employees -
Payroll Employees - Staff with Clinical Privileges -
Total Surgical Visits per Employee -
Total Facilities 0 Total Surgical Visits -
Percent of Surgical Visits, Age 65+ -
Total Operating Rooms - Total Surgical Visits per Operating Room -
Facilities Surgical Visits
Staff Licensed as M.D. -
Total Employees per Operating Room -
Average Semi-Private Daily Room Rate $695
Total Employees -

PAGE 4Susquehanna County
Pennsylvania Health Care Workforce (2013-2014)
Notes: Only health care employees renewing their license in 2013-2014 were surveyed.The "Estimated Number" and "Percent of Workforce Intending to Remain in Profession for 6 or More Years" used to compute each "% Change from Previous Survey Year" are adjusted based on the response rates for the previous and current survey results. The survey results are available every two years. Numbers and percentages pertain to county of employment.Percentages based on less than six responses are considered statistically unreliable and are not displayed (ND).Registered Nurses and Licensed Practical Nurses are not comparable to previous survey period, so some data is not available (DNA).
Licensed Practical Nurses (2014) 69 DNA 83.9% DNA
Physicians (2014) 24
Dentists (2013) 10
Registered Nurses (2012/2013) 186 DNA 74.1% DNA
-16.2% 75.0% 1.9%
3.3% 88.9% 0.0%
Estimated Number
Percent Changefrom Previous
Survey
Difference in Percent from
Previous Survey
Percent of WorkforceIntending to Remain in
Profession for 6 or More Years
Injury Hospitalizations (2014)
Injury Hospitalizations and Median Charges by Age and Sex
Injury Hospitalizations and Median Charges by Type of Payor
Injury Hospitalizations and Median Charges by Mechanism/Intent and Sex
0-4 5-14 15-24 25-44 45-64 65 and Older
Male - Total
Male - Median Charges
Female - Total
Female - Median Charges
UnintentionalMotor Vehicle All Poisonings Unintentional Falls
Unintentional Fire/Flame or Hot Object/Substance All Firearm All Other Injuries
Male - Total
Male - Median Charges
Female - Total
Female - Median Charges
Medicare Medicaid Other Government Commercial / Private Blue Cross Uninsured
Total Hospitalizations
Median Charges
All Ages
159 1 5 9 26 47 71
$20,014.35 ND ND ND $21,853.10 $30,538.50 $17,814.00
161 1 3 5 14 30 108
$19,612.90 ND ND ND $28,235.90 $18,469.12 $18,451.01
Note: Median charges not displayed (ND) for occurrences less than 10.
11200 43 27461
$10,208.02 $18,319.90 $17,421.89 $44,747.80 $41,455.47 ND
32
56
17
16
11
17
100
65
1
4
0
1
$28,850.06
$27,364.26
$48,298.29
$62,445.07
$13,165.50
$9,962.40
$13,489.63
$16,063.05
ND
ND
-
ND
Disclaimer: Injury data used in this report were provided to the Pennsylvania Department of Health by the Pennsylvania Health Care Cost Containment Council. The Pennsylvania Health Care Cost Containment Council specifically disclaims responsibility for any interpretations or conclusions. Contents may be republished or reproduced whole or in part, with attribution.

Tioga CountyHealth Profile 2016
Demographic Data (2014)
% Population Change 2010 to 2014 0.7
Median Age of the Population (2010-2014) 42.7
% Population Aged 65 and Over 19.6
Population per Square Mile 37.3
% Population with Income Below Poverty Level (2010-2014) 15.2
Per Capita Personal Income $34,360
% Labor Force Unemployed - Annual Average 6.9
% Population Eligible for Medical Assistance 16.6
Estimated Population by Age and Sex (2014)
Age Total Male Female Age Total Male Female
All Ages 42,274
Under 5 2,437
5-14 4,583
15-24 5,895
25-34 4,720
20,926
1,292
2,327
2,831
2,410
21,348
1,145
2,256
3,064
2,310
35-44 4,450
45-54 5,750
55-64 6,149
65-74 4,694
75+ 3,596
2,249
2,838
3,067
2,317
1,595
2,201
2,912
3,082
2,377
2,001
Natality and Reported Pregnancies^ (2014 Residents)
Crude Birth Rate11.1
Average Annual General58.7
% Low Birth Weight 5.1
% Prenatal Care in 1st Trimester 78.1
% Births to Mothers Under 18 ND
5.1
78.5
ND
ND
ND
ND
Per 1,000 Population
Fertility Rate* (2012-2014)
All Races White Black
All Ages 471
Under 15 0
15-17 4
468
0
4
1
0
0
2
0
0
Age of WomanReported
PregnanciesLive
BirthsFetal
DeathsInduced
Abortions
Outcome
Age of WomanReported
PregnanciesLive
BirthsFetal
DeathsInduced
Abortions
Outcome
18-19 26
20-29 300
30 and Over 140
26
299
138
0
0
1
0
1
1
All Ages* 61.8
Under 15** ND
15-17 ND
62.2
ND
ND
Age of Woman Birth Rate Reported Pregnancy Rate Age of Woman Birth Rate Reported Pregnancy Rate
18-19 32.3
20-29 110.1
30 and Over** 29.7
32.3
110.5
30.1
^Live births, fetal deaths of 16+ weeks gestation, and induced abortions performed in-state. Notes: All ages includes any unknown ages. All rates per 1,000.*All Ages includes female population ages 15-44. ** Under 15 includes female population ages 10-14; 30 and Over includes female population ages 30-49.
Hispanic
ND
ND
ND
(of any race)
ND
ND
ND
Asian / Pacific
General Notes: Crude and age-adjusted rates based on less than 10 events are considered statistically unreliable and are not displayed (ND), unless otherwise noted. Starting in 2013, race of resident was derived from multiple race selections. A person is Multi-Race if they identify as more than one race. Prior to 2013, race of resident was derived from a single race designation.
Morbidity (2012-2014 Residents)
Reported Incidence and Average Annual Rate (per 100,000) for Selected Notifiable Diseases (2012-2014)
HIV 0 ND
Syphilis 0 ND
Tuberculosis < 5 ND
Total Rate
Chlamydia 268 210.5
Giardiasis 25 19.6
Gonorrhea 13 10.2
Hepatitis: Type A 0 ND
Total Rate
Lyme Disease 45 35.3
Salmonellosis 25 19.6
Total Rate
Campylobacteriosis 40 31.4 Hep. B* Acute 0 ND
Shigellosis 0 ND
*Hepatitis: Type B **Meningococcal Disease
Meningococcal** 0 ND
Pertussis 0 ND
Hep. B* Chronic < 5 ND
Chickenpox 18 14.1
Islander
Note: Communicable diseases with demographic counts of 1 to 4 are displayed as "< 5" to avoid potential identification of cases within certain geographic areas.
Multi - Race
ND
ND
ND
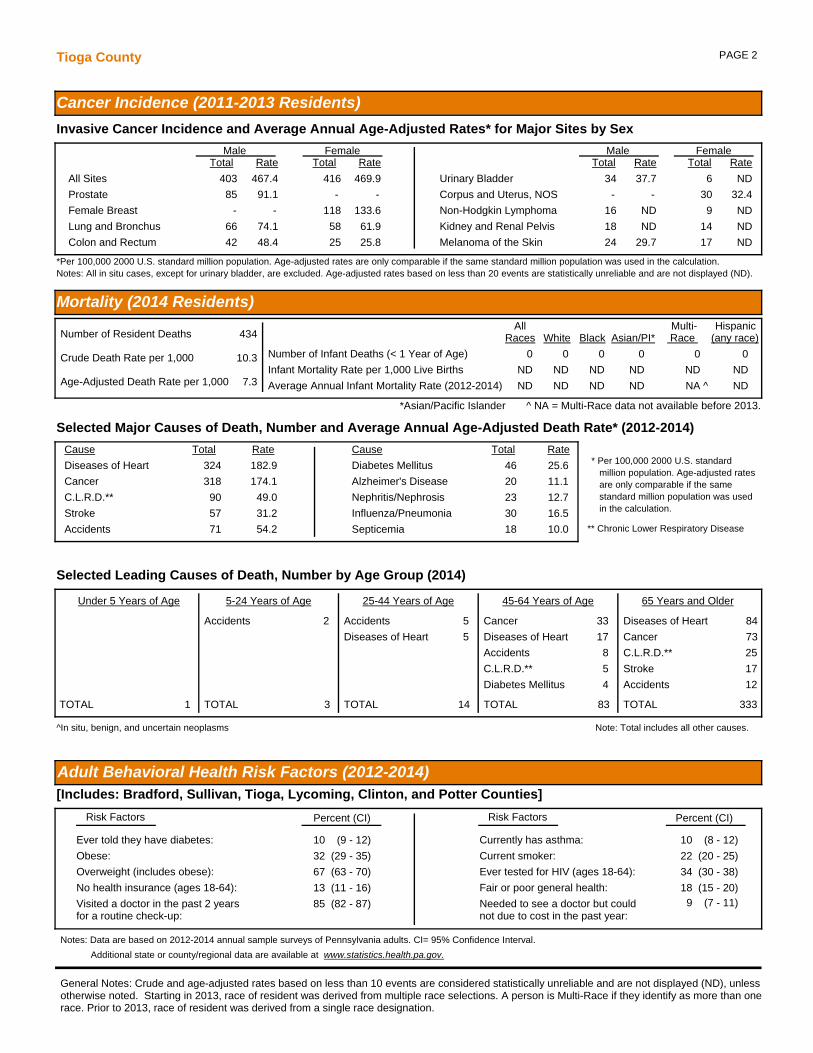
Tioga County PAGE 2
Mortality (2014 Residents)
Selected Major Causes of Death, Number and Average Annual Age-Adjusted Death Rate* (2012-2014)
Number of Resident Deaths 434
Crude Death Rate per 1,000 10.3
Age-Adjusted Death Rate per 1,000 7.3
Number of Infant Deaths (< 1 Year of Age) 0 0 0 0
AllRaces BlackWhite
Hispanic(any race)
Infant Mortality Rate per 1,000 Live Births ND ND ND ND
Average Annual Infant Mortality Rate (2012-2014) ND ND ND ND
Cause Total Rate
Diseases of Heart 324
Cancer 318
Stroke 57
C.L.R.D.** 90
Accidents 71
182.9
174.1
31.2
49.0
54.2
Cause Total Rate
Influenza/Pneumonia 30
Diabetes Mellitus 46
Septicemia 18
Nephritis/Nephrosis 23
Alzheimer's Disease 20
16.5
25.6
10.0
12.7
11.1
* Per 100,000 2000 U.S. standardmillion population. Age-adjusted rates
** Chronic Lower Respiratory Disease
Selected Leading Causes of Death, Number by Age Group (2014)
Under 5 Years of Age 5-24 Years of Age 25-44 Years of Age 45-64 Years of Age 65 Years and Older
Accidents 2 Accidents 5
Diseases of Heart 5
Cancer 33
Diseases of Heart 17
Accidents 8
C.L.R.D.** 5
Diabetes Mellitus 4
Diseases of Heart 84
Cancer 73
C.L.R.D.** 25
Stroke 17
Accidents 12
TOTAL 1 TOTAL 3 TOTAL 14 TOTAL 83 TOTAL 333
Note: Total includes all other causes.
Asian/PI*
0
ND
*Asian/Pacific Islander ^ NA = Multi-Race data not available before 2013.
are only comparable if the samestandard million population was usedin the calculation.
Invasive Cancer Incidence and Average Annual Age-Adjusted Rates* for Major Sites by Sex
All Sites 403 467.4
Prostate 85 91.1
Lung and Bronchus 66 74.1
Colon and Rectum 42 48.4
Male FemaleTotal Rate Total Rate
Female Breast 118 133.6
416 469.9
58 61.9
25 25.8
*Per 100,000 2000 U.S. standard million population. Age-adjusted rates are only comparable if the same standard million population was used in the calculation.
- -
- -
Male FemaleTotal Rate Total Rate
Non-Hodgkin Lymphoma 16 ND
Melanoma of the Skin 24 29.7
9 ND
30 32.4
17 ND
Corpus and Uterus, NOS - -
Urinary Bladder 34
Kidney and Renal Pelvis 18 ND
37.7 6
14
ND
ND
Notes: All in situ cases, except for urinary bladder, are excluded. Age-adjusted rates based on less than 20 events are statistically unreliable and are not displayed (ND).
Cancer Incidence (2011-2013 Residents)
Adult Behavioral Health Risk Factors (2012-2014)[Includes: Bradford, Sullivan, Tioga, Lycoming, Clinton, and Potter Counties]
General Notes: Crude and age-adjusted rates based on less than 10 events are considered statistically unreliable and are not displayed (ND), unless otherwise noted. Starting in 2013, race of resident was derived from multiple race selections. A person is Multi-Race if they identify as more than one race. Prior to 2013, race of resident was derived from a single race designation.
Percent (CI)Risk Factors
Fair or poor general health:
Obese:
Overweight (includes obese):
No health insurance (ages 18-64):
Visited a doctor in the past 2 yearsfor a routine check-up:
Percent (CI)Risk Factors
Ever told they have diabetes: Currently has asthma:
Current smoker:
Ever tested for HIV (ages 18-64):
Needed to see a doctor but couldnot due to cost in the past year:
18
32
(15 - 20)
(29 - 35)
67 (63 - 70)
13 (11 - 16)
85 (82 - 87)
10 10(9 - 12) (8 - 12)
22 (20 - 25)
34 (30 - 38)
9 (7 - 11)
Notes: Data are based on 2012-2014 annual sample surveys of Pennsylvania adults. CI= 95% Confidence Interval.
Additional state or county/regional data are available at www.statistics.health.pa.gov.
^In situ, benign, and uncertain neoplasms
Multi- Race
0
ND
NAND ^
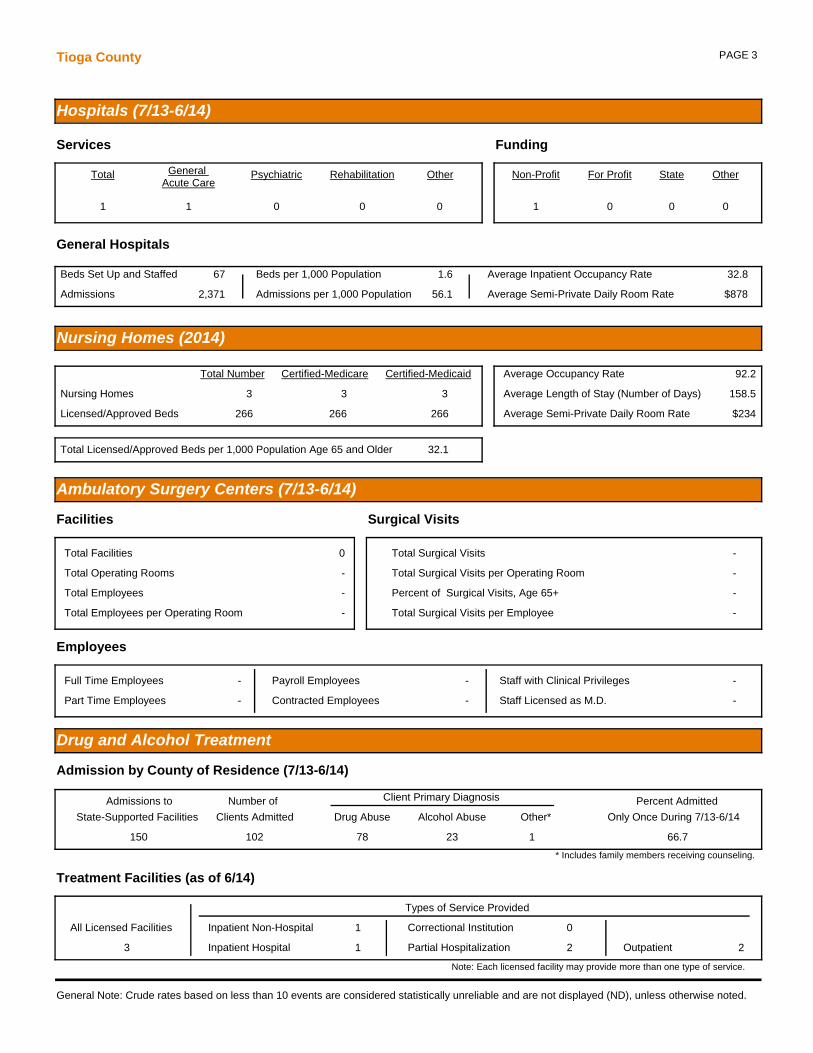
Tioga County PAGE 3
Hospitals (7/13-6/14)
Total General Acute Care
Psychiatric Rehabilitation
1 1 0 0
General Hospitals
Beds Set Up and Staffed 67
Admissions 2,371
Beds per 1,000 Population 1.6
Admissions per 1,000 Population 56.1
Average Inpatient Occupancy Rate 32.8
Nursing Homes (2014)
Total Number Certified-Medicare Certified-Medicaid
Nursing Homes
Licensed/Approved Beds
3 3 3
266 266 266
32.1
Average Occupancy Rate 92.2
Average Length of Stay (Number of Days) 158.5
$234
Total Licensed/Approved Beds per 1,000 Population Age 65 and Older
Average Semi-Private Daily Room Rate
Drug and Alcohol Treatment
Admissions to Client Primary Diagnosis
Drug Abuse Alcohol Abuse Other*
Percent Admitted
Only Once During 7/13-6/14
150 78 23 1 66.7
* Includes family members receiving counseling.
All Licensed Facilities Inpatient Non-Hospital
Inpatient Hospital Partial Hospitalization Outpatient3
1
1 2 2
Note: Each licensed facility may provide more than one type of service.
State-Supported Facilities
Types of Service Provided
Number of
Clients Admitted
102
Admission by County of Residence (7/13-6/14)
Treatment Facilities (as of 6/14)
Correctional Institution 0
General Note: Crude rates based on less than 10 events are considered statistically unreliable and are not displayed (ND), unless otherwise noted.
Services Funding
Other
0
Non-Profit
1
For Profit
0
State
0
Other
0
Ambulatory Surgery Centers (7/13-6/14)
Employees
Part Time Employees -
Full Time Employees -
Contracted Employees -
Payroll Employees - Staff with Clinical Privileges -
Total Surgical Visits per Employee -
Total Facilities 0 Total Surgical Visits -
Percent of Surgical Visits, Age 65+ -
Total Operating Rooms - Total Surgical Visits per Operating Room -
Facilities Surgical Visits
Staff Licensed as M.D. -
Total Employees per Operating Room -
Average Semi-Private Daily Room Rate $878
Total Employees -

PAGE 4Tioga County
Pennsylvania Health Care Workforce (2013-2014)
Notes: Only health care employees renewing their license in 2013-2014 were surveyed.The "Estimated Number" and "Percent of Workforce Intending to Remain in Profession for 6 or More Years" used to compute each "% Change from Previous Survey Year" are adjusted based on the response rates for the previous and current survey results. The survey results are available every two years. Numbers and percentages pertain to county of employment.Percentages based on less than six responses are considered statistically unreliable and are not displayed (ND).Registered Nurses and Licensed Practical Nurses are not comparable to previous survey period, so some data is not available (DNA).
Licensed Practical Nurses (2014) 156 DNA 84.6% DNA
Physicians (2014) 45
Dentists (2013) 21
Registered Nurses (2012/2013) 231 DNA 77.3% DNA
-6.3% 56.8% 3.3%
3.3% 61.1% -11.1%
Estimated Number
Percent Changefrom Previous
Survey
Difference in Percent from
Previous Survey
Percent of WorkforceIntending to Remain in
Profession for 6 or More Years
Injury Hospitalizations (2014)
Injury Hospitalizations and Median Charges by Age and Sex
Injury Hospitalizations and Median Charges by Type of Payor
Injury Hospitalizations and Median Charges by Mechanism/Intent and Sex
0-4 5-14 15-24 25-44 45-64 65 and Older
Male - Total
Male - Median Charges
Female - Total
Female - Median Charges
UnintentionalMotor Vehicle All Poisonings Unintentional Falls
Unintentional Fire/Flame or Hot Object/Substance All Firearm All Other Injuries
Male - Total
Male - Median Charges
Female - Total
Female - Median Charges
Medicare Medicaid Other Government Commercial / Private Blue Cross Uninsured
Total Hospitalizations
Median Charges
All Ages
167 3 3 14 27 51 69
$32,580.00 ND ND $59,693.85 $29,222.00 $29,104.25 $28,298.25
174 1 1 23 11 34 104
$24,505.08 ND ND $43,584.57 $29,008.27 $33,922.38 $21,418.44
Note: Median charges not displayed (ND) for occurrences less than 10.
16184 30 38692
$19,824.23 $24,440.55 $22,589.33 $45,897.38 $37,007.47 ND
47
59
13
20
19
11
94
71
1
6
0
0
$31,337.93
$21,129.50
$70,030.62
$69,372.88
$13,953.25
$19,599.75
$23,330.78
$36,685.82
ND
ND
-
-
Disclaimer: Injury data used in this report were provided to the Pennsylvania Department of Health by the Pennsylvania Health Care Cost Containment Council. The Pennsylvania Health Care Cost Containment Council specifically disclaims responsibility for any interpretations or conclusions. Contents may be republished or reproduced whole or in part, with attribution.

Union CountyHealth Profile 2016
Demographic Data (2014)
% Population Change 2010 to 2014 -0.2
Median Age of the Population (2010-2014) 38.5
% Population Aged 65 and Over 16.1
Population per Square Mile 142.0
% Population with Income Below Poverty Level (2010-2014) 11.8
Per Capita Personal Income $34,666
% Labor Force Unemployed - Annual Average 5.0
% Population Eligible for Medical Assistance 10.8
Estimated Population by Age and Sex (2014)
Age Total Male Female Age Total Male Female
All Ages 44,874
Under 5 1,989
5-14 4,695
15-24 7,348
25-34 6,191
24,681
1,020
2,399
3,924
3,984
20,193
969
2,296
3,424
2,207
35-44 6,048
45-54 6,041
55-64 5,345
65-74 3,777
75+ 3,440
3,904
3,495
2,789
1,815
1,351
2,144
2,546
2,556
1,962
2,089
Natality and Reported Pregnancies^ (2014 Residents)
Crude Birth Rate9.1
Average Annual General52.4
% Low Birth Weight 3.4
% Prenatal Care in 1st Trimester 63.0
% Births to Mothers Under 18 ND
3.5
62.8
ND
ND
ND
ND
Per 1,000 Population
Fertility Rate* (2012-2014)
All Races White Black
All Ages 446
Under 15 0
15-17 4
408
0
3
4
0
0
34
0
1
Age of WomanReported
PregnanciesLive
BirthsFetal
DeathsInduced
Abortions
Outcome
Age of WomanReported
PregnanciesLive
BirthsFetal
DeathsInduced
Abortions
Outcome
18-19 15
20-29 260
30 and Over 166
14
231
159
0
4
0
1
25
7
All Ages* 52.5
Under 15** ND
15-17 ND
57.4
ND
ND
Age of Woman Birth Rate Reported Pregnancy Rate Age of Woman Birth Rate Reported Pregnancy Rate
18-19 13.6
20-29 81.7
30 and Over** 36.0
14.6
91.9
37.6
^Live births, fetal deaths of 16+ weeks gestation, and induced abortions performed in-state. Notes: All ages includes any unknown ages. All rates per 1,000.*All Ages includes female population ages 15-44. ** Under 15 includes female population ages 10-14; 30 and Over includes female population ages 30-49.
Hispanic
ND
ND
ND
(of any race)
ND
90.9
ND
Asian / Pacific
General Notes: Crude and age-adjusted rates based on less than 10 events are considered statistically unreliable and are not displayed (ND), unless otherwise noted. Starting in 2013, race of resident was derived from multiple race selections. A person is Multi-Race if they identify as more than one race. Prior to 2013, race of resident was derived from a single race designation.
Morbidity (2012-2014 Residents)
Reported Incidence and Average Annual Rate (per 100,000) for Selected Notifiable Diseases (2012-2014)
HIV 9 ND
Syphilis 1 ND
Tuberculosis < 5 ND
Total Rate
Chlamydia 183 135.9
Giardiasis < 5 ND
Gonorrhea 18 13.4
Hepatitis: Type A 0 ND
Total Rate
Lyme Disease 90 66.8
Salmonellosis 20 14.8
Total Rate
Campylobacteriosis 12 8.9 Hep. B* Acute < 5 ND
Shigellosis < 5 ND
*Hepatitis: Type B **Meningococcal Disease
Meningococcal** 0 ND
Pertussis < 5 ND
Hep. B* Chronic 56 41.6
Chickenpox 16 11.9
Islander
Note: Communicable diseases with demographic counts of 1 to 4 are displayed as "< 5" to avoid potential identification of cases within certain geographic areas.
Multi - Race
ND
ND
ND

Union County PAGE 2
Mortality (2014 Residents)
Selected Major Causes of Death, Number and Average Annual Age-Adjusted Death Rate* (2012-2014)
Number of Resident Deaths 365
Crude Death Rate per 1,000 8.1
Age-Adjusted Death Rate per 1,000 6.0
Number of Infant Deaths (< 1 Year of Age) 3 3 0 0
AllRaces BlackWhite
Hispanic(any race)
Infant Mortality Rate per 1,000 Live Births ND ND ND ND
Average Annual Infant Mortality Rate (2012-2014) ND ND ND ND
Cause Total Rate
Diseases of Heart 259
Cancer 251
Stroke 71
C.L.R.D.** 47
Accidents 53
140.3
146.6
36.0
25.1
32.7
Cause Total Rate
Influenza/Pneumonia 25
Diabetes Mellitus 30
Septicemia 10
Nephritis/Nephrosis 18
Alzheimer's Disease 35
13.3
16.9
5.5
9.7
17.2
* Per 100,000 2000 U.S. standardmillion population. Age-adjusted rates
** Chronic Lower Respiratory Disease
Selected Leading Causes of Death, Number by Age Group (2014)
Under 5 Years of Age 5-24 Years of Age 25-44 Years of Age 45-64 Years of Age 65 Years and Older
Perinatal Conditions 2 Accidents 4 Accidents 3
Cancer 3
Diseases of Heart 2
Cancer 14
Diseases of Heart 10
Accidents 3
C.L.R.D.** 2
Liver Dis./Cirrhosis 2
Diseases of Heart 73
Cancer 70
Stroke 22
Accidents 16
C.L.R.D.** 13
TOTAL 3 TOTAL 6 TOTAL 12 TOTAL 43 TOTAL 301
Note: Total includes all other causes.
Asian/PI*
0
ND
*Asian/Pacific Islander ^ NA = Multi-Race data not available before 2013.
are only comparable if the samestandard million population was usedin the calculation.
Invasive Cancer Incidence and Average Annual Age-Adjusted Rates* for Major Sites by Sex
All Sites 339 447.0
Prostate 75 93.9
Lung and Bronchus 41 57.7
Colon and Rectum 32 41.1
Male FemaleTotal Rate Total Rate
Female Breast 86 109.3
314 398.6
41 49.3
26 29.7
*Per 100,000 2000 U.S. standard million population. Age-adjusted rates are only comparable if the same standard million population was used in the calculation.
- -
- -
Male FemaleTotal Rate Total Rate
Non-Hodgkin Lymphoma 31 44.1
Melanoma of the Skin 18 ND
14 ND
25 32.4
16 ND
Corpus and Uterus, NOS - -
Urinary Bladder 21
Kidney and Renal Pelvis 16 ND
29.4 6
7
ND
ND
Notes: All in situ cases, except for urinary bladder, are excluded. Age-adjusted rates based on less than 20 events are statistically unreliable and are not displayed (ND).
Cancer Incidence (2011-2013 Residents)
Adult Behavioral Health Risk Factors (2012-2014)[Includes: Centre, Columbia, Montour, Northumberland, Snyder, and Union Counties]
General Notes: Crude and age-adjusted rates based on less than 10 events are considered statistically unreliable and are not displayed (ND), unless otherwise noted. Starting in 2013, race of resident was derived from multiple race selections. A person is Multi-Race if they identify as more than one race. Prior to 2013, race of resident was derived from a single race designation.
Percent (CI)Risk Factors
Fair or poor general health:
Obese:
Overweight (includes obese):
No health insurance (ages 18-64):
Visited a doctor in the past 2 yearsfor a routine check-up:
Percent (CI)Risk Factors
Ever told they have diabetes: Currently has asthma:
Current smoker:
Ever tested for HIV (ages 18-64):
Needed to see a doctor but couldnot due to cost in the past year:
14
31
(12 - 16)
(28 - 34)
61 (58 - 64)
13 (11 - 16)
82 (80 - 85)
10 10(8 - 11) (9 - 12)
18 (16 - 20)
27 (24 - 31)
9 (7 - 11)
Notes: Data are based on 2012-2014 annual sample surveys of Pennsylvania adults. CI= 95% Confidence Interval.
Additional state or county/regional data are available at www.statistics.health.pa.gov.
^In situ, benign, and uncertain neoplasms
Multi- Race
0
ND
NAND ^

Union County PAGE 3
Hospitals (7/13-6/14)
Total General Acute Care
Psychiatric Rehabilitation
1 1 0 0
General Hospitals
Beds Set Up and Staffed 132
Admissions 5,508
Beds per 1,000 Population 2.9
Admissions per 1,000 Population 122.7
Average Inpatient Occupancy Rate 36.9
Nursing Homes (2014)
Total Number Certified-Medicare Certified-Medicaid
Nursing Homes
Licensed/Approved Beds
3 3 3
385 385 385
53.3
Average Occupancy Rate 96.5
Average Length of Stay (Number of Days) 194.4
$285
Total Licensed/Approved Beds per 1,000 Population Age 65 and Older
Average Semi-Private Daily Room Rate
Drug and Alcohol Treatment
Admissions to Client Primary Diagnosis
Drug Abuse Alcohol Abuse Other*
Percent Admitted
Only Once During 7/13-6/14
110 55 16 0 54.9
* Includes family members receiving counseling.
All Licensed Facilities Inpatient Non-Hospital
Inpatient Hospital Partial Hospitalization Outpatient3
1
0 0 3
Note: Each licensed facility may provide more than one type of service.
State-Supported Facilities
Types of Service Provided
Number of
Clients Admitted
71
Admission by County of Residence (7/13-6/14)
Treatment Facilities (as of 6/14)
Correctional Institution 0
General Note: Crude rates based on less than 10 events are considered statistically unreliable and are not displayed (ND), unless otherwise noted.
Services Funding
Other
0
Non-Profit
1
For Profit
0
State
0
Other
0
Ambulatory Surgery Centers (7/13-6/14)
Employees
Part Time Employees 65
Full Time Employees 65
Contracted Employees 24
Payroll Employees 106 Staff with Clinical Privileges 53
Total Surgical Visits per Employee 99.0
Total Facilities 6 Total Surgical Visits 12,869
Percent of Surgical Visits, Age 65+ 55.4
Total Operating Rooms 13 Total Surgical Visits per Operating Room 989.9
Facilities Surgical Visits
Staff Licensed as M.D. 33
Total Employees per Operating Room 10.0
Average Semi-Private Daily Room Rate $953
Total Employees 130

PAGE 4Union County
Pennsylvania Health Care Workforce (2013-2014)
Notes: Only health care employees renewing their license in 2013-2014 were surveyed.The "Estimated Number" and "Percent of Workforce Intending to Remain in Profession for 6 or More Years" used to compute each "% Change from Previous Survey Year" are adjusted based on the response rates for the previous and current survey results. The survey results are available every two years. Numbers and percentages pertain to county of employment.Percentages based on less than six responses are considered statistically unreliable and are not displayed (ND).Registered Nurses and Licensed Practical Nurses are not comparable to previous survey period, so some data is not available (DNA).
Licensed Practical Nurses (2014) 232 DNA 81.4% DNA
Physicians (2014) 123
Dentists (2013) 21
Registered Nurses (2012/2013) 584 DNA 83.3% DNA
6.8% 78.2% 5.4%
-10.1% 88.9% 8.9%
Estimated Number
Percent Changefrom Previous
Survey
Difference in Percent from
Previous Survey
Percent of WorkforceIntending to Remain in
Profession for 6 or More Years
Injury Hospitalizations (2014)
Injury Hospitalizations and Median Charges by Age and Sex
Injury Hospitalizations and Median Charges by Type of Payor
Injury Hospitalizations and Median Charges by Mechanism/Intent and Sex
0-4 5-14 15-24 25-44 45-64 65 and Older
Male - Total
Male - Median Charges
Female - Total
Female - Median Charges
UnintentionalMotor Vehicle All Poisonings Unintentional Falls
Unintentional Fire/Flame or Hot Object/Substance All Firearm All Other Injuries
Male - Total
Male - Median Charges
Female - Total
Female - Median Charges
Medicare Medicaid Other Government Commercial / Private Blue Cross Uninsured
Total Hospitalizations
Median Charges
All Ages
158 5 5 10 37 33 68
$37,981.21 ND ND $64,869.79 $49,181.66 $35,965.44 $34,037.51
161 2 1 5 8 19 126
$32,624.18 ND ND ND ND $48,615.10 $32,738.48
Note: Median charges not displayed (ND) for occurrences less than 10.
13198 29 195210
$21,173.15 $32,738.48 $34,310.44 $25,368.06 $54,494.59 $19,056.64
33
68
7
17
12
12
108
57
1
3
0
1
$30,221.30
$49,053.02
ND
$55,328.10
$18,058.84
$11,846.74
$33,861.15
$35,111.59
ND
ND
-
ND
Disclaimer: Injury data used in this report were provided to the Pennsylvania Department of Health by the Pennsylvania Health Care Cost Containment Council. The Pennsylvania Health Care Cost Containment Council specifically disclaims responsibility for any interpretations or conclusions. Contents may be republished or reproduced whole or in part, with attribution.

Venango CountyHealth Profile 2016
Demographic Data (2014)
% Population Change 2010 to 2014 -2.6
Median Age of the Population (2010-2014) 45.1
% Population Aged 65 and Over 19.9
Population per Square Mile 79.4
% Population with Income Below Poverty Level (2010-2014) 16.0
Per Capita Personal Income $36,151
% Labor Force Unemployed - Annual Average 5.9
% Population Eligible for Medical Assistance 20.7
Estimated Population by Age and Sex (2014)
Age Total Male Female Age Total Male Female
All Ages 53,529
Under 5 2,853
5-14 5,987
15-24 5,952
25-34 5,469
26,315
1,436
3,028
3,127
2,673
27,214
1,417
2,959
2,825
2,796
35-44 5,906
45-54 7,733
55-64 8,965
65-74 5,876
75+ 4,788
3,008
3,887
4,436
2,789
1,931
2,898
3,846
4,529
3,087
2,857
Natality and Reported Pregnancies^ (2014 Residents)
Crude Birth Rate10.3
Average Annual General64.5
% Low Birth Weight 7.7
% Prenatal Care in 1st Trimester 62.3
% Births to Mothers Under 18 1.8
7.5
63.1
1.9
ND
ND
ND
Per 1,000 Population
Fertility Rate* (2012-2014)
All Races White Black
All Ages 597
Under 15 1
15-17 12
554
1
9
6
0
0
37
0
3
Age of WomanReported
PregnanciesLive
BirthsFetal
DeathsInduced
Abortions
Outcome
Age of WomanReported
PregnanciesLive
BirthsFetal
DeathsInduced
Abortions
Outcome
18-19 32
20-29 364
30 and Over 185
28
337
176
1
3
2
3
24
7
All Ages* 65.0
Under 15** ND
15-17 ND
70.1
ND
13.6
Age of Woman Birth Rate Reported Pregnancy Rate Age of Woman Birth Rate Reported Pregnancy Rate
18-19 52.3
20-29 120.5
30 and Over** 29.4
59.8
130.2
30.9
^Live births, fetal deaths of 16+ weeks gestation, and induced abortions performed in-state. Notes: All ages includes any unknown ages. All rates per 1,000.*All Ages includes female population ages 15-44. ** Under 15 includes female population ages 10-14; 30 and Over includes female population ages 30-49.
Hispanic
ND
ND
ND
(of any race)
ND
ND
ND
Asian / Pacific
General Notes: Crude and age-adjusted rates based on less than 10 events are considered statistically unreliable and are not displayed (ND), unless otherwise noted. Starting in 2013, race of resident was derived from multiple race selections. A person is Multi-Race if they identify as more than one race. Prior to 2013, race of resident was derived from a single race designation.
Morbidity (2012-2014 Residents)
Reported Incidence and Average Annual Rate (per 100,000) for Selected Notifiable Diseases (2012-2014)
HIV 1 ND
Syphilis 1 ND
Tuberculosis 0 ND
Total Rate
Chlamydia 349 215.8
Giardiasis 9 ND
Gonorrhea 41 25.4
Hepatitis: Type A < 5 ND
Total Rate
Lyme Disease 90 55.7
Salmonellosis 16 9.9
Total Rate
Campylobacteriosis 16 9.9 Hep. B* Acute 0 ND
Shigellosis 0 ND
*Hepatitis: Type B **Meningococcal Disease
Meningococcal** 0 ND
Pertussis < 5 ND
Hep. B* Chronic < 5 ND
Chickenpox 17 10.5
Islander
Note: Communicable diseases with demographic counts of 1 to 4 are displayed as "< 5" to avoid potential identification of cases within certain geographic areas.
Multi - Race
ND
ND
ND

Venango County PAGE 2
Mortality (2014 Residents)
Selected Major Causes of Death, Number and Average Annual Age-Adjusted Death Rate* (2012-2014)
Number of Resident Deaths 630
Crude Death Rate per 1,000 11.8
Age-Adjusted Death Rate per 1,000 7.8
Number of Infant Deaths (< 1 Year of Age) 0 0 0 0
AllRaces BlackWhite
Hispanic(any race)
Infant Mortality Rate per 1,000 Live Births ND ND ND ND
Average Annual Infant Mortality Rate (2012-2014) ND ND ND ND
Cause Total Rate
Diseases of Heart 385
Cancer 467
Stroke 111
C.L.R.D.** 121
Accidents 96
155.4
191.3
44.0
48.3
52.2
Cause Total Rate
Influenza/Pneumonia 33
Diabetes Mellitus 79
Septicemia 20
Nephritis/Nephrosis 30
Alzheimer's Disease 49
13.5
33.2
8.4
11.5
19.1
* Per 100,000 2000 U.S. standardmillion population. Age-adjusted rates
** Chronic Lower Respiratory Disease
Selected Leading Causes of Death, Number by Age Group (2014)
Under 5 Years of Age 5-24 Years of Age 25-44 Years of Age 45-64 Years of Age 65 Years and Older
Accidents 7
Cancer 5
Diseases of Heart 2
Cancer 33
Diseases of Heart 28
Diabetes Mellitus 13
Accidents 8
C.L.R.D.** 5
Cancer 110
Diseases of Heart 103
Stroke 40
C.L.R.D.** 36
Diabetes Mellitus 18
TOTAL 0 TOTAL 3 TOTAL 22 TOTAL 123 TOTAL 482
Note: Total includes all other causes.
Asian/PI*
0
ND
*Asian/Pacific Islander ^ NA = Multi-Race data not available before 2013.
are only comparable if the samestandard million population was usedin the calculation.
Invasive Cancer Incidence and Average Annual Age-Adjusted Rates* for Major Sites by Sex
All Sites 608 551.1
Prostate 138 118.9
Lung and Bronchus 104 94.1
Colon and Rectum 52 45.0
Male FemaleTotal Rate Total Rate
Female Breast 129 116.6
508 430.9
76 55.5
54 42.7
*Per 100,000 2000 U.S. standard million population. Age-adjusted rates are only comparable if the same standard million population was used in the calculation.
- -
- -
Male FemaleTotal Rate Total Rate
Non-Hodgkin Lymphoma 21 17.8
Melanoma of the Skin 32 30.6
18 ND
32 26.2
19 ND
Corpus and Uterus, NOS - -
Urinary Bladder 64
Kidney and Renal Pelvis 24 22.6
54.9 10
13
ND
ND
Notes: All in situ cases, except for urinary bladder, are excluded. Age-adjusted rates based on less than 20 events are statistically unreliable and are not displayed (ND).
Cancer Incidence (2011-2013 Residents)
Adult Behavioral Health Risk Factors (2012-2014)[Includes: Crawford, Lawrence, Mercer, and Venango Counties]
General Notes: Crude and age-adjusted rates based on less than 10 events are considered statistically unreliable and are not displayed (ND), unless otherwise noted. Starting in 2013, race of resident was derived from multiple race selections. A person is Multi-Race if they identify as more than one race. Prior to 2013, race of resident was derived from a single race designation.
Percent (CI)Risk Factors
Fair or poor general health:
Obese:
Overweight (includes obese):
No health insurance (ages 18-64):
Visited a doctor in the past 2 yearsfor a routine check-up:
Percent (CI)Risk Factors
Ever told they have diabetes: Currently has asthma:
Current smoker:
Ever tested for HIV (ages 18-64):
Needed to see a doctor but couldnot due to cost in the past year:
17
35
(15 - 20)
(32 - 38)
66 (63 - 70)
16 (13 - 20)
83 (80 - 85)
13 10(11 - 15) (8 - 12)
24 (21 - 27)
28 (25 - 32)
13 (11 - 16)
Notes: Data are based on 2012-2014 annual sample surveys of Pennsylvania adults. CI= 95% Confidence Interval.
Additional state or county/regional data are available at www.statistics.health.pa.gov.
^In situ, benign, and uncertain neoplasms
Multi- Race
0
ND
NAND ^

Venango County PAGE 3
Hospitals (7/13-6/14)
Total General Acute Care
Psychiatric Rehabilitation
1 1 0 0
General Hospitals
Beds Set Up and Staffed 164
Admissions 6,787
Beds per 1,000 Population 3.1
Admissions per 1,000 Population 126.8
Average Inpatient Occupancy Rate 54.0
Nursing Homes (2014)
Total Number Certified-Medicare Certified-Medicaid
Nursing Homes
Licensed/Approved Beds
5 5 4
477 477 461
44.7
Average Occupancy Rate 92.5
Average Length of Stay (Number of Days) 154.7
$355
Total Licensed/Approved Beds per 1,000 Population Age 65 and Older
Average Semi-Private Daily Room Rate
Drug and Alcohol Treatment
Admissions to Client Primary Diagnosis
Drug Abuse Alcohol Abuse Other*
Percent Admitted
Only Once During 7/13-6/14
549 263 154 5 79.6
* Includes family members receiving counseling.
All Licensed Facilities Inpatient Non-Hospital
Inpatient Hospital Partial Hospitalization Outpatient8
2
0 2 6
Note: Each licensed facility may provide more than one type of service.
State-Supported Facilities
Types of Service Provided
Number of
Clients Admitted
422
Admission by County of Residence (7/13-6/14)
Treatment Facilities (as of 6/14)
Correctional Institution 0
General Note: Crude rates based on less than 10 events are considered statistically unreliable and are not displayed (ND), unless otherwise noted.
Services Funding
Other
0
Non-Profit
1
For Profit
0
State
0
Other
0
Ambulatory Surgery Centers (7/13-6/14)
Employees
Part Time Employees 19
Full Time Employees 9
Contracted Employees 11
Payroll Employees 17 Staff with Clinical Privileges 5
Total Surgical Visits per Employee 80.1
Total Facilities 1 Total Surgical Visits 2,243
Percent of Surgical Visits, Age 65+ 38.0
Total Operating Rooms 2 Total Surgical Visits per Operating Room 1,121.5
Facilities Surgical Visits
Staff Licensed as M.D. 4
Total Employees per Operating Room 14.0
Average Semi-Private Daily Room Rate $880
Total Employees 28

PAGE 4Venango County
Pennsylvania Health Care Workforce (2013-2014)
Notes: Only health care employees renewing their license in 2013-2014 were surveyed.The "Estimated Number" and "Percent of Workforce Intending to Remain in Profession for 6 or More Years" used to compute each "% Change from Previous Survey Year" are adjusted based on the response rates for the previous and current survey results. The survey results are available every two years. Numbers and percentages pertain to county of employment.Percentages based on less than six responses are considered statistically unreliable and are not displayed (ND).Registered Nurses and Licensed Practical Nurses are not comparable to previous survey period, so some data is not available (DNA).
Licensed Practical Nurses (2014) 271 DNA 81.8% DNA
Physicians (2014) 92
Dentists (2013) 21
Registered Nurses (2012/2013) 529 DNA 77.8% DNA
-1.5% 69.7% -0.5%
14.8% 55.6% -6.9%
Estimated Number
Percent Changefrom Previous
Survey
Difference in Percent from
Previous Survey
Percent of WorkforceIntending to Remain in
Profession for 6 or More Years
Injury Hospitalizations (2014)
Injury Hospitalizations and Median Charges by Age and Sex
Injury Hospitalizations and Median Charges by Type of Payor
Injury Hospitalizations and Median Charges by Mechanism/Intent and Sex
0-4 5-14 15-24 25-44 45-64 65 and Older
Male - Total
Male - Median Charges
Female - Total
Female - Median Charges
UnintentionalMotor Vehicle All Poisonings Unintentional Falls
Unintentional Fire/Flame or Hot Object/Substance All Firearm All Other Injuries
Male - Total
Male - Median Charges
Female - Total
Female - Median Charges
Medicare Medicaid Other Government Commercial / Private Blue Cross Uninsured
Total Hospitalizations
Median Charges
All Ages
306 5 4 16 43 96 142
$25,135.43 ND ND $29,809.08 $31,250.29 $28,347.00 $21,159.13
342 6 3 12 28 84 209
$22,432.63 ND ND $11,639.23 $17,575.38 $26,668.38 $22,377.75
Note: Median charges not displayed (ND) for occurrences less than 10.
13373 81 501217
$27,555.75 $23,125.10 $21,595.75 $27,672.63 $30,004.25 ND
94
111
17
22
33
27
194
135
3
10
1
1
$22,608.89
$27,672.75
$41,731.67
$81,098.73
$12,406.75
$6,996.25
$22,215.38
$24,202.50
ND
$15,676.00
ND
ND
Disclaimer: Injury data used in this report were provided to the Pennsylvania Department of Health by the Pennsylvania Health Care Cost Containment Council. The Pennsylvania Health Care Cost Containment Council specifically disclaims responsibility for any interpretations or conclusions. Contents may be republished or reproduced whole or in part, with attribution.

Warren CountyHealth Profile 2016
Demographic Data (2014)
% Population Change 2010 to 2014 -2.7
Median Age of the Population (2010-2014) 46.0
% Population Aged 65 and Over 20.7
Population per Square Mile 46.0
% Population with Income Below Poverty Level (2010-2014) 13.0
Per Capita Personal Income $37,883
% Labor Force Unemployed - Annual Average 5.3
% Population Eligible for Medical Assistance 17.4
Estimated Population by Age and Sex (2014)
Age Total Male Female Age Total Male Female
All Ages 40,703
Under 5 1,997
5-14 4,505
15-24 4,511
25-34 4,156
20,420
1,047
2,317
2,401
2,129
20,283
950
2,188
2,110
2,027
35-44 4,414
45-54 6,059
55-64 6,641
65-74 4,643
75+ 3,777
2,218
3,095
3,317
2,282
1,614
2,196
2,964
3,324
2,361
2,163
Natality and Reported Pregnancies^ (2014 Residents)
Crude Birth Rate10.2
Average Annual General63.9
% Low Birth Weight 11.0
% Prenatal Care in 1st Trimester 79.0
% Births to Mothers Under 18 ND
11.1
78.9
ND
ND
ND
ND
Per 1,000 Population
Fertility Rate* (2012-2014)
All Races White Black
All Ages 425
Under 15 0
15-17 5
414
0
5
5
0
0
6
0
0
Age of WomanReported
PregnanciesLive
BirthsFetal
DeathsInduced
Abortions
Outcome
Age of WomanReported
PregnanciesLive
BirthsFetal
DeathsInduced
Abortions
Outcome
18-19 13
20-29 251
30 and Over 155
13
246
149
0
2
3
0
3
3
All Ages* 65.4
Under 15** ND
15-17 ND
67.1
ND
ND
Age of Woman Birth Rate Reported Pregnancy Rate Age of Woman Birth Rate Reported Pregnancy Rate
18-19 32.8
20-29 122.6
30 and Over** 32.3
32.8
125.1
33.6
^Live births, fetal deaths of 16+ weeks gestation, and induced abortions performed in-state. Notes: All ages includes any unknown ages. All rates per 1,000.*All Ages includes female population ages 15-44. ** Under 15 includes female population ages 10-14; 30 and Over includes female population ages 30-49.
Hispanic
ND
ND
ND
(of any race)
ND
ND
ND
Asian / Pacific
General Notes: Crude and age-adjusted rates based on less than 10 events are considered statistically unreliable and are not displayed (ND), unless otherwise noted. Starting in 2013, race of resident was derived from multiple race selections. A person is Multi-Race if they identify as more than one race. Prior to 2013, race of resident was derived from a single race designation.
Morbidity (2012-2014 Residents)
Reported Incidence and Average Annual Rate (per 100,000) for Selected Notifiable Diseases (2012-2014)
HIV 0 ND
Syphilis 1 ND
Tuberculosis 0 ND
Total Rate
Chlamydia 231 188.2
Giardiasis 17 13.9
Gonorrhea 15 12.2
Hepatitis: Type A 0 ND
Total Rate
Lyme Disease 26 21.2
Salmonellosis 10 8.1
Total Rate
Campylobacteriosis 17 13.9 Hep. B* Acute 0 ND
Shigellosis 0 ND
*Hepatitis: Type B **Meningococcal Disease
Meningococcal** 0 ND
Pertussis 9 ND
Hep. B* Chronic < 5 ND
Chickenpox < 5 ND
Islander
Note: Communicable diseases with demographic counts of 1 to 4 are displayed as "< 5" to avoid potential identification of cases within certain geographic areas.
Multi - Race
ND
ND
ND

Warren County PAGE 2
Mortality (2014 Residents)
Selected Major Causes of Death, Number and Average Annual Age-Adjusted Death Rate* (2012-2014)
Number of Resident Deaths 473
Crude Death Rate per 1,000 11.6
Age-Adjusted Death Rate per 1,000 7.3
Number of Infant Deaths (< 1 Year of Age) 0 0 0 0
AllRaces BlackWhite
Hispanic(any race)
Infant Mortality Rate per 1,000 Live Births ND ND ND ND
Average Annual Infant Mortality Rate (2012-2014) ND ND ND ND
Cause Total Rate
Diseases of Heart 431
Cancer 336
Stroke 80
C.L.R.D.** 104
Accidents 58
216.5
175.8
39.5
51.9
37.7
Cause Total Rate
Influenza/Pneumonia 19
Diabetes Mellitus 87
Septicemia 14
Nephritis/Nephrosis 23
Alzheimer's Disease 27
10.2
44.8
7.0
11.6
13.5
* Per 100,000 2000 U.S. standardmillion population. Age-adjusted rates
** Chronic Lower Respiratory Disease
Selected Leading Causes of Death, Number by Age Group (2014)
Under 5 Years of Age 5-24 Years of Age 25-44 Years of Age 45-64 Years of Age 65 Years and Older
Accidents 3
Cancer 3
Cancer 24
Diseases of Heart 19
Suicide 6
Diseases of Heart 113
Cancer 89
Diabetes Mellitus 24
C.L.R.D.** 23
Stroke 19
TOTAL 0 TOTAL 1 TOTAL 12 TOTAL 81 TOTAL 379
Note: Total includes all other causes.
Asian/PI*
0
ND
*Asian/Pacific Islander ^ NA = Multi-Race data not available before 2013.
are only comparable if the samestandard million population was usedin the calculation.
Invasive Cancer Incidence and Average Annual Age-Adjusted Rates* for Major Sites by Sex
All Sites 453 515.5
Prostate 122 129.0
Lung and Bronchus 55 60.1
Colon and Rectum 35 43.1
Male FemaleTotal Rate Total Rate
Female Breast 130 143.3
419 469.3
54 51.8
30 31.1
*Per 100,000 2000 U.S. standard million population. Age-adjusted rates are only comparable if the same standard million population was used in the calculation.
- -
- -
Male FemaleTotal Rate Total Rate
Non-Hodgkin Lymphoma 19 ND
Melanoma of the Skin 13 ND
13 ND
31 31.3
14 ND
Corpus and Uterus, NOS - -
Urinary Bladder 44
Kidney and Renal Pelvis 20 20.9
52.2 11
11
ND
ND
Notes: All in situ cases, except for urinary bladder, are excluded. Age-adjusted rates based on less than 20 events are statistically unreliable and are not displayed (ND).
Cancer Incidence (2011-2013 Residents)
Adult Behavioral Health Risk Factors (2012-2014)[Includes: Forest, Elk, Cameron, Clearfield, Jefferson, Clarion, McKean, and Warren Counties]
General Notes: Crude and age-adjusted rates based on less than 10 events are considered statistically unreliable and are not displayed (ND), unless otherwise noted. Starting in 2013, race of resident was derived from multiple race selections. A person is Multi-Race if they identify as more than one race. Prior to 2013, race of resident was derived from a single race designation.
Percent (CI)Risk Factors
Fair or poor general health:
Obese:
Overweight (includes obese):
No health insurance (ages 18-64):
Visited a doctor in the past 2 yearsfor a routine check-up:
Percent (CI)Risk Factors
Ever told they have diabetes: Currently has asthma:
Current smoker:
Ever tested for HIV (ages 18-64):
Needed to see a doctor but couldnot due to cost in the past year:
20
33
(17 - 22)
(30 - 36)
69 (66 - 72)
15 (12 - 18)
84 (81 - 86)
12 11(10 - 14) (9 - 13)
23 (21 - 26)
29 (26 - 33)
10 (8 - 12)
Notes: Data are based on 2012-2014 annual sample surveys of Pennsylvania adults. CI= 95% Confidence Interval.
Additional state or county/regional data are available at www.statistics.health.pa.gov.
^In situ, benign, and uncertain neoplasms
Multi- Race
0
ND
NAND ^

Warren County PAGE 3
Hospitals (7/13-6/14)
Total General Acute Care
Psychiatric Rehabilitation
2 1 1 0
General Hospitals
Beds Set Up and Staffed 85
Admissions 3,045
Beds per 1,000 Population 2.1
Admissions per 1,000 Population 74.8
Average Inpatient Occupancy Rate 46.3
Nursing Homes (2014)
Total Number Certified-Medicare Certified-Medicaid
Nursing Homes
Licensed/Approved Beds
3 3 3
403 403 403
47.9
Average Occupancy Rate 94.9
Average Length of Stay (Number of Days) 222.3
$227
Total Licensed/Approved Beds per 1,000 Population Age 65 and Older
Average Semi-Private Daily Room Rate
Drug and Alcohol Treatment
Admissions to Client Primary Diagnosis
Drug Abuse Alcohol Abuse Other*
Percent Admitted
Only Once During 7/13-6/14
172 80 56 3 81.3
* Includes family members receiving counseling.
All Licensed Facilities Inpatient Non-Hospital
Inpatient Hospital Partial Hospitalization Outpatient3
0
1 0 2
Note: Each licensed facility may provide more than one type of service.
State-Supported Facilities
Types of Service Provided
Number of
Clients Admitted
139
Admission by County of Residence (7/13-6/14)
Treatment Facilities (as of 6/14)
Correctional Institution 0
General Note: Crude rates based on less than 10 events are considered statistically unreliable and are not displayed (ND), unless otherwise noted.
Services Funding
Other
0
Non-Profit
1
For Profit
0
State
1
Other
0
Ambulatory Surgery Centers (7/13-6/14)
Employees
Part Time Employees 27
Full Time Employees 17
Contracted Employees 6
Payroll Employees 38 Staff with Clinical Privileges 24
Total Surgical Visits per Employee 132.6
Total Facilities 2 Total Surgical Visits 5,834
Percent of Surgical Visits, Age 65+ 50.5
Total Operating Rooms 5 Total Surgical Visits per Operating Room 1,166.8
Facilities Surgical Visits
Staff Licensed as M.D. 15
Total Employees per Operating Room 8.8
Average Semi-Private Daily Room Rate $837
Total Employees 44

PAGE 4Warren County
Pennsylvania Health Care Workforce (2013-2014)
Notes: Only health care employees renewing their license in 2013-2014 were surveyed.The "Estimated Number" and "Percent of Workforce Intending to Remain in Profession for 6 or More Years" used to compute each "% Change from Previous Survey Year" are adjusted based on the response rates for the previous and current survey results. The survey results are available every two years. Numbers and percentages pertain to county of employment.Percentages based on less than six responses are considered statistically unreliable and are not displayed (ND).Registered Nurses and Licensed Practical Nurses are not comparable to previous survey period, so some data is not available (DNA).
Licensed Practical Nurses (2014) 173 DNA 80.0% DNA
Physicians (2014) 63
Dentists (2013) 10
Registered Nurses (2012/2013) 393 DNA 76.3% DNA
-4.0% 55.8% -10.3%
14.8% 77.8% -9.7%
Estimated Number
Percent Changefrom Previous
Survey
Difference in Percent from
Previous Survey
Percent of WorkforceIntending to Remain in
Profession for 6 or More Years
Injury Hospitalizations (2014)
Injury Hospitalizations and Median Charges by Age and Sex
Injury Hospitalizations and Median Charges by Type of Payor
Injury Hospitalizations and Median Charges by Mechanism/Intent and Sex
0-4 5-14 15-24 25-44 45-64 65 and Older
Male - Total
Male - Median Charges
Female - Total
Female - Median Charges
UnintentionalMotor Vehicle All Poisonings Unintentional Falls
Unintentional Fire/Flame or Hot Object/Substance All Firearm All Other Injuries
Male - Total
Male - Median Charges
Female - Total
Female - Median Charges
Medicare Medicaid Other Government Commercial / Private Blue Cross Uninsured
Total Hospitalizations
Median Charges
All Ages
194 4 1 24 23 50 92
$26,521.81 ND ND $21,585.70 $23,262.30 $23,115.59 $31,090.26
245 2 1 16 33 61 132
$24,519.19 ND ND $14,696.50 $32,393.65 $25,918.35 $24,626.10
Note: Median charges not displayed (ND) for occurrences less than 10.
6245 52 57753
ND $24,733.00 $28,855.33 $23,432.65 $30,972.75 ND
71
80
15
9
30
15
123
89
5
1
1
0
$21,224.21
$28,309.31
$33,480.75
ND
$10,809.80
$12,904.73
$28,805.60
$26,104.18
ND
ND
ND
-
Disclaimer: Injury data used in this report were provided to the Pennsylvania Department of Health by the Pennsylvania Health Care Cost Containment Council. The Pennsylvania Health Care Cost Containment Council specifically disclaims responsibility for any interpretations or conclusions. Contents may be republished or reproduced whole or in part, with attribution.

Washington CountyHealth Profile 2016
Demographic Data (2014)
% Population Change 2010 to 2014 0.2
Median Age of the Population (2010-2014) 44.0
% Population Aged 65 and Over 18.9
Population per Square Mile 242.9
% Population with Income Below Poverty Level (2010-2014) 10.5
Per Capita Personal Income $48,258
% Labor Force Unemployed - Annual Average 5.8
% Population Eligible for Medical Assistance 14.4
Estimated Population by Age and Sex (2014)
Age Total Male Female Age Total Male Female
All Ages 208,187
Under 5 10,398
5-14 23,204
15-24 25,805
25-34 22,348
101,893
5,282
11,954
13,139
11,433
106,294
5,116
11,250
12,666
10,915
35-44 24,401
45-54 30,566
55-64 32,062
65-74 21,366
75+ 18,037
12,220
15,027
15,681
10,130
7,027
12,181
15,539
16,381
11,236
11,010
Natality and Reported Pregnancies^ (2014 Residents)
Crude Birth Rate9.7
Average Annual General55.6
% Low Birth Weight 7.3
% Prenatal Care in 1st Trimester 80.3
% Births to Mothers Under 18 1.2
7.2
81.4
1.0
ND
73.8
ND
Per 1,000 Population
Fertility Rate* (2012-2014)
All Races White Black
All Ages 2,313
Under 15 1
15-17 43
2,011
0
24
19
0
1
283
1
18
Age of WomanReported
PregnanciesLive
BirthsFetal
DeathsInduced
Abortions
Outcome
Age of WomanReported
PregnanciesLive
BirthsFetal
DeathsInduced
Abortions
Outcome
18-19 98
20-29 1,193
30 and Over 972
70
1,022
889
0
9
9
28
162
74
All Ages* 56.2
Under 15** ND
15-17 6.7
64.7
ND
11.9
Age of Woman Birth Rate Reported Pregnancy Rate Age of Woman Birth Rate Reported Pregnancy Rate
18-19 25.2
20-29 88.2
30 and Over** 35.4
35.3
102.9
38.7
^Live births, fetal deaths of 16+ weeks gestation, and induced abortions performed in-state. Notes: All ages includes any unknown ages. All rates per 1,000.*All Ages includes female population ages 15-44. ** Under 15 includes female population ages 10-14; 30 and Over includes female population ages 30-49.
Hispanic
ND
55.2
ND
(of any race)
ND
ND
ND
Asian / Pacific
General Notes: Crude and age-adjusted rates based on less than 10 events are considered statistically unreliable and are not displayed (ND), unless otherwise noted. Starting in 2013, race of resident was derived from multiple race selections. A person is Multi-Race if they identify as more than one race. Prior to 2013, race of resident was derived from a single race designation.
Morbidity (2012-2014 Residents)
Reported Incidence and Average Annual Rate (per 100,000) for Selected Notifiable Diseases (2012-2014)
HIV 18 2.9
Syphilis 5 ND
Tuberculosis < 5 ND
Total Rate
Chlamydia 1,536 245.7
Giardiasis 33 5.3
Gonorrhea 428 68.5
Hepatitis: Type A < 5 ND
Total Rate
Lyme Disease 77 12.3
Salmonellosis 64 10.2
Total Rate
Campylobacteriosis 82 13.1 Hep. B* Acute < 5 ND
Shigellosis 9 ND
*Hepatitis: Type B **Meningococcal Disease
Meningococcal** < 5 ND
Pertussis 49 7.8
Hep. B* Chronic 35 5.6
Chickenpox 57 9.1
Islander
Note: Communicable diseases with demographic counts of 1 to 4 are displayed as "< 5" to avoid potential identification of cases within certain geographic areas.
Multi - Race
ND
65.7
ND

Washington County PAGE 2
Mortality (2014 Residents)
Selected Major Causes of Death, Number and Average Annual Age-Adjusted Death Rate* (2012-2014)
Number of Resident Deaths 2,498
Crude Death Rate per 1,000 12.0
Age-Adjusted Death Rate per 1,000 8.0
Number of Infant Deaths (< 1 Year of Age) 10 9 0 0
AllRaces BlackWhite
Hispanic(any race)
Infant Mortality Rate per 1,000 Live Births 5.0 ND ND ND
Average Annual Infant Mortality Rate (2012-2014) 4.0 3.8 ND ND
Cause Total Rate
Diseases of Heart 1,609
Cancer 1,663
Stroke 362
C.L.R.D.** 458
Accidents 327
165.4
181.4
36.9
49.0
47.4
Cause Total Rate
Influenza/Pneumonia 166
Diabetes Mellitus 291
Septicemia 139
Nephritis/Nephrosis 135
Alzheimer's Disease 258
17.2
30.8
14.8
13.3
24.4
* Per 100,000 2000 U.S. standardmillion population. Age-adjusted rates
** Chronic Lower Respiratory Disease
Selected Leading Causes of Death, Number by Age Group (2014)
Under 5 Years of Age 5-24 Years of Age 25-44 Years of Age 45-64 Years of Age 65 Years and Older
Perinatal Conditions 3 Accidents 10
Assault (Homicide) 2
Accidents 28
Diseases of Heart 9
Cancer 6
Suicide 5
C.L.R.D.** 2
Cancer 136
Diseases of Heart 56
Accidents 31
Liver Dis./Cirrhosis 17
C.L.R.D.** 14
Diseases of Heart 453
Cancer 403
C.L.R.D.** 131
Stroke 105
Alzheimer's Disease 79
TOTAL 10 TOTAL 19 TOTAL 67 TOTAL 417 TOTAL 1,985
Note: Total includes all other causes.
Asian/PI*
0
ND
*Asian/Pacific Islander ^ NA = Multi-Race data not available before 2013.
are only comparable if the samestandard million population was usedin the calculation.
Invasive Cancer Incidence and Average Annual Age-Adjusted Rates* for Major Sites by Sex
All Sites 2,068 526.7
Prostate 453 105.6
Lung and Bronchus 311 78.1
Colon and Rectum 207 53.4
Male FemaleTotal Rate Total Rate
Female Breast 589 132.9
2,095 463.0
288 60.4
188 38.5
*Per 100,000 2000 U.S. standard million population. Age-adjusted rates are only comparable if the same standard million population was used in the calculation.
- -
- -
Male FemaleTotal Rate Total Rate
Non-Hodgkin Lymphoma 94 25.3
Melanoma of the Skin 98 26.9
71 15.3
153 32.5
63 15.1
Corpus and Uterus, NOS - -
Urinary Bladder 167
Kidney and Renal Pelvis 82 21.1
42.7 59
48
11.6
10.8
Notes: All in situ cases, except for urinary bladder, are excluded. Age-adjusted rates based on less than 20 events are statistically unreliable and are not displayed (ND).
Cancer Incidence (2011-2013 Residents)
Adult Behavioral Health Risk Factors (2012-2014)[Includes: Fayette, Greene, and Washington Counties]
General Notes: Crude and age-adjusted rates based on less than 10 events are considered statistically unreliable and are not displayed (ND), unless otherwise noted. Starting in 2013, race of resident was derived from multiple race selections. A person is Multi-Race if they identify as more than one race. Prior to 2013, race of resident was derived from a single race designation.
Percent (CI)Risk Factors
Fair or poor general health:
Obese:
Overweight (includes obese):
No health insurance (ages 18-64):
Visited a doctor in the past 2 yearsfor a routine check-up:
Percent (CI)Risk Factors
Ever told they have diabetes: Currently has asthma:
Current smoker:
Ever tested for HIV (ages 18-64):
Needed to see a doctor but couldnot due to cost in the past year:
22
33
(19 - 25)
(30 - 37)
67 (63 - 70)
16 (13 - 20)
83 (80 - 86)
15 11(12 - 17) (9 - 14)
25 (22 - 28)
30 (26 - 35)
13 (11 - 16)
Notes: Data are based on 2012-2014 annual sample surveys of Pennsylvania adults. CI= 95% Confidence Interval.
Additional state or county/regional data are available at www.statistics.health.pa.gov.
^In situ, benign, and uncertain neoplasms
Multi- Race
0
ND
NAND ^

Washington County PAGE 3
Hospitals (7/13-6/14)
Total General Acute Care
Psychiatric Rehabilitation
4 3 0 0
General Hospitals
Beds Set Up and Staffed 534
Admissions 23,018
Beds per 1,000 Population 2.6
Admissions per 1,000 Population 110.6
Average Inpatient Occupancy Rate 55.5
Nursing Homes (2014)
Total Number Certified-Medicare Certified-Medicaid
Nursing Homes
Licensed/Approved Beds
12 12 12
1,424 1,335 1,424
36.1
Average Occupancy Rate 89.5
Average Length of Stay (Number of Days) 133.7
$254
Total Licensed/Approved Beds per 1,000 Population Age 65 and Older
Average Semi-Private Daily Room Rate
Drug and Alcohol Treatment
Admissions to Client Primary Diagnosis
Drug Abuse Alcohol Abuse Other*
Percent Admitted
Only Once During 7/13-6/14
634 294 54 10 45.8
* Includes family members receiving counseling.
All Licensed Facilities Inpatient Non-Hospital
Inpatient Hospital Partial Hospitalization Outpatient11
5
0 5 6
Note: Each licensed facility may provide more than one type of service.
State-Supported Facilities
Types of Service Provided
Number of
Clients Admitted
358
Admission by County of Residence (7/13-6/14)
Treatment Facilities (as of 6/14)
Correctional Institution 0
General Note: Crude rates based on less than 10 events are considered statistically unreliable and are not displayed (ND), unless otherwise noted.
Services Funding
Other
1
Non-Profit
3
For Profit
1
State
0
Other
0
Ambulatory Surgery Centers (7/13-6/14)
Employees
Part Time Employees 86
Full Time Employees 55
Contracted Employees 30
Payroll Employees 111 Staff with Clinical Privileges 159
Total Surgical Visits per Employee 98.5
Total Facilities 4 Total Surgical Visits 13,892
Percent of Surgical Visits, Age 65+ 43.5
Total Operating Rooms 13 Total Surgical Visits per Operating Room 1,068.6
Facilities Surgical Visits
Staff Licensed as M.D. 117
Total Employees per Operating Room 10.8
Average Semi-Private Daily Room Rate $831
Total Employees 141

PAGE 4Washington County
Pennsylvania Health Care Workforce (2013-2014)
Notes: Only health care employees renewing their license in 2013-2014 were surveyed.The "Estimated Number" and "Percent of Workforce Intending to Remain in Profession for 6 or More Years" used to compute each "% Change from Previous Survey Year" are adjusted based on the response rates for the previous and current survey results. The survey results are available every two years. Numbers and percentages pertain to county of employment.Percentages based on less than six responses are considered statistically unreliable and are not displayed (ND).Registered Nurses and Licensed Practical Nurses are not comparable to previous survey period, so some data is not available (DNA).
Licensed Practical Nurses (2014) 454 DNA 82.1% DNA
Physicians (2014) 386
Dentists (2013) 103
Registered Nurses (2012/2013) 2,086 DNA 79.1% DNA
3.1% 74.5% 2.5%
-0.6% 82.2% 1.8%
Estimated Number
Percent Changefrom Previous
Survey
Difference in Percent from
Previous Survey
Percent of WorkforceIntending to Remain in
Profession for 6 or More Years
Injury Hospitalizations (2014)
Injury Hospitalizations and Median Charges by Age and Sex
Injury Hospitalizations and Median Charges by Type of Payor
Injury Hospitalizations and Median Charges by Mechanism/Intent and Sex
0-4 5-14 15-24 25-44 45-64 65 and Older
Male - Total
Male - Median Charges
Female - Total
Female - Median Charges
UnintentionalMotor Vehicle All Poisonings Unintentional Falls
Unintentional Fire/Flame or Hot Object/Substance All Firearm All Other Injuries
Male - Total
Male - Median Charges
Female - Total
Female - Median Charges
Medicare Medicaid Other Government Commercial / Private Blue Cross Uninsured
Total Hospitalizations
Median Charges
All Ages
1,061 14 16 95 183 351 402
$31,907.49 $28,648.75 $28,950.63 $32,409.50 $35,820.25 $31,241.79 $30,993.57
1,225 15 8 44 120 259 779
$27,350.40 $19,848.50 ND $23,130.78 $20,488.97 $27,389.82 $28,499.87
Note: Median charges not displayed (ND) for occurrences less than 10.
571,272 274 28637211
$10,728.30 $29,022.32 $25,308.38 $28,862.88 $40,696.00 $22,069.20
324
401
66
97
120
104
701
431
12
23
2
5
$26,276.64
$34,990.00
$47,411.75
$66,844.40
$10,782.85
$9,814.45
$28,887.52
$30,407.27
$28,514.00
$44,768.21
ND
ND
Disclaimer: Injury data used in this report were provided to the Pennsylvania Department of Health by the Pennsylvania Health Care Cost Containment Council. The Pennsylvania Health Care Cost Containment Council specifically disclaims responsibility for any interpretations or conclusions. Contents may be republished or reproduced whole or in part, with attribution.

Wayne CountyHealth Profile 2016
Demographic Data (2014)
% Population Change 2010 to 2014 -2.7
Median Age of the Population (2010-2014) 46.2
% Population Aged 65 and Over 20.7
Population per Square Mile 70.8
% Population with Income Below Poverty Level (2010-2014) 13.0
Per Capita Personal Income $34,962
% Labor Force Unemployed - Annual Average 6.4
% Population Eligible for Medical Assistance 15.9
Estimated Population by Age and Sex (2014)
Age Total Male Female Age Total Male Female
All Ages 51,401
Under 5 2,088
5-14 5,115
15-24 5,659
25-34 5,546
27,277
1,132
2,630
3,049
3,320
24,124
956
2,485
2,610
2,226
35-44 5,979
45-54 8,011
55-64 8,365
65-74 6,461
75+ 4,177
3,463
4,253
4,271
3,329
1,830
2,516
3,758
4,094
3,132
2,347
Natality and Reported Pregnancies^ (2014 Residents)
Crude Birth Rate7.6
Average Annual General53.5
% Low Birth Weight 5.4
% Prenatal Care in 1st Trimester 73.7
% Births to Mothers Under 18 ND
5.6
74.6
ND
ND
ND
ND
Per 1,000 Population
Fertility Rate* (2012-2014)
All Races White Black
All Ages 433
Under 15 0
15-17 4
391
0
2
3
0
0
39
0
2
Age of WomanReported
PregnanciesLive
BirthsFetal
DeathsInduced
Abortions
Outcome
Age of WomanReported
PregnanciesLive
BirthsFetal
DeathsInduced
Abortions
Outcome
18-19 22
20-29 226
30 and Over 181
18
202
169
0
2
1
4
22
11
All Ages* 53.2
Under 15** ND
15-17 ND
58.9
ND
ND
Age of Woman Birth Rate Reported Pregnancy Rate Age of Woman Birth Rate Reported Pregnancy Rate
18-19 35.0
20-29 88.2
30 and Over** 31.3
42.8
98.7
33.6
^Live births, fetal deaths of 16+ weeks gestation, and induced abortions performed in-state. Notes: All ages includes any unknown ages. All rates per 1,000.*All Ages includes female population ages 15-44. ** Under 15 includes female population ages 10-14; 30 and Over includes female population ages 30-49.
Hispanic
ND
66.7
ND
(of any race)
ND
ND
ND
Asian / Pacific
General Notes: Crude and age-adjusted rates based on less than 10 events are considered statistically unreliable and are not displayed (ND), unless otherwise noted. Starting in 2013, race of resident was derived from multiple race selections. A person is Multi-Race if they identify as more than one race. Prior to 2013, race of resident was derived from a single race designation.
Morbidity (2012-2014 Residents)
Reported Incidence and Average Annual Rate (per 100,000) for Selected Notifiable Diseases (2012-2014)
HIV 6 ND
Syphilis 1 ND
Tuberculosis < 5 ND
Total Rate
Chlamydia 123 79.4
Giardiasis 12 7.7
Gonorrhea 13 8.4
Hepatitis: Type A < 5 ND
Total Rate
Lyme Disease 170 109.7
Salmonellosis 21 13.6
Total Rate
Campylobacteriosis 59 38.1 Hep. B* Acute 0 ND
Shigellosis 0 ND
*Hepatitis: Type B **Meningococcal Disease
Meningococcal** < 5 ND
Pertussis 8 ND
Hep. B* Chronic 31 20.0
Chickenpox 10 6.5
Islander
Note: Communicable diseases with demographic counts of 1 to 4 are displayed as "< 5" to avoid potential identification of cases within certain geographic areas.
Multi - Race
ND
ND
ND

Wayne County PAGE 2
Mortality (2014 Residents)
Selected Major Causes of Death, Number and Average Annual Age-Adjusted Death Rate* (2012-2014)
Number of Resident Deaths 588
Crude Death Rate per 1,000 11.4
Age-Adjusted Death Rate per 1,000 7.9
Number of Infant Deaths (< 1 Year of Age) 0 0 0 0
AllRaces BlackWhite
Hispanic(any race)
Infant Mortality Rate per 1,000 Live Births ND ND ND ND
Average Annual Infant Mortality Rate (2012-2014) ND ND ND ND
Cause Total Rate
Diseases of Heart 482
Cancer 423
Stroke 75
C.L.R.D.** 109
Accidents 83
218.5
180.2
33.3
48.2
46.8
Cause Total Rate
Influenza/Pneumonia 48
Diabetes Mellitus 68
Septicemia 30
Nephritis/Nephrosis 53
Alzheimer's Disease 74
22.7
28.9
12.5
24.9
34.7
* Per 100,000 2000 U.S. standardmillion population. Age-adjusted rates
** Chronic Lower Respiratory Disease
Selected Leading Causes of Death, Number by Age Group (2014)
Under 5 Years of Age 5-24 Years of Age 25-44 Years of Age 45-64 Years of Age 65 Years and Older
Accidents 9
Suicide 2
Cancer 37
Diseases of Heart 19
Accidents 10
C.L.R.D.** 9
Diseases of Heart 133
Cancer 101
C.L.R.D.** 30
Alzheimer's Disease 27
Stroke 19
TOTAL 0 TOTAL 2 TOTAL 19 TOTAL 116 TOTAL 451
Note: Total includes all other causes.
Asian/PI*
0
ND
*Asian/Pacific Islander ^ NA = Multi-Race data not available before 2013.
are only comparable if the samestandard million population was usedin the calculation.
Invasive Cancer Incidence and Average Annual Age-Adjusted Rates* for Major Sites by Sex
All Sites 561 497.6
Prostate 109 86.5
Lung and Bronchus 96 80.5
Colon and Rectum 40 35.6
Male FemaleTotal Rate Total Rate
Female Breast 128 113.1
496 445.0
76 61.6
56 49.7
*Per 100,000 2000 U.S. standard million population. Age-adjusted rates are only comparable if the same standard million population was used in the calculation.
- -
- -
Male FemaleTotal Rate Total Rate
Non-Hodgkin Lymphoma 30 29.6
Melanoma of the Skin 19 ND
23 19.0
34 29.2
17 ND
Corpus and Uterus, NOS - -
Urinary Bladder 53
Kidney and Renal Pelvis 27 25.5
48.5 13
6
ND
ND
Notes: All in situ cases, except for urinary bladder, are excluded. Age-adjusted rates based on less than 20 events are statistically unreliable and are not displayed (ND).
Cancer Incidence (2011-2013 Residents)
Adult Behavioral Health Risk Factors (2012-2014)[Includes: Pike, Monroe, Susquehanna, and Wayne Counties]
General Notes: Crude and age-adjusted rates based on less than 10 events are considered statistically unreliable and are not displayed (ND), unless otherwise noted. Starting in 2013, race of resident was derived from multiple race selections. A person is Multi-Race if they identify as more than one race. Prior to 2013, race of resident was derived from a single race designation.
Percent (CI)Risk Factors
Fair or poor general health:
Obese:
Overweight (includes obese):
No health insurance (ages 18-64):
Visited a doctor in the past 2 yearsfor a routine check-up:
Percent (CI)Risk Factors
Ever told they have diabetes: Currently has asthma:
Current smoker:
Ever tested for HIV (ages 18-64):
Needed to see a doctor but couldnot due to cost in the past year:
21
31
(17 - 26)
(27 - 35)
68 (64 - 71)
18 (14 - 24)
82 (77 - 86)
9 13(7 - 11) (9 - 17)
25 (20 - 30)
33 (28 - 38)
14 (11 - 18)
Notes: Data are based on 2012-2014 annual sample surveys of Pennsylvania adults. CI= 95% Confidence Interval.
Additional state or county/regional data are available at www.statistics.health.pa.gov.
^In situ, benign, and uncertain neoplasms
Multi- Race
0
ND
NAND ^

Wayne County PAGE 3
Hospitals (7/13-6/14)
Total General Acute Care
Psychiatric Rehabilitation
2 1 1 0
General Hospitals
Beds Set Up and Staffed 104
Admissions 3,636
Beds per 1,000 Population 2.0
Admissions per 1,000 Population 70.7
Average Inpatient Occupancy Rate 40.8
Nursing Homes (2014)
Total Number Certified-Medicare Certified-Medicaid
Nursing Homes
Licensed/Approved Beds
3 3 3
371 371 371
34.9
Average Occupancy Rate 86.1
Average Length of Stay (Number of Days) 201.6
$210
Total Licensed/Approved Beds per 1,000 Population Age 65 and Older
Average Semi-Private Daily Room Rate
Drug and Alcohol Treatment
Admissions to Client Primary Diagnosis
Drug Abuse Alcohol Abuse Other*
Percent Admitted
Only Once During 7/13-6/14
385 189 113 15 83.9
* Includes family members receiving counseling.
All Licensed Facilities Inpatient Non-Hospital
Inpatient Hospital Partial Hospitalization Outpatient3
1
0 0 2
Note: Each licensed facility may provide more than one type of service.
State-Supported Facilities
Types of Service Provided
Number of
Clients Admitted
317
Admission by County of Residence (7/13-6/14)
Treatment Facilities (as of 6/14)
Correctional Institution 0
General Note: Crude rates based on less than 10 events are considered statistically unreliable and are not displayed (ND), unless otherwise noted.
Services Funding
Other
0
Non-Profit
1
For Profit
0
State
1
Other
0
Ambulatory Surgery Centers (7/13-6/14)
Employees
Part Time Employees 15
Full Time Employees 10
Contracted Employees 6
Payroll Employees 19 Staff with Clinical Privileges 4
Total Surgical Visits per Employee 201.8
Total Facilities 1 Total Surgical Visits 5,045
Percent of Surgical Visits, Age 65+ 38.9
Total Operating Rooms 3 Total Surgical Visits per Operating Room 1,681.7
Facilities Surgical Visits
Staff Licensed as M.D. 4
Total Employees per Operating Room 8.3
Average Semi-Private Daily Room Rate $860
Total Employees 25

PAGE 4Wayne County
Pennsylvania Health Care Workforce (2013-2014)
Notes: Only health care employees renewing their license in 2013-2014 were surveyed.The "Estimated Number" and "Percent of Workforce Intending to Remain in Profession for 6 or More Years" used to compute each "% Change from Previous Survey Year" are adjusted based on the response rates for the previous and current survey results. The survey results are available every two years. Numbers and percentages pertain to county of employment.Percentages based on less than six responses are considered statistically unreliable and are not displayed (ND).Registered Nurses and Licensed Practical Nurses are not comparable to previous survey period, so some data is not available (DNA).
Licensed Practical Nurses (2014) 111 DNA 80.3% DNA
Physicians (2014) 55
Dentists (2013) 21
Registered Nurses (2012/2013) 397 DNA 80.9% DNA
-7.5% 68.9% 6.6%
-13.9% 83.3% 7.1%
Estimated Number
Percent Changefrom Previous
Survey
Difference in Percent from
Previous Survey
Percent of WorkforceIntending to Remain in
Profession for 6 or More Years
Injury Hospitalizations (2014)
Injury Hospitalizations and Median Charges by Age and Sex
Injury Hospitalizations and Median Charges by Type of Payor
Injury Hospitalizations and Median Charges by Mechanism/Intent and Sex
0-4 5-14 15-24 25-44 45-64 65 and Older
Male - Total
Male - Median Charges
Female - Total
Female - Median Charges
UnintentionalMotor Vehicle All Poisonings Unintentional Falls
Unintentional Fire/Flame or Hot Object/Substance All Firearm All Other Injuries
Male - Total
Male - Median Charges
Female - Total
Female - Median Charges
Medicare Medicaid Other Government Commercial / Private Blue Cross Uninsured
Total Hospitalizations
Median Charges
All Ages
242 1 5 11 45 76 104
$29,906.53 ND ND $32,946.11 $27,602.60 $31,156.96 $33,254.45
274 3 4 12 25 51 179
$29,477.28 ND ND $14,270.53 $23,259.03 $35,998.04 $30,114.59
Note: Median charges not displayed (ND) for occurrences less than 10.
6321 53 46968
ND $30,683.36 $22,942.11 $24,129.23 $37,430.96 ND
55
106
19
23
27
15
171
90
2
7
0
1
$33,341.89
$26,983.38
$49,240.53
$43,377.08
$15,893.45
$15,431.30
$31,866.89
$42,039.93
ND
ND
-
ND
Disclaimer: Injury data used in this report were provided to the Pennsylvania Department of Health by the Pennsylvania Health Care Cost Containment Council. The Pennsylvania Health Care Cost Containment Council specifically disclaims responsibility for any interpretations or conclusions. Contents may be republished or reproduced whole or in part, with attribution.

WestmorelandCountyHealth Profile 2016
Demographic Data (2014)
% Population Change 2010 to 2014 -1.6
Median Age of the Population (2010-2014) 45.8
% Population Aged 65 and Over 20.7
Population per Square Mile 349.7
% Population with Income Below Poverty Level (2010-2014) 10.3
Per Capita Personal Income $44,425
% Labor Force Unemployed - Annual Average 5.8
% Population Eligible for Medical Assistance 15.3
Estimated Population by Age and Sex (2014)
Age Total Male Female Age Total Male Female
All Ages 359,320
Under 5 16,528
5-14 38,198
15-24 41,439
25-34 36,670
175,361
8,546
19,437
21,509
18,702
183,959
7,982
18,761
19,930
17,968
35-44 40,282
45-54 54,246
55-64 57,718
65-74 39,797
75+ 34,442
20,144
26,664
28,331
18,654
13,374
20,138
27,582
29,387
21,143
21,068
Natality and Reported Pregnancies^ (2014 Residents)
Crude Birth Rate8.6
Average Annual General53.4
% Low Birth Weight 8.0
% Prenatal Care in 1st Trimester 83.8
% Births to Mothers Under 18 1.3
7.8
84.3
1.3
13.8
84.2
ND
Per 1,000 Population
Fertility Rate* (2012-2014)
All Races White Black
All Ages 3,552
Under 15 3
15-17 49
3,094
2
39
23
0
0
435
1
10
Age of WomanReported
PregnanciesLive
BirthsFetal
DeathsInduced
Abortions
Outcome
Age of WomanReported
PregnanciesLive
BirthsFetal
DeathsInduced
Abortions
Outcome
18-19 142
20-29 1,825
30 and Over 1,523
109
1,560
1,374
0
14
9
33
251
140
All Ages* 53.3
Under 15** ND
15-17 6.4
61.2
ND
8.0
Age of Woman Birth Rate Reported Pregnancy Rate Age of Woman Birth Rate Reported Pregnancy Rate
18-19 27.4
20-29 84.2
30 and Over** 32.5
35.7
98.5
36.0
^Live births, fetal deaths of 16+ weeks gestation, and induced abortions performed in-state. Notes: All ages includes any unknown ages. All rates per 1,000.*All Ages includes female population ages 15-44. ** Under 15 includes female population ages 10-14; 30 and Over includes female population ages 30-49.
Hispanic
ND
65.7
ND
(of any race)
ND
88.9
ND
Asian / Pacific
General Notes: Crude and age-adjusted rates based on less than 10 events are considered statistically unreliable and are not displayed (ND), unless otherwise noted. Starting in 2013, race of resident was derived from multiple race selections. A person is Multi-Race if they identify as more than one race. Prior to 2013, race of resident was derived from a single race designation.
Morbidity (2012-2014 Residents)
Reported Incidence and Average Annual Rate (per 100,000) for Selected Notifiable Diseases (2012-2014)
HIV 24 2.2
Syphilis 4 ND
Tuberculosis < 5 ND
Total Rate
Chlamydia 2,187 201.5
Giardiasis 60 5.5
Gonorrhea 506 46.6
Hepatitis: Type A < 5 ND
Total Rate
Lyme Disease 502 46.3
Salmonellosis 118 10.9
Total Rate
Campylobacteriosis 63 5.8 Hep. B* Acute < 5 ND
Shigellosis < 5 ND
*Hepatitis: Type B **Meningococcal Disease
Meningococcal** < 5 ND
Pertussis 120 11.1
Hep. B* Chronic 39 3.6
Chickenpox 120 11.1
Islander
Note: Communicable diseases with demographic counts of 1 to 4 are displayed as "< 5" to avoid potential identification of cases within certain geographic areas.
Multi - Race
ND
63.4
ND

Westmoreland County PAGE 2
Mortality (2014 Residents)
Selected Major Causes of Death, Number and Average Annual Age-Adjusted Death Rate* (2012-2014)
Number of Resident Deaths 4,501
Crude Death Rate per 1,000 12.5
Age-Adjusted Death Rate per 1,000 7.8
Number of Infant Deaths (< 1 Year of Age) 21 18 1 0
AllRaces BlackWhite
Hispanic(any race)
Infant Mortality Rate per 1,000 Live Births 6.8 6.3 ND ND
Average Annual Infant Mortality Rate (2012-2014) 4.8 3.9 ND ND
Cause Total Rate
Diseases of Heart 3,212
Cancer 2,934
Stroke 663
C.L.R.D.** 683
Accidents 748
176.2
172.2
36.1
37.9
59.8
Cause Total Rate
Influenza/Pneumonia 281
Diabetes Mellitus 384
Septicemia 230
Nephritis/Nephrosis 280
Alzheimer's Disease 292
15.1
22.1
13.2
15.1
14.9
* Per 100,000 2000 U.S. standardmillion population. Age-adjusted rates
** Chronic Lower Respiratory Disease
Selected Leading Causes of Death, Number by Age Group (2014)
Under 5 Years of Age 5-24 Years of Age 25-44 Years of Age 45-64 Years of Age 65 Years and Older
Perinatal Conditions 15
Accidents 2
Birth Defects 2
Accidents 15
Suicide 10
Cancer 3
Accidents 59
Cancer 16
Suicide 15
Diseases of Heart 13
Liver Dis./Cirrhosis 7
Cancer 227
Diseases of Heart 137
Accidents 66
Suicide 28
Diseases of Heart 950
Cancer 766
C.L.R.D.** 221
Stroke 191
Diabetes Mellitus 109
TOTAL 26 TOTAL 33 TOTAL 144 TOTAL 715 TOTAL 3,583
Note: Total includes all other causes.
Asian/PI*
0
ND
*Asian/Pacific Islander ^ NA = Multi-Race data not available before 2013.
are only comparable if the samestandard million population was usedin the calculation.
Invasive Cancer Incidence and Average Annual Age-Adjusted Rates* for Major Sites by Sex
All Sites 3,644 502.9
Prostate 743 94.3
Lung and Bronchus 616 82.7
Colon and Rectum 361 50.2
Male FemaleTotal Rate Total Rate
Female Breast 1,078 130.8
3,866 465.0
537 59.6
353 37.6
*Per 100,000 2000 U.S. standard million population. Age-adjusted rates are only comparable if the same standard million population was used in the calculation.
- -
- -
Male FemaleTotal Rate Total Rate
Non-Hodgkin Lymphoma 185 25.7
Melanoma of the Skin 137 19.5
168 18.8
258 29.9
84 12.9
Corpus and Uterus, NOS - -
Urinary Bladder 317
Kidney and Renal Pelvis 168 23.6
44.2 127
106
13.8
13.2
Notes: All in situ cases, except for urinary bladder, are excluded. Age-adjusted rates based on less than 20 events are statistically unreliable and are not displayed (ND).
Cancer Incidence (2011-2013 Residents)
Adult Behavioral Health Risk Factors (2012-2014)[Includes: Westmoreland County Only]
General Notes: Crude and age-adjusted rates based on less than 10 events are considered statistically unreliable and are not displayed (ND), unless otherwise noted. Starting in 2013, race of resident was derived from multiple race selections. A person is Multi-Race if they identify as more than one race. Prior to 2013, race of resident was derived from a single race designation.
Percent (CI)Risk Factors
Fair or poor general health:
Obese:
Overweight (includes obese):
No health insurance (ages 18-64):
Visited a doctor in the past 2 yearsfor a routine check-up:
Percent (CI)Risk Factors
Ever told they have diabetes: Currently has asthma:
Current smoker:
Ever tested for HIV (ages 18-64):
Needed to see a doctor but couldnot due to cost in the past year:
17
31
(14 - 19)
(28 - 35)
68 (64 - 72)
11 (9 - 15)
84 (81 - 86)
13 8(11 - 16) (7 - 11)
20 (17 - 24)
26 (22 - 30)
10 (8 - 13)
Notes: Data are based on 2012-2014 annual sample surveys of Pennsylvania adults. CI= 95% Confidence Interval.
Additional state or county/regional data are available at www.statistics.health.pa.gov.
^In situ, benign, and uncertain neoplasms
Multi- Race
1
ND
NAND ^

Westmoreland County PAGE 3
Hospitals (7/13-6/14)
Total General Acute Care
Psychiatric Rehabilitation
5 3 1 0
General Hospitals
Beds Set Up and Staffed 430
Admissions 25,060
Beds per 1,000 Population 1.2
Admissions per 1,000 Population 69.7
Average Inpatient Occupancy Rate 66.7
Nursing Homes (2014)
Total Number Certified-Medicare Certified-Medicaid
Nursing Homes
Licensed/Approved Beds
19 19 19
2,417 2,417 2,417
32.6
Average Occupancy Rate 91.6
Average Length of Stay (Number of Days) 108.2
$267
Total Licensed/Approved Beds per 1,000 Population Age 65 and Older
Average Semi-Private Daily Room Rate
Drug and Alcohol Treatment
Admissions to Client Primary Diagnosis
Drug Abuse Alcohol Abuse Other*
Percent Admitted
Only Once During 7/13-6/14
981 465 154 8 60.0
* Includes family members receiving counseling.
All Licensed Facilities Inpatient Non-Hospital
Inpatient Hospital Partial Hospitalization Outpatient16
2
0 6 14
Note: Each licensed facility may provide more than one type of service.
State-Supported Facilities
Types of Service Provided
Number of
Clients Admitted
627
Admission by County of Residence (7/13-6/14)
Treatment Facilities (as of 6/14)
Correctional Institution 0
General Note: Crude rates based on less than 10 events are considered statistically unreliable and are not displayed (ND), unless otherwise noted.
Services Funding
Other
1
Non-Profit
3
For Profit
1
State
1
Other
0
Ambulatory Surgery Centers (7/13-6/14)
Employees
Part Time Employees 94
Full Time Employees 132
Contracted Employees 33
Payroll Employees 193 Staff with Clinical Privileges 146
Total Surgical Visits per Employee 93.1
Total Facilities 8 Total Surgical Visits 21,046
Percent of Surgical Visits, Age 65+ 46.1
Total Operating Rooms 25 Total Surgical Visits per Operating Room 841.8
Facilities Surgical Visits
Staff Licensed as M.D. 108
Total Employees per Operating Room 9.0
Average Semi-Private Daily Room Rate $900
Total Employees 226

PAGE 4Westmoreland County
Pennsylvania Health Care Workforce (2013-2014)
Notes: Only health care employees renewing their license in 2013-2014 were surveyed.The "Estimated Number" and "Percent of Workforce Intending to Remain in Profession for 6 or More Years" used to compute each "% Change from Previous Survey Year" are adjusted based on the response rates for the previous and current survey results. The survey results are available every two years. Numbers and percentages pertain to county of employment.Percentages based on less than six responses are considered statistically unreliable and are not displayed (ND).Registered Nurses and Licensed Practical Nurses are not comparable to previous survey period, so some data is not available (DNA).
Licensed Practical Nurses (2014) 720 DNA 76.9% DNA
Physicians (2014) 570
Dentists (2013) 202
Registered Nurses (2012/2013) 3,251 DNA 79.5% DNA
6.0% 69.5% -6.4%
-3.3% 75.6% 0.0%
Estimated Number
Percent Changefrom Previous
Survey
Difference in Percent from
Previous Survey
Percent of WorkforceIntending to Remain in
Profession for 6 or More Years
Injury Hospitalizations (2014)
Injury Hospitalizations and Median Charges by Age and Sex
Injury Hospitalizations and Median Charges by Type of Payor
Injury Hospitalizations and Median Charges by Mechanism/Intent and Sex
0-4 5-14 15-24 25-44 45-64 65 and Older
Male - Total
Male - Median Charges
Female - Total
Female - Median Charges
UnintentionalMotor Vehicle All Poisonings Unintentional Falls
Unintentional Fire/Flame or Hot Object/Substance All Firearm All Other Injuries
Male - Total
Male - Median Charges
Female - Total
Female - Median Charges
Medicare Medicaid Other Government Commercial / Private Blue Cross Uninsured
Total Hospitalizations
Median Charges
All Ages
2,093 12 23 180 364 636 878
$28,290.00 $15,583.38 $29,768.78 $26,071.88 $25,973.00 $31,102.00 $28,507.35
2,398 6 27 122 269 514 1,460
$23,333.06 ND $11,220.75 $10,778.50 $14,438.34 $22,590.63 $25,660.23
Note: Median charges not displayed (ND) for occurrences less than 10.
1232,648 512 45371827
$23,882.87 $25,695.47 $22,214.25 $23,429.00 $31,141.88 $23,738.00
598
783
104
206
303
196
1,375
854
15
36
3
18
$21,013.13
$26,740.05
$51,552.88
$50,438.50
$10,885.31
$12,218.38
$26,553.78
$29,696.63
$21,222.25
$24,666.81
ND
$94,736.25
Disclaimer: Injury data used in this report were provided to the Pennsylvania Department of Health by the Pennsylvania Health Care Cost Containment Council. The Pennsylvania Health Care Cost Containment Council specifically disclaims responsibility for any interpretations or conclusions. Contents may be republished or reproduced whole or in part, with attribution.

Wyoming CountyHealth Profile 2016
Demographic Data (2014)
% Population Change 2010 to 2014 -0.5
Median Age of the Population (2010-2014) 42.7
% Population Aged 65 and Over 18.4
Population per Square Mile 70.8
% Population with Income Below Poverty Level (2010-2014) 11.3
Per Capita Personal Income $37,270
% Labor Force Unemployed - Annual Average 6.7
% Population Eligible for Medical Assistance 15.5
Estimated Population by Age and Sex (2014)
Age Total Male Female Age Total Male Female
All Ages 28,131
Under 5 1,416
5-14 3,264
15-24 3,570
25-34 3,094
14,176
793
1,683
1,893
1,579
13,955
623
1,581
1,677
1,515
35-44 3,272
45-54 4,034
55-64 4,302
65-74 3,187
75+ 1,992
1,626
2,007
2,127
1,639
829
1,646
2,027
2,175
1,548
1,163
Natality and Reported Pregnancies^ (2014 Residents)
Crude Birth Rate9.9
Average Annual General56.9
% Low Birth Weight 6.1
% Prenatal Care in 1st Trimester 74.4
% Births to Mothers Under 18 ND
6.0
74.9
ND
ND
ND
ND
Per 1,000 Population
Fertility Rate* (2012-2014)
All Races White Black
All Ages 293
Under 15 0
15-17 5
278
0
5
1
0
0
14
0
0
Age of WomanReported
PregnanciesLive
BirthsFetal
DeathsInduced
Abortions
Outcome
Age of WomanReported
PregnanciesLive
BirthsFetal
DeathsInduced
Abortions
Outcome
18-19 12
20-29 172
30 and Over 104
10
164
99
1
0
0
1
8
5
All Ages* 57.5
Under 15** ND
15-17 ND
60.6
ND
ND
Age of Woman Birth Rate Reported Pregnancy Rate Age of Woman Birth Rate Reported Pregnancy Rate
18-19 27.8
20-29 101.3
30 and Over** 29.6
33.3
106.2
31.1
^Live births, fetal deaths of 16+ weeks gestation, and induced abortions performed in-state. Notes: All ages includes any unknown ages. All rates per 1,000.*All Ages includes female population ages 15-44. ** Under 15 includes female population ages 10-14; 30 and Over includes female population ages 30-49.
Hispanic
ND
ND
ND
(of any race)
ND
ND
ND
Asian / Pacific
General Notes: Crude and age-adjusted rates based on less than 10 events are considered statistically unreliable and are not displayed (ND), unless otherwise noted. Starting in 2013, race of resident was derived from multiple race selections. A person is Multi-Race if they identify as more than one race. Prior to 2013, race of resident was derived from a single race designation.
Morbidity (2012-2014 Residents)
Reported Incidence and Average Annual Rate (per 100,000) for Selected Notifiable Diseases (2012-2014)
HIV 1 ND
Syphilis 0 ND
Tuberculosis 0 ND
Total Rate
Chlamydia 84 99.7
Giardiasis 6 ND
Gonorrhea 11 13.1
Hepatitis: Type A < 5 ND
Total Rate
Lyme Disease 140 166.2
Salmonellosis 6 ND
Total Rate
Campylobacteriosis 23 27.3 Hep. B* Acute 0 ND
Shigellosis 0 ND
*Hepatitis: Type B **Meningococcal Disease
Meningococcal** 0 ND
Pertussis 8 ND
Hep. B* Chronic < 5 ND
Chickenpox 6 ND
Islander
Note: Communicable diseases with demographic counts of 1 to 4 are displayed as "< 5" to avoid potential identification of cases within certain geographic areas.
Multi - Race
ND
ND
ND

Wyoming County PAGE 2
Mortality (2014 Residents)
Selected Major Causes of Death, Number and Average Annual Age-Adjusted Death Rate* (2012-2014)
Number of Resident Deaths 294
Crude Death Rate per 1,000 10.5
Age-Adjusted Death Rate per 1,000 8.0
Number of Infant Deaths (< 1 Year of Age) 0 0 0 0
AllRaces BlackWhite
Hispanic(any race)
Infant Mortality Rate per 1,000 Live Births ND ND ND ND
Average Annual Infant Mortality Rate (2012-2014) ND ND ND ND
Cause Total Rate
Diseases of Heart 251
Cancer 219
Stroke 39
C.L.R.D.** 35
Accidents 59
223.8
189.6
36.2
30.3
73.6
Cause Total Rate
Influenza/Pneumonia 10
Diabetes Mellitus 37
Septicemia 19
Nephritis/Nephrosis 15
Alzheimer's Disease 15
9.1
30.6
17.4
13.6
13.9
* Per 100,000 2000 U.S. standardmillion population. Age-adjusted rates
** Chronic Lower Respiratory Disease
Selected Leading Causes of Death, Number by Age Group (2014)
Under 5 Years of Age 5-24 Years of Age 25-44 Years of Age 45-64 Years of Age 65 Years and Older
Accidents 2 Accidents 6
Suicide 2
Cancer 21
Diseases of Heart 10
Accidents 4
Septicemia 3
Suicide 3
Diseases of Heart 73
Cancer 48
Stroke 13
C.L.R.D.** 10
Accidents 9
TOTAL 2 TOTAL 0 TOTAL 12 TOTAL 53 TOTAL 227
Note: Total includes all other causes.
Asian/PI*
0
ND
*Asian/Pacific Islander ^ NA = Multi-Race data not available before 2013.
are only comparable if the samestandard million population was usedin the calculation.
Invasive Cancer Incidence and Average Annual Age-Adjusted Rates* for Major Sites by Sex
All Sites 283 520.1
Prostate 74 124.8
Lung and Bronchus 44 83.1
Colon and Rectum 27 49.2
Male FemaleTotal Rate Total Rate
Female Breast 81 138.8
297 523.8
42 70.1
15 ND
*Per 100,000 2000 U.S. standard million population. Age-adjusted rates are only comparable if the same standard million population was used in the calculation.
- -
- -
Male FemaleTotal Rate Total Rate
Non-Hodgkin Lymphoma 10 ND
Melanoma of the Skin 16 ND
17 ND
25 41.3
12 ND
Corpus and Uterus, NOS - -
Urinary Bladder 18
Kidney and Renal Pelvis 13 ND
ND 5
6
ND
ND
Notes: All in situ cases, except for urinary bladder, are excluded. Age-adjusted rates based on less than 20 events are statistically unreliable and are not displayed (ND).
Cancer Incidence (2011-2013 Residents)
Adult Behavioral Health Risk Factors (2012-2014)[Includes: Lackawanna, Luzerne, and Wyoming Counties]
General Notes: Crude and age-adjusted rates based on less than 10 events are considered statistically unreliable and are not displayed (ND), unless otherwise noted. Starting in 2013, race of resident was derived from multiple race selections. A person is Multi-Race if they identify as more than one race. Prior to 2013, race of resident was derived from a single race designation.
Percent (CI)Risk Factors
Fair or poor general health:
Obese:
Overweight (includes obese):
No health insurance (ages 18-64):
Visited a doctor in the past 2 yearsfor a routine check-up:
Percent (CI)Risk Factors
Ever told they have diabetes: Currently has asthma:
Current smoker:
Ever tested for HIV (ages 18-64):
Needed to see a doctor but couldnot due to cost in the past year:
18
31
(16 - 20)
(28 - 34)
67 (63 - 70)
16 (13 - 20)
86 (83 - 89)
11 10(9 - 13) (8 - 12)
24 (21 - 27)
35 (31 - 39)
14 (11 - 17)
Notes: Data are based on 2012-2014 annual sample surveys of Pennsylvania adults. CI= 95% Confidence Interval.
Additional state or county/regional data are available at www.statistics.health.pa.gov.
^In situ, benign, and uncertain neoplasms
Multi- Race
0
ND
NAND ^

Wyoming County PAGE 3
Hospitals (7/13-6/14)
Total General Acute Care
Psychiatric Rehabilitation
1 1 0 0
General Hospitals
Beds Set Up and Staffed 48
Admissions 918
Beds per 1,000 Population 1.7
Admissions per 1,000 Population 32.6
Average Inpatient Occupancy Rate 17.0
Nursing Homes (2014)
Total Number Certified-Medicare Certified-Medicaid
Nursing Homes
Licensed/Approved Beds
1 1 1
124 124 124
23.9
Average Occupancy Rate 90.9
Average Length of Stay (Number of Days) 207.8
$288
Total Licensed/Approved Beds per 1,000 Population Age 65 and Older
Average Semi-Private Daily Room Rate
Drug and Alcohol Treatment
Admissions to Client Primary Diagnosis
Drug Abuse Alcohol Abuse Other*
Percent Admitted
Only Once During 7/13-6/14
196 99 45 7 74.8
* Includes family members receiving counseling.
All Licensed Facilities Inpatient Non-Hospital
Inpatient Hospital Partial Hospitalization Outpatient1
0
0 1 1
Note: Each licensed facility may provide more than one type of service.
State-Supported Facilities
Types of Service Provided
Number of
Clients Admitted
151
Admission by County of Residence (7/13-6/14)
Treatment Facilities (as of 6/14)
Correctional Institution 0
General Note: Crude rates based on less than 10 events are considered statistically unreliable and are not displayed (ND), unless otherwise noted.
Services Funding
Other
0
Non-Profit
0
For Profit
1
State
0
Other
0
Ambulatory Surgery Centers (7/13-6/14)
Employees
Part Time Employees -
Full Time Employees -
Contracted Employees -
Payroll Employees - Staff with Clinical Privileges -
Total Surgical Visits per Employee -
Total Facilities 0 Total Surgical Visits -
Percent of Surgical Visits, Age 65+ -
Total Operating Rooms - Total Surgical Visits per Operating Room -
Facilities Surgical Visits
Staff Licensed as M.D. -
Total Employees per Operating Room -
Average Semi-Private Daily Room Rate $1,413
Total Employees -

PAGE 4Wyoming County
Pennsylvania Health Care Workforce (2013-2014)
Notes: Only health care employees renewing their license in 2013-2014 were surveyed.The "Estimated Number" and "Percent of Workforce Intending to Remain in Profession for 6 or More Years" used to compute each "% Change from Previous Survey Year" are adjusted based on the response rates for the previous and current survey results. The survey results are available every two years. Numbers and percentages pertain to county of employment.Percentages based on less than six responses are considered statistically unreliable and are not displayed (ND).Registered Nurses and Licensed Practical Nurses are not comparable to previous survey period, so some data is not available (DNA).
Licensed Practical Nurses (2014) 55 DNA 85.0% DNA
Physicians (2014) 34
Dentists (2013) 10
Registered Nurses (2012/2013) 149 DNA 69.1% DNA
-4.7% 60.7% -11.2%
14.8% 88.9% 1.4%
Estimated Number
Percent Changefrom Previous
Survey
Difference in Percent from
Previous Survey
Percent of WorkforceIntending to Remain in
Profession for 6 or More Years
Injury Hospitalizations (2014)
Injury Hospitalizations and Median Charges by Age and Sex
Injury Hospitalizations and Median Charges by Type of Payor
Injury Hospitalizations and Median Charges by Mechanism/Intent and Sex
0-4 5-14 15-24 25-44 45-64 65 and Older
Male - Total
Male - Median Charges
Female - Total
Female - Median Charges
UnintentionalMotor Vehicle All Poisonings Unintentional Falls
Unintentional Fire/Flame or Hot Object/Substance All Firearm All Other Injuries
Male - Total
Male - Median Charges
Female - Total
Female - Median Charges
Medicare Medicaid Other Government Commercial / Private Blue Cross Uninsured
Total Hospitalizations
Median Charges
All Ages
153 3 1 10 18 43 78
$47,113.16 ND ND $28,034.13 $58,309.69 $78,711.54 $36,449.65
161 1 0 9 14 33 104
$39,672.70 ND - ND $52,898.62 $52,222.21 $35,073.09
Note: Median charges not displayed (ND) for occurrences less than 10.
4180 34 39605
ND $36,449.65 $46,329.78 $58,996.90 $52,532.98 ND
51
67
12
11
9
9
87
61
0
5
2
0
$38,799.90
$48,539.04
$47,411.30
$59,457.24
ND
ND
$47,111.40
$38,900.36
-
ND
ND
-
Disclaimer: Injury data used in this report were provided to the Pennsylvania Department of Health by the Pennsylvania Health Care Cost Containment Council. The Pennsylvania Health Care Cost Containment Council specifically disclaims responsibility for any interpretations or conclusions. Contents may be republished or reproduced whole or in part, with attribution.

York CountyHealth Profile 2016
Demographic Data (2014)
% Population Change 2010 to 2014 1.3
Median Age of the Population (2010-2014) 40.6
% Population Aged 65 and Over 15.9
Population per Square Mile 487.5
% Population with Income Below Poverty Level (2010-2014) 10.3
Per Capita Personal Income $43,037
% Labor Force Unemployed - Annual Average 5.4
% Population Eligible for Medical Assistance 14.7
Estimated Population by Age and Sex (2014)
Age Total Male Female Age Total Male Female
All Ages 440,755
Under 5 25,175
5-14 56,319
15-24 54,388
25-34 53,050
218,015
12,995
29,158
28,089
26,529
222,740
12,180
27,161
26,299
26,521
35-44 55,268
45-54 65,898
55-64 60,515
65-74 39,991
75+ 30,151
27,362
32,781
29,737
19,060
12,304
27,906
33,117
30,778
20,931
17,847
Estimated Population by Race and Hispanic Origin (2014)
White 395,294 Black 28,466 Other Races 16,995 Hispanic (any race) 28,841
Natality and Reported Pregnancies^ (2014 Residents)
Crude Birth Rate11.1
Average Annual General59.4
% Low Birth Weight 8.0
% Prenatal Care in 1st Trimester 75.3
% Births to Mothers Under 18 1.6
6.8
77.4
1.1
16.2
64.4
ND
Per 1,000 Population
Fertility Rate* (2012-2014)
All Races White Black
All Ages 5,570
Under 15 10
15-17 91
4,886
4
72
33
0
3
651
6
16
Age of WomanReported
PregnanciesLive
BirthsFetal
DeathsInduced
Abortions
Outcome
Age of WomanReported
PregnanciesLive
BirthsFetal
DeathsInduced
Abortions
Outcome
18-19 283
20-29 3,023
30 and Over 2,148
232
2,614
1,949
2
16
12
49
393
187
All Ages* 60.5
Under 15** ND
15-17 8.8
69.0
0.7
11.1
Age of Woman Birth Rate Reported Pregnancy Rate Age of Woman Birth Rate Reported Pregnancy Rate
18-19 43.7
20-29 101.5
30 and Over** 34.1
53.3
117.4
37.6
^Live births, fetal deaths of 16+ weeks gestation, and induced abortions performed in-state. Notes: All ages includes any unknown ages. All rates per 1,000.*All Ages includes female population ages 15-44. ** Under 15 includes female population ages 10-14; 30 and Over includes female population ages 30-49.
Hispanic
9.9
67.5
4.2
(of any race)
ND
80.0
ND
Asian / Pacific
General Notes: Crude and age-adjusted rates based on less than 10 events are considered statistically unreliable and are not displayed (ND), unless otherwise noted. Starting in 2013, race of resident was derived from multiple race selections. A person is Multi-Race if they identify as more than one race. Prior to 2013, race of resident was derived from a single race designation.
Morbidity (2012-2014 Residents)
Reported Incidence and Average Annual Rate (per 100,000) for Selected Notifiable Diseases (2012-2014)
HIV 73 5.5
Syphilis 12 0.9
Tuberculosis 14 1.1
Total Rate
Chlamydia 4,438 336.8
Giardiasis 34 2.6
Gonorrhea 1,235 93.7
Hepatitis: Type A < 5 ND
Total Rate
Lyme Disease 859 65.2
Salmonellosis 135 10.2
Total Rate
Campylobacteriosis 140 10.6 Hep. B* Acute 7 ND
Shigellosis < 5 ND
*Hepatitis: Type B **Meningococcal Disease
Meningococcal** < 5 ND
Pertussis 31 2.4
Hep. B* Chronic 123 9.3
Chickenpox 39 3.0
Islander
Note: Communicable diseases with demographic counts of 1 to 4 are displayed as "< 5" to avoid potential identification of cases within certain geographic areas.
Multi - Race
12.1
68.4
5.7

York County PAGE 2
Mortality (2014 Residents)
Selected Major Causes of Death, Number and Average Annual Age-Adjusted Death Rate* (2012-2014)
Number of Resident Deaths 3,978
Crude Death Rate per 1,000 9.0
Age-Adjusted Death Rate per 1,000 7.3
Number of Infant Deaths (< 1 Year of Age) 29 16 5 7
AllRaces BlackWhite
Hispanic(any race)
Infant Mortality Rate per 1,000 Live Births 5.9 4.2 ND ND
Average Annual Infant Mortality Rate (2012-2014) 5.2 3.6 14.8 10.9
Cause Total Rate
Diseases of Heart 2,548
Cancer 2,600
Stroke 574
C.L.R.D.** 521
Accidents 627
154.5
160.2
35.3
32.5
44.5
Cause Total Rate
Influenza/Pneumonia 209
Diabetes Mellitus 381
Septicemia 162
Nephritis/Nephrosis 235
Alzheimer's Disease 382
12.7
23.6
9.9
14.4
23.2
* Per 100,000 2000 U.S. standardmillion population. Age-adjusted rates
** Chronic Lower Respiratory Disease
Selected Leading Causes of Death, Number by Age Group (2014)
Under 5 Years of Age 5-24 Years of Age 25-44 Years of Age 45-64 Years of Age 65 Years and Older
Perinatal Conditions 17
Birth Defects 3
Accidents 34
Suicide 8
Assault (Homicide) 6
Cancer 2
Accidents 69
Suicide 24
Cancer 18
Diseases of Heart 11
Diabetes Mellitus 6
Cancer 217
Diseases of Heart 165
Accidents 62
Suicide 38
Stroke 24
Diseases of Heart 690
Cancer 629
Stroke 178
C.L.R.D.** 149
Alzheimer's Disease 137
TOTAL 32 TOTAL 60 TOTAL 158 TOTAL 718 TOTAL 3,010
Note: Total includes all other causes.
Asian/PI*
0
ND
*Asian/Pacific Islander ^ NA = Multi-Race data not available before 2013.
are only comparable if the samestandard million population was usedin the calculation.
Invasive Cancer Incidence and Average Annual Age-Adjusted Rates* for Major Sites by Sex
All Sites 3,852 525.2
Prostate 796 102.4
Lung and Bronchus 561 76.3
Colon and Rectum 362 49.0
Male FemaleTotal Rate Total Rate
Female Breast 1,071 130.2
3,807 460.8
492 56.8
361 42.5
*Per 100,000 2000 U.S. standard million population. Age-adjusted rates are only comparable if the same standard million population was used in the calculation.
- -
- -
Male FemaleTotal Rate Total Rate
Non-Hodgkin Lymphoma 175 24.9
Melanoma of the Skin 263 36.5
145 17.1
284 32.8
212 27.5
Corpus and Uterus, NOS - -
Urinary Bladder 301
Kidney and Renal Pelvis 165 21.6
42.7 96
99
11.3
11.9
Notes: All in situ cases, except for urinary bladder, are excluded. Age-adjusted rates based on less than 20 events are statistically unreliable and are not displayed (ND).
Cancer Incidence (2011-2013 Residents)
Adult Behavioral Health Risk Factors (2012-2014)[Includes: York County Only]
General Notes: Crude and age-adjusted rates based on less than 10 events are considered statistically unreliable and are not displayed (ND), unless otherwise noted. Starting in 2013, race of resident was derived from multiple race selections. A person is Multi-Race if they identify as more than one race. Prior to 2013, race of resident was derived from a single race designation.
Percent (CI)Risk Factors
Fair or poor general health:
Obese:
Overweight (includes obese):
No health insurance (ages 18-64):
Visited a doctor in the past 2 yearsfor a routine check-up:
Percent (CI)Risk Factors
Ever told they have diabetes: Currently has asthma:
Current smoker:
Ever tested for HIV (ages 18-64):
Needed to see a doctor but couldnot due to cost in the past year:
15
35
(12 - 17)
(31 - 39)
67 (63 - 71)
13 (10 - 16)
82 (79 - 85)
12 12(10 - 14) (9 - 14)
18 (16 - 21)
32 (28 - 37)
11 (9 - 13)
Notes: Data are based on 2012-2014 annual sample surveys of Pennsylvania adults. CI= 95% Confidence Interval.
Additional state or county/regional data are available at www.statistics.health.pa.gov.
^In situ, benign, and uncertain neoplasms
Multi- Race
5
ND
NAND ^

York County PAGE 3
Hospitals (7/13-6/14)
Total General Acute Care
Psychiatric Rehabilitation
7 3 0 2
General Hospitals
Beds Set Up and Staffed 749
Admissions 38,930
Beds per 1,000 Population 1.7
Admissions per 1,000 Population 88.3
Average Inpatient Occupancy Rate 68.8
Nursing Homes (2014)
Total Number Certified-Medicare Certified-Medicaid
Nursing Homes
Licensed/Approved Beds
16 15 15
2,211 2,181 2,181
31.5
Average Occupancy Rate 93.3
Average Length of Stay (Number of Days) 178.7
$306
Total Licensed/Approved Beds per 1,000 Population Age 65 and Older
Average Semi-Private Daily Room Rate
Drug and Alcohol Treatment
Admissions to Client Primary Diagnosis
Drug Abuse Alcohol Abuse Other*
Percent Admitted
Only Once During 7/13-6/14
1,455 674 338 32 72.2
* Includes family members receiving counseling.
All Licensed Facilities Inpatient Non-Hospital
Inpatient Hospital Partial Hospitalization Outpatient19
4
0 3 16
Note: Each licensed facility may provide more than one type of service.
State-Supported Facilities
Types of Service Provided
Number of
Clients Admitted
1,044
Admission by County of Residence (7/13-6/14)
Treatment Facilities (as of 6/14)
Correctional Institution 0
General Note: Crude rates based on less than 10 events are considered statistically unreliable and are not displayed (ND), unless otherwise noted.
Services Funding
Other
2
Non-Profit
3
For Profit
4
State
0
Other
0
Ambulatory Surgery Centers (7/13-6/14)
Employees
Part Time Employees 101
Full Time Employees 234
Contracted Employees 63
Payroll Employees 272 Staff with Clinical Privileges 401
Total Surgical Visits per Employee 107.7
Total Facilities 11 Total Surgical Visits 36,080
Percent of Surgical Visits, Age 65+ 34.5
Total Operating Rooms 27 Total Surgical Visits per Operating Room 1,336.3
Facilities Surgical Visits
Staff Licensed as M.D. 255
Total Employees per Operating Room 12.4
Average Semi-Private Daily Room Rate $903
Total Employees 335

PAGE 4York County
Pennsylvania Health Care Workforce (2013-2014)
Notes: Only health care employees renewing their license in 2013-2014 were surveyed.The "Estimated Number" and "Percent of Workforce Intending to Remain in Profession for 6 or More Years" used to compute each "% Change from Previous Survey Year" are adjusted based on the response rates for the previous and current survey results. The survey results are available every two years. Numbers and percentages pertain to county of employment.Percentages based on less than six responses are considered statistically unreliable and are not displayed (ND).Registered Nurses and Licensed Practical Nurses are not comparable to previous survey period, so some data is not available (DNA).
Licensed Practical Nurses (2014) 1,299 DNA 83.2% DNA
Physicians (2014) 825
Dentists (2013) 196
Registered Nurses (2012/2013) 3,433 DNA 83.8% DNA
-0.3% 71.0% -2.7%
-0.3% 72.5% -6.2%
Estimated Number
Percent Changefrom Previous
Survey
Difference in Percent from
Previous Survey
Percent of WorkforceIntending to Remain in
Profession for 6 or More Years
Injury Hospitalizations (2014)
Injury Hospitalizations and Median Charges by Age and Sex
Injury Hospitalizations and Median Charges by Type of Payor
Injury Hospitalizations and Median Charges by Mechanism/Intent and Sex
0-4 5-14 15-24 25-44 45-64 65 and Older
Male - Total
Male - Median Charges
Female - Total
Female - Median Charges
UnintentionalMotor Vehicle All Poisonings Unintentional Falls
Unintentional Fire/Flame or Hot Object/Substance All Firearm All Other Injuries
Male - Total
Male - Median Charges
Female - Total
Female - Median Charges
Medicare Medicaid Other Government Commercial / Private Blue Cross Uninsured
Total Hospitalizations
Median Charges
All Ages
1,926 27 39 214 370 585 691
$21,461.86 $18,037.60 $21,838.25 $19,047.17 $18,331.63 $22,812.26 $22,283.04
1,945 20 23 112 262 452 1,076
$21,174.57 $12,206.63 $19,197.70 $10,281.63 $14,766.08 $20,107.81 $24,246.59
Note: Median charges not displayed (ND) for occurrences less than 10.
1611,963 468 40581147
$11,798.50 $23,026.50 $19,810.85 $17,561.00 $20,968.16 $11,582.75
430
585
127
233
301
276
1,074
779
11
25
2
28
$18,852.59
$19,239.28
$26,685.50
$29,978.25
$9,863.00
$10,423.02
$25,257.17
$24,116.75
$11,956.01
$24,720.78
ND
$40,086.50
Disclaimer: Injury data used in this report were provided to the Pennsylvania Department of Health by the Pennsylvania Health Care Cost Containment Council. The Pennsylvania Health Care Cost Containment Council specifically disclaims responsibility for any interpretations or conclusions. Contents may be republished or reproduced whole or in part, with attribution.

Pennsylvania Health Statistics on the InternetVisit the Division of Health Informatics web pages at:
www.statistics.health.pa.gov
This website contains numerous detailed reports containing, but not limited to the health information provided within this report.
- This interactive health statistics dissemination web tool allows users to create customized data tables for various health related data.
and statistics to drive public health policy and program decisions.
- The Department's official annual report of population, births, deaths, induced abortions, and reported pregnancies.
- State and county statistics for national public health objectives.
- The Department's official annual report of cancer statistics.
Pennsylvania Department of HealthDivision of Health Informatics
2150 Herr StreetHarrisburg, PA 17103
Note: To subscribe to the Department's Health Statistics list service (Health e-stats), go to and click on "News and Updates" on the top navigation menu. Next, select "Health e-stats" and click on "Subscribe" to Health e-Stats now.
The EDDIE system was developed to empower public health professionals by enhancing and expanding upon their ability to use dataEDDIE
Pennsylvania Vital Statistics
Healthy People
Cancer Incidence and Mortality in Pennsylvania
Minority Health Disparities in Pennsylvania
Data Reports on Hospitals, Ambulatory Surgery Centers, and Nursing Homes
Behavioral Health Risks of Pennsylvania Adults
Pennsylvania Injury Hospitalization Statistics
Pennsylvania Tobacco Statistics
Maternal and Child Health Status Indicators for Pennsylvania and Major Municipalities
Vital Statistics for Pennsylvania 1906 to Current
Marriage and Divorce Statistics
Communicable Diseases
First Names of Live Births Lookup Tool and Reports
Health Statistics A to Z
Community Health Assessment Resources
Understanding Health Statistics
Additional Links to Federal, State, and Local Statistics
Statistical News
www.statistics.health.pa.gov
Pennsylvania Birth Statistics
Pennsylvania Death Statistics
www.statistics.health.pa.gov