Embed Size (px)
Citation preview
2016 Cashflow Planning, Crop Marketing and Budgets
Farm Business Management Ron Dvergsten ADawn Nelson Josh Tjosaas
• Successful and Poor Business Management Practices
• Historical RRV Crop Information • 2016 Cash Flow Strategies • 2016 Costs of Production • Risk Management Strategies • Marketing Basic • Marketing Strategies for 2015-16
Business Management Traits of Successful Farmers
• They know their cost of production by enterprise • They have marketing plans in place and follow them • They understand the value of
“Working Capital” in their business • They communicate with their primary
lender on regular basis
Business Management Traits of Successful Farmers- Continued • They complete an annual business
analysis and cashflow and understand key financial measures that impacts their operation
• They know what they truly spend on family living (by keeping records)
• They set business and personal goals
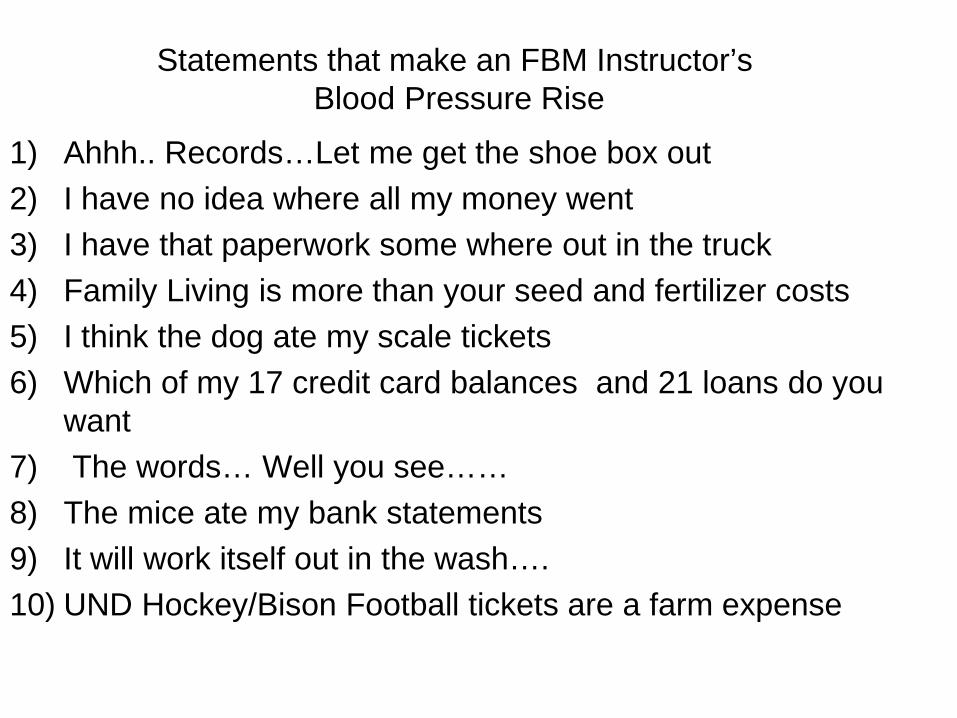
Statements that make an FBM Instructor’s Blood Pressure Rise
1) Ahhh.. Records…Let me get the shoe box out 2) I have no idea where all my money went 3) I have that paperwork some where out in the truck 4) Family Living is more than your seed and fertilizer costs 5) I think the dog ate my scale tickets 6) Which of my 17 credit card balances and 21 loans do you
want 7) The words… Well you see…… 8) The mice ate my bank statements 9) It will work itself out in the wash…. 10) UND Hockey/Bison Football tickets are a farm expense
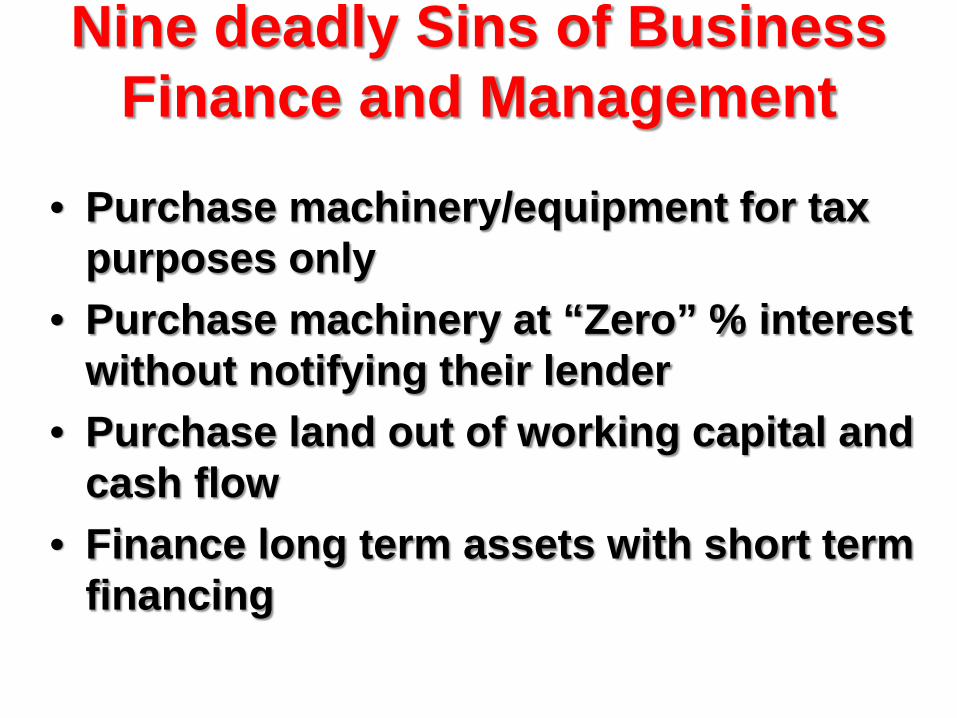
Nine deadly Sins of Business Finance and Management
• Purchase machinery/equipment for tax purposes only
• Purchase machinery at “Zero” % interest without notifying their lender
• Purchase land out of working capital and cash flow
• Finance long term assets with short term financing
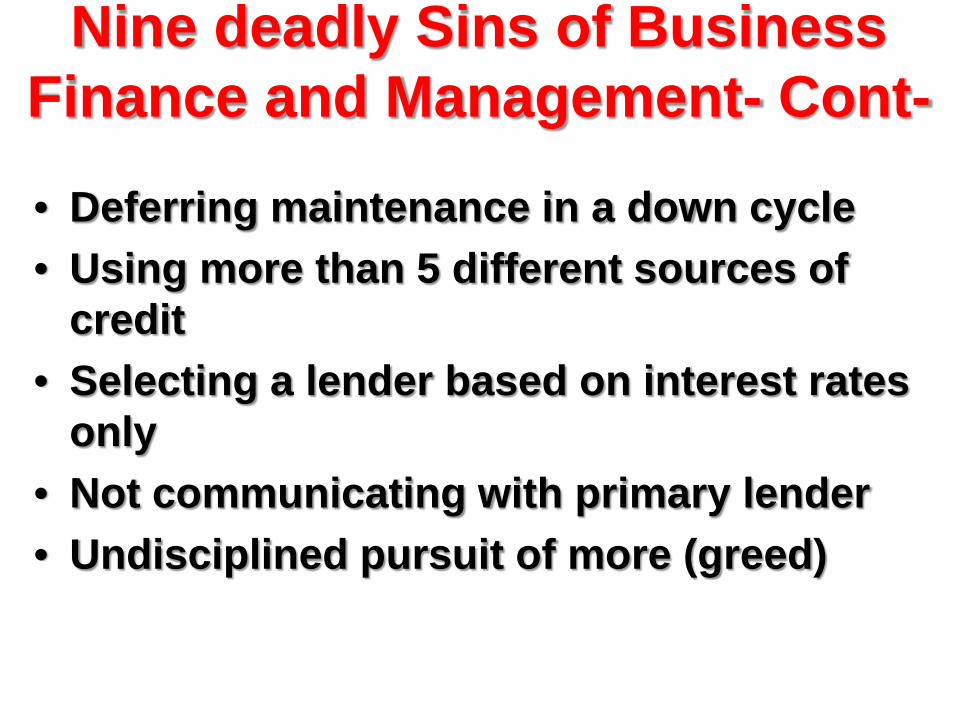
Nine deadly Sins of Business Finance and Management- Cont-
• Deferring maintenance in a down cycle • Using more than 5 different sources of
credit • Selecting a lender based on interest rates
only • Not communicating with primary lender • Undisciplined pursuit of more (greed)
Responding to Smaller Operating Margins
• What has the greatest impact on Net Income per Acre? – Yield – Price – Costs
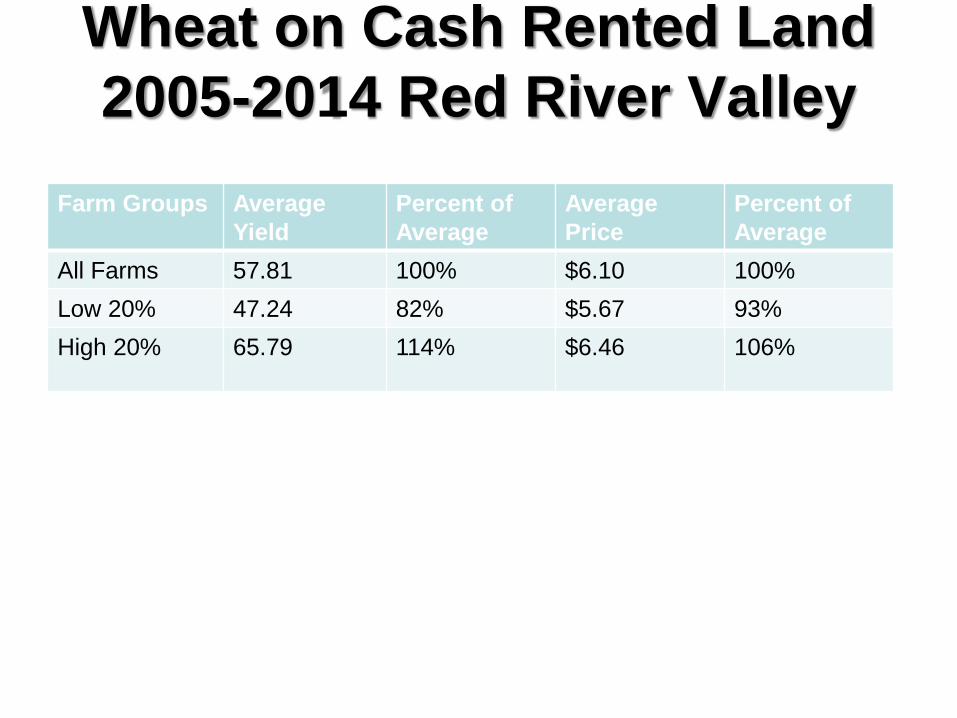
Wheat on Cash Rented Land 2005-2014 Red River Valley
Farm Groups Average Yield
Percent of Average
Average Price
Percent of Average
All Farms 57.81 100% $6.10 100% Low 20% 47.24 82% $5.67 93% High 20% 65.79 114% $6.46 106%
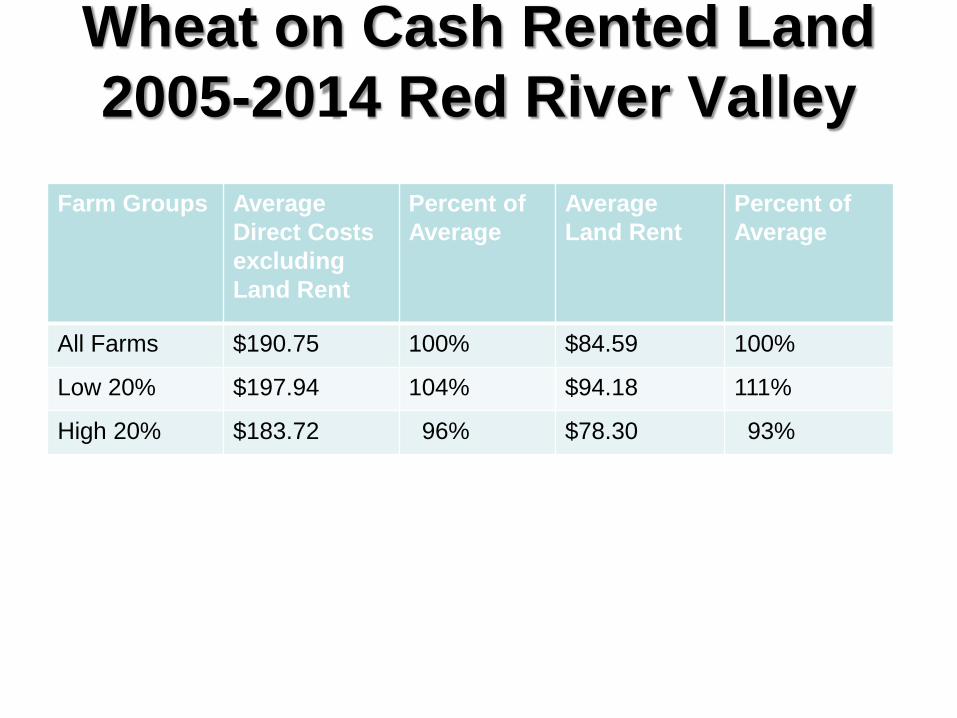
Wheat on Cash Rented Land 2005-2014 Red River Valley
Farm Groups Average Direct Costs excluding Land Rent
Percent of Average
Average Land Rent
Percent of Average
All Farms $190.75 100% $84.59 100%
Low 20% $197.94 104% $94.18 111%
High 20% $183.72 96% $78.30 93%
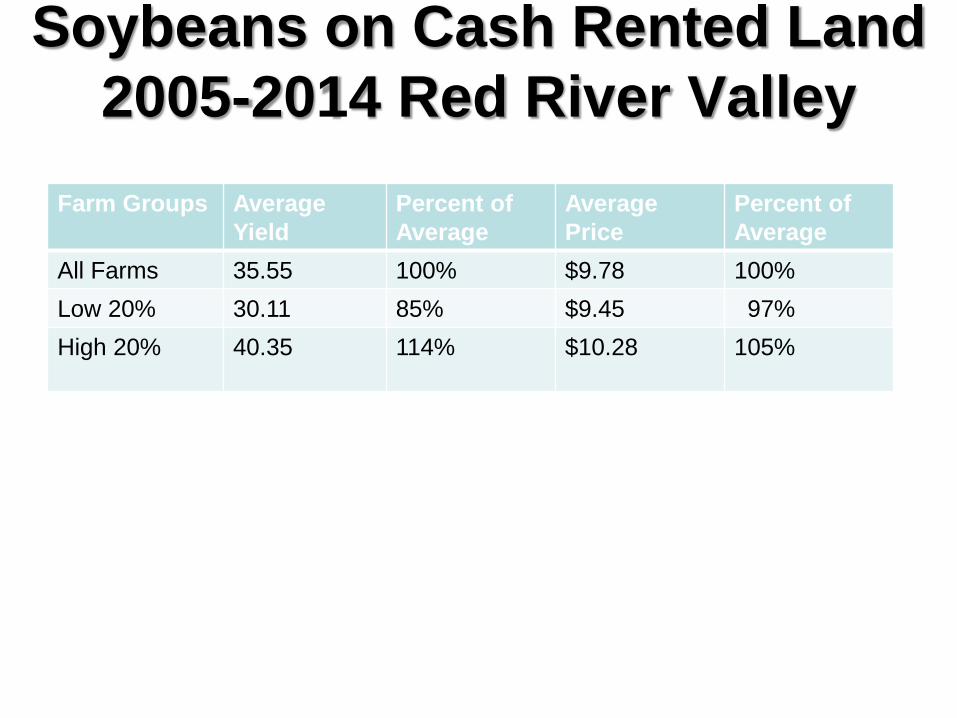
Soybeans on Cash Rented Land 2005-2014 Red River Valley
Farm Groups Average Yield
Percent of Average
Average Price
Percent of Average
All Farms 35.55 100% $9.78 100% Low 20% 30.11 85% $9.45 97% High 20% 40.35 114% $10.28 105%
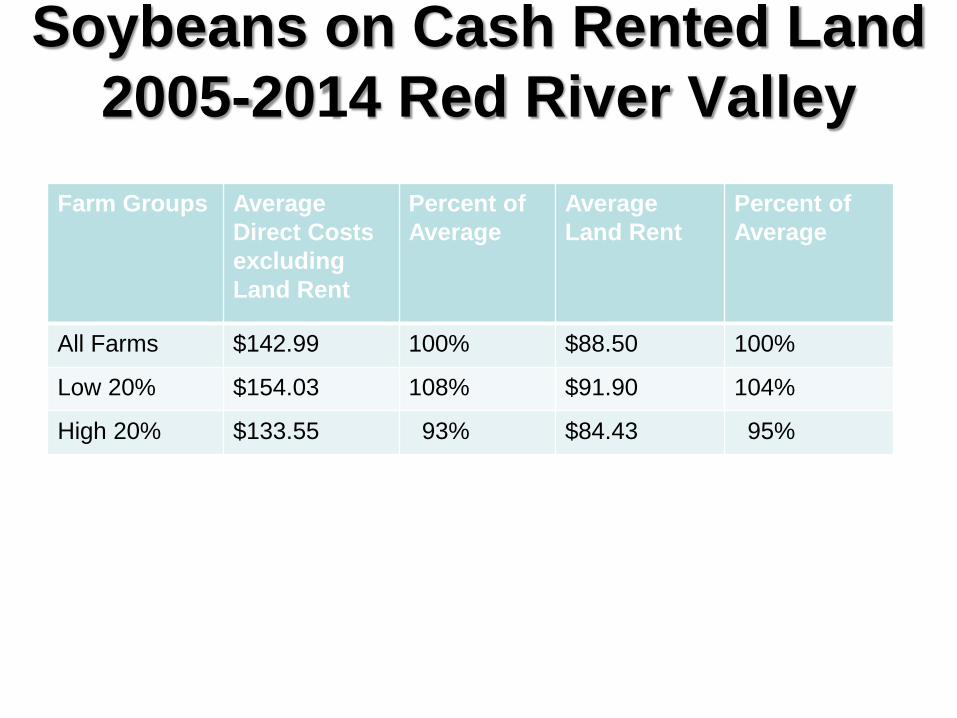
Soybeans on Cash Rented Land 2005-2014 Red River Valley
Farm Groups Average Direct Costs excluding Land Rent
Percent of Average
Average Land Rent
Percent of Average
All Farms $142.99 100% $88.50 100%
Low 20% $154.03 108% $91.90 104%
High 20% $133.55 93% $84.43 95%
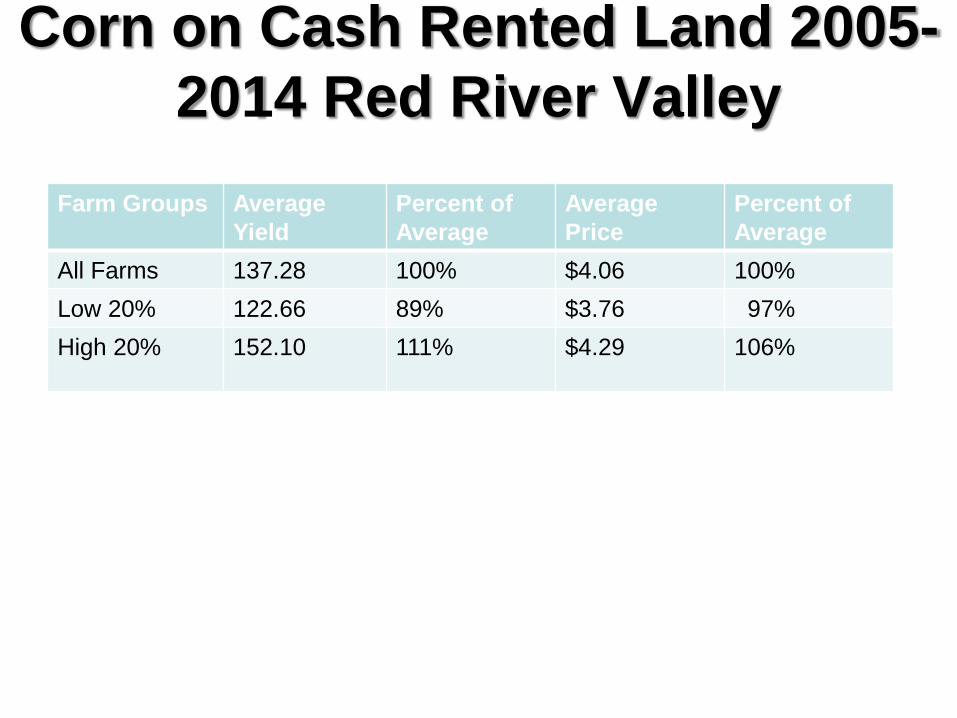
Corn on Cash Rented Land 2005-2014 Red River Valley
Farm Groups Average Yield
Percent of Average
Average Price
Percent of Average
All Farms 137.28 100% $4.06 100% Low 20% 122.66 89% $3.76 97% High 20% 152.10 111% $4.29 106%
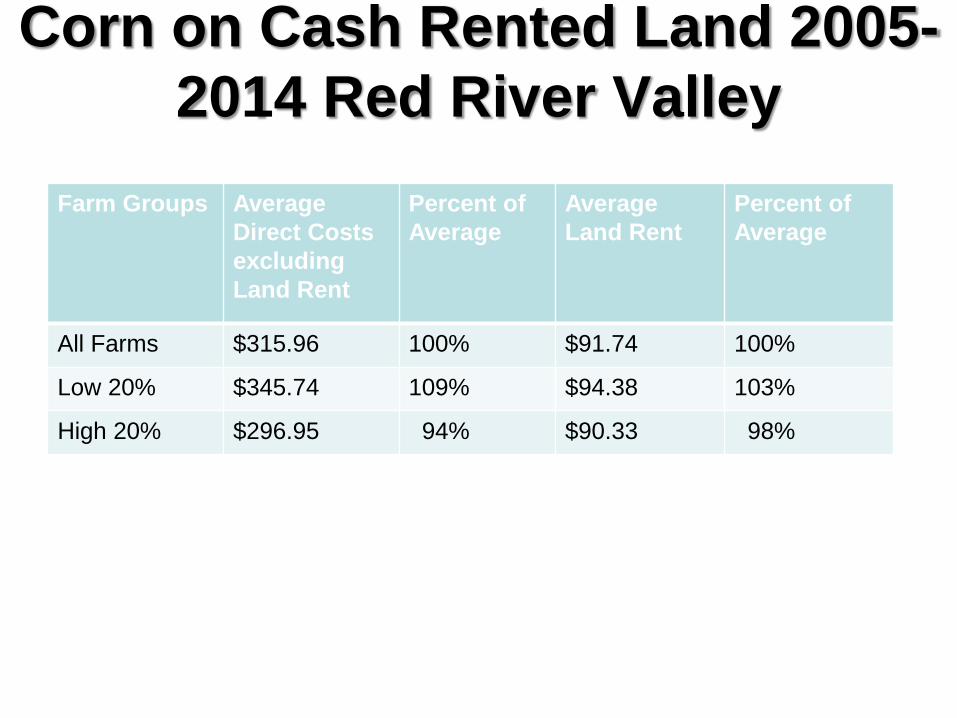
Corn on Cash Rented Land 2005-2014 Red River Valley
Farm Groups Average Direct Costs excluding Land Rent
Percent of Average
Average Land Rent
Percent of Average
All Farms $315.96 100% $91.74 100%
Low 20% $345.74 109% $94.38 103%
High 20% $296.95 94% $90.33 98%
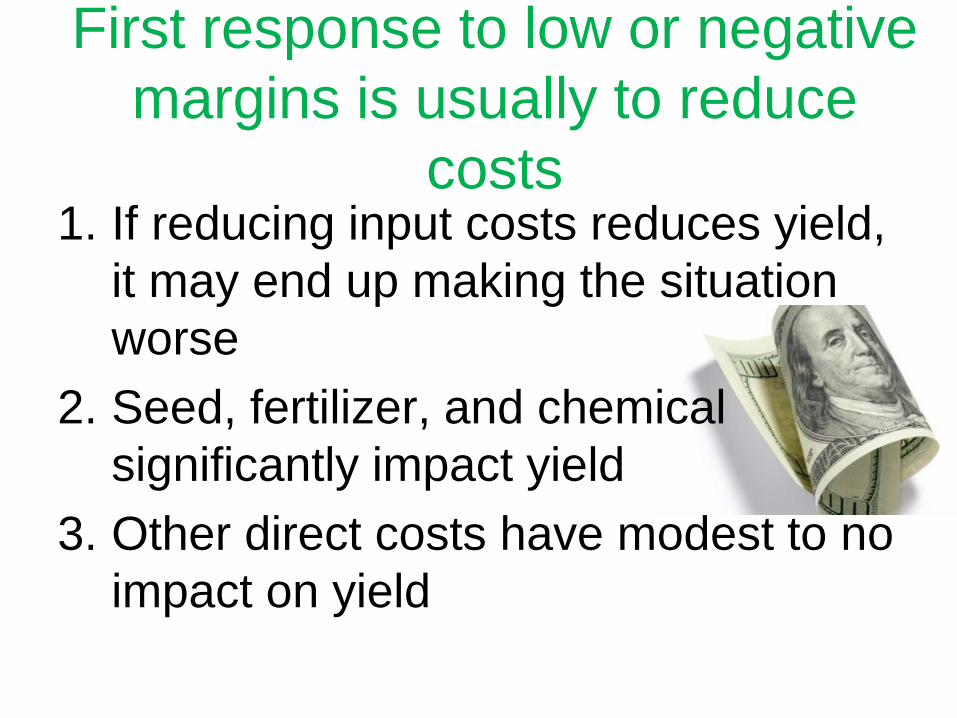
First response to low or negative margins is usually to reduce
costs 1. If reducing input costs reduces yield,
it may end up making the situation worse
2. Seed, fertilizer, and chemical significantly impact yield
3. Other direct costs have modest to no impact on yield
That leaves land costs, machinery ownership and family
living draws These cash flow needs can have a major impact but are not easily altered in the short run. If current conditions continue for multiple years, the operators with the highest cash flow needs per acre or bushel will be the first economic casualties.
Farms can be profitable and Not Cashflow!!!!
• Family living exceeds farm profits • Term Debt repayment requirements are to
lofty • Capital purchases not in line with farm
profitability
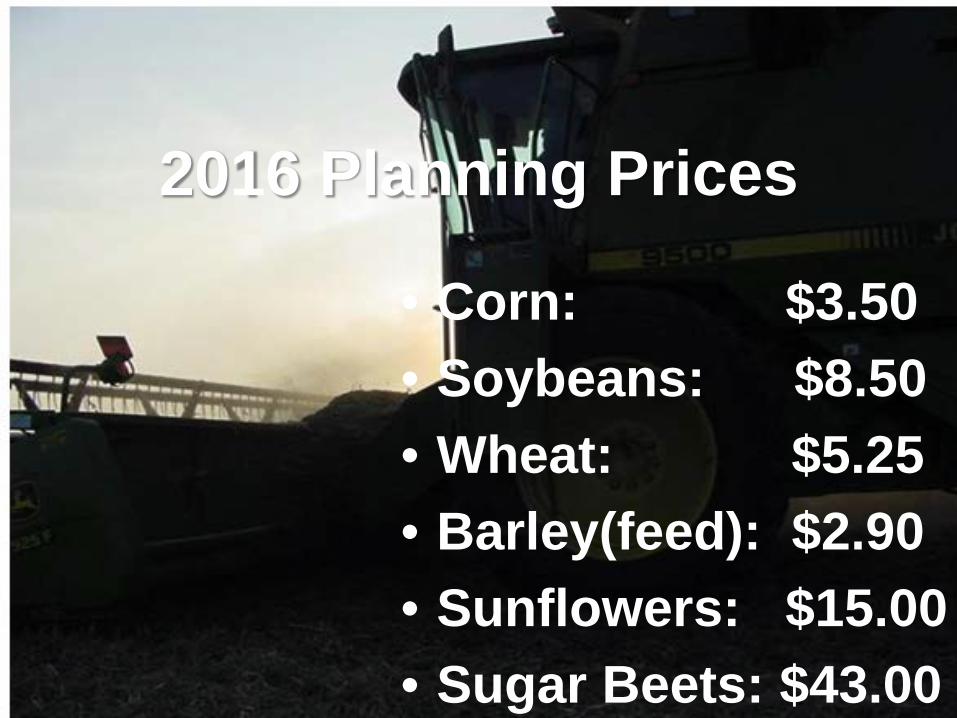
2016 Planning Prices
• Corn: $3.50 • Soybeans: $8.50 • Wheat: $5.25 • Barley(feed): $2.90 • Sunflowers: $15.00 • Sugar Beets: $43.00
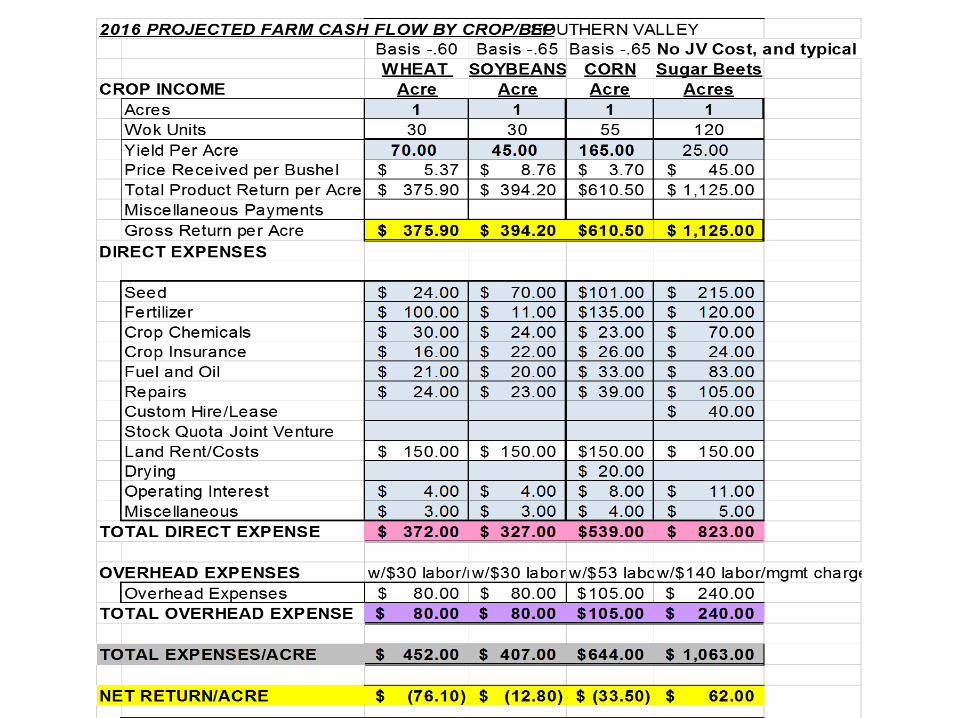
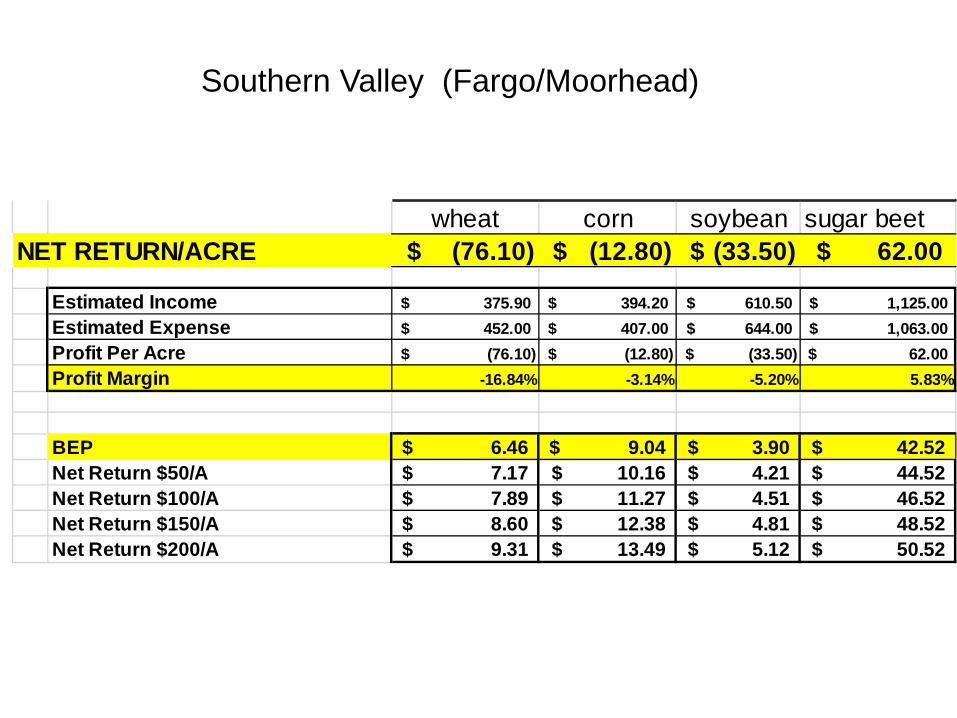
wheat corn soybean sugar beet NET RETURN/ACRE (76.10)$ (12.80)$ (33.50)$ 62.00$
Estimated Income 375.90$ 394.20$ 610.50$ 1,125.00$ Estimated Expense 452.00$ 407.00$ 644.00$ 1,063.00$ Profit Per Acre (76.10)$ (12.80)$ (33.50)$ 62.00$ Profit Margin -16.84% -3.14% -5.20% 5.83%
BEP 6.46$ 9.04$ 3.90$ 42.52$ Net Return $50/A 7.17$ 10.16$ 4.21$ 44.52$ Net Return $100/A 7.89$ 11.27$ 4.51$ 46.52$ Net Return $150/A 8.60$ 12.38$ 4.81$ 48.52$ Net Return $200/A 9.31$ 13.49$ 5.12$ 50.52$
Southern Valley (Fargo/Moorhead)
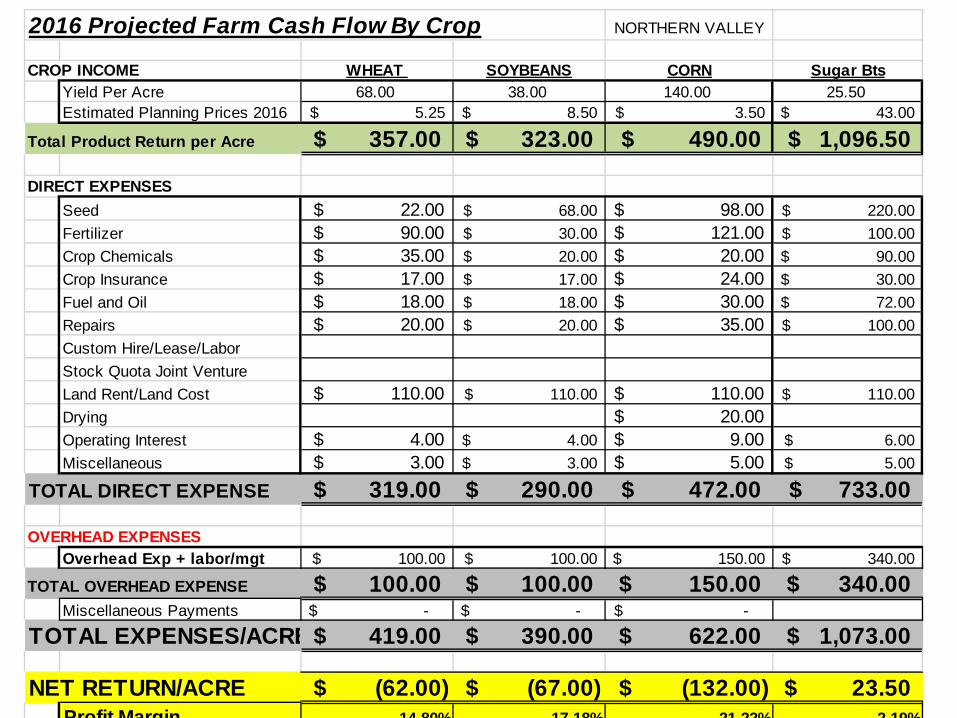
2016 Projected Farm Cash Flow By Crop NORTHERN VALLEY
CROP INCOME WHEAT SOYBEANS CORN Sugar BtsYield Per Acre 68.00 38.00 140.00 25.50Estimated Planning Prices 2016 5.25$ 8.50$ 3.50$ 43.00$
Total Product Return per Acre 357.00$ 323.00$ 490.00$ 1,096.50$
DIRECT EXPENSESSeed 22.00$ 68.00$ 98.00$ 220.00$ Fertilizer 90.00$ 30.00$ 121.00$ 100.00$ Crop Chemicals 35.00$ 20.00$ 20.00$ 90.00$ Crop Insurance 17.00$ 17.00$ 24.00$ 30.00$ Fuel and Oil 18.00$ 18.00$ 30.00$ 72.00$ Repairs 20.00$ 20.00$ 35.00$ 100.00$ Custom Hire/Lease/LaborStock Quota Joint VentureLand Rent/Land Cost 110.00$ 110.00$ 110.00$ 110.00$ Drying 20.00$ Operating Interest 4.00$ 4.00$ 9.00$ 6.00$ Miscellaneous 3.00$ 3.00$ 5.00$ 5.00$
TOTAL DIRECT EXPENSE 319.00$ 290.00$ 472.00$ 733.00$
OVERHEAD EXPENSESOverhead Exp + labor/mgt 100.00$ 100.00$ 150.00$ 340.00$
TOTAL OVERHEAD EXPENSE 100.00$ 100.00$ 150.00$ 340.00$ Miscellaneous Payments -$ -$ -$
TOTAL EXPENSES/ACRE 419.00$ 390.00$ 622.00$ 1,073.00$
NET RETURN/ACRE (62.00)$ (67.00)$ (132.00)$ 23.50$ Profit Margin -14 80% -17 18% -21 22% 2 19%
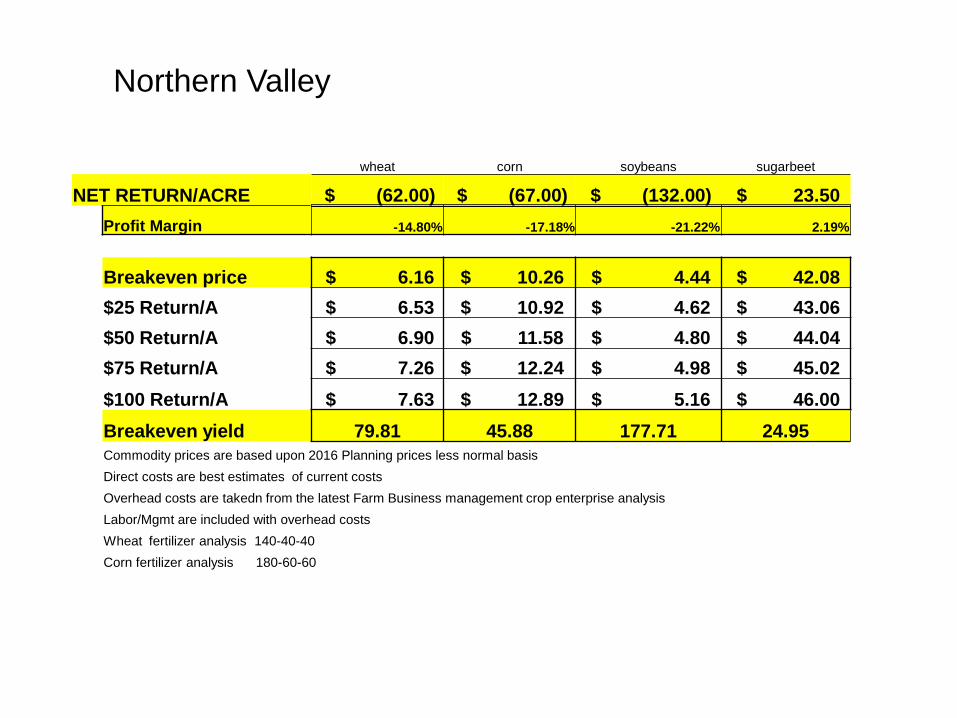
wheat corn soybeans sugarbeet
NET RETURN/ACRE $ (62.00) $ (67.00) $ (132.00) $ 23.50 Profit Margin -14.80% -17.18% -21.22% 2.19%
Breakeven price $ 6.16 $ 10.26 $ 4.44 $ 42.08 $25 Return/A $ 6.53 $ 10.92 $ 4.62 $ 43.06 $50 Return/A $ 6.90 $ 11.58 $ 4.80 $ 44.04 $75 Return/A $ 7.26 $ 12.24 $ 4.98 $ 45.02 $100 Return/A $ 7.63 $ 12.89 $ 5.16 $ 46.00 Breakeven yield 79.81 45.88 177.71 24.95 Commodity prices are based upon 2016 Planning prices less normal basis Direct costs are best estimates of current costs Overhead costs are takedn from the latest Farm Business management crop enterprise analysis Labor/Mgmt are included with overhead costs Wheat fertilizer analysis 140-40-40 Corn fertilizer analysis 180-60-60
Northern Valley
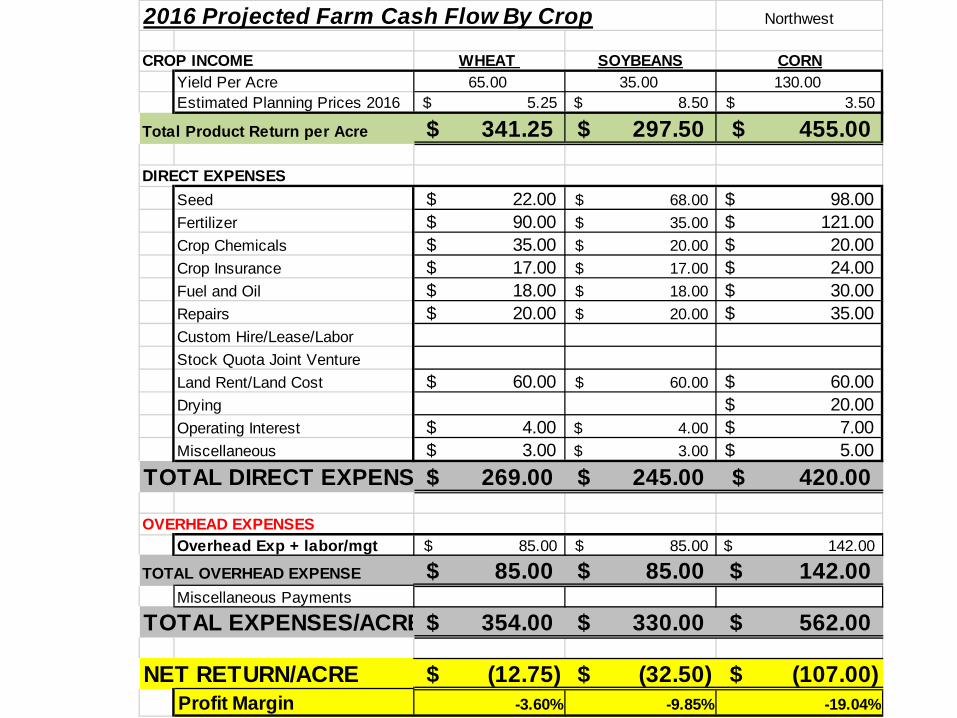
2016 Projected Farm Cash Flow By Crop Northwest
CROP INCOME WHEAT SOYBEANS CORNYield Per Acre 65.00 35.00 130.00Estimated Planning Prices 2016 5.25$ 8.50$ 3.50$
Total Product Return per Acre 341.25$ 297.50$ 455.00$
DIRECT EXPENSESSeed 22.00$ 68.00$ 98.00$ Fertilizer 90.00$ 35.00$ 121.00$ Crop Chemicals 35.00$ 20.00$ 20.00$ Crop Insurance 17.00$ 17.00$ 24.00$ Fuel and Oil 18.00$ 18.00$ 30.00$ Repairs 20.00$ 20.00$ 35.00$ Custom Hire/Lease/LaborStock Quota Joint VentureLand Rent/Land Cost 60.00$ 60.00$ 60.00$ Drying 20.00$ Operating Interest 4.00$ 4.00$ 7.00$ Miscellaneous 3.00$ 3.00$ 5.00$
TOTAL DIRECT EXPENS 269.00$ 245.00$ 420.00$
OVERHEAD EXPENSESOverhead Exp + labor/mgt 85.00$ 85.00$ 142.00$
TOTAL OVERHEAD EXPENSE 85.00$ 85.00$ 142.00$ Miscellaneous Payments
TOTAL EXPENSES/ACRE 354.00$ 330.00$ 562.00$
NET RETURN/ACRE (12.75)$ (32.50)$ (107.00)$ Profit Margin -3.60% -9.85% -19.04%
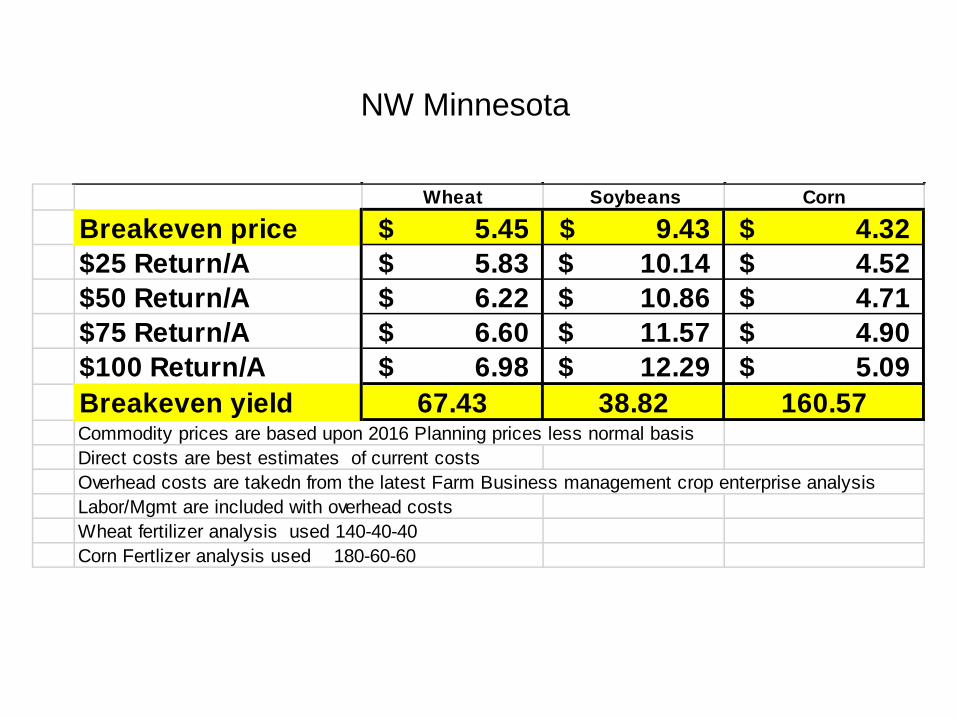
Wheat Soybeans Corn
Breakeven price 5.45$ 9.43$ 4.32$ $25 Return/A 5.83$ 10.14$ 4.52$ $50 Return/A 6.22$ 10.86$ 4.71$ $75 Return/A 6.60$ 11.57$ 4.90$ $100 Return/A 6.98$ 12.29$ 5.09$ Breakeven yield 67.43 38.82 160.57Commodity prices are based upon 2016 Planning prices less normal basisDirect costs are best estimates of current costsOverhead costs are takedn from the latest Farm Business management crop enterprise analysisLabor/Mgmt are included with overhead costsWheat fertilizer analysis used 140-40-40Corn Fertlizer analysis used 180-60-60
NW Minnesota
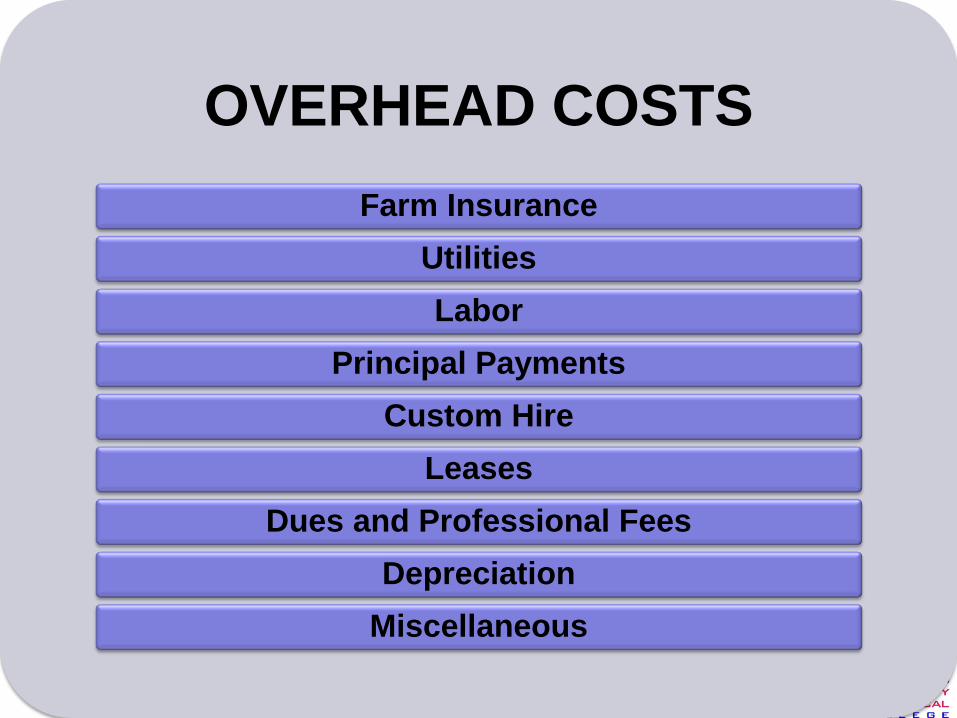
OVERHEAD COSTS Farm Insurance
Utilities Labor
Principal Payments Custom Hire
Leases Dues and Professional Fees
Depreciation Miscellaneous
Tools to increase whole farm profitability….
1. Budget and plan family living. 2. Reorganize debts. 3. Make interest only payments. 4. Manage loan interest rates. 5. Manage tax liability.
Tools to increase whole farm profitability….
6. Keep farm record up to date. 7. Analyze each enterprise for profitability. 8. Shop for inputs. 9. Evaluate ROI for each input.
2015 Marketing “Back To Basics”
• Know you BEP: Budgeted/Actual • What is the market environment and
your beliefs of where the market is headed. Futures and Basis Outlook.
• Use crop insurance as a part of your marketing plan
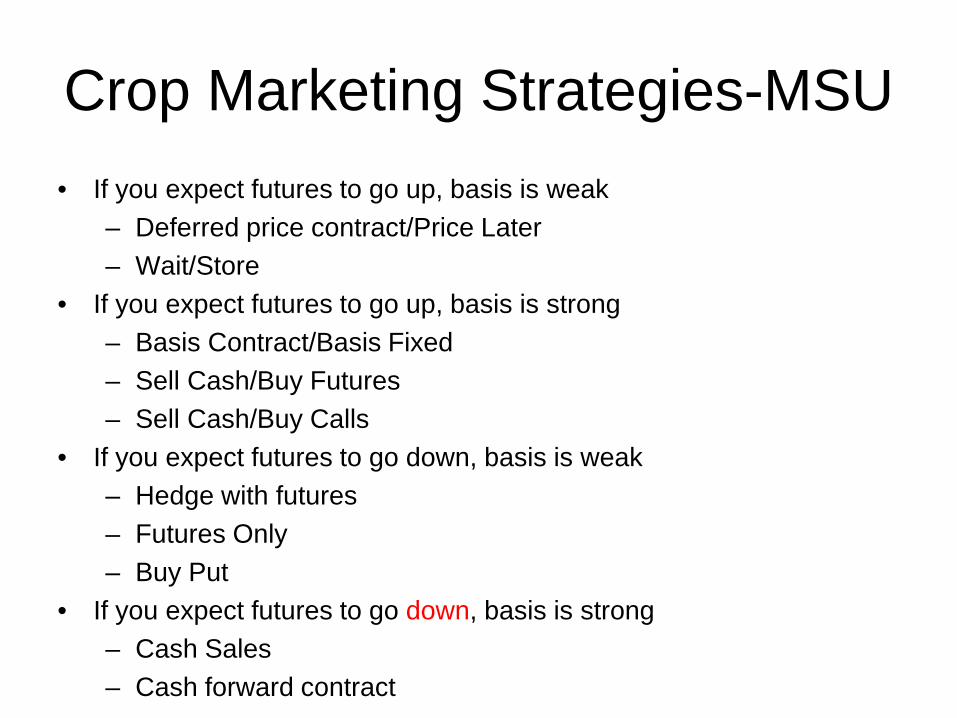
Crop Marketing Strategies-MSU • If you expect futures to go up, basis is weak
– Deferred price contract/Price Later – Wait/Store
• If you expect futures to go up, basis is strong – Basis Contract/Basis Fixed – Sell Cash/Buy Futures – Sell Cash/Buy Calls
• If you expect futures to go down, basis is weak – Hedge with futures – Futures Only – Buy Put
• If you expect futures to go down, basis is strong – Cash Sales – Cash forward contract
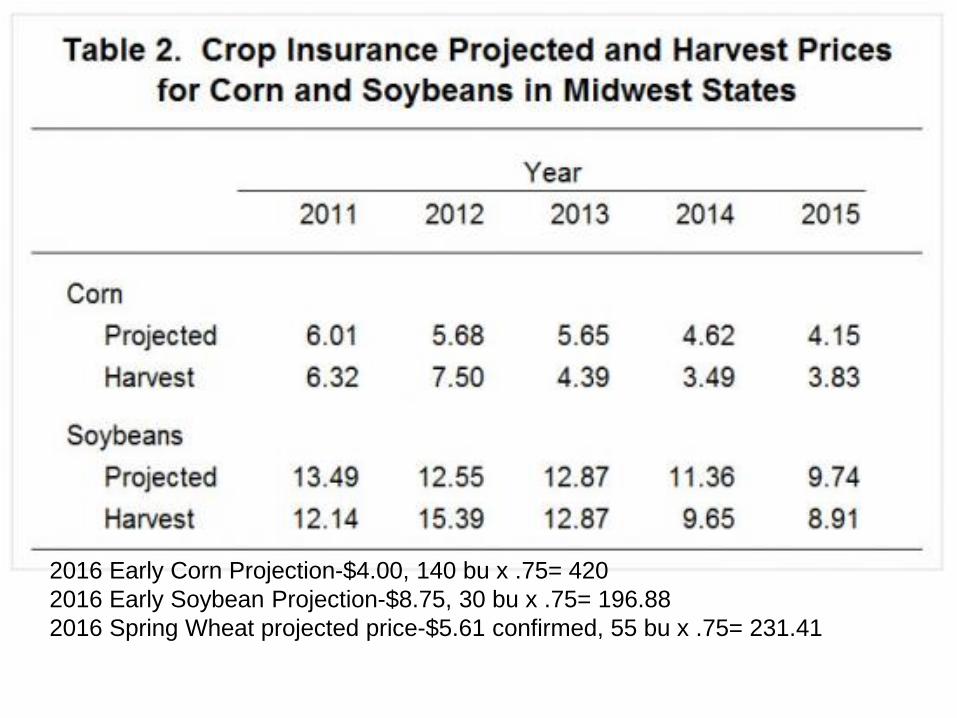
2016 Early Corn Projection-$4.00, 140 bu x .75= 420 2016 Early Soybean Projection-$8.75, 30 bu x .75= 196.88 2016 Spring Wheat projected price-$5.61 confirmed, 55 bu x .75= 231.41
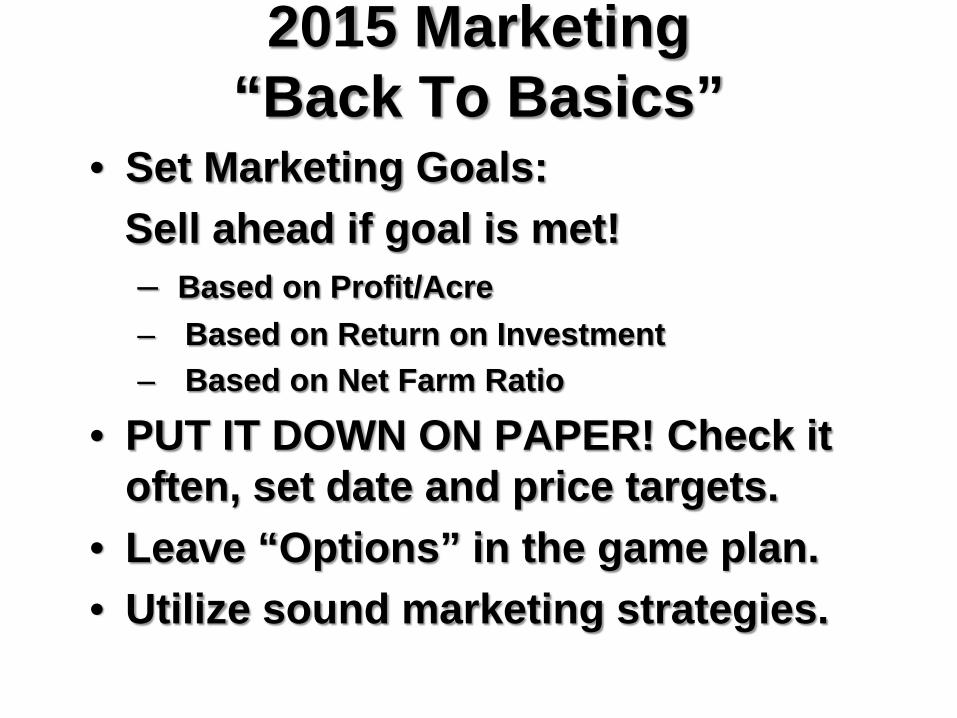
2015 Marketing “Back To Basics”
• Set Marketing Goals: Sell ahead if goal is met!
– Based on Profit/Acre – Based on Return on Investment – Based on Net Farm Ratio
• PUT IT DOWN ON PAPER! Check it often, set date and price targets.
• Leave “Options” in the game plan. • Utilize sound marketing strategies.
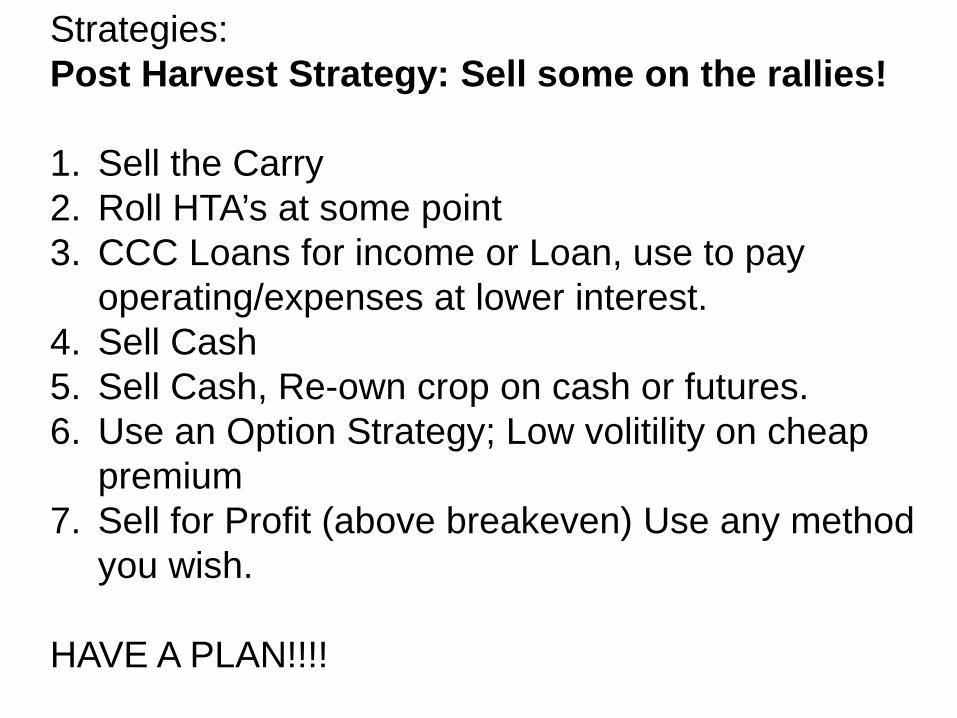
Strategies: Post Harvest Strategy: Sell some on the rallies! 1. Sell the Carry 2. Roll HTA’s at some point 3. CCC Loans for income or Loan, use to pay
operating/expenses at lower interest. 4. Sell Cash 5. Sell Cash, Re-own crop on cash or futures. 6. Use an Option Strategy; Low volitility on cheap
premium 7. Sell for Profit (above breakeven) Use any method
you wish. HAVE A PLAN!!!!