Embed Size (px)
Citation preview

Q1. How would you rate your community as a place for people to live as they age? Total
Excellent 16%
Very good 27%
Good 34%
Fair 18%
Poor 4%
No response 1%
Q2. What is the name of your community? Total
Bayview 1%
BCC 1%
Bro Country Club <0.5%
Brownsville 2%
Buen Pastor 2%
Buille Country Club 1%
Cameron County <0.5%
Cameron Park 2%
Cameron 5%
Causs County <0.5%
Celaya Subdivison <0.5%
Chonito Heights 0%
City of Brownsville 1%
Condado Cameron <0.5%
Cosmos <0.5%
East Brownsville 0%
Ebony Acres <0.5%
Ebony Heights 2%
Ebony Parway <0.5%
El Chapparal <0.5%
El Naranjal <0.5%
Esquina Subdivision 1%
Forrest North <0.5%
Garden Park <0.5%
Greenway <0.5%
Heritage Place 1%
Honeydale 0%
Huntington Estates 1%
Indian Lake <0.5%
La Resoca County <0.5%
La Villita 7%
Lakeway <0.5%
Land o Lakes 0%
Laura Lane/Ln. <0.5%
Loma Del Rey 4%
2016 Brownsville, TX Livable Community Survey50+ General Population
N = 296; Sampling Error = +/- 5.7%
S urvey Annotation.L ivability forAll:T he2016 Age-Friendly Com m unity S urvey ofBrow nsvilleAAR P M em bersAge50-P lus 1

Los Ebanos 1%
Los Fresnos <0.5%
Lower Rio Grande Valley <0.5%
Minnesota Estates 1%
Mormona 1%
North Brownsville <0.5%
Olmito 2%
Paseo Pointe Aparments Home <0.5%
Porter Zoo Area <0.5%
Prestonwood 25%
Quail Hallow 2%
Rancho Viejo <0.5%
Rio Del Sol <0.5%
Rio Grande Valley <0.5%
River Side <0.5%
Riverbend Resort <0.5%
Rockwell <0.5%
San Antonio Estates 1%
South 1%
Southmost <0.5%
Southpoint <0.5%
Steven Acros 1%
Subdircion Coolidge 1%
Sur Dakota Subdicion 1%
The Woods <0.5%
Valle De Oro <0.5%
Valley Resaca Palm <0.5%
Villa Del Rey <0.5%
Villa Los Pinos <0.5%
Villa Nueva <0.5%
West Brownsville <0.5%
West EL Valle 1%
West Point 0%
West Side <0.5%
Winterhaven Resort 3%
Woods End <0.5%
Other 2%
No response 20%
Q3. What is your 5-digit ZIP code? Total
57821 1%
78326 1%
78520 29%
78521 37%
78526 24%
78528 <0.5%
78566 5%
78575 3%
No response 1%
S urvey Annotation.L ivability forAll:T he2016 Age-Friendly Com m unity S urvey ofBrow nsvilleAAR P M em bersAge50-P lus 2
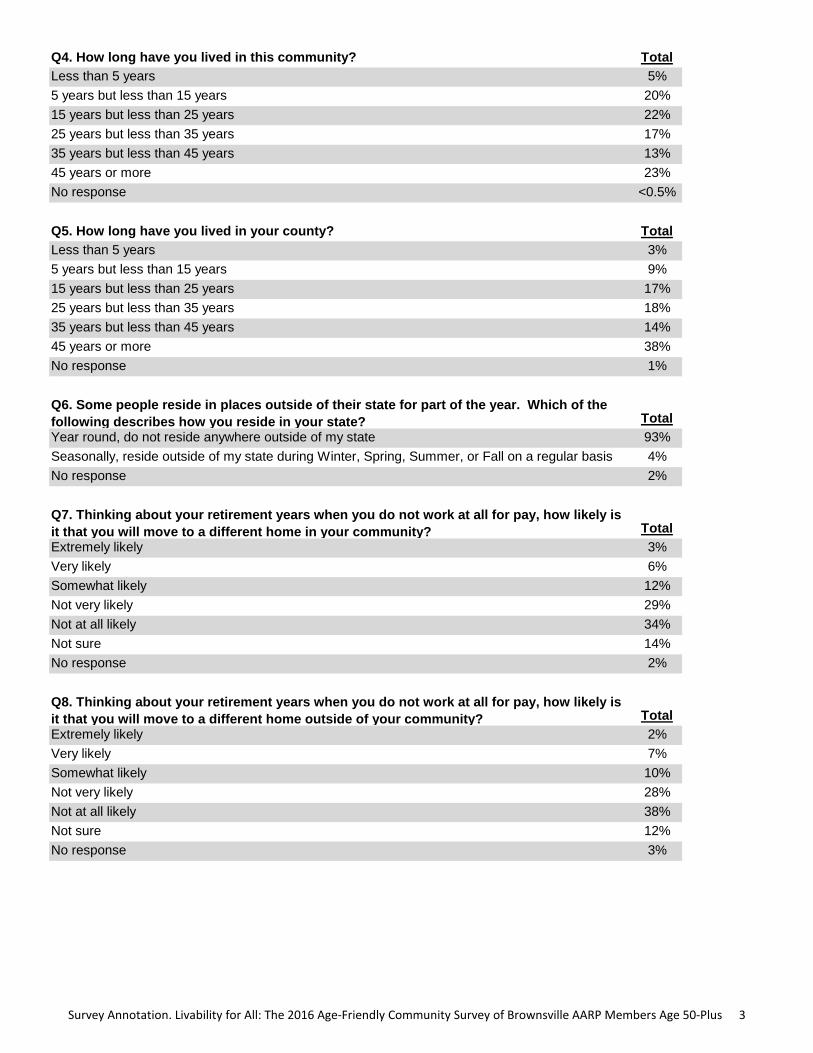
Q4. How long have you lived in this community? Total
Less than 5 years 5%
5 years but less than 15 years 20%
15 years but less than 25 years 22%
25 years but less than 35 years 17%
35 years but less than 45 years 13%
45 years or more 23%
No response <0.5%
Q5. How long have you lived in your county? Total
Less than 5 years 3%
5 years but less than 15 years 9%
15 years but less than 25 years 17%
25 years but less than 35 years 18%
35 years but less than 45 years 14%
45 years or more 38%
No response 1%
Q6. Some people reside in places outside of their state for part of the year. Which of the
following describes how you reside in your state? Total
Year round, do not reside anywhere outside of my state 93%
Seasonally, reside outside of my state during Winter, Spring, Summer, or Fall on a regular basis 4%
No response 2%
Q7. Thinking about your retirement years when you do not work at all for pay, how likely is
it that you will move to a different home in your community? Total
Extremely likely 3%
Very likely 6%
Somewhat likely 12%
Not very likely 29%
Not at all likely 34%
Not sure 14%
No response 2%
Q8. Thinking about your retirement years when you do not work at all for pay, how likely is
it that you will move to a different home outside of your community? Total
Extremely likely 2%
Very likely 7%
Somewhat likely 10%
Not very likely 28%
Not at all likely 38%
Not sure 12%
No response 3%
S urvey Annotation.L ivability forAll:T he2016 Age-Friendly Com m unity S urvey ofBrow nsvilleAAR P M em bersAge50-P lus 3
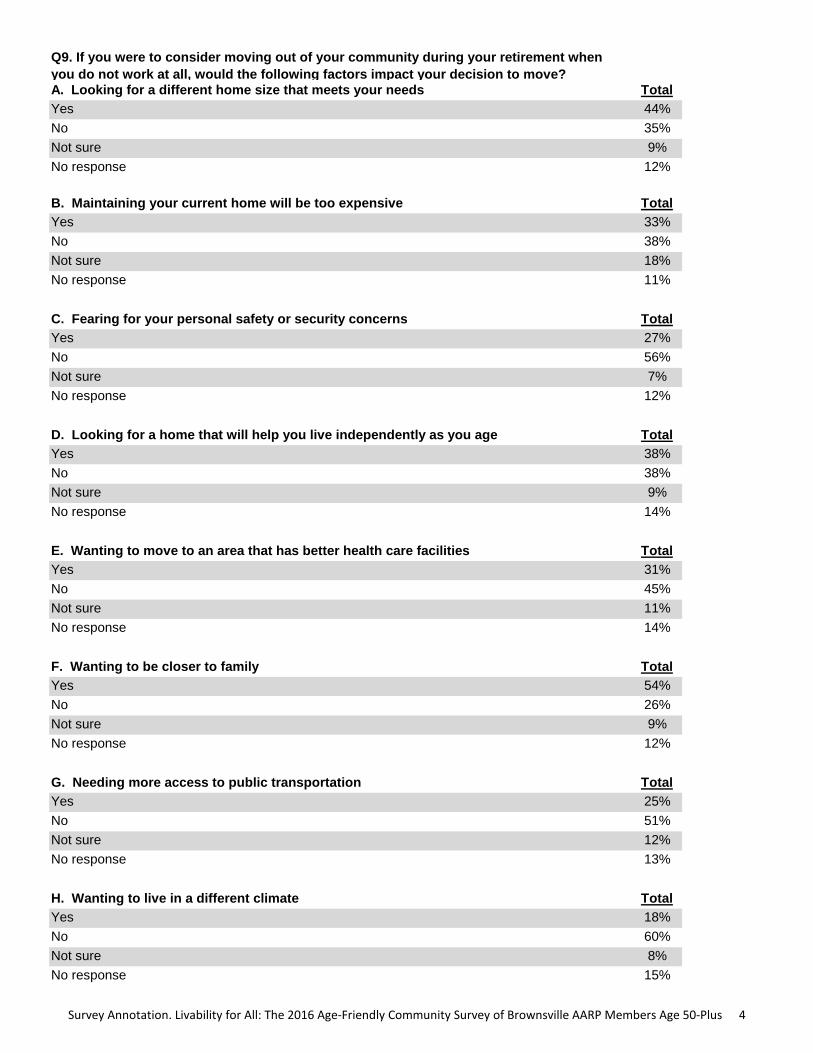
Q9. If you were to consider moving out of your community during your retirement when
you do not work at all, would the following factors impact your decision to move?A. Looking for a different home size that meets your needs Total
Yes 44%
No 35%
Not sure 9%
No response 12%
B. Maintaining your current home will be too expensive Total
Yes 33%
No 38%
Not sure 18%
No response 11%
C. Fearing for your personal safety or security concerns Total
Yes 27%
No 56%
Not sure 7%
No response 12%
D. Looking for a home that will help you live independently as you age Total
Yes 38%
No 38%
Not sure 9%
No response 14%
E. Wanting to move to an area that has better health care facilities Total
Yes 31%
No 45%
Not sure 11%
No response 14%
F. Wanting to be closer to family Total
Yes 54%
No 26%
Not sure 9%
No response 12%
G. Needing more access to public transportation Total
Yes 25%
No 51%
Not sure 12%
No response 13%
H. Wanting to live in a different climate Total
Yes 18%
No 60%
Not sure 8%
No response 15%
S urvey Annotation.L ivability forAll:T he2016 Age-Friendly Com m unity S urvey ofBrow nsvilleAAR P M em bersAge50-P lus 4
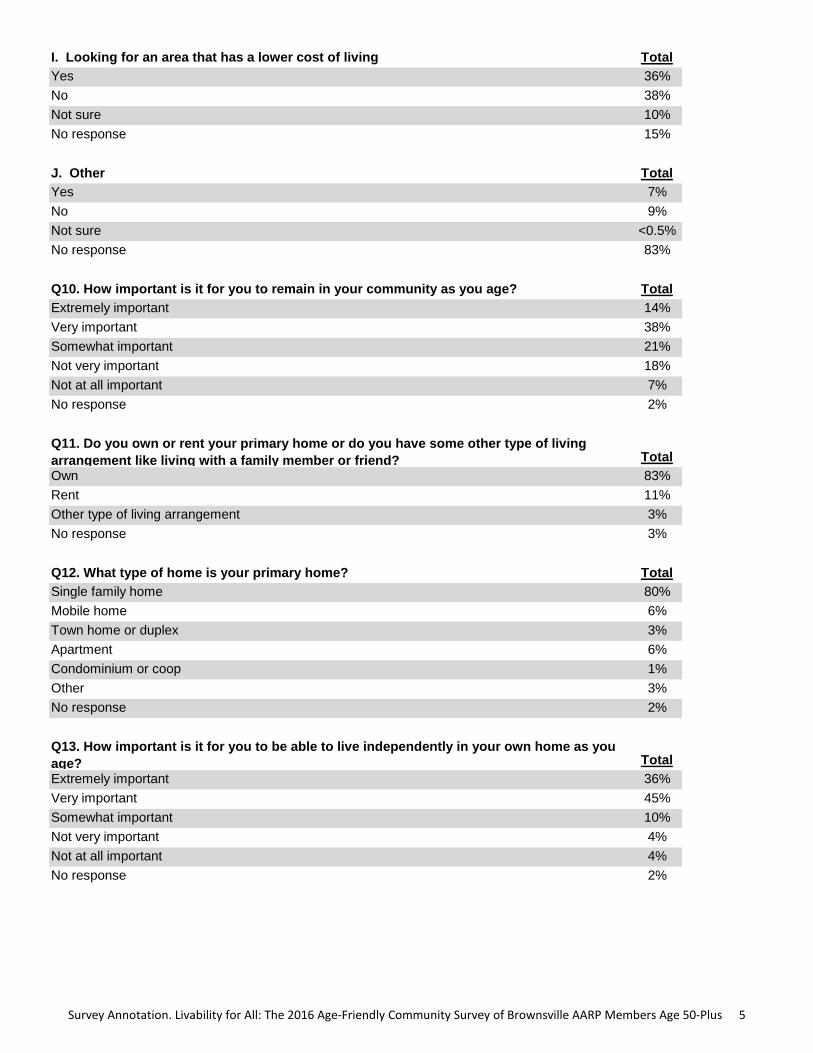
I. Looking for an area that has a lower cost of living Total
Yes 36%
No 38%
Not sure 10%
No response 15%
J. Other Total
Yes 7%
No 9%
Not sure <0.5%
No response 83%
Q10. How important is it for you to remain in your community as you age? Total
Extremely important 14%
Very important 38%
Somewhat important 21%
Not very important 18%
Not at all important 7%
No response 2%
Q11. Do you own or rent your primary home or do you have some other type of living
arrangement like living with a family member or friend? Total
Own 83%
Rent 11%
Other type of living arrangement 3%
No response 3%
Q12. What type of home is your primary home? Total
Single family home 80%
Mobile home 6%
Town home or duplex 3%
Apartment 6%
Condominium or coop 1%
Other 3%
No response 2%
Q13. How important is it for you to be able to live independently in your own home as you
age? Total
Extremely important 36%
Very important 45%
Somewhat important 10%
Not very important 4%
Not at all important 4%
No response 2%
S urvey Annotation.L ivability forAll:T he2016 Age-Friendly Com m unity S urvey ofBrow nsvilleAAR P M em bersAge50-P lus 5
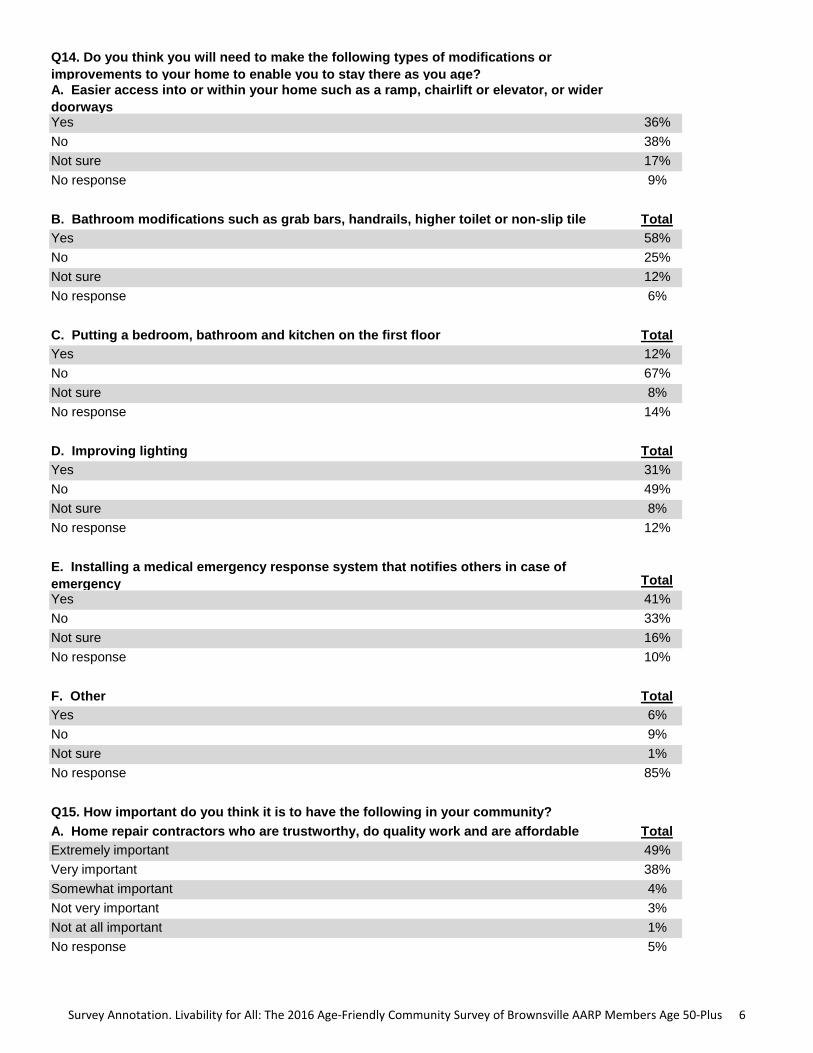
Q14. Do you think you will need to make the following types of modifications or
improvements to your home to enable you to stay there as you age?A. Easier access into or within your home such as a ramp, chairlift or elevator, or wider
doorwaysYes 36%
No 38%
Not sure 17%
No response 9%
B. Bathroom modifications such as grab bars, handrails, higher toilet or non-slip tile Total
Yes 58%
No 25%
Not sure 12%
No response 6%
C. Putting a bedroom, bathroom and kitchen on the first floor Total
Yes 12%
No 67%
Not sure 8%
No response 14%
D. Improving lighting Total
Yes 31%
No 49%
Not sure 8%
No response 12%
E. Installing a medical emergency response system that notifies others in case of
emergency Total
Yes 41%
No 33%
Not sure 16%
No response 10%
F. Other Total
Yes 6%
No 9%
Not sure 1%
No response 85%
Q15. How important do you think it is to have the following in your community?
A. Home repair contractors who are trustworthy, do quality work and are affordable Total
Extremely important 49%
Very important 38%
Somewhat important 4%
Not very important 3%
Not at all important 1%
No response 5%
S urvey Annotation.L ivability forAll:T he2016 Age-Friendly Com m unity S urvey ofBrow nsvilleAAR P M em bersAge50-P lus 6
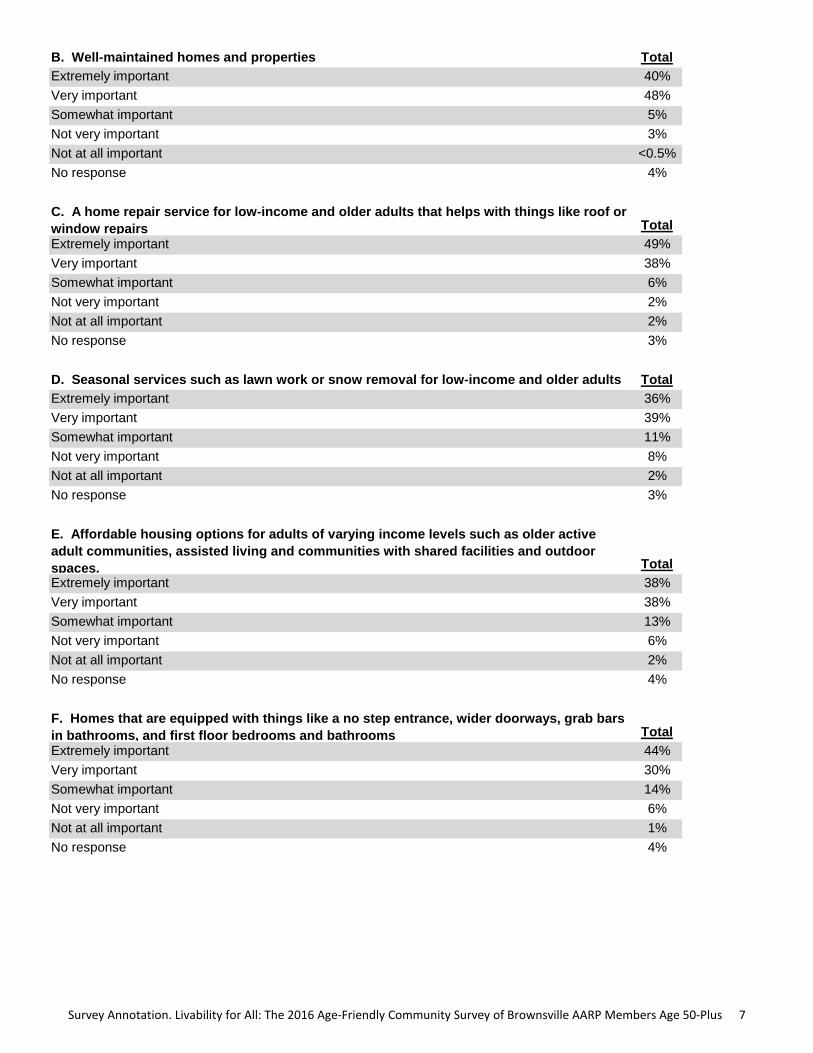
B. Well-maintained homes and properties Total
Extremely important 40%
Very important 48%
Somewhat important 5%
Not very important 3%
Not at all important <0.5%
No response 4%
C. A home repair service for low-income and older adults that helps with things like roof or
window repairs Total
Extremely important 49%
Very important 38%
Somewhat important 6%
Not very important 2%
Not at all important 2%
No response 3%
D. Seasonal services such as lawn work or snow removal for low-income and older adults Total
Extremely important 36%
Very important 39%
Somewhat important 11%
Not very important 8%
Not at all important 2%
No response 3%
E. Affordable housing options for adults of varying income levels such as older active
adult communities, assisted living and communities with shared facilities and outdoor
spaces. Total
Extremely important 38%
Very important 38%
Somewhat important 13%
Not very important 6%
Not at all important 2%
No response 4%
F. Homes that are equipped with things like a no step entrance, wider doorways, grab bars
in bathrooms, and first floor bedrooms and bathrooms Total
Extremely important 44%
Very important 30%
Somewhat important 14%
Not very important 6%
Not at all important 1%
No response 4%
S urvey Annotation.L ivability forAll:T he2016 Age-Friendly Com m unity S urvey ofBrow nsvilleAAR P M em bersAge50-P lus 7

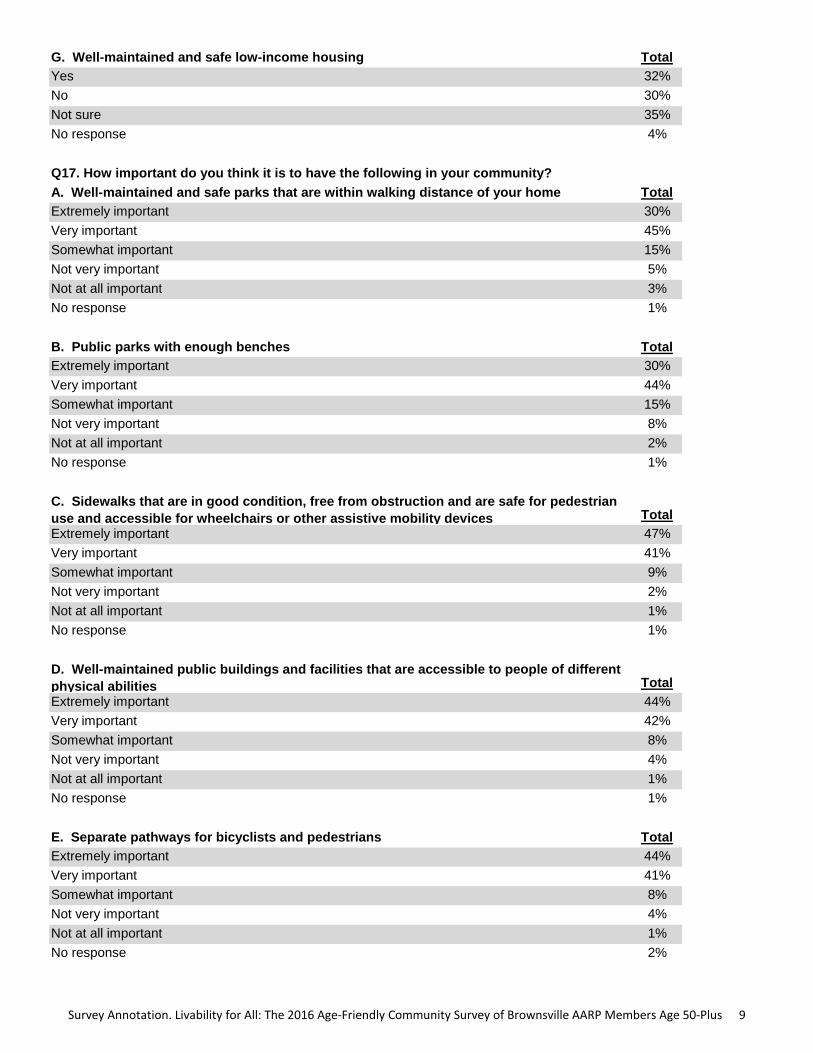
G. Well-maintained and safe low-income housing Total
Extremely important 47%
Very important 35%
Somewhat important 9%
Not very important 3%
Not at all important 2%
No response 5%
Q16. Does the community where you live have the following?
A. Home repair contractors who are trustworthy, do quality work and are affordable Total
Yes 34%
No 23%
Not sure 42%
No response 2%
B. Well-maintained homes and properties Total
Yes 51%
No 24%
Not sure 21%
No response 3%
C. A home repair service for low-income and older adults that helps with things like roof or
window repairs Total
Yes 25%
No 32%
Not sure 39%
No response 3%
D. Seasonal services such as lawn work or snow removal for low-income and older adults Total
Yes 34%
No 32%
Not sure 31%
No response 3%
E. Affordable home options for adults of varying income levels such as older active adult
communities, assisted living and communities with shared facilities and outdoor spaces Total
Yes 36%
No 28%
Not sure 32%
No response 4%
F. Homes that are equipped with things like a no step entrance, wider doorways, grab bars
in bathrooms, and first floor bedrooms and bathrooms Total
Yes 32%
No 27%
Not sure 37%
No response 4%
S urvey Annotation.L ivability forAll:T he2016 Age-Friendly Com m unity S urvey ofBrow nsvilleAAR P M em bersAge50-P lus 8
G. Well-maintained and safe low-income housing Total
Yes 32%
No 30%
Not sure 35%
No response 4%
Q17. How important do you think it is to have the following in your community?
A. Well-maintained and safe parks that are within walking distance of your home Total
Extremely important 30%
Very important 45%
Somewhat important 15%
Not very important 5%
Not at all important 3%
No response 1%
B. Public parks with enough benches Total
Extremely important 30%
Very important 44%
Somewhat important 15%
Not very important 8%
Not at all important 2%
No response 1%
C. Sidewalks that are in good condition, free from obstruction and are safe for pedestrian
use and accessible for wheelchairs or other assistive mobility devices Total
Extremely important 47%
Very important 41%
Somewhat important 9%
Not very important 2%
Not at all important 1%
No response 1%
D. Well-maintained public buildings and facilities that are accessible to people of different
physical abilities Total
Extremely important 44%
Very important 42%
Somewhat important 8%
Not very important 4%
Not at all important 1%
No response 1%
E. Separate pathways for bicyclists and pedestrians Total
Extremely important 44%
Very important 41%
Somewhat important 8%
Not very important 4%
Not at all important 1%
No response 2%
S urvey Annotation.L ivability forAll:T he2016 Age-Friendly Com m unity S urvey ofBrow nsvilleAAR P M em bersAge50-P lus 9
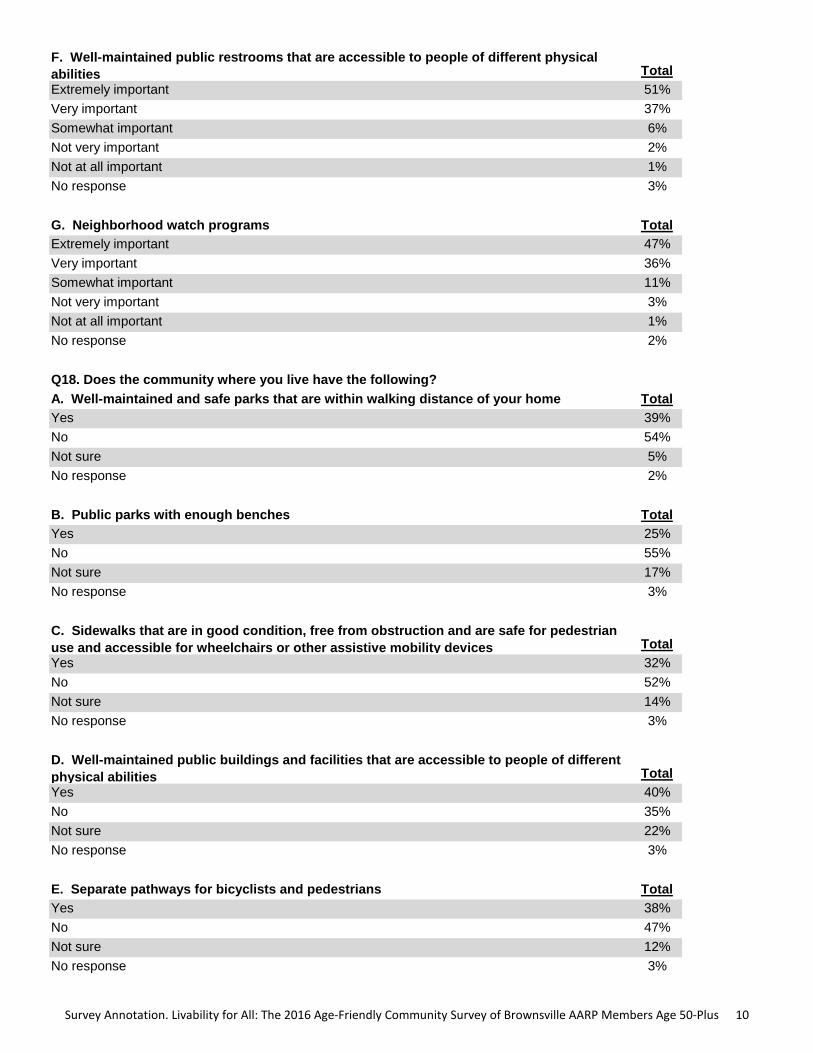
F. Well-maintained public restrooms that are accessible to people of different physical
abilities Total
Extremely important 51%
Very important 37%
Somewhat important 6%
Not very important 2%
Not at all important 1%
No response 3%
G. Neighborhood watch programs Total
Extremely important 47%
Very important 36%
Somewhat important 11%
Not very important 3%
Not at all important 1%
No response 2%
Q18. Does the community where you live have the following?
A. Well-maintained and safe parks that are within walking distance of your home Total
Yes 39%
No 54%
Not sure 5%
No response 2%
B. Public parks with enough benches Total
Yes 25%
No 55%
Not sure 17%
No response 3%
C. Sidewalks that are in good condition, free from obstruction and are safe for pedestrian
use and accessible for wheelchairs or other assistive mobility devices Total
Yes 32%
No 52%
Not sure 14%
No response 3%
D. Well-maintained public buildings and facilities that are accessible to people of different
physical abilities Total
Yes 40%
No 35%
Not sure 22%
No response 3%
E. Separate pathways for bicyclists and pedestrians Total
Yes 38%
No 47%
Not sure 12%
No response 3%
S urvey Annotation.L ivability forAll:T he2016 Age-Friendly Com m unity S urvey ofBrow nsvilleAAR P M em bersAge50-P lus 10

F. Well-maintained public restrooms that are accessible to people of different physical
abilities Total
Yes 28%
No 49%
Not sure 21%
No response 2%
G. Neighborhood watch programs Total
Yes 22%
No 56%
Not sure 20%
No response 2%
Q19. Do you get around for things like shopping, visiting the doctor, running errands, or
going to other places in the following ways?A. Drive yourself Total
Yes 82%
No 14%
No response 4%
B. Have others drive you Total
Yes 21%
No 68%
No response 12%
C. Walk Total
Yes 30%
No 59%
No response 11%
D. Ride a bike Total
Yes 12%
No 76%
No response 12%
E. Use public transportation Total
Yes 10%
No 80%
No response 10%
F. Take a taxi/cab Total
Yes 4%
No 85%
No response 11%
G. Use a special transportation service, such as one for seniors or persons with
disabilities Total
Yes 4%
No 85%
No response 12%
S urvey Annotation.L ivability forAll:T he2016 Age-Friendly Com m unity S urvey ofBrow nsvilleAAR P M em bersAge50-P lus 11
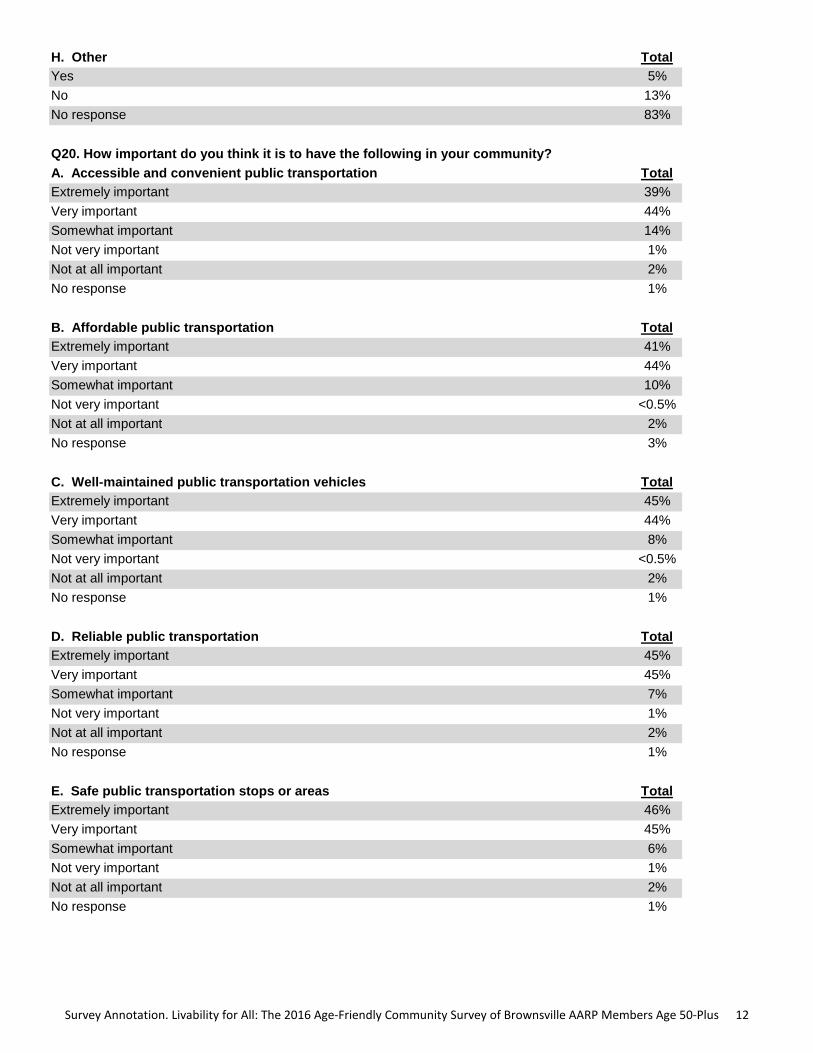
H. Other Total
Yes 5%
No 13%
No response 83%
Q20. How important do you think it is to have the following in your community?
A. Accessible and convenient public transportation Total
Extremely important 39%
Very important 44%
Somewhat important 14%
Not very important 1%
Not at all important 2%
No response 1%
B. Affordable public transportation Total
Extremely important 41%
Very important 44%
Somewhat important 10%
Not very important <0.5%
Not at all important 2%
No response 3%
C. Well-maintained public transportation vehicles Total
Extremely important 45%
Very important 44%
Somewhat important 8%
Not very important <0.5%
Not at all important 2%
No response 1%
D. Reliable public transportation Total
Extremely important 45%
Very important 45%
Somewhat important 7%
Not very important 1%
Not at all important 2%
No response 1%
E. Safe public transportation stops or areas Total
Extremely important 46%
Very important 45%
Somewhat important 6%
Not very important 1%
Not at all important 2%
No response 1%
S urvey Annotation.L ivability forAll:T he2016 Age-Friendly Com m unity S urvey ofBrow nsvilleAAR P M em bersAge50-P lus 12
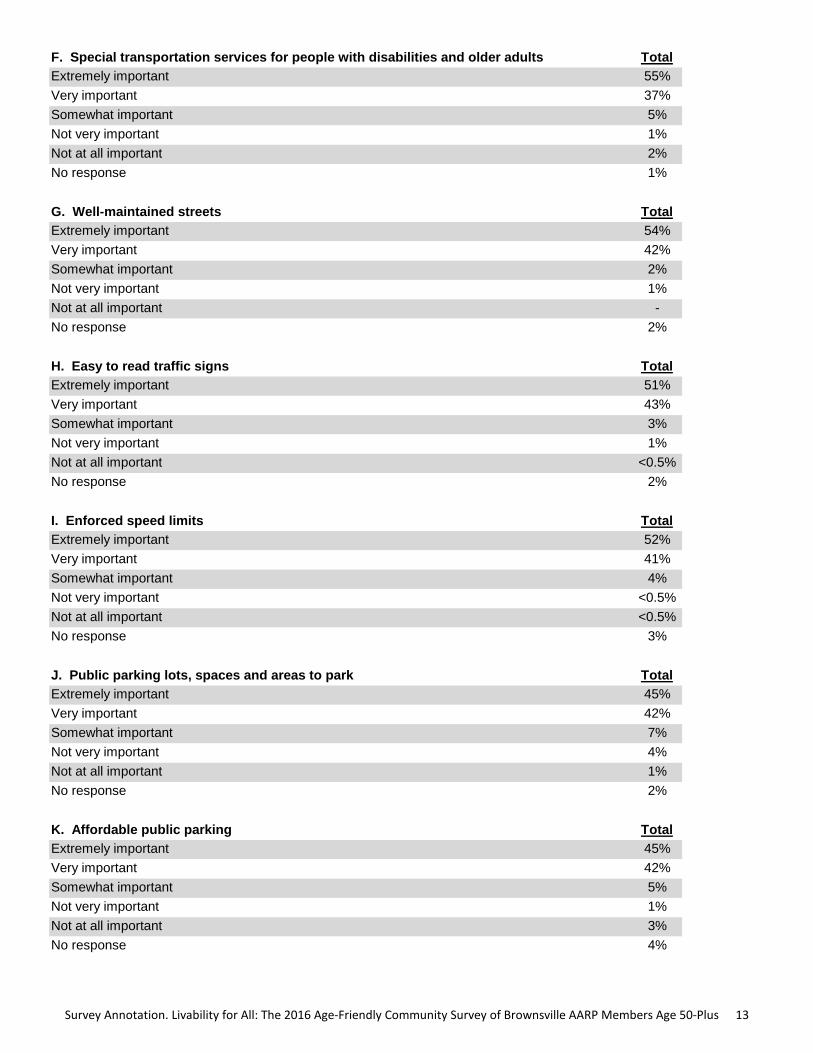
F. Special transportation services for people with disabilities and older adults Total
Extremely important 55%
Very important 37%
Somewhat important 5%
Not very important 1%
Not at all important 2%
No response 1%
G. Well-maintained streets Total
Extremely important 54%
Very important 42%
Somewhat important 2%
Not very important 1%
Not at all important -
No response 2%
H. Easy to read traffic signs Total
Extremely important 51%
Very important 43%
Somewhat important 3%
Not very important 1%
Not at all important <0.5%
No response 2%
I. Enforced speed limits Total
Extremely important 52%
Very important 41%
Somewhat important 4%
Not very important <0.5%
Not at all important <0.5%
No response 3%
J. Public parking lots, spaces and areas to park Total
Extremely important 45%
Very important 42%
Somewhat important 7%
Not very important 4%
Not at all important 1%
No response 2%
K. Affordable public parking Total
Extremely important 45%
Very important 42%
Somewhat important 5%
Not very important 1%
Not at all important 3%
No response 4%
S urvey Annotation.L ivability forAll:T he2016 Age-Friendly Com m unity S urvey ofBrow nsvilleAAR P M em bersAge50-P lus 13
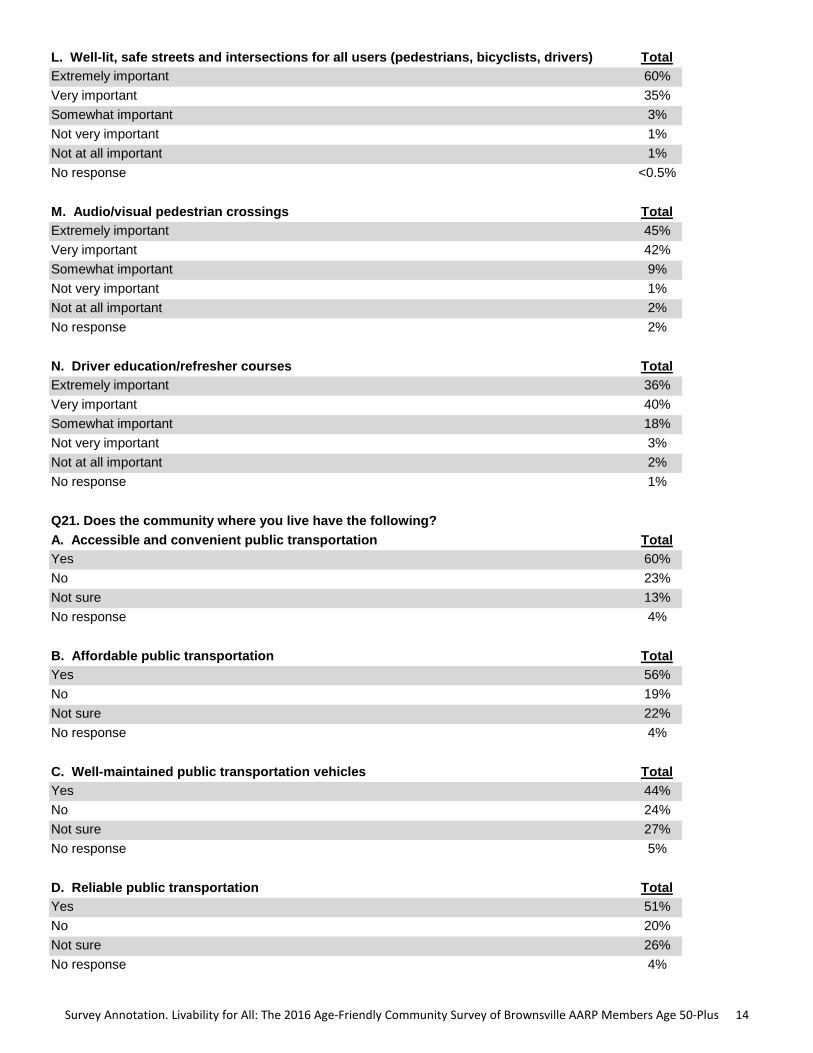
L. Well-lit, safe streets and intersections for all users (pedestrians, bicyclists, drivers) Total
Extremely important 60%
Very important 35%
Somewhat important 3%
Not very important 1%
Not at all important 1%
No response <0.5%
M. Audio/visual pedestrian crossings Total
Extremely important 45%
Very important 42%
Somewhat important 9%
Not very important 1%
Not at all important 2%
No response 2%
N. Driver education/refresher courses Total
Extremely important 36%
Very important 40%
Somewhat important 18%
Not very important 3%
Not at all important 2%
No response 1%
Q21. Does the community where you live have the following?
A. Accessible and convenient public transportation Total
Yes 60%
No 23%
Not sure 13%
No response 4%
B. Affordable public transportation Total
Yes 56%
No 19%
Not sure 22%
No response 4%
C. Well-maintained public transportation vehicles Total
Yes 44%
No 24%
Not sure 27%
No response 5%
D. Reliable public transportation Total
Yes 51%
No 20%
Not sure 26%
No response 4%
S urvey Annotation.L ivability forAll:T he2016 Age-Friendly Com m unity S urvey ofBrow nsvilleAAR P M em bersAge50-P lus 14
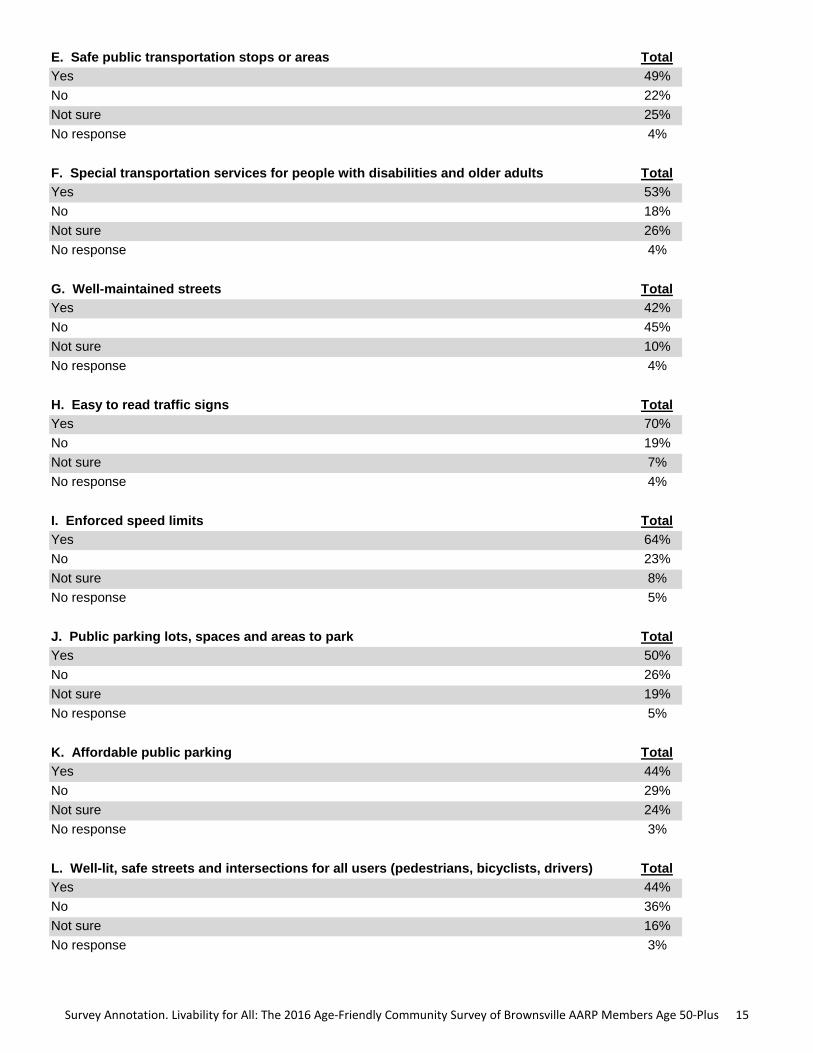
E. Safe public transportation stops or areas Total
Yes 49%
No 22%
Not sure 25%
No response 4%
F. Special transportation services for people with disabilities and older adults Total
Yes 53%
No 18%
Not sure 26%
No response 4%
G. Well-maintained streets Total
Yes 42%
No 45%
Not sure 10%
No response 4%
H. Easy to read traffic signs Total
Yes 70%
No 19%
Not sure 7%
No response 4%
I. Enforced speed limits Total
Yes 64%
No 23%
Not sure 8%
No response 5%
J. Public parking lots, spaces and areas to park Total
Yes 50%
No 26%
Not sure 19%
No response 5%
K. Affordable public parking Total
Yes 44%
No 29%
Not sure 24%
No response 3%
L. Well-lit, safe streets and intersections for all users (pedestrians, bicyclists, drivers) Total
Yes 44%
No 36%
Not sure 16%
No response 3%
S urvey Annotation.L ivability forAll:T he2016 Age-Friendly Com m unity S urvey ofBrow nsvilleAAR P M em bersAge50-P lus 15
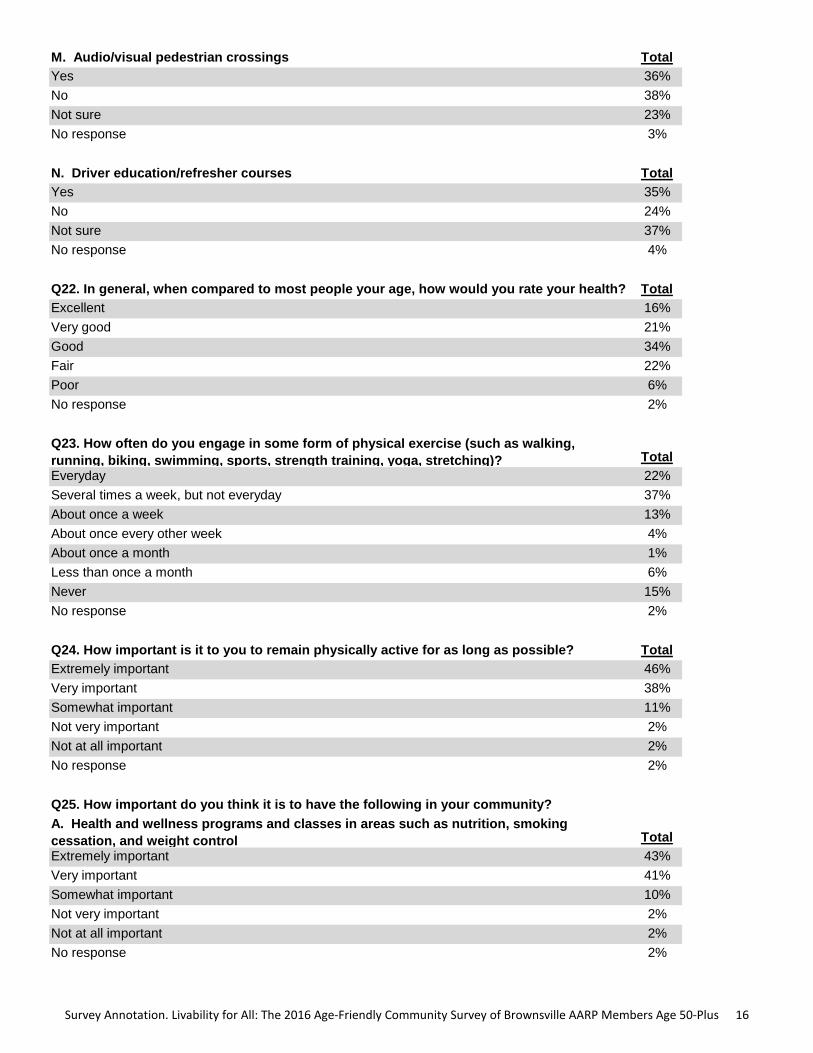
M. Audio/visual pedestrian crossings Total
Yes 36%
No 38%
Not sure 23%
No response 3%
N. Driver education/refresher courses Total
Yes 35%
No 24%
Not sure 37%
No response 4%
Q22. In general, when compared to most people your age, how would you rate your health? Total
Excellent 16%
Very good 21%
Good 34%
Fair 22%
Poor 6%
No response 2%
Q23. How often do you engage in some form of physical exercise (such as walking,
running, biking, swimming, sports, strength training, yoga, stretching)? Total
Everyday 22%
Several times a week, but not everyday 37%
About once a week 13%
About once every other week 4%
About once a month 1%
Less than once a month 6%
Never 15%
No response 2%
Q24. How important is it to you to remain physically active for as long as possible? Total
Extremely important 46%
Very important 38%
Somewhat important 11%
Not very important 2%
Not at all important 2%
No response 2%
Q25. How important do you think it is to have the following in your community?
A. Health and wellness programs and classes in areas such as nutrition, smoking
cessation, and weight control Total
Extremely important 43%
Very important 41%
Somewhat important 10%
Not very important 2%
Not at all important 2%
No response 2%
S urvey Annotation.L ivability forAll:T he2016 Age-Friendly Com m unity S urvey ofBrow nsvilleAAR P M em bersAge50-P lus 16
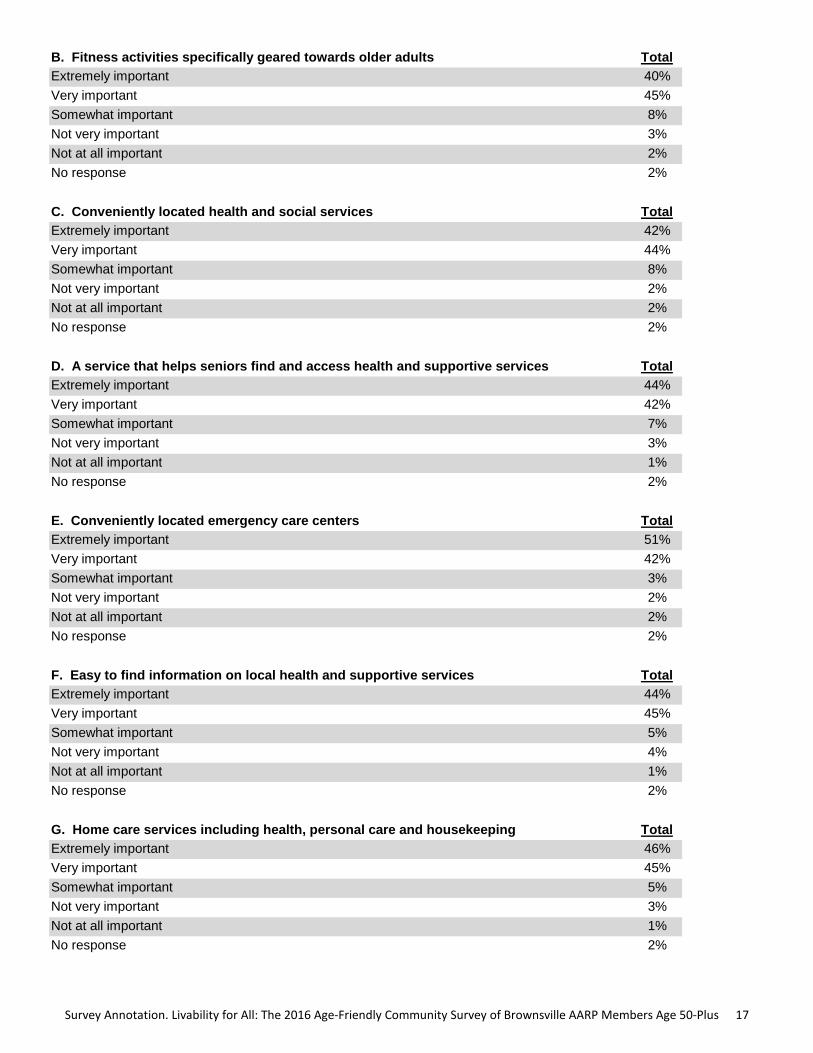
B. Fitness activities specifically geared towards older adults Total
Extremely important 40%
Very important 45%
Somewhat important 8%
Not very important 3%
Not at all important 2%
No response 2%
C. Conveniently located health and social services Total
Extremely important 42%
Very important 44%
Somewhat important 8%
Not very important 2%
Not at all important 2%
No response 2%
D. A service that helps seniors find and access health and supportive services Total
Extremely important 44%
Very important 42%
Somewhat important 7%
Not very important 3%
Not at all important 1%
No response 2%
E. Conveniently located emergency care centers Total
Extremely important 51%
Very important 42%
Somewhat important 3%
Not very important 2%
Not at all important 2%
No response 2%
F. Easy to find information on local health and supportive services Total
Extremely important 44%
Very important 45%
Somewhat important 5%
Not very important 4%
Not at all important 1%
No response 2%
G. Home care services including health, personal care and housekeeping Total
Extremely important 46%
Very important 45%
Somewhat important 5%
Not very important 3%
Not at all important 1%
No response 2%
S urvey Annotation.L ivability forAll:T he2016 Age-Friendly Com m unity S urvey ofBrow nsvilleAAR P M em bersAge50-P lus 17

H. Well-trained certified home health care providers Total
Extremely important 51%
Very important 40%
Somewhat important 4%
Not very important 1%
Not at all important 1%
No response 3%
I. Affordable home health care providers Total
Extremely important 52%
Very important 42%
Somewhat important 3%
Not very important <0.5%
Not at all important 1%
No response 2%
J. Well-maintained hospitals and health care facilities Total
Extremely important 57%
Very important 38%
Somewhat important 1%
Not very important <0.5%
Not at all important 1%
No response 3%
K. A variety of health care professionals including specialists Total
Extremely important 57%
Very important 37%
Somewhat important 3%
Not very important <0.5%
Not at all important 1%
No response 2%
L. Health care professionals who speak different languages Total
Extremely important 50%
Very important 36%
Somewhat important 6%
Not very important 3%
Not at all important 2%
No response 4%
M. Easily understandable and helpful local hospital or clinic answering services Total
Extremely important 52%
Very important 41%
Somewhat important 4%
Not very important 1%
Not at all important 1%
No response 2%
S urvey Annotation.L ivability forAll:T he2016 Age-Friendly Com m unity S urvey ofBrow nsvilleAAR P M em bersAge50-P lus 18

N. Respectful and helpful hospital and clinic staff Total
Extremely important 53%
Very important 41%
Somewhat important 2%
Not very important 1%
Not at all important 2%
No response 2%
Q26. Does the community where you live have the following?
A. Health and wellness programs and classes in areas such as nutrition, smoking
cessation, and weight control Total
Yes 38%
No 19%
Not sure 39%
No response 4%
B. Fitness activities specifically geared towards older adults Total
Yes 30%
No 24%
Not sure 41%
No response 5%
C. Conveniently located health and social services Total
Yes 39%
No 22%
Not sure 34%
No response 5%
D. A service that helps seniors find and access health and supportive services Total
Yes 29%
No 23%
Not sure 45%
No response 4%
E. Conveniently located emergency care centers Total
Yes 50%
No 21%
Not sure 25%
No response 5%
F. Easy to find information on local health and supportive services Total
Yes 31%
No 22%
Not sure 42%
No response 5%
S urvey Annotation.L ivability forAll:T he2016 Age-Friendly Com m unity S urvey ofBrow nsvilleAAR P M em bersAge50-P lus 19
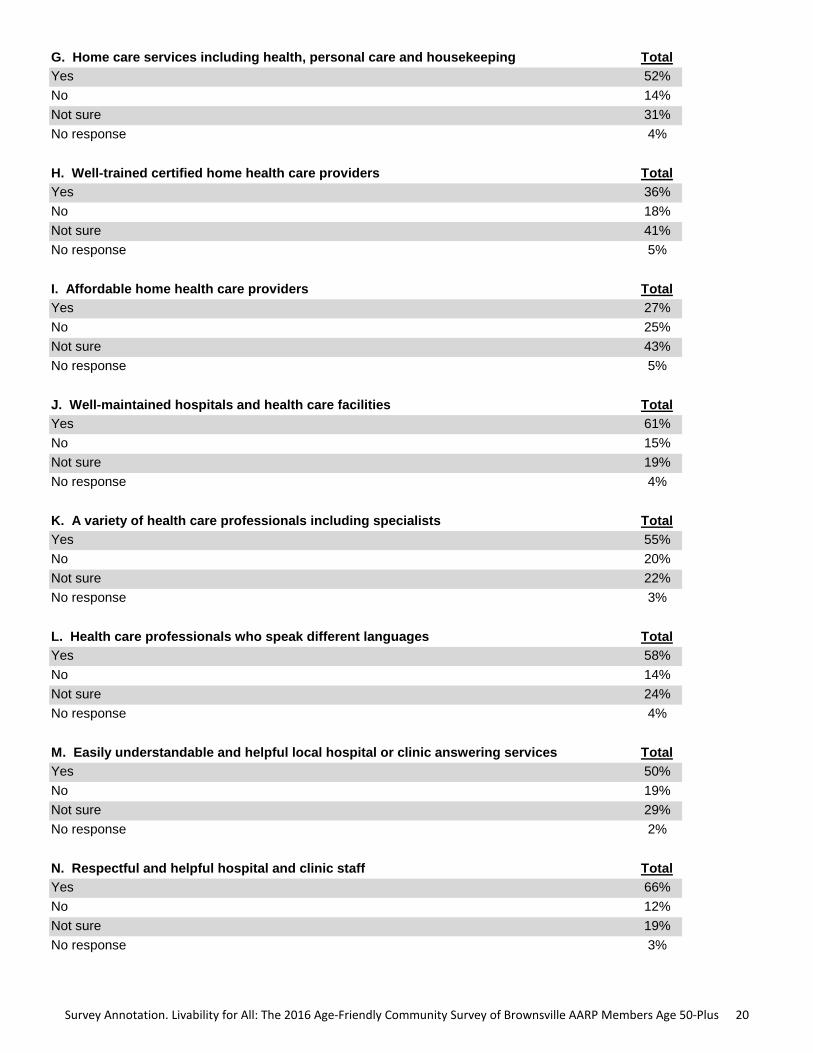
G. Home care services including health, personal care and housekeeping Total
Yes 52%
No 14%
Not sure 31%
No response 4%
H. Well-trained certified home health care providers Total
Yes 36%
No 18%
Not sure 41%
No response 5%
I. Affordable home health care providers Total
Yes 27%
No 25%
Not sure 43%
No response 5%
J. Well-maintained hospitals and health care facilities Total
Yes 61%
No 15%
Not sure 19%
No response 4%
K. A variety of health care professionals including specialists Total
Yes 55%
No 20%
Not sure 22%
No response 3%
L. Health care professionals who speak different languages Total
Yes 58%
No 14%
Not sure 24%
No response 4%
M. Easily understandable and helpful local hospital or clinic answering services Total
Yes 50%
No 19%
Not sure 29%
No response 2%
N. Respectful and helpful hospital and clinic staff Total
Yes 66%
No 12%
Not sure 19%
No response 3%
S urvey Annotation.L ivability forAll:T he2016 Age-Friendly Com m unity S urvey ofBrow nsvilleAAR P M em bersAge50-P lus 20

Q27. About how frequently do you interact with your friends, family or neighbors in your
community? This interaction could be by phone, in person, email, or social media like
Facebook. Total
More than once a day 32%
About once a day 14%
Several times a week 23%
Once a week 10%
Once every 2 or 3 weeks 9%
Once a month 4%
Less than monthly 4%
Never 6%
No response <0.5%
Q28. Where do you typically go for continuing education or self-improvement
classes/workshops in your community? Total
University/Community College 9%
Department of Parks and Recreation 4%
Faith community 19%
Local organizations or businesses 4%
Community center 5%
Senior center 3%
Offerings through my work 9%
Online programs 10%
Other, please specify 6%
I do NOT participate in any continuing education/self-improvement classes 54%
No response 5%
Q29. How important do you think it is to have the following in your community?
A. Conveniently located venues for entertainment Total
Extremely important 25%
Very important 42%
Somewhat important 22%
Not very important 6%
Not at all important 3%
No response 3%
B. Activities specifically geared towards older adults Total
Extremely important 30%
Very important 44%
Somewhat important 19%
Not very important 3%
Not at all important 2%
No response 3%
S urvey Annotation.L ivability forAll:T he2016 Age-Friendly Com m unity S urvey ofBrow nsvilleAAR P M em bersAge50-P lus 21
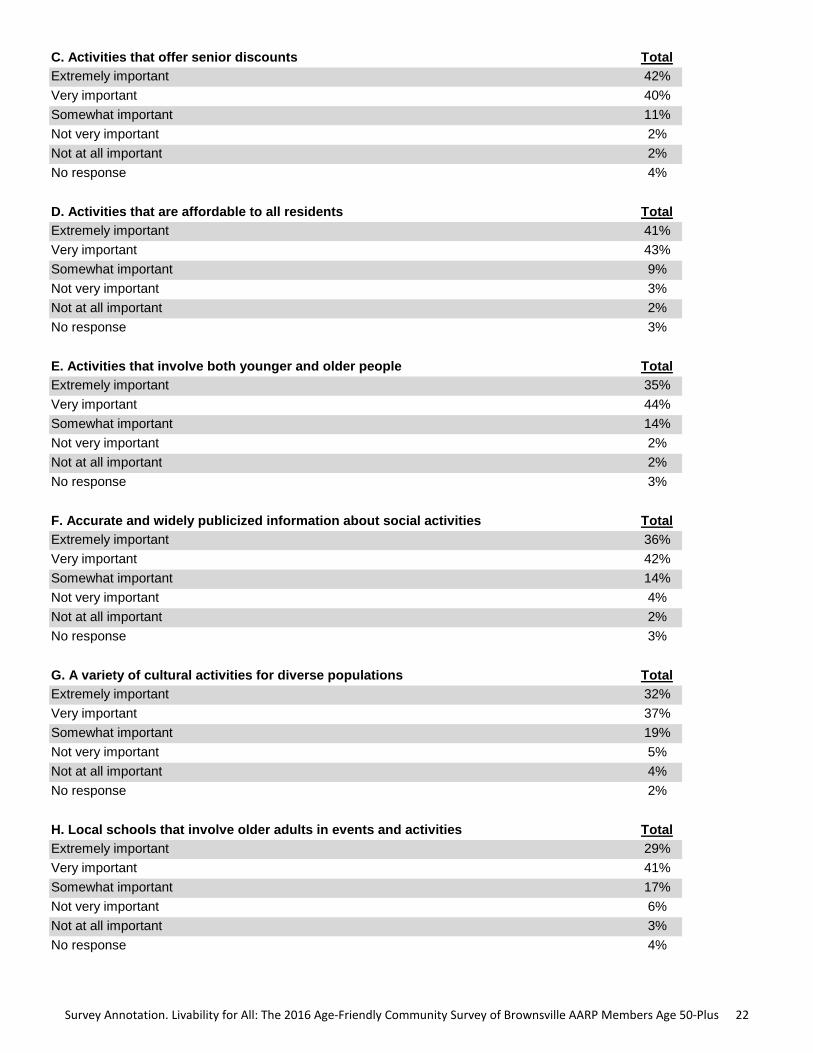
C. Activities that offer senior discounts Total
Extremely important 42%
Very important 40%
Somewhat important 11%
Not very important 2%
Not at all important 2%
No response 4%
D. Activities that are affordable to all residents Total
Extremely important 41%
Very important 43%
Somewhat important 9%
Not very important 3%
Not at all important 2%
No response 3%
E. Activities that involve both younger and older people Total
Extremely important 35%
Very important 44%
Somewhat important 14%
Not very important 2%
Not at all important 2%
No response 3%
F. Accurate and widely publicized information about social activities Total
Extremely important 36%
Very important 42%
Somewhat important 14%
Not very important 4%
Not at all important 2%
No response 3%
G. A variety of cultural activities for diverse populations Total
Extremely important 32%
Very important 37%
Somewhat important 19%
Not very important 5%
Not at all important 4%
No response 2%
H. Local schools that involve older adults in events and activities Total
Extremely important 29%
Very important 41%
Somewhat important 17%
Not very important 6%
Not at all important 3%
No response 4%
S urvey Annotation.L ivability forAll:T he2016 Age-Friendly Com m unity S urvey ofBrow nsvilleAAR P M em bersAge50-P lus 22
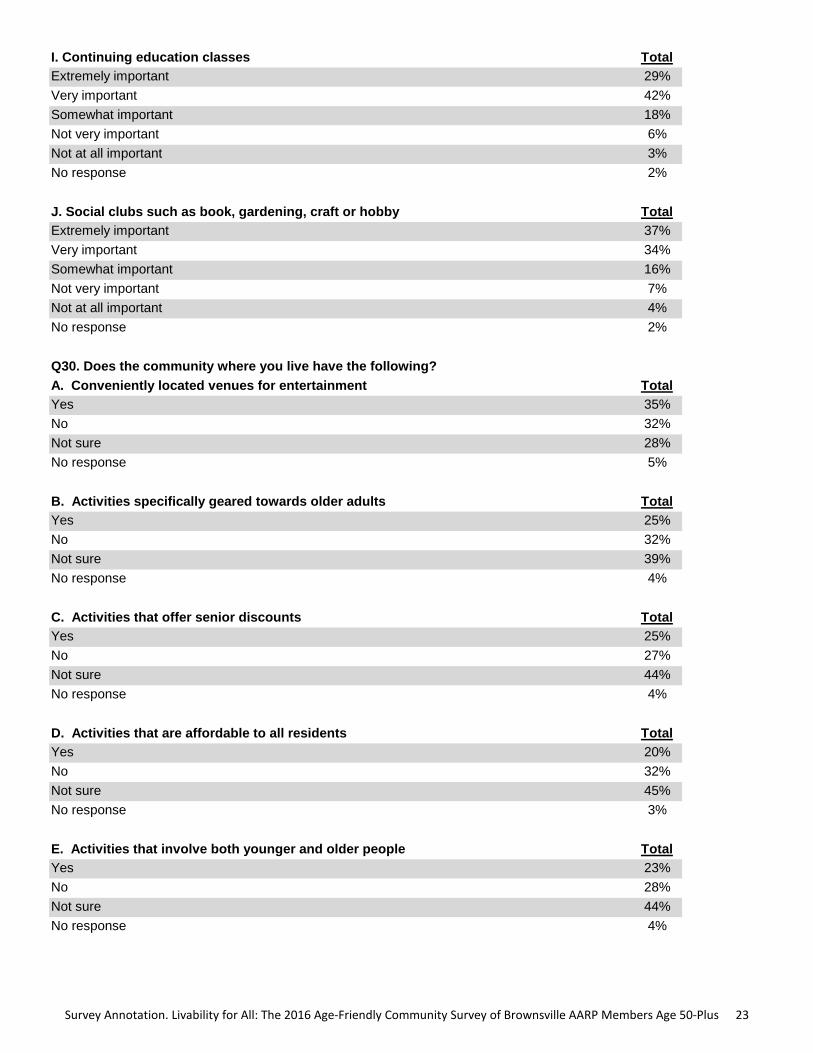
I. Continuing education classes Total
Extremely important 29%
Very important 42%
Somewhat important 18%
Not very important 6%
Not at all important 3%
No response 2%
J. Social clubs such as book, gardening, craft or hobby Total
Extremely important 37%
Very important 34%
Somewhat important 16%
Not very important 7%
Not at all important 4%
No response 2%
Q30. Does the community where you live have the following?
A. Conveniently located venues for entertainment Total
Yes 35%
No 32%
Not sure 28%
No response 5%
B. Activities specifically geared towards older adults Total
Yes 25%
No 32%
Not sure 39%
No response 4%
C. Activities that offer senior discounts Total
Yes 25%
No 27%
Not sure 44%
No response 4%
D. Activities that are affordable to all residents Total
Yes 20%
No 32%
Not sure 45%
No response 3%
E. Activities that involve both younger and older people Total
Yes 23%
No 28%
Not sure 44%
No response 4%
S urvey Annotation.L ivability forAll:T he2016 Age-Friendly Com m unity S urvey ofBrow nsvilleAAR P M em bersAge50-P lus 23
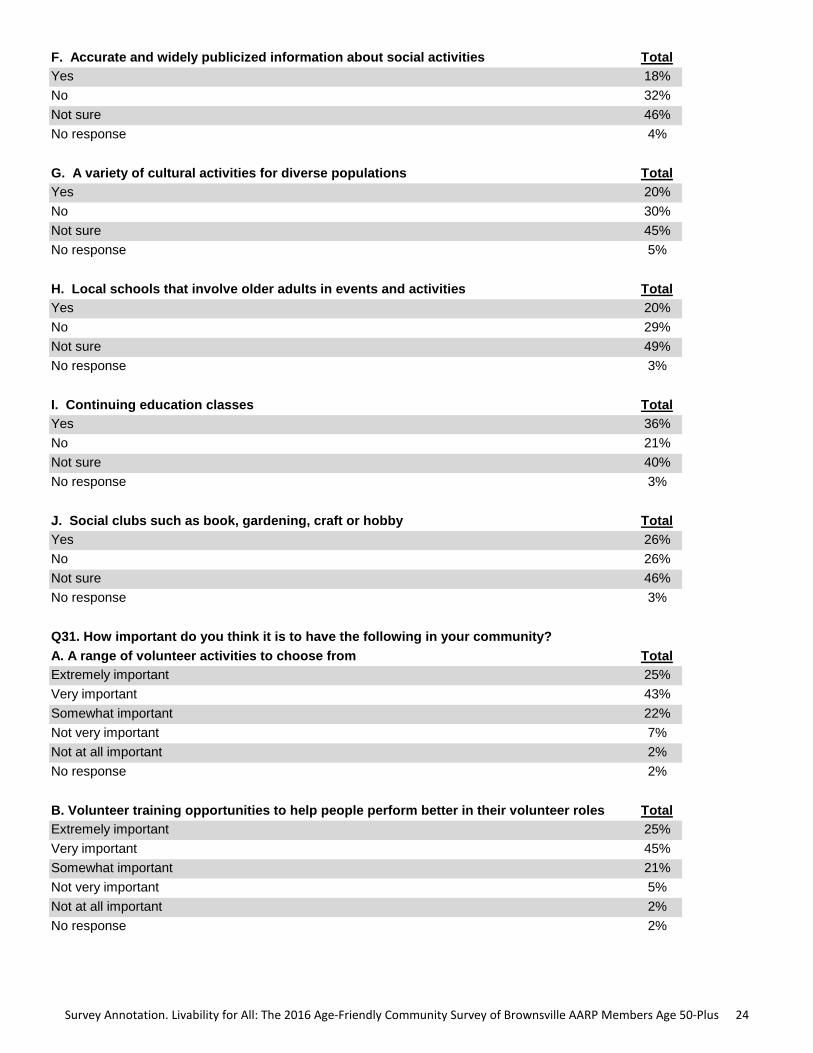
F. Accurate and widely publicized information about social activities Total
Yes 18%
No 32%
Not sure 46%
No response 4%
G. A variety of cultural activities for diverse populations Total
Yes 20%
No 30%
Not sure 45%
No response 5%
H. Local schools that involve older adults in events and activities Total
Yes 20%
No 29%
Not sure 49%
No response 3%
I. Continuing education classes Total
Yes 36%
No 21%
Not sure 40%
No response 3%
J. Social clubs such as book, gardening, craft or hobby Total
Yes 26%
No 26%
Not sure 46%
No response 3%
Q31. How important do you think it is to have the following in your community?
A. A range of volunteer activities to choose from Total
Extremely important 25%
Very important 43%
Somewhat important 22%
Not very important 7%
Not at all important 2%
No response 2%
B. Volunteer training opportunities to help people perform better in their volunteer roles Total
Extremely important 25%
Very important 45%
Somewhat important 21%
Not very important 5%
Not at all important 2%
No response 2%
S urvey Annotation.L ivability forAll:T he2016 Age-Friendly Com m unity S urvey ofBrow nsvilleAAR P M em bersAge50-P lus 24

C. Opportunities for older adults to participate in decision making bodies such as
community councils or committees Total
Extremely important 28%
Very important 41%
Somewhat important 22%
Not very important 5%
Not at all important 2%
No response 3%
D. Easy to find information on available local volunteer opportunities Total
Extremely important 26%
Very important 43%
Somewhat important 20%
Not very important 6%
Not at all important 2%
No response 3%
E. Transportation to and from volunteer activities for those who need it Total
Extremely important 29%
Very important 50%
Somewhat important 12%
Not very important 6%
Not at all important 1%
No response 2%
Q32. Does the community where you live have the following?
A. A range of volunteer activities to choose from Total
Yes 22%
No 30%
Not sure 45%
No response 4%
B. Volunteer training opportunities to help people perform better in their volunteer roles Total
Yes 15%
No 32%
Not sure 50%
No response 3%
C. Opportunities for older adults to participate in decision making bodies such as
community councils or committees Total
Yes 17%
No 31%
Not sure 49%
No response 4%
D. Easy to find information on available local volunteer opportunities Total
Yes 14%
No 33%
Not sure 49%
No response 4%
S urvey Annotation.L ivability forAll:T he2016 Age-Friendly Com m unity S urvey ofBrow nsvilleAAR P M em bersAge50-P lus 25
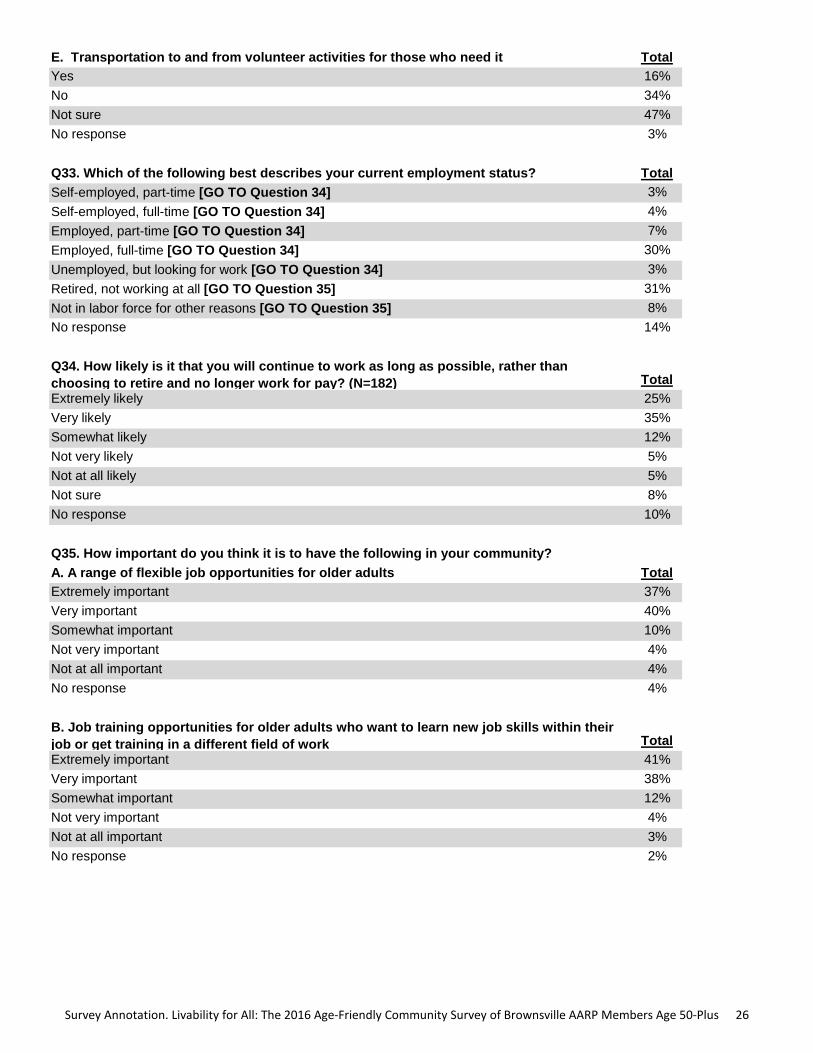
E. Transportation to and from volunteer activities for those who need it Total
Yes 16%
No 34%
Not sure 47%
No response 3%
Q33. Which of the following best describes your current employment status? Total
Self-employed, part-time [GO TO Question 34] 3%
Self-employed, full-time [GO TO Question 34] 4%
Employed, part-time [GO TO Question 34] 7%
Employed, full-time [GO TO Question 34] 30%
Unemployed, but looking for work [GO TO Question 34] 3%
Retired, not working at all [GO TO Question 35] 31%
Not in labor force for other reasons [GO TO Question 35] 8%
No response 14%
Q34. How likely is it that you will continue to work as long as possible, rather than
choosing to retire and no longer work for pay? (N=182) Total
Extremely likely 25%
Very likely 35%
Somewhat likely 12%
Not very likely 5%
Not at all likely 5%
Not sure 8%
No response 10%
Q35. How important do you think it is to have the following in your community?
A. A range of flexible job opportunities for older adults Total
Extremely important 37%
Very important 40%
Somewhat important 10%
Not very important 4%
Not at all important 4%
No response 4%
B. Job training opportunities for older adults who want to learn new job skills within their
job or get training in a different field of work Total
Extremely important 41%
Very important 38%
Somewhat important 12%
Not very important 4%
Not at all important 3%
No response 2%
S urvey Annotation.L ivability forAll:T he2016 Age-Friendly Com m unity S urvey ofBrow nsvilleAAR P M em bersAge50-P lus 26
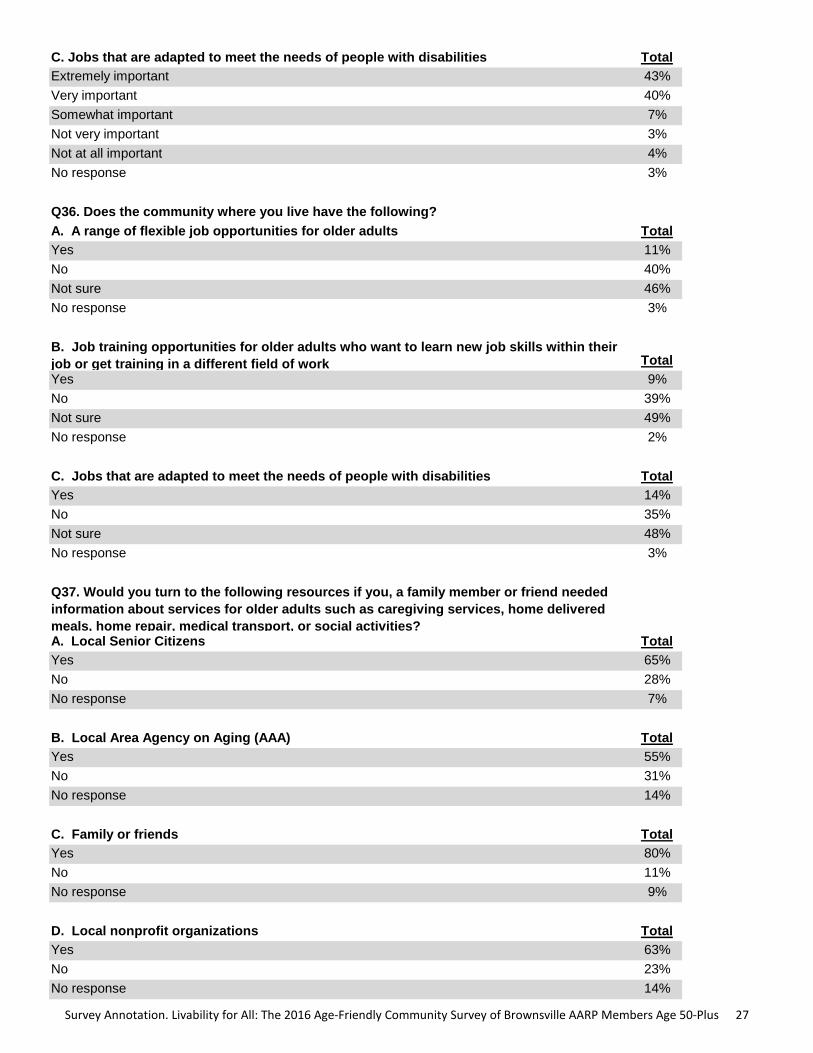
C. Jobs that are adapted to meet the needs of people with disabilities Total
Extremely important 43%
Very important 40%
Somewhat important 7%
Not very important 3%
Not at all important 4%
No response 3%
Q36. Does the community where you live have the following?
A. A range of flexible job opportunities for older adults Total
Yes 11%
No 40%
Not sure 46%
No response 3%
B. Job training opportunities for older adults who want to learn new job skills within their
job or get training in a different field of work Total
Yes 9%
No 39%
Not sure 49%
No response 2%
C. Jobs that are adapted to meet the needs of people with disabilities Total
Yes 14%
No 35%
Not sure 48%
No response 3%
Q37. Would you turn to the following resources if you, a family member or friend needed
information about services for older adults such as caregiving services, home delivered
meals, home repair, medical transport, or social activities?A. Local Senior Citizens Total
Yes 65%
No 28%
No response 7%
B. Local Area Agency on Aging (AAA) Total
Yes 55%
No 31%
No response 14%
C. Family or friends Total
Yes 80%
No 11%
No response 9%
D. Local nonprofit organizations Total
Yes 63%
No 23%
No response 14%
S urvey Annotation.L ivability forAll:T he2016 Age-Friendly Com m unity S urvey ofBrow nsvilleAAR P M em bersAge50-P lus 27
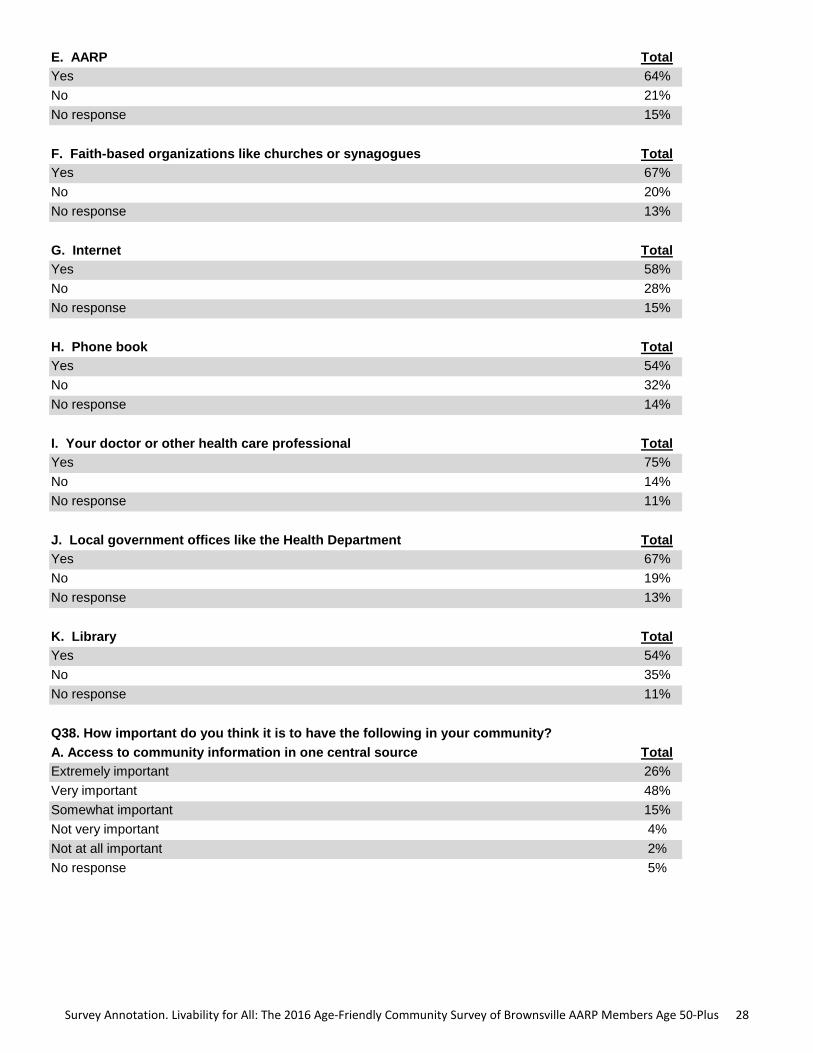
E. AARP Total
Yes 64%
No 21%
No response 15%
F. Faith-based organizations like churches or synagogues Total
Yes 67%
No 20%
No response 13%
G. Internet Total
Yes 58%
No 28%
No response 15%
H. Phone book Total
Yes 54%
No 32%
No response 14%
I. Your doctor or other health care professional Total
Yes 75%
No 14%
No response 11%
J. Local government offices like the Health Department Total
Yes 67%
No 19%
No response 13%
K. Library Total
Yes 54%
No 35%
No response 11%
Q38. How important do you think it is to have the following in your community?
A. Access to community information in one central source Total
Extremely important 26%
Very important 48%
Somewhat important 15%
Not very important 4%
Not at all important 2%
No response 5%
S urvey Annotation.L ivability forAll:T he2016 Age-Friendly Com m unity S urvey ofBrow nsvilleAAR P M em bersAge50-P lus 28

B. Clearly displayed printed community information with large lettering Total
Extremely important 29%
Very important 50%
Somewhat important 12%
Not very important 3%
Not at all important 2%
No response 4%
C. An automated community information source that is easy to understand like a toll-free
telephone number Total
Extremely important 30%
Very important 47%
Somewhat important 10%
Not very important 5%
Not at all important 3%
No response 6%
D. Free access to computers and the Internet in public places such as the library, senior
centers or government buildings Total
Extremely important 34%
Very important 47%
Somewhat important 9%
Not very important 3%
Not at all important 4%
No response 4%
E. Community information that is delivered in person to people who may have difficulty or
may not be able to leave their home Total
Extremely important 40%
Very important 40%
Somewhat important 9%
Not very important 4%
Not at all important 3%
No response 3%
F. Community information that is available in a number of different languages Total
Extremely important 37%
Very important 39%
Somewhat important 12%
Not very important 5%
Not at all important 3%
No response 4%
Q39. Does the community where you live have the following?
A. Access to community information in one central source Total
Yes 13%
No 30%
Not sure 52%
No response 5%
S urvey Annotation.L ivability forAll:T he2016 Age-Friendly Com m unity S urvey ofBrow nsvilleAAR P M em bersAge50-P lus 29
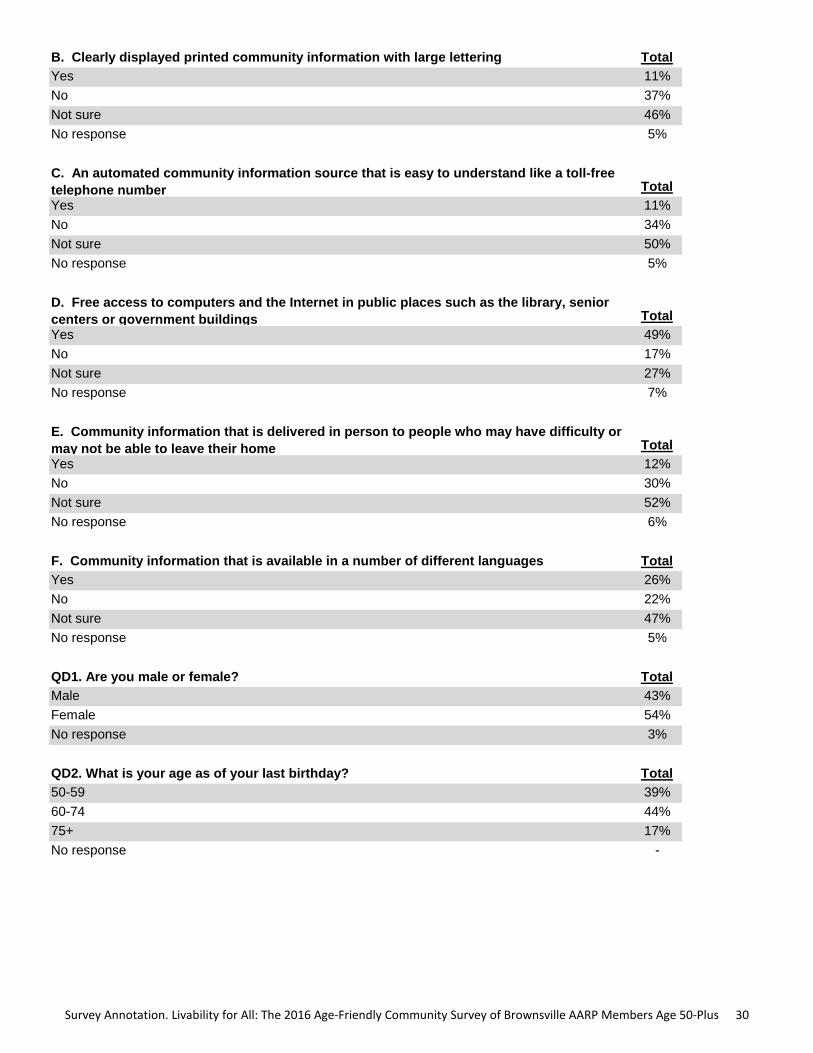
B. Clearly displayed printed community information with large lettering Total
Yes 11%
No 37%
Not sure 46%
No response 5%
C. An automated community information source that is easy to understand like a toll-free
telephone number Total
Yes 11%
No 34%
Not sure 50%
No response 5%
D. Free access to computers and the Internet in public places such as the library, senior
centers or government buildings Total
Yes 49%
No 17%
Not sure 27%
No response 7%
E. Community information that is delivered in person to people who may have difficulty or
may not be able to leave their home Total
Yes 12%
No 30%
Not sure 52%
No response 6%
F. Community information that is available in a number of different languages Total
Yes 26%
No 22%
Not sure 47%
No response 5%
QD1. Are you male or female? Total
Male 43%
Female 54%
No response 3%
QD2. What is your age as of your last birthday? Total
50-59 39%
60-74 44%
75+ 17%
No response -
S urvey Annotation.L ivability forAll:T he2016 Age-Friendly Com m unity S urvey ofBrow nsvilleAAR P M em bersAge50-P lus 30
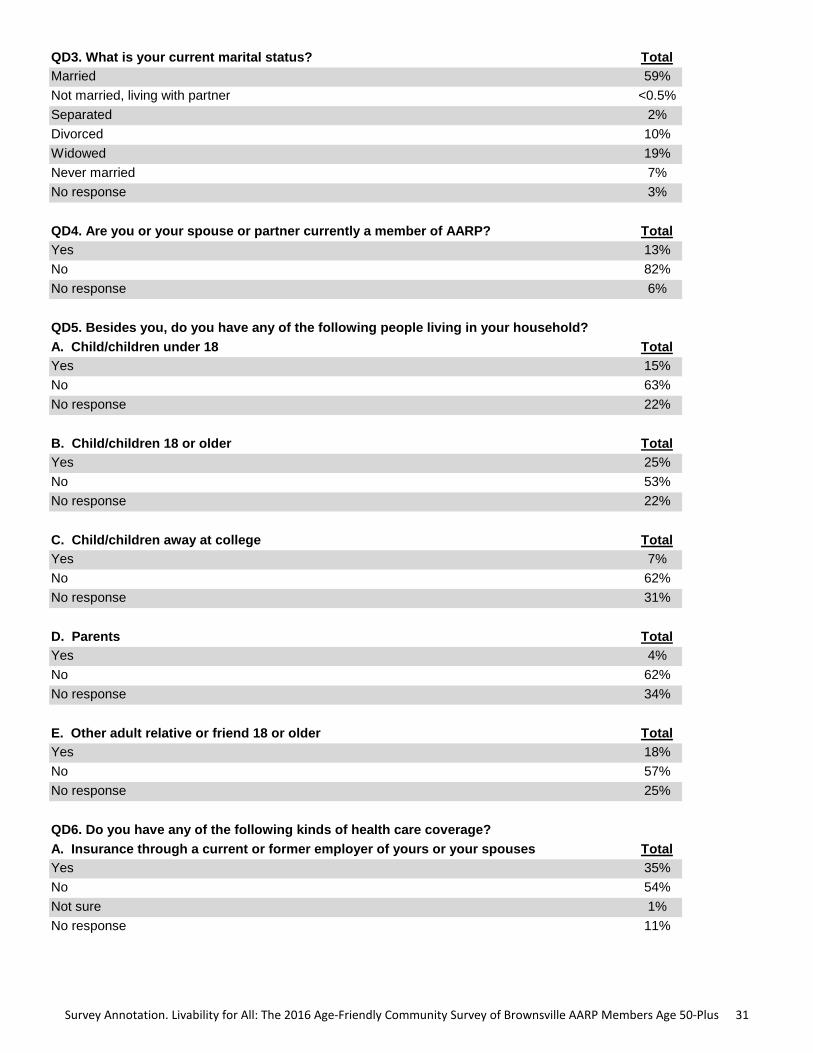
QD3. What is your current marital status? Total
Married 59%
Not married, living with partner <0.5%
Separated 2%
Divorced 10%
Widowed 19%
Never married 7%
No response 3%
QD4. Are you or your spouse or partner currently a member of AARP? Total
Yes 13%
No 82%
No response 6%
QD5. Besides you, do you have any of the following people living in your household?
A. Child/children under 18 Total
Yes 15%
No 63%
No response 22%
B. Child/children 18 or older Total
Yes 25%
No 53%
No response 22%
C. Child/children away at college Total
Yes 7%
No 62%
No response 31%
D. Parents Total
Yes 4%
No 62%
No response 34%
E. Other adult relative or friend 18 or older Total
Yes 18%
No 57%
No response 25%
QD6. Do you have any of the following kinds of health care coverage?
A. Insurance through a current or former employer of yours or your spouses Total
Yes 35%
No 54%
Not sure 1%
No response 11%
S urvey Annotation.L ivability forAll:T he2016 Age-Friendly Com m unity S urvey ofBrow nsvilleAAR P M em bersAge50-P lus 31

B. Insurance purchased directly from an insurance company (not through an employer) Total
Yes 27%
No 62%
Not sure 1%
No response 10%
C. Medicare, for people 65 and older or people with certain disabilities Total
Yes 41%
No 50%
Not sure <0.5%
No response 9%
D. Medicaid or any kind of government assistance plan for those with low incomes or a
disability Total
Yes 16%
No 70%
Not sure 2%
No response 12%
E. Veterans Administration or other military health care Total
Yes 10%
No 75%
Not sure 2%
No response 14%
F. Any other insurance coverage Total
Yes 16%
No 69%
Not sure 2%
No response 13%
QD7. Does any disability, handicap, or chronic disease keep you and your spouse or
partner from participating fully in work, school, housework, or other activities? Total
Yes, myself 20%
Yes, my spouse or partner 5%
Yes, both me and my spouse or partner 4%
No 67%
No response 4%
QD8. Are you of Hispanic, Spanish, Latino origin or descent? Total
Yes [GO TO Question D9] 75%
No [GO TO QUESTION D10] 19%
No response 6%
S urvey Annotation.L ivability forAll:T he2016 Age-Friendly Com m unity S urvey ofBrow nsvilleAAR P M em bersAge50-P lus 32
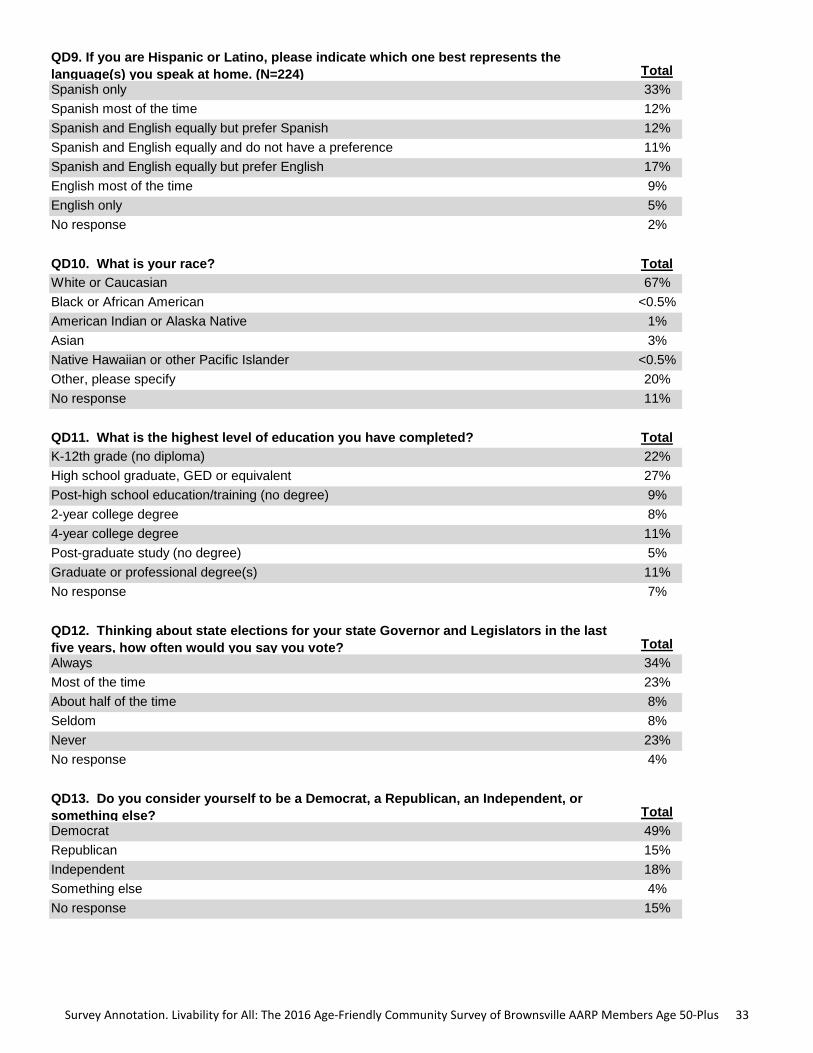
QD9. If you are Hispanic or Latino, please indicate which one best represents the
language(s) you speak at home. (N=224) Total
Spanish only 33%
Spanish most of the time 12%
Spanish and English equally but prefer Spanish 12%
Spanish and English equally and do not have a preference 11%
Spanish and English equally but prefer English 17%
English most of the time 9%
English only 5%
No response 2%
QD10. What is your race? Total
White or Caucasian 67%
Black or African American <0.5%
American Indian or Alaska Native 1%
Asian 3%
Native Hawaiian or other Pacific Islander <0.5%
Other, please specify 20%
No response 11%
QD11. What is the highest level of education you have completed? Total
K-12th grade (no diploma) 22%
High school graduate, GED or equivalent 27%
Post-high school education/training (no degree) 9%
2-year college degree 8%
4-year college degree 11%
Post-graduate study (no degree) 5%
Graduate or professional degree(s) 11%
No response 7%
QD12. Thinking about state elections for your state Governor and Legislators in the last
five years, how often would you say you vote? Total
Always 34%
Most of the time 23%
About half of the time 8%
Seldom 8%
Never 23%
No response 4%
QD13. Do you consider yourself to be a Democrat, a Republican, an Independent, or
something else? Total
Democrat 49%
Republican 15%
Independent 18%
Something else 4%
No response 15%
S urvey Annotation.L ivability forAll:T he2016 Age-Friendly Com m unity S urvey ofBrow nsvilleAAR P M em bersAge50-P lus 33

QD14. In general, how often do you go online to access the Internet for things like sending
or receiving email, getting news and information, paying bills or managing finances or
buying products or services? This includes access from home, work, a mobile device
(such as a smart phone), or someplace else. Total
Several times a day 24%
About once a day 13%
3-6 days a week 5%
1-2 days a week 6%
Once every few weeks 4%
Once a month or less 6%
Never go online 41%
No response 2%
QD15. What was your annual household income before taxes in 2014? Total
Less than $10,000 17%
$10,000 to $19,999 23%
$20,000 to $29,999 14%
$30,000 to $49,999 15%
$50,000 to $74,999 14%
$75,000 to $99,999 6%
$100,000 to $149,999 7%
$150,000 or more 2%
No response 4%
QD16. Please use the space below for any additional comments. Total
S urvey Annotation.L ivability forAll:T he2016 Age-Friendly Com m unity S urvey ofBrow nsvilleAAR P M em bersAge50-P lus 34