Embed Size (px)
Citation preview
2016 annual report
For
per
sona
l use
onl
y
Contents 1 Chairman’sforeword2 Five-yearfinancialsummary3 2016resultsataglance4 Whoweare5 Ourstrategy6 Whatwedo8 Corporatesustainability10 Ourboard13 Ourmanagementteam16 CorporategovernanceatAMP20 Directors’report28 Remunerationreport51 Analysisofshareholderprofit52 Financialreport53 Consolidatedincomestatement54 Consolidatedstatementofcomprehensiveincome55 Consolidatedstatementoffinancialposition56 Consolidatedstatementofchangesinequity57 Consolidatedstatementofcashflows58 Notestothefinancialstatements117 Directors’declaration118 Independentauditor’sreport123 SecurityholderinformationIBC Glossary
AMP Limited ABN 49 079 354 519
Unlessotherwisespecified,allamountsareinAustraliandollars.Informationinthisreportiscurrentasat9February2017.
For
per
sona
l use
onl
y
AMP 2016 annual report 1
ofworkingwithChinaLife,theworld’slargestlistedlifeinsurancegroupandaFortune500company.ThroughourjointventureswithChinaLifeandalsowithourJapanesepartner,MitsubishiUFJTrustandBankingCorporation(MUTB),wehavecontinuedtoattractinvestmentsandbuildondevelopmentopportunities.
Dividend and capital positionYourboardispleasedtohavedeliveredatotal2016dividendof28centspershareforshareholders,frankedat90%.Thisrepresentsafullyear2016dividendpayoutratioof85%ofunderlyingprofit.Wehavereturned$828milliontoshareholdersintheformofdividendsanddividendreinvestmentplan(DRP)sharesfortheyear.Ourunderlyingbusinesshasremainedstrongandwehavemaintainedastrongcapitalposition.At31December2016weheld$2.2billionincapitalaboveminimumregulatoryrequirements.ThestrengthofAMP’scapitalposition,followingthecompletionofareinsurancedealinourinsurancebusiness,hasfacilitatedanon-marketsharebuy-backofupto$500million.
Strengthening our boardFournewdirectorswereappointedtoourboardin2016.VanessaWallace,whohasover30years’consultingexperiencetothefinancialservicessector,joinedinMarch2016(andwaselectedatthe2016annualgeneralmeeting(AGM)),whileGeoffRoberts,whohaswide-reachingfinancialmanagementexperience,joinedinJuly2016.InsuranceexpertandexperiencedinvestmentmanagerMikeWilkinsjoinedinSeptember2016;andPeterVargheseAO,whohasextensivegovernmentandpublicadministrationexperience,joinedinOctober2016.Vanessa,Geoff,MikeandPetereachbringbroadskillsandcapabilitiesthatwillproveinvaluabletoourbusinessaswecontinuetopursueourstrategy.
YourboardisconfidentthatAMPistakingtherightactionsandpursuingthebeststrategytobuildasustainable,growingbusinessandimprovelong-termreturnstoshareholders.
Catherine BrennerChairman
28cps $2.2b
Total dividend
Capital surplus
$344m
Loss attributable to shareholders
$486m
Underlying profit
$500m
On-market share buy-back, up to
Chairman’s foreword
Our year2016 was a challenging year for AMP. The net loss we reported was largely driven by challenges in our insurance business and the actions that were taken to rebase and stabilise it going forwards.
Withoutdoubtour2016financialresultswereunsatisfactory.Asignificantfactorinthisresultwastheunderperformanceofourinsurancebusiness,drivenbyextremelychallengingoperatingconditionsintheinsurancesector.Wehavetakenactiontorebasethisbusinesstoprovidegreaterearningsstabilityatgrouplevel,protectourbalancesheetandfreeupcapital.ThisincludedareinsurancedealwithMunichRetoreleaseupto$500millionincapitalfromtheinsurancebusinessandtohelpreducefutureearningsvolatilityatagrouplevel.Wealsosignificantlystrengthenedourbestestimateassumptions.
Notwithstandingthesechallenges,wedeliveredagoodperformanceinAMPBank,inourNewZealandoperationsandinternationallythroughAMPCapital.OurAustraliansuperannuationandfinancialadvicebusinessesdeliveredlargelysteadyresultsinlow-growthmarketconditions,andwemadegoodprogresstobecomeamorecustomercentredorganisation.
YourboardremainsconfidentthatAMPiswellsetupforfuturesuccess,andalongwithAMP’smanagementandemployeesareunitedinourfocustorebalanceshort-termperformance,withasharperfocusoncashflows,costsandcapital,forlong-termgrowth.Ourstrategyistocapitaliseonlargeandgrowingmarketsandonbusinesseswherewehaveadistinctcompetitiveadvantagethankstoourscale,brand,distributionreachandinvestmentexpertise.
Oursuperannuationandfinancialadvicebusinessisinaverystrongposition.WearethelargestsuperannuationproviderinAustralia,basedonassetsundermanagement;andweplantogrowinthismarketoverthenextfiveyearsbyfocusingonourcustomers.Wearelisteningandrespondingtoourcustomers’needswithtechnologyandaccesstoadvicethathelpsthemreachtheirgoals.
Whilesuperannuationandfinancialadviceareimportanttoourcustomerfocus,AMPBankisapartofthatstorytoo.Thebankprovidesanimportantserviceinhelpingourcustomersachievetheirgoals,andwecontinuetoseegrowthinourresidentialhomeloansanddepositsasaresult.
ThebusinesshascontinuedtogrowselectivelyinAsiaandinternationally,primarilythroughAMPCapital.InAsia,ourfocusisonhigh-growthpotentialmarkets,particularlyChina.OurconnectiontoChinaisstrong;wehavehadapresencethereforalmost20yearsandforthepastdecadewe’vehadtheprivilege
For
per
sona
l use
onl
y
AMP 2016 annual report2
Our results in summary
Our financial performance
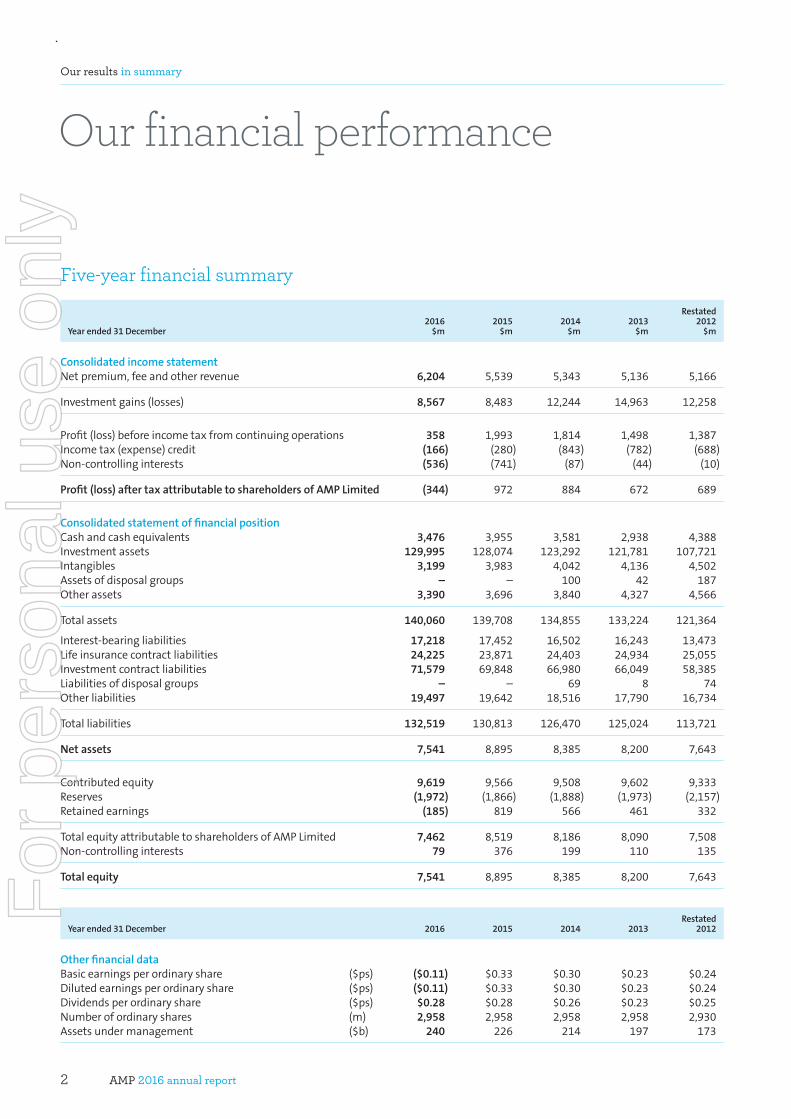
Five-year financial summary
Year ended 31 December2016
$m2015
$m2014
$m2013
$m
Restated2012
$m
Consolidated income statement Netpremium,feeandotherrevenue 6,204 5,539 5,343 5,136 5,166
Investmentgains(losses) 8,567 8,483 12,244 14,963 12,258
Profit(loss)beforeincometaxfromcontinuingoperations 358 1,993 1,814 1,498 1,387Incometax(expense)credit (166) (280) (843) (782) (688)Non-controllinginterests (536) (741) (87) (44) (10)
Profit (loss) after tax attributable to shareholders of AMP Limited (344) 972 884 672 689
Consolidated statement of financial position Cashandcashequivalents 3,476 3,955 3,581 2,938 4,388Investmentassets 129,995 128,074 123,292 121,781 107,721Intangibles 3,199 3,983 4,042 4,136 4,502Assetsofdisposalgroups – – 100 42 187Otherassets 3,390 3,696 3,840 4,327 4,566
Totalassets 140,060 139,708 134,855 133,224 121,364
Interest-bearingliabilities 17,218 17,452 16,502 16,243 13,473Lifeinsurancecontractliabilities 24,225 23,871 24,403 24,934 25,055Investmentcontractliabilities 71,579 69,848 66,980 66,049 58,385Liabilitiesofdisposalgroups – – 69 8 74Otherliabilities 19,497 19,642 18,516 17,790 16,734
Totalliabilities 132,519 130,813 126,470 125,024 113,721
Net assets 7,541 8,895 8,385 8,200 7,643
Contributedequity 9,619 9,566 9,508 9,602 9,333Reserves (1,972) (1,866) (1,888) (1,973) (2,157)Retainedearnings (185) 819 566 461 332
TotalequityattributabletoshareholdersofAMPLimited 7,462 8,519 8,186 8,090 7,508Non-controllinginterests 79 376 199 110 135
Total equity 7,541 8,895 8,385 8,200 7,643
Year ended 31 December 2016 2015 2014 2013Restated
2012
Other financial data Basicearningsperordinaryshare ($ps) ($0.11) $0.33 $0.30 $0.23 $0.24Dilutedearningsperordinaryshare ($ps) ($0.11) $0.33 $0.30 $0.23 $0.24Dividendsperordinaryshare ($ps) $0.28 $0.28 $0.26 $0.23 $0.25Numberofordinaryshares (m) 2,958 2,958 2,958 2,958 2,930Assetsundermanagement ($b) 240 226 214 197 173
For
per
sona
l use
onl
y
AMP 2016 annual report 3
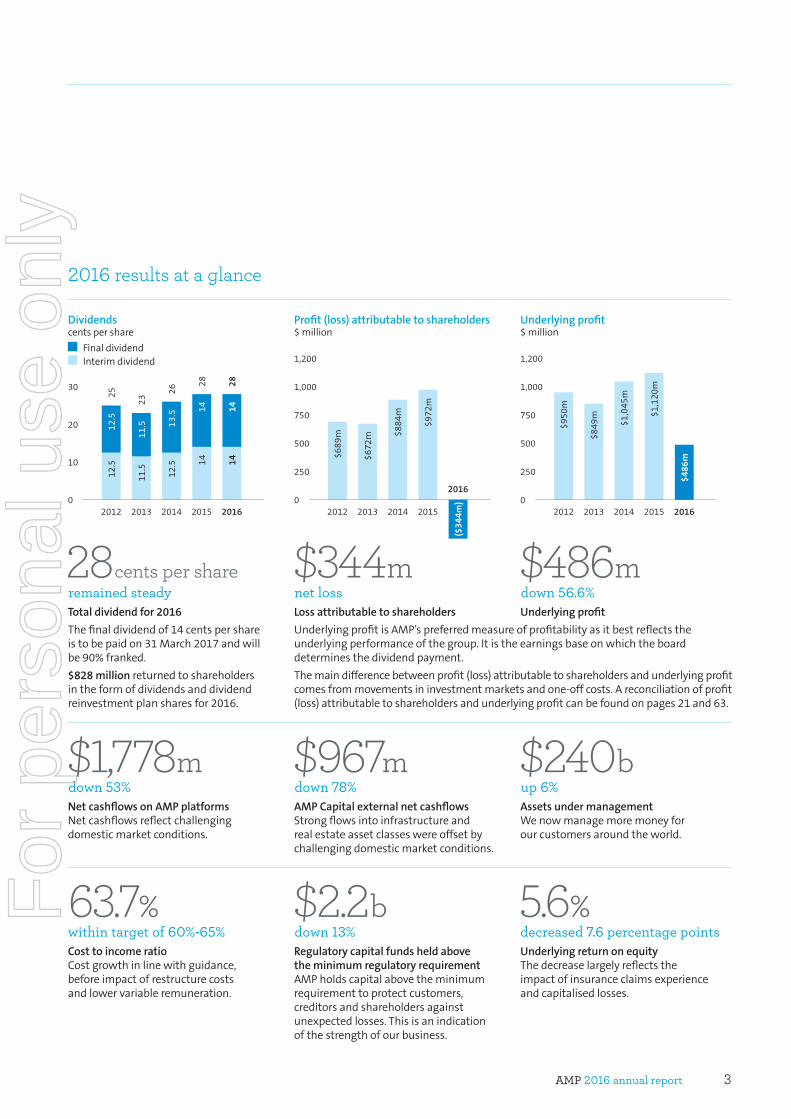
Net cashflows on AMP platformsNetcashflowsreflectchallengingdomesticmarketconditions.
AMP Capital external net cashflowsStrongflowsintoinfrastructureandrealestateassetclasseswereoffsetbychallengingdomesticmarketconditions.
Assets under managementWenowmanagemoremoneyforourcustomersaroundtheworld.
$1,778mdown 53%
$967mdown 78%
$240bup 6%
Total dividend for 2016
Thefinaldividendof14centspershareistobepaidon31March2017andwillbe90%franked.
$828 millionreturnedtoshareholdersintheformofdividendsanddividendreinvestmentplansharesfor2016.
Loss attributable to shareholders Underlying profit
UnderlyingprofitisAMP’spreferredmeasureofprofitabilityasitbestreflectstheunderlyingperformanceofthegroup.Itistheearningsbaseonwhichtheboarddeterminesthedividendpayment.
Themaindifferencebetweenprofit(loss)attributabletoshareholdersandunderlyingprofitcomesfrommovementsininvestmentmarketsandone-offcosts.Areconciliationofprofit(loss)attributabletoshareholdersandunderlyingprofitcanbefoundonpages21and63.
28cents per shareremained steady
$344mnet loss
$486mdown 56.6%
Cost to income ratioCostgrowthinlinewithguidance,beforeimpactofrestructurecostsandlowervariableremuneration.
Regulatory capital funds held above the minimum regulatory requirementAMPholdscapitalabovetheminimumrequirementtoprotectcustomers,creditorsandshareholdersagainstunexpectedlosses.Thisisanindicationofthestrengthofourbusiness.
Underlying return on equityThedecreaselargelyreflectstheimpactofinsuranceclaimsexperienceandcapitalisedlosses.
63.7%within target of 60%-65%
$2.2bdown 13%
5.6%decreased 7.6 percentage points
Dividends centspershare
Finaldividend Interimdividend
0
10
20
30
2015201420132012 2016
12.5 14 14
13.5 14 14
26
28 28
11.5
11.5
23
12.5
12.5
25
2015201420132012
2016
$884
m
($34
4m)
$972
m
$672
m
$689
m
0
250
500
750
1,000
1,200
Profit (loss) attributable to shareholders$million
0
250
500
750
1,000
1,200
2015201420132012 2016
$1,0
45m
$1,1
20m
$486
m
$849
m
$950
m
Underlying profit$million
2016 results at a glance
For
per
sona
l use
onl
y

AMP 2016 annual report4
Our business, vision and strategy
Who we areOur purpose is to help customers own their tomorrow, helping them take control of their money and achieve their financial goals.
Throughouroffers,solutionsandexpertfinancialadvice,wearehelpingourcustomersexplore,plan,trackandrealisetheirgoalssotheycanownabettertomorrow.Tosupportourcustomers,wearebuildingonourcurrentstrengths,transformingourbusinesstoplaceourcustomersatthecentreofeverythingwedo,andbecomingmoreagileandefficient.Wearecapitalisingonourstrongpartnershipswithinternationalmarketleaders,particularlyinChinaandJapan,tocontinueexpandingouroverseasgrowthwithretailandinstitutionalinvestors.
We are Australia and New Zealand’s leading specialist wealth management company. For 168 years, we have dedicated ourselves to helping our customers achieve their financial goals with quality products and expert advice. The world has changed immeasurably since our founding days; and while we have evolved and grown to keep pace, our purpose has steadfastly remained to help people own a better tomorrow.
Over
5,400 employees
More than
46,000people have an AMP Bank home loan
More than
3,500 financial advisers in Australia and New Zealand
Established in
1849 as a mutual life insurance company
Over
4 million customers
$13.8b returned to shareholders since AMP demutualised in 1998F
or p
erso
nal u
se o
nly
AMP 2016 annual report 5
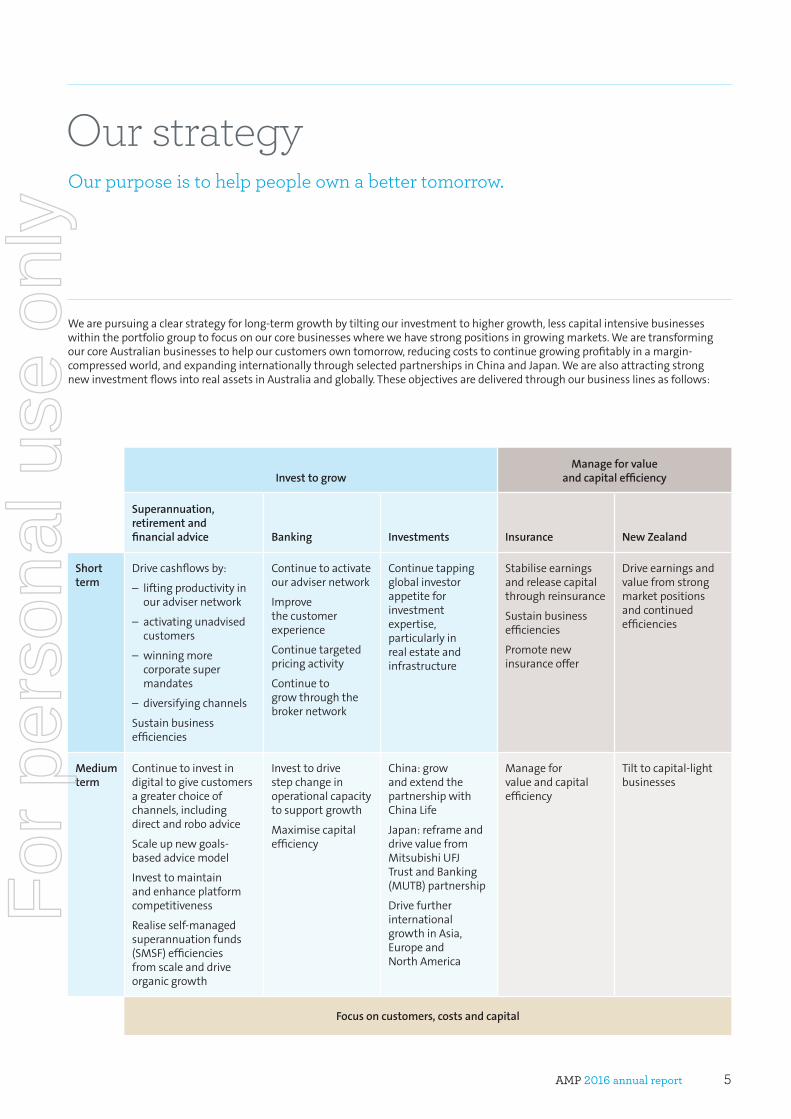
Our strategyOur purpose is to help people own a better tomorrow.
Invest to growManage for value
and capital efficiency
Superannuation, retirement and financial advice Banking Investments Insurance New Zealand
Short term
Drivecashflowsby:
– liftingproductivityinouradvisernetwork
– activatingunadvisedcustomers
– winningmorecorporatesupermandates
– diversifyingchannels
Sustainbusinessefficiencies
Continuetoactivateouradvisernetwork
Improvethecustomerexperience
Continuetargetedpricingactivity
Continuetogrowthroughthebrokernetwork
Continuetappingglobalinvestorappetiteforinvestmentexpertise,particularlyinrealestateandinfrastructure
Stabiliseearningsandreleasecapitalthroughreinsurance
Sustainbusinessefficiencies
Promotenewinsuranceoffer
Driveearningsandvaluefromstrongmarketpositionsandcontinuedefficiencies
Medium term
Continuetoinvestindigitaltogivecustomersagreaterchoiceofchannels,includingdirectandroboadvice
Scaleupnewgoals-basedadvicemodel
Investtomaintainandenhanceplatformcompetitiveness
Realiseself-managedsuperannuationfunds(SMSF)efficienciesfromscaleanddriveorganicgrowth
Investtodrivestepchangeinoperationalcapacitytosupportgrowth
Maximisecapitalefficiency
China:growandextendthepartnershipwithChinaLife
Japan:reframeanddrivevaluefromMitsubishiUFJTrustandBanking(MUTB)partnership
DrivefurtherinternationalgrowthinAsia,EuropeandNorthAmerica
Manageforvalueandcapitalefficiency
Tilttocapital-lightbusinesses
Focus on customers, costs and capital
Wearepursuingaclearstrategyforlong-termgrowthbytiltingourinvestmenttohighergrowth,lesscapitalintensivebusinesseswithintheportfoliogrouptofocusonourcorebusinesseswherewehavestrongpositionsingrowingmarkets.WearetransformingourcoreAustralianbusinessestohelpourcustomersowntomorrow,reducingcoststocontinuegrowingprofitablyinamargin-compressedworld,andexpandinginternationallythroughselectedpartnershipsinChinaandJapan.WearealsoattractingstrongnewinvestmentflowsintorealassetsinAustraliaandglobally.Theseobjectivesaredeliveredthroughourbusinesslinesasfollows:
For
per
sona
l use
onl
y
AMP 2016 annual report6
Our business, vision and strategy
What we doAustralians and New Zealanders know us best for superannuation, investments and advice, but we are growing fast in retail banking in Australia, and internationally with strong partnerships in China and Japan and investments around the globe.
WeareproudtobeAustraliaandNewZealand’sleadingspecialistwealthmanagementcompany.
Superannuation, retirement and adviceWehelpourcustomerssaveforandlivewellinretirementwithourrangeofaward-winningsuperannuationproducts,includingself-managedsuperannuationfunds(SMSFs).WeareAustralia’sleadingsuperannuationproviderandoperateinarapidlygrowingindustry,withtheAustraliansuperannuationmarketexpectedtodoubleinsizeby2026.1
AMPfinancialadvisersprovidequalityfinancialadvicetohelppeopletakecontroloftheirfinancesandreachtheirgoals.Ouradvisersaresupportedwithtraining,researchandongoingdevelopmenttoensurethattheyareequippedwiththeknowledge,expertiseandexperiencetheyneedtohelpourcustomersachievetheirgoals.
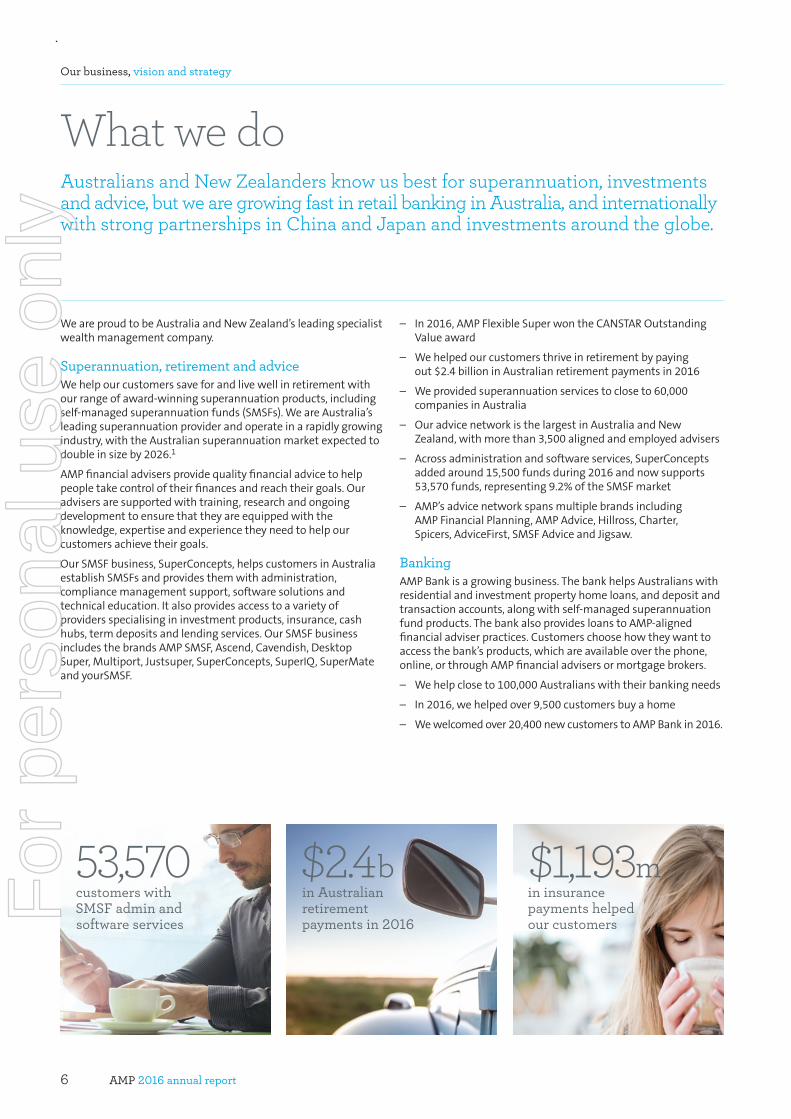
OurSMSFbusiness,SuperConcepts,helpscustomersinAustraliaestablishSMSFsandprovidesthemwithadministration,compliancemanagementsupport,softwaresolutionsandtechnicaleducation.Italsoprovidesaccesstoavarietyofprovidersspecialisingininvestmentproducts,insurance,cashhubs,termdepositsandlendingservices.OurSMSFbusinessincludesthebrandsAMPSMSF,Ascend,Cavendish,DesktopSuper,Multiport,Justsuper,SuperConcepts,SuperIQ,SuperMateandyourSMSF.
– In2016,AMPFlexibleSuperwontheCANSTAROutstandingValueaward
– Wehelpedourcustomersthriveinretirementbypayingout$2.4billioninAustralianretirementpaymentsin2016
– Weprovidedsuperannuationservicestocloseto60,000companiesinAustralia
– OuradvicenetworkisthelargestinAustraliaandNewZealand,withmorethan3,500alignedandemployedadvisers
– Acrossadministrationandsoftwareservices,SuperConceptsaddedaround15,500fundsduring2016andnowsupports53,570funds,representing9.2%oftheSMSFmarket
– AMP’sadvicenetworkspansmultiplebrandsincludingAMPFinancialPlanning,AMPAdvice,Hillross,Charter,Spicers,AdviceFirst,SMSFAdviceandJigsaw.
BankingAMPBankisagrowingbusiness.ThebankhelpsAustralianswithresidentialandinvestmentpropertyhomeloans,anddepositandtransactionaccounts,alongwithself-managedsuperannuationfundproducts.ThebankalsoprovidesloanstoAMP-alignedfinancialadviserpractices.Customerschoosehowtheywanttoaccessthebank’sproducts,whichareavailableoverthephone,online,orthroughAMPfinancialadvisersormortgagebrokers.
– Wehelpcloseto100,000Australianswiththeirbankingneeds
– In2016,wehelpedover9,500customersbuyahome
– Wewelcomedover20,400newcustomerstoAMPBankin2016.
53,570customers with SMSF admin and software services
$1,193min insurance payments helped our customers
$2.4bin Australian retirement payments in 2016F
or p
erso
nal u
se o
nly
1 DynamicsoftheAustralianSuperannuationSystem,TheNext20Years:2015–2035,Deloitte,November2015.
AMP 2016 annual report 7
InvestmentsWehelpinvestorsaroundtheworldinvestinequities,fixedincome,infrastructureandrealestate,anddiversified,multi-managerandmulti-assetfundsthroughAMPCapital.AMPCapitalalsomanagesrealestateandinfrastructureassetsincludingshoppingcentres,airports,trainsandpipelines.InAsia,wehavestrongpartnershipswithnationalchampionsinChinaandJapan,wheretheretirementmarketisrapidlygrowing.
– AMPCapitalisoneofthelargestdirectrealestatefundmanagersinAsiaPacific,with$23billioninassetsundermanagement.Onbehalfofinvestors,AMPCapitalmanagedrealestatefundsandaportfolioofassetsincludingSydney’sMacquarieCentre,AngelPlaceand200GeorgeStreet;Melbourne’sBourkePlaceand700BourkeStreet;andQueensland’sPacificFairandCoronationDriveOfficePark.AMPCapitalalsomanageddiversifiedandsector-specificportfoliosofassetsinAustralia,NewZealand,SingaporeandtheUnitedStates.In2016,$1.3billionofnewequitywasraised,including$334millioninnewequityfromoffshoreinvestorsandafurther$440millionsecondaryunitstradedacrossthepooledfundplatform.
– AMPCapitalisoneofthelargestinfrastructuremanagersintheworld,managing$12billioninassetsincludingMelbourneAirport,PowercoinNewZealandandAngelTrainsintheUnitedKingdom.
– AMPCapitalholdsa15%stakeinChinaLifeAMPAssetManagementCompanyLimited(CLAMP),whichmanagesover$23billionforChineseinvestorsthroughmutualfundproducts,includingmoneymarket,fixedincome,balancedandequityfunds.
InsuranceWesupportourcustomersandtheirfamiliesduringtoughtimeswithouraward-winninginsuranceproducts,includinglifeinsurance,incomeprotectionanddisabilityinsuranceproducts.AMPisaleadinginsurerandprovidespoliciesthatareheldbyindividualsorincludedinasuperannuationfund.In2016overtwomillionpolicies,protectingover1.5millioncustomers,werein-force.
– In2016,wewerenamedLifeInsuranceCompanyoftheYearattheAustralianandNewZealandInstituteofInsuranceandFinanceInsuranceIndustryAwards.WealsowonanawardforExcellenceandInnovationinReturntoWorkfromtheAustralasianLifeUnderwritingandClaimsAssociationandSwissRe,andwewerearunner-upintheBestClaimsOutcomeandCustomerExperiencecategoryatthe14thAnnualAustralianInsuranceAwards
– Wehelpedourcustomersbypayingout$1,193millionininsuranceclaimsin2016
– In2016welaunchedournewAMPMyLifeoffer,throughourAMPAdvicepractices.
Mature insurance and superannuationThroughourAustralianmaturebusiness,weexpertlymanageclosedinsuranceandsuperannuationproductsthatarenolongersoldbyAMP.AllproductsinAustralianmatureareclosedtonewbusinesswiththeexceptionoftheEligibleRolloverFund.TheAustralianmaturebusinessisthelargestclosedlifeinsurancebusinessinAustraliaandincludeswholeoflife,endowment,investmentlinked,investmentaccount,RetirementSavingsAccount,annuities,insurancebonds,personalsuperannuationandguaranteedsavingsaccounts.
– Australianmatureassetsundermanagementcomprisecapitalguaranteedproductsandmarketlinkedproducts.In2016thisrepresentedover$1.7millionpoliciesand$21billioninfundsundermanagement
– Wehelpedourcustomersbypayingout$2.0billioninclaimsandmaturitiesin2016.
New Zealand financial servicesInNewZealandwehaveleadingpositionsinsuperannuationandinsuranceandprovidecustomerswithtailoredfinancialproductsandservices,directlyandthroughoneofthelargestnetworksoffinancialadvisersinthecountry.
– AMPisthefourth-largestKiwiSaverSchemeproviderwith12%ofthetotalKiwiSavermarketandapproximately238,000KiwiSavercustomers
– In2016,operatingearningsincreasedby$6million(5%)to$126million.F
or p
erso
nal u
se o
nly
AMP 2016 annual report8
Corporate sustainability
Corporate sustainabilityWe are one of Australia’s oldest companies, and since the beginning we have been committed to improving the communities in which we operate. We believe that our success is linked to the prosperity of our shareholders, customers, advisers, employees and our communities.
Webelieveinmanagingourbusinesssustainablyfortodayandforthelongterm;tobuildsharedvalueandcreateabetter,moreprosperoustomorrowforourcommunities.
Sharing our expertise Webelieveintakingthemysteryoutofmanagingmoney,tomakethecomplexsimpleandhelppeoplemakeinformedfinancialdecisions.Whenpeoplehaveabetterunderstandingandgreatercontroloftheirfinancialwellbeing,theyfeelmoresecureandindependent.Wehelpbygivingpeopletheknow-howandtoolstotakecontroloftheirfinances.
ThroughourQ&infocentrewebsite,peoplecanusetheonlinetooltoexplore,prioritiseandcreateatimelinetomaptheirgoals.Thereare13commongoalstochoosefrom,rangingfromretireright,bedebtfree,andgivemykidsthebestchance,tosimplifymyfinances,pursueapassionorbuyahome.Afterattributingagradeofimportancetoeachgoal,thegoalexplorerprovidesagoalstimelineandquestionstothinkaboutforachievingeachgoal.
Ourwebsitealsofeaturesbudgetplanners,debt-reductioncalculatorsandfinancialnews.
Since2002,wehavepartneredwiththeNationalCentreforSocialandEconomicModelling(NATSEM)toproduceaseriesofreportsthatopenwindowsonAustraliansociety–thewayweliveandwork–andourfinancialandpersonalaspirations.Wepublishthesereportstohelpthecommunitymakeinformed
financialandlifestyledecisionsandtocontributetoimportantsocialandeconomicpolicydebate.In2016,wepublishedareportonthefinancialimplicationsassociatedwithdivorce,calledForRicher,ForPoorer:DivorceinAustralia.
In2016,weinvitedshareholderstoafreeinformationsessionattheannualgeneralmeeting(AGM)tohearfromsomeofourexpertsandbenefitfromtheirinsightsandexpertise.Thesessionwaswellreceivedandwillbeheldagainatthisyear’sAGMinSydneyon11May2017.Allshareholdersareinvitedtoparticipateinpersonoronline.Youcanfindfurtherdetailsoftheeventinthe2016shareholderreviewor2017noticeofmeeting.
Encouraging good corporate responsibility through responsible investingAMPCapitalisamajorinvestorincompaniesandassetsonbehalfofourcustomers,andassuch,iswellplacedtoraisethecorporateresponsibilitybarandinfluencebetteroutcomesforinvestors.Wehavelongrecognisedthestronglinkbetweenanorganisation’senvironmentalandsocialimpacts,thequalityofitscorporategovernance,anditslong-termbusinesssuccess.
AkeypartofAMPCapital’sinvestmentprocessisassessingenvironmental,socialandgovernance(ESG)factors.WeareasignatorytotheUNPrinciplesofResponsibleInvestment,andthemostrecentreportcardonhowweareprogressingonourcommitmentsisavailableatampcapital.com.au/esg.
Close to
$86mdonated to improve the lives of Australians and New Zealanders since 1992
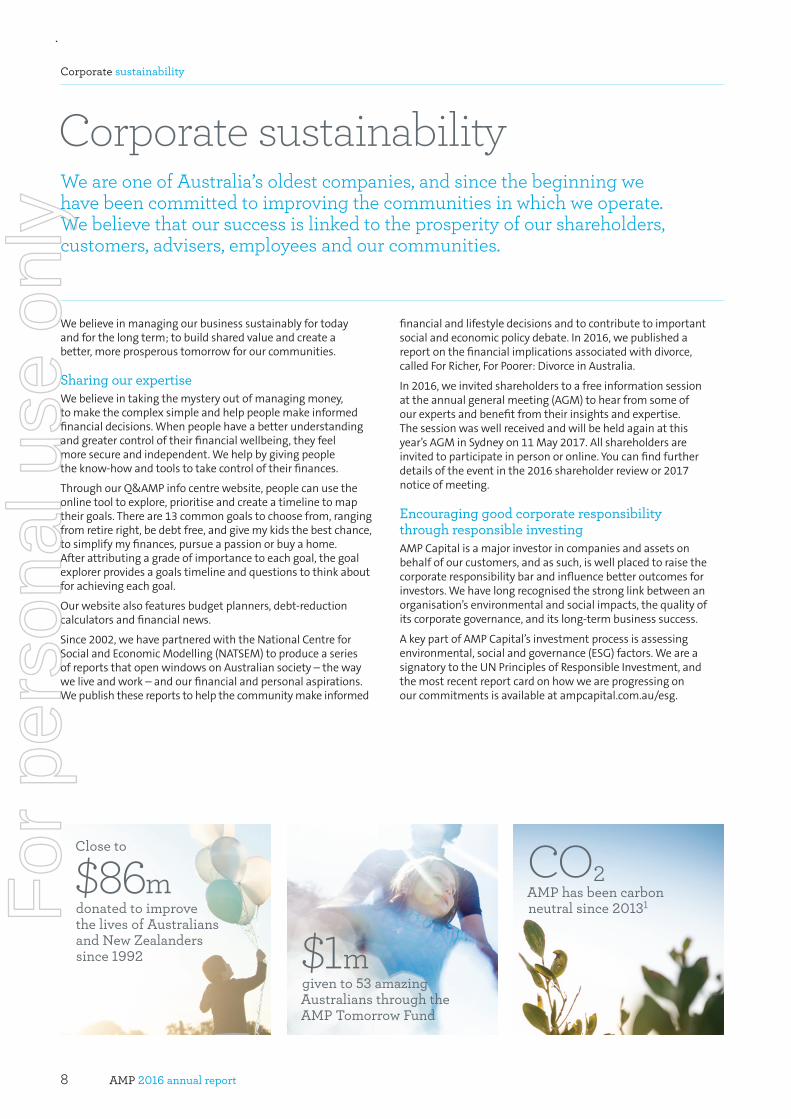
CO2AMP has been carbon neutral since 20131
$1mgiven to 53 amazing Australians through the AMP Tomorrow Fund
For
per
sona
l use
onl
y
AMP 2016 annual report 9
ThroughourdedicatedESGteam,weactivelyengagewiththeboardsandmanagementteamsofcompaniesonarangeofESGissuestoencouragesounddecisionmakingandriskmanagement,appropriatecapitalallocation,goodboardcomposition,genderdiversity,fairremunerationandopenandhonestdisclosure.Weuseourvotingpowertoencouragecorporatebehaviourthatwilldeliverbetterresultsforinvestors,shareholdersandthecommunityasawhole.
Inclusion and diversityWebelieveinaninclusiveculturewherearichandvariedarrayofthoughts,ideasandexperiencesdrivebetterperformanceforourcustomersandshareholders.Bydrawingonthestrengthsandskillsofourpeopleandempoweringthemtobethebesttheycanbe,wearebetterplacedtohelpothersowntomorrow.
AMP’sfourpillarsofinclusionremainunchanged.
– Committed and inclusive leadership–leadersaresupportedtocreateaninclusiveculturethathelpspeopleplaytotheirstrengths.
– Merit-based policies and practices–wefocusonequalitywhenwerecruit,develop,promoteandpayourpeople,aswellaswhenwerecogniseandrewardtheirperformance.
– Decision-making and voice–weleveragethediversethinkingacrossourbusinesstobetterunderstandourcustomersandmeettheirneeds.
– Measurement, accountability and rewards–wesetchallengingdiversitytargetsandbelievethatmeetingthesetargetswilldeliverbetterresultsforourbusiness.
Genderequalityisattheforefrontofourinclusionanddiversitywork,andwehavemadestrongprogressinincreasingthenumberofwomeninAMP’smostseniorrolesasaresult.In2016,weappointedfournewwomentoAMP’smanagementteamandwereproudtoappointCatherineBrennerasthefirstfemaleChairmanoftheAMPLimitedBoard.
AMPhaschallenginggenderdiversitytargets.Bytheendof2020,wewantwomentoholdhalfofourmiddle-managementrolesand47%ofseniorexecutiveroles.Wearealsoaimingforgenderbalanceonourboardswitha40:40:20target,wherebyboardsaremadeupof40%women,40%menand20%eitherwomenormen.AMPconductsanannualpayequityreviewtoidentify,analyseandaddresspotentialareasofgenderinequity.ThiscommitmentisexpresslyoutlinedinAMP’sremunerationpolicy.
In2016,AMPwasagainnamedanEmployerofChoiceforGenderEqualitybytheAustralianGovernment’sWorkplaceGenderEqualityAgency.
Lookingahead,AMPwillfocusonflexibleworkasakeypriorityacrossallemployeedemographics.Inclusionremainstheunderlyingfoundationofourinclusionanddiversitystrategy.
Protecting our environmentMinimisingourimpactontheenvironmentisasimportantforourcompanyasitisforthecommunitiesinwhichweoperate.WeactivelyassesstheenvironmentalrisksandopportunitiesacrossourbusinessandtheinvestmentsmanagedbyAMPCapital.In2016,wecontinuedtomakeprogressagainstourenvironmentalprioritiesandtargets,remainingcarbonneutralinourownoperations(tenantedsitesandairtravel).From2013to2016,wereducedourgreenhousegasemissionsby25%.
The AMP FoundationThroughtheAMPFoundationwehelptoprovideabettertomorrowforeveryone,especiallypeoplewhofacechallengesaccessingeducationandemploymentopportunities.Since1992,theAMPFoundationhasdistributedcloseto$86milliontohelpcharitiesandindividualsmakeapositiveimpactoncommunitiesinAustraliaandNewZealand.
TheAMPFoundationworksintwoways.Ithelpspeopletohelpthemselvesbysupportingnon-profitorganisationsthatgivedisadvantagedAustralianslife-changinglearningandworkopportunities.ItalsohelpspeopletohelpothersbysupportingAMPemployeesandfinancialadviserstosharetheirtime,skillsandresourceswithpeopleinneedandthroughAMP’sTomorrowFundgrants.
In2016,theAMPFoundationdistributed$5.2milliontothecommunity,includingmorethan$1millioningrantsthroughAMP’sTomorrowFundtohelp53amazingAustraliansachievetheirgoals.
Wealsopresentedscholarshipsto28equallyextraordinaryNewZealanders.
Whiletheserecipientsallhaveverydifferentinterests,likeAMP,theyareallstrivingtogiveback.
Youcanfindfurtherinformationonourenvironmentalperformance,corporategovernanceworkandAMPFoundationactivitiesatamp.com.au/corporatesustainability.
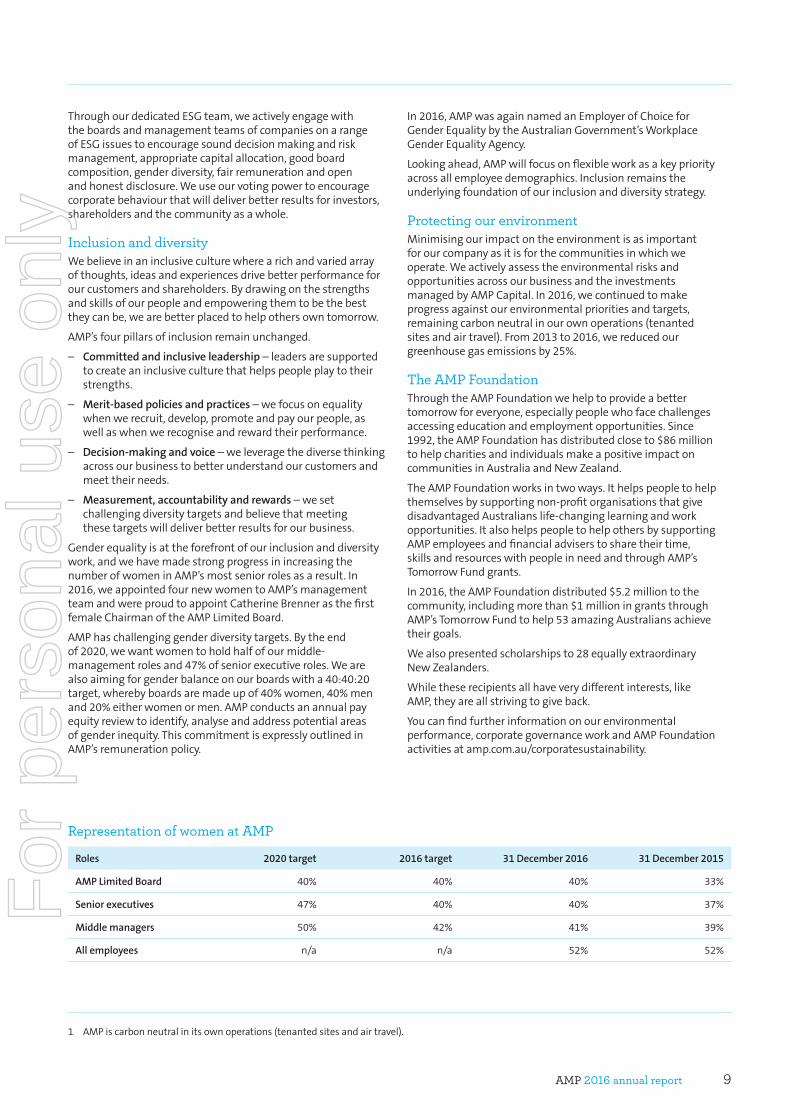
Roles 2020 target 2016 target 31 December 2016 31 December 2015
AMP Limited Board 40% 40% 40% 33%
Senior executives 47% 40% 40% 37%
Middle managers 50% 42% 41% 39%
All employees n/a n/a 52% 52%
Representation of women at AMP
1 AMPiscarbonneutralinitsownoperations(tenantedsitesandairtravel).
For
per
sona
l use
onl
y
AMP 2016 annual report10
AMP Limited Board and management team as at 9 February 2017
Our board
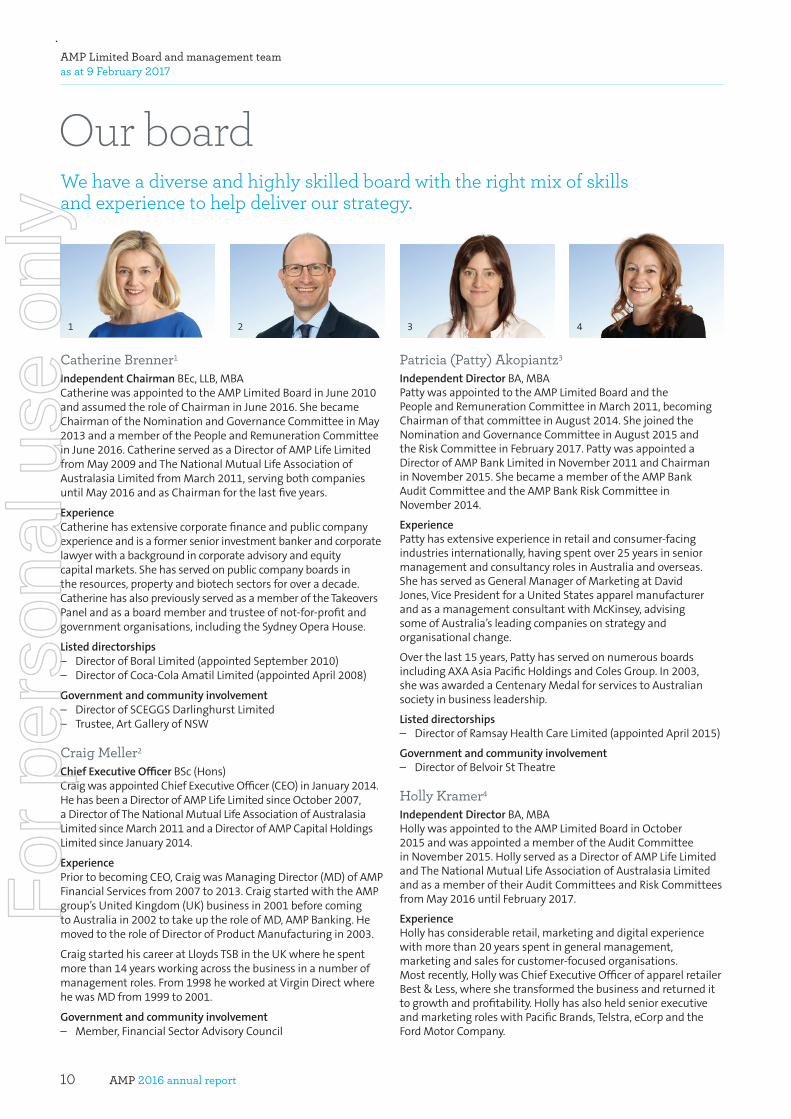
Catherine Brenner1
Independent ChairmanBEc,LLB,MBACatherinewasappointedtotheAMPLimitedBoardinJune2010andassumedtheroleofChairmaninJune2016.ShebecameChairmanoftheNominationandGovernanceCommitteeinMay2013andamemberofthePeopleandRemunerationCommitteeinJune2016.CatherineservedasaDirectorofAMPLifeLimitedfromMay2009andTheNationalMutualLifeAssociationofAustralasiaLimitedfromMarch2011,servingbothcompaniesuntilMay2016andasChairmanforthelastfiveyears.
ExperienceCatherinehasextensivecorporatefinanceandpubliccompanyexperienceandisaformerseniorinvestmentbankerandcorporatelawyerwithabackgroundincorporateadvisoryandequitycapitalmarkets.Shehasservedonpubliccompanyboardsintheresources,propertyandbiotechsectorsforoveradecade.CatherinehasalsopreviouslyservedasamemberoftheTakeoversPanelandasaboardmemberandtrusteeofnot-for-profitandgovernmentorganisations,includingtheSydneyOperaHouse.
Listed directorships– DirectorofBoralLimited(appointedSeptember2010)– DirectorofCoca-ColaAmatilLimited(appointedApril2008)
Government and community involvement– DirectorofSCEGGSDarlinghurstLimited– Trustee,ArtGalleryofNSW
Craig Meller2
Chief Executive OfficerBSc(Hons)CraigwasappointedChiefExecutiveOfficer(CEO)inJanuary2014.HehasbeenaDirectorofAMPLifeLimitedsinceOctober2007,aDirectorofTheNationalMutualLifeAssociationofAustralasiaLimitedsinceMarch2011andaDirectorofAMPCapitalHoldingsLimitedsinceJanuary2014.
ExperiencePriortobecomingCEO,CraigwasManagingDirector(MD)ofAMPFinancialServicesfrom2007to2013.CraigstartedwiththeAMPgroup’sUnitedKingdom(UK)businessin2001beforecomingtoAustraliain2002totakeuptheroleofMD,AMPBanking.HemovedtotheroleofDirectorofProductManufacturingin2003.
CraigstartedhiscareeratLloydsTSBintheUKwherehespentmorethan14yearsworkingacrossthebusinessinanumberofmanagementroles.From1998heworkedatVirginDirectwherehewasMDfrom1999to2001.
Government and community involvement– Member,FinancialSectorAdvisoryCouncil
Patricia (Patty) Akopiantz3
Independent DirectorBA,MBAPattywasappointedtotheAMPLimitedBoardandthePeopleandRemunerationCommitteeinMarch2011,becomingChairmanofthatcommitteeinAugust2014.ShejoinedtheNominationandGovernanceCommitteeinAugust2015andtheRiskCommitteeinFebruary2017.PattywasappointedaDirectorofAMPBankLimitedinNovember2011andChairmaninNovember2015.ShebecameamemberoftheAMPBankAuditCommitteeandtheAMPBankRiskCommitteeinNovember2014.
ExperiencePattyhasextensiveexperienceinretailandconsumer-facingindustriesinternationally,havingspentover25yearsinseniormanagementandconsultancyrolesinAustraliaandoverseas.ShehasservedasGeneralManagerofMarketingatDavidJones,VicePresidentforaUnitedStatesapparelmanufacturerandasamanagementconsultantwithMcKinsey,advisingsomeofAustralia’sleadingcompaniesonstrategyandorganisationalchange.
Overthelast15years,PattyhasservedonnumerousboardsincludingAXAAsiaPacificHoldingsandColesGroup.In2003,shewasawardedaCentenaryMedalforservicestoAustraliansocietyinbusinessleadership.
Listed directorships– DirectorofRamsayHealthCareLimited(appointedApril2015)
Government and community involvement– DirectorofBelvoirStTheatre
Holly Kramer4
Independent Director BA,MBAHollywasappointedtotheAMPLimitedBoardinOctober2015andwasappointedamemberoftheAuditCommitteeinNovember2015.HollyservedasaDirectorofAMPLifeLimitedandTheNationalMutualLifeAssociationofAustralasiaLimitedandasamemberoftheirAuditCommitteesandRiskCommitteesfromMay2016untilFebruary2017.
ExperienceHollyhasconsiderableretail,marketinganddigitalexperiencewithmorethan20yearsspentingeneralmanagement,marketingandsalesforcustomer-focusedorganisations.Mostrecently,HollywasChiefExecutiveOfficerofapparelretailerBest&Less,whereshetransformedthebusinessandreturnedittogrowthandprofitability.HollyhasalsoheldseniorexecutiveandmarketingroleswithPacificBrands,Telstra,eCorpandtheFordMotorCompany.
1 2 43
We have a diverse and highly skilled board with the right mix of skills and experience to help deliver our strategy.
For
per
sona
l use
onl
y
AMP 2016 annual report 11
Listed directorships– DirectorofWoolworthsLimited(appointedFebruary2016)– DirectorofNineEntertainmentCo.HoldingsLimited
(May2015toFebruary2017)
Government and community involvement– DirectorofAustraliaPost– DirectorofSouthernPhoneCompanyLimited– DirectorofTheGOFoundation
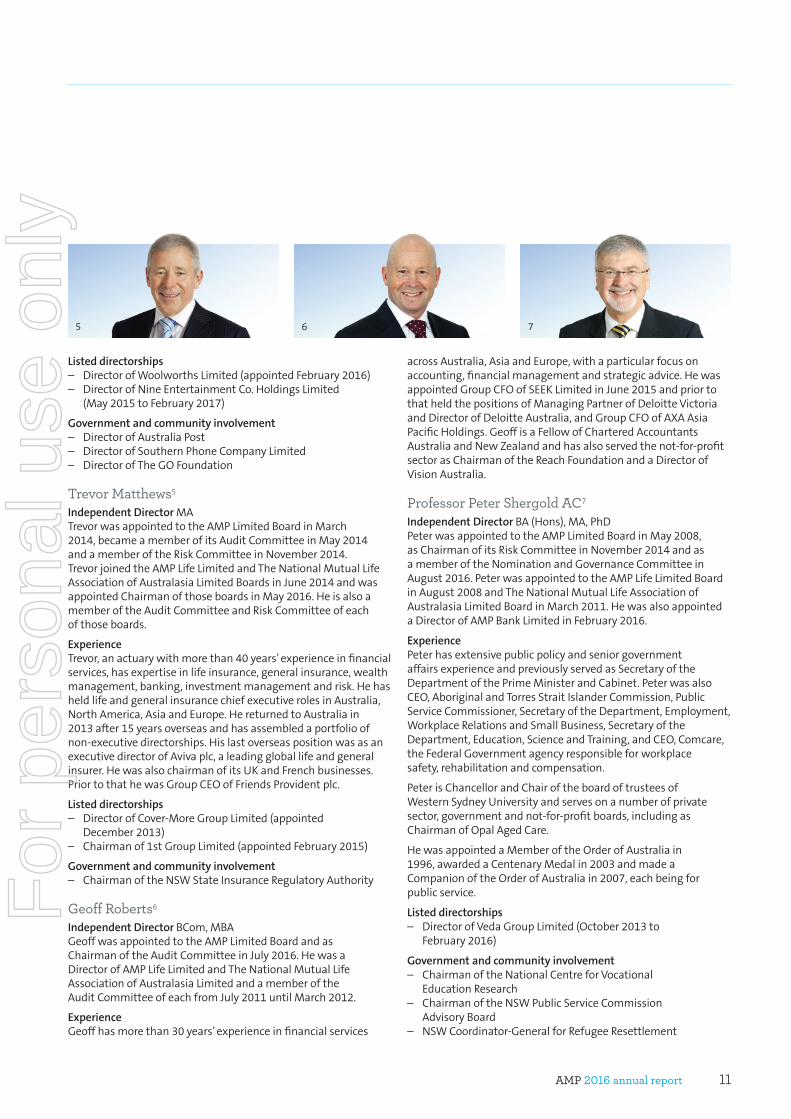
Trevor Matthews5
Independent Director MATrevorwasappointedtotheAMPLimitedBoardinMarch2014,becameamemberofitsAuditCommitteeinMay2014andamemberoftheRiskCommitteeinNovember2014.TrevorjoinedtheAMPLifeLimitedandTheNationalMutualLifeAssociationofAustralasiaLimitedBoardsinJune2014andwasappointedChairmanofthoseboardsinMay2016.HeisalsoamemberoftheAuditCommitteeandRiskCommitteeofeachofthoseboards.
ExperienceTrevor,anactuarywithmorethan40years’experienceinfinancialservices,hasexpertiseinlifeinsurance,generalinsurance,wealthmanagement,banking,investmentmanagementandrisk.HehasheldlifeandgeneralinsurancechiefexecutiverolesinAustralia,NorthAmerica,AsiaandEurope.HereturnedtoAustraliain2013after15yearsoverseasandhasassembledaportfolioofnon-executivedirectorships.HislastoverseaspositionwasasanexecutivedirectorofAvivaplc,aleadinggloballifeandgeneralinsurer.HewasalsochairmanofitsUKandFrenchbusinesses.PriortothathewasGroupCEOofFriendsProvidentplc.
Listed directorships– DirectorofCover-MoreGroupLimited(appointed
December2013)– Chairmanof1stGroupLimited(appointedFebruary2015)
Government and community involvement– ChairmanoftheNSWStateInsuranceRegulatoryAuthority
Geoff Roberts6
Independent DirectorBCom,MBAGeoffwasappointedtotheAMPLimitedBoardandasChairmanoftheAuditCommitteeinJuly2016.HewasaDirectorofAMPLifeLimitedandTheNationalMutualLifeAssociationofAustralasiaLimitedandamemberoftheAuditCommitteeofeachfromJuly2011untilMarch2012.
ExperienceGeoffhasmorethan30years’experienceinfinancialservices
acrossAustralia,AsiaandEurope,withaparticularfocusonaccounting,financialmanagementandstrategicadvice.HewasappointedGroupCFOofSEEKLimitedinJune2015andpriortothatheldthepositionsofManagingPartnerofDeloitteVictoriaandDirectorofDeloitteAustralia,andGroupCFOofAXAAsiaPacificHoldings.GeoffisaFellowofCharteredAccountantsAustraliaandNewZealandandhasalsoservedthenot-for-profitsectorasChairmanoftheReachFoundationandaDirectorofVisionAustralia.
Professor Peter Shergold AC7
Independent DirectorBA(Hons),MA,PhDPeterwasappointedtotheAMPLimitedBoardinMay2008,asChairmanofitsRiskCommitteeinNovember2014andasamemberoftheNominationandGovernanceCommitteeinAugust2016.PeterwasappointedtotheAMPLifeLimitedBoardinAugust2008andTheNationalMutualLifeAssociationofAustralasiaLimitedBoardinMarch2011.HewasalsoappointedaDirectorofAMPBankLimitedinFebruary2016.
ExperiencePeterhasextensivepublicpolicyandseniorgovernmentaffairsexperienceandpreviouslyservedasSecretaryoftheDepartmentofthePrimeMinisterandCabinet.PeterwasalsoCEO,AboriginalandTorresStraitIslanderCommission,PublicServiceCommissioner,SecretaryoftheDepartment,Employment,WorkplaceRelationsandSmallBusiness,SecretaryoftheDepartment,Education,ScienceandTraining,andCEO,Comcare,theFederalGovernmentagencyresponsibleforworkplacesafety,rehabilitationandcompensation.
PeterisChancellorandChairoftheboardoftrusteesofWesternSydneyUniversityandservesonanumberofprivatesector,governmentandnot-for-profitboards,includingasChairmanofOpalAgedCare.
HewasappointedaMemberoftheOrderofAustraliain1996,awardedaCentenaryMedalin2003andmadeaCompanionoftheOrderofAustraliain2007,eachbeingforpublicservice.
Listed directorships– DirectorofVedaGroupLimited(October2013to
February2016)
Government and community involvement– ChairmanoftheNationalCentreforVocational
EducationResearch– ChairmanoftheNSWPublicServiceCommission
AdvisoryBoard– NSWCoordinator-GeneralforRefugeeResettlement
5 6 7
For
per
sona
l use
onl
y
AMP 2016 annual report12
AMP Limited Board and management team as at 9 February 2017
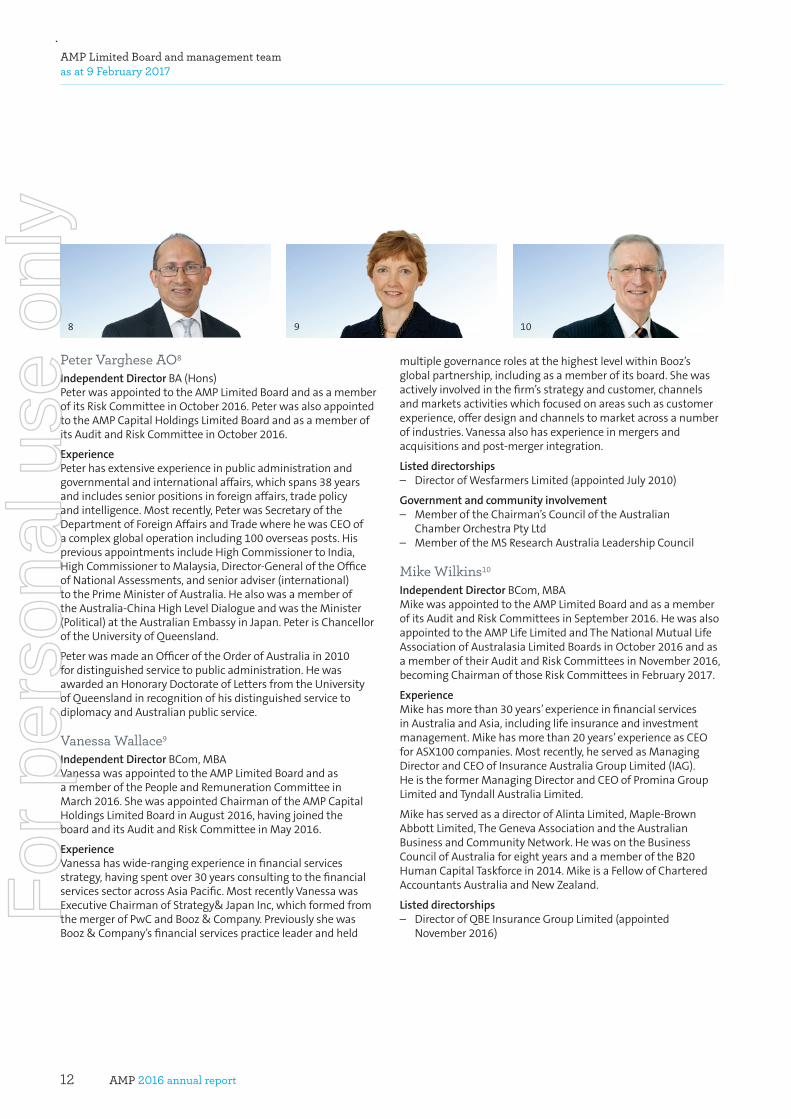
Peter Varghese AO8
Independent Director BA(Hons)PeterwasappointedtotheAMPLimitedBoardandasamemberofitsRiskCommitteeinOctober2016.PeterwasalsoappointedtotheAMPCapitalHoldingsLimitedBoardandasamemberofitsAuditandRiskCommitteeinOctober2016.
ExperiencePeterhasextensiveexperienceinpublicadministrationandgovernmentalandinternationalaffairs,whichspans38yearsandincludesseniorpositionsinforeignaffairs,tradepolicyandintelligence.Mostrecently,PeterwasSecretaryoftheDepartmentofForeignAffairsandTradewherehewasCEOofacomplexglobaloperationincluding100overseasposts.HispreviousappointmentsincludeHighCommissionertoIndia,HighCommissionertoMalaysia,Director-GeneraloftheOfficeofNationalAssessments,andsenioradviser(international)tothePrimeMinisterofAustralia.HealsowasamemberoftheAustralia-ChinaHighLevelDialogueandwastheMinister(Political)attheAustralianEmbassyinJapan.PeterisChancelloroftheUniversityofQueensland.
PeterwasmadeanOfficeroftheOrderofAustraliain2010fordistinguishedservicetopublicadministration.HewasawardedanHonoraryDoctorateofLettersfromtheUniversityofQueenslandinrecognitionofhisdistinguishedservicetodiplomacyandAustralianpublicservice.
Vanessa Wallace9
Independent DirectorBCom,MBAVanessawasappointedtotheAMPLimitedBoardandasamemberofthePeopleandRemunerationCommitteeinMarch2016.ShewasappointedChairmanoftheAMPCapitalHoldingsLimitedBoardinAugust2016,havingjoinedtheboardanditsAuditandRiskCommitteeinMay2016.
ExperienceVanessahaswide-rangingexperienceinfinancialservicesstrategy,havingspentover30yearsconsultingtothefinancialservicessectoracrossAsiaPacific.MostrecentlyVanessawasExecutiveChairmanofStrategy&JapanInc,whichformedfromthemergerofPwCandBooz&Company.PreviouslyshewasBooz&Company’sfinancialservicespracticeleaderandheld
8 9 10
multiplegovernancerolesatthehighestlevelwithinBooz’sglobalpartnership,includingasamemberofitsboard.Shewasactivelyinvolvedinthefirm’sstrategyandcustomer,channelsandmarketsactivitieswhichfocusedonareassuchascustomerexperience,offerdesignandchannelstomarketacrossanumberofindustries.Vanessaalsohasexperienceinmergersandacquisitionsandpost-mergerintegration.
Listed directorships– DirectorofWesfarmersLimited(appointedJuly2010)
Government and community involvement– MemberoftheChairman’sCounciloftheAustralian
ChamberOrchestraPtyLtd– MemberoftheMSResearchAustraliaLeadershipCouncil
Mike Wilkins10
Independent DirectorBCom,MBAMikewasappointedtotheAMPLimitedBoardandasamemberofitsAuditandRiskCommitteesinSeptember2016.HewasalsoappointedtotheAMPLifeLimitedandTheNationalMutualLifeAssociationofAustralasiaLimitedBoardsinOctober2016andasamemberoftheirAuditandRiskCommitteesinNovember2016,becomingChairmanofthoseRiskCommitteesinFebruary2017.
ExperienceMikehasmorethan30years’experienceinfinancialservicesinAustraliaandAsia,includinglifeinsuranceandinvestmentmanagement.Mikehasmorethan20years’experienceasCEOforASX100companies.Mostrecently,heservedasManagingDirectorandCEOofInsuranceAustraliaGroupLimited(IAG).HeistheformerManagingDirectorandCEOofProminaGroupLimitedandTyndallAustraliaLimited.
MikehasservedasadirectorofAlintaLimited,Maple-BrownAbbottLimited,TheGenevaAssociationandtheAustralianBusinessandCommunityNetwork.HewasontheBusinessCouncilofAustraliaforeightyearsandamemberoftheB20HumanCapitalTaskforcein2014.MikeisaFellowofCharteredAccountantsAustraliaandNewZealand.
Listed directorships– DirectorofQBEInsuranceGroupLimited(appointed
November2016)
For
per
sona
l use
onl
y
AMP 2016 annual report 13
Our management team
ThenewgroupstructuredeliversasharperfocusonperformanceinthecoreAustralianbusinesses,drivesefficiencyacrossthegroupandprovidesincreasedemphasisonthegrowthdriversintheportfolio.
PaulSainsbury,formerlyChiefCustomerOfficer,nowleadsanewWealthSolutionsandCustomerdivision,whileJackReganassumedmanagementofAMP’sadvicebusinessesinhisexpandedroleasGroupExecutive,AdviceandNewZealand.SallyBrucejoinedtheleadershipteamasGroupExecutive,AMPBank,whileMeganBeerwasappointedGroupExecutive,Insurance.CraigRyman,formerlyChiefInformationOfficer,wasappointedGroupExecutive,TechnologyandOperations,andSaskiaGoedhart,ChiefRiskOfficer,joinedtheleadershipteam.Thenewstructurewaseffective1January2017.
Thechangesresultedinthreeexecutivesleavingattheendof2016:PaulineBlight-Johnston,GroupExecutive,Insurance,SuperandRiskManagement;RobCaprioli,GroupExecutive,AdviceandBanking;andWendyThorpe,GroupExecutiveOperations.
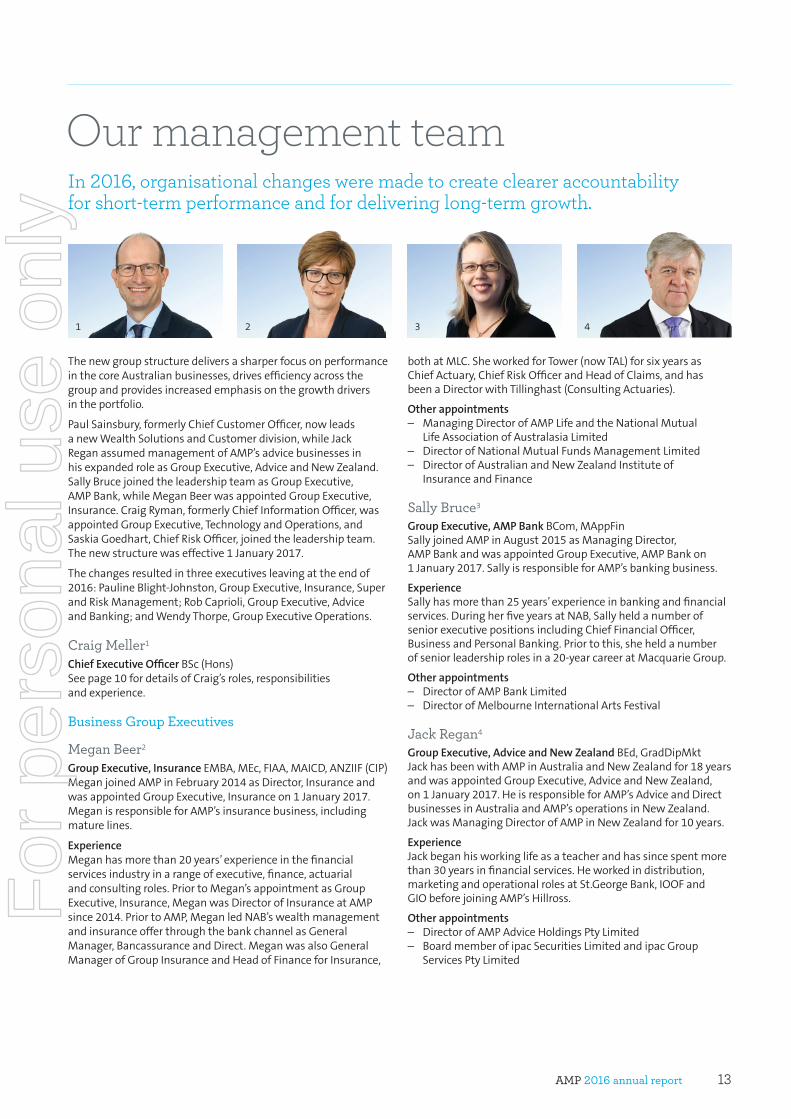
Craig Meller1
Chief Executive Officer BSc(Hons)Seepage10fordetailsofCraig’sroles,responsibilitiesandexperience.
Business Group Executives
Megan Beer2 Group Executive, Insurance EMBA,MEc,FIAA,MAICD,ANZIIF(CIP)MeganjoinedAMPinFebruary2014asDirector,InsuranceandwasappointedGroupExecutive,Insuranceon1January2017.MeganisresponsibleforAMP’sinsurancebusiness,includingmaturelines.
ExperienceMeganhasmorethan20years’experienceinthefinancialservicesindustryinarangeofexecutive,finance,actuarialandconsultingroles.PriortoMegan’sappointmentasGroupExecutive,Insurance,MeganwasDirectorofInsuranceatAMPsince2014.PriortoAMP,MeganledNAB’swealthmanagementandinsuranceofferthroughthebankchannelasGeneralManager,BancassuranceandDirect.MeganwasalsoGeneralManagerofGroupInsuranceandHeadofFinanceforInsurance,
bothatMLC.SheworkedforTower(nowTAL)forsixyearsasChiefActuary,ChiefRiskOfficerandHeadofClaims,andhasbeenaDirectorwithTillinghast(ConsultingActuaries).
Other appointments– ManagingDirectorofAMPLifeandtheNationalMutual
LifeAssociationofAustralasiaLimited– DirectorofNationalMutualFundsManagementLimited– DirectorofAustralianandNewZealandInstituteof
InsuranceandFinance
Sally Bruce3 Group Executive, AMP BankBCom,MAppFinSallyjoinedAMPinAugust2015asManagingDirector,AMPBankandwasappointedGroupExecutive,AMPBankon1January2017.SallyisresponsibleforAMP’sbankingbusiness.
ExperienceSallyhasmorethan25years’experienceinbankingandfinancialservices.DuringherfiveyearsatNAB,SallyheldanumberofseniorexecutivepositionsincludingChiefFinancialOfficer,BusinessandPersonalBanking.Priortothis,sheheldanumberofseniorleadershiprolesina20-yearcareeratMacquarieGroup.
Other appointments– DirectorofAMPBankLimited– DirectorofMelbourneInternationalArtsFestival
Jack Regan4
Group Executive, Advice and New ZealandBEd,GradDipMktJackhasbeenwithAMPinAustraliaandNewZealandfor18yearsandwasappointedGroupExecutive,AdviceandNewZealand,on1January2017.HeisresponsibleforAMP’sAdviceandDirectbusinessesinAustraliaandAMP’soperationsinNewZealand.JackwasManagingDirectorofAMPinNewZealandfor10years.
ExperienceJackbeganhisworkinglifeasateacherandhassincespentmorethan30yearsinfinancialservices.Heworkedindistribution,marketingandoperationalrolesatSt.GeorgeBank,IOOFandGIObeforejoiningAMP’sHillross.
Other appointments– DirectorofAMPAdviceHoldingsPtyLimited– BoardmemberofipacSecuritiesLimitedandipacGroup
ServicesPtyLimited
1 2 3 4
In 2016, organisational changes were made to create clearer accountability for short-term performance and for delivering long-term growth.
For
per
sona
l use
onl
y
AMP 2016 annual report14
AMP Limited Board and management team as at 9 February 2017
Paul Sainsbury5
Group Executive, Wealth Solutions and CustomerPaulwasappointedChiefCustomerOfficerinApril2013andwasappointedGroupExecutive,WealthSolutionsandCustomeron1January2017.InthisroleheisresponsibleforAMP’swealthmanagementbusinessandAMP’sstrategicfocusoncustomers.Paul’sportfolioofresponsibilityincludesdesigningandorchestratingAMP’scustomerexperiencestrategy,managementofAMP’ssuperannuation,retirementandinvestmentplatforms,businessdevelopment,digitalanddesign,aswellasAMP’sSMSFbusiness,SuperConcepts,andadedicatedbusinesstransformationteam.
ExperiencePaulhasworkedinthefinanceindustryforover30yearsandhasheldanumberofleadershippositionssincejoiningAMPin2000.TheseincludeDirector,ProductManufacturing;ChiefOperatingOfficer,AMPFinancialPlanning,Advice&Services;ChiefOperatingOfficer,ProductManufacturing;DirectorMatureProductsandCustomerService;andOperationsManager.From2010to2013,PaulwasresponsibleforAMP’smergerwiththeAustralianandNewZealandbusinessesofAXAAsiaPacificHoldingsLimited.
Adam Tindall6 CEO, AMP Capital BE(Hons),GDipMan,GCertAppFinInv,FAICDAdamwasappointedtotheroleofChiefExecutiveOfficer,AMPCapitalinOctober2015.AsCEO,Adamleadsamarketleadingspecialistinvestmentmanager,whichmanagesfundsonbehalfofretailandinstitutionalclientsacrossarangeofassetclassesincludingequities,fixedincome,realestateandinfrastructure.AMPCapitalhasofficesinAustralia,China,HongKong,India,Japan,Luxembourg,NewZealand,theUnitedArabEmirates,theUnitedKingdomandtheUnitedStates.
ExperienceBeforebeingappointedCEO,AdamheldtheroleofDirectorandChiefInvestmentOfficer,PropertyatAMPCapital.Adamhas30yearsofextensiveexperienceinthepropertyindustry.HejoinedAMPCapitalPropertyin2009fromMacquarieCapitalwherehewasExecutiveDirector,PropertyandInfrastructure,responsibleforcreatingorenhancinganumberofmajorpropertyinvestmentfunds.Priortothis,Adamspent17yearswithLendLease,ultimatelyworkinginvariousbusinessleadershiprolesincludingCEO,AsiaPacificforBovisLendLease.
Other appointments– ExecutiveMemberoftheAustraliaJapanBusiness
Co-operationExecutiveCommittee– MaleChampionofChange
Function Group Executives
Saskia Goedhart7 Chief Risk OfficerSaskiajoinedAMPinJuly2015asChiefRiskOfficerandwasappointedtothegroupleadershipteamon1January2017.SaskiaisresponsibleforAMP’sriskmanagement.
ExperienceSaskiajoinedAMPfromEYwhereshewasthepartnerresponsibleforriskmanagementinthefinancialsectorinCanada,andforriskmanagementininsuranceintheUS.Saskiahasmorethan20yearsofexperienceasariskmanagementprofessionalandhasworkedinNorthAmerica,EuropeandAsia.
PriorrolesincludeChiefRiskOfficer(CRO)fortheNorthAmericanregionatAvivaplcandCROforMunichReLife,alsoinNorthAmerica.Saskiaworkedfor10yearsatINGasHeadofEconomicCapitalandAssetLiabilityManagementintheUS,CROoftheannuitybusinessintheUS,ChiefFinancialOfficer,INGLifeinJapan,andotherseniorriskandfinancialmanagementrolesthroughoutINGinEurope.Saskiaalsohasmorethan10yearsofexperienceasacorporatefinanceandriskmanagementconsultant,havingworkedatEY,PwCandVanDenBoomGroep.
Gordon Lefevre8
Chief Financial OfficerFCAGordonjoinedAMPinJanuary2014andassumedtheChiefFinancialOfficerrolefrom1March2014.
ExperienceGordonhasconsiderablefinancialservicesindustryexperienceincluding13yearswiththeNationalAustraliaBankGroup.Hiscareeratthebankincludedarangeofbothcustomerfacingandgroupsupportfunctionrolesdomesticallyandoverseas.ImmediatelypriortoleavinghewastheDeputyGroupChiefFinancialOfficer.BeforejoiningAMPhewasChiefFinancialOfficeroftheGroconConstructionGroupinAustralia.
Other appointment – DirectorofAMPBankLimited
65 7 8
For
per
sona
l use
onl
y
AMP 2016 annual report 15
Helen Livesey9 Group Executive, Public Affairs and Chief of Staff Bsc(Hons)HelenjoinedAMPin1999andwasappointedGroupExecutive,PublicAffairsandChiefofStaffon1January2017.Helenhasgroup-wideresponsibilityforbrand,reputationandcommunicationsmanagement,managingAMP’srelationshipwithkeystakeholders.
ExperienceHelenhasheldanumberofseniorrolesatAMP,includingDirectorBrandandMarketing,DirectorCorporateCommunicationsandDirectorPublicAffairsUK.Helenhasover20years’experienceincorporateaffairs,marketingandbrandmanagementacrossarangeofindustriesinAustraliaandtheUKinbothconsultancyandin-houseroles.
Craig Ryman10 Group Executive, Technology and OperationsBComCraigjoinedAMPin1997andwasappointedtotheroleofGroupExecutive,TechnologyandOperations,effective1January2017.CraigisresponsibleforAMP’sgroup-wideinformationtechnologyandoperations.
ExperiencePriortohiscurrentrole,CraigwasAMP’sChiefInformationOfficerandbeforethatITDirectorforAMP’sAdviceandBankingandInsuranceandSuperannuationbusinessareas.DuringhistimeatAMP,CraighasledtheITfunctionforavarietyofdifferentareasofthebusinessandhasalsocompletedarangeoftransformationprogramsincludingtheintegrationoftheAustraliaandNewZealandbusinessesofAXAAsiaPacificHoldings,platformconsolidationprojectsandtransformationinitiativesinAustraliaandtheUK.
BeforejoiningAMP,CraigworkedasasuperannuationconsultantforWilliamMMercerinAustralia.
Brian Salter11 Group General Counsel BA,LLB(Hons),LLM(Hons)BrianjoinedAMPinJuly2008asGroupGeneralCounsel.Brianhasgroup-wideresponsibilityforAMP’slegalandgovernancefunctions.
ExperienceBrianhasover35years’experienceinthelegalprofession,advisingmanyofAustralia’sleadingfinancialandwealthmanagementcompanies.BeforejoiningAMP,BrianwasapartnerwithamajorAustralianlawfirmfor19yearsandamemberofitsexecutiveteamforanumberofyears.
BrianisaformermemberoftheAustralianGovernment’sCorporationsandMarketsAdvisoryCommittee(CAMAC),whichwasestablishedtoprovideindependentadvicetotheAustralianGovernmentonissuesthatariseincorporationsandfinancialmarketslawandpractice.BrianisalsoamemberoftheLegalCommitteeoftheAustralianInstituteofCompanyDirectorsandtheCorporationsCommitteeoftheBusinessLawSectionoftheLawCouncilofAustraliaandistheDeputyChairoftheGeneralCounsel100.HeisaformerChairmanandNationalCommitteememberoftheAustralianSecuritisationForum.
Other appointments– ExecutiveDirectorofAMPSuperannuationLimited– ExecutiveDirectorofN.M.SuperannuationProprietaryLimited– ChairmanofSCECGSRedlandsLimited
Fiona Wardlaw12 Group Executive, People and CultureBA(Psych)(Hons)FionajoinedAMPinAugust2008andhasresponsibilityforAMP’speopleandculturefunction.
ExperienceFionajoinedAMPfromANZBankwhere,asheadofLeadershipandTalent,shewasresponsibleforrecruitmentstrategy,talentmanagement,successionplanningandseniorexecutivedevelopment.PriortojoiningANZ,FionaworkedintheAustralianbankingoperationsatNationalAustraliaBank,whereherrolesincludedheadingupthebank’sunsecuredlendingbusinessandleadingtheAustralianhumanresourcesfunction.
Herbackgroundalsoincludesexecutivehumanresourcesexperienceintheresourcesandtelecommunicationssectors,includingCableandWireless’cableTVstart-upOptusVisionandBHP.
Other appointment– DirectorofAMPFoundationLimited
9 1110 12
For
per
sona
l use
onl
y
AMP 2016 annual report16
Corporate governance
Corporate governance at AMPThis section explains how AMP’s business is structured and managed to deliver on our strategy and protect the interests of our shareholders, customers, employees, business partners and communities.
Ourpromiseistohelppeopleowntomorrow.Thisisaresponsibilitywetakeseriously,andourgovernanceframeworkisdesignedtoprovidetherightstructureandreviewprocessestodeliveronourpromiseformanyyearstocome.
Key information During2016,AMPcontinuedtostrengthenandenhanceitscorporategovernancepractices,includinginthefollowingkeyareas:
Succession planning–atAMP,ensuringthattheAMPLimitedBoardasawholemaintainstherightcombinationofskillsandexperiencetodriveourbusinessforwardiskeytooursuccess.In2016,theboard’sskillsandexperiencewereenhancedwiththeappointmentsofVanessaWallace,GeoffRoberts,MikeWilkinsandPeterVarghese.Theseappointmentsunderlinetheintegrityandstrengthoftheboard’snominationandsuccessionplanningprocesses.Youcanfindthedirectors’biographies,includingdetailsoftheirqualifications,tenureandexperience,inthisreportandonourwebsite.
Inclusion and diversity–AMPiscommittedtofosteringaninclusiveanddiverseworkplace.Genderequalityisaclearpriority,andat31December2016,womenheld40%ofAMPLimitedBoardandseniorexecutivepositions.Womenalsoheld41%ofourmiddlemanagerroles,slightlybehindtarget(42%).Weremaincommittedtoincreasinggenderrepresentationatthislevelandtoarangeofbroaderinclusionanddiversitygoalsandinitiatives,includinganincreasedfocusonflexiblework.
Risk culture–AMPvalueseffectiveriskmanagementasfundamentaltoitslong-termsustainabilityandreputation.Theboardandmanagementbelievethateffectiveriskmanagementrequiresarisk-awarecultureamongstallemployees.In2016,AMPcontinuedtofocusoninitiativestofurtherembedriskawarenessintoAMP’sbroaderculturetoensurethatriskiseffectivelyintegratedintodecisionmaking.
Corporate sustainability–atAMP,corporatesustainabilityencompassesabroadrangeofmattersincludingenvironmentalmanagement,peopleandworkplace,corporateresponsibilityandcommunityinvestment.In2016,AMPcontinuedtoreduceitsgreenhousegasemissions,by25%fromour2013baseyear,andtheAMPFoundationdistributed$5.2milliontothecommunity.
Board governance–during2016,wecomprehensivelyreviewedtheboard’sgovernancemodeltoprovideenhancedclarityovertherolesandresponsibilitiesoftheboardanditscommittees,forgreatergovernanceefficiencyandeffectiveness.
Engaging with our shareholdersAMP encourages our individual and institutional shareholders to actively engage with our business.
Ourshareholdersaretheownersofourcompanyandwevaluetheirinput.During2016,wehadthesecond-largestshareholderbaseofanycompanyinAustraliawithover795,000shareholders,manyofwhomarealsoourcustomers.
Keeping our shareholders informedAMPvaluesdirect,two-waycommunicationwithourshareholdersandweensurethattheyreceiveclear,transparentandtimelyinformationaboutourbusiness.Wecommunicatewithourshareholdersonchangestoourbusinessandissuesthatimpactourindustry.
Wetakeourcontinuousdisclosureobligationsseriously.AllmaterialpricesensitiveinformationthatrequiresdisclosureismadeavailablethroughtheAustralianSecuritiesExchange(ASX)andNewZealandStockExchange(NZX).ShareholderscanalsoelecttoreceiveemailsdirectlyfromAMPonkeyannouncements,andwecontinuetoencourageshareholderstoprovidetheiremailaddresssowecandelivertimelyupdatesdirecttotheirinbox.
Shareholderscanelecttoreceivetheirannualreports,noticesofmeetinganddividendstatementsinprintoronline.Shouldtheychoosetoreceivetheirreportinginformationonline,theycanstillopttoreceiveacopyoftheirdividendstatementbypost.Inaddition,shareholdersareabletocommunicateelectronicallywithourshareregistry,Computershare.Shareholdersarealsoabletolodgetheirproxyformsonlineusingtheircomputerormobiledevice.
OurInvestorRelationsteamcoordinatesaninvestorrelationsprogramandconductsgroupandone-on-onebriefingswithourinstitutionalinvestorsandanalysts.Wherepossible,ourgroupbriefingsarewebcast.Ourdedicatedshareholderwebsiteincludesacalendarofupcomingannouncementsandpresentationsandallowsuserstosetupautomaticdiaryremindersofthesedates.Youcanfindthiswebsiteatamp.com.au/shares.
Annual shareholder meetingOurboardwelcomestheopportunitytomeetwithourshareholdersandencouragesthemtojoinusforourannualgeneralmeeting(AGM)eachyeareitherinpersonorviaourwebcast.WeencourageshareholderstoprovideuswithanyquestionsaboutourbusinessorthebusinessoftheAGMaheadofeachmeeting,sothatthesecanbeaddressedbeforeoratthemeeting.ForshareholderswhoareunabletoattendtheAGM,weenablequestionstobeaskedonlineduringthemeeting.
For
per
sona
l use
onl
y
AMP 2016 annual report 17
Weareagainofferinganinformationsessionforshareholderstohearfromourfinancialexpertsandbenefitfromtheirinsightsandexpertise.Thissessionwillbeheldbeforethe2017AGM,at9.30amonThursday11May2017atSydneyTownHall,andallshareholdersareinvitedtojointhesessioninpersonoronline.
2017 annual general meetingAMP’s2017AGMwillbeheldat11amonThursday11May2017atSydneyTownHall.Shareholderswhoareunabletoattendcanappointaproxytovoteontheirbehalf,eitheronlineorbypostorfax,andcanobserveandcontributetothemeetingthroughourwebcast.Youcanfindfulldetailsinthe2017noticeofmeeting.
Our board of directorsThe AMP Limited Board oversees the management of our company on behalf of shareholders.
TheboardisresponsibleforoverseeingthemanagementofAMPonbehalfofshareholders.Inadditiontothematterstheboardisrequiredtoapprovebylaw,itskeyresponsibilitiesinclude:– approvingthestrategicdirectionofthecompanyand
overseeingitsimplementation– approvingmaterialtransactionsandcapitalinitiatives– overseeingandapprovingthecompany’sgovernancemodel– approvingtheriskmanagementframework(including
riskappetite,riskmanagementstrategy,andcontrolandcompliancesystems)andmonitoringitseffectiveness(includingriskculture)
– approvingtheappointmentofthechiefexecutiveofficer(CEO)andchieffinancialofficer(CFO)andtheremunerationarrangementsforcertainkeyexecutives
– overseeingsuccessionplanningforkeyexecutiveroles– approvingdiversitytargetsandoverseeingprogress
againstthem– monitoringtheperformanceofmanagementand
thebusiness.
Theresponsibilitiesoftheboardareoutlinedinourcorporategovernancecharter,whichyoucanfindatamp.com.au/corporategovernance.
Board compositionAMP’s non-executive directors have diverse backgrounds. Each brings valuable skills and experience to help oversee the delivery of our strategy and manage the opportunities and risks we face.
Underourcorporategovernancecharter,theboardmustbemadeupofamajorityofindependentnon-executivedirectorsandwillhavenomorethantwoexecutivedirectors.Thechairmanoftheboardwillbenon-executiveandindependent.Themaximumtenureofanon-executivedirectorwillnormallybeuntiltheAGMoccurringintheninthyearaftertheirfirstelectionbyshareholdersatanAGM.
Ourboardismadeupofnineindependentnon-executivedirectorsandtheCEO.OurChairman,CatherineBrenner,joinedtheboardin2010andwaselectedChairmaninJune2016.SheisresponsibleforprovidingleadershiptotheboardandtheAMPgroupasawhole.
Youcanfindbiographiesoftheboardofdirectors,includingdetailsoftheirqualifications,tenureandexperience,onpages10to12andonourwebsite.
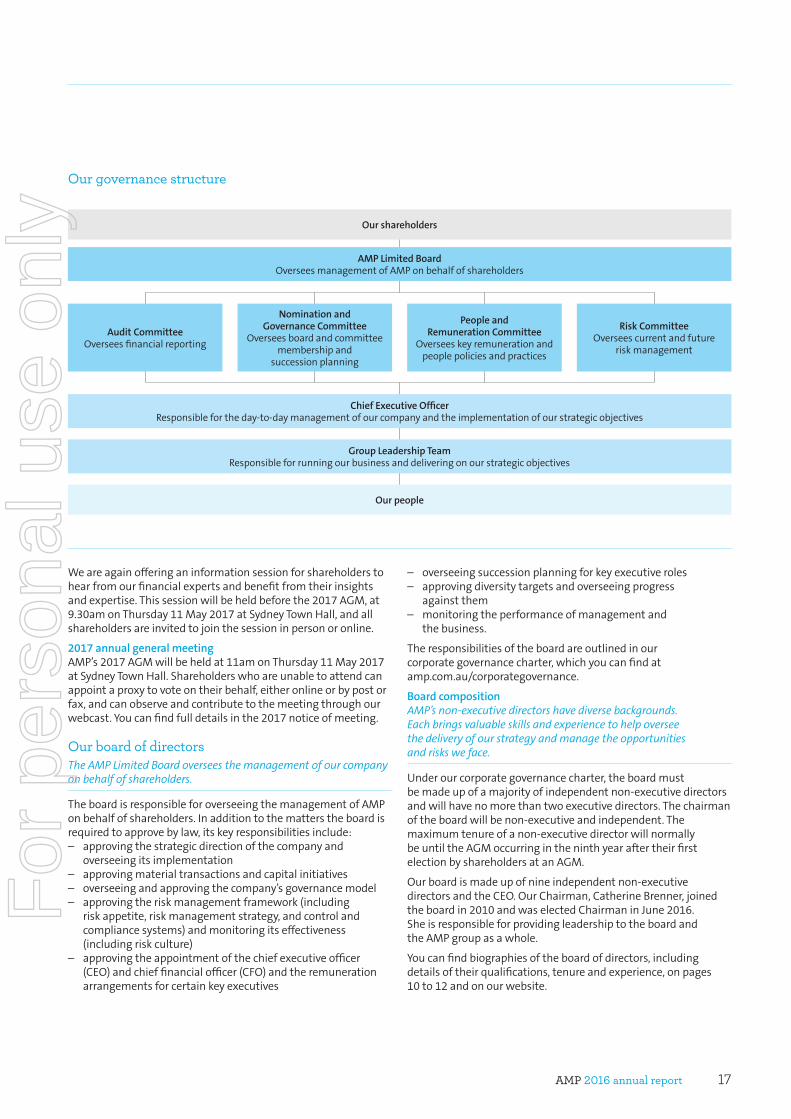
Our shareholders
AMP Limited Board OverseesmanagementofAMPonbehalfofshareholders
Audit Committee Overseesfinancialreporting
Nomination and Governance Committee
Overseesboardandcommitteemembershipand
successionplanning
Chief Executive Officer Responsiblefortheday-to-daymanagementofourcompanyandtheimplementationofourstrategicobjectives
Group Leadership Team Responsibleforrunningourbusinessanddeliveringonourstrategicobjectives
Our people
People and Remuneration Committee
Overseeskeyremunerationandpeoplepoliciesandpractices
Risk Committee Overseescurrentandfuture
riskmanagement
Our governance structure
For
per
sona
l use
onl
y
AMP 2016 annual report18
Corporate governance
Board committeesThe AMP Limited Board is supported by four committees, which focus in detail on different areas of the board’s responsibilities and provide a strong governance framework.
Theboardhasthefollowingfourcommitteestoassistintheexecutionofitsresponsibilities:
Audit Committee–responsibleforoverseeingtheintegrityofthefinancialstatements,reviewingtheeffectivenessofAMP’sriskmanagementframeworkandmonitoringtheperformance,adequacyandindependenceoftheinternalandexternalauditfunctions
Nomination and Governance Committee–responsibleforreviewingthecompositionofAMP’sboardsandsuccessionplanningandplanningforboard,committeeanddirectorperformancereviews
People and Remuneration Committee–responsibleforreviewingandendorsingtheremunerationarrangementsforcertainexecutivesandnon-executivedirectors,monitoringtheeffectivenessofAMP’sstrategiesforexecutivesuccession,talentmanagementanddiversityandapprovingmattersrelatingtoAMP’skeyincentiveplans
Risk Committee–responsibleforoverseeingtheimplementationandoperationofAMP’senterpriseriskmanagementframework,monitoringAMP’sriskcultureandendorsingAMP’sriskmanagementstrategy,riskappetitestatementandtheappointmentofthechiefriskofficer.
Eachcommitteehasitsownannualprogramandmeetsatleastfourtimesperyear.Eachprogramprovidesahigh-leveloverviewofitemstobeconsideredbytherelevantcommitteeduringtheyear.Throughout2016,allcommitteememberswereindependentdirectors.
Youcanfindthetermsofreferenceforeachcommitteeatamp.com.au/corporategovernance.
Managing risksEvery day AMP monitors and manages risks to deliver sustainable growth, protect our business and our stakeholders’ interests, and meet our legal and regulatory obligations.
Riskisinherentinourbusinessandindustry.Assuch,wetakemeasuredriskstoachieveAMP’svisionofhelpingpeopleowntomorrowanddeliversustainablevaluetoourshareholders.Effectiveriskmanagementsupportsinformeddecisionmakingandaidsincapitalisingonbusinessopportunitiestoensurethat
strategicobjectivesareachieved.TheboardandmanagementvalueeffectiveriskmanagementasfundamentaltoAMP’slong-termsustainabilityandreputation.Inaddition,theboardandmanagementbelievethateffectiveriskmanagementrequiresarisk-awarecultureamongstallemployees,whichinturnpromotesrisk-informeddecisionmaking.
GovernanceTheboardisultimatelyresponsiblefortheEnterpriseRiskManagement(ERM)frameworkandoversightofitsoperationbyAMP’smanagement.Inparticular,theboardisresponsibleforsettingAMP’sriskappetite,thestrategicplanandriskmanagementstrategy.ItalsomonitorspoliciesandbusinesspracticestoensurethatstrategicobjectivesareachievedwithinAMP’sriskappetiteandtocomplywithapplicablelawsandregulations.TheRiskCommitteeandboardreviewtheERMframeworkatleastannually,includingfor2016,tosatisfythemselvesthatitcontinuestobesound.
TheboardandRiskCommitteehavebeenprovidedwithassurancethatallofAMP’smaterialbusinessriskshavebeeneffectivelymanagedfortheyearended31December2016.
Wehaveathreelinesofdefenceapproachtoriskmanagementaccountability:
Line 1–managementisresponsibleforidentifying,assessing,monitoringandmanagingmaterialrisksinthebusiness.Theseteamsareresponsiblefordecisionmakingandtheexecutionoftheday-to-daybusiness,whilstmanagingriskandtheresultingprofitandlosstoensureitisinlinewiththeboard’sriskappetiteandstrategy.
Line 2–theERMteamisresponsiblefordesigning,implementingandmonitoringthepracticesandprocessestoidentify,assess,monitorandmanagematerialrisksandprovideadviceandoversightonmaterialbusinessdecisions.Theteamalsoprovidesobjectiveadviceandchallengetothefirstline’sdecisionsandprovidesassurancetotheboardthattheriskprofileisalignedwiththeboard’sexpectations.
Line 3–theInternalAuditteamprovidesindependentandobjectiveassurancetotheboardontheoperationaleffectivenessofriskmanagementacrossthebusinessandtheeffectivenessofourcontrolprocesses.
ManagementprocessesarecomplementedbytheInternalAuditteam,whichregularlyreportstotheleadershipteamandtheboardonthemanagementofriskswithintheorganisation.Thisteamcallsonsupportandadvicefromexternalexpertsasrequired.
AnoutlineofAMP’skeyriskscanbefoundinthedirectors’report.
For
per
sona
l use
onl
y
AMP 2016 annual report 19
Our approach to taxAMP is proud of the contribution we make to the public finances of the countries in which we operate.
Wetakeourtaxobligationsveryseriouslyandarefocusedonintegrityinbothcomplianceandreporting.TheAMPLimitedBoarddoesnotsanctionorsupportanyactivitieswhichseektoaggressivelystructureAMP’staxaffairs.
WepublishdetailsofthetaxeswepayintheAMPtaxreportonourshareholdercentrewebsiteatamp.com.au/shares.ThereportisconsistentwiththeBoardofTaxation’svoluntarytaxtransparencycode.
ThemajorityofourtaxispaidinAustraliaanddeterminedbythenatureofourbusiness.Forexample,superannuationissubjecttodifferent(lower)taxratesandwepayourtaxesaccordingly.
WehaveanannualcompliancearrangementinrelationtobothincometaxandGSTwiththeAustralianTaxationOffice,andweworkcloselywithittoensurethatwemeetallourtaxrequirements.
Comparison of NZX and ASX corporate governance rulesAsanNZXoverseaslistedissuer,AMPLimitedisdeemedtosatisfyandcomplywithalltheNZXListingRulessolongasitremainslistedontheASX.TheonlyNZXrequirementsapplicabletoAMParetogivetheNZXthesameinformationandnoticesitis
requiredtogivetotheASXandtoincludeastatementtothiseffectinitsannualreport.
TheASXListingRulesandtheASXRecommendationsmaydiffermateriallyfromNZX’scorporategovernancerulesandtheprinciplesoftheNZXCorporateGovernanceBestPracticeCode.YoucanfindfurtherinformationabouttheASXRecommendationsontheASXwebsite:asx.com.au/regulation/corporate-governance-council.htm.
Acting ethically and responsiblyAMP wants to create a better tomorrow for our customers, employees, business partners, communities and shareholders.
Everythingwedo,everydecisionwemake,hasanimpact,notonlyonthelong-termsuccessofourbusinessbutalsoonthelivesofourcustomers.Wearecommittedtoactingwithprofessionalism,honestyandintegritysoallourstakeholdersknowtheycantrustustodotherightthing.Youcanfindinformationonthestructureofourbusiness,ourboardandmanagementteamsandourpoliciesandpracticesatamp.com.au/aboutamp.
Throughout2016,wecompliedwiththethirdeditionoftheASXCorporateGovernancePrinciplesandRecommendations,andwecontinuallyreviewourgovernancepracticestoensurethatwenotonlymeetbutexceedtheexpectationsoftheregulatorsandallourstakeholders.Ourboard-approvedcorporategovernancestatement,dated8February2017,isavailableonourwebsiteatamp.com.au/corporategovernance.
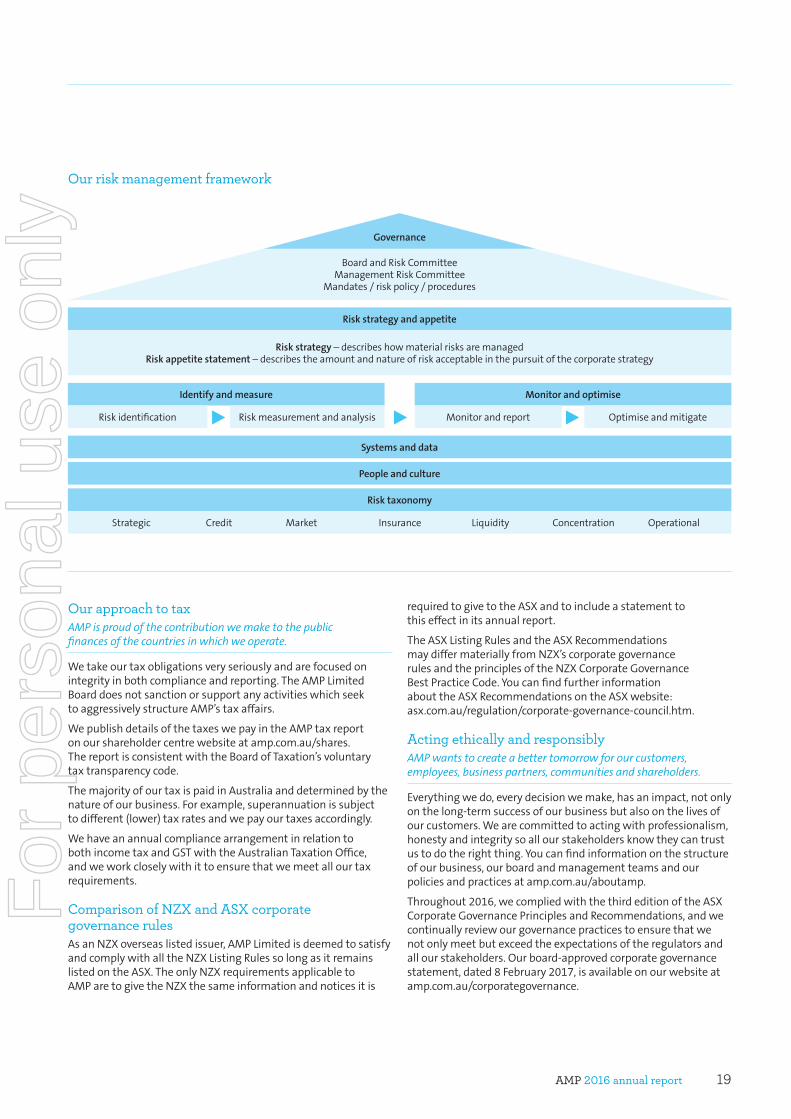
Our risk management framework
Risk strategy and appetite
Systems and data
People and culture
Risk taxonomy
Strategic Credit Market Insurance Liquidity Concentration Operational
Identify and measure Monitor and optimise
Riskidentification MonitorandreportRiskmeasurementandanalysis Optimiseandmitigate
Risk strategy–describeshowmaterialrisksaremanagedRisk appetite statement–describestheamountandnatureofriskacceptableinthepursuitofthecorporatestrategy
Governance
BoardandRiskCommitteeManagementRiskCommittee
Mandates/riskpolicy/procedures
For
per
sona
l use
onl
y
AMP 2016 annual report20
Directors’ report for the year ended 31 December 2016
Operating and financial reviewPrincipal activitiesAMPisAustraliaandNewZealand’sleadingindependentwealthmanagementcompany,withanexpandinginternationalinvestmentmanagementbusinessandagrowingretailbankingbusiness.
WeprovideretailcustomersinAustraliaandNewZealandwithfinancialadviceandsuperannuation,retirementincomeandinvestmentproducts.Wealsoprovidesuperannuationservicesforbusinesses,administration,bankingandinvestmentservicesforself-managedsuperannuationfunds(SMSF),incomeprotection,disabilityandlifeinsurance,andselectedbankingproducts.TheseproductsandservicesaredelivereddirectlyfromAMPandthroughanetworkofover3,500alignedandemployedfinancialadvisersinAustraliaandNewZealandandextensiverelationshipswithindependentfinancialadvisers.
ThroughAMPCapital,wemanageinvestmentsacrossmajorassetclassesincludingequities,fixedincome,infrastructure,realestate,diversifiedfunds,multi-managerandmulti-assetfunds,fordomesticandinternationalcustomers.AMPCapitalalsoprovidescommercial,industrialandretailrealestatemanagementservices.
Wehaveover5,400employees,around795,000shareholdersandmanageandadminister$240billioninassets.
AMPCapitalhasastrategicalliancewithleadingJapanesebank,MitsubishiUFJTrustandBankingCorporation(MUTB)throughwhichMUTBholdsa15%minorityinterestinAMPCapitalHoldingsLimited.AMPCapitalholdsa15%stakeinChinaLifeAMPAssetManagementCompanyLimited,afundsmanagementcompanywhichoffersretailandinstitutionalinvestorsinChinaaccesstoleadinginvestmentsolutions.AMPalsoownsa19.99%stakeinChinaLifePensionCompany.
In this report, our business is divided into six areas: Australian wealth management, AMP Capital, Australian wealth protection, AMP Bank, New Zealand financial services and Australian mature.
TheAustralian wealth managementbusinessprovidescustomerswithsuperannuation,retirementincome,investment,SMSFadministrationandfinancialadviceservices(throughalignedandownedadvicebusinesses).
AMP Capitalisadiversifiedinvestmentmanager,managinginvestmentsacrossmajorassetclassesincludingequities,fixedinterest,infrastructure,realestate,diversifiedfunds,multi-managerandmulti-assetfunds.
Directors’ reportThis directors’ report provides information on the structure and progress of our business, our 2016 financial performance, our strategies and prospects for the future and the key risks we face. It covers AMP Limited and the entities it controlled during the year ended 31 December 2016.
Australian wealth protectioncomprisesindividualandgrouptermlife,trauma,disabilityandincomeprotectioninsuranceproducts.Productscanbebundledwithasuperannuationproductorheldindependently.
AMP BankisanAustralianretailbankofferingresidentialmortgages,deposits,transactionalbanking,andSMSFproductswitharound100,000customers.ItalsohasasmallportfolioofpracticefinanceloanssupportingAMP’sAdvisernetwork.AMPBankdistributesthroughbrokers,AMPadvisersanddirecttoretailcustomersviaphoneandinternetbanking.
New Zealand financial servicesprovidestailoredfinancialproductsandsolutionstoNewZealandersbothdirectlyandthroughanetworkoffinancialadvisers.NewZealandfinancialserviceshasaleadingmarketpositioninbothwealthprotectionandwealthmanagement,inadditiontobeingthemarketleaderinadviceandinprovidingsupporttoadvisers.
The Australian mature businessisthelargestclosedlifeinsurancebusinessinAustralia.Australianmatureassetsundermanagement(AUM)comprisescapitalguaranteedproducts(77%)andmarketlinkedproducts(23%).Australianmatureproductsincludewholeoflife,endowment,investmentlinked,investmentaccount,retirementsavingsaccount,eligiblerolloverfund,annuities,insurancebonds,personalsuperannuationandguaranteedsavingsaccounts.
2016 performanceThelossattributabletoshareholdersofAMPLimitedfortheyearended31December2016was$344million(2015:profitof$972million).
Basiclossespersharefortheyearended31December2016onastatutorybasiswere11.7centspershare(2015:earningsof33.3centspershare).Onanunderlyingbasis,theearningspersharewere16.4centspershare(2015:37.9centspershare).
Keyperformancemeasureswereasfollows:
– 2016underlyingprofit1of$486millionfellfrom$1,120millionin2015largelyduetoAustralianwealthprotectionlossesof$415million.2016underlyingprofitwasalsoimpactedbychallenginginvestmentmarketconditionsthatresultedinloweroperatingearningsinAustralianwealthmanagement(-2%)andexpectedportfoliorun-offwhichreducedtheearningsofAustralianmature(-4%).
– 2016Australianwealthprotectionoperatinglossesweredrivenbyexperiencelossesof$105millionandcapitalisedlossesandotherone-offexperienceitemsof$485million.
1 Underlyingprofitisourkeymeasureofbusinessprofitability,asitnormalisesinvestmentmarketvolatilitythatstemsfromshareholderassetsinvestedininvestmentmarketsandaimstoreflectthetrendsintheunderlyingbusinessperformanceoftheAMPgroup.
For
per
sona
l use
onl
y
AMP 2016 annual report 21
– Partialoffsetstothesefallsin2016camefromstrongoperatingearningsgrowthfromAMPBank(+15%),NewZealandfinancialservices(+5%)andAMPCapital(+4%).
– 2016underlyinginvestmentincomefell$3millionto$122millionfrom2015.
– AMPgrouptotalcontrollablecostsincreased$64million(5%)on2015to$1,393million.Underlyingcostgrowth,increasedinvestmentingrowthinitiativesandbusinessrestructuringcostswereonlypartlyoffsetbybusinessefficiencyprogrambenefits.
– Australianwealthmanagementnetcashflowswere$336millionin2016,downfrom$2,213millionin2015.Netcashflowswereimpactedbyongoingmarketvolatility,superannuationlegislativeuncertaintyandadvisersadjustingtoanenhancedregulatoryenvironment.
– AMPCapitalexternalnetcashflowswere$967millionin2016,downfrom$4,434millionin2015.StrongflowsintoinfrastructureandrealestateassetclasseswereoffsetbychallengingdomesticandJapaneseretailmarketconditions.
– Underlyingreturnonequitydecreased7.6percentagepointsto5.6%in2016from2015,largelyreflectingtheimpactofAustralianwealthprotectionexperienceandcapitalisedlosses.
AMP’stotalassetsundermanagement(AUM)andadministrationwere$240billionat31December2016(2015:$226billion).
Differences between underlying profit and statutory profitThe31December2016underlyingprofitof$486millionexcludestheimpact(netofanytaxeffect)of:– goodwillimpairmentof$668million– netlossfromone-offandnon-recurringitemsof$9million– businessefficiencyprogramcostsof$19million– amortisationofAXAacquiredintangibleassetsof$77million– marketadjustmentlossesof$43million– accountingmismatchlossesof$14million.
AreconciliationbetweenunderlyingprofitandstatutoryprofitisprovidedinNote1.1ofthefinancialreport.
UnderAustralianAccountingStandards,someassetsheldonbehalfofpolicyholders(andrelatedtaxbalances)areincludedinthefinancialstatementsatdifferentvaluestothoseusedinthecalculationoftheliabilitytopolicyholdersinrespectofthesameassets.Theseaccountingvaluationdifferencesbetweenpolicyholderassetsandliabilitiesflowthroughtoshareholderprofit,buthavenoimpactonthetrueeconomicprofitsandlossesoftheAMPgroup.
Operating results by business areaTheoperatingresultsofeachbusinessareafor2016wereasfollows:
Australian wealth management–operatingearningsfellby$9million(2%)to$401millionin2016from$410millionin2015,largelyduetothechallenginginvestmentmarketconditionswhichimpactedinvestorsentimentandearnings,primarilyinthefirsthalfof2016.Operatingearningsbenefitedfromstrongcostcontrol,includinglowervariableremunerationinthesecondhalfof2016.
AMP Capital–AMPgroup’s85%shareofAMPCapital’s2016operatingearningswas$144million,up4%from$138millionin2015.Despitevolatileequitymarketsin2016,AMPCapital’s
operatingearningsbenefitedfrompositivefeeincomegrowthof5%,assistedbystrongperformancefeesinthefirsthalfof2016.Feeincomegrowthwaspartiallyoffsetbyan8%increaseincontrollablecosts.
Australian wealth protection–2016operatinglossesof$415million(2015:operatingearningsof$185million)wereimpactedbyexperiencelossesof$105millionandcapitalisedlossesandotheroneoffexperienceitemsof$485million.Profitmarginsfellby$21million(11%)to$175millionin2016,largelyduetotheimpactofstrengthenedassumptionsadoptedforlumpsumproductsinthesecondhalfof2015andtheimplementationofa50%quotasharereinsurancearrangementof$750millionofannualpremiumincomeoftheAMPLiferetailportfolio,withMunichReinsuranceCompanyofAustralasiaLimited,effectivefrom1November.
AMP Bank–operatingearningsincreased$16million(15%)to$120millionin2016from$104millionin2015.Totalrevenueincreased11%in2016on2015,drivenbyimprovednetinterestmarginandgrowthintheloanportfolio.
New Zealand financial services–operatingearningsincreasedby$6million(5%)to$126millionin2016from2015largelyasaresultofhigherprofitmargins,partiallyoffsetbythereductionintransitionaltaxrelief.
Australian mature–operatingearningsfell$7millionto$151millionin2016from$158millionin2015.Operatingearningswereimpactedbytheexpectedportfoliorun-off($9milliondecrease),investmentmarkets($1million)andotheritems($1million).Thesewerepartiallyoffsetbylowercontrollablecosts($3million)andexperienceprofits($1million).
Capital management and dividendEquityandreservesoftheAMPgroupattributabletoshareholdersofAMPLimiteddecreasedto$7.5billionat31December2016from$8.5billionat31December2015.
AMPremainswellcapitalised,with$2.2billioninshareholderregulatorycapitalresources,aboveminimumregulatoryrequirements(MRR)at31December2016($2.5billionat31December2015).
AMP’sfinal2016dividendis14.0centspershare,frankedto90%.Thisrepresentsafullyear2016dividendpayoutratioof85%ofunderlyingprofit2.AMPwillcontinuetoofferthedividendreinvestmentplan(DRP)toeligibleshareholders.Forthe2016finaldividend,nodiscountwillapplytotheDRPallocationprice.AMPintendstoneutralisetheimpactoftheDRPbyacquiringshareson-markettosatisfyanyentitlementsundertheDRP.
ThestrengthofAMP’scapitalposition,followingtheexecutionofthereinsurancedealandthelifecompanymerger,hasfacilitatedtheannouncementofanon-marketbuy-backofupto$500milliontobegininthefirstquarterof2017.
Strategy and prospectsOur vision is to be Australia and New Zealand’s favourite financial services company.
AMPiswellpositionedtotakeadvantageofpositivelong-termdemographicandmarkettrendsandmitigatepotentialthreatswithagrowthstrategythatleveragesitscompetitiveadvantagesinitschosenmarkets.Thecompanyispursuingaclearstrategyforlong-termgrowthwithfourkeyobjectives:
2 Theunderlyingpayoutratiofor2016iscalculatedbasedonunderlyingprofitexcludingcapitalisedlossesandotherone-offexperienceitems.
For
per
sona
l use
onl
y
AMP 2016 annual report22
Directors’ report for the year ended 31 December 2016
– tiltinginvestmenttohighergrowth,lesscapitalintensivebusinesseswithstrongpositionsingrowingmarkets
– transformingthecoreAustralianbusinesstocentreonthecustomer
– reducingcoststocontinuegrowingprofitablyinamargincompressedworld,and
– expandingselectivelyinAsiaandinternationallytocapturenewgrowthopportunities.
Inthesecondhalfof2016,AMPrealignedthebusinesswithanewmanagementstructuretostrengthenaccountabilityfordrivingshort-termbusinessperformancewhiledeliveringlonger-termgrowth.Thisalignmentacrossbusinessunitsissupportiveofthefourkeyobjectives,withasharpenedfocusoneffectivecostandcapitalmanagementtounderpinshort-termperformance.
1. Tilt investment to higher growth businessesAMPisfocusedondeliveringgrowthacrosstheportfoliobyfocusinginvestmentonhighergrowth,lesscapitalintensivebusinessestobuildontheirmarket-leadingpositions.
ThegrowthinvestmentisbeingdeliberatelytiltedtowardsAustralianwealthmanagement,AMPBankandAMPCapital,thebusinesslineswiththegreatestopportunities.Australianwealthprotection,NewZealandfinancialservicesandMaturearebeingmanagedforvalueandefficiency.
Akeypriorityistogrowintheexpanding$2.8trillion3Australianwealthmanagementmarket,whereitholdsthenumberone4marketsharepositioninsuperannuation.
AMPisinvestinginAustralianwealthmanagementtomaintainandenhanceasustainableandcompetitiveadvantageindistributionandincreaseitschannelcapacitybyactivatingnewdigitalanddirectchannelstocomplementourface-to-faceadvicecapabilities.AMP’sleadingcorporatesuperannuationbusinessisexpectedtoassistindrivingAustralianwealthmanagementcashflowsintheshortandlongterm.
AMPBankcontinuestogrowstronglyandrepresentsasignificantopportunityforAMP,particularlyacrossitsalignedadvicenetworkwheredebtandcashflowmanagementstrategiescanbeembeddedasacorepartofAMP’sadvicevalueproposition.
AMPCapitalhasdemonstratedconsistentandsustainableearningsgrowthandisfocusedongrowingdomesticallywhilealsoextendingitsgeographicreachanddistributioncapabilitiesacrossselectedmarkets.Utilisingitsstrengthsinthemanagementofrealassets,AMPCapitalhasfurtheropportunitytocaptureattractiverevenues.
2. Transform AMPistransformingitscoreAustralianbusinessestohelpourcustomersowntomorrow.WhilethistransformationisbeingdrivenfromAustralianwealthmanagement,italsoencompassesAMPBank,AMPCapitalandAustralianwealthprotection,asAMPpackagestherightsolutionsforitscustomerstohelpthemmeettheirgoals.
Differentiate via integrated goals-based modelAMPhaslaunchedanexperientialgoals-basedapproachdesignedtoengageexistingcustomersandactivateAMP’scustomerbaseofmorethan3.7million,particularlyunadvisedcustomers.
Deliver goals-based advice model of the futureAMPisaimingtomakefinancialadvicemorerelevant,accessibleandaffordableforconsumers,andatthesametime,moreefficientandprofitableforAMPanditsstrongnetworkofalignedadvisers.Thecompanyisrollingoutitstechnology-enabled,goals-basedadviceplatformtobothAMPAdviceanditsbroaderadvisernetwork.Bytheendof2016,24practiceswereoperatingunderthenewAMPAdvicemodelandareexpectedtodelivergreateradviserproductivity,increasedshareofcustomerwalletandimprovedadvicepracticeprofitability.
Increase channel choiceAMPisgivingconsumersmorewaystointeractwiththecompany.Itiscreatinganomni-channelexperiencewithnewdigitalanddirectchannelsthatcomplementitsexistingmulti-brandedface-to-faceadviceexperience.Newdataandanalyticsinfrastructureisdrivingcustomerengagementandnewbusinessacrossallchannels.
Deliver a superior customer experienceNetpromoterscore(NPS)isnowusedacrossthecompanytoobjectivelymeasureanddriveongoingimprovementofcustomerexperiences.25%ofvariableemployeeremunerationisnowbasedonNPS.
3. Reduce costsAMPcompleteditsthree-yearbusinessefficiencyprogramattheendof2016(delivering$200millioninpre-taxrecurringrunratecostsavings).Thecompanyissustainingitsbusinessefficiencybenefitsbyembeddingmoreeffectiveprocessesandprojectmanagement,processautomationandactivity-basedworking.Operatingmodelandorganisationaldesignchangeswilldeliverafurtherroundofbusinessefficiencygainsin2017,withtheaimofreducingcontrollablecosts.
4. Expand internationallyAMPisexpandinginternationally,primarilythroughAMPCapital,inhigh-growthpotentialregionswhereitsexpertiseandcapabilitiesareindemand.ItisdoingthisbybuildingstrongpartnershipswithnationalchampioncompaniesinChinaandJapanandiscapitalisingondemandforitsinfrastructure,realestateandfixedincomecapabilitiesacrossAsia,EuropeandNorthAmerica.AMP’srelationshipswithChinaLifearegoingfromstrengthtostrength.ChinaLifeAssetManagementCompanyLimitedisthefastestgrowingnewassetmanagementcompanyinChinawhileChinaLifePensionCompany(CLPC)ranksfirstintrusteeserviceswith29%marketshareandthirdininvestmentmanagementwith12%marketshare.
In2017,CLPCissettobenefitfromtheimplementationofnewregulationsforOccupationalPensions(OP)inChina.OPrepresentsasignificantgrowthopportunityforCLPC,coveringaround40millioncivilservantemployeeswith12%salarycontributionandannualcontributionsexpectedtoreachuptoRMB200billion.CLPCiscurrentlycompetingtowinthisOPbusinessacrosseachregionofChina.
AMP’srelationshipwithitsJapanesepartnerMUTBisalsobeingstrengthened.
Strategies and prospects by business area5
Australian wealth managementAustralianwealthmanagement’skeyprioritiesareto:
3 ABSManagedFundsReport,ManagedFundsIndustry,September2016.4 FundMarketOverviewRetail–Marketer,StrategicInsight(PlanForLife),September2016.5 Forwardlookingstatementsinthedirectors’reportarebasedonmanagement’scurrentviewsandassumptionsandinvolveknownandunknown
risksanduncertainties,manyofwhicharebeyondAMP’scontrolandcouldcauseactualresults,performanceoreventstodiffermateriallyfromthoseexpressed.Theseforwardlookingstatementsarenotguaranteesorrepresentationsoffutureperformance,andshouldnotbereliedupon.
For
per
sona
l use
onl
y
AMP 2016 annual report 23
– buildcustomergoals-orientedbusinesswhilstremainingvigilantoncostcontrol
– buildthegoals-basedadvicemodelofthefutureandimprovethequalityoftheadviceexperience
– increasechannelchoice– usenewcapabilitiestodesigncustomercentricoffers
coveringadvice,productandservice– developastrongSMSFcapabilitywithafocusonbuilding
scaleandefficiency.
AMP CapitalWorkingasaunifiedinvestmenthouse,AMPCapital’skeyprioritiesaretogeneraterevenuegrowththrough:– deliveringoutstandinginvestmentoutcomestoclients– buildingadifferentiatedclientexperiencedrivingstrong
clientengagement– partneringeffectivelyacrosstheAMPgrouptodeliverinvestment
solutionsforretail,SMSFandcorporatesupercustomers– expandingtheglobalpensionfundclientbase– buildingpreferentialdistributionpartnershipsinselect
Asianmarkets,particularlyJapanandChina.
Australian wealth protectionThekeyprioritiesformanagementareto:– stabiliseearningsandreleasecapitalviareinsurance– sustainbusinessefficiencies– promotethenewinsuranceoffer.
AMP BankAsthebankingarmofawealthmanager,AMPBank’sroleistoleverageandgrowthegroup’scustomerbasetoprovidecorebankingsolutionstohelpmeetthegoalsofcustomers.Inaligningwiththisstrategicimperative,AMPBank’sprioritiesareto:– delivercompellingcustomer-centricbankingpropositions
toAMPgrouptargetcustomersegments– makebankingeasierforcustomersbyinvestingintechnology
andserviceexcellence– maintainfocusandgrowthinboththealignedadviserand
mortgagebrokerchannels– leverageAMPgroupinvestmentstobuildoutcapabilitiesin
directanddigital– continuetooptimiseAMPBank’sfundingsourcesandinvest
inoperatingcapacity.
New Zealand financial servicesNewZealandfinancialserviceshasthefollowingkeyprioritiestogrowshareholdervalue:– deepenitscustomerrelationships– re-engineerwealthprotectiontoincreaseproductattractiveness– maximisewealthmanagementmarketopportunitiescreated
byregulatorychange– evolveadviceanddistributioncapability– leveragetheKiwiSaveropportunity– buildonourgeneralinsurancepartnership– continueitsfocusoncostcontrol.
Australian matureKeyprioritiesformanagementareto:– maintainhighpersistency– prudentlymanageassetandliabilityrisk– achievegreatercostefficiency– maintaincapitalefficiency.
TheAustralianmaturebusinessremainsinslowdeclinebutisexpectedtoremainprofitableformanyyears.Itisexpectedtorunoffataround6%perannum.However,involatileinvestmentmarkets,thisrun-offratecanvarysubstantially.Therun-offofAUMmirrorspolicyliabilities,althoughthereispotentialforprofitmarginstobeimpacteddifferently.Therun-offofAustralianmatureAUMisanticipatedtohaveanaveragedurationofapproximately12years,butwillbeimpactedbyinvestmentmarketsandregulatorychanges.
Key risksRisk is inherent to our business and AMP takes measured risks to achieve our strategic objectives. We have a clear strategic plan to drive our business forward and an Enterprise Risk Management framework to identify, understand and manage risks.
TheEnterpriseRiskManagement(ERM)frameworkisdesignedtoenableAMPtoidentify,assess,respond,monitorandreviewcurrentandemergingrisksthatcanaffectourbusiness.Werecognisethateffectiveriskmanagementissupportedbyappropriatebehaviourbyouremployeesandwearecommittedtodrivingariskawareculture.AMP’sERMframeworkincludesariskmanagementstrategywhichestablishestheprinciples,requirements,rolesandresponsibilitiesforthemanagementofriskacrossAMPandtheriskappetitestatementwhicharticulatesthenatureandlevelofrisktheboardiswillingtoacceptinthepursuitofstrategicobjectives.
AMP’scorporatestrategyreflectsthetypesofriskstheboardiswillingtoaccept.Thestrategicrisksandtheirimpactsareidentifiedaspartofthestrategicplanningprocess.
KeyriskswhichmayimpactAMP’sabilitytoachieveitsstrategicobjectivesinclude:
Strategic risk– Changes to the business environment:Ourstrategyissetbased
onexistingandexpectedbusinessenvironmentalfactorsincludingbusinesscycle,technology,customerpreferencesandcompetitivelandscape.SignificantchangesintheseenvironmentalfactorsmaydisruptAMP’sbusinessoperations.Forexample,asignificantchangeincustomerpreferencesmayimpactsalesvolumes,revenueandcustomersatisfaction.AMPfocusesonimplementingprogramstobetteranticipateandrespondtothreatsandopportunitiesthatarisefromchangingcustomerpreferencesandcompetitorstrategiesandcapabilities.
– Changes in the regulatory environment:Thefinancialservicesindustryisgoingthroughaperiodofsignificantchange.Thesechanges,combinedwithincreasedattentionfromthemediaandpublic,haveplacedadditionalpressuresongovernmentstomakechangestoexistingregulations.WerecognisethatfailuretoeffectivelyanticipateandrespondtoregulatorychangescouldadverselyimpactAMP’sreputationandabilitytoachieveitsstrategicobjectives.Wemanagethisriskbyhavingdedicatedresourcestoimplementrequiredchangeprogramsandactivelyengagewithgovernment,regulatorsandindustrybodiestoeffectivelymonitorandanticipateregulatorychanges.Wealsoplacesignificantfocusonourriskculturetoensurewearekeepingourlegal,regulatoryandsocialresponsibilitiesfrontofmindinourdailyactivities.
For
per
sona
l use
onl
y
AMP 2016 annual report24
Directors’ report for the year ended 31 December 2016
– Sufficient investment in operating environment:AMP’spromisetohelppeopleowntomorrowrequireschangestoproducts,servicesandcustomerexperiences.Thepromisehasdrivennewapproaches,modelsandwaysofworkingwithinourbusinesswhichrequiremodificationandcapabilityuplifttoexistingsysteminfrastructure,processesandpeopleskillsandcapabilities.Inadequateinvestmentintocorefunctionscanlimitourabilitytoachieveourstrategicobjectivestomeetcustomerexpectations.Tomanagethis,wecontinuallyreview,investinandmonitortheadequacyofcorefunctionsofsystems,processesandpeopletoensurethatthesearesufficienttosupportthestrategicobjectives.
Market risk– Inadequate monitoring and management of exposure to
market volatility:Volatilityinmarketfactorssuchasinterestrates,equitymarketsorforeignexchangeratescouldhaveanegativeimpactontheprofitabilityofAMP.Uncertaintyininvestmentreturnscanimpactoncustomersentimentandmayresultinareductionincapitalinvestedandincreasedproductswitchingbyinvestors.Cashinflowstowealthmanagementproductssuchassuperannuationandinvestmentproductsmaybeimpactedifcustomerappetitefordiscretionarysavingsandinvestmentproductsreduces.Wemonitormarketconditionsandcontinuallyreviewourproductofferingstoensuretheyareappropriatelybalancedtoaccountformarketvolatilityandchangingcustomerneeds.
Insurance risk– Greater than expected insurance claims and lapse rates:
ConditionsintheAustralianlifeinsurancemarkethaveprovenchallengingoverthepastfewyears.AMPhasexperiencedunfavourableinsuranceclaimsandlapserateswhichimpactonearnings.Thisisdrivenbypoorterminations,increasingincomeprotectionclaims,ahighervolumeoflumpsumclaimsandunfavourablegroupsalarycontinuanceclaims.Wearemanagingthevolatilityininsuranceclaimsandlapseratesbyredesigninginsuranceproductsandtheclaimsprocesses,reducingexposurethroughreinsuringpartofthelifeinsurancebusinessandstrengtheningourbestestimateassumptions.Wearealsolookingtomanagevolatilityacrossthegroupbyfocusingongrowingourbusinessinareaswheretheindustryhasinvestedheavilyindevelopingmethodstomeasureandmanagevolatilitysuchaswealthmanagement,assetmanagementandthebankingindustry.
Operational risk– Effective management and implementation of change:
AMPhasinvestedheavilyintodevelopingnewapproaches,modelsandwaysofworkingwithinthebusinesstodriveefficiency.Thishasresultedinsignificantmodificationoruplifttoexistingsysteminfrastructure,processesandpeoplerolerequirements.WerecognisethatfailuretoappropriatelymanagetheimplementationofthesechangescancausedisruptiontoAMP’sbusinessoperations.Tomanagethis,AMPhasdedicatedresourceswithappropriateskillsandexpertisewhoworkwiththebusinesstoestablishchangeprogramsandmanagethetransition.
– Cyber risk:Cyberriskcontinuestobeafocusareaacrossallfinancialindustries.Werecognisethatcyberriskwillcontinuetoincreasesignificantlyinarapidlychangingtechnologicalenvironmentandthatthemagnitudeandcostsofacyber-crimevarydependingonthenatureoftheattack.Wearecommittedtoinvestinginenhancingourcybersecuritynetworkandwehaveanumberofdetective,preventative
andresponsivecontrolstoprotectourassetsandnetworks.Whilstwearecommittedtoenhancingourcybersecuritynetwork,werecogniseitisinevitablethatcyberattackswilloccur.Inassessingandmitigatingcybercrime,weregularlyconsidervulnerabilitiesandpotentialcontrolsforfailuresacrosspeople,processesandtechnology.
– Outsourcing risk:AMPhasoutsourcingarrangementswithexternalserviceproviderstosupportbusinessfunctions.WerecognisethatpoormanagementofoutsourcedserviceswilldirectlyimpactAMP’sabilitytoservicecustomersandachievestrategicobjectives.Wearecommittedtoensuringthatoutsourcedarrangementsareappropriatelymanagedandpoliciesandprocessesareinplacetoensureappropriategovernance,managementandoversightofexternalserviceproviders.AMPhasdedicatedresourcestomonitorcontracts,servicelevelagreementsandperformancetargetstoensureservicedeliverablesaremet.
– Conduct risk:AMPiscommittedtoestablishingacultureofhelpthatreflectsourvaluesofprofessionalism,honestyandintegrity.Weseeconductriskastheriskofinappropriate,unethicalorunlawfulbehaviouronthepartofouremployees.Ourcodeofconductoutlinestheminimumstandardsforbehaviours,decisionmakingandourexpectationsforhowwetreatouremployees,customers,businesspartnersandshareholders.Wearecommittedtodoingtherightthingandourcodeofconductsupportsdrivingastrongrisk-awareculture.WerecognisethatculturedrivestherightbehaviourandconductwithinAMPandinfluencesoutcomesandtheachievementofstrategicobjectives.AMP’sapproachtomanagingconductriskistoeducateandsupportstafftorecognisetheriskimplicationsoftheirdecisions,andempowerouremployeestospeakoutagainstinstancesofbadconduct.
Theserisksareconstantlymonitored,assessedandreportedtotherelevantcommitteesandtheboardtoensurethatanymitigatingactionsaretakenappropriately.
The environmentInthenormalcourseofitsbusinessoperations,AMPissubjecttoarangeofenvironmentalregulationsofwhichtherehavebeennomaterialbreachesduringtheyear.YoucanfindfurtherinformationaboutAMP’senvironmentpolicyandactivitiesatamp.com.au/corporatesustainability.
Significant changes to the state of affairsDetailsofchangesinAMP’sstrategicprioritiesaresetoutearlierinthisreport.
Events occurring after the reporting dateAsatthedateofthisreport,thedirectorsarenotawareofanymatterorcircumstancethathasarisensincethereportingdatethathassignificantlyaffectedormaysignificantlyaffecttheentity’soperationsinfutureyears;theresultsofthoseoperationsinfutureyears;ortheentity’sstateofaffairsinfutureyearswhichisnotalreadyreflectedinthisreport,otherthanthefollowingannouncementsmadeon9February2017of:– Afinaldividendonordinarysharesof14.0centspershare.
DetailsoftheannounceddividendanddividendspaidanddeclaredduringtheyeararedisclosedinNote1.4ofthefinancialreport;and
– Anon-marketsharebuy-backofupto$500milliontobegininthefirstquarterof2017.
For
per
sona
l use
onl
y
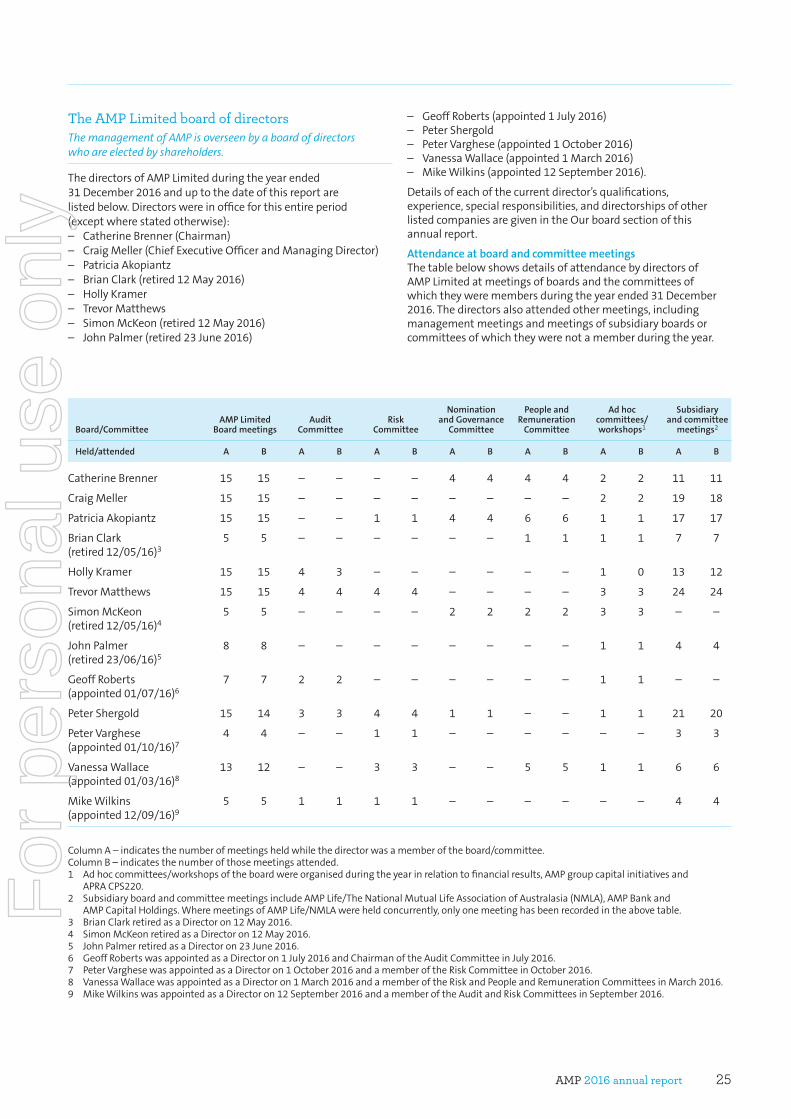
AMP 2016 annual report 25
The AMP Limited board of directorsThe management of AMP is overseen by a board of directors who are elected by shareholders.
ThedirectorsofAMPLimitedduringtheyearended31December2016anduptothedateofthisreportarelistedbelow.Directorswereinofficeforthisentireperiod(exceptwherestatedotherwise):– CatherineBrenner(Chairman)– CraigMeller(ChiefExecutiveOfficerandManagingDirector)– PatriciaAkopiantz– BrianClark(retired12May2016)– HollyKramer– TrevorMatthews– SimonMcKeon(retired12May2016)– JohnPalmer(retired23June2016)
– GeoffRoberts(appointed1July2016)– PeterShergold– PeterVarghese(appointed1October2016)– VanessaWallace(appointed1March2016)– MikeWilkins(appointed12September2016).
Detailsofeachofthecurrentdirector’squalifications,experience,specialresponsibilities,anddirectorshipsofotherlistedcompaniesaregivenintheOurboardsectionofthisannualreport.
Attendance at board and committee meetings ThetablebelowshowsdetailsofattendancebydirectorsofAMPLimitedatmeetingsofboardsandthecommitteesofwhichtheyweremembersduringtheyearended31December2016.Thedirectorsalsoattendedothermeetings,includingmanagementmeetingsandmeetingsofsubsidiaryboardsorcommitteesofwhichtheywerenotamemberduringtheyear.
Board/CommitteeAMP Limited
Board meetingsAudit
CommitteeRisk
Committee
Nomination and Governance
Committee
People and Remuneration
Committee
Ad hoc committees/ workshops1
Subsidiary and committee
meetings2
Held/attended A B A B A B A B A B A B A B
CatherineBrenner 15 15 – – – – 4 4 4 4 2 2 11 11
CraigMeller 15 15 – – – – – – – – 2 2 19 18
PatriciaAkopiantz 15 15 – – 1 1 4 4 6 6 1 1 17 17
BrianClark(retired12/05/16)3
5 5 – – – – – – 1 1 1 1 7 7
HollyKramer 15 15 4 3 – – – – – – 1 0 13 12
TrevorMatthews 15 15 4 4 4 4 – – – – 3 3 24 24
SimonMcKeon(retired12/05/16)4
5 5 – – – – 2 2 2 2 3 3 – –
JohnPalmer(retired23/06/16)5
8 8 – – – – – – – – 1 1 4 4
GeoffRoberts(appointed01/07/16)6
7 7 2 2 – – – – – – 1 1 – –
PeterShergold 15 14 3 3 4 4 1 1 – – 1 1 21 20
PeterVarghese(appointed01/10/16)7
4 4 – – 1 1 – – – – – – 3 3
VanessaWallace(appointed01/03/16)8
13 12 – – 3 3 – – 5 5 1 1 6 6
MikeWilkins(appointed12/09/16)9
5 5 1 1 1 1 – – – – – – 4 4
ColumnA–indicatesthenumberofmeetingsheldwhilethedirectorwasamemberoftheboard/committee.ColumnB–indicatesthenumberofthosemeetingsattended.1 Adhoccommittees/workshopsoftheboardwereorganisedduringtheyearinrelationtofinancialresults,AMPgroupcapitalinitiativesand
APRACPS220.2 SubsidiaryboardandcommitteemeetingsincludeAMPLife/TheNationalMutualLifeAssociationofAustralasia(NMLA),AMPBankand
AMPCapitalHoldings.WheremeetingsofAMPLife/NMLAwereheldconcurrently,onlyonemeetinghasbeenrecordedintheabovetable.3 BrianClarkretiredasaDirectoron12May2016.4 SimonMcKeonretiredasaDirectoron12May2016.5 JohnPalmerretiredasaDirectoron23June2016.6 GeoffRobertswasappointedasaDirectoron1July2016andChairmanoftheAuditCommitteeinJuly2016.7 PeterVarghesewasappointedasaDirectoron1October2016andamemberoftheRiskCommitteeinOctober2016.8 VanessaWallacewasappointedasaDirectoron1March2016andamemberoftheRiskandPeopleandRemunerationCommitteesinMarch2016.9 MikeWilkinswasappointedasaDirectoron12September2016andamemberoftheAuditandRiskCommitteesinSeptember2016.
For
per
sona
l use
onl
y
AMP 2016 annual report26
Directors’ report for the year ended 31 December 2016
Company secretaries’ detailsDetailsofeachcompanysecretaryofAMPLimited,includingtheirqualificationsandexperience,aresetoutbelow.
Brian SalterGroup General Counsel BA,LLB(Hons),LLM(Hons)BrianjoinedAMPinJuly2008asGroupGeneralCounsel.Brianhasover35years’experienceinthelegalprofession,advisingmanyofAustralia’sleadingfinancialandwealthmanagementcompanies.BeforejoiningAMP,BrianwasapartnerwithamajorAustralianlawfirmfor19yearsandamemberofitsexecutiveteamforanumberofyears.
BrianisaformermemberoftheAustralianGovernment’sCorporationsandMarketsAdvisoryCommittee,whichwasestablishedtoprovideindependentadvicetotheAustralianGovernmentonissuesthatariseincorporationsandfinancialmarketslawandpractice.BrianisalsoamemberoftheLegalCommitteeoftheAustralianInstituteofCompanyDirectorsandtheCorporationsCommitteeoftheBusinessLawSectionoftheLawCouncilofAustraliaandistheDeputyChairoftheGeneralCounsel100.HeisaformerChairmanandNationalCommitteememberoftheAustralianSecuritisationForum.HeisalsoanExecutiveDirectorofAMPSuperannuationLimitedandN.M.SuperannuationProprietaryLimitedandtheChairmanofSCECGSRedlandsLimited.
David Cullen Group Company Secretary and General Counsel, GovernanceBCom,LLB,LLM,GradDipAppFin,PGCertMgmtDavidjoinedAMPinSeptember2004andhasheldvariouslegalandgovernancerolesacrossAMPCapitalandtheAMPgroup,withaparticularfocusonmergers,acquisitionsandjointventures.HewasappointedGroupCompanySecretaryandGeneralCounsel,GovernanceinJuly2013andisCompanySecretaryforAMPLimited.PriortojoiningAMP,DavidspenteightyearsinprivatelegalpracticefocusingonmergersandacquisitionsandequitycapitalmarketsinPerthandSydneyandtwoyearswiththeASX.DavidisadirectorofvariousAMPsubsidiariesandaFellowoftheGovernanceInstituteofAustralia.
Vicki VordisCompany SecretaryBEc,LLB(Hons),FGIAVickijoinedAMPinDecember2000andheldvariouslegalrolesbeforemovingintoGroupSecretariat.SheisaCompanySecretaryofAMPBankLimited.Priorto2000,VickiworkedasalawyerinseveralSydneylawpractices.SheholdsagraduatediplomainAppliedCorporateGovernanceandisaFellowoftheGovernanceInstituteofAustralia.
Indemnification and insurance of directors and officersUnderourconstitution,thecompanyindemnifies,totheextentpermittedbylaw,allcurrentandformerofficersofthecompany(includingthenon-executivedirectors)againstanyliability(includingthecostsandexpensesofdefendingactionsforanactualorallegedliability)incurredintheircapacityasanofficerofthecompany.
ThisindemnityisnotextendedtocurrentorformeremployeesoftheAMPgroupagainstliabilityincurredintheircapacityasanemployee,unlessapprovedbytheAMPLimitedBoard.Nosuchindemnitieshavebeenprovidedduringorsincetheendofthefinancialyear.
Duringthefinancialyear,thecompanyagreedtoinsurealloftheofficers(includingalldirectors)oftheAMPgroupagainstcertainliabilitiesaspermittedbytheCorporationsAct2001.Theinsurancepolicyprohibitsdisclosureofthenatureofthecover,theamountofthepremium,thelimitofliabilityandotherterms.
Inaddition,thecompanyandeachofthedirectorsarepartiestodeedsofindemnityandaccess,asapprovedbytheboard.Thosedeedsofindemnityandaccessprovidethat:– thedirectorswillhaveaccesstothebooksofthecompany
fortheirperiodofofficeandfor10(orincertaincases,seven)yearsaftertheyceasetoholdoffice(subjecttocertainconditions)
– thecompanyindemnifiesthedirectorstotheextentpermittedbylaw
– theindemnitycoversliabilitiesincurredbythedirectorsintheircapacityasofficersofthecompanyandofotherAMPgroupcompanies,and
– thecompanywillmaintaindirectors’andofficers’insurancecoverforthedirectorstotheextentpermittedbylawfortheperiodoftheirofficeandfor10yearsaftertheyceasetoholdoffice.
Rounding InaccordancewiththeAustralianSecuritiesandInvestmentsCommissionCorporationsInstrument2016/191,amountsinthisdirectors’reportandtheaccompanyingfinancialreporthavebeenroundedofftothenearestmillionAustraliandollars,unlessstatedotherwise.
For
per
sona
l use
onl
y
AMP 2016 annual report 27
Tel: +61 2 9248 5555Fax: +61 2 9248 5959ey.com/au
Ernst & Young200 George StreetSydney NSW 2000 AustraliaGPO Box 2646 Sydney NSW 2001
A member firm of Ernst & Young Global LimitedLiability limited by a scheme approved under Professional Standards Legislation
Ernst & Young Tony JohnsonPartnerSydney, 9 February 2017
Auditor’s Independence Declaration to the Directors of AMP LimitedAsleadauditorfortheauditofAMPLimitedforthefinancialyearended31December2016,Ideclaretothebestofmyknowledgeandbelief,therehavebeen:a) nocontraventionsoftheauditorindependencerequirementsoftheCorporations Act 2001inrelationtotheaudit;andb) nocontraventionsofanyapplicablecodeofprofessionalconductinrelationtotheaudit.
ThisdeclarationisinrespectofAMPLimitedandtheentitiesitcontrolledduringthefinancialyear.
Auditor’s independence declaration to the directors of AMP LimitedThedirectorshaveobtainedanindependencedeclarationfromthecompany’sauditor,Ernst&Young,forthefullyearended31December2016.
Non-audit servicesTheAuditCommitteehasrevieweddetailsoftheamountspaidorpayablefornon-auditservicesprovidedtotheAMPgroupduringtheyearended31December2016,bythecompany’sauditor,EY.
Thedirectorsaresatisfiedthattheprovisionofthosenon-auditservicesbytheauditoriscompatiblewiththegeneralstandardofindependenceforauditorsimposedbytheCorporations Act 2001anddidnotcompromisetheauditorindependencerequirementsoftheCorporations Act 2001forthefollowingreasons:– allnon-auditassignmentswereapprovedbythenominated
delegatetothechieffinancialofficerorthechairmanoftheAuditCommittee
– nonon-auditassignmentswerecarriedoutwhichwerespecificallyexcludedbytheAMPcharterofauditindependence,and
– theleveloffeesfornon-auditservicesamountedto$2,089,000or13%ofthetotalfeespaidtotheauditors(refertoNote7.5ofthefinancialreportforfurtherdetails).
Remuneration disclosuresTheremunerationarrangementsforAMPdirectorsandseniorexecutivesareoutlinedintheremunerationreportwhichformspartofthedirectors’reportfortheyearended31December2016.
Directors’andseniorexecutives’interestsinAMPLimitedshares,performancerightsandoptionsarealsosetoutintheremunerationreportonthefollowingpages.
For
per
sona
l use
onl
y
AMP 2016 annual report28
Directors’ report for the year ended 31 December 2016
Remuneration report
Dear shareholders,OnbehalfoftheboardIampleasedtopresentour2016remunerationreportforwhichweseekyourapprovalattheannualgeneralmeetingonThursday11May2017.
Theboardunderstandsthatthereisincreasingshareholderinterestinthescaleandstructureofexecutiveremuneration.Thatisentirelyappropriate.We,too,believethatremunerationshouldbeclearlyalignedtothesustainablegrowthofourcompanyandlong-termreturnstoshareholders.Thisisimportantinagoodyear.Itisevenmorecriticalinachallengingyear.
2016 remuneration outcomesTheyearsawstrongresultsfromAMPCapital,AMPBankandNewZealand,andaresilientperformancefromwealthmanagementdespitechallengingmarketconditions.However,theseresultswereovershadowedbyapoorperformanceinwealthprotection.Nonetheless,ourcapitalpositionandunderlyingbusinessremainedstrongandasaresultshareholderswillreceiveafinaldividendof14centspershare,bringingthe2016totaldividendto28centspershare,thesametotaldividendpaymentaswasdeliveredin2015.
ToensurethatremunerationoutcomesarealignedwithAMP’sperformancein2016,thefollowingdecisionswereapprovedbyyourboard:
– No short-term incentive (STI) was paid to our CEO or KMP executives for 2016 under the AMP Group STI plan.AdamTindall,AMPCapital’sCEO,isanexceptionasheparticipatesinaseparateincentiveplanthat’salignedwiththeprofitandperformanceofAMPCapital.AMPGroup’sperformanceagainstfinancialSTIgoalswasbelowthresholdin2016(exceptfornetrevenueofAMPCapital).Progressagainstourstrategictransformationprogramtobuildacustomercentredculturecontinuedatpacein2016,andtherelatedperformanceagainstthestrategicgoalswasabovetarget.Giventhefinancialperformance,theCEOandboardagreedthatnoneoftheSTIpoolbepaidtotheCEOorKMPexecutives.
– No salary increase will be made for our CEO in 2017.TheonlyKMPexecutiveswhowillreceiveanincreasein2017arethoseexecutiveswhoserolessignificantlyincreasedintherestructurethatwasannouncedinNovember2016.Theseincreaseswereeffectivefrom1January2017.Asaresultoftherestructure,threeKMProlesweremaderedundantandtheirredundancypaymentsaredisclosedinthisreport.TheseamountswerecalculatedusingtheAMPpolicywhichappliestoallemployees.
Inaddition:– No portion of the long-term incentive (LTI) granted in 2014
is expected to vest.Thereturnonequity(RoE)targetwasnotachievedandthecurrentrelativetotalshareholderreturn(TSR)performanceindicatesthatAMPwillnotoutperformatleast50%ofthepeergroupwhenthishurdleistestedin2017(notconfirmedatthetimeofpublication).ThereforeweexpecttheentireLTIgrantmadein2014tolapseatthevestingdatein2017.
2015 remuneration outcomes Asshareholderswillrecall,AMP’s2015performancewasstrongwitha7%increaseinunderlyingprofit.Itwasinthecontextofthis2015performancethattheboardreviewedtheCEO’ssalaryfor2016.
InFebruary2016,thePeopleandRemunerationCommittee(PRC)benchmarkedtheCEO’sremunerationagainstcompaniesofsimilarsizeandotherfinancialinstitutions.ThisdatashowedthattheCEO’sfixedremunerationwasatthe25thpercentileofthispeergroup.Ascontext,whentheCEOwasappointedtotherole,hissalarywassetatalowerlevelcomparedtohispeersandpredecessor.Itwastoprogressivelyincreaseashegainedexperienceanddeliveredresults.Inkeepingwiththisapproach,andconsidering2015performance,theboardincreasedhissalaryby9%to$1.9millioninFebruary2016.
InFebruary2016,theboardalsoreviewedthevestingofthe2013LTI.The2013TSRhurdlewasnotmetandthistranchedidnotvest.TheRoEperformancehurdlewaspartiallymetanda
We believe that remuneration should be clearly aligned to the sustainable growth of our company and long-term returns to shareholders.
For
per
sona
l use
onl
y
AMP 2016 annual report 29
portionofthistranchedidvest.TheminimumRoEhurdleforthe2013LTIgrantwas13.4%.Whenthehurdleswereset,theboardagreedthatitwouldexercisediscretion,inparticularforstrategicdecisionsthatwerenotforeseenatthetimetheperformancetargetswereset.TheactualRoEresultfor2015was13.2%buttheboardexerciseditsdiscretionandadjustedtheRoEoutcomeupto13.5%totakeintoaccounttheimpactoftheinvestmentintheChinaLifePensionCompany(CLPC)(0.3%)onthe2015RoEresult.Theboardwascognisantthatthisdiscretionwasthedifferencebetweenvestingandnotvestingandappliedduerigour.Thisdecisionwasmadetoensurethattheboardcontinuestoencouragemanagementtopursuesuchgrowthopportunitiesandnotbedisadvantagedformakingdecisionsthatbenefitthelong-termvalueforshareholders.ThisdecisionwaspreviouslydisclosedtoshareholdersinMay2016.
Improving transparencyTheboardisawareoftheneedtoimprovetransparencyonthelinkbetweenremunerationandperformance,withoutundermininganycompetitiveadvantagewithinappropriatedisclosure.Inthisreportwehavesoughttoimprovethatby:– providingasummaryofkeydecisionstointroducethe
remunerationreport(thisletter)– movingtodiscloseRoEtargetsforvestedandunvested
LTIgrants– expandingtheexplanationonstrategicSTItargetsandtheir
linktolong-termvaluecreation– improvingtheuser-friendlinessofthisdocument.
Wetrustthatshareholdersfindthisreporteasiertounderstand.
Changes in 2017Finally,yourboardisengagedinaveryactivediscussionabouthowremunerationcansupportacceleratedstrategicdeliveryandimprovereturnsforshareholders.For2017,threekeychangeshavebeenmadetoimprovealignment.
1. Extend the LTI vesting period from three to four years.Startingwiththe2017grant,LTIwillvestoverfouryearsandthevestingperiodwillcommencefrom1January2017toalignwithAMP’s
financialyear.PreviouslythevestingperiodcommencedinMarcheachyear.ThischangewillaligntheperformanceperiodthatdeterminesvestingwiththeperformanceperiodofAMP,andwilldirectmanagement’sfocusonvaluecreationoveralongerterm.ThiswillnotresultinanincreaseintheLTIvalueawarded.
2. Remove the RoE performance hurdle so that 100% of LTI vests subject to relative TSR.RoEwasintroducedasaperformancehurdlearoundthetimeoftheAXAtransactiontodriveanimprovementinRoE.WithanimprovedRoEachievedoverthelastfewyearsthroughcapitalefficiencyactivitiesacrossthebusiness,theuseofaRoEmeasureisnolongerconsideredappropriateforLTIpurposes.Capitalmanagementwillcontinuetobeakeyfocusareaformanagement.Ourfocusonunderlyingprofitaftertax(UPAT)lesscostofcapitalensuresacontinuedfocusoneffectivecapitalmanagementandisakeyconsiderationwhendeterminingindividualperformance.
3. Increase focus on financial goals.In2017wewillincreasetheweightingoffinancialmeasuresto70%oftheSTIscorecard(from65%).Theremaining30%willfocusonembeddingourcustomercentredculturesupportedbyastrongriskmanagementenvironmentthroughouttheorganisation,whichwebelieveiscriticaltodeliveringourstrategy.
In2017,wewillcontinuetoreviewhowwecanbetteralignourremunerationstrategytodriveperformanceandreturnsforshareholders.Fundamentally,yourboardbelievesthatremunerationshoulddrivethedeliveryofAMP’sbusinessstrategybyachievingtherightbalanceofmotivationandchallengeforourKMP;encouragingthemtobothgrowthebusinessanddeliversustainableshareholderreturns.
Patricia AkopiantzChairman,PeopleandRemunerationCommittee
For
per
sona
l use
onl
y
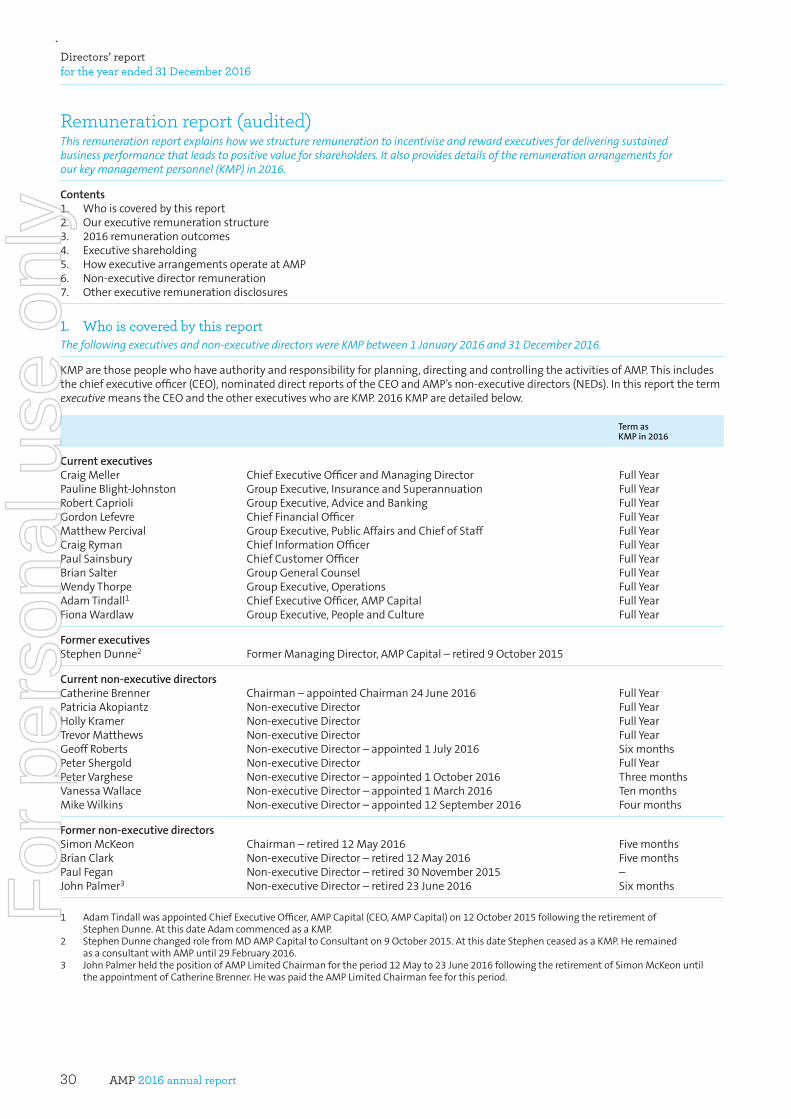
AMP 2016 annual report30
Directors’ report for the year ended 31 December 2016
Remuneration report (audited)This remuneration report explains how we structure remuneration to incentivise and reward executives for delivering sustained business performance that leads to positive value for shareholders. It also provides details of the remuneration arrangements for our key management personnel (KMP) in 2016.
Contents1. Whoiscoveredbythisreport2. Ourexecutiveremunerationstructure3. 2016remunerationoutcomes4. Executiveshareholding5. HowexecutivearrangementsoperateatAMP6. Non-executivedirectorremuneration7. Otherexecutiveremunerationdisclosures
1. Who is covered by this reportThe following executives and non-executive directors were KMP between 1 January 2016 and 31 December 2016.
KMParethosepeoplewhohaveauthorityandresponsibilityforplanning,directingandcontrollingtheactivitiesofAMP.Thisincludesthechiefexecutiveofficer(CEO),nominateddirectreportsoftheCEOandAMP’snon-executivedirectors(NEDs).InthisreportthetermexecutivemeanstheCEOandtheotherexecutiveswhoareKMP.2016KMParedetailedbelow.
Term as KMP in 2016
Current executives CraigMeller ChiefExecutiveOfficerandManagingDirector FullYearPaulineBlight-Johnston GroupExecutive,InsuranceandSuperannuation FullYearRobertCaprioli GroupExecutive,AdviceandBanking FullYearGordonLefevre ChiefFinancialOfficer FullYearMatthewPercival GroupExecutive,PublicAffairsandChiefofStaff FullYearCraigRyman ChiefInformationOfficer FullYearPaulSainsbury ChiefCustomerOfficer FullYearBrianSalter GroupGeneralCounsel FullYearWendyThorpe GroupExecutive,Operations FullYearAdamTindall1 ChiefExecutiveOfficer,AMPCapital FullYearFionaWardlaw GroupExecutive,PeopleandCulture FullYear
Former executives StephenDunne2 FormerManagingDirector,AMPCapital–retired9October2015
Current non-executive directors CatherineBrenner Chairman–appointedChairman24June2016 FullYearPatriciaAkopiantz Non-executiveDirector FullYearHollyKramer Non-executiveDirector FullYearTrevorMatthews Non-executiveDirector FullYearGeoffRoberts Non-executiveDirector–appointed1July2016 SixmonthsPeterShergold Non-executiveDirector FullYearPeterVarghese Non-executiveDirector–appointed1October2016 ThreemonthsVanessaWallace Non-executiveDirector–appointed1March2016 TenmonthsMikeWilkins Non-executiveDirector–appointed12September2016 Fourmonths
Former non-executive directors SimonMcKeon Chairman–retired12May2016 FivemonthsBrianClark Non-executiveDirector–retired12May2016 FivemonthsPaulFegan Non-executiveDirector–retired30November2015 –JohnPalmer3 Non-executiveDirector–retired23June2016 Sixmonths
1 AdamTindallwasappointedChiefExecutiveOfficer,AMPCapital(CEO,AMPCapital)on12October2015followingtheretirementofStephenDunne.AtthisdateAdamcommencedasaKMP.
2 StephenDunnechangedrolefromMDAMPCapitaltoConsultanton9October2015.AtthisdateStephenceasedasaKMP.HeremainedasaconsultantwithAMPuntil29February2016.
3 JohnPalmerheldthepositionofAMPLimitedChairmanfortheperiod12Mayto23June2016followingtheretirementofSimonMcKeonuntiltheappointmentofCatherineBrenner.HewaspaidtheAMPLimitedChairmanfeeforthisperiod.
For
per
sona
l use
onl
y
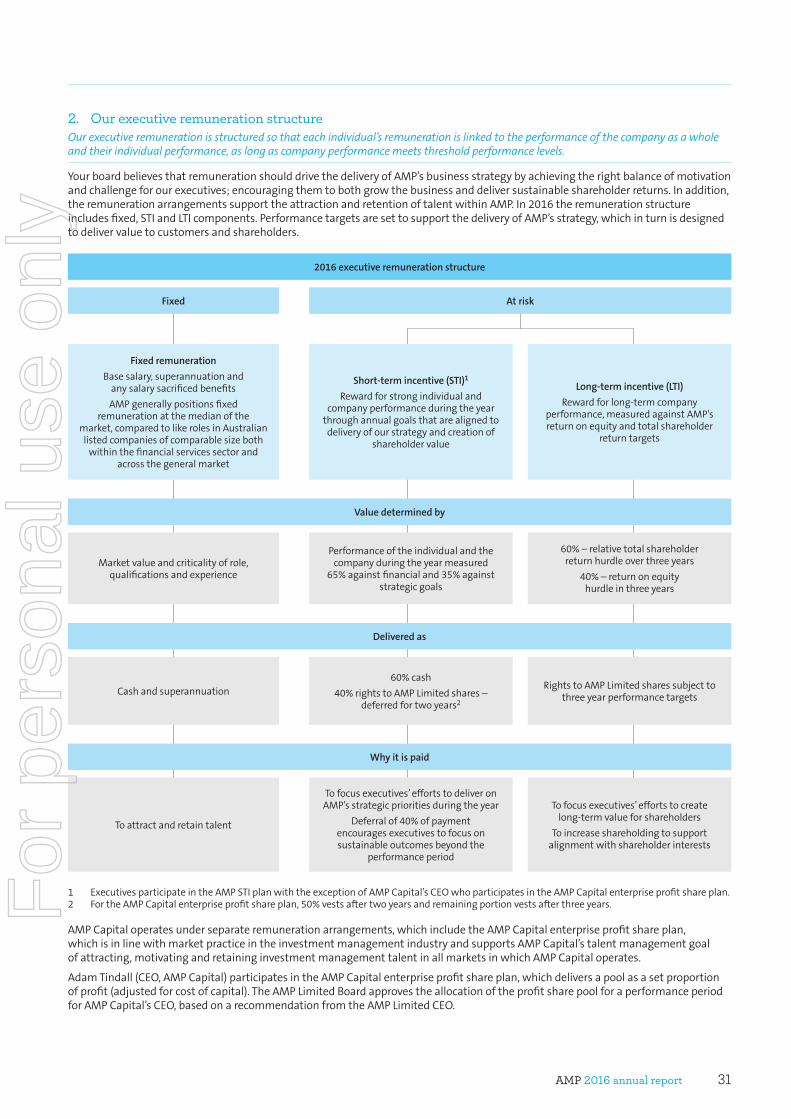
AMP 2016 annual report 31
2. Our executive remuneration structure Our executive remuneration is structured so that each individual’s remuneration is linked to the performance of the company as a whole and their individual performance, as long as company performance meets threshold performance levels.
YourboardbelievesthatremunerationshoulddrivethedeliveryofAMP’sbusinessstrategybyachievingtherightbalanceofmotivationandchallengeforourexecutives;encouragingthemtobothgrowthebusinessanddeliversustainableshareholderreturns.Inaddition,theremunerationarrangementssupporttheattractionandretentionoftalentwithinAMP.In2016theremunerationstructureincludesfixed,STIandLTIcomponents.PerformancetargetsaresettosupportthedeliveryofAMP’sstrategy,whichinturnisdesignedtodelivervaluetocustomersandshareholders.
2016 executive remuneration structure
Fixed At risk
Fixed remuneration
Basesalary,superannuationandanysalarysacrificedbenefits
AMPgenerallypositionsfixedremunerationatthemedianofthe
market,comparedtolikerolesinAustralianlistedcompaniesofcomparablesizeboth
withinthefinancialservicessectorandacrossthegeneralmarket
Short-term incentive (STI)1
Rewardforstrongindividualandcompanyperformanceduringtheyear
throughannualgoalsthatarealignedtodeliveryofourstrategyandcreationof
shareholdervalue
Long-term incentive (LTI)
Rewardforlong-termcompanyperformance,measuredagainstAMP’sreturnonequityandtotalshareholder
returntargets
Value determined by
Delivered as
Why it is paid
60%–relativetotalshareholderreturnhurdleoverthreeyears
40%–returnonequityhurdleinthreeyears
RightstoAMPLimitedsharessubjecttothreeyearperformancetargets
Tofocusexecutives’effortstocreatelong-termvalueforshareholders
Toincreaseshareholdingtosupportalignmentwithshareholderinterests
Performanceoftheindividualandthecompanyduringtheyearmeasured
65%againstfinancialand35%againststrategicgoals
60%cash
40%rightstoAMPLimitedshares–deferredfortwoyears2
Tofocusexecutives’effortstodeliveronAMP’sstrategicprioritiesduringtheyear
Deferralof40%ofpaymentencouragesexecutivestofocusonsustainableoutcomesbeyondthe
performanceperiod
Marketvalueandcriticalityofrole,qualificationsandexperience
Cashandsuperannuation
Toattractandretaintalent
1 ExecutivesparticipateintheAMPSTIplanwiththeexceptionofAMPCapital’sCEOwhoparticipatesintheAMPCapitalenterpriseprofitshareplan.2 FortheAMPCapitalenterpriseprofitshareplan,50%vestsaftertwoyearsandremainingportionvestsafterthreeyears.
AMPCapitaloperatesunderseparateremunerationarrangements,whichincludetheAMPCapitalenterpriseprofitshareplan,whichisinlinewithmarketpracticeintheinvestmentmanagementindustryandsupportsAMPCapital’stalentmanagementgoalofattracting,motivatingandretaininginvestmentmanagementtalentinallmarketsinwhichAMPCapitaloperates.
AdamTindall(CEO,AMPCapital)participatesintheAMPCapitalenterpriseprofitshareplan,whichdeliversapoolasasetproportionofprofit(adjustedforcostofcapital).TheAMPLimitedBoardapprovestheallocationoftheprofitsharepoolforaperformanceperiodforAMPCapital’sCEO,basedonarecommendationfromtheAMPLimitedCEO.
For
per
sona
l use
onl
y
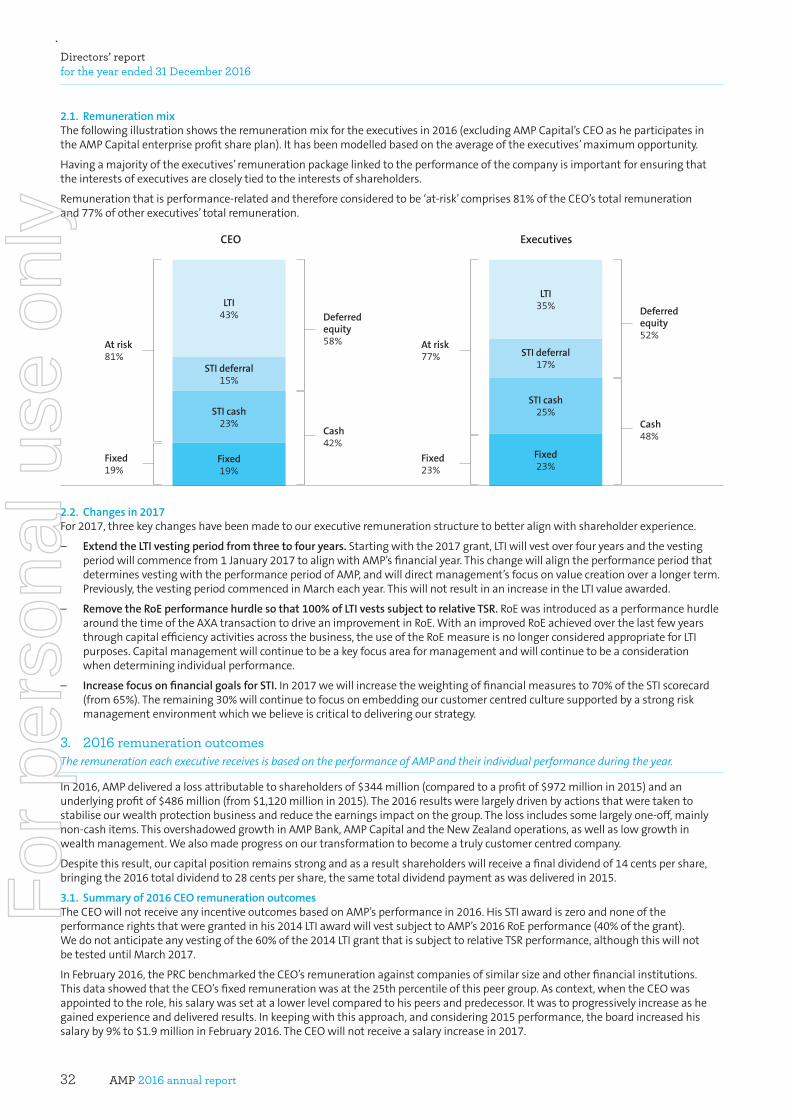
AMP 2016 annual report32
Directors’ report for the year ended 31 December 2016
2.1. Remuneration mix Thefollowingillustrationshowstheremunerationmixfortheexecutivesin2016(excludingAMPCapital’sCEOasheparticipatesintheAMPCapitalenterpriseprofitshareplan).Ithasbeenmodelledbasedontheaverageoftheexecutives’maximumopportunity.
Havingamajorityoftheexecutives’remunerationpackagelinkedtotheperformanceofthecompanyisimportantforensuringthattheinterestsofexecutivesarecloselytiedtotheinterestsofshareholders.
Remunerationthatisperformance-relatedandthereforeconsideredtobe‘at-risk’comprises81%oftheCEO’stotalremunerationand77%ofotherexecutives’totalremuneration.
Fixed19%
Fixed23%
STI cash 23%
STI cash 25%
STI deferral17%
LTI35%
STI deferral 15%
LTI 43%
At risk81%
At risk77%
Deferred equity58%
CEO Executives
Deferred equity52%
Cash42%
Cash48%
Fixed19%
Fixed23%
2.2. Changes in 2017For2017,threekeychangeshavebeenmadetoourexecutiveremunerationstructuretobetteralignwithshareholderexperience.
– Extend the LTI vesting period from three to four years. Startingwiththe2017grant,LTIwillvestoverfouryearsandthevestingperiodwillcommencefrom1January2017toalignwithAMP’sfinancialyear.ThischangewillaligntheperformanceperiodthatdeterminesvestingwiththeperformanceperiodofAMP,andwilldirectmanagement’sfocusonvaluecreationoveralongerterm.Previously,thevestingperiodcommencedinMarcheachyear.ThiswillnotresultinanincreaseintheLTIvalueawarded.
– Remove the RoE performance hurdle so that 100% of LTI vests subject to relative TSR.RoEwasintroducedasaperformancehurdlearoundthetimeoftheAXAtransactiontodriveanimprovementinRoE.WithanimprovedRoEachievedoverthelastfewyearsthroughcapitalefficiencyactivitiesacrossthebusiness,theuseoftheRoEmeasureisnolongerconsideredappropriateforLTIpurposes.Capitalmanagementwillcontinuetobeakeyfocusareaformanagementandwillcontinuetobeaconsiderationwhendeterminingindividualperformance.
– Increase focus on financial goals for STI. In2017wewillincreasetheweightingoffinancialmeasuresto70%oftheSTIscorecard(from65%).Theremaining30%willcontinuetofocusonembeddingourcustomercentredculturesupportedbyastrongriskmanagementenvironmentwhichwebelieveiscriticaltodeliveringourstrategy.
3. 2016 remuneration outcomesThe remuneration each executive receives is based on the performance of AMP and their individual performance during the year.
In2016,AMPdeliveredalossattributabletoshareholdersof$344million(comparedtoaprofitof$972millionin2015)andanunderlyingprofitof$486million(from$1,120millionin2015).The2016resultswerelargelydrivenbyactionsthatweretakentostabiliseourwealthprotectionbusinessandreducetheearningsimpactonthegroup.Thelossincludessomelargelyone-off,mainlynon-cashitems.ThisovershadowedgrowthinAMPBank,AMPCapitalandtheNewZealandoperations,aswellaslowgrowthinwealthmanagement.Wealsomadeprogressonourtransformationtobecomeatrulycustomercentredcompany.
Despitethisresult,ourcapitalpositionremainsstrongandasaresultshareholderswillreceiveafinaldividendof14centspershare,bringingthe2016totaldividendto28centspershare,thesametotaldividendpaymentaswasdeliveredin2015.
3.1. Summary of 2016 CEO remuneration outcomesTheCEOwillnotreceiveanyincentiveoutcomesbasedonAMP’sperformancein2016.HisSTIawardiszeroandnoneoftheperformancerightsthatweregrantedinhis2014LTIawardwillvestsubjecttoAMP’s2016RoEperformance(40%ofthegrant).Wedonotanticipateanyvestingofthe60%ofthe2014LTIgrantthatissubjecttorelativeTSRperformance,althoughthiswillnotbetesteduntilMarch2017.
InFebruary2016,thePRCbenchmarkedtheCEO’sremunerationagainstcompaniesofsimilarsizeandotherfinancialinstitutions.ThisdatashowedthattheCEO’sfixedremunerationwasatthe25thpercentileofthispeergroup.Ascontext,whentheCEOwasappointedtotherole,hissalarywassetatalowerlevelcomparedtohispeersandpredecessor.Itwastoprogressivelyincreaseashegainedexperienceanddeliveredresults.Inkeepingwiththisapproach,andconsidering2015performance,theboardincreasedhissalaryby9%to$1.9millioninFebruary2016.TheCEOwillnotreceiveasalaryincreasein2017.
For
per
sona
l use
onl
y
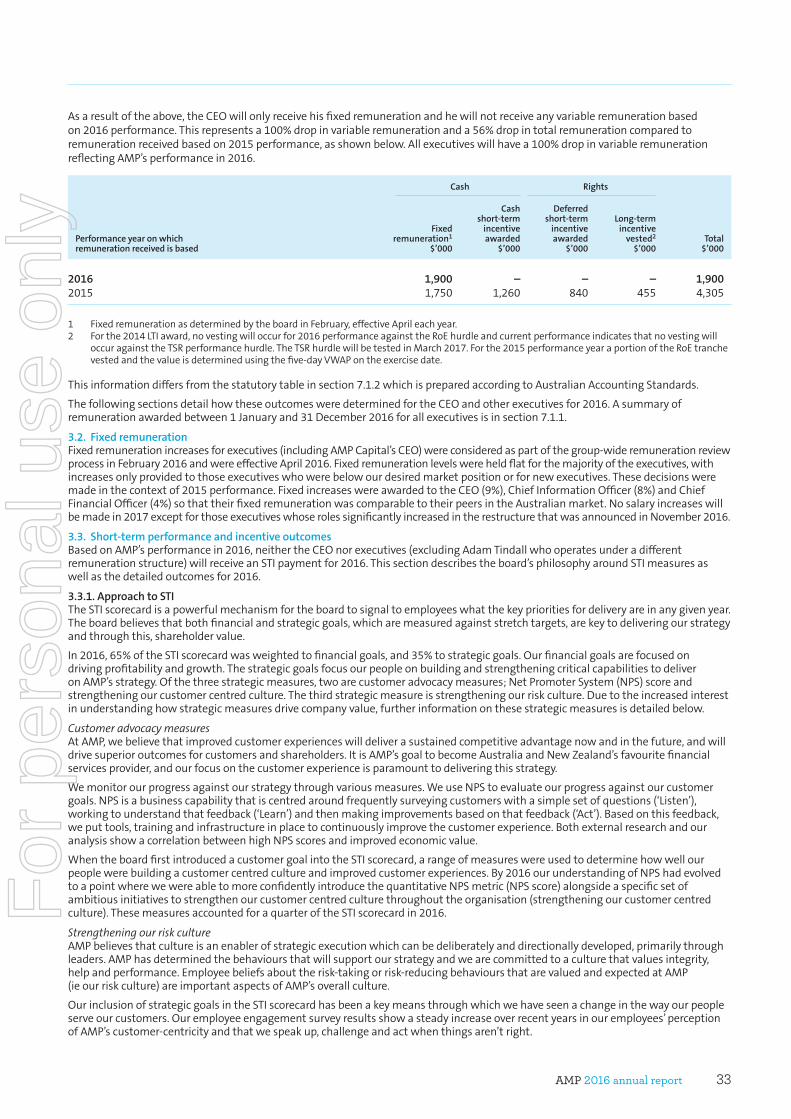
AMP 2016 annual report 33
Asaresultoftheabove,theCEOwillonlyreceivehisfixedremunerationandhewillnotreceiveanyvariableremunerationbasedon2016performance.Thisrepresentsa100%dropinvariableremunerationanda56%dropintotalremunerationcomparedtoremunerationreceivedbasedon2015performance,asshownbelow.Allexecutiveswillhavea100%dropinvariableremunerationreflectingAMP’sperformancein2016.
Cash Rights
Performance year on which remuneration received is based
Fixed remuneration1
$’000
Cash short-term
incentive awarded
$’000
Deferred short-term
incentive awarded
$’000
Long-term incentive
vested2
$’000Total
$’000
2016 1,900 – – – 1,9002015 1,750 1,260 840 455 4,305
1 FixedremunerationasdeterminedbytheboardinFebruary,effectiveAprileachyear.2 Forthe2014LTIaward,novestingwilloccurfor2016performanceagainsttheRoEhurdleandcurrentperformanceindicatesthatnovestingwill
occuragainsttheTSRperformancehurdle.TheTSRhurdlewillbetestedinMarch2017.Forthe2015performanceyearaportionoftheRoEtranchevestedandthevalueisdeterminedusingthefive-dayVWAPontheexercisedate.
Thisinformationdiffersfromthestatutorytableinsection7.1.2whichispreparedaccordingtoAustralianAccountingStandards.
ThefollowingsectionsdetailhowtheseoutcomesweredeterminedfortheCEOandotherexecutivesfor2016.Asummaryofremunerationawardedbetween1Januaryand31December2016forallexecutivesisinsection7.1.1.
3.2. Fixed remunerationFixedremunerationincreasesforexecutives(includingAMPCapital’sCEO)wereconsideredaspartofthegroup-wideremunerationreviewprocessinFebruary2016andwereeffectiveApril2016.Fixedremunerationlevelswereheldflatforthemajorityoftheexecutives,withincreasesonlyprovidedtothoseexecutiveswhowerebelowourdesiredmarketpositionorfornewexecutives.Thesedecisionsweremadeinthecontextof2015performance.FixedincreaseswereawardedtotheCEO(9%),ChiefInformationOfficer(8%)andChiefFinancialOfficer(4%)sothattheirfixedremunerationwascomparabletotheirpeersintheAustralianmarket.Nosalaryincreaseswillbemadein2017exceptforthoseexecutiveswhoserolessignificantlyincreasedintherestructurethatwasannouncedinNovember2016.
3.3. Short-term performance and incentive outcomesBasedonAMP’sperformancein2016,neithertheCEOnorexecutives(excludingAdamTindallwhooperatesunderadifferentremunerationstructure)willreceiveanSTIpaymentfor2016.Thissectiondescribestheboard’sphilosophyaroundSTImeasuresaswellasthedetailedoutcomesfor2016.
3.3.1. Approach to STITheSTIscorecardisapowerfulmechanismfortheboardtosignaltoemployeeswhatthekeyprioritiesfordeliveryareinanygivenyear.Theboardbelievesthatbothfinancialandstrategicgoals,whicharemeasuredagainststretchtargets,arekeytodeliveringourstrategyandthroughthis,shareholdervalue.
In2016,65%oftheSTIscorecardwasweightedtofinancialgoals,and35%tostrategicgoals.Ourfinancialgoalsarefocusedondrivingprofitabilityandgrowth.ThestrategicgoalsfocusourpeopleonbuildingandstrengtheningcriticalcapabilitiestodeliveronAMP’sstrategy.Ofthethreestrategicmeasures,twoarecustomeradvocacymeasures;NetPromoterSystem(NPS)scoreandstrengtheningourcustomercentredculture.Thethirdstrategicmeasureisstrengtheningourriskculture.Duetotheincreasedinterestinunderstandinghowstrategicmeasuresdrivecompanyvalue,furtherinformationonthesestrategicmeasuresisdetailedbelow.
Customer advocacy measuresAtAMP,webelievethatimprovedcustomerexperienceswilldeliverasustainedcompetitiveadvantagenowandinthefuture,andwilldrivesuperioroutcomesforcustomersandshareholders.ItisAMP’sgoaltobecomeAustraliaandNewZealand’sfavouritefinancialservicesprovider,andourfocusonthecustomerexperienceisparamounttodeliveringthisstrategy.
Wemonitorourprogressagainstourstrategythroughvariousmeasures.WeuseNPStoevaluateourprogressagainstourcustomergoals.NPSisabusinesscapabilitythatiscentredaroundfrequentlysurveyingcustomerswithasimplesetofquestions(‘Listen’),workingtounderstandthatfeedback(‘Learn’)andthenmakingimprovementsbasedonthatfeedback(‘Act’).Basedonthisfeedback,weputtools,trainingandinfrastructureinplacetocontinuouslyimprovethecustomerexperience.BothexternalresearchandouranalysisshowacorrelationbetweenhighNPSscoresandimprovedeconomicvalue.
WhentheboardfirstintroducedacustomergoalintotheSTIscorecard,arangeofmeasureswereusedtodeterminehowwellourpeoplewerebuildingacustomercentredcultureandimprovedcustomerexperiences.By2016ourunderstandingofNPShadevolvedtoapointwherewewereabletomoreconfidentlyintroducethequantitativeNPSmetric(NPSscore)alongsideaspecificsetofambitiousinitiativestostrengthenourcustomercentredculturethroughouttheorganisation(strengtheningourcustomercentredculture).ThesemeasuresaccountedforaquarteroftheSTIscorecardin2016.
Strengthening our risk cultureAMPbelievesthatcultureisanenablerofstrategicexecutionwhichcanbedeliberatelyanddirectionallydeveloped,primarilythroughleaders.AMPhasdeterminedthebehavioursthatwillsupportourstrategyandwearecommittedtoaculturethatvaluesintegrity,helpandperformance.Employeebeliefsabouttherisk-takingorrisk-reducingbehavioursthatarevaluedandexpectedatAMP(ieourriskculture)areimportantaspectsofAMP’soverallculture.
OurinclusionofstrategicgoalsintheSTIscorecardhasbeenakeymeansthroughwhichwehaveseenachangeinthewayourpeopleserveourcustomers.Ouremployeeengagementsurveyresultsshowasteadyincreaseoverrecentyearsinouremployees’perceptionofAMP’scustomer-centricityandthatwespeakup,challengeandactwhenthingsaren’tright.
For
per
sona
l use
onl
y
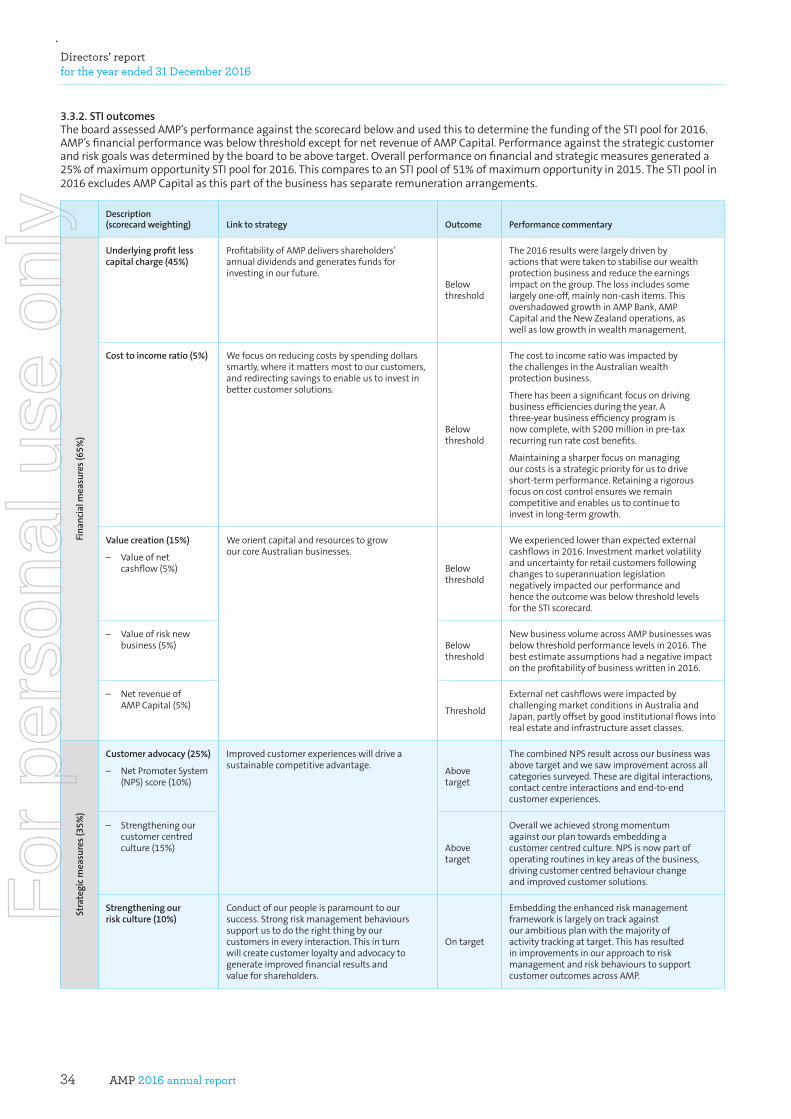
AMP 2016 annual report34
Directors’ report for the year ended 31 December 2016
3.3.2. STI outcomesTheboardassessedAMP’sperformanceagainstthescorecardbelowandusedthistodeterminethefundingoftheSTIpoolfor2016.AMP’sfinancialperformancewasbelowthresholdexceptfornetrevenueofAMPCapital.Performanceagainstthestrategiccustomerandriskgoalswasdeterminedbytheboardtobeabovetarget.Overallperformanceonfinancialandstrategicmeasuresgenerateda25%ofmaximumopportunitySTIpoolfor2016.ThiscomparestoanSTIpoolof51%ofmaximumopportunityin2015.TheSTIpoolin2016excludesAMPCapitalasthispartofthebusinesshasseparateremunerationarrangements.
Description (scorecard weighting) Link to strategy Outcome Performance commentary
Fina
ncia
l mea
sure
s (6
5%)
Underlying profit less capital charge (45%)
ProfitabilityofAMPdeliversshareholders’annualdividendsandgeneratesfundsforinvestinginourfuture.
Belowthreshold
The2016resultswerelargelydrivenbyactionsthatweretakentostabiliseourwealthprotectionbusinessandreducetheearningsimpactonthegroup.Thelossincludessomelargelyone-off,mainlynon-cashitems.ThisovershadowedgrowthinAMPBank,AMPCapitalandtheNewZealandoperations,aswellaslowgrowthinwealthmanagement.
Cost to income ratio (5%) Wefocusonreducingcostsbyspendingdollarssmartly,whereitmattersmosttoourcustomers,andredirectingsavingstoenableustoinvestinbettercustomersolutions.
Belowthreshold
ThecosttoincomeratiowasimpactedbythechallengesintheAustralianwealthprotectionbusiness.
Therehasbeenasignificantfocusondrivingbusinessefficienciesduringtheyear.Athree-yearbusinessefficiencyprogramisnowcomplete,with$200millioninpre-taxrecurringrunratecostbenefits.
Maintainingasharperfocusonmanagingourcostsisastrategicpriorityforustodriveshort-termperformance.Retainingarigorousfocusoncostcontrolensuresweremaincompetitiveandenablesustocontinuetoinvestinlong-termgrowth.
Value creation (15%)
– Valueofnetcashflow(5%)
WeorientcapitalandresourcestogrowourcoreAustralianbusinesses.
Belowthreshold
Weexperiencedlowerthanexpectedexternalcashflowsin2016.InvestmentmarketvolatilityanduncertaintyforretailcustomersfollowingchangestosuperannuationlegislationnegativelyimpactedourperformanceandhencetheoutcomewasbelowthresholdlevelsfortheSTIscorecard.
– Valueofrisknewbusiness(5%) Below
threshold
NewbusinessvolumeacrossAMPbusinesseswasbelowthresholdperformancelevelsin2016.Thebestestimateassumptionshadanegativeimpactontheprofitabilityofbusinesswrittenin2016.
– NetrevenueofAMPCapital(5%)
Threshold
ExternalnetcashflowswereimpactedbychallengingmarketconditionsinAustraliaandJapan,partlyoffsetbygoodinstitutionalflowsintorealestateandinfrastructureassetclasses.
Stra
tegi
c m
easu
res
(35%
)
Customer advocacy (25%)
– NetPromoterSystem(NPS)score(10%)
Improvedcustomerexperienceswilldriveasustainablecompetitiveadvantage.
Abovetarget
ThecombinedNPSresultacrossourbusinesswasabovetargetandwesawimprovementacrossallcategoriessurveyed.Thesearedigitalinteractions,contactcentreinteractionsandend-to-endcustomerexperiences.
– Strengtheningourcustomercentredculture(15%) Above
target
Overallweachievedstrongmomentumagainstourplantowardsembeddingacustomercentredculture.NPSisnowpartofoperatingroutinesinkeyareasofthebusiness,drivingcustomercentredbehaviourchangeandimprovedcustomersolutions.
Strengthening our risk culture (10%)
Conductofourpeopleisparamounttooursuccess.Strongriskmanagementbehaviourssupportustodotherightthingbyourcustomersineveryinteraction.Thisinturnwillcreatecustomerloyaltyandadvocacytogenerateimprovedfinancialresultsandvalueforshareholders.
Ontarget
Embeddingtheenhancedriskmanagementframeworkislargelyontrackagainstourambitiousplanwiththemajorityofactivitytrackingattarget.ThishasresultedinimprovementsinourapproachtoriskmanagementandriskbehaviourstosupportcustomeroutcomesacrossAMP.
For
per
sona
l use
onl
y
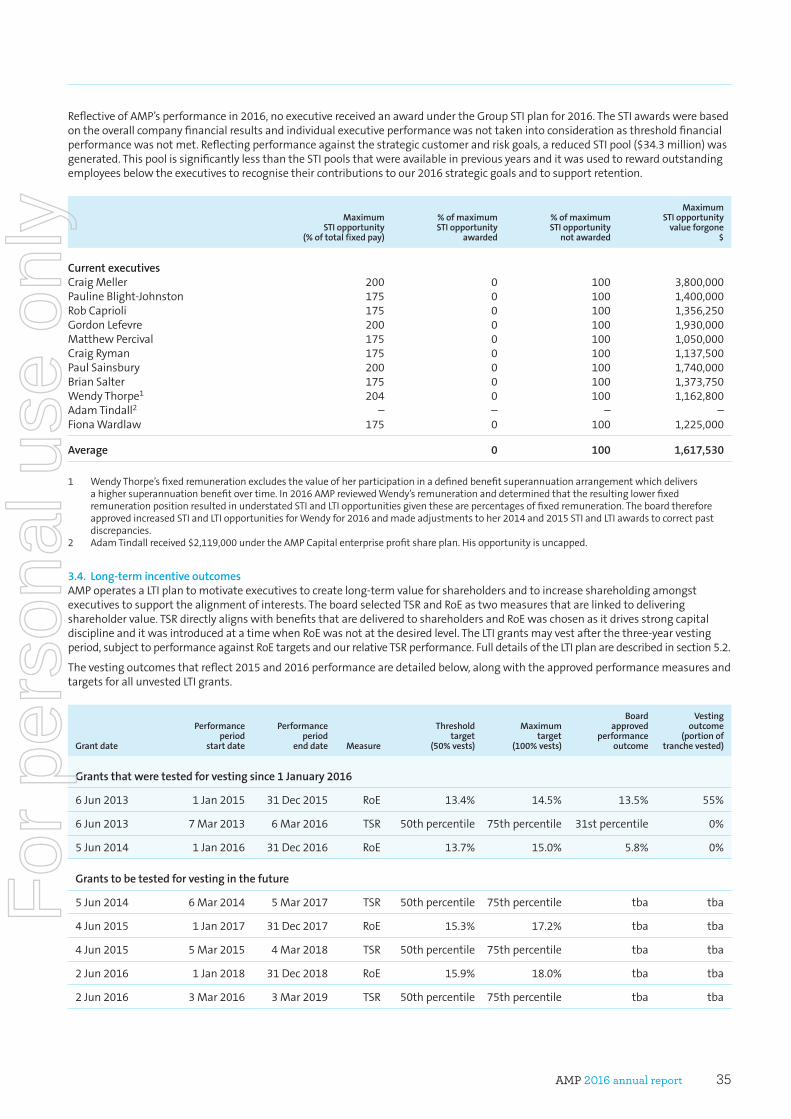
AMP 2016 annual report 35
ReflectiveofAMP’sperformancein2016,noexecutivereceivedanawardundertheGroupSTIplanfor2016.TheSTIawardswerebasedontheoverallcompanyfinancialresultsandindividualexecutiveperformancewasnottakenintoconsiderationasthresholdfinancialperformancewasnotmet.Reflectingperformanceagainstthestrategiccustomerandriskgoals,areducedSTIpool($34.3million)wasgenerated.ThispoolissignificantlylessthantheSTIpoolsthatwereavailableinpreviousyearsanditwasusedtorewardoutstandingemployeesbelowtheexecutivestorecognisetheircontributionstoour2016strategicgoalsandtosupportretention.
Maximum STI opportunity
(% of total fixed pay)
% of maximum STI opportunity
awarded
% of maximum STI opportunity
not awarded
Maximum STI opportunity
value forgone $
Current executivesCraigMeller 200 0 100 3,800,000PaulineBlight-Johnston 175 0 100 1,400,000RobCaprioli 175 0 100 1,356,250GordonLefevre 200 0 100 1,930,000MatthewPercival 175 0 100 1,050,000CraigRyman 175 0 100 1,137,500PaulSainsbury 200 0 100 1,740,000BrianSalter 175 0 100 1,373,750WendyThorpe1 204 0 100 1,162,800AdamTindall2 – – – –FionaWardlaw 175 0 100 1,225,000
Average 0 100 1,617,530
1 WendyThorpe’sfixedremunerationexcludesthevalueofherparticipationinadefinedbenefitsuperannuationarrangementwhichdeliversahighersuperannuationbenefitovertime.In2016AMPreviewedWendy’sremunerationanddeterminedthattheresultinglowerfixedremunerationpositionresultedinunderstatedSTIandLTIopportunitiesgiventhesearepercentagesoffixedremuneration.TheboardthereforeapprovedincreasedSTIandLTIopportunitiesforWendyfor2016andmadeadjustmentstoher2014and2015STIandLTIawardstocorrectpastdiscrepancies.
2 AdamTindallreceived$2,119,000undertheAMPCapitalenterpriseprofitshareplan.Hisopportunityisuncapped.
3.4. Long-term incentive outcomesAMPoperatesaLTIplantomotivateexecutivestocreatelong-termvalueforshareholdersandtoincreaseshareholdingamongstexecutivestosupportthealignmentofinterests.TheboardselectedTSRandRoEastwomeasuresthatarelinkedtodeliveringshareholdervalue.TSRdirectlyalignswithbenefitsthataredeliveredtoshareholdersandRoEwaschosenasitdrivesstrongcapitaldisciplineanditwasintroducedatatimewhenRoEwasnotatthedesiredlevel.TheLTIgrantsmayvestafterthethree-yearvestingperiod,subjecttoperformanceagainstRoEtargetsandourrelativeTSRperformance.FulldetailsoftheLTIplanaredescribedinsection5.2.
Thevestingoutcomesthatreflect2015and2016performancearedetailedbelow,alongwiththeapprovedperformancemeasuresandtargetsforallunvestedLTIgrants.
Grant date
Performance period
start date
Performance period
end date Measure
Threshold target
(50% vests)
Maximum target
(100% vests)
Board approved
performance outcome
Vesting outcome
(portion of tranche vested)
Grants that were tested for vesting since 1 January 2016
6Jun2013 1Jan2015 31Dec2015 RoE 13.4% 14.5% 13.5% 55%
6Jun2013 7Mar2013 6Mar2016 TSR 50thpercentile 75thpercentile 31stpercentile 0%
5Jun2014 1Jan2016 31Dec2016 RoE 13.7% 15.0% 5.8% 0%
Grants to be tested for vesting in the future
5Jun2014 6Mar2014 5Mar2017 TSR 50thpercentile 75thpercentile tba tba
4Jun2015 1Jan2017 31Dec2017 RoE 15.3% 17.2% tba tba
4Jun2015 5Mar2015 4Mar2018 TSR 50thpercentile 75thpercentile tba tba
2Jun2016 1Jan2018 31Dec2018 RoE 15.9% 18.0% tba tba
2Jun2016 3Mar2016 3Mar2019 TSR 50thpercentile 75thpercentile tba tba
For
per
sona
l use
onl
y
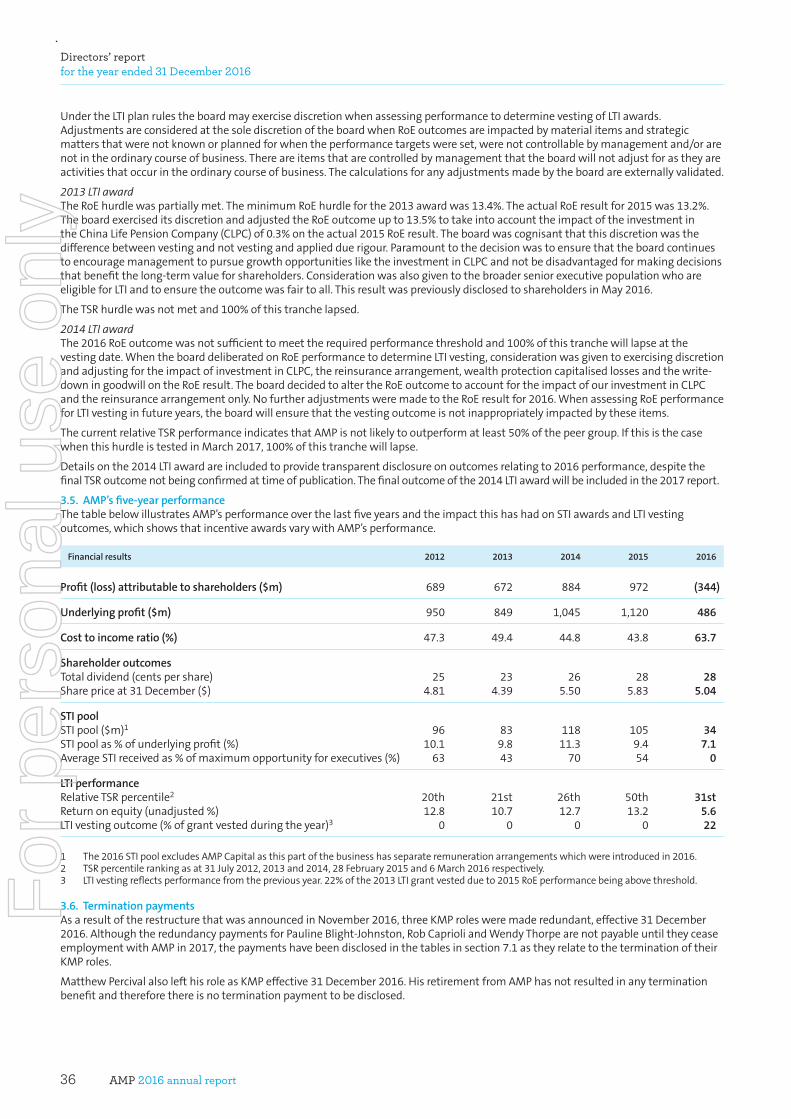
AMP 2016 annual report36
Directors’ report for the year ended 31 December 2016
UndertheLTIplanrulestheboardmayexercisediscretionwhenassessingperformancetodeterminevestingofLTIawards.AdjustmentsareconsideredatthesolediscretionoftheboardwhenRoEoutcomesareimpactedbymaterialitemsandstrategicmattersthatwerenotknownorplannedforwhentheperformancetargetswereset,werenotcontrollablebymanagementand/orarenotintheordinarycourseofbusiness.Thereareitemsthatarecontrolledbymanagementthattheboardwillnotadjustforastheyareactivitiesthatoccurintheordinarycourseofbusiness.Thecalculationsforanyadjustmentsmadebytheboardareexternallyvalidated.
2013 LTI awardTheRoEhurdlewaspartiallymet.TheminimumRoEhurdleforthe2013awardwas13.4%.TheactualRoEresultfor2015was13.2%.TheboardexerciseditsdiscretionandadjustedtheRoEoutcomeupto13.5%totakeintoaccounttheimpactoftheinvestmentintheChinaLifePensionCompany(CLPC)of0.3%ontheactual2015RoEresult.Theboardwascognisantthatthisdiscretionwasthedifferencebetweenvestingandnotvestingandappliedduerigour.ParamounttothedecisionwastoensurethattheboardcontinuestoencouragemanagementtopursuegrowthopportunitiesliketheinvestmentinCLPCandnotbedisadvantagedformakingdecisionsthatbenefitthelong-termvalueforshareholders.ConsiderationwasalsogiventothebroaderseniorexecutivepopulationwhoareeligibleforLTIandtoensuretheoutcomewasfairtoall.ThisresultwaspreviouslydisclosedtoshareholdersinMay2016.
TheTSRhurdlewasnotmetand100%ofthistranchelapsed.
2014 LTI awardThe2016RoEoutcomewasnotsufficienttomeettherequiredperformancethresholdand100%ofthistranchewilllapseatthevestingdate.WhentheboarddeliberatedonRoEperformancetodetermineLTIvesting,considerationwasgiventoexercisingdiscretionandadjustingfortheimpactofinvestmentinCLPC,thereinsurancearrangement,wealthprotectioncapitalisedlossesandthewrite-downingoodwillontheRoEresult.TheboarddecidedtoaltertheRoEoutcometoaccountfortheimpactofourinvestmentinCLPCandthereinsurancearrangementonly.NofurtheradjustmentsweremadetotheRoEresultfor2016.WhenassessingRoEperformanceforLTIvestinginfutureyears,theboardwillensurethatthevestingoutcomeisnotinappropriatelyimpactedbytheseitems.
ThecurrentrelativeTSRperformanceindicatesthatAMPisnotlikelytooutperformatleast50%ofthepeergroup.IfthisisthecasewhenthishurdleistestedinMarch2017,100%ofthistranchewilllapse.
Detailsonthe2014LTIawardareincludedtoprovidetransparentdisclosureonoutcomesrelatingto2016performance,despitethefinalTSRoutcomenotbeingconfirmedattimeofpublication.Thefinaloutcomeofthe2014LTIawardwillbeincludedinthe2017report.
3.5. AMP’s five-year performanceThetablebelowillustratesAMP’sperformanceoverthelastfiveyearsandtheimpactthishashadonSTIawardsandLTIvestingoutcomes,whichshowsthatincentiveawardsvarywithAMP’sperformance.
Financial results 2012 2013 2014 2015 2016
Profit (loss) attributable to shareholders ($m) 689 672 884 972 (344)
Underlying profit ($m) 950 849 1,045 1,120 486
Cost to income ratio (%) 47.3 49.4 44.8 43.8 63.7
Shareholder outcomesTotaldividend(centspershare) 25 23 26 28 28Sharepriceat31December($) 4.81 4.39 5.50 5.83 5.04
STI pool STIpool($m)1 96 83 118 105 34STIpoolas%ofunderlyingprofit(%) 10.1 9.8 11.3 9.4 7.1AverageSTIreceivedas%ofmaximumopportunityforexecutives(%) 63 43 70 54 0
LTI performanceRelativeTSRpercentile2 20th 21st 26th 50th 31st Returnonequity(unadjusted%) 12.8 10.7 12.7 13.2 5.6LTIvestingoutcome(%ofgrantvestedduringtheyear)3 0 0 0 0 22
1 The2016STIpoolexcludesAMPCapitalasthispartofthebusinesshasseparateremunerationarrangementswhichwereintroducedin2016.2 TSRpercentilerankingasat31July2012,2013and2014,28February2015and6March2016respectively.3 LTIvestingreflectsperformancefromthepreviousyear.22%ofthe2013LTIgrantvesteddueto2015RoEperformancebeingabovethreshold.
3.6. Termination paymentsAsaresultoftherestructurethatwasannouncedinNovember2016,threeKMProlesweremaderedundant,effective31December2016.AlthoughtheredundancypaymentsforPaulineBlight-Johnston,RobCaprioliandWendyThorpearenotpayableuntiltheyceaseemploymentwithAMPin2017,thepaymentshavebeendisclosedinthetablesinsection7.1astheyrelatetotheterminationoftheirKMProles.
MatthewPercivalalsolefthisroleasKMPeffective31December2016.HisretirementfromAMPhasnotresultedinanyterminationbenefitandthereforethereisnoterminationpaymenttobedisclosed.
For
per
sona
l use
onl
y
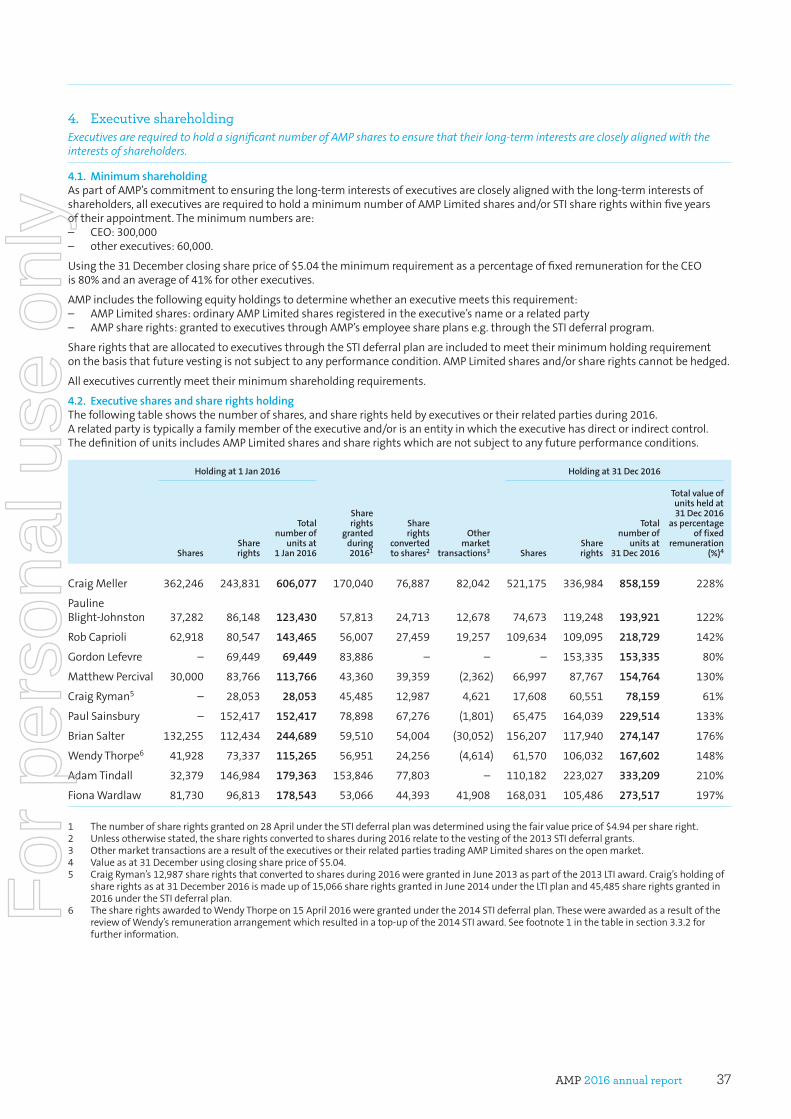
AMP 2016 annual report 37
4. Executive shareholding Executives are required to hold a significant number of AMP shares to ensure that their long-term interests are closely aligned with the interests of shareholders.
4.1. Minimum shareholdingAspartofAMP’scommitmenttoensuringthelong-terminterestsofexecutivesarecloselyalignedwiththelong-terminterestsofshareholders,allexecutivesarerequiredtoholdaminimumnumberofAMPLimitedsharesand/orSTIsharerightswithinfiveyearsoftheirappointment.Theminimumnumbersare:– CEO:300,000– otherexecutives:60,000.
Usingthe31Decemberclosingsharepriceof$5.04theminimumrequirementasapercentageoffixedremunerationfortheCEOis80%andanaverageof41%forotherexecutives.
AMPincludesthefollowingequityholdingstodeterminewhetheranexecutivemeetsthisrequirement:– AMPLimitedshares:ordinaryAMPLimitedsharesregisteredintheexecutive’snameorarelatedparty– AMPsharerights:grantedtoexecutivesthroughAMP’semployeeshareplanse.g.throughtheSTIdeferralprogram.
SharerightsthatareallocatedtoexecutivesthroughtheSTIdeferralplanareincludedtomeettheirminimumholdingrequirementonthebasisthatfuturevestingisnotsubjecttoanyperformancecondition.AMPLimitedsharesand/orsharerightscannotbehedged.
Allexecutivescurrentlymeettheirminimumshareholdingrequirements.
4.2. Executive shares and share rights holding Thefollowingtableshowsthenumberofshares,andsharerightsheldbyexecutivesortheirrelatedpartiesduring2016.Arelatedpartyistypicallyafamilymemberoftheexecutiveand/orisanentityinwhichtheexecutivehasdirectorindirectcontrol.ThedefinitionofunitsincludesAMPLimitedsharesandsharerightswhicharenotsubjecttoanyfutureperformanceconditions.
Holding at 1 Jan 2016 Holding at 31 Dec 2016
SharesShare rights
Total number of
units at 1 Jan 2016
Share rights
granted during 20161
Share rights
converted to shares2
Other market
transactions3 SharesShare rights
Total number of
units at 31 Dec 2016
Total value of units held at 31 Dec 2016
as percentage of fixed
remuneration (%)4
CraigMeller 362,246 243,831 606,077 170,040 76,887 82,042 521,175 336,984 858,159 228%
PaulineBlight-Johnston 37,282 86,148 123,430 57,813 24,713 12,678 74,673 119,248 193,921 122%
RobCaprioli 62,918 80,547 143,465 56,007 27,459 19,257 109,634 109,095 218,729 142%
GordonLefevre – 69,449 69,449 83,886 – – – 153,335 153,335 80%
MatthewPercival 30,000 83,766 113,766 43,360 39,359 (2,362) 66,997 87,767 154,764 130%
CraigRyman5 – 28,053 28,053 45,485 12,987 4,621 17,608 60,551 78,159 61%
PaulSainsbury – 152,417 152,417 78,898 67,276 (1,801) 65,475 164,039 229,514 133%
BrianSalter 132,255 112,434 244,689 59,510 54,004 (30,052) 156,207 117,940 274,147 176%
WendyThorpe6 41,928 73,337 115,265 56,951 24,256 (4,614) 61,570 106,032 167,602 148%
AdamTindall 32,379 146,984 179,363 153,846 77,803 – 110,182 223,027 333,209 210%
FionaWardlaw 81,730 96,813 178,543 53,066 44,393 41,908 168,031 105,486 273,517 197%
1 Thenumberofsharerightsgrantedon28AprilundertheSTIdeferralplanwasdeterminedusingthefairvaluepriceof$4.94pershareright.2 Unlessotherwisestated,thesharerightsconvertedtosharesduring2016relatetothevestingofthe2013STIdeferralgrants.3 OthermarkettransactionsarearesultoftheexecutivesortheirrelatedpartiestradingAMPLimitedsharesontheopenmarket.4 Valueasat31Decemberusingclosingsharepriceof$5.04.5 CraigRyman’s12,987sharerightsthatconvertedtosharesduring2016weregrantedinJune2013aspartofthe2013LTIaward.Craig’sholdingof
sharerightsasat31December2016ismadeupof15,066sharerightsgrantedinJune2014undertheLTIplanand45,485sharerightsgrantedin2016undertheSTIdeferralplan.
6 ThesharerightsawardedtoWendyThorpeon15April2016weregrantedunderthe2014STIdeferralplan.ThesewereawardedasaresultofthereviewofWendy’sremunerationarrangementwhichresultedinatop-upofthe2014STIaward.Seefootnote1inthetableinsection3.3.2forfurtherinformation.
For
per
sona
l use
onl
y
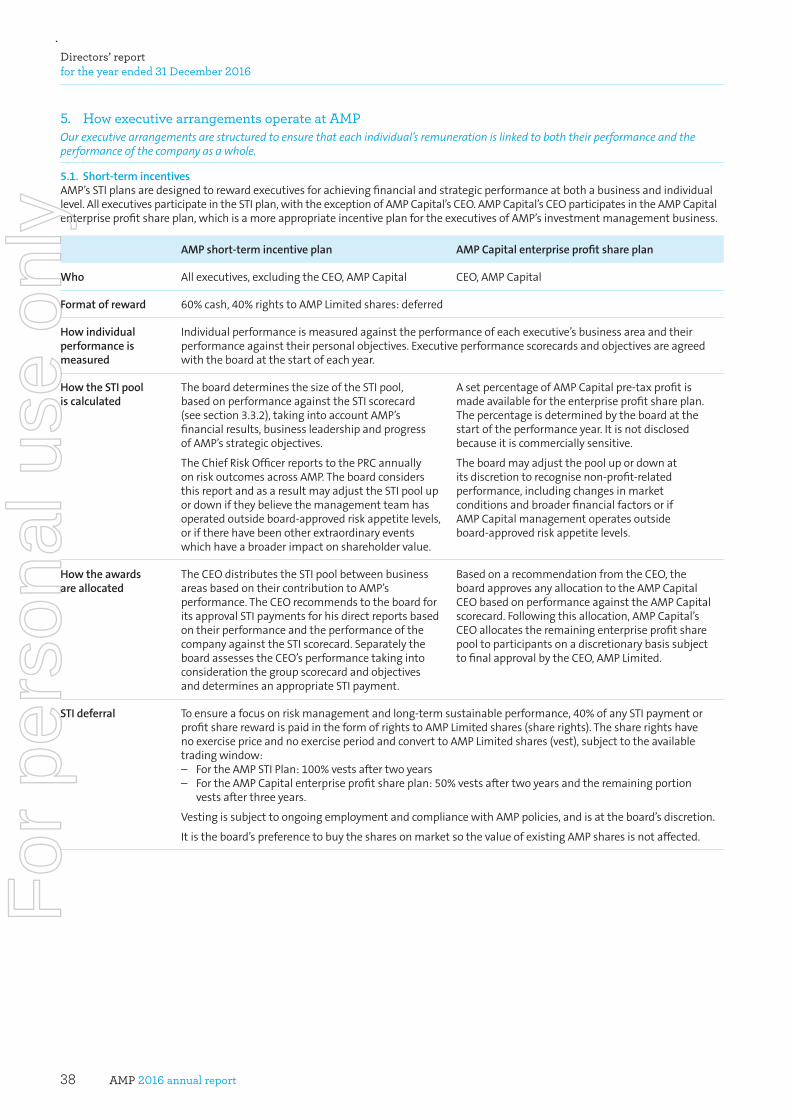
AMP 2016 annual report38
Directors’ report for the year ended 31 December 2016
5. How executive arrangements operate at AMP Our executive arrangements are structured to ensure that each individual’s remuneration is linked to both their performance and the performance of the company as a whole.
5.1. Short-term incentivesAMP’sSTIplansaredesignedtorewardexecutivesforachievingfinancialandstrategicperformanceatbothabusinessandindividuallevel.AllexecutivesparticipateintheSTIplan,withtheexceptionofAMPCapital’sCEO.AMPCapital’sCEOparticipatesintheAMPCapitalenterpriseprofitshareplan,whichisamoreappropriateincentiveplanfortheexecutivesofAMP’sinvestmentmanagementbusiness.
AMP short-term incentive plan AMP Capital enterprise profit share plan
Who Allexecutives,excludingtheCEO,AMPCapital CEO,AMPCapital
Format of reward 60%cash,40%rightstoAMPLimitedshares:deferred
How individual performance is measured
Individualperformanceismeasuredagainsttheperformanceofeachexecutive’sbusinessareaandtheirperformanceagainsttheirpersonalobjectives.Executiveperformancescorecardsandobjectivesareagreedwiththeboardatthestartofeachyear.
How the STI pool is calculated
TheboarddeterminesthesizeoftheSTIpool,basedonperformanceagainsttheSTIscorecard(seesection3.3.2),takingintoaccountAMP’sfinancialresults,businessleadershipandprogressofAMP’sstrategicobjectives.
TheChiefRiskOfficerreportstothePRCannuallyonriskoutcomesacrossAMP.TheboardconsidersthisreportandasaresultmayadjusttheSTIpoolupordowniftheybelievethemanagementteamhasoperatedoutsideboard-approvedriskappetitelevels,oriftherehavebeenotherextraordinaryeventswhichhaveabroaderimpactonshareholdervalue.
AsetpercentageofAMPCapitalpre-taxprofitismadeavailablefortheenterpriseprofitshareplan.Thepercentageisdeterminedbytheboardatthestartoftheperformanceyear.Itisnotdisclosedbecauseitiscommerciallysensitive.
Theboardmayadjustthepoolupordownatitsdiscretiontorecognisenon-profit-relatedperformance,includingchangesinmarketconditionsandbroaderfinancialfactorsorifAMPCapitalmanagementoperatesoutsideboard-approvedriskappetitelevels.
How the awards are allocated
TheCEOdistributestheSTIpoolbetweenbusinessareasbasedontheircontributiontoAMP’sperformance.TheCEOrecommendstotheboardforitsapprovalSTIpaymentsforhisdirectreportsbasedontheirperformanceandtheperformanceofthecompanyagainsttheSTIscorecard.SeparatelytheboardassessestheCEO’sperformancetakingintoconsiderationthegroupscorecardandobjectivesanddeterminesanappropriateSTIpayment.
BasedonarecommendationfromtheCEO,theboardapprovesanyallocationtotheAMPCapitalCEObasedonperformanceagainsttheAMPCapitalscorecard.Followingthisallocation,AMPCapital’sCEOallocatestheremainingenterpriseprofitsharepooltoparticipantsonadiscretionarybasissubjecttofinalapprovalbytheCEO,AMPLimited.
STI deferral Toensureafocusonriskmanagementandlong-termsustainableperformance,40%ofanySTIpaymentorprofitsharerewardispaidintheformofrightstoAMPLimitedshares(sharerights).ThesharerightshavenoexercisepriceandnoexerciseperiodandconverttoAMPLimitedshares(vest),subjecttotheavailabletradingwindow:– FortheAMPSTIPlan:100%vestsaftertwoyears– FortheAMPCapitalenterpriseprofitshareplan:50%vestsaftertwoyearsandtheremainingportion
vestsafterthreeyears.
VestingissubjecttoongoingemploymentandcompliancewithAMPpolicies,andisattheboard’sdiscretion.
Itistheboard’spreferencetobuythesharesonmarketsothevalueofexistingAMPsharesisnotaffected.
For
per
sona
l use
onl
y
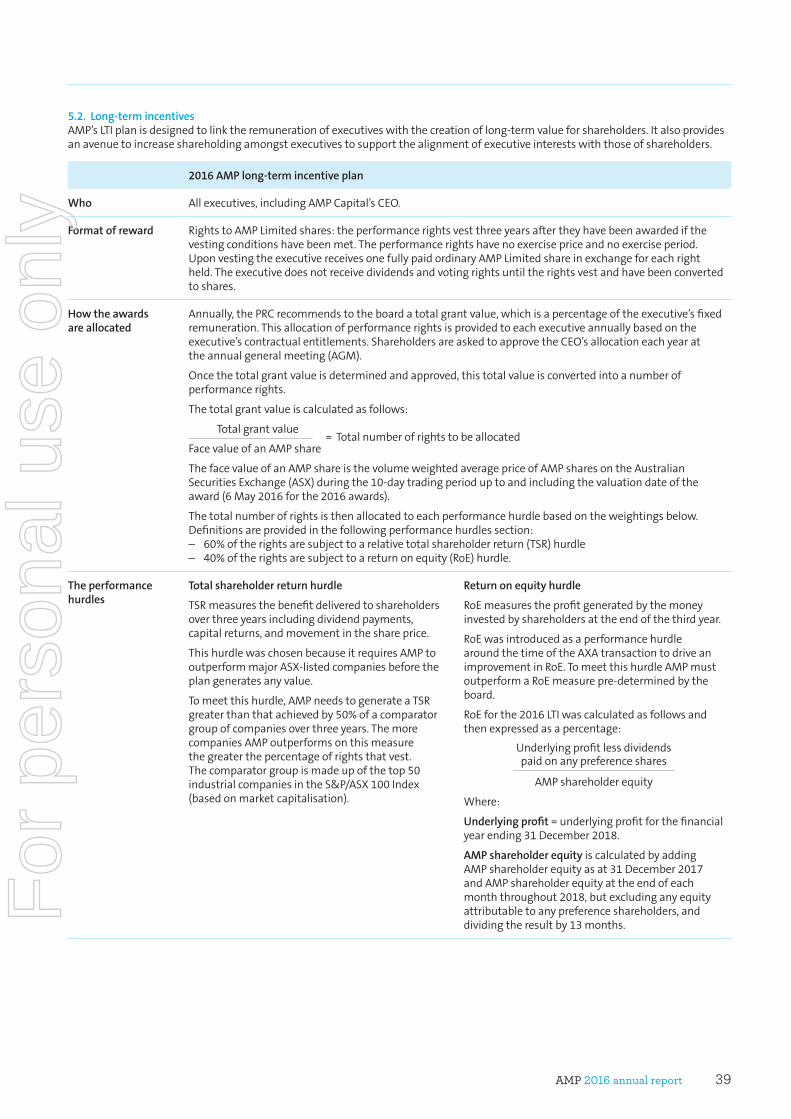
AMP 2016 annual report 39
5.2. Long-term incentivesAMP’sLTIplanisdesignedtolinktheremunerationofexecutiveswiththecreationoflong-termvalueforshareholders.Italsoprovidesanavenuetoincreaseshareholdingamongstexecutivestosupportthealignmentofexecutiveinterestswiththoseofshareholders.
2016 AMP long-term incentive plan
Who Allexecutives,includingAMPCapital’sCEO.
Format of reward RightstoAMPLimitedshares:theperformancerightsvestthreeyearsaftertheyhavebeenawardedifthevestingconditionshavebeenmet.Theperformancerightshavenoexercisepriceandnoexerciseperiod.UponvestingtheexecutivereceivesonefullypaidordinaryAMPLimitedshareinexchangeforeachrightheld.Theexecutivedoesnotreceivedividendsandvotingrightsuntiltherightsvestandhavebeenconvertedtoshares.
How the awards are allocated
Annually,thePRCrecommendstotheboardatotalgrantvalue,whichisapercentageoftheexecutive’sfixedremuneration.Thisallocationofperformancerightsisprovidedtoeachexecutiveannuallybasedontheexecutive’scontractualentitlements.ShareholdersareaskedtoapprovetheCEO’sallocationeachyearattheannualgeneralmeeting(AGM).
Oncethetotalgrantvalueisdeterminedandapproved,thistotalvalueisconvertedintoanumberofperformancerights.
Thetotalgrantvalueiscalculatedasfollows:
Totalgrantvalue=Totalnumberofrightstobeallocated
FacevalueofanAMPshare
ThefacevalueofanAMPshareisthevolumeweightedaveragepriceofAMPsharesontheAustralianSecuritiesExchange(ASX)duringthe10-daytradingperioduptoandincludingthevaluationdateoftheaward(6May2016forthe2016awards).
Thetotalnumberofrightsisthenallocatedtoeachperformancehurdlebasedontheweightingsbelow.Definitionsareprovidedinthefollowingperformancehurdlessection:– 60%oftherightsaresubjecttoarelativetotalshareholderreturn(TSR)hurdle– 40%oftherightsaresubjecttoareturnonequity(RoE)hurdle.
The performance hurdles
Total shareholder return hurdle
TSRmeasuresthebenefitdeliveredtoshareholdersoverthreeyearsincludingdividendpayments,capitalreturns,andmovementintheshareprice.
ThishurdlewaschosenbecauseitrequiresAMPtooutperformmajorASX-listedcompaniesbeforetheplangeneratesanyvalue.
Tomeetthishurdle,AMPneedstogenerateaTSRgreaterthanthatachievedby50%ofacomparatorgroupofcompaniesoverthreeyears.ThemorecompaniesAMPoutperformsonthismeasurethegreaterthepercentageofrightsthatvest.Thecomparatorgroupismadeupofthetop50industrialcompaniesintheS&P/ASX100Index(basedonmarketcapitalisation).
Return on equity hurdle
RoEmeasurestheprofitgeneratedbythemoneyinvestedbyshareholdersattheendofthethirdyear.
RoEwasintroducedasaperformancehurdlearoundthetimeoftheAXAtransactiontodriveanimprovementinRoE.TomeetthishurdleAMPmustoutperformaRoEmeasurepre-determinedbytheboard.
RoEforthe2016LTIwascalculatedasfollowsandthenexpressedasapercentage:
Underlyingprofitlessdividendspaidonanypreferenceshares
AMPshareholderequity
Where:
Underlying profit=underlyingprofitforthefinancialyearending31December2018.
AMP shareholder equityiscalculatedbyaddingAMPshareholderequityasat31December2017andAMPshareholderequityattheendofeachmonththroughout2018,butexcludinganyequityattributabletoanypreferenceshareholders,anddividingtheresultby13months.F
or p
erso
nal u
se o
nly
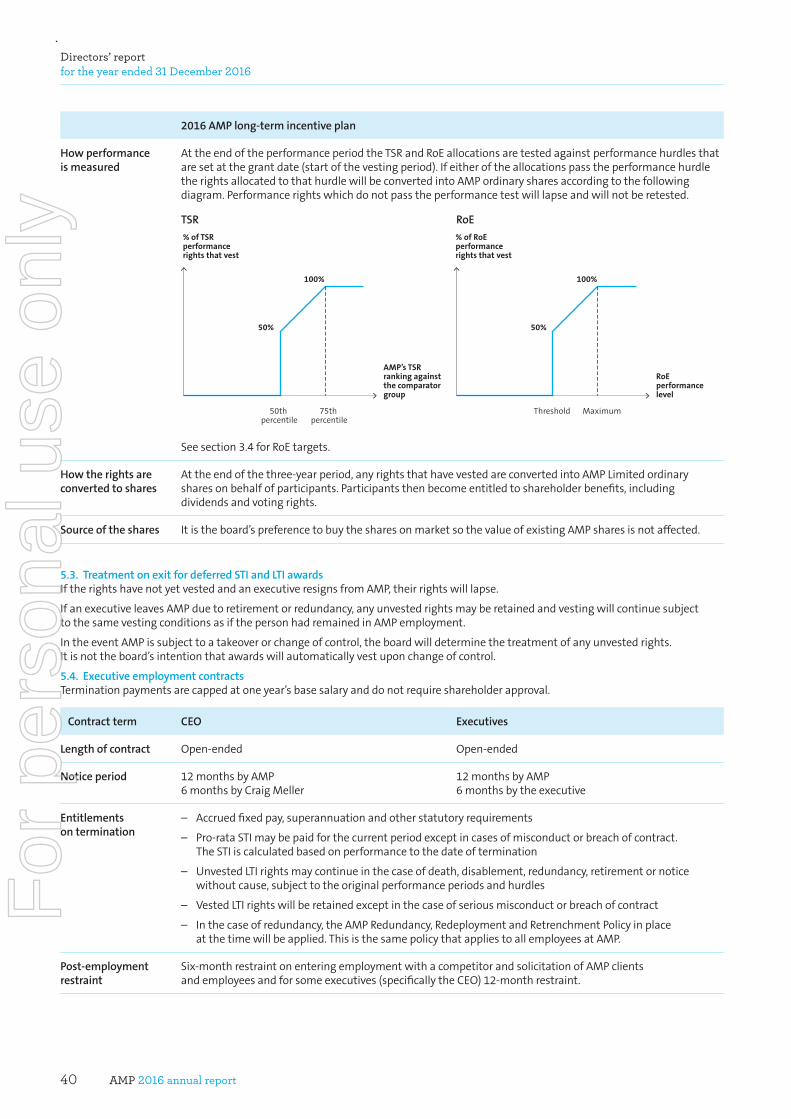
AMP 2016 annual report40
Directors’ report for the year ended 31 December 2016
2016 AMP long-term incentive plan
How performance is measured
AttheendoftheperformanceperiodtheTSRandRoEallocationsaretestedagainstperformancehurdlesthataresetatthegrantdate(startofthevestingperiod).IfeitheroftheallocationspasstheperformancehurdletherightsallocatedtothathurdlewillbeconvertedintoAMPordinarysharesaccordingtothefollowingdiagram.Performancerightswhichdonotpasstheperformancetestwilllapseandwillnotberetested.
TSR RoE% of TSR performance rights that vest
AMP’s TSR ranking against the comparator group
50th percentile
50%
100%
75th percentile
% of RoE performance rights that vest
RoE performance level
Threshold
50%
100%
Maximum
Seesection3.4forRoEtargets.
How the rights are converted to shares
Attheendofthethree-yearperiod,anyrightsthathavevestedareconvertedintoAMPLimitedordinarysharesonbehalfofparticipants.Participantsthenbecomeentitledtoshareholderbenefits,includingdividendsandvotingrights.
Source of the shares Itistheboard’spreferencetobuythesharesonmarketsothevalueofexistingAMPsharesisnotaffected.
5.3. Treatment on exit for deferred STI and LTI awardsIftherightshavenotyetvestedandanexecutiveresignsfromAMP,theirrightswilllapse.
IfanexecutiveleavesAMPduetoretirementorredundancy,anyunvestedrightsmayberetainedandvestingwillcontinuesubjecttothesamevestingconditionsasifthepersonhadremainedinAMPemployment.
IntheeventAMPissubjecttoatakeoverorchangeofcontrol,theboardwilldeterminethetreatmentofanyunvestedrights.Itisnottheboard’sintentionthatawardswillautomaticallyvestuponchangeofcontrol.
5.4. Executive employment contractsTerminationpaymentsarecappedatoneyear’sbasesalaryanddonotrequireshareholderapproval.
Contract term CEO Executives
Length of contract Open-ended Open-ended
Notice period 12monthsbyAMP6monthsbyCraigMeller
12monthsbyAMP6monthsbytheexecutive
Entitlements on termination
– Accruedfixedpay,superannuationandotherstatutoryrequirements
– Pro-rataSTImaybepaidforthecurrentperiodexceptincasesofmisconductorbreachofcontract.TheSTIiscalculatedbasedonperformancetothedateoftermination
– UnvestedLTIrightsmaycontinueinthecaseofdeath,disablement,redundancy,retirementornoticewithoutcause,subjecttotheoriginalperformanceperiodsandhurdles
– VestedLTIrightswillberetainedexceptinthecaseofseriousmisconductorbreachofcontract
– Inthecaseofredundancy,theAMPRedundancy,RedeploymentandRetrenchmentPolicyinplaceatthetimewillbeapplied.ThisisthesamepolicythatappliestoallemployeesatAMP.
Post-employment restraint
Six-monthrestraintonenteringemploymentwithacompetitorandsolicitationofAMPclientsandemployeesandforsomeexecutives(specificallytheCEO)12-monthrestraint.
For
per
sona
l use
onl
y
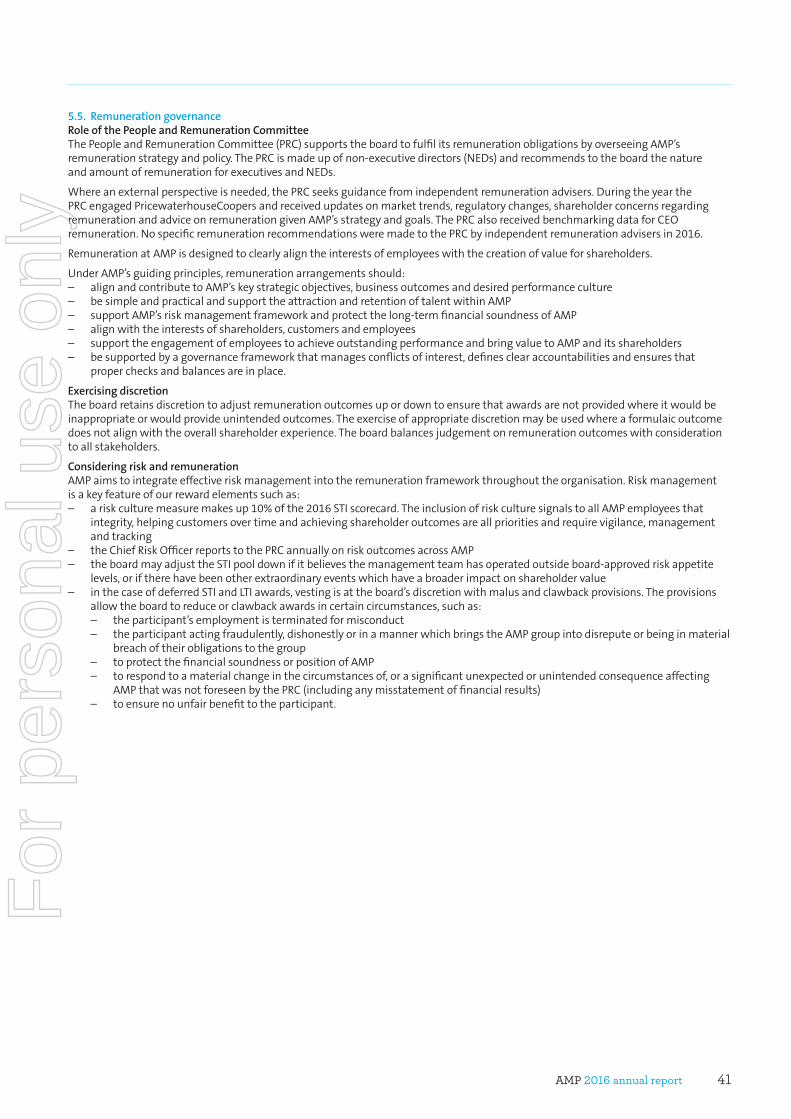
AMP 2016 annual report 41
5.5. Remuneration governanceRole of the People and Remuneration CommitteeThePeopleandRemunerationCommittee(PRC)supportstheboardtofulfilitsremunerationobligationsbyoverseeingAMP’sremunerationstrategyandpolicy.ThePRCismadeupofnon-executivedirectors(NEDs)andrecommendstotheboardthenatureandamountofremunerationforexecutivesandNEDs.
Whereanexternalperspectiveisneeded,thePRCseeksguidancefromindependentremunerationadvisers.DuringtheyearthePRCengagedPricewaterhouseCoopersandreceivedupdatesonmarkettrends,regulatorychanges,shareholderconcernsregardingremunerationandadviceonremunerationgivenAMP’sstrategyandgoals.ThePRCalsoreceivedbenchmarkingdataforCEOremuneration.NospecificremunerationrecommendationsweremadetothePRCbyindependentremunerationadvisersin2016.
RemunerationatAMPisdesignedtoclearlyaligntheinterestsofemployeeswiththecreationofvalueforshareholders.
UnderAMP’sguidingprinciples,remunerationarrangementsshould:– alignandcontributetoAMP’skeystrategicobjectives,businessoutcomesanddesiredperformanceculture– besimpleandpracticalandsupporttheattractionandretentionoftalentwithinAMP– supportAMP’sriskmanagementframeworkandprotectthelong-termfinancialsoundnessofAMP– alignwiththeinterestsofshareholders,customersandemployees– supporttheengagementofemployeestoachieveoutstandingperformanceandbringvaluetoAMPanditsshareholders– besupportedbyagovernanceframeworkthatmanagesconflictsofinterest,definesclearaccountabilitiesandensuresthat
properchecksandbalancesareinplace.
Exercising discretionTheboardretainsdiscretiontoadjustremunerationoutcomesupordowntoensurethatawardsarenotprovidedwhereitwouldbeinappropriateorwouldprovideunintendedoutcomes.Theexerciseofappropriatediscretionmaybeusedwhereaformulaicoutcomedoesnotalignwiththeoverallshareholderexperience.Theboardbalancesjudgementonremunerationoutcomeswithconsiderationtoallstakeholders.
Considering risk and remunerationAMPaimstointegrateeffectiveriskmanagementintotheremunerationframeworkthroughouttheorganisation.Riskmanagementisakeyfeatureofourrewardelementssuchas:– ariskculturemeasuremakesup10%ofthe2016STIscorecard.TheinclusionofriskculturesignalstoallAMPemployeesthat
integrity,helpingcustomersovertimeandachievingshareholderoutcomesareallprioritiesandrequirevigilance,managementandtracking
– theChiefRiskOfficerreportstothePRCannuallyonriskoutcomesacrossAMP– theboardmayadjusttheSTIpooldownifitbelievesthemanagementteamhasoperatedoutsideboard-approvedriskappetite
levels,oriftherehavebeenotherextraordinaryeventswhichhaveabroaderimpactonshareholdervalue– inthecaseofdeferredSTIandLTIawards,vestingisattheboard’sdiscretionwithmalusandclawbackprovisions.Theprovisions
allowtheboardtoreduceorclawbackawardsincertaincircumstances,suchas: – theparticipant’semploymentisterminatedformisconduct – theparticipantactingfraudulently,dishonestlyorinamannerwhichbringstheAMPgroupintodisreputeorbeinginmaterial
breachoftheirobligationstothegroup – toprotectthefinancialsoundnessorpositionofAMP – torespondtoamaterialchangeinthecircumstancesof,orasignificantunexpectedorunintendedconsequenceaffecting
AMPthatwasnotforeseenbythePRC(includinganymisstatementoffinancialresults) – toensurenounfairbenefittotheparticipant.
For
per
sona
l use
onl
y
AMP 2016 annual report42
Directors’ report for the year ended 31 December 2016
6. Non-executive director remuneration AMP’s NED remuneration is designed to attract and retain high-calibre board members who are appropriately paid for their time and effort.
AMP’sremunerationisstructuredtoensurethatAMPisabletoattractandretainNEDswiththeskills,experienceandqualificationsnecessarytooverseeagroupascomplexandhighlyregulatedasAMPandtoremuneratethemappropriatelyfortheirtime,effortandexpertise.
NEDremunerationconsistsoffourcomponents:– AMPLimitedBoardbasefee– AMPLimitedcommitteefees– AMPsubsidiaryboardandcommitteefees– superannuation.
NEDsreceivefixedremunerationforcompletingtheirdutiesanddonotreceiveanyremunerationlinkedtotheirorAMP’sperformance.Thissupportstheindependenceandimpartialityoftheirrolesinmakingdecisionsaboutthefuturedirectionofthecompany.
Asdetailedinsection6.1.2below,akeyfeatureofAMP’sconglomerate-basedgovernancemodelistheappointmentoftwoormoreAMPLimitedNEDstotheboardofeachofAMP’skeysubsidiaries.Theboardconsidersthisenhancesitsoperationandtheoperationoftheboardsofthosesubsidiaries.ThesubsidiaryboardsareAMPLifeLimited,TheNationalMutualLifeAssociationofAustralasiaLimited,AMPBankLimitedandAMPCapitalHoldingsLimited(AMPCHL).ThefirstthreeboardsareAPRAregulated.TheAMPCHLboardalsohasasanon-executivedirectorarepresentativeofTheMitsubishiTrustandBankingCorporation.Theboardsofthosesubsidiariesoperateasfullyfunctioningindependentboards–withsignificantregulatoryandoversightresponsibilitiesforthebusinessesofthosesubsidiaries–and,accordingly,theAMPLimitedNEDsappointedtothoseboardsandtheircommitteesreceivethesamefeesasotherNEDsappointedtothem.
ToaligntheinterestsofNEDswiththelong-terminterestsofshareholders,allNEDsarerequiredtoholdaminimumnumberofAMPshares,asoutlinedinsection6.3.
NEDfeelevelsforAMPLimitedanditskeysubsidiariesdidnotincreasein2016.However,aspartofaprogramtosimplifyNEDfeestructuresandincreasetransparency,somechangeshavebeenapproved:– from1April2016,the$6,000annualexpenseallowancepaidtoAMPLimitedNEDs(otherthanthechairman)wasconsolidated
intotheAMPLimitedNEDbasefee– from1January2017,thesuperannuationentitlementsofAMPLimitedandkeysubsidiaryNEDswillbeconsolidatedintotheir
boardandcommitteefees.
ThesechangeswillnotresultinanychangetothetotalremunerationreceivedbytheNEDs.
6.1. Non-executive director fees ThePRCisresponsibleforreviewingNEDfeesforAMPLimitedanditskeysubsidiaries.
Inreviewingthesefeesthecommitteehasregardtoarangeoffactors,including:– feespaidtoboardmembersofotherAustraliancorporationsofasimilarsizeandcomplexity– thecomplexityofAMP’soperationsandthoseofitskeysubsidiaries– theneeds,responsibilitiesandworkloadrequirementsofeachboardandcommittee.
ThePRCcommissionsmarketdataanalysisandmatchingservicesfromexternalremunerationadviserswhereitconsidersnecessary.
Non-executivedirectorfeesarerecommendedbythePRCtotheAMPLimitedBoardforapproval.
TheaggregateannualremunerationreceivedbyAMPLimitedNEDsmustnotexceedthemaximumaggregatefeepoolapprovedbyshareholdersfromtimetotime.Themaximumaggregatefeepooliscurrently$4,620,000,whichwasapprovedbyshareholdersatthe2015AGM.TheaggregateannualremunerationpaidtoAMPLimitedNEDsforallservicesperformedasdirectorsandmembersofboardcommitteesofAMPanditssubsidiariesmustnotexceedthisamount.
During2016,thetotalremunerationpaidtoAMPLimitedNEDswas$3,206,217being69%oftheshareholder-approvedfeepool.
NEDsdonotreceiveperformancerightsorsharerightsaspartoftheirremuneration.NoretirementbenefitsarepaidtoNEDs.
For
per
sona
l use
onl
y
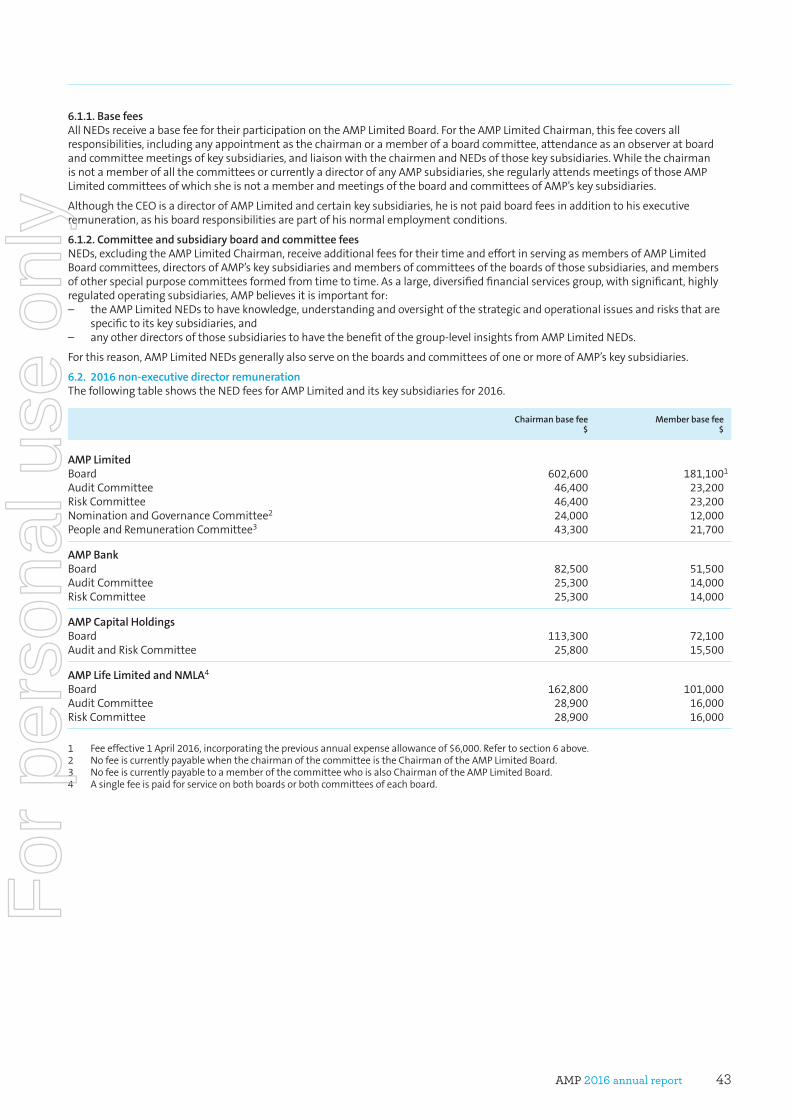
AMP 2016 annual report 43
6.1.1. Base feesAllNEDsreceiveabasefeefortheirparticipationontheAMPLimitedBoard.FortheAMPLimitedChairman,thisfeecoversallresponsibilities,includinganyappointmentasthechairmanoramemberofaboardcommittee,attendanceasanobserveratboardandcommitteemeetingsofkeysubsidiaries,andliaisonwiththechairmenandNEDsofthosekeysubsidiaries.WhilethechairmanisnotamemberofallthecommitteesorcurrentlyadirectorofanyAMPsubsidiaries,sheregularlyattendsmeetingsofthoseAMPLimitedcommitteesofwhichsheisnotamemberandmeetingsoftheboardandcommitteesofAMP’skeysubsidiaries.
AlthoughtheCEOisadirectorofAMPLimitedandcertainkeysubsidiaries,heisnotpaidboardfeesinadditiontohisexecutiveremuneration,ashisboardresponsibilitiesarepartofhisnormalemploymentconditions.
6.1.2. Committee and subsidiary board and committee fees NEDs,excludingtheAMPLimitedChairman,receiveadditionalfeesfortheirtimeandeffortinservingasmembersofAMPLimitedBoardcommittees,directorsofAMP’skeysubsidiariesandmembersofcommitteesoftheboardsofthosesubsidiaries,andmembersofotherspecialpurposecommitteesformedfromtimetotime.Asalarge,diversifiedfinancialservicesgroup,withsignificant,highlyregulatedoperatingsubsidiaries,AMPbelievesitisimportantfor:– theAMPLimitedNEDstohaveknowledge,understandingandoversightofthestrategicandoperationalissuesandrisksthatare
specifictoitskeysubsidiaries,and– anyotherdirectorsofthosesubsidiariestohavethebenefitofthegroup-levelinsightsfromAMPLimitedNEDs.
Forthisreason,AMPLimitedNEDsgenerallyalsoserveontheboardsandcommitteesofoneormoreofAMP’skeysubsidiaries.
6.2. 2016 non-executive director remunerationThefollowingtableshowstheNEDfeesforAMPLimitedanditskeysubsidiariesfor2016.
Chairman base fee $
Member base fee $
AMP Limited Board 602,600 181,1001
AuditCommittee 46,400 23,200RiskCommittee 46,400 23,200NominationandGovernanceCommittee2 24,000 12,000PeopleandRemunerationCommittee3 43,300 21,700
AMP Bank Board 82,500 51,500AuditCommittee 25,300 14,000RiskCommittee 25,300 14,000
AMP Capital Holdings Board 113,300 72,100AuditandRiskCommittee 25,800 15,500
AMP Life Limited and NMLA4 Board 162,800 101,000AuditCommittee 28,900 16,000RiskCommittee 28,900 16,000
1 Feeeffective1April2016,incorporatingthepreviousannualexpenseallowanceof$6,000.Refertosection6above.2 NofeeiscurrentlypayablewhenthechairmanofthecommitteeistheChairmanoftheAMPLimitedBoard.3 NofeeiscurrentlypayabletoamemberofthecommitteewhoisalsoChairmanoftheAMPLimitedBoard.4 Asinglefeeispaidforserviceonbothboardsorbothcommitteesofeachboard.
For
per
sona
l use
onl
y
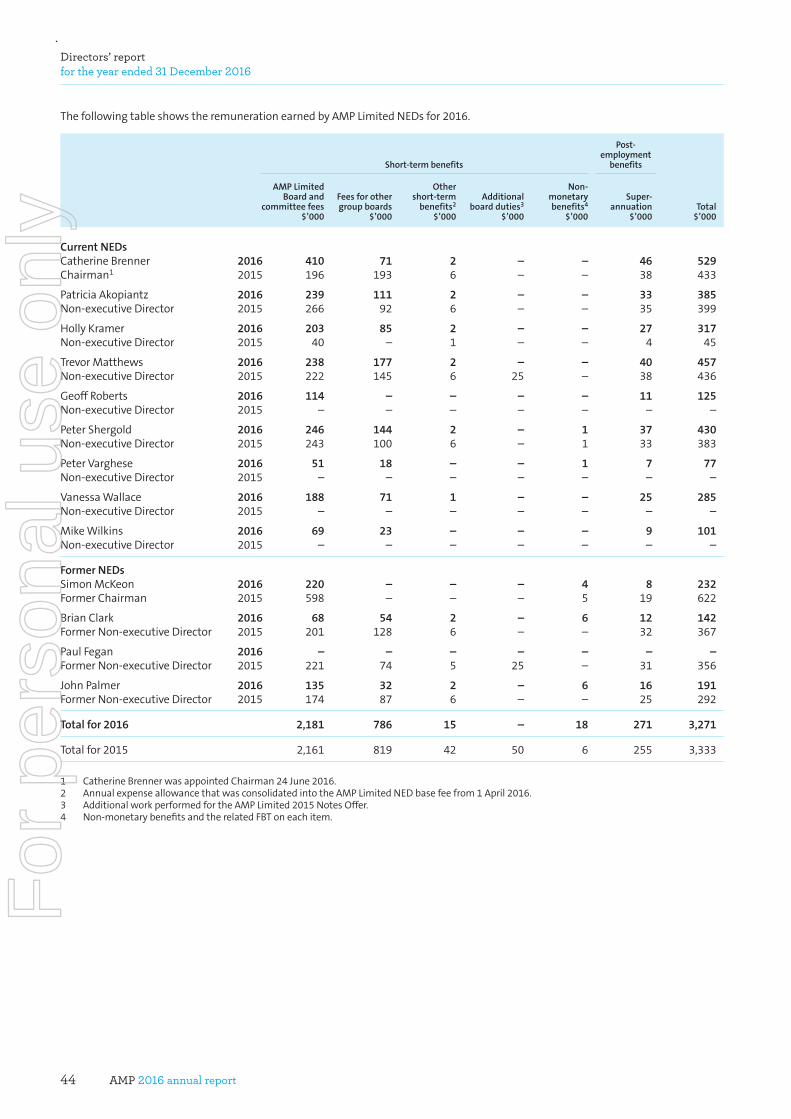
AMP 2016 annual report44
Directors’ report for the year ended 31 December 2016
ThefollowingtableshowstheremunerationearnedbyAMPLimitedNEDsfor2016.
Short-term benefits
Post-employment
benefits
AMP Limited Board and
committee fees$’000
Fees for other group boards
$’000
Other short-term
benefits2
$’000
Additional board duties3
$’000
Non-monetary benefits4
$’000
Super- annuation
$’000Total
$’000
Current NEDs CatherineBrenner 2016 410 71 2 – – 46 529Chairman1 2015 196 193 6 – – 38 433
PatriciaAkopiantz 2016 239 111 2 – – 33 385Non-executiveDirector 2015 266 92 6 – – 35 399
HollyKramer 2016 203 85 2 – – 27 317 Non-executiveDirector 2015 40 – 1 – – 4 45
TrevorMatthews 2016 238 177 2 – – 40 457 Non-executiveDirector 2015 222 145 6 25 – 38 436
GeoffRoberts 2016 114 – – – – 11 125 Non-executiveDirector 2015 – – – – – – –
PeterShergold 2016 246 144 2 – 1 37 430 Non-executiveDirector 2015 243 100 6 – 1 33 383
PeterVarghese 2016 51 18 – – 1 7 77 Non-executiveDirector 2015 – – – – – – –
VanessaWallace 2016 188 71 1 – – 25 285 Non-executiveDirector 2015 – – – – – – –
MikeWilkins 2016 69 23 – – – 9 101 Non-executiveDirector 2015 – – – – – – –
Former NEDs SimonMcKeon 2016 220 – – – 4 8 232 FormerChairman 2015 598 – – – 5 19 622
BrianClark 2016 68 54 2 – 6 12 142 FormerNon-executiveDirector 2015 201 128 6 – – 32 367
PaulFegan 2016 – – – – – – – FormerNon-executiveDirector 2015 221 74 5 25 – 31 356
JohnPalmer 2016 135 32 2 – 6 16 191 FormerNon-executiveDirector 2015 174 87 6 – – 25 292
Total for 2016 2,181 786 15 – 18 271 3,271
Totalfor2015 2,161 819 42 50 6 255 3,333
1 CatherineBrennerwasappointedChairman24June2016.2 AnnualexpenseallowancethatwasconsolidatedintotheAMPLimitedNEDbasefeefrom1April2016.3 AdditionalworkperformedfortheAMPLimited2015NotesOffer.4 Non-monetarybenefitsandtherelatedFBToneachitem.
For
per
sona
l use
onl
y
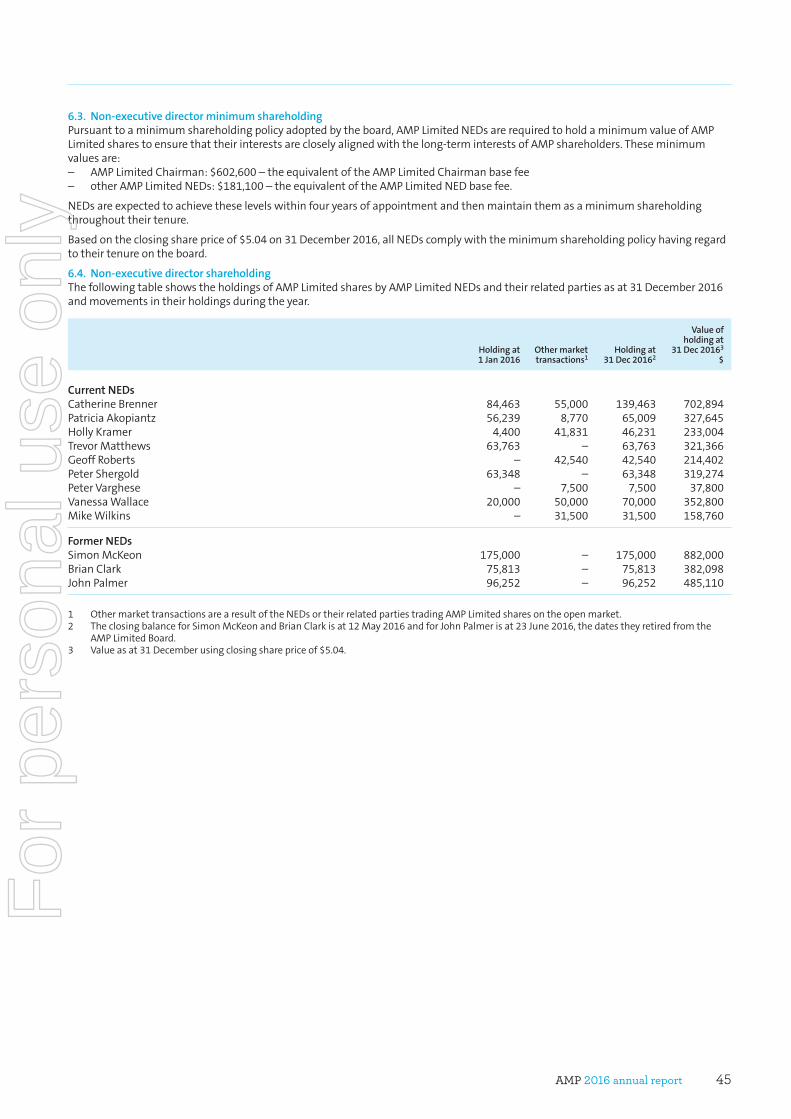
AMP 2016 annual report 45
6.3. Non-executive director minimum shareholdingPursuanttoaminimumshareholdingpolicyadoptedbytheboard,AMPLimitedNEDsarerequiredtoholdaminimumvalueofAMPLimitedsharestoensurethattheirinterestsarecloselyalignedwiththelong-terminterestsofAMPshareholders.Theseminimumvaluesare:– AMPLimitedChairman:$602,600–theequivalentoftheAMPLimitedChairmanbasefee– otherAMPLimitedNEDs:$181,100–theequivalentoftheAMPLimitedNEDbasefee.
NEDsareexpectedtoachievetheselevelswithinfouryearsofappointmentandthenmaintainthemasaminimumshareholdingthroughouttheirtenure.
Basedontheclosingsharepriceof$5.04on31December2016,allNEDscomplywiththeminimumshareholdingpolicyhavingregardtotheirtenureontheboard.
6.4. Non-executive director shareholdingThefollowingtableshowstheholdingsofAMPLimitedsharesbyAMPLimitedNEDsandtheirrelatedpartiesasat31December2016andmovementsintheirholdingsduringtheyear.
Holding at 1 Jan 2016
Other market transactions1
Holding at 31 Dec 20162
Value of holding at
31 Dec 20163
$
Current NEDs CatherineBrenner 84,463 55,000 139,463 702,894PatriciaAkopiantz 56,239 8,770 65,009 327,645HollyKramer 4,400 41,831 46,231 233,004TrevorMatthews 63,763 – 63,763 321,366GeoffRoberts – 42,540 42,540 214,402PeterShergold 63,348 – 63,348 319,274PeterVarghese – 7,500 7,500 37,800VanessaWallace 20,000 50,000 70,000 352,800MikeWilkins – 31,500 31,500 158,760
Former NEDs SimonMcKeon 175,000 – 175,000 882,000BrianClark 75,813 – 75,813 382,098JohnPalmer 96,252 – 96,252 485,110
1 OthermarkettransactionsarearesultoftheNEDsortheirrelatedpartiestradingAMPLimitedsharesontheopenmarket.2 TheclosingbalanceforSimonMcKeonandBrianClarkisat12May2016andforJohnPalmerisat23June2016,thedatestheyretiredfromthe
AMPLimitedBoard.3 Valueasat31Decemberusingclosingsharepriceof$5.04.
For
per
sona
l use
onl
y
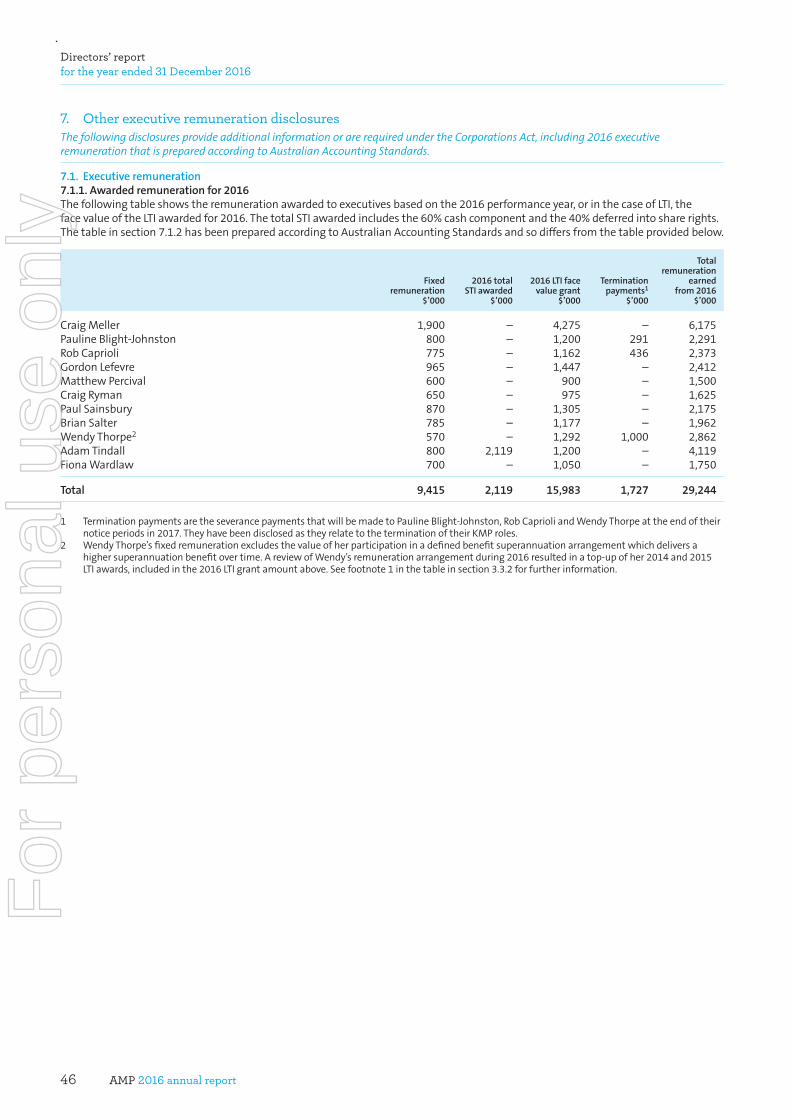
AMP 2016 annual report46
Directors’ report for the year ended 31 December 2016
7. Other executive remuneration disclosuresThe following disclosures provide additional information or are required under the Corporations Act, including 2016 executive remuneration that is prepared according to Australian Accounting Standards.
7.1. Executive remuneration7.1.1. Awarded remuneration for 2016Thefollowingtableshowstheremunerationawardedtoexecutivesbasedonthe2016performanceyear,orinthecaseofLTI,thefacevalueoftheLTIawardedfor2016.ThetotalSTIawardedincludesthe60%cashcomponentandthe40%deferredintosharerights.Thetableinsection7.1.2hasbeenpreparedaccordingtoAustralianAccountingStandardsandsodiffersfromthetableprovidedbelow.
Fixed remuneration
$’000
2016 total STI awarded
$’000
2016 LTI face value grant
$’000
Termination payments1
$’000
Total remuneration
earned from 2016
$’000
CraigMeller 1,900 – 4,275 – 6,175PaulineBlight-Johnston 800 – 1,200 291 2,291RobCaprioli 775 – 1,162 436 2,373GordonLefevre 965 – 1,447 – 2,412MatthewPercival 600 – 900 – 1,500CraigRyman 650 – 975 – 1,625PaulSainsbury 870 – 1,305 – 2,175BrianSalter 785 – 1,177 – 1,962WendyThorpe2 570 – 1,292 1,000 2,862AdamTindall 800 2,119 1,200 – 4,119FionaWardlaw 700 – 1,050 – 1,750
Total 9,415 2,119 15,983 1,727 29,244
1 TerminationpaymentsaretheseverancepaymentsthatwillbemadetoPaulineBlight-Johnston,RobCaprioliandWendyThorpeattheendoftheirnoticeperiodsin2017.TheyhavebeendisclosedastheyrelatetotheterminationoftheirKMProles.
2 WendyThorpe’sfixedremunerationexcludesthevalueofherparticipationinadefinedbenefitsuperannuationarrangementwhichdeliversahighersuperannuationbenefitovertime.AreviewofWendy’sremunerationarrangementduring2016resultedinatop-upofher2014and2015LTIawards,includedinthe2016LTIgrantamountabove.Seefootnote1inthetableinsection3.3.2forfurtherinformation.
For
per
sona
l use
onl
y
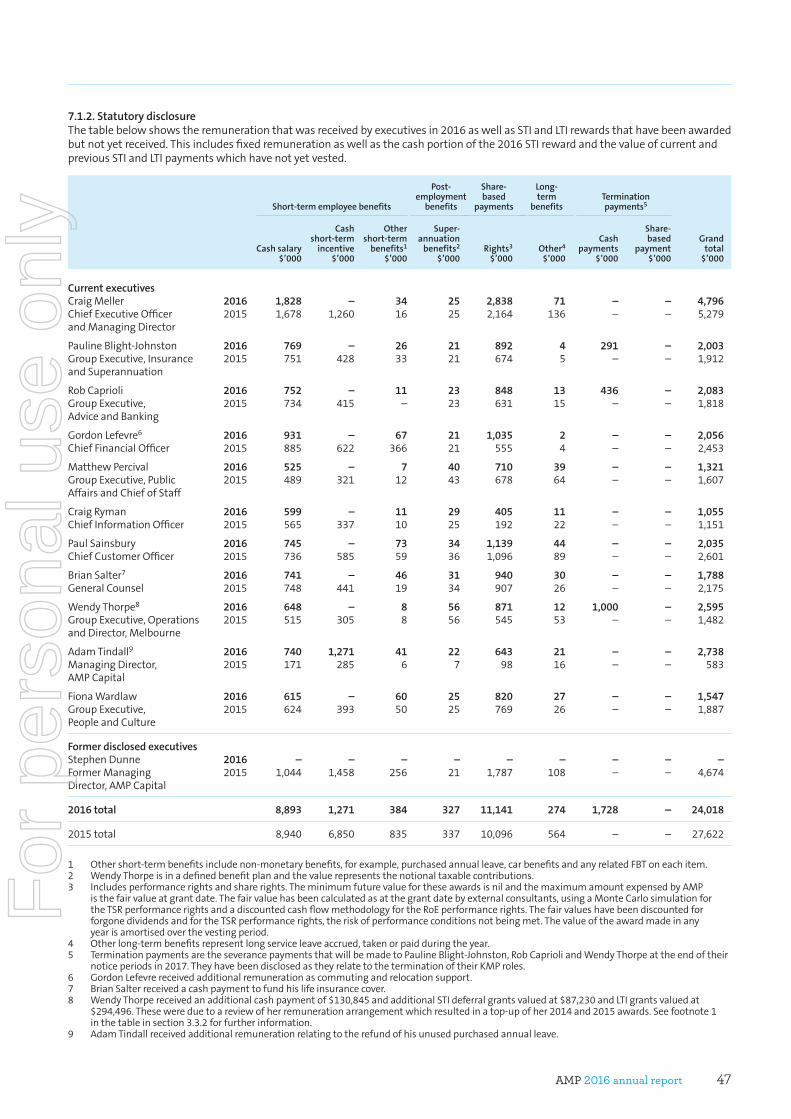
AMP 2016 annual report 47
7.1.2. Statutory disclosureThetablebelowshowstheremunerationthatwasreceivedbyexecutivesin2016aswellasSTIandLTIrewardsthathavebeenawardedbutnotyetreceived.Thisincludesfixedremunerationaswellasthecashportionofthe2016STIrewardandthevalueofcurrentandpreviousSTIandLTIpaymentswhichhavenotyetvested.
Short-term employee benefits
Post-employment
benefits
Share- based
payments
Long-term
benefitsTermination payments5
Cash salary$’000
Cash short-term
incentive$’000
Other short-term
benefits1
$’000
Super- annuation
benefits2
$’000Rights3
$’000Other4
$’000
Cash payments
$’000
Share-based
payment$’000
Grand total
$’000
Current executives CraigMeller 2016 1,828 – 34 25 2,838 71 – – 4,796 ChiefExecutiveOfficer 2015 1,678 1,260 16 25 2,164 136 – – 5,279andManagingDirector
PaulineBlight-Johnston 2016 769 – 26 21 892 4 291 – 2,003 GroupExecutive,Insurance 2015 751 428 33 21 674 5 – – 1,912andSuperannuation
RobCaprioli 2016 752 – 11 23 848 13 436 – 2,083 GroupExecutive, 2015 734 415 – 23 631 15 – – 1,818AdviceandBanking
GordonLefevre6 2016 931 – 67 21 1,035 2 – – 2,056 ChiefFinancialOfficer 2015 885 622 366 21 555 4 – – 2,453
MatthewPercival 2016 525 – 7 40 710 39 – – 1,321 GroupExecutive,Public 2015 489 321 12 43 678 64 – – 1,607AffairsandChiefofStaff
CraigRyman 2016 599 – 11 29 405 11 – – 1,055 ChiefInformationOfficer 2015 565 337 10 25 192 22 – – 1,151
PaulSainsbury 2016 745 – 73 34 1,139 44 – – 2,035 ChiefCustomerOfficer 2015 736 585 59 36 1,096 89 – – 2,601
BrianSalter7 2016 741 – 46 31 940 30 – – 1,788 GeneralCounsel 2015 748 441 19 34 907 26 – – 2,175
WendyThorpe8 2016 648 – 8 56 871 12 1,000 – 2,595 GroupExecutive,Operations 2015 515 305 8 56 545 53 – – 1,482andDirector,Melbourne
AdamTindall9 2016 740 1,271 41 22 643 21 – – 2,738 ManagingDirector, 2015 171 285 6 7 98 16 – – 583AMPCapital
FionaWardlaw 2016 615 – 60 25 820 27 – – 1,547 GroupExecutive, 2015 624 393 50 25 769 26 – – 1,887PeopleandCulture
Former disclosed executives StephenDunne 2016 – – – – – – – – – FormerManaging 2015 1,044 1,458 256 21 1,787 108 – – 4,674Director,AMPCapital
2016 total 8,893 1,271 384 327 11,141 274 1,728 – 24,018
2015total 8,940 6,850 835 337 10,096 564 – – 27,622
1 Othershort-termbenefitsincludenon-monetarybenefits,forexample,purchasedannualleave,carbenefitsandanyrelatedFBToneachitem.2 WendyThorpeisinadefinedbenefitplanandthevaluerepresentsthenotionaltaxablecontributions.3 Includesperformancerightsandsharerights.TheminimumfuturevaluefortheseawardsisnilandthemaximumamountexpensedbyAMP
isthefairvalueatgrantdate.Thefairvaluehasbeencalculatedasatthegrantdatebyexternalconsultants,usingaMonteCarlosimulationfortheTSRperformancerightsandadiscountedcashflowmethodologyfortheRoEperformancerights.ThefairvalueshavebeendiscountedforforgonedividendsandfortheTSRperformancerights,theriskofperformanceconditionsnotbeingmet.Thevalueoftheawardmadeinanyyearisamortisedoverthevestingperiod.
4 Otherlong-termbenefitsrepresentlongserviceleaveaccrued,takenorpaidduringtheyear.5 TerminationpaymentsaretheseverancepaymentsthatwillbemadetoPaulineBlight-Johnston,RobCaprioliandWendyThorpeattheendoftheir
noticeperiodsin2017.TheyhavebeendisclosedastheyrelatetotheterminationoftheirKMProles.6 GordonLefevrereceivedadditionalremunerationascommutingandrelocationsupport.7 BrianSalterreceivedacashpaymenttofundhislifeinsurancecover.8 WendyThorpereceivedanadditionalcashpaymentof$130,845andadditionalSTIdeferralgrantsvaluedat$87,230andLTIgrantsvaluedat
$294,496.Thesewereduetoareviewofherremunerationarrangementwhichresultedinatop-upofher2014and2015awards.Seefootnote1inthetableinsection3.3.2forfurtherinformation.
9 AdamTindallreceivedadditionalremunerationrelatingtotherefundofhisunusedpurchasedannualleave.
For
per
sona
l use
onl
y
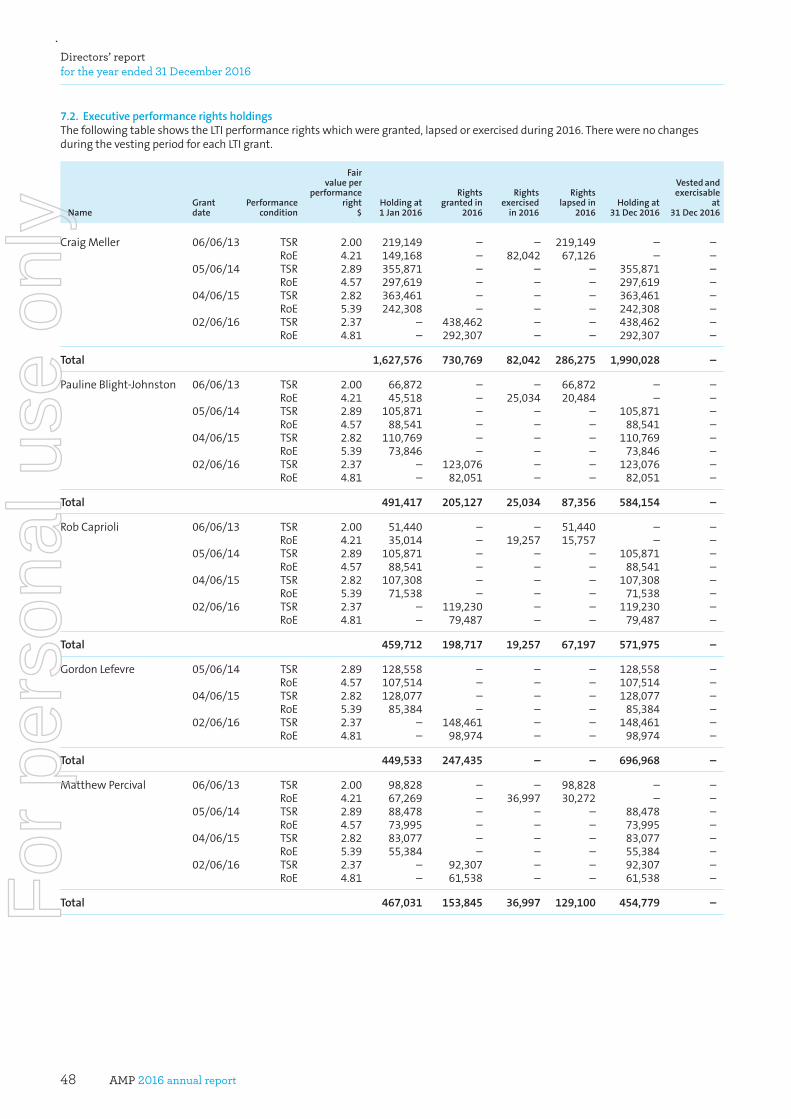
AMP 2016 annual report48
Directors’ report for the year ended 31 December 2016
7.2. Executive performance rights holdingsThefollowingtableshowstheLTIperformancerightswhichweregranted,lapsedorexercisedduring2016.TherewerenochangesduringthevestingperiodforeachLTIgrant.
NameGrant date
Performance condition
Fair value per
performance right
$Holding at 1 Jan 2016
Rights granted in
2016
Rights exercised
in 2016
Rights lapsed in
2016Holding at
31 Dec 2016
Vested and exercisable
at 31 Dec 2016
CraigMeller 06/06/13 TSR 2.00 219,149 – – 219,149 – – RoE 4.21 149,168 – 82,042 67,126 – – 05/06/14 TSR 2.89 355,871 – – – 355,871 – RoE 4.57 297,619 – – – 297,619 – 04/06/15 TSR 2.82 363,461 – – – 363,461 – RoE 5.39 242,308 – – – 242,308 – 02/06/16 TSR 2.37 – 438,462 – – 438,462 – RoE 4.81 – 292,307 – – 292,307 –
Total 1,627,576 730,769 82,042 286,275 1,990,028 –
PaulineBlight-Johnston 06/06/13 TSR 2.00 66,872 – – 66,872 – – RoE 4.21 45,518 – 25,034 20,484 – – 05/06/14 TSR 2.89 105,871 – – – 105,871 – RoE 4.57 88,541 – – – 88,541 – 04/06/15 TSR 2.82 110,769 – – – 110,769 – RoE 5.39 73,846 – – – 73,846 – 02/06/16 TSR 2.37 – 123,076 – – 123,076 – RoE 4.81 – 82,051 – – 82,051 –
Total 491,417 205,127 25,034 87,356 584,154 –
RobCaprioli 06/06/13 TSR 2.00 51,440 – – 51,440 – – RoE 4.21 35,014 – 19,257 15,757 – – 05/06/14 TSR 2.89 105,871 – – – 105,871 – RoE 4.57 88,541 – – – 88,541 – 04/06/15 TSR 2.82 107,308 – – – 107,308 – RoE 5.39 71,538 – – – 71,538 – 02/06/16 TSR 2.37 – 119,230 – – 119,230 – RoE 4.81 – 79,487 – – 79,487 –
Total 459,712 198,717 19,257 67,197 571,975 –
GordonLefevre 05/06/14 TSR 2.89 128,558 – – – 128,558 – RoE 4.57 107,514 – – – 107,514 – 04/06/15 TSR 2.82 128,077 – – – 128,077 – RoE 5.39 85,384 – – – 85,384 – 02/06/16 TSR 2.37 – 148,461 – – 148,461 – RoE 4.81 – 98,974 – – 98,974 –
Total 449,533 247,435 – – 696,968 –
MatthewPercival 06/06/13 TSR 2.00 98,828 – – 98,828 – – RoE 4.21 67,269 – 36,997 30,272 – – 05/06/14 TSR 2.89 88,478 – – – 88,478 – RoE 4.57 73,995 – – – 73,995 – 04/06/15 TSR 2.82 83,077 – – – 83,077 – RoE 5.39 55,384 – – – 55,384 – 02/06/16 TSR 2.37 – 92,307 – – 92,307 – RoE 4.81 – 61,538 – – 61,538 –
Total 467,031 153,845 36,997 129,100 454,779 –For
per
sona
l use
onl
y
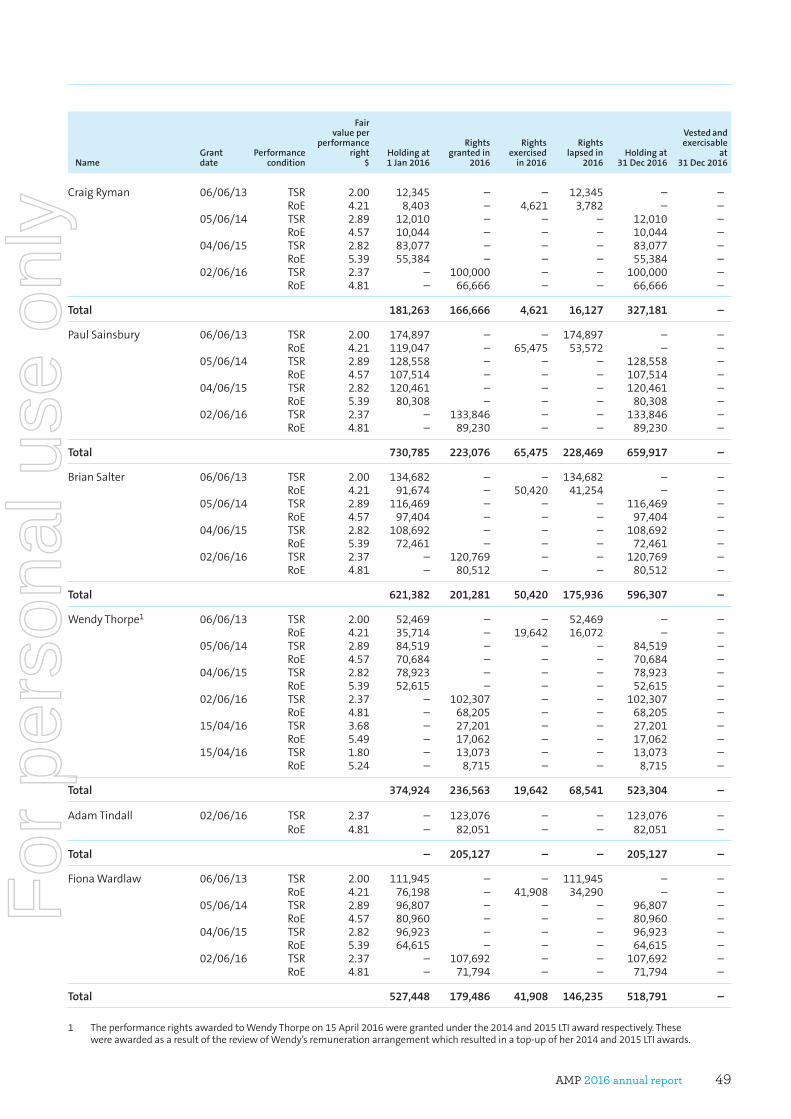
AMP 2016 annual report 49
NameGrant date
Performance condition
Fair value per
performance right
$Holding at 1 Jan 2016
Rights granted in
2016
Rights exercised
in 2016
Rights lapsed in
2016Holding at
31 Dec 2016
Vested and exercisable
at 31 Dec 2016
CraigRyman 06/06/13 TSR 2.00 12,345 – – 12,345 – – RoE 4.21 8,403 – 4,621 3,782 – – 05/06/14 TSR 2.89 12,010 – – – 12,010 – RoE 4.57 10,044 – – – 10,044 – 04/06/15 TSR 2.82 83,077 – – – 83,077 – RoE 5.39 55,384 – – – 55,384 – 02/06/16 TSR 2.37 – 100,000 – – 100,000 – RoE 4.81 – 66,666 – – 66,666 –
Total 181,263 166,666 4,621 16,127 327,181 –
PaulSainsbury 06/06/13 TSR 2.00 174,897 – – 174,897 – – RoE 4.21 119,047 – 65,475 53,572 – – 05/06/14 TSR 2.89 128,558 – – – 128,558 – RoE 4.57 107,514 – – – 107,514 – 04/06/15 TSR 2.82 120,461 – – – 120,461 – RoE 5.39 80,308 – – – 80,308 – 02/06/16 TSR 2.37 – 133,846 – – 133,846 – RoE 4.81 – 89,230 – – 89,230 –
Total 730,785 223,076 65,475 228,469 659,917 –
BrianSalter 06/06/13 TSR 2.00 134,682 – – 134,682 – – RoE 4.21 91,674 – 50,420 41,254 – – 05/06/14 TSR 2.89 116,469 – – – 116,469 – RoE 4.57 97,404 – – – 97,404 – 04/06/15 TSR 2.82 108,692 – – – 108,692 – RoE 5.39 72,461 – – – 72,461 – 02/06/16 TSR 2.37 – 120,769 – – 120,769 – RoE 4.81 – 80,512 – – 80,512 –
Total 621,382 201,281 50,420 175,936 596,307 –
WendyThorpe1 06/06/13 TSR 2.00 52,469 – – 52,469 – – RoE 4.21 35,714 – 19,642 16,072 – – 05/06/14 TSR 2.89 84,519 – – – 84,519 – RoE 4.57 70,684 – – – 70,684 – 04/06/15 TSR 2.82 78,923 – – – 78,923 – RoE 5.39 52,615 – – – 52,615 – 02/06/16 TSR 2.37 – 102,307 – – 102,307 – RoE 4.81 – 68,205 – – 68,205 – 15/04/16 TSR 3.68 – 27,201 – – 27,201 – RoE 5.49 – 17,062 – – 17,062 – 15/04/16 TSR 1.80 – 13,073 – – 13,073 – RoE 5.24 – 8,715 – – 8,715 –
Total 374,924 236,563 19,642 68,541 523,304 –
AdamTindall 02/06/16 TSR 2.37 – 123,076 – – 123,076 – RoE 4.81 – 82,051 – – 82,051 –
Total – 205,127 – – 205,127 –
FionaWardlaw 06/06/13 TSR 2.00 111,945 – – 111,945 – – RoE 4.21 76,198 – 41,908 34,290 – – 05/06/14 TSR 2.89 96,807 – – – 96,807 – RoE 4.57 80,960 – – – 80,960 – 04/06/15 TSR 2.82 96,923 – – – 96,923 – RoE 5.39 64,615 – – – 64,615 – 02/06/16 TSR 2.37 – 107,692 – – 107,692 – RoE 4.81 – 71,794 – – 71,794 –
Total 527,448 179,486 41,908 146,235 518,791 –
1 TheperformancerightsawardedtoWendyThorpeon15April2016weregrantedunderthe2014and2015LTIawardrespectively.ThesewereawardedasaresultofthereviewofWendy’sremunerationarrangementwhichresultedinatop-upofher2014and2015LTIawards.
For
per
sona
l use
onl
y
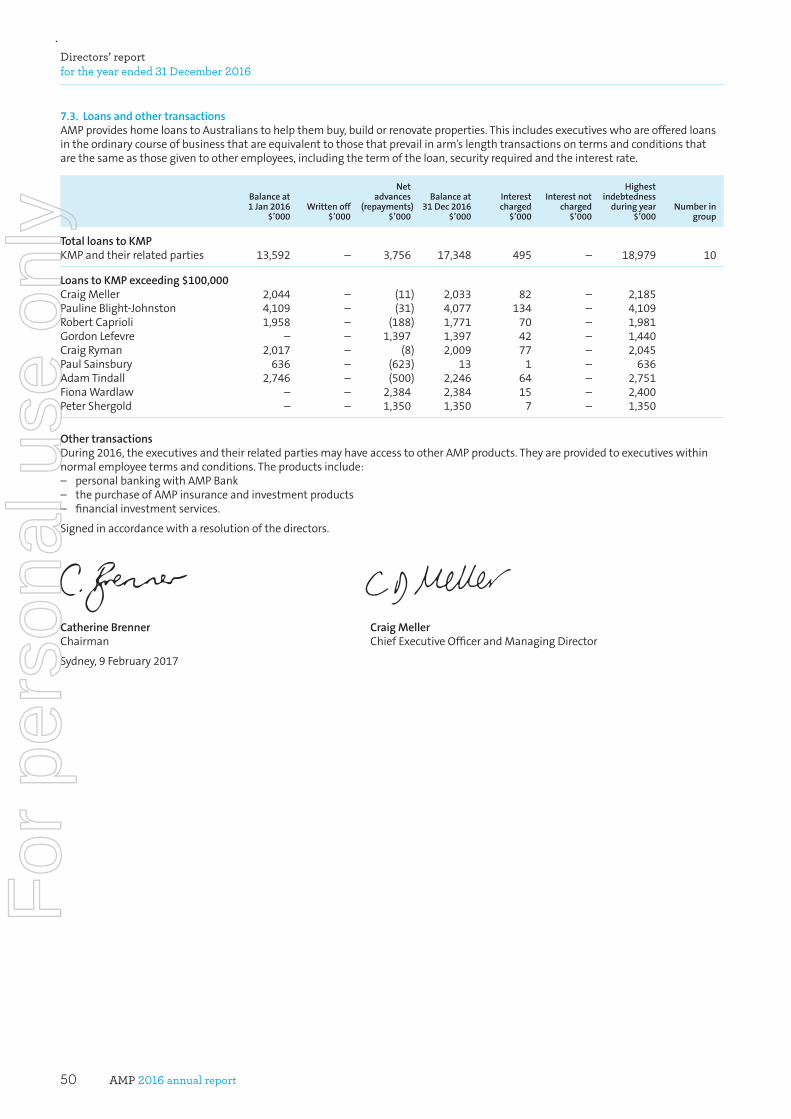
AMP 2016 annual report50
Directors’ report for the year ended 31 December 2016
7.3. Loans and other transactionsAMPprovideshomeloanstoAustralianstohelpthembuy,buildorrenovateproperties.Thisincludesexecutiveswhoareofferedloansintheordinarycourseofbusinessthatareequivalenttothosethatprevailinarm’slengthtransactionsontermsandconditionsthatarethesameasthosegiventootheremployees,includingthetermoftheloan,securityrequiredandtheinterestrate.
Balance at 1 Jan 2016
$’000Written off
$’000
Net advances
(repayments)$’000
Balance at 31 Dec 2016
$’000
Interest charged
$’000
Interest not charged
$’000
Highest indebtedness
during year$’000
Number in group
Total loans to KMP KMPandtheirrelatedparties 13,592 – 3,756 17,348 495 – 18,979 10
Loans to KMP exceeding $100,000 CraigMeller 2,044 – (11) 2,033 82 – 2,185PaulineBlight-Johnston 4,109 – (31) 4,077 134 – 4,109RobertCaprioli 1,958 – (188) 1,771 70 – 1,981GordonLefevre – – 1,397 1,397 42 – 1,440CraigRyman 2,017 – (8) 2,009 77 – 2,045PaulSainsbury 636 – (623) 13 1 – 636AdamTindall 2,746 – (500) 2,246 64 – 2,751FionaWardlaw – – 2,384 2,384 15 – 2,400PeterShergold – – 1,350 1,350 7 – 1,350
Other transactions During2016,theexecutivesandtheirrelatedpartiesmayhaveaccesstootherAMPproducts.Theyareprovidedtoexecutiveswithinnormalemployeetermsandconditions.Theproductsinclude:– personalbankingwithAMPBank– thepurchaseofAMPinsuranceandinvestmentproducts– financialinvestmentservices.
Signedinaccordancewitharesolutionofthedirectors.
Catherine Brenner Craig MellerChairman ChiefExecutiveOfficerandManagingDirector
Sydney,9February2017
For
per
sona
l use
onl
y
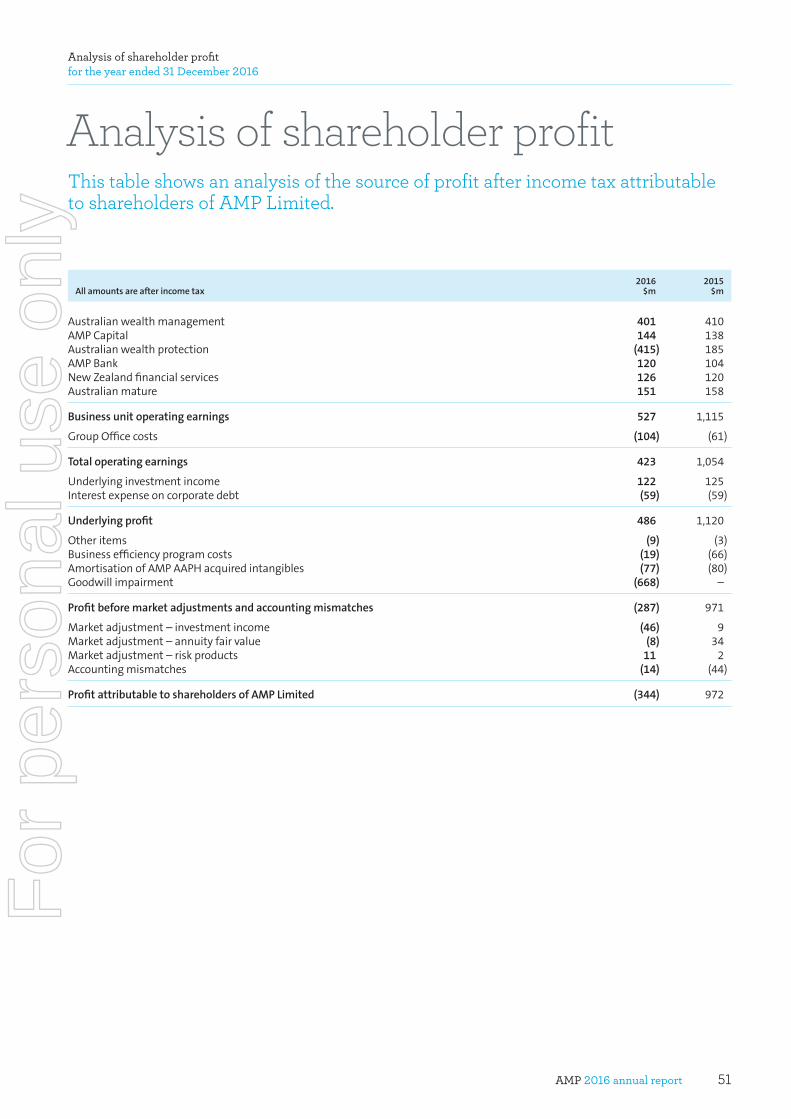
AMP 2016 annual report 51
Analysis of shareholder profit for the year ended 31 December 2016
Analysis of shareholder profit
All amounts are after income tax2016
$m2015
$m
Australianwealthmanagement 401 410AMPCapital 144 138Australianwealthprotection (415) 185AMPBank 120 104NewZealandfinancialservices 126 120Australianmature 151 158
Business unit operating earnings 527 1,115
GroupOfficecosts (104) (61)
Total operating earnings 423 1,054
Underlyinginvestmentincome 122 125Interestexpenseoncorporatedebt (59) (59)
Underlying profit 486 1,120
Otheritems (9) (3)Businessefficiencyprogramcosts (19) (66)AmortisationofAMPAAPHacquiredintangibles (77) (80)Goodwillimpairment (668) –
Profit before market adjustments and accounting mismatches (287) 971
Marketadjustment–investmentincome (46) 9Marketadjustment–annuityfairvalue (8) 34Marketadjustment–riskproducts 11 2Accountingmismatches (14) (44)
Profit attributable to shareholders of AMP Limited (344) 972
This table shows an analysis of the source of profit after income tax attributable to shareholders of AMP Limited.
For
per
sona
l use
onl
y
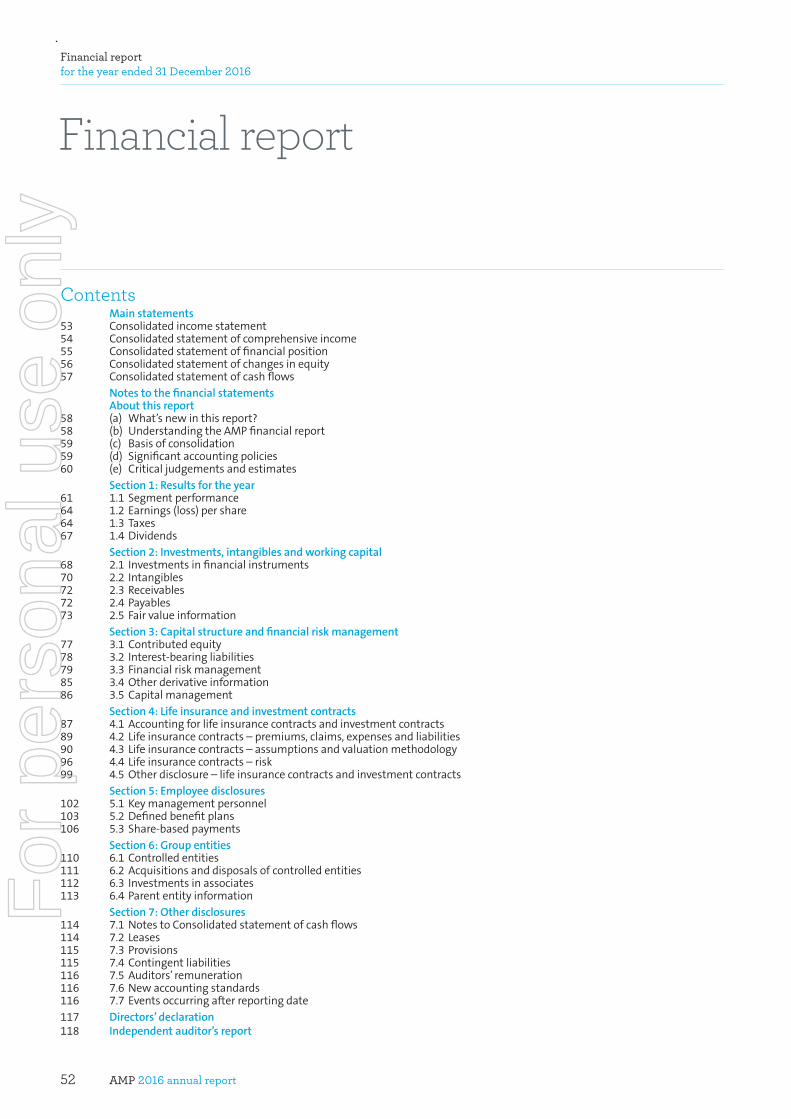
AMP 2016 annual report52
Financial report for the year ended 31 December 2016
Financial report
Contents Mainstatements53 Consolidatedincomestatement54 Consolidatedstatementofcomprehensiveincome55 Consolidatedstatementoffinancialposition56 Consolidatedstatementofchangesinequity57 Consolidatedstatementofcashflows Notestothefinancialstatements Aboutthisreport58 (a) What’snewinthisreport?58 (b) UnderstandingtheAMPfinancialreport59 (c) Basisofconsolidation59 (d) Significantaccountingpolicies60 (e) Criticaljudgementsandestimates Section1:Resultsfortheyear61 1.1Segmentperformance64 1.2Earnings(loss)pershare64 1.3Taxes67 1.4Dividends Section2:Investments,intangiblesandworkingcapital68 2.1Investmentsinfinancialinstruments70 2.2Intangibles72 2.3Receivables72 2.4Payables73 2.5Fairvalueinformation Section3:Capitalstructureandfinancialriskmanagement77 3.1Contributedequity78 3.2Interest-bearingliabilities79 3.3Financialriskmanagement85 3.4Otherderivativeinformation86 3.5Capitalmanagement Section4:Lifeinsuranceandinvestmentcontracts87 4.1Accountingforlifeinsurancecontractsandinvestmentcontracts89 4.2Lifeinsurancecontracts–premiums,claims,expensesandliabilities90 4.3Lifeinsurancecontracts–assumptionsandvaluationmethodology96 4.4Lifeinsurancecontracts–risk99 4.5Otherdisclosure–lifeinsurancecontractsandinvestmentcontracts Section5:Employeedisclosures102 5.1Keymanagementpersonnel103 5.2Definedbenefitplans106 5.3Share-basedpayments Section6:Groupentities110 6.1Controlledentities111 6.2Acquisitionsanddisposalsofcontrolledentities112 6.3Investmentsinassociates113 6.4Parententityinformation Section7:Otherdisclosures114 7.1NotestoConsolidatedstatementofcashflows114 7.2Leases115 7.3Provisions115 7.4Contingentliabilities116 7.5Auditors’remuneration116 7.6Newaccountingstandards116 7.7Eventsoccurringafterreportingdate117 Directors’declaration118 Independentauditor’sreport
For
per
sona
l use
onl
y
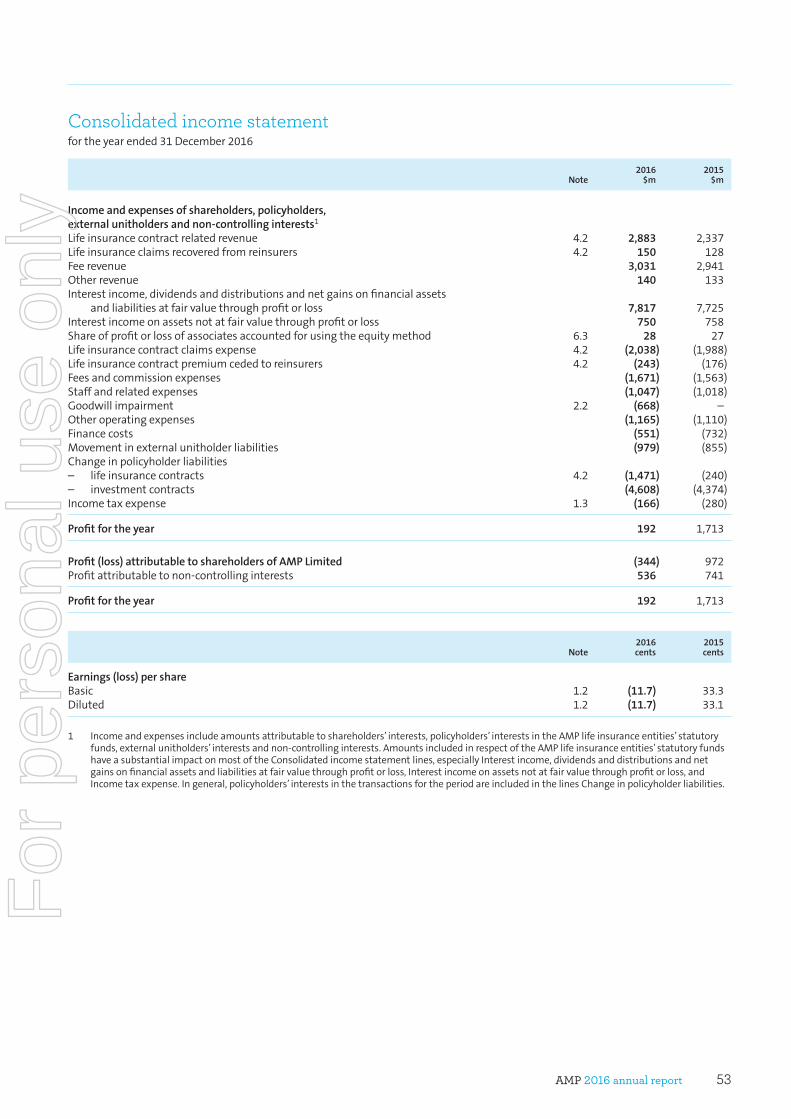
AMP 2016 annual report 53
Consolidated income statement fortheyearended31December2016
Note2016
$m2015
$m
Incomeandexpensesofshareholders,policyholders,externalunitholdersandnon-controllinginterests1 Lifeinsurancecontractrelatedrevenue 4.2 2,883 2,337Lifeinsuranceclaimsrecoveredfromreinsurers 4.2 150 128Feerevenue 3,031 2,941Otherrevenue 140 133Interestincome,dividendsanddistributionsandnetgainsonfinancialassets andliabilitiesatfairvaluethroughprofitorloss 7,817 7,725Interestincomeonassetsnotatfairvaluethroughprofitorloss 750 758Shareofprofitorlossofassociatesaccountedforusingtheequitymethod 6.3 28 27Lifeinsurancecontractclaimsexpense 4.2 (2,038) (1,988)Lifeinsurancecontractpremiumcededtoreinsurers 4.2 (243) (176)Feesandcommissionexpenses (1,671) (1,563)Staffandrelatedexpenses (1,047) (1,018)Goodwillimpairment 2.2 (668) –Otheroperatingexpenses (1,165) (1,110)Financecosts (551) (732)Movementinexternalunitholderliabilities (979) (855)Changeinpolicyholderliabilities – lifeinsurancecontracts 4.2 (1,471) (240)– investmentcontracts (4,608) (4,374)Incometaxexpense 1.3 (166) (280)
Profitfortheyear 192 1,713
Profit(loss)attributabletoshareholdersofAMPLimited (344) 972Profitattributabletonon-controllinginterests 536 741
Profitfortheyear 192 1,713
Note2016cents
2015cents
Earnings(loss)pershare Basic 1.2 (11.7) 33.3Diluted 1.2 (11.7) 33.1
1 Incomeandexpensesincludeamountsattributabletoshareholders’interests,policyholders’interestsintheAMPlifeinsuranceentities’statutoryfunds,externalunitholders’interestsandnon-controllinginterests.AmountsincludedinrespectoftheAMPlifeinsuranceentities’statutoryfundshaveasubstantialimpactonmostoftheConsolidatedincomestatementlines,especiallyInterestincome,dividendsanddistributionsandnetgainsonfinancialassetsandliabilitiesatfairvaluethroughprofitorloss,Interestincomeonassetsnotatfairvaluethroughprofitorloss,andIncometaxexpense.Ingeneral,policyholders’interestsinthetransactionsfortheperiodareincludedinthelinesChangeinpolicyholderliabilities.
For
per
sona
l use
onl
y
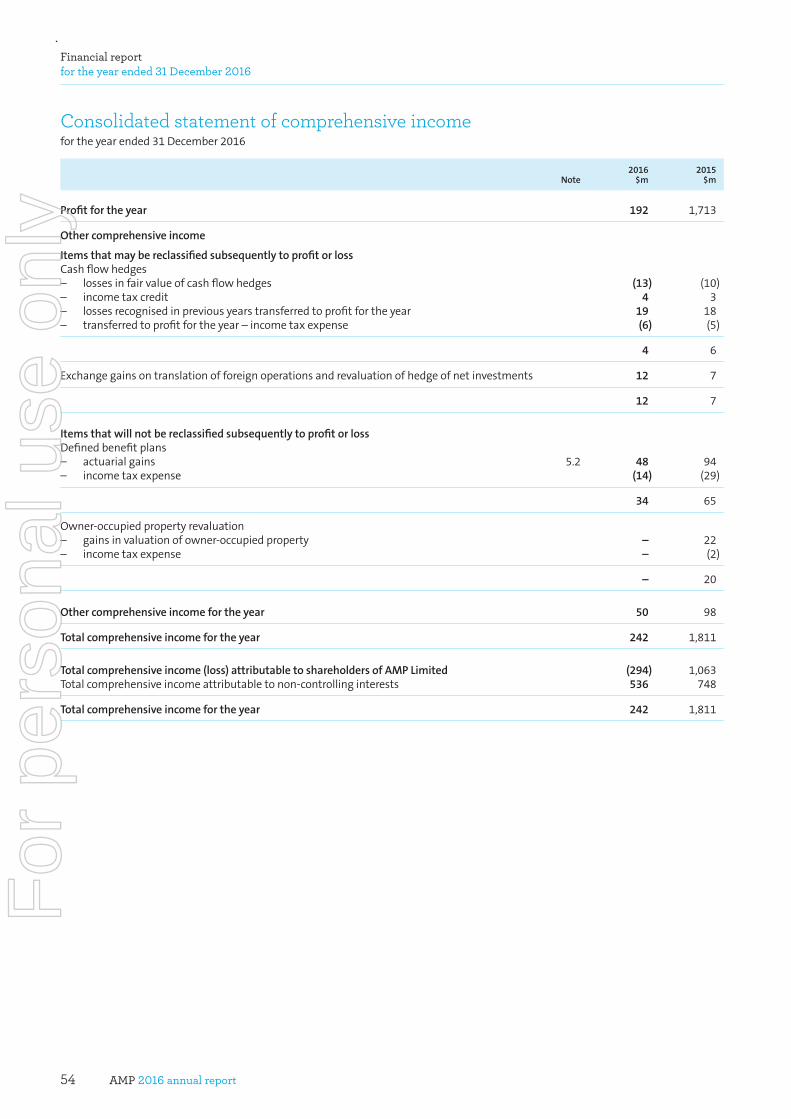
AMP 2016 annual report54
Financial report for the year ended 31 December 2016
Consolidated statement of comprehensive incomefortheyearended31December2016
Note2016
$m2015
$m
Profitfortheyear 192 1,713
Othercomprehensiveincome
Itemsthatmaybereclassifiedsubsequentlytoprofitorloss Cashflowhedges – lossesinfairvalueofcashflowhedges (13) (10)– incometaxcredit 4 3– lossesrecognisedinpreviousyearstransferredtoprofitfortheyear 19 18– transferredtoprofitfortheyear–incometaxexpense (6) (5)
4 6
Exchangegainsontranslationofforeignoperationsandrevaluationofhedgeofnetinvestments 12 7
12 7
Itemsthatwillnotbereclassifiedsubsequentlytoprofitorloss Definedbenefitplans – actuarialgains 5.2 48 94– incometaxexpense (14) (29)
34 65
Owner-occupiedpropertyrevaluation – gainsinvaluationofowner-occupiedproperty – 22– incometaxexpense – (2)
– 20
Othercomprehensiveincomefortheyear 50 98
Totalcomprehensiveincomefortheyear 242 1,811
Totalcomprehensiveincome(loss)attributabletoshareholdersofAMPLimited (294) 1,063Totalcomprehensiveincomeattributabletonon-controllinginterests 536 748
Totalcomprehensiveincomefortheyear 242 1,811
For
per
sona
l use
onl
y
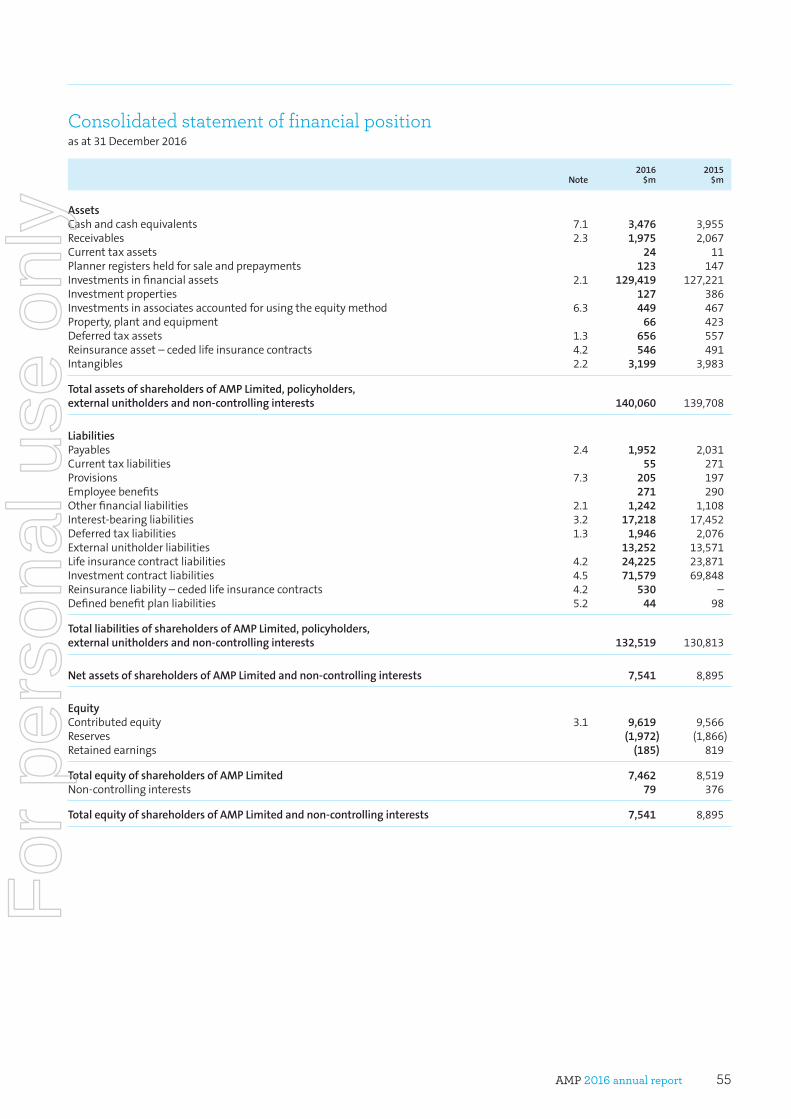
AMP 2016 annual report 55
Consolidated statement of financial positionasat31December2016
Note2016
$m2015
$m
Assets Cashandcashequivalents 7.1 3,476 3,955Receivables 2.3 1,975 2,067Currenttaxassets 24 11Plannerregistersheldforsaleandprepayments 123 147Investmentsinfinancialassets 2.1 129,419 127,221Investmentproperties 127 386Investmentsinassociatesaccountedforusingtheequitymethod 6.3 449 467Property,plantandequipment 66 423Deferredtaxassets 1.3 656 557Reinsuranceasset–cededlifeinsurancecontracts 4.2 546 491Intangibles 2.2 3,199 3,983
TotalassetsofshareholdersofAMPLimited,policyholders,externalunitholdersandnon-controllinginterests 140,060 139,708
Liabilities Payables 2.4 1,952 2,031Currenttaxliabilities 55 271Provisions 7.3 205 197Employeebenefits 271 290Otherfinancialliabilities 2.1 1,242 1,108Interest-bearingliabilities 3.2 17,218 17,452Deferredtaxliabilities 1.3 1,946 2,076Externalunitholderliabilities 13,252 13,571Lifeinsurancecontractliabilities 4.2 24,225 23,871Investmentcontractliabilities 4.5 71,579 69,848Reinsuranceliability–cededlifeinsurancecontracts 4.2 530 –Definedbenefitplanliabilities 5.2 44 98
TotalliabilitiesofshareholdersofAMPLimited,policyholders,externalunitholdersandnon-controllinginterests 132,519 130,813
NetassetsofshareholdersofAMPLimitedandnon-controllinginterests 7,541 8,895
Equity Contributedequity 3.1 9,619 9,566Reserves (1,972) (1,866)Retainedearnings (185) 819
TotalequityofshareholdersofAMPLimited 7,462 8,519Non-controllinginterests 79 376
TotalequityofshareholdersofAMPLimitedandnon-controllinginterests 7,541 8,895
For
per
sona
l use
onl
y
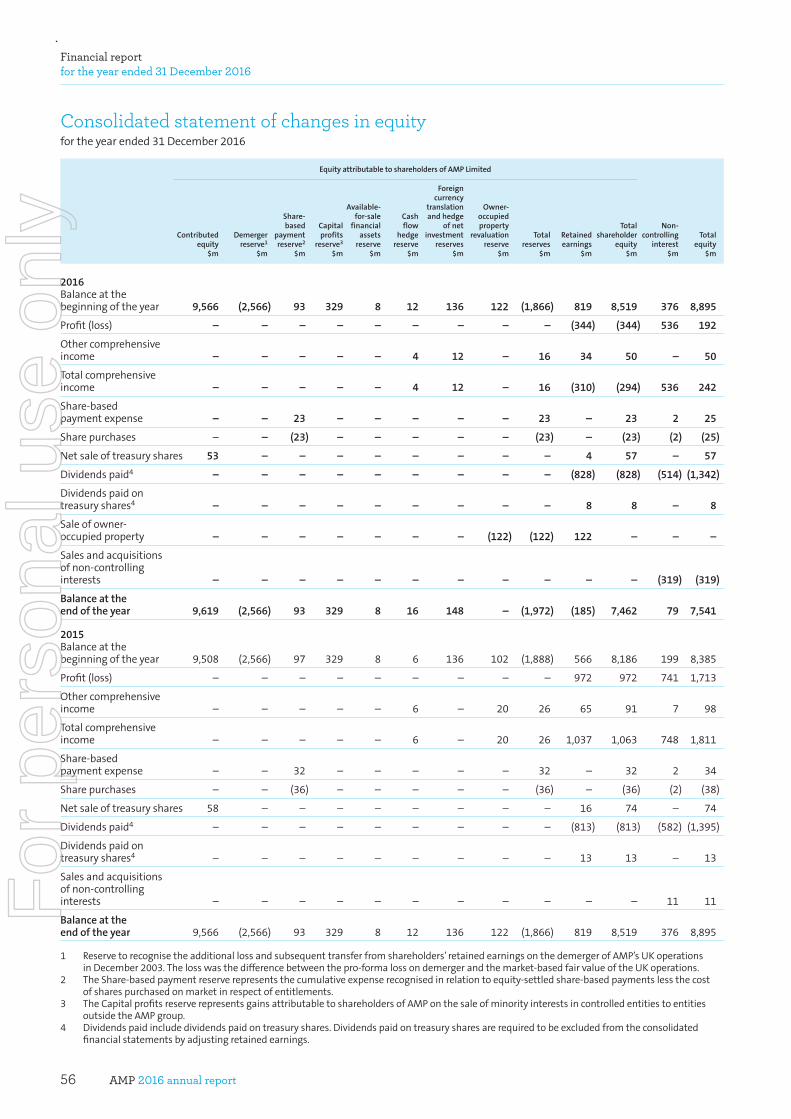
AMP 2016 annual report56
Financial report for the year ended 31 December 2016
Consolidated statement of changes in equityfortheyearended31December2016
EquityattributabletoshareholdersofAMPLimited
Contributedequity
$m
Demergerreserve1
$m
Share-based
paymentreserve2
$m
Capitalprofits
reserve3
$m
Available-for-sale
financialassets
reserve$m
Cashflow
hedgereserve
$m
Foreigncurrency
translationandhedge
ofnetinvestment
reserves$m
Owner-occupiedproperty
revaluationreserve
$m
Totalreserves
$m
Retainedearnings
$m
Totalshareholder
equity$m
Non-controlling
interest$m
Totalequity
$m
2016 Balanceatthebeginningoftheyear 9,566 (2,566) 93 329 8 12 136 122 (1,866) 819 8,519 376 8,895
Profit(loss) – – – – – – – – – (344) (344) 536 192
Othercomprehensiveincome – – – – – 4 12 – 16 34 50 – 50
Totalcomprehensiveincome – – – – – 4 12 – 16 (310) (294) 536 242
Share-basedpaymentexpense – – 23 – – – – – 23 – 23 2 25
Sharepurchases – – (23) – – – – – (23) – (23) (2) (25)
Netsaleoftreasuryshares 53 – – – – – – – – 4 57 – 57
Dividendspaid4 – – – – – – – – – (828) (828) (514) (1,342)
Dividendspaidontreasuryshares4 – – – – – – – – – 8 8 – 8
Saleofowner-occupiedproperty – – – – – – – (122) (122) 122 – – –
Salesandacquisitionsofnon-controllinginterests – – – – – – – – – – – (319) (319)
Balanceattheendoftheyear 9,619 (2,566) 93 329 8 16 148 – (1,972) (185) 7,462 79 7,541
2015 Balanceatthebeginningoftheyear 9,508 (2,566) 97 329 8 6 136 102 (1,888) 566 8,186 199 8,385
Profit(loss) – – – – – – – – – 972 972 741 1,713
Othercomprehensiveincome – – – – – 6 – 20 26 65 91 7 98
Totalcomprehensiveincome – – – – – 6 – 20 26 1,037 1,063 748 1,811
Share-basedpaymentexpense – – 32 – – – – – 32 – 32 2 34
Sharepurchases – – (36) – – – – – (36) – (36) (2) (38)
Netsaleoftreasuryshares 58 – – – – – – – – 16 74 – 74
Dividendspaid4 – – – – – – – – – (813) (813) (582) (1,395)
Dividendspaidontreasuryshares4 – – – – – – – – – 13 13 – 13
Salesandacquisitionsofnon-controllinginterests – – – – – – – – – – – 11 11
Balanceattheendoftheyear 9,566 (2,566) 93 329 8 12 136 122 (1,866) 819 8,519 376 8,895
1 Reservetorecognisetheadditionallossandsubsequenttransferfromshareholders’retainedearningsonthedemergerofAMP’sUKoperationsinDecember2003.Thelosswasthedifferencebetweenthepro-formalossondemergerandthemarket-basedfairvalueoftheUKoperations.
2 TheShare-basedpaymentreserverepresentsthecumulativeexpenserecognisedinrelationtoequity-settledshare-basedpaymentslessthecostofsharespurchasedonmarketinrespectofentitlements.
3 TheCapitalprofitsreserverepresentsgainsattributabletoshareholdersofAMPonthesaleofminorityinterestsincontrolledentitiestoentitiesoutsidetheAMPgroup.
4 Dividendspaidincludedividendspaidontreasuryshares.Dividendspaidontreasurysharesarerequiredtobeexcludedfromtheconsolidatedfinancialstatementsbyadjustingretainedearnings.
For
per
sona
l use
onl
y
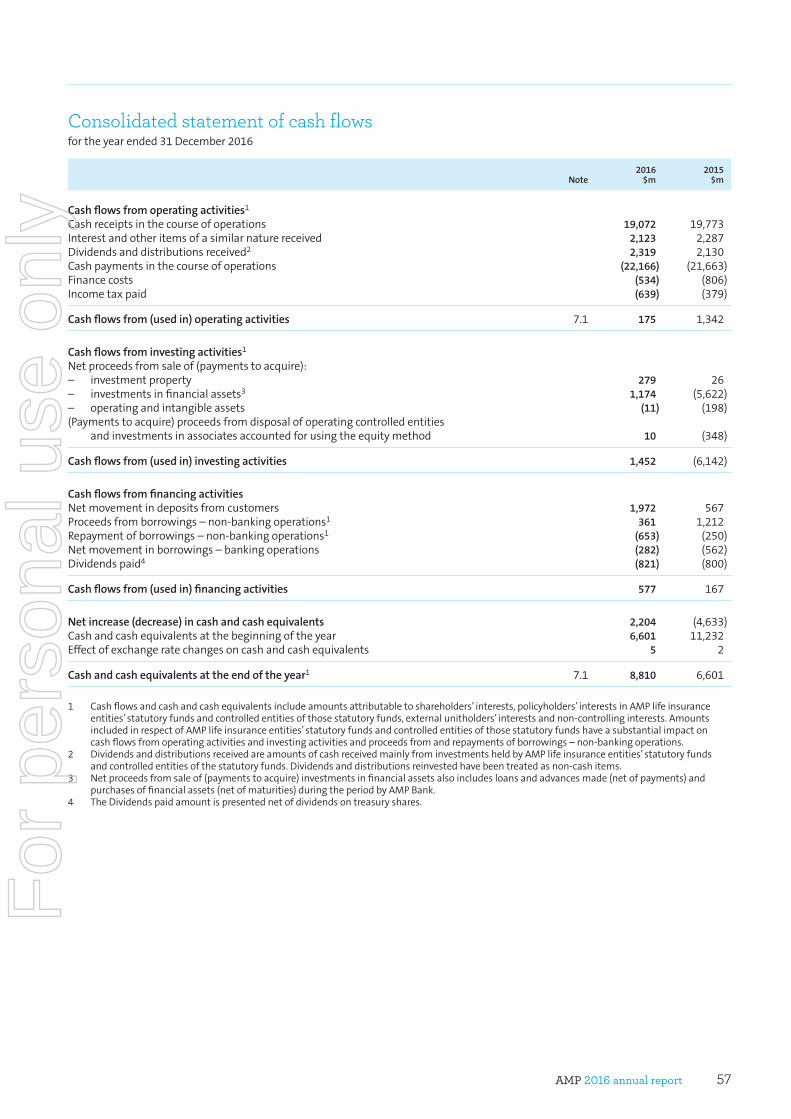
AMP 2016 annual report 57
Consolidated statement of cash flowsfortheyearended31December2016
Note2016
$m2015
$m
Cashflowsfromoperatingactivities1 Cashreceiptsinthecourseofoperations 19,072 19,773Interestandotheritemsofasimilarnaturereceived 2,123 2,287Dividendsanddistributionsreceived2 2,319 2,130Cashpaymentsinthecourseofoperations (22,166) (21,663)Financecosts (534) (806)Incometaxpaid (639) (379)
Cashflowsfrom(usedin)operatingactivities 7.1 175 1,342
Cashflowsfrominvestingactivities1 Netproceedsfromsaleof(paymentstoacquire): – investmentproperty 279 26– investmentsinfinancialassets3 1,174 (5,622)– operatingandintangibleassets (11) (198)(Paymentstoacquire)proceedsfromdisposalofoperatingcontrolledentities andinvestmentsinassociatesaccountedforusingtheequitymethod 10 (348)
Cashflowsfrom(usedin)investingactivities 1,452 (6,142)
Cashflowsfromfinancingactivities Netmovementindepositsfromcustomers 1,972 567Proceedsfromborrowings–non-bankingoperations1 361 1,212Repaymentofborrowings–non-bankingoperations1 (653) (250)Netmovementinborrowings–bankingoperations (282) (562)Dividendspaid4 (821) (800)
Cashflowsfrom(usedin)financingactivities 577 167
Netincrease(decrease)incashandcashequivalents 2,204 (4,633)Cashandcashequivalentsatthebeginningoftheyear 6,601 11,232Effectofexchangeratechangesoncashandcashequivalents 5 2
Cashandcashequivalentsattheendoftheyear1 7.1 8,810 6,601
1 Cashflowsandcashandcashequivalentsincludeamountsattributabletoshareholders’interests,policyholders’interestsinAMPlifeinsuranceentities’statutoryfundsandcontrolledentitiesofthosestatutoryfunds,externalunitholders’interestsandnon-controllinginterests.AmountsincludedinrespectofAMPlifeinsuranceentities’statutoryfundsandcontrolledentitiesofthosestatutoryfundshaveasubstantialimpactoncashflowsfromoperatingactivitiesandinvestingactivitiesandproceedsfromandrepaymentsofborrowings–non-bankingoperations.
2 DividendsanddistributionsreceivedareamountsofcashreceivedmainlyfrominvestmentsheldbyAMPlifeinsuranceentities’statutoryfundsandcontrolledentitiesofthestatutoryfunds.Dividendsanddistributionsreinvestedhavebeentreatedasnon-cashitems.
3 Netproceedsfromsaleof(paymentstoacquire)investmentsinfinancialassetsalsoincludesloansandadvancesmade(netofpayments)andpurchasesoffinancialassets(netofmaturities)duringtheperiodbyAMPBank.
4 TheDividendspaidamountispresentednetofdividendsontreasuryshares.
For
per
sona
l use
onl
y
AMP 2016 annual report58
Notes to the financial statements for the year ended 31 December 2016
About this reportThissectionoutlinesthestructureoftheAMPgroup,informationusefultounderstandingtheAMPgroup’sfinancialreportandthebasisonwhichthefinancialreporthasbeenprepared.
(a) What’s new in this report?Wehavereviewedthecontentandstructureofthefinancialreportandidentifiedopportunitiestoreduceitscomplexityandtomakeitmorerelevanttoourshareholdersandotherstakeholders.
Aspartofthisreviewwehavemadeanumberofchangestothefinancialreportincluding:– Removingimmaterialdisclosuresthatmaydetractfromtheusefulnessofthefinancialreportbydistractingfromimportant
information;– Disaggregatingbalances(includingprioryearcomparatives)toshowamountsseparatelyontheIncomestatementandStatement
offinancialposition;– Disclosingparententityinformationinaseparatenote;and– Groupingthenotestothefinancialstatementsintosevensections: 1. Resultsfortheyear 2. Investments,intangiblesandworkingcapital 3. Capitalstructureandfinancialriskmanagement 4. Lifeinsuranceandinvestmentcontracts 5. Employeedisclosures 6. Groupentities 7. Otherdisclosures.
Thesechangesdonotinvolveanychangestothemeasurementandrecognitionofamountsinthefinancialstatements.
ThepurposeofthesechangesistoprovideourshareholdersandotherstakeholderswithaclearerunderstandingofhowtheAMPgroupstrategy,asoutlinedintheDirectors’report,isreflectedinthefinancialperformanceandpositionoftheAMPgroup.
MaterialityInformationhasonlybeenincludedinthefinancialreporttotheextentthatithasbeenconsideredmaterialandrelevanttotheunderstandingofthefinancialstatements.Adisclosureisconsideredmaterialandrelevantif,forexample:– theamountinquestionissignificantbecauseofitssizeornature;– itisimportantforunderstandingtheresultsoftheAMPgroup;– ithelpsexplaintheimpactofsignificantchangesintheAMPgroup;and/or– itrelatestoanaspectoftheAMPgroup’soperationsthatisimportanttoitsfutureperformance.
(b) Understanding the AMP financial reportTheAMPgroupiscomprisedofAMPLimited(theparent),aholdingcompanyincorporatedanddomiciledinAustralia,andtheentitiesitcontrols(subsidiaries).TheconsolidatedfinancialstatementsofAMPLimitedincludethefinancialinformationofitscontrolledentities.
AMPbusinessoperationsarecarriedoutbyanumberofthesecontrolledentitiesincluding,during2016and2015,tworegisteredlifeinsuranceentities–AMPLifeLimited(AMPLife)andTheNationalMutualLifeAssociationofAustralasiaLimited(NMLA),AMPBankandAMPCapitalinvestmentmanagementcompanies.
ThebusinessofAMP’slifeinsuranceentitiesisconductedthroughstatutoryfundsandrelatestotheprovisionofwealthmanagementandlifeinsuranceproductstoinvestors,referredtoaspolicyholders.TheinvestmentassetsofthestatutoryfundsrepresentthemajorityoftheassetsoftheAMPgroup,alargeproportionofwhichisheldonbehalfofpolicyholders.Thecorrespondingliabilitiestopolicyholdersareclassifiedaseitherlifeinvestmentorlifeinsurancecontractliabilities.UnderAustralianAccountingStandards,someassetsheldonbehalfofpolicyholders(andtherelatedtaxbalances)areincludedinthefinancialstatementsatdifferentvaluestothoseusedinthecalculationoftheliabilitytopolicyholdersinrespectofthesameassets.Theimpactofthesedifferencesflowsthroughtoshareholderprofitandtheyarereferredtoasaccountingmismatchesinthesegmentdisclosuresinnote1.1(b).
AMPCapitaloperatesalargenumberofregisteredmanagedinvestmentschemesandotherpooledinvestmentvehicles.AMP’slifeinsuranceentitiesmakesignificantpolicyholderinvestmentsintothesevehicles.Inmanycases,thisresultsinthevehiclebeingcontrolledandthereforeconsolidatedinitsentiretyintotheAMPgroupfinancialstatements,includingtheportionthatrepresentstheshareholdingsofexternalparties,knownasnon-controllinginterests.
Asaconsequence,theseconsolidatedfinancialstatementsincludenotonlytheassetsandliabilitiesattributabletoAMPLimited’sshareholdersbutalsotheassetsandliabilitiesofthestatutoryfundsattributabletopolicyholdersandtheassetsandliabilitiesattributabletonon-controllinginterests.F
or p
erso
nal u
se o
nly
AMP 2016 annual report 59
(b) Understanding the AMP financial report (continued)Thefinancialreport:– isageneralpurposefinancialreport;– hasbeenpreparedinaccordancewiththerequirementsoftheCorporationsAct2001,AustralianAccountingStandards(AASBs)
includingAustralianAccountingInterpretationsadoptedbytheAustralianAccountingStandardsBoard(AASB)andInternationalFinancialReportingStandards(IFRSs)asissuedbytheInternationalAccountingStandardsBoard;
– ispresentedinAustralianDollarswithallvaluesroundedtothenearestmilliondollars($m),unlessotherwisestated;– hasbeenpreparedonagoingconcernbasisgenerallyusinganhistoricalcostbasis;howeverwherepermittedunderaccounting
standardsadifferentbasismaybeused,includingthefairvaluebasisfor: − assetsandliabilitiesassociatedwithlifeinsurancecontracts − assetsandliabilitiesassociatedwithinvestmentcontracts– presentsassetsandliabilitiesonthefaceoftheStatementoffinancialpositionindecreasingorderofliquidityanddoesnot
distinguishbetweencurrentandnon-currentitems;– presentsreclassifiedcomparativeinformationwhererequiredforconsistencywiththecurrentyear’spresentation.
AMPLimitedisafor-profitentityandislimitedbyshares.
Thefinancialstatementsfortheyearended31December2016wereauthorisedforissueon9February2017inaccordancewitharesolutionofthedirectors.
(c) Basis of consolidation Entitiesarefullyconsolidatedfromthedateofacquisition,beingthedateonwhichtheAMPgroupobtainscontrol,andcontinuetobeconsolidateduntilthedatethatcontrolceases.ControlexistswheretheAMPgroupisexposed,orhasrights,tovariablereturnsfromitsinvolvementwiththeentityandhastheabilitytoaffectthosereturnsthroughitspowerovertheentity.
Income,expenses,assets,liabilitiesandcashflowsofcontrolledentitiesareconsolidatedintotheAMPgroupfinancialstatements,alongwiththoseattributabletotheshareholdersoftheparententity.Allinter-companytransactionsareeliminatedinfull,includingunrealisedprofitsarisingfromintra-grouptransactions.
Whenacontrolledmanagedinvestmentschemeisconsolidated,theshareoftheunitholderliabilityattributabletotheAMPgroupiseliminatedbutamountsduetoexternalunitholdersremainasliabilitiesintheConsolidatedstatementoffinancialposition.Theshareofthenetassetsofcontrolledentitiesattributabletonon-controllinginterestsisdisclosedasaseparatelineitemontheConsolidatedstatementoffinancialposition.
(d) Significant accounting policiesThesignificantaccountingpoliciesadoptedinthepreparationofthefinancialreportarecontainedinthenotestothefinancialstatementstowhichtheyrelate.Allaccountingpolicieshavebeenconsistentlyappliedtothecurrentyearandcomparativeperiod,unlessotherwisestated.Whereanaccountingpolicyrelatestomorethanonenoteorwherenonoteisprovided,theaccountingpoliciesaresetoutbelow.
FeerevenueFeesarechargedtocustomersinconnectionwithinvestmentcontractsandotherfinancialservicescontracts.Feerevenueisrecognisedasservicesareprovidedeitheratinceptionofthecontractorastheyareperformedoverthelifeofthecontract.Forexample,feesforongoinginvestmentmanagementservicesandotherservicesprovidedarechargedonaregularbasis,usuallydaily,andarerecognisedastheserviceisprovided.
Interest,dividendsanddistributionsincomeInterestincomeisrecognisedwhentheAMPgroupobtainscontroloftherighttoreceivetheinterest.RevenuefromdividendsisrecognisedwhentheAMPgroup’srighttoreceivepaymentisestablished.
ForeigncurrencytransactionsTransactions,assetsandliabilitiesdenominatedinforeigncurrenciesaretranslatedintoAustraliandollars(thefunctionalcurrency)atreportingdateusingthefollowingapplicableexchangerates:
Foreigncurrencyamount Applicableexchangerate
Transactions DateoftransactionMonetaryassetsandliabilities ReportingdateNon-monetaryassetsandliabilitiescarriedatfairvalue Datefairvalueisdetermined
ForeignexchangegainsandlossesresultingfromtranslationofforeignexchangetransactionsarerecognisedintheIncomestatement,exceptforqualifyingcashflowhedgeswhicharedeferredtoequity.
For
per
sona
l use
onl
y
AMP 2016 annual report60
Notes to the financial statements for the year ended 31 December 2016
(d) Significant accounting policies (continued)Onconsolidationtheassets,liabilities,incomeandexpensesofforeignoperationsaretranslatedintoAustraliandollarsusingthefollowingapplicableexchangerates:
Foreigncurrencyamount Applicableexchangerate
Incomeandexpenses AverageexchangerateAssetsandliabilities ReportingdateEquity HistoricaldateReserves Reportingdate
ForeignexchangedifferencesresultingfromtranslationofforeignoperationsareinitiallyrecognisedintheforeigncurrencytranslationreserveandsubsequentlytransferredtotheIncomestatementondisposaloftheforeignoperation.
(e) Critical judgements and estimatesPreparationofthefinancialstatementsrequiresmanagementtomakejudgements,estimatesandassumptionsaboutfutureevents.Informationoncriticaljudgementsandestimatesconsideredwhenapplyingtheaccountingpoliciescanbefoundinthefollowingnotes:
Accountingjudgementsandestimates Note Page
Consolidation Aboutthisreport(c) Basisofconsolidation 59Tax 1.3 Taxes 66Fairvalueoffinancialassets 2.1 Financialassetsandotherfinancialliabilities 69Goodwillandacquiredintangibleassets 2.2 Intangibles 72Lifeinsuranceandinvestmentcontractliabilities 4.1 Accountingforlifeinsurancecontracts andinvestmentcontracts 88Consolidation 6.1 Controlledentities 110Provisions 7.3 Provisions 115
For
per
sona
l use
onl
y
AMP 2016 annual report 61
Section 1: Results for the yearThissectionprovidesinsightsintohowtheAMPgrouphasperformedinthecurrentyearandprovidesadditionalinformationaboutthoseindividuallineitemsinthefinancialstatementsthatthedirectorsconsidermostrelevantinthecontextoftheoperationsoftheAMPgroup.
Statutorymeasuresofperformancedisclosedinthisreportare:– Statutoryearningspershare(EPS)–basicanddiluted– Annualdividend– ProfitaftertaxattributabletotheshareholdersofAMP
UnderlyingprofitisAMP’skeymeasureofbusinessperformance.ThisperformancemeasureisdisclosedbytheAMPoperatingsegmentwithinSegmentperformance.
1.1 Segmentperformance1.2 Earnings(loss)pershare1.3 Taxes1.4 Dividends
1.1 Segment performance TheAMPgroupidentifiesitsoperatingsegmentsbasedonseparatefinancialinformationthatisregularlyreviewedbythechiefexecutiveofficerandhisimmediateteaminassessingperformanceanddeterminingtheallocationofresources.Theoperatingsegmentsareidentifiedaccordingtothenatureofprofitgeneratedandservicesprovided,andtheirperformanceisevaluatedbasedonapost-taxoperatingearningsbasis.
Reportablesegment Segmentdescription
Australianwealthmanagement(WM)
Financialadviceservices(throughalignedandownedadvicebusinesses),platformadministration(includingSMSF),unit-linkedsuperannuation,retirementincomeandmanagedinvestmentproductsbusiness.Superannuationproductsincludepersonalandemployersponsoredplans.
AMPCapital Adiversifiedinvestmentmanagerwithagrowinginternationalpresence,providinginvestmentservicesfordomesticandinternationalcustomers.AMPCapitalmanagesinvestmentsacrossmajorassetclassesincludingequities,fixedinterest,realestate,infrastructureandmulti-managerandmulti-assetfunds.AMPCapitalalsoprovidescommercial,industrialandretailrealestatemanagementservices.
AMPCapitalandMitsubishiUFJTrustandBankingCorporation(MUTB)haveastrategicbusinessandcapitalalliance,withMUTBholdinga15%ownershipinterestinAMPCapital.
InNovember2013,AMPCapitalestablishedafundsmanagementcompanyinChinawithChinaLifecalledChinaLifeAMPAssetManagementCompanyLimited(CLAMP).AMPCapitalisafoundingshareholder,holdinga15%stake,withthebalanceheldbyChinaLifeAssetManagementCompany,asubsidiaryofChinaLife.
Australianwealthprotection(WP)
Includesindividualandgroupterm,disabilityandincomeprotectioninsuranceproducts.Productscanbebundledwithasuperannuationproductorheldindependentlyofsuperannuation.
AMPBank Australianretailbankofferingresidentialmortgages,deposits,transactionbankingandSMSFproducts.Italsohasaportfolioofpracticefinanceloans.AMPBankdistributesthroughAMP’saligneddistributionnetworkaswellasthirdpartybrokers,anddirecttoretailcustomersviaphoneandonline.
NewZealandfinancialservices(NZFS)
Riskinsurance,wealthmanagementandmaturebook(traditionalparticipatingbusiness),withgrowthinwealthmanagementdrivenbyKiwiSaver.
Australianmature(Mature)
Abusinesscomprisingproductswhicharelargelyclosedtonewbusinessandareinrun-off.ProductswithinAustralianmatureincludewholeoflife,endowment,investment-linked,investmentaccount,RetirementSavingsAccount,EligibleRolloverFund,annuities,insurancebonds,personalsuperannuationandguaranteedsavingsaccounts.
SegmentinformationisnotreportedforactivitiesoftheAMPgroupofficecompaniesasitisnotthefunctionofthesedepartmentstoearnrevenueandanyrevenuesearnedareonlyincidentaltotheactivitiesoftheAMPgroup.
For
per
sona
l use
onl
y
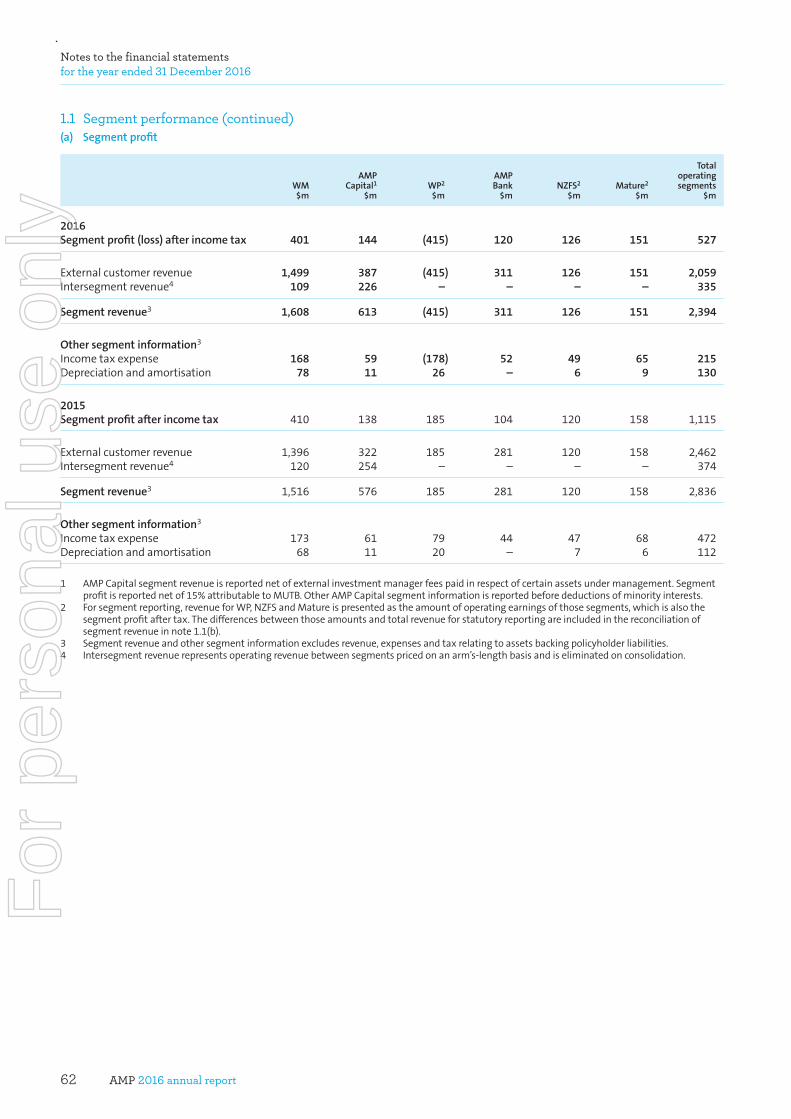
AMP 2016 annual report62
Notes to the financial statements for the year ended 31 December 2016
1.1 Segment performance (continued) (a) Segmentprofit
WM$m
AMPCapital1
$mWP2
$m
AMPBank
$mNZFS2
$mMature2
$m
Totaloperatingsegments
$m
2016Segmentprofit(loss)afterincometax 401 144 (415) 120 126 151 527
Externalcustomerrevenue 1,499 387 (415) 311 126 151 2,059Intersegmentrevenue4 109 226 – – – – 335
Segmentrevenue3 1,608 613 (415) 311 126 151 2,394
Othersegmentinformation3 Incometaxexpense 168 59 (178) 52 49 65 215Depreciationandamortisation 78 11 26 – 6 9 130
2015 Segmentprofitafterincometax 410 138 185 104 120 158 1,115
Externalcustomerrevenue 1,396 322 185 281 120 158 2,462Intersegmentrevenue4 120 254 – – – – 374
Segmentrevenue3 1,516 576 185 281 120 158 2,836
Othersegmentinformation3 Incometaxexpense 173 61 79 44 47 68 472Depreciationandamortisation 68 11 20 – 7 6 112
1 AMPCapitalsegmentrevenueisreportednetofexternalinvestmentmanagerfeespaidinrespectofcertainassetsundermanagement.Segmentprofitisreportednetof15%attributabletoMUTB.OtherAMPCapitalsegmentinformationisreportedbeforedeductionsofminorityinterests.
2 Forsegmentreporting,revenueforWP,NZFSandMatureispresentedastheamountofoperatingearningsofthosesegments,whichisalsothesegmentprofitaftertax.Thedifferencesbetweenthoseamountsandtotalrevenueforstatutoryreportingareincludedinthereconciliationofsegmentrevenueinnote1.1(b).
3 Segmentrevenueandothersegmentinformationexcludesrevenue,expensesandtaxrelatingtoassetsbackingpolicyholderliabilities.4 Intersegmentrevenuerepresentsoperatingrevenuebetweensegmentspricedonanarm’s-lengthbasisandiseliminatedonconsolidation.
For
per
sona
l use
onl
y
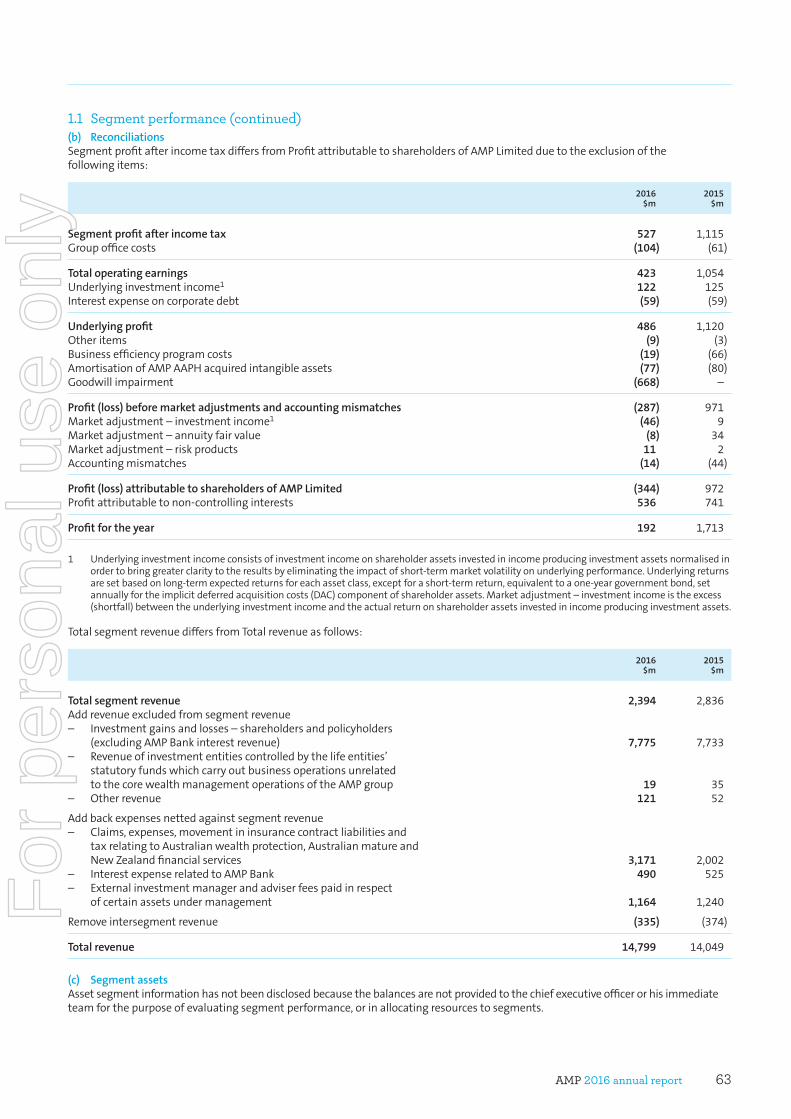
AMP 2016 annual report 63
1.1 Segment performance (continued) (b) ReconciliationsSegmentprofitafterincometaxdiffersfromProfitattributabletoshareholdersofAMPLimitedduetotheexclusionofthefollowingitems:
2016$m
2015$m
Segmentprofitafterincometax 527 1,115Groupofficecosts (104) (61)
Totaloperatingearnings 423 1,054Underlyinginvestmentincome1 122 125Interestexpenseoncorporatedebt (59) (59)
Underlyingprofit 486 1,120Otheritems (9) (3)Businessefficiencyprogramcosts (19) (66)AmortisationofAMPAAPHacquiredintangibleassets (77) (80)Goodwillimpairment (668) –
Profit(loss)beforemarketadjustmentsandaccountingmismatches (287) 971Marketadjustment–investmentincome1 (46) 9Marketadjustment–annuityfairvalue (8) 34Marketadjustment–riskproducts 11 2Accountingmismatches (14) (44)
Profit(loss)attributabletoshareholdersofAMPLimited (344) 972Profitattributabletonon-controllinginterests 536 741
Profitfortheyear 192 1,713
1 Underlyinginvestmentincomeconsistsofinvestmentincomeonshareholderassetsinvestedinincomeproducinginvestmentassetsnormalisedinordertobringgreaterclaritytotheresultsbyeliminatingtheimpactofshort-termmarketvolatilityonunderlyingperformance.Underlyingreturnsaresetbasedonlong-termexpectedreturnsforeachassetclass,exceptforashort-termreturn,equivalenttoaone-yeargovernmentbond,setannuallyfortheimplicitdeferredacquisitioncosts(DAC)componentofshareholderassets.Marketadjustment–investmentincomeistheexcess(shortfall)betweentheunderlyinginvestmentincomeandtheactualreturnonshareholderassetsinvestedinincomeproducinginvestmentassets.
TotalsegmentrevenuediffersfromTotalrevenueasfollows:
2016$m
2015$m
Totalsegmentrevenue 2,394 2,836Addrevenueexcludedfromsegmentrevenue – Investmentgainsandlosses–shareholdersandpolicyholders
(excludingAMPBankinterestrevenue) 7,775 7,733– Revenueofinvestmententitiescontrolledbythelifeentities’
statutoryfundswhichcarryoutbusinessoperationsunrelatedtothecorewealthmanagementoperationsoftheAMPgroup 19 35
– Otherrevenue 121 52
Addbackexpensesnettedagainstsegmentrevenue – Claims,expenses,movementininsurancecontractliabilitiesand
taxrelatingtoAustralianwealthprotection,AustralianmatureandNewZealandfinancialservices 3,171 2,002
– InterestexpenserelatedtoAMPBank 490 525– Externalinvestmentmanagerandadviserfeespaidinrespect
ofcertainassetsundermanagement 1,164 1,240
Removeintersegmentrevenue (335) (374)
Totalrevenue 14,799 14,049
(c) SegmentassetsAssetsegmentinformationhasnotbeendisclosedbecausethebalancesarenotprovidedtothechiefexecutiveofficerorhisimmediateteamforthepurposeofevaluatingsegmentperformance,orinallocatingresourcestosegments.
For
per
sona
l use
onl
y
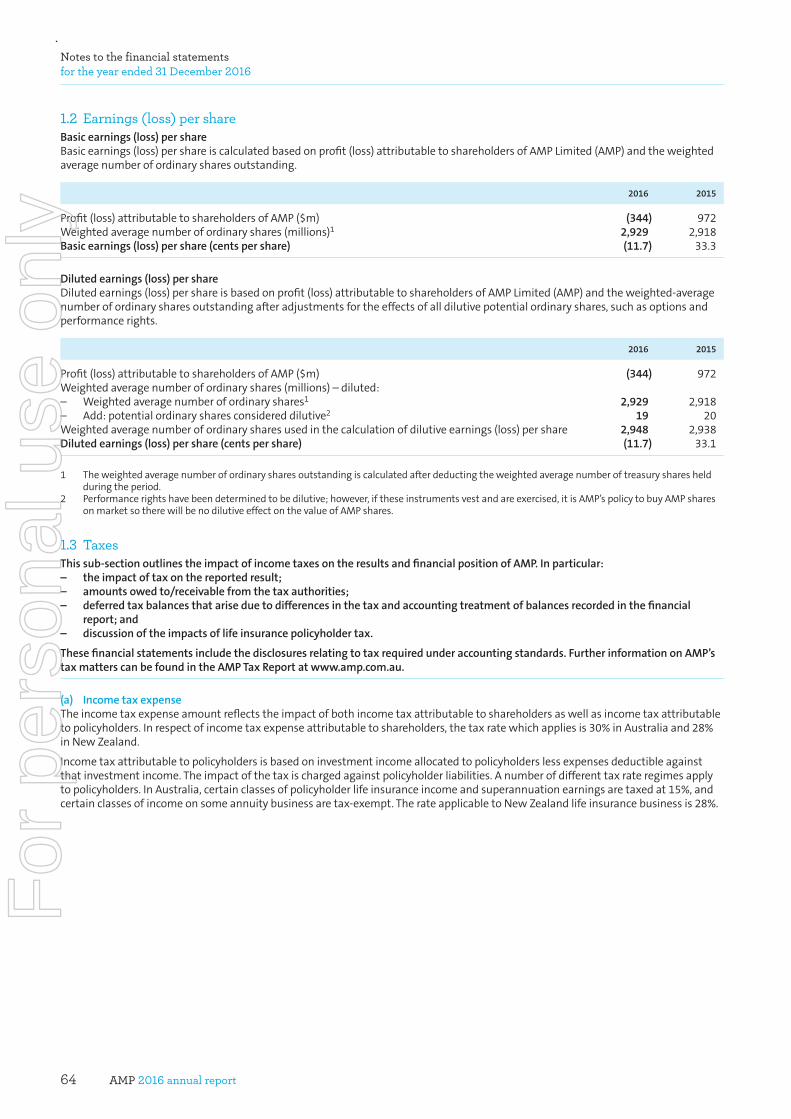
AMP 2016 annual report64
Notes to the financial statements for the year ended 31 December 2016
1.2 Earnings (loss) per shareBasicearnings(loss)pershareBasicearnings(loss)pershareiscalculatedbasedonprofit(loss)attributabletoshareholdersofAMPLimited(AMP)andtheweightedaveragenumberofordinarysharesoutstanding.
2016 2015
Profit(loss)attributabletoshareholdersofAMP($m) (344) 972Weightedaveragenumberofordinaryshares(millions)1 2,929 2,918Basicearnings(loss)pershare(centspershare) (11.7) 33.3
Dilutedearnings(loss)pershareDilutedearnings(loss)pershareisbasedonprofit(loss)attributabletoshareholdersofAMPLimited(AMP)andtheweighted-averagenumberofordinarysharesoutstandingafteradjustmentsfortheeffectsofalldilutivepotentialordinaryshares,suchasoptionsandperformancerights.
2016 2015
Profit(loss)attributabletoshareholdersofAMP($m) (344) 972Weightedaveragenumberofordinaryshares(millions)–diluted: – Weightedaveragenumberofordinaryshares1 2,929 2,918– Add:potentialordinarysharesconsidereddilutive2 19 20Weightedaveragenumberofordinarysharesusedinthecalculationofdilutiveearnings(loss)pershare 2,948 2,938Dilutedearnings(loss)pershare(centspershare) (11.7) 33.1
1 Theweightedaveragenumberofordinarysharesoutstandingiscalculatedafterdeductingtheweightedaveragenumberoftreasurysharesheldduringtheperiod.
2 Performancerightshavebeendeterminedtobedilutive;however,iftheseinstrumentsvestandareexercised,itisAMP’spolicytobuyAMPsharesonmarketsotherewillbenodilutiveeffectonthevalueofAMPshares.
1.3 TaxesThissub-sectionoutlinestheimpactofincometaxesontheresultsandfinancialpositionofAMP.Inparticular:– theimpactoftaxonthereportedresult;– amountsowedto/receivablefromthetaxauthorities;– deferredtaxbalancesthatariseduetodifferencesinthetaxandaccountingtreatmentofbalancesrecordedinthefinancial
report;and– discussionoftheimpactsoflifeinsurancepolicyholdertax.
Thesefinancialstatementsincludethedisclosuresrelatingtotaxrequiredunderaccountingstandards.FurtherinformationonAMP’staxmatterscanbefoundintheAMPTaxReportatwww.amp.com.au.
(a) IncometaxexpenseTheincometaxexpenseamountreflectstheimpactofbothincometaxattributabletoshareholdersaswellasincometaxattributabletopolicyholders.Inrespectofincometaxexpenseattributabletoshareholders,thetaxratewhichappliesis30%inAustraliaand28%inNewZealand.
Incometaxattributabletopolicyholdersisbasedoninvestmentincomeallocatedtopolicyholderslessexpensesdeductibleagainstthatinvestmentincome.Theimpactofthetaxischargedagainstpolicyholderliabilities.Anumberofdifferenttaxrateregimesapplytopolicyholders.InAustralia,certainclassesofpolicyholderlifeinsuranceincomeandsuperannuationearningsaretaxedat15%,andcertainclassesofincomeonsomeannuitybusinessaretax-exempt.TherateapplicabletoNewZealandlifeinsurancebusinessis28%.
For
per
sona
l use
onl
y
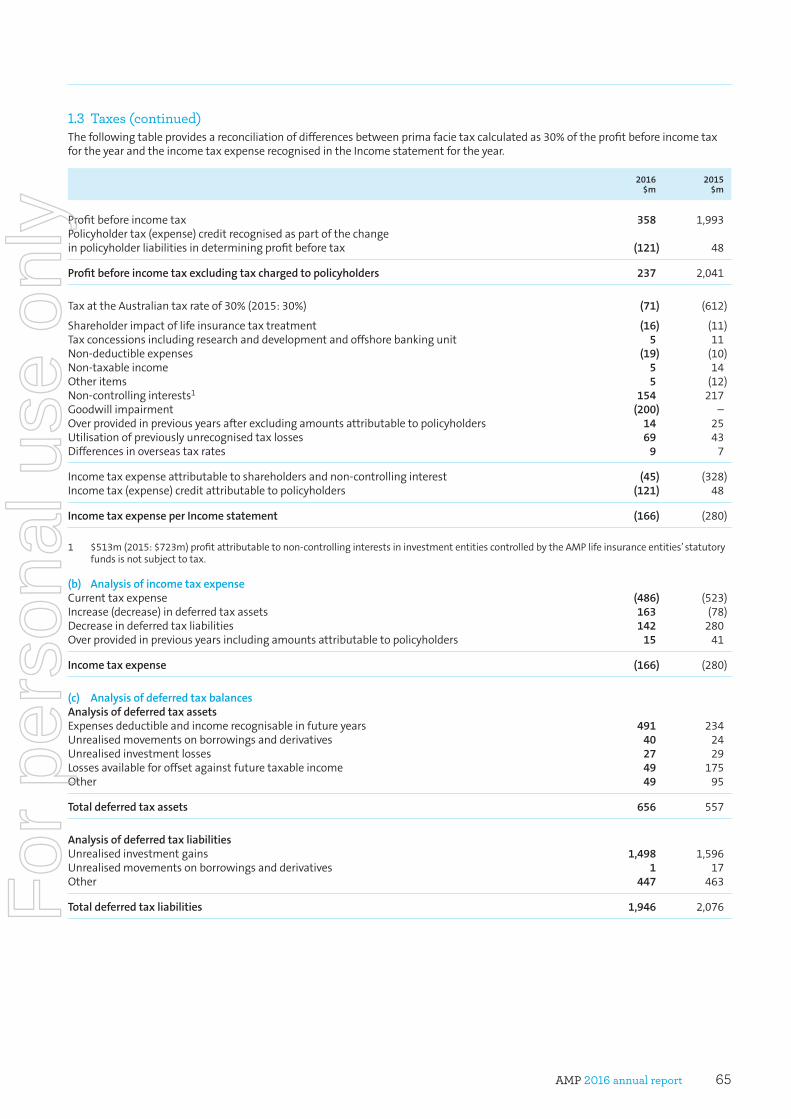
AMP 2016 annual report 65
1.3 Taxes (continued)Thefollowingtableprovidesareconciliationofdifferencesbetweenprimafacietaxcalculatedas30%oftheprofitbeforeincometaxfortheyearandtheincometaxexpenserecognisedintheIncomestatementfortheyear.
2016$m
2015$m
Profitbeforeincometax 358 1,993Policyholdertax(expense)creditrecognisedaspartofthechangeinpolicyholderliabilitiesindeterminingprofitbeforetax (121) 48
Profitbeforeincometaxexcludingtaxchargedtopolicyholders 237 2,041
TaxattheAustraliantaxrateof30%(2015:30%) (71) (612)
Shareholderimpactoflifeinsurancetaxtreatment (16) (11)Taxconcessionsincludingresearchanddevelopmentandoffshorebankingunit 5 11Non-deductibleexpenses (19) (10)Non-taxableincome 5 14Otheritems 5 (12)Non-controllinginterests1 154 217Goodwillimpairment (200) –Overprovidedinpreviousyearsafterexcludingamountsattributabletopolicyholders 14 25Utilisationofpreviouslyunrecognisedtaxlosses 69 43Differencesinoverseastaxrates 9 7
Incometaxexpenseattributabletoshareholdersandnon-controllinginterest (45) (328)Incometax(expense)creditattributabletopolicyholders (121) 48
IncometaxexpenseperIncomestatement (166) (280)
1 $513m(2015:$723m)profitattributabletonon-controllinginterestsininvestmententitiescontrolledbytheAMPlifeinsuranceentities’statutoryfundsisnotsubjecttotax.
(b) AnalysisofincometaxexpenseCurrenttaxexpense (486) (523)Increase(decrease)indeferredtaxassets 163 (78)Decreaseindeferredtaxliabilities 142 280Overprovidedinpreviousyearsincludingamountsattributabletopolicyholders 15 41
Incometaxexpense (166) (280)
(c) AnalysisofdeferredtaxbalancesAnalysisofdeferredtaxassets Expensesdeductibleandincomerecognisableinfutureyears 491 234Unrealisedmovementsonborrowingsandderivatives 40 24Unrealisedinvestmentlosses 27 29Lossesavailableforoffsetagainstfuturetaxableincome 49 175Other 49 95
Totaldeferredtaxassets 656 557
Analysisofdeferredtaxliabilities Unrealisedinvestmentgains 1,498 1,596Unrealisedmovementsonborrowingsandderivatives 1 17Other 447 463
Totaldeferredtaxliabilities 1,946 2,076For
per
sona
l use
onl
y
AMP 2016 annual report66
Notes to the financial statements for the year ended 31 December 2016
1.3 Taxes (continued)
2016$m
2015$m
(d) AmountsrecogniseddirectlyinequityDeferredincometaxexpenserelatedtoitemstakendirectlytoequityduringthecurrentyear (16) (28)
(e) UnusedtaxlossesanddeductibletemporarydifferencesnotrecognisedRevenuelosses 110 109Capitallosses 170 239
Accountingpolicy–recognitionandmeasurementIncometaxexpenseIncometaxexpenseisthetaxpayableontaxableincomeforthecurrentperiodbasedontheincometaxrateforeachjurisdictionandadjustedforchangesindeferredtaxassetsandliabilities.Thesechangesareattributableto:– temporarydifferencesbetweenthetaxbasesofassetsandliabilitiesandtheirStatementoffinancialpositioncarryingamounts;– unusedtaxlosses;– theimpactofchangesintheamountsofdeferredtaxassetsandliabilitiesarisingfromchangesintaxratesorinthemannerin
whichthesebalancesareexpectedtoberealised.
Adjustmentstoincometaxexpensearealsomadeforanydifferencesbetweentheamountspaid,orexpectedtobepaid,inrelationtopriorperiodsandtheamountsprovidedfortheseperiodsatthestartofthecurrentperiod.
Anytaximpactonincomeandexpenseitemsthatarerecogniseddirectlyinequityisalsorecogniseddirectlyinequity.
IncometaxforinvestmentcontractsbusinessandlifeinsurancecontractsbusinessTheincometaxexpenserecognisedintheIncomestatementoftheAMPgroup,whicharisesinrespectoftheAMPlifeinsuranceentities,reflectstaximposedonshareholdersaswellaspolicyholders.InvestmentcontractsliabilitiesandlifeinsurancecontractsliabilitiesareestablishedinAustralianet,andinNewZealandgross,ofthepolicyholders’shareofanycurrenttaxpayableanddeferredtaxbalancesoftheAMPgroup.ArrangementsmadewithsomesuperannuationfundsresultintheAMPlifeinsuranceentitiesmakingpaymentstotheAustralianTaxationOfficeinrelationtocontributionstaxarisinginthosefunds.Theamountspaidarerecognisedasadecreaseininvestmentcontractliabilitiesandnotincludedinincometaxexpense.
DeferredtaxDeferredtaxassetsandliabilitiesarerecognisedfortemporarydifferencesandaremeasuredatthetaxrateswhichareexpectedtoapplywhentheassetsarerecoveredorliabilitiesaresettled,basedontaxratesthathavebeenenactedorsubstantivelyenactedforeachjurisdictionatthereportingdate.Deferredtaxassetsandliabilities,includingamountsinrespectofinvestmentcontractsandlifeinsurancecontracts,arenotdiscountedtopresentvalue.
Deferredtaxassetsarerecognisedfordeductibletemporarydifferencesandunusedtaxlossesonlyifitisprobablethatfuturetaxableamountswillbeavailabletoutilisethosetemporarydifferencesandlosses.
TaxconsolidationAMPLimitedanditswholly-ownedAustraliancontrolledentitiesarepartofatax-consolidatedgroup,withAMPLimitedbeingtheheadentity.Ataxfundingagreementhasbeenenteredintobytheheadentityandthecontrolledentitiesinthetax-consolidatedgroupandrequiresentitiestofullycompensatethecompanyforcurrenttaxliabilitiesandtobefullycompensatedbythecompanyforanycurrentordeferredtaxassetsinrespectoftaxlossesarisingfromexternaltransactionsoccurringafter30June2003,theimplementationdateofthetax-consolidatedgroup.
Criticalaccountingestimatesandjudgements:The AMP group is subject to taxes in Australia and other jurisdictions where it has operations. The application of tax law to the specific circumstances and transactions of the AMP group requires the exercise of judgement by management. The tax treatments adopted by management in preparing the financial statements may be impacted by changes in legislation and interpretations or be subject to challenge by tax authorities.
Judgement is also applied by management in determining the extent to which the recovery of carried forward tax losses is probable for the purpose of meeting the criteria for recognition as deferred tax assets.
For
per
sona
l use
onl
y
AMP 2016 annual report 67
1.4 DividendsDividendspaidandproposedduringtheyearareshowninthetablebelow:
2016Final
2016Interim
2015Final
2015Interim
Dividendpershare(cents) 14.0 14.0 14.0 14.0Frankingpercentage 90% 90% 90% 85%Cost(in$m) 414 414 414 414
Paymentdate 31March 7October 8April 9October 2017 2016 2016 2015
2016$m
2015$m
Dividendspaid Previousyearfinaldividendonordinaryshares 414 399Interimdividendonordinaryshares 414 414
Totaldividendspaid1 828 813
1 Totaldividendspaidincludesdividendspaidontreasuryshares$8m(2015:$13m).
DividendfrankingcreditsFrankingcreditsavailabletoshareholdersare$342m(2015:$396m),basedonataxrateof30%.Thisamountiscalculatedfromthebalanceofthefrankingaccountasattheendofthereportingperiod,adjustedforfrankingcreditsthatwillarisefromthesettlement,aftertheendofthereportingdate,ofliabilitiesforincometaxandreceivablesfordividends.
Thecompany’sabilitytoutilisethefrankingaccountcreditsdependsonmeetingCorporationsAct2001requirementstodeclaredividends.Theimpactoftheproposeddividendwillbetoreducethebalanceofthefrankingcreditaccountby$160m.
Alldividendsarefrankedatataxrateof30%.
For
per
sona
l use
onl
y
AMP 2016 annual report68
Notes to the financial statements for the year ended 31 December 2016
Section 2: Investments, intangibles and working capitalThissectionhighlightstheAMPgroup’sassetsandworkingcapitalusedtosupporttheAMPgroup’sactivities.
2.1 Investmentsinfinancialinstruments2.2 Intangibles 2.3 Receivables2.4 Payables2.5 Fairvalueinformation
2.1 Investments in financial instruments
2016$m
2015$m
Financialassetsmeasuredatfairvaluethroughprofitorloss1 Equitysecuritiesandlistedmanagedinvestmentschemes 53,520 53,173Debtsecurities2 34,512 35,743Investmentsinunlistedmanagedinvestmentschemes 21,359 19,421Derivativefinancialassets 1,195 1,790Otherfinancialassets 5 8
Totalfinancialassetsmeasuredatfairvaluethroughprofitorloss 110,591 110,135
Available-for-salefinancialassets Equitysecuritiesandmanagedinvestmentschemes 67 66
Totalavailable-for-salefinancialassets 67 66
Financialassetsmeasuredatamortisedcost3 Loansandadvances 17,204 15,281Debtsecurities–heldtomaturity 1,557 1,739
Totalfinancialassetsmeasuredatamortisedcost 18,761 17,020
Totalfinancialassets 129,419 127,221
Otherfinancialliabilities Derivativefinancialliabilities 1,150 883Collateraldepositsheld2 92 225
Totalotherfinancialliabilities 1,242 1,108
1 FinancialassetsmeasuredatfairvaluethroughprofitorlossaremainlyassetsoftheAMPlifeinsuranceentities’statutoryfundsandtheircontrolledentities.
2 IncludedwithindebtsecuritiesareassetsheldtobacktheliabilityforcollateraldepositsfordebtsecurityrepurchasearrangementsenteredintobytheAMPlifeinsuranceentities’statutoryfundsandtheircontrolledentities.Collateraldepositsheldaremostlyinrespectoftheobligationtorepaycollateralforthedebtsecurityrepurchasearrangements.
3 FinancialassetsmeasuredatamortisedcostaremainlyassetsofAMPBank.
For
per
sona
l use
onl
y
AMP 2016 annual report 69
2.1 Investments in financial instruments (continued)Accountingpolicy–recognitionandmeasurementFinancialassetsmeasuredatfairvaluethroughprofitorlossFinancialassetsdesignatedoninitialrecognitionas financial assets measured at fair value through profit or lossareinitiallyrecognisedatfairvaluedeterminedasthepurchasecostoftheasset,exclusiveofanytransactioncosts.Transactioncostsareexpensedasincurredinprofitorloss.AnyrealisedandunrealisedgainsorlossesarisingfromsubsequentmeasurementatfairvaluearerecognisedintheIncomestatementintheperiodinwhichtheyarise.
Available-for-salefinancialassetsFinancialassetswhichareneitherdesignatedasfairvaluethroughprofitorlossnormeasuredatamortisedcostareclassifiedasavailable-for-sale.Measurementisinaccordancewithfinancialassetsmeasuredatfairvaluethroughprofitorlossbutanyunrealisedgainsorlossesarisingfromsubsequentmeasurementatfairvaluearetakentoothercomprehensiveincomeandonlytransferredtoprofitandlosswhentheyarerealised.
Detailsonhowthefairvaluesforfinancialassetsaredeterminedfollowinginitialrecognitionaredisclosedinnote2.5.
FinancialassetsmeasuredatamortisedcostLoans,advancesandotherreceivableswhicharisewhenAMPBankprovidesmoneydirectlytoacustomer,includingloansandadvancestoadvisers,withnointentionoftradingthefinancialassets,aremeasuredatamortisedcost.AllotherdebtsecuritiesheldbyAMPBankareclassifiedasheldtomaturityinvestments.Heldtomaturityinvestmentsarenon-derivativeassetswithfixedordeterminablepaymentsandfixedmaturitiesthatmanagementhasthepositiveintentionandabilitytoholdtomaturity.
Financialassetsmeasuredatamortisedcostareinitiallyrecognisedatfairvalueplustransactioncoststhataredirectlyattributabletotheacquisitionorissueofthefinancialasset.Theseassetsaresubsequentlyrecognisedatamortisedcostusingtheeffectiveinterestratemethod.
Recognitionandde-recognitionoffinancialassetsandliabilitiesFinancialassetsandfinancialliabilitiesarerecognisedatthedatetheAMPgroupbecomesapartytothecontractualprovisionsoftheinstrument.Financialassetsarede-recognisedwhenthecontractualrightstothecashflowsfromthefinancialassetsexpire,oraretransferred.Atransferoccurswhensubstantiallyalltherisksandrewardsofownershipofthefinancialassetarepassedtoanunrelatedthirdparty.Financialliabilitiesarede-recognisedwhentheobligationspecifiedinthecontractisdischarged,cancelledorexpires.
ImpairmentoffinancialassetsAssetsmeasuredatfairvalue,wherechangesinfairvaluearereflectedintheIncomestatement,arenotsubjecttoimpairmenttesting.
Forfinancialassetsmeasuredatamortisedcost,includingloans,advances,heldtomaturityinvestmentsandotherreceivables,impairmentisrecognisedintheIncomestatementwhenthereisobjectiveevidencealosshasbeenincurred.Itismeasuredasthedifferencebetweenthecarryingamountandthepresentvalueofestimatedfuturecashflows,discountedattheoriginaleffectiveinterestrate.
Criticalaccountingestimatesandjudgements:Financial assets measured at fair valueWhere available, quoted market prices for the same or similar instruments are used to determine fair value. Where there is no market price available for an instrument, a valuation technique is used. Management applies judgement in selecting valuation techniques and setting valuation assumptions and inputs.
For
per
sona
l use
onl
y
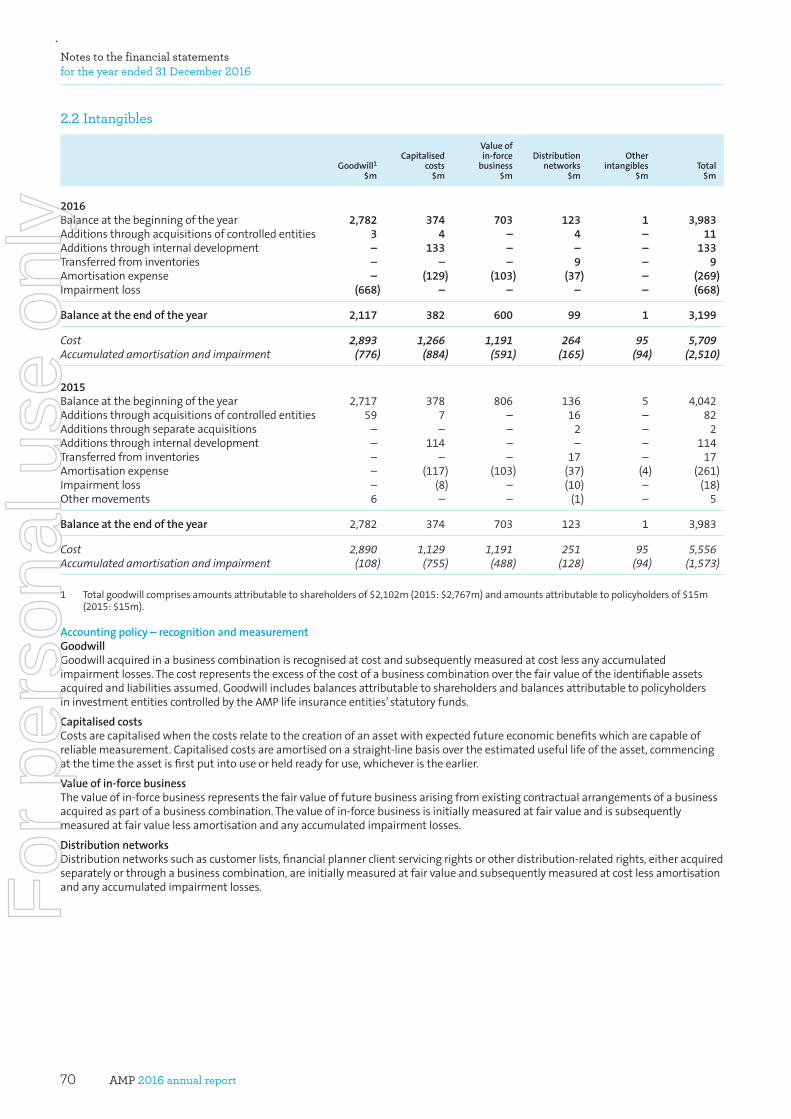
AMP 2016 annual report70
Notes to the financial statements for the year ended 31 December 2016
2.2 Intangibles
Goodwill1
$m
Capitalisedcosts
$m
Valueofin-force
business$m
Distributionnetworks
$m
Otherintangibles
$mTotal
$m
2016Balanceatthebeginningoftheyear 2,782 374 703 123 1 3,983Additionsthroughacquisitionsofcontrolledentities 3 4 – 4 – 11Additionsthroughinternaldevelopment – 133 – – – 133Transferredfrominventories – – – 9 – 9Amortisationexpense – (129) (103) (37) – (269)Impairmentloss (668) – – – – (668)
Balanceattheendoftheyear 2,117 382 600 99 1 3,199
Cost 2,893 1,266 1,191 264 95 5,709 Accumulated amortisation and impairment (776) (884) (591) (165) (94) (2,510)
2015 Balanceatthebeginningoftheyear 2,717 378 806 136 5 4,042Additionsthroughacquisitionsofcontrolledentities 59 7 – 16 – 82Additionsthroughseparateacquisitions – – – 2 – 2Additionsthroughinternaldevelopment – 114 – – – 114Transferredfrominventories – – – 17 – 17Amortisationexpense – (117) (103) (37) (4) (261)Impairmentloss – (8) – (10) – (18)Othermovements 6 – – (1) – 5
Balanceattheendoftheyear 2,782 374 703 123 1 3,983
Cost 2,890 1,129 1,191 251 95 5,556 Accumulated amortisation and impairment (108) (755) (488) (128) (94) (1,573)
1 Totalgoodwillcomprisesamountsattributabletoshareholdersof$2,102m(2015:$2,767m)andamountsattributabletopolicyholdersof$15m(2015:$15m).
Accountingpolicy–recognitionandmeasurementGoodwillGoodwillacquiredinabusinesscombinationisrecognisedatcostandsubsequentlymeasuredatcostlessanyaccumulatedimpairmentlosses.Thecostrepresentstheexcessofthecostofabusinesscombinationoverthefairvalueoftheidentifiableassetsacquiredandliabilitiesassumed.GoodwillincludesbalancesattributabletoshareholdersandbalancesattributabletopolicyholdersininvestmententitiescontrolledbytheAMPlifeinsuranceentities’statutoryfunds.
CapitalisedcostsCostsarecapitalisedwhenthecostsrelatetothecreationofanassetwithexpectedfutureeconomicbenefitswhicharecapableofreliablemeasurement.Capitalisedcostsareamortisedonastraight-linebasisovertheestimatedusefullifeoftheasset,commencingatthetimetheassetisfirstputintouseorheldreadyforuse,whicheveristheearlier.
Valueofin-forcebusinessThevalueofin-forcebusinessrepresentsthefairvalueoffuturebusinessarisingfromexistingcontractualarrangementsofabusinessacquiredaspartofabusinesscombination.Thevalueofin-forcebusinessisinitiallymeasuredatfairvalueandissubsequentlymeasuredatfairvaluelessamortisationandanyaccumulatedimpairmentlosses.
DistributionnetworksDistributionnetworkssuchascustomerlists,financialplannerclientservicingrightsorotherdistribution-relatedrights,eitheracquiredseparatelyorthroughabusinesscombination,areinitiallymeasuredatfairvalueandsubsequentlymeasuredatcostlessamortisationandanyaccumulatedimpairmentlosses.F
or p
erso
nal u
se o
nly
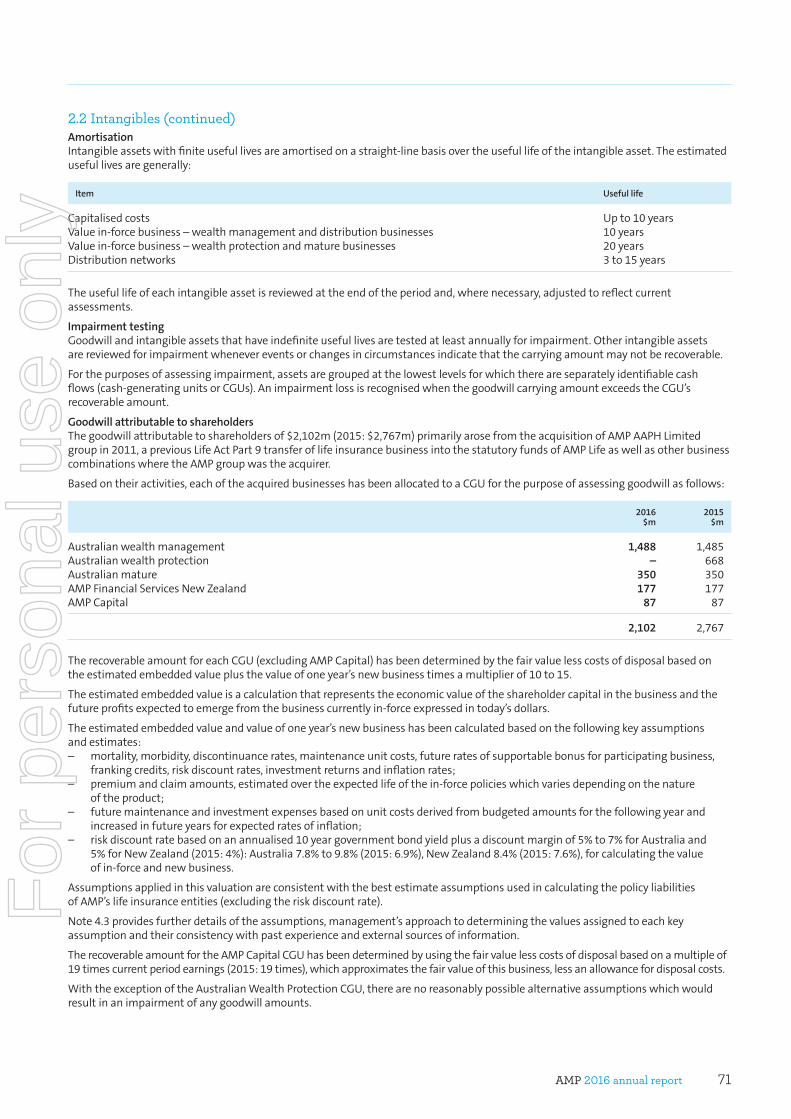
AMP 2016 annual report 71
2.2 Intangibles (continued)AmortisationIntangibleassetswithfiniteusefullivesareamortisedonastraight-linebasisovertheusefullifeoftheintangibleasset.Theestimatedusefullivesaregenerally:
Item Usefullife
Capitalisedcosts Upto10yearsValuein-forcebusiness–wealthmanagementanddistributionbusinesses 10yearsValuein-forcebusiness–wealthprotectionandmaturebusinesses 20yearsDistributionnetworks 3to15years
Theusefullifeofeachintangibleassetisreviewedattheendoftheperiodand,wherenecessary,adjustedtoreflectcurrentassessments.
ImpairmenttestingGoodwillandintangibleassetsthathaveindefiniteusefullivesaretestedatleastannuallyforimpairment.Otherintangibleassetsarereviewedforimpairmentwhenevereventsorchangesincircumstancesindicatethatthecarryingamountmaynotberecoverable.
Forthepurposesofassessingimpairment,assetsaregroupedatthelowestlevelsforwhichthereareseparatelyidentifiablecashflows(cash-generatingunitsorCGUs).AnimpairmentlossisrecognisedwhenthegoodwillcarryingamountexceedstheCGU’srecoverableamount.
GoodwillattributabletoshareholdersThegoodwillattributabletoshareholdersof$2,102m(2015:$2,767m)primarilyarosefromtheacquisitionofAMPAAPHLimitedgroupin2011,apreviousLifeActPart9transferoflifeinsurancebusinessintothestatutoryfundsofAMPLifeaswellasotherbusinesscombinationswheretheAMPgroupwastheacquirer.
Basedontheiractivities,eachoftheacquiredbusinesseshasbeenallocatedtoaCGUforthepurposeofassessinggoodwillasfollows:
2016$m
2015$m
Australianwealthmanagement 1,488 1,485Australianwealthprotection – 668Australianmature 350 350AMPFinancialServicesNewZealand 177 177AMPCapital 87 87
2,102 2,767
TherecoverableamountforeachCGU(excludingAMPCapital)hasbeendeterminedbythefairvaluelesscostsofdisposalbasedontheestimatedembeddedvalueplusthevalueofoneyear’snewbusinesstimesamultiplierof10to15.
Theestimatedembeddedvalueisacalculationthatrepresentstheeconomicvalueoftheshareholdercapitalinthebusinessandthefutureprofitsexpectedtoemergefromthebusinesscurrentlyin-forceexpressedintoday’sdollars.
Theestimatedembeddedvalueandvalueofoneyear’snewbusinesshasbeencalculatedbasedonthefollowingkeyassumptionsandestimates:– mortality,morbidity,discontinuancerates,maintenanceunitcosts,futureratesofsupportablebonusforparticipatingbusiness,
frankingcredits,riskdiscountrates,investmentreturnsandinflationrates;– premiumandclaimamounts,estimatedovertheexpectedlifeofthein-forcepolicieswhichvariesdependingonthenature
oftheproduct;– futuremaintenanceandinvestmentexpensesbasedonunitcostsderivedfrombudgetedamountsforthefollowingyearand
increasedinfutureyearsforexpectedratesofinflation;– riskdiscountratebasedonanannualised10yeargovernmentbondyieldplusadiscountmarginof5%to7%forAustraliaand
5%forNewZealand(2015:4%):Australia7.8%to9.8%(2015:6.9%),NewZealand8.4%(2015:7.6%),forcalculatingthevalueofin-forceandnewbusiness.
AssumptionsappliedinthisvaluationareconsistentwiththebestestimateassumptionsusedincalculatingthepolicyliabilitiesofAMP’slifeinsuranceentities(excludingtheriskdiscountrate).
Note4.3providesfurtherdetailsoftheassumptions,management’sapproachtodeterminingthevaluesassignedtoeachkeyassumptionandtheirconsistencywithpastexperienceandexternalsourcesofinformation.
TherecoverableamountfortheAMPCapitalCGUhasbeendeterminedbyusingthefairvaluelesscostsofdisposalbasedonamultipleof19timescurrentperiodearnings(2015:19times),whichapproximatesthefairvalueofthisbusiness,lessanallowancefordisposalcosts.
WiththeexceptionoftheAustralianWealthProtectionCGU,therearenoreasonablypossiblealternativeassumptionswhichwouldresultinanimpairmentofanygoodwillamounts.
For
per
sona
l use
onl
y
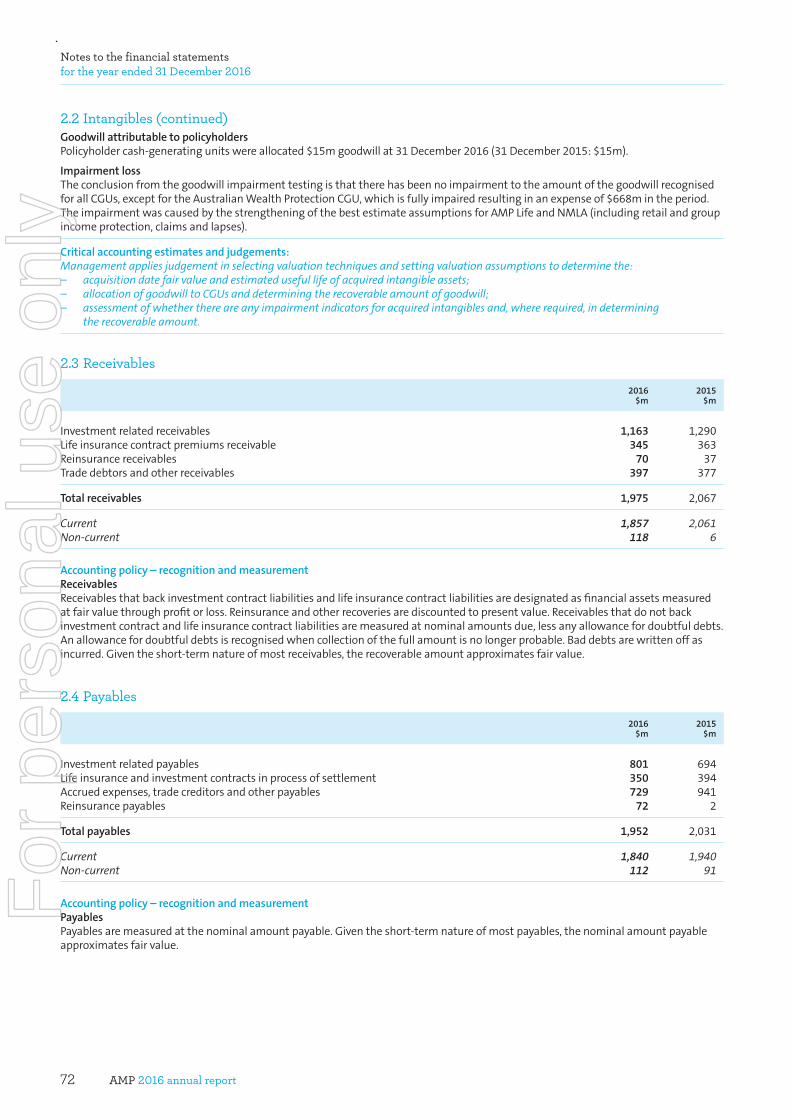
AMP 2016 annual report72
Notes to the financial statements for the year ended 31 December 2016
2.2 Intangibles (continued)GoodwillattributabletopolicyholdersPolicyholdercash-generatingunitswereallocated$15mgoodwillat31December2016(31December2015:$15m).
ImpairmentlossTheconclusionfromthegoodwillimpairmenttestingisthattherehasbeennoimpairmenttotheamountofthegoodwillrecognisedforallCGUs,exceptfortheAustralianWealthProtectionCGU,whichisfullyimpairedresultinginanexpenseof$668mintheperiod.TheimpairmentwascausedbythestrengtheningofthebestestimateassumptionsforAMPLifeandNMLA(includingretailandgroupincomeprotection,claimsandlapses).
Criticalaccountingestimatesandjudgements:Management applies judgement in selecting valuation techniques and setting valuation assumptions to determine the:– acquisition date fair value and estimated useful life of acquired intangible assets;– allocation of goodwill to CGUs and determining the recoverable amount of goodwill;– assessment of whether there are any impairment indicators for acquired intangibles and, where required, in determining
the recoverable amount.
2.3 Receivables
2016$m
2015$m
Investmentrelatedreceivables 1,163 1,290Lifeinsurancecontractpremiumsreceivable 345 363Reinsurancereceivables 70 37Tradedebtorsandotherreceivables 397 377
Totalreceivables 1,975 2,067
Current 1,857 2,061 Non-current 118 6
Accountingpolicy–recognitionandmeasurementReceivablesReceivablesthatbackinvestmentcontractliabilitiesandlifeinsurancecontractliabilitiesaredesignatedasfinancialassetsmeasuredatfairvaluethroughprofitorloss.Reinsuranceandotherrecoveriesarediscountedtopresentvalue.Receivablesthatdonotbackinvestmentcontractandlifeinsurancecontractliabilitiesaremeasuredatnominalamountsdue,lessanyallowancefordoubtfuldebts.Anallowancefordoubtfuldebtsisrecognisedwhencollectionofthefullamountisnolongerprobable.Baddebtsarewrittenoffasincurred.Giventheshort-termnatureofmostreceivables,therecoverableamountapproximatesfairvalue.
2.4 Payables
2016$m
2015$m
Investmentrelatedpayables 801 694Lifeinsuranceandinvestmentcontractsinprocessofsettlement 350 394Accruedexpenses,tradecreditorsandotherpayables 729 941Reinsurancepayables 72 2
Totalpayables 1,952 2,031
Current 1,840 1,940 Non-current 112 91
Accountingpolicy–recognitionandmeasurementPayablesPayablesaremeasuredatthenominalamountpayable.Giventheshort-termnatureofmostpayables,thenominalamountpayableapproximatesfairvalue.
For
per
sona
l use
onl
y
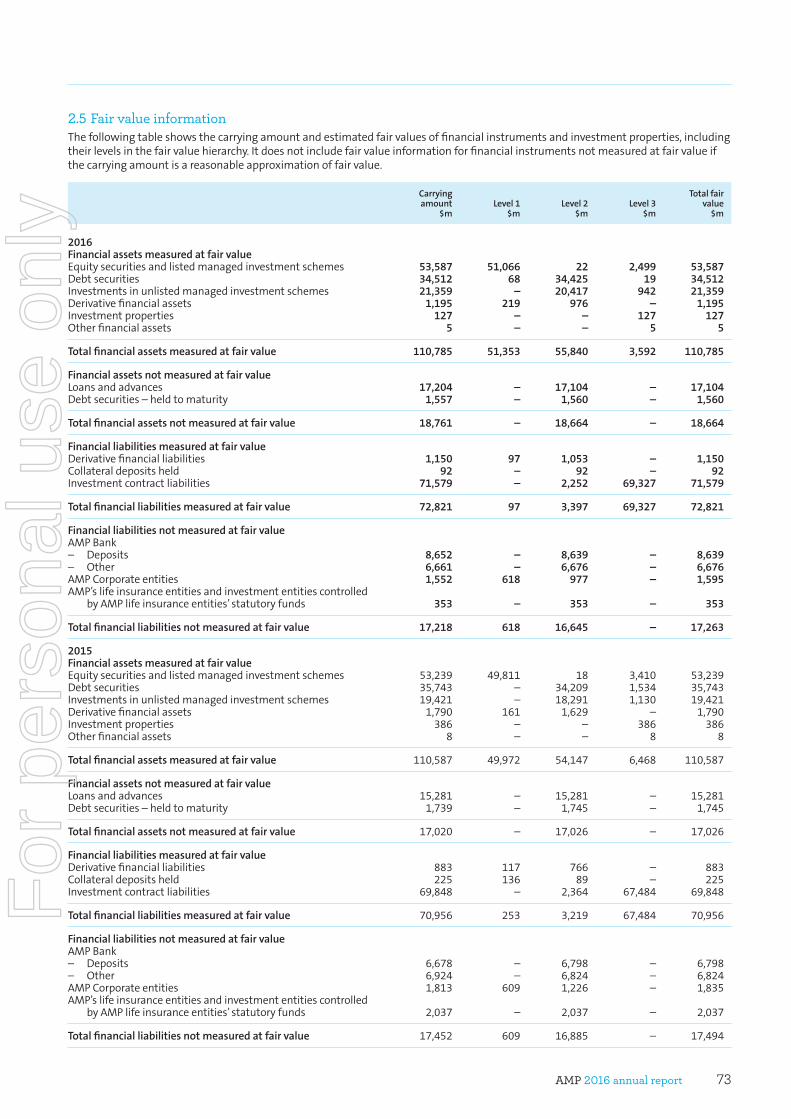
AMP 2016 annual report 73
2.5 Fair value informationThefollowingtableshowsthecarryingamountandestimatedfairvaluesoffinancialinstrumentsandinvestmentproperties,includingtheirlevelsinthefairvaluehierarchy.Itdoesnotincludefairvalueinformationforfinancialinstrumentsnotmeasuredatfairvalueifthecarryingamountisareasonableapproximationoffairvalue.
Carryingamount
$mLevel1
$mLevel2
$mLevel3
$m
Totalfairvalue
$m
2016Financialassetsmeasuredatfairvalue Equitysecuritiesandlistedmanagedinvestmentschemes 53,587 51,066 22 2,499 53,587Debtsecurities 34,512 68 34,425 19 34,512Investmentsinunlistedmanagedinvestmentschemes 21,359 – 20,417 942 21,359Derivativefinancialassets 1,195 219 976 – 1,195Investmentproperties 127 – – 127 127Otherfinancialassets 5 – – 5 5
Totalfinancialassetsmeasuredatfairvalue 110,785 51,353 55,840 3,592 110,785
Financialassetsnotmeasuredatfairvalue Loansandadvances 17,204 – 17,104 – 17,104Debtsecurities–heldtomaturity 1,557 – 1,560 – 1,560
Totalfinancialassetsnotmeasuredatfairvalue 18,761 – 18,664 – 18,664
FinancialliabilitiesmeasuredatfairvalueDerivativefinancialliabilities 1,150 97 1,053 – 1,150Collateraldepositsheld 92 – 92 – 92Investmentcontractliabilities 71,579 – 2,252 69,327 71,579
Totalfinancialliabilitiesmeasuredatfairvalue 72,821 97 3,397 69,327 72,821
Financialliabilitiesnotmeasuredatfairvalue AMPBank– Deposits 8,652 – 8,639 – 8,639– Other 6,661 – 6,676 – 6,676AMPCorporateentities 1,552 618 977 – 1,595AMP’slifeinsuranceentitiesandinvestmententitiescontrolled byAMPlifeinsuranceentities’statutoryfunds 353 – 353 – 353
Totalfinancialliabilitiesnotmeasuredatfairvalue 17,218 618 16,645 – 17,263
2015 Financialassetsmeasuredatfairvalue Equitysecuritiesandlistedmanagedinvestmentschemes 53,239 49,811 18 3,410 53,239Debtsecurities 35,743 – 34,209 1,534 35,743Investmentsinunlistedmanagedinvestmentschemes 19,421 – 18,291 1,130 19,421Derivativefinancialassets 1,790 161 1,629 – 1,790Investmentproperties 386 – – 386 386Otherfinancialassets 8 – – 8 8
Totalfinancialassetsmeasuredatfairvalue 110,587 49,972 54,147 6,468 110,587
Financialassetsnotmeasuredatfairvalue Loansandadvances 15,281 – 15,281 – 15,281Debtsecurities–heldtomaturity 1,739 – 1,745 – 1,745
Totalfinancialassetsnotmeasuredatfairvalue 17,020 – 17,026 – 17,026
Financialliabilitiesmeasuredatfairvalue Derivativefinancialliabilities 883 117 766 – 883Collateraldepositsheld 225 136 89 – 225Investmentcontractliabilities 69,848 – 2,364 67,484 69,848
Totalfinancialliabilitiesmeasuredatfairvalue 70,956 253 3,219 67,484 70,956
Financialliabilitiesnotmeasuredatfairvalue AMPBank – Deposits 6,678 – 6,798 – 6,798– Other 6,924 – 6,824 – 6,824AMPCorporateentities 1,813 609 1,226 – 1,835AMP’slifeinsuranceentitiesandinvestmententitiescontrolled byAMPlifeinsuranceentities’statutoryfunds 2,037 – 2,037 – 2,037
Totalfinancialliabilitiesnotmeasuredatfairvalue 17,452 609 16,885 – 17,494
For
per
sona
l use
onl
y
AMP 2016 annual report74
Notes to the financial statements for the year ended 31 December 2016
2.5 Fair value information (continued)AMP’smethodologyandassumptionsusedtoestimatethefairvalueoffinancialinstrumentsaredescribedbelow:
Listed equity securities and listed managed investment schemes
Thefairvalueoflistedequitysecuritiestradedinanactivemarketandlistedmanagedinvestmentschemesreflectsthequotedbidpriceatthereportingdate.Inthecaseofequitysecuritiesandlistedmanagedinvestmentschemeswherethereisnoactivemarket,fairvalueisestablishedusingvaluationtechniquesincludingtheuseofrecentarm’slengthtransactions,referencestootherinstrumentsthataresubstantiallythesame,discountedcashflowanalysisandoptionpricingmodels.
Debt securities Thefairvalueoflisteddebtsecuritiesreflectsthebidpriceatthereportingdate.Listeddebtsecuritiesthatarenotfrequentlytradedarevaluedbydiscountingestimatedrecoverableamounts.
Thefairvalueofunlisteddebtsecuritiesisestimatedusinginterestrateyieldsobtainableoncomparablelistedinvestments.Thefairvalueofloansisdeterminedbydiscountingtheestimatedrecoverableamountusingprevailinginterestrates.
Loans Theestimatedfairvalueofloansrepresentsthediscountedamountofestimatedfuturecashflowsexpectedtobereceived,basedonthematurityprofileoftheloans.Astheloansareunlisted,thediscountratesappliedarebasedontheyieldcurvesappropriatetotheremainingtermoftheloans.Theloansmaybemeasuredatanamountinexcessoffairvalueduetofluctuationsonfixedrateloans.Asthefluctuationsinfairvaluedonotrepresentapermanentdiminutionandthecarryingamountsoftheloansarerecordedatrecoverableamountsafterassessingimpairment,itisnotappropriatetorestatetheircarryingamount.
Unlisted managed investment schemes
Thefairvalueofinvestmentsinunlistedmanagedinvestmentschemesisdeterminedonthebasisofpublishedredemptionpricesofthosemanagedinvestmentschemesatthereportingdate.
Derivative financial assets and liabilities
Thefairvalueoffinancialinstrumentstradedinactivemarkets(suchaspubliclytradedderivatives)isbasedonquotedmarketprices(currentbidpriceorcurrentofferprice)atthereportingdate.Thefairvalueoffinancialinstrumentsnottradedinanactivemarket(egover-the-counterderivatives)isdeterminedusingvaluationtechniques.Valuationtechniquesincludenetpresentvaluetechniques,optionpricingmodels,discountedcashflowmethodsandcomparisontoquotedmarketpricesordealerquotesforsimilarinstruments.
Subordinated debt Thefairvalueofsubordinateddebtisdeterminedwithreferencetoquotedmarketpricesatthereportingdate.
Thefinancialassetsandliabilitiesmeasuredatfairvaluearecategorisedusingthefairvaluehierarchywhichreflectsthesignificanceofinputsintothedeterminationoffairvalueasfollows:– Level1:thefairvalueisvaluedbyreferencetoquotedpricesandactivemarketsforidenticalassets– Level2:thefairvalueisestimatedusinginputsotherthanquotedpricesincludedwithinLevel1thatareobservableforthe
assetorliability,eitherdirectly(asprices)orindirectly(derivedfromprices)– Level3:thefairvalueisestimatedusinginputsfortheassetorliabilitythatarenotbasedonobservablemarketdata.
TherehavebeennosignificanttransfersbetweenLevel1andLevel2duringthe2016and2015financialyears.Transfersto/fromLevel3areshownintheReconciliationofLevel3valuestablelaterinthisnote.
For
per
sona
l use
onl
y
AMP 2016 annual report 75
2.5 Fair value information (continued)Level3fairvaluesThefollowingtableshowsthevaluationtechniquesusedinmeasuringLevel3fairvalues,aswellasthesignificantunobservableinputsused.
Type Valuationtechnique Significantunobservableinputs
Equitysecuritiesandlistedmanagedinvestmentschemes
Discountedcashflowapproachutilisingcostofequityasthediscountrate.
Discountrate.Terminalvaluegrowthrate.Cashflowforecasts.
Debtsecurities Discountedcashflowapproach. Discountrate.Cashflowforecasts.
Investmentsinunlistedmanagedinvestmentschemes
Publishedredemptionprices. Judgementmadeindeterminingunitprices.
Investmentcontractliabilities Valuationmodelbasedonpublishedunitpricesandthefairvalueofbackingassets.
Fixedretirementincomepolicies–discountedcashflow.
Fairvalueoffinancialinstruments.Cashflowforecasts.Creditrisk.
SensitivityanalysisReasonablypossiblealternativeassumptionscouldhavebeenusedindeterminingthefairvaluesoffinancialinstrumentscategorisedasLevel3.Thefollowingtableshowsthesensitivitytochangesinkeyassumptions,calculatedbychangingoneormoreofthesignificantunobservableinputsforindividualassets.Thisincludedassumptionssuchascreditriskanddiscountratesfordeterminingthevaluationrangeonanindividualestimate.
2016 2015
(+)$m
(–)$m
(+)$m
(–)$m
Financialassets Equitysecuritiesandlistedmanagedinvestmentschemes 146 (153) 206 (206)
FinancialliabilitiesInvestmentcontractliabilities 6 (5) 8 (7)
FinancialassetsvaluationprocessForfinancialassetscategorisedwithinLevel3ofthefairvaluehierarchy,thevaluationprocessesappliedinvaluingsuchassetsisgovernedbytheAMPCapitalassetvaluationpolicy.Thispolicyoutlinestheassetvaluationmethodologiesandprocessesappliedtomeasurenon-exchangetradedassetswhichhavenoregularmarketprice,includinginvestmentproperty,infrastructure,privateequity,alternativeassetsandilliquiddebtsecurities.AllsignificantLevel3assetsarereferredtotheappropriatevaluationcommitteewhomeetatleasteverysixmonths,ormorefrequentlyifrequired.
For
per
sona
l use
onl
y
AMP 2016 annual report76
Notes to the financial statements for the year ended 31 December 2016
2.5 Fair value information (continued)ReconciliationofLevel3valuesThefollowingtableshowsmovementsinthefairvaluesoffinancialinstrumentscategorisedasLevel3inthefairvaluehierarchy:
Balanceatthe
beginningoftheperiod
$m
FXgainsorlosses1
$m
Totalgains/losses1
$m
Purchases/deposits
$m
Sales/withdrawals
$m
Nettransfersin/(out)2
$m
Balanceattheendoftheperiod
$m
Totalgainsandlosseson
assetsandliabilities
heldatreporting
date$m
2016 AssetsclassifiedasLevel3
Equitysecuritiesandlisted managedinvestmentschemes 3,410 – 191 271 (1,580) 207 2,499 190Debtsecurities 1,534 – (3) 2 (1,329) (185) 19 (2)Investmentsinunlistedmanaged investmentschemes 1,130 3 10 96 (25) (272) 942 8Investmentproperties 386 – 105 6 (370) – 127 105Otherfinancialassets 8 – (1) – (2) – 5 (1)
LiabilitiesclassifiedasLevel3 Investmentcontractliabilities 67,484 7 3,413 10,785 (12,362) – 69,327 3,333
2015 AssetsclassifiedasLevel3
Equitysecuritiesandlisted managedinvestmentschemes 2,354 48 378 942 (435) 123 3,410 379Debtsecurities 599 55 210 764 (93) (1) 1,534 209Investmentsinunlistedmanaged investmentschemes 850 – 44 383 (21) (127) 1,130 52Investmentproperties 340 – 71 1 (26) – 386 71Otherfinancialassets 9 – – – (1) – 8 –
LiabilitiesclassifiedasLevel3 Investmentcontractliabilities 64,448 (5) 3,100 11,743 (11,802) – 67,484 2,755
1 GainsandlossesareclassifiedininvestmentgainsandlossesorchangeinpolicyholderliabilitiesintheIncomestatement.2 TheAMPgrouprecognisestransfersasattheendofthereportingperiodduringwhichthetransferhasoccurred.Transfersarerecognisedwhen
therearechangesintheobservabilityofthepricingoftherelevantsecuritiesorwheretheAMPgroupceasestoconsolidateacontrolledentity.
For
per
sona
l use
onl
y
AMP 2016 annual report 77
Section 3: Capital structure and financial risk managementThissectionprovidesinformationrelatingto:– AMPgroup’scapitalmanagementandequityanddebtstructure;and– exposuretofinancialrisks–howtherisksaffectfinancialpositionandperformanceandhowtherisksaremanaged,
includingtheuseofderivativefinancialinstruments.
ThecapitalstructureoftheAMPgroupconsistsofequityanddebt.AMPdeterminestheappropriatecapitalstructureinordertofinancethecurrentandfutureactivitiesoftheAMPgroupandsatisfytherequirementsoftheregulator.Thedirectorsreviewthegroup’scapitalstructureanddividendpolicyregularlyanddosointhecontextofthegroup’sabilitytosatisfyminimumandtargetcapitalrequirements,andtoprotectandmeettheneedsofthepolicyholders.
3.1 Contributedequity3.2 Interest-bearingliabilities3.3 Financialriskmanagement3.4 Otherderivativeinformation3.5 Capitalmanagement
3.1 Contributed equity
2016$m
2015$m
Issuedcapital1 2,957,737,964(2015:2,957,737,964)ordinarysharesfullypaid 9,747 9,747Treasuryshares2 23,539,463(2015:33,390,553)treasuryshares (128) (181)
Totalcontributedequity2,934,198,501(2015:2,924,347,411)ordinarysharesfullypaid 9,619 9,566
Issuedcapital Balanceatthebeginningoftheyear 9,747 9,747
Balanceattheendoftheyear 9,747 9,747
Treasuryshares Balanceatthebeginningoftheyear (181) (239)Decreaseduetopurchaseslesssalesduringtheyear 53 58
Balanceattheendoftheyear (128) (181)
Holdersofordinaryshareshavetherighttoreceivedividendsasdeclaredand,intheeventofthewindingupofthecompany,toparticipateintheproceedsfromthesaleofallsurplusassetsinproportiontothenumberofandamountspaiduponsharesheld.Fullypaidordinarysharescarrytherighttoonevotepershare.Ordinaryshareshavenoparvalue.
1 Underthetermsofthedividendreinvestmentplan(DRP),shareholdersmayelecttohaveallorpartoftheirdividendentitlementssatisfiedinsharesratherthanbeingpaidcash.TheDRPappliedforthe2015finaldividend(paidinApril2016)at14.0centspershareand2016interimdividend(paidinOctober2016)at14.0centspershare.AMPsettledtheDRPforthe2015finaldividendand2016interimdividendbyacquiringsharesonmarketand,accordingly,nonewshareswereissued.
2 OftheAMPLimitedordinarysharesonissue21,413,076(2015:31,264,166)areheldbyAMP’slifeinsuranceentitiesonbehalfofpolicyholders.ASIChasgrantedrelieffromrestrictionsintheCorporations Act 2001toallowAMP’slifeinsuranceentitiestoholdandtradesharesinAMPLimitedaspartofthepolicyholderfunds’investmentactivities.Thecostoftheinvestmentinthesetreasurysharesisreflectedasadeductionfromtotalcontributedequity.TheremainingbalanceisheldbyAMPFoundationLimitedastrusteefortheAMPFoundation.
3 MitsubishiUFJTrustandBankingCorporation(MUTB)hasanoptiontorequireAMPLimitedtopurchaseMUTB’sinterestinAMPCapitalHoldingsLimited(AMPCH)incertaincircumstances.AsconsiderationfortheacquisitionofAMPCHshares,AMPwouldberequiredtoissueordinarysharesinAMPLimitedtoMUTB(oritsnominee).
For
per
sona
l use
onl
y
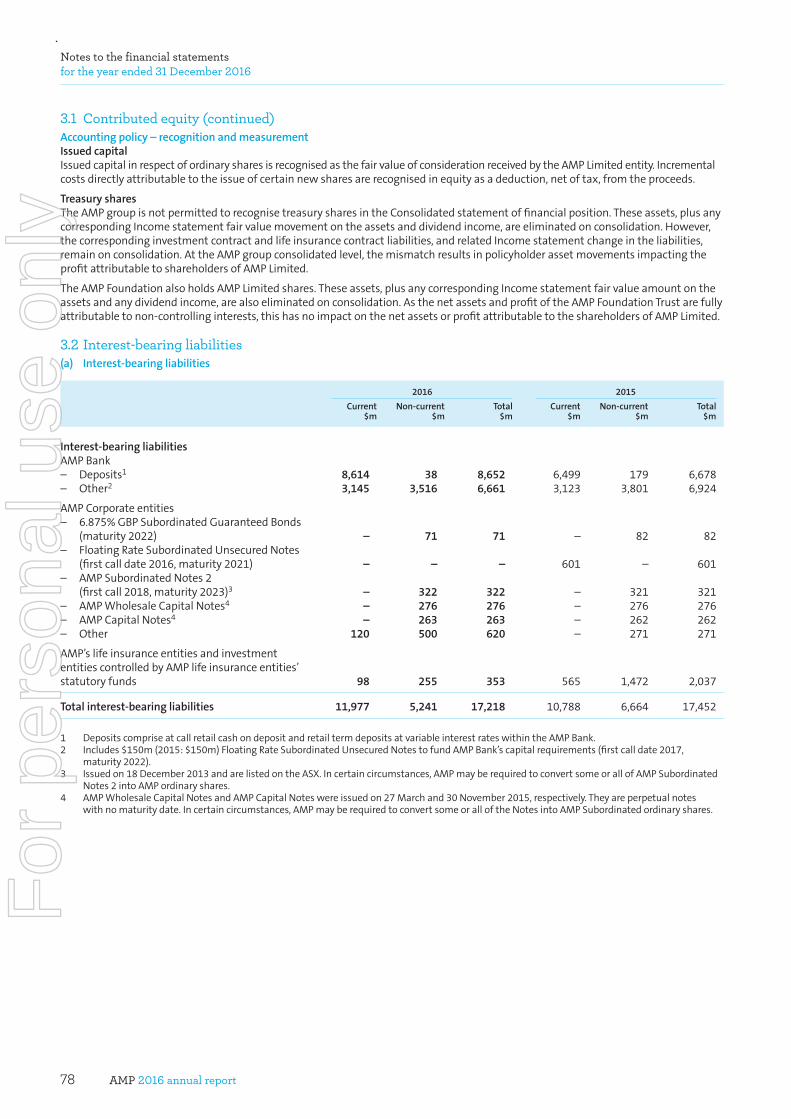
AMP 2016 annual report78
Notes to the financial statements for the year ended 31 December 2016
3.1 Contributed equity (continued)Accountingpolicy–recognitionandmeasurementIssuedcapitalIssuedcapitalinrespectofordinarysharesisrecognisedasthefairvalueofconsiderationreceivedbytheAMPLimitedentity.Incrementalcostsdirectlyattributabletotheissueofcertainnewsharesarerecognisedinequityasadeduction,netoftax,fromtheproceeds.
TreasurysharesTheAMPgroupisnotpermittedtorecognisetreasurysharesintheConsolidatedstatementoffinancialposition.Theseassets,plusanycorrespondingIncomestatementfairvaluemovementontheassetsanddividendincome,areeliminatedonconsolidation.However,thecorrespondinginvestmentcontractandlifeinsurancecontractliabilities,andrelatedIncomestatementchangeintheliabilities,remainonconsolidation.AttheAMPgroupconsolidatedlevel,themismatchresultsinpolicyholderassetmovementsimpactingtheprofitattributabletoshareholdersofAMPLimited.
TheAMPFoundationalsoholdsAMPLimitedshares.Theseassets,plusanycorrespondingIncomestatementfairvalueamountontheassetsandanydividendincome,arealsoeliminatedonconsolidation.AsthenetassetsandprofitoftheAMPFoundationTrustarefullyattributabletonon-controllinginterests,thishasnoimpactonthenetassetsorprofitattributabletotheshareholdersofAMPLimited.
3.2 Interest-bearing liabilities (a) Interest-bearingliabilities
2016 2015
Current$m
Non-current$m
Total$m
Current$m
Non-current$m
Total$m
Interest-bearingliabilitiesAMPBank– Deposits1 8,614 38 8,652 6,499 179 6,678– Other2 3,145 3,516 6,661 3,123 3,801 6,924
AMPCorporateentities – 6.875%GBPSubordinatedGuaranteedBonds
(maturity2022) – 71 71 – 82 82– FloatingRateSubordinatedUnsecuredNotes
(firstcalldate2016,maturity2021) – – – 601 – 601– AMPSubordinatedNotes2
(firstcall2018,maturity2023)3 – 322 322 – 321 321– AMPWholesaleCapitalNotes4 – 276 276 – 276 276– AMPCapitalNotes4 – 263 263 – 262 262– Other 120 500 620 – 271 271
AMP’slifeinsuranceentitiesandinvestmententitiescontrolledbyAMPlifeinsuranceentities’statutoryfunds 98 255 353 565 1,472 2,037
Totalinterest-bearingliabilities 11,977 5,241 17,218 10,788 6,664 17,452
1 DepositscompriseatcallretailcashondepositandretailtermdepositsatvariableinterestrateswithintheAMPBank.2 Includes$150m(2015:$150m)FloatingRateSubordinatedUnsecuredNotestofundAMPBank’scapitalrequirements(firstcalldate2017,
maturity2022).3 Issuedon18December2013andarelistedontheASX.Incertaincircumstances,AMPmayberequiredtoconvertsomeorallofAMPSubordinated
Notes2intoAMPordinaryshares.4 AMPWholesaleCapitalNotesandAMPCapitalNoteswereissuedon27Marchand30November2015,respectively.Theyareperpetualnotes
withnomaturitydate.Incertaincircumstances,AMPmayberequiredtoconvertsomeoralloftheNotesintoAMPSubordinatedordinaryshares.
For
per
sona
l use
onl
y
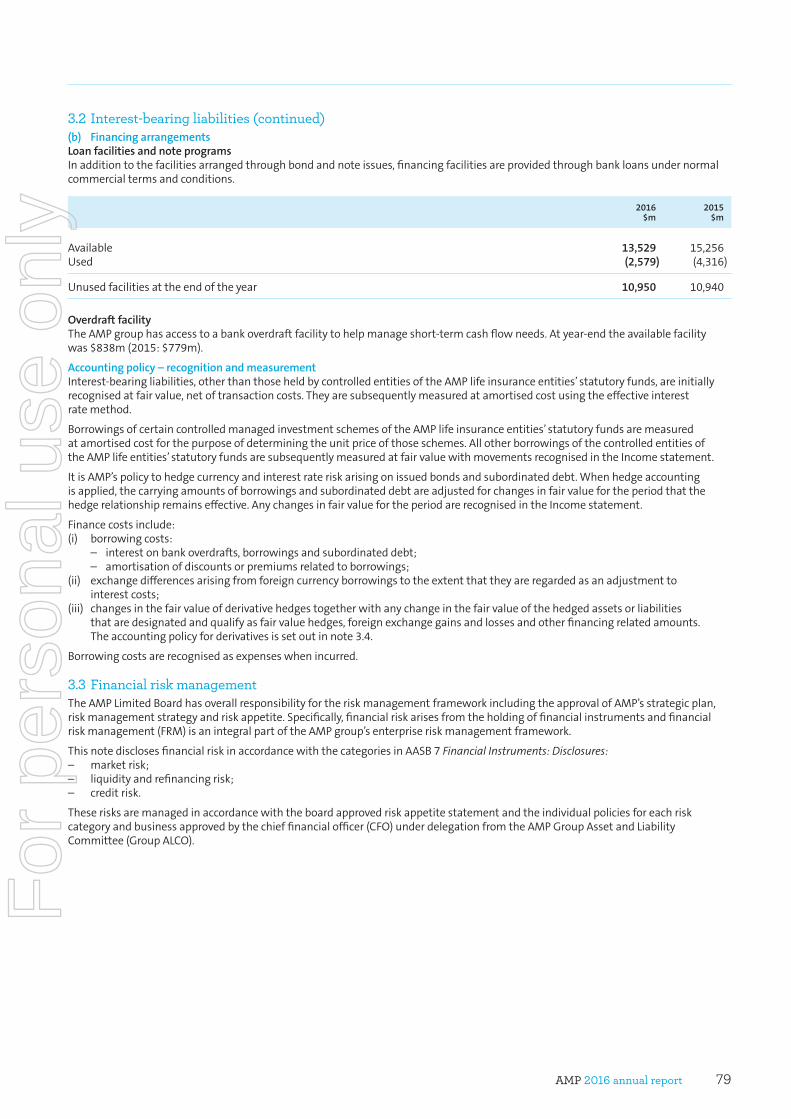
AMP 2016 annual report 79
3.2 Interest-bearing liabilities (continued)(b) FinancingarrangementsLoanfacilitiesandnoteprogramsInadditiontothefacilitiesarrangedthroughbondandnoteissues,financingfacilitiesareprovidedthroughbankloansundernormalcommercialtermsandconditions.
2016$m
2015$m
Available 13,529 15,256Used (2,579) (4,316)
Unusedfacilitiesattheendoftheyear 10,950 10,940
OverdraftfacilityTheAMPgrouphasaccesstoabankoverdraftfacilitytohelpmanageshort-termcashflowneeds.Atyear-endtheavailablefacilitywas$838m(2015:$779m).
Accountingpolicy–recognitionandmeasurementInterest-bearingliabilities,otherthanthoseheldbycontrolledentitiesoftheAMPlifeinsuranceentities’statutoryfunds,areinitiallyrecognisedatfairvalue,netoftransactioncosts.Theyaresubsequentlymeasuredatamortisedcostusingtheeffectiveinterestratemethod.
BorrowingsofcertaincontrolledmanagedinvestmentschemesoftheAMPlifeinsuranceentities’statutoryfundsaremeasuredatamortisedcostforthepurposeofdeterminingtheunitpriceofthoseschemes.AllotherborrowingsofthecontrolledentitiesoftheAMPlifeentities’statutoryfundsaresubsequentlymeasuredatfairvaluewithmovementsrecognisedintheIncomestatement.
ItisAMP’spolicytohedgecurrencyandinterestrateriskarisingonissuedbondsandsubordinateddebt.Whenhedgeaccountingisapplied,thecarryingamountsofborrowingsandsubordinateddebtareadjustedforchangesinfairvaluefortheperiodthatthehedgerelationshipremainseffective.AnychangesinfairvaluefortheperiodarerecognisedintheIncomestatement.
Financecostsinclude:(i) borrowingcosts: – interestonbankoverdrafts,borrowingsandsubordinateddebt; – amortisationofdiscountsorpremiumsrelatedtoborrowings;(ii) exchangedifferencesarisingfromforeigncurrencyborrowingstotheextentthattheyareregardedasanadjustmentto
interestcosts;(iii) changesinthefairvalueofderivativehedgestogetherwithanychangeinthefairvalueofthehedgedassetsorliabilities
thataredesignatedandqualifyasfairvaluehedges,foreignexchangegainsandlossesandotherfinancingrelatedamounts.Theaccountingpolicyforderivativesissetoutinnote3.4.
Borrowingcostsarerecognisedasexpenseswhenincurred.
3.3 Financial risk management TheAMPLimitedBoardhasoverallresponsibilityfortheriskmanagementframeworkincludingtheapprovalofAMP’sstrategicplan,riskmanagementstrategyandriskappetite.Specifically,financialriskarisesfromtheholdingoffinancialinstrumentsandfinancialriskmanagement(FRM)isanintegralpartoftheAMPgroup’senterpriseriskmanagementframework.
ThisnotedisclosesfinancialriskinaccordancewiththecategoriesinAASB7Financial Instruments: Disclosures:– marketrisk;– liquidityandrefinancingrisk;– creditrisk.
Theserisksaremanagedinaccordancewiththeboardapprovedriskappetitestatementandtheindividualpoliciesforeachriskcategoryandbusinessapprovedbythechieffinancialofficer(CFO)underdelegationfromtheAMPGroupAssetandLiabilityCommittee(GroupALCO).
For
per
sona
l use
onl
y
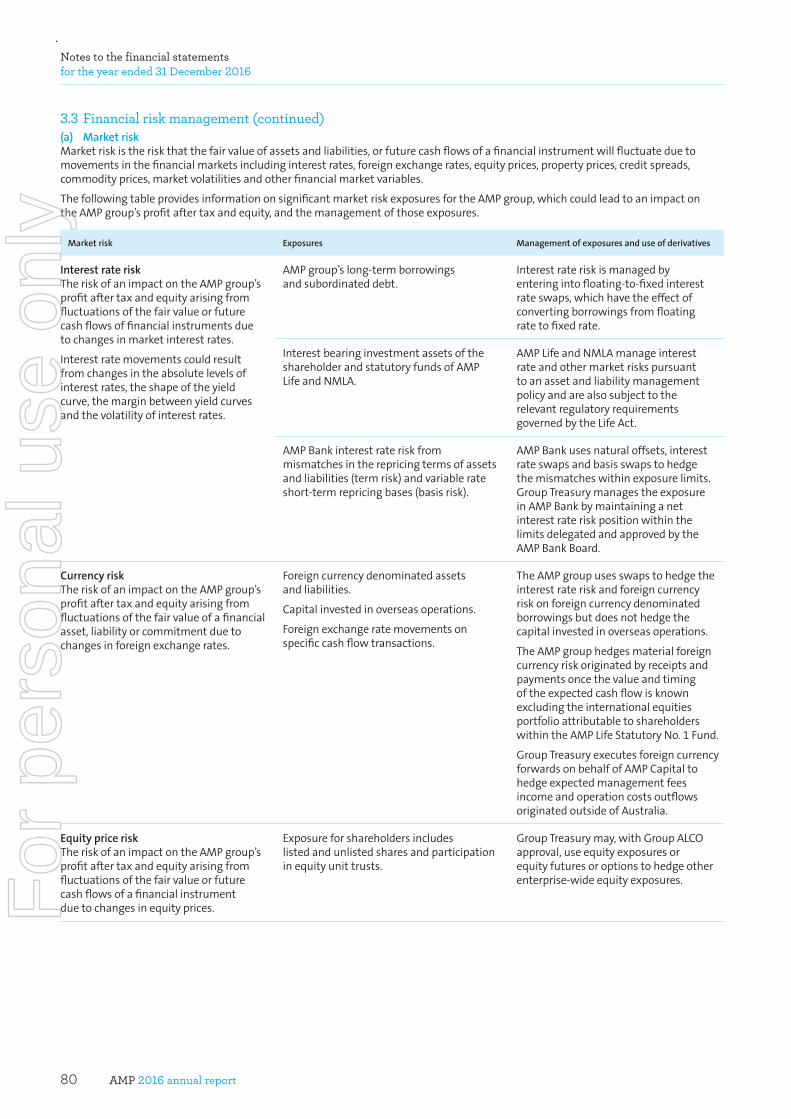
AMP 2016 annual report80
Notes to the financial statements for the year ended 31 December 2016
3.3 Financial risk management (continued)(a) MarketriskMarketriskistheriskthatthefairvalueofassetsandliabilities,orfuturecashflowsofafinancialinstrumentwillfluctuateduetomovementsinthefinancialmarketsincludinginterestrates,foreignexchangerates,equityprices,propertyprices,creditspreads,commodityprices,marketvolatilitiesandotherfinancialmarketvariables.
ThefollowingtableprovidesinformationonsignificantmarketriskexposuresfortheAMPgroup,whichcouldleadtoanimpactontheAMPgroup’sprofitaftertaxandequity,andthemanagementofthoseexposures.
Marketrisk Exposures Managementofexposuresanduseofderivatives
InterestrateriskTheriskofanimpactontheAMPgroup’sprofitaftertaxandequityarisingfromfluctuationsofthefairvalueorfuturecashflowsoffinancialinstrumentsduetochangesinmarketinterestrates.
Interestratemovementscouldresultfromchangesintheabsolutelevelsofinterestrates,theshapeoftheyieldcurve,themarginbetweenyieldcurvesandthevolatilityofinterestrates.
AMPgroup’slong-termborrowingsandsubordinateddebt.
Interestrateriskismanagedbyenteringintofloating-to-fixedinterestrateswaps,whichhavetheeffectofconvertingborrowingsfromfloatingratetofixedrate.
InterestbearinginvestmentassetsoftheshareholderandstatutoryfundsofAMPLifeandNMLA.
AMPLifeandNMLAmanageinterestrateandothermarketriskspursuanttoanassetandliabilitymanagementpolicyandarealsosubjecttotherelevantregulatoryrequirementsgovernedbytheLifeAct.
AMPBankinterestrateriskfrommismatchesintherepricingtermsofassetsandliabilities(termrisk)andvariablerateshort-termrepricingbases(basisrisk).
AMPBankusesnaturaloffsets,interestrateswapsandbasisswapstohedgethemismatcheswithinexposurelimits.GroupTreasurymanagestheexposureinAMPBankbymaintaininganetinterestrateriskpositionwithinthelimitsdelegatedandapprovedbytheAMPBankBoard.
CurrencyriskTheriskofanimpactontheAMPgroup’sprofitaftertaxandequityarisingfromfluctuationsofthefairvalueofafinancialasset,liabilityorcommitmentduetochangesinforeignexchangerates.
Foreigncurrencydenominatedassetsandliabilities.
Capitalinvestedinoverseasoperations.
Foreignexchangeratemovementsonspecificcashflowtransactions.
TheAMPgroupusesswapstohedgetheinterestrateriskandforeigncurrencyriskonforeigncurrencydenominatedborrowingsbutdoesnothedgethecapitalinvestedinoverseasoperations.
TheAMPgrouphedgesmaterialforeigncurrencyriskoriginatedbyreceiptsandpaymentsoncethevalueandtimingoftheexpectedcashflowisknownexcludingtheinternationalequitiesportfolioattributabletoshareholderswithintheAMPLifeStatutoryNo.1Fund.
GroupTreasuryexecutesforeigncurrencyforwardsonbehalfofAMPCapitaltohedgeexpectedmanagementfeesincomeandoperationcostsoutflowsoriginatedoutsideofAustralia.
EquitypriceriskTheriskofanimpactontheAMPgroup’sprofitaftertaxandequityarisingfromfluctuationsofthefairvalueorfuturecashflowsofafinancialinstrumentduetochangesinequityprices.
Exposureforshareholdersincludeslistedandunlistedsharesandparticipationinequityunittrusts.
GroupTreasurymay,withGroupALCOapproval,useequityexposuresorequityfuturesoroptionstohedgeotherenterprise-wideequityexposures.F
or p
erso
nal u
se o
nly
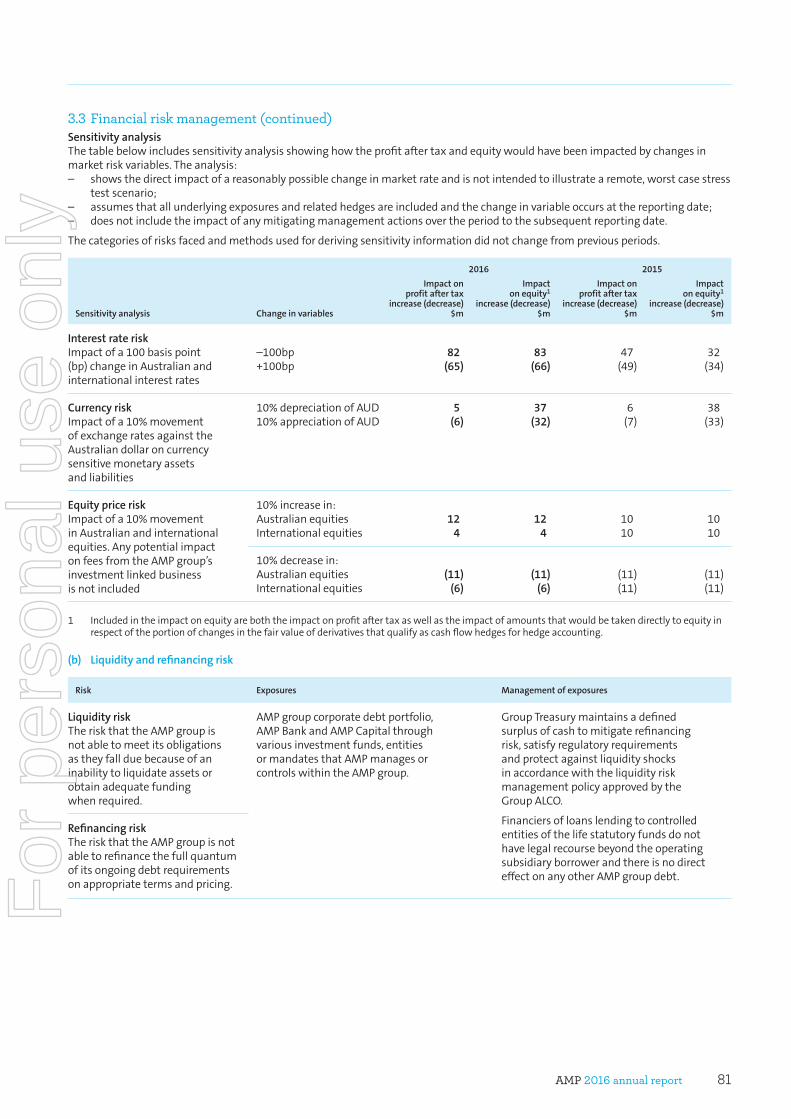
AMP 2016 annual report 81
3.3 Financial risk management (continued)SensitivityanalysisThetablebelowincludessensitivityanalysisshowinghowtheprofitaftertaxandequitywouldhavebeenimpactedbychangesinmarketriskvariables.Theanalysis:– showsthedirectimpactofareasonablypossiblechangeinmarketrateandisnotintendedtoillustratearemote,worstcasestress
testscenario;– assumesthatallunderlyingexposuresandrelatedhedgesareincludedandthechangeinvariableoccursatthereportingdate;– doesnotincludetheimpactofanymitigatingmanagementactionsovertheperiodtothesubsequentreportingdate.
Thecategoriesofrisksfacedandmethodsusedforderivingsensitivityinformationdidnotchangefrompreviousperiods.
2016 2015
Sensitivityanalysis Changeinvariables
Impactonprofitaftertax
increase(decrease)$m
Impactonequity1
increase(decrease)$m
Impactonprofitaftertax
increase(decrease)$m
Impactonequity1
increase(decrease)$m
InterestrateriskImpactofa100basispoint(bp)changeinAustralianandinternationalinterestrates
–100bp+100bp
82(65)
83(66)
47(49)
32(34)
CurrencyriskImpactofa10%movementofexchangeratesagainsttheAustraliandollaroncurrencysensitivemonetaryassetsandliabilities
10%depreciationofAUD10%appreciationofAUD
5(6)
37(32)
6(7)
38(33)
EquitypriceriskImpactofa10%movementinAustralianandinternationalequities.AnypotentialimpactonfeesfromtheAMPgroup’sinvestmentlinkedbusinessisnotincluded
10%increasein:AustralianequitiesInternationalequities
124
124
1010
1010
10%decreasein:AustralianequitiesInternationalequities
(11)(6)
(11)(6)
(11)(11)
(11)(11)
1 Includedintheimpactonequityareboththeimpactonprofitaftertaxaswellastheimpactofamountsthatwouldbetakendirectlytoequityinrespectoftheportionofchangesinthefairvalueofderivativesthatqualifyascashflowhedgesforhedgeaccounting.
(b) Liquidityandrefinancingrisk
Risk Exposures Managementofexposures
LiquidityriskTheriskthattheAMPgroupisnotabletomeetitsobligationsastheyfallduebecauseofaninabilitytoliquidateassetsorobtainadequatefundingwhenrequired.
AMPgroupcorporatedebtportfolio,AMPBankandAMPCapitalthroughvariousinvestmentfunds,entitiesormandatesthatAMPmanagesorcontrolswithintheAMPgroup.
GroupTreasurymaintainsadefinedsurplusofcashtomitigaterefinancingrisk,satisfyregulatoryrequirementsandprotectagainstliquidityshocksinaccordancewiththeliquidityriskmanagementpolicyapprovedbytheGroupALCO.
FinanciersofloanslendingtocontrolledentitiesofthelifestatutoryfundsdonothavelegalrecoursebeyondtheoperatingsubsidiaryborrowerandthereisnodirecteffectonanyotherAMPgroupdebt.
RefinancingriskTheriskthattheAMPgroupisnotabletorefinancethefullquantumofitsongoingdebtrequirementsonappropriatetermsandpricing.F
or p
erso
nal u
se o
nly
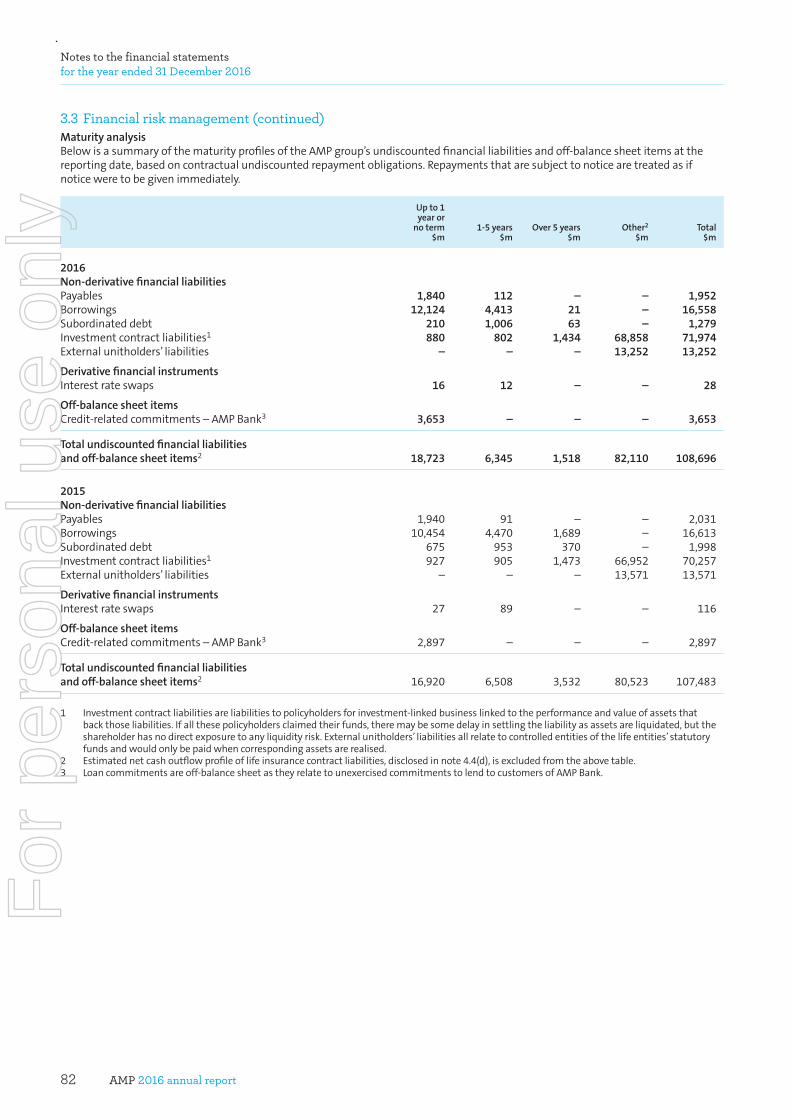
AMP 2016 annual report82
Notes to the financial statements for the year ended 31 December 2016
3.3 Financial risk management (continued)MaturityanalysisBelowisasummaryofthematurityprofilesoftheAMPgroup’sundiscountedfinancialliabilitiesandoff-balancesheetitemsatthereportingdate,basedoncontractualundiscountedrepaymentobligations.Repaymentsthataresubjecttonoticearetreatedasifnoticeweretobegivenimmediately.
Upto1yearor
noterm$m
1-5years$m
Over5years$m
Other2
$mTotal
$m
2016Non-derivativefinancialliabilitiesPayables 1,840 112 – – 1,952Borrowings 12,124 4,413 21 – 16,558Subordinateddebt 210 1,006 63 – 1,279Investmentcontractliabilities1 880 802 1,434 68,858 71,974Externalunitholders’liabilities – – – 13,252 13,252
DerivativefinancialinstrumentsInterestrateswaps 16 12 – – 28
Off-balancesheetitems Credit-relatedcommitments–AMPBank3 3,653 – – – 3,653
Totalundiscountedfinancialliabilitiesandoff-balancesheetitems2 18,723 6,345 1,518 82,110 108,696
2015Non-derivativefinancialliabilities Payables 1,940 91 – – 2,031Borrowings 10,454 4,470 1,689 – 16,613Subordinateddebt 675 953 370 – 1,998Investmentcontractliabilities1 927 905 1,473 66,952 70,257Externalunitholders’liabilities – – – 13,571 13,571
Derivativefinancialinstruments Interestrateswaps 27 89 – – 116
Off-balancesheetitems Credit-relatedcommitments–AMPBank3 2,897 – – – 2,897
Totalundiscountedfinancialliabilitiesandoff-balancesheetitems2 16,920 6,508 3,532 80,523 107,483
1 Investmentcontractliabilitiesareliabilitiestopolicyholdersforinvestment-linkedbusinesslinkedtotheperformanceandvalueofassetsthatbackthoseliabilities.Ifallthesepolicyholdersclaimedtheirfunds,theremaybesomedelayinsettlingtheliabilityasassetsareliquidated,buttheshareholderhasnodirectexposuretoanyliquidityrisk.Externalunitholders’liabilitiesallrelatetocontrolledentitiesofthelifeentities’statutoryfundsandwouldonlybepaidwhencorrespondingassetsarerealised.
2 Estimatednetcashoutflowprofileoflifeinsurancecontractliabilities,disclosedinnote4.4(d),isexcludedfromtheabovetable.3 Loancommitmentsareoff-balancesheetastheyrelatetounexercisedcommitmentstolendtocustomersofAMPBank.
For
per
sona
l use
onl
y
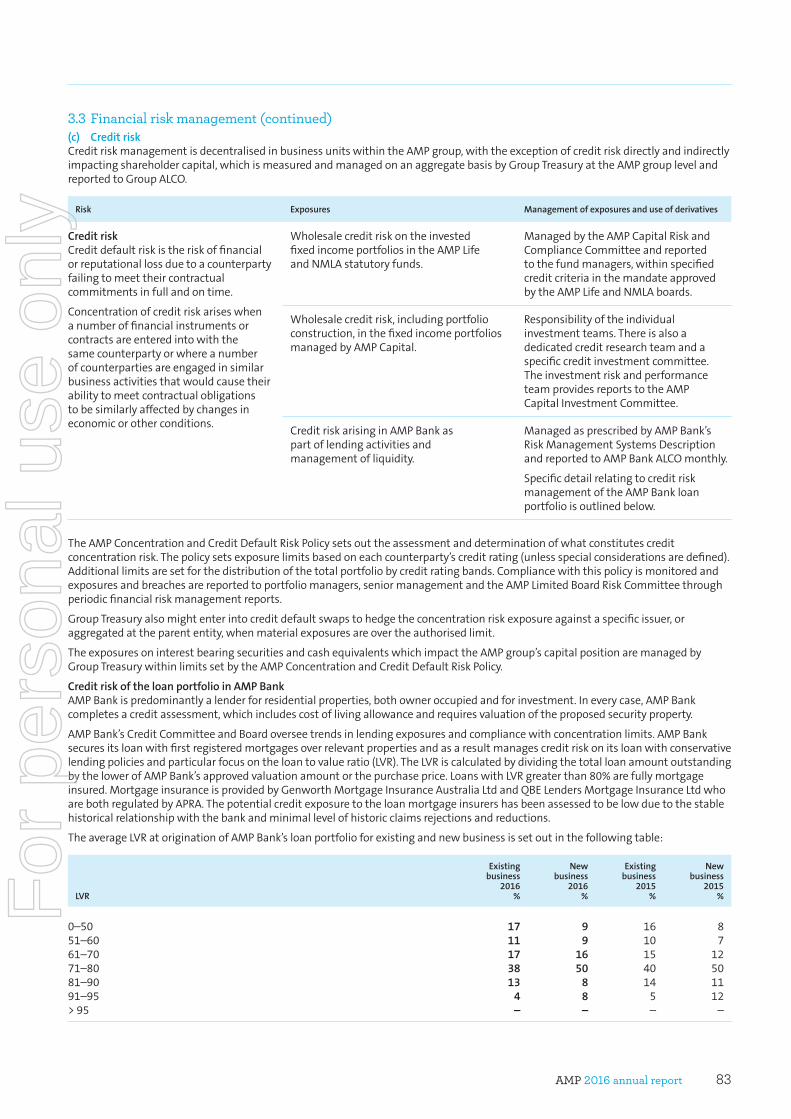
AMP 2016 annual report 83
3.3 Financial risk management (continued)(c) CreditriskCreditriskmanagementisdecentralisedinbusinessunitswithintheAMPgroup,withtheexceptionofcreditriskdirectlyandindirectlyimpactingshareholdercapital,whichismeasuredandmanagedonanaggregatebasisbyGroupTreasuryattheAMPgrouplevelandreportedtoGroupALCO.
Risk Exposures Managementofexposuresanduseofderivatives
CreditriskCreditdefaultriskistheriskoffinancialorreputationallossduetoacounterpartyfailingtomeettheircontractualcommitmentsinfullandontime.
Concentrationofcreditriskariseswhenanumberoffinancialinstrumentsorcontractsareenteredintowiththesamecounterpartyorwhereanumberofcounterpartiesareengagedinsimilarbusinessactivitiesthatwouldcausetheirabilitytomeetcontractualobligationstobesimilarlyaffectedbychangesineconomicorotherconditions.
WholesalecreditriskontheinvestedfixedincomeportfoliosintheAMPLifeandNMLAstatutoryfunds.
ManagedbytheAMPCapitalRiskandComplianceCommitteeandreportedtothefundmanagers,withinspecifiedcreditcriteriainthemandateapprovedbytheAMPLifeandNMLAboards.
Wholesalecreditrisk,includingportfolioconstruction,inthefixedincomeportfoliosmanagedbyAMPCapital.
Responsibilityoftheindividualinvestmentteams.Thereisalsoadedicatedcreditresearchteamandaspecificcreditinvestmentcommittee.TheinvestmentriskandperformanceteamprovidesreportstotheAMPCapitalInvestmentCommittee.
CreditriskarisinginAMPBankaspartoflendingactivitiesandmanagementofliquidity.
ManagedasprescribedbyAMPBank’sRiskManagementSystemsDescriptionandreportedtoAMPBankALCOmonthly.
SpecificdetailrelatingtocreditriskmanagementoftheAMPBankloanportfolioisoutlinedbelow.
TheAMPConcentrationandCreditDefaultRiskPolicysetsouttheassessmentanddeterminationofwhatconstitutescreditconcentrationrisk.Thepolicysetsexposurelimitsbasedoneachcounterparty’screditrating(unlessspecialconsiderationsaredefined).Additionallimitsaresetforthedistributionofthetotalportfoliobycreditratingbands.Compliancewiththispolicyismonitoredandexposuresandbreachesarereportedtoportfoliomanagers,seniormanagementandtheAMPLimitedBoardRiskCommitteethroughperiodicfinancialriskmanagementreports.
GroupTreasuryalsomightenterintocreditdefaultswapstohedgetheconcentrationriskexposureagainstaspecificissuer,oraggregatedattheparententity,whenmaterialexposuresareovertheauthorisedlimit.
TheexposuresoninterestbearingsecuritiesandcashequivalentswhichimpacttheAMPgroup’scapitalpositionaremanagedbyGroupTreasurywithinlimitssetbytheAMPConcentrationandCreditDefaultRiskPolicy.
CreditriskoftheloanportfolioinAMPBankAMPBankispredominantlyalenderforresidentialproperties,bothowneroccupiedandforinvestment.Ineverycase,AMPBankcompletesacreditassessment,whichincludescostoflivingallowanceandrequiresvaluationoftheproposedsecurityproperty.
AMPBank’sCreditCommitteeandBoardoverseetrendsinlendingexposuresandcompliancewithconcentrationlimits.AMPBanksecuresitsloanwithfirstregisteredmortgagesoverrelevantpropertiesandasaresultmanagescreditriskonitsloanwithconservativelendingpoliciesandparticularfocusontheloantovalueratio(LVR).TheLVRiscalculatedbydividingthetotalloanamountoutstandingbythelowerofAMPBank’sapprovedvaluationamountorthepurchaseprice.LoanswithLVRgreaterthan80%arefullymortgageinsured.MortgageinsuranceisprovidedbyGenworthMortgageInsuranceAustraliaLtdandQBELendersMortgageInsuranceLtdwhoarebothregulatedbyAPRA.Thepotentialcreditexposuretotheloanmortgageinsurershasbeenassessedtobelowduetothestablehistoricalrelationshipwiththebankandminimallevelofhistoricclaimsrejectionsandreductions.
TheaverageLVRatoriginationofAMPBank’sloanportfolioforexistingandnewbusinessissetoutinthefollowingtable:
LVR
Existingbusiness
2016%
Newbusiness
2016%
Existingbusiness
2015%
Newbusiness
2015%
0–50 17 9 16 851–60 11 9 10 761–70 17 16 15 1271–80 38 50 40 5081–90 13 8 14 1191–95 4 8 5 12>95 – – – –
For
per
sona
l use
onl
y
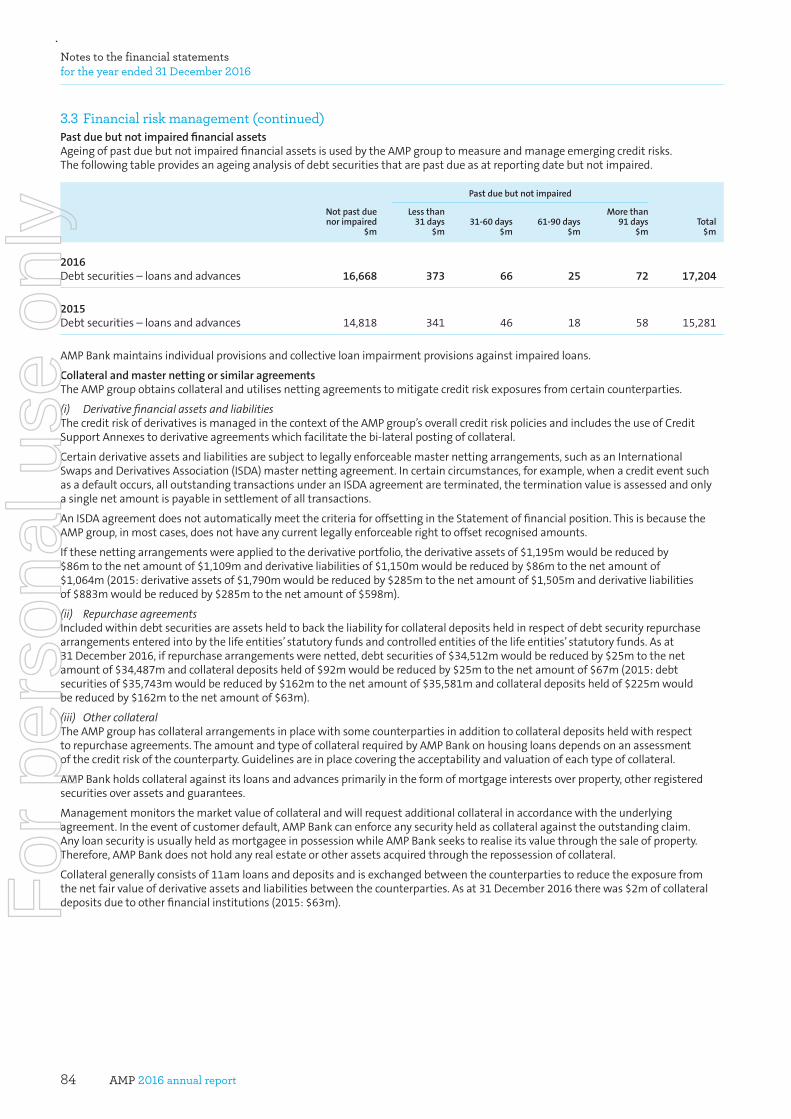
AMP 2016 annual report84
Notes to the financial statements for the year ended 31 December 2016
3.3 Financial risk management (continued)PastduebutnotimpairedfinancialassetsAgeingofpastduebutnotimpairedfinancialassetsisusedbytheAMPgrouptomeasureandmanageemergingcreditrisks.Thefollowingtableprovidesanageinganalysisofdebtsecuritiesthatarepastdueasatreportingdatebutnotimpaired.
Pastduebutnotimpaired
Notpastduenorimpaired
$m
Lessthan31days
$m31-60days
$m61-90days
$m
Morethan91days
$mTotal
$m
2016Debtsecurities–loansandadvances 16,668 373 66 25 72 17,204
2015 Debtsecurities–loansandadvances 14,818 341 46 18 58 15,281
AMPBankmaintainsindividualprovisionsandcollectiveloanimpairmentprovisionsagainstimpairedloans.
CollateralandmasternettingorsimilaragreementsTheAMPgroupobtainscollateralandutilisesnettingagreementstomitigatecreditriskexposuresfromcertaincounterparties.
(i) Derivative financial assets and liabilitiesThecreditriskofderivativesismanagedinthecontextoftheAMPgroup’soverallcreditriskpoliciesandincludestheuseofCreditSupportAnnexestoderivativeagreementswhichfacilitatethebi-lateralpostingofcollateral.
Certainderivativeassetsandliabilitiesaresubjecttolegallyenforceablemasternettingarrangements,suchasanInternationalSwapsandDerivativesAssociation(ISDA)masternettingagreement.Incertaincircumstances,forexample,whenacrediteventsuchasadefaultoccurs,alloutstandingtransactionsunderanISDAagreementareterminated,theterminationvalueisassessedandonlyasinglenetamountispayableinsettlementofalltransactions.
AnISDAagreementdoesnotautomaticallymeetthecriteriaforoffsettingintheStatementoffinancialposition.ThisisbecausetheAMPgroup,inmostcases,doesnothaveanycurrentlegallyenforceablerighttooffsetrecognisedamounts.
Ifthesenettingarrangementswereappliedtothederivativeportfolio,thederivativeassetsof$1,195mwouldbereducedby$86mtothenetamountof$1,109mandderivativeliabilitiesof$1,150mwouldbereducedby$86mtothenetamountof$1,064m(2015:derivativeassetsof$1,790mwouldbereducedby$285mtothenetamountof$1,505mandderivativeliabilitiesof$883mwouldbereducedby$285mtothenetamountof$598m).
(ii) Repurchase agreementsIncludedwithindebtsecuritiesareassetsheldtobacktheliabilityforcollateraldepositsheldinrespectofdebtsecurityrepurchasearrangementsenteredintobythelifeentities’statutoryfundsandcontrolledentitiesofthelifeentities’statutoryfunds.Asat31December2016,ifrepurchasearrangementswerenetted,debtsecuritiesof$34,512mwouldbereducedby$25mtothenetamountof$34,487mandcollateraldepositsheldof$92mwouldbereducedby$25mtothenetamountof$67m(2015:debtsecuritiesof$35,743mwouldbereducedby$162mtothenetamountof$35,581mandcollateraldepositsheldof$225mwouldbereducedby$162mtothenetamountof$63m).
(iii) Other collateralTheAMPgrouphascollateralarrangementsinplacewithsomecounterpartiesinadditiontocollateraldepositsheldwithrespecttorepurchaseagreements.TheamountandtypeofcollateralrequiredbyAMPBankonhousingloansdependsonanassessmentofthecreditriskofthecounterparty.Guidelinesareinplacecoveringtheacceptabilityandvaluationofeachtypeofcollateral.
AMPBankholdscollateralagainstitsloansandadvancesprimarilyintheformofmortgageinterestsoverproperty,otherregisteredsecuritiesoverassetsandguarantees.
Managementmonitorsthemarketvalueofcollateralandwillrequestadditionalcollateralinaccordancewiththeunderlyingagreement.Intheeventofcustomerdefault,AMPBankcanenforceanysecurityheldascollateralagainsttheoutstandingclaim.AnyloansecurityisusuallyheldasmortgageeinpossessionwhileAMPBankseekstorealiseitsvaluethroughthesaleofproperty.Therefore,AMPBankdoesnotholdanyrealestateorotherassetsacquiredthroughtherepossessionofcollateral.
Collateralgenerallyconsistsof11amloansanddepositsandisexchangedbetweenthecounterpartiestoreducetheexposurefromthenetfairvalueofderivativeassetsandliabilitiesbetweenthecounterparties.Asat31December2016therewas$2mofcollateraldepositsduetootherfinancialinstitutions(2015:$63m).F
or p
erso
nal u
se o
nly
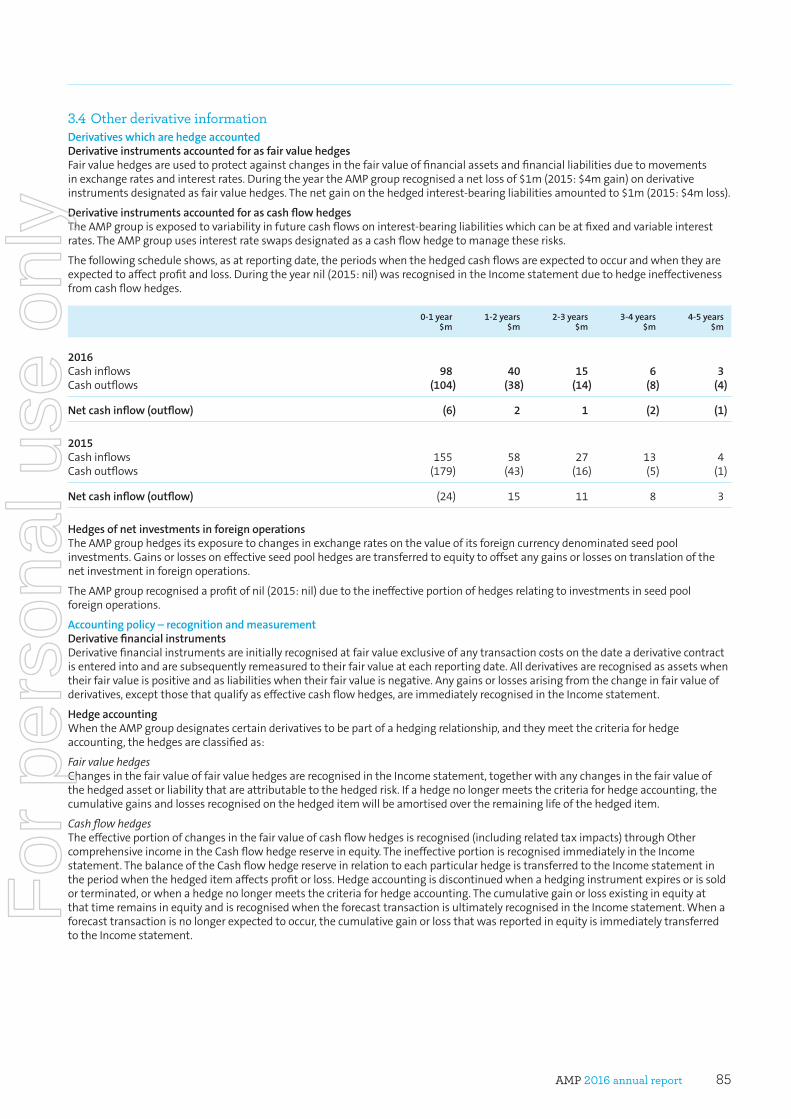
AMP 2016 annual report 85
3.4 Other derivative informationDerivativeswhicharehedgeaccountedDerivativeinstrumentsaccountedforasfairvaluehedgesFairvaluehedgesareusedtoprotectagainstchangesinthefairvalueoffinancialassetsandfinancialliabilitiesduetomovementsinexchangeratesandinterestrates.DuringtheyeartheAMPgrouprecognisedanetlossof$1m(2015:$4mgain)onderivativeinstrumentsdesignatedasfairvaluehedges.Thenetgainonthehedgedinterest-bearingliabilitiesamountedto$1m(2015:$4mloss).
DerivativeinstrumentsaccountedforascashflowhedgesTheAMPgroupisexposedtovariabilityinfuturecashflowsoninterest-bearingliabilitieswhichcanbeatfixedandvariableinterestrates.TheAMPgroupusesinterestrateswapsdesignatedasacashflowhedgetomanagetheserisks.
Thefollowingscheduleshows,asatreportingdate,theperiodswhenthehedgedcashflowsareexpectedtooccurandwhentheyareexpectedtoaffectprofitandloss.Duringtheyearnil(2015:nil)wasrecognisedintheIncomestatementduetohedgeineffectivenessfromcashflowhedges.
0-1year$m
1-2years$m
2-3years$m
3-4years$m
4-5years$m
2016 Cashinflows 98 40 15 6 3Cashoutflows (104) (38) (14) (8) (4)
Netcashinflow(outflow) (6) 2 1 (2) (1)
2015 Cashinflows 155 58 27 13 4Cashoutflows (179) (43) (16) (5) (1)
Netcashinflow(outflow) (24) 15 11 8 3
HedgesofnetinvestmentsinforeignoperationsTheAMPgrouphedgesitsexposuretochangesinexchangeratesonthevalueofitsforeigncurrencydenominatedseedpoolinvestments.Gainsorlossesoneffectiveseedpoolhedgesaretransferredtoequitytooffsetanygainsorlossesontranslationofthenetinvestmentinforeignoperations.
TheAMPgrouprecognisedaprofitofnil(2015:nil)duetotheineffectiveportionofhedgesrelatingtoinvestmentsinseedpoolforeignoperations.
Accountingpolicy–recognitionandmeasurementDerivativefinancialinstrumentsDerivativefinancialinstrumentsareinitiallyrecognisedatfairvalueexclusiveofanytransactioncostsonthedateaderivativecontractisenteredintoandaresubsequentlyremeasuredtotheirfairvalueateachreportingdate.Allderivativesarerecognisedasassetswhentheirfairvalueispositiveandasliabilitieswhentheirfairvalueisnegative.Anygainsorlossesarisingfromthechangeinfairvalueofderivatives,exceptthosethatqualifyaseffectivecashflowhedges,areimmediatelyrecognisedintheIncomestatement.
HedgeaccountingWhentheAMPgroupdesignatescertainderivativestobepartofahedgingrelationship,andtheymeetthecriteriaforhedgeaccounting,thehedgesareclassifiedas:
Fair value hedgesChangesinthefairvalueoffairvaluehedgesarerecognisedintheIncomestatement,togetherwithanychangesinthefairvalueofthehedgedassetorliabilitythatareattributabletothehedgedrisk.Ifahedgenolongermeetsthecriteriaforhedgeaccounting,thecumulativegainsandlossesrecognisedonthehedgeditemwillbeamortisedovertheremaininglifeofthehedgeditem.
Cash flow hedgesTheeffectiveportionofchangesinthefairvalueofcashflowhedgesisrecognised(includingrelatedtaximpacts)throughOthercomprehensiveincomeintheCashflowhedgereserveinequity.TheineffectiveportionisrecognisedimmediatelyintheIncomestatement.ThebalanceoftheCashflowhedgereserveinrelationtoeachparticularhedgeistransferredtotheIncomestatementintheperiodwhenthehedgeditemaffectsprofitorloss.Hedgeaccountingisdiscontinuedwhenahedginginstrumentexpiresorissoldorterminated,orwhenahedgenolongermeetsthecriteriaforhedgeaccounting.ThecumulativegainorlossexistinginequityatthattimeremainsinequityandisrecognisedwhentheforecasttransactionisultimatelyrecognisedintheIncomestatement.Whenaforecasttransactionisnolongerexpectedtooccur,thecumulativegainorlossthatwasreportedinequityisimmediatelytransferredtotheIncomestatement.
For
per
sona
l use
onl
y
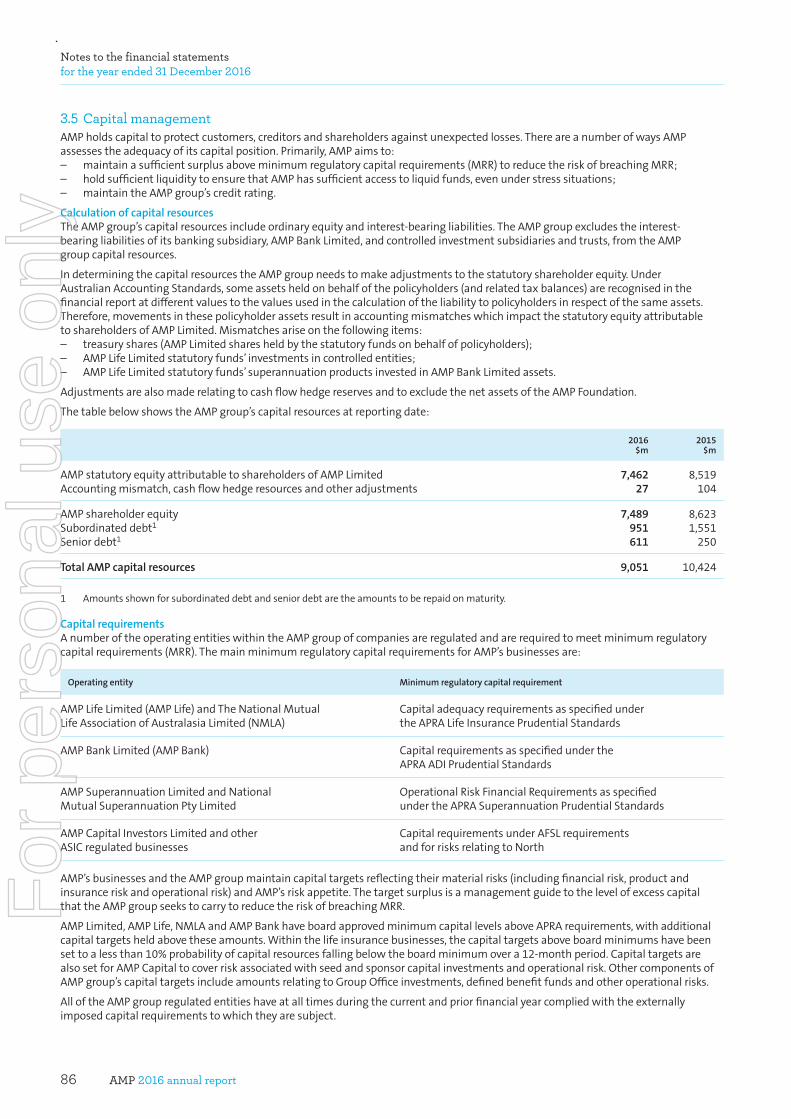
AMP 2016 annual report86
Notes to the financial statements for the year ended 31 December 2016
3.5 Capital management AMPholdscapitaltoprotectcustomers,creditorsandshareholdersagainstunexpectedlosses.ThereareanumberofwaysAMPassessestheadequacyofitscapitalposition.Primarily,AMPaimsto:– maintainasufficientsurplusaboveminimumregulatorycapitalrequirements(MRR)toreducetheriskofbreachingMRR;– holdsufficientliquiditytoensurethatAMPhassufficientaccesstoliquidfunds,evenunderstresssituations;– maintaintheAMPgroup’screditrating.
CalculationofcapitalresourcesTheAMPgroup’scapitalresourcesincludeordinaryequityandinterest-bearingliabilities.TheAMPgroupexcludestheinterest-bearingliabilitiesofitsbankingsubsidiary,AMPBankLimited,andcontrolledinvestmentsubsidiariesandtrusts,fromtheAMPgroupcapitalresources.
IndeterminingthecapitalresourcestheAMPgroupneedstomakeadjustmentstothestatutoryshareholderequity.UnderAustralianAccountingStandards,someassetsheldonbehalfofthepolicyholders(andrelatedtaxbalances)arerecognisedinthefinancialreportatdifferentvaluestothevaluesusedinthecalculationoftheliabilitytopolicyholdersinrespectofthesameassets.Therefore,movementsinthesepolicyholderassetsresultinaccountingmismatcheswhichimpactthestatutoryequityattributabletoshareholdersofAMPLimited.Mismatchesariseonthefollowingitems:– treasuryshares(AMPLimitedsharesheldbythestatutoryfundsonbehalfofpolicyholders);– AMPLifeLimitedstatutoryfunds’investmentsincontrolledentities;– AMPLifeLimitedstatutoryfunds’superannuationproductsinvestedinAMPBankLimitedassets.
AdjustmentsarealsomaderelatingtocashflowhedgereservesandtoexcludethenetassetsoftheAMPFoundation.
ThetablebelowshowstheAMPgroup’scapitalresourcesatreportingdate:
2016$m
2015$m
AMPstatutoryequityattributabletoshareholdersofAMPLimited 7,462 8,519Accountingmismatch,cashflowhedgeresourcesandotheradjustments 27 104
AMPshareholderequity 7,489 8,623Subordinateddebt1 951 1,551Seniordebt1 611 250
TotalAMPcapitalresources 9,051 10,424
1 Amountsshownforsubordinateddebtandseniordebtaretheamountstoberepaidonmaturity.
CapitalrequirementsAnumberoftheoperatingentitieswithintheAMPgroupofcompaniesareregulatedandarerequiredtomeetminimumregulatorycapitalrequirements(MRR).ThemainminimumregulatorycapitalrequirementsforAMP’sbusinessesare:
Operatingentity Minimumregulatorycapitalrequirement
AMPLifeLimited(AMPLife)andTheNationalMutualLifeAssociationofAustralasiaLimited(NMLA)
CapitaladequacyrequirementsasspecifiedundertheAPRALifeInsurancePrudentialStandards
AMPBankLimited(AMPBank) CapitalrequirementsasspecifiedundertheAPRAADIPrudentialStandards
AMPSuperannuationLimitedandNationalMutualSuperannuationPtyLimited
OperationalRiskFinancialRequirementsasspecifiedundertheAPRASuperannuationPrudentialStandards
AMPCapitalInvestorsLimitedandotherASICregulatedbusinesses
CapitalrequirementsunderAFSLrequirementsandforrisksrelatingtoNorth
AMP’sbusinessesandtheAMPgroupmaintaincapitaltargetsreflectingtheirmaterialrisks(includingfinancialrisk,productandinsuranceriskandoperationalrisk)andAMP’sriskappetite.ThetargetsurplusisamanagementguidetothelevelofexcesscapitalthattheAMPgroupseekstocarrytoreducetheriskofbreachingMRR.
AMPLimited,AMPLife,NMLAandAMPBankhaveboardapprovedminimumcapitallevelsaboveAPRArequirements,withadditionalcapitaltargetsheldabovetheseamounts.Withinthelifeinsurancebusinesses,thecapitaltargetsaboveboardminimumshavebeensettoalessthan10%probabilityofcapitalresourcesfallingbelowtheboardminimumovera12-monthperiod.CapitaltargetsarealsosetforAMPCapitaltocoverriskassociatedwithseedandsponsorcapitalinvestmentsandoperationalrisk.OthercomponentsofAMPgroup’scapitaltargetsincludeamountsrelatingtoGroupOfficeinvestments,definedbenefitfundsandotheroperationalrisks.
AlloftheAMPgroupregulatedentitieshaveatalltimesduringthecurrentandpriorfinancialyearcompliedwiththeexternallyimposedcapitalrequirementstowhichtheyaresubject.
For
per
sona
l use
onl
y
AMP 2016 annual report 87
Section 4: Life insurance and investment contractsThissectionexplainshowAMP’sliabilitiesinrespectoflifeinsurancecontractsandinvestmentcontractsaremeasured,includingthemethodologiesandkeyassumptionsthatareapplied.Italsodetailsthekeycomponentsoftheprofitsthatarerecognisedinrespectoflifeinsurancecontractsandthesensitivityofthoseprofitstovariationsinassumptions.
4.1 Accountingforlifeinsurancecontractsandinvestmentcontracts4.2 Lifeinsurancecontracts–premiums,claims,expensesandliabilities4.3 Lifeinsurancecontracts–assumptionsandvaluationmethodology4.4 Lifeinsurancecontracts–risk4.5 Otherdisclosure–lifeinsurancecontractsandinvestmentcontracts
4.1 Accounting for life insurance contracts and investment contractsTheAMPgroup’slifeinsurancerelatedactivitieswereconductedthroughtworegisteredlifeinsurancecompanies,AMPLifeLimited(AMPLife)andTheNationalMutualLifeAssociationofAustralasiaLimited(NMLA),collectively‘theAMPlifeinsuranceentities’.
Thetwomajorcontractclassificationsareinvestmentcontractsandlifeinsurancecontracts.
Forthepurposesofthisfinancialreport,holdersofinvestmentcontractsorlifeinsurancecontractsarecollectivelyandindividuallyreferredtoaspolicyholders.
InvestmentcontractsTheinvestmentcontractsoftheAMPlifeinsuranceentitiesrelatetowealthmanagementproductssuchassavings,investment-linkedandretirementincomepolicies.ThenatureofthisbusinessisthattheAMPlifeinsuranceentitiesreceivedepositsfrompolicyholdersandthosefundsareinvestedonbehalfofthepolicyholders.Feesandotherchargesarepassedtotheshareholderandreportedasrevenue.
Theliabilitytopolicyholders,otherthanforfixedretirementincomepolicies,islinkedtotheperformanceandvalueoftheassetsthatbackthoseliabilities.Thefairvalueofsuchliabilitiesisthereforethesameasthefairvalueofthoseassets.Forfixedretirementincomepolicies,theliabilityislinkedtothefairvalueofthefixedretirementincomepaymentsandassociatedmanagementservices.
Thefairvalueofthefixedretirementincomepaymentsiscalculatedastheirnetpresentvalueusingafairvaluediscountrate.Thefairvalueoftheassociatedmanagementserviceselementisthenetpresentvalue,usingafairvaluediscountrate,ofallexpensesassociatedwiththeprovisionofservicesandanyprofitmarginsthereon.
LifeinsurancecontractsTheAMPlifeinsuranceentitiesissuecontractsthattransfersignificantinsuranceriskfromthepolicyholder,coveringdeath,disabilityorlongevityoftheinsured.Inaddition,therearesomepoliciesknownasdiscretionaryparticipatingcontractsthataresimilartoinvestmentcontracts,butthetimingofthevestingoftheprofitattributabletothepolicyholdersisatthediscretionoftheAMPlifeinsuranceentities.Suchcontractsaredefinedaslife insurance contractsandaccountedforusing Margin on Services(MoS).
UnderMoS,theexcessofpremiumreceivedoverclaimsandexpenses(themargin)isrecognisedoverthelifeofthecontractinamannerthatreflectsthepatternofriskacceptedfromthepolicyholder(theservice).TheplannedreleaseofthismarginisincludedinthemovementinlifeinsurancecontractliabilitiesrecognisedintheIncomestatement.
Lifeinsurancecontractliabilitiesareusuallydeterminedusingaprojectionmethod,wherebyestimatesofpolicycashflows(premiums,benefits,expensesandprofitmarginstobereleasedinfutureperiods)areprojectedusingbest-estimateassumptionsaboutthefuture.Theliabilityiscalculatedasthenetpresentvalueoftheseprojectedcashflows.Whenthebenefitsunderalifeinsurancecontractarelinkedtotheassetsbackingit,thediscountrateappliedisbasedontheexpectedfutureinvestmentearningsrateofthoseassets.Wherethebenefitsarenotlinkedtotheperformanceofthebackingassets,arisk-freediscountrateisused.Therisk-freediscountrateisbasedonthezerocoupongovernmentbondrateandaliquiditymargin,whichdependonthenature,structureandtermsofthecontractliabilities.
Anaccumulationmethodmaybeusedifitproducesresultsthatarenotmateriallydifferentfromthoseproducedbyaprojectionmethod.Amodifiedaccumulationmethodisusedforsomediscretionaryparticipatingbusiness,wherethelifeinsuranceliabilityistheaccumulationofamountsinvestedbypolicyholders,lessfeesspecifiedinthepolicy,plusinvestmentearningsandvestedbenefits,adjustedtoallowforthefactthatcreditingratesaredeterminedbyreferencetoinvestmentincomeoveraperiodofgreaterthanoneyear.Theaccumulationmethodmaybeadjustedtotheextentthatacquisitionexpensesaretoberecoveredfromfuturemarginsbetweenfeesandexpenses.
AllocationofoperatingprofitandunvestedpolicyholderbenefitsTheoperatingprofitarisingfromdiscretionaryparticipatingcontractsisallocatedbetweenshareholdersandparticipatingpolicyholdersbyapplyingtheMoSprinciplesinaccordancewiththeLife Insurance Act 1995(Cth)(LifeAct)andtheParticipatingBusinessManagementFrameworkapplyingtoNMLA.
Onceprofitisallocatedtoparticipatingpolicyholdersitcanonlybedistributedtothesepolicyholders.
ProfitallocatedtoparticipatingpolicyholdersisrecognisedintheIncomestatementasanincreaseinpolicyliabilities.Thepolicyliabilitiesincludeprofitthathasnotyetbeenallocatedtospecificpolicyholders(ieunvested)andthatwhichhasbeenallocatedtospecificpolicyholdersbywayofbonusdistributions(ievested).
Bonusdistributionstoparticipatingpolicyholdersdonotaltertheamountofprofitattributabletoshareholders.Therearemerelychangestothenatureoftheliabilityfromunvestedtovested.
For
per
sona
l use
onl
y
AMP 2016 annual report88
Notes to the financial statements for the year ended 31 December 2016
4.1 Accounting for life insurance contracts and investment contracts (continued)Theprinciplesofallocationoftheprofitarisingfromdiscretionaryparticipatingbusinessareasfollows:(i) investmentincome(netoftaxandinvestmentexpenses)onretainedearningsinrespectofdiscretionaryparticipatingbusiness
isallocatedbetweenpolicyholdersandshareholdersinproportiontothebalancesofpolicyholders’andshareholders’retainedearnings.Thisproportionis,mostly,80%topolicyholdersand20%toshareholders;
(ii) otherMoSprofitsarisingfromdiscretionaryparticipatingbusinessareallocated80%topolicyholdersand20%toshareholders,withthefollowingexceptions:
– theprofitarisingfromNewZealandcorporatesuperannuationbusinessisapportionedsuchthatshareholdersareallocated15%oftheprofitallocatedtopolicyholders;
– theprofitarisinginrespectofpreservationsuperannuationaccountbusinessisallocated92.5%topolicyholdersand7.5%toshareholders;
– theprofitsarisingfromNMLA’sdiscretionaryparticipatinginvestmentaccountbusinesswhere100%ofinvestmentprofitisallocatedtopolicyholdersand100%ofanyotherprofitorlossisallocatedtoshareholders,withtheover-ridingprovisionbeingthatatleast80%ofanyprofitandnotmorethan80%ofanylossbeallocatedtopolicyholders’retainedprofitsoftherelevantstatutoryfund;
– theunderwritingprofitarisinginrespectofNMLA’sparticipatingsuperriskbusinessisallocated90%topolicyholdersand10%toshareholders.
Allocationofexpenseswithinthelifeinsuranceentities’statutoryfundsAlloperatingexpensesrelatingtothelifeinsurancecontractandinvestmentcontractactivitiesareapportionedbetweenacquisition,maintenanceandinvestmentmanagementexpenses.Expenseswhicharedirectlyattributabletoanindividuallifeinsurancecontractorinvestmentcontractorproductareallocateddirectlytoaparticularexpensecategory,fund,classofbusinessandproductlineasappropriate.
Whereexpensesarenotdirectlyattributable,theyareappropriatelyapportioned,accordingtodetailedexpenseanalysis,withdueregardtotheactivitiestowhichthatexpenserelates.TheapportionmentbasishasbeenmadeinaccordancewithActuarialStandardsandonanequitablebasistothedifferentclassesofbusinessinaccordancewiththeLifeAct.
Thecostsapportionedtolifeinsurancecontractsareincludedinthedeterminationofthemargindescribedinnote4.1.
Investmentmanagementexpensesofthelifestatutoryfundsareclassifiedasoperatingexpenses.
ReinsuranceLifeinsurancecontractpremiumcededtoreinsurersisrecognisedasanexpenseandLifeinsurancecontractclaimsrecoveredfromreinsurersisrecognisedasincome.
Upfrontcommissionreceivedonquotasharereinsurancecontractsisrecognisedascommissionrevenueandacorrespondingreinsuranceliabilityisrecognisedrepresentingtheobligationtopayfuturepremiumstothereinsurer.TheestablishmentofthereinsuranceliabilityisreflectedinChangeinpolicyholderliabilities.Theliabilitywillbereleasedinlinewiththereleaseoftheprofitmarginontheunderlyinginsurancecontracts.
ThepresentvalueofAMP’snetcontractualrightsandobligationsunderreinsurancecontractsispresentedasareinsuranceassetorareinsuranceliability.
ChangesinthereinsuranceassetandthereinsuranceliabilityduringtheperiodarerecognisedasChangesinpolicyholderliabilities.
On-goingcommissionfromreinsurersisrecognisedasrevenueatthetimethecommissionisreceivedorreceivable.
Criticalaccountingestimatesandjudgements:Life insurance contract liabilitiesThe measurement of insurance contract liabilities is determined using the MoS methodology. The determination of the liability amounts involves judgement in selecting the valuation methods, profit carriers and valuation assumptions for each type of business. The determination is subjective and relatively small changes in assumptions may have a significant impact on the reported profit. The board of each of the life entities is responsible for these judgements and assumptions, after taking advice from the Appointed Actuary.
Investment contract liabilitiesInvestment contract liabilities are measured at fair value. For the majority of contracts, the fair value is determined based on published unit prices and the fair value of backing assets, and does not generally require the exercise of judgement. For fixed income products and the North capital guarantee, fair value is determined using valuation models. Judgement is applied in selecting the valuation model and setting the valuation assumptions.
For
per
sona
l use
onl
y
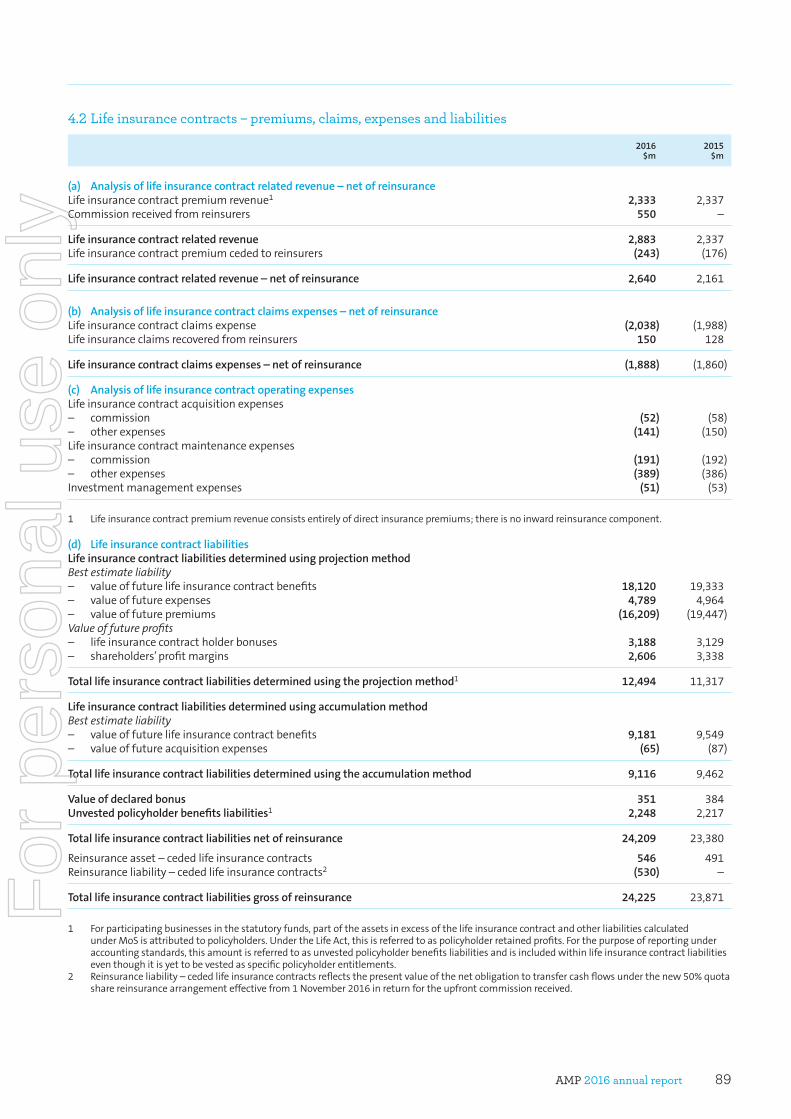
AMP 2016 annual report 89
4.2 Life insurance contracts – premiums, claims, expenses and liabilities
2016$m
2015$m
(a) Analysisoflifeinsurancecontractrelatedrevenue–netofreinsurance Lifeinsurancecontractpremiumrevenue1 2,333 2,337Commissionreceivedfromreinsurers 550 –
Lifeinsurancecontractrelatedrevenue 2,883 2,337Lifeinsurancecontractpremiumcededtoreinsurers (243) (176)
Lifeinsurancecontractrelatedrevenue–netofreinsurance 2,640 2,161
(b) Analysisoflifeinsurancecontractclaimsexpenses–netofreinsurance Lifeinsurancecontractclaimsexpense (2,038) (1,988)Lifeinsuranceclaimsrecoveredfromreinsurers 150 128
Lifeinsurancecontractclaimsexpenses–netofreinsurance (1,888) (1,860)
(c) Analysisoflifeinsurancecontractoperatingexpenses Lifeinsurancecontractacquisitionexpenses – commission (52) (58)– otherexpenses (141) (150)Lifeinsurancecontractmaintenanceexpenses – commission (191) (192)– otherexpenses (389) (386)Investmentmanagementexpenses (51) (53)
1 Lifeinsurancecontractpremiumrevenueconsistsentirelyofdirectinsurancepremiums;thereisnoinwardreinsurancecomponent.
(d) Lifeinsurancecontractliabilities Lifeinsurancecontractliabilitiesdeterminedusingprojectionmethod Best estimate liability – valueoffuturelifeinsurancecontractbenefits 18,120 19,333– valueoffutureexpenses 4,789 4,964– valueoffuturepremiums (16,209) (19,447)Value of future profits – lifeinsurancecontractholderbonuses 3,188 3,129– shareholders’profitmargins 2,606 3,338
Totallifeinsurancecontractliabilitiesdeterminedusingtheprojectionmethod1 12,494 11,317
Lifeinsurancecontractliabilitiesdeterminedusingaccumulationmethod Best estimate liability – valueoffuturelifeinsurancecontractbenefits 9,181 9,549– valueoffutureacquisitionexpenses (65) (87)
Totallifeinsurancecontractliabilitiesdeterminedusingtheaccumulationmethod 9,116 9,462
Valueofdeclaredbonus 351 384Unvestedpolicyholderbenefitsliabilities1 2,248 2,217
Totallifeinsurancecontractliabilitiesnetofreinsurance 24,209 23,380
Reinsuranceasset–cededlifeinsurancecontracts 546 491Reinsuranceliability–cededlifeinsurancecontracts2 (530) –
Totallifeinsurancecontractliabilitiesgrossofreinsurance 24,225 23,871
1 Forparticipatingbusinessesinthestatutoryfunds,partoftheassetsinexcessofthelifeinsurancecontractandotherliabilitiescalculatedunderMoSisattributedtopolicyholders.UndertheLifeAct,thisisreferredtoaspolicyholderretainedprofits.Forthepurposeofreportingunderaccountingstandards,thisamountisreferredtoasunvestedpolicyholderbenefitsliabilitiesandisincludedwithinlifeinsurancecontractliabilitieseventhoughitisyettobevestedasspecificpolicyholderentitlements.
2 Reinsuranceliability–cededlifeinsurancecontractsreflectsthepresentvalueofthenetobligationtotransfercashflowsunderthenew50%quotasharereinsurancearrangementeffectivefrom1November2016inreturnfortheupfrontcommissionreceived.
For
per
sona
l use
onl
y
AMP 2016 annual report90
Notes to the financial statements for the year ended 31 December 2016
4.2 Life insurance contracts – premiums, claims, expenses and liabilities (continued)
2016$m
2015$m
(e) Reconciliationofchangesinlifeinsurancecontractliabilities Totallifeinsurancecontractliabilitiesatthebeginningoftheyear 23,871 24,403ChangeinlifeinsurancecontractliabilitiesrecognisedintheIncomestatement 1,471 240Premiumsrecognisedasanincreaseinlifeinsurancecontractliabilities 415 467Claimsrecognisedasadecreaseinlifeinsurancecontractliabilities (1,140) (1,153)Changeinreinsuranceasset–cededlifeinsurancecontracts 55 (38)Changeinreinsuranceliability–cededlifeinsurancecontracts (530) –Foreignexchangeadjustment 83 (48)
Totallifeinsurancecontractliabilitiesattheendoftheyear 24,225 23,871
4.3 Life insurance contracts – assumptions and valuation methodology Lifeinsurancecontractliabilities,andhencethenetprofitsfromlifeinsurancecontracts,arecalculatedbyapplyingtheprinciplesofmarginonservices(MoS)describedinnote4.1.Thekeyassumptionsandmethodsusedinthecalculationoflifeinsurancecontractliabilitiesareoutlinedbelow.
Themethodsandprofitcarriersusedtocalculatelifeinsurancecontractliabilitiesforparticularpolicytypesareasfollows:
Businesstype MethodProfitcarriers(forbusinessvaluedusingprojectionmethod)
Conventional Projection BonusesInvestmentaccount Modifiedaccumulation n/aRetailrisk(lumpsum) Projection ExpectedpremiumsRetailrisk(incomeprotection) Projection ExpectedpremiumsGrouprisk(lumpsum) Accumulation n/aGrouprisk(incomebenefits) Accumulation n/aParticipatingallocatedannuities(AMPLifeonly) Modifiedaccumulation n/aLifeannuities Projection Annuitypayments
(a) Risk-freediscountratesExceptwherebenefitsarecontractuallylinkedtotheperformanceoftheassetsheld,arisk-freediscountratebasedoncurrentobservable,objectiveratesthatrelatetothenature,structureandtermofthefutureobligationsisused.Theratesaredeterminedasshowninthefollowingtable:
31December2016 31December2015
Businesstype Basis1Australia
%NewZealand
%Australia
%NewZealand
%
Retailrisk(otherthanincomebenefitopenclaims)1
Zerocoupongovernmentbondyieldcurve
1.7–4.1 1.9–4.8 2.0–3.7 2.7–4.5
Retailriskandgrouprisk(incomebenefitopenclaims)1
Zerocoupongovernmentbondyieldcurve(includingliquiditypremium)
2.1–4.4 2.2–5.1 2.5–4.2 3.1–5.0
Lifeannuities2 Non-CPI
Zerocoupongovernmentbondyieldcurve(includingliquiditypremium)
2.2–4.5 2.3–5.2 2.6–4.3 3.3–5.1
CPI Commonwealthindexedbondyieldcurve(includingliquiditypremium)
0.7–1.6 0.9–3.4 0.8–1.8 2.0–3.5
1 Thediscountratesvarybydurationintherangeshownabove. 2 Australiannon-CPIannuitiesandallCPIannuitiesareAMPLifeonly. F
or p
erso
nal u
se o
nly
AMP 2016 annual report 91
4.3 Life insurance contracts – assumptions and valuation methodology (continued)(b) FuturemaintenanceandinvestmentexpensesUnitmaintenancecostsarebasedonbudgetedexpensesintheyearfollowingthereportingdate(includingGST,asappropriate,andexcludingone-offexpenses).Forfutureyears,theseareincreasedforinflationasdescribedin(c)below.TheseexpensesincludefeeschargedtothelifestatutoryfundsbyservicecompaniesintheAMPgroup.Unitcostsvarybyproductlineandclassofbusinessbasedonanapportionmentthatissupportedbyexpenseanalyses.
Futureinvestmentexpensesarebasedonthefeescurrentlychargedbytheassetmanagers.
(c) InflationandindexationBenefitsandpremiumsofmanyregularpremiumpoliciesareautomaticallyindexedbythepublishedconsumerpriceindex(CPI).Assumedfuturetake-upoftheseindexationoptionsisbasedonAMPLife’sandNMLA’sownexperience.TheannualfutureCPIratesarederivedfromthedifferencebetweenlong-termgovernmentbondsandindexedgovernmentbonds.
Theexpenseinflationassumptionshavebeensetbasedontheinflationrates,recentexpenseperformance,AMPLife’sandNMLA’scurrentplansandthetermsoftherelevantservicecompanyagreements,asappropriate.
TheassumedCPIandexpenseinflationratesatthevaluationdateare:
Australia%
NewZealand%
31December2016 AMPLifeandNMLA 2.0CPI,3.0expenses 1.5CPI,2.0expenses31December2015 AMPLifeandNMLA 2.2CPI,3.0expenses 2.5CPI,3.0expenses
(d) BasesoftaxationThebasesoftaxation(includingdeductibilityofexpenses)areassumedtocontinueinaccordancewithlegislationcurrentatthevaluationdate.
(e) VoluntarydiscontinuanceAssumptionsfortheincidenceofwithdrawals,paidupsandpremiumdormancyareprimarilybasedoninvestigationsofAMPLife’sandNMLA’sownhistoricalexperience.Theseratesarebasedupontheassessedglobalrateforeachoftheindividualproducts(orproductgroups)andthen,whereappropriate,furtheradjustedforduration,premiumstructure,smokerstatus,ageattainedorshort-termmarketandbusinesseffects.Giventhevarietyofinfluencesaffectingdiscontinuancefordifferentproductgroups,therangeofvoluntarydiscontinuanceratesacrossAMPLifeandNMLAisextremelydiverse.
Theassumptionsforfutureratesofdiscontinuanceforthemajorclassesoflifeinsurancecontractshavebeenreviewedandstrengthenedforsomebusinesslinesfromthoseassumedat31December2015,asshowninthefollowingtable.
31December2016 31December2015
Businesstype LifecompanyAustralia
%NewZealand
%Australia
%NewZealand
%
Conventional AMPLife 1.7–4.1 1.1–1.6 1.7–4.1 1.1–1.7 NMLA 2.0–9.4 1.9–2.5 2.1–9.4 1.9–2.5
Retailrisk(lumpsum) AMPLife 14.2–18.3 12.0 12.1–16.4 12.0–13.0 NMLA 12.7–13.5 11.6 13.3–15.1 11.6
Retailrisk(incomebenefit) AMPLife 11.2–19.1 11.4 9.1–19.1 11.4 NMLA 8.0–13.5 9.5 12.0–13.3 9.5
FlexibleLifetimeSuper(FLS)riskbusiness AMPLife 13.3–16.5 n/a 10.2–18.9 n/a
Investmentaccount AMPLife n/a n/a n/a n/a NMLA n/a n/a n/a n/a
(f) SurrendervaluesThesurrenderbasesassumedforcalculatingsurrendervaluesarethosecurrentatthereportingdate.Therehavebeennochangestothebasesduringtheyear(ortheprioryear)thatwouldmateriallyaffectthevaluationresults.
For
per
sona
l use
onl
y
AMP 2016 annual report92
Notes to the financial statements for the year ended 31 December 2016
4.3 Life insurance contracts – assumptions and valuation methodology (continued)(g) MortalityandmorbidityStandardmortalitytables,basedonnationalorindustry-widedata,areused.
Ratesofmortalityassumedat31December2016forAMPLifeandNMLAareasfollows:– RetailriskmortalityratesforAMPLifeAustraliaandNMLAAustraliahavebeenreviewedandstrengthenedforsomebusiness
linesfromthoseassumedat31December2015,asindicatedinthetablesbelow.RetailriskmortalityratesforAMPLifeandNMLANewZealandareunchangedfromthoseassumedat31December2015.TheratesarebasedontheIndustrystandardIA04-08DeathWithoutRiders;
– Conventionalbusinessmortalityratesareunchangedfromthoseassumedat31December2015;– Annuitantmortalityratesareunchangedfromthoseassumedat31December2015.
ForAustralianincomeprotectionbusiness,theassumptionshavebeenupdatedandbasedontherecentlyreleasedADI07-11standardtablemodifiedforAMPLifeandNMLAwithoverallproductspecificadjustmentfactors.ForNewZealandincomeprotectionbusiness,theassumptionsareunchangedfromthoseassumedat31December2015.TheseassumptionsarebasedontheIAD89-93standardtable.
ForAustralianTPDandTraumabusiness,theAMPLifeandNMLAretailriskproductsassumptionshavebeenstrengthenedforsomebusinesslinesfromthoseassumedat31December2015.ForNewZealandTPDandTraumabusiness,theretailriskproductsassumptionsareunchangedfromthoseassumedat31December2015.TheseassumptionsarebasedonthelatestindustrytableIA04-08.
Theassumptionsaresummarisedinthefollowingtable.
Conventional–%ofIA95-97(AMPLife)
Conventional–%ofIA95-97(NMLA)
Conventional Male Female Male Female
31December2016 Australia 67.5 67.5 67.5 67.5NewZealand 73.0 73.0 73.0 73.0
31December2015 Australia 67.5 67.5 67.5 67.5NewZealand 73.0 73.0 73.0 73.0
RetailLumpSum–%oftable(AMPLife)
RetailLumpSum–%oftable(NMLA)
Riskproducts Male Female Male Female
31December2016 Australia1 94–148 94–148 100–106 100–106NewZealand 100 82 120 98
31December2015 Australia1 86–118 86–118 88–104 88–104NewZealand 100 82 120 98
1 BaseIA04-08DeathWithoutRiderstablemodifiedbasedonaggregatedexperiencebutwithoverallproduct-specificadjustmentfactors.
AMPLife NMLA
AnnuitiesMale–
%ofIML00*Female–
%ofIFL00*Male–
%ofIML00*Female–
%ofIFL00*
31December2016 AustraliaandNewZealand1 95.0 80.0 95.0 80.0
31December2015 AustraliaandNewZealand1 95.0 80.0 95.0 80.0
1 Annuitiestablesmodifiedforfuturemortalityimprovements.For
per
sona
l use
onl
y
AMP 2016 annual report 93
4.3 Life insurance contracts – assumptions and valuation methodology (continued)Typicalmorbidityassumptions,inaggregate,areasfollows:
Incomeprotection
Incidencerates2016–%ofADI07-112015–%ofIAD89-93
(AMPLife)
Incidencerates2016–%ofADI07-112015–%ofIAD89-93
(NMLA)
Terminationrates(ultimate)
2016–%ofADI07-112015–%ofIAD89-93
(AMPLife)
Terminationrates(ultimate)
2016–%ofADI07-112015–%ofIAD89-93
(NMLA)
31December2016 Australia 45–143 70–146 86–99 70–95
31December2015Australia 49–138 60–125 44–75 41–72
Incomeprotection
Incidencerates%ofIAD89-93
(AMPLife)
Incidencerates%ofIAD89-93
(NMLA)
Terminationrates(ultimate)
%ofIAD89-93(AMPLife)
Terminationrates(ultimate)
%ofIAD89-93(NMLA)
31December2016 NewZealand 45–67 53–80 57–78 41–57
31December2015 NewZealand 45–67 53–80 57–78 41–57
Retaillumpsum
Male%ofIA04-08
(AMPLife)
Male%ofIA04-08
(NMLA)
Female%ofIA04-08
(AMPLife)
Female%ofIA04-08
(NMLA)
31December2016 AustraliaTPD1 150–173 132–143 170–196 150–162AustraliaTrauma2 102–168 120–134 102–168 120–134NewZealandTPD1 150 194 190 194NewZealandTrauma2 114 101 114 101
31December2015AustraliaTPD1 140–155 125–138 177–196 158–175AustraliaTrauma2 105–110 96–116 105–121 96–111NewZealandTPD1 150 194 190 194NewZealandTrauma2 114 101 114 101
1 BaseIA04-08TPDtablemodifiedbasedonouraggregatedexperiencebutwithoverallproduct-specificadjustmentfactors.2 BaseIA04-08Traumatablemodifiedbasedonouraggregatedexperiencebutwithoverallproduct-specificadjustmentfactors.
Theactuarialtablesusedwereasfollows:
IA95-97 AmortalitytabledevelopedbytheInstituteofActuariesofAustraliabasedonAustralianinsuredlivesexperiencefrom1995–1997.Thetablehasbeenmodifiedtoallowforfuturemortalityimprovement.
IML00*/IFL00* IML00andIFL00aremortalitytablesdevelopedbytheInstituteandFacultyofActuariesbasedonUnitedKingdomannuitantlivesexperiencefrom1999–2002.Thetablesrefertomaleandfemalelivesrespectivelyandincorporatefactorsthatallowformortalityimprovementssincethedateoftheinvestigation.IML00*andIFL00*arethesepublishedtablesamendedforsomespecificAMPLifeandNMLAexperience.
IA04-08DTH ThiswaspublishedbytheInstituteofActuariesofAustraliaunderthenameA graduation of the 2004-2008 Lump Sum Investigation Data.Thetablehasbeenmodifiedbasedonaggregatedexperiencewithoverallproductspecificadjustmentfactors.
IA04-08TPD ThisistheTPDgraduationpublishedinthesamepaperasabove.
IA04-08Trauma ThisistheTraumagraduationpublishedinthesamepaperasabove.
IAD89-93 AdisabilitytabledevelopedbytheInstituteofActuariesofAustraliabasedonAustraliandisabilityincomeexperiencefortheperiod1989–1993.ThetablehasbeenadjustedtotakeaccountofAMPLife’sandNMLA’sownexperience.
ADI07-11 AdisabilitytabledevelopedbyKPMGattherequestoftheFinancialServicesCouncil(FSC)basedonAustraliandisabilityincomeexperiencefortheperiod2007–2011.ThistablehasbeenmodifiedforAMPLifeandNMLAwithoverallproduct-specificadjustmentfactors.
For
per
sona
l use
onl
y
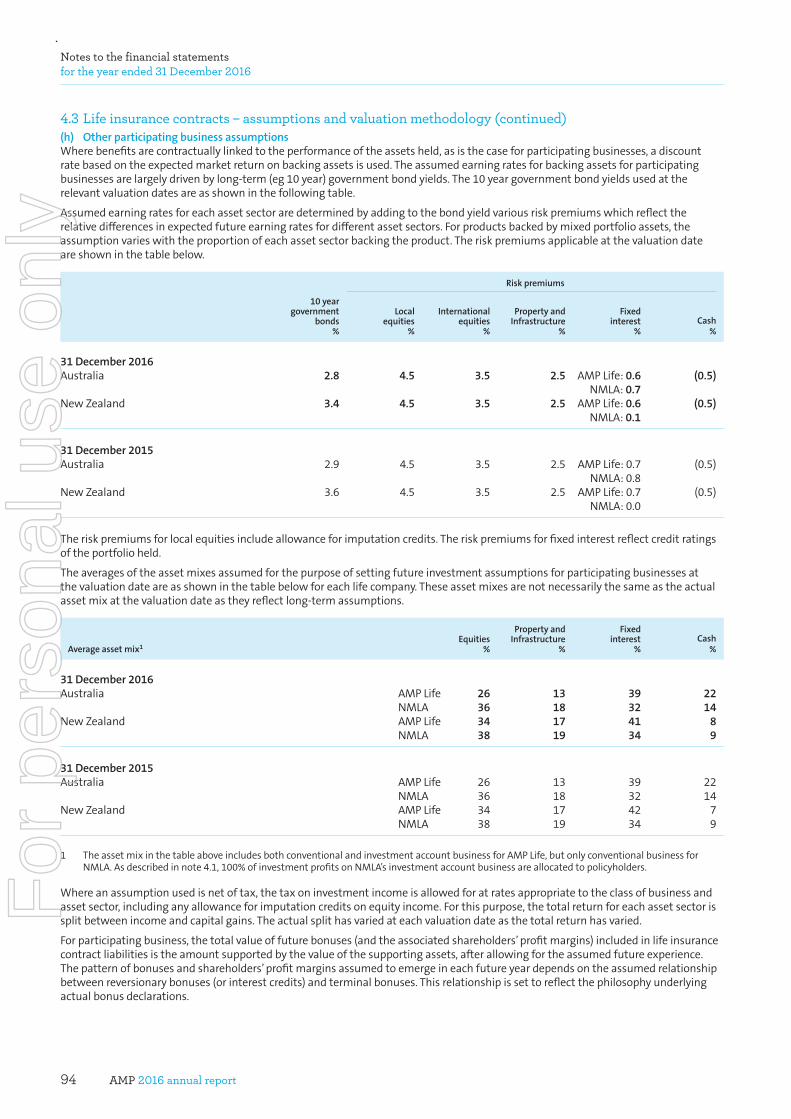
AMP 2016 annual report94
Notes to the financial statements for the year ended 31 December 2016
4.3 Life insurance contracts – assumptions and valuation methodology (continued)(h) OtherparticipatingbusinessassumptionsWherebenefitsarecontractuallylinkedtotheperformanceoftheassetsheld,asisthecaseforparticipatingbusinesses,adiscountratebasedontheexpectedmarketreturnonbackingassetsisused.Theassumedearningratesforbackingassetsforparticipatingbusinessesarelargelydrivenbylong-term(eg10year)governmentbondyields.The10yeargovernmentbondyieldsusedattherelevantvaluationdatesareasshowninthefollowingtable.
Assumedearningratesforeachassetsectoraredeterminedbyaddingtothebondyieldvariousriskpremiumswhichreflecttherelativedifferencesinexpectedfutureearningratesfordifferentassetsectors.Forproductsbackedbymixedportfolioassets,theassumptionvarieswiththeproportionofeachassetsectorbackingtheproduct.Theriskpremiumsapplicableatthevaluationdateareshowninthetablebelow.
Riskpremiums
10yeargovernment
bonds%
Localequities
%
Internationalequities
%
PropertyandInfrastructure
%
Fixedinterest
%Cash
%
31December2016 Australia 2.8 4.5 3.5 2.5 AMPLife:0.6 (0.5) NMLA:0.7NewZealand 3.4 4.5 3.5 2.5 AMPLife:0.6 (0.5) NMLA:0.1
31December2015 Australia 2.9 4.5 3.5 2.5 AMPLife:0.7 (0.5) NMLA:0.8NewZealand 3.6 4.5 3.5 2.5 AMPLife:0.7 (0.5) NMLA:0.0
Theriskpremiumsforlocalequitiesincludeallowanceforimputationcredits.Theriskpremiumsforfixedinterestreflectcreditratingsoftheportfolioheld.
Theaveragesoftheassetmixesassumedforthepurposeofsettingfutureinvestmentassumptionsforparticipatingbusinessesatthevaluationdateareasshowninthetablebelowforeachlifecompany.Theseassetmixesarenotnecessarilythesameastheactualassetmixatthevaluationdateastheyreflectlong-termassumptions.
Averageassetmix1 Equities
%
PropertyandInfrastructure
%
Fixedinterest
%Cash
%
31December2016 Australia AMPLife 26 13 39 22 NMLA 36 18 32 14NewZealand AMPLife 34 17 41 8 NMLA 38 19 34 9
31December2015 Australia AMPLife 26 13 39 22 NMLA 36 18 32 14NewZealand AMPLife 34 17 42 7 NMLA 38 19 34 9
1 TheassetmixinthetableaboveincludesbothconventionalandinvestmentaccountbusinessforAMPLife,butonlyconventionalbusinessforNMLA.Asdescribedinnote4.1,100%ofinvestmentprofitsonNMLA’sinvestmentaccountbusinessareallocatedtopolicyholders.
Whereanassumptionusedisnetoftax,thetaxoninvestmentincomeisallowedforatratesappropriatetotheclassofbusinessandassetsector,includinganyallowanceforimputationcreditsonequityincome.Forthispurpose,thetotalreturnforeachassetsectorissplitbetweenincomeandcapitalgains.Theactualsplithasvariedateachvaluationdateasthetotalreturnhasvaried.
Forparticipatingbusiness,thetotalvalueoffuturebonuses(andtheassociatedshareholders’profitmargins)includedinlifeinsurancecontractliabilitiesistheamountsupportedbythevalueofthesupportingassets,afterallowingfortheassumedfutureexperience.Thepatternofbonusesandshareholders’profitmarginsassumedtoemergeineachfutureyeardependsontheassumedrelationshipbetweenreversionarybonuses(orinterestcredits)andterminalbonuses.Thisrelationshipissettoreflectthephilosophyunderlyingactualbonusdeclarations.
For
per
sona
l use
onl
y
AMP 2016 annual report 95
4.3 Life insurance contracts – assumptions and valuation methodology (continued)Actualbonusdeclarationsaredeterminedtoreflect,overtime,theinvestmentreturnsoftheparticularfundandotherfactorsintheemergingexperienceandmanagementofthebusiness.Thesefactorsinclude:– allowanceforanappropriatedegreeofbenefitsmoothing;– reasonableexpectationsofpolicyholders;– equitybetweengenerationsofpolicyholdersappliedacrossdifferentclassesandtypesofbusiness;– ongoingcapitaladequacy.
Giventhemanyfactorsinvolved,therangeofbonusstructuresandratesforparticipatingbusinessisextremelydiverse.
TypicalsupportablebonusratesonmajorproductlinesareasfollowsforAMPLifeandNMLA(31December2015inparentheses).
ReversionarybonusBonusonsuminsured
%Bonusonexistingbonuses
%
Australia AMPLife 0.8–1.0(0.9–1.0) 1.0–1.5(1.0–1.6) NMLA 0.4–1.0(0.5–1.0) 0.8–1.5(0.9–1.4)NewZealand AMPLife 0.7–1.0(0.8–1.2) 0.7–1.0(0.8–1.2) NMLA 0.8(0.8) 1.1(1.1)
TerminalbonusTheterminalbonusscalesarecomplexandvarybyduration,productline,classofbusinessandcountryforAMPLifeandNMLA.
Creditingrates(investmentaccount) %
Australia AMPLife 1.3–3.7(0.3–5.5) NMLA 2.2–5.2(3.1–7.9)NewZealand AMPLife 2.0–3.3(3.1–7.1) NMLA 5.4–6.4(5.9–7.4)
(i) ImpactofchangesinassumptionsUnderMoS,forlifeinsurancecontractsvaluationsusingtheprojectionmethod,changesinassumptionsarerecognisedbyadjustingthevalueoffutureprofitmarginsinlifeinsurancecontractliabilities.Futureprofitmarginsarereleasedoverfutureperiods.
Changesinassumptionsdonotincludemarket-relatedchangesindiscountratessuchaschangesinbenchmarkmarketyieldscausedbychangesininvestmentmarketsandeconomicconditions.Thesearereflectedinbothlifeinsurancecontractliabilitiesandassetvaluesatthereportingdate.
Theimpactonfutureprofitmarginsofactualchangesinassumptionsfrom31December2015to31December2016inrespectoflifeinsurancecontracts(excludingnewbusinesscontractswhicharemeasuredusingassumptionsatreportingdate)isasshowninthetablebelowforthetwolifecompanies.
AMPLife NMLA
Assumptionchange
Changeinfutureprofit
margins$m
Changeinlifeinsurance
contractliabilities2
$m
Changeinshareholders’
profitandequity3
$m
Changeinfutureprofit
margins$m
Changeinlifeinsurance
contractliabilities2
$m
Changeinshareholders’
profitandequity3
$m
Non-market-relatedchangestodiscountrates (8) – – 11 2 (1)Mortalityandmorbidity (247) 212 (149) (66) 240 (168)Discontinuancerates (85) 23 (16) (121) 19 (13)Maintenanceexpenses 138 88 (62) (55) 157 (110)Otherassumptions1 (209) (48) 33 44 (84) 59
1 Otherassumptionchangesincludetheimpactofmodelling,reinsurance,productandpremiumchanges. 2 Changeinlifeinsurancecontractliabilitiesisnetofreinsurance,grossoftax. 3 Changeinshareholders’profitandequityisnetofreinsurance,netoftax. Inmostcases,theoverallamountoflifeinsurancecontractliabilitiesandthecurrentperiodprofitarenotaffectedbychangesinassumptions.However,whereinthecaseofaparticularrelatedproductgroup,thechangesinassumptionsattheendofaperiodeliminateanyfutureprofitmarginsfortherelatedproductgroup,andresultinnegativefutureprofitmargins,thisnegativebalanceforallforecastedfutureperiodsisrecognisedasalossinthecurrentperiod.Ifthechangesinassumptionsinaperiodarefavourableforaproductgroupcurrentlyinlossrecognition,thenthepreviouslyrecognisedlossesarereversedintheperiod.
For
per
sona
l use
onl
y
AMP 2016 annual report96
Notes to the financial statements for the year ended 31 December 2016
4.4 Life insurance contracts – risk (a) LifeinsuranceriskAMPLifeandNMLAlifeinsuranceentitiesissuecontractsthattransfersignificantinsuranceriskfromthepolicyholder,coveringdeath,disabilityorlongevityoftheinsured,ofteninconjunctionwiththeprovisionofwealthmanagementproducts.
Theproductscarryinginsuranceriskaredesignedtoensurethatpolicywordingandpromotionalmaterialsareclear,unambiguousanddonotleaveAMPLifeandNMLAopentoclaimsfromcausesthatwerenotanticipated.Thevariabilityinherentininsurancerisk,includingconcentrationrisk,ismanagedbyhavingalargegeographicallydiverseportfolioofindividualrisks,underwritingandtheuseofreinsurance.
Underwritingismanagedthroughadedicatedunderwritingdepartment,withformalunderwritinglimitsandappropriatetraininganddevelopmentofunderwritingstaff.Individualpoliciescarryinginsuranceriskaregenerallyunderwrittenindividuallyontheirmerits.Individualpolicieswhicharetransferredfromagroupschemearegenerallyissuedwithoutunderwriting.Groupriskinsurancepoliciesmeetingcertaincriteriaareunderwrittenonthemeritsoftheemployeegroupasawhole.
Claimsaremanagedthroughadedicatedclaimsmanagementteam,withformalclaimsacceptancelimitsandappropriatetraininganddevelopmentofstaffwithanobjectivetoensurepaymentofallgenuineclaims.Claimsexperienceisassessedregularlyandappropriateactuarialreservesareestablishedtoreflectup-to-dateexperienceandanyanticipatedfutureevents.Thisincludesreservesforclaimsincurredbutnotyetreported.
AMPLifeandNMLAreinsure(cede)toreinsurancecompaniesaproportionoftheirportfolioorcertaintypesofinsurancerisk,includingcatastrophe.Thisservesprimarilyto:– reducethenetliabilityonlargeindividualrisks;– obtaingreaterdiversificationofinsurancerisks;– provideprotectionagainstlargelosses;– reduceoverallexposuretorisk;– reducetheamountofcapitalrequiredtosupportthebusiness.
ThereinsurancecompaniesareregulatedbytheAustralianPrudentialRegulationAuthority(APRA),orindustryregulatorsinotherjurisdictionsandhavestrongcreditratingsfromA+toAA+.
For
per
sona
l use
onl
y
AMP 2016 annual report 97
4.4 Life insurance contracts – risk (continued)(b) KeytermsandconditionsoflifeinsurancecontractsThenatureofthetermsofthelifeinsurancecontractswrittenbyAMPLifeandNMLAissuchthatcertainexternalvariablescanbeidentifiedonwhichrelatedcashflowsforclaimpaymentsdepend.ThefollowingtableprovidesanoverviewofthekeyvariablesuponwhichthetiminganduncertaintyoffuturecashflowsofthevariouslifeinsurancecontractsissuedbyAMPLifeandNMLAdepend.
Typeofcontract Detailofcontractworkings NatureofcompensationforclaimsKeyvariablesaffectingfuturecashflows
Non-participating life insurance contracts with fixed and guaranteed terms (term life and disability)
Thesepoliciesprovideguaranteedbenefits,whicharepaidondeathorill-health,thatarefixedandnotatthediscretionoftheLifeCompanies.PremiumratesforyearlyrenewablebusinessarenotguaranteedandmaybechangedatthediscretionoftheLifeCompaniesfortheportfolioasawhole.
Benefitsaredefinedbytheinsurancecontractandarenotdirectlyaffectedbytheinvestmentperformanceofanyunderlyingassets.
Mortality,morbidity,lapses,expensesandinvestmentmarketearningratesonassetsbackingtheliabilities.
Life annuity contracts
Thesepoliciesprovideaguaranteedregularincomeforthelifeoftheinsuredinexchangeforaninitialsinglepremium.
Theamountoftheguaranteedregularincomeissetatinceptionofthepolicyallowingforanyindexation.
Longevity,expenses,inflationandinvestmentmarketearningratesonassetsbackingtheliabilities.
Conventional life insurance contracts with discretionary participating benefits (endowment and whole of life)
Thepolicyholderpaysaregularpremiumandreceivesthespecifiedsuminsuredplusanyaccruingbonusesondeathormaturity.Thesuminsuredisspecifiedatinceptionandguaranteed.Bonusesareaddedannually,whichonceaddedareguaranteed.Afurtherbonusmaybeaddedonsurrender,deathormaturity.
Benefitsarisingfromthediscretionarybonusesarebasedontheperformanceofaspecifiedpoolofcontractsandtheassetssupportingthesecontracts.
Investmentmarketearningratesonassetsbackingtheliabilities,lapses,expensesandmortality.
Investment account contracts with discretionary participating features
Thegrossvalueofpremiumsreceivedisinvestedintheinvestmentaccountwithfeesandpremiumsforanyassociatedinsurancecoverbeingdeductedfromtheaccountbalancewhendue.Interestiscreditedregularly.
Paymentoftheaccountbalanceisgenerallyguaranteed,althoughitmaybesubjecttocertainpenaltiesonearlysurrenderorlimitedadjustmentinadverseinvestmentmarkets.Operatingprofitarisingfromthesecontractsisallocatedbetweenthepolicyholdersandshareholderswithnotlessthan80%allocatedtopolicyholders.Distributionofpolicyholderprofitisthroughaninterestratemechanism.
Fees,lapses,expensesandinvestmentmarketearningratesontheassetsbackingtheliabilities.
For
per
sona
l use
onl
y
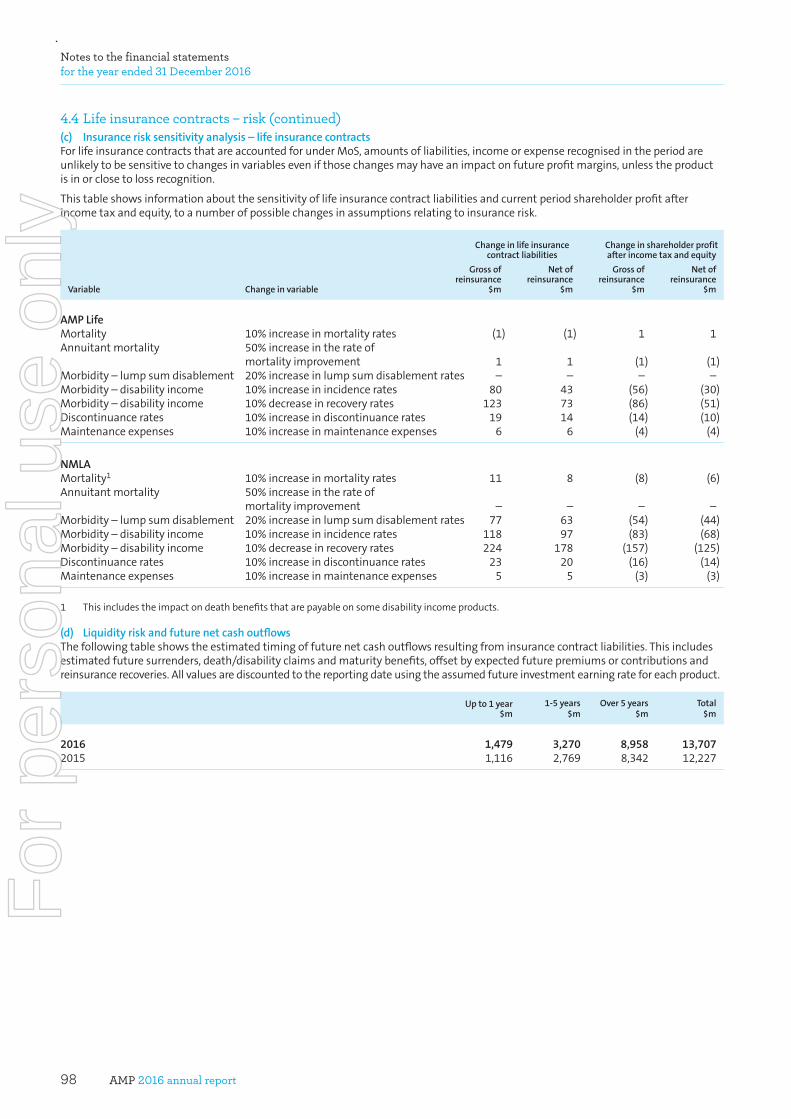
AMP 2016 annual report98
Notes to the financial statements for the year ended 31 December 2016
4.4 Life insurance contracts – risk (continued)(c) Insurancerisksensitivityanalysis–lifeinsurancecontractsForlifeinsurancecontractsthatareaccountedforunderMoS,amountsofliabilities,incomeorexpenserecognisedintheperiodareunlikelytobesensitivetochangesinvariablesevenifthosechangesmayhaveanimpactonfutureprofitmargins,unlesstheproductisinorclosetolossrecognition.
Thistableshowsinformationaboutthesensitivityoflifeinsurancecontractliabilitiesandcurrentperiodshareholderprofitafterincometaxandequity,toanumberofpossiblechangesinassumptionsrelatingtoinsurancerisk.
Changeinlifeinsurancecontractliabilities
Changeinshareholderprofitafterincometaxandequity
Variable Changeinvariable
Grossofreinsurance
$m
Netofreinsurance
$m
Grossofreinsurance
$m
Netofreinsurance
$m
AMPLifeMortality 10%increaseinmortalityrates (1) (1) 1 1Annuitantmortality 50%increaseintherateof mortalityimprovement 1 1 (1) (1)Morbidity–lumpsumdisablement 20%increaseinlumpsumdisablementrates – – – –Morbidity–disabilityincome 10%increaseinincidencerates 80 43 (56) (30)Morbidity–disabilityincome 10%decreaseinrecoveryrates 123 73 (86) (51)Discontinuancerates 10%increaseindiscontinuancerates 19 14 (14) (10)Maintenanceexpenses 10%increaseinmaintenanceexpenses 6 6 (4) (4)
NMLA Mortality1 10%increaseinmortalityrates 11 8 (8) (6)Annuitantmortality 50%increaseintherateof mortalityimprovement – – – –Morbidity–lumpsumdisablement 20%increaseinlumpsumdisablementrates 77 63 (54) (44)Morbidity–disabilityincome 10%increaseinincidencerates 118 97 (83) (68)Morbidity–disabilityincome 10%decreaseinrecoveryrates 224 178 (157) (125)Discontinuancerates 10%increaseindiscontinuancerates 23 20 (16) (14)Maintenanceexpenses 10%increaseinmaintenanceexpenses 5 5 (3) (3)
1 Thisincludestheimpactondeathbenefitsthatarepayableonsomedisabilityincomeproducts.
(d) LiquidityriskandfuturenetcashoutflowsThefollowingtableshowstheestimatedtimingoffuturenetcashoutflowsresultingfrominsurancecontractliabilities.Thisincludesestimatedfuturesurrenders,death/disabilityclaimsandmaturitybenefits,offsetbyexpectedfuturepremiumsorcontributionsandreinsurancerecoveries.Allvaluesarediscountedtothereportingdateusingtheassumedfutureinvestmentearningrateforeachproduct.
Upto1year$m
1-5years$m
Over5years$m
Total$m
2016 1,479 3,270 8,958 13,7072015 1,116 2,769 8,342 12,227
For
per
sona
l use
onl
y
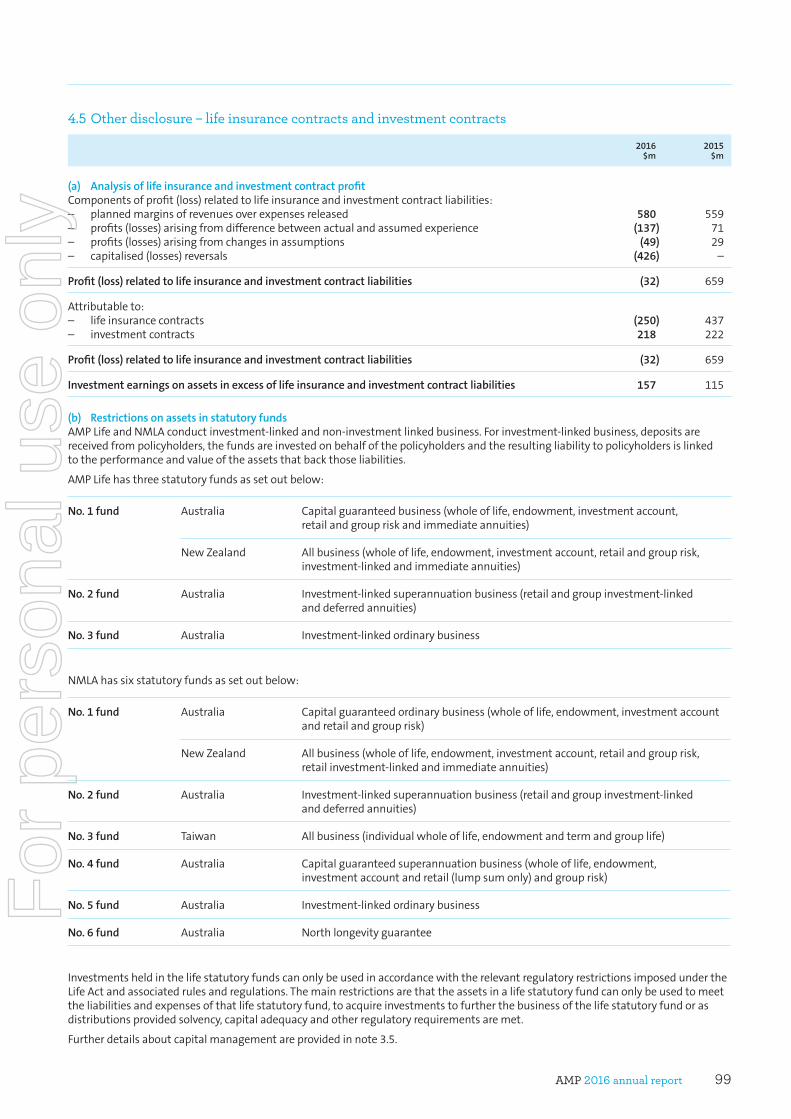
AMP 2016 annual report 99
4.5 Other disclosure – life insurance contracts and investment contracts
2016$m
2015$m
(a) Analysisoflifeinsuranceandinvestmentcontractprofit Componentsofprofit(loss)relatedtolifeinsuranceandinvestmentcontractliabilities: – plannedmarginsofrevenuesoverexpensesreleased 580 559– profits(losses)arisingfromdifferencebetweenactualandassumedexperience (137) 71– profits(losses)arisingfromchangesinassumptions (49) 29– capitalised(losses)reversals (426) –
Profit(loss)relatedtolifeinsuranceandinvestmentcontractliabilities (32) 659
Attributableto: – lifeinsurancecontracts (250) 437– investmentcontracts 218 222
Profit(loss)relatedtolifeinsuranceandinvestmentcontractliabilities (32) 659
Investmentearningsonassetsinexcessoflifeinsuranceandinvestmentcontractliabilities 157 115
(b) RestrictionsonassetsinstatutoryfundsAMPLifeandNMLAconductinvestment-linkedandnon-investmentlinkedbusiness.Forinvestment-linkedbusiness,depositsarereceivedfrompolicyholders,thefundsareinvestedonbehalfofthepolicyholdersandtheresultingliabilitytopolicyholdersislinkedtotheperformanceandvalueoftheassetsthatbackthoseliabilities.
AMPLifehasthreestatutoryfundsassetoutbelow:
No.1fund Australia Capitalguaranteedbusiness(wholeoflife,endowment,investmentaccount,retailandgroupriskandimmediateannuities)
NewZealand Allbusiness(wholeoflife,endowment,investmentaccount,retailandgrouprisk,investment-linkedandimmediateannuities)
No.2fund Australia Investment-linkedsuperannuationbusiness(retailandgroupinvestment-linkedanddeferredannuities)
No.3fund Australia Investment-linkedordinarybusiness
NMLAhassixstatutoryfundsassetoutbelow:
No.1fund Australia Capitalguaranteedordinarybusiness(wholeoflife,endowment,investmentaccountandretailandgrouprisk)
NewZealand Allbusiness(wholeoflife,endowment,investmentaccount,retailandgrouprisk,retailinvestment-linkedandimmediateannuities)
No.2fund Australia Investment-linkedsuperannuationbusiness(retailandgroupinvestment-linkedanddeferredannuities)
No.3fund Taiwan Allbusiness(individualwholeoflife,endowmentandtermandgrouplife)
No.4fund Australia Capitalguaranteedsuperannuationbusiness(wholeoflife,endowment,investmentaccountandretail(lumpsumonly)andgrouprisk)
No.5fund Australia Investment-linkedordinarybusiness
No.6fund Australia Northlongevityguarantee
InvestmentsheldinthelifestatutoryfundscanonlybeusedinaccordancewiththerelevantregulatoryrestrictionsimposedundertheLifeActandassociatedrulesandregulations.Themainrestrictionsarethattheassetsinalifestatutoryfundcanonlybeusedtomeettheliabilitiesandexpensesofthatlifestatutoryfund,toacquireinvestmentstofurtherthebusinessofthelifestatutoryfundorasdistributionsprovidedsolvency,capitaladequacyandotherregulatoryrequirementsaremet.
Furtherdetailsaboutcapitalmanagementareprovidedinnote3.5.
For
per
sona
l use
onl
y
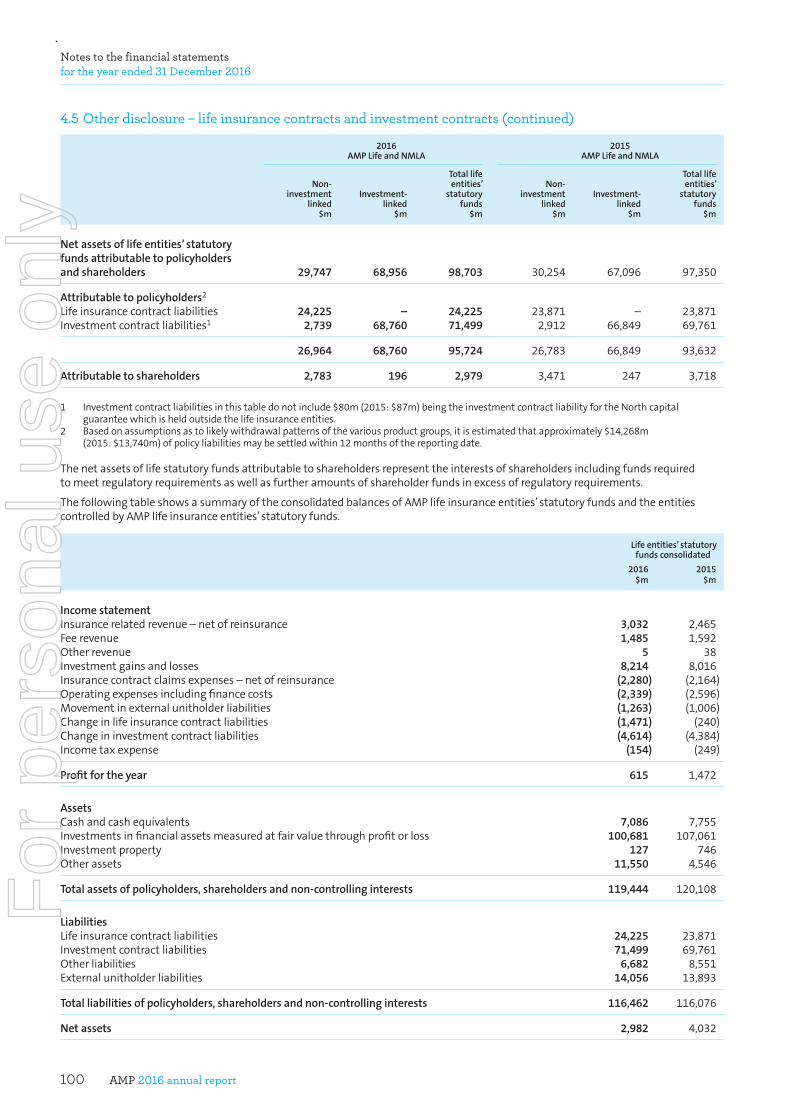
AMP 2016 annual report100
Notes to the financial statements for the year ended 31 December 2016
4.5 Other disclosure – life insurance contracts and investment contracts (continued)
2016AMPLifeandNMLA
2015AMPLifeandNMLA
Non-investment
linked$m
Investment-linked
$m
Totallifeentities’
statutoryfunds
$m
Non-investment
linked$m
Investment-linked
$m
Totallifeentities’
statutoryfunds
$m
Netassetsoflifeentities’statutoryfundsattributabletopolicyholdersandshareholders 29,747 68,956 98,703 30,254 67,096 97,350
Attributabletopolicyholders2 Lifeinsurancecontractliabilities 24,225 – 24,225 23,871 – 23,871Investmentcontractliabilities1 2,739 68,760 71,499 2,912 66,849 69,761
26,964 68,760 95,724 26,783 66,849 93,632
Attributabletoshareholders 2,783 196 2,979 3,471 247 3,718
1 Investmentcontractliabilitiesinthistabledonotinclude$80m(2015:$87m)beingtheinvestmentcontractliabilityfortheNorthcapitalguaranteewhichisheldoutsidethelifeinsuranceentities.
2 Basedonassumptionsastolikelywithdrawalpatternsofthevariousproductgroups,itisestimatedthatapproximately$14,268m(2015:$13,740m)ofpolicyliabilitiesmaybesettledwithin12monthsofthereportingdate.
Thenetassetsoflifestatutoryfundsattributabletoshareholdersrepresenttheinterestsofshareholdersincludingfundsrequiredtomeetregulatoryrequirementsaswellasfurtheramountsofshareholderfundsinexcessofregulatoryrequirements.
ThefollowingtableshowsasummaryoftheconsolidatedbalancesofAMPlifeinsuranceentities’statutoryfundsandtheentitiescontrolledbyAMPlifeinsuranceentities’statutoryfunds.
Lifeentities’statutoryfundsconsolidated
2016$m
2015$m
IncomestatementInsurancerelatedrevenue–netofreinsurance 3,032 2,465Feerevenue 1,485 1,592Otherrevenue 5 38Investmentgainsandlosses 8,214 8,016Insurancecontractclaimsexpenses–netofreinsurance (2,280) (2,164)Operatingexpensesincludingfinancecosts (2,339) (2,596)Movementinexternalunitholderliabilities (1,263) (1,006)Changeinlifeinsurancecontractliabilities (1,471) (240)Changeininvestmentcontractliabilities (4,614) (4,384)Incometaxexpense (154) (249)
Profitfortheyear 615 1,472
Assets Cashandcashequivalents 7,086 7,755Investmentsinfinancialassetsmeasuredatfairvaluethroughprofitorloss 100,681 107,061Investmentproperty 127 746Otherassets 11,550 4,546
Totalassetsofpolicyholders,shareholdersandnon-controllinginterests 119,444 120,108
Liabilities Lifeinsurancecontractliabilities 24,225 23,871Investmentcontractliabilities 71,499 69,761Otherliabilities 6,682 8,551Externalunitholderliabilities 14,056 13,893
Totalliabilitiesofpolicyholders,shareholdersandnon-controllinginterests 116,462 116,076
Netassets 2,982 4,032
For
per
sona
l use
onl
y
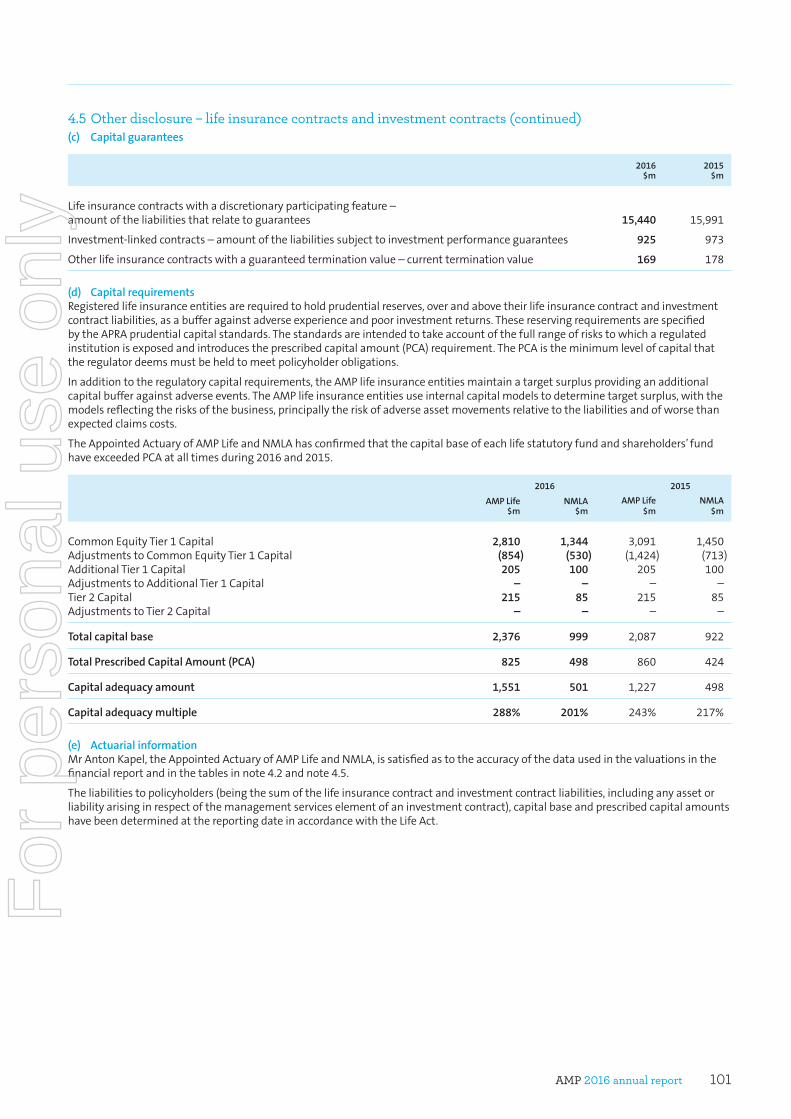
AMP 2016 annual report 101
4.5 Other disclosure – life insurance contracts and investment contracts (continued)(c) Capitalguarantees
2016$m
2015$m
Lifeinsurancecontractswithadiscretionaryparticipatingfeature–amountoftheliabilitiesthatrelatetoguarantees 15,440 15,991
Investment-linkedcontracts–amountoftheliabilitiessubjecttoinvestmentperformanceguarantees 925 973
Otherlifeinsurancecontractswithaguaranteedterminationvalue–currentterminationvalue 169 178
(d) CapitalrequirementsRegisteredlifeinsuranceentitiesarerequiredtoholdprudentialreserves,overandabovetheirlifeinsurancecontractandinvestmentcontractliabilities,asabufferagainstadverseexperienceandpoorinvestmentreturns.ThesereservingrequirementsarespecifiedbytheAPRAprudentialcapitalstandards.Thestandardsareintendedtotakeaccountofthefullrangeofriskstowhicharegulatedinstitutionisexposedandintroducestheprescribedcapitalamount(PCA)requirement.ThePCAistheminimumlevelofcapitalthattheregulatordeemsmustbeheldtomeetpolicyholderobligations.
Inadditiontotheregulatorycapitalrequirements,theAMPlifeinsuranceentitiesmaintainatargetsurplusprovidinganadditionalcapitalbufferagainstadverseevents.TheAMPlifeinsuranceentitiesuseinternalcapitalmodelstodeterminetargetsurplus,withthemodelsreflectingtherisksofthebusiness,principallytheriskofadverseassetmovementsrelativetotheliabilitiesandofworsethanexpectedclaimscosts.
TheAppointedActuaryofAMPLifeandNMLAhasconfirmedthatthecapitalbaseofeachlifestatutoryfundandshareholders’fundhaveexceededPCAatalltimesduring2016and2015.
2016 2015
AMPLife$m
NMLA$m
AMPLife$m
NMLA$m
CommonEquityTier1Capital 2,810 1,344 3,091 1,450AdjustmentstoCommonEquityTier1Capital (854) (530) (1,424) (713)AdditionalTier1Capital 205 100 205 100AdjustmentstoAdditionalTier1Capital – – – –Tier2Capital 215 85 215 85AdjustmentstoTier2Capital – – – –
Totalcapitalbase 2,376 999 2,087 922
TotalPrescribedCapitalAmount(PCA) 825 498 860 424
Capitaladequacyamount 1,551 501 1,227 498
Capitaladequacymultiple 288% 201% 243% 217%
(e) ActuarialinformationMrAntonKapel,theAppointedActuaryofAMPLifeandNMLA,issatisfiedastotheaccuracyofthedatausedinthevaluationsinthefinancialreportandinthetablesinnote4.2andnote4.5.
Theliabilitiestopolicyholders(beingthesumofthelifeinsurancecontractandinvestmentcontractliabilities,includinganyassetorliabilityarisinginrespectofthemanagementserviceselementofaninvestmentcontract),capitalbaseandprescribedcapitalamountshavebeendeterminedatthereportingdateinaccordancewiththeLifeAct.
For
per
sona
l use
onl
y
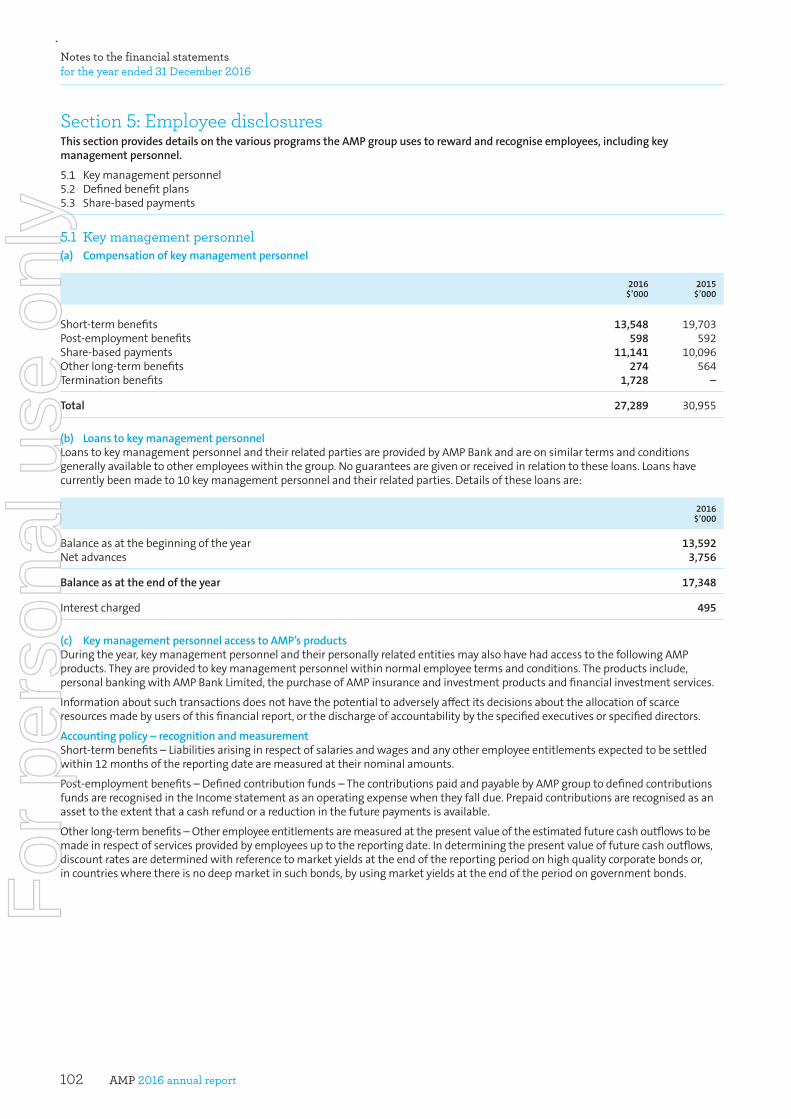
AMP 2016 annual report102
Notes to the financial statements for the year ended 31 December 2016
Section 5: Employee disclosuresThissectionprovidesdetailsonthevariousprogramstheAMPgroupusestorewardandrecogniseemployees,includingkeymanagementpersonnel.
5.1 Keymanagementpersonnel5.2 Definedbenefitplans5.3 Share-basedpayments
5.1 Key management personnel(a) Compensationofkeymanagementpersonnel
2016$’000
2015$’000
Short-termbenefits 13,548 19,703Post-employmentbenefits 598 592Share-basedpayments 11,141 10,096Otherlong-termbenefits 274 564Terminationbenefits 1,728 –
Total 27,289 30,955
(b) LoanstokeymanagementpersonnelLoanstokeymanagementpersonnelandtheirrelatedpartiesareprovidedbyAMPBankandareonsimilartermsandconditionsgenerallyavailabletootheremployeeswithinthegroup.Noguaranteesaregivenorreceivedinrelationtotheseloans.Loanshavecurrentlybeenmadeto10keymanagementpersonnelandtheirrelatedparties.Detailsoftheseloansare:
2016$’000
Balanceasatthebeginningoftheyear 13,592Netadvances 3,756
Balanceasattheendoftheyear 17,348
Interestcharged 495
(c) KeymanagementpersonnelaccesstoAMP’sproductsDuringtheyear,keymanagementpersonnelandtheirpersonallyrelatedentitiesmayalsohavehadaccesstothefollowingAMPproducts.Theyareprovidedtokeymanagementpersonnelwithinnormalemployeetermsandconditions.Theproductsinclude,personalbankingwithAMPBankLimited,thepurchaseofAMPinsuranceandinvestmentproductsandfinancialinvestmentservices.
Informationaboutsuchtransactionsdoesnothavethepotentialtoadverselyaffectitsdecisionsabouttheallocationofscarceresourcesmadebyusersofthisfinancialreport,orthedischargeofaccountabilitybythespecifiedexecutivesorspecifieddirectors.
Accountingpolicy–recognitionandmeasurementShort-termbenefits–Liabilitiesarisinginrespectofsalariesandwagesandanyotheremployeeentitlementsexpectedtobesettledwithin12monthsofthereportingdatearemeasuredattheirnominalamounts.
Post-employmentbenefits–Definedcontributionfunds–ThecontributionspaidandpayablebyAMPgrouptodefinedcontributionsfundsarerecognisedintheIncomestatementasanoperatingexpensewhentheyfalldue.Prepaidcontributionsarerecognisedasanassettotheextentthatacashrefundorareductioninthefuturepaymentsisavailable.
Otherlong-termbenefits–Otheremployeeentitlementsaremeasuredatthepresentvalueoftheestimatedfuturecashoutflowstobemadeinrespectofservicesprovidedbyemployeesuptothereportingdate.Indeterminingthepresentvalueoffuturecashoutflows,discountratesaredeterminedwithreferencetomarketyieldsattheendofthereportingperiodonhighqualitycorporatebondsor,incountrieswherethereisnodeepmarketinsuchbonds,byusingmarketyieldsattheendoftheperiodongovernmentbonds.
For
per
sona
l use
onl
y
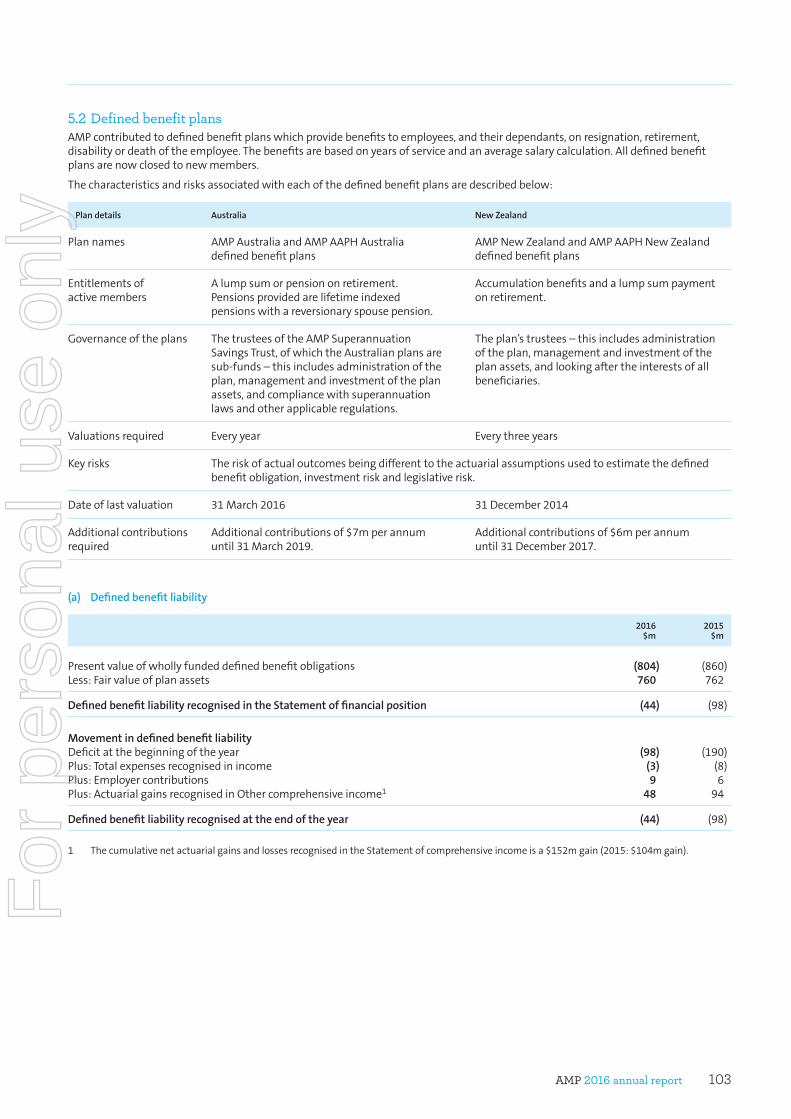
AMP 2016 annual report 103
5.2 Defined benefit plans AMPcontributedtodefinedbenefitplanswhichprovidebenefitstoemployees,andtheirdependants,onresignation,retirement,disabilityordeathoftheemployee.Thebenefitsarebasedonyearsofserviceandanaveragesalarycalculation.Alldefinedbenefitplansarenowclosedtonewmembers.
Thecharacteristicsandrisksassociatedwitheachofthedefinedbenefitplansaredescribedbelow:
Plandetails Australia NewZealand
Plannames AMPAustraliaandAMPAAPHAustraliadefinedbenefitplans
AMPNewZealandandAMPAAPHNewZealanddefinedbenefitplans
Entitlementsofactivemembers
Alumpsumorpensiononretirement.Pensionsprovidedarelifetimeindexedpensionswithareversionaryspousepension.
Accumulationbenefitsandalumpsumpaymentonretirement.
Governanceoftheplans ThetrusteesoftheAMPSuperannuationSavingsTrust,ofwhichtheAustralianplansaresub-funds–thisincludesadministrationoftheplan,managementandinvestmentoftheplanassets,andcompliancewithsuperannuationlawsandotherapplicableregulations.
Theplan’strustees–thisincludesadministrationoftheplan,managementandinvestmentoftheplanassets,andlookingaftertheinterestsofallbeneficiaries.
Valuationsrequired Everyyear Everythreeyears
Keyrisks Theriskofactualoutcomesbeingdifferenttotheactuarialassumptionsusedtoestimatethedefinedbenefitobligation,investmentriskandlegislativerisk.
Dateoflastvaluation 31March2016 31December2014
Additionalcontributionsrequired
Additionalcontributionsof$7mperannumuntil31March2019.
Additionalcontributionsof$6mperannumuntil31December2017.
(a) Definedbenefitliability
2016$m
2015$m
Presentvalueofwhollyfundeddefinedbenefitobligations (804) (860)Less:Fairvalueofplanassets 760 762
DefinedbenefitliabilityrecognisedintheStatementoffinancialposition (44) (98)
Movementindefinedbenefitliability Deficitatthebeginningoftheyear (98) (190)Plus:Totalexpensesrecognisedinincome (3) (8)Plus:Employercontributions 9 6Plus:ActuarialgainsrecognisedinOthercomprehensiveincome1 48 94
Definedbenefitliabilityrecognisedattheendoftheyear (44) (98)
1 ThecumulativenetactuarialgainsandlossesrecognisedintheStatementofcomprehensiveincomeisa$152mgain(2015:$104mgain).
For
per
sona
l use
onl
y
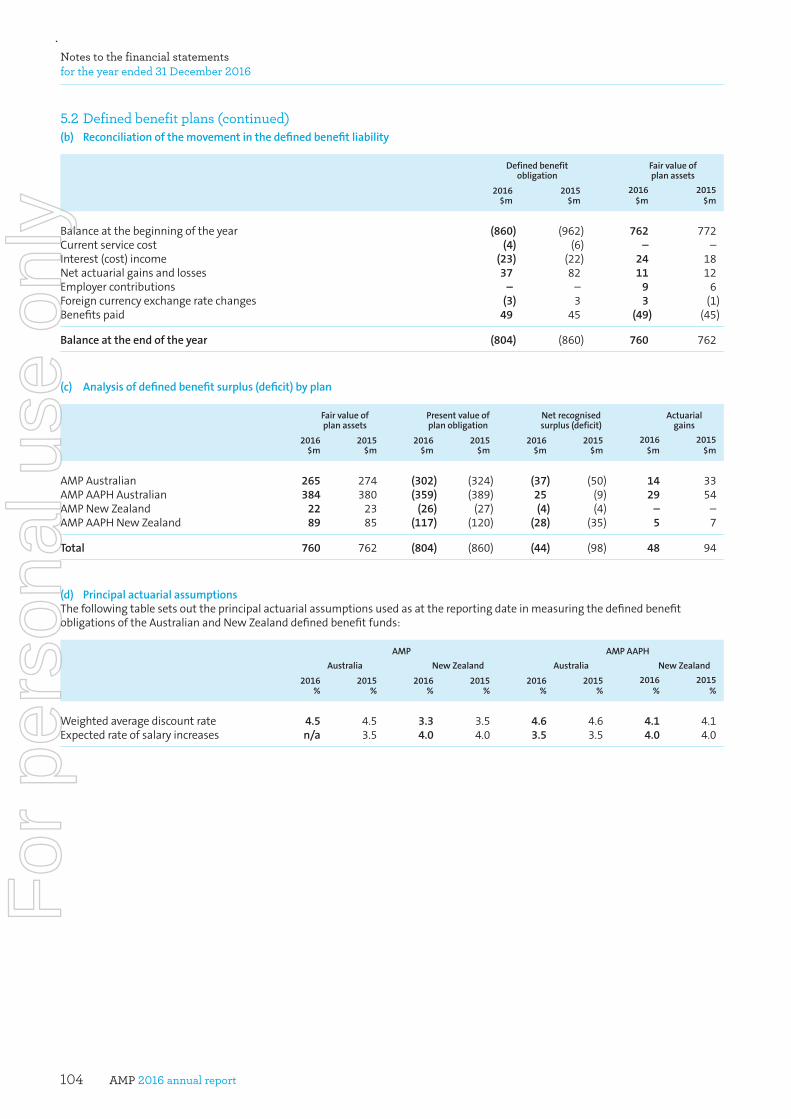
AMP 2016 annual report104
Notes to the financial statements for the year ended 31 December 2016
5.2 Defined benefit plans (continued)(b) Reconciliationofthemovementinthedefinedbenefitliability
Definedbenefitobligation
Fairvalueofplanassets
2016$m
2015$m
2016$m
2015$m
Balanceatthebeginningoftheyear (860) (962) 762 772Currentservicecost (4) (6) – –Interest(cost)income (23) (22) 24 18Netactuarialgainsandlosses 37 82 11 12Employercontributions – – 9 6Foreigncurrencyexchangeratechanges (3) 3 3 (1)Benefitspaid 49 45 (49) (45)
Balanceattheendoftheyear (804) (860) 760 762
(c) Analysisofdefinedbenefitsurplus(deficit)byplan
Fairvalueofplanassets
Presentvalueofplanobligation
Netrecognisedsurplus(deficit)
Actuarialgains
2016$m
2015$m
2016$m
2015$m
2016$m
2015$m
2016$m
2015$m
AMPAustralian 265 274 (302) (324) (37) (50) 14 33AMPAAPHAustralian 384 380 (359) (389) 25 (9) 29 54AMPNewZealand 22 23 (26) (27) (4) (4) – –AMPAAPHNewZealand 89 85 (117) (120) (28) (35) 5 7
Total 760 762 (804) (860) (44) (98) 48 94
(d) PrincipalactuarialassumptionsThefollowingtablesetsouttheprincipalactuarialassumptionsusedasatthereportingdateinmeasuringthedefinedbenefitobligationsoftheAustralianandNewZealanddefinedbenefitfunds:
AMP AMPAAPH
Australia NewZealand Australia NewZealand
2016%
2015%
2016%
2015%
2016%
2015%
2016%
2015%
Weightedaveragediscountrate 4.5 4.5 3.3 3.5 4.6 4.6 4.1 4.1Expectedrateofsalaryincreases n/a 3.5 4.0 4.0 3.5 3.5 4.0 4.0
For
per
sona
l use
onl
y
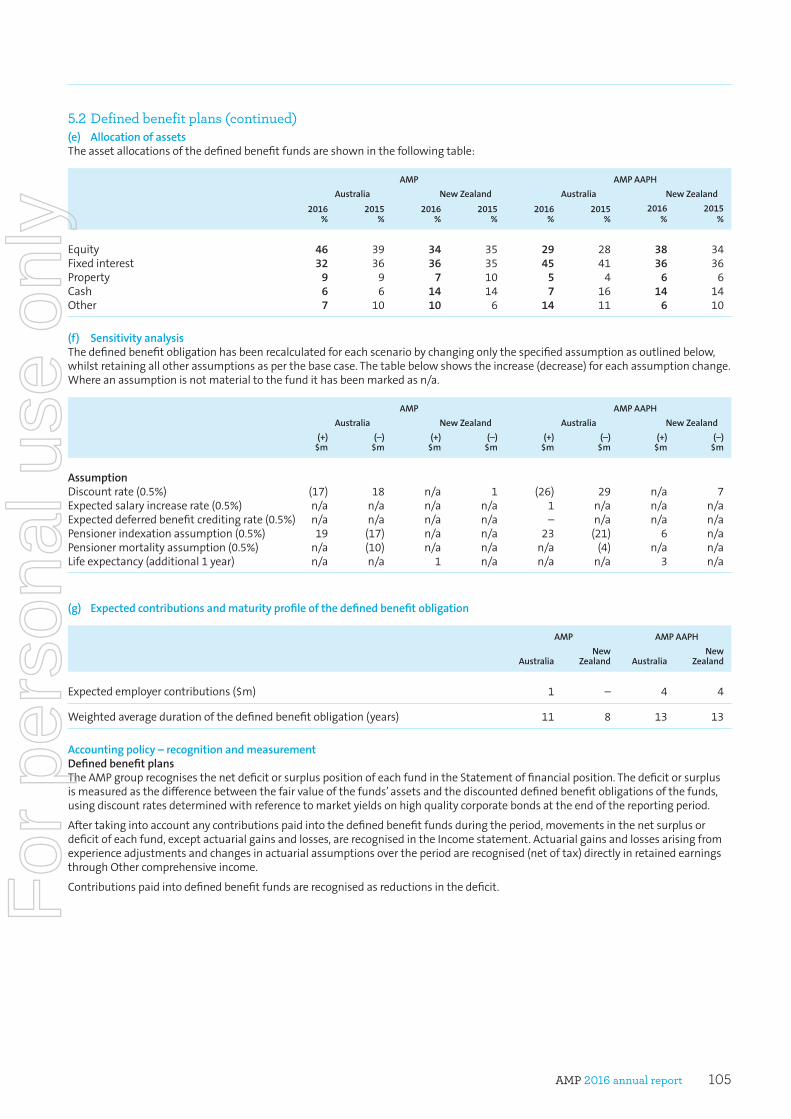
AMP 2016 annual report 105
5.2 Defined benefit plans (continued)(e) AllocationofassetsTheassetallocationsofthedefinedbenefitfundsareshowninthefollowingtable:
AMP AMPAAPH
Australia NewZealand Australia NewZealand
2016%
2015%
2016%
2015%
2016%
2015%
2016%
2015%
Equity 46 39 34 35 29 28 38 34Fixedinterest 32 36 36 35 45 41 36 36Property 9 9 7 10 5 4 6 6Cash 6 6 14 14 7 16 14 14Other 7 10 10 6 14 11 6 10
(f) SensitivityanalysisThedefinedbenefitobligationhasbeenrecalculatedforeachscenariobychangingonlythespecifiedassumptionasoutlinedbelow,whilstretainingallotherassumptionsasperthebasecase.Thetablebelowshowstheincrease(decrease)foreachassumptionchange.Whereanassumptionisnotmaterialtothefundithasbeenmarkedasn/a.
AMP AMPAAPH
Australia NewZealand Australia NewZealand
(+)$m
(–)$m
(+)$m
(–)$m
(+)$m
(–)$m
(+)$m
(–)$m
AssumptionDiscountrate(0.5%) (17) 18 n/a 1 (26) 29 n/a 7Expectedsalaryincreaserate(0.5%) n/a n/a n/a n/a 1 n/a n/a n/aExpecteddeferredbenefitcreditingrate(0.5%) n/a n/a n/a n/a – n/a n/a n/aPensionerindexationassumption(0.5%) 19 (17) n/a n/a 23 (21) 6 n/aPensionermortalityassumption(0.5%) n/a (10) n/a n/a n/a (4) n/a n/aLifeexpectancy(additional1year) n/a n/a 1 n/a n/a n/a 3 n/a
(g) Expectedcontributionsandmaturityprofileofthedefinedbenefitobligation
AMP AMPAAPH
AustraliaNew
Zealand AustraliaNew
Zealand
Expectedemployercontributions($m) 1 – 4 4
Weightedaveragedurationofthedefinedbenefitobligation(years) 11 8 13 13
Accountingpolicy–recognitionandmeasurementDefinedbenefitplansTheAMPgrouprecognisesthenetdeficitorsurpluspositionofeachfundintheStatementoffinancialposition.Thedeficitorsurplusismeasuredasthedifferencebetweenthefairvalueofthefunds’assetsandthediscounteddefinedbenefitobligationsofthefunds,usingdiscountratesdeterminedwithreferencetomarketyieldsonhighqualitycorporatebondsattheendofthereportingperiod.
Aftertakingintoaccountanycontributionspaidintothedefinedbenefitfundsduringtheperiod,movementsinthenetsurplusordeficitofeachfund,exceptactuarialgainsandlosses,arerecognisedintheIncomestatement.Actuarialgainsandlossesarisingfromexperienceadjustmentsandchangesinactuarialassumptionsovertheperiodarerecognised(netoftax)directlyinretainedearningsthroughOthercomprehensiveincome.
Contributionspaidintodefinedbenefitfundsarerecognisedasreductionsinthedeficit.For
per
sona
l use
onl
y
AMP 2016 annual report106
Notes to the financial statements for the year ended 31 December 2016
5.3 Share-based paymentsAMPhasanumberofemployeeshare-basedpaymentplans.Share-basedpaymentsplaceemployeesparticipatinginthoseplans(participants)inthepositionoftheshareholder,andindoingso,rewardemployeesforthegenerationofvalueforshareholders.InformationonplanswhichAMPcurrentlyoffersisprovidedbelow.
ThefollowingtableshowstheexpenserecordedforAMPshare-basedpaymentplansduringtheyear:
2016$’000
2015$’000
Performancerights 12,377 11,433Sharerights 24,109 22,596Restrictedshares – 16Employeeshareacquisitionplan–matchingshares – 1
Totalshare-basedpaymentsexpense 36,486 34,046
(a) PerformancerightsTheCEOandhisdirectreports,aswellasselectedseniorexecutives,arerequiredtotaketheirlong-termincentive(LTI)awardsintheformofperformancerights.Thisistoensurethattheinterestsofthoseexecutives,whoaremostdirectlyabletoinfluencecompanyperformance,areappropriatelyalignedwiththeinterestsofshareholders.
Plan LTIawardplan
Overview PerformancerightsgivetheparticipanttherighttoacquireonefullypaidordinaryshareinAMPLimiteduponmeetingspecificperformancehurdles.Theyaregrantedatnocosttotheparticipantandcarrynodividendorvotingrightsuntiltheyvest.Performancerightsmaybesettledthroughacashpaymentinlieuofshares,atthediscretionoftheboard.
Vestingconditions Theperformancehurdlesforrightsgrantedin2014and2013are:– 50%subjecttoAMP’stotalshareholderreturn(TSR)performancerelativetothetopindustrial
companiesintheS&P/ASX100Indexoverathree-yearperformanceperiod;– 50%subjecttoareturnonequity(RoE)measure.
Theperformancehurdlesforrightsgrantedin2016and2015are:– 60%subjecttoAMP’sTSRperformancerelativetothetopindustrialcompaniesinthe
S&P/ASX100Indexoverathree-yearperformanceperiod;– 40%subjecttoaRoEmeasure.
Vestingperiod Threeyears.
Vestedawards Vestedperformancerightsareautomaticallyconvertedtosharesonbehalfofparticipants.
Unvestedawards Unvestedawardsareforfeitediftheparticipantvoluntarilyceasesemploymentorisdismissedformisconductorpoorperformance.
ValuationofperformancerightsTheallocationvaluesforperformancerightsarebasedonvaluationspreparedbyanindependentexternalconsultant.Thevaluationsarebasedonthe10-dayvolumeweightedaveragesharepriceoverthe10-daytradingperiodafterthereleaseofAMPresultsandendingpriortothestartoftheperformanceperiod.AssumptionsregardingthedividendyieldandvolatilityhavebeenestimatedbasedonAMP’sactualhistoricdividendyieldandvolatilityoveranappropriateperiod.
Indeterminingtheshare-basedpaymentsexpense,thenumberofinstrumentsexpectedtovesthasbeenadjustedtoreflectthenumberofemployeesexpectedtoremainwithAMPuntiltheendoftheperformanceperiod.
For
per
sona
l use
onl
y
AMP 2016 annual report 107
5.3 Share-based payments (continued)Thefollowingtableshowsthefactorsconsideredindeterminingtheallocationvalueoftheperformancerightsgrantedduringtheperiod:
Grantdate SharepriceContractual
life(years)Dividend
yield Volatility1Risk-free
rate1
TSRperformance
hurdlediscount
RoEperformance
hurdlediscount2
TSRperformance
rightsfairvalue
RoEperformance
rightsfairvalue
02/06/2016 $5.54 3.0 4.7% 24% 1.6% 57% 0% $2.37 $4.8115/04/2016 $5.79 2.1 4.7% 23% 2.0% 69% 0% $1.80 $5.2415/04/2016 $5.79 1.1 4.7% 25% 2.0% 36% 0% $3.68 $5.4918/09/2015 $5.79 2.7 4.6% 23% 1.9% 58% 0% $2.43 $5.1104/06/2015 $6.20 3.0 4.7% 23% 2.1% 55% 0% $2.82 $5.3913/04/2015 $6.69 2.1 4.8% 23% 1.8% 34% 0% $4.44 $6.0505/06/2014 $5.28 3.0 4.8% 25% 2.9% 45% 0% $2.89 $4.5706/06/2013 $4.97 3.0 5.6% 23% 2.5% 60% 0% $2.00 $4.21
1 AppliestoperformancerightssubjecttoarelativeTSRperformancehurdleonly.ThesefactorsdonotapplytoperformancerightssubjecttoaRoEperformancehurdle.
2 InaccordancewiththeaccountingstandardAASB2Share-based Payment,allowancecannotbemadefortheimpactofanon-market-basedperformancehurdleindeterminingfairvalue.
Thefollowingtableshowsthemovementinperformancerightsoutstandingduringtheperiod:
GrantdateExerciseperiod1
Exerciseprice
Balanceat1Jan2016
Exercisedduringtheyear
Grantedduringtheyear
Lapsedduringtheyear
Balanceat31Dec2016
06/06/2013 n/a nil 4,646,382 1,034,932 – 3,611,450 –05/06/2014 n/a nil 3,902,891 – – 10,291 3,892,60013/04/2015 n/a nil 8,004 – – – 8,00404/06/2015 n/a nil 3,449,078 – – 7,269 3,441,80918/09/2015 n/a nil 61,038 – – – 61,03815/04/2016 n/a nil – – 44,263 – 44,26315/04/2016 n/a nil – – 21,788 – 21,78802/06/2016 n/a nil – – 3,749,418 17,251 3,732,167
Total 12,067,393 1,034,932 3,815,469 3,646,261 11,201,669
1 Performancerightshavenoexerciseperiod;theyareexercisedinthefirsttradingwindowfollowingtheapprovalofthevestingbytheboard.
Fromtheendofthefinancialyearanduptothedateofthisreport,12,820performancerightshavebeenissued,noperformancerightshavebeenexercised,andnoperformancerightshavelapsed.Oftheperformancerightsoutstandingattheendoftheperiod,nonehavevestedorbecomeexercisable.
For
per
sona
l use
onl
y
AMP 2016 annual report108
Notes to the financial statements for the year ended 31 December 2016
5.3 Share-based payments (continued)(b) SharerightsTheLTIparticipantsbelowtheCEOandhisdirectreportsmaybeawardedsharerightsaspartoftheiroverallLTIaward.
Nominatedexecutives,andselectedotherseniorleaderswhohavetheabilitytoimpactAMP’sfinancialsoundness,participateintheshort-termincentive(STI)deferralplan;thisplanrequiresthat40%oftheparticipants’STIbeawardedassharerights.AdditionallyeachyearhighpotentialemployeesataseniorleaderlevelareeligiblefornominationtoparticipateintheSTImatchplan,whichprovidesanawardofsharerightstothevalueof50%oftheindividual’sSTI.
Plan LTIawardplan STIdeferralplan STImatchplan
Overview SharerightsgivetheparticipanttherighttoacquireonefullypaidordinaryshareinAMPLimitedafteraspecifiedserviceperiod.Theyaregrantedatnocosttotheparticipantandcarrynodividendorvotingrightsuntiltheyvest.
Vestingconditions/period
Continuedserviceforthreeyears,butmayvarywherethesharerightsareawardedtoretainanemployeeforacriticalperiod.
Continuedservicefortwoyearsandsubjecttoongoingemployment,compliancewithAMPpoliciesandtheboard’sdiscretion.
Continuedservicefortwoyearsandsubjecttoongoingemployment,compliancewithAMPpoliciesandtheboard’sdiscretion.
Vestedawards Vestedsharerightsareautomaticallyconvertedtosharesonbehalfofparticipants.
Unvestedawards Unvestedawardsareforfeitediftheparticipantvoluntarilyceasesemploymentorisdismissedformisconductorpoorperformance.
PlanvaluationThefairvalueofsharerightshasbeencalculatedasatthegrantdate,byexternalconsultantsusinga‘discountedcashflow’methodology.Fairvaluehasbeendiscountedforthepresentvalueofdividendsexpectedtobepaidduringthevestingperiodtowhichtheparticipantisnotentitled.Forthepurposesofthevaluationitisassumedsharerightsareexercisedassoontheyhavevested.AssumptionsregardingthedividendyieldhavebeenestimatedbasedonAMP’sactualhistoricdividendyieldoveranappropriateperiod.
Indeterminingtheshare-basedpaymentsexpense,thenumberofinstrumentsexpectedtovesthasbeenadjustedtoreflectthenumberofemployeesexpectedtoremainwithAMPuntiltheendoftheperformanceperiod.
Thefollowingtableshowsthefactorswhichwereconsideredindeterminingtheindependentfairvalueofthesharerightsgrantedduring2016andthecomparativeperiod(2015):
Grantdate SharepriceContractual
life(years)Dividend
yieldDividenddiscount Fairvalue
02/06/2016 $5.54 3.0 4.7% 13% $4.8128/04/2016 $5.84 1.8 4.7% 8% $5.3615/04/2016 $5.79 0.9 4.7% 4% $5.5629/02/2016 $5.32 1.1 4.7% 5% $5.0622/02/2016 $5.54 1.5 4.6% 7% $5.1722/02/2016 $5.54 0.5 4.6% 2% $5.4122/02/2016 $5.54 2.6 4.6% 11% $4.9122/02/2016 $5.54 1.6 4.6% 7% $5.1522/02/2016 $5.54 0.6 4.6% 3% $5.3918/09/2015 $5.79 2.7 4.6% 12% $5.1118/09/2015 $5.79 1.8 4.6% 7% $5.4118/09/2015 $5.79 2.0 4.6% 6% $5.4204/06/2015 $6.20 3.0 4.7% 13% $5.3929/05/2015 $6.66 0.8 4.8% 4% $6.4129/05/2015 $6.66 1.8 4.8% 8% $6.1130/04/2015 $6.44 1.8 4.8% 8% $5.9013/04/2015 $6.69 2.1 4.8% 10% $6.0505/06/2014 $5.28 3.0 4.8% 13% $4.5729/04/2014 $5.07 1.8 4.8% 8% $4.6414/03/2014 $4.92 1.0 4.8% 4% $4.7014/03/2014 $4.92 2.0 4.8% 9% $4.48
For
per
sona
l use
onl
y
AMP 2016 annual report 109
5.3 Share-based payments (continued)Thefollowingtableshowsthemovementinsharerightsoutstandingduringtheperiod:
Grantdate Exerciseperiod1 ExercisepriceBalanceat1Jan2016
Exercisedduringtheyear
Grantedduringtheyear
Lapsedduringtheyear
Balanceat31Dec2016
06/06/2013 n/a nil 1,430,780 1,374,504 – 56,276 –09/09/2013 n/a nil 35,726 35,726 – – –14/03/2014 n/a nil 37,500 37,500 – – –29/04/2014 n/a nil 654,982 644,077 – 10,905 –29/04/2014 n/a nil 2,492,491 2,492,491 – – –05/06/2014 n/a nil 1,441,351 – – 62,831 1,378,52013/04/2015 n/a nil 5,468 – – – 5,46830/04/2015 n/a nil 852,176 – – – 852,17630/04/2015 n/a nil 1,357,234 – – – 1,357,23430/04/2015 n/a nil 714,837 – – 67,518 647,31930/04/2015 n/a nil 166,944 – – – 166,94429/05/2015 n/a nil 11,848 11,848 – – –29/05/2015 n/a nil 12,437 – – – 12,43704/06/2015 n/a nil 1,587,055 – – 54,180 1,532,87518/09/2015 n/a nil 61,037 – – – 61,03718/09/2015 n/a nil 24,469 8,156 – – 16,31318/09/2015 n/a nil 83,333 41,666 – – 41,66722/02/2016 n/a nil – 16,100 16,100 – –22/02/2016 n/a nil – – 10,733 – 10,73322/02/2016 n/a nil – – 10,733 – 10,73322/02/2016 n/a nil – 27,522 27,522 – –22/02/2016 n/a nil – – 27,522 – 27,52229/02/2016 n/a nil – – 52,739 – 52,73915/04/2016 n/a nil – – 8,932 – 8,93228/04/2016 n/a nil – – 3,625,934 45,341 3,580,59302/06/2016 n/a nil – – 1,792,604 26,655 1,765,949
Total 10,969,668 4,689,590 5,572,819 323,706 11,529,191
1 Thesharerightsgrantedhavenoexerciseperiod;theyareexercisedinthefirsttradingwindowfollowingtheapprovalofthevestingbytheboard.
Fromtheendofthefinancialyearanduptothedateofthisreport,30,457sharerightshavebeenissued,nosharerightshavebeenexercised,andnosharerightshavelapsedduetoresignation.Ofthesharerightsoutstandingattheendoftheperiod,nonehavevestedorbecomeexercisable.
(c) RestrictedsharesNorestrictedsharesweregrantedduring2016or2015.
(d) EmployeeshareacquisitionplanTheemployeeshareacquisitionplanwassuspendedmid-waythrough2009inAustraliabutcontinuestooperateinNewZealand.
Accountingpolicy–recognitionandmeasurementEquity-settledshare-basedpaymentsThecostofequity-settledshare-basedpaymentsismeasuredusingtheirfairvalueatthedateatwhichtheyaregranted.Thefairvaluecalculationtakesintoconsiderationanumberoffactors,includingthelikelihoodofachievingmarket-basedvestingconditionssuchastotalshareholderreturn(marketconditions).
Thecostofequity-settledshare-basedpaymentsisrecognised,togetherwithacorrespondingincreaseintheshare-basedpaymentreserveinequity,overthevestingperiodoftheinstrument.Ateachreportingdate,theAMPgroupreviewsitsestimatesofthenumberofinstrumentsthatareexpectedtovestandanychangestothecostarerecognisedintheIncomestatementandtheshare-basedpaymentreserve,overtheremainingvestingperiod.
Wherethetermsofanequity-settledshare-basedpaymentaremodifiedandtheexpenseincreasesasaresultofthemodification,theincreaseisrecognisedovertheremainingvestingperiod.Whenamodificationreducestheexpense,thereisnoadjustmentandthepre-modificationcostcontinuestoberecognised.
Whereanequity-settledawarddoesnotultimatelyvest,expensesarenotreversed,exceptforawardswherevestingisconditionaluponanon-marketcondition,inwhichcaseallexpensesarereversedintheperiodinwhichtheinstrumentlapses.
For
per
sona
l use
onl
y
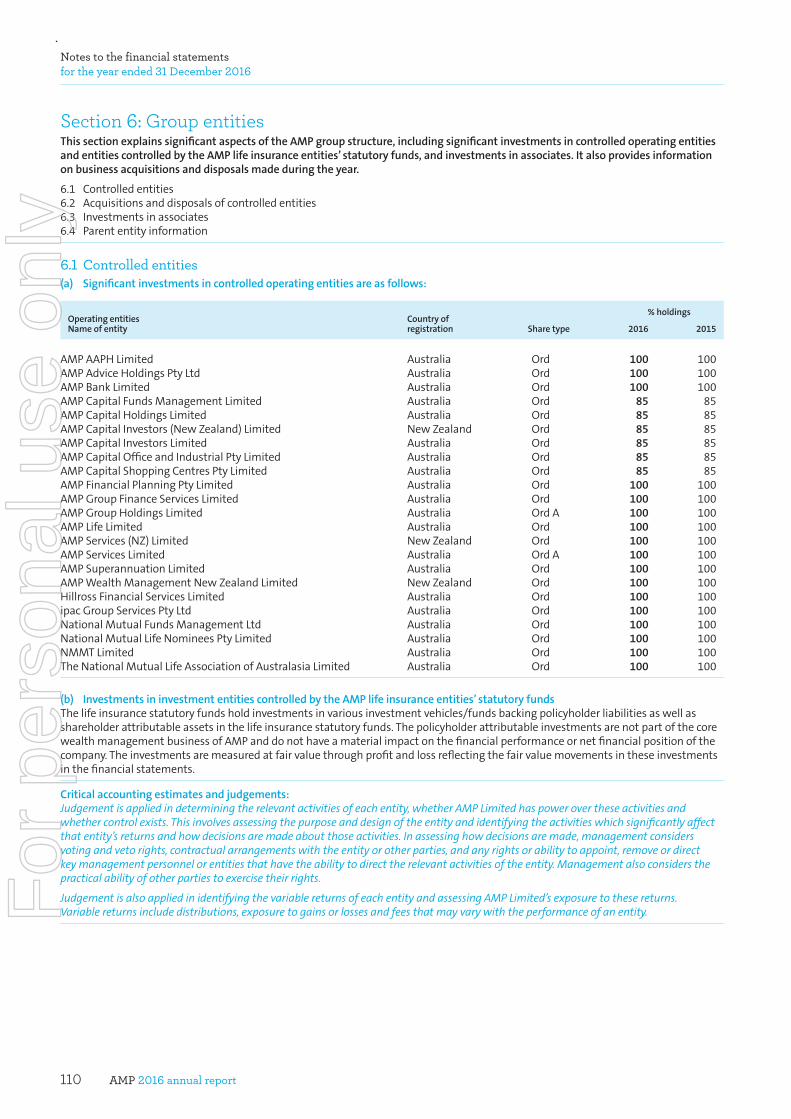
AMP 2016 annual report110
Notes to the financial statements for the year ended 31 December 2016
Section 6: Group entitiesThissectionexplainssignificantaspectsoftheAMPgroupstructure,includingsignificantinvestmentsincontrolledoperatingentitiesandentitiescontrolledbytheAMPlifeinsuranceentities’statutoryfunds,andinvestmentsinassociates.Italsoprovidesinformationonbusinessacquisitionsanddisposalsmadeduringtheyear.
6.1 Controlledentities6.2 Acquisitionsanddisposalsofcontrolledentities6.3 Investmentsinassociates6.4 Parententityinformation
6.1 Controlled entities(a) Significantinvestmentsincontrolledoperatingentitiesareasfollows:
%holdingsOperatingentitiesNameofentity
Countryofregistration Sharetype 2016 2015
AMPAAPHLimited Australia Ord 100 100AMPAdviceHoldingsPtyLtd Australia Ord 100 100AMPBankLimited Australia Ord 100 100AMPCapitalFundsManagementLimited Australia Ord 85 85AMPCapitalHoldingsLimited Australia Ord 85 85AMPCapitalInvestors(NewZealand)Limited NewZealand Ord 85 85AMPCapitalInvestorsLimited Australia Ord 85 85AMPCapitalOfficeandIndustrialPtyLimited Australia Ord 85 85AMPCapitalShoppingCentresPtyLimited Australia Ord 85 85AMPFinancialPlanningPtyLimited Australia Ord 100 100AMPGroupFinanceServicesLimited Australia Ord 100 100AMPGroupHoldingsLimited Australia OrdA 100 100AMPLifeLimited Australia Ord 100 100AMPServices(NZ)Limited NewZealand Ord 100 100AMPServicesLimited Australia OrdA 100 100AMPSuperannuationLimited Australia Ord 100 100AMPWealthManagementNewZealandLimited NewZealand Ord 100 100HillrossFinancialServicesLimited Australia Ord 100 100ipacGroupServicesPtyLtd Australia Ord 100 100NationalMutualFundsManagementLtd Australia Ord 100 100NationalMutualLifeNomineesPtyLimited Australia Ord 100 100NMMTLimited Australia Ord 100 100TheNationalMutualLifeAssociationofAustralasiaLimited Australia Ord 100 100
(b) InvestmentsininvestmententitiescontrolledbytheAMPlifeinsuranceentities’statutoryfundsThelifeinsurancestatutoryfundsholdinvestmentsinvariousinvestmentvehicles/fundsbackingpolicyholderliabilitiesaswellasshareholderattributableassetsinthelifeinsurancestatutoryfunds.ThepolicyholderattributableinvestmentsarenotpartofthecorewealthmanagementbusinessofAMPanddonothaveamaterialimpactonthefinancialperformanceornetfinancialpositionofthecompany.Theinvestmentsaremeasuredatfairvaluethroughprofitandlossreflectingthefairvaluemovementsintheseinvestmentsinthefinancialstatements.
Criticalaccountingestimatesandjudgements:Judgement is applied in determining the relevant activities of each entity, whether AMP Limited has power over these activities and whether control exists. This involves assessing the purpose and design of the entity and identifying the activities which significantly affect that entity’s returns and how decisions are made about those activities. In assessing how decisions are made, management considers voting and veto rights, contractual arrangements with the entity or other parties, and any rights or ability to appoint, remove or direct key management personnel or entities that have the ability to direct the relevant activities of the entity. Management also considers the practical ability of other parties to exercise their rights.
Judgement is also applied in identifying the variable returns of each entity and assessing AMP Limited’s exposure to these returns. Variable returns include distributions, exposure to gains or losses and fees that may vary with the performance of an entity. F
or p
erso
nal u
se o
nly
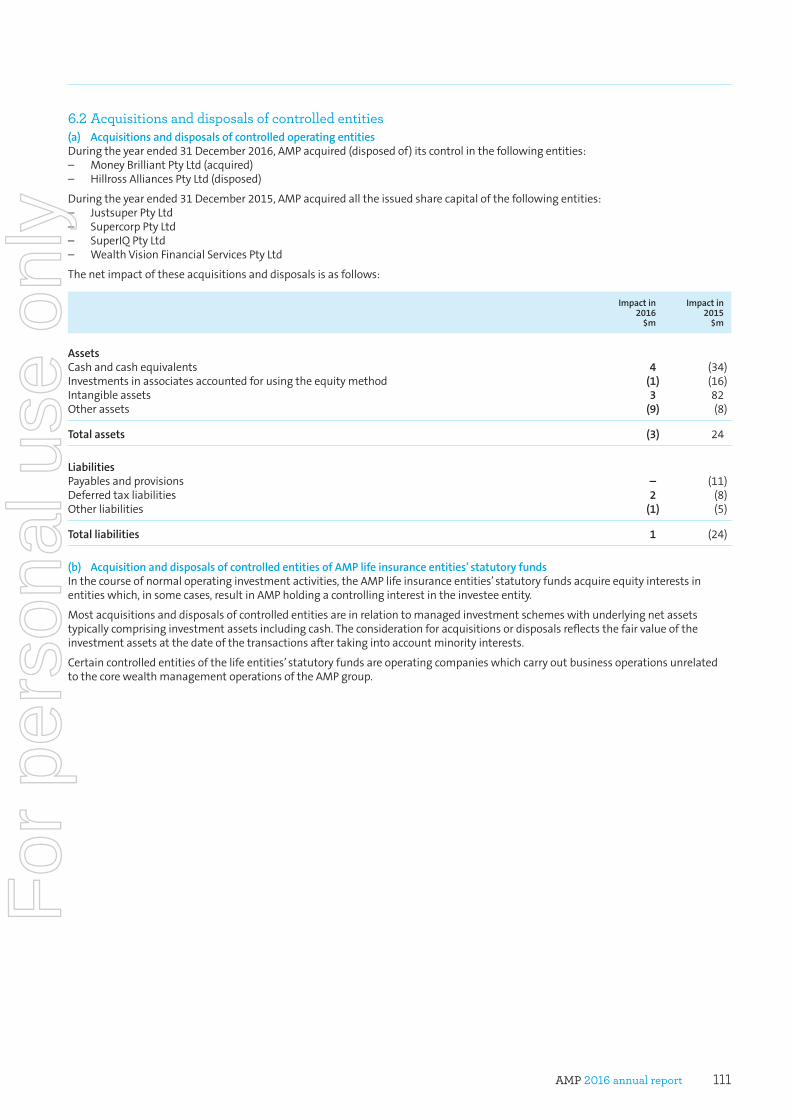
AMP 2016 annual report 111
6.2 Acquisitions and disposals of controlled entities(a) AcquisitionsanddisposalsofcontrolledoperatingentitiesDuringtheyearended31December2016,AMPacquired(disposedof)itscontrolinthefollowingentities:– MoneyBrilliantPtyLtd(acquired)– HillrossAlliancesPtyLtd(disposed)
Duringtheyearended31December2015,AMPacquiredalltheissuedsharecapitalofthefollowingentities:– JustsuperPtyLtd– SupercorpPtyLtd– SuperIQPtyLtd– WealthVisionFinancialServicesPtyLtd
Thenetimpactoftheseacquisitionsanddisposalsisasfollows:
Impactin2016
$m
Impactin2015
$m
Assets Cashandcashequivalents 4 (34)Investmentsinassociatesaccountedforusingtheequitymethod (1) (16)Intangibleassets 3 82Otherassets (9) (8)
Totalassets (3) 24
Liabilities Payablesandprovisions – (11)Deferredtaxliabilities 2 (8)Otherliabilities (1) (5)
Totalliabilities 1 (24)
(b) AcquisitionanddisposalsofcontrolledentitiesofAMPlifeinsuranceentities’statutoryfundsInthecourseofnormaloperatinginvestmentactivities,theAMPlifeinsuranceentities’statutoryfundsacquireequityinterestsinentitieswhich,insomecases,resultinAMPholdingacontrollinginterestintheinvesteeentity.
Mostacquisitionsanddisposalsofcontrolledentitiesareinrelationtomanagedinvestmentschemeswithunderlyingnetassetstypicallycomprisinginvestmentassetsincludingcash.Theconsiderationforacquisitionsordisposalsreflectsthefairvalueoftheinvestmentassetsatthedateofthetransactionsaftertakingintoaccountminorityinterests.
Certaincontrolledentitiesofthelifeentities’statutoryfundsareoperatingcompanieswhichcarryoutbusinessoperationsunrelatedtothecorewealthmanagementoperationsoftheAMPgroup.
For
per
sona
l use
onl
y
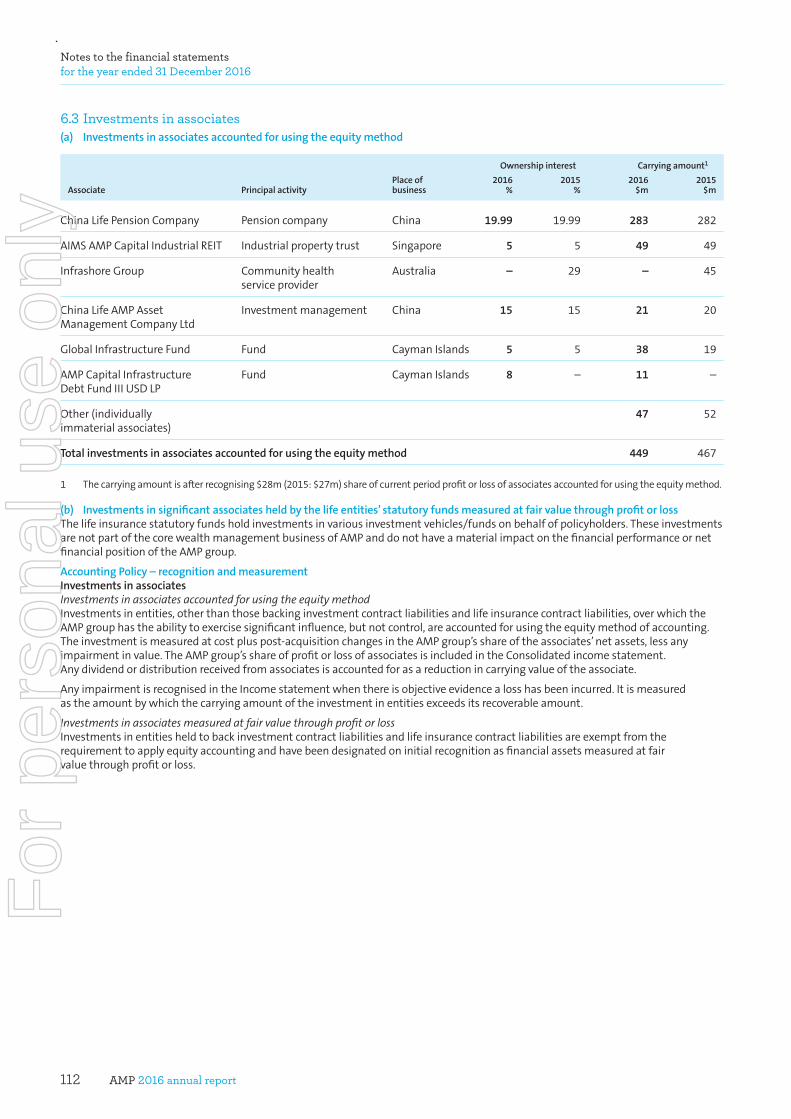
AMP 2016 annual report112
Notes to the financial statements for the year ended 31 December 2016
6.3 Investments in associates (a) Investmentsinassociatesaccountedforusingtheequitymethod
Ownershipinterest Carryingamount1
Associate PrincipalactivityPlaceofbusiness
2016%
2015%
2016$m
2015$m
ChinaLifePensionCompany Pensioncompany China 19.99 19.99 283 282
AIMSAMPCapitalIndustrialREIT Industrialpropertytrust Singapore 5 5 49 49
InfrashoreGroup Communityhealth Australia – 29 – 45 serviceprovider
ChinaLifeAMPAsset Investmentmanagement China 15 15 21 20ManagementCompanyLtd
GlobalInfrastructureFund Fund CaymanIslands 5 5 38 19
AMPCapitalInfrastructure Fund CaymanIslands 8 – 11 –DebtFundIIIUSDLP
Other(individually 47 52immaterialassociates)
Totalinvestmentsinassociatesaccountedforusingtheequitymethod 449 467
1 Thecarryingamountisafterrecognising$28m(2015:$27m)shareofcurrentperiodprofitorlossofassociatesaccountedforusingtheequitymethod.
(b) Investmentsinsignificantassociatesheldbythelifeentities’statutoryfundsmeasuredatfairvaluethroughprofitorlossThelifeinsurancestatutoryfundsholdinvestmentsinvariousinvestmentvehicles/fundsonbehalfofpolicyholders.TheseinvestmentsarenotpartofthecorewealthmanagementbusinessofAMPanddonothaveamaterialimpactonthefinancialperformanceornetfinancialpositionoftheAMPgroup.
AccountingPolicy–recognitionandmeasurementInvestmentsinassociatesInvestments in associates accounted for using the equity methodInvestmentsinentities,otherthanthosebackinginvestmentcontractliabilitiesandlifeinsurancecontractliabilities,overwhichtheAMPgrouphastheabilitytoexercisesignificantinfluence,butnotcontrol,areaccountedforusingtheequitymethodofaccounting.Theinvestmentismeasuredatcostpluspost-acquisitionchangesintheAMPgroup’sshareoftheassociates’netassets,lessanyimpairmentinvalue.TheAMPgroup’sshareofprofitorlossofassociatesisincludedintheConsolidatedincomestatement.Anydividendordistributionreceivedfromassociatesisaccountedforasareductionincarryingvalueoftheassociate.
AnyimpairmentisrecognisedintheIncomestatementwhenthereisobjectiveevidencealosshasbeenincurred.Itismeasuredastheamountbywhichthecarryingamountoftheinvestmentinentitiesexceedsitsrecoverableamount.
Investments in associates measured at fair value through profit or lossInvestmentsinentitiesheldtobackinvestmentcontractliabilitiesandlifeinsurancecontractliabilitiesareexemptfromtherequirementtoapplyequityaccountingandhavebeendesignatedoninitialrecognitionasfinancialassetsmeasuredatfairvaluethroughprofitorloss.
For
per
sona
l use
onl
y
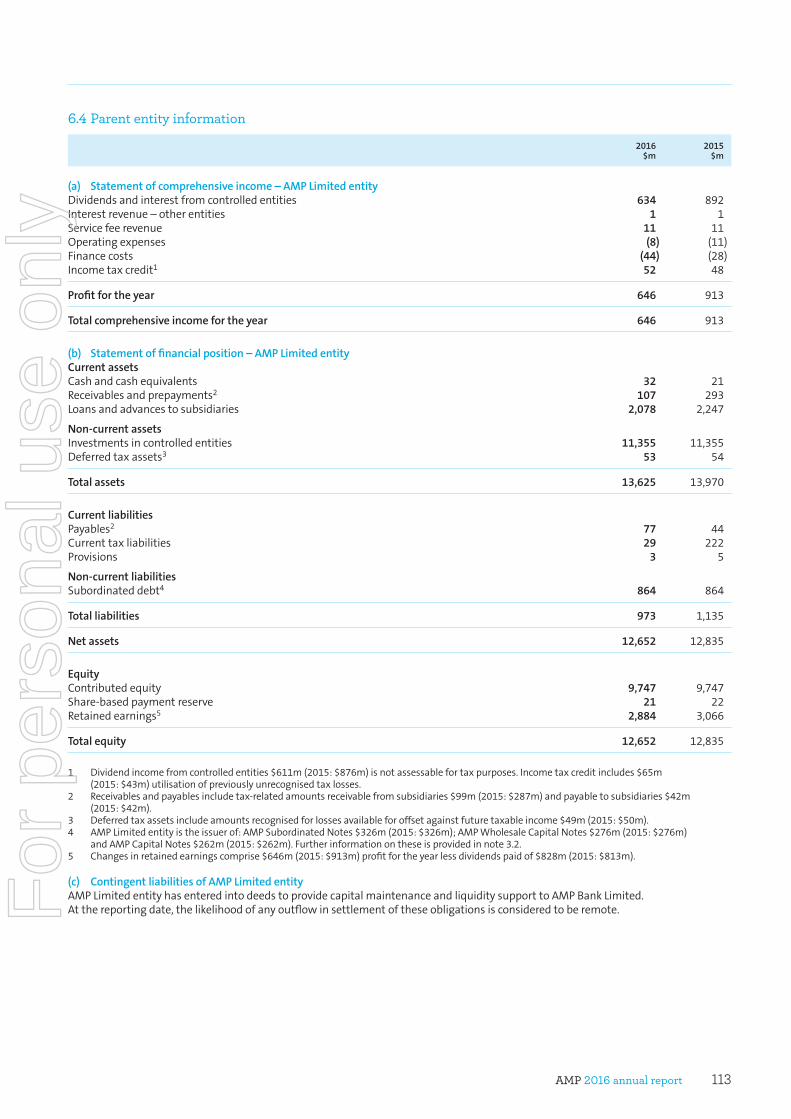
AMP 2016 annual report 113
6.4 Parent entity information
2016 $m
2015 $m
(a) Statement of comprehensive income – AMP Limited entity Dividendsandinterestfromcontrolledentities 634 892Interestrevenue–otherentities 1 1Servicefeerevenue 11 11Operatingexpenses (8) (11)Financecosts (44) (28)Incometaxcredit1 52 48
Profit for the year 646 913
Total comprehensive income for the year 646 913
(b) Statement of financial position – AMP Limited entity Current assets Cashandcashequivalents 32 21Receivablesandprepayments2 107 293Loansandadvancestosubsidiaries 2,078 2,247
Non-current assets Investmentsincontrolledentities 11,355 11,355Deferredtaxassets3 53 54
Total assets 13,625 13,970
Current liabilities Payables2 77 44Currenttaxliabilities 29 222Provisions 3 5
Non-current liabilities Subordinateddebt4 864 864
Total liabilities 973 1,135
Net assets 12,652 12,835
Equity Contributedequity 9,747 9,747Share-basedpaymentreserve 21 22Retainedearnings5 2,884 3,066
Total equity 12,652 12,835
1 Dividendincomefromcontrolledentities$611m(2015:$876m)isnotassessablefortaxpurposes.Incometaxcreditincludes$65m(2015:$43m)utilisationofpreviouslyunrecognisedtaxlosses.
2 Receivablesandpayablesincludetax-relatedamountsreceivablefromsubsidiaries$99m(2015:$287m)andpayabletosubsidiaries$42m(2015:$42m).
3 Deferredtaxassetsincludeamountsrecognisedforlossesavailableforoffsetagainstfuturetaxableincome$49m(2015:$50m).4 AMPLimitedentityistheissuerof:AMPSubordinatedNotes$326m(2015:$326m);AMPWholesaleCapitalNotes$276m(2015:$276m)
andAMPCapitalNotes$262m(2015:$262m).Furtherinformationontheseisprovidedinnote3.2.5 Changesinretainedearningscomprise$646m(2015:$913m)profitfortheyearlessdividendspaidof$828m(2015:$813m).
(c) Contingent liabilities of AMP Limited entity AMPLimitedentityhasenteredintodeedstoprovidecapitalmaintenanceandliquiditysupporttoAMPBankLimited.Atthereportingdate,thelikelihoodofanyoutflowinsettlementoftheseobligationsisconsideredtoberemote.F
or p
erso
nal u
se o
nly
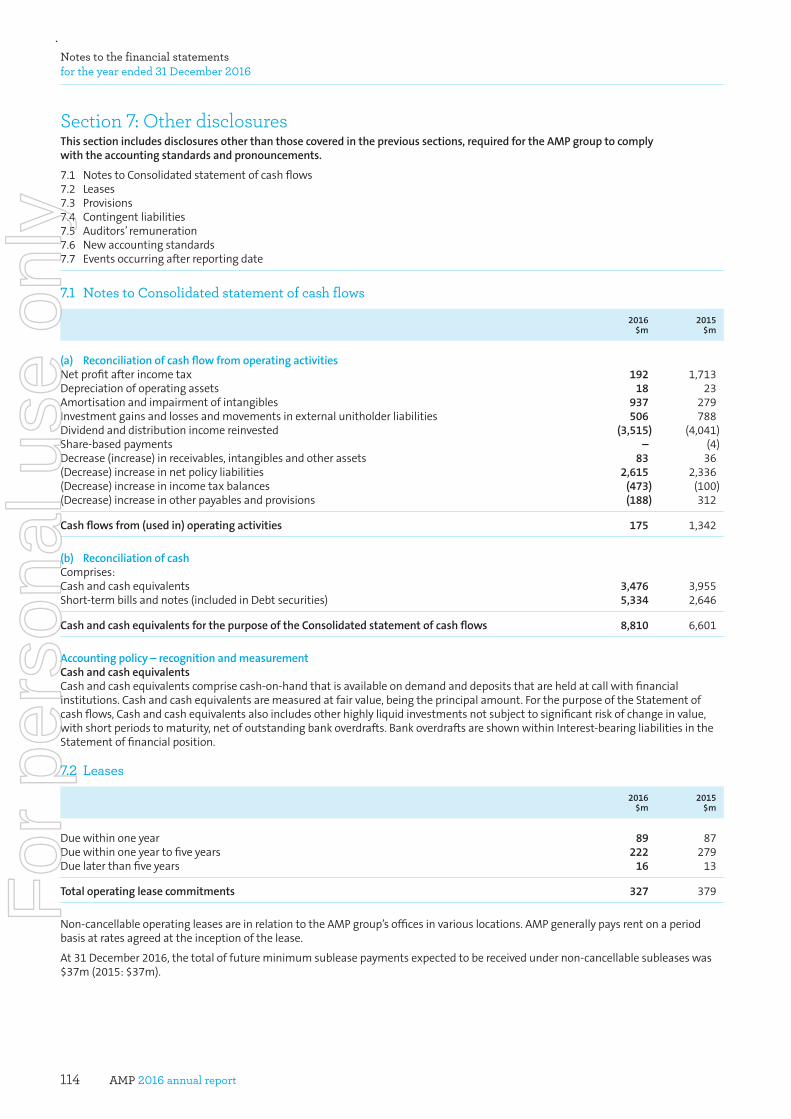
AMP 2016 annual report114
Notes to the financial statements for the year ended 31 December 2016
Section 7: Other disclosuresThissectionincludesdisclosuresotherthanthosecoveredintheprevioussections,requiredfortheAMPgrouptocomplywiththeaccountingstandardsandpronouncements.
7.1 NotestoConsolidatedstatementofcashflows7.2 Leases7.3 Provisions7.4 Contingentliabilities7.5 Auditors’remuneration7.6 Newaccountingstandards7.7 Eventsoccurringafterreportingdate
7.1 Notes to Consolidated statement of cash flows
2016$m
2015$m
(a) ReconciliationofcashflowfromoperatingactivitiesNetprofitafterincometax 192 1,713Depreciationofoperatingassets 18 23Amortisationandimpairmentofintangibles 937 279Investmentgainsandlossesandmovementsinexternalunitholderliabilities 506 788Dividendanddistributionincomereinvested (3,515) (4,041)Share-basedpayments – (4)Decrease(increase)inreceivables,intangiblesandotherassets 83 36(Decrease)increaseinnetpolicyliabilities 2,615 2,336(Decrease)increaseinincometaxbalances (473) (100)(Decrease)increaseinotherpayablesandprovisions (188) 312
Cashflowsfrom(usedin)operatingactivities 175 1,342
(b) ReconciliationofcashComprises: Cashandcashequivalents 3,476 3,955Short-termbillsandnotes(includedinDebtsecurities) 5,334 2,646
CashandcashequivalentsforthepurposeoftheConsolidatedstatementofcashflows 8,810 6,601
Accountingpolicy–recognitionandmeasurementCashandcashequivalentsCashandcashequivalentscomprisecash-on-handthatisavailableondemandanddepositsthatareheldatcallwithfinancialinstitutions.Cashandcashequivalentsaremeasuredatfairvalue,beingtheprincipalamount.ForthepurposeoftheStatementofcashflows,Cashandcashequivalentsalsoincludesotherhighlyliquidinvestmentsnotsubjecttosignificantriskofchangeinvalue,withshortperiodstomaturity,netofoutstandingbankoverdrafts.BankoverdraftsareshownwithinInterest-bearingliabilitiesintheStatementoffinancialposition.
7.2 Leases
2016$m
2015$m
Duewithinoneyear 89 87Duewithinoneyeartofiveyears 222 279Duelaterthanfiveyears 16 13
Totaloperatingleasecommitments 327 379
Non-cancellableoperatingleasesareinrelationtotheAMPgroup’sofficesinvariouslocations.AMPgenerallypaysrentonaperiodbasisatratesagreedattheinceptionofthelease.
At31December2016,thetotaloffutureminimumsubleasepaymentsexpectedtobereceivedundernon-cancellablesubleaseswas$37m(2015:$37m).
For
per
sona
l use
onl
y
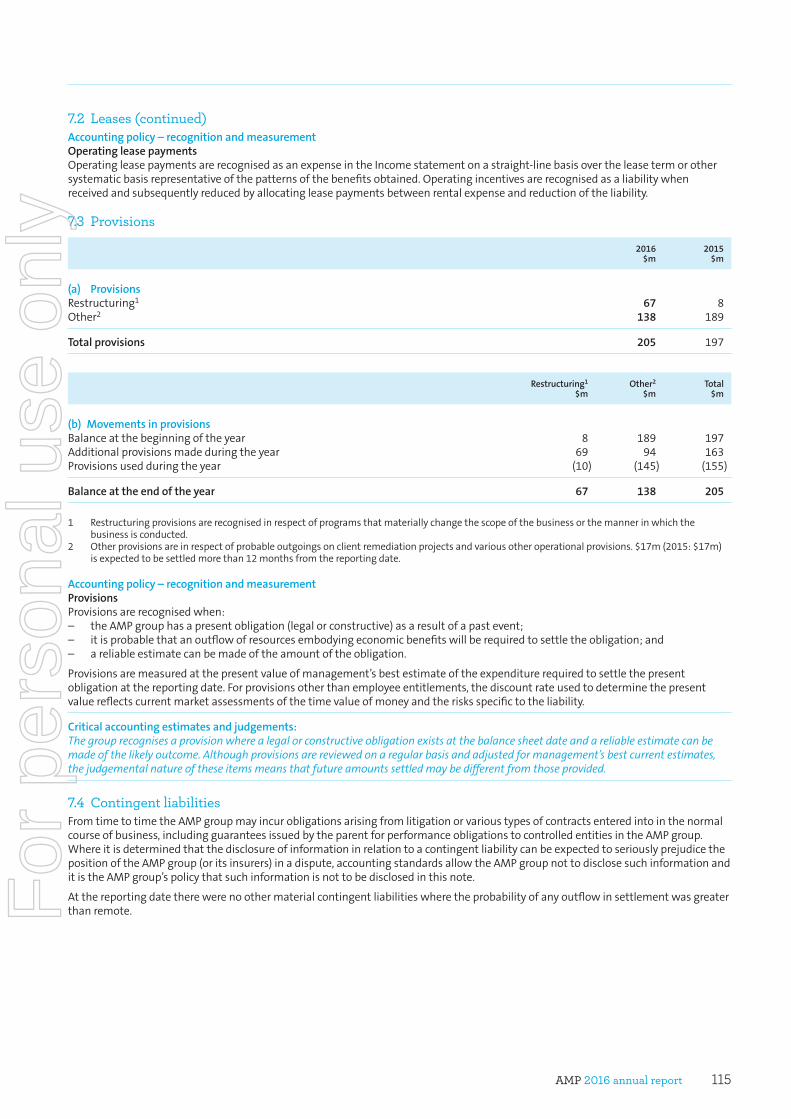
AMP 2016 annual report 115
7.2 Leases (continued)Accountingpolicy–recognitionandmeasurementOperatingleasepaymentsOperatingleasepaymentsarerecognisedasanexpenseintheIncomestatementonastraight-linebasisovertheleasetermorothersystematicbasisrepresentativeofthepatternsofthebenefitsobtained.Operatingincentivesarerecognisedasaliabilitywhenreceivedandsubsequentlyreducedbyallocatingleasepaymentsbetweenrentalexpenseandreductionoftheliability.
7.3 Provisions
2016$m
2015$m
(a) Provisions Restructuring1 67 8Other2 138 189
Totalprovisions 205 197
Restructuring1
$mOther2
$mTotal
$m
(b)Movementsinprovisions Balanceatthebeginningoftheyear 8 189 197Additionalprovisionsmadeduringtheyear 69 94 163Provisionsusedduringtheyear (10) (145) (155)
Balanceattheendoftheyear 67 138 205
1 Restructuringprovisionsarerecognisedinrespectofprogramsthatmateriallychangethescopeofthebusinessorthemannerinwhichthebusinessisconducted.
2 Otherprovisionsareinrespectofprobableoutgoingsonclientremediationprojectsandvariousotheroperationalprovisions.$17m(2015:$17m)isexpectedtobesettledmorethan12monthsfromthereportingdate.
Accountingpolicy–recognitionandmeasurementProvisionsProvisionsarerecognisedwhen:– theAMPgrouphasapresentobligation(legalorconstructive)asaresultofapastevent;– itisprobablethatanoutflowofresourcesembodyingeconomicbenefitswillberequiredtosettletheobligation;and– areliableestimatecanbemadeoftheamountoftheobligation.
Provisionsaremeasuredatthepresentvalueofmanagement’sbestestimateoftheexpenditurerequiredtosettlethepresentobligationatthereportingdate.Forprovisionsotherthanemployeeentitlements,thediscountrateusedtodeterminethepresentvaluereflectscurrentmarketassessmentsofthetimevalueofmoneyandtherisksspecifictotheliability.
Criticalaccountingestimatesandjudgements:The group recognises a provision where a legal or constructive obligation exists at the balance sheet date and a reliable estimate can be made of the likely outcome. Although provisions are reviewed on a regular basis and adjusted for management’s best current estimates, the judgemental nature of these items means that future amounts settled may be different from those provided.
7.4 Contingent liabilitiesFromtimetotimetheAMPgroupmayincurobligationsarisingfromlitigationorvarioustypesofcontractsenteredintointhenormalcourseofbusiness,includingguaranteesissuedbytheparentforperformanceobligationstocontrolledentitiesintheAMPgroup.WhereitisdeterminedthatthedisclosureofinformationinrelationtoacontingentliabilitycanbeexpectedtoseriouslyprejudicethepositionoftheAMPgroup(oritsinsurers)inadispute,accountingstandardsallowtheAMPgroupnottodisclosesuchinformationanditistheAMPgroup’spolicythatsuchinformationisnottobedisclosedinthisnote.
Atthereportingdatetherewerenoothermaterialcontingentliabilitieswheretheprobabilityofanyoutflowinsettlementwasgreaterthanremote.F
or p
erso
nal u
se o
nly
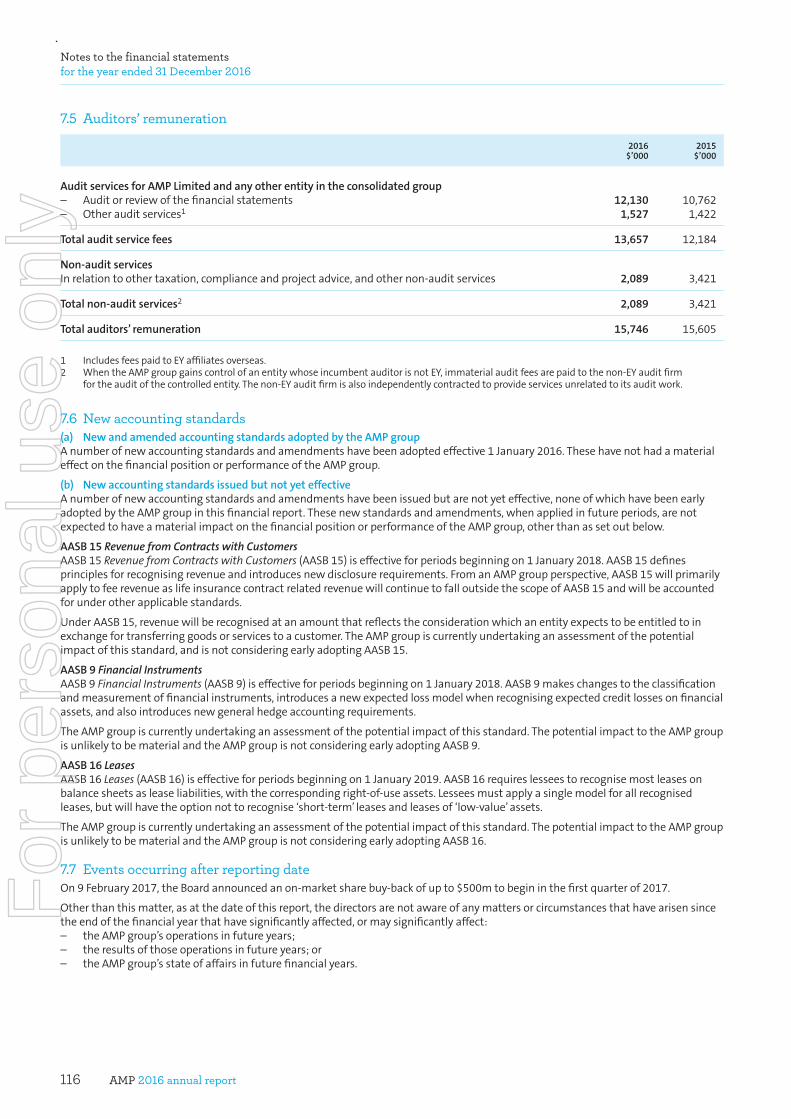
AMP 2016 annual report116
Notes to the financial statements for the year ended 31 December 2016
7.5 Auditors’ remuneration
2016$’000
2015$’000
AuditservicesforAMPLimitedandanyotherentityintheconsolidatedgroup – Auditorreviewofthefinancialstatements 12,130 10,762– Otherauditservices1 1,527 1,422
Totalauditservicefees 13,657 12,184
Non-auditservices Inrelationtoothertaxation,complianceandprojectadvice,andothernon-auditservices 2,089 3,421
Totalnon-auditservices2 2,089 3,421
Totalauditors’remuneration 15,746 15,605
1 IncludesfeespaidtoEYaffiliatesoverseas. 2 WhentheAMPgroupgainscontrolofanentitywhoseincumbentauditorisnotEY,immaterialauditfeesarepaidtothenon-EYauditfirm
fortheauditofthecontrolledentity.Thenon-EYauditfirmisalsoindependentlycontractedtoprovideservicesunrelatedtoitsauditwork.
7.6 New accounting standards(a) NewandamendedaccountingstandardsadoptedbytheAMPgroupAnumberofnewaccountingstandardsandamendmentshavebeenadoptedeffective1January2016.ThesehavenothadamaterialeffectonthefinancialpositionorperformanceoftheAMPgroup.
(b) NewaccountingstandardsissuedbutnotyeteffectiveAnumberofnewaccountingstandardsandamendmentshavebeenissuedbutarenotyeteffective,noneofwhichhavebeenearlyadoptedbytheAMPgroupinthisfinancialreport.Thesenewstandardsandamendments,whenappliedinfutureperiods,arenotexpectedtohaveamaterialimpactonthefinancialpositionorperformanceoftheAMPgroup,otherthanassetoutbelow.
AASB15Revenue from Contracts with CustomersAASB15Revenue from Contracts with Customers(AASB15)iseffectiveforperiodsbeginningon1January2018.AASB15definesprinciplesforrecognisingrevenueandintroducesnewdisclosurerequirements.FromanAMPgroupperspective,AASB15willprimarilyapplytofeerevenueaslifeinsurancecontractrelatedrevenuewillcontinuetofalloutsidethescopeofAASB15andwillbeaccountedforunderotherapplicablestandards.
UnderAASB15,revenuewillberecognisedatanamountthatreflectstheconsiderationwhichanentityexpectstobeentitledtoinexchangefortransferringgoodsorservicestoacustomer.TheAMPgroupiscurrentlyundertakinganassessmentofthepotentialimpactofthisstandard,andisnotconsideringearlyadoptingAASB15.
AASB9Financial InstrumentsAASB9Financial Instruments(AASB9)iseffectiveforperiodsbeginningon1January2018.AASB9makeschangestotheclassificationandmeasurementoffinancialinstruments,introducesanewexpectedlossmodelwhenrecognisingexpectedcreditlossesonfinancialassets,andalsointroducesnewgeneralhedgeaccountingrequirements.
TheAMPgroupiscurrentlyundertakinganassessmentofthepotentialimpactofthisstandard.ThepotentialimpacttotheAMPgroupisunlikelytobematerialandtheAMPgroupisnotconsideringearlyadoptingAASB9.
AASB16LeasesAASB16Leases(AASB16)iseffectiveforperiodsbeginningon1January2019.AASB16requireslesseestorecognisemostleasesonbalancesheetsasleaseliabilities,withthecorrespondingright-of-useassets.Lesseesmustapplyasinglemodelforallrecognisedleases,butwillhavetheoptionnottorecognise‘short-term’leasesandleasesof‘low-value’assets.
TheAMPgroupiscurrentlyundertakinganassessmentofthepotentialimpactofthisstandard.ThepotentialimpacttotheAMPgroupisunlikelytobematerialandtheAMPgroupisnotconsideringearlyadoptingAASB16.
7.7 Events occurring after reporting dateOn9February2017,theBoardannouncedanon-marketsharebuy-backofupto$500mtobegininthefirstquarterof2017.
Otherthanthismatter,asatthedateofthisreport,thedirectorsarenotawareofanymattersorcircumstancesthathavearisensincetheendofthefinancialyearthathavesignificantlyaffected,ormaysignificantlyaffect:– theAMPgroup’soperationsinfutureyears;– theresultsofthoseoperationsinfutureyears;or– theAMPgroup’sstateofaffairsinfuturefinancialyears.
For
per
sona
l use
onl
y
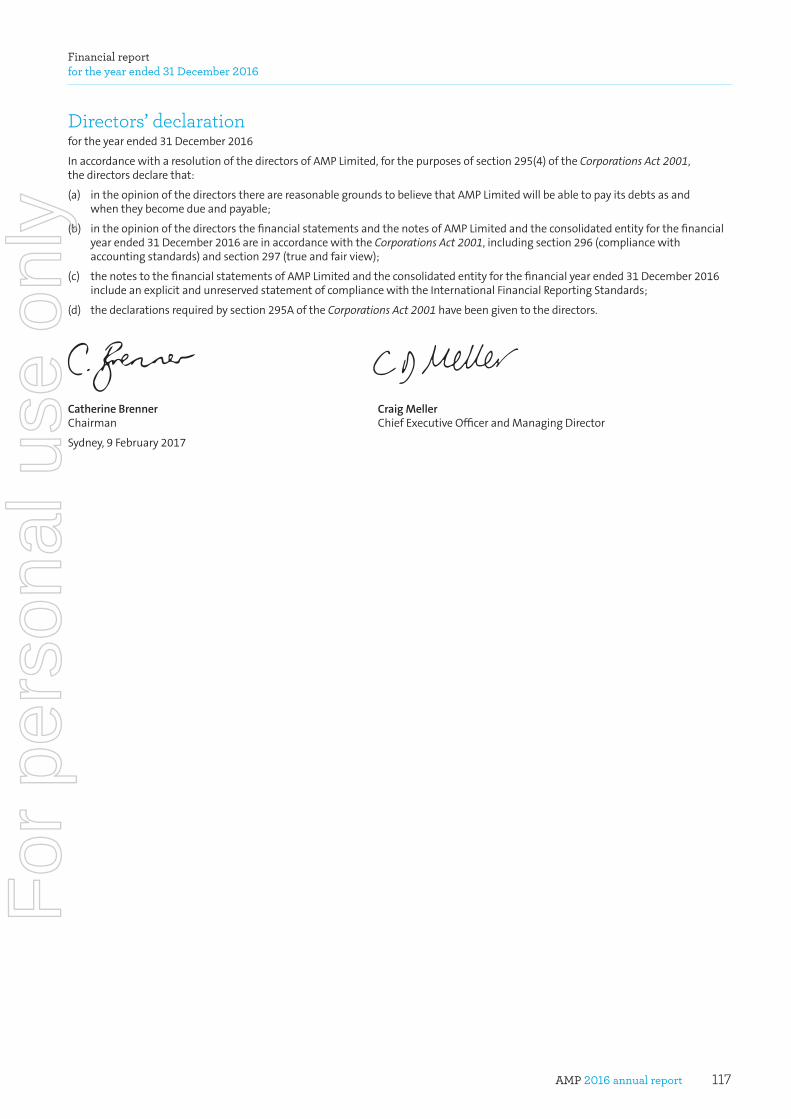
AMP 2016 annual report 117
Directors’ declarationfortheyearended31December2016
InaccordancewitharesolutionofthedirectorsofAMPLimited,forthepurposesofsection295(4)oftheCorporations Act 2001,thedirectorsdeclarethat:
(a) intheopinionofthedirectorstherearereasonablegroundstobelievethatAMPLimitedwillbeabletopayitsdebtsasandwhentheybecomedueandpayable;
(b) intheopinionofthedirectorsthefinancialstatementsandthenotesofAMPLimitedandtheconsolidatedentityforthefinancialyearended31December2016areinaccordancewiththeCorporations Act 2001,includingsection296(compliancewithaccountingstandards)andsection297(trueandfairview);
(c) thenotestothefinancialstatementsofAMPLimitedandtheconsolidatedentityforthefinancialyearended31December2016includeanexplicitandunreservedstatementofcompliancewiththeInternationalFinancialReportingStandards;
(d) thedeclarationsrequiredbysection295AoftheCorporations Act 2001havebeengiventothedirectors.
CatherineBrenner CraigMellerChairman ChiefExecutiveOfficerandManagingDirector
Sydney,9February2017
Financial report for the year ended 31 December 2016
For
per
sona
l use
onl
y
AMP 2016 annual report118
Financial report for the year ended 31 December 2016
Tel: +61 2 9248 5555Fax: +61 2 9248 5959ey.com/au
200 George StreetSydney NSW 2000 AustraliaGPO Box 2646 Sydney NSW 2001
Independent Auditor’s ReportTotheShareholdersofAMPLimited
Report on the Audit of the Financial ReportOpinionWehaveauditedthefinancialreportofAMPLimited(theCompany),includingitssubsidiaries(theGroup),whichcomprisesthestatementsoffinancialpositionasat31December2016,theincomestatements,thestatementsofcomprehensiveincome,thestatementsofchangesinequityandthestatementsofcashflowsfortheyearthenended,notescomprisingasummaryofsignificantaccountingpoliciesandotherexplanatoryinformationandtheDirectors’DeclarationoftheCompanyandGroup.
InouropiniontheaccompanyingfinancialreportofAMPLimitedisinaccordancewiththeCorporations Act 2001,including:(i) givingatrueandfairviewoftheCompanyandGroup’sfinancialpositionasat31December2016andoftheirfinancial
performancefortheyearendedonthatdate;and(ii) complyingwithAustralianAccountingStandardsandtheCorporations Regulations 2001.
BasisforOpinionWeconductedourauditinaccordancewithAustralianAuditingStandards.OurresponsibilitiesunderthosestandardsarefurtherdescribedintheAuditor’s Responsibilities for the Audit of the Consolidated Financial Statementssectionofourreport.WeareindependentoftheGroupinaccordancewiththeCorporations Act 2001andtheethicalrequirementsoftheAccountingProfessionalandEthicalStandardsBoard’sAPES110Code of Ethics for Professional Accountants(theCode)thatarerelevanttoourauditofthefinancialreportinAustralia;andwehavefulfilledourotherethicalresponsibilitiesinaccordancewiththeCode.
Webelievethattheauditevidencewehaveobtainedissufficientandappropriatetoprovideabasisforouropinion.
KeyAuditMattersKeyauditmattersarethosemattersthat,inourprofessionaljudgement,wereofmostsignificanceinourauditofthefinancialreportofthecurrentyear.Thesematterswereaddressedinthecontextofourauditofthefinancialreportasawhole,andinformingouropinionthereon,butwedonotprovideaseparateopiniononthesematters.Foreachmatterbelow,ourdescriptionofhowourauditaddressedthematterisprovidedinthatcontext.
WehavefulfilledtheresponsibilitiesdescribedintheAuditor’s Responsibilities for the Audit of the Financial Reportsectionofourreport,includinginrelationtothesematters.Accordingly,ourauditincludedtheperformanceofproceduresdesignedtorespondtoourassessmentoftherisksofmaterialmisstatementofthefinancialstatements.Theresultsofourauditprocedures,includingtheproceduresperformedtoaddressthemattersbelow,providethebasisforourauditopinionontheaccompanyingfinancialreport.
For
per
sona
l use
onl
y
AMP 2016 annual report 119
Keyauditmatter Howourauditaddressedthematter
Valuationoflifeinsurancepolicyliabilities31December2016Financialreportreference:Section4:Lifeinsuranceandinvestmentcontracts
Lifeinsurancepolicyliabilitiestotal$24,255millionandrepresent18%oftotalliabilities.
Thevaluationoftheprovisionsforthesettlementoffutureclaimsinvolvescomplexandsubjectivejudgementsaboutfutureevents,bothinternalandexternaltothebusiness.Smallchangesinassumptionscanhaveamaterialimpactonthevaluationoftheseliabilities.
Keyassumptionsinvolvedinthevaluationofthepolicyliabilitiesinclude:– Discountrates– Inflationandindexation– Forecastlapserates,particularlyforthewealthprotection
bookofbusiness– Futuremaintenanceandinvestmentexpenses– Taxation– Surrendervalues– Mortalityandmorbidity
Inobtainingsufficientauditevidence:– Weassessedthedesignandoperatingeffectivenessofcontrols
overthenewbusiness,maintenanceandclaimsprocesses.– Weassessedtheprocessandtestedthekeyreconciliationson
thevalidity,accuracyandcompletenessofthedatausedforthepolicyliabilityvaluation.
– AspartofourworkweusedtheworkofAMP’sAppointedActuarywhoisamanagementexpertunderauditingstandards.ThisincludedassessingthecompetenceandobjectivityoftheAppointedActuaryaswellasperformingtestsontheaccuracyoftheactuarialreports.
– WeevaluatedthekeyITsystemsandthedesignandoperatingeffectivenessofITsystemcontrols.
– Ouractuarialspecialistsassessedthereasonablenessofthevaluationmethodology,keyassumptions,includingtheimpactofthereinsurancetransactionenteredintoduringthecourseoftheyear,andtheinterpretationofaccountingandprudentialstandardsthataffectthepolicyliabilityvaluation.
– Wheremanualadjustmentsweremadetothevaluationmodeloutputsoutsidethestandardprocesses,ouractuarialspecialistsperformedtestingnecessary,onasamplebasis,tovalidatethenatureandaccuracyoftheadjustments.
– Ourspecialistsindependentlydevelopedexpectationsregardingthevaluationresultsbasedontheirunderstandingofthebusiness,externalindustrytrendsandexperienceandAMP’shistoricbusinessactivity.Theseexpectationswerecomparedtothepolicyliabilityvaluationresultsandsignificantdifferencesweresubjecttofurthertesting.
– WeassessedtheadequacyandcompletenessofpolicyliabilitydisclosuresincludedinthefinancialreportagainsttherequirementsofAustralianAccountingStandard–AASB1038Life Insurance Contract Liabilities.
Valuationofinvestmentcontractliabilities31December2016Financialreportreference:Section4:Lifeinsuranceandinvestmentcontracts
Investmentcontractliabilitiestotal$71,579millionandrepresent54%oftotalliabilities.Theyconsistofafinancialinstrumentandaninvestmentmanagementserviceselement,bothofwhicharemeasuredatfairvalue.Withtheexceptionoffixedretirementincomepolicies,theresultingliabilitytopolicyholdersiscloselylinkedtotheperformanceandvalueoftheassets(aftertax)thatsupportthoseliabilities.Forthemajorityofcontracts,thefairvalueisdeterminedbasedonexternalthirdpartypublishedunitpricesandthefairvalueofbackingassets,anddoesnotgenerallyrequiretheexerciseofjudgement.Thevaluationofinvestmentcontractliabilitiesisconsideredakeyauditmattergiventhematerialityofthisaccounttotheoverallfinancialstatements.
Inobtainingsufficientauditevidence:– Weassessedthedesignandoperatingeffectivenessofcontrols
overthenewbusiness,maintenanceandclaimsprocesses.– WeevaluatedthekeyITsystemsandthedesignandoperating
effectivenessofITsystemcontrols.– Weidentifiedandtestedkeycontrolsoverdailyinvestment,
includingwhereappropriateapplicationdrivencontrols.– Weexaminedtheunitpricingprocess,whichincludedassessing
thedesignoftheprocess,andtheroleplayedbyBNPascustodianofthepricing.
– WeevaluatedtheprocessandtestedthekeycontrolsperformedbyAMPthatsupportthevaluationofinvestmentcontractliabilities.Wereceivedandreviewedanunqualifiedassurancereportfromanauditfirmcoveringthecontrolsatthecustodian.
– Fortheinvestmentlinkedpolicies,werecalculatedthetotalinvestmentcontractliabilityviasystemextractionsofunitsheldperproduct,andthepricesasat31December2016.Weperformedtestingoverthisextractionprocessandthesystemholdingthisdata.Wereconciledtheinvestmentcontractliabilitytothefairvalueofunderlyingassets.
Independent Auditor’s Report (continued)
For
per
sona
l use
onl
y
AMP 2016 annual report120
Financial report for the year ended 31 December 2016
Keyauditmatter Howourauditaddressedthematter
Valuationofcomplexandilliquidfinancialinvestments31December2016Financialreportreference:Section2.5Fairvalueinformation
TheGrouphastotalinvestmentsinfinancialassetsof$129,419million,representing92%oftotalassets.Asexplainedinsection2.5,theportfolioofinvestmentsiscategorisedinaccordancewiththefairvaluehierarchy,asrequiredbyaccountingstandards.ThecomplexandilliquidinvestmentsaretypicallyclassifiedasLevel3investments,wherethereisalackofobservablemarkettransactionsandavailablemarketdata.ForAMPthesetotal$3,592million,or3%oftotalassets.TheGroupisrequiredtomakejudgementstoarriveattheirbestestimatesoffairvalueoftheseassets.Thereiscomplexityinthisprocess,aswellasriskassociatedwiththevaluationandmodellingmethodologiesandtheassumptionsadopted.
Theriskisnotuniformforallinvestmenttypesandisgreatestforthefollowingwheretheinvestmentsarehardtovalue:– Infrastructureassets– Unlistedindirectpropertyholdings– Unlistedequities– Unlistedunittrusts
ForthosecomplexandilliquidfinancialinvestmentsweassessedboththemethodologyandassumptionsusedbytheGroupinthecalculationoftheyearendvalueaswellastestedtheoperatingeffectivenessofgovernancecontrolsthattheGrouphasinplacetomonitortheseinvestments.
Further,inobtainingsufficientauditevidence:– Weinvolvedourvaluationandbusinessmodellingspecialiststo
assessthevaluationandmodellingmethodologiesandthekeyassumptionsusedfortheyearendvaluations.
– Weinvolvedourpropertyspecialiststoassesstheindependenceandcompetencyoftheexternalvaluationspecialistsaswellastoassessthemodels,methodologiesandassumptions,includingdiscountrate,yearonyearchangesinvaluationmovements,andoperatingcashflowchangesemployedintheyearendvaluations.
– Forassetsrecordedwithincontrolledunittrustswheretherearenospecificlocalreportingrequirements,weassessedthevaluationsofinvestmentsasprovidedbyexternalinvestmentmanagers,includinganassessmentofthereliabilityoftheinformationprovidedbytheinvestmentmanager,suchaskeyassumptions,multiplesanddiscountsapplied.
– Foroffshoreassets,weinvolvedauditteamsinthoselocationstoperformprocedures.Thisapproachensuredthatlocalmarketconditionswereconsideredaspartofthevaluationprocedures.
Goodwillandintangibleassets31December2016Financialreportreference:Section2.2Intangibles
GoodwillhasbeenrecognisedasaresultofAMPLimited’shistoricalacquisitions,representingtheexcessofthepurchaseconsiderationoverthefairvalueofassetsacquired.OnacquisitionthisgoodwillhasbeenallocatedtotheapplicableCashGeneratingUnits(CGUs).At31December2016,AMPhasrecordedgoodwillof$2,117millionasdescribedinsection2.2.
Animpairmentassessmentisperformedateachreportingperiod,comparingthecarryingvalueoftheCGUwithitsrecoverableamount.TherecoverableamountofeachCGUisdeterminedbycalculatingtheCGU’sfairvalue.Thisiscalculatedastheembeddedvalueplusthevalueofnewbusiness.Thecalculationofembeddedvalueisdependentontheassumptionsthatdrivethevaluationoflifeinsurancepolicyliabilities.
Intangibleassetsforin-forcecontractsanddistributionnetworkswereacquiredduringhistoricalacquisitions.Theseintangibleassetsareamortisedandareassessedforimpairmentwhenevereventsorchangesincircumstancesindicatethatthecarryingamountmaynotberecoverable.
OurauditoftheimpairmentassessmentofeachCGUandintangibleassetrequiredvaluationandactuarialexpertisetoassistinthetestingoftherecoverableamountmodelsandassumptions.Accordingly,weinvolvedourEYactuarialspecialistswho:– AssessedwhetherthemethodologyusedbytheGroup
forimpairmentassessmentpurposeswasinlinewiththerequirementsofAustralianAccountingStandards–AASB136Impairment of Assets,includinganassessmentoftheadequacyoftheembeddedvaluemodelforgoodwillimpairmentassessmentpurposes.
– Assessedtheunderlyingassumptionsforconsistencywiththoseusedinthevaluationofthelifeinsurancepolicyliabilities.
– Assessedthemethodologyandassumptionsusedinthecalculationofthediscountrate,includingcomparisonoftheratetomarketbenchmarks.
– Performedsensitivityanalysisonkeyassumptions,includingcomponentsofthediscountrate.
– Assessedthevalueofoneyear’snewbusinessandthemultipleappliedtocalculatethevalueofthenewbusiness.
– AssessedtheGroup’sdeterminationoftheCGUstowhichgoodwillisallocatedandtheadequacyofthedisclosuresinthefinancialstatementsforcompliancewithapplicableaccountingstandards.
– AssessedthemathematicalaccuracyoftheimpairmentassessmentperformedbytheGroup.
– Foramortisingintangibleassets,weassessedthemethodologyusedbytheGroupforimpairmentassessmentpurposestoevaluatewhethereventsorchangesincircumstancesindicatedthatthecarryingamountmaynotberecoverable.
Independent Auditor’s Report (continued)
For
per
sona
l use
onl
y
AMP 2016 annual report 121
Keyauditmatter Howourauditaddressedthematter
Informationtechnology(IT)environment31December2016Financialreportreference:None
TheoperationsofAMPLimitedareheavilydependentoninformationtechnologysystemsandtheirassociatedITcontrols.
Afundamentalcomponentoftheseprocessesisensuringappropriateuseraccessmanagementprotocolsexist,andarebeingadheredto.
WeinvolvedourITspecialiststoassessthedesignandoperatingeffectivenessofcriticaloperationalandfinancialreportingsystems.
Wheredeficiencieswereidentified,weperformedadditionalprocedurestodeterminewhetherwecouldrelyonthedataandreportingproducedfromaffectedsystems.
Theseproceduresincluded:– Identifyingwhethertherehadbeenunauthorisedor
inappropriatechangesmadetocriticalITsystemsanddatabases.
– Assessingthedesignandoperatingeffectivenessofcompensatingcontrols.
Whererequired,weperformedsubstantiveprocedurestovalidatetheintegrityandreliabilityofassociateddataandreporting.
Information Other than the Financial Statements and Auditor’s ReportTheDirectorsoftheCompanyareresponsiblefortheotherinformation.TheotherinformationcomprisestheinformationintheCompany’sAnnualReportfortheyearended31December2016,butdoesnotincludethefinancialreportandtheauditor’sreportthereon.
Ouropiniononthefinancialreportdoesnotcovertheotherinformationandwedonotexpressanyformofassuranceconclusionthereon.
OtherinformationconsistsoftheinformationincludedintheCompany’s2016AnnualReportotherthanthefinancialstatementsandourauditor’sreportthereon.Weobtainedthedirectors’report(includingtheremunerationreport)priortothedateofourauditor’sreport.WeexpecttoobtaintheChairman’sreport,financialsummaryinformation,informationaboutAMPincludingitsbusinessandstrategy,informationabouttheboardandmanagementteam,thecorporategovernancestatement,theanalysisofshareholderprofitandsecurityholderinformationafterthedateofourauditor’sreport.Managementisresponsiblefortheotherinformation.
Ouropiniononthefinancialstatementsdoesnotcovertheotherinformationandwedonotandwillnotexpressanyformofassuranceconclusionthereon.
Inconnectionwithourauditofthefinancialstatements,ourresponsibilityistoreadtheotherinformationand,indoingso,considerwhethertheotherinformationismateriallyinconsistentwiththefinancialstatementsorourknowledgeobtainedintheauditorotherwiseappearstobemateriallymisstated.
If,basedontheworkwehaveperformedontheotherinformationobtainedpriortothedateoftheauditor’sreport,weconcludethatthereisamaterialmisstatementofthisotherinformation,wearerequiredtoreportthatfact.Wehavenothingtoreportinthisregard.
Directors’ ResponsibilitiesTheDirectorsoftheCompanyareresponsibleforthepreparationofthefinancialreportthatgivesatrueandfairviewinaccordancewithAustralianAccountingStandardsandtheCorporations Act 2001andforsuchinternalcontrolastheDirectorsdetermineisnecessarytoenablethepreparationofthefinancialreportthatgivesatrueandfairviewandisfreefrommaterialmisstatement,whetherduetofraudorerror.
Inpreparingthefinancialreport,theDirectorsareresponsibleforassessingtheGroup’sabilitytocontinueasagoingconcern,disclosing,asapplicable,mattersrelatedtogoingconcernandusingthegoingconcernbasisofaccountingunlesstheDirectorseitherintendtoliquidatetheGrouporceaseoperations,orhavenorealisticalternativebuttodoso.
Auditor’s Responsibilities for the Audit of the Financial Report Ourobjectivesaretoobtainreasonableassuranceaboutwhetherthefinancialreportasawholeisfreefrommaterialmisstatement,whetherduetofraudorerror,andtoissueanauditor’sreportthatincludesouropinion.Reasonableassuranceisahighlevelofassurance,butisnotaguaranteethatanauditconductedinaccordancewithAustralianAuditingStandardswillalwaysdetectamaterialmisstatementwhenitexists.Misstatementscanarisefromfraudorerrorandareconsideredmaterialif,individuallyorintheaggregate,theycouldreasonablybeexpectedtoinfluencetheeconomicdecisionsofuserstakenonthebasisofthisfinancialreport.
Independent Auditor’s Report (continued)
For
per
sona
l use
onl
y
AMP 2016 annual report122
Financial report for the year ended 31 December 2016
Independent Auditor’s Report (continued)AspartofanauditinaccordancewithAustralianAuditingStandards,weexerciseprofessionaljudgementandmaintainprofessionalscepticismthroughouttheaudit.Wealso:
– Identifyandassesstherisksofmaterialmisstatementofthefinancialreport,whetherduetofraudorerror,designandperformauditproceduresresponsivetothoserisks,andobtainauditevidencethatissufficientandappropriatetoprovideabasisforouropinion.Theriskofnotdetectingamaterialmisstatementresultingfromfraudishigherthanforoneresultingfromerror,asfraudmayinvolvecollusion,forgery,intentionalomissions,misrepresentations,ortheoverrideofinternalcontrol.
– Obtainanunderstandingofinternalcontrolrelevanttotheauditinordertodesignauditproceduresthatareappropriateinthecircumstances,butnotforthepurposeofexpressinganopinionontheeffectivenessoftheentity’sinternalcontrol.
– EvaluatetheappropriatenessofaccountingpoliciesusedandthereasonablenessofaccountingestimatesandrelateddisclosuresmadebytheDirectors.
– ConcludeontheappropriatenessoftheDirectors’useofthegoingconcernbasisofaccountinginthepreparationofthefinancialreport.Wealsoconclude,basedontheauditevidenceobtained,whetheramaterialuncertaintyexistsrelatedtoeventsandconditionsthatmaycastsignificantdoubtontheentity’sabilitytocontinueasagoingconcern.Ifweconcludethatamaterialuncertaintyexists,wearerequiredtodrawattentionintheauditor’sreporttothedisclosuresinthefinancialreportaboutthematerialuncertaintyor,ifsuchdisclosuresareinadequate,tomodifytheopiniononthefinancialreport.However,futureeventsorconditionsmaycauseanentitytoceasetocontinueasagoingconcern.
– Evaluatetheoverallpresentation,structureandcontentofthefinancialreport,includingthedisclosures,andwhethertheconsolidatedfinancialstatementsrepresenttheunderlyingtransactionsandeventsinamannerthatachievesfairpresentation.
– ObtainsufficientappropriateauditevidenceregardingthefinancialinformationoftheentitiesorbusinessactivitieswithintheGrouptoexpressanopiniononthefinancialreport.Weareresponsibleforthedirection,supervisionandperformanceoftheGroupaudit.Weremainsolelyresponsibleforourauditopinion.
WecommunicatewiththeDirectorsregarding,amongothermatters,theplannedscopeandtimingoftheauditandsignificantauditfindings,includinganysignificantdeficienciesininternalcontrolthatweidentifyduringouraudit.
WearealsorequiredtoprovidetheDirectorswithastatementthatwehavecompliedwithrelevantethicalrequirementsregardingindependence,andtocommunicatewiththemallrelationshipsandothermattersthatmayreasonablybethoughttobearonourindependence,andwhereapplicable,relatedsafeguards.
FromthematterscommunicatedtotheDirectors,wedeterminethosemattersthatwereofmostsignificanceintheauditofthefinancialreportofthecurrentyearandarethereforethekeyauditmatters.Wedescribethesemattersinourauditor’sreportunlesslaworregulationprecludespublicdisclosureaboutthematterorwhen,inextremelyrarecircumstances,wedeterminethatamattershouldnotbecommunicatedinourreportbecausetheadverseconsequencesofdoingsowouldreasonablybeexpectedtooutweighthepublicinterestbenefitsofsuchcommunication.
Report on the Remuneration ReportOpinionontheRemunerationReportWehaveauditedtheRemunerationReportincludedintheDirectors’Reportfortheyearended31December2016.
Inouropinion,theRemunerationReportofAMPLimitedfortheyearended31December2016,complieswithsection300AoftheCorporations Act 2001.
ResponsibilitiesTheDirectorsoftheCompanyareresponsibleforthepreparationandpresentationoftheRemunerationReportinaccordancewithsection300Aofthe Corporations Act 2001.OurresponsibilityistoexpressanopinionontheRemunerationReport,basedonourauditconductedinaccordancewithAustralianAuditingStandards.
Ernst&Young
TonyJohnsonEngagementPartnerSydney9February2017
AmemberfirmofErnst&YoungGlobalLimitedLiabilitylimitedbyaschemeapprovedunderProfessionalStandardsLegislation
For
per
sona
l use
onl
y
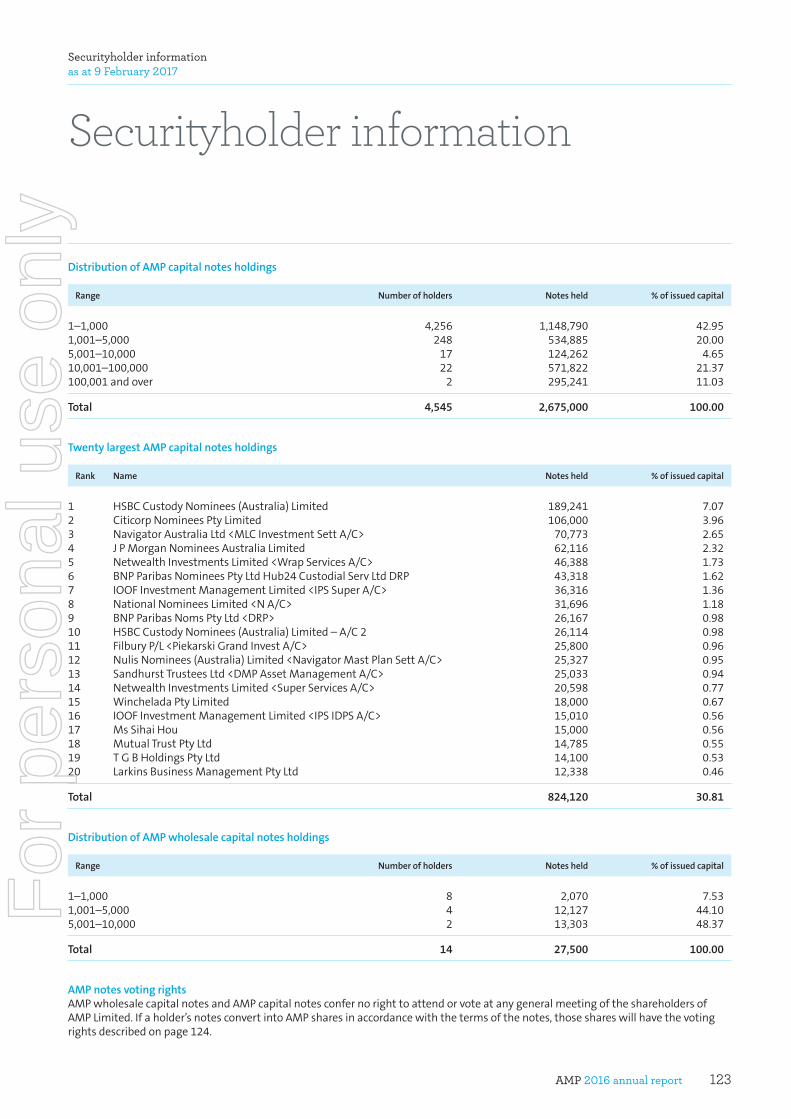
AMP 2016 annual report 123
Securityholder information
Securityholder information as at 9 February 2017
DistributionofAMPcapitalnotesholdings
Range Numberofholders Notesheld %ofissuedcapital
1–1,000 4,256 1,148,790 42.951,001–5,000 248 534,885 20.005,001–10,000 17 124,262 4.6510,001–100,000 22 571,822 21.37100,001andover 2 295,241 11.03
Total 4,545 2,675,000 100.00
TwentylargestAMPcapitalnotesholdings
Rank Name Notesheld %ofissuedcapital
1 HSBCCustodyNominees(Australia)Limited 189,241 7.072 CiticorpNomineesPtyLimited 106,000 3.963 NavigatorAustraliaLtd<MLCInvestmentSettA/C> 70,773 2.654 JPMorganNomineesAustraliaLimited 62,116 2.325 NetwealthInvestmentsLimited<WrapServicesA/C> 46,388 1.736 BNPParibasNomineesPtyLtdHub24CustodialServLtdDRP 43,318 1.627 IOOFInvestmentManagementLimited<IPSSuperA/C> 36,316 1.368 NationalNomineesLimited<NA/C> 31,696 1.189 BNPParibasNomsPtyLtd<DRP> 26,167 0.9810 HSBCCustodyNominees(Australia)Limited–A/C2 26,114 0.9811 FilburyP/L<PiekarskiGrandInvestA/C> 25,800 0.9612 NulisNominees(Australia)Limited<NavigatorMastPlanSettA/C> 25,327 0.9513 SandhurstTrusteesLtd<DMPAssetManagementA/C> 25,033 0.9414 NetwealthInvestmentsLimited<SuperServicesA/C> 20,598 0.7715 WincheladaPtyLimited 18,000 0.6716 IOOFInvestmentManagementLimited<IPSIDPSA/C> 15,010 0.5617 MsSihaiHou 15,000 0.5618 MutualTrustPtyLtd 14,785 0.5519 TGBHoldingsPtyLtd 14,100 0.5320 LarkinsBusinessManagementPtyLtd 12,338 0.46
Total 824,120 30.81
DistributionofAMPwholesalecapitalnotesholdings
Range Numberofholders Notesheld %ofissuedcapital
1–1,000 8 2,070 7.531,001–5,000 4 12,127 44.105,001–10,000 2 13,303 48.37
Total 14 27,500 100.00
AMPnotesvotingrightsAMPwholesalecapitalnotesandAMPcapitalnotesconfernorighttoattendorvoteatanygeneralmeetingoftheshareholdersofAMPLimited.Ifaholder’snotesconvertintoAMPsharesinaccordancewiththetermsofthenotes,thoseshareswillhavethevotingrightsdescribedonpage124.
For
per
sona
l use
onl
y
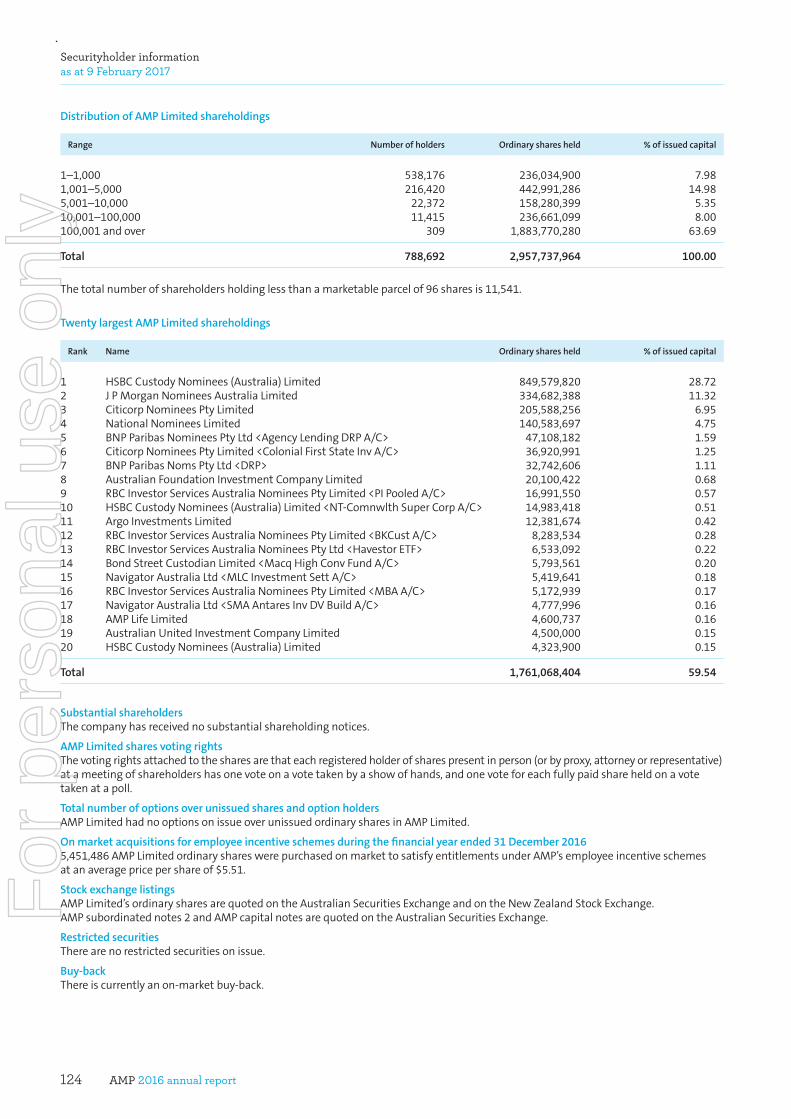
AMP 2016 annual report124
Securityholder information as at 9 February 2017
DistributionofAMPLimitedshareholdings
Range Numberofholders Ordinarysharesheld %ofissuedcapital
1–1,000 538,176 236,034,900 7.981,001–5,000 216,420 442,991,286 14.985,001–10,000 22,372 158,280,399 5.3510,001–100,000 11,415 236,661,099 8.00100,001andover 309 1,883,770,280 63.69
Total 788,692 2,957,737,964 100.00
Thetotalnumberofshareholdersholdinglessthanamarketableparcelof96sharesis11,541.
TwentylargestAMPLimitedshareholdings
Rank Name Ordinarysharesheld %ofissuedcapital
1 HSBCCustodyNominees(Australia)Limited 849,579,820 28.722 JPMorganNomineesAustraliaLimited 334,682,388 11.323 CiticorpNomineesPtyLimited 205,588,256 6.954 NationalNomineesLimited 140,583,697 4.755 BNPParibasNomineesPtyLtd<AgencyLendingDRPA/C> 47,108,182 1.596 CiticorpNomineesPtyLimited<ColonialFirstStateInvA/C> 36,920,991 1.257 BNPParibasNomsPtyLtd<DRP> 32,742,606 1.118 AustralianFoundationInvestmentCompanyLimited 20,100,422 0.689 RBCInvestorServicesAustraliaNomineesPtyLimited<PIPooledA/C> 16,991,550 0.5710 HSBCCustodyNominees(Australia)Limited<NT-ComnwlthSuperCorpA/C> 14,983,418 0.5111 ArgoInvestmentsLimited 12,381,674 0.4212 RBCInvestorServicesAustraliaNomineesPtyLimited<BKCustA/C> 8,283,534 0.2813 RBCInvestorServicesAustraliaNomineesPtyLtd<HavestorETF> 6,533,092 0.2214 BondStreetCustodianLimited<MacqHighConvFundA/C> 5,793,561 0.2015 NavigatorAustraliaLtd<MLCInvestmentSettA/C> 5,419,641 0.1816 RBCInvestorServicesAustraliaNomineesPtyLimited<MBAA/C> 5,172,939 0.1717 NavigatorAustraliaLtd<SMAAntaresInvDVBuildA/C> 4,777,996 0.1618 AMPLifeLimited 4,600,737 0.1619 AustralianUnitedInvestmentCompanyLimited 4,500,000 0.1520 HSBCCustodyNominees(Australia)Limited 4,323,900 0.15
Total 1,761,068,404 59.54
SubstantialshareholdersThecompanyhasreceivednosubstantialshareholdingnotices.
AMPLimitedsharesvotingrightsThevotingrightsattachedtothesharesarethateachregisteredholderofsharespresentinperson(orbyproxy,attorneyorrepresentative)atameetingofshareholdershasonevoteonavotetakenbyashowofhands,andonevoteforeachfullypaidshareheldonavotetakenatapoll.
TotalnumberofoptionsoverunissuedsharesandoptionholdersAMPLimitedhadnooptionsonissueoverunissuedordinarysharesinAMPLimited.
Onmarketacquisitionsforemployeeincentiveschemesduringthefinancialyearended31December20165,451,486AMPLimitedordinaryshareswerepurchasedonmarkettosatisfyentitlementsunderAMP’semployeeincentiveschemesatanaveragepricepershareof$5.51.
StockexchangelistingsAMPLimited’sordinarysharesarequotedontheAustralianSecuritiesExchangeandontheNewZealandStockExchange.AMPsubordinatednotes2andAMPcapitalnotesarequotedontheAustralianSecuritiesExchange.
RestrictedsecuritiesTherearenorestrictedsecuritiesonissue.
Buy-backThereiscurrentlyanon-marketbuy-back.
For
per
sona
l use
onl
y
Glossary
ContingentliabilitiesAsituationexistingatreportingdate,wherepasteventshaveledtoapossibleobligation,theoutcomeofwhichdependsonuncertainfutureevents,oranobligationwheretheoutcomeisnotsufficientlyprobableorreliablymeasurabletowarrantrecognisingtheliabilityatthisreportingdate.
ControllablecostsCoststhatAMPincursinrunningitsbusiness.Controllablecostsincludeoperationalandprojectcostsandexcludevariablecosts,provisionforbadanddoubtfuldebtsandinterestoncorporatedebt.
Earningspershare(EPS)Eachearningspershare(EPS)calculationrepresentstheprofitamountdividedbytheweightedaveragenumberofsharesonissueduringtheyear.
EmbeddedvalueAcalculationoftheeconomicvalueoftheshareholdercapitalinthebusinessesotherthanAMPBank,andthefutureshareholderprofitsexpectedtoemergefromthebusinesscurrentlyin-force(expressedintoday’sdollars).
ExecutivesWithinthisreport,thetermexecutivesreferstothechiefexecutiveofficerandnominateddirectreportsoftheCEOwhoarekeymanagementpersonnel(KMP).
FrankingrateTheamountoftaxAMPhasalreadypaidonadividendpayment.ThiscanbeusedasataxcreditbyAustralianresidentshareholders.ThefrankingrateisdeterminedbyAMP’staxableincome.AMP’spolicyistoalwaysfrankdividendsatthehighestpossiblerate.
InvestmentperformanceAmeasureofhowwellwemanagefundsonbehalfofourcustomers.ThepercentageofassetsmanagedbyAMPwhichmetorexceededtheirrespectiveclientgoals.
Keymanagementpersonnel(KMP)Thechiefexecutiveofficer(CEO),directreportsoftheCEOandthenon-executivedirectors,whohaveauthorityandresponsibilityforplanning,directingandcontrollingtheactivitiesofAMP.
Long-termincentive(LTI)AnexecutiverewardforhelpingAMPachievespecificlong-termperformancetargets.Itisawardedintheformofsharerightsand/orperformancerightstomotivateexecutivestocreateoutstandinglong-termvalueforshareholders.ArightisanentitlementtoreceiveoneAMPlimitedshareperrightsubjecttomeetingthevestingconditions.
Non-executivedirectors(NEDs)BoarddirectorswhoarenotemployeesofAMP(theyareindependent).
OperatingearningsTotaloperatingearningsaretheshareholderprofitsthatrelatetotheperformanceofAMP.Operatingearningsexcludeinvestmentearningsonshareholdercapitalandone-offitems.
PerformancerightAformofexecutiveremunerationdesignedtorewardlong-termperformance.Selectedexecutivesaregrantedperformancerights.EachperformancerightisarighttoacquireoneAMPshareafterathree-yearperformanceperiod,ifaspecificperformancehurdleismet.
Returnonequity(RoE)Returnonequity(RoE)isameasureusedintheAMPlong-termincentiveplan.ItisapercentagethatshowshoweffectiveAMPhasbeeningrowingthevalueofthemoneyinvestedbyourshareholders.ThepercentageisdeterminedbydividingAMP’sunderlyingprofitbyAMPshareholderequity.
SharerightAsharerightisanentitlementtoacquireoneAMPshareattheendofavestingperiodegtwoyears,aslongastheserviceconditionsaremet.
Short-termincentive(STI)AnexecutiverewardforhelpingAMPachievespecificshort-termperformancetargetsandobjectives.Itispaidintheformofcashandsharerightstomotivateexecutivestoachieveoutstandingperformanceduringtheyear.
STIpoolThemoneyusedforthepaymentofSTIrewards.ThepoolsizevarieseachyeardependingonAMP’sfinancialandnon-financialperformanceagainsttheSTIscorecard.
Totalshareholderreturn(TSR)Ameasureofthevaluereturnedtoshareholdersoveraperiodoftime.IttakesintoaccountthechangesinmarketvalueofAMPshares,plusthevalueofanydividendspaidandcapitalreturnsontheshares.
UnderlyinginvestmentincomeUnderlyinginvestmentincomeisbasedonlong-termexpectedratesofreturn.Actualinvestmentincomecanbehigherorlowerthanthelong-termratefromyeartoyear.
UnderlyingprofitAMP’skeymeasureofbusinessprofitability,asitsmoothsinvestmentmarketvolatilitythatstemsfromshareholderassetsthatareinvestedininvestmentmarketsandaimstoreflectthetrendsintheunderlyingbusinessperformanceoftheAMPgroup.Thecomponentsofunderlyingprofitarelistedonpage51.
VestingRemunerationtermdefiningthepointatwhichtherequiredperformancehurdlesand/orservicerequirementshavebeenmet,andafinancialbenefitmayberealisedbytherecipient.
AMPiscommittedtoactivelyreducingitsimpactontheenvironmentandhasprintedthisdocumentonpaperderivedfromcertifiedwellmanagedforestsandmanufacturedbyanISO14001certifiedmill.ThedocumenthasalsobeenprintedatanFSC®certifiedprinter.
For
per
sona
l use
onl
y
NS1
247
03/1
7
Registered office of AMP Limited 33 Alfred StreetSydney NSW 2000AustraliaT +612 9257 5000F +612 9257 7178W amp.com.auCompany Secretary: David Cullen
AMP investor relations Level 21, 33 Alfred StreetSydney NSW 2000AustraliaT +612 9257 9009F +612 8843 8255E [email protected] amp.com.au/sharesHead of shareholder services: Marnie Reid
AMP products and policies AustraliaT 131 267E [email protected]
New ZealandT 0800 808 267E [email protected]
InternationalT +612 8048 8162
Australia AMP share registryReply Paid 2980Melbourne VIC 8060T 1300 654 442F 1300 301 721
New ZealandAMP share registryPO Box 91543Victoria Street WestAuckland 1142T 0800 448 062F 09 488 8787
Other countries AMP share registryGPO Box 2980Melbourne VIC 3001AustraliaT +613 9415 4051F +612 8234 5002
AMP share registry
facebook.com/AMPaustralia @AMP_AU
Contact us
AMP is incorporated and domiciled in Australia
For
per
sona
l use
onl
y