Embed Size (px)
Citation preview

LAEDC KYSER CENTER FOR ECONOMIC RESEARCH
ECONOMIC FORECAST & INDUSTRY OUTLOOK
2 0 1 6 - 2 0 1 7

10th Annual International Trade Outlook S P O N S O R E D B Y:
EVENT SPONSORSMEDIA SPONSORS
EVENT SPONSORS
ECONOMIC FORECAST AND
INDUSTRY OUTLOOK
California and Southern California
Including the National and International Setting
February 2016
Los Angeles County Economic Development Corporation The Kyser Center for Economic Research 444 S. Flower St., 37th
Tel: 213-622-4300 | 888-4-LAEDC-1 | Fax: 213-622-7100 Floor, Los Angeles, CA 90071
Web: http://laedc.org | E-mail: [email protected]
©2016 Los Angeles County Economic Development Corporation 444 S. Flower Street, 37th Floor., Los Angeles 90071 T: (213) 622-4300 | F: (213) 622-7100 | www.laedc.org
As Southern California’s premier economic development leadership organization, the Los Angeles County Economic Development Corporation (LAEDC) is focused on raising the standards of living for the residents of L.A. County by increasing economic opportunity and regional prosperity. We achieve this through objective economic research and analysis, strategic assistance to government and business, and targeted public policy. Our efforts are guided and supported by the expertise and counsel of our business, government and education members and partners. Strategic Planning LAEDC has again facilitated a collaborative, public consensus process to develop a regional blueprint for progress on regional economic priorities, resulting in the 2016-2020 L.A. County Strategic Plan for Economic Development, which will guide collective action throughout the region. Drawing Strength from Regional Leaders The membership of the LAEDC includes civic leaders and ranking executives of the region’s leading public and private organizations. Through financial support and direct participation in the mission, programs and public policy initiatives of the LAEDC, the members are committed to playing a decisive role in shaping the region’s economic future. Business Assistance and Job Creation The LAEDC’s Business Development and Assistance Program provides essential services to L.A. County businesses at no cost, including coordinating site searches, securing incentives and permits, and identifying traditional and nontraditional financing. Since 1996, the LAEDC has directly helped retain or attract more than 200,000 jobs. Economic Information and Analysis Through our objective economic research and analysis, the LAEDC provides valuable insight to business decision makers, education, media and government. The LAEDC Kyser Center for Economic Research publishes a variety of industry focused and regional analysis, including our Economic Forecast report, which has been ranked No. 1 by the Wall Street Journal. The LAEDC Institute for Applied Economics offers highly regarded economic and policy expertise to private- and public-sector clients, and produces regional industry cluster analyses, related workforce studies and occupational forecasts, as well as fee-based studies that help clients understand economic impact of policy options, industries, or projects. Representing Southern California at the State Level The LAEDC partners with the Southern California Leadership Council, to help enable public sector officials, policy makers and other civic leaders to address and solve public policy issues critical to the entire Southern California region’s economic vitality and quality of life. Global Connections Our World Trade Center Los Angeles works to support the development of international trade and business opportunities for Southern California companies, by fostering exports, finding international market opportunities, and promoting the Los Angeles region as a prime destination for foreign investment.
The LAEDC is a public-benefit, private, non-profit 501(c)3 organization established in 1981.
On behalf of our dedicated members and talented staff, we are pleased to present the LAEDC 2016-
2017 Economic Forecast and Industry Outlook, with a special focus on the future of mobility and the
ways we will be moving people and goods through the Los Angeles region in the years to come.
The LAEDC Economic Forecast is Southern California’s premier source for in-depth economic
information and analysis on our global, national, state and regional economies, produced by the LAEDC
Kyser Center for Economic Research, led by its Chief Economist, Dr. Robert Kleinhenz.
Dr. Kleinhenz is joined at the event this year by Brogan BamBrogan, CTO & Co-founder, Hyperloop
Technologies, Inc., Wilhelm Cashen, Chairman, UAV Systems Association, Jim Cooper, Entrepreneur in
Residence, PortTech Los Angeles, Keith Kaplan, CEO & Co-Founder, Tesla Foundation Group, Nick
Sampson, SVP, R&D and Product Development, Faraday Future, Joshua L. Schank, Chief Innovation
Officer, Los Angeles County Metropolitan Transportation Authority (LA Metro), Michael
Shabun, Marketing Manager, DJI, and Rodney E. Slater, Partner, Squire Patton Boggs and former U.S.
Secretary of Transportation. These guest experts provide an insider’s look at what lies ahead for our
region in the areas of autonomous vehicles, commercial drones, high-speed commuting, goods
movement, and the impact of such innovation on our cities.
Repeating his role as Master of Ceremonies, is Frank Mottek, the voice of business news in Los Angeles,
and the host of the top-rated KNX NEWSRADIO Money Hour.
This event has been made possible by our generous sponsors, Squire Patton Boggs, CDS Insurance
Services, and Southern California Association of Governments (SCAG). Our media sponsor is
KNX NEWSRADIO 1070. Our sincere thanks go to them.
Thank you for your continued support of the LAEDC and our work to attract, retain, and grow
businesses and jobs for the residents of Los Angeles County. This work has directly led to more than
200,000 good jobs for L.A. County. The beneficial impacts these jobs have on the health and well-being
of families and communities of our region is a great reminder of the true value of economic
development.
We also want to thank the hundreds stakeholders from all across our region who helped develop the
new 2016-2020 L.A. County Strategic Plan for Economic Development, a blueprint for a strong
economy and more widely shared prosperity for L.A. County's residents. To learn more about the plan
and how you can get involved in its implementation, please visit www.LACountyStrategicPlan.com
Sincerely,
Bill Allen, Praful Kulkarni, President, gkkWorks
President and CEO Chairman
LAEDC LAEDC
PREPARED AND RESEARCHED BY:
Robert A. Kleinhenz Ph.D. Chief Economist Kimberly Ritter-Martinez Economist Bengte Evenson Ph.D. Economist George Entis Research Analyst
About the Kyser Center for Economic Research
The Kyser Center for Economic Research was named in November 2007 in honor of the LAEDC’s first Chief Economist, Jack Kyser. The Kyser Center’s economic research encompasses the Southern California region, which includes the counties of Los Angeles, Orange, Riverside, San Bernardino, San Diego and Ventura. The center also tracks developments and produces forecasts, studies and reports on the California, national and international economies.
The economy of the greater Los Angeles region is driven by more than its famed entertainment industry. The region’s broad economic base also includes aerospace, automotive, biotechnology, fashion, manufacturing and international trade. The Kyser Center conducts research on the individual industries of the region to gain a better understanding of ongoing changes in the economy.
The Kyser Center is highly regarded for its accurate and unbiased assessment of the economy. Kyser Center economists are also sought-after public speakers and frequent contributors to media coverage of the economy. At the heart of the Kyser Center is its mission to provide information, insights and perspectives to help business leaders, government officials and the general public understand and take advantage of emerging trends.
TABLE OF CONTENTS
2016-2017 Forecast at a Glance..................................................................................... 1
The U.S. Economy .......................................................................................................... 2
The International Economy ............................................................................................. 9
Foreign Exchange Rates ........................................................................................................... 17
The California Economy................................................................................................ 19 Gross Product Comparisons ..................................................................................................... 25
Los Angeles County...................................................................................................... 34
Orange County.............................................................................................................. 40
Riverside and San Bernardino Counties........................................................................ 46
San Diego County......................................................................................................... 53
Ventura County............................................................................................................. 59
Major Industries of the Southern California Economy.................................................... 64
Aerospace and Defense ............................................................................................................ 64
Apparel Design and Manufacturing ........................................................................................... 66
Computer and Electronic Product Manufacturing ..................................................................... 68
Professional and Business Services ........................................................................................ 68
Financial Services ..................................................................................................................... 69
Health Care Services and Biomedical ...................................................................................... 69
International Trade/Goods Movement ...................................................................................... 70
Motion Picture and Video Production ........................................................................................ 72
Real Estate and Construction ................................................................................................... 73
Retail Trade ............................................................................................................................... 86
Travel and Tourism ................................................................................................................... 87
Index of Statistical Tables ............................................................................................. 92

2016-2017 Forecast at a Glance
LAEDC Kyser Center for Economic Research 1 Economic Forecast, February 2016
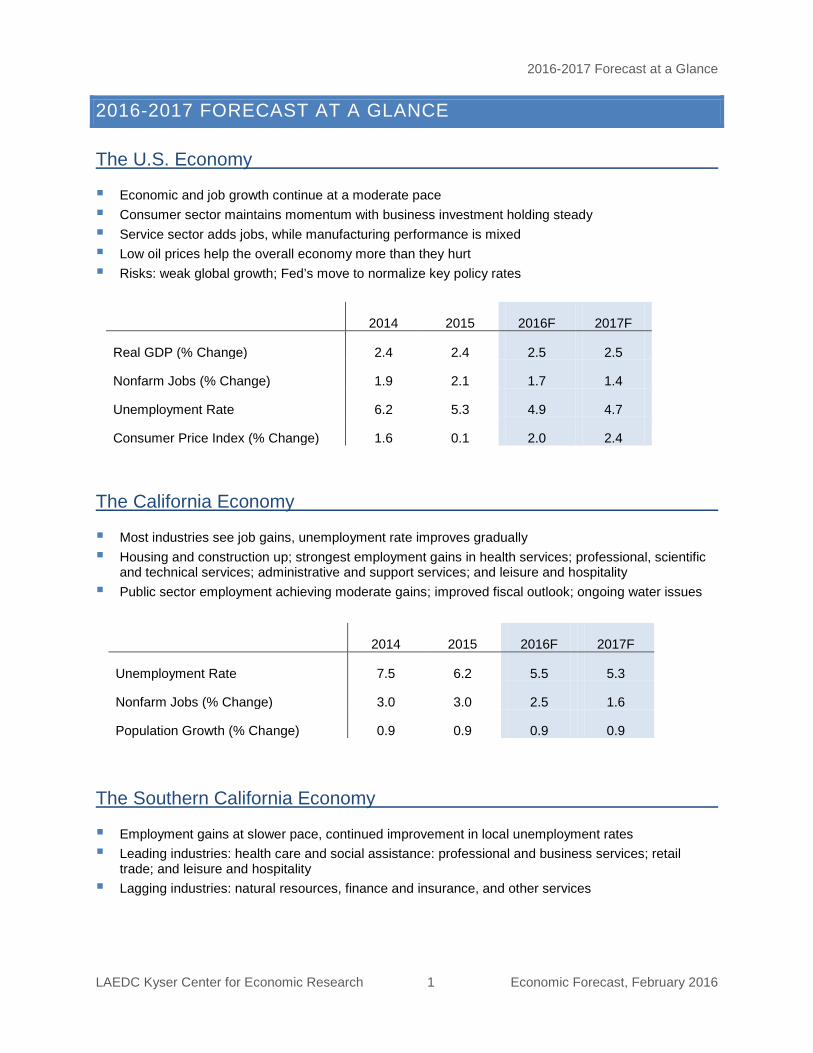
2016-2017 FORECAST AT A GLANCE The U.S. Economy
Economic and job growth continue at a moderate pace Consumer sector maintains momentum with business investment holding steady Service sector adds jobs, while manufacturing performance is mixed Low oil prices help the overall economy more than they hurt Risks: weak global growth; Fed’s move to normalize key policy rates
The California Economy
Most industries see job gains, unemployment rate improves gradually Housing and construction up; strongest employment gains in health services; professional, scientific
and technical services; administrative and support services; and leisure and hospitality Public sector employment achieving moderate gains; improved fiscal outlook; ongoing water issues
The Southern California Economy
Employment gains at slower pace, continued improvement in local unemployment rates Leading industries: health care and social assistance: professional and business services; retail
trade; and leisure and hospitality Lagging industries: natural resources, finance and insurance, and other services
2014 2015 2016F 2017F
Real GDP (% Change) 2.4 2.4 2.5 2.5
Nonfarm Jobs (% Change) 1.9 2.1 1.7 1.4
Unemployment Rate 6.2 5.3 4.9 4.7
Consumer Price Index (% Change) 1.6 0.1 2.0 2.4
2014 2015 2016F 2017F
Unemployment Rate 7.5 6.2 5.5 5.3
Nonfarm Jobs (% Change) 3.0 3.0 2.5 1.6
Population Growth (% Change) 0.9 0.9 0.9 0.9
The U.S. Economy
LAEDC Kyser Center for Economic Research 2 Economic Forecast, February 2016
THE U.S. ECONOMY
The first quarter has been a treacherous one in recent years, marked by natural disasters (East Coast snowstorm), government machinations (sequestration budget cuts) and sovereign debt crises. This year is no different: the U.S. has been attacked by an economic Hydra in the form of plunging oil prices, central bank uncertainty and volatility in China.
Let’s begin with China. This is a story with two parts. First, the country is transitioning from an industrializing, export-oriented economic system to one that will be driven more by internal forces such as the consumer sector. Second, China’s financial markets are evolving and experiencing growing pains to say the least. How will these developments affect the U.S. this year?
Exports are the most direct link between the U.S. and China, but U.S. exports to China equate to less than one percent of U.S. GDP. As such, China’s economic transition will have little effect on the performance of the U.S. economy in the near term. Financial market linkages, however, pose a greater risk. China’s financial markets may be small, but their growing pains can cause “referred pain” around the globe, and, given the extensive integration of global markets, can increase volatility in U.S. financial markets. In turn, uncertainty in financial markets can have an adverse effect on consumer and business confidence.
Meanwhile, who would have thought ten years ago that the world would be awash in oil? The U.S. has seen oil production increase in recent years, Saudi Arabia is flooding the market with its supplies, and other oil producers are scrambling to maintain their revenue stream in the midst of plunging oil prices. Low oil prices are good for consumers and most businesses in the U.S., but the global glut in oil is just one symptom of weak demand in the global economy.
Finally, central banks, and the Federal Reserve in particular, continue to play a central role in economic policy. With the U.S. economy at full employment, the Fed would like to raise rates and prepare itself for the next battle. But central banks in Europe, Japan and elsewhere around the globe are dealing with fragile economies, which rate hikes will further weaken.
In the midst of all this, the U.S. economy keeps chugging along, with a 2.4% GDP growth rate last year that matched that of 2014. Two percent growth is not stellar, but it has been steady, and the tightening labor market should prompt long-awaited increases in the wages of many workers. Modest growth of 2.5% is expected this year and next, partly because of the momentum inherent in the consumer sector, the economy’s flywheel, but also because of improving numbers in housing. It also helps that the U.S. economy is relatively isolated from the rest of the world.
The U.S. Economy
LAEDC Kyser Center for Economic Research 3 Economic Forecast, February 2016
KEY SECTORS
Consumers: The consumer sector represents nearly seventy percent of the U.S. economy. Its size and its acceleration helped the U.S. economy turn in a respectable performance last year. With the consumer sector accounting for 2.1% of the economy’s 2.4% growth rate, increases in consumer spending accounted for nearly all of the economic growth in the U.S. in 2015.
Advancing by 3.1% last year, consumer spending grew at the fastest pace in ten years. While spending was led by a 6.0% increase in purchases of durable goods, slower-growing segments (services were up by 2.8% and nondurable goods rose by 2.7%) accounted for most of the absolute increase in consumer spending. Vehicle purchases made up a large part of household durable goods purchases. In fact, with 17.8 million vehicles sold, 2015 matched the record that was set in 2000. Improvement in the housing market and general gains in household income led to a sizable increase in spending on home furnishings, appliances and the like. With declining oil and energy prices, households spent less on fuel and energy, and instead increased both their savings and their purchases of other goods and services.
With growing confidence in their financial situation, households have been more willing to use credit. Credit card balances rose by 5.0% in the third quarter of 2015 compared with the same period a year earlier, but are still nearly 20% below their peak prior to the recession. Record-tying vehicle sales triggered an 11.9% year-to-year increase in auto loans, while student loan balances rose by 6.8% year-to-year.1
Increased household wealth has also supported higher levels of spending. Household net worth surpassed the prerecession peak three years ago in response to higher returns in the financial markets and improving property values. Homeowner’s equity increased by 11.6% year-to-year in the third quarter of 2015, continuing a string of double-digit gains that began in mid-2012. Homeowner’s equity was still 7% below peak in the third quarter of last year, but the gap has closed steadily. If anticipated gains in housing are realized this year and next, the gap will ultimately be closed.
Overall, total household debt is still 4.8% lower than the peak of the third quarter of 2008. This may be due to greater caution on the part of households with respect to using credit, but it is also related to homeownership, which stood at 63.7% in the third quarter of last year, considerably below the 69.2% peak that was achieved in early 2005. In fact, mortgage debt in the third quarter of last year still lagged behind its peak (third quarter of 2008) by 11.1%. Assuming the housing market improves over this year and next, homeownership and mortgage debt will increase together, pushing total household debt to a new high.
Continued gains in the labor market and the higher incomes that are associated with those gains will sustain somewhat higher levels of consumer spending this year and next. Increases in expenditures of both goods and services can be expected. Moreover, consumer spending on appliances and furnishings and other items for the home should be pulled forward by the housing market. As mentioned elsewhere, several forces will
1 Quarterly Report on Household Debt and Credit, Federal Reserve Bank of New York, November 2015
The U.S. Economy
LAEDC Kyser Center for Economic Research 4 Economic Forecast, February 2016
support increased demand for housing: more Millennials coming of age and forming households, stronger incomes supporting increased capacity to buy or rent, and heighted urgency to buy in anticipation of higher mortgage rates. In recent years, these trends have been met by sluggish increases in supply. Inventories of existing homes are lean, and while new home building has been rising at a respectable rate (about 10% annually), new construction has consistently fallen below expectations. For a more detailed discussion of the region’s real estate and construction sector, see the Real Estate and Construction section of this report.
Businesses: Investment spending accounts for one-sixth of GDP and has made regular contributions to the current economic expansion, increasing by 5.0% in 2015 despite weakness in the energy sector. Nonresidential fixed investment spending (business investment spending except for residential construction and inventory changes) increased by 2.9% last year. Increased spending on equipment and intellectual property more than offset a decline in spending on structures due to a pullback in the energy sector. It is worth noting that investment spending is notoriously volatile, increasing by an impressive 9.0% in 2012, followed by a subdued 3.0% gain in 2013, which doubled to a 6.2% increase in 2014.
Other components of investment spending include residential construction and changes in inventories. Residential investment spending (construction) advanced at an 8.6% rate last year, which is roughly in line with the performance of other housing-related indicators. Residential construction has been on the rise in recent years, but remains somewhat tentative. As for changes in inventory, weakness in final demand last year, both in the U.S. and abroad, resulted in increases in inventories across many of the economy’s key industries, including agriculture, construction, mining and utilities, and the retail sector. Elevated inventories will have to be drawn down in 2016, which will likely take the edge off of growth rates in the first half of the year.
With the overall economy is expected to maintain its trajectory over the next two years, investment spending is expected to grow more slowly (just under four percent) this year, mainly because of inventory corrections and continued weakness in energy. However, investment spending should accelerate to a growth rate between six and seven percent in 2017. Looking at the major categories of investment spending, business fixed investment should grow by five percent this year and next, with increased spending anticipated in equipment, intellectual property and structures. Residential investment spending should see sustained growth of approximately ten percent this year and next, while inventory changes will register wide swings, first offsetting the 2015 buildup with a sharp dip in 2016, then rising modestly in 2017.
Government: After four consecutive years of decline, government purchases saw a slight gain (0.8%) in 2015. This occurred despite a 0.4% cut in federal government expenditures because increased spending at the state and local level more than offset another decrease in federal spending. State and local finances have generally improved in recent years, resulting in a 1.5% increase in expenditures last year. Even so, state and local outlays were 7% lower in inflation-adjusted terms when compared with the 2009 peak. State and local spending will accelerate somewhat this year growing by 1.5%, with a 1.2% gain expected next year. Federal spending will be a mixed bag, up this year with next year less certain. Overall, total government expenditures are expected to rise by 2.3% this year, downshifting to a 0.4% increase in 2017.
The U.S. Economy
LAEDC Kyser Center for Economic Research 5 Economic Forecast, February 2016
Trade: The headline in recent months may have been China, but the main themes in the story on U.S. trade have been the value of the dollar and the health (or lack thereof) of our trading partners. With a stronger economy and anticipated increases in interest rates, the U.S. Dollar appreciated nearly 13% against a basket of foreign currencies last year. When coupled with the fact that many of our trading partners are facing weak conditions at home, it should be no surprise that U.S. exports of goods (adjusted for inflation) fell last year. However, the decline in exports of goods was just 0.2%, and the exports of both goods and services actually rose by 1.1% last year. (Locally, the situation was more dire, with exports of containers from the twin San Pedro ports falling by 10.0% in 2015). Meanwhile, imports rose by 5.0% last year in response to strength of the U.S. economy. All in all, the trade picture is not all that bad. As for China and its likely impact on the U.S. economy, one should note that U.S. exports to China equate to less than one percent of GDP. As such, volatility in China’s economy should have a muted effect in the U.S.
Over the next two years, exports are expected to increase modestly (just over two percent), while imports should stay on track with last year’s growth rate. With imports exceeding exports by about thirty percent, net trade will make a net negative contribution to growth in the U.S. economy. However, it bears mentioning that strong imports (rather than weak exports) drive the negative contribution and are the result of strength in the domestic economy.
Labor: The labor market hit key milestones in 2015. First, the headline unemployment rate fell to 5.1% in August, which is equivalent to the economy’s long-run natural rate as gauged by the Congressional Budget office. Second, nonfarm jobs are on track to increase at a rate of 2.1% this year, which would be the fastest growth rate in the past 15 years.
Inflation: Despite the Federal Reserve Bank’s hopes for inflation approaching two percent, prices showed little movement in 2015, with the consumer price index rising by a scant 0.1%. The biggest sources of inflation in recent years have been increases in consumer and commodities prices, but weak global demand has kept a lid on those prices. Together with the price of oil, which has been dancing around the $30 mark as of this writing, there is little to ignite inflation. However, tightening labor markets should trigger wage increases over this year and next, resulting in inflation hitting 2.0% this year and 2.4% in 2017.
ECONOMIC POLICY
Fiscal Policy: Fiscal policy has been on automatic pilot in recent years. Although federal government expenditures have exerted a net drag on the economy over the last few years, an uptick in spending is expected this year and next. Meanwhile, there is not much chance that any changes in taxation policy will be forthcoming. Thus, despite 2016 being an election year, fiscal policy will have little effect on the direction and overall performance of the economy this year and next.
Monetary Policy: All eyes have been on the Federal Reserve Bank (the Fed) for some time now. With little happening in the fiscal policy arena, the Fed has been left to single-handedly pursue its dual mandate of achieving full employment in the labor market while maintaining price stability. Full employment was reached in recent months and prices are stable, but the rate of inflation is well below the Fed’s two percent target. Even so, the
The U.S. Economy
LAEDC Kyser Center for Economic Research 6 Economic Forecast, February 2016
Fed’s current task-at-hand is to normalize the federal funds rate which has effectively been at zero since late in 2008. That is, it would like to move the federal funds rate to a neutral position of 2.5 to 3% to be ready for future contingencies. In theory, a set of well-timed increases should get the Fed to that neutral position sometime in 2017 or 2018. But increases in U.S rates can wreak havoc on economies around the globe: Europe, Japan, China, and emerging economies. With that in mind, the Fed must balance the need to move forward with rate hikes against the damage such a move may inflict on other countries.
The U.S. Economy
LAEDC Kyser Center for Economic Research 7 Economic Forecast, February 2016
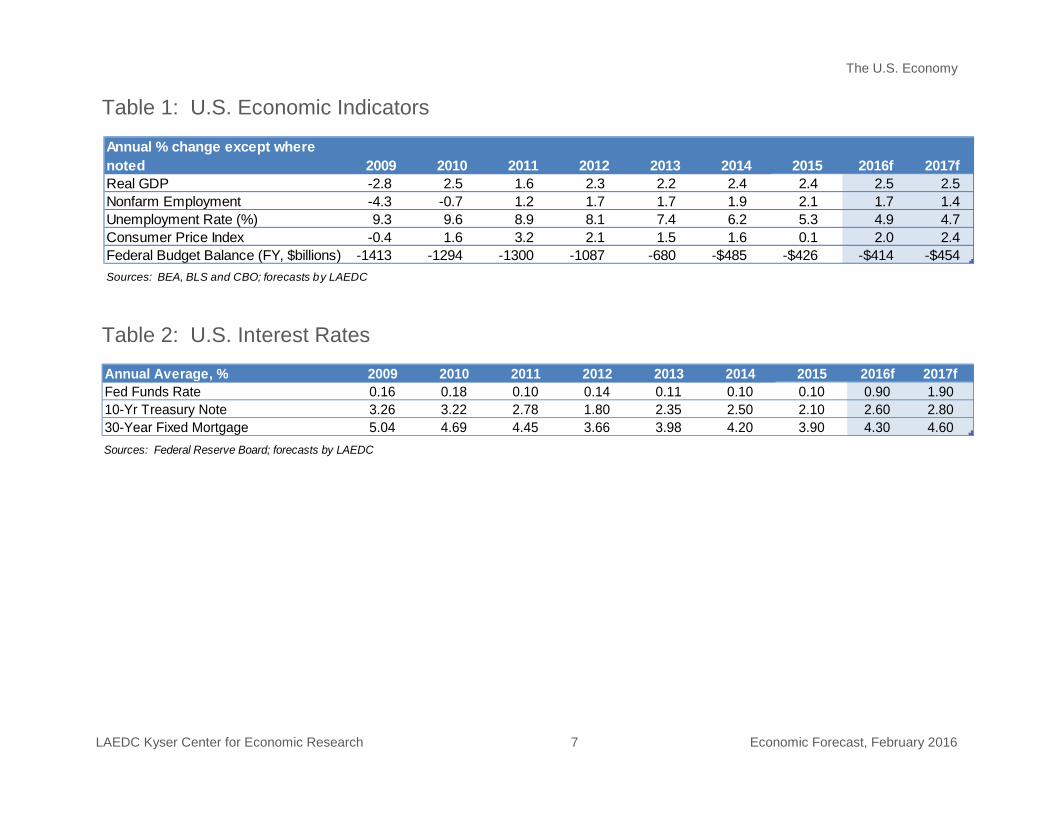
Annual % change except where noted 2009 2010 2011 2012 2013 2014 2015 2016f 2017fReal GDP -2.8 2.5 1.6 2.3 2.2 2.4 2.4 2.5 2.5Nonfarm Employment -4.3 -0.7 1.2 1.7 1.7 1.9 2.1 1.7 1.4Unemployment Rate (%) 9.3 9.6 8.9 8.1 7.4 6.2 5.3 4.9 4.7Consumer Price Index -0.4 1.6 3.2 2.1 1.5 1.6 0.1 2.0 2.4Federal Budget Balance (FY, $billions) -1413 -1294 -1300 -1087 -680 -$485 -$426 -$414 -$454Sources: BEA, BLS and CBO; forecasts by LAEDC
Table 1: U.S. Economic Indicators
Table 2: U.S. Interest Rates
Annual Average, % 2009 2010 2011 2012 2013 2014 2015 2016f 2017fFed Funds Rate 0.16 0.18 0.10 0.14 0.11 0.10 0.10 0.90 1.9010-Yr Treasury Note 3.26 3.22 2.78 1.80 2.35 2.50 2.10 2.60 2.8030-Year Fixed Mortgage 5.04 4.69 4.45 3.66 3.98 4.20 3.90 4.30 4.60Sources: Federal Reserve Board; forecasts by LAEDC
The U.S. Economy
LAEDC Kyser Center for Economic Research 8 Economic Forecast, February 2016
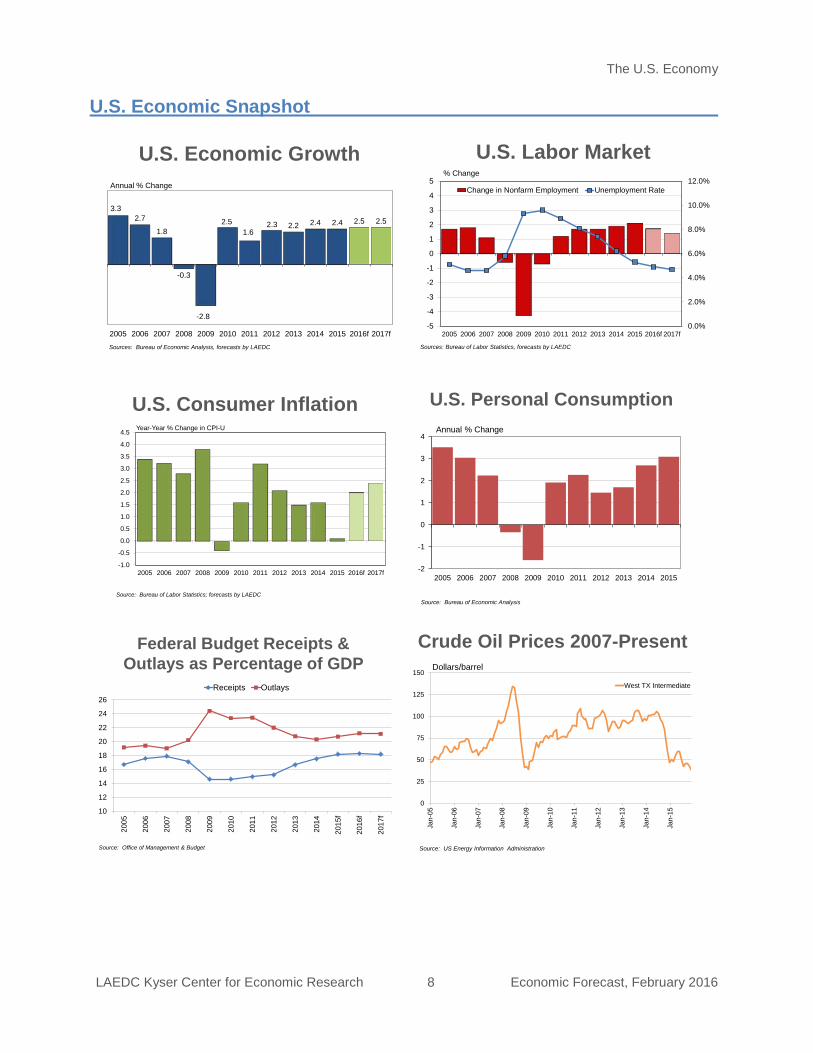
U.S. Economic Snapshot
U.S. Economic Growth
3.32.7
1.8
-0.3
-2.8
2.51.6
2.3 2.2 2.4 2.4 2.5 2.5
2005 2006 2007 2008 2009 2010 2011 2012 2013 2014 2015 2016f 2017fSources: Bureau of Economic Analysis, forecasts by LAEDC
Annual % Change
U.S. Labor Market
0.0%
2.0%
4.0%
6.0%
8.0%
10.0%
12.0%
-5
-4
-3
-2
-1
0
1
2
3
4
5
2005 2006 2007 2008 2009 2010 2011 2012 2013 2014 2015 2016f 2017f
Change in Nonfarm Employment Unemployment Rate
Sources: Bureau of Labor Statistics, forecasts by LAEDC
% Change
U.S. Consumer Inflation
-1.0
-0.5
0.0
0.5
1.0
1.5
2.0
2.5
3.0
3.5
4.0
4.5
2005 2006 2007 2008 2009 2010 2011 2012 2013 2014 2015 2016f 2017f
Year-Year % Change in CPI-U
Source: Bureau of Labor Statistics; forecasts by LAEDC
-2
-1
0
1
2
3
4
2005 2006 2007 2008 2009 2010 2011 2012 2013 2014 2015
U.S. Personal Consumption
Source: Bureau of Economic Analysis
Annual % Change
10
12
14
16
18
20
22
24
26
2005
2006
2007
2008
2009
2010
2011
2012
2013
2014
2015
f
2016
f
2017
f
Receipts Outlays
Federal Budget Receipts & Outlays as Percentage of GDP
Source: Office of Management & Budget
0
25
50
75
100
125
150
Jan-
05
Jan-
06
Jan-
07
Jan-
08
Jan-
09
Jan-
10
Jan-
11
Jan-
12
Jan-
13
Jan-
14
Jan-
15
West TX Intermediate
Crude Oil Prices 2007-Present
Source: US Energy Information Administration
Dollars/barrel
The International Economy
LAEDC Kyser Center for Economic Research 9 Economic Forecast, February 2016
THE INTERNATIONAL ECONOMY
Southern California’s ties to the international economy, and especially China, continued to strengthen in 2015. With the nation’s dominant customs district and the world’s 16th
CURRENT CONTEXT
largest economy, Southern California continues to be a principal gateway for international business activity, a leading destination for foreign direct investment (FDI), and a popular destination location, with 2015 seeing particularly strong growth in Chinese tourism.
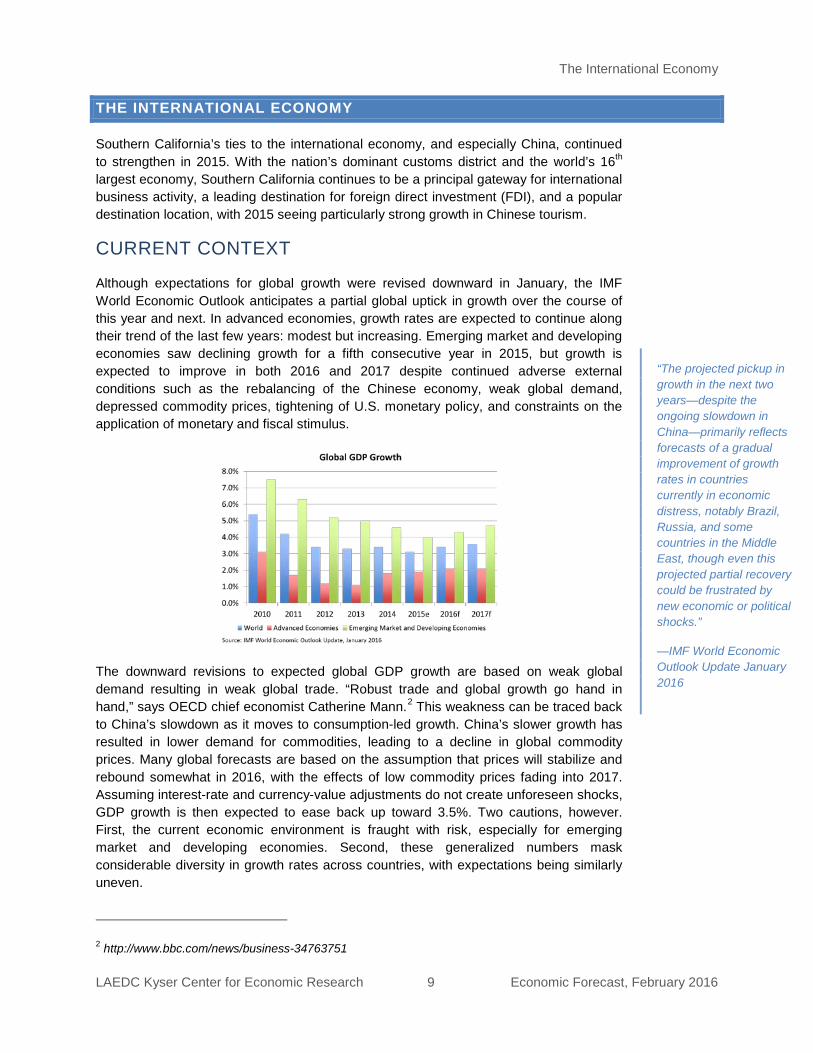
Although expectations for global growth were revised downward in January, the IMF World Economic Outlook anticipates a partial global uptick in growth over the course of this year and next. In advanced economies, growth rates are expected to continue along their trend of the last few years: modest but increasing. Emerging market and developing economies saw declining growth for a fifth consecutive year in 2015, but growth is expected to improve in both 2016 and 2017 despite continued adverse external conditions such as the rebalancing of the Chinese economy, weak global demand, depressed commodity prices, tightening of U.S. monetary policy, and constraints on the application of monetary and fiscal stimulus.
The downward revisions to expected global GDP growth are based on weak global demand resulting in weak global trade. “Robust trade and global growth go hand in hand,” says OECD chief economist Catherine Mann.2
2 http://www.bbc.com/news/business-34763751
This weakness can be traced back to China’s slowdown as it moves to consumption-led growth. China’s slower growth has resulted in lower demand for commodities, leading to a decline in global commodity prices. Many global forecasts are based on the assumption that prices will stabilize and rebound somewhat in 2016, with the effects of low commodity prices fading into 2017. Assuming interest-rate and currency-value adjustments do not create unforeseen shocks, GDP growth is then expected to ease back up toward 3.5%. Two cautions, however. First, the current economic environment is fraught with risk, especially for emerging market and developing economies. Second, these generalized numbers mask considerable diversity in growth rates across countries, with expectations being similarly uneven.
“The projected pickup in growth in the next two years—despite the ongoing slowdown in China—primarily reflects forecasts of a gradual improvement of growth rates in countries currently in economic distress, notably Brazil, Russia, and some countries in the Middle East, though even this projected partial recovery could be frustrated by new economic or political shocks.”
—IMF World Economic Outlook Update January 2016
The International Economy
LAEDC Kyser Center for Economic Research 10 Economic Forecast, February 2016
SELECTED COUNTRY AND REGION SUMMARIES3
CHINA
GDP GROWTH (%)
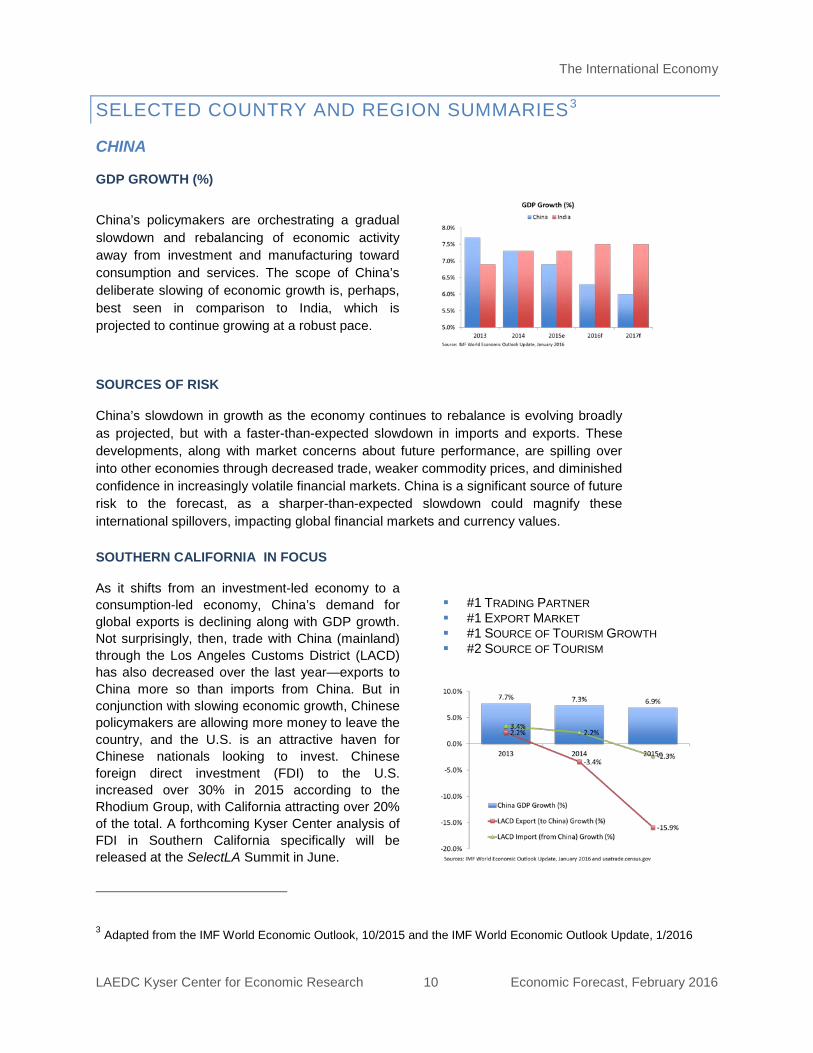
China’s policymakers are orchestrating a gradual slowdown and rebalancing of economic activity away from investment and manufacturing toward consumption and services. The scope of China’s deliberate slowing of economic growth is, perhaps, best seen in comparison to India, which is projected to continue growing at a robust pace.
SOURCES OF RISK
China’s slowdown in growth as the economy continues to rebalance is evolving broadly as projected, but with a faster-than-expected slowdown in imports and exports. These developments, along with market concerns about future performance, are spilling over into other economies through decreased trade, weaker commodity prices, and diminished confidence in increasingly volatile financial markets. China is a significant source of future risk to the forecast, as a sharper-than-expected slowdown could magnify these international spillovers, impacting global financial markets and currency values.
SOUTHERN CALIFORNIA IN FOCUS
As it shifts from an investment-led economy to a consumption-led economy, China’s demand for global exports is declining along with GDP growth. Not surprisingly, then, trade with China (mainland) through the Los Angeles Customs District (LACD) has also decreased over the last year—exports to China more so than imports from China. But in conjunction with slowing economic growth, Chinese policymakers are allowing more money to leave the country, and the U.S. is an attractive haven for Chinese nationals looking to invest. Chinese foreign direct investment (FDI) to the U.S. increased over 30% in 2015 according to the Rhodium Group, with California attracting over 20% of the total. A forthcoming Kyser Center analysis of FDI in Southern California specifically will be released at the SelectLA Summit in June.
#1 TRADING PARTNER #1 EXPORT MARKET #1 SOURCE OF TOURISM GROWTH #2 SOURCE OF TOURISM
3 Adapted from the IMF World Economic Outlook, 10/2015 and the IMF World Economic Outlook Update, 1/2016
The International Economy
LAEDC Kyser Center for Economic Research 11 Economic Forecast, February 2016
ASIA PACIFIC REGION
GDP GROWTH (%)
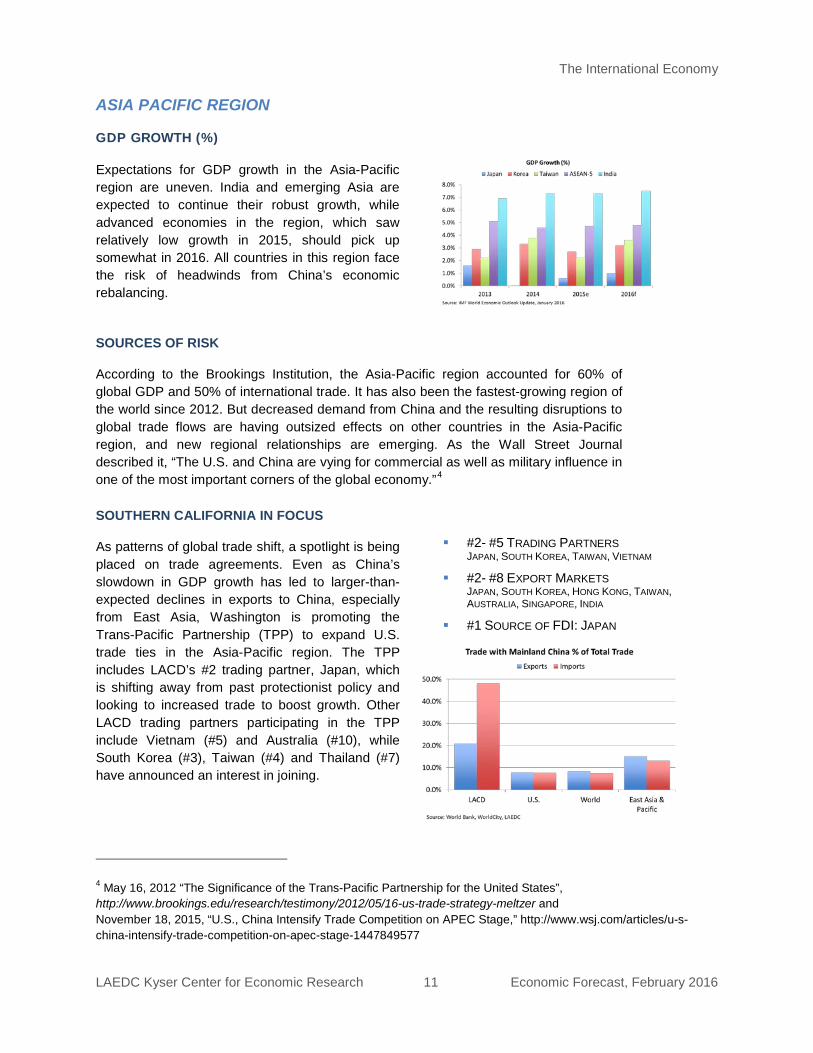
Expectations for GDP growth in the Asia-Pacific region are uneven. India and emerging Asia are expected to continue their robust growth, while advanced economies in the region, which saw relatively low growth in 2015, should pick up somewhat in 2016. All countries in this region face the risk of headwinds from China’s economic rebalancing.
SOURCES OF RISK
According to the Brookings Institution, the Asia-Pacific region accounted for 60% of global GDP and 50% of international trade. It has also been the fastest-growing region of the world since 2012. But decreased demand from China and the resulting disruptions to global trade flows are having outsized effects on other countries in the Asia-Pacific region, and new regional relationships are emerging. As the Wall Street Journal described it, “The U.S. and China are vying for commercial as well as military influence in one of the most important corners of the global economy.”4
SOUTHERN CALIFORNIA IN FOCUS
As patterns of global trade shift, a spotlight is being placed on trade agreements. Even as China’s slowdown in GDP growth has led to larger-than-expected declines in exports to China, especially from East Asia, Washington is promoting the Trans-Pacific Partnership (TPP) to expand U.S. trade ties in the Asia-Pacific region. The TPP includes LACD’s #2 trading partner, Japan, which is shifting away from past protectionist policy and looking to increased trade to boost growth. Other LACD trading partners participating in the TPP include Vietnam (#5) and Australia (#10), while South Korea (#3), Taiwan (#4) and Thailand (#7) have announced an interest in joining.
#2- #5 TRADING PARTNERS JAPAN, SOUTH KOREA, TAIWAN, VIETNAM
#2- #8 EXPORT MARKETS JAPAN, SOUTH KOREA, HONG KONG, TAIWAN, AUSTRALIA, SINGAPORE, INDIA
#1 SOURCE OF FDI: JAPAN
4 May 16, 2012 “The Significance of the Trans-Pacific Partnership for the United States”, http://www.brookings.edu/research/testimony/2012/05/16-us-trade-strategy-meltzer and November 18, 2015, “U.S., China Intensify Trade Competition on APEC Stage,” http://www.wsj.com/articles/u-s-china-intensify-trade-competition-on-apec-stage-1447849577
The International Economy
LAEDC Kyser Center for Economic Research 12 Economic Forecast, February 2016
U.K. AND EUROZONE
GDP GROWTH (%)
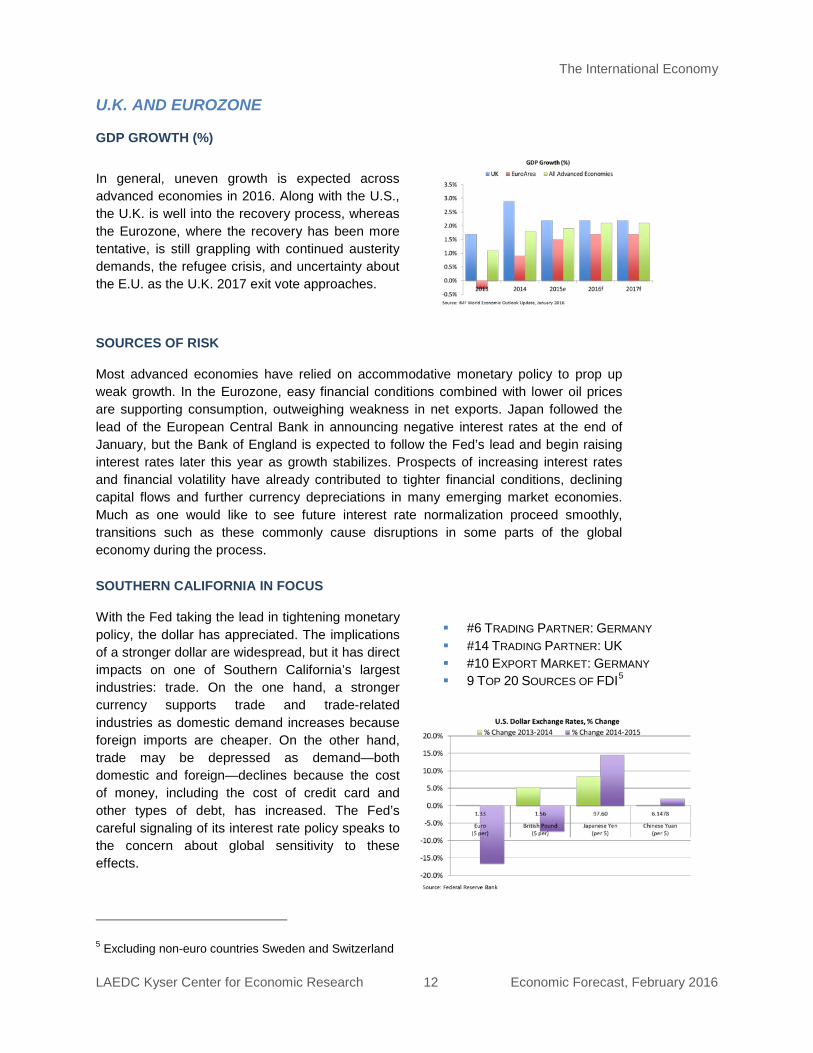
In general, uneven growth is expected across advanced economies in 2016. Along with the U.S., the U.K. is well into the recovery process, whereas the Eurozone, where the recovery has been more tentative, is still grappling with continued austerity demands, the refugee crisis, and uncertainty about the E.U. as the U.K. 2017 exit vote approaches.
SOURCES OF RISK
Most advanced economies have relied on accommodative monetary policy to prop up weak growth. In the Eurozone, easy financial conditions combined with lower oil prices are supporting consumption, outweighing weakness in net exports. Japan followed the lead of the European Central Bank in announcing negative interest rates at the end of January, but the Bank of England is expected to follow the Fed’s lead and begin raising interest rates later this year as growth stabilizes. Prospects of increasing interest rates and financial volatility have already contributed to tighter financial conditions, declining capital flows and further currency depreciations in many emerging market economies. Much as one would like to see future interest rate normalization proceed smoothly, transitions such as these commonly cause disruptions in some parts of the global economy during the process.
SOUTHERN CALIFORNIA IN FOCUS
With the Fed taking the lead in tightening monetary policy, the dollar has appreciated. The implications of a stronger dollar are widespread, but it has direct impacts on one of Southern California’s largest industries: trade. On the one hand, a stronger currency supports trade and trade-related industries as domestic demand increases because foreign imports are cheaper. On the other hand, trade may be depressed as demand—both domestic and foreign—declines because the cost of money, including the cost of credit card and other types of debt, has increased. The Fed’s careful signaling of its interest rate policy speaks to the concern about global sensitivity to these effects.
#6 TRADING PARTNER: GERMANY #14 TRADING PARTNER: UK #10 EXPORT MARKET: GERMANY 9 TOP 20 SOURCES OF FDI5
5 Excluding non-euro countries Sweden and Switzerland
The International Economy
LAEDC Kyser Center for Economic Research 13 Economic Forecast, February 2016
CANADA AND MEXICO
GDP GROWTH (%)
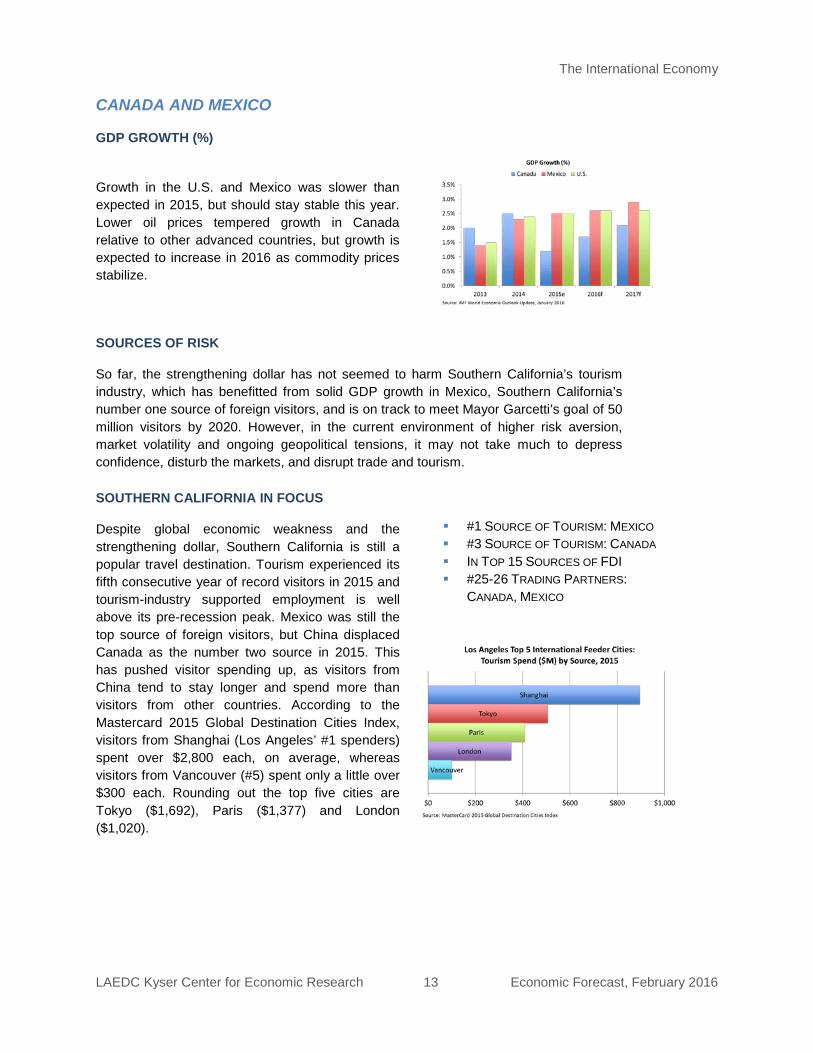
Growth in the U.S. and Mexico was slower than expected in 2015, but should stay stable this year. Lower oil prices tempered growth in Canada relative to other advanced countries, but growth is expected to increase in 2016 as commodity prices stabilize.
SOURCES OF RISK
So far, the strengthening dollar has not seemed to harm Southern California’s tourism industry, which has benefitted from solid GDP growth in Mexico, Southern California’s number one source of foreign visitors, and is on track to meet Mayor Garcetti’s goal of 50 million visitors by 2020. However, in the current environment of higher risk aversion, market volatility and ongoing geopolitical tensions, it may not take much to depress confidence, disturb the markets, and disrupt trade and tourism.
SOUTHERN CALIFORNIA IN FOCUS
Despite global economic weakness and the strengthening dollar, Southern California is still a popular travel destination. Tourism experienced its fifth consecutive year of record visitors in 2015 and tourism-industry supported employment is well above its pre-recession peak. Mexico was still the top source of foreign visitors, but China displaced Canada as the number two source in 2015. This has pushed visitor spending up, as visitors from China tend to stay longer and spend more than visitors from other countries. According to the Mastercard 2015 Global Destination Cities Index, visitors from Shanghai (Los Angeles’ #1 spenders) spent over $2,800 each, on average, whereas visitors from Vancouver (#5) spent only a little over $300 each. Rounding out the top five cities are Tokyo ($1,692), Paris ($1,377) and London ($1,020).
#1 SOURCE OF TOURISM: MEXICO #3 SOURCE OF TOURISM: CANADA IN TOP 15 SOURCES OF FDI #25-26 TRADING PARTNERS:
CANADA, MEXICO
The International Economy
LAEDC Kyser Center for Economic Research 14 Economic Forecast, February 2016
OIL AND COMMODITY PRODUCERS
GDP GROWTH (%)
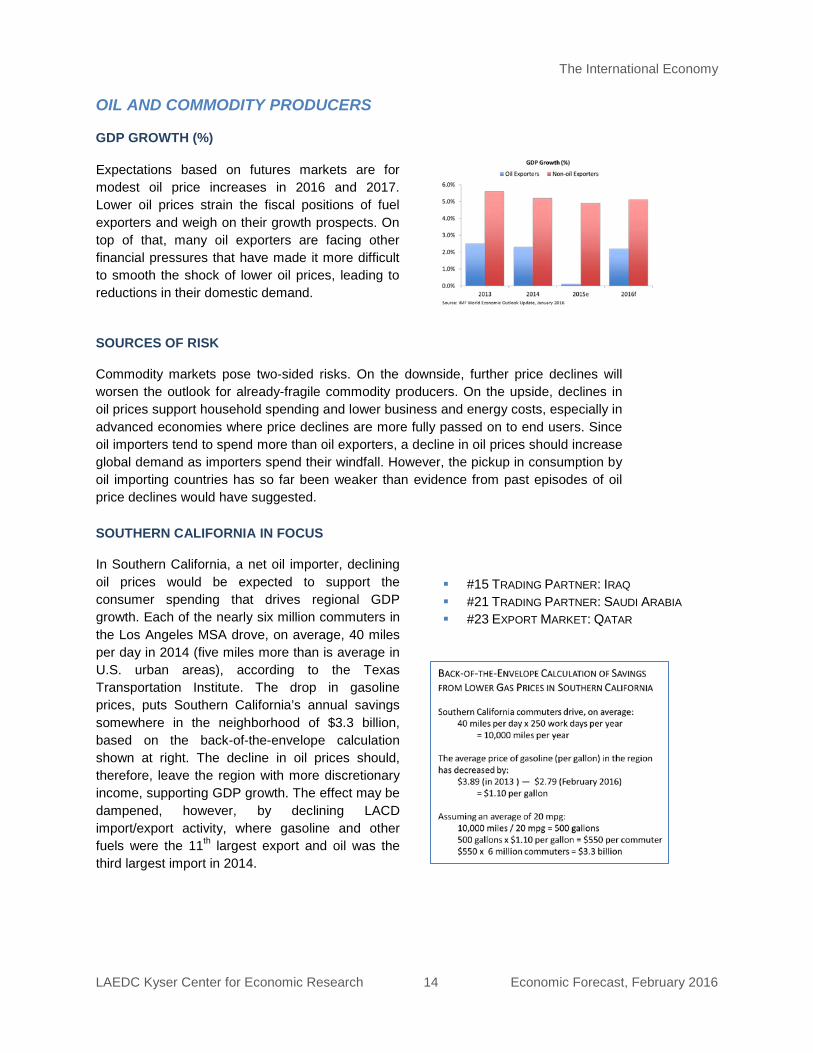
Expectations based on futures markets are for modest oil price increases in 2016 and 2017. Lower oil prices strain the fiscal positions of fuel exporters and weigh on their growth prospects. On top of that, many oil exporters are facing other financial pressures that have made it more difficult to smooth the shock of lower oil prices, leading to reductions in their domestic demand.
SOURCES OF RISK
Commodity markets pose two-sided risks. On the downside, further price declines will worsen the outlook for already-fragile commodity producers. On the upside, declines in oil prices support household spending and lower business and energy costs, especially in advanced economies where price declines are more fully passed on to end users. Since oil importers tend to spend more than oil exporters, a decline in oil prices should increase global demand as importers spend their windfall. However, the pickup in consumption by oil importing countries has so far been weaker than evidence from past episodes of oil price declines would have suggested.
SOUTHERN CALIFORNIA IN FOCUS
In Southern California, a net oil importer, declining oil prices would be expected to support the consumer spending that drives regional GDP growth. Each of the nearly six million commuters in the Los Angeles MSA drove, on average, 40 miles per day in 2014 (five miles more than is average in U.S. urban areas), according to the Texas Transportation Institute. The drop in gasoline prices, puts Southern California’s annual savings somewhere in the neighborhood of $3.3 billion, based on the back-of-the-envelope calculation shown at right. The decline in oil prices should, therefore, leave the region with more discretionary income, supporting GDP growth. The effect may be dampened, however, by declining LACD import/export activity, where gasoline and other fuels were the 11th largest export and oil was the third largest import in 2014.
#15 TRADING PARTNER: IRAQ #21 TRADING PARTNER: SAUDI ARABIA #23 EXPORT MARKET: QATAR
The International Economy
LAEDC Kyser Center for Economic Research 15 Economic Forecast, February 2016
RISK ASSESSMENT
Several factors could affect global economic growth in 2016. Political instability, immigration policy, commodity prices, export diversification, monetary policy normalization, increasing global demand, investment to accommodate aging populations and infrastructure, and reserve buffers against unexpected natural disasters (such as last year’s Ebola outbreak, the 7.8 magnitude earthquake in Nepal or worldwide flooding episodes), will all be important for keeping economic expectations on track across the globe in the coming year.
While many of the economic concerns of 2015 have carried over into 2016, so have several optimistic notes, too. China’s economic transition will take some time – measured in years, not in months – and there may be bumps in the road. But ultimately, it is moving to a path of slower but sustainable growth. U.S. relations with Cuba are normalizing, a nuclear deal was reached with Iran, Africa marked the one-year anniversary of no new cases of wild polio, the United Nations Climate Change Conference in Paris led to a 195-country agreement, and the list goes on. There are many reasons to be optimistic about 2016, so long as one or more of the many risks to the global growth forecasts do not derail expectations.
“Risks to the global outlook remain tilted to the downside and relate to ongoing adjustments in the global economy: a generalized slowdown in emerging market economics, China’s rebalancing, lower commodity prices, and the gradual exit from the extraordinarily accommodative monetary conditions in the United States. If these key challenges are not successfully managed, global growth could be derailed.”
—IMF World Economic Outlook Update January 2016
The International Economy
LAEDC Kyser Center for Economic Research 16 Economic Forecast, February 2016
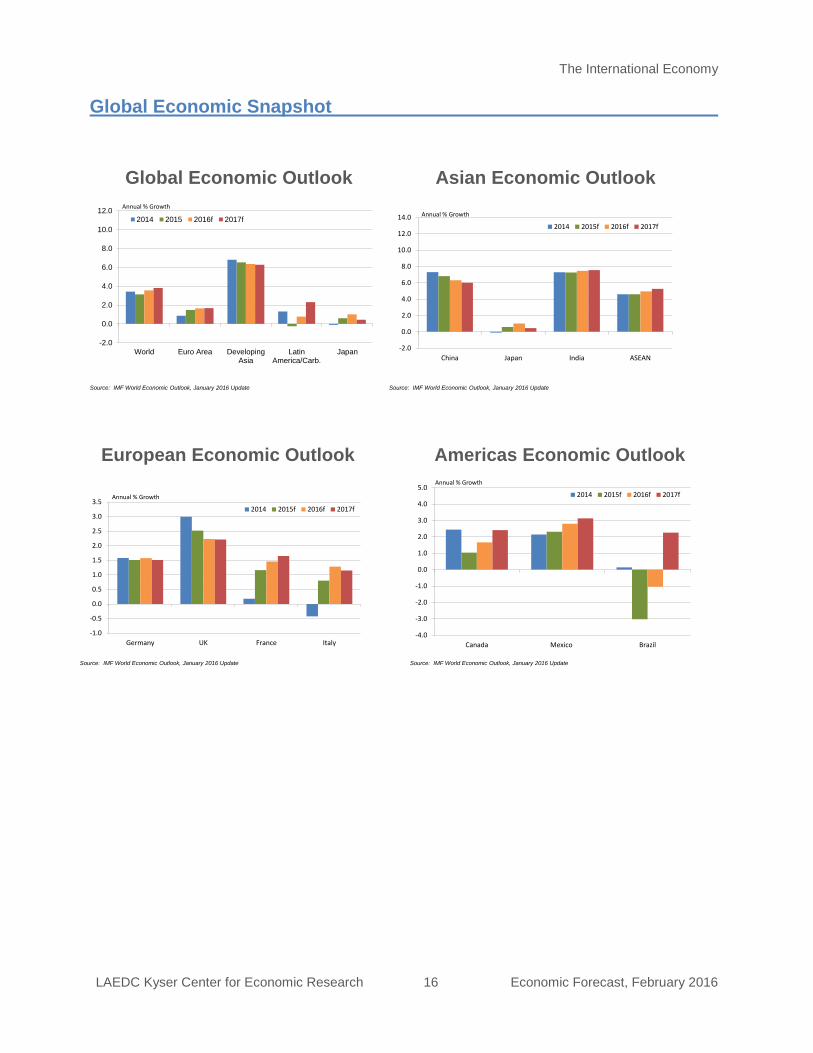
Global Economic Outlook
-2.0
0.0
2.0
4.0
6.0
8.0
10.0
12.0
World Euro Area DevelopingAsia
LatinAmerica/Carb.
Japan
2014 2015 2016f 2017f
Annual % Growth
Source: IMF World Economic Outlook, January 2016 Update
Asian Economic Outlook
-2.0
0.0
2.0
4.0
6.0
8.0
10.0
12.0
14.0
China Japan India ASEAN
2014 2015f 2016f 2017f
Annual % Growth
Source: IMF World Economic Outlook, January 2016 Update
European Economic Outlook
-1.0
-0.5
0.0
0.5
1.0
1.5
2.0
2.5
3.0
3.5
Germany UK France Italy
2014 2015f 2016f 2017f
Annual % Growth
Source: IMF World Economic Outlook, January 2016 Update
Americas Economic Outlook
-4.0
-3.0
-2.0
-1.0
0.0
1.0
2.0
3.0
4.0
5.0
Canada Mexico Brazil
2014 2015f 2016f 2017f
Annual % Growth
Source: IMF World Economic Outlook, January 2016 Update
Global Economic Snapshot
The International Economy
LAEDC Kyser Center for Economic Research 17 Economic Forecast, February 2016
“The constellation underpinning dollar appreciation over the past year or so is expected to remain in place for some time in the baseline forecast. It includes domestic demand strength relative to most other advanced economies, monetary policy divergence among major advanced economies, and an improved external position with lower oil prices. U.S. dollar appreciation against most currencies could thus continue, causing a lasting upswing in the dollar, as has happened previously. If this risk were to materialize, balance sheet and funding strains for dollar debtors could potentially more than offset trade benefits from real depreciation in some economies.”
—IMF World Economic Outlook October 2015
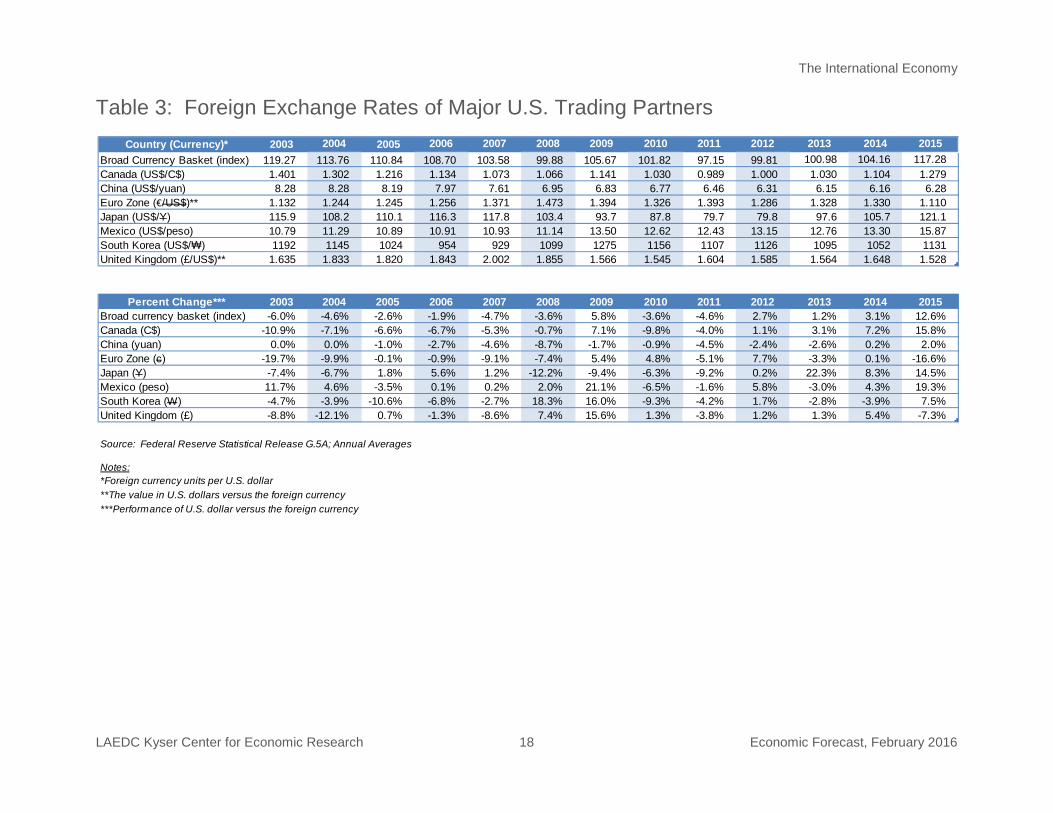
FOREIGN EXCHANGE RATES
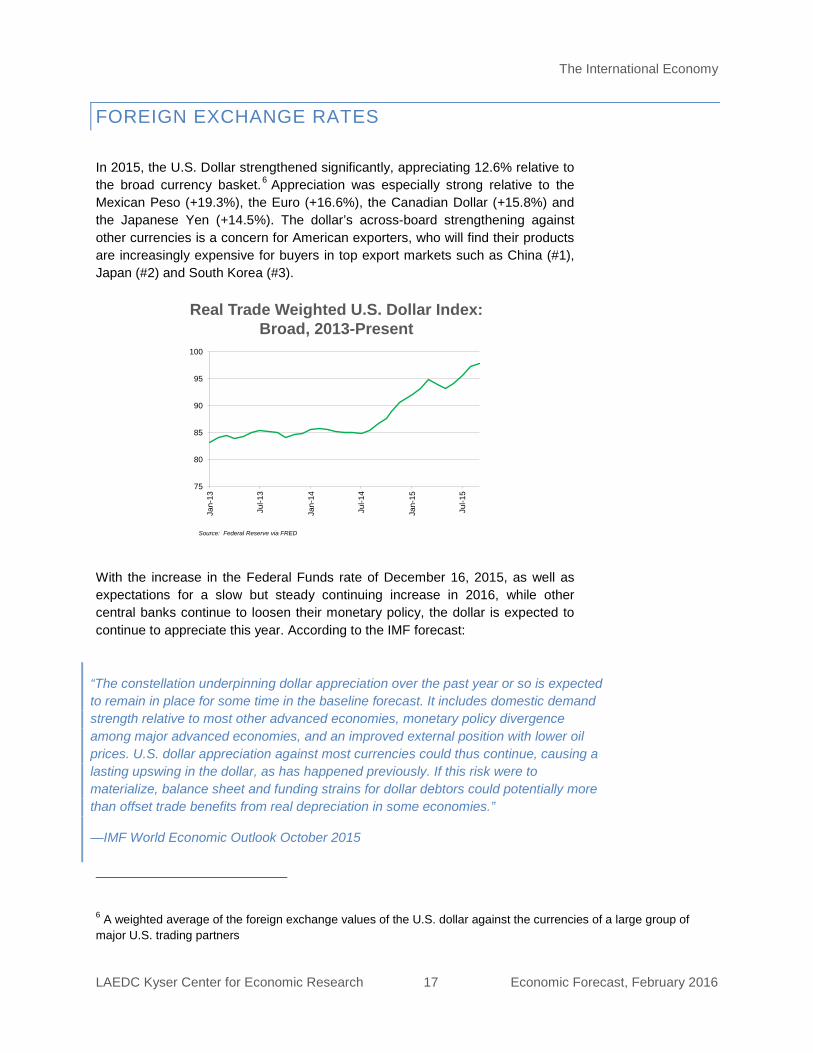
In 2015, the U.S. Dollar strengthened significantly, appreciating 12.6% relative to the broad currency basket.6
Appreciation was especially strong relative to the Mexican Peso (+19.3%), the Euro (+16.6%), the Canadian Dollar (+15.8%) and the Japanese Yen (+14.5%). The dollar’s across-board strengthening against other currencies is a concern for American exporters, who will find their products are increasingly expensive for buyers in top export markets such as China (#1), Japan (#2) and South Korea (#3).
With the increase in the Federal Funds rate of December 16, 2015, as well as expectations for a slow but steady continuing increase in 2016, while other central banks continue to loosen their monetary policy, the dollar is expected to continue to appreciate this year. According to the IMF forecast:
6 A weighted average of the foreign exchange values of the U.S. dollar against the currencies of a large group of major U.S. trading partners
75
80
85
90
95
100
Jan-
13
Jul-1
3
Jan-
14
Jul-1
4
Jan-
15
Jul-1
5
Real Trade Weighted U.S. Dollar Index: Broad, 2013-Present
Source: Federal Reserve via FRED
The International Economy
LAEDC Kyser Center for Economic Research 18 Economic Forecast, February 2016
Table 3: Foreign Exchange Rates of Major U.S. Trading Partners
Country (Currency)* 2003 2004 2005 2006 2007 2008 2009 2010 2011 2012 2013 2014 2015Broad Currency Basket (index) 119.27 113.76 110.84 108.70 103.58 99.88 105.67 101.82 97.15 99.81 100.98 104.16 117.28Canada (US$/C$) 1.401 1.302 1.216 1.134 1.073 1.066 1.141 1.030 0.989 1.000 1.030 1.104 1.279China (US$/yuan) 8.28 8.28 8.19 7.97 7.61 6.95 6.83 6.77 6.46 6.31 6.15 6.16 6.28Euro Zone (€/US$)** 1.132 1.244 1.245 1.256 1.371 1.473 1.394 1.326 1.393 1.286 1.328 1.330 1.110Japan (US$/Y) 115.9 108.2 110.1 116.3 117.8 103.4 93.7 87.8 79.7 79.8 97.6 105.7 121.1Mexico (US$/peso) 10.79 11.29 10.89 10.91 10.93 11.14 13.50 12.62 12.43 13.15 12.76 13.30 15.87South Korea (US$/₩) 1192 1145 1024 954 929 1099 1275 1156 1107 1126 1095 1052 1131United Kingdom (£/US$)** 1.635 1.833 1.820 1.843 2.002 1.855 1.566 1.545 1.604 1.585 1.564 1.648 1.528
Percent Change*** 2003 2004 2005 2006 2007 2008 2009 2010 2011 2012 2013 2014 2015Broad currency basket (index) -6.0% -4.6% -2.6% -1.9% -4.7% -3.6% 5.8% -3.6% -4.6% 2.7% 1.2% 3.1% 12.6%Canada (C$) -10.9% -7.1% -6.6% -6.7% -5.3% -0.7% 7.1% -9.8% -4.0% 1.1% 3.1% 7.2% 15.8%China (yuan) 0.0% 0.0% -1.0% -2.7% -4.6% -8.7% -1.7% -0.9% -4.5% -2.4% -2.6% 0.2% 2.0%Euro Zone (c) -19.7% -9.9% -0.1% -0.9% -9.1% -7.4% 5.4% 4.8% -5.1% 7.7% -3.3% 0.1% -16.6%Japan (Y) -7.4% -6.7% 1.8% 5.6% 1.2% -12.2% -9.4% -6.3% -9.2% 0.2% 22.3% 8.3% 14.5%Mexico (peso) 11.7% 4.6% -3.5% 0.1% 0.2% 2.0% 21.1% -6.5% -1.6% 5.8% -3.0% 4.3% 19.3%South Korea (W) -4.7% -3.9% -10.6% -6.8% -2.7% 18.3% 16.0% -9.3% -4.2% 1.7% -2.8% -3.9% 7.5%United Kingdom (£) -8.8% -12.1% 0.7% -1.3% -8.6% 7.4% 15.6% 1.3% -3.8% 1.2% 1.3% 5.4% -7.3%
Source: Federal Reserve Statistical Release G.5A; Annual Averages
Notes:*Foreign currency units per U.S. dollar **The value in U.S. dollars versus the foreign currency***Performance of U.S. dollar versus the foreign currency
The California Economy
LAEDC Kyser Center for Economic Research 19 Economic Forecast, February 2016
THE CALIFORNIA ECONOMY
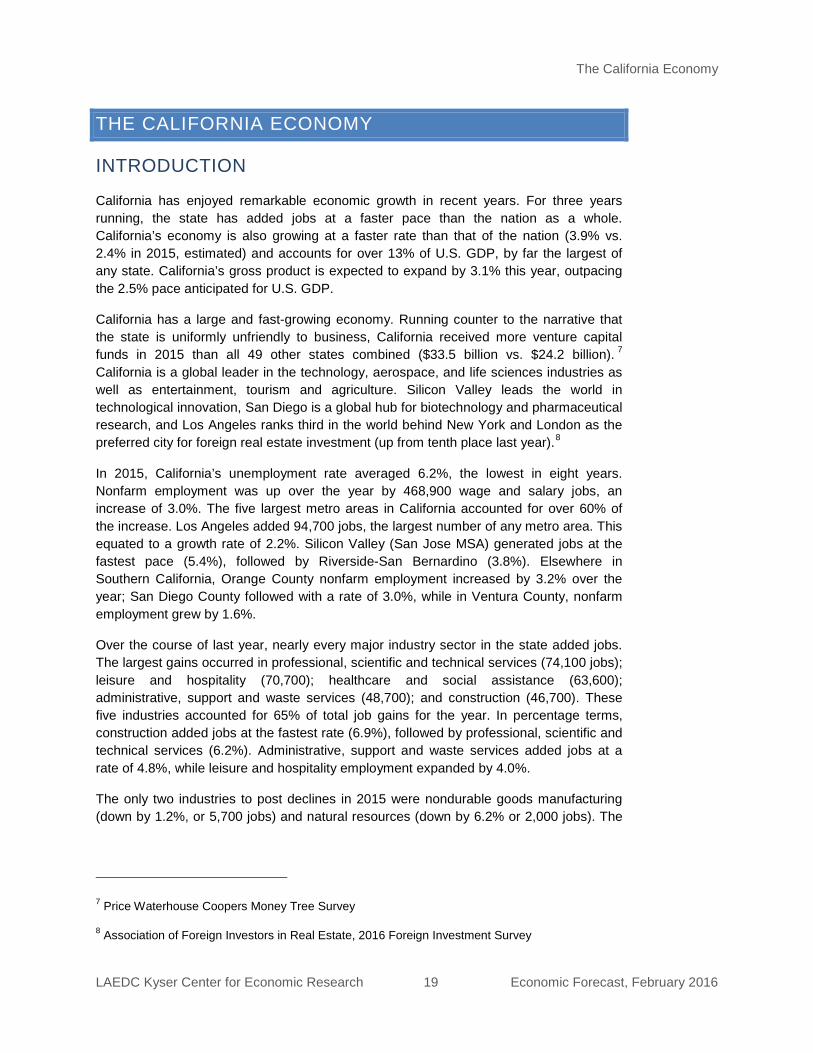
California has enjoyed remarkable economic growth in recent years. For three years running, the state has added jobs at a faster pace than the nation as a whole. California’s economy is also growing at a faster rate than that of the nation (3.9% vs. 2.4% in 2015, estimated) and accounts for over 13% of U.S. GDP, by far the largest of any state. California’s gross product is expected to expand by 3.1% this year, outpacing the 2.5% pace anticipated for U.S. GDP.
INTRODUCTION
California has a large and fast-growing economy. Running counter to the narrative that the state is uniformly unfriendly to business, California received more venture capital funds in 2015 than all 49 other states combined ($33.5 billion vs. $24.2 billion). 7 California is a global leader in the technology, aerospace, and life sciences industries as well as entertainment, tourism and agriculture. Silicon Valley leads the world in technological innovation, San Diego is a global hub for biotechnology and pharmaceutical research, and Los Angeles ranks third in the world behind New York and London as the preferred city for foreign real estate investment (up from tenth place last year).8
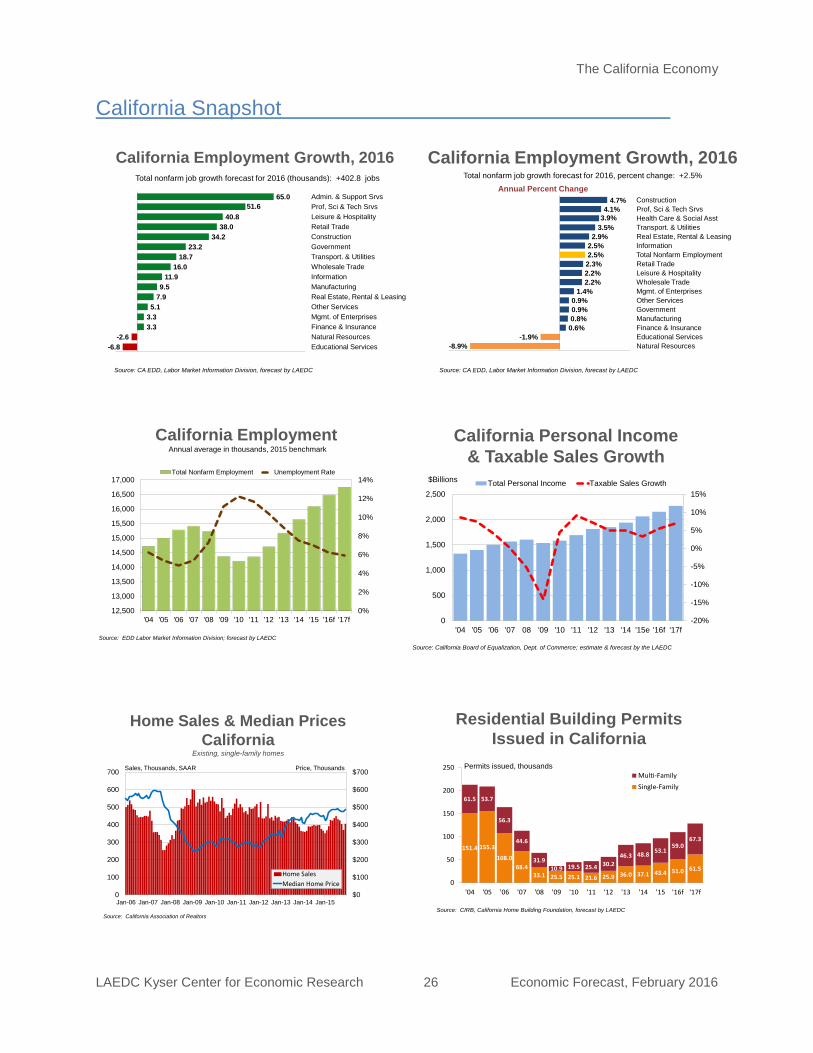
In 2015, California’s unemployment rate averaged 6.2%, the lowest in eight years. Nonfarm employment was up over the year by 468,900 wage and salary jobs, an increase of 3.0%. The five largest metro areas in California accounted for over 60% of the increase. Los Angeles added 94,700 jobs, the largest number of any metro area. This equated to a growth rate of 2.2%. Silicon Valley (San Jose MSA) generated jobs at the fastest pace (5.4%), followed by Riverside-San Bernardino (3.8%). Elsewhere in Southern California, Orange County nonfarm employment increased by 3.2% over the year; San Diego County followed with a rate of 3.0%, while in Ventura County, nonfarm employment grew by 1.6%.
Over the course of last year, nearly every major industry sector in the state added jobs. The largest gains occurred in professional, scientific and technical services (74,100 jobs); leisure and hospitality (70,700); healthcare and social assistance (63,600); administrative, support and waste services (48,700); and construction (46,700). These five industries accounted for 65% of total job gains for the year. In percentage terms, construction added jobs at the fastest rate (6.9%), followed by professional, scientific and technical services (6.2%). Administrative, support and waste services added jobs at a rate of 4.8%, while leisure and hospitality employment expanded by 4.0%.
The only two industries to post declines in 2015 were nondurable goods manufacturing (down by 1.2%, or 5,700 jobs) and natural resources (down by 6.2% or 2,000 jobs). The
7 Price Waterhouse Coopers Money Tree Survey
8 Association of Foreign Investors in Real Estate, 2016 Foreign Investment Survey
The California Economy
LAEDC Kyser Center for Economic Research 20 Economic Forecast, February 2016
decline in natural resources was due primarily to a pullback in energy sector investment resulting from low energy prices.
Unfortunately, California’s current prosperity has not been spread equally across the state. There are regions within the state where the labor markets continue to struggle with high unemployment and low growth. As of December 2015, 12 of California’s 58 counties still had an unemployment rate over ten percent, predominately agricultural or rural areas. The highest recorded unemployment rates were Imperial County at 19.6% and Colusa County at 19.3%.
TRENDS IN MAJOR INDUSTRIES
Aerospace and Technology: California’s technology sector consists of a combination of manufacturing and service industries in aerospace, information technology and biomedical technology. The aerospace and technology industries are concentrated in Los Angeles and Orange counties, San Diego County and the San Francisco/Silicon Valley region. Together, these regions make up the core of the state’s information, technology and innovation economy. They also receive the majority of the venture capital dollars that flow into California.
Technology employment exceeded 1.12 million workers in 2015, advancing past the previous peak of 1.06 million reached in 2014 by 5.0%. While overall employment is growing, most jobs are concentrated in the service sector. As late as 2004, employment was about evenly split between jobs in technology manufacturing and services, but as of 2015, employment in technology services had grown to over 66% of total sector employment.
Nearly half of the new technology jobs created in 2015 were in computer systems design (23,700 jobs) with management and consulting contributing 16,300 jobs. Smaller increases occurred elsewhere, except for aerospace product and parts manufacturing, which lost 1,900 jobs over the year. These trends are expected to continue with the largest gains occurring in technology services, while technology manufacturing employment remains flat or down marginally.
Agriculture: California is the nation’s leading producer of fruits, vegetables, nuts and dairy products. The state’s highest value commodities are milk, grapes, almonds and nursery plants. California’s top producing agricultural counties are Fresno, Tulare, Kern, Monterey and Merced, which together had a combined share of 44% of the total state farm receipts in 2014.
Agricultural and related products are also one of California’s largest exports to the rest of the world – already the slowing of China’s economy has made itself felt through a drop in demand for California almonds, dairy products and wine. The number of farm workers totaled 417,000 in 2015, which was 0.1% lower than recorded in 2014. Agricultural output in California increased by an estimated 2.9% in 2015 accounting for about 1.1% of the state’s gross product and 2.6% of civilian employment, both of which are consistent with recent trends.
The California Economy
LAEDC Kyser Center for Economic Research 21 Economic Forecast, February 2016
California’s 76,4009 farms and ranches generated cash receipts of $51.8 billion (inflation adjusted) in 2014 (latest data available), up by 3.6% compared with 2013 and a new record high in spite of California’s ongoing drought. Crop receipts edged down by 1.4% to $35.1 billion, while livestock receipts increased by 17.5% to $14.1 billion. California was also the top state in cash farm receipts in 2014 with 12.0% of the total for the U.S. In 2014, California ranked first among the 50 states in terms of net real farm income at $13.9 billion, or 16.7% of the national total.
According to the USDA, as of March 2015, over 97% of California’s $43 billion agricultural sector was experiencing severe, extreme or exceptional drought. California’s agricultural sector has proven exceptionally resilient but if this year’s winter El Niño storms are followed by more dry years, employment, which is already beginning to erode, will suffer further declines along with a drop in production as more land is left fallow. Researchers at UC Davis estimate that the drought cost the state economy $2.74 billion in 2015. 10
Health Care:
The health care industry continues to adjust to rising costs, rapidly evolving technologies and new regulations legislated by the Affordable Care Act. Over the past two years, a wave of consolidations has rippled through the industry as health care providers, insurers and large corporate customers formed partnerships and alliances in order to survive the shift to value-based (as opposed to volume-based) health care. Meanwhile, the expansion of health care technology has been explosive. Rapidly evolving technological advancements include not only diagnostic and treatment equipment, but also wearable tracking devices, patient centered care, and increased data demands and data security concerns.
The health care and social assistance industry is California’s largest private sector employer and one of the fastest growing. With over 2.1 million workers, this sector accounts for slightly more than 13% of the state’s 16.1 million wage and salary jobs. Over the course of 2015, health care added 63,600 jobs, an annual growth rate of 3.1%. By the close of 2016, health care employment is expected to post an even stronger annual increase of 3.9%, bringing total health care jobs up to 2.2 million across a range of skill and income levels.
Over the longer term, the health care industry must respond to the state’s growing population, a larger share of older residents and increased longevity.11 The challenge for California will be to manage the ongoing costs associated with demographic changes and expanded access to high quality health care.
9 California Department of Food and Agriculture
International Trade: The international trade sector is a significant part of California’s economy and a vital link in the nation’s trade network. The majority of the nation’s goods
10 Howitt, Richard, et al; “Economic Analysis of the 2015 Drought For California Agriculture”, UC Davis (August 17, 2014)
11 California’s senior population is expected to grow by 87%, or four million people, over the next two decades (PPIC August 2015)
The California Economy
LAEDC Kyser Center for Economic Research 22 Economic Forecast, February 2016
trade is highly concentrated in the corridors between its largest metropolitan areas. The Los Angeles-Riverside and San Francisco-San Jose trade corridors are among the largest in the U.S. Likewise, eight of the nation’s 25 most valuable international trade corridors are in California. This should come as no surprise given the state’s extensive trade infrastructure, and its geography and status as one of the nation’s largest consumer markets. 12
California is the second-largest goods exporting state in the country (just behind Texas, which is heavily dependent on energy-related exports). California’s largest export categories by value are computer products, transportation equipment (mainly aerospace-related), machinery, agricultural products, and chemicals (pharmaceuticals). Measured by value, imports outweigh exports by a two-to-one margin.
California is also a major exporter of services to the rest of the world. Film and music industry royalties are a major source of export revenues as are financial services, management and consulting services, entertainment services and information technology services.
Global trade slowed sharply in 2015. Last year, statewide two-way trade declined by 4.5% to $581 billion after reaching a record setting $608 billion in 2014. With expectations for subdued global growth in 2016, two-way trade in California is forecast to decline again this year (by 0.4%) before rebounding in 2017 to $632 billion (a gain of 9.2%) and achieving a new record high. The IMF names three key factors underlying low expectations for trade this year. The first is the slowdown and rebalancing of economic activity in China. The second is lower prices for energy and other commodities, and the third is the tightening of U.S. monetary policy against the backdrop of other major advanced economies continuing to ease policy.
Expectations for a recovery in global trade volumes over the next two years are based on U.S. and Eurozone growth, which will spur trade of both capital and consumer goods. The drag on global trade will also be reduced as conditions stabilize in China and as other Asian economies regain their footing.
Tourism: The multibillion dollar travel and tourism industry has achieved a prominent position in California’s economy. In 2014 (latest figures available), the gross product generated by California’s travel industry was $57.6 billion,13 or approximately 2.5% of total state gross product. California also had the largest share of the domestic travel market among all 50 states.
12 Tomer, Adie and Kane, Joseph; “Mapping Freight: The Highly Concentrated Nature of Goods Trade in the United States” Brookings Institute (November 2014)
Total visitor counts were up by an estimated 2.1% on an annual basis in 2015, slowing from a stronger growth rate of 3.5% in 2014. The growth of international visitors slowed considerably in 2015, to 2.2% (estimated) from 9.9% the previous year. The forecast for 2016 is an increase of 2.3% in total visits, with domestic travel forecast to increase by
13 “California Travel Impacts”; Dean Runyan Associates, VisitCalifornia.com (April 2015)
The California Economy
LAEDC Kyser Center for Economic Research 23 Economic Forecast, February 2016
2.1% and international travel by 4.2%.14 The slower pace of visitor growth last year is primarily attributable to the stronger dollar and slow domestic wage growth.
Expenditures by business and leisure travelers to the state totaled $120.7 billion in 2015, an increase of 2.7% compared with 2014. Domestic travelers accounted for $96.6 billion, while international visitors spent $24.1 billion. On average, hotel occupancy rates closed in on 75% in 2015, while increased demand, lack of new hotel construction and high occupancy rates drove revenue per room to $112 from $102 in 2014.15
All of California’s major tourism markets are expected to see gains this year and next. Continuing improvements in the labor markets, income growth and rising consumer confidence will support higher household spending, which in turn suggests solid near-term growth for the state’s travel and tourism industry in spite the stronger dollar and uneasiness abroad.
Leisure and hospitality jobs account for about 11% of all wage and salary jobs in California. While a significant part of leisure and hospitality activity is associated with tourism, many of these jobs serve the local population more so than the region’s tourists and business travelers. Jobs in this industry include lodging, food services, the performing arts, museums, amusement parks and gambling establishments. Leisure and hospitality employment grew by 4.0% in 2015 to 1.8 million jobs, with an additional expected gain of 2.2% in 2016. Payrolls continue to grow the fastest at restaurants and bars, which account for over 70% of all leisure and hospitality employment.
Construction employment saw substantial growth in 2015, growing by 6.9% to 722,100 jobs. Employment gains in recent years have finally started to offset the 373,900 construction jobs lost during the recession. Construction employment is expected to grow by an additional 4.7% this year with a 5.5% gain projected for 2017, bringing California construction employment to within 14% of the pre-downturn peak.
Construction: Construction activity and employment in 2015 posted another welcome increase after struggling in the years during and immediately following the Great Recession. New office construction continues to lag because of elevated vacancy rates in many regions of the state, but industrial construction is gaining momentum, especially in the goods movement and distribution and technology sectors. Nonresidential construction permits in 2015 rose by 4.3% to $24.7 billion and are expected to increase by 9.3% this year. New home permits, which showed a moderate gain in 2015 (12.4%), are expected to accelerate slightly this year rising to 110,000 permitted units, an increase of 14.0%.
14 Tourism Economics (July 2015), VisitCalifornia.com
15 2016 STR, Inc, VisitCalifornia.com
The California Economy
LAEDC Kyser Center for Economic Research 24 Economic Forecast, February 2016
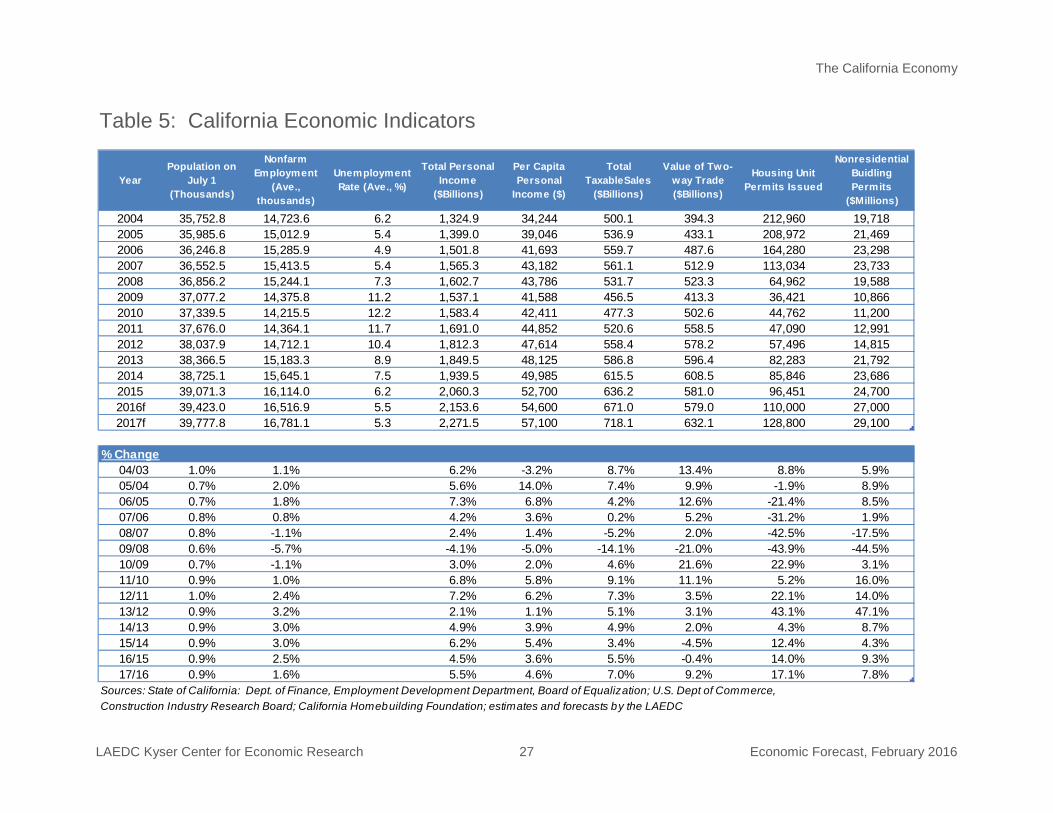
On many levels, California’s economy is doing very well. Following a 3.0% increase in 2015, nonfarm jobs are expected to grow by 2.5% in 2016, slowing to 1.6% in 2017. The unemployment rate averaged 6.2% last year and is expected to decline to 5.5% in 2016 (the long-run average since 1990 is 7.5%). With further improvements anticipated for the labor market, personal income and total taxable sales should increase by 4.5% and 5.5% respectively this year, with additional gains expected in 2017.
LOOKING AHEAD
In addition to a relatively strong employment outlook, California has made significant headway in setting its fiscal house in order. The state’s finances have stabilized, and after years of deficits, the General Fund is expected to end the current fiscal year with a cash surplus for the third consecutive year. California’s bond rating has also improved (although the state still ranks among the bottom three – only New Jersey and Illinois have a lower rating), saving the General Fund millions of dollars per year in borrowing costs. In January, Governor Brown proposed a 2016-17 budget that would bring the state’s cash reserves up to $10.2 billion by the end of the next fiscal year while increasing spending on infrastructure and education. Although passing a budget is in the hands of the Legislature, the Governor has communicated his position that planning for the next downturn is necessary to protect the remarkable economic progress California has achieved in recent years.
At the same time, a number of persistent problems continue to defy resolution. The unfunded liability of state retiree health care costs (currently at $74.1 billion) remains a concern. Moreover, it is not yet certain how much the Legislature will budget to fund critical and long deferred infrastructure projects and maintenance. There is also a severe shortage of housing (affordable and otherwise) particularly in the metro areas that are experiencing the fastest rates of job growth. At the same time, many of California’s inland and rural regions have not shared in the economic growth enjoyed by the state’s larger coastal metro areas. Additionally, California’s poverty rate remains depressingly high, 16.4% by official measures and as high as 21% if California’s high cost of living is factored in.16
Still, most regions in the state have regained all of the jobs lost during the recession or are very close to doing so. Expanding the benefits of the state’s economic growth to a larger share of the population is the next big step. Meeting this challenge will require attracting skilled workers to the state, increasing college enrollment and completion rates, upgrading the state’s physical infrastructure, and careful management of California’s finances and water resources.
16 “Poverty in California”, Public Policy Institute of California (December 2015)
The California Economy
LAEDC Kyser Center for Economic Research 25 Economic Forecast, February 2016
Rank Country/State/RegionNominal GDP 2015(e)
$US Billions
Nominal 2014-2015 % Change
Real 2014-2015 % Change
Nominal Per Capita Income
2015(e)1 United States $17,968.2 3.4% 2.4% $55,9042 China $11,384.8 9.9% 6.8% $8,2803 Japan $4,116.2 -10.6% 0.6% $32,4814 Germany $3,371.0 -13.0% 1.5% $41,2675 United Kingdom $2,864.9 -2.9% 2.5% $44,118
California $2,430.3 5.4% 3.9% $52,5696 France $2,422.6 -14.5% 1.2% $37,7287 India $2,182.6 6.4% 7.3% $1,6888 Italy $1,819.0 -15.3% 0.8% $29,8479 Brazil $1,799.6 -23.3% -3.0% $8,80210 Canada $1,572.8 -11.9% 1.0% $43,93511 Korea $1,393.0 -1.2% 2.7% $27,51312 Australia $1,240.8 -14.0% 2.4% $51,64213 Russia $1,235.9 -33.6% -3.8% $8,44714 Spain $1,221.4 -13.2% 3.1% $26,32715 Mexico $1,161.5 -10.0% 2.3% $9,592
L.A. 5-County Region $1,093.4 4.4% 2.7% $58,42616 Indonesia $872.6 -1.8% 4.7% $3,41617 Netherlands $750.8 -14.8% 1.8% $44,33318 Turkey $722.2 -9.5% 3.0% $9,29019 Switzerland $677.0 -3.8% 1.0% $82,178
Los Angeles County $664.2 4.1% 2.4% $49,77220 Saudi Arabia $632.1 -15.3% 3.4% $20,13921 Argentina $578.7 6.6% 0.4% $13,42822 Taiwan $518.8 -2.0% 2.2% $22,08323 Nigeria $493.0 -14.1% 4.0% $2,75824 Sweden $483.7 -15.2% 2.8% $48,96625 Poland $481.2 -12.2% 3.5% $12,662
Note: Figures based on market exchange ratesSource: IMF World Economic Outlook (WEO), January 2016
Bureau of Economic Analysis; IHS Global Insight
GROSS PRODUCT COMPARISONS
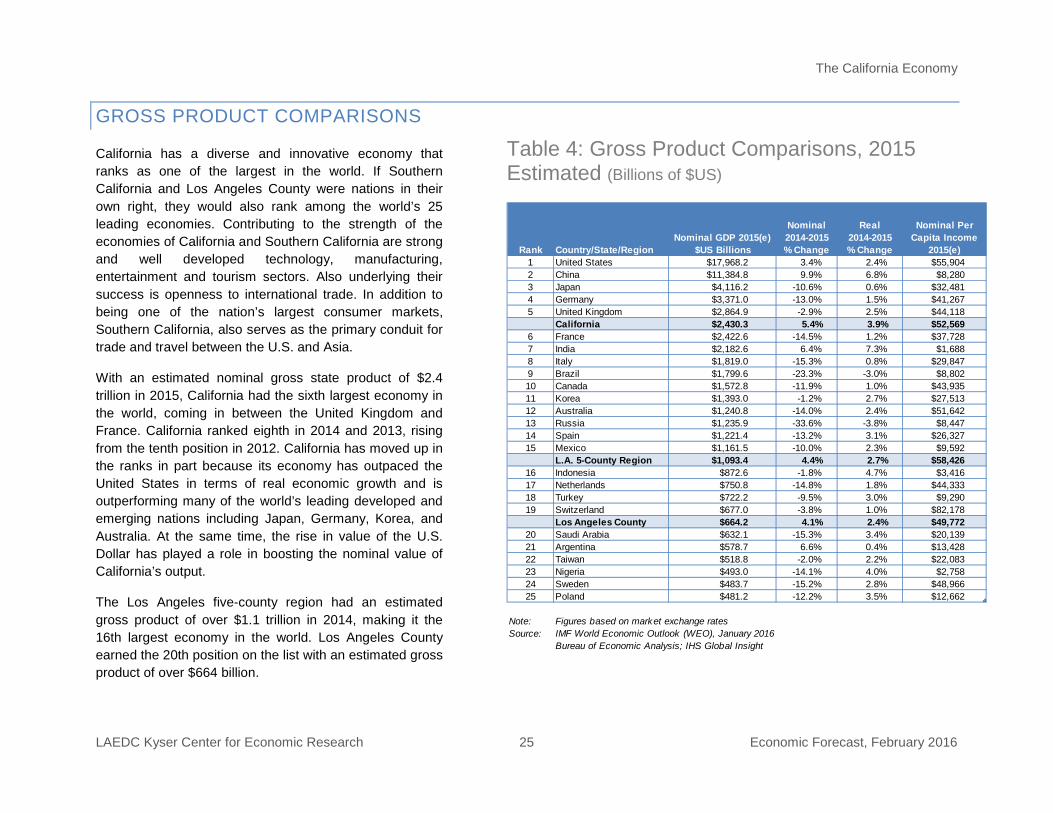
California has a diverse and innovative economy that ranks as one of the largest in the world. If Southern California and Los Angeles County were nations in their own right, they would also rank among the world’s 25 leading economies. Contributing to the strength of the economies of California and Southern California are strong and well developed technology, manufacturing, entertainment and tourism sectors. Also underlying their success is openness to international trade. In addition to being one of the nation’s largest consumer markets, Southern California, also serves as the primary conduit for trade and travel between the U.S. and Asia.
With an estimated nominal gross state product of $2.4 trillion in 2015, California had the sixth largest economy in the world, coming in between the United Kingdom and France. California ranked eighth in 2014 and 2013, rising from the tenth position in 2012. California has moved up in the ranks in part because its economy has outpaced the United States in terms of real economic growth and is outperforming many of the world’s leading developed and emerging nations including Japan, Germany, Korea, and Australia. At the same time, the rise in value of the U.S. Dollar has played a role in boosting the nominal value of California’s output.
The Los Angeles five-county region had an estimated gross product of over $1.1 trillion in 2014, making it the 16th largest economy in the world. Los Angeles County earned the 20th position on the list with an estimated gross product of over $664 billion.
Table 4: Gross Product Comparisons, 2015 Estimated (Billions of $US)
The California Economy
LAEDC Kyser Center for Economic Research 26 Economic Forecast, February 2016
California Employment Growth, 2016
-6.8-2.6
3.33.35.1
7.99.5
11.916.0
18.723.2
34.238.0
40.851.6
65.0
-10.0 0.0 10.0 20.0 30.0 40.0 50.0 60.0 70.0 80.0
Educational ServicesNatural ResourcesFinance & InsuranceMgmt. of EnterprisesOther ServicesReal Estate, Rental & LeasingManufacturingInformationWholesale TradeTransport. & UtilitiesGovernmentConstructionRetail TradeLeisure & HospitalityProf, Sci & Tech SrvsAdmin. & Support Srvs
Source: CA EDD, Labor Market Information Division, forecast by LAEDC
Total nonfarm job growth forecast for 2016 (thousands): +402.8 jobs
California Employment Growth, 2016
-8.9%-1.9%
0.6%0.8%0.9%0.9%
1.4%2.2%2.2%2.3%2.5%2.5%
2.9%3.5%3.9%4.1%
4.7%
-11.0% -9.0% -7.0% -5.0% -3.0% -1.0% 1.0% 3.0% 5.0% 7.0%
Natural ResourcesEducational ServicesFinance & InsuranceManufacturingGovernmentOther ServicesMgmt. of EnterprisesWholesale TradeLeisure & HospitalityRetail TradeTotal Nonfarm EmploymentInformationReal Estate, Rental & LeasingTransport. & UtilitiesHealth Care & Social AsstProf, Sci & Tech SrvsConstruction
Source: CA EDD, Labor Market Information Division, forecast by LAEDC
Annual Percent ChangeTotal nonfarm job growth forecast for 2016, percent change: +2.5%
California Employment
0%
2%
4%
6%
8%
10%
12%
14%
12,500
13,000
13,500
14,000
14,500
15,000
15,500
16,000
16,500
17,000
'04 '05 '06 '07 '08 '09 '10 '11 '12 '13 '14 '15 '16f '17f
Total Nonfarm Employment Unemployment Rate
Source: EDD Labor Market Information Division; forecast by LAEDC
Annual average in thousands, 2015 benchmarkCalifornia Personal Income
& Taxable Sales Growth
-20%
-15%
-10%
-5%
0%
5%
10%
15%
0
500
1,000
1,500
2,000
2,500
'04 '05 '06 '07 08 '09 '10 '11 '12 '13 '14 '15e '16f '17f
Total Personal Income Taxable Sales Growth$Billions
Source: California Board of Equalization, Dept. of Commerce; estimate & forecast by the LAEDC
California Snapshot
$0
$100
$200
$300
$400
$500
$600
$700
0
100
200
300
400
500
600
700
Jan-06 Jan-07 Jan-08 Jan-09 Jan-10 Jan-11 Jan-12 Jan-13 Jan-14 Jan-15
Home SalesMedian Home Price
Home Sales & Median Prices California
Existing, single-family homes
Sales, Thousands, SAAR Price, Thousands
Source: California Association of Realtors
Residential Building Permits Issued in California
151.4 155.3
108.068.4
33.1 25.5 25.1 21.6 25.9 36.0 37.1 43.4 51.0 61.5
61.5 53.7
56.3
44.6
31.910.9 19.5 25.4 30.2
46.3 48.8 53.159.0
67.3
0
50
100
150
200
250
'04 '05 '06 '07 '08 '09 '10 '11 '12 '13 '14 '15 '16f '17f
Multi-FamilySingle-Family
Permits issued, thousands
Source: CIRB, California Home Building Foundation, forecast by LAEDC
The California Economy
LAEDC Kyser Center for Economic Research 27 Economic Forecast, February 2016
Table 5: California Economic Indicators
YearPopulation on
July 1 (Thousands)
Nonfarm Employment
(Ave., thousands)
Unemployment Rate (Ave., %)
Total Personal Income
($Billions)
Per Capita Personal
Income ($)
Total TaxableSales
($Billions)
Value of Two-way Trade ($Billions)
Housing Unit Permits Issued
Nonresidential Buidling Permits
($Millions)
2004 35,752.8 14,723.6 6.2 1,324.9 34,244 500.1 394.3 212,960 19,7182005 35,985.6 15,012.9 5.4 1,399.0 39,046 536.9 433.1 208,972 21,4692006 36,246.8 15,285.9 4.9 1,501.8 41,693 559.7 487.6 164,280 23,2982007 36,552.5 15,413.5 5.4 1,565.3 43,182 561.1 512.9 113,034 23,7332008 36,856.2 15,244.1 7.3 1,602.7 43,786 531.7 523.3 64,962 19,5882009 37,077.2 14,375.8 11.2 1,537.1 41,588 456.5 413.3 36,421 10,8662010 37,339.5 14,215.5 12.2 1,583.4 42,411 477.3 502.6 44,762 11,2002011 37,676.0 14,364.1 11.7 1,691.0 44,852 520.6 558.5 47,090 12,9912012 38,037.9 14,712.1 10.4 1,812.3 47,614 558.4 578.2 57,496 14,8152013 38,366.5 15,183.3 8.9 1,849.5 48,125 586.8 596.4 82,283 21,7922014 38,725.1 15,645.1 7.5 1,939.5 49,985 615.5 608.5 85,846 23,6862015 39,071.3 16,114.0 6.2 2,060.3 52,700 636.2 581.0 96,451 24,7002016f 39,423.0 16,516.9 5.5 2,153.6 54,600 671.0 579.0 110,000 27,0002017f 39,777.8 16,781.1 5.3 2,271.5 57,100 718.1 632.1 128,800 29,100
% Change Column1 Column2 Column3 Column4 Column5 Column6 Column7 Column8 Column904/03 1.0% 1.1% 6.2% -3.2% 8.7% 13.4% 8.8% 5.9%05/04 0.7% 2.0% 5.6% 14.0% 7.4% 9.9% -1.9% 8.9%06/05 0.7% 1.8% 7.3% 6.8% 4.2% 12.6% -21.4% 8.5%07/06 0.8% 0.8% 4.2% 3.6% 0.2% 5.2% -31.2% 1.9%08/07 0.8% -1.1% 2.4% 1.4% -5.2% 2.0% -42.5% -17.5%09/08 0.6% -5.7% -4.1% -5.0% -14.1% -21.0% -43.9% -44.5%10/09 0.7% -1.1% 3.0% 2.0% 4.6% 21.6% 22.9% 3.1%11/10 0.9% 1.0% 6.8% 5.8% 9.1% 11.1% 5.2% 16.0%12/11 1.0% 2.4% 7.2% 6.2% 7.3% 3.5% 22.1% 14.0%13/12 0.9% 3.2% 2.1% 1.1% 5.1% 3.1% 43.1% 47.1%14/13 0.9% 3.0% 4.9% 3.9% 4.9% 2.0% 4.3% 8.7%15/14 0.9% 3.0% 6.2% 5.4% 3.4% -4.5% 12.4% 4.3%16/15 0.9% 2.5% 4.5% 3.6% 5.5% -0.4% 14.0% 9.3%17/16 0.9% 1.6% 5.5% 4.6% 7.0% 9.2% 17.1% 7.8%
Sources: State of California: Dept. of Finance, Employment Development Department, Board of Equalization; U.S. Dept of Commerce, Construction Industry Research Board; California Homebuilding Foundation; estimates and forecasts by the LAEDC
The California Economy
LAEDC Kyser Center for Economic Research 28 Economic Forecast, February 2016
Year Total Nonfarm Employment
Natural Resources
Construction Manufacturing M fg. -- Durable
M fg .-- Nondurable
Wholesale Trade
Retail Trade Transport. & Utilities
Information
2004 14,723.6 22.8 850.4 1,523.5 966.1 557.4 653.0 1,617.8 482.8 482.42005 15,012.9 23.6 905.3 1,505.2 959.4 545.7 673.6 1,659.3 487.1 473.62006 15,285.9 25.1 933.7 1,490.9 948.3 542.6 700.3 1,680.1 496.1 466.12007 15,413.5 26.7 892.6 1,465.4 929.0 536.4 715.3 1,689.9 507.7 471.12008 15,244.1 28.7 787.7 1,426.7 901.1 525.6 703.5 1,640.9 504.9 476.12009 14,375.8 26.1 623.1 1,283.6 800.6 483.0 645.3 1,522.5 474.5 441.32010 14,215.5 26.8 559.8 1,244.0 773.1 470.8 644.0 1,517.7 466.3 429.02011 14,364.1 28.8 561.3 1,250.1 781.0 469.1 657.9 1,546.6 474.3 430.62012 14,712.1 30.5 589.9 1,254.7 784.0 470.7 675.5 1,571.3 487.3 435.12013 15,183.3 30.6 637.3 1,256.3 783.5 472.8 693.8 1,597.0 502.8 448.62014 15,645.1 31.3 675.4 1,269.6 794.2 475.4 715.1 1,633.8 522.2 457.92015 16,114.0 29.4 722.1 1,271.0 801.3 469.7 738.7 1,669.9 541.5 472.92016f 16,516.9 26.7 756.2 1,280.6 807.9 472.7 754.7 1,707.9 560.2 484.82017f 16,781.1 27.4 798.0 1,297.4 822.9 474.5 768.0 1,710.6 576.1 482.7
YearFinance & Insurance
Real Estate, Rental & Leasing
Prof, Sci & Tech Srvs
Mgmt. of Enterprises
Admin. & Support Srvs
Educational Services
Health Care & Social Asst
Leisure & Hospitality Other Services Government
2004 618.8 276.4 918.9 231.4 947.8 262.9 1,493.9 1,439.4 503.9 2,397.72005 636.6 283.6 970.2 222.8 969.0 272.2 1,530.1 1,475.2 505.5 2,420.22006 639.3 288.5 1,026.4 213.8 1,004.4 277.6 1,565.4 1,519.0 507.1 2,452.32007 613.1 283.5 1,060.1 208.8 998.9 289.3 1,624.0 1,560.4 512.2 2,494.62008 566.0 275.9 1,079.1 209.4 952.5 300.6 1,689.3 1,572.6 511.3 2,518.92009 528.1 254.9 1,013.6 199.9 850.2 304.3 1,739.6 1,503.1 486.1 2,479.62010 511.9 248.3 1,015.3 198.6 863.0 309.7 1,746.3 1,501.6 484.9 2,448.42011 514.8 247.1 1,049.1 203.0 882.5 325.8 1,758.1 1,535.8 493.7 2,404.92012 522.7 250.8 1,100.5 209.3 932.6 336.2 1,836.1 1,598.7 504.7 2,376.32013 524.1 258.7 1,139.1 221.2 981.0 344.5 1,980.9 1,676.4 516.6 2,374.32014 518.4 265.9 1,187.0 225.2 1,021.2 355.3 2,059.0 1,757.1 539.8 2,411.02015 521.2 274.0 1,261.1 230.7 1,069.9 365.6 2,122.6 1,827.8 549.8 2,445.92016f 524.5 282.0 1,312.7 234.0 1,134.9 358.8 2,206.4 1,868.6 554.8 2,469.12017f 510.5 285.9 1,340.5 232.7 1,204.3 356.5 2,253.7 1,894.2 551.9 2,490.6
Sources: California Employment Development Department, LMID; estimates and forecasts by LAEDC
Table 6: California Nonfarm Employment Annual averages, thousands, March 2014 benchmark
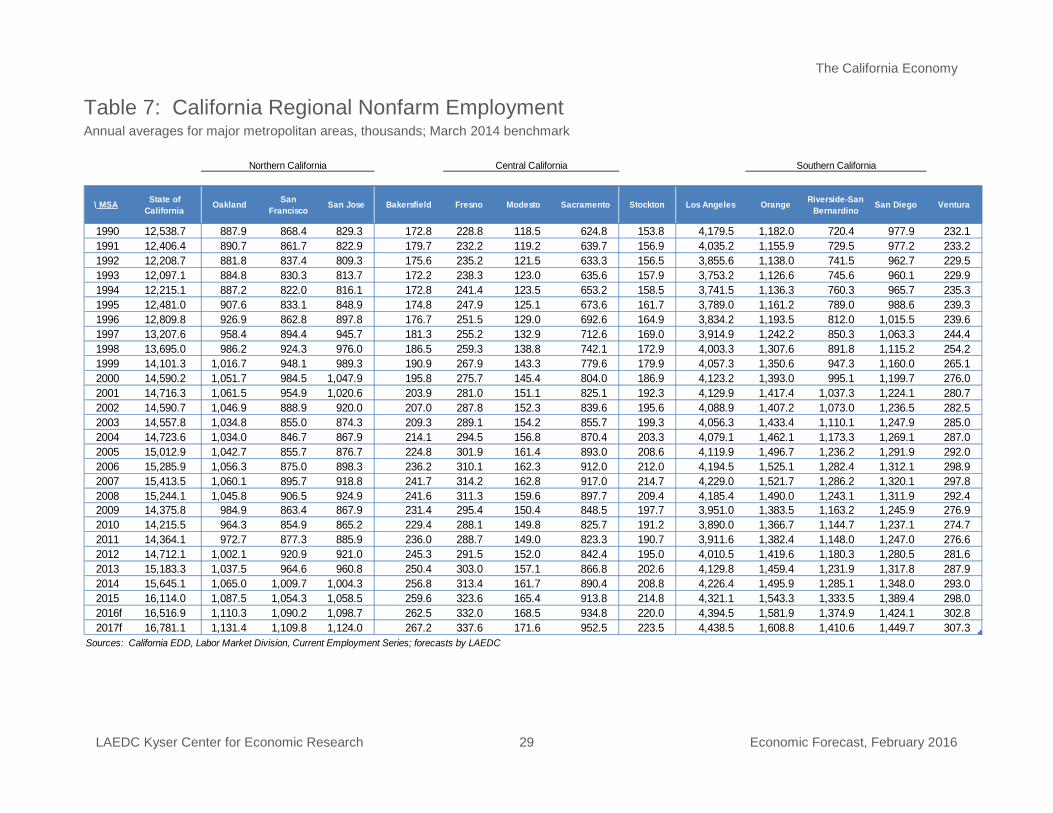
The California Economy
LAEDC Kyser Center for Economic Research 29 Economic Forecast, February 2016
Table 7: California Regional Nonfarm Employment Annual averages for major metropolitan areas, thousands; March 2014 benchmark
\ MSA State of California Oakland San
Francisco San Jose Bakersfield Fresno Modesto Sacramento Stockton Los Angeles Orange Riverside-San Bernardino San Diego Ventura
1990 12,538.7 887.9 868.4 829.3 172.8 228.8 118.5 624.8 153.8 4,179.5 1,182.0 720.4 977.9 232.11991 12,406.4 890.7 861.7 822.9 179.7 232.2 119.2 639.7 156.9 4,035.2 1,155.9 729.5 977.2 233.21992 12,208.7 881.8 837.4 809.3 175.6 235.2 121.5 633.3 156.5 3,855.6 1,138.0 741.5 962.7 229.51993 12,097.1 884.8 830.3 813.7 172.2 238.3 123.0 635.6 157.9 3,753.2 1,126.6 745.6 960.1 229.91994 12,215.1 887.2 822.0 816.1 172.8 241.4 123.5 653.2 158.5 3,741.5 1,136.3 760.3 965.7 235.31995 12,481.0 907.6 833.1 848.9 174.8 247.9 125.1 673.6 161.7 3,789.0 1,161.2 789.0 988.6 239.31996 12,809.8 926.9 862.8 897.8 176.7 251.5 129.0 692.6 164.9 3,834.2 1,193.5 812.0 1,015.5 239.61997 13,207.6 958.4 894.4 945.7 181.3 255.2 132.9 712.6 169.0 3,914.9 1,242.2 850.3 1,063.3 244.41998 13,695.0 986.2 924.3 976.0 186.5 259.3 138.8 742.1 172.9 4,003.3 1,307.6 891.8 1,115.2 254.21999 14,101.3 1,016.7 948.1 989.3 190.9 267.9 143.3 779.6 179.9 4,057.3 1,350.6 947.3 1,160.0 265.12000 14,590.2 1,051.7 984.5 1,047.9 195.8 275.7 145.4 804.0 186.9 4,123.2 1,393.0 995.1 1,199.7 276.02001 14,716.3 1,061.5 954.9 1,020.6 203.9 281.0 151.1 825.1 192.3 4,129.9 1,417.4 1,037.3 1,224.1 280.72002 14,590.7 1,046.9 888.9 920.0 207.0 287.8 152.3 839.6 195.6 4,088.9 1,407.2 1,073.0 1,236.5 282.52003 14,557.8 1,034.8 855.0 874.3 209.3 289.1 154.2 855.7 199.3 4,056.3 1,433.4 1,110.1 1,247.9 285.02004 14,723.6 1,034.0 846.7 867.9 214.1 294.5 156.8 870.4 203.3 4,079.1 1,462.1 1,173.3 1,269.1 287.02005 15,012.9 1,042.7 855.7 876.7 224.8 301.9 161.4 893.0 208.6 4,119.9 1,496.7 1,236.2 1,291.9 292.02006 15,285.9 1,056.3 875.0 898.3 236.2 310.1 162.3 912.0 212.0 4,194.5 1,525.1 1,282.4 1,312.1 298.92007 15,413.5 1,060.1 895.7 918.8 241.7 314.2 162.8 917.0 214.7 4,229.0 1,521.7 1,286.2 1,320.1 297.82008 15,244.1 1,045.8 906.5 924.9 241.6 311.3 159.6 897.7 209.4 4,185.4 1,490.0 1,243.1 1,311.9 292.42009 14,375.8 984.9 863.4 867.9 231.4 295.4 150.4 848.5 197.7 3,951.0 1,383.5 1,163.2 1,245.9 276.92010 14,215.5 964.3 854.9 865.2 229.4 288.1 149.8 825.7 191.2 3,890.0 1,366.7 1,144.7 1,237.1 274.72011 14,364.1 972.7 877.3 885.9 236.0 288.7 149.0 823.3 190.7 3,911.6 1,382.4 1,148.0 1,247.0 276.62012 14,712.1 1,002.1 920.9 921.0 245.3 291.5 152.0 842.4 195.0 4,010.5 1,419.6 1,180.3 1,280.5 281.62013 15,183.3 1,037.5 964.6 960.8 250.4 303.0 157.1 866.8 202.6 4,129.8 1,459.4 1,231.9 1,317.8 287.92014 15,645.1 1,065.0 1,009.7 1,004.3 256.8 313.4 161.7 890.4 208.8 4,226.4 1,495.9 1,285.1 1,348.0 293.02015 16,114.0 1,087.5 1,054.3 1,058.5 259.6 323.6 165.4 913.8 214.8 4,321.1 1,543.3 1,333.5 1,389.4 298.02016f 16,516.9 1,110.3 1,090.2 1,098.7 262.5 332.0 168.5 934.8 220.0 4,394.5 1,581.9 1,374.9 1,424.1 302.82017f 16,781.1 1,131.4 1,109.8 1,124.0 267.2 337.6 171.6 952.5 223.5 4,438.5 1,608.8 1,410.6 1,449.7 307.3
Sources: California EDD, Labor Market Division, Current Employment Series; forecasts by LAEDC
Central California Southern CaliforniaNorthern California
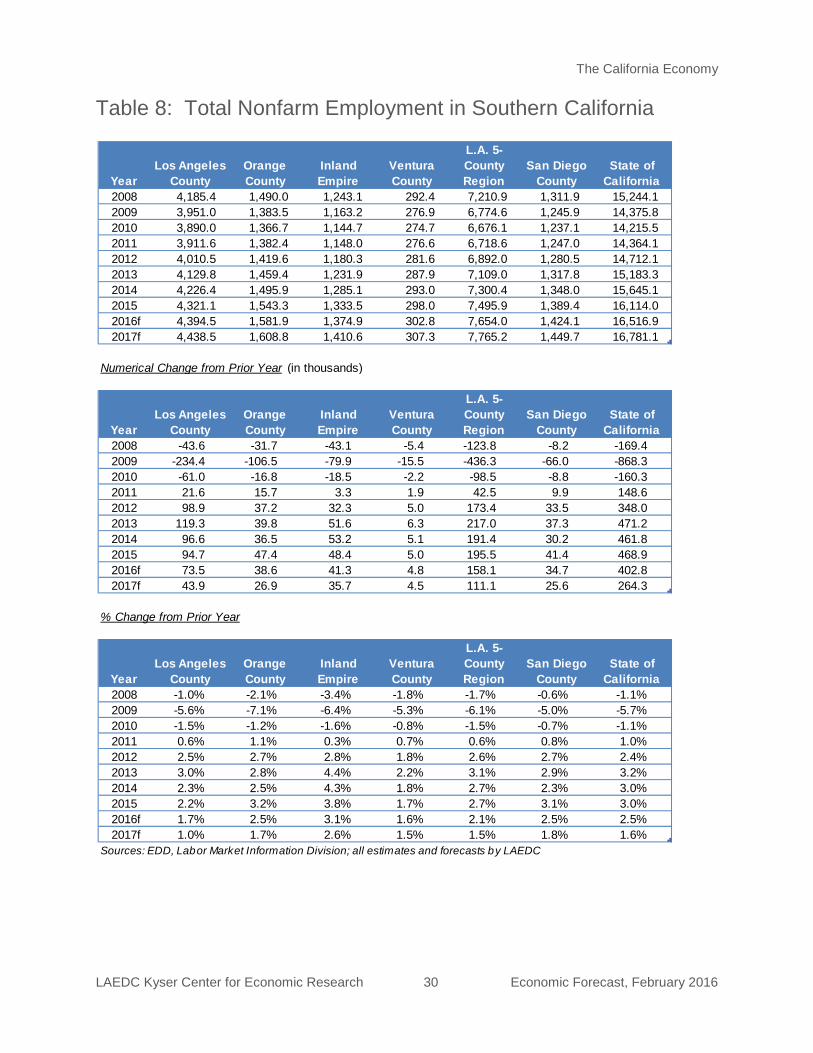
The California Economy
LAEDC Kyser Center for Economic Research 30 Economic Forecast, February 2016
YearLos Angeles
CountyOrange County
Inland Empire
Ventura County
L.A. 5-County Region
San Diego County
State of California
2008 4,185.4 1,490.0 1,243.1 292.4 7,210.9 1,311.9 15,244.12009 3,951.0 1,383.5 1,163.2 276.9 6,774.6 1,245.9 14,375.82010 3,890.0 1,366.7 1,144.7 274.7 6,676.1 1,237.1 14,215.52011 3,911.6 1,382.4 1,148.0 276.6 6,718.6 1,247.0 14,364.12012 4,010.5 1,419.6 1,180.3 281.6 6,892.0 1,280.5 14,712.12013 4,129.8 1,459.4 1,231.9 287.9 7,109.0 1,317.8 15,183.32014 4,226.4 1,495.9 1,285.1 293.0 7,300.4 1,348.0 15,645.12015 4,321.1 1,543.3 1,333.5 298.0 7,495.9 1,389.4 16,114.02016f 4,394.5 1,581.9 1,374.9 302.8 7,654.0 1,424.1 16,516.92017f 4,438.5 1,608.8 1,410.6 307.3 7,765.2 1,449.7 16,781.1
Numerical Change from Prior Year (in thousands)
YearLos Angeles
CountyOrange County
Inland Empire
Ventura County
L.A. 5-County Region
San Diego County
State of California
2008 -43.6 -31.7 -43.1 -5.4 -123.8 -8.2 -169.42009 -234.4 -106.5 -79.9 -15.5 -436.3 -66.0 -868.32010 -61.0 -16.8 -18.5 -2.2 -98.5 -8.8 -160.32011 21.6 15.7 3.3 1.9 42.5 9.9 148.62012 98.9 37.2 32.3 5.0 173.4 33.5 348.02013 119.3 39.8 51.6 6.3 217.0 37.3 471.22014 96.6 36.5 53.2 5.1 191.4 30.2 461.82015 94.7 47.4 48.4 5.0 195.5 41.4 468.92016f 73.5 38.6 41.3 4.8 158.1 34.7 402.82017f 43.9 26.9 35.7 4.5 111.1 25.6 264.3
% Change from Prior Year
YearLos Angeles
CountyOrange County
Inland Empire
Ventura County
L.A. 5-County Region
San Diego County
State of California
2008 -1.0% -2.1% -3.4% -1.8% -1.7% -0.6% -1.1%2009 -5.6% -7.1% -6.4% -5.3% -6.1% -5.0% -5.7%2010 -1.5% -1.2% -1.6% -0.8% -1.5% -0.7% -1.1%2011 0.6% 1.1% 0.3% 0.7% 0.6% 0.8% 1.0%2012 2.5% 2.7% 2.8% 1.8% 2.6% 2.7% 2.4%2013 3.0% 2.8% 4.4% 2.2% 3.1% 2.9% 3.2%2014 2.3% 2.5% 4.3% 1.8% 2.7% 2.3% 3.0%2015 2.2% 3.2% 3.8% 1.7% 2.7% 3.1% 3.0%2016f 1.7% 2.5% 3.1% 1.6% 2.1% 2.5% 2.5%2017f 1.0% 1.7% 2.6% 1.5% 1.5% 1.8% 1.6%
Sources: EDD, Labor Market Information Division; all estimates and forecasts by LAEDC
Table 8: Total Nonfarm Employment in Southern California
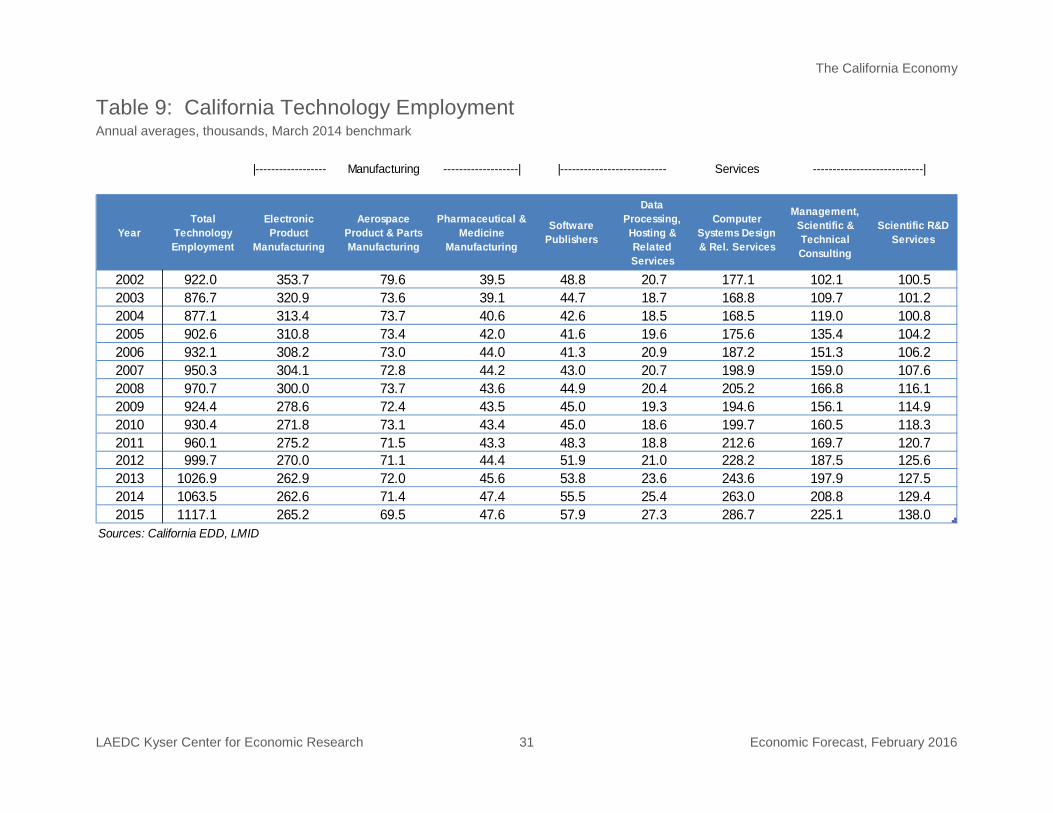
The California Economy
LAEDC Kyser Center for Economic Research 31 Economic Forecast, February 2016
Table 9: California Technology Employment Annual averages, thousands, March 2014 benchmark
|------------------ Manufacturing -------------------| Services
YearTotal
Technology Employment
Electronic Product
Manufacturing
Aerospace Product & Parts Manufacturing
Pharmaceutical & Medicine
Manufacturing
Software Publishers
Data Processing, Hosting & Related Services
Computer Systems Design & Rel. Services
Management, Scientific & Technical Consulting
Scientific R&D Services
2002 922.0 353.7 79.6 39.5 48.8 20.7 177.1 102.1 100.52003 876.7 320.9 73.6 39.1 44.7 18.7 168.8 109.7 101.22004 877.1 313.4 73.7 40.6 42.6 18.5 168.5 119.0 100.82005 902.6 310.8 73.4 42.0 41.6 19.6 175.6 135.4 104.22006 932.1 308.2 73.0 44.0 41.3 20.9 187.2 151.3 106.22007 950.3 304.1 72.8 44.2 43.0 20.7 198.9 159.0 107.62008 970.7 300.0 73.7 43.6 44.9 20.4 205.2 166.8 116.12009 924.4 278.6 72.4 43.5 45.0 19.3 194.6 156.1 114.92010 930.4 271.8 73.1 43.4 45.0 18.6 199.7 160.5 118.32011 960.1 275.2 71.5 43.3 48.3 18.8 212.6 169.7 120.72012 999.7 270.0 71.1 44.4 51.9 21.0 228.2 187.5 125.62013 1026.9 262.9 72.0 45.6 53.8 23.6 243.6 197.9 127.52014 1063.5 262.6 71.4 47.4 55.5 25.4 263.0 208.8 129.42015 1117.1 265.2 69.5 47.6 57.9 27.3 286.7 225.1 138.0
Sources: California EDD, LMID
|--------------------------- ----------------------------|
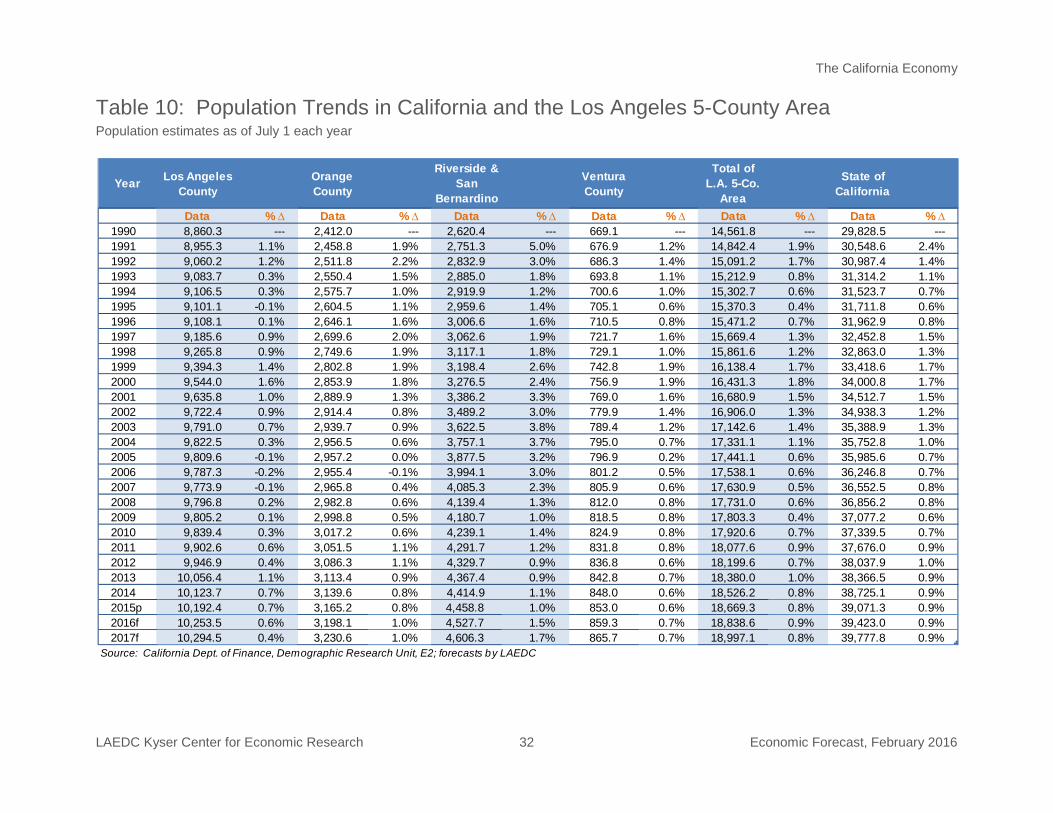
The California Economy
LAEDC Kyser Center for Economic Research 32 Economic Forecast, February 2016
Year Los Angeles County
Column2
Orange County Column4
Riverside & San
BernardinoColumn6 Ventura
CountyColumn
8
Total of L.A. 5-Co.
Area
Column10
State of California
Column12
Data % ∆ Data % ∆ Data % ∆ Data % ∆ Data % ∆ Data % ∆1990 8,860.3 --- 2,412.0 --- 2,620.4 --- 669.1 --- 14,561.8 --- 29,828.5 ---1991 8,955.3 1.1% 2,458.8 1.9% 2,751.3 5.0% 676.9 1.2% 14,842.4 1.9% 30,548.6 2.4%1992 9,060.2 1.2% 2,511.8 2.2% 2,832.9 3.0% 686.3 1.4% 15,091.2 1.7% 30,987.4 1.4%1993 9,083.7 0.3% 2,550.4 1.5% 2,885.0 1.8% 693.8 1.1% 15,212.9 0.8% 31,314.2 1.1%1994 9,106.5 0.3% 2,575.7 1.0% 2,919.9 1.2% 700.6 1.0% 15,302.7 0.6% 31,523.7 0.7%1995 9,101.1 -0.1% 2,604.5 1.1% 2,959.6 1.4% 705.1 0.6% 15,370.3 0.4% 31,711.8 0.6%1996 9,108.1 0.1% 2,646.1 1.6% 3,006.6 1.6% 710.5 0.8% 15,471.2 0.7% 31,962.9 0.8%1997 9,185.6 0.9% 2,699.6 2.0% 3,062.6 1.9% 721.7 1.6% 15,669.4 1.3% 32,452.8 1.5%1998 9,265.8 0.9% 2,749.6 1.9% 3,117.1 1.8% 729.1 1.0% 15,861.6 1.2% 32,863.0 1.3%1999 9,394.3 1.4% 2,802.8 1.9% 3,198.4 2.6% 742.8 1.9% 16,138.4 1.7% 33,418.6 1.7%2000 9,544.0 1.6% 2,853.9 1.8% 3,276.5 2.4% 756.9 1.9% 16,431.3 1.8% 34,000.8 1.7%2001 9,635.8 1.0% 2,889.9 1.3% 3,386.2 3.3% 769.0 1.6% 16,680.9 1.5% 34,512.7 1.5%2002 9,722.4 0.9% 2,914.4 0.8% 3,489.2 3.0% 779.9 1.4% 16,906.0 1.3% 34,938.3 1.2%2003 9,791.0 0.7% 2,939.7 0.9% 3,622.5 3.8% 789.4 1.2% 17,142.6 1.4% 35,388.9 1.3%2004 9,822.5 0.3% 2,956.5 0.6% 3,757.1 3.7% 795.0 0.7% 17,331.1 1.1% 35,752.8 1.0%2005 9,809.6 -0.1% 2,957.2 0.0% 3,877.5 3.2% 796.9 0.2% 17,441.1 0.6% 35,985.6 0.7%2006 9,787.3 -0.2% 2,955.4 -0.1% 3,994.1 3.0% 801.2 0.5% 17,538.1 0.6% 36,246.8 0.7%2007 9,773.9 -0.1% 2,965.8 0.4% 4,085.3 2.3% 805.9 0.6% 17,630.9 0.5% 36,552.5 0.8%2008 9,796.8 0.2% 2,982.8 0.6% 4,139.4 1.3% 812.0 0.8% 17,731.0 0.6% 36,856.2 0.8%2009 9,805.2 0.1% 2,998.8 0.5% 4,180.7 1.0% 818.5 0.8% 17,803.3 0.4% 37,077.2 0.6%2010 9,839.4 0.3% 3,017.2 0.6% 4,239.1 1.4% 824.9 0.8% 17,920.6 0.7% 37,339.5 0.7%2011 9,902.6 0.6% 3,051.5 1.1% 4,291.7 1.2% 831.8 0.8% 18,077.6 0.9% 37,676.0 0.9%2012 9,946.9 0.4% 3,086.3 1.1% 4,329.7 0.9% 836.8 0.6% 18,199.6 0.7% 38,037.9 1.0%2013 10,056.4 1.1% 3,113.4 0.9% 4,367.4 0.9% 842.8 0.7% 18,380.0 1.0% 38,366.5 0.9%2014 10,123.7 0.7% 3,139.6 0.8% 4,414.9 1.1% 848.0 0.6% 18,526.2 0.8% 38,725.1 0.9%2015p 10,192.4 0.7% 3,165.2 0.8% 4,458.8 1.0% 853.0 0.6% 18,669.3 0.8% 39,071.3 0.9%2016f 10,253.5 0.6% 3,198.1 1.0% 4,527.7 1.5% 859.3 0.7% 18,838.6 0.9% 39,423.0 0.9%2017f 10,294.5 0.4% 3,230.6 1.0% 4,606.3 1.7% 865.7 0.7% 18,997.1 0.8% 39,777.8 0.9%
Source: California Dept. of Finance, Demographic Research Unit, E2; forecasts by LAEDC
Table 10: Population Trends in California and the Los Angeles 5-County Area Population estimates as of July 1 each year
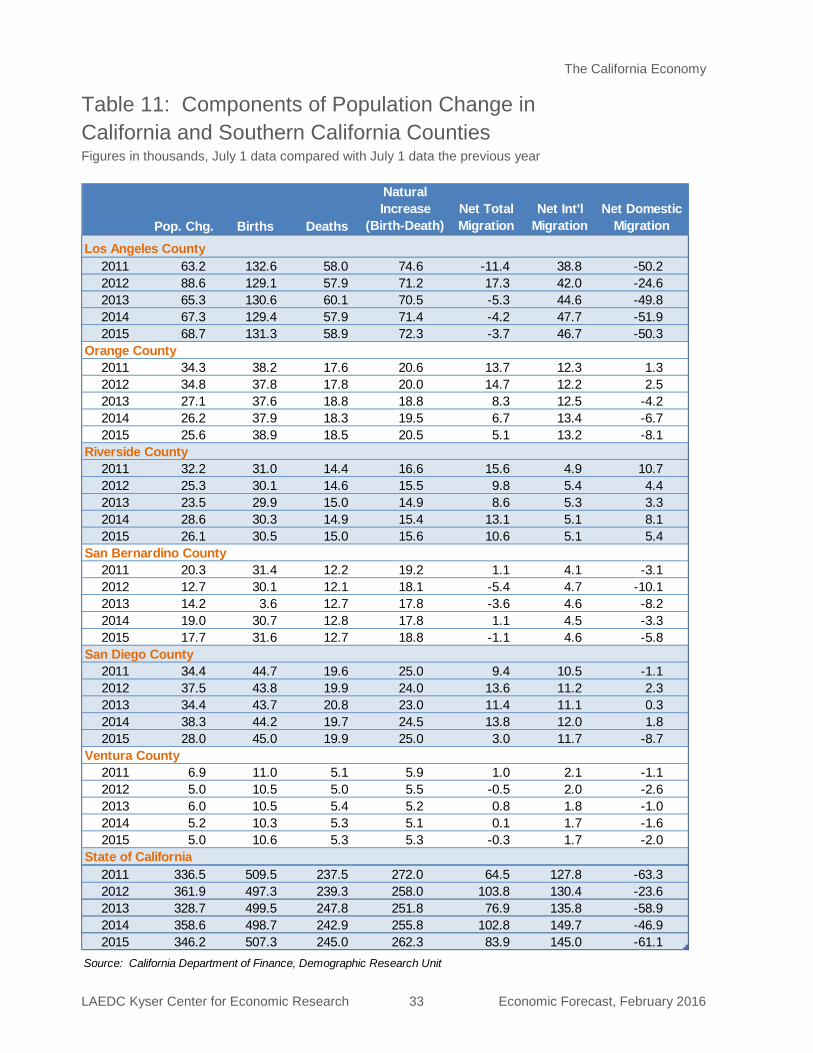
The California Economy
LAEDC Kyser Center for Economic Research 33 Economic Forecast, February 2016
Table 11: Components of Population Change in California and Southern California Counties Figures in thousands, July 1 data compared with July 1 data the previous year
Column1 Pop. Chg. Births Deaths
Natural Increase
(Birth-Death)Net Total Migration
Net Int'l Migration
Net Domestic Migration
Los Angeles County2011 63.2 132.6 58.0 74.6 -11.4 38.8 -50.22012 88.6 129.1 57.9 71.2 17.3 42.0 -24.62013 65.3 130.6 60.1 70.5 -5.3 44.6 -49.82014 67.3 129.4 57.9 71.4 -4.2 47.7 -51.92015 68.7 131.3 58.9 72.3 -3.7 46.7 -50.3
Orange County2011 34.3 38.2 17.6 20.6 13.7 12.3 1.32012 34.8 37.8 17.8 20.0 14.7 12.2 2.52013 27.1 37.6 18.8 18.8 8.3 12.5 -4.22014 26.2 37.9 18.3 19.5 6.7 13.4 -6.72015 25.6 38.9 18.5 20.5 5.1 13.2 -8.1
Riverside County2011 32.2 31.0 14.4 16.6 15.6 4.9 10.72012 25.3 30.1 14.6 15.5 9.8 5.4 4.42013 23.5 29.9 15.0 14.9 8.6 5.3 3.32014 28.6 30.3 14.9 15.4 13.1 5.1 8.12015 26.1 30.5 15.0 15.6 10.6 5.1 5.4
San Bernardino County2011 20.3 31.4 12.2 19.2 1.1 4.1 -3.12012 12.7 30.1 12.1 18.1 -5.4 4.7 -10.12013 14.2 3.6 12.7 17.8 -3.6 4.6 -8.22014 19.0 30.7 12.8 17.8 1.1 4.5 -3.32015 17.7 31.6 12.7 18.8 -1.1 4.6 -5.8
San Diego County2011 34.4 44.7 19.6 25.0 9.4 10.5 -1.12012 37.5 43.8 19.9 24.0 13.6 11.2 2.32013 34.4 43.7 20.8 23.0 11.4 11.1 0.32014 38.3 44.2 19.7 24.5 13.8 12.0 1.82015 28.0 45.0 19.9 25.0 3.0 11.7 -8.7
Ventura County2011 6.9 11.0 5.1 5.9 1.0 2.1 -1.12012 5.0 10.5 5.0 5.5 -0.5 2.0 -2.62013 6.0 10.5 5.4 5.2 0.8 1.8 -1.02014 5.2 10.3 5.3 5.1 0.1 1.7 -1.62015 5.0 10.6 5.3 5.3 -0.3 1.7 -2.0
State of California2011 336.5 509.5 237.5 272.0 64.5 127.8 -63.32012 361.9 497.3 239.3 258.0 103.8 130.4 -23.62013 328.7 499.5 247.8 251.8 76.9 135.8 -58.92014 358.6 498.7 242.9 255.8 102.8 149.7 -46.92015 346.2 507.3 245.0 262.3 83.9 145.0 -61.1
Source: California Department of Finance, Demographic Research Unit
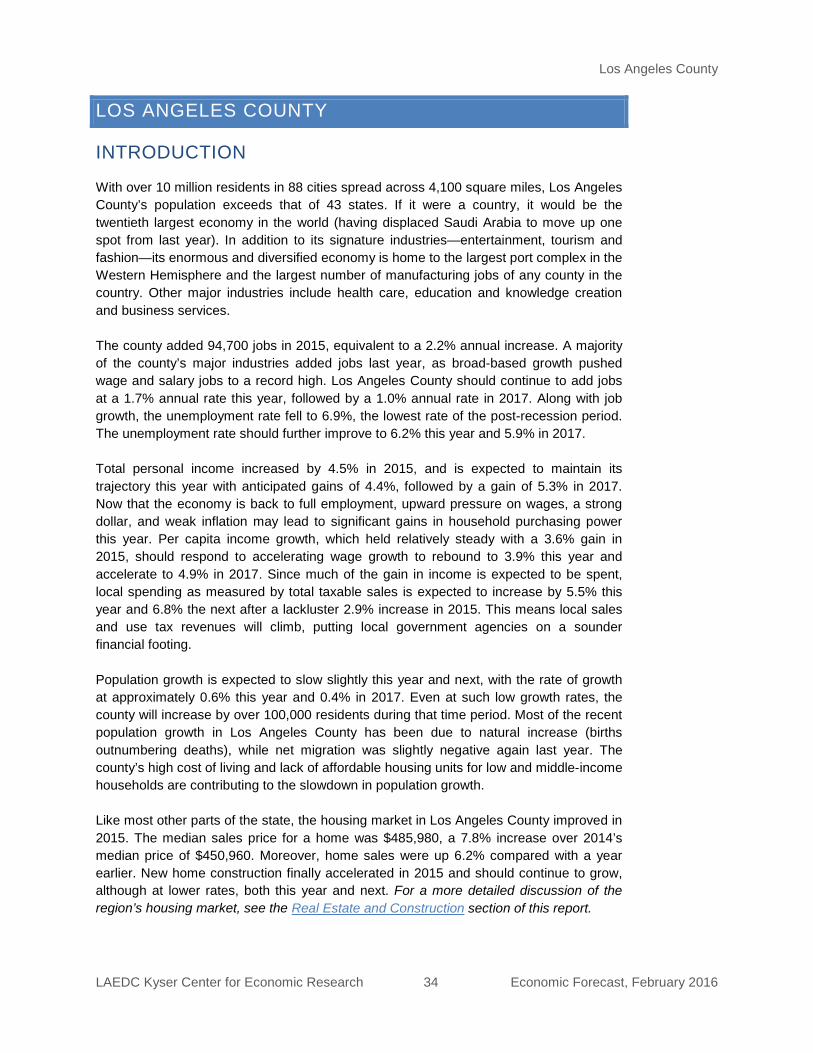
Los Angeles County
LAEDC Kyser Center for Economic Research 34 Economic Forecast, February 2016
LOS ANGELES COUNTY
With over 10 million residents in 88 cities spread across 4,100 square miles, Los Angeles County’s population exceeds that of 43 states. If it were a country, it would be the twentieth largest economy in the world (having displaced Saudi Arabia to move up one spot from last year). In addition to its signature industries—entertainment, tourism and fashion—its enormous and diversified economy is home to the largest port complex in the Western Hemisphere and the largest number of manufacturing jobs of any county in the country. Other major industries include health care, education and knowledge creation and business services.
INTRODUCTION
The county added 94,700 jobs in 2015, equivalent to a 2.2% annual increase. A majority of the county’s major industries added jobs last year, as broad-based growth pushed wage and salary jobs to a record high. Los Angeles County should continue to add jobs at a 1.7% annual rate this year, followed by a 1.0% annual rate in 2017. Along with job growth, the unemployment rate fell to 6.9%, the lowest rate of the post-recession period. The unemployment rate should further improve to 6.2% this year and 5.9% in 2017. Total personal income increased by 4.5% in 2015, and is expected to maintain its trajectory this year with anticipated gains of 4.4%, followed by a gain of 5.3% in 2017. Now that the economy is back to full employment, upward pressure on wages, a strong dollar, and weak inflation may lead to significant gains in household purchasing power this year. Per capita income growth, which held relatively steady with a 3.6% gain in 2015, should respond to accelerating wage growth to rebound to 3.9% this year and accelerate to 4.9% in 2017. Since much of the gain in income is expected to be spent, local spending as measured by total taxable sales is expected to increase by 5.5% this year and 6.8% the next after a lackluster 2.9% increase in 2015. This means local sales and use tax revenues will climb, putting local government agencies on a sounder financial footing. Population growth is expected to slow slightly this year and next, with the rate of growth at approximately 0.6% this year and 0.4% in 2017. Even at such low growth rates, the county will increase by over 100,000 residents during that time period. Most of the recent population growth in Los Angeles County has been due to natural increase (births outnumbering deaths), while net migration was slightly negative again last year. The county’s high cost of living and lack of affordable housing units for low and middle-income households are contributing to the slowdown in population growth. Like most other parts of the state, the housing market in Los Angeles County improved in 2015. The median sales price for a home was $485,980, a 7.8% increase over 2014’s median price of $450,960. Moreover, home sales were up 6.2% compared with a year earlier. New home construction finally accelerated in 2015 and should continue to grow, although at lower rates, both this year and next. For a more detailed discussion of the region’s housing market, see the Real Estate and Construction section of this report.
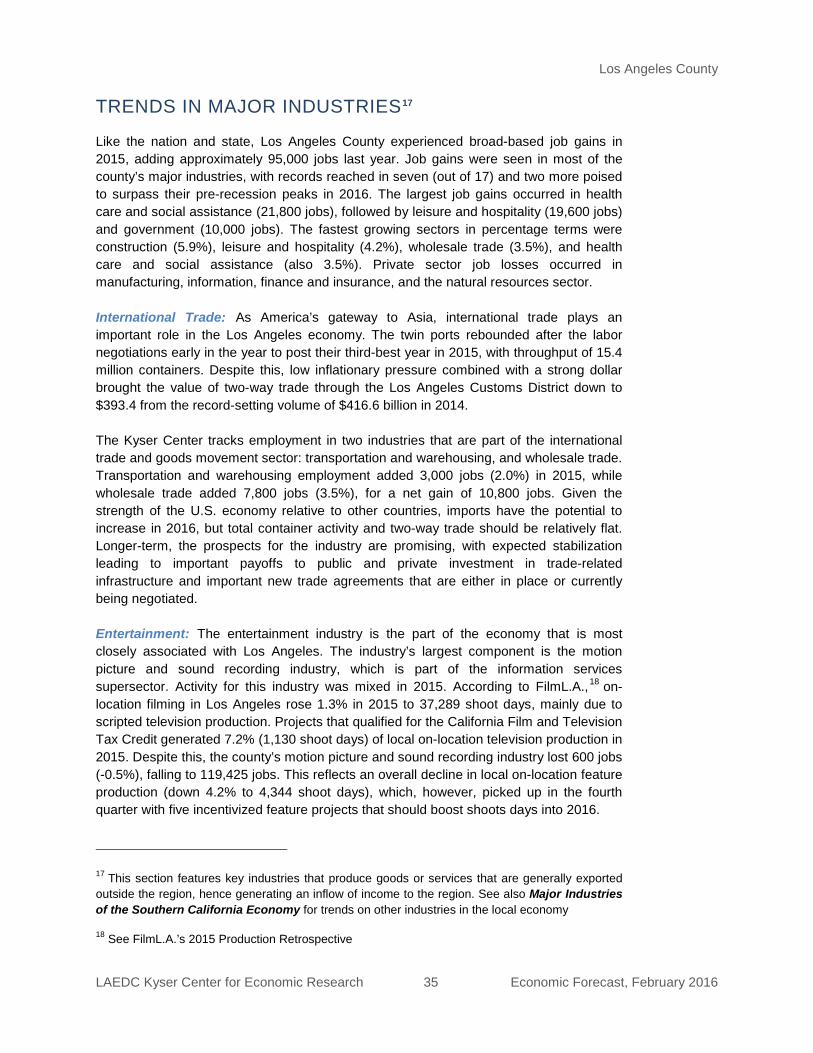
Los Angeles County
LAEDC Kyser Center for Economic Research 35 Economic Forecast, February 2016
TRENDS IN MAJOR INDUSTRIES17
Like the nation and state, Los Angeles County experienced broad-based job gains in 2015, adding approximately 95,000 jobs last year. Job gains were seen in most of the county’s major industries, with records reached in seven (out of 17) and two more poised to surpass their pre-recession peaks in 2016. The largest job gains occurred in health care and social assistance (21,800 jobs), followed by leisure and hospitality (19,600 jobs) and government (10,000 jobs). The fastest growing sectors in percentage terms were construction (5.9%), leisure and hospitality (4.2%), wholesale trade (3.5%), and health care and social assistance (also 3.5%). Private sector job losses occurred in manufacturing, information, finance and insurance, and the natural resources sector.
International Trade: As America’s gateway to Asia, international trade plays an important role in the Los Angeles economy. The twin ports rebounded after the labor negotiations early in the year to post their third-best year in 2015, with throughput of 15.4 million containers. Despite this, low inflationary pressure combined with a strong dollar brought the value of two-way trade through the Los Angeles Customs District down to $393.4 from the record-setting volume of $416.6 billion in 2014. The Kyser Center tracks employment in two industries that are part of the international trade and goods movement sector: transportation and warehousing, and wholesale trade. Transportation and warehousing employment added 3,000 jobs (2.0%) in 2015, while wholesale trade added 7,800 jobs (3.5%), for a net gain of 10,800 jobs. Given the strength of the U.S. economy relative to other countries, imports have the potential to increase in 2016, but total container activity and two-way trade should be relatively flat. Longer-term, the prospects for the industry are promising, with expected stabilization leading to important payoffs to public and private investment in trade-related infrastructure and important new trade agreements that are either in place or currently being negotiated. Entertainment: The entertainment industry is the part of the economy that is most closely associated with Los Angeles. The industry’s largest component is the motion picture and sound recording industry, which is part of the information services supersector. Activity for this industry was mixed in 2015. According to FilmL.A.,18
17 This section features key industries that produce goods or services that are generally exported outside the region, hence generating an inflow of income to the region. See also Major Industries of the Southern California Economy for trends on other industries in the local economy
on-location filming in Los Angeles rose 1.3% in 2015 to 37,289 shoot days, mainly due to scripted television production. Projects that qualified for the California Film and Television Tax Credit generated 7.2% (1,130 shoot days) of local on-location television production in 2015. Despite this, the county’s motion picture and sound recording industry lost 600 jobs (-0.5%), falling to 119,425 jobs. This reflects an overall decline in local on-location feature production (down 4.2% to 4,344 shoot days), which, however, picked up in the fourth quarter with five incentivized feature projects that should boost shoots days into 2016.
18 See FilmL.A.’s 2015 Production Retrospective
Los Angeles County
LAEDC Kyser Center for Economic Research 36 Economic Forecast, February 2016
Professional Services and Technology: In terms of employment, the professional services super-sector is the second largest in Los Angeles County, with over 620,000 workers in 2015 (surpassed only by health care and education). There are three major industries in this group: professional, scientific and technical services; management of enterprises; and administrative, support and waste services. All saw solid gains in 2015.
Professional, scientific and technical services was the largest of the three with 288,700 jobs in 2015. The industry, which includes legal, accounting, architecture, computer systems design, consulting, research and advertising, added 5,800 jobs, equivalent to a 2.0% growth rate. Management of enterprises, which encompasses corporate headquarters, is smaller at 61,100 jobs, but experienced a somewhat faster growth rate of 2.8% (1,700 jobs) over the same period. Finally, the administrative, support and waste services sector added 4,900 jobs (1.8%) for a total of 271,900. All three components of professional services and technology are expected see additional job gains in 2016 and 2017.
Los Angeles County has seen steady improvement over the past four years, both in terms of job gains and unemployment rate declines. This improvement is expected to continue in 2016 and 2017, although at a slower pace. With the economy back at full employment levels, wage gains are expected over the next year across many occupations. Households could experience significant gains in purchasing power this year as wage gains spread out more broadly than in recent years.
LOOKING AHEAD
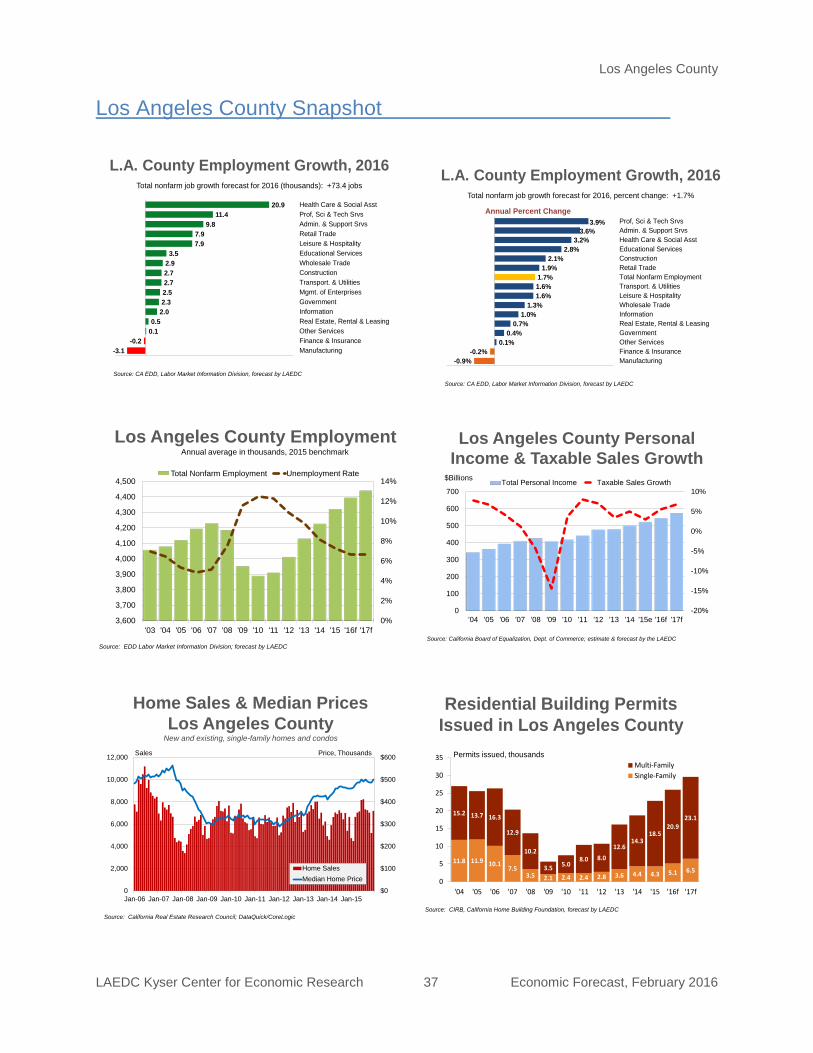
Los Angeles County
LAEDC Kyser Center for Economic Research 37 Economic Forecast, February 2016
Los Angeles County Employment
0%
2%
4%
6%
8%
10%
12%
14%
3,600
3,700
3,800
3,900
4,000
4,100
4,200
4,300
4,400
4,500
'03 '04 '05 '06 '07 '08 '09 '10 '11 '12 '13 '14 '15 '16f '17f
Total Nonfarm Employment Unemployment Rate
Source: EDD Labor Market Information Division; forecast by LAEDC
Annual average in thousands, 2015 benchmark
L.A. County Employment Growth, 2016
-3.1-0.2
0.10.5
2.02.32.52.72.72.93.5
7.97.9
9.811.4
20.9
-5.0 0.0 5.0 10.0 15.0 20.0 25.0
ManufacturingFinance & InsuranceOther ServicesReal Estate, Rental & LeasingInformationGovernmentMgmt. of EnterprisesTransport. & UtilitiesConstructionWholesale TradeEducational ServicesLeisure & HospitalityRetail TradeAdmin. & Support SrvsProf, Sci & Tech SrvsHealth Care & Social Asst
Source: CA EDD, Labor Market Information Division, forecast by LAEDC
Total nonfarm job growth forecast for 2016 (thousands): +73.4 jobsL.A. County Employment Growth, 2016
-0.9%-0.2%
0.1%0.4%
0.7%1.0%
1.3%1.6%1.6%1.7%
1.9%2.1%
2.8%3.2%
3.6%3.9%
-2.0% -1.0% 0.0% 1.0% 2.0% 3.0% 4.0% 5.0%
ManufacturingFinance & InsuranceOther ServicesGovernmentReal Estate, Rental & LeasingInformationWholesale TradeLeisure & HospitalityTransport. & UtilitiesTotal Nonfarm EmploymentRetail TradeConstructionEducational ServicesHealth Care & Social AsstAdmin. & Support SrvsProf, Sci & Tech Srvs
Source: CA EDD, Labor Market Information Division, forecast by LAEDC
Annual Percent Change
Total nonfarm job growth forecast for 2016, percent change: +1.7%
Los Angeles County Personal Income & Taxable Sales Growth
-20%
-15%
-10%
-5%
0%
5%
10%
0
100
200
300
400
500
600
700
'04 '05 '06 '07 '08 '09 '10 '11 '12 '13 '14 '15e '16f '17f
Total Personal Income Taxable Sales Growth$Billions
Source: California Board of Equalization, Dept. of Commerce; estimate & forecast by the LAEDC
Los Angeles County Snapshot
$0
$100
$200
$300
$400
$500
$600
0
2,000
4,000
6,000
8,000
10,000
12,000
Jan-06 Jan-07 Jan-08 Jan-09 Jan-10 Jan-11 Jan-12 Jan-13 Jan-14 Jan-15
Home SalesMedian Home Price
Home Sales & Median PricesLos Angeles County
New and existing, single-family homes and condos
Sales Price, Thousands
Source: California Real Estate Research Council; DataQuick/CoreLogic
Residential Building Permits Issued in Los Angeles County
11.8 11.9 10.17.5
3.5 2.1 2.4 2.4 2.8 3.6 4.4 4.3 5.1 6.5
15.2 13.7 16.3
12.9
10.2
3.5 5.08.0 8.0
12.614.3
18.520.9
23.1
0
5
10
15
20
25
30
35
'04 '05 '06 '07 '08 '09 '10 '11 '12 '13 '14 '15 '16f '17f
Multi-FamilySingle-Family
Permits issued, thousands
Source: CIRB, California Home Building Foundation, forecast by LAEDC
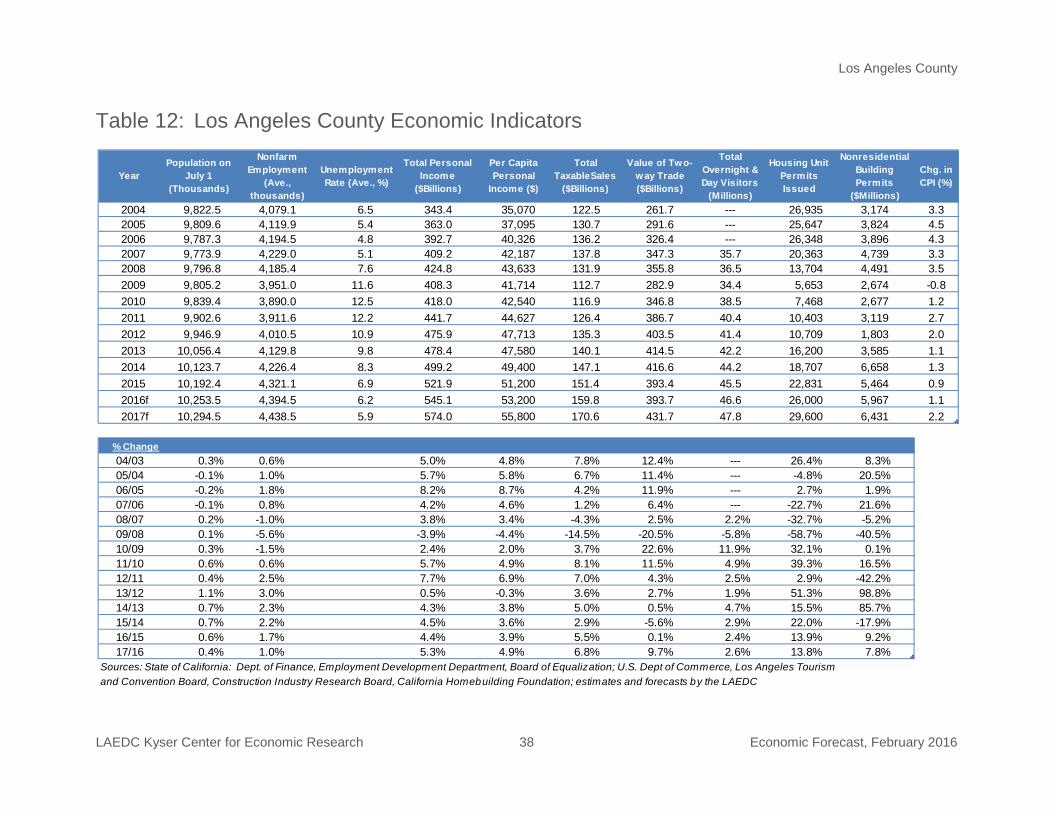
Los Angeles County
LAEDC Kyser Center for Economic Research 38 Economic Forecast, February 2016
Table 12: Los Angeles County Economic Indicators
YearPopulation on
July 1 (Thousands)
Nonfarm Employment
(Ave., thousands)
Unemployment Rate (Ave., %)
Total Personal Income
($Billions)
Per Capita Personal
Income ($)
Total TaxableSales
($Billions)
Value of Two-way Trade ($Billions)
Total Overnight & Day Visitors
(Millions)
Housing Unit Permits Issued
Nonresidential Building Permits
($Millions)
Chg. in CPI (%)
2004 9,822.5 4,079.1 6.5 343.4 35,070 122.5 261.7 --- 26,935 3,174 3.32005 9,809.6 4,119.9 5.4 363.0 37,095 130.7 291.6 --- 25,647 3,824 4.52006 9,787.3 4,194.5 4.8 392.7 40,326 136.2 326.4 --- 26,348 3,896 4.32007 9,773.9 4,229.0 5.1 409.2 42,187 137.8 347.3 35.7 20,363 4,739 3.32008 9,796.8 4,185.4 7.6 424.8 43,633 131.9 355.8 36.5 13,704 4,491 3.52009 9,805.2 3,951.0 11.6 408.3 41,714 112.7 282.9 34.4 5,653 2,674 -0.82010 9,839.4 3,890.0 12.5 418.0 42,540 116.9 346.8 38.5 7,468 2,677 1.22011 9,902.6 3,911.6 12.2 441.7 44,627 126.4 386.7 40.4 10,403 3,119 2.72012 9,946.9 4,010.5 10.9 475.9 47,713 135.3 403.5 41.4 10,709 1,803 2.02013 10,056.4 4,129.8 9.8 478.4 47,580 140.1 414.5 42.2 16,200 3,585 1.12014 10,123.7 4,226.4 8.3 499.2 49,400 147.1 416.6 44.2 18,707 6,658 1.32015 10,192.4 4,321.1 6.9 521.9 51,200 151.4 393.4 45.5 22,831 5,464 0.92016f 10,253.5 4,394.5 6.2 545.1 53,200 159.8 393.7 46.6 26,000 5,967 1.12017f 10,294.5 4,438.5 5.9 574.0 55,800 170.6 431.7 47.8 29,600 6,431 2.2
% Change Column1 Column2 Column3 Column4 Column5 Column6 Column7 Column8 Column9 Column1004/03 0.3% 0.6% 5.0% 4.8% 7.8% 12.4% --- 26.4% 8.3%05/04 -0.1% 1.0% 5.7% 5.8% 6.7% 11.4% --- -4.8% 20.5%06/05 -0.2% 1.8% 8.2% 8.7% 4.2% 11.9% --- 2.7% 1.9%07/06 -0.1% 0.8% 4.2% 4.6% 1.2% 6.4% --- -22.7% 21.6%08/07 0.2% -1.0% 3.8% 3.4% -4.3% 2.5% 2.2% -32.7% -5.2%09/08 0.1% -5.6% -3.9% -4.4% -14.5% -20.5% -5.8% -58.7% -40.5%10/09 0.3% -1.5% 2.4% 2.0% 3.7% 22.6% 11.9% 32.1% 0.1%11/10 0.6% 0.6% 5.7% 4.9% 8.1% 11.5% 4.9% 39.3% 16.5%12/11 0.4% 2.5% 7.7% 6.9% 7.0% 4.3% 2.5% 2.9% -42.2%13/12 1.1% 3.0% 0.5% -0.3% 3.6% 2.7% 1.9% 51.3% 98.8%14/13 0.7% 2.3% 4.3% 3.8% 5.0% 0.5% 4.7% 15.5% 85.7%15/14 0.7% 2.2% 4.5% 3.6% 2.9% -5.6% 2.9% 22.0% -17.9%16/15 0.6% 1.7% 4.4% 3.9% 5.5% 0.1% 2.4% 13.9% 9.2%17/16 0.4% 1.0% 5.3% 4.9% 6.8% 9.7% 2.6% 13.8% 7.8%
Sources: State of California: Dept. of Finance, Employment Development Department, Board of Equalization; U.S. Dept of Commerce, Los Angeles Tourismand Convention Board, Construction Industry Research Board, California Homebuilding Foundation; estimates and forecasts by the LAEDC
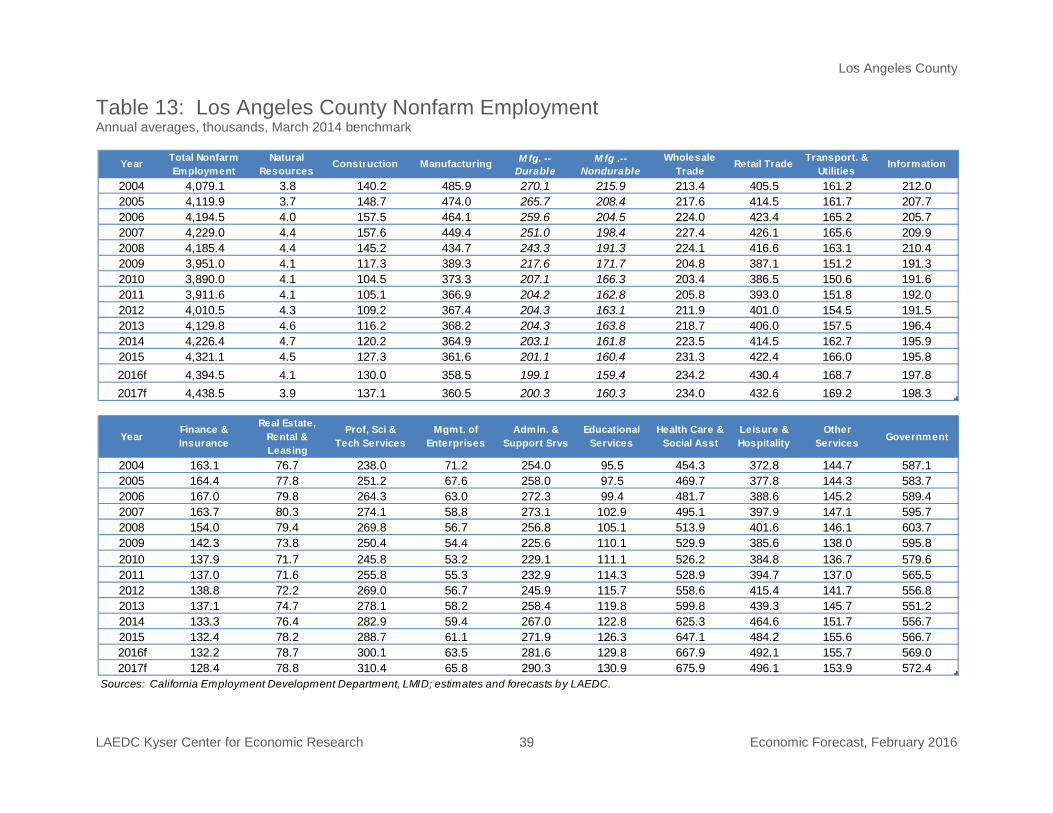
Los Angeles County
LAEDC Kyser Center for Economic Research 39 Economic Forecast, February 2016
Table 13: Los Angeles County Nonfarm Employment Annual averages, thousands, March 2014 benchmark
Year Total Nonfarm Employment
Natural Resources
Construction Manufacturing M fg. -- Durable
M fg .-- Nondurable
Wholesale Trade
Retail Trade Transport. & Utilities
Information
2004 4,079.1 3.8 140.2 485.9 270.1 215.9 213.4 405.5 161.2 212.02005 4,119.9 3.7 148.7 474.0 265.7 208.4 217.6 414.5 161.7 207.72006 4,194.5 4.0 157.5 464.1 259.6 204.5 224.0 423.4 165.2 205.72007 4,229.0 4.4 157.6 449.4 251.0 198.4 227.4 426.1 165.6 209.92008 4,185.4 4.4 145.2 434.7 243.3 191.3 224.1 416.6 163.1 210.42009 3,951.0 4.1 117.3 389.3 217.6 171.7 204.8 387.1 151.2 191.32010 3,890.0 4.1 104.5 373.3 207.1 166.3 203.4 386.5 150.6 191.62011 3,911.6 4.1 105.1 366.9 204.2 162.8 205.8 393.0 151.8 192.02012 4,010.5 4.3 109.2 367.4 204.3 163.1 211.9 401.0 154.5 191.52013 4,129.8 4.6 116.2 368.2 204.3 163.8 218.7 406.0 157.5 196.42014 4,226.4 4.7 120.2 364.9 203.1 161.8 223.5 414.5 162.7 195.92015 4,321.1 4.5 127.3 361.6 201.1 160.4 231.3 422.4 166.0 195.82016f 4,394.5 4.1 130.0 358.5 199.1 159.4 234.2 430.4 168.7 197.82017f 4,438.5 3.9 137.1 360.5 200.3 160.3 234.0 432.6 169.2 198.3
YearFinance & Insurance
Real Estate, Rental & Leasing
Prof, Sci & Tech Services
Mgmt. of Enterprises
Admin. & Support Srvs
Educational Services
Health Care & Social Asst
Leisure & Hospitality
Other Services Government
2004 163.1 76.7 238.0 71.2 254.0 95.5 454.3 372.8 144.7 587.12005 164.4 77.8 251.2 67.6 258.0 97.5 469.7 377.8 144.3 583.72006 167.0 79.8 264.3 63.0 272.3 99.4 481.7 388.6 145.2 589.42007 163.7 80.3 274.1 58.8 273.1 102.9 495.1 397.9 147.1 595.72008 154.0 79.4 269.8 56.7 256.8 105.1 513.9 401.6 146.1 603.72009 142.3 73.8 250.4 54.4 225.6 110.1 529.9 385.6 138.0 595.82010 137.9 71.7 245.8 53.2 229.1 111.1 526.2 384.8 136.7 579.62011 137.0 71.6 255.8 55.3 232.9 114.3 528.9 394.7 137.0 565.52012 138.8 72.2 269.0 56.7 245.9 115.7 558.6 415.4 141.7 556.82013 137.1 74.7 278.1 58.2 258.4 119.8 599.8 439.3 145.7 551.22014 133.3 76.4 282.9 59.4 267.0 122.8 625.3 464.6 151.7 556.72015 132.4 78.2 288.7 61.1 271.9 126.3 647.1 484.2 155.6 566.72016f 132.2 78.7 300.1 63.5 281.6 129.8 667.9 492.1 155.7 569.02017f 128.4 78.8 310.4 65.8 290.3 130.9 675.9 496.1 153.9 572.4
Sources: California Employment Development Department, LMID; estimates and forecasts by LAEDC.
Orange County
LAEDC Kyser Center for Economic Research 40 Economic Forecast, February 2016
ORANGE COUNTY
The Orange County economy has been one of the standout performers in California. During the current economic cycle, its unemployment rate peaked in 2010 at 9.7%, falling to an average annual rate of 4.4% in 2015. By December of last year, the unemployment rate stood at 4.1%, the lowest in Southern California and the fourth lowest in the state. In 2016, the unemployment rate is expected to decline yet further to 3.5%, the lowest since 2006 when it was 3.4%.
INTRODUCTION
At its lowest point in this cycle, Orange County total nonfarm employment fell 10.4% below the previous peak reached in 2006. Last year, rising job counts pushed nonfarm employment past its previous peak (by 1.1%) to reach 1.54 million jobs, a new record high. The largest gains were in healthcare and social assistance (up by 6,900 jobs); construction (6,500 jobs); leisure and hospitality (6,000 jobs); and professional, technical and scientific services (5,500 jobs). In 2016, total nonfarm employment in Orange County is expected to average 1.58 million jobs, a gain of 2.5% over 2015 with an additional gain of 1.7% anticipated for 2017.
Health Care: Health care is a large and integral part of the Orange County economy. Over eleven percent of the county’s wage and salary jobs are in the health care sector. Employment in 2015 rose by 4.2% to 171,600 jobs, making it the largest private sector employer in the county. In 2016, employment is expected to reach 177,500 jobs, representing an annual gain of 3.4%. The health care industry has also had a major impact on commercial real estate in the county through the expansion of medical offices and healthcare facilities. As the industry grows, healthcare organizations, insurance companies and large employers are reshaping the region’s healthcare industry as they form new partnerships and alliances to expand their reach and control costs.
TRENDS IN MAJOR INDUSTRIES
Technology and Manufacturing: Orange County has a strong high-tech manufacturing sector that includes computer and related electronic products, aerospace parts and products and medical devices. These capital-intensive sectors rely on Orange County’s highly skilled and productive workforce to remain competitive. Manufacturing employment also accounts for nearly eleven percent of total nonfarm jobs in Orange County. However, unlike the healthcare sector, which has seen jobs increase by two-thirds since 2000, manufacturing jobs have declined by two-thirds. More recently, Orange County’s manufacturing sector has experienced a small resurgence, adding jobs at a moderate pace in four of the last five years with further gains anticipated in 2016 and 2017. About 73% of manufacturing jobs in Orange County are concentrated in durable goods (computers, machinery, aerospace parts and products, and medical devices). The balance of manufacturing workers produces nondurable goods such as pharmaceuticals, apparel and food. In 2015, total manufacturing jobs in Orange County increased by 2.7%
Orange County
LAEDC Kyser Center for Economic Research 41 Economic Forecast, February 2016
to 163,100 workers with all four of Orange County’s primary manufacturing sectors showing gains compared with 2014: fabricated metal products (up by 1.2%); machinery (1.0%); computer and electronic products (5.0%); and transportation equipment – primarily aerospace (1.3%). The LAEDC anticipates manufacturing employment will average 165,100 jobs for all of 2016, increasing to 167,000 in 2017.
Real Estate and Construction: Orange County’s housing market has been recovering since 2012 but is like most parts of California and the nation in that it is still not fully normalized. Sales of existing homes (single-family and condominiums) have now risen on a year-over-year basis for nine of the past ten months. Median prices, on the other hand, have climbed year-over-year for 44 consecutive months. According to CoreLogic, the median home price in Orange County rose by 8.2% over the year in December to $630,000, which is just 4% below the previous peak reached in 2007. Strong demand (among both domestic and foreign buyers) and a lack of inventory have pushed up prices and reduced affordability, but have resulted in only a moderate pickup in new home building activity. The number of permits issued for new residential construction in 2015 increased by an estimated 7.4% to 11,428 compared with the previous year. In 2016, activity is expected to accelerate in response to job growth and rising wages, increasing to 13,600 new homes permitted, a gain of 19.0%.
The local commercial and industrial real estate markets have made significant progress over the past year. Office and industrial vacancy rates continue to decline and lease rates are on the rise throughout the county. The overall office vacancy rate decreased by 2.1 percentage points to 11.5% during the last quarter of 2015 compared with the year ago rate. Direct class A asking rents increased by 6.3% to $2.70/square foot during the same period, while occupancy gains increased for all of 2015 by 26.6% to 1.7 million square feet.
Orange County’s industrial market performed well in 2015, but it was constrained by a lack of new development. The industrial vacancy rate dropped to 2.8% during the final half of 2015, reaching a new record low. Net absorption last year was 2.4 million square feet compared with 1.7 million square feet in 2014. Meanwhile, the year closed with over 1.1 million square feet of new industrial space added to the market with an additional 625,000 square feet in development.
Non-residential building permits edged up by 1.0% to nearly $2 billion in 2015 after increasing by 49.5% during the previous year. The bulk of the value of nonresidential construction in Orange County (and elsewhere in Southern California) continues to be remodels and renovations as opposed to new structures. Leasing fundamentals are expected to further strengthen through 2016, paving the way for more substantial gains in new non-residential construction next year. For a more detailed discussion of the region’s real estate and construction sector, see the Real Estate and Construction section of this report.
Leisure and Hospitality: Tourism is one of Orange County’s most important industries and is its second largest industry employer after healthcare. The Orange County Visitor and Convention Bureau reported that over 47 million people (including 4.3 million international travelers) visited Orange County and spent $11.3 billion in 2015. Visitor counts and spending are expected to continue to increase at a moderate pace this year and next.
Orange County
LAEDC Kyser Center for Economic Research 42 Economic Forecast, February 2016
Attractions like Disneyland, Fashion Island, and the county’s spectacular beaches are drawing increasing numbers of international visitors, particularly tourists from China and the Middle East. Orange County is also a major convention destination. In the spring of 2015, the Anaheim Convention Center began work on an expansion to increase total meeting space to one million square feet. In the lodging sector, both occupancy rates and average daily room rates continue to achieve new peak levels. Countywide occupation averaged 77.8% in 2015 while the average daily room rate increased by 6.1% over the year to $156.74.19
After once again achieving record high employment levels in 2015, leisure and hospitality jobs in Orange County are projected to increase by 2.0% to 203,400 workers in 2016.
The Orange County economy has made significant headway over the last six years in terms of economic growth and job creation. As employment prospects continue to improve, the population will grow moderately, although the high cost of housing will constrain that growth. An increase in population of about 1.0% is expected this year and next. Most of the recent population growth in the county has come from natural increases (births outnumbering deaths), as opposed to migration. Along with job growth and higher incomes, rising home values all point to strong consumer spending with total taxable sales rising by 6.2% this year and next.
LOOKING AHEAD
Since the 1950s, Orange County’s economy has evolved from one based largely on agriculture to what it is today – an economy rooted in the high-tech and biomed industries, health care, tourism and professional business services. Facilitating the transformation of Orange County’s economy was its success in attracting a highly skilled workforce. Home to well regarded colleges and universities, nearly 84% of the adult population in Orange County has a high school diploma and roughly 37% has a bachelor’s degree or higher, both above the statewide average. Quality of life is another attribute in which Orange County ranks high. Orange County’s “new economy” and traditional industries alike will continue to expand, leading to economic and job growth over the forecast period, providing opportunities for the region’s talented workers.
19 2016 Southern California Lodging Forecast”, PKF Consulting USA/CRBR Hotels
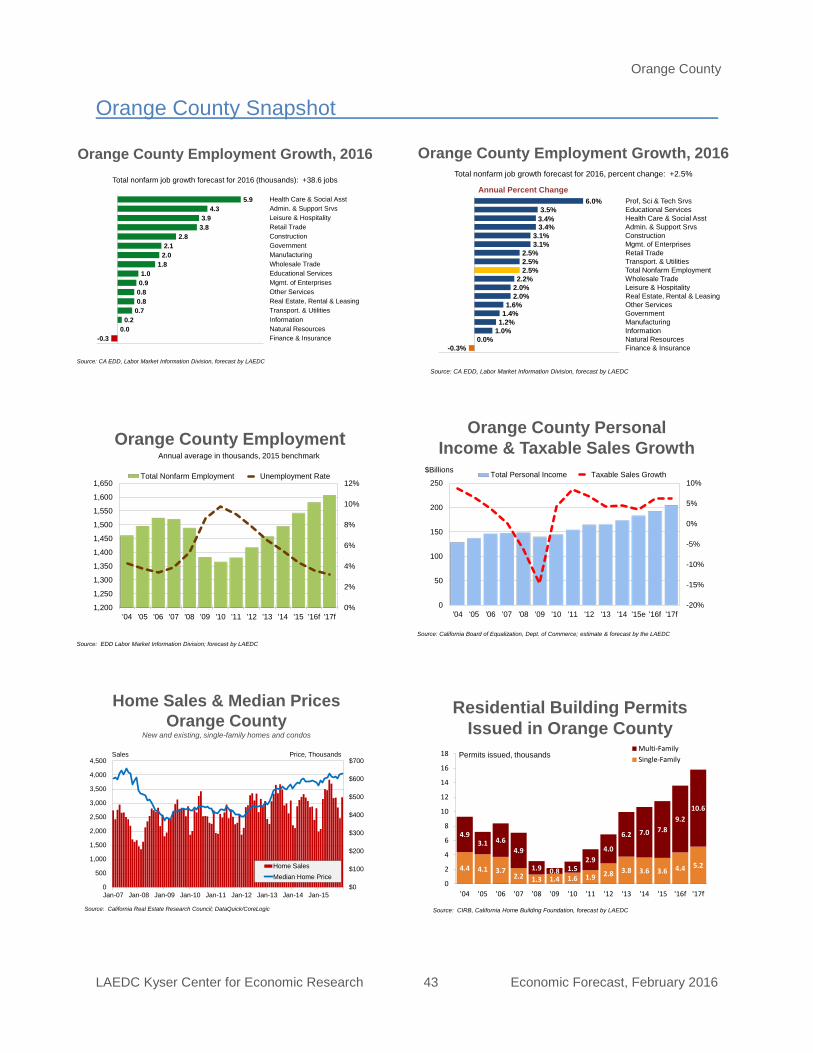
Orange County
LAEDC Kyser Center for Economic Research 43 Economic Forecast, February 2016
Orange County Employment Growth, 2016
-0.3%0.0%
1.0%1.2%1.4%1.6%
2.0%2.0%2.2%
2.5%2.5%2.5%
3.1%3.1%
3.4%3.4%3.5%
6.0%
-2.0% 0.0% 2.0% 4.0% 6.0% 8.0%
Finance & InsuranceNatural ResourcesInformationManufacturingGovernmentOther ServicesReal Estate, Rental & LeasingLeisure & HospitalityWholesale TradeTotal Nonfarm EmploymentTransport. & UtilitiesRetail TradeMgmt. of EnterprisesConstructionAdmin. & Support SrvsHealth Care & Social AsstEducational ServicesProf, Sci & Tech Srvs
Source: CA EDD, Labor Market Information Division, forecast by LAEDC
Annual Percent Change
Total nonfarm job growth forecast for 2016, percent change: +2.5%
$0
$100
$200
$300
$400
$500
$600
$700
0
500
1,000
1,500
2,000
2,500
3,000
3,500
4,000
4,500
Jan-07 Jan-08 Jan-09 Jan-10 Jan-11 Jan-12 Jan-13 Jan-14 Jan-15
Home SalesMedian Home Price
Home Sales & Median PricesOrange County
New and existing, single-family homes and condos
Sales Price, Thousands
Source: California Real Estate Research Council; DataQuick/CoreLogic
Residential Building Permits Issued in Orange County
4.4 4.1 3.72.2 1.3 1.4 1.6 1.9 2.8 3.8 3.6 3.6 4.4 5.2
4.93.1 4.6
4.9
1.9 0.8 1.52.9
4.0
6.2 7.0 7.89.2
10.6
0
2
4
6
8
10
12
14
16
18
'04 '05 '06 '07 '08 '09 '10 '11 '12 '13 '14 '15 '16f '17f
Multi-FamilySingle-FamilyPermits issued, thousands
Source: CIRB, California Home Building Foundation, forecast by LAEDC
Orange County Personal Income & Taxable Sales Growth
-20%
-15%
-10%
-5%
0%
5%
10%
0
50
100
150
200
250
'04 '05 '06 '07 '08 '09 '10 '11 '12 '13 '14 '15e '16f '17f
Total Personal Income Taxable Sales Growth$Billions
Source: California Board of Equalization, Dept. of Commerce; estimate & forecast by the LAEDC
Orange County Employment Growth, 2016
-0.30.0
0.20.70.80.80.91.0
1.82.02.1
2.83.83.9
4.35.9
-1 0 1 2 3 4 5 6 7
Finance & InsuranceNatural ResourcesInformationTransport. & UtilitiesReal Estate, Rental & LeasingOther ServicesMgmt. of EnterprisesEducational ServicesWholesale TradeManufacturingGovernmentConstructionRetail TradeLeisure & HospitalityAdmin. & Support SrvsHealth Care & Social Asst
Source: CA EDD, Labor Market Information Division, forecast by LAEDC
Total nonfarm job growth forecast for 2016 (thousands): +38.6 jobs
Orange County Snapshot
Orange County Employment
0%
2%
4%
6%
8%
10%
12%
1,200
1,250
1,300
1,350
1,400
1,450
1,500
1,550
1,600
1,650
'04 '05 '06 '07 '08 '09 '10 '11 '12 '13 '14 '15 '16f '17f
Total Nonfarm Employment Unemployment Rate
Source: EDD Labor Market Information Division; forecast by LAEDC
Annual average in thousands, 2015 benchmark
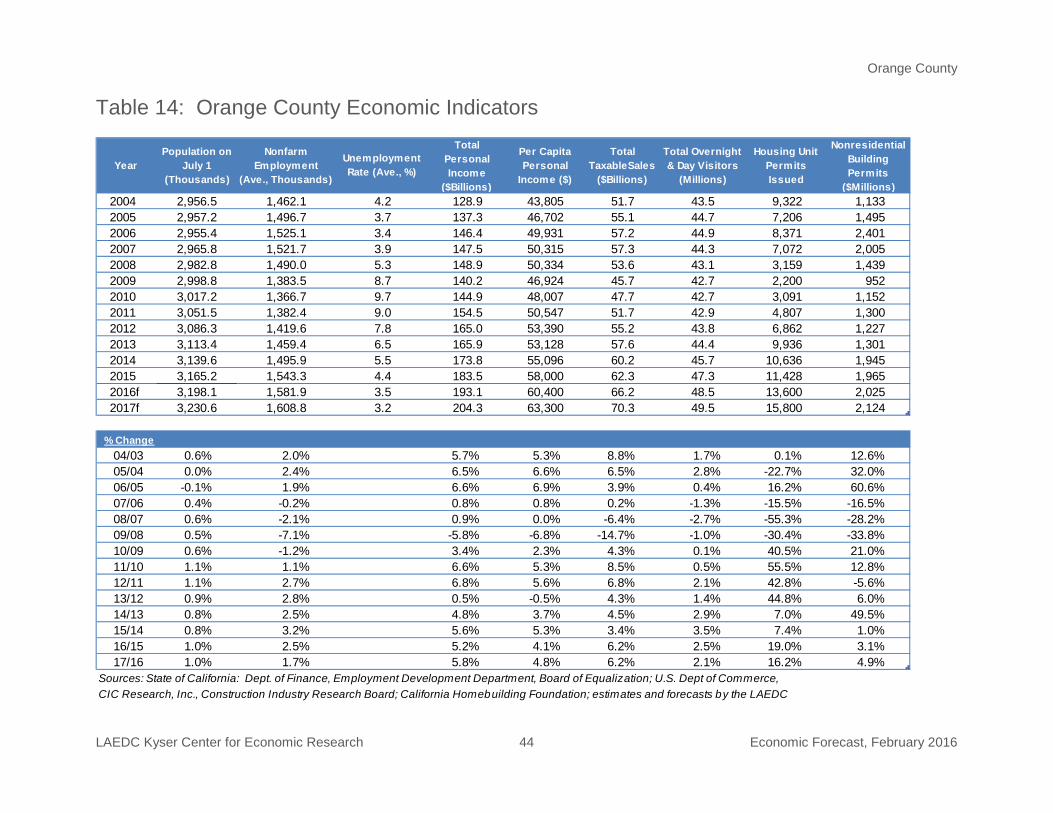
Orange County
LAEDC Kyser Center for Economic Research 44 Economic Forecast, February 2016
YearPopulation on
July 1 (Thousands)
Nonfarm Employment
(Ave., Thousands)
Unemployment Rate (Ave., %)
Total Personal Income
($Billions)
Per Capita Personal
Income ($)
Total TaxableSales
($Billions)
Total Overnight & Day Visitors
(Millions)
Housing Unit Permits Issued
Nonresidential Building Permits
($Millions)2004 2,956.5 1,462.1 4.2 128.9 43,805 51.7 43.5 9,322 1,1332005 2,957.2 1,496.7 3.7 137.3 46,702 55.1 44.7 7,206 1,4952006 2,955.4 1,525.1 3.4 146.4 49,931 57.2 44.9 8,371 2,4012007 2,965.8 1,521.7 3.9 147.5 50,315 57.3 44.3 7,072 2,0052008 2,982.8 1,490.0 5.3 148.9 50,334 53.6 43.1 3,159 1,4392009 2,998.8 1,383.5 8.7 140.2 46,924 45.7 42.7 2,200 9522010 3,017.2 1,366.7 9.7 144.9 48,007 47.7 42.7 3,091 1,1522011 3,051.5 1,382.4 9.0 154.5 50,547 51.7 42.9 4,807 1,3002012 3,086.3 1,419.6 7.8 165.0 53,390 55.2 43.8 6,862 1,2272013 3,113.4 1,459.4 6.5 165.9 53,128 57.6 44.4 9,936 1,3012014 3,139.6 1,495.9 5.5 173.8 55,096 60.2 45.7 10,636 1,9452015 3,165.2 1,543.3 4.4 183.5 58,000 62.3 47.3 11,428 1,9652016f 3,198.1 1,581.9 3.5 193.1 60,400 66.2 48.5 13,600 2,0252017f 3,230.6 1,608.8 3.2 204.3 63,300 70.3 49.5 15,800 2,124
% Change Column1 Column2 Column3 Column4 Column5 Column6 Column7 Column8 Column904/03 0.6% 2.0% 5.7% 5.3% 8.8% 1.7% 0.1% 12.6%05/04 0.0% 2.4% 6.5% 6.6% 6.5% 2.8% -22.7% 32.0%06/05 -0.1% 1.9% 6.6% 6.9% 3.9% 0.4% 16.2% 60.6%07/06 0.4% -0.2% 0.8% 0.8% 0.2% -1.3% -15.5% -16.5%08/07 0.6% -2.1% 0.9% 0.0% -6.4% -2.7% -55.3% -28.2%09/08 0.5% -7.1% -5.8% -6.8% -14.7% -1.0% -30.4% -33.8%10/09 0.6% -1.2% 3.4% 2.3% 4.3% 0.1% 40.5% 21.0%11/10 1.1% 1.1% 6.6% 5.3% 8.5% 0.5% 55.5% 12.8%12/11 1.1% 2.7% 6.8% 5.6% 6.8% 2.1% 42.8% -5.6%13/12 0.9% 2.8% 0.5% -0.5% 4.3% 1.4% 44.8% 6.0%14/13 0.8% 2.5% 4.8% 3.7% 4.5% 2.9% 7.0% 49.5%15/14 0.8% 3.2% 5.6% 5.3% 3.4% 3.5% 7.4% 1.0%16/15 1.0% 2.5% 5.2% 4.1% 6.2% 2.5% 19.0% 3.1%17/16 1.0% 1.7% 5.8% 4.8% 6.2% 2.1% 16.2% 4.9%
Sources: State of California: Dept. of Finance, Employment Development Department, Board of Equalization; U.S. Dept of Commerce, CIC Research, Inc., Construction Industry Research Board; California Homebuilding Foundation; estimates and forecasts by the LAEDC
Table 14: Orange County Economic Indicators
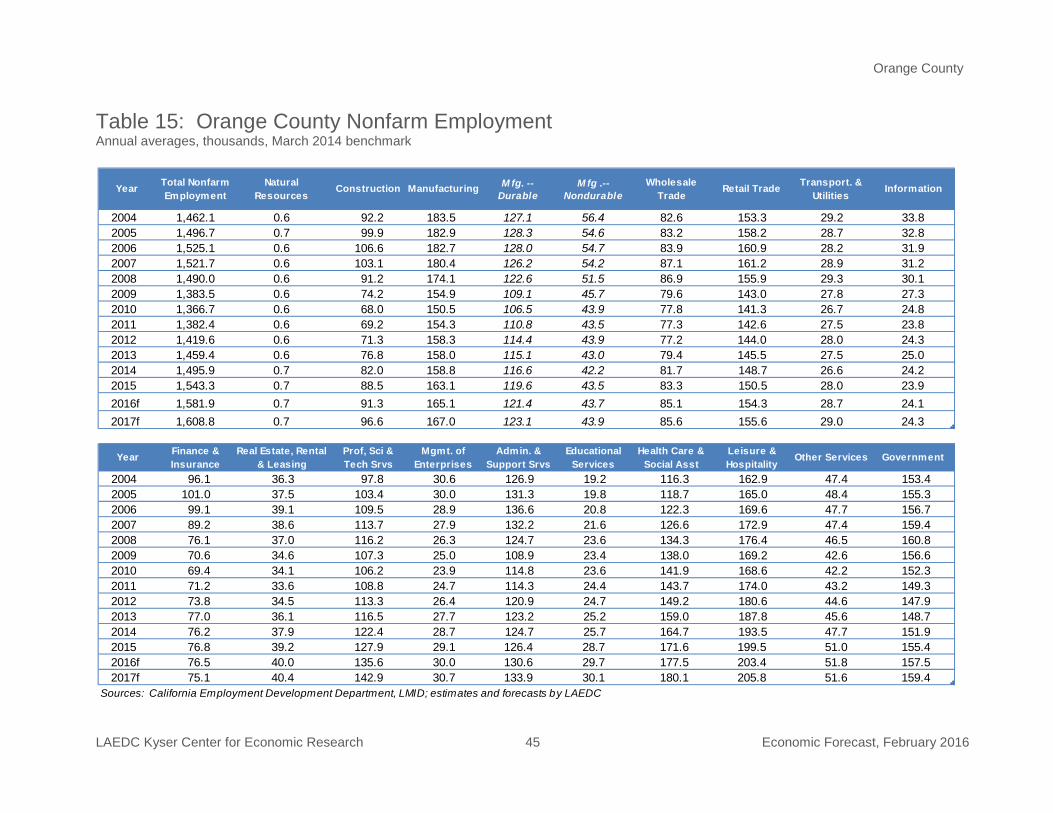
Orange County
LAEDC Kyser Center for Economic Research 45 Economic Forecast, February 2016
Year Total Nonfarm Employment
Natural Resources
Construction Manufacturing M fg. -- Durable
M fg .-- Nondurable
Wholesale Trade
Retail Trade Transport. & Utilities
Information
2004 1,462.1 0.6 92.2 183.5 127.1 56.4 82.6 153.3 29.2 33.82005 1,496.7 0.7 99.9 182.9 128.3 54.6 83.2 158.2 28.7 32.82006 1,525.1 0.6 106.6 182.7 128.0 54.7 83.9 160.9 28.2 31.92007 1,521.7 0.6 103.1 180.4 126.2 54.2 87.1 161.2 28.9 31.22008 1,490.0 0.6 91.2 174.1 122.6 51.5 86.9 155.9 29.3 30.12009 1,383.5 0.6 74.2 154.9 109.1 45.7 79.6 143.0 27.8 27.32010 1,366.7 0.6 68.0 150.5 106.5 43.9 77.8 141.3 26.7 24.82011 1,382.4 0.6 69.2 154.3 110.8 43.5 77.3 142.6 27.5 23.82012 1,419.6 0.6 71.3 158.3 114.4 43.9 77.2 144.0 28.0 24.32013 1,459.4 0.6 76.8 158.0 115.1 43.0 79.4 145.5 27.5 25.02014 1,495.9 0.7 82.0 158.8 116.6 42.2 81.7 148.7 26.6 24.22015 1,543.3 0.7 88.5 163.1 119.6 43.5 83.3 150.5 28.0 23.92016f 1,581.9 0.7 91.3 165.1 121.4 43.7 85.1 154.3 28.7 24.12017f 1,608.8 0.7 96.6 167.0 123.1 43.9 85.6 155.6 29.0 24.3
Year Finance & Insurance
Real Estate, Rental & Leasing
Prof, Sci & Tech Srvs
Mgmt. of Enterprises
Admin. & Support Srvs
Educational Services
Health Care & Social Asst
Leisure & Hospitality
Other Services Government
2004 96.1 36.3 97.8 30.6 126.9 19.2 116.3 162.9 47.4 153.42005 101.0 37.5 103.4 30.0 131.3 19.8 118.7 165.0 48.4 155.32006 99.1 39.1 109.5 28.9 136.6 20.8 122.3 169.6 47.7 156.72007 89.2 38.6 113.7 27.9 132.2 21.6 126.6 172.9 47.4 159.42008 76.1 37.0 116.2 26.3 124.7 23.6 134.3 176.4 46.5 160.82009 70.6 34.6 107.3 25.0 108.9 23.4 138.0 169.2 42.6 156.62010 69.4 34.1 106.2 23.9 114.8 23.6 141.9 168.6 42.2 152.32011 71.2 33.6 108.8 24.7 114.3 24.4 143.7 174.0 43.2 149.32012 73.8 34.5 113.3 26.4 120.9 24.7 149.2 180.6 44.6 147.92013 77.0 36.1 116.5 27.7 123.2 25.2 159.0 187.8 45.6 148.72014 76.2 37.9 122.4 28.7 124.7 25.7 164.7 193.5 47.7 151.92015 76.8 39.2 127.9 29.1 126.4 28.7 171.6 199.5 51.0 155.42016f 76.5 40.0 135.6 30.0 130.6 29.7 177.5 203.4 51.8 157.52017f 75.1 40.4 142.9 30.7 133.9 30.1 180.1 205.8 51.6 159.4
Sources: California Employment Development Department, LMID; estimates and forecasts by LAEDC
Table 15: Orange County Nonfarm Employment Annual averages, thousands, March 2014 benchmark
Riverside and San Bernardino Counties
LAEDC Kyser Center for Economic Research 46 Economic Forecast, February 2016
RIVERSIDE AND SAN BERNARDINO COUNTIES
Job growth in the Inland Empire, as the combined Riverside County-San Bernardino County region is known, outpaced the state and the rest of Southern California for the fourth year in a row in 2015. This has been a welcome development, as the Inland Empire suffered a more severe blow during the Great Recession and took longer to turn around. Job gains have brought the unemployment rate down and contributed to rising personal income, which has supported growth in a number of consumer-driven industries.
INTRODUCTION
Wage and salary (nonfarm) jobs in the Inland Empire grew at a rate of 3.8% in 2015, outpacing the state’s 3.0% growth rate during the same year. With 1.33 million jobs in 2015, the region has finally surpassed the prerecession annual peak of 1.29 million jobs from 2007, about six years after the technical end of the recession.
The unemployment rate in 2015 fell to 6.5%, down from 8.2% a year earlier, and down significantly from the recession-era peak of 13.7% in 2010. Job creation accounted for most of the decline in the unemployment rate last year, as the labor force increased by 1.2% from 2014 to 2015.
The composition of employment gains in the Inland Empire was broad-based with many strong performers, including business and professional services, goods movement, leisure and hospitality, construction and manufacturing. Manufacturing had its largest gains since 2004, growing by 3.9% last year. Noteworthy increases also occurred in construction and government, the latter finally recovering from the job cuts in the wake of the recession when local government coffers were severely depleted.
While consumer-serving industries such as leisure and hospitality have seen large gains in absolute terms, other business-serving industries (transportation and warehousing, wholesale trade, professional, scientific and technical services) have also added jobs. Administrative, support and waste services led the way, growing by 9.4% on a year-over-year basis while professional, scientific and technical services grew by 7.5% in 2015. Meanwhile, natural resources and mining and information lost jobs during the course of the year, not unlike many other parts of Southern California.
Goods Movement: The goods movement industry includes transportation and warehousing along with wholesaling. The industry employed over 150,000 workers in the Inland Empire in 2015, accounting for almost 12% of total nonfarm employment. Last year, transportation and warehousing employment rose by 6,400 jobs to 93,700, an annual gain of 7.3%. Wholesale trade added 3,600 jobs (a 6.1% yearly gain) over the same period, with employment averaging 62,600 jobs in 2015.
TRENDS IN MAJOR INDUSTRIES
Over the last two years, with the national economy moving forward, the region’s goods movement industry has benefited from an increase in activity at the Ports of Los Angeles and Long Beach. The number of containers passing through the twin ports hovered
Riverside and San Bernardino Counties
LAEDC Kyser Center for Economic Research 47 Economic Forecast, February 2016
around 14 million from 2010 through 2012, but jumped by 3.8% to 15.2 million in 2014, and edged up by 1.6% to 15.4 million in 2015, despite labor disputes and port congestion. The outlook for 2016 is a modest gain of 1.6% to 15.6 million containers. Accordingly, transportation and warehousing employment along with wholesaling should hit new record highs in 2016 and in 2017.
Real Estate: The Inland Empire is a relatively affordable alternative to the more expensive coastal regions of Southern California. Last year, the region’s housing market performed well, with job growth and low interest rates driving demand. In December, home sales were up by 6.8% over the year. The median price of a home in Riverside County returned to levels that were last seen in early 2008, with a 2015 median price of $310,500. The median price of a home in San Bernardino County was $272,000, also roughly on par with home prices in early 2008. Overall, the Inland Empire continued to see steady price appreciation for the fourth year in a row. Price increases have been due to limited supplies of homes for sale, and to rising demand resulting form higher incomes and demographic pressures.
On the supply side, low inventories have constrained sales. The unsold inventory (supply) of existing homes in Riverside County was just 4.4 months in December while the figure for San Bernardino was 3.5 months. Both readings were higher than a year ago, but continue to be somewhat below long-run average levels. Demand has been hindered by declining affordability and stricter underwriting standards.
New home construction responded to tight market conditions and higher home prices in 2013 with a 46.3% increase in housing permits. This trend was expected to continue through 2014 and into 2015, but uncertainty about the future direction of the market depressed homebuilding activity in 2015, which fell by 4.7%. With pent-up demand expected to speed up the housing market over the next two years, permits for new home construction should advance more quickly, with an increase of 22.1% expected in 2016 followed by a gain of 24.6% in 2017. Permit levels will remain well below peak levels of the last decade, however. About three out of four homes built in 2015 were single-family homes, a pattern that should continue into 2016 and 2017.
The Inland Empire housing market will register additional gains in 2016. The supply of new and existing homes for sale should increase in response to stronger demand as the population grows and as the financial condition of households in the region improves. In turn, both higher home prices and sales are expected. For a more detailed discussion of the region’s housing market, see the Real Estate and Construction section of this report.
Riverside and San Bernardino Counties
LAEDC Kyser Center for Economic Research 48 Economic Forecast, February 2016
LOOKING AHEAD
While job growth in 2015 did not acheive the 4.3% growth rate of the previous year, the 3.8% increase was still among the fastest in the state. Employment should expand by an additional 3.1% in 2016 before slowing to 2.6% in 2017, with annual wage and salary employment expected to hit a new high this year.
As the region’s industries grow over this year and next, the unemployment rate will fall from 6.6% in 2015 to 5.6% this year and 5.1% in 2017, well below the 8.8% average since 2004. As the economy moves forward and population growth accelerates, personal income will grow by 5.5% in 2016 and 6.3% in 2017, and give rise to further gains in taxable sales and continued job growth in population-serving industries.
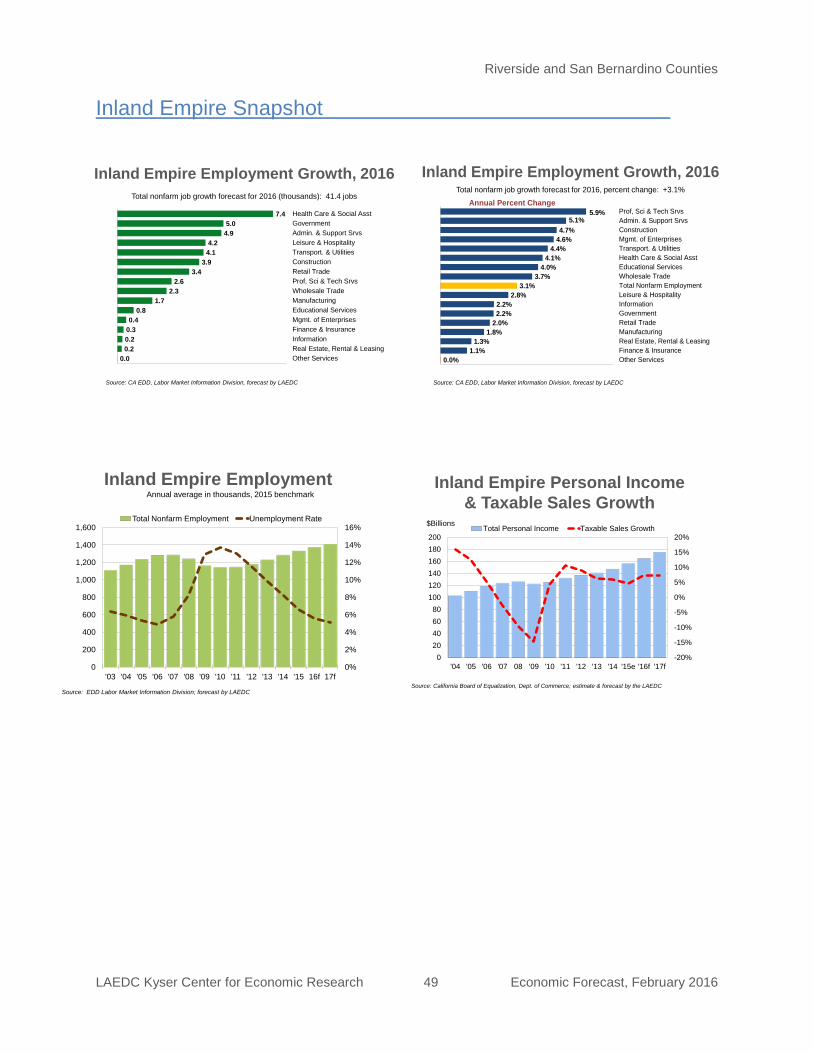
Riverside and San Bernardino Counties
LAEDC Kyser Center for Economic Research 49 Economic Forecast, February 2016
Inland Empire Employment Growth, 2016
0.00.20.20.30.4
0.81.7
2.32.6
3.43.9
4.14.2
4.95.0
7.4
0 0 0 0 0 0 0 0 0
Other ServicesReal Estate, Rental & LeasingInformationFinance & InsuranceMgmt. of EnterprisesEducational ServicesManufacturingWholesale TradeProf, Sci & Tech SrvsRetail TradeConstructionTransport. & UtilitiesLeisure & HospitalityAdmin. & Support SrvsGovernmentHealth Care & Social Asst
Source: CA EDD, Labor Market Information Division, forecast by LAEDC
Total nonfarm job growth forecast for 2016 (thousands): 41.4 jobs
Inland Empire Employment Growth, 2016
0.0%1.1%
1.3%1.8%
2.0%2.2%2.2%
2.8%3.1%
3.7%4.0%
4.1%4.4%
4.6%4.7%
5.1%5.9%
0.0% 1.0% 2.0% 3.0% 4.0% 5.0% 6.0% 7.0%
Other ServicesFinance & InsuranceReal Estate, Rental & LeasingManufacturingRetail TradeGovernmentInformationLeisure & HospitalityTotal Nonfarm EmploymentWholesale TradeEducational ServicesHealth Care & Social AsstTransport. & UtilitiesMgmt. of EnterprisesConstructionAdmin. & Support SrvsProf, Sci & Tech Srvs
Source: CA EDD, Labor Market Information Division, forecast by LAEDC
Annual Percent ChangeTotal nonfarm job growth forecast for 2016, percent change: +3.1%
Inland Empire Employment
0%
2%
4%
6%
8%
10%
12%
14%
16%
0
200
400
600
800
1,000
1,200
1,400
1,600
'03 '04 '05 '06 '07 '08 '09 '10 '11 '12 '13 '14 '15 16f 17f
Total Nonfarm Employment Unemployment Rate
Source: EDD Labor Market Information Division; forecast by LAEDC
Annual average in thousands, 2015 benchmarkInland Empire Personal Income
& Taxable Sales Growth
-20%
-15%
-10%
-5%
0%
5%
10%
15%
20%
020406080
100120140160180200
'04 '05 '06 '07 08 '09 '10 '11 '12 '13 '14 '15e '16f '17f
Total Personal Income Taxable Sales Growth$Billions
Source: California Board of Equalization, Dept. of Commerce; estimate & forecast by the LAEDC
Inland Empire Snapshot
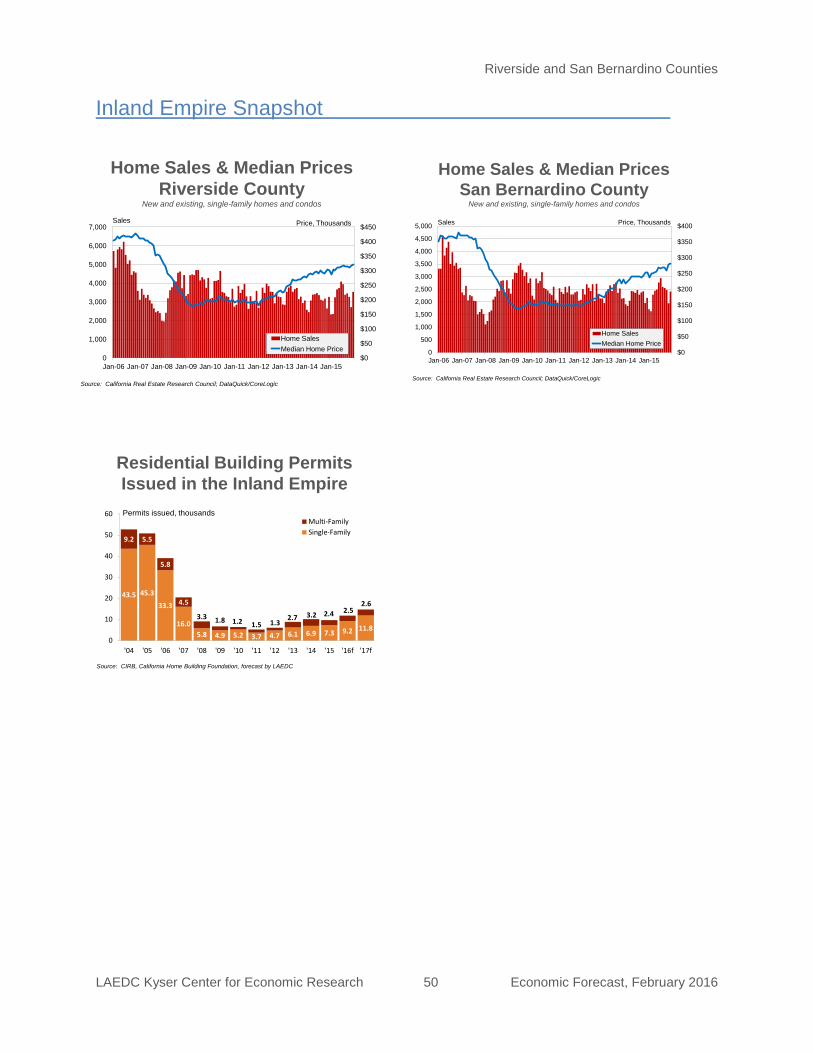
Riverside and San Bernardino Counties
LAEDC Kyser Center for Economic Research 50 Economic Forecast, February 2016
$0
$50
$100
$150
$200
$250
$300
$350
$400
0
500
1,000
1,500
2,000
2,500
3,000
3,500
4,000
4,500
5,000
Jan-06 Jan-07 Jan-08 Jan-09 Jan-10 Jan-11 Jan-12 Jan-13 Jan-14 Jan-15
Home SalesMedian Home Price
Home Sales & Median PricesSan Bernardino County
New and existing, single-family homes and condos
Sales Price, Thousands
Source: California Real Estate Research Council; DataQuick/CoreLogic
Residential Building Permits Issued in the Inland Empire
43.5 45.3
33.3
16.05.8 4.9 5.2 3.7 4.7 6.1 6.9 7.3 9.2 11.8
9.2 5.5
5.8
4.5
3.3 1.8 1.2 1.5 1.32.7 3.2 2.4 2.5
2.6
0
10
20
30
40
50
60
'04 '05 '06 '07 '08 '09 '10 '11 '12 '13 '14 '15 '16f '17f
Multi-FamilySingle-Family
Permits issued, thousands
Source: CIRB, California Home Building Foundation, forecast by LAEDC
$0
$50
$100
$150
$200
$250
$300
$350
$400
$450
0
1,000
2,000
3,000
4,000
5,000
6,000
7,000
Jan-06 Jan-07 Jan-08 Jan-09 Jan-10 Jan-11 Jan-12 Jan-13 Jan-14 Jan-15
Home SalesMedian Home Price
Home Sales & Median PricesRiverside County
New and existing, single-family homes and condos
Sales Price, Thousands
Source: California Real Estate Research Council; DataQuick/CoreLogic
Inland Empire Snapshot
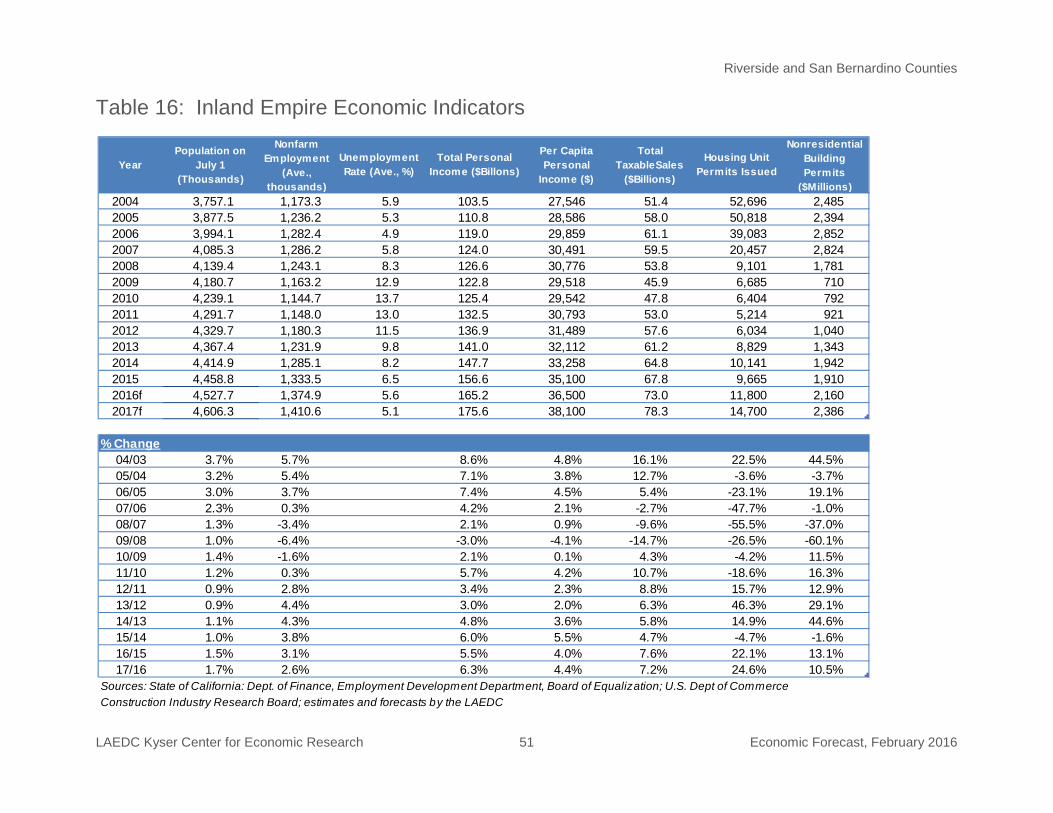
Riverside and San Bernardino Counties
LAEDC Kyser Center for Economic Research 51 Economic Forecast, February 2016
Table 16: Inland Empire Economic Indicators
YearPopulation on
July 1 (Thousands)
Nonfarm Employment
(Ave., thousands)
Unemployment Rate (Ave., %)
Total Personal Income ($Billons)
Per Capita Personal
Income ($)
Total TaxableSales
($Billions)
Housing Unit Permits Issued
Nonresidential Building Permits
($Millions)2004 3,757.1 1,173.3 5.9 103.5 27,546 51.4 52,696 2,4852005 3,877.5 1,236.2 5.3 110.8 28,586 58.0 50,818 2,3942006 3,994.1 1,282.4 4.9 119.0 29,859 61.1 39,083 2,8522007 4,085.3 1,286.2 5.8 124.0 30,491 59.5 20,457 2,8242008 4,139.4 1,243.1 8.3 126.6 30,776 53.8 9,101 1,7812009 4,180.7 1,163.2 12.9 122.8 29,518 45.9 6,685 7102010 4,239.1 1,144.7 13.7 125.4 29,542 47.8 6,404 7922011 4,291.7 1,148.0 13.0 132.5 30,793 53.0 5,214 9212012 4,329.7 1,180.3 11.5 136.9 31,489 57.6 6,034 1,0402013 4,367.4 1,231.9 9.8 141.0 32,112 61.2 8,829 1,3432014 4,414.9 1,285.1 8.2 147.7 33,258 64.8 10,141 1,9422015 4,458.8 1,333.5 6.5 156.6 35,100 67.8 9,665 1,9102016f 4,527.7 1,374.9 5.6 165.2 36,500 73.0 11,800 2,1602017f 4,606.3 1,410.6 5.1 175.6 38,100 78.3 14,700 2,386
% Change Column1 Column2 Column3 Column4 Column5 Column6 Column7 Column804/03 3.7% 5.7% 8.6% 4.8% 16.1% 22.5% 44.5%05/04 3.2% 5.4% 7.1% 3.8% 12.7% -3.6% -3.7%06/05 3.0% 3.7% 7.4% 4.5% 5.4% -23.1% 19.1%07/06 2.3% 0.3% 4.2% 2.1% -2.7% -47.7% -1.0%08/07 1.3% -3.4% 2.1% 0.9% -9.6% -55.5% -37.0%09/08 1.0% -6.4% -3.0% -4.1% -14.7% -26.5% -60.1%10/09 1.4% -1.6% 2.1% 0.1% 4.3% -4.2% 11.5%11/10 1.2% 0.3% 5.7% 4.2% 10.7% -18.6% 16.3%12/11 0.9% 2.8% 3.4% 2.3% 8.8% 15.7% 12.9%13/12 0.9% 4.4% 3.0% 2.0% 6.3% 46.3% 29.1%14/13 1.1% 4.3% 4.8% 3.6% 5.8% 14.9% 44.6%15/14 1.0% 3.8% 6.0% 5.5% 4.7% -4.7% -1.6%16/15 1.5% 3.1% 5.5% 4.0% 7.6% 22.1% 13.1%17/16 1.7% 2.6% 6.3% 4.4% 7.2% 24.6% 10.5%
Sources: State of California: Dept. of Finance, Employment Development Department, Board of Equalization; U.S. Dept of CommerceConstruction Industry Research Board; estimates and forecasts by the LAEDC
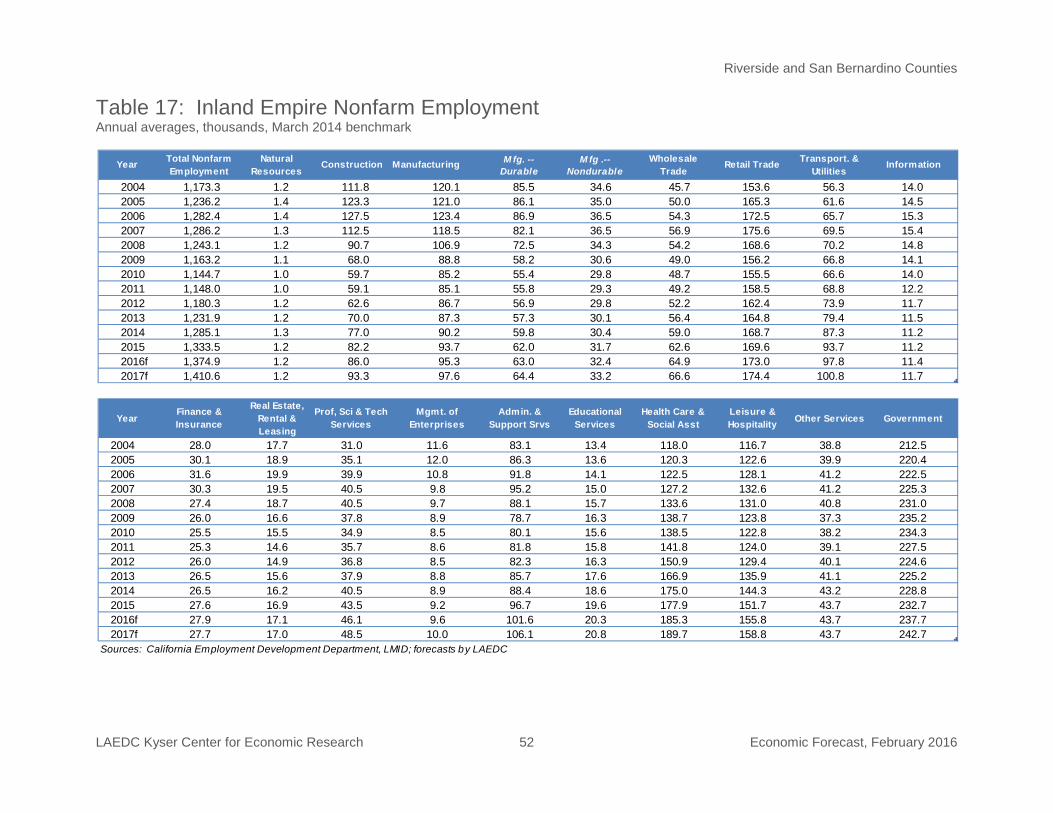
Riverside and San Bernardino Counties
LAEDC Kyser Center for Economic Research 52 Economic Forecast, February 2016
Year Total Nonfarm Employment
Natural Resources
Construction Manufacturing M fg. -- Durable
M fg .-- Nondurable
Wholesale Trade
Retail Trade Transport. & Utilities
Information
2004 1,173.3 1.2 111.8 120.1 85.5 34.6 45.7 153.6 56.3 14.02005 1,236.2 1.4 123.3 121.0 86.1 35.0 50.0 165.3 61.6 14.52006 1,282.4 1.4 127.5 123.4 86.9 36.5 54.3 172.5 65.7 15.32007 1,286.2 1.3 112.5 118.5 82.1 36.5 56.9 175.6 69.5 15.42008 1,243.1 1.2 90.7 106.9 72.5 34.3 54.2 168.6 70.2 14.82009 1,163.2 1.1 68.0 88.8 58.2 30.6 49.0 156.2 66.8 14.12010 1,144.7 1.0 59.7 85.2 55.4 29.8 48.7 155.5 66.6 14.02011 1,148.0 1.0 59.1 85.1 55.8 29.3 49.2 158.5 68.8 12.22012 1,180.3 1.2 62.6 86.7 56.9 29.8 52.2 162.4 73.9 11.72013 1,231.9 1.2 70.0 87.3 57.3 30.1 56.4 164.8 79.4 11.52014 1,285.1 1.3 77.0 90.2 59.8 30.4 59.0 168.7 87.3 11.22015 1,333.5 1.2 82.2 93.7 62.0 31.7 62.6 169.6 93.7 11.22016f 1,374.9 1.2 86.0 95.3 63.0 32.4 64.9 173.0 97.8 11.42017f 1,410.6 1.2 93.3 97.6 64.4 33.2 66.6 174.4 100.8 11.7
YearFinance & Insurance
Real Estate, Rental & Leasing
Prof, Sci & Tech Services
Mgmt. of Enterprises
Admin. & Support Srvs
Educational Services
Health Care & Social Asst
Leisure & Hospitality Other Services Government
2004 28.0 17.7 31.0 11.6 83.1 13.4 118.0 116.7 38.8 212.52005 30.1 18.9 35.1 12.0 86.3 13.6 120.3 122.6 39.9 220.42006 31.6 19.9 39.9 10.8 91.8 14.1 122.5 128.1 41.2 222.52007 30.3 19.5 40.5 9.8 95.2 15.0 127.2 132.6 41.2 225.32008 27.4 18.7 40.5 9.7 88.1 15.7 133.6 131.0 40.8 231.02009 26.0 16.6 37.8 8.9 78.7 16.3 138.7 123.8 37.3 235.22010 25.5 15.5 34.9 8.5 80.1 15.6 138.5 122.8 38.2 234.32011 25.3 14.6 35.7 8.6 81.8 15.8 141.8 124.0 39.1 227.52012 26.0 14.9 36.8 8.5 82.3 16.3 150.9 129.4 40.1 224.62013 26.5 15.6 37.9 8.8 85.7 17.6 166.9 135.9 41.1 225.22014 26.5 16.2 40.5 8.9 88.4 18.6 175.0 144.3 43.2 228.82015 27.6 16.9 43.5 9.2 96.7 19.6 177.9 151.7 43.7 232.72016f 27.9 17.1 46.1 9.6 101.6 20.3 185.3 155.8 43.7 237.72017f 27.7 17.0 48.5 10.0 106.1 20.8 189.7 158.8 43.7 242.7
Sources: California Employment Development Department, LMID; forecasts by LAEDC
Table 17: Inland Empire Nonfarm Employment Annual averages, thousands, March 2014 benchmark
San Diego County
LAEDC Kyser Center for Economic Research 53 Economic Forecast, February 2016
SAN DIEGO COUNTY
With 3.3 million residents, San Diego County is the second largest in California in terms of population. The City of San Diego is the largest of the county’s 18 cities, and is second in population in the state after the City of Los Angeles. With several companies engaged in life sciences and technology as well as a number of higher education institutions, the county’s residents have higher levels of educational attainment compared to the state as a whole.
INTRODUCTION
The county added 41,400 wage and salary (nonfarm) jobs, increasing its job base from 1.35 million in 2014 to 1.39 million in 2015. This corresponded to a 3.1% annual growth rate, which outpaced the nation (2.1%) and edged out the state (3.0%). In turn, the county’s unemployment rate fell from 6.4% a year ago to 5.1% in 2015, well below the long run rate of 6.0%. The county will see continued job gains this year and next, with a 2.5% gain expected this year followed by a more modest 1.8% increase next year. Job gains will contribute to a lower unemployment rate, which will fall to 4.2% this year and 3.9% next year. Economic gains and increases in population tend to go hand in hand, so it is no surprise that population growth in San Diego County will accelerate from 0.9% in 2015 to 1.2% both this year and next. Ninety percent of the county’s population growth last year came from natural increases (births outnumbering deaths), markedly higher than in previous years. Migration’s (mostly international) contribution to population growth will likely increase this year and next, Along with job and population gains, the county will also see increases in per capita income (mid-four percent this year and next), which in turn will trigger higher consumer spending as measured by total taxable sales.
Last year was a good one for San Diego’s housing market. The median price for all homes was $475,000 in December, up 8.0% from a year earlier but still shy of the January 2006 peak of $510,000. Sales for all of 2015 rose by 9.0% over the previous year, consistent with the trend for California as a whole. New home construction rose sharply in 2015 after a drop the year before. Building permits rose by 52.2% from 6,603 units in 2014 to 10,049 units in 2015. Significant increases are expected this year and next, supported by increases in income, demographics, and an urgency to beat higher rates in the future. For a more detailed discussion of the region’s housing market, see the Real Estate and Construction section of this report.
Every industry in the county added jobs last year except for mining and logging, which was flat. The biggest percentage gains showed up in professional, scientific, and technical services (6.6%), construction (6.5%), and real estate, rental, and leasing (4.9%). In absolute terms, professional, scientific and technical services added the largest number of jobs (8,600), followed by health care and social assistance (7,000), and
TRENDS IN MAJOR INDUSTRIES
San Diego County
LAEDC Kyser Center for Economic Research 54 Economic Forecast, February 2016
leisure and hospitality (6,500 jobs). Job gains in the government sector accelerated in response to the improved fiscal circumstances of state and local jurisdictions. Most industries are expected to add jobs in 2016, led once again by professional, scientific, and technical services, health care and social services, and leisure and hospitality.
Aerospace and Defense: San Diego County’s transportation equipment industry has close ties to the local defense sector. It includes both aerospace and ship building. Transportation equipment manufacturing jobs edged up from 14,400 jobs in 2014 to 15,400 jobs in 2015, mainly because of increases in ship building. The Pentagon budget outlook remains uncertain, but much of the work being done by local contractors is related to work on systems should continue in the near future regardless of the overall budget picture: cyber security, intelligence surveillance, defense-related electronics and software and unmanned aerial systems.
Agriculture: San Diego County farm employment rose 3.0% last year from 10,000 jobs in 2014 to 10,300 in 2015. County crop sales totaled $1.82 billion in 2014 (the latest available), just shy of the $1.85 billion record from 2013.20 The largest commercial crops were ornamental trees and shrubs, followed by indoor flowering and foliage plants. San Diego growers do face challenges in the coming years, the most significant being high land costs and uncertainty about the cost and supply of water.
Biotechnology and Health Care: San Diego’s life sciences sector benefits from its close ties to the area’s research institutions and from the county’s long-standing efforts to support and grow the industry. During the fourth quarter of 2015, San Diego County ranked third in the nation in the total amount of life sciences venture capital received.21
The county’s health care and social assistance industry is expanding, similar to the trend elsewhere in the state. The industry employed 163,500 workers in 2015, up 7,000 jobs (4.5%) from a year earlier. Job gains were distributed across ambulatory and health care services, hospitals, and nursing and residential care facilities. With its advanced treatment and diagnostic facilities, San Diego is a center for both medical research and medical services.
Tourism and Hospitality: Last year was expected to be another record year for San Diego’s travel and tourism industry, with estimated visitor expenditures increasing by seven percent to $9.9 billion. The number of visitors hit a record high of 34.2 million in 2015, and is expected to hit record high levels again this year and next. 22
Hotel occupancy rates and average daily rates will continue to rise over this year and next. With demand for hotel rooms outpacing new supply, several new hotels are being built across the county while existing hotels are undergoing extensive renovations.
20 San Diego Farm Bureau, San Diego Crop Statistics and Annual Report, 2014
21 PwC MoneyTree
22 San Diego Tourism Authority
San Diego County
LAEDC Kyser Center for Economic Research 55 Economic Forecast, February 2016
With continued growth in tourism and in the local economy as a whole, leisure and hospitality employment will grow through 2016. Leisure and hospitality is expected to increase by 2.7%, from 183,300 jobs in 2015 to 188,200 this year, followed by a 1.5% (2,900 jobs) gain expected next year.
In the near future, San Diego’s economy is expected to match or exceed the state’s pace of job growth and experience job gains across most of its industries. This will cut the county’s unemployment rate from 5.1% in 2015 to 4.2% in 2016, with the rate dropping below 4% in 2017. The region will continue to benefit from its role as an innovation hub for telecommunications, medical devices and life sciences, and high-tech manufacturing. Moreover, San Diego will remain a popular travel destination.
LOOKING AHEAD
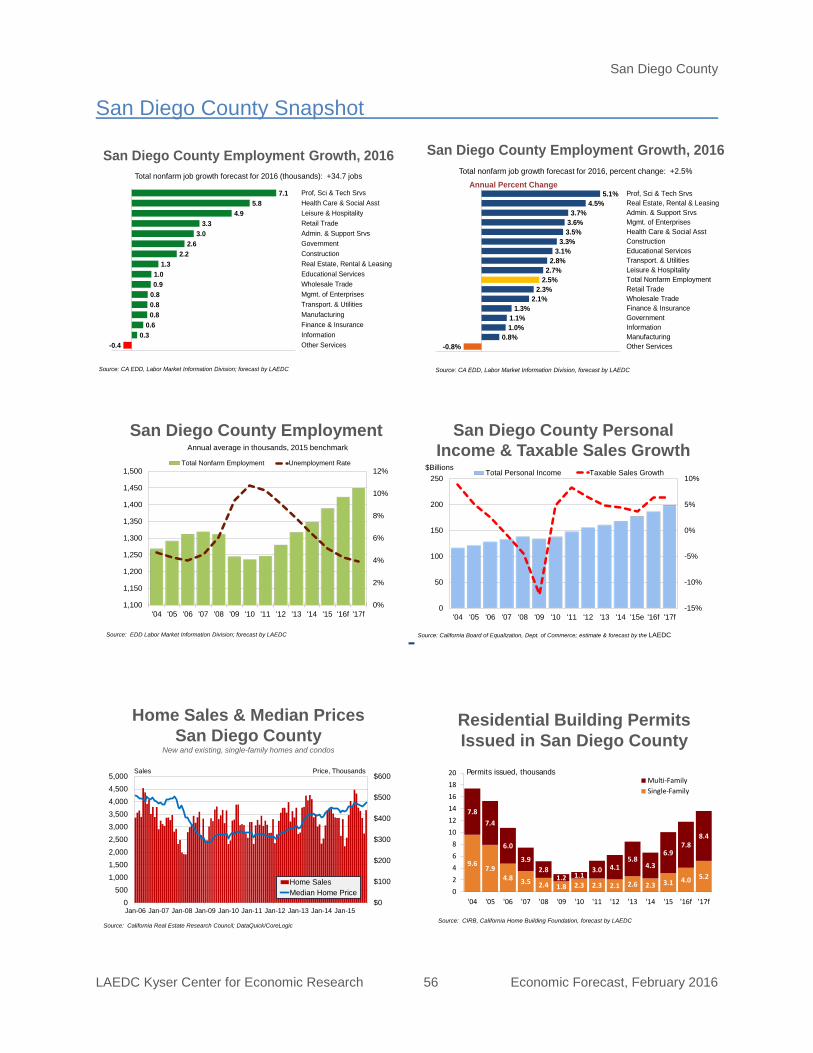
San Diego County
LAEDC Kyser Center for Economic Research 56 Economic Forecast, February 2016
San Diego County Employment Growth, 2016
-0.8%0.8%
1.0%1.1%
1.3%2.1%
2.3%2.5%2.7%
2.8%3.1%
3.3%3.5%3.6%3.7%
4.5%5.1%
-2.0% -1.0% 0.0% 1.0% 2.0% 3.0% 4.0% 5.0% 6.0%
Other ServicesManufacturingInformationGovernmentFinance & InsuranceWholesale TradeRetail TradeTotal Nonfarm EmploymentLeisure & HospitalityTransport. & UtilitiesEducational ServicesConstructionHealth Care & Social AsstMgmt. of EnterprisesAdmin. & Support SrvsReal Estate, Rental & LeasingProf, Sci & Tech Srvs
Source: CA EDD, Labor Market Information Division, forecast by LAEDC
Total nonfarm job growth forecast for 2016, percent change: +2.5%
Annual Percent Change
San Diego County Employment Growth, 2016
-0.40.3
0.60.80.80.80.91.0
1.32.2
2.63.0
3.34.9
5.87.1
-1 0 1 2 3 4 5 6 7 8
Other ServicesInformationFinance & InsuranceManufacturingTransport. & UtilitiesMgmt. of EnterprisesWholesale TradeEducational ServicesReal Estate, Rental & LeasingConstructionGovernmentAdmin. & Support SrvsRetail TradeLeisure & HospitalityHealth Care & Social AsstProf, Sci & Tech Srvs
Source: CA EDD, Labor Market Information Division; forecast by LAEDC
Total nonfarm job growth forecast for 2016 (thousands): +34.7 jobs
$0
$100
$200
$300
$400
$500
$600
0500
1,0001,5002,0002,5003,0003,5004,0004,5005,000
Jan-06 Jan-07 Jan-08 Jan-09 Jan-10 Jan-11 Jan-12 Jan-13 Jan-14 Jan-15
Home SalesMedian Home Price
Sales Price, Thousands
Source: California Real Estate Research Council; DataQuick/CoreLogic
Home Sales & Median PricesSan Diego County
New and existing, single-family homes and condos
Residential Building Permits Issued in San Diego County
9.67.9
4.8 3.5 2.4 1.8 2.3 2.3 2.1 2.6 2.3 3.1 4.0 5.2
7.87.4
6.0
3.92.8
1.2 1.13.0 4.1
5.84.3
6.97.8
8.4
02468
101214161820
'04 '05 '06 '07 '08 '09 '10 '11 '12 '13 '14 '15 '16f '17f
Multi-FamilySingle-Family
Permits issued, thousands
Source: CIRB, California Home Building Foundation, forecast by LAEDC
San Diego County Snapshot
San Diego County Employment
0%
2%
4%
6%
8%
10%
12%
1,100
1,150
1,200
1,250
1,300
1,350
1,400
1,450
1,500
'04 '05 '06 '07 '08 '09 '10 '11 '12 '13 '14 '15 '16f '17f
Total Nonfarm Employment Unemployment Rate
Source: EDD Labor Market Information Division; forecast by LAEDC
Annual average in thousands, 2015 benchmark
San Diego County Personal Income & Taxable Sales Growth
-15%
-10%
-5%
0%
5%
10%
0
50
100
150
200
250
'04 '05 '06 '07 '08 '09 '10 '11 '12 '13 '14 '15e '16f '17f
Total Personal Income Taxable Sales Growth$Billions
Source: California Board of Equalization, Dept. of Commerce; estimate & forecast by the LAEDC
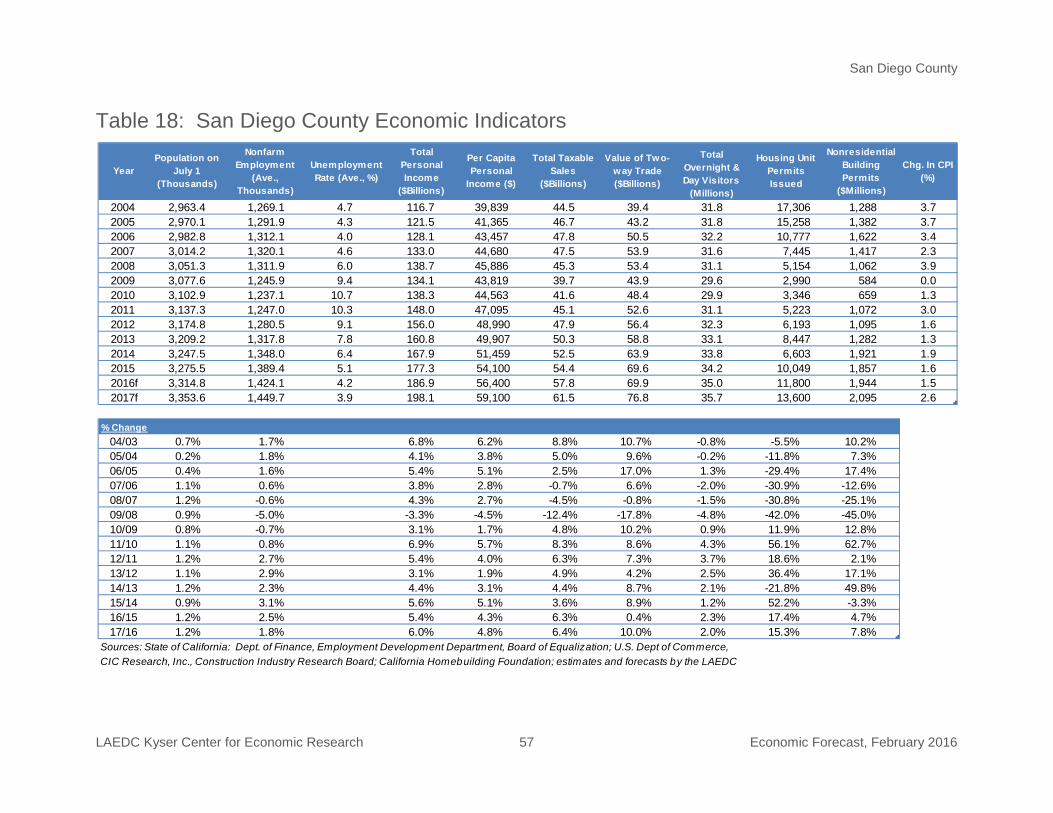
San Diego County
LAEDC Kyser Center for Economic Research 57 Economic Forecast, February 2016
YearPopulation on
July 1 (Thousands)
Nonfarm Employment
(Ave., Thousands)
Unemployment Rate (Ave., %)
Total Personal Income
($Billions)
Per Capita Personal
Income ($)
Total Taxable Sales
($Billions)
Value of Two-way Trade ($Billions)
Total Overnight & Day Visitors
(Millions)
Housing Unit Permits Issued
Nonresidential Building Permits
($Millions)
Chg. In CPI (%)
2004 2,963.4 1,269.1 4.7 116.7 39,839 44.5 39.4 31.8 17,306 1,288 3.72005 2,970.1 1,291.9 4.3 121.5 41,365 46.7 43.2 31.8 15,258 1,382 3.72006 2,982.8 1,312.1 4.0 128.1 43,457 47.8 50.5 32.2 10,777 1,622 3.42007 3,014.2 1,320.1 4.6 133.0 44,680 47.5 53.9 31.6 7,445 1,417 2.32008 3,051.3 1,311.9 6.0 138.7 45,886 45.3 53.4 31.1 5,154 1,062 3.92009 3,077.6 1,245.9 9.4 134.1 43,819 39.7 43.9 29.6 2,990 584 0.02010 3,102.9 1,237.1 10.7 138.3 44,563 41.6 48.4 29.9 3,346 659 1.32011 3,137.3 1,247.0 10.3 148.0 47,095 45.1 52.6 31.1 5,223 1,072 3.02012 3,174.8 1,280.5 9.1 156.0 48,990 47.9 56.4 32.3 6,193 1,095 1.62013 3,209.2 1,317.8 7.8 160.8 49,907 50.3 58.8 33.1 8,447 1,282 1.32014 3,247.5 1,348.0 6.4 167.9 51,459 52.5 63.9 33.8 6,603 1,921 1.92015 3,275.5 1,389.4 5.1 177.3 54,100 54.4 69.6 34.2 10,049 1,857 1.62016f 3,314.8 1,424.1 4.2 186.9 56,400 57.8 69.9 35.0 11,800 1,944 1.52017f 3,353.6 1,449.7 3.9 198.1 59,100 61.5 76.8 35.7 13,600 2,095 2.6
% Change Column1 Column2 Column3 Column4 Column5 Column6 Column7 Column8 Column9 Column1004/03 0.7% 1.7% 6.8% 6.2% 8.8% 10.7% -0.8% -5.5% 10.2%05/04 0.2% 1.8% 4.1% 3.8% 5.0% 9.6% -0.2% -11.8% 7.3%06/05 0.4% 1.6% 5.4% 5.1% 2.5% 17.0% 1.3% -29.4% 17.4%07/06 1.1% 0.6% 3.8% 2.8% -0.7% 6.6% -2.0% -30.9% -12.6%08/07 1.2% -0.6% 4.3% 2.7% -4.5% -0.8% -1.5% -30.8% -25.1%09/08 0.9% -5.0% -3.3% -4.5% -12.4% -17.8% -4.8% -42.0% -45.0%10/09 0.8% -0.7% 3.1% 1.7% 4.8% 10.2% 0.9% 11.9% 12.8%11/10 1.1% 0.8% 6.9% 5.7% 8.3% 8.6% 4.3% 56.1% 62.7%12/11 1.2% 2.7% 5.4% 4.0% 6.3% 7.3% 3.7% 18.6% 2.1%13/12 1.1% 2.9% 3.1% 1.9% 4.9% 4.2% 2.5% 36.4% 17.1%14/13 1.2% 2.3% 4.4% 3.1% 4.4% 8.7% 2.1% -21.8% 49.8%15/14 0.9% 3.1% 5.6% 5.1% 3.6% 8.9% 1.2% 52.2% -3.3%16/15 1.2% 2.5% 5.4% 4.3% 6.3% 0.4% 2.3% 17.4% 4.7%17/16 1.2% 1.8% 6.0% 4.8% 6.4% 10.0% 2.0% 15.3% 7.8%
Sources: State of California: Dept. of Finance, Employment Development Department, Board of Equalization; U.S. Dept of Commerce, CIC Research, Inc., Construction Industry Research Board; California Homebuilding Foundation; estimates and forecasts by the LAEDC
Table 18: San Diego County Economic Indicators
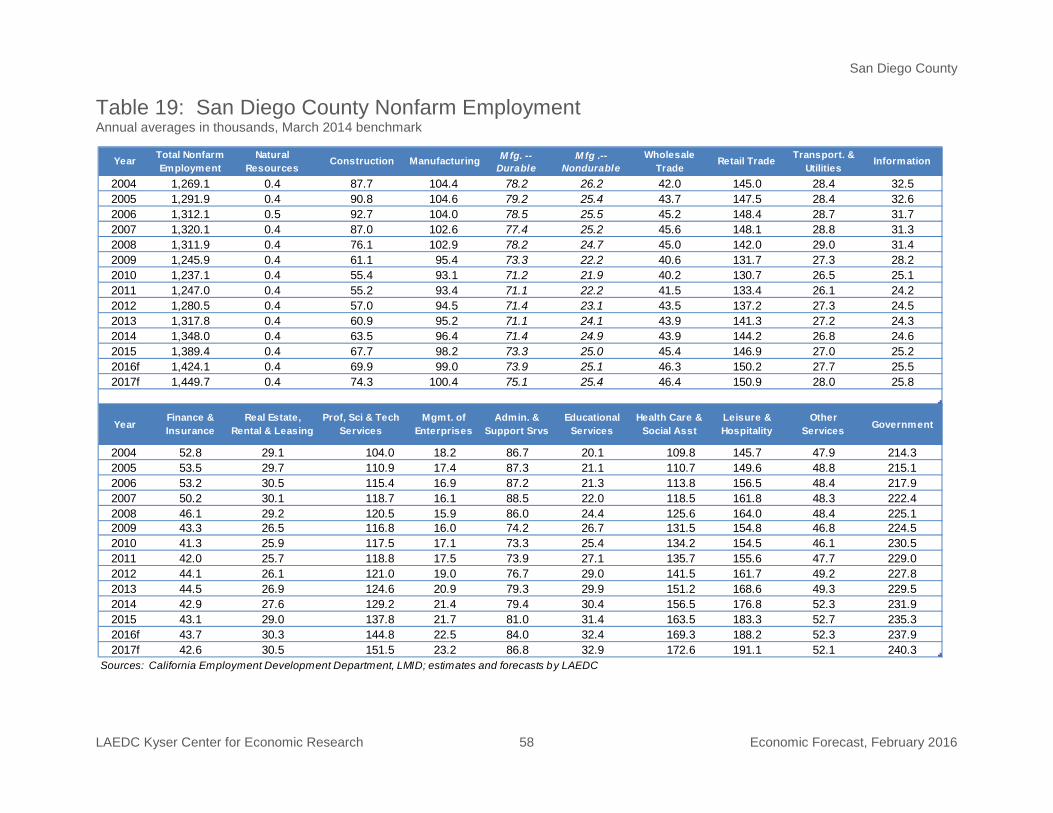
San Diego County
LAEDC Kyser Center for Economic Research 58 Economic Forecast, February 2016
Year Total Nonfarm Employment
Natural Resources
Construction Manufacturing M fg. -- Durable
M fg .-- Nondurable
Wholesale Trade
Retail Trade Transport. & Utilities
Information
2004 1,269.1 0.4 87.7 104.4 78.2 26.2 42.0 145.0 28.4 32.52005 1,291.9 0.4 90.8 104.6 79.2 25.4 43.7 147.5 28.4 32.62006 1,312.1 0.5 92.7 104.0 78.5 25.5 45.2 148.4 28.7 31.72007 1,320.1 0.4 87.0 102.6 77.4 25.2 45.6 148.1 28.8 31.32008 1,311.9 0.4 76.1 102.9 78.2 24.7 45.0 142.0 29.0 31.42009 1,245.9 0.4 61.1 95.4 73.3 22.2 40.6 131.7 27.3 28.22010 1,237.1 0.4 55.4 93.1 71.2 21.9 40.2 130.7 26.5 25.12011 1,247.0 0.4 55.2 93.4 71.1 22.2 41.5 133.4 26.1 24.22012 1,280.5 0.4 57.0 94.5 71.4 23.1 43.5 137.2 27.3 24.52013 1,317.8 0.4 60.9 95.2 71.1 24.1 43.9 141.3 27.2 24.32014 1,348.0 0.4 63.5 96.4 71.4 24.9 43.9 144.2 26.8 24.62015 1,389.4 0.4 67.7 98.2 73.3 25.0 45.4 146.9 27.0 25.22016f 1,424.1 0.4 69.9 99.0 73.9 25.1 46.3 150.2 27.7 25.52017f 1,449.7 0.4 74.3 100.4 75.1 25.4 46.4 150.9 28.0 25.8
YearFinance & Insurance
Real Estate, Rental & Leasing
Prof, Sci & Tech Services
Mgmt. of Enterprises
Admin. & Support Srvs
Educational Services
Health Care & Social Asst
Leisure & Hospitality
Other Services Government
2004 52.8 29.1 104.0 18.2 86.7 20.1 109.8 145.7 47.9 214.32005 53.5 29.7 110.9 17.4 87.3 21.1 110.7 149.6 48.8 215.12006 53.2 30.5 115.4 16.9 87.2 21.3 113.8 156.5 48.4 217.92007 50.2 30.1 118.7 16.1 88.5 22.0 118.5 161.8 48.3 222.42008 46.1 29.2 120.5 15.9 86.0 24.4 125.6 164.0 48.4 225.12009 43.3 26.5 116.8 16.0 74.2 26.7 131.5 154.8 46.8 224.52010 41.3 25.9 117.5 17.1 73.3 25.4 134.2 154.5 46.1 230.52011 42.0 25.7 118.8 17.5 73.9 27.1 135.7 155.6 47.7 229.02012 44.1 26.1 121.0 19.0 76.7 29.0 141.5 161.7 49.2 227.82013 44.5 26.9 124.6 20.9 79.3 29.9 151.2 168.6 49.3 229.52014 42.9 27.6 129.2 21.4 79.4 30.4 156.5 176.8 52.3 231.92015 43.1 29.0 137.8 21.7 81.0 31.4 163.5 183.3 52.7 235.32016f 43.7 30.3 144.8 22.5 84.0 32.4 169.3 188.2 52.3 237.92017f 42.6 30.5 151.5 23.2 86.8 32.9 172.6 191.1 52.1 240.3
Sources: California Employment Development Department, LMID; estimates and forecasts by LAEDC
Table 19: San Diego County Nonfarm Employment Annual averages in thousands, March 2014 benchmark
Ventura County
LAEDC Kyser Center for Economic Research 59 Economic Forecast, February 2016
VENTURA COUNTY
Ventura County is the smallest of the counties in the Los Angeles five-county area based on population, but it is home to a broad array of industries, including agriculture, professional business services, technology and tourism. Proximity to one of the world’s leading wine growing regions and 43 miles of coastline attracts large numbers of visitors, many of whom make the quick trip up from Southern California for a weekend getaway.
INTRODUCTION
Ventura County is not only a port of call for travelers, but also a shipping hub for automobiles and agricultural goods. Port Hueneme serves as a distribution hub for automobile manufacturers and is a collection point for many agricultural goods that are shipped throughout the nation. Port Hueneme handled 5.3 million tons of cargo in 2015, up by 0.7% from 2014. In 2015, two-way trade was valued at $9.9 billion, an increase of 7.5% from a year earlier. On an annual basis, Ventura County’s unemployment rate continued to decline, dropping over a full percentage point from 6.7% in 2014 to 5.5% in 2015. However, within the Tri-Counties area, Ventura lags behind both San Louis Obispo County (4.6%) and Santa Barbara County (5.1%). While 5.5% is the lowest unemployment rate recorded in Ventura since 2008, it is still just shy of prerecession levels. The LAEDC expects that the unemployment rate will fall to 4.8% in 2016 and to 4.6% in 2017, levels not seen since the mid-2000s. In 2015, nonfarm employment grew by 1.7% (5,000 jobs) averaging 298,000 jobs over the year. Despite adding jobs over the last five years, nonfarm employment in 2015 was still 900 jobs short of the peak in 2006. The LAEDC forecasts Ventura County will surpass its prerecession peak in 2016, with projected growth of 1.6% this year and 1.5% in 2017. The increase in hiring has been led by a surge in professional, scientific and technical services (up by 10.8%), where many tech-related occupations tend to show up. The industry accounted for roughly one out of every three net new jobs added in 2015 following a flat performance in 2014. Health care and social assistance also accounted for one-third of net job gains, expanding by 5.0% last year, up from 1.7% in 2014. Leisure and hospitality continued to be a major contributor to local job growth, with growth in the three percent range for the third year in a row. Slow and steady improvement in other major industries such as construction, retail trade and government services offset declining employment in the manufacturing sector.
TRENDS IN MAJOR INDUSTRIES
Tourism: Ventura is an ideal destination for tourists looking for an alternative to the higher-priced Santa Barbara area. Benefits include the short distance from Los Angeles County and more affordable lodging.
Ventura County
LAEDC Kyser Center for Economic Research 60 Economic Forecast, February 2016
Occupancy rates reached 73.7% in 2015, compared with 72.3% a year earlier. Average daily room rates also edged up, rising to $118.26 in 2015 from $109.43 in 2014. Further gains are expected in 2016. The number of occupied rooms is expected to remain flat this year, while market occupancy rates should reach 74.5%. Average daily room rates are expected to rise by 5.3%,while revenue per available room should increase by 6.5% to $92.81. Hotel supply has remained largely unchanged since 2013 and while several projects are in the pipeline through 2016, they were not recorded into 2015 estimates and the 2016 forecast for room supply and their effects on occupancy rates because these projects are not scheduled to actually open until possibly 2017.23
Housing and Consumer Spending: Ventura County’s housing market continues to improve. Sales of existing homes were strong in 2015, with double-digit growth. With increasing demand, median prices have been steadily growing on a year-over-year basis for much of the last four years. The median price of an existing single-family home in Ventura County was $491,000 in December 2015, up by 2.9% compared with a year ago. New home building has slowed in 2015 as permits issued for new construction fell 3.9% below 2014 levels. With steady gains in the housing market expected over the next two years, new home construction should gain momentum, with a 19.3% increase in permits expected in 2016 and a 25.0% jump in 2016.
LOOKING AHEAD
The LAEDC forecasts total personal income will rise by 4.7% this year and by 5.4% in 2015. As long as job growth continues at its current pace, per capita income will grow by 4.0% this year and by 4.6% in 2017. Consumer spending is expected to see strong gains this year and next as the labor market continues to strengthen and personal income rises. The Ventura County economy will advance unevenly over the next two years. The LAEDC forecasts job growth in professional, scientific and technical services, and administration, waste and support services to lead the way. These two sectors make up a large part of the professional and business services sector, which is expected to produce one-third of net job gains in both 2016 and 2017. Construction, health care and social assistance, and government should continue to be steady contributors. A mixed performance is expected for the remaining industries.
23 “2016 Southern California Lodging Forecast”, PKF Consulting
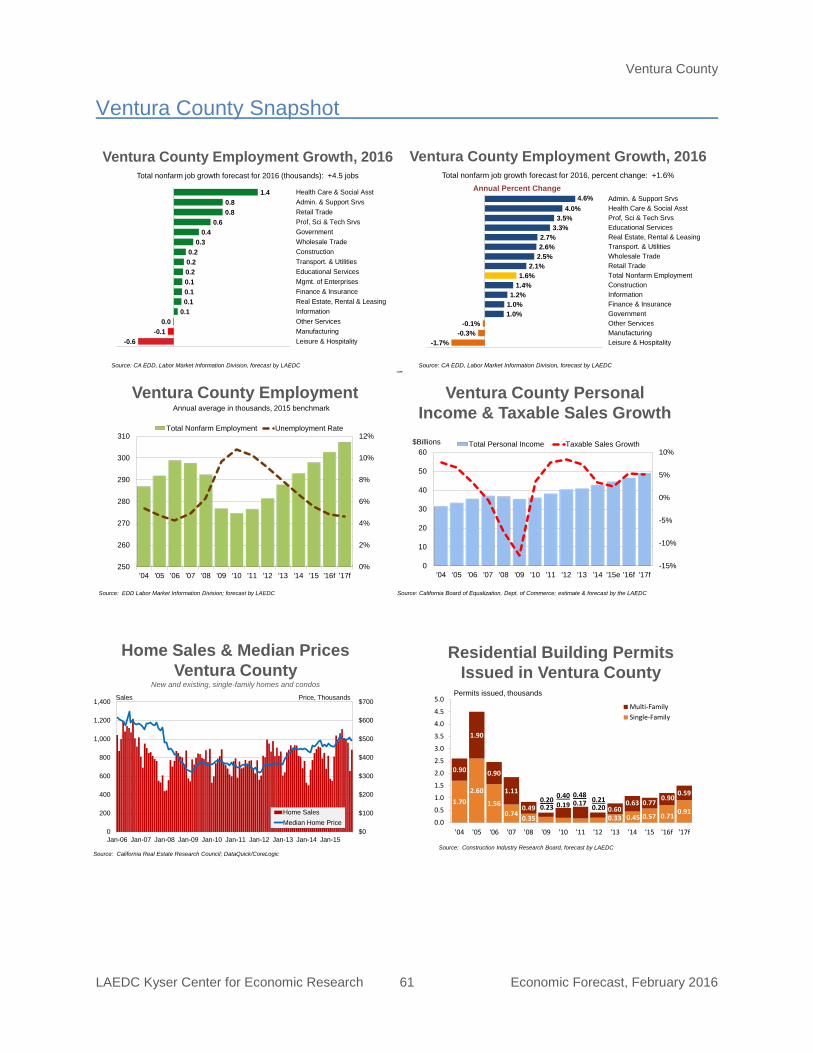
Ventura County
LAEDC Kyser Center for Economic Research 61 Economic Forecast, February 2016
$0
$100
$200
$300
$400
$500
$600
$700
0
200
400
600
800
1,000
1,200
1,400
Jan-06 Jan-07 Jan-08 Jan-09 Jan-10 Jan-11 Jan-12 Jan-13 Jan-14 Jan-15
Home SalesMedian Home Price
Home Sales & Median PricesVentura County
New and existing, single-family homes and condos
Sales Price, Thousands
Source: California Real Estate Research Council; DataQuick/CoreLogic
Residential Building Permits Issued in Ventura County
1.702.60
1.560.74 0.35
0.23 0.19 0.17 0.200.33 0.45 0.57 0.71 0.91
0.90
1.90
0.90
1.11
0.490.20 0.40 0.48
0.210.60
0.63 0.770.90
0.59
0.0
0.5
1.0
1.5
2.0
2.5
3.0
3.5
4.0
4.5
5.0
'04 '05 '06 '07 '08 '09 '10 '11 '12 '13 '14 '15 '16f '17f
Multi-FamilySingle-Family
Permits issued, thousands
Source: Construction Industry Research Board, forecast by LAEDC
Ventura County Snapshot
Ventura County Employment Growth, 2016
Source: CA EDD, Labor Market Information Division, forecast by LAEDC
Total nonfarm job growth forecast for 2016 (thousands): +4.5 jobs
-0.6-0.1
0.00.10.10.10.10.20.20.2
0.30.4
0.60.80.8
1.4
-1.0 -0.5 0.0 0.5 1.0 1.5 2.0
Leisure & HospitalityManufacturingOther ServicesInformationReal Estate, Rental & LeasingFinance & InsuranceMgmt. of EnterprisesEducational ServicesTransport. & UtilitiesConstructionWholesale TradeGovernmentProf, Sci & Tech SrvsRetail TradeAdmin. & Support SrvsHealth Care & Social Asst
Ventura County Employment Growth, 2016
-1.7%-0.3%
-0.1%1.0%1.0%1.2%
1.4%1.6%
2.1%2.5%2.6%2.7%
3.3%3.5%
4.0%4.6%
-3.0% -2.0% -1.0% 0.0% 1.0% 2.0% 3.0% 4.0% 5.0% 6.0%
Leisure & HospitalityManufacturingOther ServicesGovernmentFinance & InsuranceInformationConstructionTotal Nonfarm EmploymentRetail TradeWholesale TradeTransport. & UtilitiesReal Estate, Rental & LeasingEducational ServicesProf, Sci & Tech SrvsHealth Care & Social AsstAdmin. & Support Srvs
Source: CA EDD, Labor Market Information Division, forecast by LAEDC
Annual Percent ChangeTotal nonfarm job growth forecast for 2016, percent change: +1.6%
Ventura County Employment
0%
2%
4%
6%
8%
10%
12%
250
260
270
280
290
300
310
'04 '05 '06 '07 '08 '09 '10 '11 '12 '13 '14 '15 '16f '17f
Total Nonfarm Employment Unemployment Rate
Source: EDD Labor Market Information Division; forecast by LAEDC
Annual average in thousands, 2015 benchmarkVentura County Personal
Income & Taxable Sales Growth
-15%
-10%
-5%
0%
5%
10%
0
10
20
30
40
50
60
'04 '05 '06 '07 '08 '09 '10 '11 '12 '13 '14 '15e '16f '17f
Total Personal Income Taxable Sales Growth$Billions
Source: California Board of Equalization, Dept. of Commerce; estimate & forecast by the LAEDC
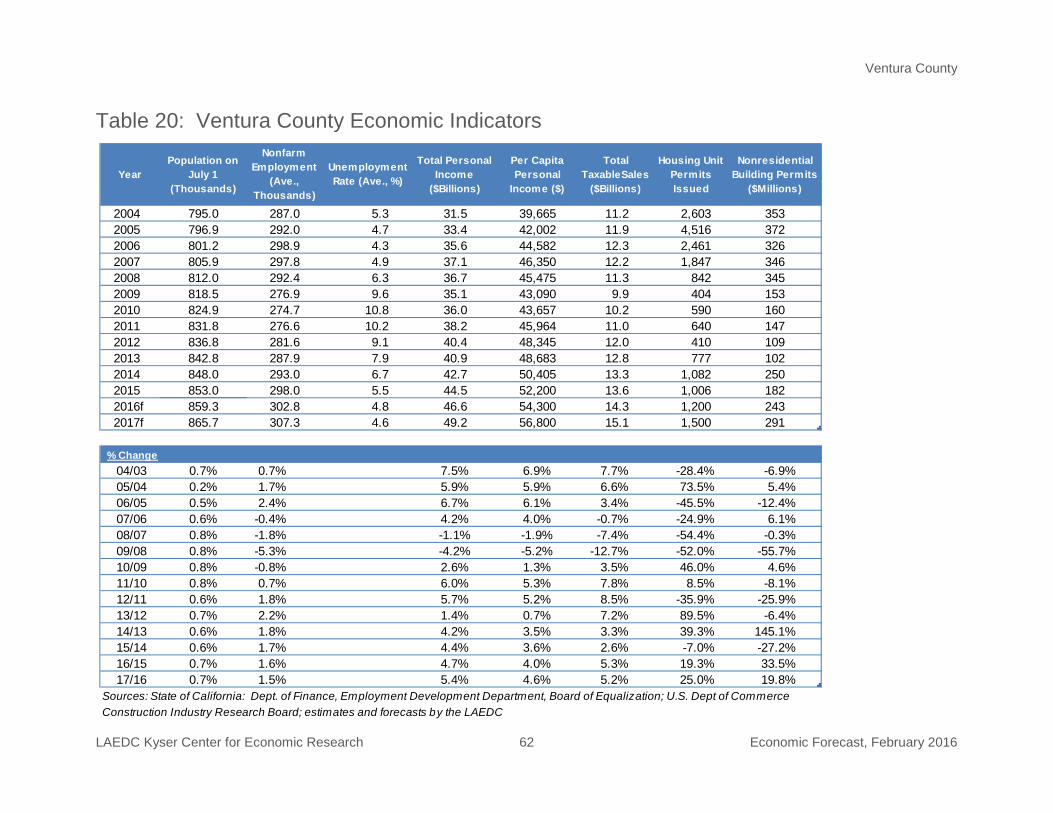
Ventura County
LAEDC Kyser Center for Economic Research 62 Economic Forecast, February 2016
YearPopulation on
July 1 (Thousands)
Nonfarm Employment
(Ave., Thousands)
Unemployment Rate (Ave., %)
Total Personal Income
($Billions)
Per Capita Personal
Income ($)
Total TaxableSales
($Billions)
Housing Unit Permits Issued
Nonresidential Building Permits
($Millions)
2004 795.0 287.0 5.3 31.5 39,665 11.2 2,603 3532005 796.9 292.0 4.7 33.4 42,002 11.9 4,516 3722006 801.2 298.9 4.3 35.6 44,582 12.3 2,461 3262007 805.9 297.8 4.9 37.1 46,350 12.2 1,847 3462008 812.0 292.4 6.3 36.7 45,475 11.3 842 3452009 818.5 276.9 9.6 35.1 43,090 9.9 404 1532010 824.9 274.7 10.8 36.0 43,657 10.2 590 1602011 831.8 276.6 10.2 38.2 45,964 11.0 640 1472012 836.8 281.6 9.1 40.4 48,345 12.0 410 1092013 842.8 287.9 7.9 40.9 48,683 12.8 777 1022014 848.0 293.0 6.7 42.7 50,405 13.3 1,082 2502015 853.0 298.0 5.5 44.5 52,200 13.6 1,006 1822016f 859.3 302.8 4.8 46.6 54,300 14.3 1,200 2432017f 865.7 307.3 4.6 49.2 56,800 15.1 1,500 291
% Change Column1 Column2 Column3 Column4 Column5 Column6 Column7 Column804/03 0.7% 0.7% 7.5% 6.9% 7.7% -28.4% -6.9%05/04 0.2% 1.7% 5.9% 5.9% 6.6% 73.5% 5.4%06/05 0.5% 2.4% 6.7% 6.1% 3.4% -45.5% -12.4%07/06 0.6% -0.4% 4.2% 4.0% -0.7% -24.9% 6.1%08/07 0.8% -1.8% -1.1% -1.9% -7.4% -54.4% -0.3%09/08 0.8% -5.3% -4.2% -5.2% -12.7% -52.0% -55.7%10/09 0.8% -0.8% 2.6% 1.3% 3.5% 46.0% 4.6%11/10 0.8% 0.7% 6.0% 5.3% 7.8% 8.5% -8.1%12/11 0.6% 1.8% 5.7% 5.2% 8.5% -35.9% -25.9%13/12 0.7% 2.2% 1.4% 0.7% 7.2% 89.5% -6.4%14/13 0.6% 1.8% 4.2% 3.5% 3.3% 39.3% 145.1%15/14 0.6% 1.7% 4.4% 3.6% 2.6% -7.0% -27.2%16/15 0.7% 1.6% 4.7% 4.0% 5.3% 19.3% 33.5%17/16 0.7% 1.5% 5.4% 4.6% 5.2% 25.0% 19.8%
Sources: State of California: Dept. of Finance, Employment Development Department, Board of Equalization; U.S. Dept of CommerceConstruction Industry Research Board; estimates and forecasts by the LAEDC
Table 20: Ventura County Economic Indicators
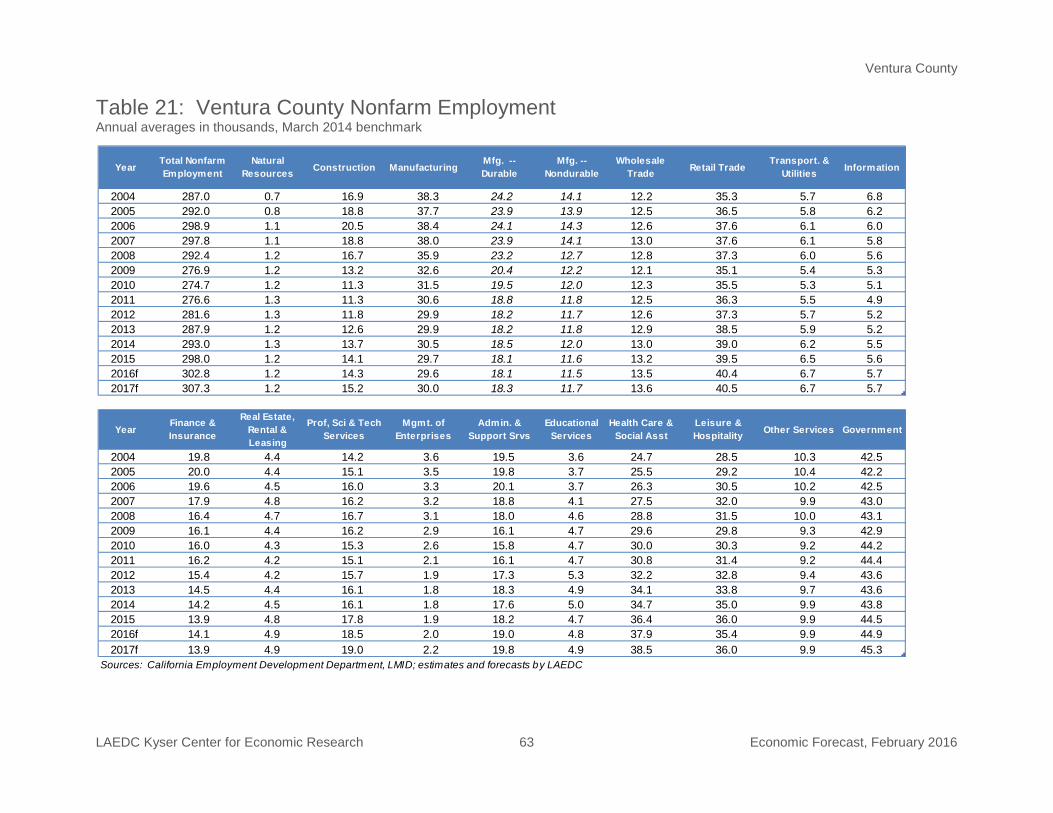
Ventura County
LAEDC Kyser Center for Economic Research 63 Economic Forecast, February 2016
YearTotal Nonfarm Employment
Natural Resources Construction Manufacturing
Mfg. -- Durable
Mfg. -- Nondurable
Wholesale Trade Retail Trade
Transport. & Utilities Information
2004 287.0 0.7 16.9 38.3 24.2 14.1 12.2 35.3 5.7 6.82005 292.0 0.8 18.8 37.7 23.9 13.9 12.5 36.5 5.8 6.22006 298.9 1.1 20.5 38.4 24.1 14.3 12.6 37.6 6.1 6.02007 297.8 1.1 18.8 38.0 23.9 14.1 13.0 37.6 6.1 5.82008 292.4 1.2 16.7 35.9 23.2 12.7 12.8 37.3 6.0 5.62009 276.9 1.2 13.2 32.6 20.4 12.2 12.1 35.1 5.4 5.32010 274.7 1.2 11.3 31.5 19.5 12.0 12.3 35.5 5.3 5.12011 276.6 1.3 11.3 30.6 18.8 11.8 12.5 36.3 5.5 4.92012 281.6 1.3 11.8 29.9 18.2 11.7 12.6 37.3 5.7 5.22013 287.9 1.2 12.6 29.9 18.2 11.8 12.9 38.5 5.9 5.22014 293.0 1.3 13.7 30.5 18.5 12.0 13.0 39.0 6.2 5.52015 298.0 1.2 14.1 29.7 18.1 11.6 13.2 39.5 6.5 5.62016f 302.8 1.2 14.3 29.6 18.1 11.5 13.5 40.4 6.7 5.72017f 307.3 1.2 15.2 30.0 18.3 11.7 13.6 40.5 6.7 5.7
YearFinance & Insurance
Real Estate, Rental & Leasing
Prof, Sci & Tech Services
Mgmt. of Enterprises
Admin. & Support Srvs
Educational Services
Health Care & Social Asst
Leisure & Hospitality Other Services Government
2004 19.8 4.4 14.2 3.6 19.5 3.6 24.7 28.5 10.3 42.52005 20.0 4.4 15.1 3.5 19.8 3.7 25.5 29.2 10.4 42.22006 19.6 4.5 16.0 3.3 20.1 3.7 26.3 30.5 10.2 42.52007 17.9 4.8 16.2 3.2 18.8 4.1 27.5 32.0 9.9 43.02008 16.4 4.7 16.7 3.1 18.0 4.6 28.8 31.5 10.0 43.12009 16.1 4.4 16.2 2.9 16.1 4.7 29.6 29.8 9.3 42.92010 16.0 4.3 15.3 2.6 15.8 4.7 30.0 30.3 9.2 44.22011 16.2 4.2 15.1 2.1 16.1 4.7 30.8 31.4 9.2 44.42012 15.4 4.2 15.7 1.9 17.3 5.3 32.2 32.8 9.4 43.62013 14.5 4.4 16.1 1.8 18.3 4.9 34.1 33.8 9.7 43.62014 14.2 4.5 16.1 1.8 17.6 5.0 34.7 35.0 9.9 43.82015 13.9 4.8 17.8 1.9 18.2 4.7 36.4 36.0 9.9 44.52016f 14.1 4.9 18.5 2.0 19.0 4.8 37.9 35.4 9.9 44.92017f 13.9 4.9 19.0 2.2 19.8 4.9 38.5 36.0 9.9 45.3
Sources: California Employment Development Department, LMID; estimates and forecasts by LAEDC
Table 21: Ventura County Nonfarm Employment Annual averages in thousands, March 2014 benchmark
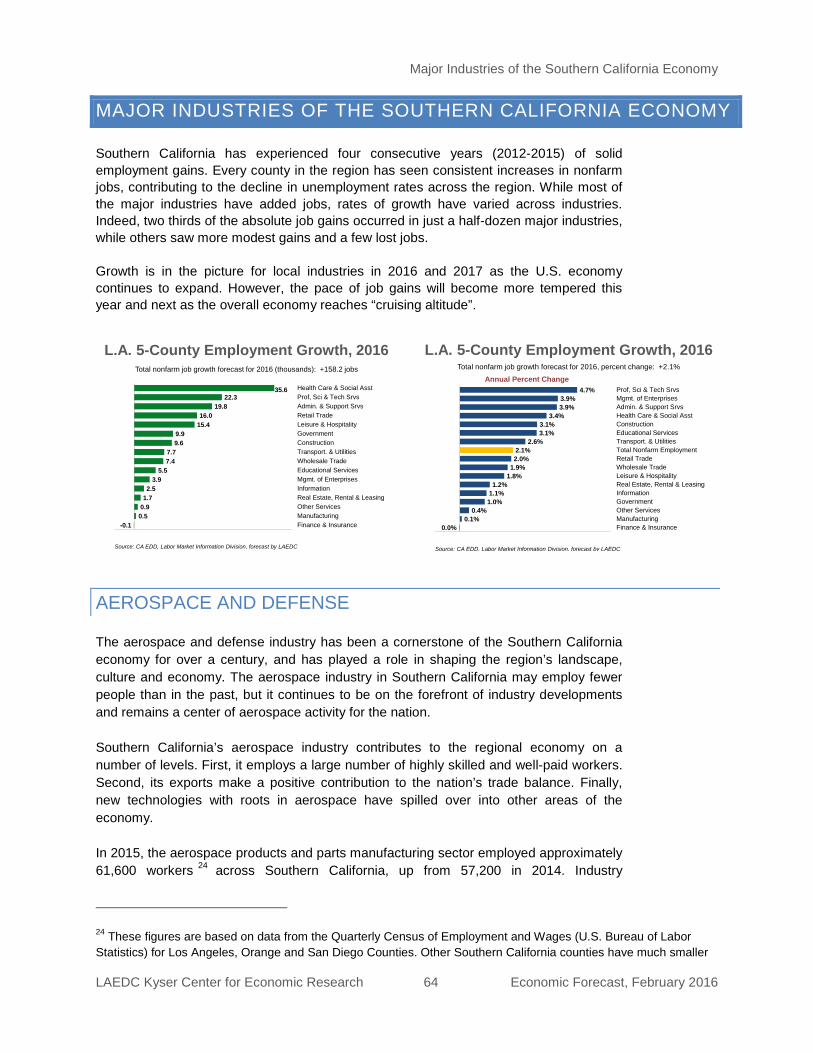
Major Industries of the Southern California Economy
LAEDC Kyser Center for Economic Research 64 Economic Forecast, February 2016
MAJOR INDUSTRIES OF THE SOUTHERN CALIFORNIA ECONOMY Southern California has experienced four consecutive years (2012-2015) of solid employment gains. Every county in the region has seen consistent increases in nonfarm jobs, contributing to the decline in unemployment rates across the region. While most of the major industries have added jobs, rates of growth have varied across industries. Indeed, two thirds of the absolute job gains occurred in just a half-dozen major industries, while others saw more modest gains and a few lost jobs. Growth is in the picture for local industries in 2016 and 2017 as the U.S. economy continues to expand. However, the pace of job gains will become more tempered this year and next as the overall economy reaches “cruising altitude”.
AEROSPACE AND DEFENSE
The aerospace and defense industry has been a cornerstone of the Southern California economy for over a century, and has played a role in shaping the region’s landscape, culture and economy. The aerospace industry in Southern California may employ fewer people than in the past, but it continues to be on the forefront of industry developments and remains a center of aerospace activity for the nation. Southern California’s aerospace industry contributes to the regional economy on a number of levels. First, it employs a large number of highly skilled and well-paid workers. Second, its exports make a positive contribution to the nation’s trade balance. Finally, new technologies with roots in aerospace have spilled over into other areas of the economy. In 2015, the aerospace products and parts manufacturing sector employed approximately 61,600 workers 24
24 These figures are based on data from the Quarterly Census of Employment and Wages (U.S. Bureau of Labor Statistics) for Los Angeles, Orange and San Diego Counties. Other Southern California counties have much smaller
across Southern California, up from 57,200 in 2014. Industry
L.A. 5-County Employment Growth, 2016
-0.10.50.91.72.5
3.95.5
7.47.7
9.69.9
15.416.0
19.822.3
35.6
-5.0 0.0 5.0 10.0 15.0 20.0 25.0 30.0 35.0 40.0
Finance & InsuranceManufacturingOther ServicesReal Estate, Rental & LeasingInformationMgmt. of EnterprisesEducational ServicesWholesale TradeTransport. & UtilitiesConstructionGovernmentLeisure & HospitalityRetail TradeAdmin. & Support SrvsProf, Sci & Tech SrvsHealth Care & Social Asst
Source: CA EDD, Labor Market Information Division, forecast by LAEDC
Total nonfarm job growth forecast for 2016 (thousands): +158.2 jobs
L.A. 5-County Employment Growth, 2016
0.0%0.1%
0.4%1.0%1.1%1.2%
1.8%1.9%2.0%2.1%
2.6%3.1%3.1%
3.4%3.9%3.9%
4.7%
-1.0% 0.0% 1.0% 2.0% 3.0% 4.0% 5.0% 6.0%
Finance & InsuranceManufacturingOther ServicesGovernmentInformationReal Estate, Rental & LeasingLeisure & HospitalityWholesale TradeRetail TradeTotal Nonfarm EmploymentTransport. & UtilitiesEducational ServicesConstructionHealth Care & Social AsstAdmin. & Support SrvsMgmt. of EnterprisesProf, Sci & Tech Srvs
Source: CA EDD, Labor Market Information Division, forecast by LAEDC
Annual Percent ChangeTotal nonfarm job growth forecast for 2016, percent change: +2.1%
Major Industries of the Southern California Economy
LAEDC Kyser Center for Economic Research 65 Economic Forecast, February 2016
employment last year was about 70% below the 1990 level, with most of the decline occurring in the early 1990s. More recently, regional employment in the industry has stabilized at between 55,000 and 59,000 workers. Capital is increasingly replacing labor, while labor itself has become more productive. The result is that even as employment levels have fallen, the value of aerospace products manufactured in the region has increased. Through the first three quarters of 2015, the Aerospace Industries Association 25
estimates shipments of aerospace products at $230 billion, up 9.0% over the same period a year earlier. Foreign orders comprise a significant portion of the industry’s business, with exports over the same period at $92 billion, up 5.8% from a year earlier. Moreover, backlogs were 6.8% higher than a year earlier with a monthly average of $732 billion.
Civil Aviation: Commercial jetliners are no longer manufactured in Southern California, but the region is home to thousands of subcontractors who produce parts for Boeing, Airbus and other aircraft manufacturers. The latest U.S. Department of Commerce26
data suggest that 2015 was a good year, but the next couple of years could see a pullback in activity. Shipments of nondefense aircraft and parts rose by 10.3% from $153.0 billion in 2014 to $168.8 billion in 2015. However, unfilled orders were down 1.0% at $606.1 billion while new orders fell by 32.7% to $162.5 billion.
Defense: Federal budget cuts pose an ongoing challenge to Southern California’s aerospace and defense firms. However, federal spending on defense-related R&D should be buoyed in the next few years by demand for cyber security, intelligence, surveillance and defense electronics. Moreover, as a leader in the development and manufacture of unmanned aircraft systems (UAS), the region’s aerospace industry will greatly benefit from growing demand for UAS for military and civilian uses in the years ahead. Looking Ahead: Southern California is home to one out of eight aerospace workers nationally. With its deep pool of skilled labor, its extensive array of test fields, numerous universities and other educational and research centers, and a strong electronics industry, the region will be a center for the aerospace and defense industries for many years to come. The region is home to a wide selection of research, development and testing operations, as well as aerospace contractor and sub-contractor facilities. Commercial satellites manufactured in Southern California orbit the earth, providing GPS, cell phone and radio/television communications. More recently, Southern California companies such as SpaceX, Scaled Composites and Virgin Galactic have engaged in private commercial space activities, once the sole domain of NASA.
numbers of workers in the industry and are excluded to maintain comparability with previous LAEDC research on the industry.
25 Aerospace Industries Association US Aerospace Manufacturing Update, 1Q-3Q 2015
26 https://www.census.gov/manufacturing/m3/prel/pdf/s-i-o.pdf
Major Industries of the Southern California Economy
LAEDC Kyser Center for Economic Research 66 Economic Forecast, February 2016
APPAREL DESIGN AND MANUFACTURING
The fashion industry is one of Southern California’s signature industries. Apparel design, manufacturing and wholesaling continue to make significant contributions to the Southern California economy even as the industry adapts to the shifting forces of globalization and technological change. The industry is characterized by short product life cycles, fickle consumers, almost unimaginable product variety and complex supply chains.
While the local industry is dominated by activity in Los Angeles County, Orange County has carved out a distinct identity of its own. In addition to apparel, Southern California’s fashion industry includes textiles, jewelry, footwear, handbags and cosmetics. The region is also home to a number of highly-regarded fashion design and merchandizing schools such as FIDM, Otis College of Art and Design, and Los Angeles Trade Tech.
Los Angeles and Orange counties employ the largest number of apparel workers in the United States and together, are one of the few regions in the U.S. where apparel continues to be manufactured on a large scale. Although production of most apparel items has largely shifted to lower-cost countries in Latin America and Asia,27
On the opposite end of the apparel spectrum, the local industry is a leader in “fast-fashion” apparel production – a term used to describe the high-volume production of inexpensive clothing that reflects current fashion trends and can go from sketch to store shelves in as little as four weeks, with retailers sometimes receiving daily shipments. The fast-fashion segment of the apparel market, which primarily targets young women and teens, depends on such rapid turnaround times that a trend may come and go by the time a container makes the voyage from Asia to Los Angeles.
high-end garments and accessories that require strict quality control and specialized skills or processing are often manufactured locally. There is also a small but vigorous community of designer-owned boutiques that specialize in locally designed and manufactured fashions that emphasize well-made, local and sustainably sourced apparel.
Design-related activity also contributes to maintaining the apparel industry’s presence in Southern California. One the of great strengths of the local fashion industry is the community of designers responsible for the global appeal of the “Made in L.A.” label. In 2014, there were 4,650 fashion designers working in Los Angeles and Orange counties.28
27 Africa may be the final frontier for low-cost apparel manufacturing. According to the International Labor Organization, Ethiopia’s garment sector has no minimum wage (garment workers start at $21 per month), while in Bangladesh, workers earn at least $67 per month. Search for Even Cheaper Garment Factories Leads to Africa, Wall Street Journal, July 12, 2015
Los Angeles may not receive the same level of attention as New York due to a lack of highly publicized fashion shows, but L.A. designers are noted for their more wearable (and saleable) designs. The many apparel design and merchandising schools that are located in the region attract talented students from all over the world. Fashion is also closely linked with the entertainment industry and the region’s flourishing art scene. Much of the apparel manufacturing and wholesaling workforce in Southern California is located
28 There were 5,750 fashion designers in California in 2015, compared with 7,190 in New York.
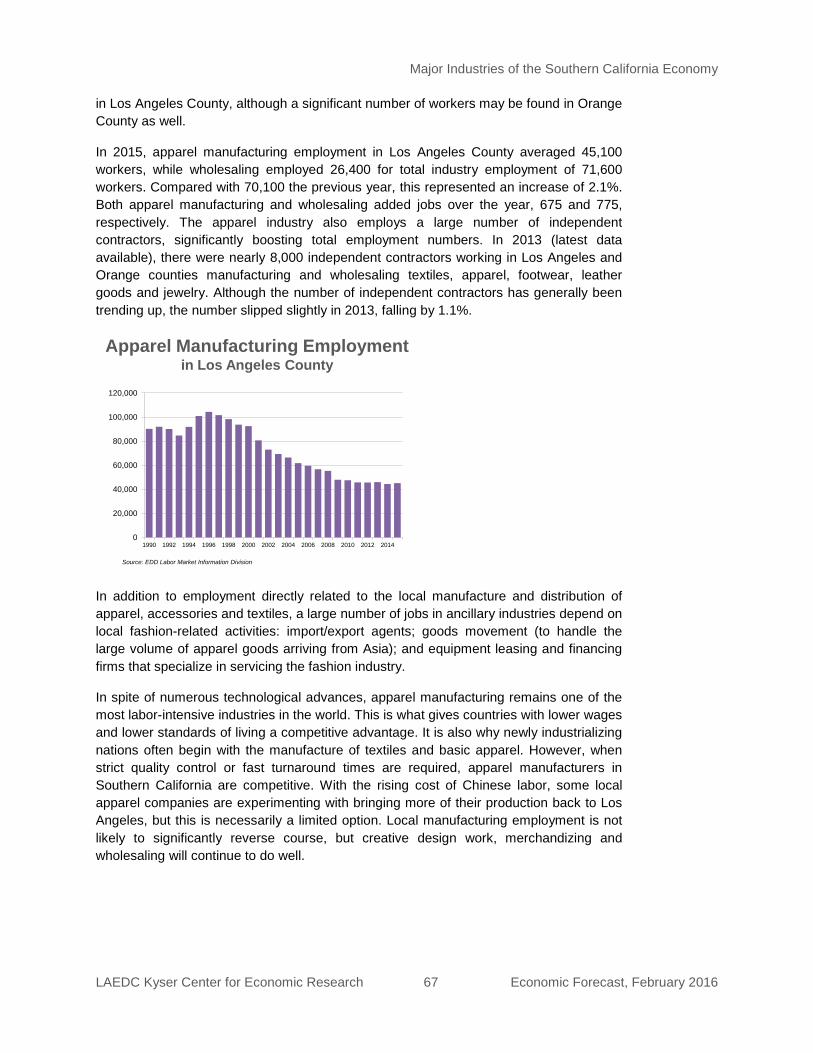
Major Industries of the Southern California Economy
LAEDC Kyser Center for Economic Research 67 Economic Forecast, February 2016
in Los Angeles County, although a significant number of workers may be found in Orange County as well.
In 2015, apparel manufacturing employment in Los Angeles County averaged 45,100 workers, while wholesaling employed 26,400 for total industry employment of 71,600 workers. Compared with 70,100 the previous year, this represented an increase of 2.1%. Both apparel manufacturing and wholesaling added jobs over the year, 675 and 775, respectively. The apparel industry also employs a large number of independent contractors, significantly boosting total employment numbers. In 2013 (latest data available), there were nearly 8,000 independent contractors working in Los Angeles and Orange counties manufacturing and wholesaling textiles, apparel, footwear, leather goods and jewelry. Although the number of independent contractors has generally been trending up, the number slipped slightly in 2013, falling by 1.1%.
In addition to employment directly related to the local manufacture and distribution of apparel, accessories and textiles, a large number of jobs in ancillary industries depend on local fashion-related activities: import/export agents; goods movement (to handle the large volume of apparel goods arriving from Asia); and equipment leasing and financing firms that specialize in servicing the fashion industry.
In spite of numerous technological advances, apparel manufacturing remains one of the most labor-intensive industries in the world. This is what gives countries with lower wages and lower standards of living a competitive advantage. It is also why newly industrializing nations often begin with the manufacture of textiles and basic apparel. However, when strict quality control or fast turnaround times are required, apparel manufacturers in Southern California are competitive. With the rising cost of Chinese labor, some local apparel companies are experimenting with bringing more of their production back to Los Angeles, but this is necessarily a limited option. Local manufacturing employment is not likely to significantly reverse course, but creative design work, merchandizing and wholesaling will continue to do well.
Apparel Manufacturing Employmentin Los Angeles County
Source: EDD Labor Market Information Division
0
20,000
40,000
60,000
80,000
100,000
120,000
1990 1992 1994 1996 1998 2000 2002 2004 2006 2008 2010 2012 2014
Major Industries of the Southern California Economy
LAEDC Kyser Center for Economic Research 68 Economic Forecast, February 2016
The computer and electronic product manufacturing industry is one of the largest manufacturing industries in Los Angeles County, surpassed only by transportation, apparel and fabricated metal product manufacturing, and roughly the same size as aerospace product and parts manufacturing, and food manufacturing. The industry employed 38,100 workers in Los Angeles County in 2015, with another 34,800 in Orange County and 5,000 in Ventura County. San Diego County also had 24,000 workers in the industry.
COMPUTER AND ELECTRONIC PRODUCT MANUFACTURING
Like many other manufacturing sectors, computer and electronic product manufacturing has experienced a trend decline in employment dating back over twenty years. Last year was the first time in a decade that employment growth entered positive territory, growing marginally by 0.6% across the six-county Southern California region. Employment declined in Los Angeles County by 2.1% in 2015, but this was offset by a gain of 4.5% in Orange County. Employment in San Diego County was essentially flat over the same period (up 0.6%).
Even so, the industry continues to be a significant source of employment and an important part of the region’s manufacturing base. It employs a large number of skilled workers in both professional and production occupations, drawing from the deep pool of skilled labor in the region. Moreover, occupations in this industry generally earn above-average wages.
PROFESSIONAL AND BUSINESS SERVICES
The professional and business services supersector includes three major subsectors: professional, scientific and technical services; management of companies and enterprises; and administrative, support and waste services. Collectively, these industries employed more than 1.39 million workers in the six-county Southern California region in 2015. Los Angeles County was home to over 620,000 jobs, with over 283,000 in Orange County, 240,000 in San Diego County, over 149,000 in the Inland Empire and nearly 38,000 in Ventura County.
Many occupations in these industries pay well and often require advanced education or training. These occupations include architects, engineers, IT consultants and other business consultants, accountants and lawyers.
Professional and business services employment in the six-county Southern California region rose by 4.3% in 2015, an increase of 56,900 jobs from 2014. Most of the region has achieved record-high levels of industry employment during the last year. By major industry, regional employment in professional, scientific and technical services increased by 4.8% (29,400 jobs) in 2015, with the largest gains in management, scientific and technical consulting services; advertising and related services; architectural and engineering services; and scientific research and development services. Jobs in management of companies and enterprises rose by 3.8% (4,700 jobs), while administrative, support and waste services jobs also expanded by 3.8% (22,800 jobs), with a large number of jobs created in employment services.
Major Industries of the Southern California Economy
LAEDC Kyser Center for Economic Research 69 Economic Forecast, February 2016
FINANCIAL SERVICES After peaking in 2005 at 544,300 jobs, employment in Southern California’s financial services industry was hit hard by the triple impact of the financial meltdown, the housing crisis and the Great Recession. By 2010, the industry had lost 103,000 jobs throughout Southern California. There are two major subsectors in this industry: finance and insurance, and real estate, rental and leasing. Most of the job losses over this five-year period were concentrated in finance and insurance. After struggling to regain ground during the early years of the recovery, the financial services industry recorded job gains in 2012 and 2013, but employment contracted again in 2014 and grew only marginally in 2015 (by 0.7%). The industry has seen a soft rebound, recovering approximately 15,000 jobs since 2011. However, employment growth is expected to slow moving forward. In Southern California, Orange County posted the largest financial services job gains in 2015, contributing over 1,900 jobs (or 1.7%), while the Inland Empire trailed closely with a gain of nearly 1,800 positions (or 4.2%). Los Angeles County, where nearly half of Southern California’s financial jobs are concentrated, experienced marginal growth. In fact, since 2008, the share of financial jobs in Los Angeles County has decreased by over two percent while Orange County has added two percent during the same time period. The real estate and rental and leasing sub-sector improved across Southern California, with gains of 1.8%, or 3,000 jobs. All counties in the region experienced strong gains since 2013. However, roughly two-thirds of jobs in financial activities are in the finance and insurance sector, which has generally struggled since the recession. Within finance and insurance, growth has been scattered across the region, with the Inland Empire recording the only notable employment growth, increasing by 4.3% from 2014 to 2015. Wage and salary jobs gains were flat across Southern California, registering a gain of 0.2% during the same time period. Overall, the Southern California area created over 15,00 financial services jobs last year, bringing the total to 465,300. While contributing to the recovery of jobs lost since the recession, employment is still a far cry from the 2006 peak of 544,300 jobs. Growth in financial activities is expected to be sluggish due to national economic factors. The Fed finally raised interest rates, the first of what is expected to be a series of rate hikes over the next two years. Higher interest rates will negatively impact housing demand. Furthermore, continued consolidation of the banking industry will slow employment in financial services. This will limit growth of the sector in Southern California to 0.7% in 2016, and employment will contract by 1.3% in 2017.
HEALTH CARE SERVICES AND BIOMEDICAL Together, the Los Angeles five-county region and San Diego County have a population of nearly 22 million people, over 10 million of whom live in Los Angeles County. With such a large population, Southern California is able to support a number of important and influential medical centers and a thriving life sciences industry. The health care sector is also one of the largest employers in Southern California. In addition to serving the local population, a number of medical centers in the region are attracting growing numbers of foreign patients as well.
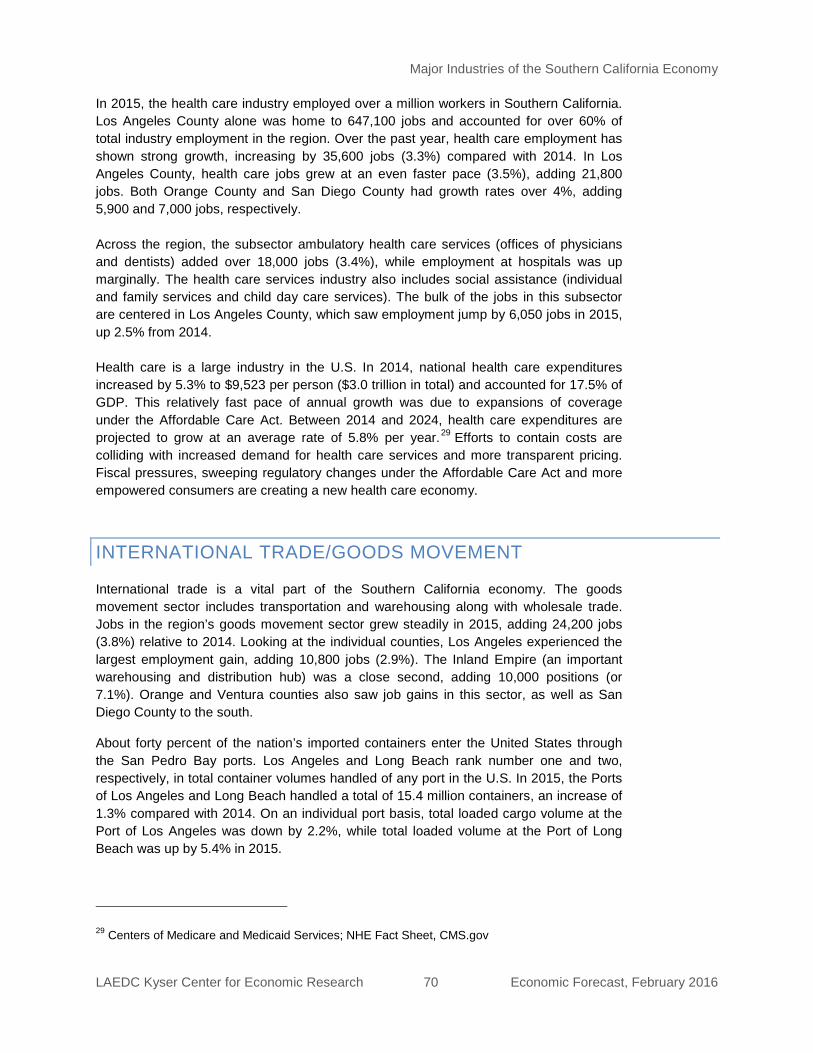
Major Industries of the Southern California Economy
LAEDC Kyser Center for Economic Research 70 Economic Forecast, February 2016
In 2015, the health care industry employed over a million workers in Southern California. Los Angeles County alone was home to 647,100 jobs and accounted for over 60% of total industry employment in the region. Over the past year, health care employment has shown strong growth, increasing by 35,600 jobs (3.3%) compared with 2014. In Los Angeles County, health care jobs grew at an even faster pace (3.5%), adding 21,800 jobs. Both Orange County and San Diego County had growth rates over 4%, adding 5,900 and 7,000 jobs, respectively. Across the region, the subsector ambulatory health care services (offices of physicians and dentists) added over 18,000 jobs (3.4%), while employment at hospitals was up marginally. The health care services industry also includes social assistance (individual and family services and child day care services). The bulk of the jobs in this subsector are centered in Los Angeles County, which saw employment jump by 6,050 jobs in 2015, up 2.5% from 2014. Health care is a large industry in the U.S. In 2014, national health care expenditures increased by 5.3% to $9,523 per person ($3.0 trillion in total) and accounted for 17.5% of GDP. This relatively fast pace of annual growth was due to expansions of coverage under the Affordable Care Act. Between 2014 and 2024, health care expenditures are projected to grow at an average rate of 5.8% per year.29
Efforts to contain costs are colliding with increased demand for health care services and more transparent pricing. Fiscal pressures, sweeping regulatory changes under the Affordable Care Act and more empowered consumers are creating a new health care economy.
INTERNATIONAL TRADE/GOODS MOVEMENT International trade is a vital part of the Southern California economy. The goods movement sector includes transportation and warehousing along with wholesale trade. Jobs in the region’s goods movement sector grew steadily in 2015, adding 24,200 jobs (3.8%) relative to 2014. Looking at the individual counties, Los Angeles experienced the largest employment gain, adding 10,800 jobs (2.9%). The Inland Empire (an important warehousing and distribution hub) was a close second, adding 10,000 positions (or 7.1%). Orange and Ventura counties also saw job gains in this sector, as well as San Diego County to the south.
About forty percent of the nation’s imported containers enter the United States through the San Pedro Bay ports. Los Angeles and Long Beach rank number one and two, respectively, in total container volumes handled of any port in the U.S. In 2015, the Ports of Los Angeles and Long Beach handled a total of 15.4 million containers, an increase of 1.3% compared with 2014. On an individual port basis, total loaded cargo volume at the Port of Los Angeles was down by 2.2%, while total loaded volume at the Port of Long Beach was up by 5.4% in 2015.
29 Centers of Medicare and Medicaid Services; NHE Fact Sheet, CMS.gov
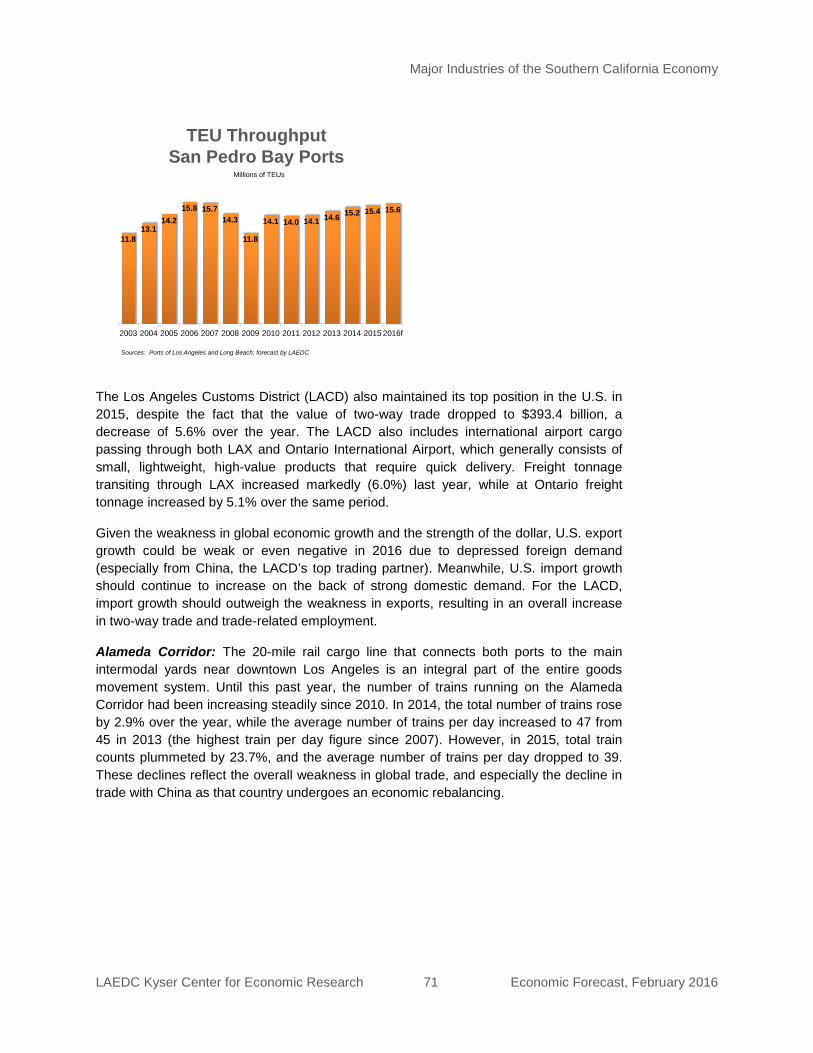
Major Industries of the Southern California Economy
LAEDC Kyser Center for Economic Research 71 Economic Forecast, February 2016
The Los Angeles Customs District (LACD) also maintained its top position in the U.S. in 2015, despite the fact that the value of two-way trade dropped to $393.4 billion, a decrease of 5.6% over the year. The LACD also includes international airport cargo passing through both LAX and Ontario International Airport, which generally consists of small, lightweight, high-value products that require quick delivery. Freight tonnage transiting through LAX increased markedly (6.0%) last year, while at Ontario freight tonnage increased by 5.1% over the same period.
Given the weakness in global economic growth and the strength of the dollar, U.S. export growth could be weak or even negative in 2016 due to depressed foreign demand (especially from China, the LACD’s top trading partner). Meanwhile, U.S. import growth should continue to increase on the back of strong domestic demand. For the LACD, import growth should outweigh the weakness in exports, resulting in an overall increase in two-way trade and trade-related employment.
Alameda Corridor: The 20-mile rail cargo line that connects both ports to the main intermodal yards near downtown Los Angeles is an integral part of the entire goods movement system. Until this past year, the number of trains running on the Alameda Corridor had been increasing steadily since 2010. In 2014, the total number of trains rose by 2.9% over the year, while the average number of trains per day increased to 47 from 45 in 2013 (the highest train per day figure since 2007). However, in 2015, total train counts plummeted by 23.7%, and the average number of trains per day dropped to 39. These declines reflect the overall weakness in global trade, and especially the decline in trade with China as that country undergoes an economic rebalancing.
11.813.1
14.215.8 15.7
14.3
11.8
14.1 14.0 14.1 14.6 15.2 15.4 15.6
2003 2004 2005 2006 2007 2008 2009 2010 2011 2012 2013 2014 2015 2016f
Millions of TEUs
TEU Throughput San Pedro Bay Ports
Sources: Ports of Los Angeles and Long Beach; forecast by LAEDC
Major Industries of the Southern California Economy
LAEDC Kyser Center for Economic Research 72 Economic Forecast, February 2016
MOTION PICTURE AND VIDEO PRODUCTION
Entertainment is probably the best-known industry in Los Angeles County. The focal point of this sector is the motion picture and sound recording industry, which also anchors the county’s broader creative economy, contributing more than a quarter of the county’s 417,000 creative industry jobs.
Within the motion picture and sound recording industry, the largest employment subsector is motion picture and video production, but motion picture distribution, post production services and sound recording all have a significant presence in the county’s broader entertainment industry. The industry generates substantial economic benefits for the region. It is a major source of new income by virtue of the royalties that are earned by locally produced films and TV shows. Closely related to this industry is tourism, with people from all over the world drawn to Hollywood and the entertainment industry’s theme parks.
Los Angeles County was home to 119,40030
Another indicator of local-industry activity is the number of permitted on-location shoot days, which reflected a mixed performance last year. The total number of shoot days rose 1.3% over 2014 to 37,289, and television shows experienced a substantial 9.5% increase, but shoot days for commercials were essentially flat (up 0.2%), and both feature films and other video (which includes student films, industrial films, and music videos) were down (4.2% and 5.5% respectively).
wage and salary jobs in the motion picture and sound recording industry last year, down slightly (0.5%) from 120,000 jobs in 2014. Employment remains below the prerecession peak of 132,200 and the all-time high of 146,600 from 1999.
Domestic box office receipts rose by nearly four percent from $10.4 billion in 2014 to an estimated $11.1 billion last year.31 Worldwide receipts totaled an estimated $27.6 billion last year, an increase of 2.2% over 2014. Tickets sold rose from 1.27 billion in 2014 to 1.34 billion last year.32
At-home entertainment spending turned around in 2015, with a one percent increase from $17.9 billion in 2014 to $18.07 billion last year. At-home spending was $18.13 billion in 2013. Substantial revenue growth occurred last year in electronic sell-through (+24.9%) and subscription streaming (+18.3%), while rentals uniformly fell.
33
30 Industry wage and salary job counts are subject to an annual benchmarking process in the first quarter of the year. It is expected that the 2015 job count for this industry will be revised upward once the benchmarking process is completed.
31 Estimated by the LAEDC based on data from www.boxofficemojo.com. Final numbers will be released by the MPAA later this year.
32 Estimate from www.the-numbers.com. Final numbers will be released by the MPAA later this year. 33 The Digital Entertainment Group, 2015 Annual Home Entertainment Report
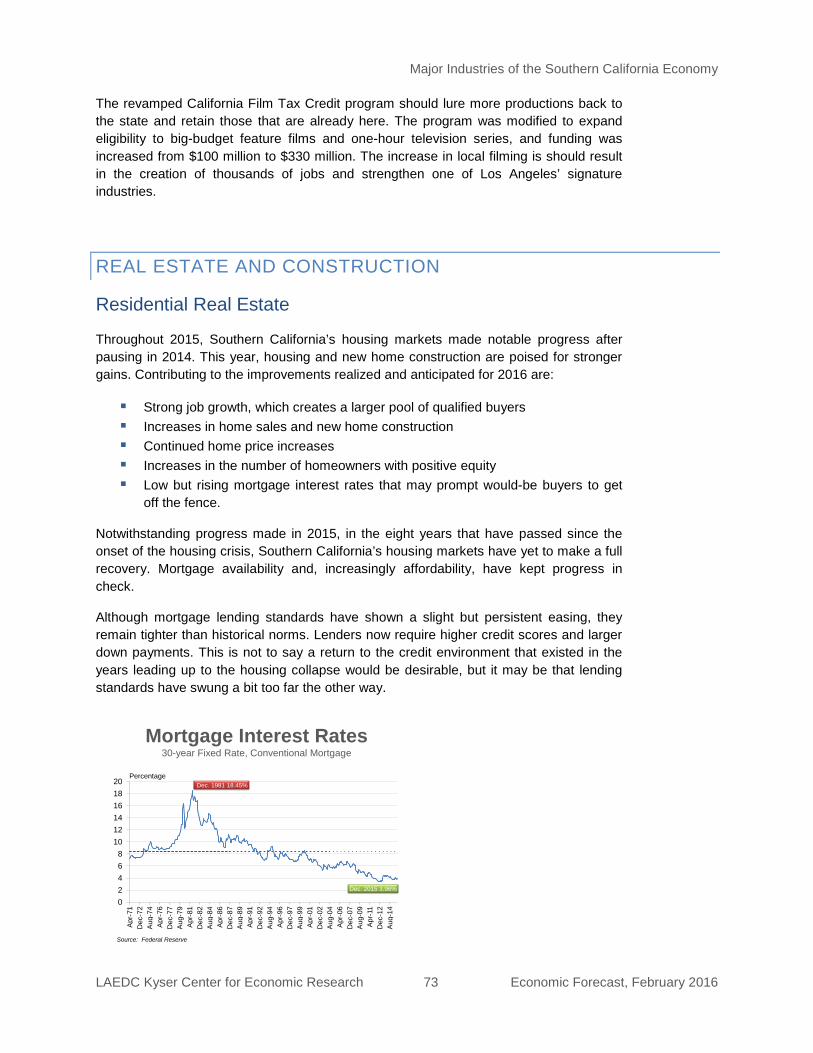
Major Industries of the Southern California Economy
LAEDC Kyser Center for Economic Research 73 Economic Forecast, February 2016
The revamped California Film Tax Credit program should lure more productions back to the state and retain those that are already here. The program was modified to expand eligibility to big-budget feature films and one-hour television series, and funding was increased from $100 million to $330 million. The increase in local filming is should result in the creation of thousands of jobs and strengthen one of Los Angeles’ signature industries.
REAL ESTATE AND CONSTRUCTION
Throughout 2015, Southern California’s housing markets made notable progress after pausing in 2014. This year, housing and new home construction are poised for stronger gains. Contributing to the improvements realized and anticipated for 2016 are:
Residential Real Estate
Strong job growth, which creates a larger pool of qualified buyers Increases in home sales and new home construction Continued home price increases Increases in the number of homeowners with positive equity Low but rising mortgage interest rates that may prompt would-be buyers to get
off the fence.
Notwithstanding progress made in 2015, in the eight years that have passed since the onset of the housing crisis, Southern California’s housing markets have yet to make a full recovery. Mortgage availability and, increasingly affordability, have kept progress in check.
Although mortgage lending standards have shown a slight but persistent easing, they remain tighter than historical norms. Lenders now require higher credit scores and larger down payments. This is not to say a return to the credit environment that existed in the years leading up to the housing collapse would be desirable, but it may be that lending standards have swung a bit too far the other way.
Mortgage Interest Rates30-year Fixed Rate, Conventional Mortgage
Dec. 1981 18.45%
Dec. 2015 3.96%
02468
101214161820
Apr
-71
Dec
-72
Aug
-74
Apr
-76
Dec
-77
Aug
-79
Apr
-81
Dec
-82
Aug
-84
Apr
-86
Dec
-87
Aug
-89
Apr
-91
Dec
-92
Aug
-94
Apr
-96
Dec
-97
Aug
-99
Apr
-01
Dec
-02
Aug
-04
Apr
-06
Dec
-07
Aug
-09
Apr
-11
Dec
-12
Aug
-14
Source: Federal Reserve
Percentage
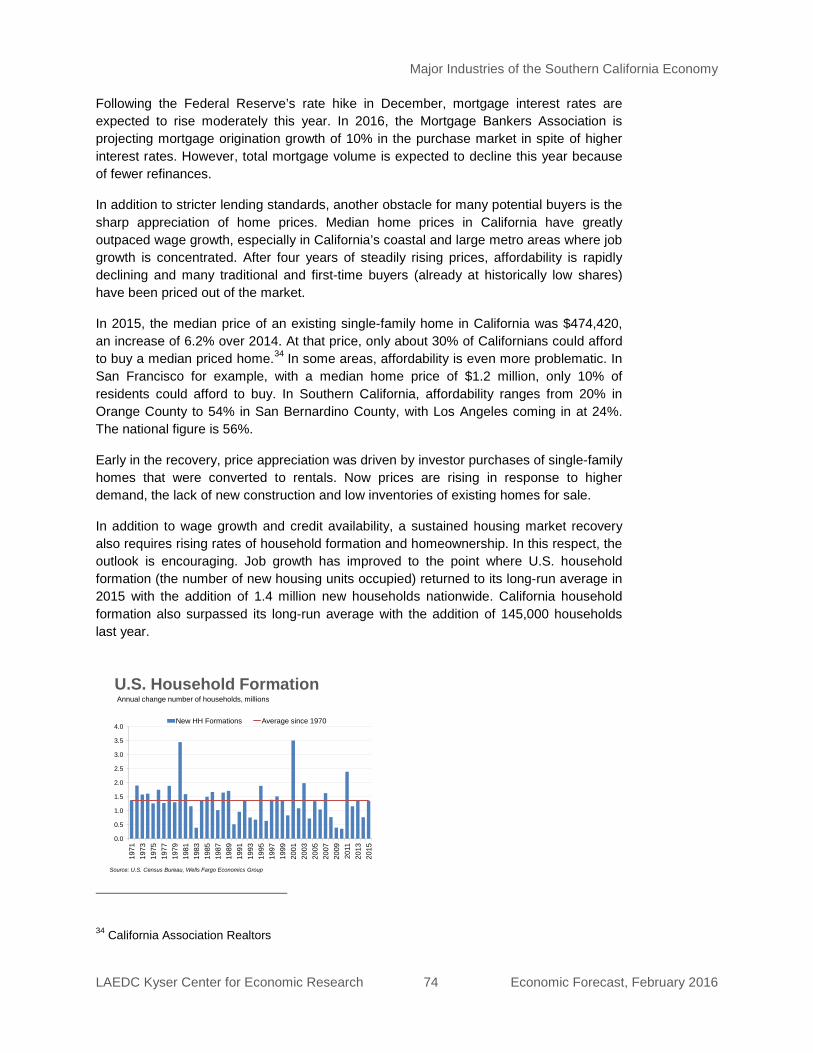
Major Industries of the Southern California Economy
LAEDC Kyser Center for Economic Research 74 Economic Forecast, February 2016
Following the Federal Reserve’s rate hike in December, mortgage interest rates are expected to rise moderately this year. In 2016, the Mortgage Bankers Association is projecting mortgage origination growth of 10% in the purchase market in spite of higher interest rates. However, total mortgage volume is expected to decline this year because of fewer refinances.
In addition to stricter lending standards, another obstacle for many potential buyers is the sharp appreciation of home prices. Median home prices in California have greatly outpaced wage growth, especially in California’s coastal and large metro areas where job growth is concentrated. After four years of steadily rising prices, affordability is rapidly declining and many traditional and first-time buyers (already at historically low shares) have been priced out of the market.
In 2015, the median price of an existing single-family home in California was $474,420, an increase of 6.2% over 2014. At that price, only about 30% of Californians could afford to buy a median priced home.34
Early in the recovery, price appreciation was driven by investor purchases of single-family homes that were converted to rentals. Now prices are rising in response to higher demand, the lack of new construction and low inventories of existing homes for sale.
In some areas, affordability is even more problematic. In San Francisco for example, with a median home price of $1.2 million, only 10% of residents could afford to buy. In Southern California, affordability ranges from 20% in Orange County to 54% in San Bernardino County, with Los Angeles coming in at 24%. The national figure is 56%.
In addition to wage growth and credit availability, a sustained housing market recovery also requires rising rates of household formation and homeownership. In this respect, the outlook is encouraging. Job growth has improved to the point where U.S. household formation (the number of new housing units occupied) returned to its long-run average in 2015 with the addition of 1.4 million new households nationwide. California household formation also surpassed its long-run average with the addition of 145,000 households last year.
34 California Association Realtors
0.0
0.5
1.0
1.5
2.0
2.5
3.0
3.5
4.0
1971
1973
1975
1977
1979
1981
1983
1985
1987
1989
1991
1993
1995
1997
1999
2001
2003
2005
2007
2009
2011
2013
2015
New HH Formations Average since 1970
U.S. Household Formation
Source: U.S. Census Bureau, Wells Fargo Economics Group
Annual change number of households, millions
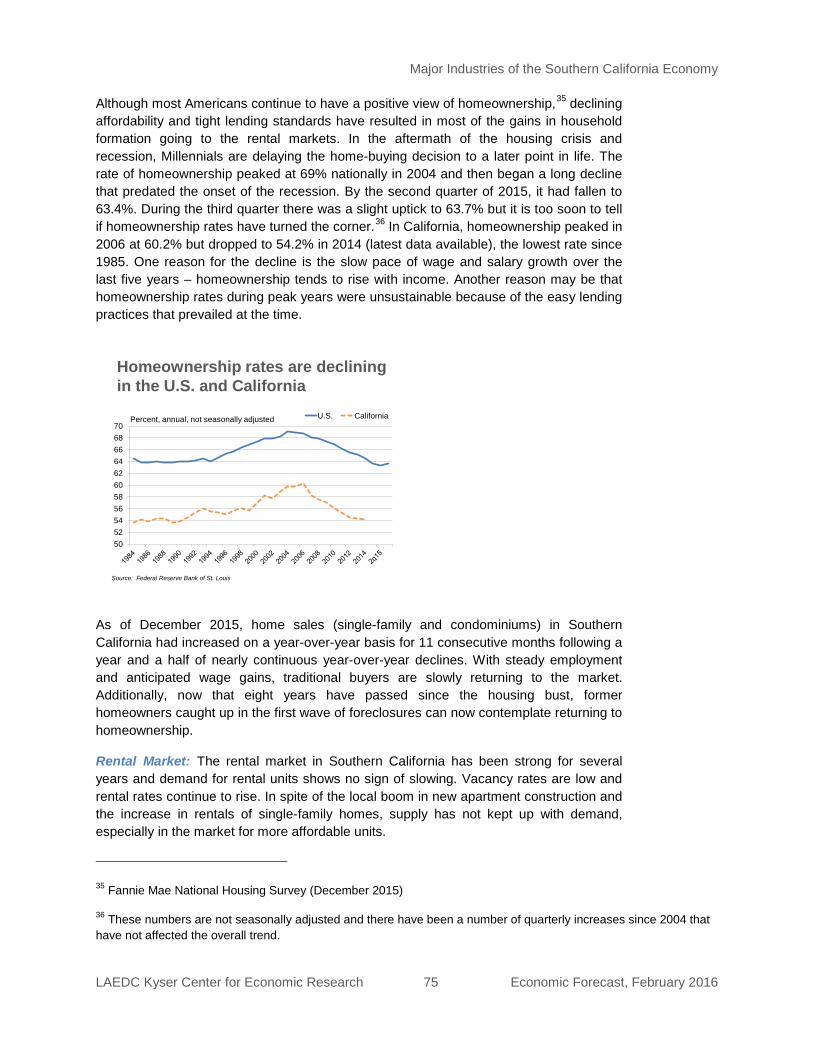
Major Industries of the Southern California Economy
LAEDC Kyser Center for Economic Research 75 Economic Forecast, February 2016
Although most Americans continue to have a positive view of homeownership,35 declining affordability and tight lending standards have resulted in most of the gains in household formation going to the rental markets. In the aftermath of the housing crisis and recession, Millennials are delaying the home-buying decision to a later point in life. The rate of homeownership peaked at 69% nationally in 2004 and then began a long decline that predated the onset of the recession. By the second quarter of 2015, it had fallen to 63.4%. During the third quarter there was a slight uptick to 63.7% but it is too soon to tell if homeownership rates have turned the corner.36
In California, homeownership peaked in 2006 at 60.2% but dropped to 54.2% in 2014 (latest data available), the lowest rate since 1985. One reason for the decline is the slow pace of wage and salary growth over the last five years – homeownership tends to rise with income. Another reason may be that homeownership rates during peak years were unsustainable because of the easy lending practices that prevailed at the time.
As of December 2015, home sales (single-family and condominiums) in Southern California had increased on a year-over-year basis for 11 consecutive months following a year and a half of nearly continuous year-over-year declines. With steady employment and anticipated wage gains, traditional buyers are slowly returning to the market. Additionally, now that eight years have passed since the housing bust, former homeowners caught up in the first wave of foreclosures can now contemplate returning to homeownership.
35 Fannie Mae National Housing Survey (December 2015)
Rental Market: The rental market in Southern California has been strong for several years and demand for rental units shows no sign of slowing. Vacancy rates are low and rental rates continue to rise. In spite of the local boom in new apartment construction and the increase in rentals of single-family homes, supply has not kept up with demand, especially in the market for more affordable units.
36 These numbers are not seasonally adjusted and there have been a number of quarterly increases since 2004 that have not affected the overall trend.
Homeownership rates are declining in the U.S. and California
5052545658606264666870
U.S. California
Source: Federal Reserve Bank of St. Louis
Percent, annual, not seasonally adjusted
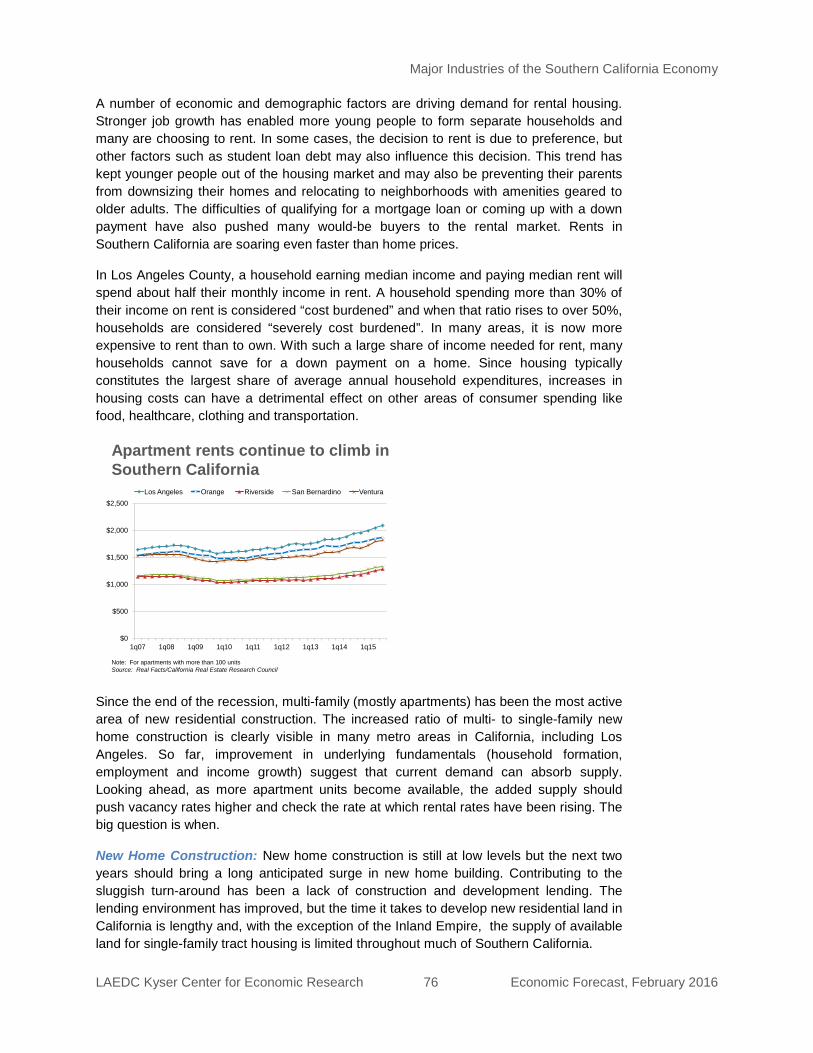
Major Industries of the Southern California Economy
LAEDC Kyser Center for Economic Research 76 Economic Forecast, February 2016
A number of economic and demographic factors are driving demand for rental housing. Stronger job growth has enabled more young people to form separate households and many are choosing to rent. In some cases, the decision to rent is due to preference, but other factors such as student loan debt may also influence this decision. This trend has kept younger people out of the housing market and may also be preventing their parents from downsizing their homes and relocating to neighborhoods with amenities geared to older adults. The difficulties of qualifying for a mortgage loan or coming up with a down payment have also pushed many would-be buyers to the rental market.
In Los Angeles County, a household earning median income and paying median rent will spend about half their monthly income in rent. A household spending more than 30% of their income on rent is considered “cost burdened” and when that ratio rises to over 50%, households are considered “severely cost burdened”. In many areas, it is now more expensive to rent than to own. With such a large share of income needed for rent, many households cannot save for a down payment on a home. Since housing typically constitutes the largest share of average annual household expenditures, increases in housing costs can have a detrimental effect on other areas of consumer spending like food, healthcare, clothing and transportation.
Rents in Southern California are soaring even faster than home prices.
Since the end of the recession, multi-family (mostly apartments) has been the most active area of new residential construction. The increased ratio of multi- to single-family new home construction is clearly visible in many metro areas in California, including Los Angeles. So far, improvement in underlying fundamentals (household formation, employment and income growth) suggest that current demand can absorb supply. Looking ahead, as more apartment units become available, the added supply should push vacancy rates higher and check the rate at which rental rates have been rising. The big question is when.
Apartment rents continue to climb in Southern California
Note: For apartments with more than 100 unitsSource: Real Facts/California Real Estate Research Council
$0
$500
$1,000
$1,500
$2,000
$2,500
1q07 1q08 1q09 1q10 1q11 1q12 1q13 1q14 1q15
Los Angeles Orange Riverside San Bernardino Ventura
New Home Construction: New home construction is still at low levels but the next two years should bring a long anticipated surge in new home building. Contributing to the sluggish turn-around has been a lack of construction and development lending. The lending environment has improved, but the time it takes to develop new residential land in California is lengthy and, with the exception of the Inland Empire, the supply of available land for single-family tract housing is limited throughout much of Southern California.
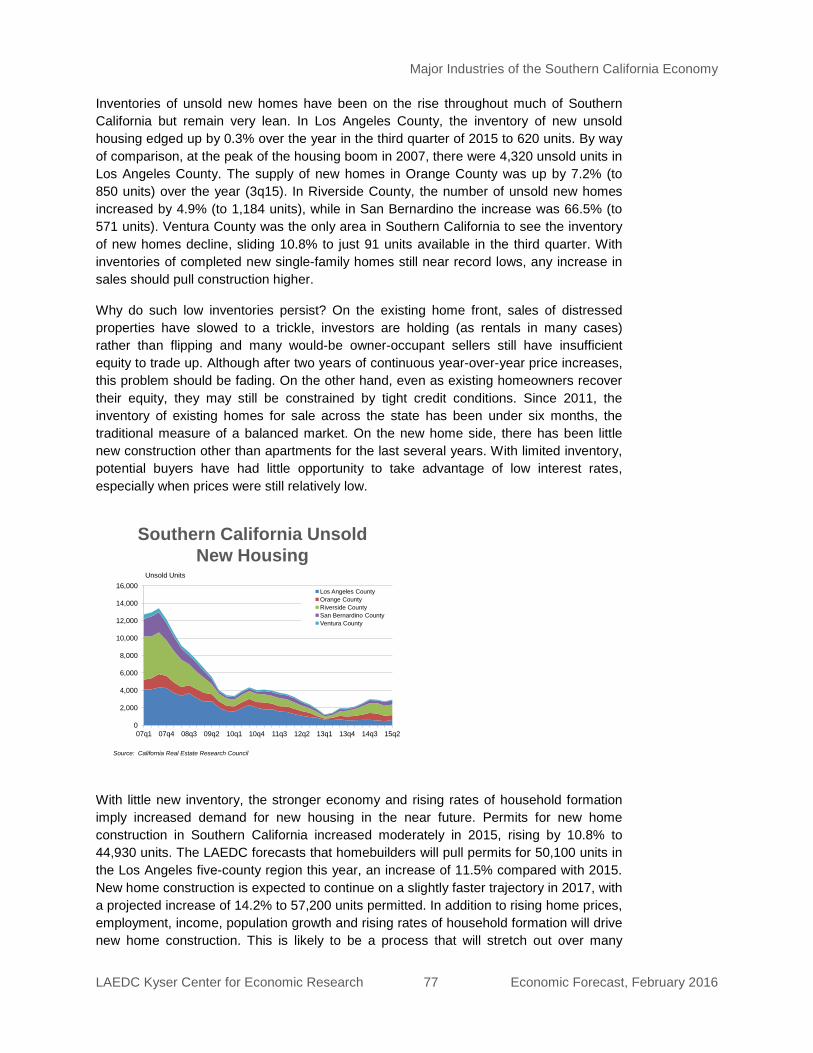
Major Industries of the Southern California Economy
LAEDC Kyser Center for Economic Research 77 Economic Forecast, February 2016
Southern California Unsold New Housing
Source: California Real Estate Research Council
0
2,000
4,000
6,000
8,000
10,000
12,000
14,000
16,000
07q1 07q4 08q3 09q2 10q1 10q4 11q3 12q2 13q1 13q4 14q3 15q2
Los Angeles CountyOrange CountyRiverside CountySan Bernardino CountyVentura County
Unsold Units
Inventories of unsold new homes have been on the rise throughout much of Southern California but remain very lean. In Los Angeles County, the inventory of new unsold housing edged up by 0.3% over the year in the third quarter of 2015 to 620 units. By way of comparison, at the peak of the housing boom in 2007, there were 4,320 unsold units in Los Angeles County. The supply of new homes in Orange County was up by 7.2% (to 850 units) over the year (3q15). In Riverside County, the number of unsold new homes increased by 4.9% (to 1,184 units), while in San Bernardino the increase was 66.5% (to 571 units). Ventura County was the only area in Southern California to see the inventory of new homes decline, sliding 10.8% to just 91 units available in the third quarter. With inventories of completed new single-family homes still near record lows, any increase in sales should pull construction higher.
Why do such low inventories persist? On the existing home front, sales of distressed properties have slowed to a trickle, investors are holding (as rentals in many cases) rather than flipping and many would-be owner-occupant sellers still have insufficient equity to trade up. Although after two years of continuous year-over-year price increases, this problem should be fading. On the other hand, even as existing homeowners recover their equity, they may still be constrained by tight credit conditions. Since 2011, the inventory of existing homes for sale across the state has been under six months, the traditional measure of a balanced market. On the new home side, there has been little new construction other than apartments for the last several years. With limited inventory, potential buyers have had little opportunity to take advantage of low interest rates, especially when prices were still relatively low.
With little new inventory, the stronger economy and rising rates of household formation imply increased demand for new housing in the near future. Permits for new home construction in Southern California increased moderately in 2015, rising by 10.8% to 44,930 units. The LAEDC forecasts that homebuilders will pull permits for 50,100 units in the Los Angeles five-county region this year, an increase of 11.5% compared with 2015. New home construction is expected to continue on a slightly faster trajectory in 2017, with a projected increase of 14.2% to 57,200 units permitted. In addition to rising home prices, employment, income, population growth and rising rates of household formation will drive new home construction. This is likely to be a process that will stretch out over many
Major Industries of the Southern California Economy
LAEDC Kyser Center for Economic Research 78 Economic Forecast, February 2016
years. Heavily skewed to multi-family construction in recent years, the mix is expected to shift to a greater share of single-family homes as older Millennials enter their mid-thirties, begin to have families and look to buy a home.
While there has been considerable overall improvement in Southern California’s housing markets, the strength of the rebound is divided between regions where employment and population are growing the fastest: coastal versus inland regions; central city areas versus distant suburbs. This bifurcation is also manifested in the demand for apartments and rentals versus owner-occupied single-family homes.
Conclusion: The demand for housing is largely derived from the underlying growth of the U.S. economy. The housing market is one of the last sectors of the economy to recover from the Great Recession, but a number of forward-looking indicators such as pending home sales and mortgage applications remain solidly positive, suggesting that housing will gain additional momentum through the end of this year and into 2017. New programs introduced by the FHA and the Department of Housing and Urban Development seek to expand credit access to underserved borrowers.
Southern California’s housing market is steadily working its way back to something that might be considered normal. Housing should once again be a bright spot for the region’s economy, but the strongest rebound will be in the areas where job growth is the strongest, while foreign purchases will continue to influence recovery in certain local markets.

Major Industries of the Southern California Economy
LAEDC Kyser Center for Economic Research 79 Economic Forecast, February 2016
% Annual Change
YearL.A.
CountyOrange County
Inland Empire
Ventura County LA-5 Year
L.A. County
Orange County
Inland Empire
Ventura County LA-5
2004 26,935 9,322 52,696 2,603 91,556 2004 26.4% 0.1% 22.5% -28.4% 18.5%2005 25,647 7,206 50,818 4,516 88,187 2005 -4.8% -22.7% -3.6% 73.5% -3.7%2006 26,348 8,371 39,083 2,461 76,263 2006 2.7% 16.2% -23.1% -45.5% -13.5%2007 20,363 7,072 20,457 1,847 49,739 2007 -22.7% -15.5% -47.7% -24.9% -34.8%2008 13,704 3,159 9,101 842 26,806 2008 -32.7% -55.3% -55.5% -54.4% -46.1%2009 5,653 2,200 6,685 404 14,942 2009 -58.7% -30.4% -26.5% -52.0% -44.3%2010 7,468 3,091 6,404 590 17,553 2010 32.1% 40.5% -4.2% 46.0% 17.5%2011 10,403 4,807 5,214 640 21,064 2011 39.3% 55.5% -18.6% 8.5% 20.0%2012 10,709 6,862 6,034 410 24,015 2012 2.9% 42.8% 15.7% -35.9% 14.0%2013 16,200 9,936 8,829 777 35,742 2013 51.3% 44.8% 46.3% 89.5% 48.8%2014 18,707 10,636 10,141 1,082 40,566 2014 15.5% 7.0% 14.9% 39.3% 13.5%2015 22,831 11,428 9,665 1,006 44,930 2015 22.0% 7.4% -4.7% -7.0% 10.8%2016f 26,000 13,600 11,800 1,200 52,600 2016f 13.9% 19.0% 22.1% 19.3% 17.1%2017f 29,600 15,800 14,700 1,500 61,600 2017f 13.8% 16.2% 24.6% 25.0% 17.1%
Sources: Construction Industry Research Board, California Homebuilding Foundation; forecasts by LAEDC
Annual % Change
YearL.A.
CountyOrange County
Inland Empire
Ventura County Year
L.A. County
Orange County
Inland Empire
Ventura County
2004 435,954 642,577 295,173 599,282 2004 25.1% 31.6% 35.4% 29.6%2005 517,853 706,555 364,407 668,138 2005 18.8% 10.0% 23.5% 11.5%2006 577,147 732,517 383,580 685,957 2006 11.4% 3.7% 5.3% 2.7%2007 589,166 727,570 367,248 673,940 2007 2.1% -0.7% -4.3% -1.8%2008 382,714 540,650 230,710 463,560 2008 -35.0% -25.7% -37.2% -31.2%2009 299,268 505,589 161,114 416,770 2009 -21.8% -6.5% -30.2% -10.1%2010 323,290 546,385 179,268 442,820 2010 8.0% 8.1% 11.3% 6.3%2011 307,660 512,500 172,280 418,270 2011 -4.8% -6.2% -3.9% -5.5%
2012 327,470 542,700 189,300 427,000 2012 6.4% 5.9% 9.9% 2.1%2013 405,630 651,640 241,410 516,470 2013 23.9% 20.1% 27.5% 21.0%2014 449,510 687,930 273,890 573,560 2014 10.8% 5.6% 13.5% 11.1%2015 476,830 707,460 290,700 609,410 2015 6.1% 2.8% 6.1% 6.3%
Source: California Association of Realtors
Table 22: Median Existing Single-Family Home Prices
Table 23: Total Housing Permits
Major Industries of the Southern California Economy
LAEDC Kyser Center for Economic Research 80 Economic Forecast, February 2016
Nonresidential Real Estate37
The fundamentals of commercial (offices, retail and hotel) and industrial real estate are strong, supported by employment growth and stronger economic activity. Delinquency rates on commercial and industrial loans, and default rates on CMBS are near all-time lows. Nationally, investment in nonresidential structures took a step back in 2015, declining by an estimated 1.2% over the year after increasing by 8.1% in 2014, but is expected rise by 2.0% or more this year and next. Meanwhile, the value of nonresidential structures put in place increased by 11.4% in 2015 and is projected to rise by 8.8% in 2016.
Overall, businesses are feeling more comfortable with the idea of investing in long-term projects. In Southern California, vacancy rates continue to decline, rental rates are up and interest from foreign investors is on the rise. A recent survey (January 2016) of foreign investors from the Association of Foreign Investors in Real Estate (AFIRE) listed Los Angeles as the third most desirable city globally (up from #10 in 2015) and the second nationally for real estate investment.
Office employment growth across the Southern California region is healthy and in some submarkets vacancy rates are approaching or have crossed their long-run average, an indication that new office construction may start to ramp up in the near future. In the fourth quarter of 2015, the overall vacancy rate in Southern California declined by 1.7 percentage points (pps.) to 13.7%. Leasing activity in 2015 totaled 22.9 million square feet, little changed from 2014. Net absorption (occupancy gains) was 5.5 million square feet, also on par with 2014. Across the region, the average direct class A asking rent increased by 6.0% compared with the final quarter of 2014 to $3.04/square foot.
Office Space
Los Angeles County: The Los Angeles County office market picked up momentum in the final quarter of 2015. Rents are returning to prerecession highs and the countywide vacancy rate is now below 15%. In 2016, with additional gains in office employment expected, vacancy rates should continue to trend lower.
37 The LAEDC thanks CBRE and Cushman and Wakefield for providing office and industrial vacancy rates, rental rates and the figures for leasing activity that are cited in this section.
During the fourth quarter of 2015, the overall vacancy rate declined over the year by 1.7 pps. to 14.4%, the lowest since the first quarter of 2009, when it stood at 14.3%. Total leasing activity for the year was 14.3 million square feet, up from 13.6 million square feet in 2014. Occupancy gains of 3.9 million square feet were about even with 2014. The steady decline in vacancy rates is placing upward pressure on lease rates. Direct class A asking rents increased by 8.9% to $3.15/square foot in the fourth quarter of 2015, compared with year ago rates. During 2015, 770,400 square feet of new office space was completed and the year closed with 1.8 million square feet of additional new office space under construction.
Major Industries of the Southern California Economy
LAEDC Kyser Center for Economic Research 81 Economic Forecast, February 2016
At 10.8% (10% is considered a balanced market), the Westside submarket had the lowest vacancy rate during the final quarter of 2015. It also had the highest average rental rate at $4.07/square foot, an increase of 11.5% over the year. Although leasing activity was strong (4.3 million square feet), it was down by 2.6% compared with 2014. The Westside also accounts for about 30% of the new office construction currently in the pipeline for Los Angeles County.
Vacancy rates were highest in the South Bay (20.1%) but were lower by 2.1 pps. points compared with a year ago. The average class A rental rate was $2.49/square foot, an increase of 5.1% from the final quarter of 2014. Vacancy rates in the Central submarket38 remain relatively high, averaging 18.1% during the fourth quarter of 2015, but are also trending down. Meanwhile, the class A asking rent rose by 5.1% to $3.10/square foot. In spite of an average vacancy rate still north of 15%, 54% of new office construction in Los Angeles is occurring downtown. The area’s influx of residents, restaurants, retail and entertainment options are attracting a growing number of office-space using tenants, and developers are responding.
Orange County: The Orange County office market is characterized by low availability and rising lease rates. Strong employment growth has been the primary force behind improving fundamentals. Meanwhile, the mix of tenants driving demand for office space has changed. Traditionally (before the recession), the office market in Orange County was dominated by the finance, insurance and real estate industries. Today, the primary movers are education, healthcare and technical services. This new diversity will help provide stability to the market as education and healthcare tend to be less cyclical. Having performed well over the last year, momentum is expected to build through 2016.
The Orange County overall vacancy rate decreased by 2.1 pps. to 11.5% during the last quarter of 2015, compared with the year ago rate. Leasing activity declined by 11.0% over the year to 7.8 million square feet in 2015, while occupancy gains expanded by 26.6% to 1.7 million square feet of positive absorption. Direct class A asking rents increased by 6.3% to $2.70/square foot during the final quarter of 2015 from the same period in 2014. The year closed with 477,387 square feet of new office space under construction, but no new product was added during the year. Looking ahead, there are over a dozen proposed projects that, if built, would add significant new square footage to the region’s office market.
38 The Central submarket consists of the Central Business District, South Park, Little Tokyo/Chinatown, the Historic District and Mid-Wilshire.
Strong demand is providing lift for asking rents in the most desirable areas where large blocks of space are hard to come by. The strongest submarket was South Orange County, which posted a vacancy rate of 8.2% (4q15), down by 2.0 pps. compared with 4q14. The direct class A asking rent averaged $2.86/square foot, an increase of 19.2% compared with the year ago rate. The South County market includes the Irvine Spectrum, which is where 90% of new office construction currently in the pipeline is located. Elsewhere, submarket vacancy rates ranged from 10.7% in the Greater Airport Area to 15.5% in Central County.
Major Industries of the Southern California Economy
LAEDC Kyser Center for Economic Research 82 Economic Forecast, February 2016
Inland Empire: The Inland Empire office market has improved significantly over the past five years, maintaining a slow but steady pace. Benefiting from the strongest employment growth in the Los Angeles five-county region, vacancy rates drifted downward though 2015. It is still a renter’s market, however. The vacancy rate averaged 16.1% during the last quarter of 2015, down by just 0.9 pp over the year. Leasing activity totaled 816,335 square feet, an increase of 10.9% compared with 2014. Because of occupancy losses, however, positive aborption was only 157,489 square feet for the year, down from 466,407 square feet in 2014. Still, the Inland Empire has now seen four consecutive years of positive absorption. Direct class A asking rents increased by 1.5% to $2.04/square foot in the final quarter of last year compared with the same period in 2014. No new office space was delivered to the market in 2015 and the year closed with no construction in the pipeline.
There are three primary submarkets in the Inland Empire. Inland Empire West had the lowest vacancy rate in the fourth quarter of 2015 (14.5%). This region includes Ontario, Rancho Cucamonga, Fontana, Chino and Upland. Next was Inland Empire East (16.9%), followed by Inland Empire South (17.5%).
Primary among tenants leasing space in the Inland Empire are payroll and staffing firms, government agencies and health care firms. These are industries either bound by geography (they serve local clients) or are not client-facing and so do not require space in more desirable, and thus more expensive, areas. Strong population growth has also fueled demand for office space in a variety of industries. With the lack of new development activity and increasing tenant demand, existing office space in the Inland Empire is steadily being absorbed. Vacancy rates should continue to trend down this year, driving lease rates up.
As a major gateway market for consumer and business goods, Southern California’s industrial real estate markets have seen several years of steady improvement. The region is a hub for manufacturing, international trade and logistics, and entertainment, all of which are users of industrial space. Los Angeles County is the nation’s largest manufacturing center and is home to its biggest port complex. Right now, the primary concern for the region’s industrial market is not demand, but supply. Fundamentals for all of Southern California’s major industrial product types are healthy and continue to strengthen.
Industrial Space
Los Angeles County: The Los Angeles industrial market tilted further into landlords’ favor in 2015. Overall vacancy rates continue to decline and average asking lease rates have steadily increased. Availability levels are at record lows, constricting activity in the face of rising demand. Lease rates are expected to continue to rise over the next 12 months as developers push to deliver new product to the market
During the fourth quarter of 2015, the overall vacancy rate declined by 0.6 pps. over the year to 1.3%. Total leasing activity reached 42.2 million square feet, slightly surpassing the total for 2014. Nearly half of that activity was generated in the South Bay and Central Los Angeles. Net absorbtion for the year was 5.8 million square feet, which was slightly below the 2014 level. The average class A asking rent was $0.70/square foot in the final quarter of 2015, an increase of 9.4% over the final quarter of 2014. In 2015, over 3.6
Major Industries of the Southern California Economy
LAEDC Kyser Center for Economic Research 83 Economic Forecast, February 2016
million square feet of new industrial space was delivered to the market. In addition, the Greater Los Angeles region currently has over 2.8 million square feet of new industrial space under construction. Most of this new development is concentrated in the South Bay and the San Gabriel Valley (1.9 million square feet).
The Los Angeles County industrial market closed 2015 on a high note. All of the county’s submarkets experienced a decline in vacancy rates and an increase in lease rates. With demand expected to hold steady, vacancy rates will continue to fall well into 2016 and then moderate as a substantial amount of new space becomes available.
Orange County: Like Los Angeles, Orange County has one of the tightest industrial real estate markets in the country. Declines in vacancy rates are expected to continue through 2016, creating additional upward pressure on rents. The major challenge for Orange County is a lack of development activity. Because vacancy rates are so tight, there were no major move-ins or move-outs in 2015. Tenants are choosing to remain where they are. CBRE reported that there were over 60 lease renewals totaling 3.9 million square feet last year and since 2014, there have been 142 lease renewals totaling more than 8.5 million square feet.
The Orange County overall vacancy rate decreased by 0.9 pps to 2.8% during the last quarter of 2015 compared with the year ago rate. Total leasing activity reached 12.5 million square feet, 12.9% higher than it was in 2014. Occupancy gains were 2.4 million square feet, the highest level of absorption in nine years and the fifth consecutive year of growth. The average class A asking rent increased by 6.7% to $0.80/square foot. Over 1.1 million square feet of new industrial space was added to the market in 2015, with an additional 625,000 square feet still under construction at year end.
Orange County’s industrial real estate market performed well in 2015. It was a year marked by increasing rental rates and historically low vacancy rates. It was also a year in which the market moved solidly into the landlord’s favor. Fierce competition for space has allowed many landlords to increase rents and cut concessions on new deals. On the other hand, additional progress was constrained by a lack of new development. In many cases, particularly near the airport, industrial buildings have been replaced by other kinds of commercial development and apartments. Critical to future growth are new construction and development projects.
Inland Empire: The Inland Empire industrial market can, without exaggeration, be described as outstanding. In 2015, tenant demand broke multiple records, propelling the market to highs last seen in the early 2000s. Port activity and the growing importance of e-commerce continue to drive improvement in the Inland Empire’s industrial real estate market. The stronger overall economy also provided a boost – since the second half of 2015, the Inland Empire has been one of the faster-growing metro regions in California. In addition to undiminished demand for large warehouse/distribution facilities (over 500,000 square feet), demand for product under 250,000 square feet has been also robust.
The Inland Empire overall vacancy rate decreased by 0.6 pp to 5.7% during the fourth quarter of 2015 compared with the year ago rate. Leasing activity reached 43.7 million square feet last year, blowing by the previous record of 34.0 million square feet reached in 2005. Occupancy gains totaled 22.4 million square feet for the year, the second best
Major Industries of the Southern California Economy
LAEDC Kyser Center for Economic Research 84 Economic Forecast, February 2016
year on record. The Inland Empire has now posted 26 consecutive quarters of positive absorption. Low vacancy rates and strong demand pushed the overall average asking rent in the final quarter to $0.48/square foot, an increase of 11.6% from the year ago rate and a new record high. Strong demand has also kept development levels high with 20.8 million square feet of newly completed inventory added to the market in 2015 and another 16.7 million square feet in the pipeline.
The Inland Empire is one of the strongest and most dynamic industrial markets in the nation, benefiting from logistics advantages, high demand, growing lease rates and a substantial amount of available land for future industrial projects. The outlook for the market continues to be positive through 2016. Alone among the Los Angeles five-county region, new development and construction is expected to be strong with demand easily absorbing new supply.
New office space development will continue to proceed at a cautious rate in all five counties of the Southern California region. Vacancy rates in the most desirable areas are just beginning to cross below their long-run averages while remaining elevated (above 15%) in the Inland Empire. Office vacancy rates will continue to decline through 2016 but how fast will depend on job growth and the strength of the overall economy. Average asking rents are firming and in some cases, approaching previous peak levels. Although changes in work force organization have resulted in less space needed per employee, the lack of new construction and continuing employment growth this year and next will help expand and strengthen the region’s office market recovery. Growth in health care, entertainment, technology and business services employment will propel improvements in the office market. The outlook for industrial development is much more optimistic, especially for warehouse and distribution facilities, data centers and R&D centers. Additional improvements in vacancy rates and asking rents will depend on increases in international trade and industrial production (both question marks in early 2016), and e-commerce.
FORECAST FOR PRIVATE NONRESIDENTIAL CONSTRUCTION
The value of total nonresidential construction in the Los Angeles five-county region is reached $9.5 billion in 2015, a decline of 11.8% compared with 2014. In 2016, building on continuing economic growth and additional employment gains, the LAEDC forecasts nonresidential construction in the region will reverse course and increase by 9.2% to $10.4 billion.
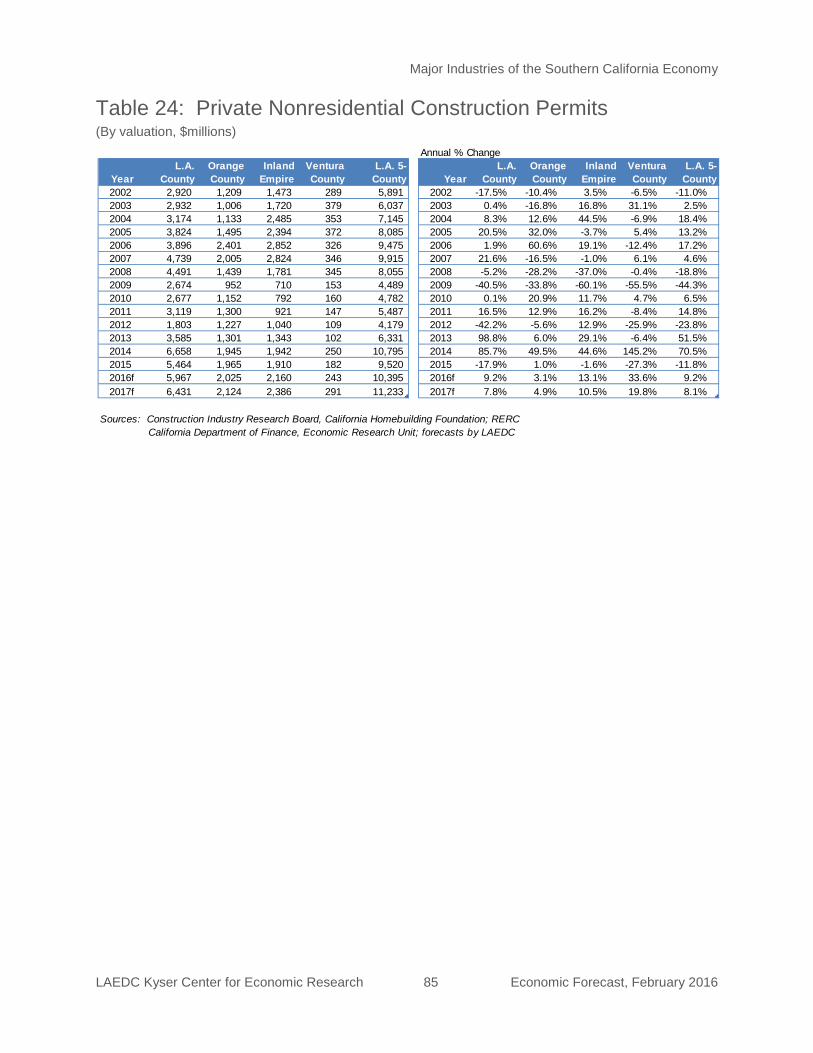
Major Industries of the Southern California Economy
LAEDC Kyser Center for Economic Research 85 Economic Forecast, February 2016
Annual % Change
YearL.A.
CountyOrange County
Inland Empire
Ventura County
L.A. 5-County Year
L.A. County
Orange County
Inland Empire
Ventura County
L.A. 5-County
2002 2,920 1,209 1,473 289 5,891 2002 -17.5% -10.4% 3.5% -6.5% -11.0%2003 2,932 1,006 1,720 379 6,037 2003 0.4% -16.8% 16.8% 31.1% 2.5%2004 3,174 1,133 2,485 353 7,145 2004 8.3% 12.6% 44.5% -6.9% 18.4%2005 3,824 1,495 2,394 372 8,085 2005 20.5% 32.0% -3.7% 5.4% 13.2%2006 3,896 2,401 2,852 326 9,475 2006 1.9% 60.6% 19.1% -12.4% 17.2%2007 4,739 2,005 2,824 346 9,915 2007 21.6% -16.5% -1.0% 6.1% 4.6%2008 4,491 1,439 1,781 345 8,055 2008 -5.2% -28.2% -37.0% -0.4% -18.8%2009 2,674 952 710 153 4,489 2009 -40.5% -33.8% -60.1% -55.5% -44.3%2010 2,677 1,152 792 160 4,782 2010 0.1% 20.9% 11.7% 4.7% 6.5%2011 3,119 1,300 921 147 5,487 2011 16.5% 12.9% 16.2% -8.4% 14.8%2012 1,803 1,227 1,040 109 4,179 2012 -42.2% -5.6% 12.9% -25.9% -23.8%2013 3,585 1,301 1,343 102 6,331 2013 98.8% 6.0% 29.1% -6.4% 51.5%2014 6,658 1,945 1,942 250 10,795 2014 85.7% 49.5% 44.6% 145.2% 70.5%2015 5,464 1,965 1,910 182 9,520 2015 -17.9% 1.0% -1.6% -27.3% -11.8%2016f 5,967 2,025 2,160 243 10,395 2016f 9.2% 3.1% 13.1% 33.6% 9.2%2017f 6,431 2,124 2,386 291 11,233 2017f 7.8% 4.9% 10.5% 19.8% 8.1%
Sources: Construction Industry Research Board, California Homebuilding Foundation; RERCCalifornia Department of Finance, Economic Research Unit; forecasts by LAEDC
Table 24: Private Nonresidential Construction Permits (By valuation, $millions)
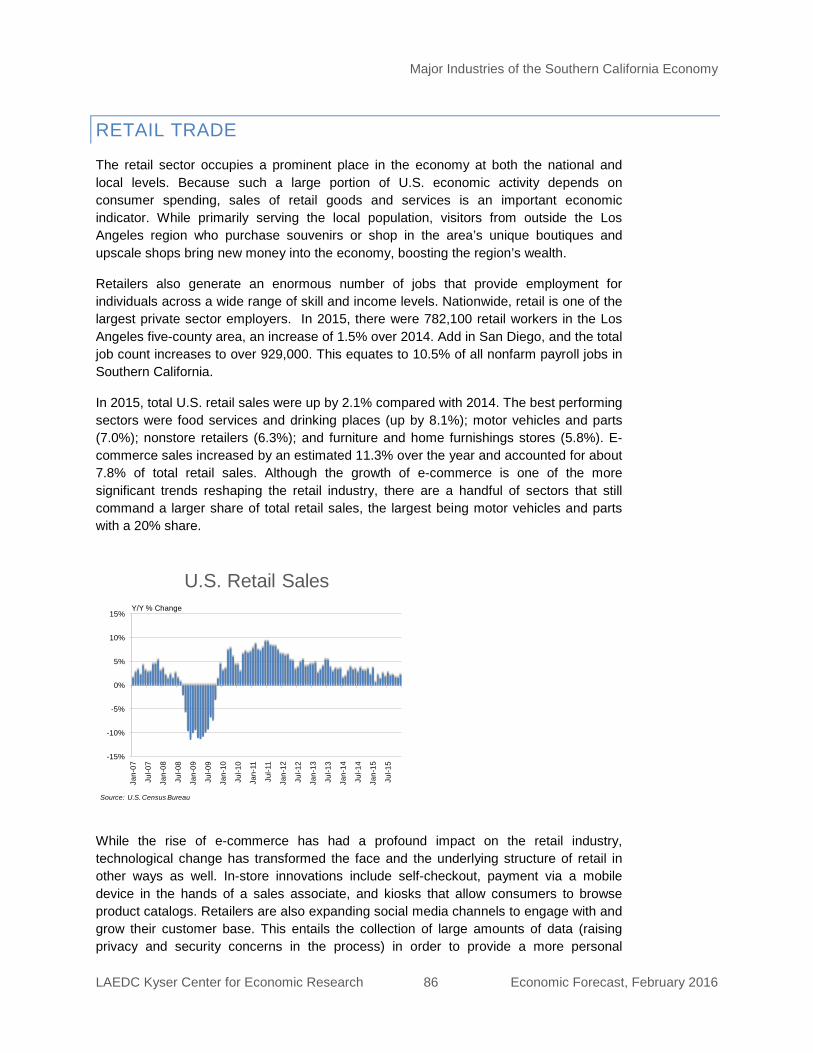
Major Industries of the Southern California Economy
LAEDC Kyser Center for Economic Research 86 Economic Forecast, February 2016
RETAIL TRADE
The retail sector occupies a prominent place in the economy at both the national and local levels. Because such a large portion of U.S. economic activity depends on consumer spending, sales of retail goods and services is an important economic indicator. While primarily serving the local population, visitors from outside the Los Angeles region who purchase souvenirs or shop in the area’s unique boutiques and upscale shops bring new money into the economy, boosting the region’s wealth.
Retailers also generate an enormous number of jobs that provide employment for individuals across a wide range of skill and income levels. Nationwide, retail is one of the largest private sector employers. In 2015, there were 782,100 retail workers in the Los Angeles five-county area, an increase of 1.5% over 2014. Add in San Diego, and the total job count increases to over 929,000. This equates to 10.5% of all nonfarm payroll jobs in Southern California.
In 2015, total U.S. retail sales were up by 2.1% compared with 2014. The best performing sectors were food services and drinking places (up by 8.1%); motor vehicles and parts (7.0%); nonstore retailers (6.3%); and furniture and home furnishings stores (5.8%). E-commerce sales increased by an estimated 11.3% over the year and accounted for about 7.8% of total retail sales. Although the growth of e-commerce is one of the more significant trends reshaping the retail industry, there are a handful of sectors that still command a larger share of total retail sales, the largest being motor vehicles and parts with a 20% share.
While the rise of e-commerce has had a profound impact on the retail industry, technological change has transformed the face and the underlying structure of retail in other ways as well. In-store innovations include self-checkout, payment via a mobile device in the hands of a sales associate, and kiosks that allow consumers to browse product catalogs. Retailers are also expanding social media channels to engage with and grow their customer base. This entails the collection of large amounts of data (raising privacy and security concerns in the process) in order to provide a more personal
-15%
-10%
-5%
0%
5%
10%
15%
Jan-
07
Jul-0
7
Jan-
08
Jul-0
8
Jan-
09
Jul-0
9
Jan-
10
Jul-1
0
Jan-
11
Jul-1
1
Jan-
12
Jul-1
2
Jan-
13
Jul-1
3
Jan-
14
Jul-1
4
Jan-
15
Jul-1
5
U.S. Retail Sales
Source: U.S. Census Bureau
Y/Y % Change
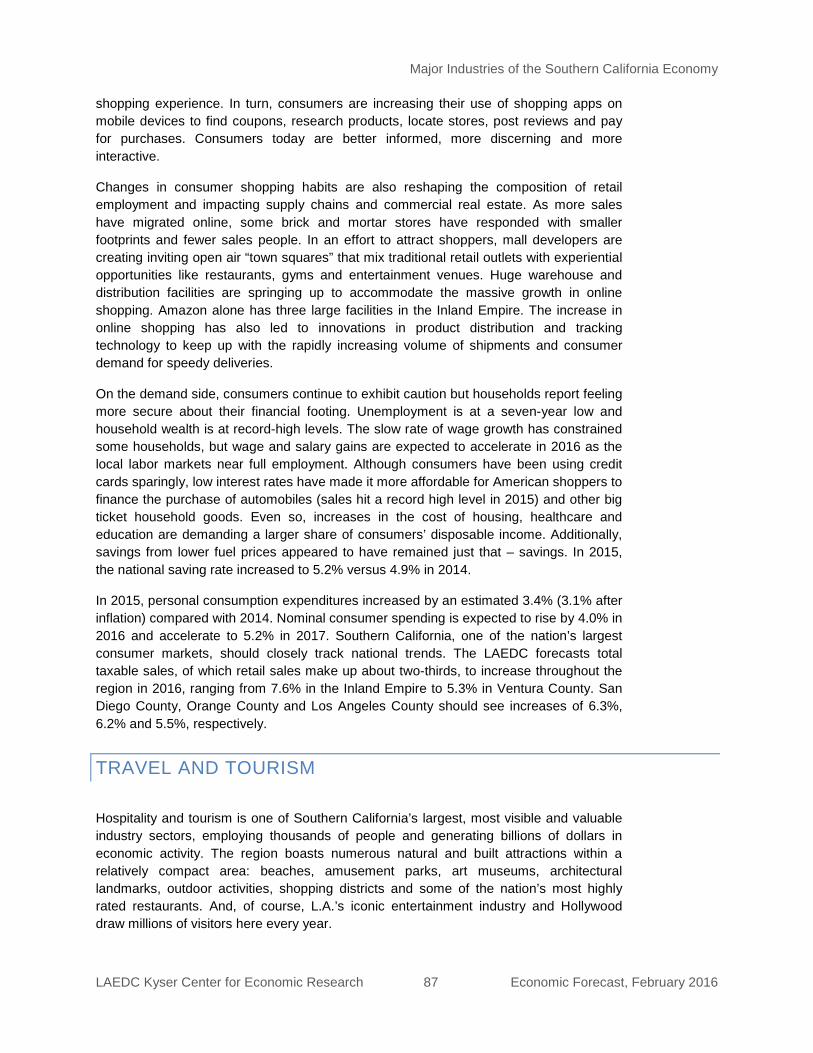
Major Industries of the Southern California Economy
LAEDC Kyser Center for Economic Research 87 Economic Forecast, February 2016
shopping experience. In turn, consumers are increasing their use of shopping apps on mobile devices to find coupons, research products, locate stores, post reviews and pay for purchases. Consumers today are better informed, more discerning and more interactive.
Changes in consumer shopping habits are also reshaping the composition of retail employment and impacting supply chains and commercial real estate. As more sales have migrated online, some brick and mortar stores have responded with smaller footprints and fewer sales people. In an effort to attract shoppers, mall developers are creating inviting open air “town squares” that mix traditional retail outlets with experiential opportunities like restaurants, gyms and entertainment venues. Huge warehouse and distribution facilities are springing up to accommodate the massive growth in online shopping. Amazon alone has three large facilities in the Inland Empire. The increase in online shopping has also led to innovations in product distribution and tracking technology to keep up with the rapidly increasing volume of shipments and consumer demand for speedy deliveries.
On the demand side, consumers continue to exhibit caution but households report feeling more secure about their financial footing. Unemployment is at a seven-year low and household wealth is at record-high levels. The slow rate of wage growth has constrained some households, but wage and salary gains are expected to accelerate in 2016 as the local labor markets near full employment. Although consumers have been using credit cards sparingly, low interest rates have made it more affordable for American shoppers to finance the purchase of automobiles (sales hit a record high level in 2015) and other big ticket household goods. Even so, increases in the cost of housing, healthcare and education are demanding a larger share of consumers’ disposable income. Additionally, savings from lower fuel prices appeared to have remained just that – savings. In 2015, the national saving rate increased to 5.2% versus 4.9% in 2014.
In 2015, personal consumption expenditures increased by an estimated 3.4% (3.1% after inflation) compared with 2014. Nominal consumer spending is expected to rise by 4.0% in 2016 and accelerate to 5.2% in 2017. Southern California, one of the nation’s largest consumer markets, should closely track national trends. The LAEDC forecasts total taxable sales, of which retail sales make up about two-thirds, to increase throughout the region in 2016, ranging from 7.6% in the Inland Empire to 5.3% in Ventura County. San Diego County, Orange County and Los Angeles County should see increases of 6.3%, 6.2% and 5.5%, respectively.
TRAVEL AND TOURISM
Hospitality and tourism is one of Southern California’s largest, most visible and valuable industry sectors, employing thousands of people and generating billions of dollars in economic activity. The region boasts numerous natural and built attractions within a relatively compact area: beaches, amusement parks, art museums, architectural landmarks, outdoor activities, shopping districts and some of the nation’s most highly rated restaurants. And, of course, L.A.’s iconic entertainment industry and Hollywood draw millions of visitors here every year.
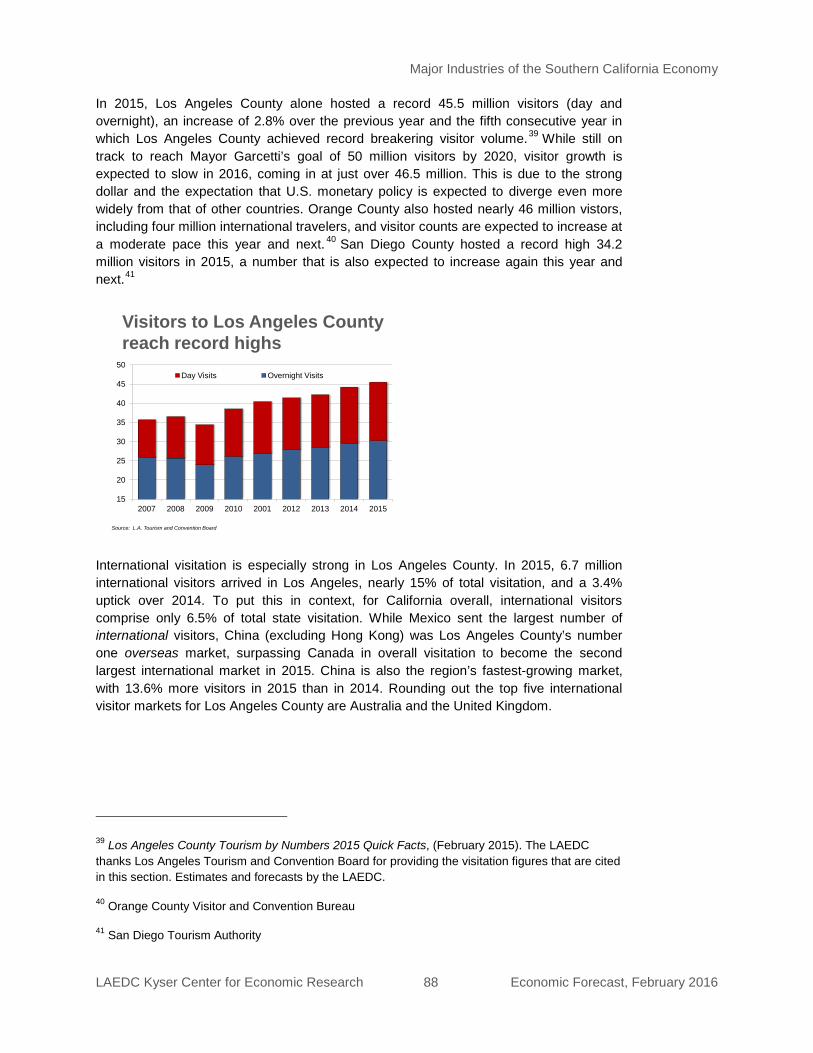
Major Industries of the Southern California Economy
LAEDC Kyser Center for Economic Research 88 Economic Forecast, February 2016
In 2015, Los Angeles County alone hosted a record 45.5 million visitors (day and overnight), an increase of 2.8% over the previous year and the fifth consecutive year in which Los Angeles County achieved record breakering visitor volume.39 While still on track to reach Mayor Garcetti’s goal of 50 million visitors by 2020, visitor growth is expected to slow in 2016, coming in at just over 46.5 million. This is due to the strong dollar and the expectation that U.S. monetary policy is expected to diverge even more widely from that of other countries. Orange County also hosted nearly 46 million vistors, including four million international travelers, and visitor counts are expected to increase at a moderate pace this year and next. 40 San Diego County hosted a record high 34.2 million visitors in 2015, a number that is also expected to increase again this year and next.41
International visitation is especially strong in Los Angeles County. In 2015, 6.7 million international visitors arrived in Los Angeles, nearly 15% of total visitation, and a 3.4% uptick over 2014. To put this in context, for California overall, international visitors comprise only 6.5% of total state visitation. While Mexico sent the largest number of international visitors, China (excluding Hong Kong) was Los Angeles County’s number one overseas market, surpassing Canada in overall visitation to become the second largest international market in 2015. China is also the region’s fastest-growing market, with 13.6% more visitors in 2015 than in 2014. Rounding out the top five international visitor markets for Los Angeles County are Australia and the United Kingdom.
39 Los Angeles County Tourism by Numbers 2015 Quick Facts, (February 2015). The LAEDC thanks Los Angeles Tourism and Convention Board for providing the visitation figures that are cited in this section. Estimates and forecasts by the LAEDC.
40 Orange County Visitor and Convention Bureau
41 San Diego Tourism Authority
Visitors to Los Angeles County reach record highs
Source: L.A. Tourism and Convention Board
15
20
25
30
35
40
45
50
2007 2008 2009 2010 2001 2012 2013 2014 2015
Day Visits Overnight Visits
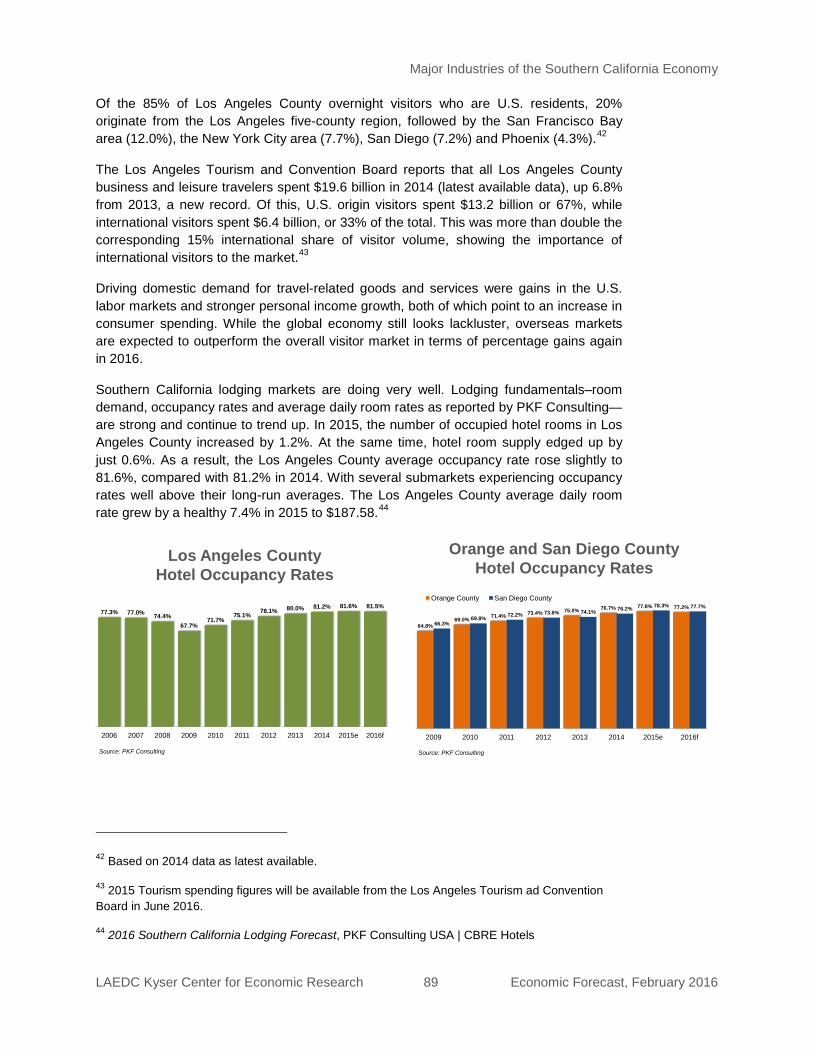
Major Industries of the Southern California Economy
LAEDC Kyser Center for Economic Research 89 Economic Forecast, February 2016
64.8%69.0% 71.4% 73.4% 75.0% 76.7% 77.8% 77.2%
66.3%69.8% 72.2% 73.6% 74.1% 76.2% 78.3% 77.7%
2009 2010 2011 2012 2013 2014 2015e 2016f
Orange County San Diego County
Orange and San Diego CountyHotel Occupancy Rates
Source: PKF Consulting
77.3% 77.0% 74.4%67.7%
71.7%75.1% 78.1% 80.0% 81.2% 81.6% 81.5%
2006 2007 2008 2009 2010 2011 2012 2013 2014 2015e 2016f
Los Angeles CountyHotel Occupancy Rates
Source: PKF Consulting
Of the 85% of Los Angeles County overnight visitors who are U.S. residents, 20% originate from the Los Angeles five-county region, followed by the San Francisco Bay area (12.0%), the New York City area (7.7%), San Diego (7.2%) and Phoenix (4.3%).42
The Los Angeles Tourism and Convention Board reports that all Los Angeles County business and leisure travelers spent $19.6 billion in 2014 (latest available data), up 6.8% from 2013, a new record. Of this, U.S. origin visitors spent $13.2 billion or 67%, while international visitors spent $6.4 billion, or 33% of the total. This was more than double the corresponding 15% international share of visitor volume, showing the importance of international visitors to the market.
43
Driving domestic demand for travel-related goods and services were gains in the U.S. labor markets and stronger personal income growth, both of which point to an increase in consumer spending. While the global economy still looks lackluster, overseas markets are expected to outperform the overall visitor market in terms of percentage gains again in 2016.
Southern California lodging markets are doing very well. Lodging fundamentals–room demand, occupancy rates and average daily room rates as reported by PKF Consulting—are strong and continue to trend up. In 2015, the number of occupied hotel rooms in Los Angeles County increased by 1.2%. At the same time, hotel room supply edged up by just 0.6%. As a result, the Los Angeles County average occupancy rate rose slightly to 81.6%, compared with 81.2% in 2014. With several submarkets experiencing occupancy rates well above their long-run averages. The Los Angeles County average daily room rate grew by a healthy 7.4% in 2015 to $187.58.44
42 Based on 2014 data as latest available.
43 2015 Tourism spending figures will be available from the Los Angeles Tourism ad Convention Board in June 2016.
44 2016 Southern California Lodging Forecast, PKF Consulting USA | CBRE Hotels
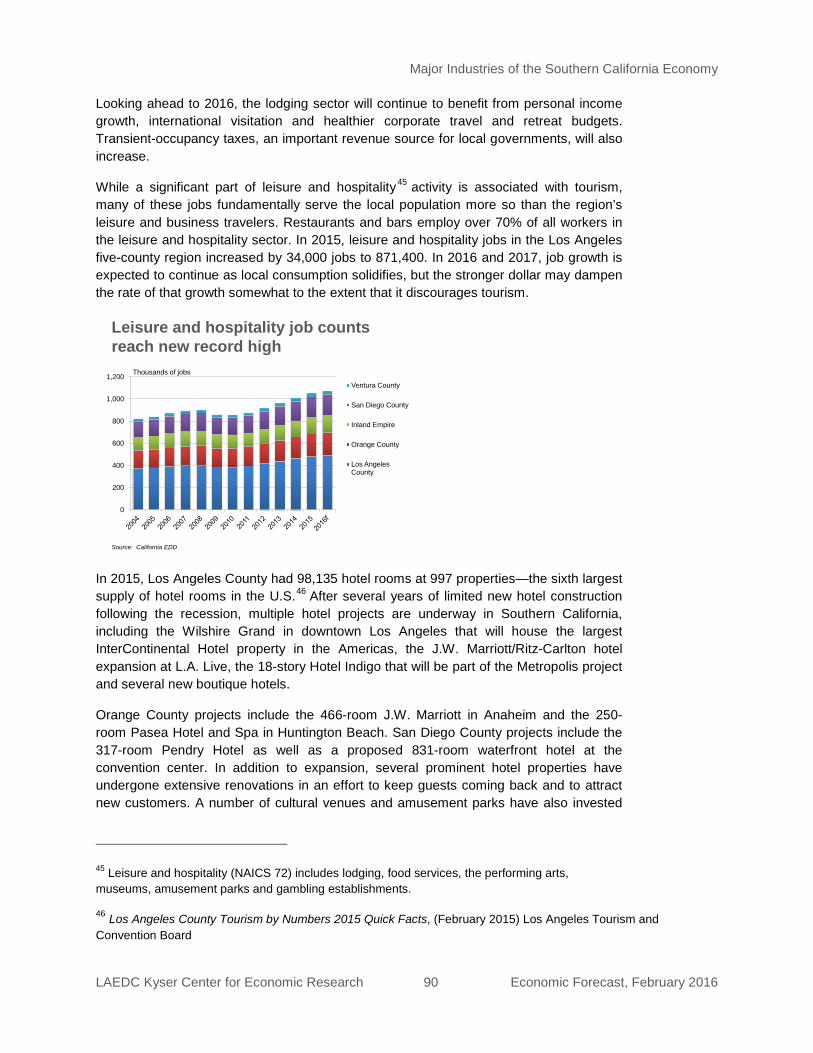
Major Industries of the Southern California Economy
LAEDC Kyser Center for Economic Research 90 Economic Forecast, February 2016
Looking ahead to 2016, the lodging sector will continue to benefit from personal income growth, international visitation and healthier corporate travel and retreat budgets. Transient-occupancy taxes, an important revenue source for local governments, will also increase.
While a significant part of leisure and hospitality45
activity is associated with tourism, many of these jobs fundamentally serve the local population more so than the region’s leisure and business travelers. Restaurants and bars employ over 70% of all workers in the leisure and hospitality sector. In 2015, leisure and hospitality jobs in the Los Angeles five-county region increased by 34,000 jobs to 871,400. In 2016 and 2017, job growth is expected to continue as local consumption solidifies, but the stronger dollar may dampen the rate of that growth somewhat to the extent that it discourages tourism.
In 2015, Los Angeles County had 98,135 hotel rooms at 997 properties—the sixth largest supply of hotel rooms in the U.S.46
Orange County projects include the 466-room J.W. Marriott in Anaheim and the 250-room Pasea Hotel and Spa in Huntington Beach. San Diego County projects include the 317-room Pendry Hotel as well as a proposed 831-room waterfront hotel at the convention center. In addition to expansion, several prominent hotel properties have undergone extensive renovations in an effort to keep guests coming back and to attract new customers. A number of cultural venues and amusement parks have also invested
After several years of limited new hotel construction following the recession, multiple hotel projects are underway in Southern California, including the Wilshire Grand in downtown Los Angeles that will house the largest InterContinental Hotel property in the Americas, the J.W. Marriott/Ritz-Carlton hotel expansion at L.A. Live, the 18-story Hotel Indigo that will be part of the Metropolis project and several new boutique hotels.
45 Leisure and hospitality (NAICS 72) includes lodging, food services, the performing arts, museums, amusement parks and gambling establishments.
46 Los Angeles County Tourism by Numbers 2015 Quick Facts, (February 2015) Los Angeles Tourism and Convention Board
Leisure and hospitality job counts reach new record high
Source: California EDD
0
200
400
600
800
1,000
1,200Ventura County
San Diego County
Inland Empire
Orange County
Los Angeles County
Thousands of jobs
Major Industries of the Southern California Economy
LAEDC Kyser Center for Economic Research 91 Economic Forecast, February 2016
heavily in improvements to attract both local and out-of-area visitors, the largest being Disneyland’s plans to add a 14-acre Star Wars-themed land to their Anaheim park.
Transportation and infrastructure projects to maintain Southern California’s position as a premier travel destination include an $8.5 billion modernization project at LAX, an additional $5 billion in projects to connect LAX via rail and continued expansion of the county rail system. San Diego International and Orange County’s John Wayne Airport have also recently completed major upgrades.
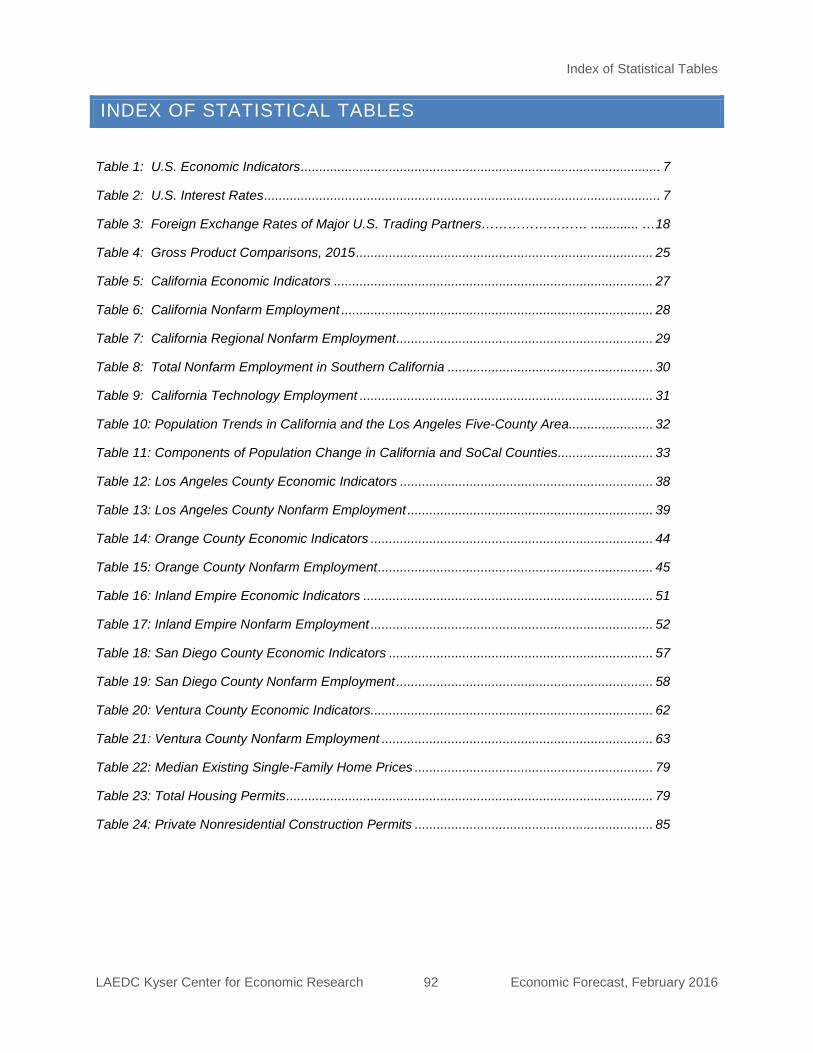
Index of Statistical Tables
LAEDC Kyser Center for Economic Research 92 Economic Forecast, February 2016
INDEX OF STATISTICAL TABLES
Table 1: U.S. Economic Indicators .................................................................................................. 7
Table 2: U.S. Interest Rates ............................................................................................................ 7
Table 3: Foreign Exchange Rates of Major U.S. Trading Partners…………………… ............. …18
Table 4: Gross Product Comparisons, 2015 ................................................................................. 25
Table 5: California Economic Indicators ....................................................................................... 27
Table 6: California Nonfarm Employment ..................................................................................... 28
Table 7: California Regional Nonfarm Employment ...................................................................... 29
Table 8: Total Nonfarm Employment in Southern California ........................................................ 30
Table 9: California Technology Employment ................................................................................ 31
Table 10: Population Trends in California and the Los Angeles Five-County Area....................... 32
Table 11: Components of Population Change in California and SoCal Counties.......................... 33
Table 12: Los Angeles County Economic Indicators ..................................................................... 38
Table 13: Los Angeles County Nonfarm Employment ................................................................... 39
Table 14: Orange County Economic Indicators ............................................................................. 44
Table 15: Orange County Nonfarm Employment ........................................................................... 45
Table 16: Inland Empire Economic Indicators ............................................................................... 51
Table 17: Inland Empire Nonfarm Employment ............................................................................. 52
Table 18: San Diego County Economic Indicators ........................................................................ 57
Table 19: San Diego County Nonfarm Employment ...................................................................... 58
Table 20: Ventura County Economic Indicators............................................................................. 62
Table 21: Ventura County Nonfarm Employment .......................................................................... 63
Table 22: Median Existing Single-Family Home Prices ................................................................. 79
Table 23: Total Housing Permits .................................................................................................... 79
Table 24: Private Nonresidential Construction Permits ................................................................. 85