Embed Size (px)
DESCRIPTION
teknologi dalam sains sukan
Citation preview

This article was downloaded by: [Victoria University]On: 14 August 2014, At: 20:06Publisher: Taylor & FrancisInforma Ltd Registered in England and Wales Registered Number: 1072954 Registered office: Mortimer House,37-41 Mortimer Street, London W1T 3JH, UK
European Journal of Sport SciencePublication details, including instructions for authors and subscription information:http://www.tandfonline.com/loi/tejs20
Anaerobic power characteristics of elite athletes innational level team-sport gamesMichael Kalinski a , Henrick Norkowski b , Matthew Kerner c & Wlodzimierz Tkaczuk da Exercise Sciences Laboratories in the School of Exercise, Leisure, and Sport, Kent StateUniversity, Kent, OH, 44242b Department of Sport Games, Academy of Physical Education, Polandc Division of Sports Sciences in the School of Health Professional, Long Island University,Brooklyn, NY, 11201d Department of Physiology and Biochemistry, Academy of Physical Education, PolandPublished online: 09 Nov 2010.
To cite this article: Michael Kalinski , Henrick Norkowski , Matthew Kerner & Wlodzimierz Tkaczuk (2002) Anaerobic powercharacteristics of elite athletes in national level team-sport games, European Journal of Sport Science, 2:3, 1-21, DOI:10.1080/17461390200072303
To link to this article: http://dx.doi.org/10.1080/17461390200072303
PLEASE SCROLL DOWN FOR ARTICLE
Taylor & Francis makes every effort to ensure the accuracy of all the information (the “Content”) containedin the publications on our platform. However, Taylor & Francis, our agents, and our licensors make norepresentations or warranties whatsoever as to the accuracy, completeness, or suitability for any purpose of theContent. Any opinions and views expressed in this publication are the opinions and views of the authors, andare not the views of or endorsed by Taylor & Francis. The accuracy of the Content should not be relied upon andshould be independently verified with primary sources of information. Taylor and Francis shall not be liable forany losses, actions, claims, proceedings, demands, costs, expenses, damages, and other liabilities whatsoeveror howsoever caused arising directly or indirectly in connection with, in relation to or arising out of the use ofthe Content.
This article may be used for research, teaching, and private study purposes. Any substantial or systematicreproduction, redistribution, reselling, loan, sub-licensing, systematic supply, or distribution in anyform to anyone is expressly forbidden. Terms & Conditions of access and use can be found at http://www.tandfonline.com/page/terms-and-conditions

Anaerobic Power and Elite Athletes / 1
1
Anaerobic Power Characteristics of Elite Athletesin National Level Team-Sport Games
Michael I. Kalinski, Henrick Norkowski,Matthew S. Kerner, and Wlodzimierz G. Tkaczuk
Purpose: The purpose of the study was to acquire current anthropometric andphysiological profiling of elite athletes and to examine differences in the char-acteristics. Methods: Three hundred and sixteen male, team-sport athletes wereevaluated for anaerobic performance using the Wingate anaerobic test. Results:MANOVA procedures indicated significant differences in height among play-ers of the sports. Pearson correlations indicated strong correlations for bodymass with absolute peak power (Pp) and mean power (Pm), and relative Pm.Height correlated strongly with absolute Pp and Pm, with a low correlation withrelative Pp. MANOVA procedures indicated that athletes who specialized inhandball, volleyball, and basketball attained the greatest relative and absolutePp, and the greatest relative Pm. Relative and absolute Pp of the soccer athleteswere lowest of all other elite athletes. Conclusion: This study introduces nor-mative values for elite male athletes, empowering coaches in the evaluation ofanaerobic abilities and in the objective selection of athletes for competition.
Key Words: Wingate anaerobic test, anaerobic capacity
Key Points:
1. This study introduces anthropometric and physiological profiling of elite maleathletes from five different team sports in Poland.
2. Members of elite league teams in Poland, including soccer, European-style hand-ball, rugby, basketball, and volleyball, were evaluated for performance in theWingate anaerobic test.
3. Athletes specializing in European-style handball, volleyball, and basketball at-tained the greatest relative and absolute peak anaerobic power, and the greatestrelative mean anaerobic power.
4. Height correlated strongly with absolute peak anaerobic power and mean anaero-bic power, with a low correlation for height with relative peak anaerobic power.
European Journal of Sport Science, vol. 2, issue 3©2002 by Human Kinetics Publishers and the European College of Sport Science
M.I. Kalinski <[email protected]> is with the Exercise Sciences Laboratories in theSchool of Exercise, Leisure, and Sport at Kent State University, Kent, OH 44242. H.Norkowski is with the Department of Sport Games in the Academy of Physical Education,Poland. M.S. Kerner <[email protected]> is with the Division of Sports Sciences inthe School of Health Professional at Long Island University, Brooklyn, NY 11201. W.G.Tkaczuk is with the Department of Physiology and Biochemistry in the Academy of PhysicalEducation, Poland.
Dow
nloa
ded
by [
Vic
tori
a U
nive
rsity
] at
20:
06 1
4 A
ugus
t 201
4

2 / Kalinski, Norkowski, Kerner, and Tkaczuk
Introduction
Many sports can be described as interval sports, with the demands at high levelsrequiring intermittent bouts of high-intensity play interspersed with periods ofsubmaximal effort, utilizing both aerobic and anaerobic energy systems. Sportactivities such as volleyball, rugby, handball, basketball, and soccer are comprisedof varying explosive movement patterns (e.g., forward, side-to-side, backwardshuffles), runs at different intensities (e.g., jog, sprint), kicking, tackling, turning,jumps, and sustained forceful contractions to control the ball against defensivepressure. It has been suggested that success in many sport games appears to includehigh anaerobic capacity, not aerobic power alone (1, 13, 14, 16, 18, 20).
The assessment of physical work capacity is a major consideration in prepar-ing athletes for high-level competition. Current information regarding physiologi-cal profiles is necessary to provide a quantifiable basis for the development andmaintenance of conditioning and training programs (2, 7, 16, 18, 21). The assess-ment of anaerobic performance is relevant to athletes and coaches because anaero-bic performance can be altered through anaerobic conditioning.
The importance of anaerobic capacity measurement in sport games is in thedevelopment of sport-specific physiological profiling, the assessment of condition-ing and training programs, and the evaluation of the sport’s physiological demands.
Numerous studies have been reported to document the physiological profilesof competitors in a variety of sport games (1, 4, 6, 9, 12, 17, 20, 24). However, thereis a paucity of scientific literature readily available pointing to similarities anddifferences among competitors of different sport games and different nations. Thepurpose of this study was threefold: (a) to acquire current physiological profiling ofelite athletes from five different team sports of the Polish elite league to serve as aquantifiable basis for the development and maintenance of conditioning and train-ing programs; (b) to examine the differences in the anthropometric and physiologi-cal characteristics among basketball, volleyball, handball, rugby, and soccer ath-letes; and (c) to compare such values with those reported for similar elite athletesfrom other nations.
Methods
Subjects
The 316 male subjects (age, mean = 23.7, SD = 2.9 years), having consented toparticipate in this investigation, were all members of first league sports teams inPoland during the 2000–2001 seasons (for basketball, n = 54; for volleyball, n = 48;for handball, n = 76; for rugby, n = 64; for soccer, n = 74). The teams were comprisedof players who were chosen from different cities nationwide. Training experienceaveraged 8.4 years and ranged from 3.7 to 16.4 years. Subject treatment was consis-tent with the policies of the Academy of Physical Education Institutional ReviewBoard.
Assessment of Body Mass
Body mass and stature were measured according to Gordon et al. (11). Body masswas measured using a leveled platform scale, with a beam and moveable weights.
Dow
nloa
ded
by [
Vic
tori
a U
nive
rsity
] at
20:
06 1
4 A
ugus
t 201
4

Anaerobic Power and Elite Athletes / 3
The subjects were weighed wearing shorts and a tee shirt, and without shoes. Bodymass was recorded to the nearest 100 g. Stature was measured using a portablestadiometer. The subjects were measured wearing thin socks, with bodyweightevenly distributed to both feet and head positioned in the Frankfurt HorizontalPlane. Stature was recorded to the nearest .25 cm.
Wingate Anaerobic Test
Metabolic criteria were assessed using the Wingate protocol (15) on a Monark 824Ecycle ergometer (Monark, Varberg, Sweden) interfaced with a computer. Data werecollected with the OptoSensor testing software package (Sports Medicine Indus-tries, Inc., St. Cloud, MN, U.S.). Each subject was asked to cycle at maximum effortagainst a predetermined workload. The subjects were instructed to begin seatedpedaling as fast as possible throughout the test. Subjects were instructed to completea 4–5-min intermittent warm-up at an intensity sufficient to elicit heart rate in-creases to 150–160 b · min–1. The warm-up was interspersed with three “all-outsprints” at maximum rpm, lasting 4–8 s, to get a feel for the actual test. The subjectsthen rested for about 5 min to eliminate any fatigue associated with the warm-up.
The data collection phase was initiated by a 3–4-s period, whereby subjectspedaled at a submaximal resistance to allow them to overcome the inertial andfrictional resistance of the flywheel and to shorten the acceleration phase. This wasimmediately followed by application of the full workload, corresponding to 0.075kp · kg–1 of bodyweight, which signaled the beginning of the 30-s test. The subjectswere instructed to pedal as fast as possible for the entire length of the test and tomaintain that maximal effort throughout the 30-s test period. Verbal encouragementwas given throughout the test. The test was followed by a 2–3-min active recoveryperiod on the cycle ergometer, consisting of pedaling against a light resistance thatallowed the heart rate to return to within 10 b · min–1 of resting value in all cases.
Performance was expressed by two indices commonly used in this test: peakpower (Pp) or maximal power output attained during the test, and mean power (Pm)performed during the entire 30 s. Peak power output was taken as the highest poweroutput attained over a 5-s interval, and mean power output was the average of allvalues obtained during the test. Peak anaerobic power and Pm were expressed inrelative and absolute terms.
Statistical Procedures
Means and standard deviations were calculated individually for each sport and forthe five sports combined. Pearson correlations were executed between the anthro-pometric data and the metabolic criteria. Multiple analysis of variance procedureswere used to determine possible significant differences among the elite players ofthe Polish elite league sports teams. This was followed by post hoc Tukey multiple-comparison procedures in order to identify pair-wise differences among the groups.Significance levels for all statistical analyses were set at = .05.
Results
Table 1 provides the anthropometric and descriptive data for variables according toeach team sport, and probability values for MANOVA and post hoc Tukey tests
Dow
nloa
ded
by [
Vic
tori
a U
nive
rsity
] at
20:
06 1
4 A
ugus
t 201
4

4 / Kalinski, Norkowski, Kerner, and Tkaczuk
Table 1 Anthropometric and Descriptive Characteristics of the SubjectsBy Sport Including Probability Values for MANOVA and Post Hoc Tukey TestsBetween the Sports (N = 316)
Longevity of Age Body mass HeightSport/variables n training (year) (year) (kg) (cm)
1. Basketball 54 9.4 (3.3) 24.2 (3.3) 91.0 (10.5) 196.9 (7.5)2. Volleyball 48 8.1 (3.1) 23.7 (3.3) 85.1 (5.4) 195.4 (5.2)3. Handball 76 8.0 (2.9) 23.5 (3.1) 88.3 (6.2) 190.2 (4.9)4. Rugby 64 7.4 (2.6) 24.3 (2.8) 93.3 (11.5) 184.8 (6.4)5. Soccer 74 8.9 (2.1) 23.0 (2.2) 75.8 (6.0) 178.3 (6.3)
Mean 316 8.4 (3.3) 23.7 (2.9) 86.3 (10.4) 188.2 (9.2)[1] p n.s. +5; *2 +3,4,5[2] p n.s. +4,5; *1 +3,4,5[3] p n.s. +5; **4 +1,2,4,5[4] p n.s. ++2,5; **3 +1,2,3,5[5] p n.s. ++1,2,3,4 +1,2,3,4
Note. Values expressed as mean (SD).+p < .001; ++p = .001; ^p < .03; ^^p < .02; *p < .05; **p < .01.
between the sports (N = 316). The age of the athletes ranged from 19 to 34 years(mean = 23.7, SD = 2.9). Results of MANOVA procedures indicate no significantdifferences in age between the elite athletes by sport.
Length of training ranged from 3.7 to 16.4 years (mean = 8.4, SD = 3.3).MANOVA procedures indicated that the length of training was significantly high-est for the basketball athletes and lowest for both handball and rugby athletes.
Player height ranged from 165 to 212 cm, while body mass ranged from 64 to122 kg. Descriptive analyses and MANOVA procedures indicated that rugby andbasketball athletes had the greatest body mass, and soccer athletes the least. Resultsof MANOVA procedures indicate that significant differences in body mass existbetween players of: volleyball and soccer, rugby and basketball; soccer and volley-ball, rugby, handball and basketball; rugby and volleyball, soccer, and handball;handball and soccer and rugby; and basketball and volleyball and soccer.
Results of descriptive analyses point out that basketball and volleyball ath-letes had the greatest body height, and soccer, the least. Results of MANOVAprocedures indicated that significant differences in body height exist between play-ers of: volleyball and soccer, rugby and handball; soccer and volleyball, rugby,handball and basketball; rugby and volleyball, soccer, handball, and basketball;handball and volleyball, soccer, rugby and basketball; and basketball and soccer,rugby and handball.
A significant large correlation was found for body mass with height (r = .83,p < .001) among the basketball players. Significant (p < .001) moderate correlationswere found for body mass with height for handball (r = .62), soccer (r = .54), rugby(r = .52), and volleyball (r = .48). Overall, a significant moderate correlation was
Dow
nloa
ded
by [
Vic
tori
a U
nive
rsity
] at
20:
06 1
4 A
ugus
t 201
4

Anaerobic Power and Elite Athletes / 5
found for body mass with height (r = .60, p < .001). Height and body mass ranges forthe basketball players were very large, from 178 cm to 212 cm and 65 kg to 111 kg,respectively. Figure 1 illustrates that body mass of the soccer players tended tocluster at the low end of the range of height scores, with body mass scores of thevolleyball and handball players clustering about the midrange of height scores, andthe body mass scores of the rugby players having slightly greater variability aboutthe mid to high range of height scores.
Significant large correlations were found for body mass with absolute Pp (r =.87, p < .001; Figure 2) and absolute Pm (r = .86, p < .001; Figure 3). A low butsignificant correlation was found for body mass with relative Pm (r = .12, p < .03;Figure 4). No correlation was observed between body mass and relative Pp (Figure
Figure 1 — Relationship between body mass and height among sports (N = 316).
Figure 2 — Relationship between body mass and absolute peak anaerobic power amongsports (N = 316).
Dow
nloa
ded
by [
Vic
tori
a U
nive
rsity
] at
20:
06 1
4 A
ugus
t 201
4

6 / Kalinski, Norkowski, Kerner, and Tkaczuk
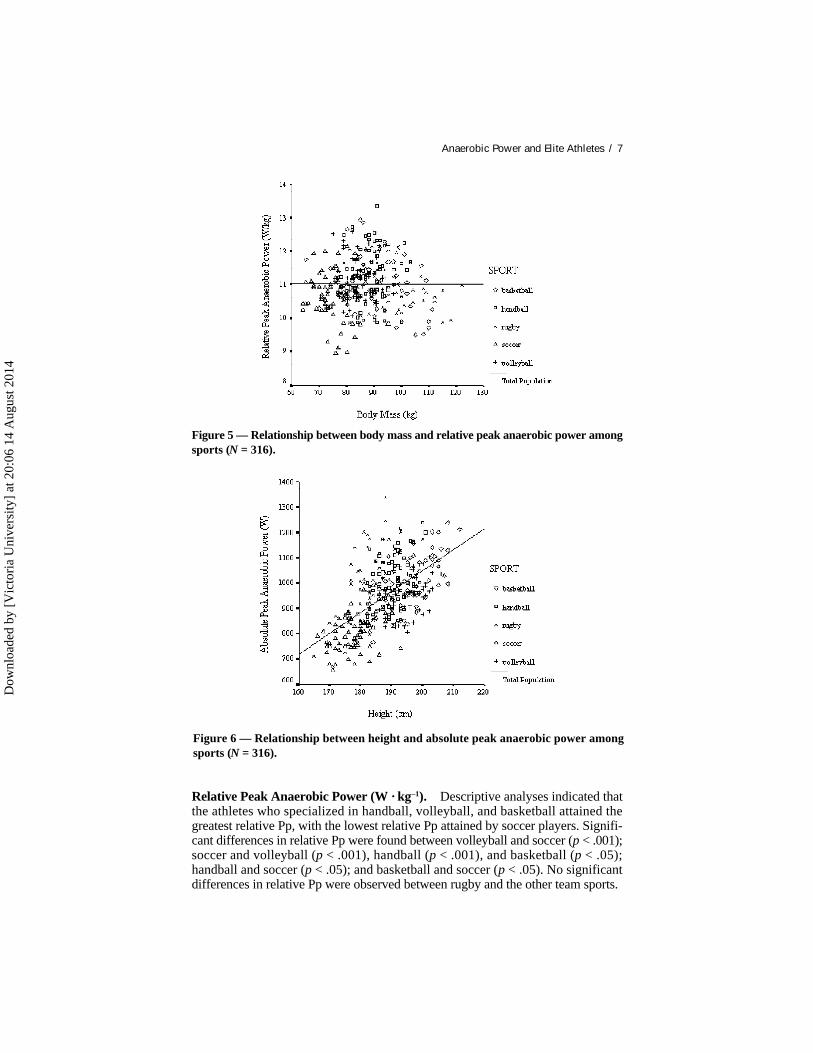
5). Height correlated strongly with absolute Pp (r = .59, p < .001; Figure 6) andabsolute Pm (r = .47, p < .001; Figure 7). A low but significant correlation was foundfor height with relative Pp (r = .15, p < .01; Figure 8), while no correlation wasobserved between body mass and relative Pm (Figure 9).
Evaluation of Metabolic Criteria
Results of the anaerobic assessments expressed by team sport participation andprobability values for MANOVA and post hoc Tukey tests between the sports (N =316) are shown in Table 2.
Figure 3 — Relationship between body mass and absolute mean anaerobic power amongsports (N = 316).
Figure 4 — Relationship between body mass and relative mean anaerobic power among
Dow
nloa
ded
by [
Vic
tori
a U
nive
rsity
] at
20:
06 1
4 A
ugus
t 201
4
Anaerobic Power and Elite Athletes / 7
Figure 5 — Relationship between body mass and relative peak anaerobic power amongsports (N = 316).
Figure 6 — Relationship between height and absolute peak anaerobic power amongsports (N = 316).
Relative Peak Anaerobic Power (W · kg–1). Descriptive analyses indicated thatthe athletes who specialized in handball, volleyball, and basketball attained thegreatest relative Pp, with the lowest relative Pp attained by soccer players. Signifi-cant differences in relative Pp were found between volleyball and soccer (p < .001);soccer and volleyball (p < .001), handball (p < .001), and basketball (p < .05);handball and soccer (p < .05); and basketball and soccer (p < .05). No significantdifferences in relative Pp were observed between rugby and the other team sports.
Dow
nloa
ded
by [
Vic
tori
a U
nive
rsity
] at
20:
06 1
4 A
ugus
t 201
4

8 / Kalinski, Norkowski, Kerner, and Tkaczuk
Absolute Peak Anaerobic Power (W). Descriptive analyses indicated that theathletes who specialized in rugby, basketball, and handball attained the greatestabsolute Pp, with the lowest Pp attained by volleyball and soccer players. Signifi-cant differences in absolute Pp were found between volleyball and soccer (p < .001)and rugby (p < .02); soccer and volleyball (p < .001), rugby (p < .001), handball (p <.001), and basketball (p < .001); rugby and volleyball (p < .02) and soccer (p < .001);handball and soccer (p < .001); and basketball and soccer (p < .001).
Figure 7 — Relationship between height and absolute mean anaerobic power amongsports (N = 316).
Figure 8 — Relationship between height and relative peak anaerobic power amongsports (N = 316).
Dow
nloa
ded
by [
Vic
tori
a U
nive
rsity
] at
20:
06 1
4 A
ugus
t 201
4

Anaerobic Power and Elite Athletes / 9
Relative Mean Anaerobic Power (W · kg–1). Descriptive analyses indicated thatthe athletes who specialized in handball, rugby, and basketball attained the greatestrelative Pm, with the lowest relative Pm attained by volleyball and soccer players.Significant differences in relative Pm were found between volleyball and soccer (p< .03), rugby (p < .001), handball (p < .001), and basketball (p < .001); soccer andvolleyball (p < .03), rugby (p < .001), handball (p < .001) and basketball (p < .001);rugby and volleyball (p < .001) and soccer (p < .001); handball and volleyball (p <.001) and soccer (p < .001); and basketball and volleyball (p < .001) and soccer (p <.001).
Absolute Mean Anaerobic Power (W). Descriptive analyses indicated that theathletes who specialized in rugby, basketball, and handball attained the greatestabsolute Pm, with the lowest absolute Pm attained by volleyball and soccer players.Significant differences in absolute Pm were found between volleyball and soccer (p< .01), rugby (p < .001), handball (p < .001), and basketball (p < .001); soccer andvolleyball (p < .01), rugby (p < .001), handball (p < .001), and basketball (p < .001);rugby and volleyball (p < .001) and soccer (p < .001); handball and volleyball (p <.001) and soccer (p < .001); and basketball and volleyball (p < .001) and soccer (p <.001).
Discussion
In sport games such as volleyball, soccer, rugby, handball, and basketball, athletesperform intermittent exercise (3). Bangsbo states that aerobic metabolism contrib-utes to sport games during both exercise and recovery phases, whereas anaerobicmetabolism provides energy during the exercise bout (3). The results of this studydescribe the anthropometric, and relative and absolute anaerobic characteristics ofelite athletes from different team sports of a national elite league. To the best of our
Figure 9 — Relationship between height and relative mean anaerobic power amongsports (N = 316).
Dow
nloa
ded
by [
Vic
tori
a U
nive
rsity
] at
20:
06 1
4 A
ugus
t 201
4

10 / Kalinski, Norkowski, Kerner, and Tkaczuk
Table 2 Anaerobic Potentials of the Subjects Including Probability Valuesfor MANOVA and Post Hoc Tukey Tests Between the Sports (N = 316)
Relative peak Absolute peak Relative mean Absolute meananaerobic anaerobic anaerobic anaerobic
power power power powerSport/variables (W · kg–1) (W) (W · kg–1) (W)
1. Basketball 11.05 1002.73 8.70 789.92(0.81) (114.09) (0.63) (93.88)
2. Volleyball 11.24 956.01 7.95 676.27(0.64) (78.69) (0.46) (57.85)
3. Handball 11.27 994.79 8.93 788.02(0.80) (101.13) (0.66) (77.37)
4. Rugby 10.94 1016.84 8.79 816.1(0.59) (124.22) (0.49) (101.08)
5. Soccer 10.69 809.84 8.26 626.34(0.68) (79.56) (0.57) (67.50)
Mean 11.03 951.41 8.56 739.2(0.74) (128.80) (0.67) (111.00)
[1] p *5 *5 +5 +5
[2] p +5 +5; ^4 +1,3,4; ++5 +1,3,4; **5
[3] p *5 *5 +2,5 +2,5
[4] p n.s. ^2; +5 +2,5 +2,5
[5] p +2,3; *1 +1,2,3,4 +1,3,4; ++2 +1,3,4; **2
Note. Values expressed as mean (SD).+p < .001; ++p < .03; ^p < .02; *p < .05; **p < .01.
knowledge, data presented in Tables 1 and 2 represent the first profiling of anaerobiccharacteristics of such athletes as in Poland’s elite league. A limited number ofcomparisons to similar elite athletes can be made with respect to anaerobic power.The current investigation complements previous studies in which comparisons be-tween metabolic criteria and anthropometric data were limited to a single sportgame, devoid of comparison to different games. Data were absent for comparisonbetween metabolic criteria and anthropometric data measured in this study andother studies of elite athletes from the sports of volleyball, soccer, rugby, handball,and basketball.
Physical Characteristics
In this investigation, subjects indicated a considerable number of years in specificconditioning and training for their sport games, averaging 8.4 years (SD = 3.3), withbasketball players averaging the greatest at 9.4 years (SD = 3.3).
Dow
nloa
ded
by [
Vic
tori
a U
nive
rsity
] at
20:
06 1
4 A
ugus
t 201
4

Anaerobic Power and Elite Athletes / 11
Basketball and volleyball players were significantly taller than the athletes ofthe other sports. Success in both basketball and volleyball depends upon character-istics of blocking, spiking, and shooting, all combined with high technical skill. Ithas been suggested that player height may be a very important criterion whenselecting players (22). A comparison of body heights among international basket-ball and volleyball teams reveals that mean heights ranged from 192 to 195 cm (12,19, 22–24). However, success in sport is also dependent in large part upon explosivepower, skill, training, and tactic. Driss, Vanderwalle, and Monod (9) have reporteda mean height of 180 cm (SD = 7.0) for volleyball players, with Maud (17) reportingbody heights as low as 160 cm (mean = 180.7 cm, SD = 8.7) for rugby players.
In this investigation, rugby and basketball players had the greatest body massand soccer players, the least. Results of MANOVA procedures indicate that signifi-cant differences in body mass exist between players of: volleyball and soccer, rugbyand basketball; soccer and volleyball, rugby, handball and basketball; rugby andvolleyball, soccer, and handball; handball and soccer and rugby; and basketball andvolleyball and soccer. A comparison of body mass among American, Canadian,English, Finish, French, Saudi, and Soviet national basketball, rugby, soccer, andvolleyball teams reveals that mean body mass ranged widely, from 69 to 90.1 kg (1,9, 17, 19, 20, 22, 23). The broad body mass range indicates that body mass is likely aresult of sport selection yet also points toward heterogeneity of body mass, evenwithin the same sport.
Anaerobic Characteristics
We observed for both relative and absolute Pp that values achieved for elite athletesof basketball, handball, rugby, and volleyball were similar. Whereas the rugby andbasketball players attained the largest absolute Pp values, their absolute Pp valuesdisplayed an inverse relationship to body mass. This is in agreement with a previousstudy (5) and supports the argument that dimensional scaling should be incorpo-rated when comparing athletes with different body mass. A limited comparisoncould only be made with regard to elite athletes in similar sports due to a paucity ofpublished data in the sports of rugby and handball, in particular.
Our findings for relative Pp of volleyball players are 15.5% lower than thosefound of Canadian national volleyball players (mean = 13.3 W · kg–1, SD = 0.9; 20).Our findings for relative Pp of basketball players are 21.6% lower than those foundfor Israeli national basketball players (mean = 14.1 W · kg–1, SD = 1.4; 12). Theabsolute Pp of the Israeli national team (mean = 1199.91 W) was 19.7% higher thanthe absolute Pp reached by the basketball players in this study. We observed thatboth relative and absolute Pp of the basketball, volleyball, handball, and rugbyathletes in this study were exceedingly higher (for relative Pp, as high as 23%; forabsolute Pp, as high as 64%) than for those anaerobic potentials reported for appar-ently healthy, untrained males (15).
We observed for both relative and absolute Pm that values achieved for eliteathletes of basketball, handball, and rugby were similar. Mean anaerobic power ofthe volleyball and soccer players was unremarkably different. Herein, again, onlylimited comparisons could be made with regard to elite athletes in these sports due toa paucity of published data in the sports of rugby, handball, and volleyball, inparticular.
Dow
nloa
ded
by [
Vic
tori
a U
nive
rsity
] at
20:
06 1
4 A
ugus
t 201
4

12 / Kalinski, Norkowski, Kerner, and Tkaczuk
Our findings for relative Pm of volleyball players in this study is 16.3% lowerthan that found of Israeli National basketball players (mean = 9.5 W · kg–1; 14). Theabsolute Pm of the Israeli national team (mean = 808.45 W) was only 2.3% higherthan the absolute Pm reached by the basketball players in this study.
In this study, we observed that both relative and absolute Pm of the basketball(for relative Pp, 16.0%; for absolute Pp, 127.3%), volleyball (for relative Pp, 6.0%;for absolute Pp, 94.8%), handball (for relative Pp, 19.1%; for absolute Pp, 127.1%),and rugby (for relative Pp, 17.2%; for absolute Pp, 235.2%) athletes were exceed-ingly higher than for those “good” anaerobic potentials reported for apparentlyhealthy, untrained males (15). The relative and absolute Pm of the aforementionedsport games in this investigation were 8.59 W · kg–1 and 767.5 W, respectively. Acomparison of these relative and absolute Pm values to those of the untrained Israelimales indicates that the average relative and absolute Pm values of the athletes fromthese four sports are greater by 48.4% and 93.1%, respectively. In this study, weobserved mean relative and absolute Pp for basketball, volleyball, handball, andrugby of 11.13 W · kg–1 and 922.6 W, respectively. A comparison of these relativeand absolute Pp values to those of the untrained Israeli males indicates that theaverage relative and absolute Pm values of the athletes from these four sports aregreater by 21.6% and 59.6%, respectively.
In this study, we observed that both relative and absolute Pp and Pm of thesoccer athletes were higher than the apparently healthy, untrained males previouslyreported by Inbar, Bar-Or, and Skinner (15). While the soccer players in the currentstudy reached a relative Pp of 10.7 W · kg–1 and an absolute Pp of 810 W, these valuesare 16.9% and 30.0% higher than the “good” normalized scores reported in theInbar, Bar-Or, and Skinner study (for relative Pp, as high as 23%; for absolute Pp, ashigh as 64%). The relative and absolute Pm of the soccer athletes in the currentinvestigation were 10.1% and 80.2% greater than the “good” normalized scoresreported in the Inbar, Bar-Or, and Skinner study. These findings are in agreementwith data reported by Kirkendall (16), who concluded that when comparing soccerplayers to the general population, the athletes’ physiological profiles are above thenorm. The relative and absolute Pp values in this study were similar to those recentlyreported for elite soccer players (for relative Pp, mean = 11.88, SD = 1.3; for absolutePp, mean = 873.6, SD = 141.8; 1). Our findings are also in agreement with therelative and absolute Pm values reported in that same study by Al-Hazzaa et al. (forrelative Pm, mean = 8.02, SD = 0.53; for absolute Pp, mean = 587.7, SD = 55.4; 1). Incontrast, the mean values for both peak power and mean power, expressed relative tobody mass, were lower than values reported for elite Swedish (10) and Englishsoccer players (8).
In comparison, however, we found the relative and absolute Pp of the soccerathletes to be lowest of all other elite athletes in this study (for handball, 5.1% and18.8%, respectively; for volleyball, 4.9% and 15.3%, respectively; and for basket-ball, 3.3% and 19.2%, respectively). In addition, we found the absolute Pp of thesoccer athletes to be 20.4% lower than the handball athletes, with no significantdifference in absolute Pp between them.
Conclusions
The present study introduces normative values for male athletes at the elite level ofthe team sports of basketball, volleyball, handball, rugby, and soccer. These data
Dow
nloa
ded
by [
Vic
tori
a U
nive
rsity
] at
20:
06 1
4 A
ugus
t 201
4

Anaerobic Power and Elite Athletes / 13
should benefit coaches and athletes alike in the evaluation of anaerobic abilities andassist in the selection of athletes for competition. The physiological profile of a sportdescribes the physical characteristics of an athlete, which can then be used to iden-tify talent and develop sport-specific training programs.
References
1. Al-Hazzaa HM, Almuzini KS, Al-Refaee SA, Sulaiman MA, Dafterdar MY, Al-GhamediA, Al-Khuraiji KN. 2001. Aerobic and anaerobic power characteristics of Saudi elitesoccer players. J Sports Med Phys Fitness 41:54-61.
2. Bacharach DW, Petelin von Duvillard S. 1995. Intermediate and long-term anaerobicperformance of elite Alpine skiers. Med Sci Sports Exerc 27:305-9.
3. Bangsbo J. 2000. Physiology of intermittent exercise. In: Garrett Jr. WE, Kirkendall DT,editors. Exercise and sport science. Philadelphia: Lippincott Williams & Wilkins. p. 53-65.
4. Bell W, Cooper SM, Cobner D, Longville J. 1994. Physiological changes arising from atraining programme in under-21 international netball players. Ergonomics. 37:149-57.
5. Bergh U, Sjodin B, Forsberg A, Svedenhag J. 1991. The relationship between body massand oxygen uptake during running in humans. Med Sci Sports Exerc 23:211.
6. Brinzak VP, Kalinski MI, Valtin AI, Povzitkova MC. 1983. Blood acid-base balance inathletes during exercise. Ukranian Biochem J 55:83-85.
7. Bulbulian R, Jeong J-W, Murphy M. 2001. Comparison of anaerobic components of theWingate and critical power tests in males and females. Med Sci Sports Exerc 28:1336-41.
8. Davis J, Brewer J, Atkin D. 1992. Pre-season physiological characteristics of Englishfirst and second division soccer players. J Sports Sci 10:547.
9. Driss T, Vanderwalle H, Monod H. 1998. Maximal power and force-velocity relation-ships during cycling and cranking exercises in volleyball players: correlation with thevertical jump test. J Sports Med Phys Fitness 38:286-93.
10. Ekblom B. 1986. Applied physiology of soccer. Sports Med 3:50-60.11. Gordon CC, Chumlea WC, Roche AF. 1988. Stature, recumbent length, and weight. In:
Lohman TG, Roche AF, Martorell R, editors. Anthropometric standardization referencemanual. Champaign, IL: Human Kinetics. p. 3-8.
12. Hoffman JR, Epstein S, Einbinder M, Weinstein Y. 2000. A comparison between theWingate anaerobic power test to both vertical jump and lone drill tests in basketballplayers. J Strength Conditioning Res 14:261-64.
13. Hoffman JR, Maresh CM. 2000. Physiology of basketball. In: Garrett Jr. WE, KirkendallDT, editors. Exercise and sport science. Philadelphia: Lippincott Williams & Wilkins. p.733-44.
14. Hoffman JR, Tennenbaum G, Maresh CM, Kraemer WJ. 1996. Relationship betweenathletic performance tests and playing time in elite college basketball players. J StrengthConditioning Res 10:67-71.
15. Inbar O, Bar-Or O, Skinner JS. 1996. The Wingate anaerobic test. Champaign, IL:Human Kinetics. p. 8-24.
16. Kirkendall DT. 2000. Physiology of soccer. In: Garrett Jr. WE, Kirkendall DT, editors.Exercise and sport science. Philadelphia: Lippincott Williams & Wilkins. p. 875-84.
17. Maud PJ. 1983. Physiological and anthropometric parameters that describe a rugbyunion team. Br J Sports Med 17:16-23.
Dow
nloa
ded
by [
Vic
tori
a U
nive
rsity
] at
20:
06 1
4 A
ugus
t 201
4

14 / Kalinski, Norkowski, Kerner, and Tkaczuk
18. Norkowski H. 2000. Assessment of the anaerobic capacity of the players in handball inthe field settings. Trening 45:137-48 (Warsaw, Poland).
19. Puhl J, Case S, Fleck S, van Handel P. 1882. Physical and physiological characteristics ofelite volleyball players. Res Q Exerc Sport 53:257-62.
20. Smith DJ, Roberts D, Watson B. 1992. Physical, physiological and performance differ-ences between Canadian national team and universiade volleyball players. J Sports Sci10:131-38.
21. Tanaka H, Bassett DR, Swenson TC, Sampedro RM. 1993. Aerobic and anaerobicpower characteristics of competitive cyclists in the United States Cycling Federation. IntJ Sports Med 14:334-38.
22. Viitasalo JT. 1982. Anthropometric and physical performance characteristics of malevolleyball players. Can J Appl Sport Sci 7:182-88.
23. Viitasalo JT, Rusko M, Pagula O, Rahkila P, Ahila M, Montonen H. 1987. Endurancerequirements in volleyball. Can J Appl Sport Sci 12:194-201.
24. Zelenzow AM, Lobanovsky VV, Kondratev AI, Tkachuk VH. 1989. Tactic and strategyin soccer. Kiev: Health.
About the Author
Michael I. Kalinski, PhD, FACSM, is with the Exercise Sciences Laboratories in theSchool of Exercise, Leisure, and Sport at Kent State University (Ohio). He is a member of theECSS and an editorial board member of Medicina Sportiva (Poland) and Medical Chemistry(Ukraine). His main research area of interest is physiological and biochemical adaptation toexercise.
Henrick Norkowski, PhD, is with the Department of Sport Games in the Academy ofPhysical Education in Poland. His research interests include assessment of physical andphysiological characteristics of elite athletes of the national team sports of Poland, andconditioning of elite athletes in handball.
Matthew S. Kerner, PhD, FACSM, is with the Division of Sports Sciences in theSchool of Health Professional at Long Island University (New York). His research interestsinclude the psychosocial and behavioral aspects of physical activity and obesity, and thequantification of human performance.
Wlodzimierz G. Tkaczuk, PhD, is with the Department of Physiology and Biochemis-try in the Academy of Physical Education in Poland. He is a member of the Baltic PedagogicalAcademy and the Ukrainian Academy of Informatics. His main research area of interest isphysical and physiological characteristics of elite athletes.D
ownl
oade
d by
[V
icto
ria
Uni
vers
ity]
at 2
0:06
14
Aug
ust 2
014


![Installation Wingate[1]](https://img.pdfslide.us/doc/110x75/577d34821a28ab3a6b8e308b/installation-wingate1.jpg)