Embed Size (px)
Citation preview
2015 State of the Market
15 August 2016
SPP Market Monitoring Unit
2015 State of the Market | ii
Disclaimer
The data and analysis in this report are provided for informational purposes only and shall not be
considered or relied upon as market advice or market settlement data. All analysis and opinions
contained in this report are solely those of the SPP Market Monitoring Unit (MMU), the
independent market monitor for Southwest Power Pool, Inc. (SPP). The MMU and SPP make no
representations or warranties of any kind, express or implied, with respect to the accuracy or
adequacy of the information contained herein. The MMU and SPP shall have no liability to
recipients of this information or third parties for the consequences that may arise from errors or
discrepancies in this information, for recipients’ or third parties’ reliance upon such information,
or for any claim, loss, or damage of any kind or nature whatsoever arising out of or in connection
with:
(i) the deficiency or inadequacy of this information for any purpose, whether or not
known or disclosed to the authors
(ii) any error or discrepancy in this information
(iii) the use of this information
(iv) any loss of business or other consequential loss or damage whether or not resulting
from any of the foregoing
2015 State of the Market | iii
Table of Contents
1. Executive Summary ................................................................................................................ 1
1.1. Overview .......................................................................................................................... 1
1.2. Energy and Operating Reserve Markets .......................................................................... 3
1.3. Day-Ahead Market........................................................................................................... 4
1.4. Congestion and Losses ..................................................................................................... 5
1.5. Competitive Assessment .................................................................................................. 6
1.6. Recommendations ............................................................................................................ 9
2. Overview of the SPP Market ............................................................................................... 10
2.1. Market Description ........................................................................................................ 10
2.2. Market Prices ................................................................................................................. 15
2.3. Capacity in SPP.............................................................................................................. 18
2.4. Electricity Demand in the SPP Market .......................................................................... 22
2.5. Electricity Supply in the SPP Market ............................................................................ 29
2.6. Growing Impact of Wind Generation Capacity on the SPP System .............................. 38
3. Real-Time Balancing Market............................................................................................... 47
3.1. Unit Commitment: Day-Ahead and Real-Time Processes ............................................ 48
3.2. Energy ............................................................................................................................ 61
3.3. Real-Time and Day-Ahead Price Comparisons ............................................................. 63
3.4. Ancillary Services .......................................................................................................... 65
3.5. Shortage Pricing ............................................................................................................. 71
3.6. Make-Whole Payments .................................................................................................. 76
4. Day-Ahead Market ............................................................................................................... 85
4.1. Generation ...................................................................................................................... 85
4.2. Load ............................................................................................................................... 86
4.3. Virtual Trading............................................................................................................... 87
4.4. Must-Offer Provision ..................................................................................................... 91
5. Congestion and Losses .......................................................................................................... 96
5.1. Geographic Pricing Patterns .......................................................................................... 96
5.2. Congestion by Geographic Location ............................................................................. 98
2015 State of the Market | iv
5.3. Transmission Constraints ............................................................................................. 101
5.4. Market Congestion Management ................................................................................. 106
5.5. Frequently Constrained Areas and Local Market Power ............................................. 108
5.6. Geography and Marginal Losses ................................................................................. 109
5.7. Congestion Hedging and Revenue Distribution .......................................................... 111
5.8. Market Congestion Costs ............................................................................................. 112
5.9. Hedging Congestion with TCRs and ARRs................................................................. 114
5.10. Market-to-Market Coordination................................................................................... 130
6. Competitive Assessment ..................................................................................................... 135
6.1. Structural Aspects of the SPP Market .......................................................................... 136
6.2. Behavioral Aspects of the SPP Market ........................................................................ 141
6.3. Summary Assessment .................................................................................................. 146
7. Recommendations ............................................................................................................... 148
7.1. Quick-Start Logic......................................................................................................... 148
7.2. Ramp-Constrained Shortage Pricing............................................................................ 150
7.3. Manipulation of Make-Whole Payment Provisions ..................................................... 150
7.4. Day-Ahead Must-Offer Requirement .......................................................................... 151
7.5. TCR and ARR System Availability in Annual Process ............................................... 152
7.6. TCR and ARR System Availability in Monthly Process ............................................. 152
7.7. TCR Bidding at Electrically Equivalent Settlement Locations ................................... 153
7.8. Allocation of Over-Collected Losses ........................................................................... 153
7.9. Market Power Mitigation Conduct Thresholds............................................................ 154
7.10. NDVER Transition to DVER Status ........................................................................... 154
Appendix A. Common Acronyms .......................................................................................... 155
2015 State of the Market | v
List of Figures
Figure 2–1 ISO RTO Operating Regions...................................................................................... 11
Figure 2–2 Integrated System Addition to the SPP Market .......................................................... 12
Figure 2–3 Distribution of Number of Market Participants with Resources by Type .................. 13
Figure 2–4 Capacity (MW) by Market Participant Type .............................................................. 14
Figure 2–5 SPP All-In Price of Electricity ................................................................................... 15
Figure 2–6 ISO/RTO Comparison of Average Hub On-Peak Day-Ahead LMP.......................... 16
Figure 2–7 Assumptions for Net Revenue Analysis ..................................................................... 17
Figure 2–8 Net Revenue Results................................................................................................... 17
Figure 2–9 Net Revenue Analysis by Zone and by Technology .................................................. 18
Figure 2–10 SPP Market Generation Capacity by Technology .................................................... 19
Figure 2–11 Reserve Margin by Year for 2008–2015 .................................................................. 19
Figure 2–12 New Capacity in 2015 .............................................................................................. 20
Figure 2–13 Capacity Retirements in 2015 .................................................................................. 21
Figure 2–14 Capacity by Age of Resource ................................................................................... 22
Figure 2–15 Monthly Peak Electric Energy Demand, 2011–2015 ............................................... 23
Figure 2–16 Market Participant Energy Usage, 2014–2015 ......................................................... 24
Figure 2–17 Monthly and Annual System Energy Consumption, 2011–2015 ............................. 25
Figure 2–18 Electrical Energy Load Duration Curve, 2013–2015 ............................................... 26
Figure 2–19 Monthly Heating Degree Days and Cooling Degree Days, 2012–2015 .................. 28
Figure 2–20 Yearly Degree Days and Loads Compared with a Normal Year, 2013–2015 ......... 29
Figure 2–21 Percent Generation by Technology Type – Real-Time Market, 2007–2015 ........... 30
Figure 2–22 Generation by Technology Type – Real-Time Market by Month, 2015 .................. 31
Figure 2–23 Coal-Fired Generation, 2013–2015 .......................................................................... 32
Figure 2–24 Implied Heat Rate ..................................................................................................... 33
Figure 2–25 Real-Time Generation on the Margin by Technology Type, 2007–2015 ................ 34
Figure 2–26 Real-Time Market Generation on the Margin, 2015 – Monthly .............................. 35
Figure 2–27 Day-Ahead Market Generation on the Margin, Monthly (2015) and Annual (2014–2015) ............................................................................................................................................. 36
Figure 2–28 Active Generation Interconnection Requests by Fuel Type ..................................... 37
Figure 2–29 United States Wind Speed Map ................................................................................ 39
2015 State of the Market | vi
Figure 2–30 Wind Capacity and Generation, 2007–2015 ............................................................ 40
Figure 2–31 Wind Generation as a Percent of Load, 2007–2015 ................................................. 41
Figure 2–32 Wind Production Duration Curve by Interval – Wind as a Percent of Load, 2012–2015............................................................................................................................................... 42
Figure 2–33 Wind Generation by Month, 2014–2015 .................................................................. 44
Figure 2–34 Number of Manual Dispatches, 2012–2015 ............................................................. 45
Figure 3–1 Online Capacity as Percent of Demand ...................................................................... 48
Figure 3–2 Commitment Process Timeline .................................................................................. 49
Figure 3–3 SPP Start-Up Instructions by Resource Count, 2015 ................................................. 50
Figure 3–4 SPP Start-Up Instructions by Resource Capacity ....................................................... 51
Figure 3–5 Origin of Start-Up Instruction for Gas-Fired Resources ............................................ 52
Figure 3–6 Average Hourly Day-Ahead Market/RUC Resource Gaps ........................................ 53
Figure 3–7 Average Hourly Capacity Increases ........................................................................... 55
Figure 3–8 Commitments of Quick-Start Resources .................................................................... 57
Figure 3–9 Efficient Operation of Quick-Start Resources ............................................................ 60
Figure 3–10 Real-Time Energy Price vs. Natural Gas Price, 2007–2015 .................................... 61
Figure 3–11 Real-Time Energy Price by Month vs. Natural Gas Price, 2014–2015.................... 62
Figure 3–12 System Marginal Price Day-Ahead and Real-Time ................................................. 63
Figure 3–13 SPP Market Hub Prices, 2015 .................................................................................. 64
Figure 3–14 North Hub Price Density Curves .............................................................................. 64
Figure 3–15 South Hub Price Density Curves .............................................................................. 65
Figure 3–16 Real-Time Operating Reserve Product Prices, 2015 ................................................ 66
Figure 3–17 Real-Time Regulation Mileage Prices, 2015............................................................ 67
Figure 3–18 Regulation-Up Service Prices................................................................................... 68
Figure 3–19 Regulation-Down Service Prices .............................................................................. 68
Figure 3–20 Spinning Reserve Prices ........................................................................................... 68
Figure 3–21 Supplemental Reserve Prices ................................................................................... 69
Figure 3–22 Energy Settlements – Load ....................................................................................... 69
Figure 3–23 Energy Settlements – Generation ............................................................................. 70
Figure 3–24 Operating Reserve Products Settlements.................................................................. 70
Figure 3–25 Capacity Shortages ................................................................................................... 72
Figure 3–26 Capacity Shortage Statistics ..................................................................................... 73
Figure 3–27 Capacity Shortages – Hour of Day for 2015 ............................................................ 73
2015 State of the Market | vii
Figure 3–28 Ramp-Constrained Shortages ................................................................................... 75
Figure 3–29 Ramp-Constrained Shortage Statistics ..................................................................... 75
Figure 3–30 Revenue and Cost Conceptual Graph ....................................................................... 77
Figure 3–31 Make-Whole Payment Totals by Fuel Type, 2015 ................................................... 78
Figure 3–32 Concentration of Make-Whole Payments by Resource............................................ 79
Figure 3–33 SPP Market Participants Receiving Make-Whole Payments ................................... 80
Figure 3–34 SPP Real-Time Make-Whole Payments by Market Uplift Allocations ................... 81
Figure 3–35 SPP Real-Time Mileage Make-Whole Payments ..................................................... 82
Figure 4–1 Day-Ahead Market Commitment by Status, 2015 ..................................................... 86
Figure 4–2 Cleared Demand Bids in Day-Ahead Market ............................................................. 87
Figure 4–3 Virtual Transactions as Percentage of SPP Market Load, 2014–2015 ....................... 88
Figure 4–4 Virtual Offers and Bids in Day-Ahead Market, 2015 ................................................ 89
Figure 4–5 Virtual Profit/Loss, 2015 ............................................................................................ 90
Figure 4–6 Penalties for Non-Compliance with Day-Ahead Must-Offer Provisions, 2015 ......... 91
Figure 4–7 Offered Capacity and Reported Load during Non-Compliant Hours ........................ 92
Figure 4–8 Day-Ahead Participation ............................................................................................ 93
Figure 5–1 Average LMP for Day-Ahead Market, 2015 .............................................................. 97
Figure 5–2 Average LMP for Real-Time Balancing Market, 2015 .............................................. 98
Figure 5–3 Average MCC for Day-Ahead Market, 2015 ........................................................... 100
Figure 5–4 SPP Transmission Expansion Plan, May 2016 Map ................................................ 101
Figure 5–5 SPP Congestion by Shadow Price, 2015 .................................................................. 102
Figure 5–6 Congestion by Shadow Price with Projects .............................................................. 105
Figure 5–7 Congestion – Breached and Binding Intervals for Day-Ahead Market, 2014–2015 106
Figure 5–8 Breached and Binding Intervals for Real-Time Balancing Market, 2015 ................ 107
Figure 5–9 Breached and Binding Intervals for RTBM Annual Comparison, 2007–2015 ........ 108
Figure 5–10 Annual MLC Map – Day-Ahead Market, 2015 ..................................................... 110
Figure 5–11 Total Congestion Payments for Load-Serving Entities and Non-Load Entities ..... 112
Figure 5–12 DA Market and RTBM Net Annual Congestion Payment by LSE ........................ 113
Figure 5–13 Monthly TCR Funding Levels, 2015...................................................................... 117
Figure 5–14 Monthly ARR Funding Levels, 2015 ..................................................................... 118
Figure 5–15 Daily Funding Percent, 2015 .................................................................................. 118
Figure 5–16 TCR Bids by Value ................................................................................................ 120
Figure 5–17 Transmission Outages by Reporting Lead Time .................................................... 123
2015 State of the Market | viii
Figure 5–18 Transmission Outages by Duration ........................................................................ 124
Figure 5–19 Self-Convert Modeled Prices, 2015 ....................................................................... 125
Figure 5–20 Total Congestion Payments for Load-Serving Entities and Non-Load Entities ..... 127
Figure 5–21 Over-Collected Losses Totals for January–March 2015 ........................................ 128
Figure 5–22 Over-Collected Losses Totals April – December, 2015 ......................................... 129
Figure 5–23 Market-to-Market Settlements, 2015 ...................................................................... 131
Figure 5–24 Net Settlements by Flowgate .................................................................................. 132
Figure 6–1 Market Share of Largest Supplier by Hour .............................................................. 136
Figure 6–2 Count of RTBM Hours by Market Concentration Level, 2015 ............................... 137
Figure 6–3 Hourly HHI, 2015 ..................................................................................................... 138
Figure 6–4 Hourly HHI Statistics by Supply Curve Segment, 2015 .......................................... 138
Figure 6–5 Market Participants on the RTBM Margin, 2015 ..................................................... 139
Figure 6–6 Percent of Hours at Least One Supplier Being Pivotal by Demand Level ............... 140
Figure 6–7 Monthly Average Offer Price Markups, 2015 .......................................................... 141
Figure 6–8 Mitigation Frequency, Day-Ahead Market .............................................................. 143
Figure 6–9 Mitigation Frequency, Day-Ahead Market Start-Up Offers .................................... 144
Figure 6–10 Output Gap by Load Level and Conduct Threshold .............................................. 146
1. Executive Summary
2015 State of the Market | 1
1. Executive Summary
The Southwest Power Pool (SPP) Market Monitoring Unit’s Annual State of the Market report
for the second year of the SPP Integrated Marketplace presents an overview of the market design
and market outcomes, assesses market performance, and provides recommendations for
improvement. The report fulfills the MMU’s requirement under Attachment AG of the SPP Open
Access Transmission Tariff to review and report on market performance with particular regard to
market efficiency, competitiveness of market outcomes, and prevention of the exercise of market
power and market manipulation. Along with this goal, the MMU emphasizes that economics and
reliability are inseparable and that an efficient wholesale electricity market provides the greatest
benefit to the end user both presently and in the years to come.
1.1. Overview
The second year of the Integrated Marketplace shows significant maturing of the market, which
is reflected in high levels of participation, lower levels of make-whole payments and mitigation
compared to other markets, and a modest level of scarcity pricing. Major factors impacting the
market include low and declining natural gas prices, increasing wind generation capacity and
output, declining levels of overall congestion with increased congestion in the wind-sourced
generation areas, and an expanding market footprint.
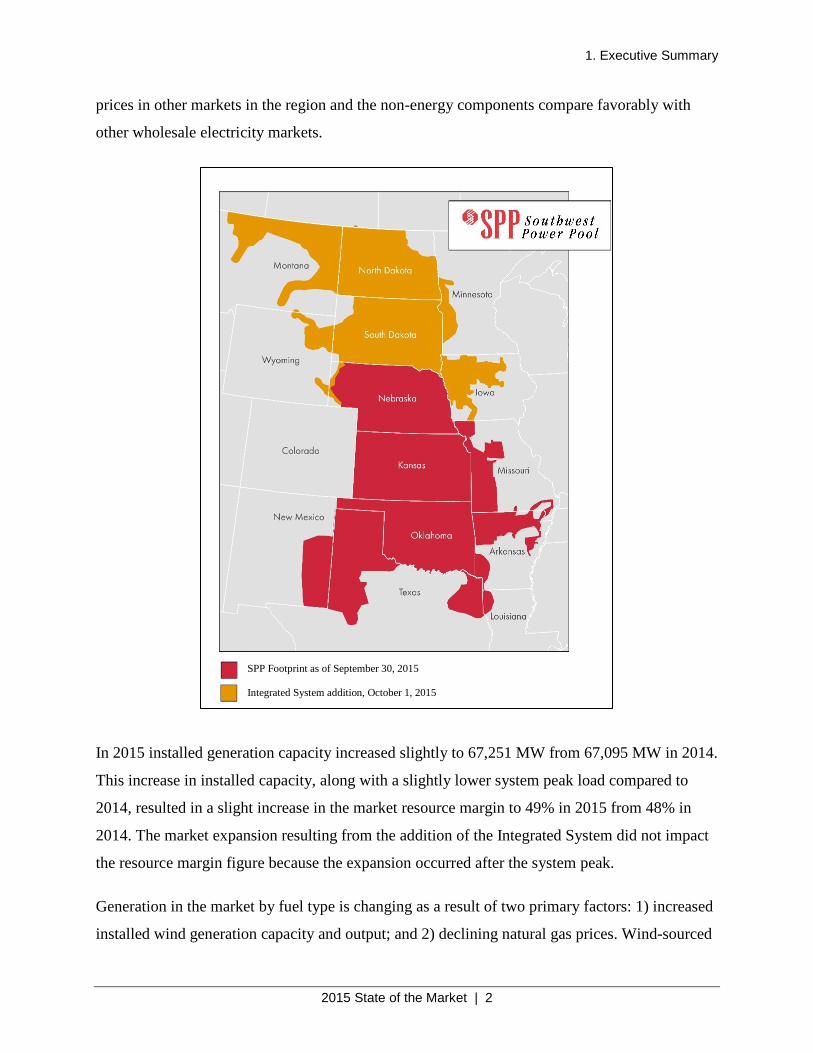
The SPP Market footprint experienced an increase of about 10% in both generation and load in
2015 with the addition of the Integrated System (IS). The SPP Market now covers most of North
and South Dakota and parts of several adjacent states. This expansion occurred on October 1,
2015.
Average monthly natural gas prices were generally flat at about $2.50/MMBtu through
September and then declining to below $2.00/MMBtu in December. Monthly average electricity
prices (LMP) in the Integrated Marketplace for 2015 were generally flat with some variation in
the $20 to $25/MWh range with the annual average all-in price of $23.48/MWh. The cost of
operating reserves represented about 1% of the total all-in price, with Make-Whole Payments
representing only about 1.3% of the total price of electricity. The total price is comparable to
1. Executive Summary
2015 State of the Market | 2
prices in other markets in the region and the non-energy components compare favorably with
other wholesale electricity markets.
In 2015 installed generation capacity increased slightly to 67,251 MW from 67,095 MW in 2014.
This increase in installed capacity, along with a slightly lower system peak load compared to
2014, resulted in a slight increase in the market resource margin to 49% in 2015 from 48% in
2014. The market expansion resulting from the addition of the Integrated System did not impact
the resource margin figure because the expansion occurred after the system peak.
Generation in the market by fuel type is changing as a result of two primary factors: 1) increased
installed wind generation capacity and output; and 2) declining natural gas prices. Wind-sourced
SPP Footprint as of September 30, 2015
Integrated System addition, October 1, 2015
1. Executive Summary
2015 State of the Market | 3
generation continues to increase and represented almost 20% of total SPP generation in
November and December. On the other hand, coal generation has declined from a historical
average of 60–65% to an annual average of 55% in 2015, with November coal generation
representing only 45% of SPP total generation for the month.
In 2015 year-end installed wind generation capacity in the SPP Market increased by 44%, from
8,606 MW of registered capacity in 2014 to 12,398 MW in 2015. Because actual generation
resulting from new capacity does not show up in the market for several months after registration,
the full impact of this nearly 4,000 MW of new wind capacity in 2015 will not be felt until 2016.
Initial results from 2016 indicate that at times generation is approaching 50% of total load. This
is a substantial increase from 34% in 2015 and 33% in 2014.
Given the large resource margin and the frequency with which the LMP represents inexpensive
generation, prices generally did not rise to levels high enough to support investment in new
generating capacity.
1.2. Energy and Operating Reserve Markets
The Integrated Marketplace introduced a centralized unit commitment and dispatch process, a
Day-Ahead Market, and a Real-Time Balancing Market with both energy and Operating Reserve
products. The centralized unit commitment and dispatch constituted the largest and most
immediate financial benefit to the SPP Market, as it allowed SPP to reduce online generating
capacity by 10% in 2014 and a somewhat lower amount in 2015. Changing generation patterns in
2015 driven by extremely low natural gas prices, high wind generation, and decreased use of
coal generation all have increased uncertainty and appear to be affecting the capacity
commitment process. This is reflected in high online capacity as a percent of demand in
December comparable to what was generally experienced during the last year of the EIS Market.
The MMU considers this a temporary state as the market adjusts to new conditions and gas
prices increase to more normal historical levels.
In addition to committing capacity to meet the load and operating reserve obligations, SPP also
committed resources for reliability needs through its Reliability Unit Commitment (RUC)
processes. The demand for reliability met through the Day-Ahead and Real-Time RUC processes
1. Executive Summary
2015 State of the Market | 4
supplemented the load and operating reserve obligations with market ramping and local
reliability constraints, services for which the market provided no additional payment. The
commitment of additional capacity to meet these constraints dampened real-time prices,
increased RUC Make-Whole Payments, and implied that faster-starting resources may not have
received market revenues sufficient to cover annual avoidable costs. Through the stakeholder
process and in particular the Price Formation Task Force, SPP is assessing this issue and looking
into alternatives. The MMU continues to support these activities and will provide suggestions
and recommendations as appropriate.
In 2015 scarcity pricing levels for aggregate Operating Reserves at about $1,100/MWh, for
Regulating Reserves at about $700/MWh, and for Spinning Reserves at about $300/MWh are
comparable to 2014 levels and consistent with what other markets experience. These high prices
allowed the market to reflect the demand for reliability.
However, average prices below $100/MWh in 2015 for ramp-constrained shortages are similar to
what was experienced in 2014. The MMU continues to have a concern for these low prices such
that they do not reflect the value of demand for ramp capability provided by fast-responding
resources, creating a market separation between economics and reliability.
The Integrated Marketplace provides relatively simple provisions for market uplift, or Make-
Whole Payments, when compared to other RTO markets. Coupled with five-minute RTBM
settlements, these provide incentives for resources to meet their commitment and dispatch
instructions by ensuring that the market covers the short run marginal costs of production. The
level of make-whole payments in 2015 continued to constitute about 1% of the all-in price of
electricity, with 70% of make-whole payments related to RUC commitments, slightly less than
what was experienced in 2014. The level of make-whole payments in the SPP Market continue to
be about half of what is experienced in other markets.
1.3. Day-Ahead Market
The Day-Ahead Market produced economically sound LMPs and resource commitments
consistently and transparently. Load participation in the Day-Ahead Market by participants
declined from a high of 109% in some 2014 months to less than 101% in all month for 2015. The
1. Executive Summary
2015 State of the Market | 5
market design flaw in the allocation of Over-Collected Losses (OCL), which SPP corrected,
appears to have addressed the incentives that drove the OCC-related improper behavior in 2014.
Virtual transactions as a percentage of load increased slightly in 2015 to about 7.5% of load,
although the participation rate is lower than the level experienced in other RTO markets, which
approaches 10%. Virtual trading profits declined in 2015 to about $21 million from about $24
million in 2014. This lower level of profits is consistent with lower energy prices and a maturing
of the market resulting from more competition. Generators also participated fully in the Day-
Ahead Market, whether or not they held a day-ahead must-offer obligation, with the exception of
the wind farms. Overall, the first two years of the market experienced moderate levels of virtual
participation, consistent profitability of virtual trading, and increasing convergence of DA
Market and RTBM LMPs. All these factors indicate a reasonably efficient virtual market.
1.4. Congestion and Losses
Locational Marginal Prices reflect the marginal cost of energy, marginal cost of congestion, and
marginal cost of losses at any given pricing location in the market. With its historic transmission
bottlenecks and ever-expanding network, the SPP Market’s geographic pricing pattern continued
to evolve in 2015. The challenge of moving inexpensive power generated by coal and wind
resources from the northern and western parts of the footprint to the eastern load centers resulted
in an average $22/MWh spread between the lowest and highest LMP points. This is slightly
higher than what was experienced in 2014 and likely the result of an increase in wind generation
penetration.
The market charged Load-Serving Entities a total of $150 million in congestion costs for 2015.
This total is consistent with but lower than the 2014 total of $290 million given the lower overall
average system price in 2015, 25% lower than what was experienced in 2014. This also reflects
the full impact of the significant expansion in transmission capacity activated in 2014. Load-
Serving Entities may hedge the congestion cost with Transmission Congestion Rights (TCRs)
and Auction Revenue Rights (ARRs). This market provided them with $170 million in payments
in 2015. Therefore, in aggregate the load was hedged. However, the TCR and ARR payments for
a few Load-Serving Entities fell well short of their congestion costs. In total, non-load
1. Executive Summary
2015 State of the Market | 6
participants profited by $15 million from SPP congestion and by $26 million from TCRs.
Despite the overall gains from TCRs and ARRs, the TCR market performance could be
enhanced by improvements to market efficiency and transparency. The 86% funding of TCRs
from Day-Ahead Market congestion was low, and the 118% funding of ARR positions by TCR
auction revenues was high. Reductions in transmission capacity made available in the TCR and
ARR process to more realistic levels, earlier reporting of planned transmission outages, and
improvements to modeling of the conversion of ARRs to TCRs would enhance price formation
and thus the ability to effectively and economically hedge load for congestion costs.
1.5. Competitive Assessment
The SPP Integrated Marketplace provides sufficient market incentives and mitigation measures
to produce competitive market outcomes in regions and periods when there are no concerns with
regard to local market power. The MMU’s competitive assessment provides evidence that
market results in 2015 were workably competitive and that the market required mitigation of
local market power infrequently to achieve those outcomes. Nonetheless, mitigation remains an
essential tool in ensuring market results are competitive during periods of high demand and
supply shortages when such market conditions offer suppliers the potential to abuse significant
local market power.
Three metrics—Market Share Analysis, Herfindahl-Hirschman Index (HHI), and Pivotal
Supplier Analysis (PSA)—were used to evaluate structural market power in the SPP footprint.
The Market Share Analysis assessed the market share of the largest supplier in terms of energy
output in the real-time market by hour for the entire year along with a ranked maximum market
share duration curve. The market share rank ranged from 10% to 21%, exceeding the 20%
benchmark in only six hours for the year.
The overall concentration in the SPP Market was evaluated by employing the HHI in terms of
installed capacity, and the results show that the SPP Market was unconcentrated more than 70%
of the hours in 2015 and moderately concentrated only about 29% of the time. HHI never rose
above the 1,800 threshold determined for a high level of concentration.
1. Executive Summary
2015 State of the Market | 7
The third structural metric, the PSA, was used to evaluate the potential of market power in the
presence of “pivotal” suppliers. In this report the PSA identified the frequency with which at
least one supplier was pivotal at varying load levels in five different reserve zones (regions) of
the SPP footprint in 2015. The results indicate that the percent of hours with pivotal supplier is
the highest (around 100%) in the New Mexico and Texas region irrespective of demand level.
This region is followed by Iowa and the Dakotas where—depending on the level of load—13%
to 36% of the hours exhibit at least one pivotal supplier. The remaining regions of Nebraska,
Oklahoma and Kansas City, and Western Kansas and Panhandles indicate that suppliers became
pivotal for only negligible periods.
In sum, the MMU’s Market Share, HHI, and Pivotal Supplier Analyses all indicate minimal
potential structural market power in SPP Markets outside of areas that are frequently congested.
For the FCAs—only one such area was so designated in 2015—where potential for concerns of
local market power is the highest, existing mitigation measures with relatively tight thresholds
provided effective levels of local market power mitigation in terms of preventing pivotal
suppliers unilaterally raising prices.
The structural indicators discussed above were used to look for the potential for market power
without regard to the actual exercise of market power. Behavioral indicators, on the other hand,
were assessed through the analysis of actual offer or bid behavior (i.e., conduct) of the Market
Participants and the impact of such behavior on market prices to look for the exercise of market
power.
In that context, the frequency of mitigation in 2015 was dramatically lower than that experienced
in 2014. The mitigation for incremental energy, regulation, and no-load in 2015 was generally
below the 0.1% level in many months, while the mitigation level for these market components
was virtually zero in some months. This is in stark contrast to the mitigation levels in 2014 when
some of these market components experienced mitigation levels approaching 1%. The decline in
the frequency of start-up offer mitigation in the Day-Ahead market in 2015 is similar to that
experienced for the other market components, declining from 15–20% levels in 2014 to about the
1% level in 2015. This overall decline of more than 90% in the level of mitigation is attributed to
normal market maturing and the addressing of some specific market implementation problems.

1. Executive Summary
2015 State of the Market | 8
The overall mitigation frequency levels experienced in 2015 are consistent with the levels
experienced in other markets.
Finally, output gap as a measure for Economic Withholding was also calculated and the results
show that the overall (average) level of output gap varies between 0.48% and 1.26%, the latter
showing the amount of (economic) capacity withheld at the highest load percentile level. This
low level of withholding is consistent with competitive market conduct.
1. Executive Summary
2015 State of the Market | 9
1.6. Recommendations
One of the primary responsibilities of a Market Monitoring Unit is to evaluate market rules and
market design features for market efficiency and effectiveness. The MMU does this through
multiple forums. One such forum is the Annual State of the Market report. Other forums the
MMU uses to fulfill this responsibility include preparation and submittal of Revision Request
(RR) forms used in the RTO stakeholder process, commenting on RRs submitted by the SPP and
stakeholders, presenting comments and recommendations directly to the SPP Board of Directors
and FERC regarding proposed Tariff changes, and filing comments on FERC NOPRs.
In the 2014 Annual State of the Market report, the MMU made a number of recommendations
that are currently in various stages of being addressed. The MMU considers several of these
recommendations as being resolved by SPP, including Quick-Start logic, jointly owned units
Combined Resource Option, over-allocation of annual TCR and ARR system availability, and
systematic blocking of bids at electrically equivalent settlement locations. The MMU has
withdrawn the recommendation to change mitigation conduct thresholds. The recommendations
that remain open at the time this report is published include ramp-constrained shortage pricing,
several concerns regarding the potential manipulation of Make-Whole Payment provisions, Day-
Ahead Must-Offer requirements and physical withholding penalty rules, TCR and ARR system
availability in the monthly allocation process, and allocation of over-collected losses. The MMU
is currently recommending transition of Non-Dispatchable Variable Energy Resources
NDVERs) to Dispatchable Variable Energy Resources (DVER) status, thereby lessening the
negative impact of such resources on the market as discussed in this report.
The MMU appreciates the constructive effort of the Market Working Group and SPP staff to
identify and implement solutions that address these recommendations. Detailed discussion of
each recommendation is contained in the body of this report below.
2. Overview of the SPP Market
2015 State of the Market | 10
2. Overview of the SPP Market
2.1. Market Description
Southwest Power Pool (SPP) is a Regional Transmission Organization (RTO) authorized by the
Federal Energy Regulatory Commission (FERC) with a mandate to ensure reliable power
supplies, adequate transmission infrastructure, and competitive wholesale electricity prices.
FERC granted RTO status to SPP in 2004. SPP is one of nine Independent System Operators
(ISOs)/RTOs and one of eight NERC Regional Entities in North America. SPP provides many
services to its members including reliability coordination, tariff administration, regional
scheduling, reserve sharing, transmission expansion planning, wholesale electricity market
operations, and training. This report focuses on the 2015 calendar year of the SPP wholesale
electricity market referred to as the Integrated Marketplace, which started on March 1, 2014.
The Integrated Marketplace is a full Day-Ahead Market with Transmission Congestion Rights,
virtual trading, a Reliability Unit Commitment (RUC) process, a Real-Time Balancing Market
(RTBM), and a price-based Operating Reserves market. SPP simultaneously put into operation a
single Balancing Authority as part of the implementation of the Integrated Marketplace. The
primary benefit of converting to a day-ahead market is to improve the efficiency of daily
resource commitments. Another benefit of the new market includes the joint optimization of the
available capacity for energy and operating reserves.
2.1.1. SPP Market Footprint
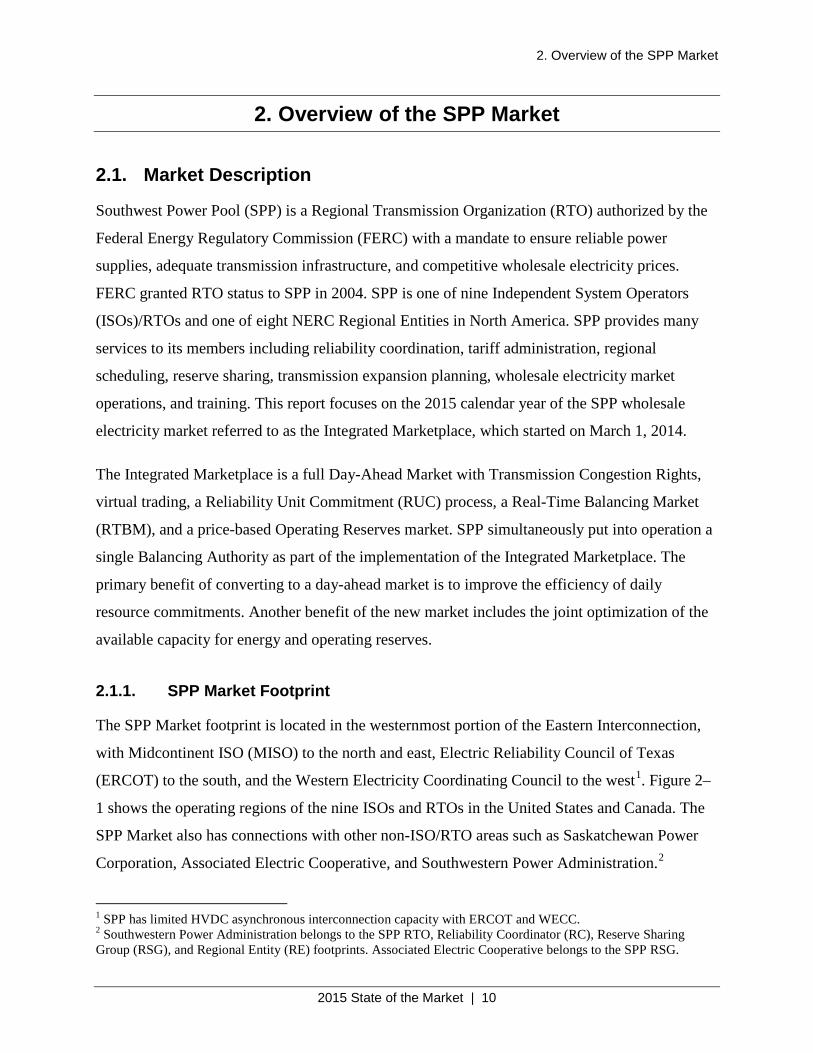
The SPP Market footprint is located in the westernmost portion of the Eastern Interconnection,
with Midcontinent ISO (MISO) to the north and east, Electric Reliability Council of Texas
(ERCOT) to the south, and the Western Electricity Coordinating Council to the west1. Figure 2–
1 shows the operating regions of the nine ISOs and RTOs in the United States and Canada. The
SPP Market also has connections with other non-ISO/RTO areas such as Saskatchewan Power
Corporation, Associated Electric Cooperative, and Southwestern Power Administration.2
1 SPP has limited HVDC asynchronous interconnection capacity with ERCOT and WECC. 2 Southwestern Power Administration belongs to the SPP RTO, Reliability Coordinator (RC), Reserve Sharing Group (RSG), and Regional Entity (RE) footprints. Associated Electric Cooperative belongs to the SPP RSG.
2. Overview of the SPP Market
2015 State of the Market | 11
Figure 2–1 ISO RTO Operating Regions
Source: ISO/RTO Council
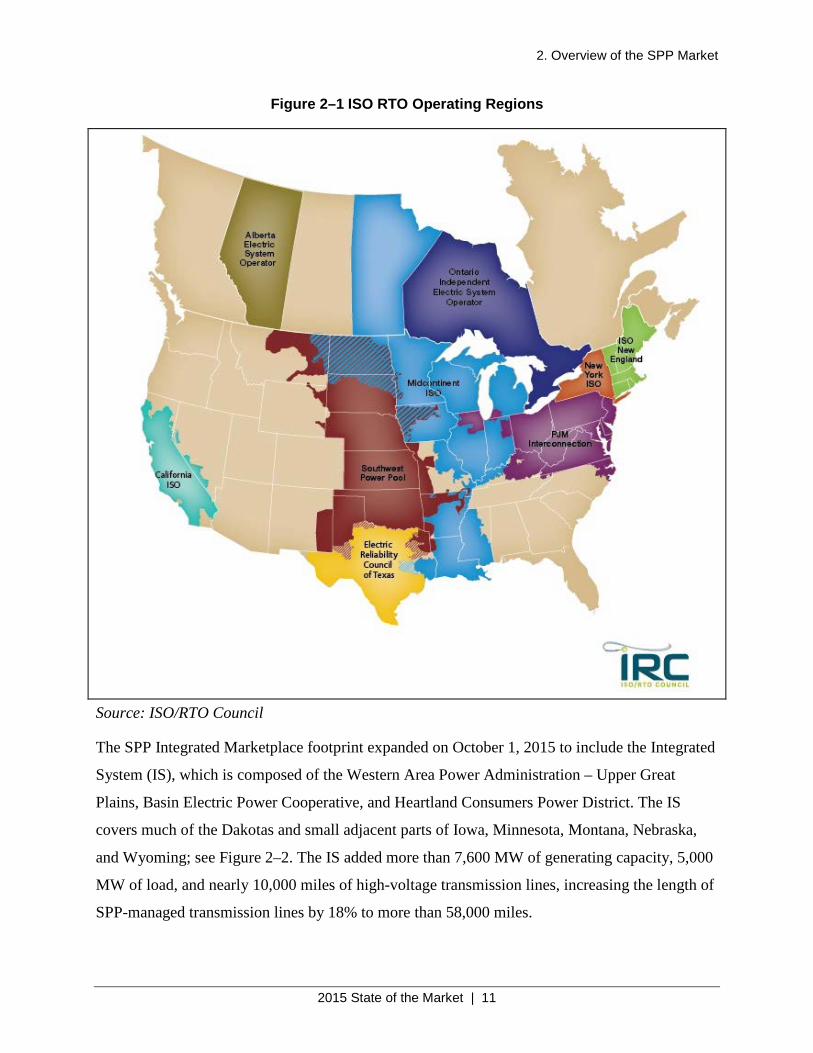
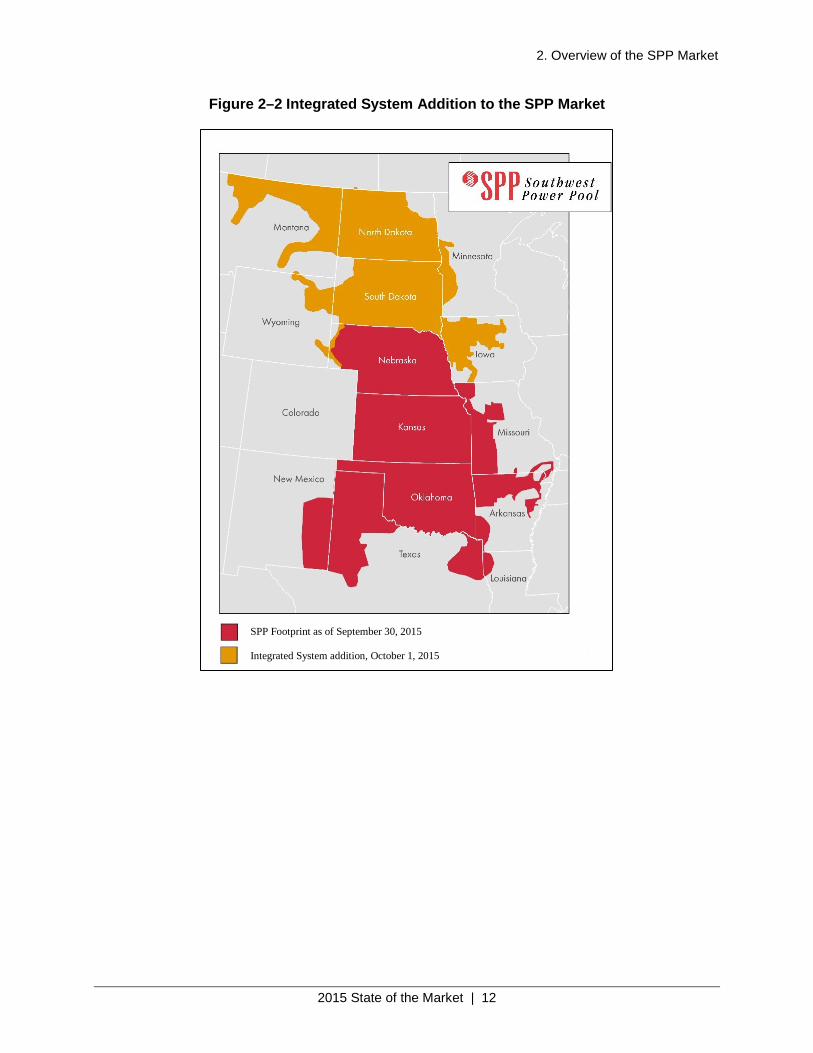
The SPP Integrated Marketplace footprint expanded on October 1, 2015 to include the Integrated
System (IS), which is composed of the Western Area Power Administration – Upper Great
Plains, Basin Electric Power Cooperative, and Heartland Consumers Power District. The IS
covers much of the Dakotas and small adjacent parts of Iowa, Minnesota, Montana, Nebraska,
and Wyoming; see Figure 2–2. The IS added more than 7,600 MW of generating capacity, 5,000
MW of load, and nearly 10,000 miles of high-voltage transmission lines, increasing the length of
SPP-managed transmission lines by 18% to more than 58,000 miles.
2. Overview of the SPP Market
2015 State of the Market | 12
Figure 2–2 Integrated System Addition to the SPP Market
SPP Footprint as of September 30, 2015
Integrated System addition, October 1, 2015
2. Overview of the SPP Market
2015 State of the Market | 13
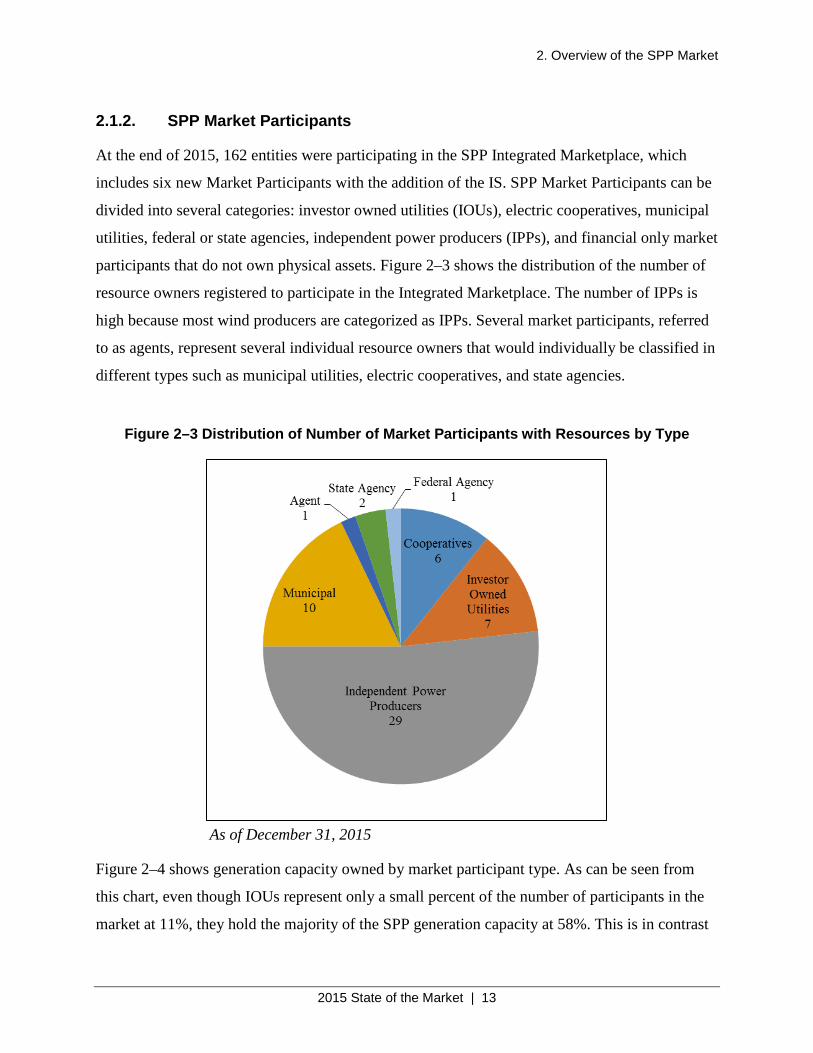
2.1.2. SPP Market Participants
At the end of 2015, 162 entities were participating in the SPP Integrated Marketplace, which
includes six new Market Participants with the addition of the IS. SPP Market Participants can be
divided into several categories: investor owned utilities (IOUs), electric cooperatives, municipal
utilities, federal or state agencies, independent power producers (IPPs), and financial only market
participants that do not own physical assets. Figure 2–3 shows the distribution of the number of
resource owners registered to participate in the Integrated Marketplace. The number of IPPs is
high because most wind producers are categorized as IPPs. Several market participants, referred
to as agents, represent several individual resource owners that would individually be classified in
different types such as municipal utilities, electric cooperatives, and state agencies.
Figure 2–3 Distribution of Number of Market Participants with Resources by Type
As of December 31, 2015
Figure 2–4 shows generation capacity owned by market participant type. As can be seen from
this chart, even though IOUs represent only a small percent of the number of participants in the
market at 11%, they hold the majority of the SPP generation capacity at 58%. This is in contrast
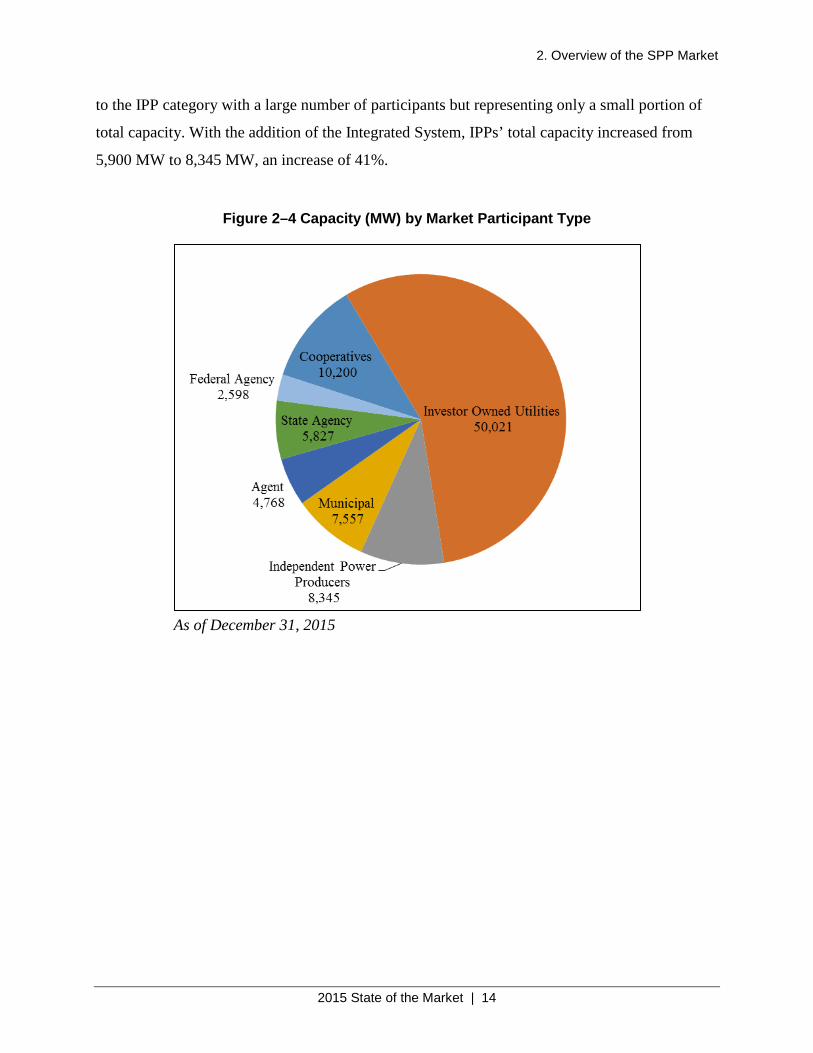
2. Overview of the SPP Market
2015 State of the Market | 14
to the IPP category with a large number of participants but representing only a small portion of
total capacity. With the addition of the Integrated System, IPPs’ total capacity increased from
5,900 MW to 8,345 MW, an increase of 41%.
Figure 2–4 Capacity (MW) by Market Participant Type
As of December 31, 2015
2. Overview of the SPP Market
2015 State of the Market | 15
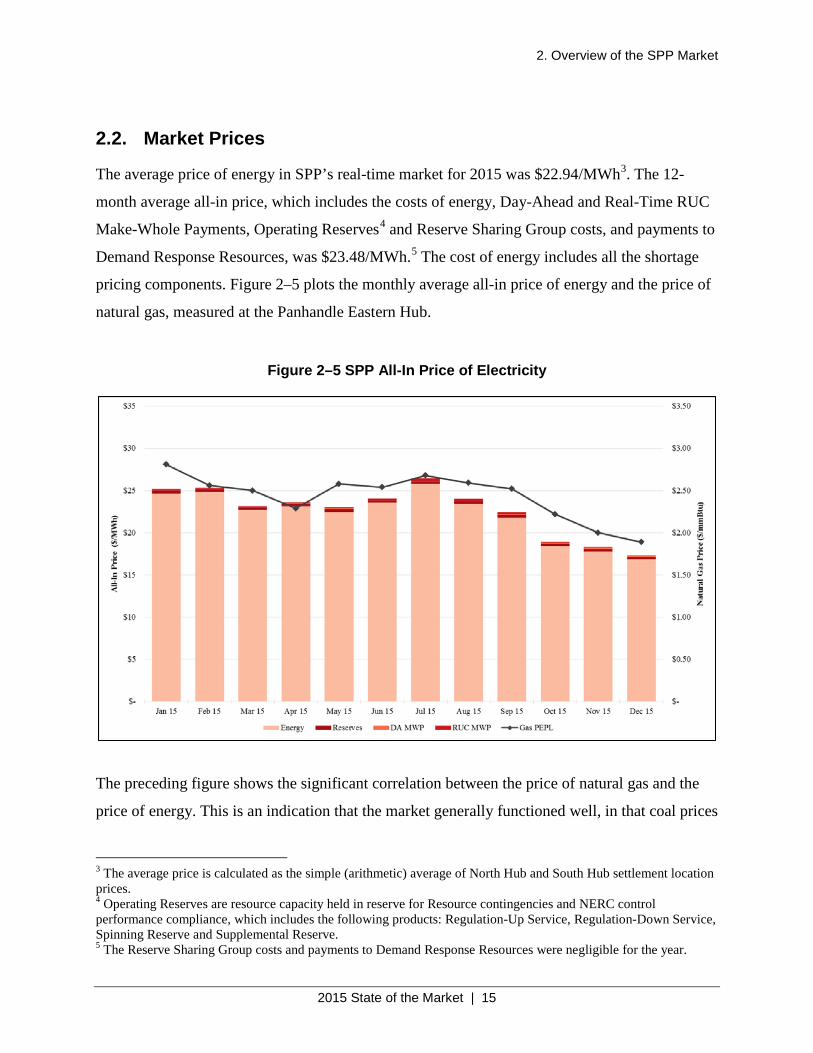
2.2. Market Prices
The average price of energy in SPP’s real-time market for 2015 was $22.94/MWh3. The 12-
month average all-in price, which includes the costs of energy, Day-Ahead and Real-Time RUC
Make-Whole Payments, Operating Reserves4 and Reserve Sharing Group costs, and payments to
Demand Response Resources, was $23.48/MWh.5 The cost of energy includes all the shortage
pricing components. Figure 2–5 plots the monthly average all-in price of energy and the price of
natural gas, measured at the Panhandle Eastern Hub.
Figure 2–5 SPP All-In Price of Electricity
The preceding figure shows the significant correlation between the price of natural gas and the
price of energy. This is an indication that the market generally functioned well, in that coal prices
3 The average price is calculated as the simple (arithmetic) average of North Hub and South Hub settlement location prices. 4 Operating Reserves are resource capacity held in reserve for Resource contingencies and NERC control performance compliance, which includes the following products: Regulation-Up Service, Regulation-Down Service, Spinning Reserve and Supplemental Reserve. 5 The Reserve Sharing Group costs and payments to Demand Response Resources were negligible for the year.
2. Overview of the SPP Market
2015 State of the Market | 16
are relatively stable where gas prices are much more volatile, resulting in the high correlation of
gas and electric prices given that gas or coal are the fuel on the margin 95% of the time. Much of
the deviation from the energy-gas price trend, also known as the implied heat rate, resulted from
monthly fluctuation in load, marginal fuel, and the coal/natural gas price spread. The graph also
shows that the market cost of operating reserves constituted approximately 2.3% of the all-in
price, with Make-Whole Payments and reserves amounting to $0.24/MWh and $0.30/MWh,
respectively. Shortage pricing is included in the energy component and not easily separated out
in the SPP settlement data; see Section 3.5 for a discussion of shortage pricing impacts. Figure
3–13 in Section 3 shows annual real-time prices starting with the beginning of the Energy
Imbalance Market in 2007.
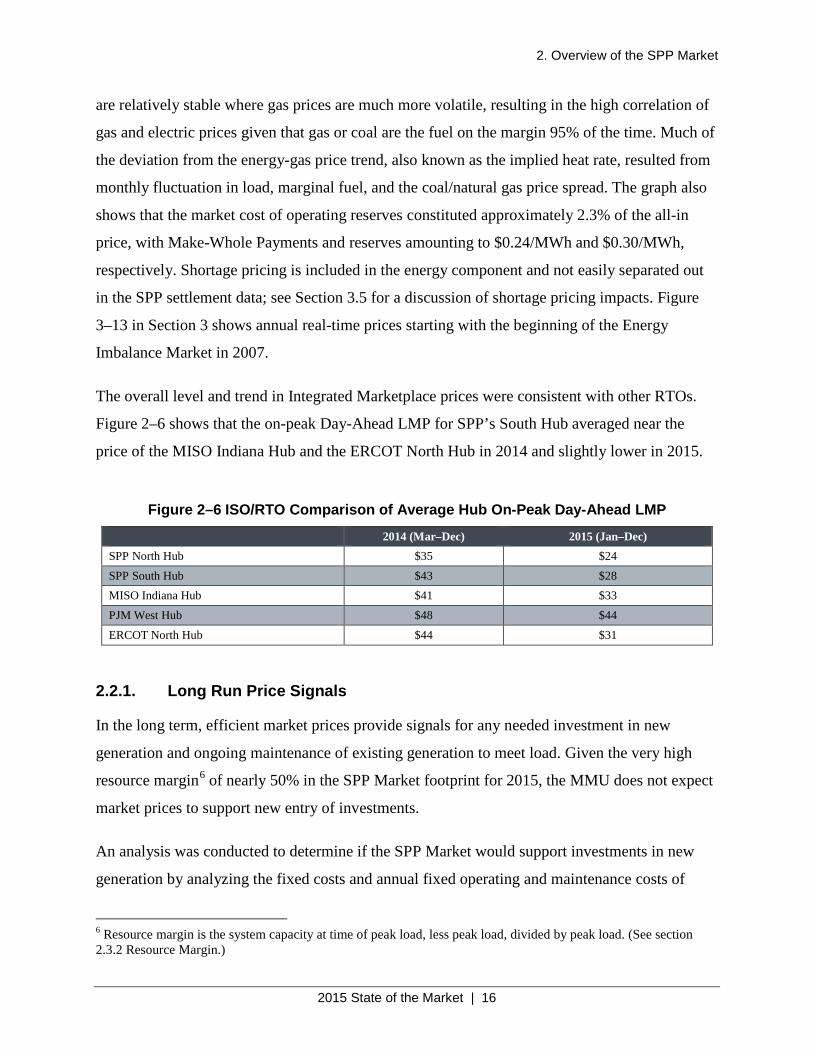
The overall level and trend in Integrated Marketplace prices were consistent with other RTOs.
Figure 2–6 shows that the on-peak Day-Ahead LMP for SPP’s South Hub averaged near the
price of the MISO Indiana Hub and the ERCOT North Hub in 2014 and slightly lower in 2015.
Figure 2–6 ISO/RTO Comparison of Average Hub On-Peak Day-Ahead LMP 2014 (Mar–Dec) 2015 (Jan–Dec) SPP North Hub $35 $24
SPP South Hub $43 $28 MISO Indiana Hub $41 $33
PJM West Hub $48 $44
ERCOT North Hub $44 $31
2.2.1. Long Run Price Signals
In the long term, efficient market prices provide signals for any needed investment in new
generation and ongoing maintenance of existing generation to meet load. Given the very high
resource margin6 of nearly 50% in the SPP Market footprint for 2015, the MMU does not expect
market prices to support new entry of investments.
An analysis was conducted to determine if the SPP Market would support investments in new
generation by analyzing the fixed costs and annual fixed operating and maintenance costs of
6 Resource margin is the system capacity at time of peak load, less peak load, divided by peak load. (See section 2.3.2 Resource Margin.)
2. Overview of the SPP Market
2015 State of the Market | 17
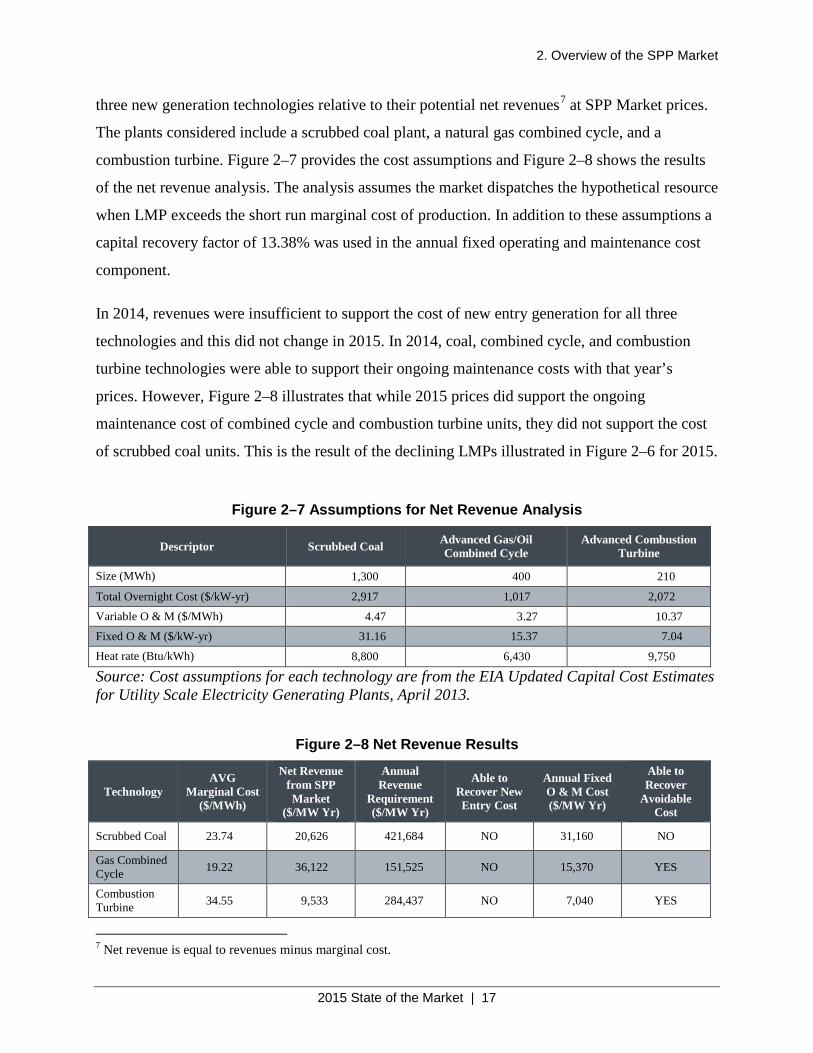
three new generation technologies relative to their potential net revenues7 at SPP Market prices.
The plants considered include a scrubbed coal plant, a natural gas combined cycle, and a
combustion turbine. Figure 2–7 provides the cost assumptions and Figure 2–8 shows the results
of the net revenue analysis. The analysis assumes the market dispatches the hypothetical resource
when LMP exceeds the short run marginal cost of production. In addition to these assumptions a
capital recovery factor of 13.38% was used in the annual fixed operating and maintenance cost
component.
In 2014, revenues were insufficient to support the cost of new entry generation for all three
technologies and this did not change in 2015. In 2014, coal, combined cycle, and combustion
turbine technologies were able to support their ongoing maintenance costs with that year’s
prices. However, Figure 2–8 illustrates that while 2015 prices did support the ongoing
maintenance cost of combined cycle and combustion turbine units, they did not support the cost
of scrubbed coal units. This is the result of the declining LMPs illustrated in Figure 2–6 for 2015.
Figure 2–7 Assumptions for Net Revenue Analysis
Descriptor Scrubbed Coal Advanced Gas/Oil Combined Cycle
Advanced Combustion Turbine
Size (MWh) 1,300 400 210
Total Overnight Cost ($/kW-yr) 2,917 1,017 2,072
Variable O & M ($/MWh) 4.47 3.27 10.37
Fixed O & M ($/kW-yr) 31.16 15.37 7.04
Heat rate (Btu/kWh) 8,800 6,430 9,750
Source: Cost assumptions for each technology are from the EIA Updated Capital Cost Estimates for Utility Scale Electricity Generating Plants, April 2013.
Figure 2–8 Net Revenue Results
Technology AVG
Marginal Cost ($/MWh)
Net Revenue from SPP Market
($/MW Yr)
Annual Revenue
Requirement ($/MW Yr)
Able to Recover New Entry Cost
Annual Fixed O & M Cost ($/MW Yr)
Able to Recover
Avoidable Cost
Scrubbed Coal 23.74 20,626 421,684 NO 31,160 NO
Gas Combined Cycle 19.22 36,122 151,525 NO 15,370 YES
Combustion Turbine 34.55 9,533 284,437 NO 7,040 YES
7 Net revenue is equal to revenues minus marginal cost.
2. Overview of the SPP Market
2015 State of the Market | 18
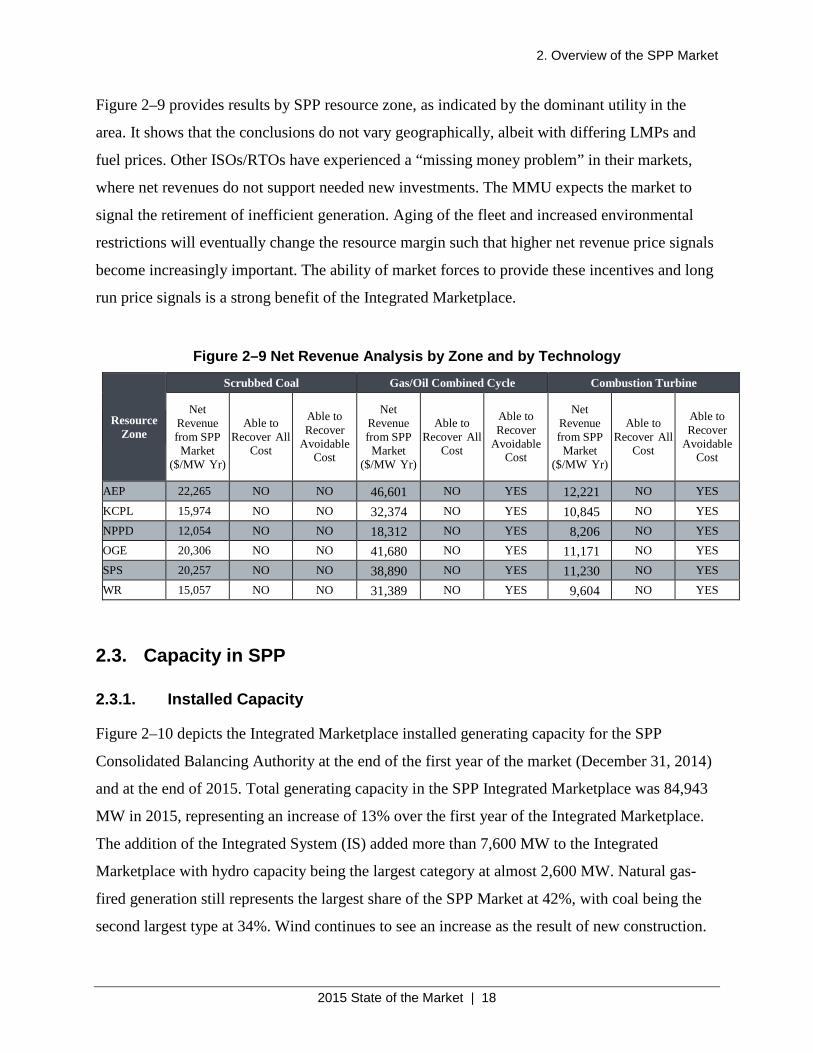
Figure 2–9 provides results by SPP resource zone, as indicated by the dominant utility in the
area. It shows that the conclusions do not vary geographically, albeit with differing LMPs and
fuel prices. Other ISOs/RTOs have experienced a “missing money problem” in their markets,
where net revenues do not support needed new investments. The MMU expects the market to
signal the retirement of inefficient generation. Aging of the fleet and increased environmental
restrictions will eventually change the resource margin such that higher net revenue price signals
become increasingly important. The ability of market forces to provide these incentives and long
run price signals is a strong benefit of the Integrated Marketplace.
Figure 2–9 Net Revenue Analysis by Zone and by Technology
Resource Zone
Scrubbed Coal Gas/Oil Combined Cycle Combustion Turbine
Net Revenue from SPP Market
($/MW Yr)
Able to Recover All
Cost
Able to Recover
Avoidable Cost
Net Revenue from SPP Market
($/MW Yr)
Able to Recover All
Cost
Able to Recover
Avoidable Cost
Net Revenue from SPP Market
($/MW Yr)
Able to Recover All
Cost
Able to Recover
Avoidable Cost
AEP 22,265 NO NO 46,601 NO YES 12,221 NO YES
KCPL 15,974 NO NO 32,374 NO YES 10,845 NO YES
NPPD 12,054 NO NO 18,312 NO YES 8,206 NO YES OGE 20,306 NO NO 41,680 NO YES 11,171 NO YES
SPS 20,257 NO NO 38,890 NO YES 11,230 NO YES
WR 15,057 NO NO 31,389 NO YES 9,604 NO YES
2.3. Capacity in SPP
2.3.1. Installed Capacity
Figure 2–10 depicts the Integrated Marketplace installed generating capacity for the SPP
Consolidated Balancing Authority at the end of the first year of the market (December 31, 2014)
and at the end of 2015. Total generating capacity in the SPP Integrated Marketplace was 84,943
MW in 2015, representing an increase of 13% over the first year of the Integrated Marketplace.
The addition of the Integrated System (IS) added more than 7,600 MW to the Integrated
Marketplace with hydro capacity being the largest category at almost 2,600 MW. Natural gas-
fired generation still represents the largest share of the SPP Market at 42%, with coal being the
second largest type at 34%. Wind continues to see an increase as the result of new construction.
2. Overview of the SPP Market
2015 State of the Market | 19
Excluding approximately 1,000 MW of wind capacity added with the IS, wind still saw a 33%
increase in 2015.
Figure 2–10 SPP Market Generation Capacity by Technology
Fuel Type December 31, 2014 December 31, 2015 Percent as of 12/31/15 Natural Gas 35,016 35,935 42%
Coal 26,486 28,821 34%
Wind 8,582 12,397 15%
Hydro 832 3,430 4%
Nuclear 2,569 2,629 3% Oil 1,527 1,608 2%
Other 155 123 <1%
Total 75,167 84,943
Note: Capacity is nameplate rating.
2.3.2. Reserve Margin
The SPP market-wide reserve margin is the amount of extra system capacity available after
serving system peak load as a percentage of peak load. For this analysis, system capacity is taken
to be unit registration ratings. In 2015, SPP reserve margin was up 1% from 48% in 2014, as
shown in Figure 2–11, which amounts to four times the SPP’s Annual Planning Capacity
Requirement of 12%. This relatively high reserve margin has positive implications for both
reliability and for mitigation of the potential exercise of market power within the market.8
Figure 2–11 Reserve Margin by Year for 2008–2015
Year Capacity (MW) Peak Load (MW) Reserve Margin 2008 49,561 36,538 36% 2009 58,223 39,622 47% 2010 61,570 45,373 36% 2011 63,367 47,989 32% 2012 64,053 47,142 36% 2013 66,668 45,256 47% 2014 67,095 45,301 48% 2015 67,251 45,279 49%
8 Figure 2–11 differs from Figure 2–10 by counting only 5% of wind capacity. The 5% wind capacity factor was used in this analysis to be consistent with Integrated Transmission Planning (ITP) Year 20 Assessment methodology as approved by SPP Economic Studies Working Group on 19 January 2010.
2. Overview of the SPP Market
2015 State of the Market | 20
2.3.3. Capacity Additions and Retirements
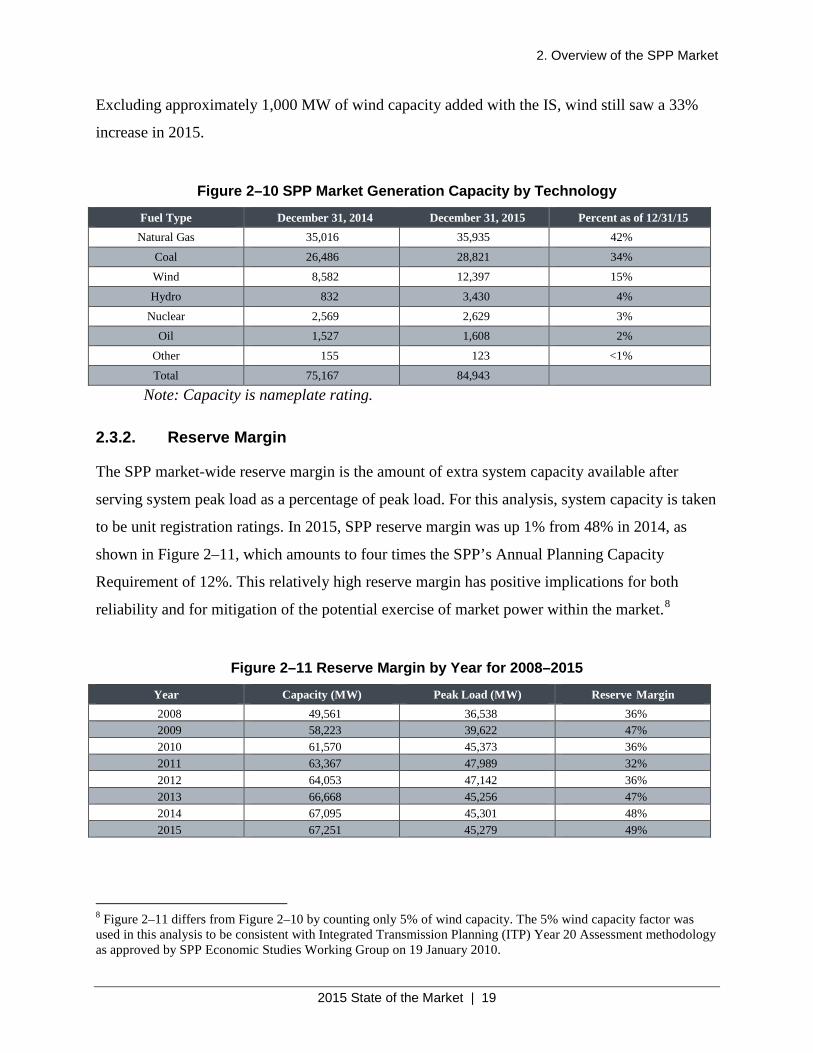
In 2015 about 11,345 MW of new generation capacity was added to the SPP Market, which
includes the capacity associated with the IS. Most of this capacity was wind at 34%, followed by
hydro at 24%, coal at 21%, natural gas at 17%, and oil at 4%. Figure 2–12 shows the capacity by
the technology and the number of resources added. Of this capacity, only 2,689 MW were new
construction, all belonging to the wind category.
Figure 2–12 New Capacity in 2015
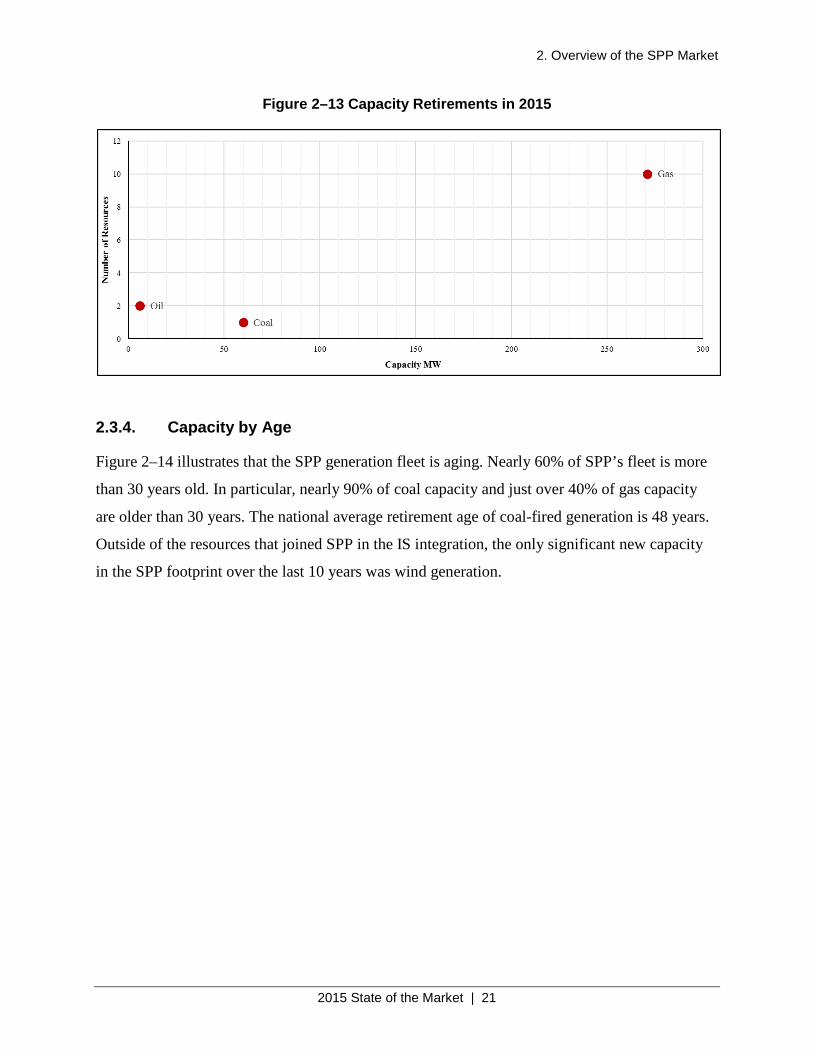
In 2015, the SPP Market also experienced generation retirements amounting to 337 MW in
installed capacity, of which 271 MW (80.4%) was gas-fired9, 60 MW (17.8 %) was coal-fired,
and 6 MW (1.8 %) was oil-fired. The bulk of the retired capacity was 1950s, 1970s, and 1980s
vintage coal-fired units followed by 1950s, 1960s, and 1970s vintage gas-fired units. Figure 2–13
shows capacity retirements in 2015 by the fuel and technology type.
9 Out of 271 MW gas-fired generation retired, 12 MW belongs to CT units, with the remainder being ST units.
2. Overview of the SPP Market
2015 State of the Market | 21
Figure 2–13 Capacity Retirements in 2015
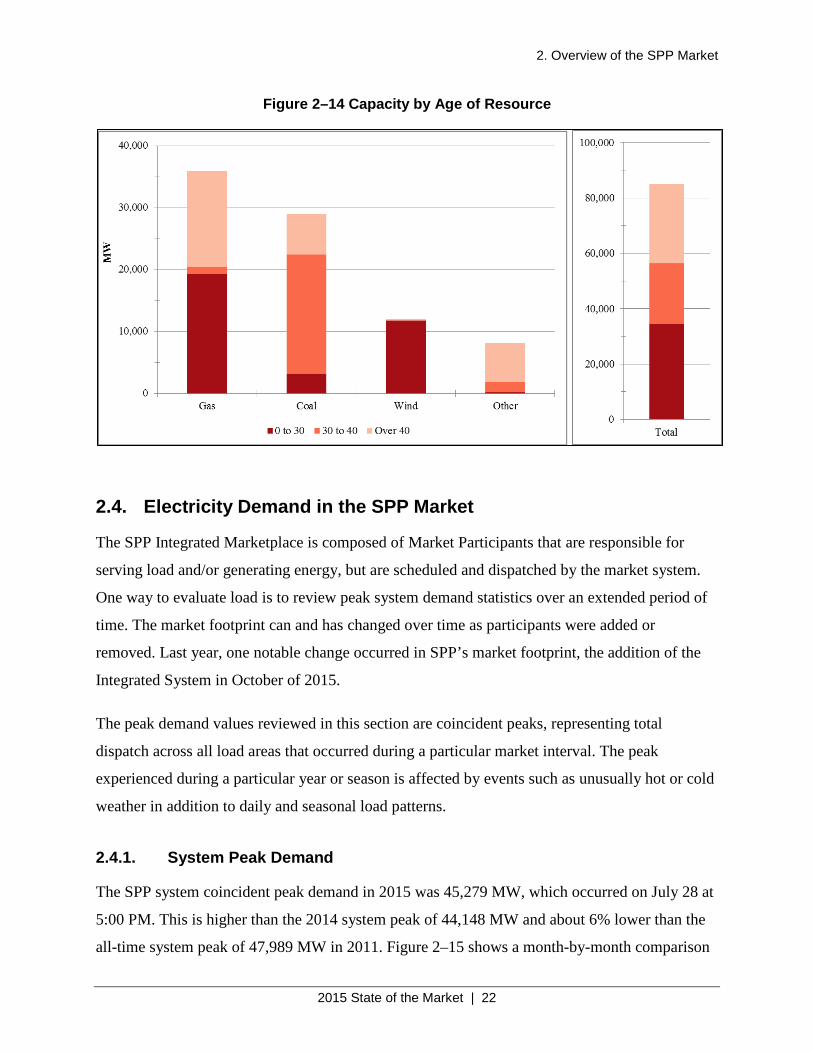
2.3.4. Capacity by Age
Figure 2–14 illustrates that the SPP generation fleet is aging. Nearly 60% of SPP’s fleet is more
than 30 years old. In particular, nearly 90% of coal capacity and just over 40% of gas capacity
are older than 30 years. The national average retirement age of coal-fired generation is 48 years.
Outside of the resources that joined SPP in the IS integration, the only significant new capacity
in the SPP footprint over the last 10 years was wind generation.
2. Overview of the SPP Market
2015 State of the Market | 22
Figure 2–14 Capacity by Age of Resource
2.4. Electricity Demand in the SPP Market
The SPP Integrated Marketplace is composed of Market Participants that are responsible for
serving load and/or generating energy, but are scheduled and dispatched by the market system.
One way to evaluate load is to review peak system demand statistics over an extended period of
time. The market footprint can and has changed over time as participants were added or
removed. Last year, one notable change occurred in SPP’s market footprint, the addition of the
Integrated System in October of 2015.
The peak demand values reviewed in this section are coincident peaks, representing total
dispatch across all load areas that occurred during a particular market interval. The peak
experienced during a particular year or season is affected by events such as unusually hot or cold
weather in addition to daily and seasonal load patterns.
2.4.1. System Peak Demand
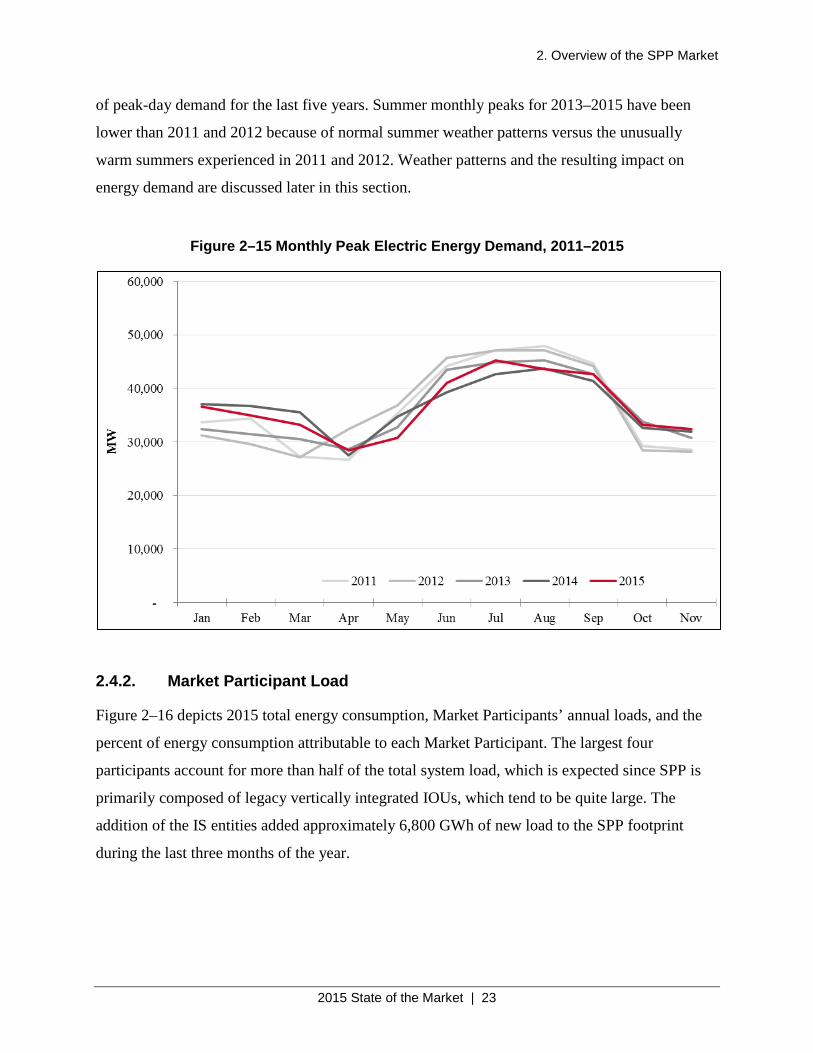
The SPP system coincident peak demand in 2015 was 45,279 MW, which occurred on July 28 at
5:00 PM. This is higher than the 2014 system peak of 44,148 MW and about 6% lower than the
all-time system peak of 47,989 MW in 2011. Figure 2–15 shows a month-by-month comparison
2. Overview of the SPP Market
2015 State of the Market | 23
of peak-day demand for the last five years. Summer monthly peaks for 2013–2015 have been
lower than 2011 and 2012 because of normal summer weather patterns versus the unusually
warm summers experienced in 2011 and 2012. Weather patterns and the resulting impact on
energy demand are discussed later in this section.
Figure 2–15 Monthly Peak Electric Energy Demand, 2011–2015
2.4.2. Market Participant Load
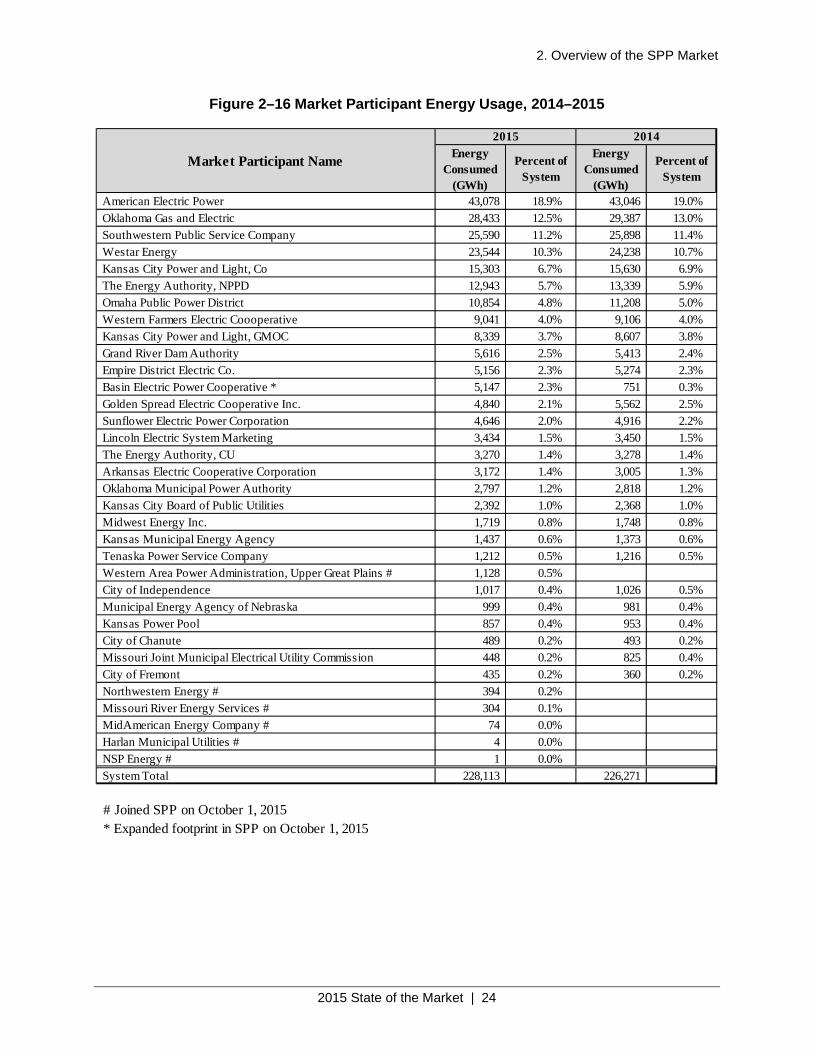
Figure 2–16 depicts 2015 total energy consumption, Market Participants’ annual loads, and the
percent of energy consumption attributable to each Market Participant. The largest four
participants account for more than half of the total system load, which is expected since SPP is
primarily composed of legacy vertically integrated IOUs, which tend to be quite large. The
addition of the IS entities added approximately 6,800 GWh of new load to the SPP footprint
during the last three months of the year.
2. Overview of the SPP Market
2015 State of the Market | 24
Figure 2–16 Market Participant Energy Usage, 2014–2015
Energy Consumed
(GWh)
Percent of System
Energy Consumed
(GWh)
Percent of System
American Electric Power 43,078 18.9% 43,046 19.0%Oklahoma Gas and Electric 28,433 12.5% 29,387 13.0%Southwestern Public Service Company 25,590 11.2% 25,898 11.4%Westar Energy 23,544 10.3% 24,238 10.7%Kansas City Power and Light, Co 15,303 6.7% 15,630 6.9%The Energy Authority, NPPD 12,943 5.7% 13,339 5.9%Omaha Public Power District 10,854 4.8% 11,208 5.0%Western Farmers Electric Coooperative 9,041 4.0% 9,106 4.0%Kansas City Power and Light, GMOC 8,339 3.7% 8,607 3.8%Grand River Dam Authority 5,616 2.5% 5,413 2.4%Empire District Electric Co. 5,156 2.3% 5,274 2.3%Basin Electric Power Cooperative * 5,147 2.3% 751 0.3%Golden Spread Electric Cooperative Inc. 4,840 2.1% 5,562 2.5%Sunflower Electric Power Corporation 4,646 2.0% 4,916 2.2%Lincoln Electric System Marketing 3,434 1.5% 3,450 1.5%The Energy Authority, CU 3,270 1.4% 3,278 1.4%Arkansas Electric Cooperative Corporation 3,172 1.4% 3,005 1.3%Oklahoma Municipal Power Authority 2,797 1.2% 2,818 1.2%Kansas City Board of Public Utilities 2,392 1.0% 2,368 1.0%Midwest Energy Inc. 1,719 0.8% 1,748 0.8%Kansas Municipal Energy Agency 1,437 0.6% 1,373 0.6%Tenaska Power Service Company 1,212 0.5% 1,216 0.5%Western Area Power Administration, Upper Great Plains # 1,128 0.5%City of Independence 1,017 0.4% 1,026 0.5%Municipal Energy Agency of Nebraska 999 0.4% 981 0.4%Kansas Power Pool 857 0.4% 953 0.4%City of Chanute 489 0.2% 493 0.2%Missouri Joint Municipal Electrical Utility Commission 448 0.2% 825 0.4%City of Fremont 435 0.2% 360 0.2%Northwestern Energy # 394 0.2%Missouri River Energy Services # 304 0.1%MidAmerican Energy Company # 74 0.0%Harlan Municipal Utilities # 4 0.0%NSP Energy # 1 0.0%System Total 228,113 226,271
# Joined SPP on October 1, 2015* Expanded footprint in SPP on October 1, 2015
Market Participant Name
20142015
2. Overview of the SPP Market
2015 State of the Market | 25
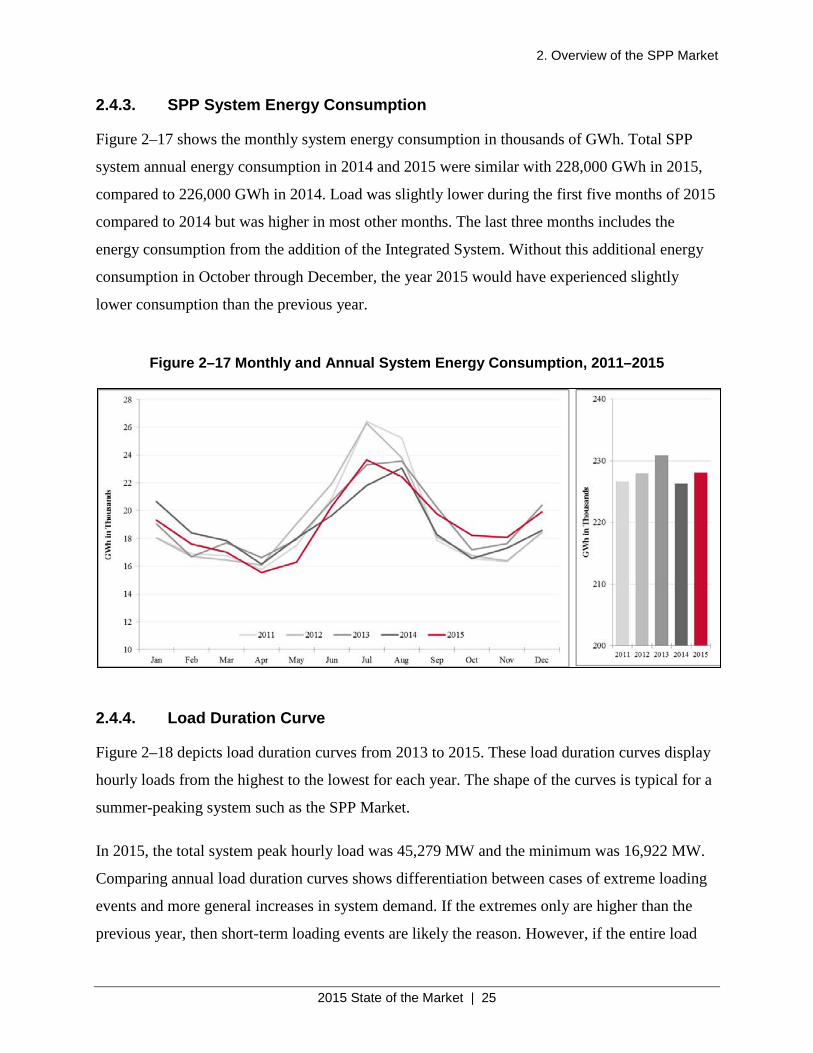
2.4.3. SPP System Energy Consumption
Figure 2–17 shows the monthly system energy consumption in thousands of GWh. Total SPP
system annual energy consumption in 2014 and 2015 were similar with 228,000 GWh in 2015,
compared to 226,000 GWh in 2014. Load was slightly lower during the first five months of 2015
compared to 2014 but was higher in most other months. The last three months includes the
energy consumption from the addition of the Integrated System. Without this additional energy
consumption in October through December, the year 2015 would have experienced slightly
lower consumption than the previous year.
Figure 2–17 Monthly and Annual System Energy Consumption, 2011–2015
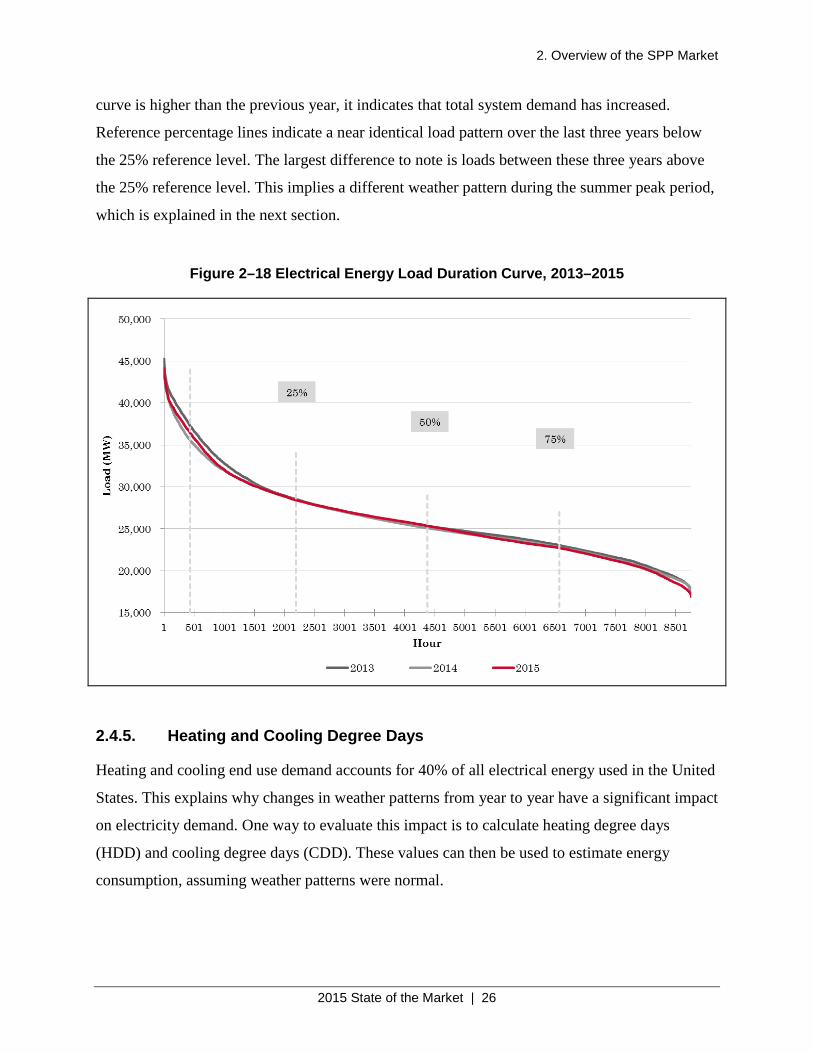
2.4.4. Load Duration Curve
Figure 2–18 depicts load duration curves from 2013 to 2015. These load duration curves display
hourly loads from the highest to the lowest for each year. The shape of the curves is typical for a
summer-peaking system such as the SPP Market.
In 2015, the total system peak hourly load was 45,279 MW and the minimum was 16,922 MW.
Comparing annual load duration curves shows differentiation between cases of extreme loading
events and more general increases in system demand. If the extremes only are higher than the
previous year, then short-term loading events are likely the reason. However, if the entire load
2. Overview of the SPP Market
2015 State of the Market | 26
curve is higher than the previous year, it indicates that total system demand has increased.
Reference percentage lines indicate a near identical load pattern over the last three years below
the 25% reference level. The largest difference to note is loads between these three years above
the 25% reference level. This implies a different weather pattern during the summer peak period,
which is explained in the next section.
Figure 2–18 Electrical Energy Load Duration Curve, 2013–2015
2.4.5. Heating and Cooling Degree Days
Heating and cooling end use demand accounts for 40% of all electrical energy used in the United
States. This explains why changes in weather patterns from year to year have a significant impact
on electricity demand. One way to evaluate this impact is to calculate heating degree days
(HDD) and cooling degree days (CDD). These values can then be used to estimate energy
consumption, assuming weather patterns were normal.
2. Overview of the SPP Market
2015 State of the Market | 27
To determine HDD and CDD for the SPP footprint, several representative locations10 were used
to calculate system daily average temperatures11. In this report, the base temperature separating
heating and cooling periods is 65 degrees Fahrenheit. If the average temperature of a day is 75
degrees Fahrenheit, there would be 10 (=75-65) cooling degree days. If a day’s average
temperature is 50 degrees Fahrenheit, there would be 15 (=65-50) heating degree days. Using
statistical tools, the estimated load impact of a single CDD was determined to be 3,340 MWh
compared to 816 MWh per HDD. As expected, the impact of a single CDD on load is
significantly higher than that of an HDD in part because of the higher saturation of electric
cooling than electric heating. HDD values were adjusted accordingly in the graph below to
reflect load impact differences.
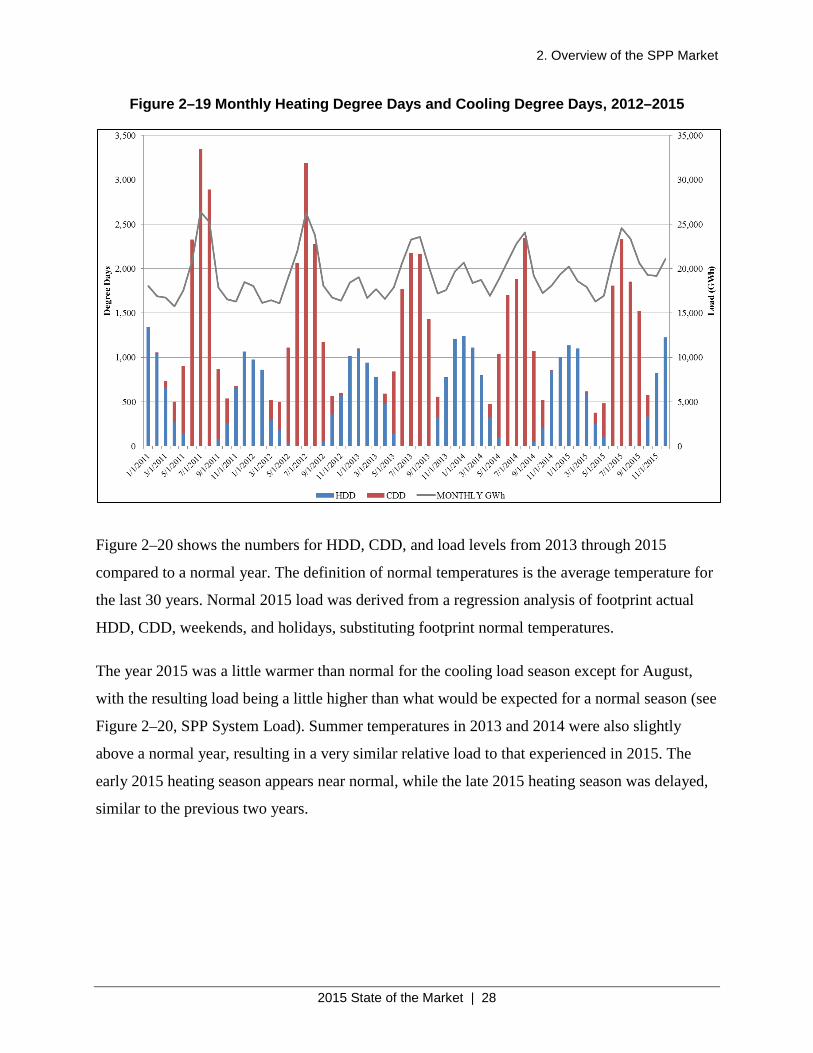
Figure 2–19 illustrates that 2015 experienced a very similar level of cooling degree days to the
prior two years, all substantially lower than 2011 and 2012. Lower temperatures in the last three
summers are the major cause of lower peak loads shown in Figure 2–10 and lower total energy
consumption shown in Figure 2–15.
10 Amarillo TX, Topeka KS, Oklahoma City OK, Tulsa OK, and Lincoln NE. After October 1, 2015, Bismarck ND was added to represent SPP’s expanded market footprint. 11 Daily average temperature is calculated as the average of the daily lowest and highest temperatures. The source of the temperature is the National Oceanic and Atmospheric Administration (NOAA).
2. Overview of the SPP Market
2015 State of the Market | 28
Figure 2–19 Monthly Heating Degree Days and Cooling Degree Days, 2012–2015
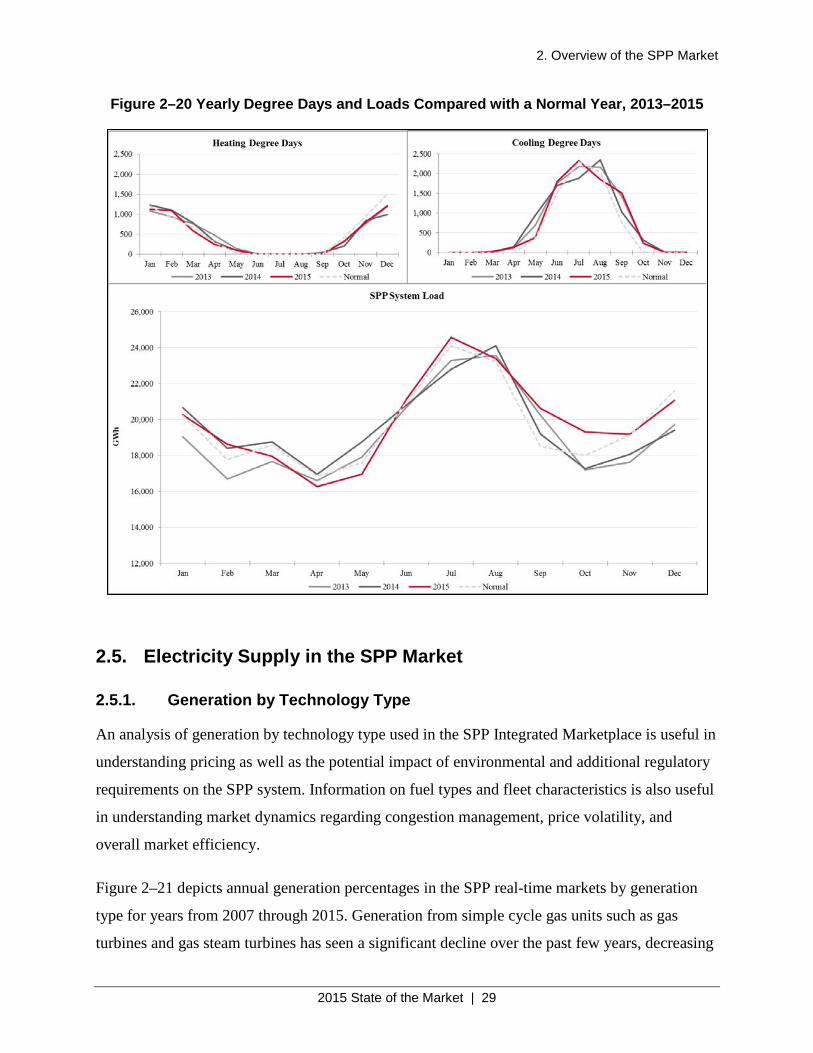
Figure 2–20 shows the numbers for HDD, CDD, and load levels from 2013 through 2015
compared to a normal year. The definition of normal temperatures is the average temperature for
the last 30 years. Normal 2015 load was derived from a regression analysis of footprint actual
HDD, CDD, weekends, and holidays, substituting footprint normal temperatures.
The year 2015 was a little warmer than normal for the cooling load season except for August,
with the resulting load being a little higher than what would be expected for a normal season (see
Figure 2–20, SPP System Load). Summer temperatures in 2013 and 2014 were also slightly
above a normal year, resulting in a very similar relative load to that experienced in 2015. The
early 2015 heating season appears near normal, while the late 2015 heating season was delayed,
similar to the previous two years.
2. Overview of the SPP Market
2015 State of the Market | 29
Figure 2–20 Yearly Degree Days and Loads Compared with a Normal Year, 2013–2015
2.5. Electricity Supply in the SPP Market
2.5.1. Generation by Technology Type
An analysis of generation by technology type used in the SPP Integrated Marketplace is useful in
understanding pricing as well as the potential impact of environmental and additional regulatory
requirements on the SPP system. Information on fuel types and fleet characteristics is also useful
in understanding market dynamics regarding congestion management, price volatility, and
overall market efficiency.
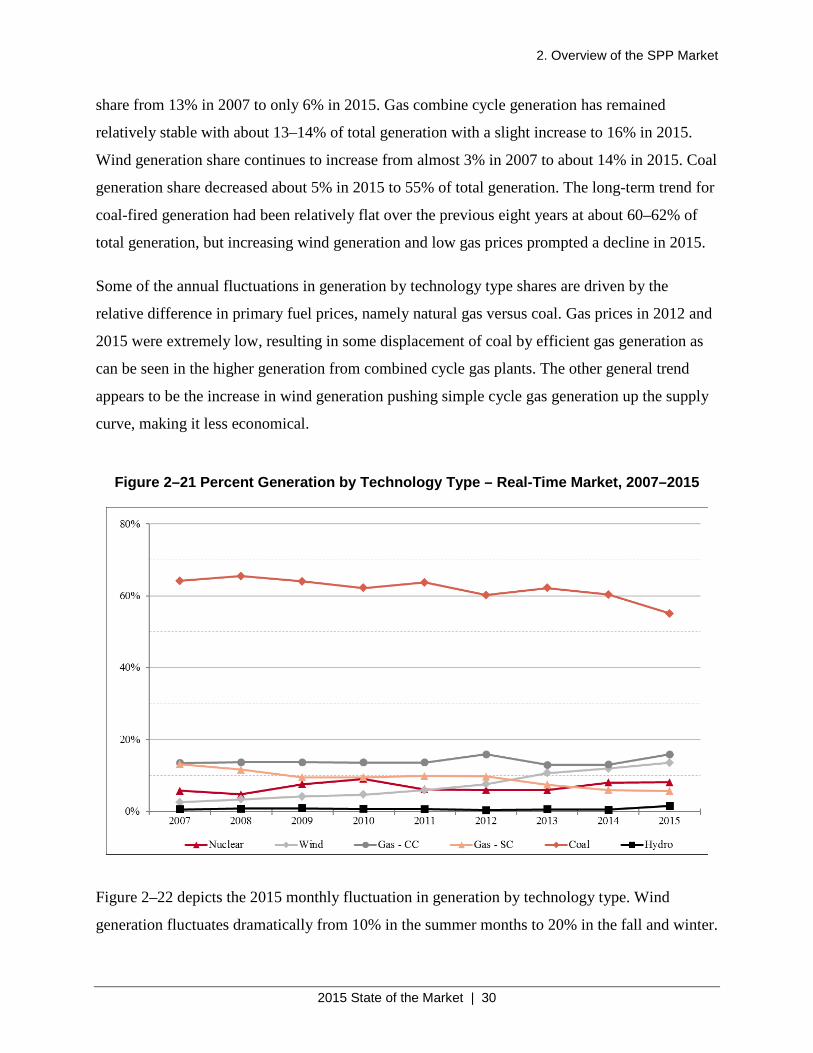
Figure 2–21 depicts annual generation percentages in the SPP real-time markets by generation
type for years from 2007 through 2015. Generation from simple cycle gas units such as gas
turbines and gas steam turbines has seen a significant decline over the past few years, decreasing
2. Overview of the SPP Market
2015 State of the Market | 30
share from 13% in 2007 to only 6% in 2015. Gas combine cycle generation has remained
relatively stable with about 13–14% of total generation with a slight increase to 16% in 2015.
Wind generation share continues to increase from almost 3% in 2007 to about 14% in 2015. Coal
generation share decreased about 5% in 2015 to 55% of total generation. The long-term trend for
coal-fired generation had been relatively flat over the previous eight years at about 60–62% of
total generation, but increasing wind generation and low gas prices prompted a decline in 2015.
Some of the annual fluctuations in generation by technology type shares are driven by the
relative difference in primary fuel prices, namely natural gas versus coal. Gas prices in 2012 and
2015 were extremely low, resulting in some displacement of coal by efficient gas generation as
can be seen in the higher generation from combined cycle gas plants. The other general trend
appears to be the increase in wind generation pushing simple cycle gas generation up the supply
curve, making it less economical.
Figure 2–21 Percent Generation by Technology Type – Real-Time Market, 2007–2015
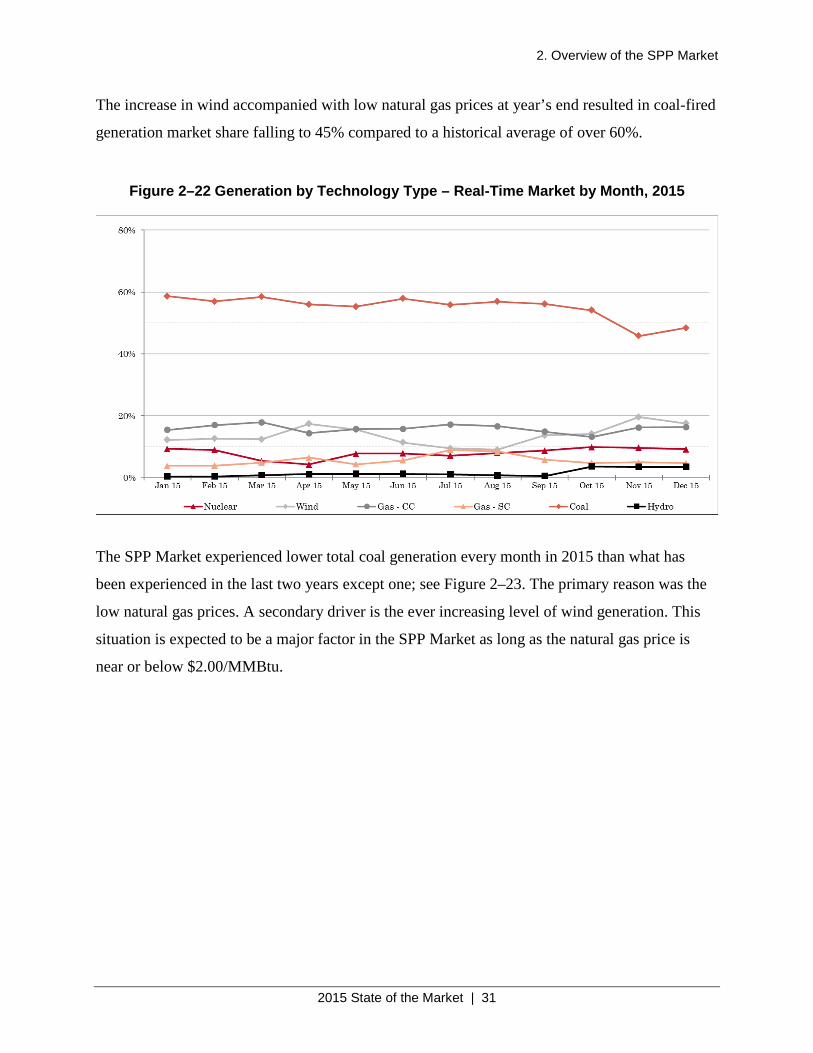
Figure 2–22 depicts the 2015 monthly fluctuation in generation by technology type. Wind
generation fluctuates dramatically from 10% in the summer months to 20% in the fall and winter.
2. Overview of the SPP Market
2015 State of the Market | 31
The increase in wind accompanied with low natural gas prices at year’s end resulted in coal-fired
generation market share falling to 45% compared to a historical average of over 60%.
Figure 2–22 Generation by Technology Type – Real-Time Market by Month, 2015
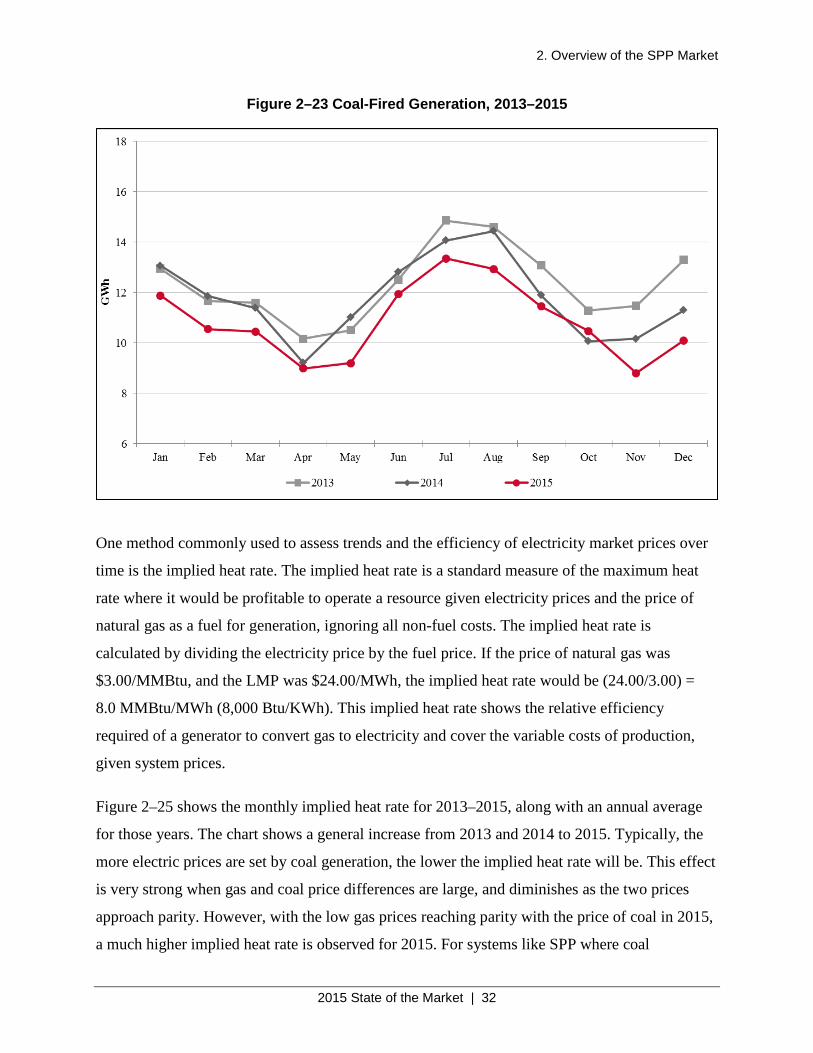
The SPP Market experienced lower total coal generation every month in 2015 than what has
been experienced in the last two years except one; see Figure 2–23. The primary reason was the
low natural gas prices. A secondary driver is the ever increasing level of wind generation. This
situation is expected to be a major factor in the SPP Market as long as the natural gas price is
near or below $2.00/MMBtu.
2. Overview of the SPP Market
2015 State of the Market | 32
Figure 2–23 Coal-Fired Generation, 2013–2015
One method commonly used to assess trends and the efficiency of electricity market prices over
time is the implied heat rate. The implied heat rate is a standard measure of the maximum heat
rate where it would be profitable to operate a resource given electricity prices and the price of
natural gas as a fuel for generation, ignoring all non-fuel costs. The implied heat rate is
calculated by dividing the electricity price by the fuel price. If the price of natural gas was
$3.00/MMBtu, and the LMP was $24.00/MWh, the implied heat rate would be (24.00/3.00) =
8.0 MMBtu/MWh (8,000 Btu/KWh). This implied heat rate shows the relative efficiency
required of a generator to convert gas to electricity and cover the variable costs of production,
given system prices.
Figure 2–25 shows the monthly implied heat rate for 2013–2015, along with an annual average
for those years. The chart shows a general increase from 2013 and 2014 to 2015. Typically, the
more electric prices are set by coal generation, the lower the implied heat rate will be. This effect
is very strong when gas and coal price differences are large, and diminishes as the two prices
approach parity. However, with the low gas prices reaching parity with the price of coal in 2015,
a much higher implied heat rate is observed for 2015. For systems like SPP where coal
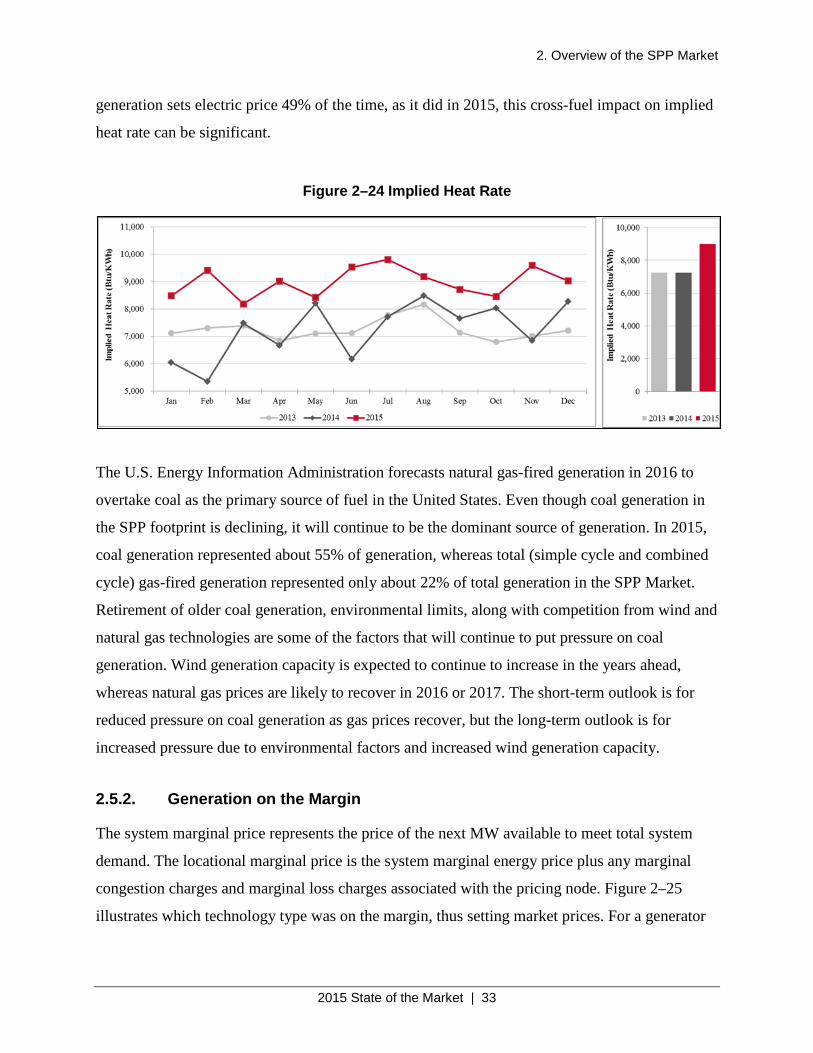
2. Overview of the SPP Market
2015 State of the Market | 33
generation sets electric price 49% of the time, as it did in 2015, this cross-fuel impact on implied
heat rate can be significant.
Figure 2–24 Implied Heat Rate
The U.S. Energy Information Administration forecasts natural gas-fired generation in 2016 to
overtake coal as the primary source of fuel in the United States. Even though coal generation in
the SPP footprint is declining, it will continue to be the dominant source of generation. In 2015,
coal generation represented about 55% of generation, whereas total (simple cycle and combined
cycle) gas-fired generation represented only about 22% of total generation in the SPP Market.
Retirement of older coal generation, environmental limits, along with competition from wind and
natural gas technologies are some of the factors that will continue to put pressure on coal
generation. Wind generation capacity is expected to continue to increase in the years ahead,
whereas natural gas prices are likely to recover in 2016 or 2017. The short-term outlook is for
reduced pressure on coal generation as gas prices recover, but the long-term outlook is for
increased pressure due to environmental factors and increased wind generation capacity.
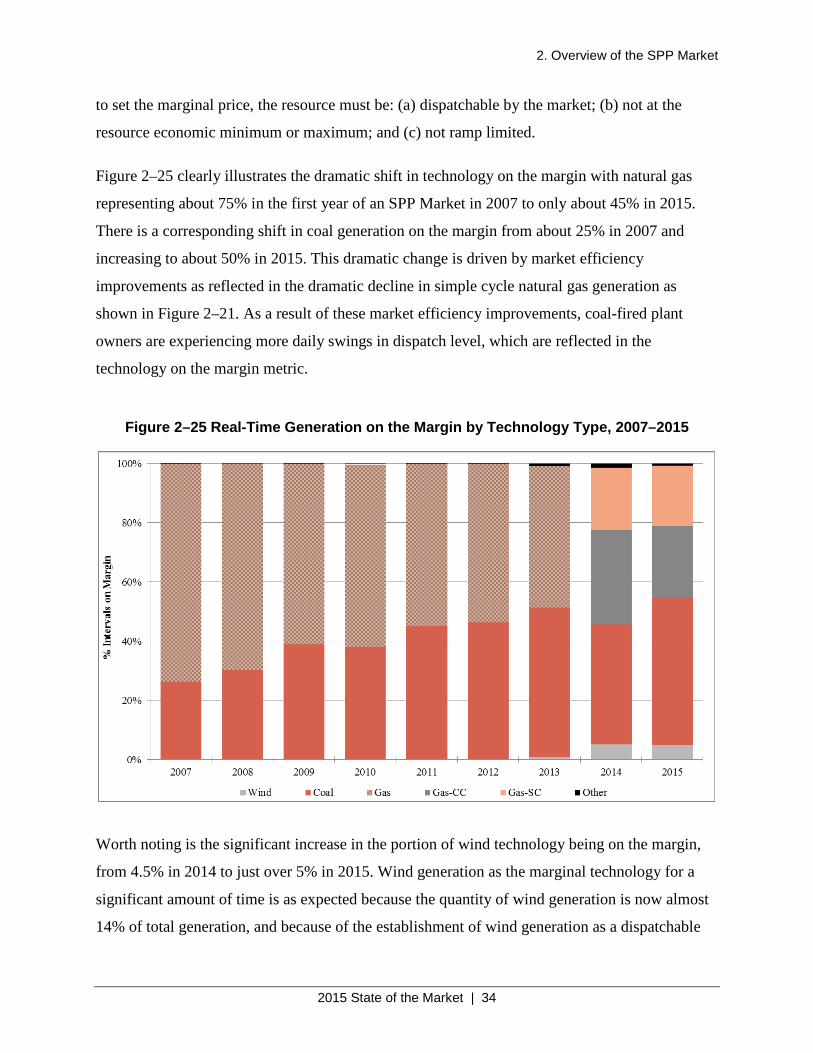
2.5.2. Generation on the Margin
The system marginal price represents the price of the next MW available to meet total system
demand. The locational marginal price is the system marginal energy price plus any marginal
congestion charges and marginal loss charges associated with the pricing node. Figure 2–25
illustrates which technology type was on the margin, thus setting market prices. For a generator
2. Overview of the SPP Market
2015 State of the Market | 34
to set the marginal price, the resource must be: (a) dispatchable by the market; (b) not at the
resource economic minimum or maximum; and (c) not ramp limited.
Figure 2–25 clearly illustrates the dramatic shift in technology on the margin with natural gas
representing about 75% in the first year of an SPP Market in 2007 to only about 45% in 2015.
There is a corresponding shift in coal generation on the margin from about 25% in 2007 and
increasing to about 50% in 2015. This dramatic change is driven by market efficiency
improvements as reflected in the dramatic decline in simple cycle natural gas generation as
shown in Figure 2–21. As a result of these market efficiency improvements, coal-fired plant
owners are experiencing more daily swings in dispatch level, which are reflected in the
technology on the margin metric.
Figure 2–25 Real-Time Generation on the Margin by Technology Type, 2007–2015
Worth noting is the significant increase in the portion of wind technology being on the margin,
from 4.5% in 2014 to just over 5% in 2015. Wind generation as the marginal technology for a
significant amount of time is as expected because the quantity of wind generation is now almost
14% of total generation, and because of the establishment of wind generation as a dispatchable
2. Overview of the SPP Market
2015 State of the Market | 35
resource in the new market. At the end of 2015 just over 46% of wind capacity was dispatchable,
compared to 27% at the beginning of the Integrated Marketplace in March 2014. All but 5% of
wind capacity in the EIS Market was a price taker in 2013.
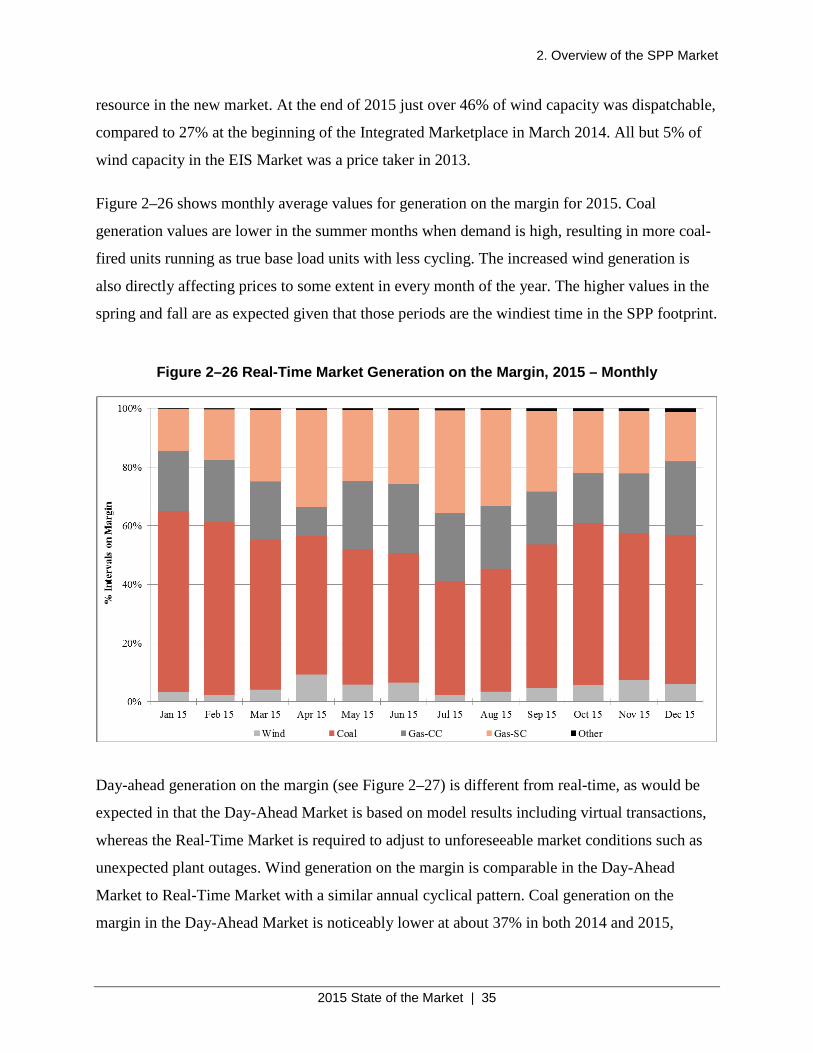
Figure 2–26 shows monthly average values for generation on the margin for 2015. Coal
generation values are lower in the summer months when demand is high, resulting in more coal-
fired units running as true base load units with less cycling. The increased wind generation is
also directly affecting prices to some extent in every month of the year. The higher values in the
spring and fall are as expected given that those periods are the windiest time in the SPP footprint.
Figure 2–26 Real-Time Market Generation on the Margin, 2015 – Monthly
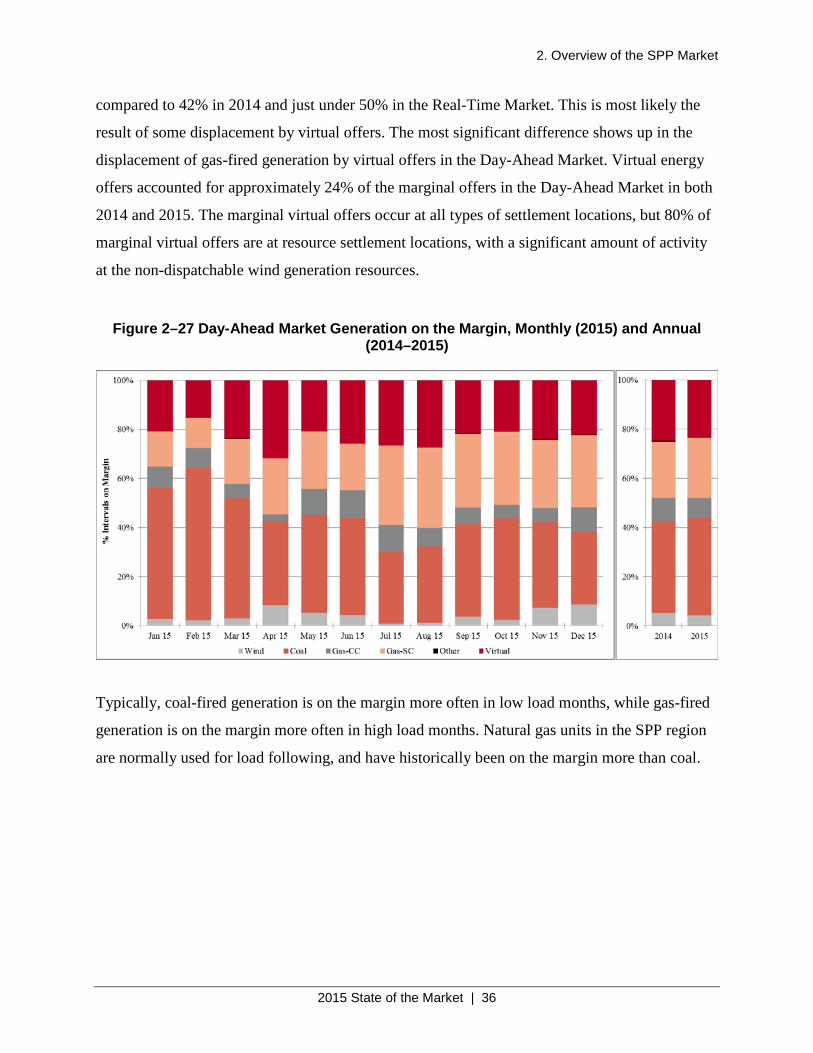
Day-ahead generation on the margin (see Figure 2–27) is different from real-time, as would be
expected in that the Day-Ahead Market is based on model results including virtual transactions,
whereas the Real-Time Market is required to adjust to unforeseeable market conditions such as
unexpected plant outages. Wind generation on the margin is comparable in the Day-Ahead
Market to Real-Time Market with a similar annual cyclical pattern. Coal generation on the
margin in the Day-Ahead Market is noticeably lower at about 37% in both 2014 and 2015,
2. Overview of the SPP Market
2015 State of the Market | 36
compared to 42% in 2014 and just under 50% in the Real-Time Market. This is most likely the
result of some displacement by virtual offers. The most significant difference shows up in the
displacement of gas-fired generation by virtual offers in the Day-Ahead Market. Virtual energy
offers accounted for approximately 24% of the marginal offers in the Day-Ahead Market in both
2014 and 2015. The marginal virtual offers occur at all types of settlement locations, but 80% of
marginal virtual offers are at resource settlement locations, with a significant amount of activity
at the non-dispatchable wind generation resources.
Figure 2–27 Day-Ahead Market Generation on the Margin, Monthly (2015) and Annual (2014–2015)
Typically, coal-fired generation is on the margin more often in low load months, while gas-fired
generation is on the margin more often in high load months. Natural gas units in the SPP region
are normally used for load following, and have historically been on the margin more than coal.
2. Overview of the SPP Market
2015 State of the Market | 37
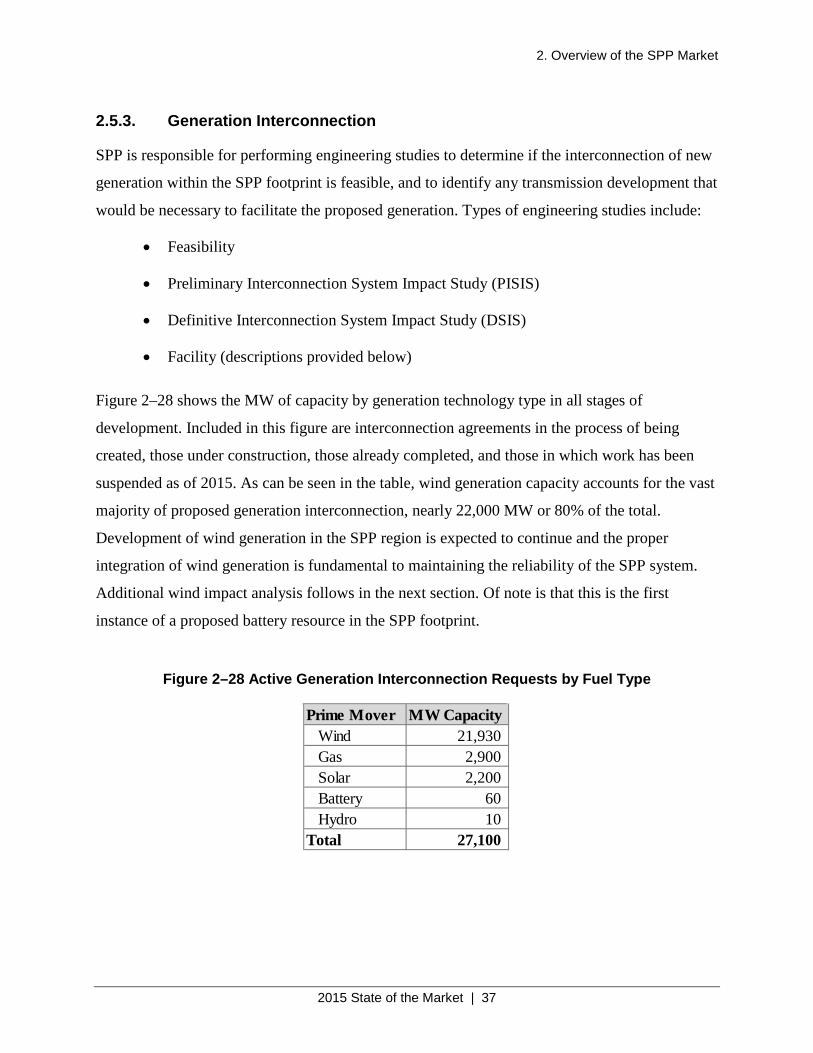
2.5.3. Generation Interconnection
SPP is responsible for performing engineering studies to determine if the interconnection of new
generation within the SPP footprint is feasible, and to identify any transmission development that
would be necessary to facilitate the proposed generation. Types of engineering studies include:
• Feasibility
• Preliminary Interconnection System Impact Study (PISIS)
• Definitive Interconnection System Impact Study (DSIS)
• Facility (descriptions provided below)
Figure 2–28 shows the MW of capacity by generation technology type in all stages of
development. Included in this figure are interconnection agreements in the process of being
created, those under construction, those already completed, and those in which work has been
suspended as of 2015. As can be seen in the table, wind generation capacity accounts for the vast
majority of proposed generation interconnection, nearly 22,000 MW or 80% of the total.
Development of wind generation in the SPP region is expected to continue and the proper
integration of wind generation is fundamental to maintaining the reliability of the SPP system.
Additional wind impact analysis follows in the next section. Of note is that this is the first
instance of a proposed battery resource in the SPP footprint.
Figure 2–28 Active Generation Interconnection Requests by Fuel Type
Prime Mover MW CapacityWind 21,930 Gas 2,900 Solar 2,200 Battery 60 Hydro 10
Total 27,100
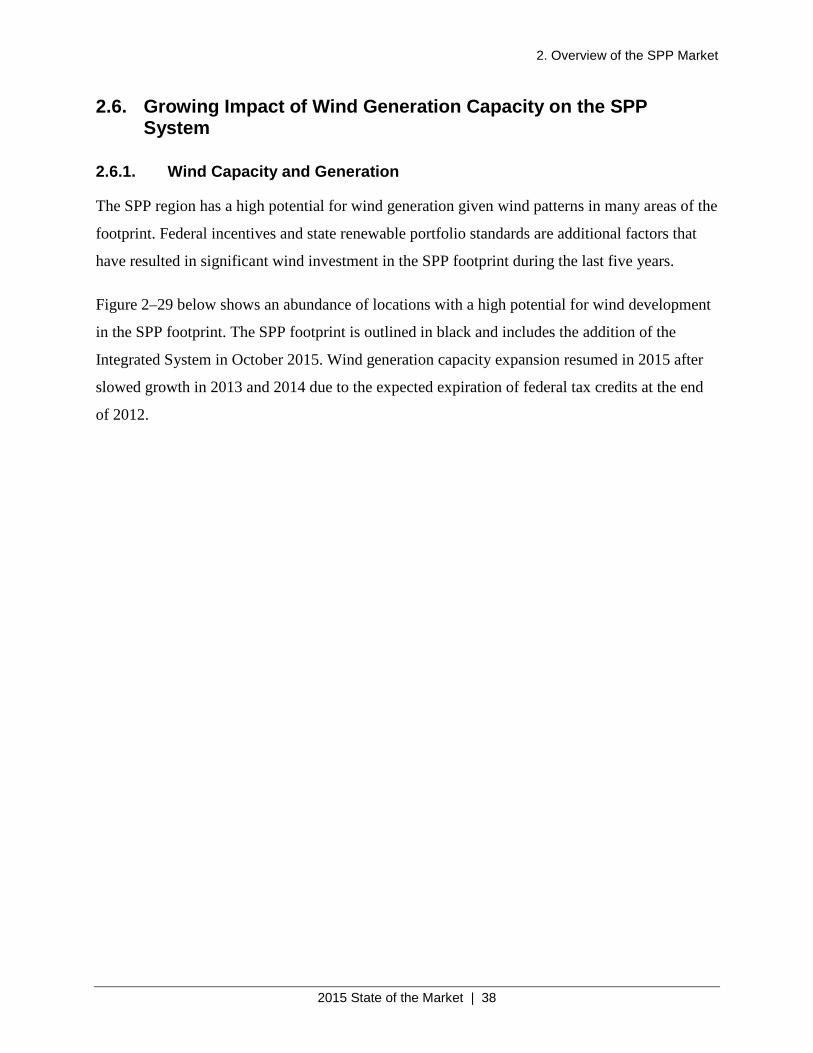
2. Overview of the SPP Market
2015 State of the Market | 38
2.6. Growing Impact of Wind Generation Capacity on the SPP System
2.6.1. Wind Capacity and Generation
The SPP region has a high potential for wind generation given wind patterns in many areas of the
footprint. Federal incentives and state renewable portfolio standards are additional factors that
have resulted in significant wind investment in the SPP footprint during the last five years.
Figure 2–29 below shows an abundance of locations with a high potential for wind development
in the SPP footprint. The SPP footprint is outlined in black and includes the addition of the
Integrated System in October 2015. Wind generation capacity expansion resumed in 2015 after
slowed growth in 2013 and 2014 due to the expected expiration of federal tax credits at the end
of 2012.
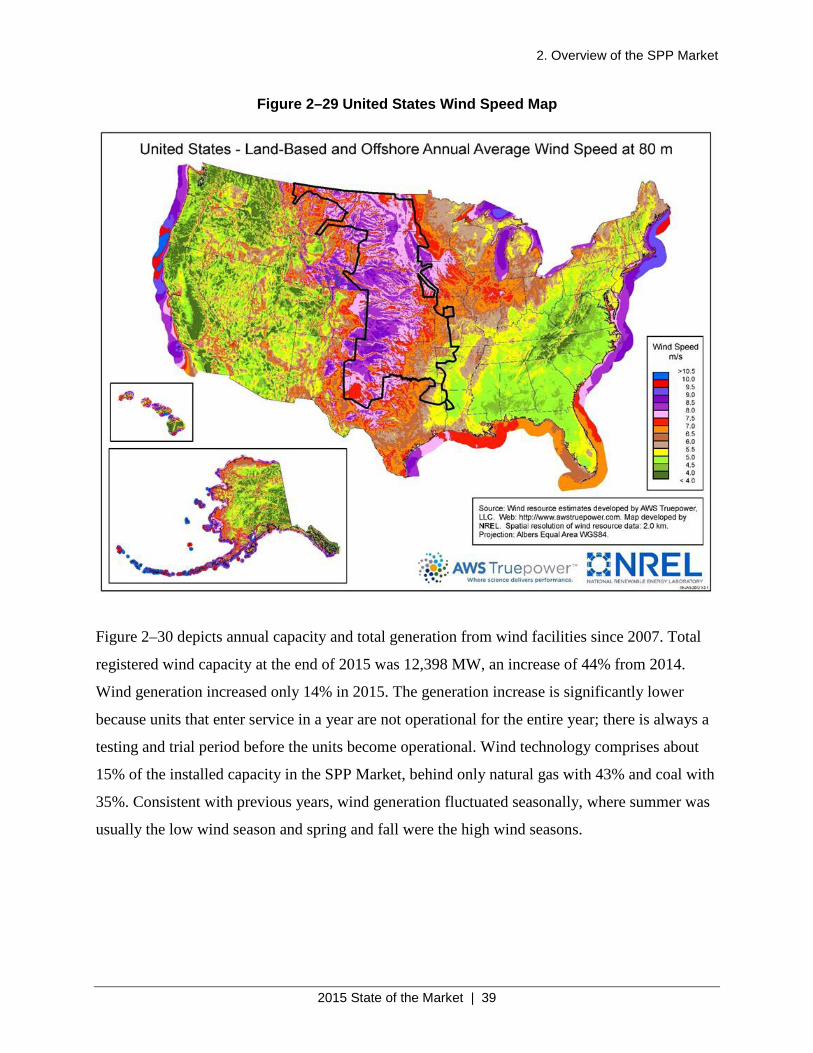
2. Overview of the SPP Market
2015 State of the Market | 39
Figure 2–29 United States Wind Speed Map
Figure 2–30 depicts annual capacity and total generation from wind facilities since 2007. Total
registered wind capacity at the end of 2015 was 12,398 MW, an increase of 44% from 2014.
Wind generation increased only 14% in 2015. The generation increase is significantly lower
because units that enter service in a year are not operational for the entire year; there is always a
testing and trial period before the units become operational. Wind technology comprises about
15% of the installed capacity in the SPP Market, behind only natural gas with 43% and coal with
35%. Consistent with previous years, wind generation fluctuated seasonally, where summer was
usually the low wind season and spring and fall were the high wind seasons.
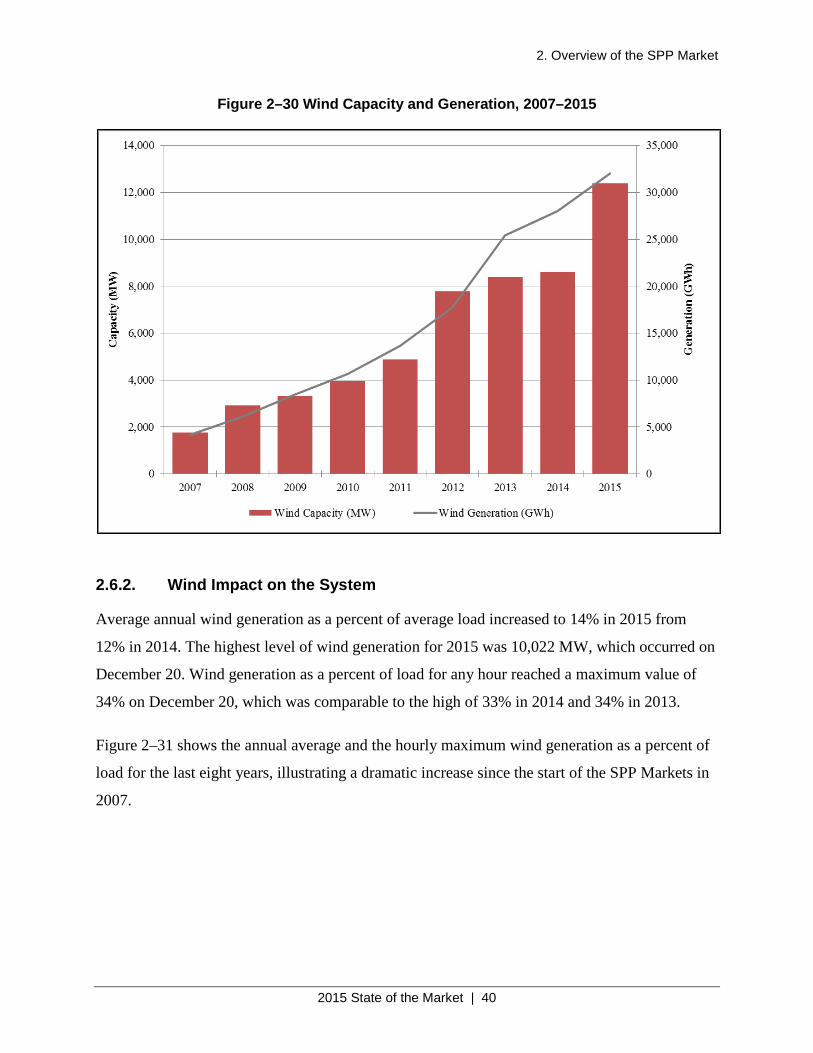
2. Overview of the SPP Market
2015 State of the Market | 40
Figure 2–30 Wind Capacity and Generation, 2007–2015
2.6.2. Wind Impact on the System
Average annual wind generation as a percent of average load increased to 14% in 2015 from
12% in 2014. The highest level of wind generation for 2015 was 10,022 MW, which occurred on
December 20. Wind generation as a percent of load for any hour reached a maximum value of
34% on December 20, which was comparable to the high of 33% in 2014 and 34% in 2013.
Figure 2–31 shows the annual average and the hourly maximum wind generation as a percent of
load for the last eight years, illustrating a dramatic increase since the start of the SPP Markets in
2007.
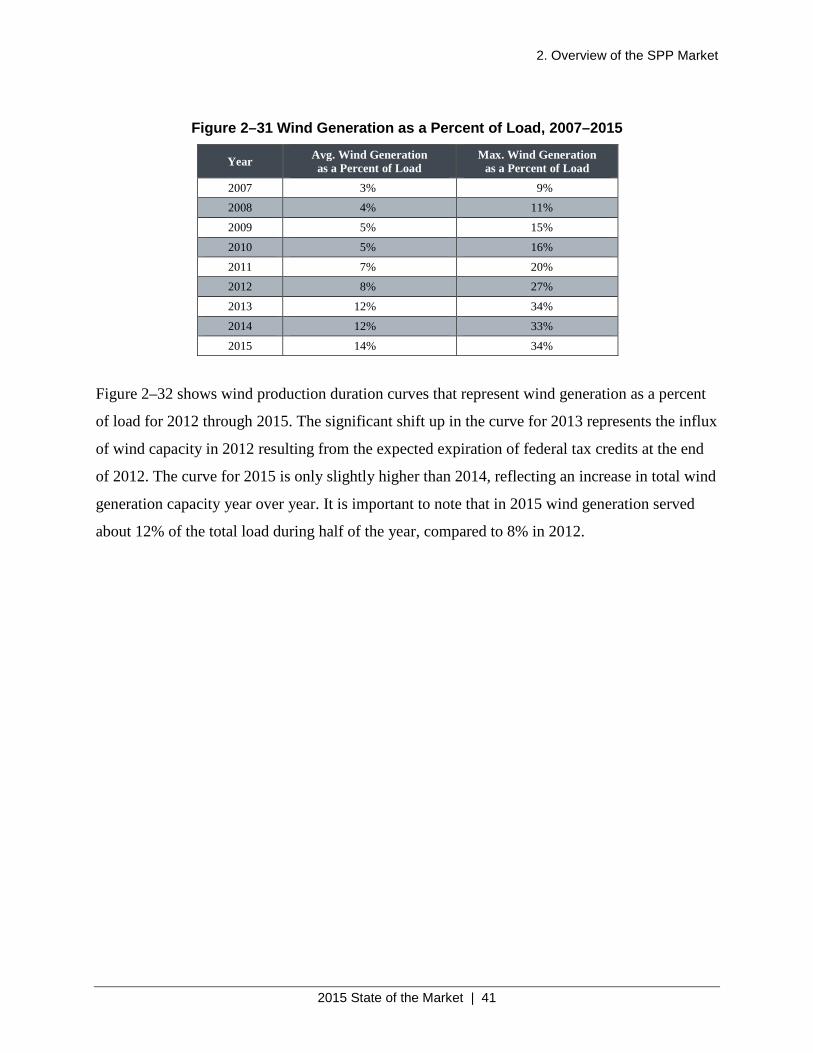
2. Overview of the SPP Market
2015 State of the Market | 41
Figure 2–31 Wind Generation as a Percent of Load, 2007–2015
Year Avg. Wind Generation as a Percent of Load
Max. Wind Generation as a Percent of Load
2007 3% 9% 2008 4% 11%
2009 5% 15%
2010 5% 16%
2011 7% 20% 2012 8% 27%
2013 12% 34%
2014 12% 33%
2015 14% 34%
Figure 2–32 shows wind production duration curves that represent wind generation as a percent
of load for 2012 through 2015. The significant shift up in the curve for 2013 represents the influx
of wind capacity in 2012 resulting from the expected expiration of federal tax credits at the end
of 2012. The curve for 2015 is only slightly higher than 2014, reflecting an increase in total wind
generation capacity year over year. It is important to note that in 2015 wind generation served
about 12% of the total load during half of the year, compared to 8% in 2012.
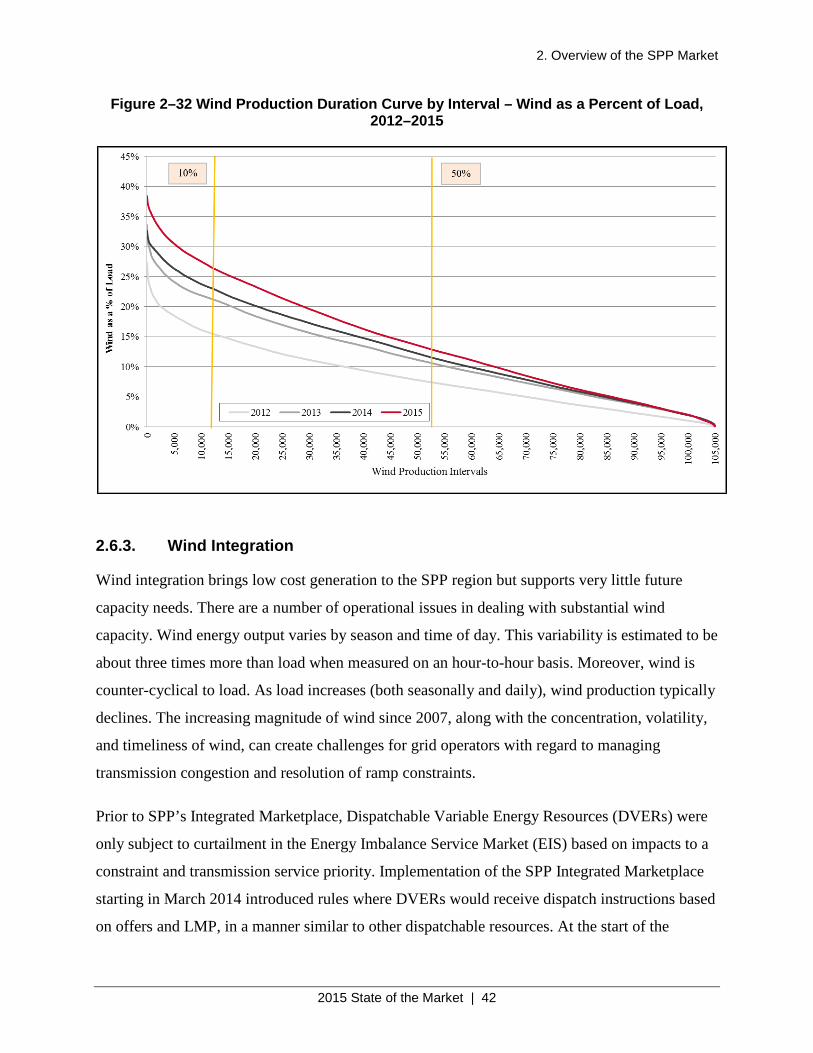
2. Overview of the SPP Market
2015 State of the Market | 42
Figure 2–32 Wind Production Duration Curve by Interval – Wind as a Percent of Load, 2012–2015
2.6.3. Wind Integration
Wind integration brings low cost generation to the SPP region but supports very little future
capacity needs. There are a number of operational issues in dealing with substantial wind
capacity. Wind energy output varies by season and time of day. This variability is estimated to be
about three times more than load when measured on an hour-to-hour basis. Moreover, wind is
counter-cyclical to load. As load increases (both seasonally and daily), wind production typically
declines. The increasing magnitude of wind since 2007, along with the concentration, volatility,
and timeliness of wind, can create challenges for grid operators with regard to managing
transmission congestion and resolution of ramp constraints.
Prior to SPP’s Integrated Marketplace, Dispatchable Variable Energy Resources (DVERs) were
only subject to curtailment in the Energy Imbalance Service Market (EIS) based on impacts to a
constraint and transmission service priority. Implementation of the SPP Integrated Marketplace
starting in March 2014 introduced rules where DVERs would receive dispatch instructions based
on offers and LMP, in a manner similar to other dispatchable resources. At the start of the
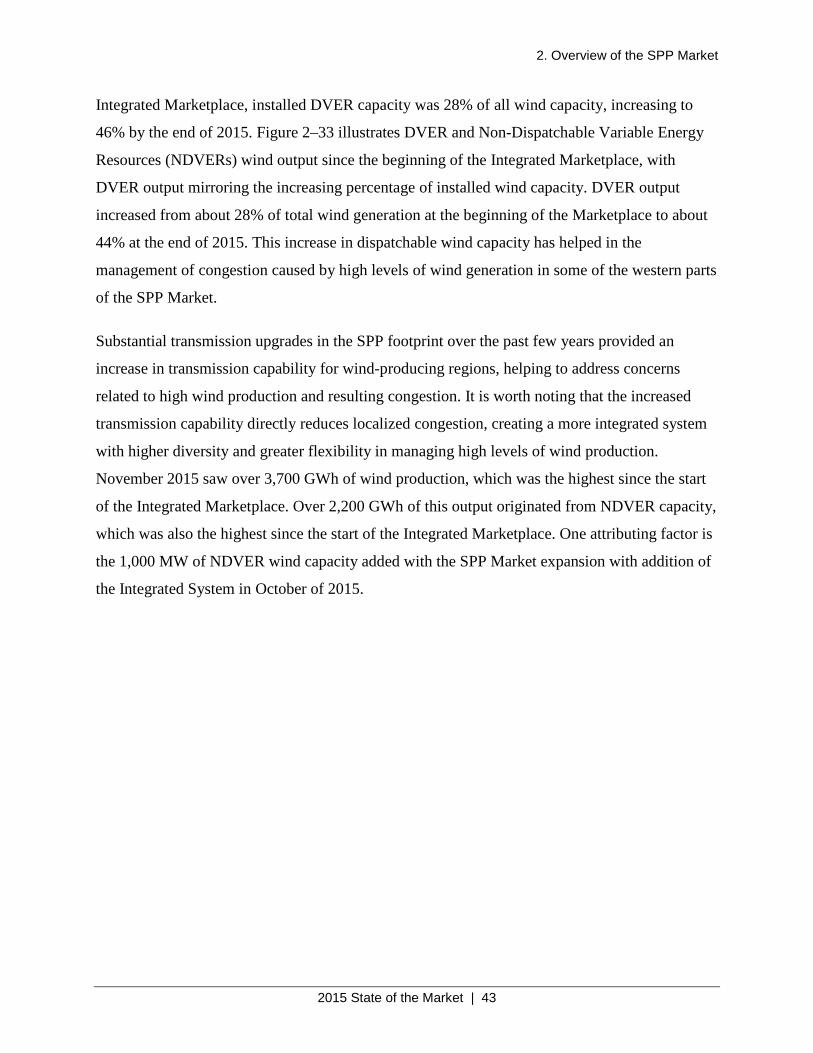
2. Overview of the SPP Market
2015 State of the Market | 43
Integrated Marketplace, installed DVER capacity was 28% of all wind capacity, increasing to
46% by the end of 2015. Figure 2–33 illustrates DVER and Non-Dispatchable Variable Energy
Resources (NDVERs) wind output since the beginning of the Integrated Marketplace, with
DVER output mirroring the increasing percentage of installed wind capacity. DVER output
increased from about 28% of total wind generation at the beginning of the Marketplace to about
44% at the end of 2015. This increase in dispatchable wind capacity has helped in the
management of congestion caused by high levels of wind generation in some of the western parts
of the SPP Market.
Substantial transmission upgrades in the SPP footprint over the past few years provided an
increase in transmission capability for wind-producing regions, helping to address concerns
related to high wind production and resulting congestion. It is worth noting that the increased
transmission capability directly reduces localized congestion, creating a more integrated system
with higher diversity and greater flexibility in managing high levels of wind production.
November 2015 saw over 3,700 GWh of wind production, which was the highest since the start
of the Integrated Marketplace. Over 2,200 GWh of this output originated from NDVER capacity,
which was also the highest since the start of the Integrated Marketplace. One attributing factor is
the 1,000 MW of NDVER wind capacity added with the SPP Market expansion with addition of
the Integrated System in October of 2015.
2. Overview of the SPP Market
2015 State of the Market | 44
Figure 2–33 Wind Generation by Month, 2014–2015
In the SPP Market, wind and other qualifying resources were allowed to register as NDVER,
provided the resource had an interconnection agreement executed by May 21, 2011 and was
commercially operated prior to October 15, 2012. Because more than half of the existing
installed wind capacity is composed of NDVERs, grid operators must still issue manual dispatch
instructions to reduce or limit their output at certain times. Figure 2–34 shows the number of
directives initiated during the last two years of the EIS Market and Out-of-Merit Energy
(OOME) instructions for wind resources during the first two years of the Integrated Marketplace.
These numbers include manual dispatch for both DVER and NDVERs, although most are for
NDVERs since March 2014. As expected, OOMEs are fewer during the lower wind output
months of summer. One area to note is that of the 264 instances in 2015, 178 (67%) of the
OOMEs are for a group of five NDVERs where transmission is limited, particularly during
periods when there are transmission outages in the area.
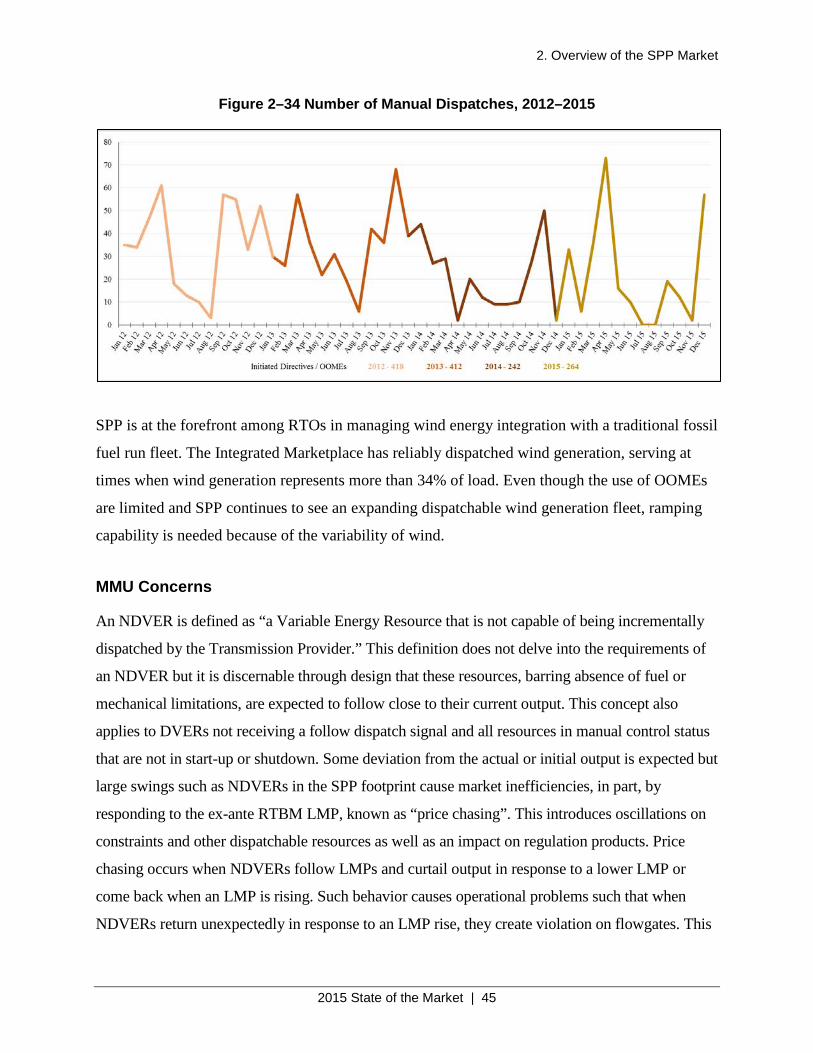
2. Overview of the SPP Market
2015 State of the Market | 45
Figure 2–34 Number of Manual Dispatches, 2012–2015
SPP is at the forefront among RTOs in managing wind energy integration with a traditional fossil
fuel run fleet. The Integrated Marketplace has reliably dispatched wind generation, serving at
times when wind generation represents more than 34% of load. Even though the use of OOMEs
are limited and SPP continues to see an expanding dispatchable wind generation fleet, ramping
capability is needed because of the variability of wind.
MMU Concerns
An NDVER is defined as “a Variable Energy Resource that is not capable of being incrementally
dispatched by the Transmission Provider.” This definition does not delve into the requirements of
an NDVER but it is discernable through design that these resources, barring absence of fuel or
mechanical limitations, are expected to follow close to their current output. This concept also
applies to DVERs not receiving a follow dispatch signal and all resources in manual control status
that are not in start-up or shutdown. Some deviation from the actual or initial output is expected but
large swings such as NDVERs in the SPP footprint cause market inefficiencies, in part, by
responding to the ex-ante RTBM LMP, known as “price chasing”. This introduces oscillations on
constraints and other dispatchable resources as well as an impact on regulation products. Price
chasing occurs when NDVERs follow LMPs and curtail output in response to a lower LMP or
come back when an LMP is rising. Such behavior causes operational problems such that when
NDVERs return unexpectedly in response to an LMP rise, they create violation on flowgates. This
2. Overview of the SPP Market
2015 State of the Market | 46
in turn causes more relief than necessary and SCED effectiveness declines. Other impacts include
additional volatility in RTBM, more regulation is needed, and more output is lost due to increased
regulation. As a result, OOMEs are issued to NDVERs, which means extra cost (uplift) to the
system, which translates into lower market efficiency.
In addition to the inefficiencies introduced to the market because of NDVERs’ price chasing
behavior, there are also inefficiencies introduced by NDVERs due to their being physically
incapable of responding to a dispatch or acting as “price takers”. These inefficiencies exist at times
when an NDVER is operating uneconomically even when considering any (state or federal)
subsidies or contract terms outside the market. This results in uneconomic production, which leads
to exacerbating transmission congestion and greater differences in price splits and price volatility.
MMU Recommendation - NDVER Transition to DVER Status
At the end of 2015, just over half of all registered wind capacity was NDVERs, which reduces
flexibility and/or results in resources “chasing” price. Although MMU does not deem NDVER
price chasing to be a direct Tariff violation behavior per se since there are no restrictive rules on
this behavior, the MMU does have a role to play in terms of addressing market inefficiencies
caused by suboptimal design features. For this reason, the MMU recommends SPP continue
discussions to transition NDVERs to DVER status and thereby lessen the negative impact of such
resources on the market, as discussed above.
3. Real-Time Balancing Market
2015 State of the Market | 47
3. Real-Time Balancing Market
The Real-Time Balancing Market (RTBM) is the real-time market for Energy, Regulation-Up
Service, Regulation-Down Service, Spinning Reserves, and Supplemental Reserves. The RTBM
algorithm co-optimizes the clearing of energy and operating reserve products out of the available
capacity. The RTBM clears every five minutes for all products. The settlement of the RTBM
also occurs at the five-minute level, and the settlement is based on Market Participants’
deviations from their day-ahead positions.
Prior to the start of the Integrated Marketplace and the SPP Centralized Balancing Authority
(CBA), SPP was composed of 16 distinct balancing authorities, and the participants in the SPP
real-time market, the Energy Imbalance Service (EIS) Market, made their own commitment
decisions. The CBA and the Integrated Marketplace, as implemented on March 1, 2014, provide
cost savings through the efficiency gains of an auction-based market mechanism combined with
a centralized unit commitment process.
Figure 3–1 shows that in the first year of the market SPP reduced the online capacity about 10%
below what was committed in the EIS Market. It appears that capacity commitment as a percent
of load has been increasing during 2015, thereby reducing the savings achieved in 2014. Changes
in the SPP Market in 2015 that may be driving a higher level of online capacity are low gas
prices, coal plants self-committing, and higher levels of wind generation. All of these factors are
driving down system average prices but also driving up volatility and risk. Higher online
capacity levels may be an unintended consequence as individual plant owners and SPP
Operations adjust to these changes in market conditions that are resulting in a higher level of
volatility and risk. The MMU has indications that online capacity levels in 2016 are returning to
2014 levels.
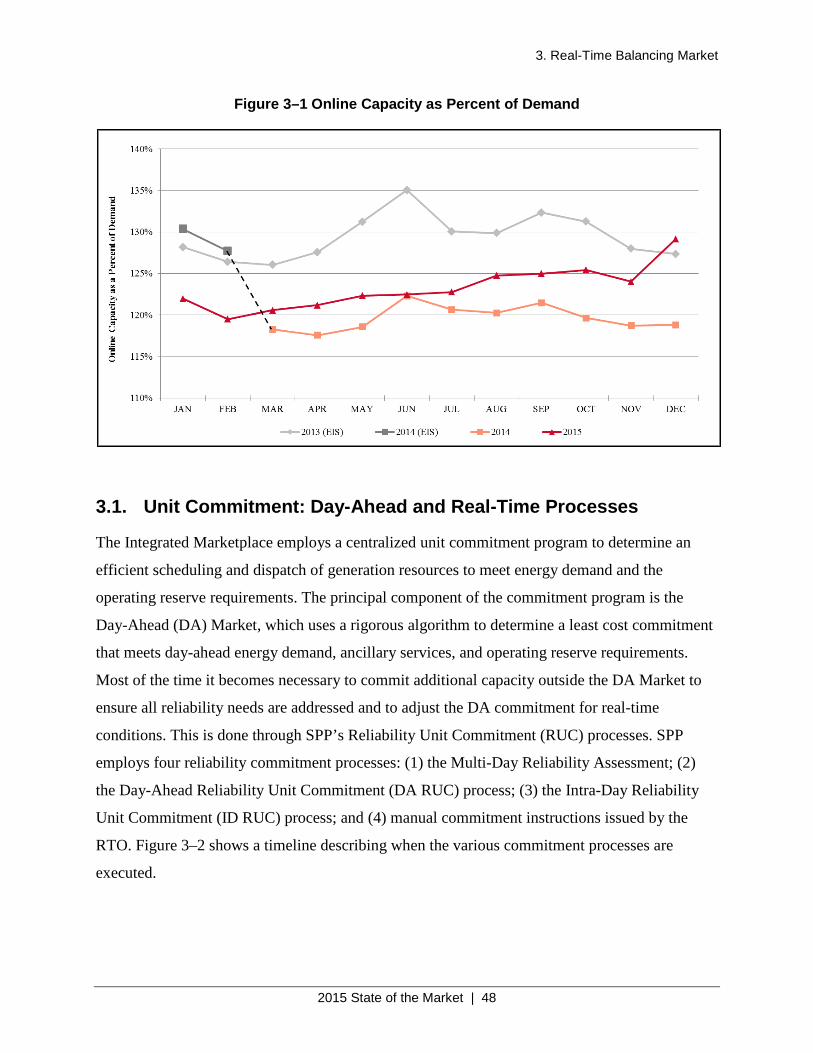
3. Real-Time Balancing Market
2015 State of the Market | 48
Figure 3–1 Online Capacity as Percent of Demand
3.1. Unit Commitment: Day-Ahead and Real-Time Processes
The Integrated Marketplace employs a centralized unit commitment program to determine an
efficient scheduling and dispatch of generation resources to meet energy demand and the
operating reserve requirements. The principal component of the commitment program is the
Day-Ahead (DA) Market, which uses a rigorous algorithm to determine a least cost commitment
that meets day-ahead energy demand, ancillary services, and operating reserve requirements.
Most of the time it becomes necessary to commit additional capacity outside the DA Market to
ensure all reliability needs are addressed and to adjust the DA commitment for real-time
conditions. This is done through SPP’s Reliability Unit Commitment (RUC) processes. SPP
employs four reliability commitment processes: (1) the Multi-Day Reliability Assessment; (2)
the Day-Ahead Reliability Unit Commitment (DA RUC) process; (3) the Intra-Day Reliability
Unit Commitment (ID RUC) process; and (4) manual commitment instructions issued by the
RTO. Figure 3–2 shows a timeline describing when the various commitment processes are
executed.
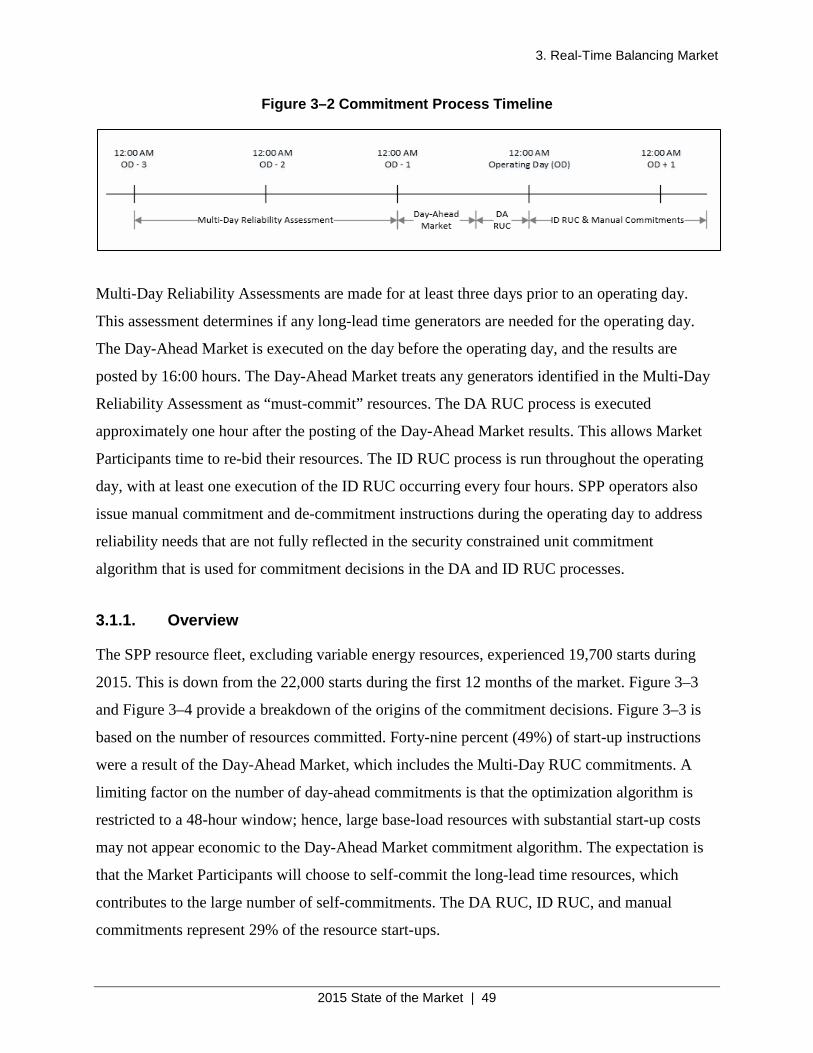
3. Real-Time Balancing Market
2015 State of the Market | 49
Figure 3–2 Commitment Process Timeline
Multi-Day Reliability Assessments are made for at least three days prior to an operating day.
This assessment determines if any long-lead time generators are needed for the operating day.
The Day-Ahead Market is executed on the day before the operating day, and the results are
posted by 16:00 hours. The Day-Ahead Market treats any generators identified in the Multi-Day
Reliability Assessment as “must-commit” resources. The DA RUC process is executed
approximately one hour after the posting of the Day-Ahead Market results. This allows Market
Participants time to re-bid their resources. The ID RUC process is run throughout the operating
day, with at least one execution of the ID RUC occurring every four hours. SPP operators also
issue manual commitment and de-commitment instructions during the operating day to address
reliability needs that are not fully reflected in the security constrained unit commitment
algorithm that is used for commitment decisions in the DA and ID RUC processes.
3.1.1. Overview
The SPP resource fleet, excluding variable energy resources, experienced 19,700 starts during
2015. This is down from the 22,000 starts during the first 12 months of the market. Figure 3–3
and Figure 3–4 provide a breakdown of the origins of the commitment decisions. Figure 3–3 is
based on the number of resources committed. Forty-nine percent (49%) of start-up instructions
were a result of the Day-Ahead Market, which includes the Multi-Day RUC commitments. A
limiting factor on the number of day-ahead commitments is that the optimization algorithm is
restricted to a 48-hour window; hence, large base-load resources with substantial start-up costs
may not appear economic to the Day-Ahead Market commitment algorithm. The expectation is
that the Market Participants will choose to self-commit the long-lead time resources, which
contributes to the large number of self-commitments. The DA RUC, ID RUC, and manual
commitments represent 29% of the resource start-ups.
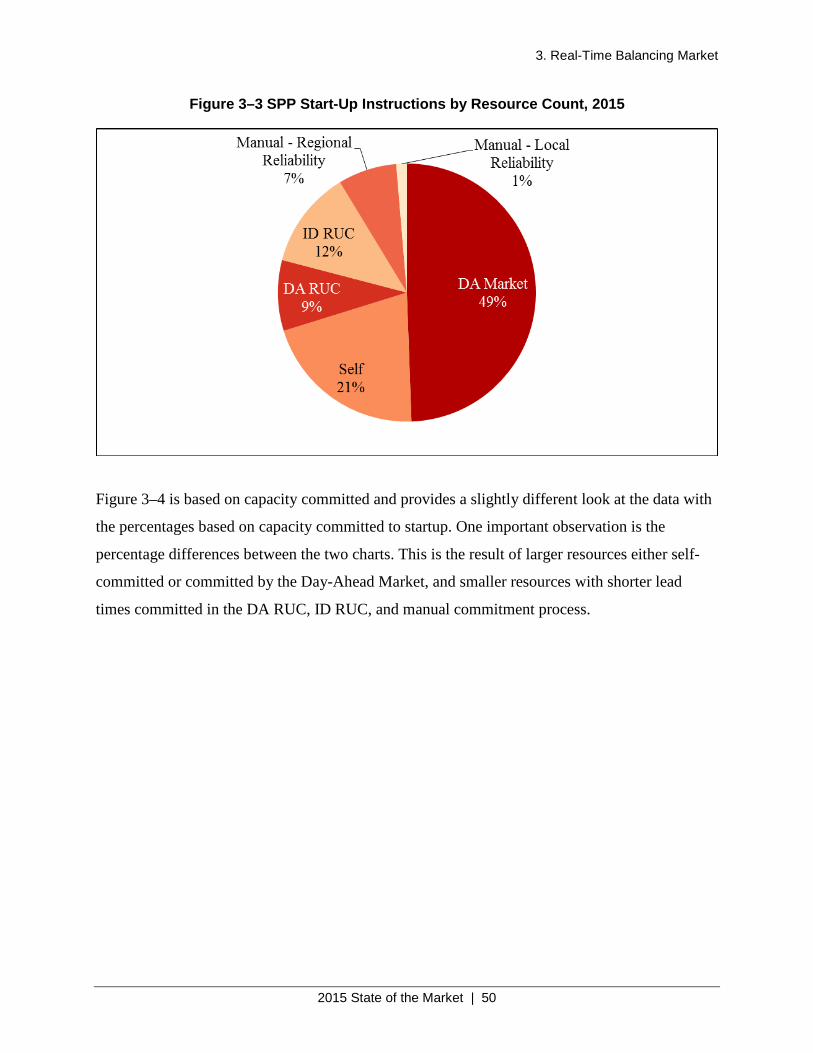
3. Real-Time Balancing Market
2015 State of the Market | 50
Figure 3–3 SPP Start-Up Instructions by Resource Count, 2015
Figure 3–4 is based on capacity committed and provides a slightly different look at the data with
the percentages based on capacity committed to startup. One important observation is the
percentage differences between the two charts. This is the result of larger resources either self-
committed or committed by the Day-Ahead Market, and smaller resources with shorter lead
times committed in the DA RUC, ID RUC, and manual commitment process.
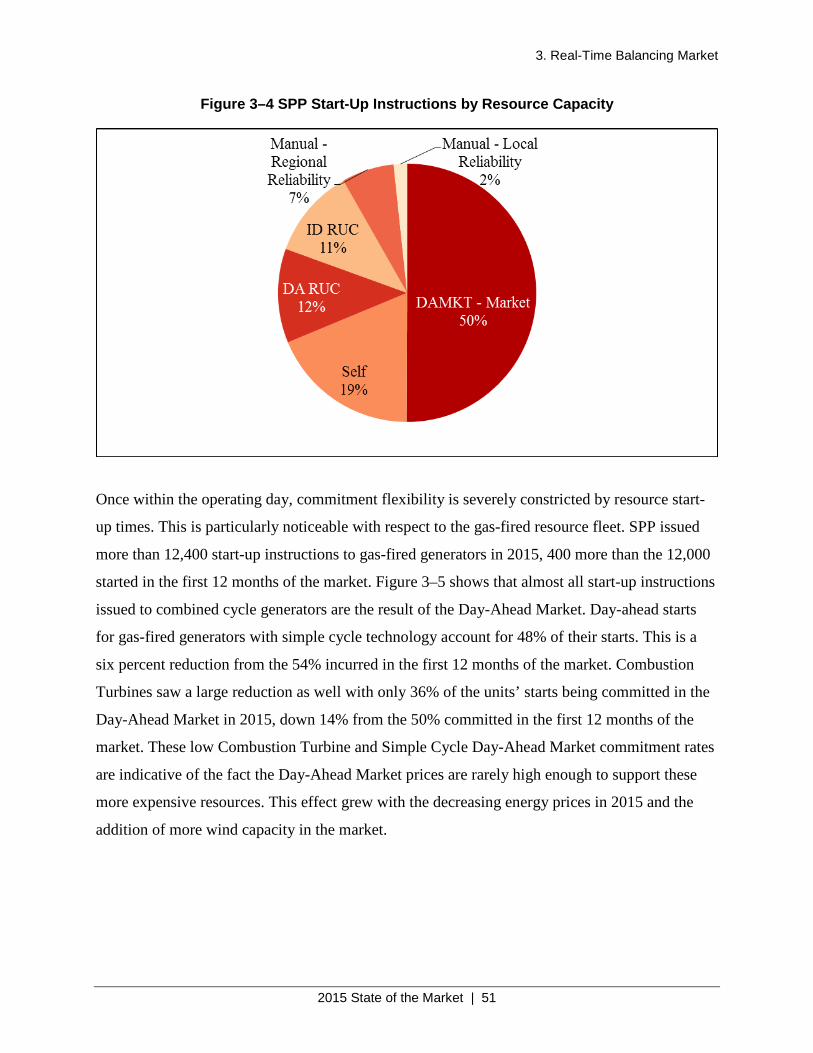
3. Real-Time Balancing Market
2015 State of the Market | 51
Figure 3–4 SPP Start-Up Instructions by Resource Capacity
Once within the operating day, commitment flexibility is severely constricted by resource start-
up times. This is particularly noticeable with respect to the gas-fired resource fleet. SPP issued
more than 12,400 start-up instructions to gas-fired generators in 2015, 400 more than the 12,000
started in the first 12 months of the market. Figure 3–5 shows that almost all start-up instructions
issued to combined cycle generators are the result of the Day-Ahead Market. Day-ahead starts
for gas-fired generators with simple cycle technology account for 48% of their starts. This is a
six percent reduction from the 54% incurred in the first 12 months of the market. Combustion
Turbines saw a large reduction as well with only 36% of the units’ starts being committed in the
Day-Ahead Market in 2015, down 14% from the 50% committed in the first 12 months of the
market. These low Combustion Turbine and Simple Cycle Day-Ahead Market commitment rates
are indicative of the fact the Day-Ahead Market prices are rarely high enough to support these
more expensive resources. This effect grew with the decreasing energy prices in 2015 and the
addition of more wind capacity in the market.
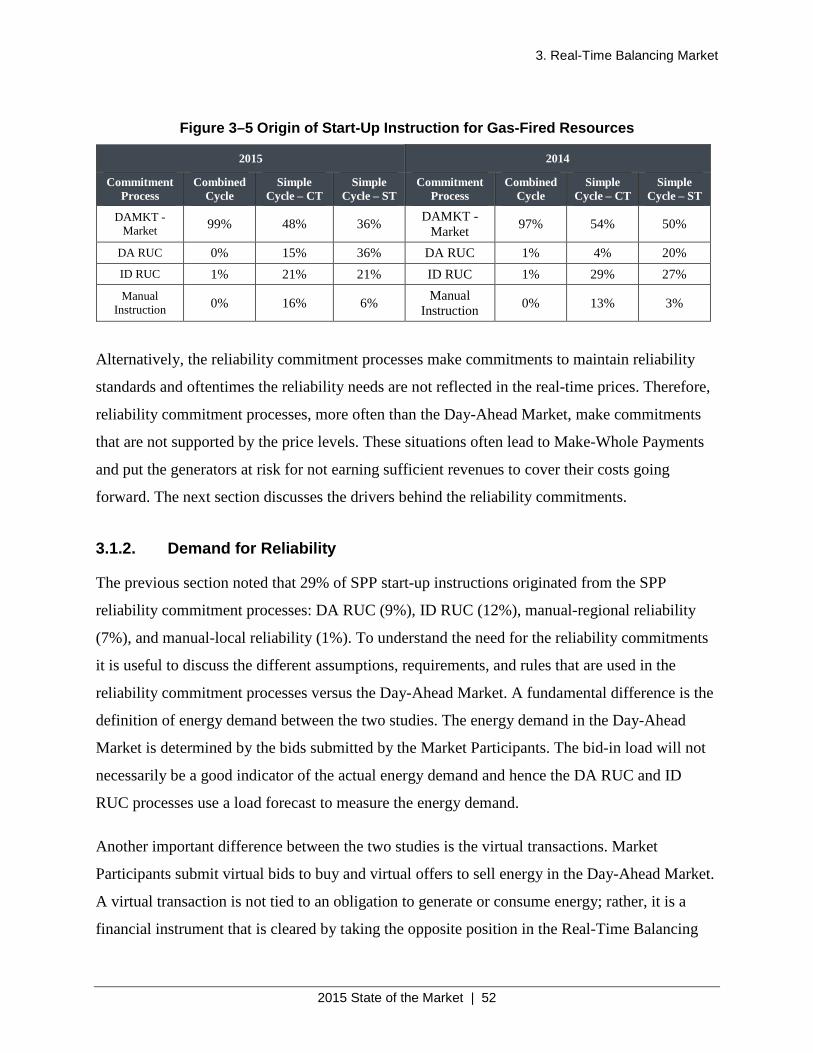
3. Real-Time Balancing Market
2015 State of the Market | 52
Figure 3–5 Origin of Start-Up Instruction for Gas-Fired Resources
2015 2014
Commitment Process
Combined Cycle
Simple Cycle – CT
Simple Cycle – ST
Commitment Process
Combined Cycle
Simple Cycle – CT
Simple Cycle – ST
DAMKT - Market 99% 48% 36% DAMKT -
Market 97% 54% 50%
DA RUC 0% 15% 36% DA RUC 1% 4% 20% ID RUC 1% 21% 21% ID RUC 1% 29% 27% Manual
Instruction 0% 16% 6% Manual Instruction 0% 13% 3%
Alternatively, the reliability commitment processes make commitments to maintain reliability
standards and oftentimes the reliability needs are not reflected in the real-time prices. Therefore,
reliability commitment processes, more often than the Day-Ahead Market, make commitments
that are not supported by the price levels. These situations often lead to Make-Whole Payments
and put the generators at risk for not earning sufficient revenues to cover their costs going
forward. The next section discusses the drivers behind the reliability commitments.
3.1.2. Demand for Reliability
The previous section noted that 29% of SPP start-up instructions originated from the SPP
reliability commitment processes: DA RUC (9%), ID RUC (12%), manual-regional reliability
(7%), and manual-local reliability (1%). To understand the need for the reliability commitments
it is useful to discuss the different assumptions, requirements, and rules that are used in the
reliability commitment processes versus the Day-Ahead Market. A fundamental difference is the
definition of energy demand between the two studies. The energy demand in the Day-Ahead
Market is determined by the bids submitted by the Market Participants. The bid-in load will not
necessarily be a good indicator of the actual energy demand and hence the DA RUC and ID
RUC processes use a load forecast to measure the energy demand.
Another important difference between the two studies is the virtual transactions. Market
Participants submit virtual bids to buy and virtual offers to sell energy in the Day-Ahead Market.
A virtual transaction is not tied to an obligation to generate or consume energy; rather, it is a
financial instrument that is cleared by taking the opposite position in the Real-Time Balancing
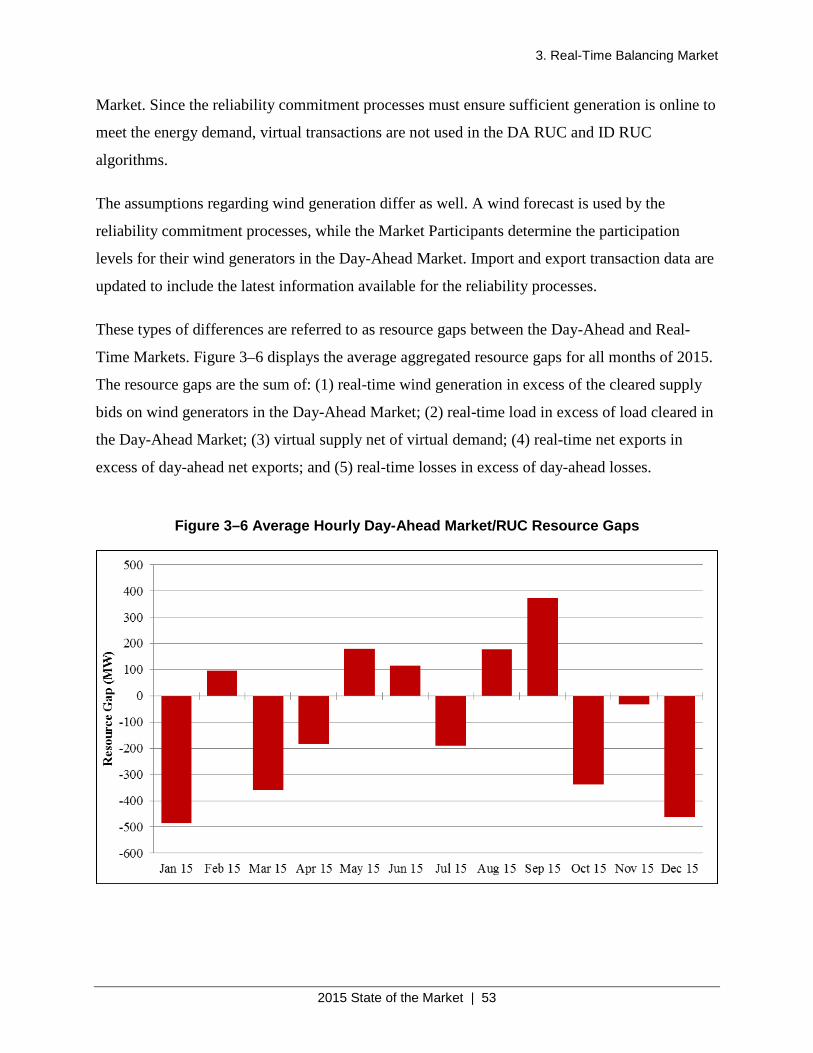
3. Real-Time Balancing Market
2015 State of the Market | 53
Market. Since the reliability commitment processes must ensure sufficient generation is online to
meet the energy demand, virtual transactions are not used in the DA RUC and ID RUC
algorithms.
The assumptions regarding wind generation differ as well. A wind forecast is used by the
reliability commitment processes, while the Market Participants determine the participation
levels for their wind generators in the Day-Ahead Market. Import and export transaction data are
updated to include the latest information available for the reliability processes.
These types of differences are referred to as resource gaps between the Day-Ahead and Real-
Time Markets. Figure 3–6 displays the average aggregated resource gaps for all months of 2015.
The resource gaps are the sum of: (1) real-time wind generation in excess of the cleared supply
bids on wind generators in the Day-Ahead Market; (2) real-time load in excess of load cleared in
the Day-Ahead Market; (3) virtual supply net of virtual demand; (4) real-time net exports in
excess of day-ahead net exports; and (5) real-time losses in excess of day-ahead losses.
Figure 3–6 Average Hourly Day-Ahead Market/RUC Resource Gaps
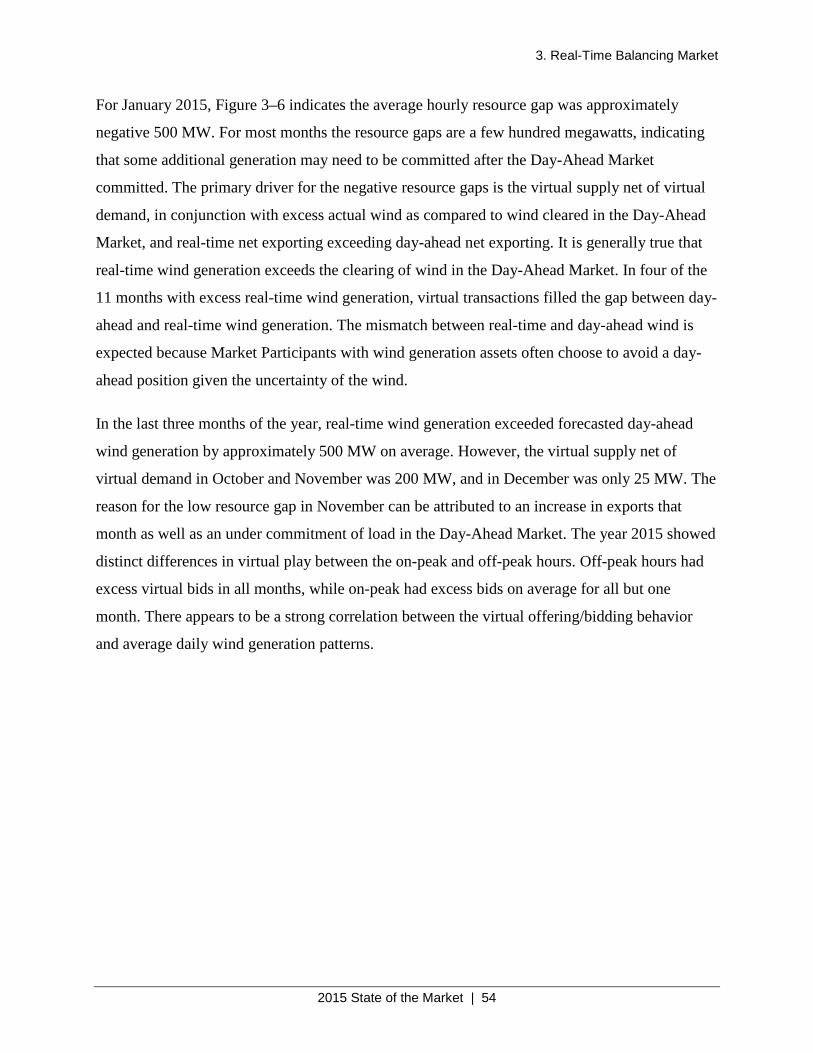
3. Real-Time Balancing Market
2015 State of the Market | 54
For January 2015, Figure 3–6 indicates the average hourly resource gap was approximately
negative 500 MW. For most months the resource gaps are a few hundred megawatts, indicating
that some additional generation may need to be committed after the Day-Ahead Market
committed. The primary driver for the negative resource gaps is the virtual supply net of virtual
demand, in conjunction with excess actual wind as compared to wind cleared in the Day-Ahead
Market, and real-time net exporting exceeding day-ahead net exporting. It is generally true that
real-time wind generation exceeds the clearing of wind in the Day-Ahead Market. In four of the
11 months with excess real-time wind generation, virtual transactions filled the gap between day-
ahead and real-time wind generation. The mismatch between real-time and day-ahead wind is
expected because Market Participants with wind generation assets often choose to avoid a day-
ahead position given the uncertainty of the wind.
In the last three months of the year, real-time wind generation exceeded forecasted day-ahead
wind generation by approximately 500 MW on average. However, the virtual supply net of
virtual demand in October and November was 200 MW, and in December was only 25 MW. The
reason for the low resource gap in November can be attributed to an increase in exports that
month as well as an under commitment of load in the Day-Ahead Market. The year 2015 showed
distinct differences in virtual play between the on-peak and off-peak hours. Off-peak hours had
excess virtual bids in all months, while on-peak had excess bids on average for all but one
month. There appears to be a strong correlation between the virtual offering/bidding behavior
and average daily wind generation patterns.
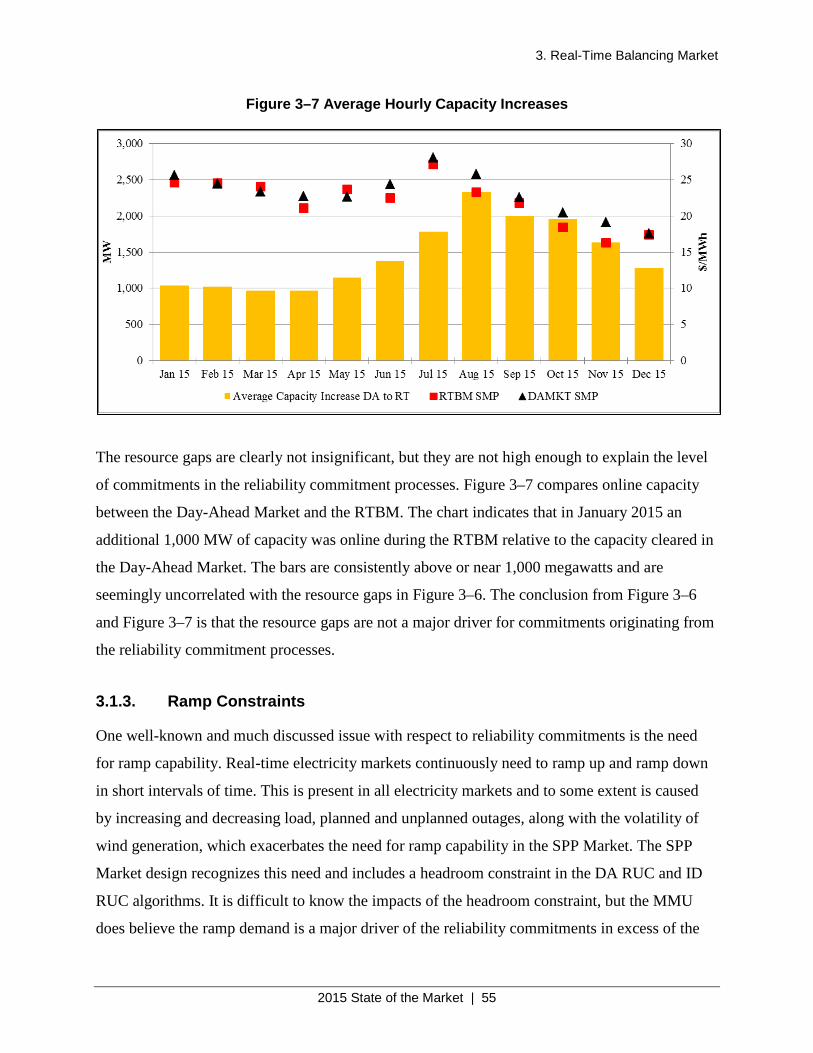
3. Real-Time Balancing Market
2015 State of the Market | 55
Figure 3–7 Average Hourly Capacity Increases
The resource gaps are clearly not insignificant, but they are not high enough to explain the level
of commitments in the reliability commitment processes. Figure 3–7 compares online capacity
between the Day-Ahead Market and the RTBM. The chart indicates that in January 2015 an
additional 1,000 MW of capacity was online during the RTBM relative to the capacity cleared in
the Day-Ahead Market. The bars are consistently above or near 1,000 megawatts and are
seemingly uncorrelated with the resource gaps in Figure 3–6. The conclusion from Figure 3–6
and Figure 3–7 is that the resource gaps are not a major driver for commitments originating from
the reliability commitment processes.
3.1.3. Ramp Constraints
One well-known and much discussed issue with respect to reliability commitments is the need
for ramp capability. Real-time electricity markets continuously need to ramp up and ramp down
in short intervals of time. This is present in all electricity markets and to some extent is caused
by increasing and decreasing load, planned and unplanned outages, along with the volatility of
wind generation, which exacerbates the need for ramp capability in the SPP Market. The SPP
Market design recognizes this need and includes a headroom constraint in the DA RUC and ID
RUC algorithms. It is difficult to know the impacts of the headroom constraint, but the MMU
does believe the ramp demand is a major driver of the reliability commitments in excess of the
3. Real-Time Balancing Market
2015 State of the Market | 56
resource gaps. What is not clear is if these commitments are resulting from the headroom
constraint in the DA RUC and ID RUC algorithms or rather from the manual commitment
process whereby they show up in the data as manual commitments for regional reliability.
The issue with ramp procurement is a problem in all of the ISOs/RTOs in the United States and
was a topic in the price formation workshops held by the FERC in 2014. Resources committed to
provide additional capacity for ramp capability, whether as a result of applying the headroom
constraint in a reliability commitment algorithm or a manual process, depress the real-time price
signals. The cost of bringing the resource online is not reflected in the real-time prices, and often
the real-time prices will not be high enough for the resource to recover its operating costs.
Figure 3–7 above shows the average system marginal price (SMP) for both the Day-Ahead and
Real-Time Markets. For 2015, the day-ahead SMP exceeds the real-time SMP by $1/MWh, and
is higher by almost $3/MWh in some months. Many factors contribute to the price differences
between day-ahead and real-time prices, and it is difficult to quantify the impacts of the
reliability commitments on the real-time prices. Nevertheless, the direction of the impact is clear:
reliability commitments dampen the real-time price signals. Several ISOs/RTOs, including SPP,
are currently studying the possibility of adding a ramping product to their array of ancillary
service products and the MMU supports this effort.
3.1.4. Quick-Start Resources Commitment
A Quick-Start Resource is defined by SPP as a resource that can be started, synchronized, and
start injecting energy within 10 minutes of SPP notification. The Market Monitoring database
indicates that in 2015 the SPP generation fleet included 74 resources that met the 10-minute
start-up time requirement for quick-start capability. The total capacity for the quick-start capable
resources totals 3,100 MW and consists of a mix of gas-fired, hydro, and oil-fired generators.
During 2015 the reliability commitment processes committed 61 of the 74 quick-start capable
resources. Ten additional resources submitted real-time bids with cold start-up times less than or
equal to 10 minutes and were also committed by the DA RUC or ID RUC processes. Figure 3–8
summarizes the start-up instructions issued to resources with real-time bids indicating a 10-
minute start-up capability. In 2015, 541 start instructions originated in a reliability commitment
process, 2,660 start instructions originated from the Day-Ahead Market, and 747 were manually
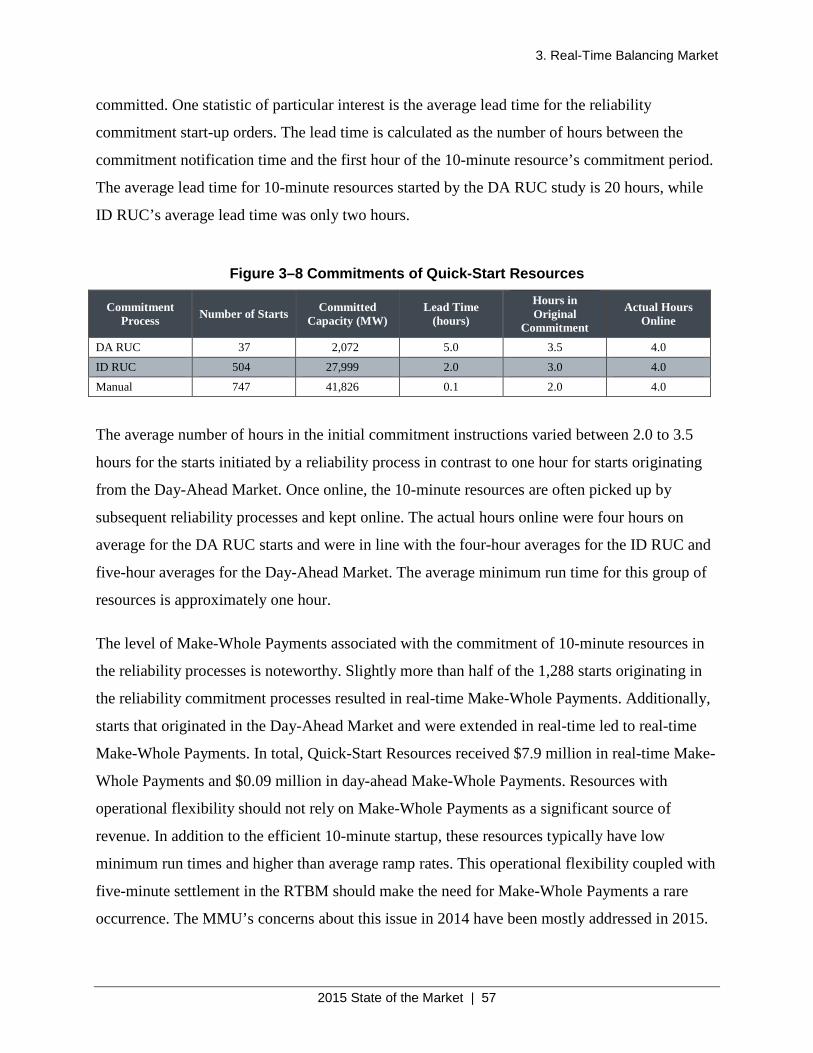
3. Real-Time Balancing Market
2015 State of the Market | 57
committed. One statistic of particular interest is the average lead time for the reliability
commitment start-up orders. The lead time is calculated as the number of hours between the
commitment notification time and the first hour of the 10-minute resource’s commitment period.
The average lead time for 10-minute resources started by the DA RUC study is 20 hours, while
ID RUC’s average lead time was only two hours.
Figure 3–8 Commitments of Quick-Start Resources
Commitment Process Number of Starts Committed
Capacity (MW) Lead Time
(hours)
Hours in Original
Commitment
Actual Hours Online
DA RUC 37 2,072 5.0 3.5 4.0
ID RUC 504 27,999 2.0 3.0 4.0
Manual 747 41,826 0.1 2.0 4.0
The average number of hours in the initial commitment instructions varied between 2.0 to 3.5
hours for the starts initiated by a reliability process in contrast to one hour for starts originating
from the Day-Ahead Market. Once online, the 10-minute resources are often picked up by
subsequent reliability processes and kept online. The actual hours online were four hours on
average for the DA RUC starts and were in line with the four-hour averages for the ID RUC and
five-hour averages for the Day-Ahead Market. The average minimum run time for this group of
resources is approximately one hour.
The level of Make-Whole Payments associated with the commitment of 10-minute resources in
the reliability processes is noteworthy. Slightly more than half of the 1,288 starts originating in
the reliability commitment processes resulted in real-time Make-Whole Payments. Additionally,
starts that originated in the Day-Ahead Market and were extended in real-time led to real-time
Make-Whole Payments. In total, Quick-Start Resources received $7.9 million in real-time Make-
Whole Payments and $0.09 million in day-ahead Make-Whole Payments. Resources with
operational flexibility should not rely on Make-Whole Payments as a significant source of
revenue. In addition to the efficient 10-minute startup, these resources typically have low
minimum run times and higher than average ramp rates. This operational flexibility coupled with
five-minute settlement in the RTBM should make the need for Make-Whole Payments a rare
occurrence. The MMU’s concerns about this issue in 2014 have been mostly addressed in 2015.
3. Real-Time Balancing Market
2015 State of the Market | 58
There appears to be significant opportunity to improve the commitment efficiency of Quick-Start
Resources. Committing these resources hours ahead of the actual start time, sometimes more
than a day, ignores the value of their flexible capability. The value of flexibility, the optionality
value of waiting, is prevalent throughout markets, and the long lead-time commitment far
exceeding the 10-minute requirement of these resources by the system operator ignores this
value.
The Integrated Marketplace Protocols Section 4.4.2.3.1 describes the RTBM dispatch of
resources with quick-start capability. However, the ability for the system operator to optimally
deploy the Quick-Start Resources appears to be hampered by concerns that the Quick-Start
Resources will not perform when needed. Uncertainty as to the resources’ true capabilities
contributes to these concerns. There is also a system issue contributing to the inefficient
commitment of 10-minute resources. The issue is that the automated reliability commitment
processes, the DA RUC and ID RUC, are unable to account for resources participating in the
RTBM as quick-start ready resources, and therefore unable to adjust the online capacity
calculations to reflect the additional capacity available for dispatch. Without changes to the
system, a manual workaround must be used to track the quick-start capacity available in the
RTBM.
In May 2015, RTO staff presented a new design proposal that was well received by stakeholders.
Subsequently, this proposal was submitted to the Market Working Group (MWG) by a Market
Participant12 and was approved in September 2015. In January 2016, the MWG also formed a
Price Formation Task Force (PFTF) “to evaluate the efficiency and transparency of Energy and
Operating Reserve pricing” and is expected to complete its tasks by the end of 2016.13
12 Revision Request 116 “Quick-Start Real-Time Commitment” received all the necessary approvals from the various SPP committees and, as of May 2016, is awaiting FERC filing and implementation. 13 PFTF Charter, January 19, 2016 available at http://www.spp.org/organizational-groups/board-of-directorsmembers-committee/markets-and-operations-policy-committee/market-working-group/price-formation-task-force/.
3. Real-Time Balancing Market
2015 State of the Market | 59
The new quick-start design is expected to be implemented by the latter half of 2017. The new
quick-start logic was developed to address the following concerns:
• Quick-Start Resources (QSRs) should not be physically committed prior to RTBM,
even for a day-ahead position, and therefore QSRs should be allowed to be dispatched
from an offline state in real-time.
• QSRs’ parameters should be respected (Econ Min, Min Run Time, Min Down Time,
etc.).
• QSRs should have a clear shutdown process.
• RTBM should automatically roll up a QSR offer.
• QSRs should be Make-Whole Payments eligible for their Minimum Run Time.
A registered QSR will not receive a physical commitment before real-time unless it is for a
reliability reason. If a QSR is committed, it must start at its communicated start time. If a QSR is
offered in the Day-Ahead Market, then it will receive a physical commitment if cleared in real-
time. Market Participants may use virtual offers in the Day-Ahead Market to take a day-ahead
position. For real-time operations, ID RUC or Short-Term RUC (introduced in April 2016) will
determine if the QSR is needed for reliability, needed for economic reasons, or not needed at all.
If the QSR is needed for reliability, it will receive a physical commitment. If it is needed for
economic reasons, then it may receive economic dispatch instructions in real-time and will
receive a real-time physical commitment following an online dispatch by RTBM. If it is not
needed at all, the unit will not be dispatched in real-time.
Figure 3–13 shows the percent of time Quick-Start Resources generated power when the LMP
was higher than their offer. For the first 12 months of the Integrated Marketplace, Quick-Start
Resources were dispatched during intervals where the LMP was above the marginal production
cost for just over half of the power produced. In May of 2014, 60% of the time Quick-Start
Resources on average were generating power when the price was below their offer. During 2015,
over two-thirds of MWh produced by Quick-Start Resources were with LMP above real-time
energy offers. This is consistent with relative relationship of offers to LMP for the balance of the
SPP fleet that is represented by the line in the figure below. The Market Monitors recognize this
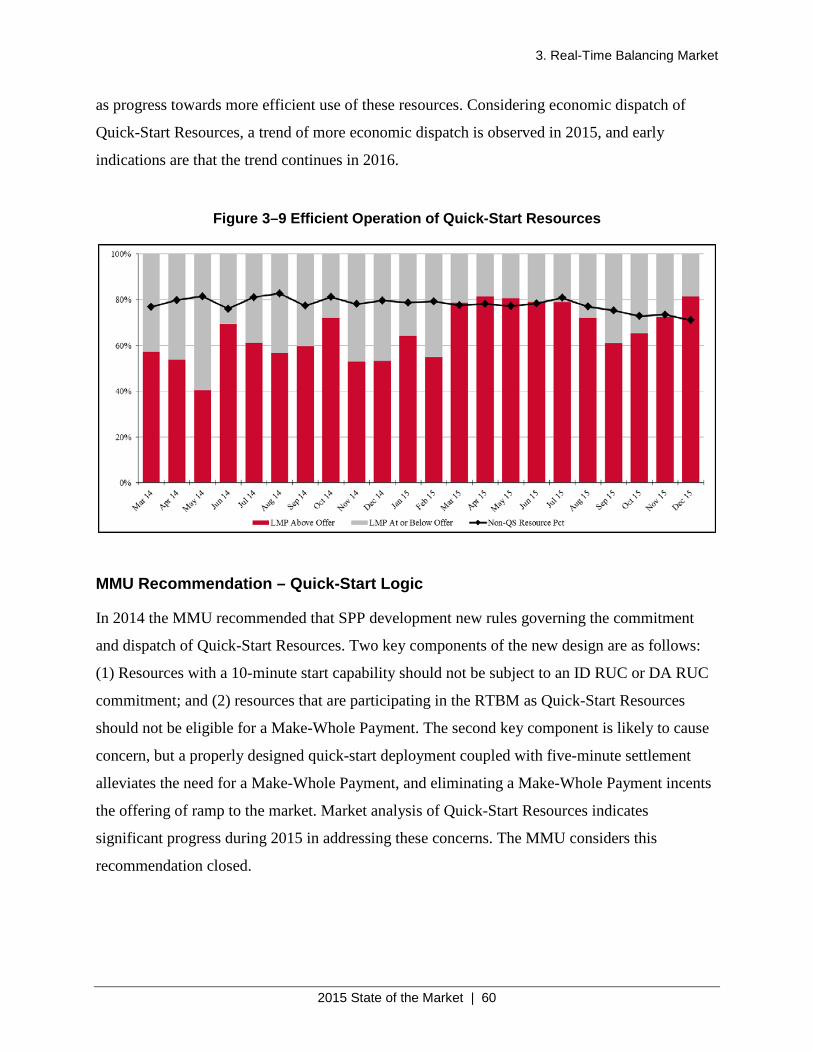
3. Real-Time Balancing Market
2015 State of the Market | 60
as progress towards more efficient use of these resources. Considering economic dispatch of
Quick-Start Resources, a trend of more economic dispatch is observed in 2015, and early
indications are that the trend continues in 2016.
Figure 3–9 Efficient Operation of Quick-Start Resources
MMU Recommendation – Quick-Start Logic
In 2014 the MMU recommended that SPP development new rules governing the commitment
and dispatch of Quick-Start Resources. Two key components of the new design are as follows:
(1) Resources with a 10-minute start capability should not be subject to an ID RUC or DA RUC
commitment; and (2) resources that are participating in the RTBM as Quick-Start Resources
should not be eligible for a Make-Whole Payment. The second key component is likely to cause
concern, but a properly designed quick-start deployment coupled with five-minute settlement
alleviates the need for a Make-Whole Payment, and eliminating a Make-Whole Payment incents
the offering of ramp to the market. Market analysis of Quick-Start Resources indicates
significant progress during 2015 in addressing these concerns. The MMU considers this
recommendation closed.
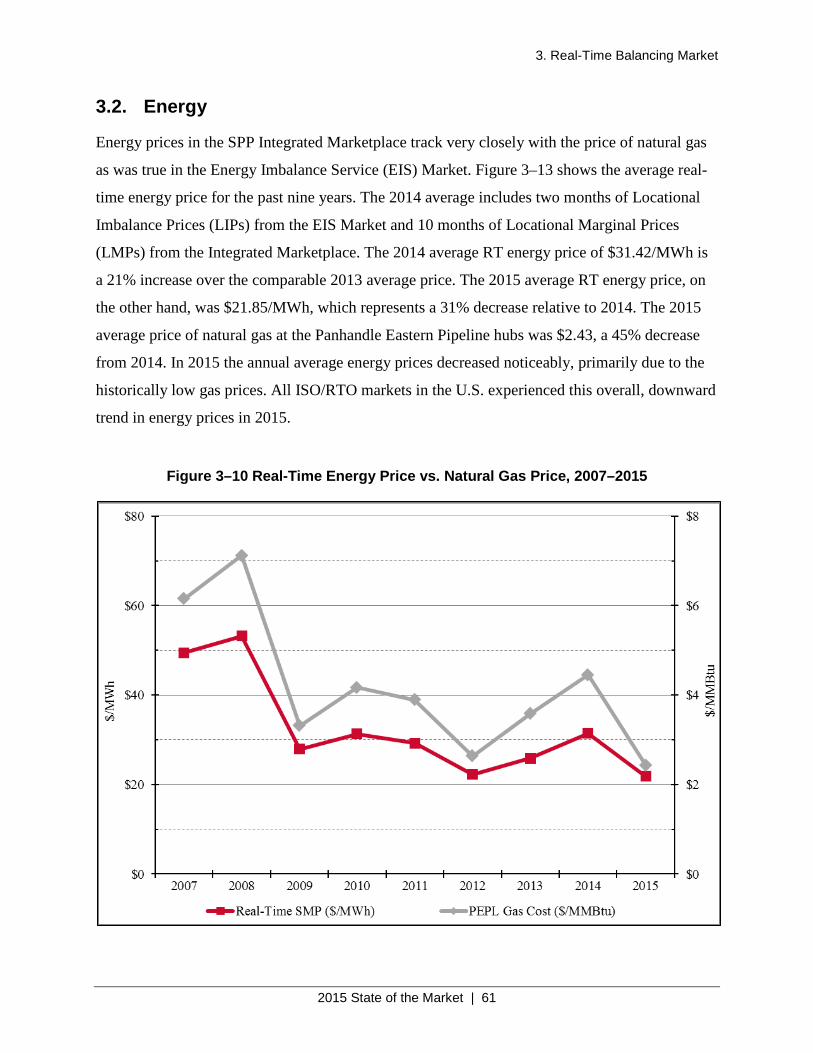
3. Real-Time Balancing Market
2015 State of the Market | 61
3.2. Energy
Energy prices in the SPP Integrated Marketplace track very closely with the price of natural gas
as was true in the Energy Imbalance Service (EIS) Market. Figure 3–13 shows the average real-
time energy price for the past nine years. The 2014 average includes two months of Locational
Imbalance Prices (LIPs) from the EIS Market and 10 months of Locational Marginal Prices
(LMPs) from the Integrated Marketplace. The 2014 average RT energy price of $31.42/MWh is
a 21% increase over the comparable 2013 average price. The 2015 average RT energy price, on
the other hand, was $21.85/MWh, which represents a 31% decrease relative to 2014. The 2015
average price of natural gas at the Panhandle Eastern Pipeline hubs was $2.43, a 45% decrease
from 2014. In 2015 the annual average energy prices decreased noticeably, primarily due to the
historically low gas prices. All ISO/RTO markets in the U.S. experienced this overall, downward
trend in energy prices in 2015.
Figure 3–10 Real-Time Energy Price vs. Natural Gas Price, 2007–2015
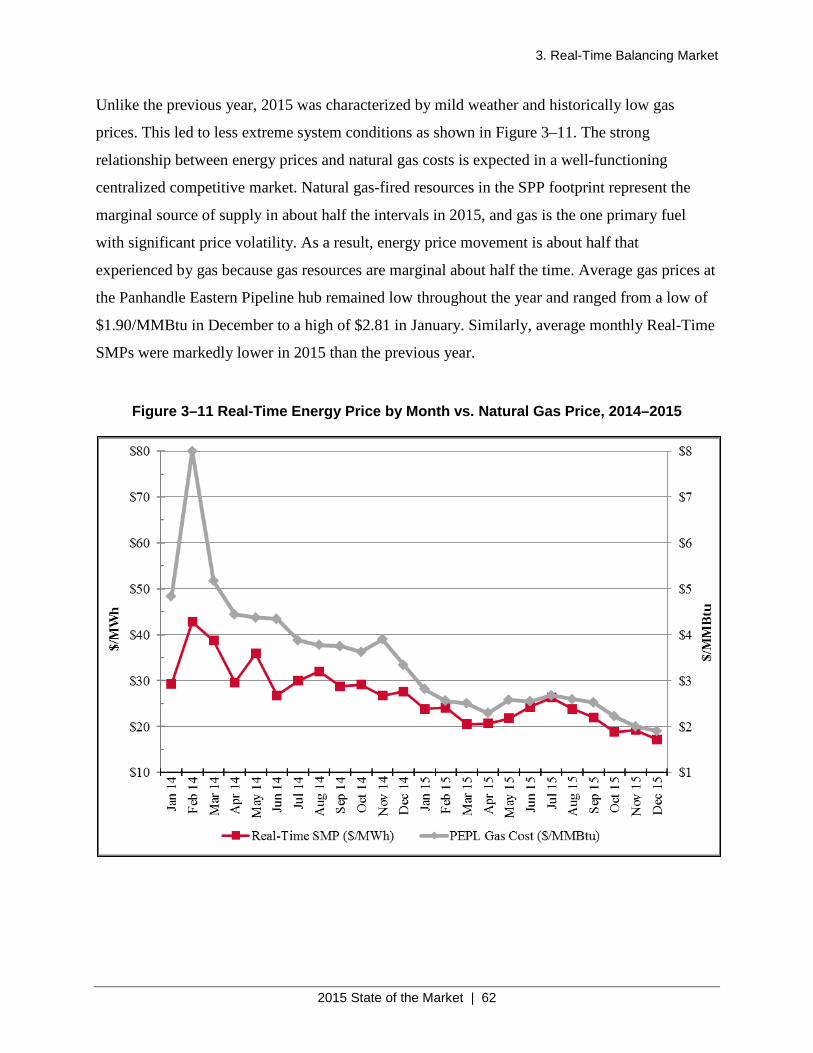
3. Real-Time Balancing Market
2015 State of the Market | 62
Unlike the previous year, 2015 was characterized by mild weather and historically low gas
prices. This led to less extreme system conditions as shown in Figure 3–11. The strong
relationship between energy prices and natural gas costs is expected in a well-functioning
centralized competitive market. Natural gas-fired resources in the SPP footprint represent the
marginal source of supply in about half the intervals in 2015, and gas is the one primary fuel
with significant price volatility. As a result, energy price movement is about half that
experienced by gas because gas resources are marginal about half the time. Average gas prices at
the Panhandle Eastern Pipeline hub remained low throughout the year and ranged from a low of
$1.90/MMBtu in December to a high of $2.81 in January. Similarly, average monthly Real-Time
SMPs were markedly lower in 2015 than the previous year.
Figure 3–11 Real-Time Energy Price by Month vs. Natural Gas Price, 2014–2015
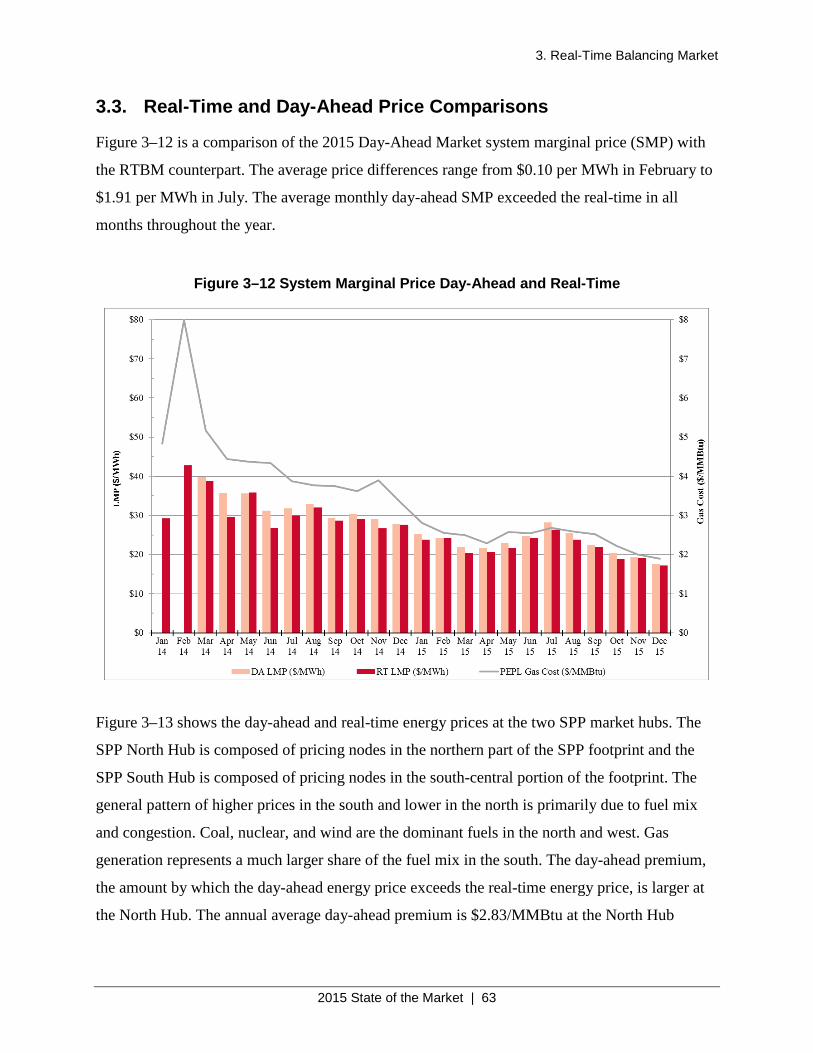
3. Real-Time Balancing Market
2015 State of the Market | 63
3.3. Real-Time and Day-Ahead Price Comparisons
Figure 3–12 is a comparison of the 2015 Day-Ahead Market system marginal price (SMP) with
the RTBM counterpart. The average price differences range from $0.10 per MWh in February to
$1.91 per MWh in July. The average monthly day-ahead SMP exceeded the real-time in all
months throughout the year.
Figure 3–12 System Marginal Price Day-Ahead and Real-Time
Figure 3–13 shows the day-ahead and real-time energy prices at the two SPP market hubs. The
SPP North Hub is composed of pricing nodes in the northern part of the SPP footprint and the
SPP South Hub is composed of pricing nodes in the south-central portion of the footprint. The
general pattern of higher prices in the south and lower in the north is primarily due to fuel mix
and congestion. Coal, nuclear, and wind are the dominant fuels in the north and west. Gas
generation represents a much larger share of the fuel mix in the south. The day-ahead premium,
the amount by which the day-ahead energy price exceeds the real-time energy price, is larger at
the North Hub. The annual average day-ahead premium is $2.83/MMBtu at the North Hub
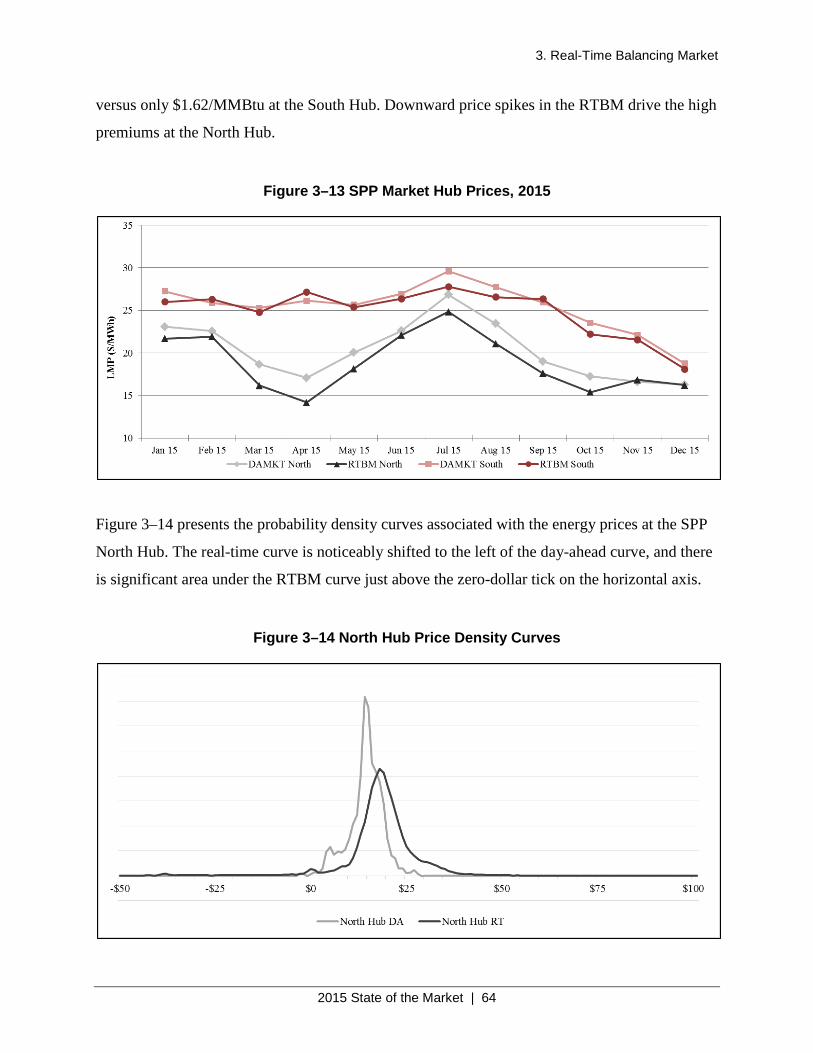
3. Real-Time Balancing Market
2015 State of the Market | 64
versus only $1.62/MMBtu at the South Hub. Downward price spikes in the RTBM drive the high
premiums at the North Hub.
Figure 3–13 SPP Market Hub Prices, 2015
Figure 3–14 presents the probability density curves associated with the energy prices at the SPP
North Hub. The real-time curve is noticeably shifted to the left of the day-ahead curve, and there
is significant area under the RTBM curve just above the zero-dollar tick on the horizontal axis.
Figure 3–14 North Hub Price Density Curves
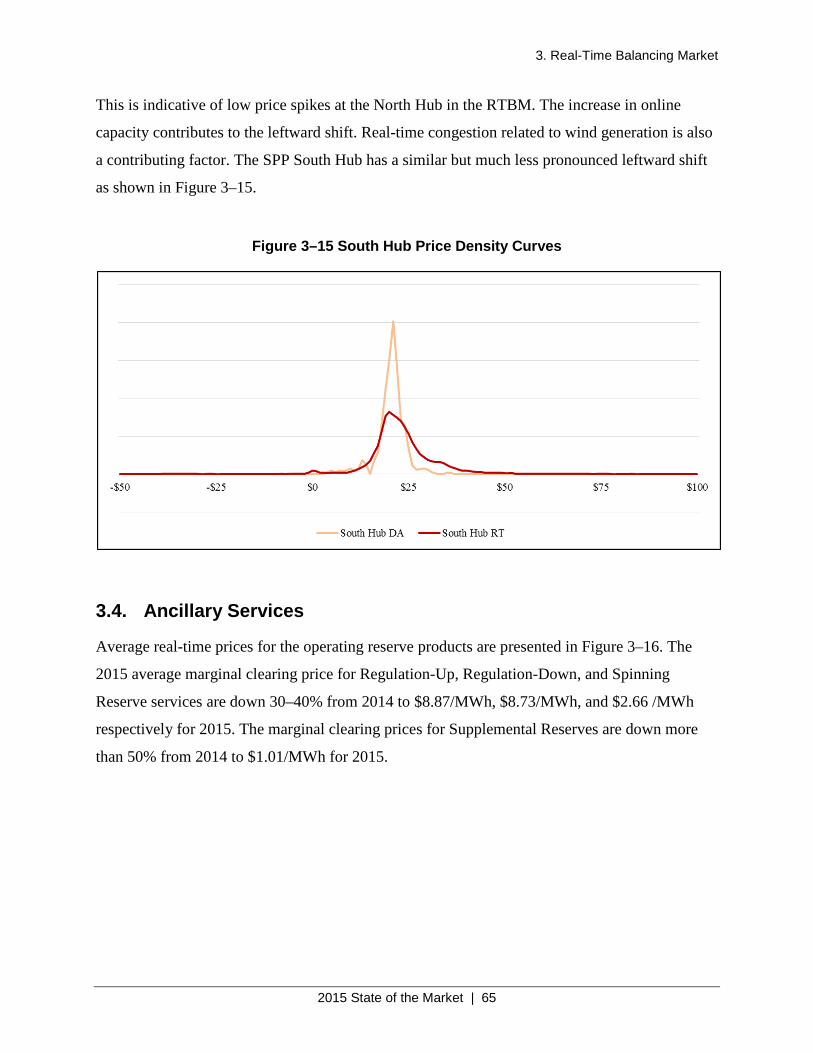
3. Real-Time Balancing Market
2015 State of the Market | 65
This is indicative of low price spikes at the North Hub in the RTBM. The increase in online
capacity contributes to the leftward shift. Real-time congestion related to wind generation is also
a contributing factor. The SPP South Hub has a similar but much less pronounced leftward shift
as shown in Figure 3–15.
Figure 3–15 South Hub Price Density Curves
3.4. Ancillary Services
Average real-time prices for the operating reserve products are presented in Figure 3–16. The
2015 average marginal clearing price for Regulation-Up, Regulation-Down, and Spinning
Reserve services are down 30–40% from 2014 to $8.87/MWh, $8.73/MWh, and $2.66 /MWh
respectively for 2015. The marginal clearing prices for Supplemental Reserves are down more
than 50% from 2014 to $1.01/MWh for 2015.
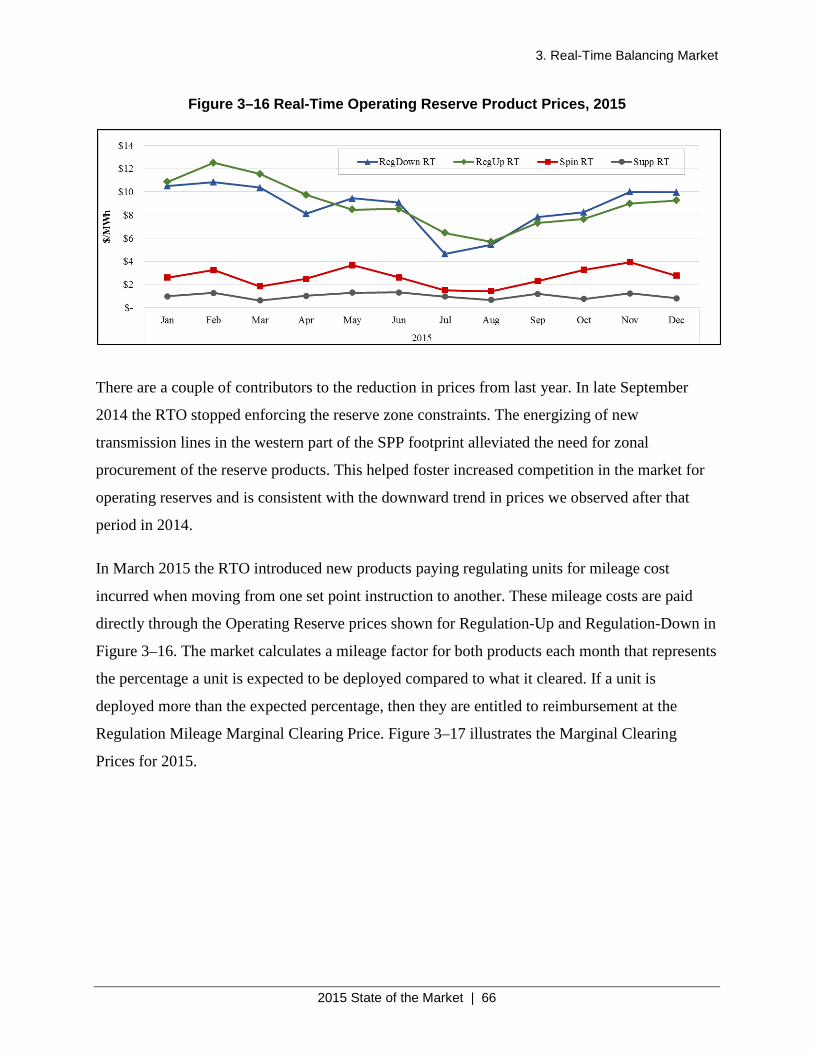
3. Real-Time Balancing Market
2015 State of the Market | 66
Figure 3–16 Real-Time Operating Reserve Product Prices, 2015
There are a couple of contributors to the reduction in prices from last year. In late September
2014 the RTO stopped enforcing the reserve zone constraints. The energizing of new
transmission lines in the western part of the SPP footprint alleviated the need for zonal
procurement of the reserve products. This helped foster increased competition in the market for
operating reserves and is consistent with the downward trend in prices we observed after that
period in 2014.
In March 2015 the RTO introduced new products paying regulating units for mileage cost
incurred when moving from one set point instruction to another. These mileage costs are paid
directly through the Operating Reserve prices shown for Regulation-Up and Regulation-Down in
Figure 3–16. The market calculates a mileage factor for both products each month that represents
the percentage a unit is expected to be deployed compared to what it cleared. If a unit is
deployed more than the expected percentage, then they are entitled to reimbursement at the
Regulation Mileage Marginal Clearing Price. Figure 3–17 illustrates the Marginal Clearing
Prices for 2015.
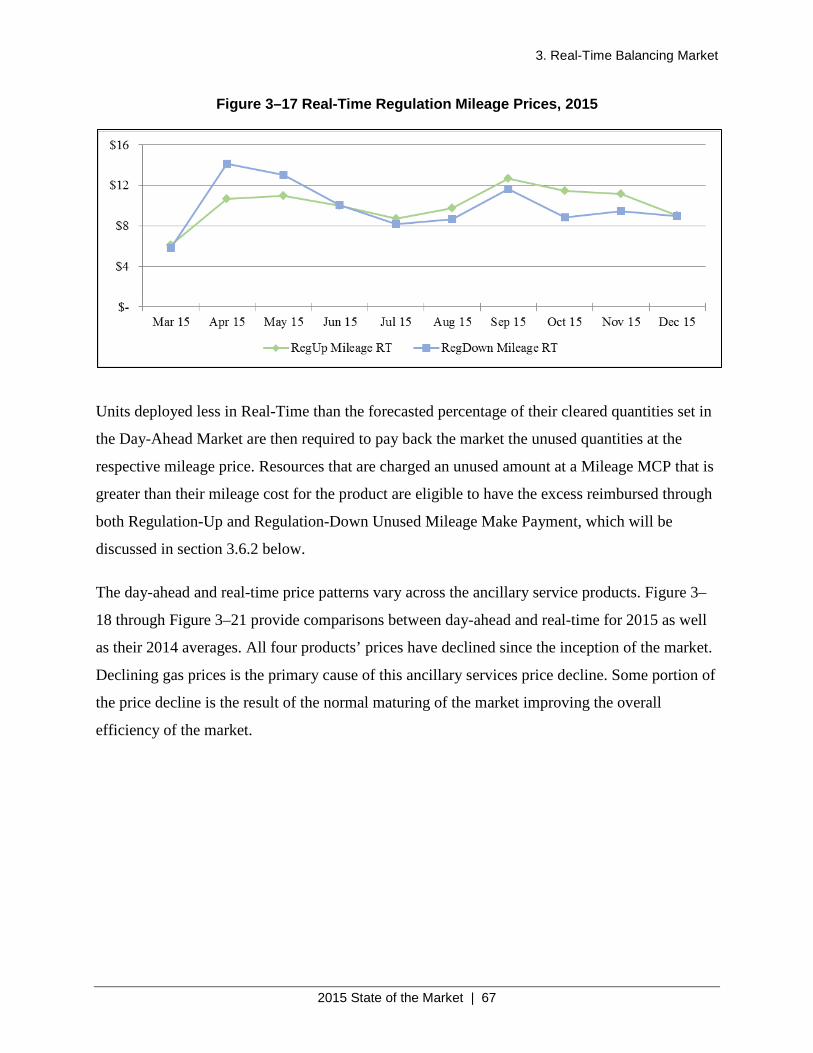
3. Real-Time Balancing Market
2015 State of the Market | 67
Figure 3–17 Real-Time Regulation Mileage Prices, 2015
Units deployed less in Real-Time than the forecasted percentage of their cleared quantities set in
the Day-Ahead Market are then required to pay back the market the unused quantities at the
respective mileage price. Resources that are charged an unused amount at a Mileage MCP that is
greater than their mileage cost for the product are eligible to have the excess reimbursed through
both Regulation-Up and Regulation-Down Unused Mileage Make Payment, which will be
discussed in section 3.6.2 below.
The day-ahead and real-time price patterns vary across the ancillary service products. Figure 3–
18 through Figure 3–21 provide comparisons between day-ahead and real-time for 2015 as well
as their 2014 averages. All four products’ prices have declined since the inception of the market.
Declining gas prices is the primary cause of this ancillary services price decline. Some portion of
the price decline is the result of the normal maturing of the market improving the overall
efficiency of the market.
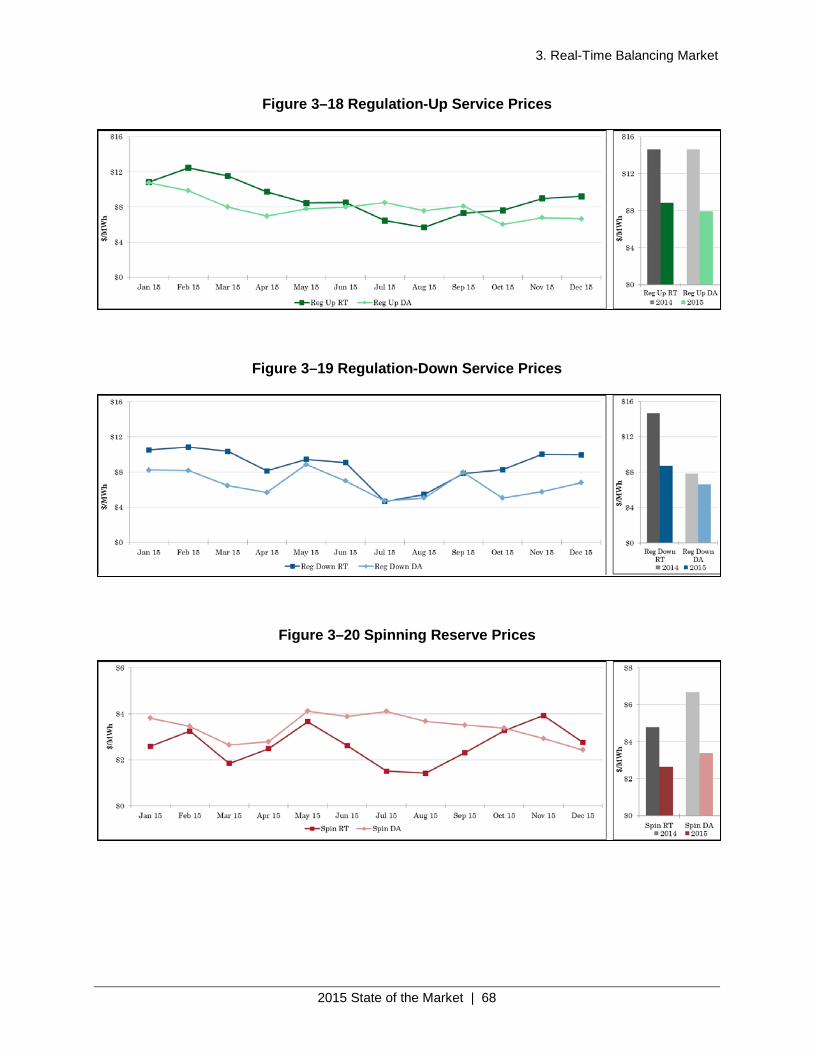
3. Real-Time Balancing Market
2015 State of the Market | 68
Figure 3–18 Regulation-Up Service Prices
Figure 3–19 Regulation-Down Service Prices
Figure 3–20 Spinning Reserve Prices
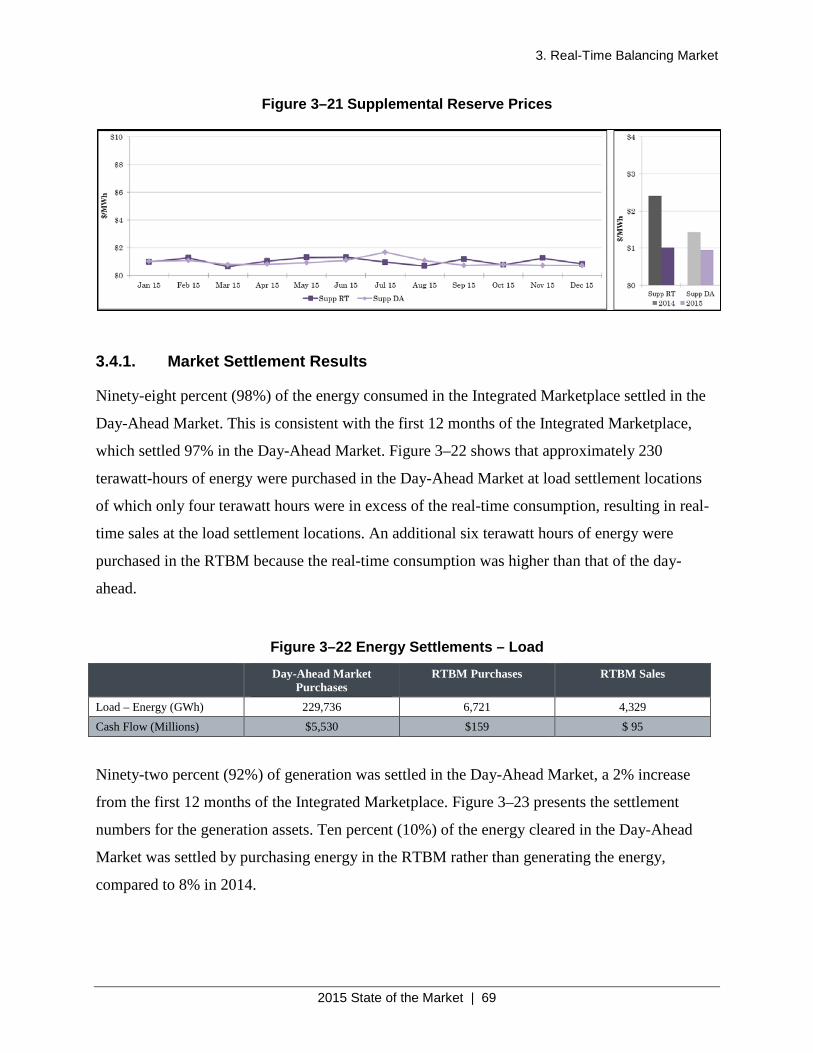
3. Real-Time Balancing Market
2015 State of the Market | 69
Figure 3–21 Supplemental Reserve Prices
3.4.1. Market Settlement Results
Ninety-eight percent (98%) of the energy consumed in the Integrated Marketplace settled in the
Day-Ahead Market. This is consistent with the first 12 months of the Integrated Marketplace,
which settled 97% in the Day-Ahead Market. Figure 3–22 shows that approximately 230
terawatt-hours of energy were purchased in the Day-Ahead Market at load settlement locations
of which only four terawatt hours were in excess of the real-time consumption, resulting in real-
time sales at the load settlement locations. An additional six terawatt hours of energy were
purchased in the RTBM because the real-time consumption was higher than that of the day-
ahead.
Figure 3–22 Energy Settlements – Load
Day-Ahead Market Purchases
RTBM Purchases RTBM Sales
Load – Energy (GWh) 229,736 6,721 4,329 Cash Flow (Millions) $5,530 $159 $ 95
Ninety-two percent (92%) of generation was settled in the Day-Ahead Market, a 2% increase
from the first 12 months of the Integrated Marketplace. Figure 3–23 presents the settlement
numbers for the generation assets. Ten percent (10%) of the energy cleared in the Day-Ahead
Market was settled by purchasing energy in the RTBM rather than generating the energy,
compared to 8% in 2014.
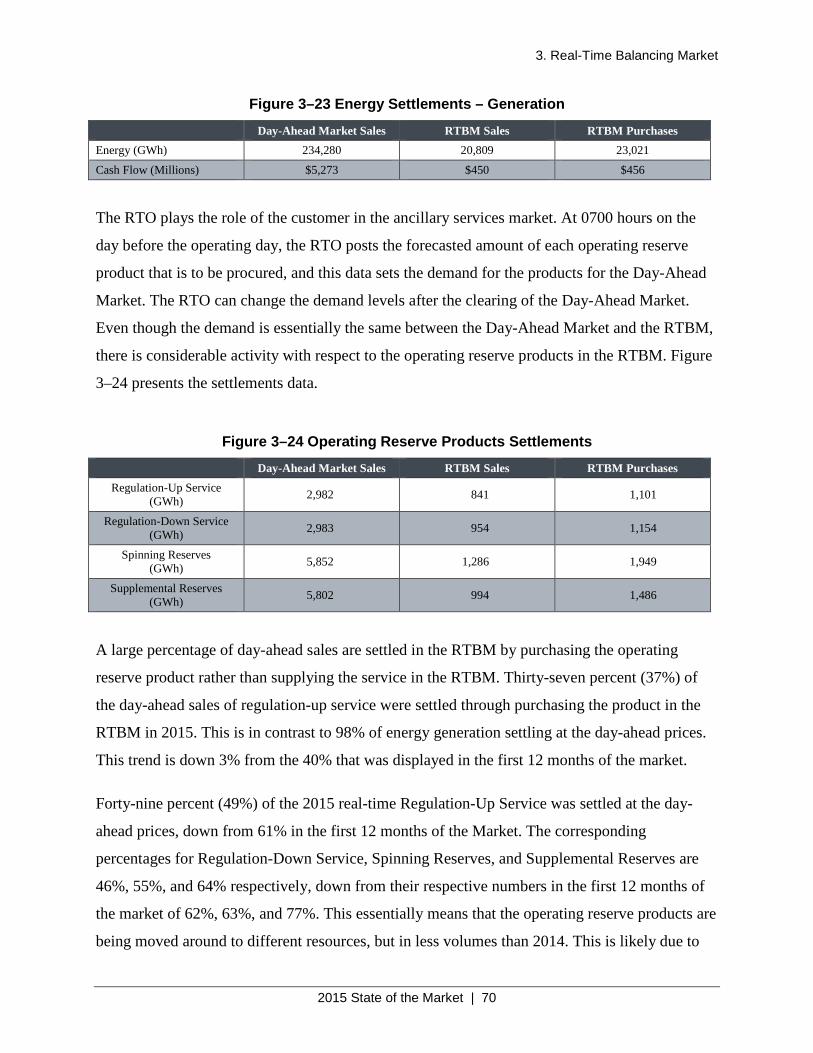
3. Real-Time Balancing Market
2015 State of the Market | 70
Figure 3–23 Energy Settlements – Generation
Day-Ahead Market Sales RTBM Sales RTBM Purchases Energy (GWh) 234,280 20,809 23,021
Cash Flow (Millions) $5,273 $450 $456
The RTO plays the role of the customer in the ancillary services market. At 0700 hours on the
day before the operating day, the RTO posts the forecasted amount of each operating reserve
product that is to be procured, and this data sets the demand for the products for the Day-Ahead
Market. The RTO can change the demand levels after the clearing of the Day-Ahead Market.
Even though the demand is essentially the same between the Day-Ahead Market and the RTBM,
there is considerable activity with respect to the operating reserve products in the RTBM. Figure
3–24 presents the settlements data.
Figure 3–24 Operating Reserve Products Settlements
Day-Ahead Market Sales RTBM Sales RTBM Purchases Regulation-Up Service
(GWh) 2,982 841 1,101
Regulation-Down Service (GWh) 2,983 954 1,154
Spinning Reserves (GWh) 5,852 1,286 1,949
Supplemental Reserves (GWh) 5,802 994 1,486
A large percentage of day-ahead sales are settled in the RTBM by purchasing the operating
reserve product rather than supplying the service in the RTBM. Thirty-seven percent (37%) of
the day-ahead sales of regulation-up service were settled through purchasing the product in the
RTBM in 2015. This is in contrast to 98% of energy generation settling at the day-ahead prices.
This trend is down 3% from the 40% that was displayed in the first 12 months of the market.
Forty-nine percent (49%) of the 2015 real-time Regulation-Up Service was settled at the day-
ahead prices, down from 61% in the first 12 months of the Market. The corresponding
percentages for Regulation-Down Service, Spinning Reserves, and Supplemental Reserves are
46%, 55%, and 64% respectively, down from their respective numbers in the first 12 months of
the market of 62%, 63%, and 77%. This essentially means that the operating reserve products are
being moved around to different resources, but in less volumes than 2014. This is likely due to
3. Real-Time Balancing Market
2015 State of the Market | 71
the additional capacity online as part of the reliability commitment processes. Resources that
were not committed in the Day-Ahead Market, and subsequently committed by a reliability
commitment process, are generally more expensive and once online it is economical to carry
reserves on these resources.
One issue that is not clear is the high level of Regulation-Down Service that is being purchased
by generation owners to cover their day-ahead positions. Figure 3–19 shows that real-time prices
consistently exceed the day-ahead prices for Regulation-Down Service. This means that 32% of
the regulation-down megawatts that clear in the Day-Ahead Market are oftentimes being bought
back at a higher price. In most cases, this should not be an issue due to the co-optimization of
offered capacity for energy and operating reserves. Presumably, the resource’s capacity is being
more efficiently used for energy generation. However, there are cases where the resources are
taken out of the real-time market for regulation due to transmission constraint issues. In these
cases, the set point required for the provision of regulation services causes a transmission
constraint to overload.
3.5. Shortage Pricing
The Integrated Marketplace employs scarcity pricing demand curves that administratively set
price during capacity shortages. An efficient electricity price reflects the cost of the marginal
action required to meet the market demand. Generally, the marginal action to meet demand is the
clearing of energy from a generator; however, during shortage pricing events, the marginal
megawatt comes from reducing the amount of operating reserves. The scarcity pricing demand
curves reflect the administratively determined cost of the marginal action during operating
reserve shortages. The RTBM experienced 24 hours of capacity shortages in 2015. Most
shortages, 90%, were for Spinning Reserve. There was one hour of regulation shortage and only
five-minute interval of aggregate operating reserve shortage. A capacity shortage occurs when
there is not enough online generation to meet both the energy demand and the operating reserve
requirements. No capacity shortages occurred in the Day-Ahead Market.
Figure 3–25 displays the number of shortage hours and the corresponding average of the system
marginal price (SMP). The high SMP during the operating reserve shortage reflects the
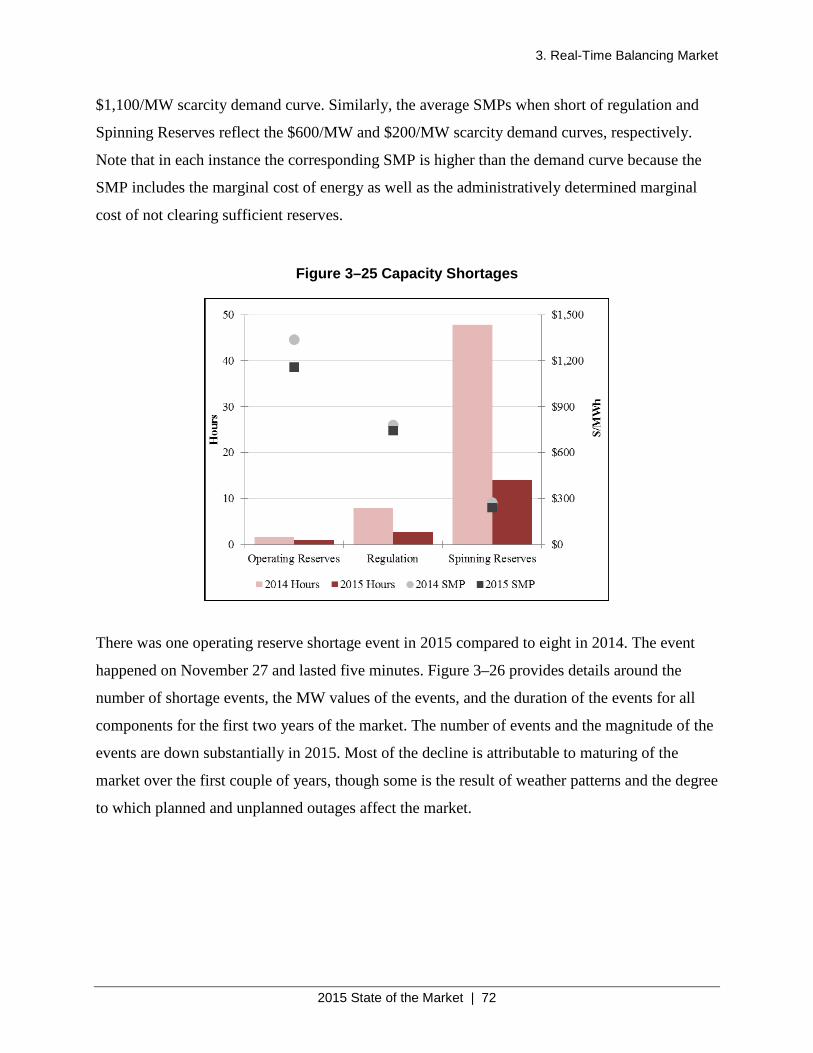
3. Real-Time Balancing Market
2015 State of the Market | 72
$1,100/MW scarcity demand curve. Similarly, the average SMPs when short of regulation and
Spinning Reserves reflect the $600/MW and $200/MW scarcity demand curves, respectively.
Note that in each instance the corresponding SMP is higher than the demand curve because the
SMP includes the marginal cost of energy as well as the administratively determined marginal
cost of not clearing sufficient reserves.
Figure 3–25 Capacity Shortages
There was one operating reserve shortage event in 2015 compared to eight in 2014. The event
happened on November 27 and lasted five minutes. Figure 3–26 provides details around the
number of shortage events, the MW values of the events, and the duration of the events for all
components for the first two years of the market. The number of events and the magnitude of the
events are down substantially in 2015. Most of the decline is attributable to maturing of the
market over the first couple of years, though some is the result of weather patterns and the degree
to which planned and unplanned outages affect the market.
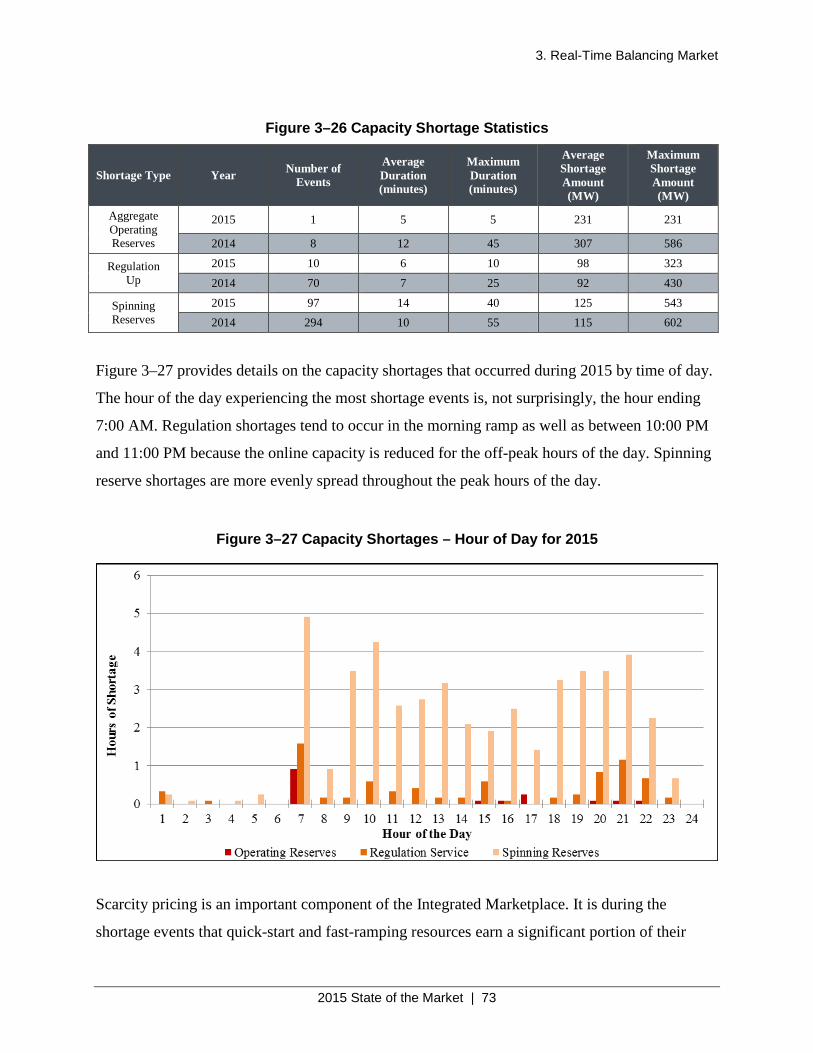
3. Real-Time Balancing Market
2015 State of the Market | 73
Figure 3–26 Capacity Shortage Statistics
Shortage Type Year Number of Events
Average Duration (minutes)
Maximum Duration (minutes)
Average Shortage Amount (MW)
Maximum Shortage Amount (MW)
Aggregate Operating Reserves
2015 1 5 5 231 231
2014 8 12 45 307 586
Regulation Up
2015 10 6 10 98 323
2014 70 7 25 92 430
Spinning Reserves
2015 97 14 40 125 543 2014 294 10 55 115 602
Figure 3–27 provides details on the capacity shortages that occurred during 2015 by time of day.
The hour of the day experiencing the most shortage events is, not surprisingly, the hour ending
7:00 AM. Regulation shortages tend to occur in the morning ramp as well as between 10:00 PM
and 11:00 PM because the online capacity is reduced for the off-peak hours of the day. Spinning
reserve shortages are more evenly spread throughout the peak hours of the day.
Figure 3–27 Capacity Shortages – Hour of Day for 2015
Scarcity pricing is an important component of the Integrated Marketplace. It is during the
shortage events that quick-start and fast-ramping resources earn a significant portion of their
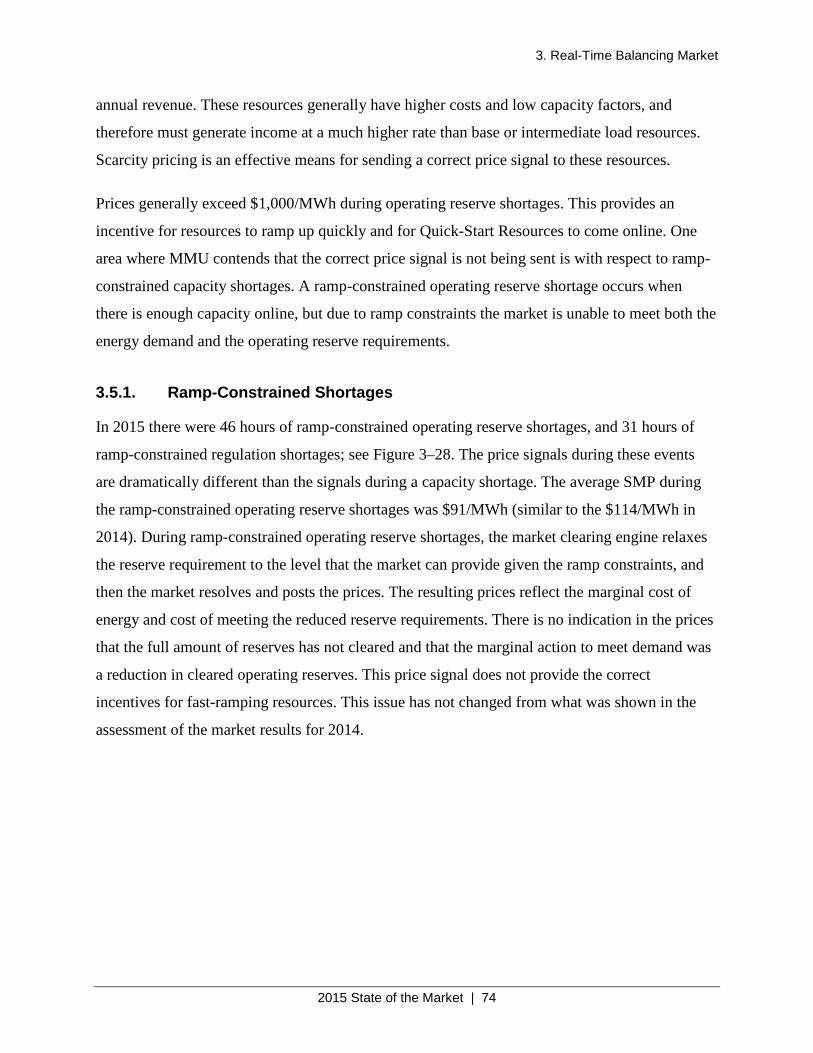
3. Real-Time Balancing Market
2015 State of the Market | 74
annual revenue. These resources generally have higher costs and low capacity factors, and
therefore must generate income at a much higher rate than base or intermediate load resources.
Scarcity pricing is an effective means for sending a correct price signal to these resources.
Prices generally exceed $1,000/MWh during operating reserve shortages. This provides an
incentive for resources to ramp up quickly and for Quick-Start Resources to come online. One
area where MMU contends that the correct price signal is not being sent is with respect to ramp-
constrained capacity shortages. A ramp-constrained operating reserve shortage occurs when
there is enough capacity online, but due to ramp constraints the market is unable to meet both the
energy demand and the operating reserve requirements.
3.5.1. Ramp-Constrained Shortages
In 2015 there were 46 hours of ramp-constrained operating reserve shortages, and 31 hours of
ramp-constrained regulation shortages; see Figure 3–28. The price signals during these events
are dramatically different than the signals during a capacity shortage. The average SMP during
the ramp-constrained operating reserve shortages was $91/MWh (similar to the $114/MWh in
2014). During ramp-constrained operating reserve shortages, the market clearing engine relaxes
the reserve requirement to the level that the market can provide given the ramp constraints, and
then the market resolves and posts the prices. The resulting prices reflect the marginal cost of
energy and cost of meeting the reduced reserve requirements. There is no indication in the prices
that the full amount of reserves has not cleared and that the marginal action to meet demand was
a reduction in cleared operating reserves. This price signal does not provide the correct
incentives for fast-ramping resources. This issue has not changed from what was shown in the
assessment of the market results for 2014.
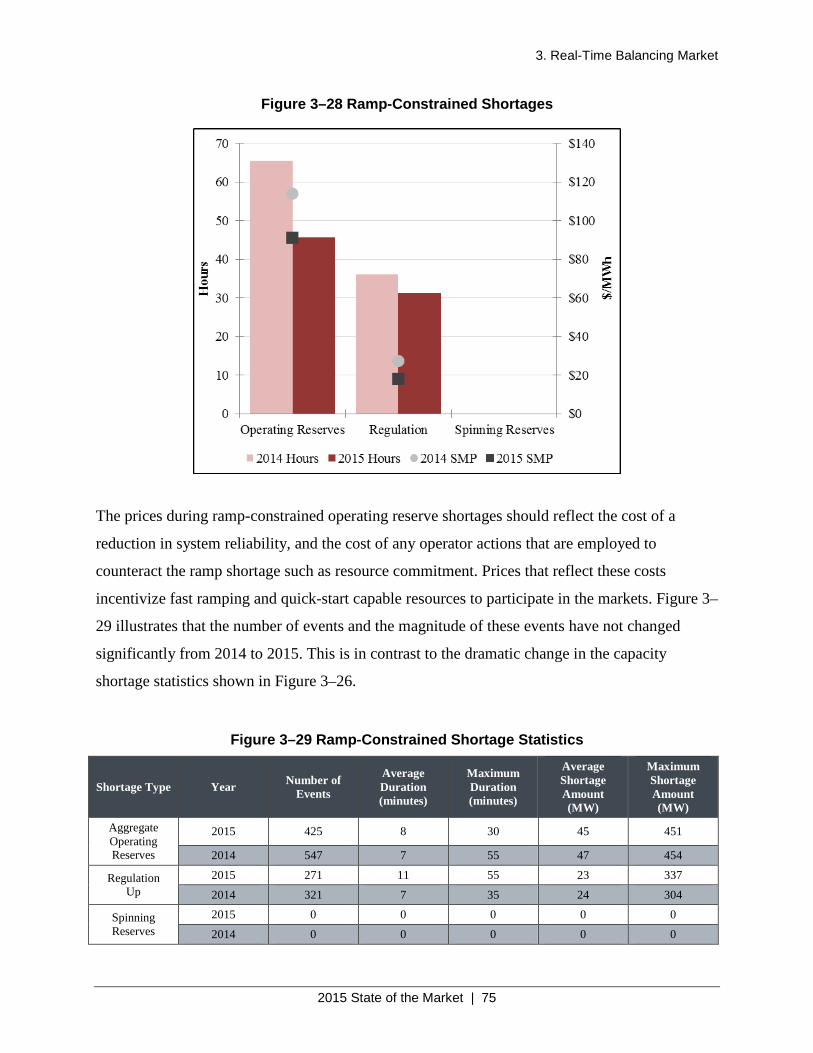
3. Real-Time Balancing Market
2015 State of the Market | 75
Figure 3–28 Ramp-Constrained Shortages
The prices during ramp-constrained operating reserve shortages should reflect the cost of a
reduction in system reliability, and the cost of any operator actions that are employed to
counteract the ramp shortage such as resource commitment. Prices that reflect these costs
incentivize fast ramping and quick-start capable resources to participate in the markets. Figure 3–
29 illustrates that the number of events and the magnitude of these events have not changed
significantly from 2014 to 2015. This is in contrast to the dramatic change in the capacity
shortage statistics shown in Figure 3–26.
Figure 3–29 Ramp-Constrained Shortage Statistics
Shortage Type Year Number of Events
Average Duration (minutes)
Maximum Duration (minutes)
Average Shortage Amount (MW)
Maximum Shortage Amount (MW)
Aggregate Operating Reserves
2015 425 8 30 45 451
2014 547 7 55 47 454
Regulation Up
2015 271 11 55 23 337
2014 321 7 35 24 304
Spinning Reserves
2015 0 0 0 0 0
2014 0 0 0 0 0
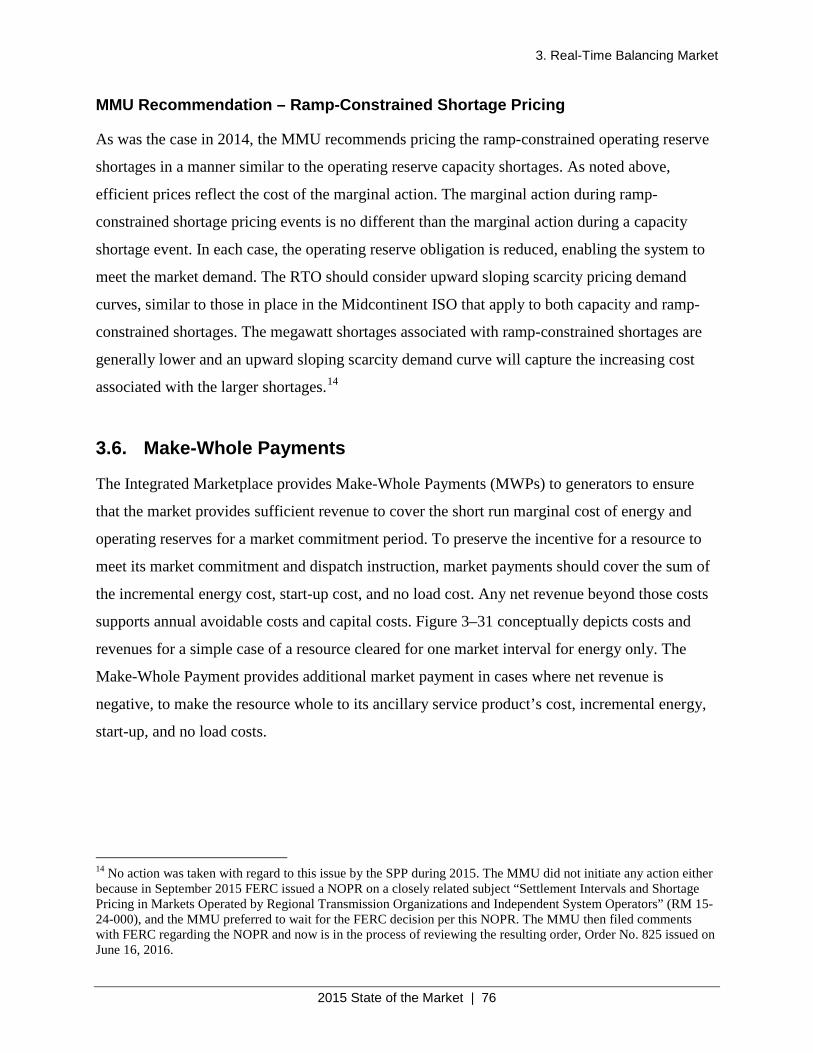
3. Real-Time Balancing Market
2015 State of the Market | 76
MMU Recommendation – Ramp-Constrained Shortage Pricing
As was the case in 2014, the MMU recommends pricing the ramp-constrained operating reserve
shortages in a manner similar to the operating reserve capacity shortages. As noted above,
efficient prices reflect the cost of the marginal action. The marginal action during ramp-
constrained shortage pricing events is no different than the marginal action during a capacity
shortage event. In each case, the operating reserve obligation is reduced, enabling the system to
meet the market demand. The RTO should consider upward sloping scarcity pricing demand
curves, similar to those in place in the Midcontinent ISO that apply to both capacity and ramp-
constrained shortages. The megawatt shortages associated with ramp-constrained shortages are
generally lower and an upward sloping scarcity demand curve will capture the increasing cost
associated with the larger shortages.14
3.6. Make-Whole Payments
The Integrated Marketplace provides Make-Whole Payments (MWPs) to generators to ensure
that the market provides sufficient revenue to cover the short run marginal cost of energy and
operating reserves for a market commitment period. To preserve the incentive for a resource to
meet its market commitment and dispatch instruction, market payments should cover the sum of
the incremental energy cost, start-up cost, and no load cost. Any net revenue beyond those costs
supports annual avoidable costs and capital costs. Figure 3–31 conceptually depicts costs and
revenues for a simple case of a resource cleared for one market interval for energy only. The
Make-Whole Payment provides additional market payment in cases where net revenue is
negative, to make the resource whole to its ancillary service product’s cost, incremental energy,
start-up, and no load costs.
14 No action was taken with regard to this issue by the SPP during 2015. The MMU did not initiate any action either because in September 2015 FERC issued a NOPR on a closely related subject “Settlement Intervals and Shortage Pricing in Markets Operated by Regional Transmission Organizations and Independent System Operators” (RM 15-24-000), and the MMU preferred to wait for the FERC decision per this NOPR. The MMU then filed comments with FERC regarding the NOPR and now is in the process of reviewing the resulting order, Order No. 825 issued on June 16, 2016.
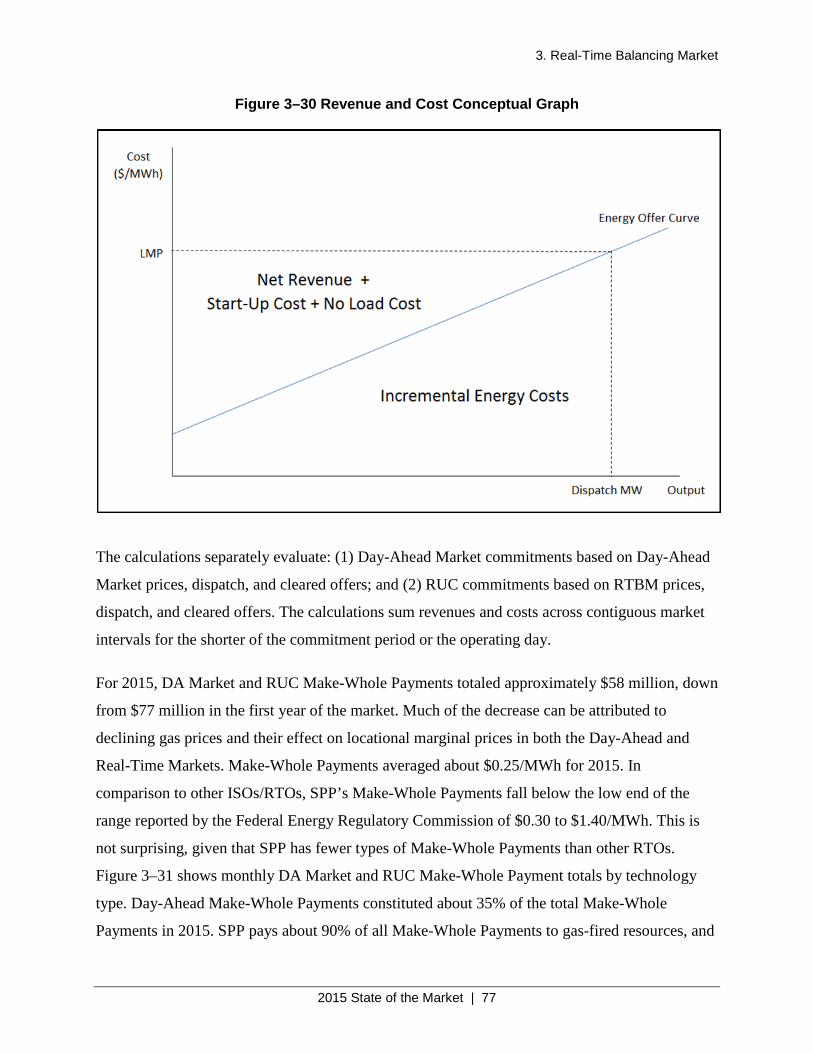
3. Real-Time Balancing Market
2015 State of the Market | 77
Figure 3–30 Revenue and Cost Conceptual Graph
The calculations separately evaluate: (1) Day-Ahead Market commitments based on Day-Ahead
Market prices, dispatch, and cleared offers; and (2) RUC commitments based on RTBM prices,
dispatch, and cleared offers. The calculations sum revenues and costs across contiguous market
intervals for the shorter of the commitment period or the operating day.
For 2015, DA Market and RUC Make-Whole Payments totaled approximately $58 million, down
from $77 million in the first year of the market. Much of the decrease can be attributed to
declining gas prices and their effect on locational marginal prices in both the Day-Ahead and
Real-Time Markets. Make-Whole Payments averaged about $0.25/MWh for 2015. In
comparison to other ISOs/RTOs, SPP’s Make-Whole Payments fall below the low end of the
range reported by the Federal Energy Regulatory Commission of $0.30 to $1.40/MWh. This is
not surprising, given that SPP has fewer types of Make-Whole Payments than other RTOs.
Figure 3–31 shows monthly DA Market and RUC Make-Whole Payment totals by technology
type. Day-Ahead Make-Whole Payments constituted about 35% of the total Make-Whole
Payments in 2015. SPP pays about 90% of all Make-Whole Payments to gas-fired resources, and
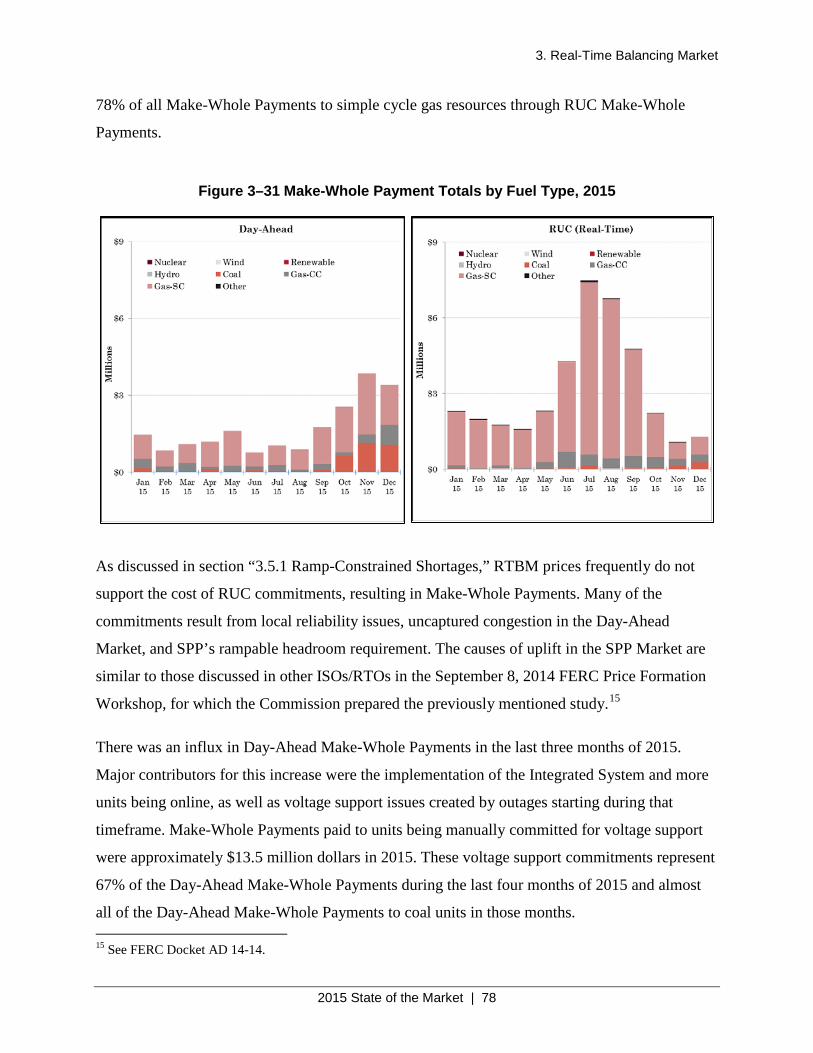
3. Real-Time Balancing Market
2015 State of the Market | 78
78% of all Make-Whole Payments to simple cycle gas resources through RUC Make-Whole
Payments.
Figure 3–31 Make-Whole Payment Totals by Fuel Type, 2015
As discussed in section “3.5.1 Ramp-Constrained Shortages,” RTBM prices frequently do not
support the cost of RUC commitments, resulting in Make-Whole Payments. Many of the
commitments result from local reliability issues, uncaptured congestion in the Day-Ahead
Market, and SPP’s rampable headroom requirement. The causes of uplift in the SPP Market are
similar to those discussed in other ISOs/RTOs in the September 8, 2014 FERC Price Formation
Workshop, for which the Commission prepared the previously mentioned study.15
There was an influx in Day-Ahead Make-Whole Payments in the last three months of 2015.
Major contributors for this increase were the implementation of the Integrated System and more
units being online, as well as voltage support issues created by outages starting during that
timeframe. Make-Whole Payments paid to units being manually committed for voltage support
were approximately $13.5 million dollars in 2015. These voltage support commitments represent
67% of the Day-Ahead Make-Whole Payments during the last four months of 2015 and almost
all of the Day-Ahead Make-Whole Payments to coal units in those months. 15 See FERC Docket AD 14-14.
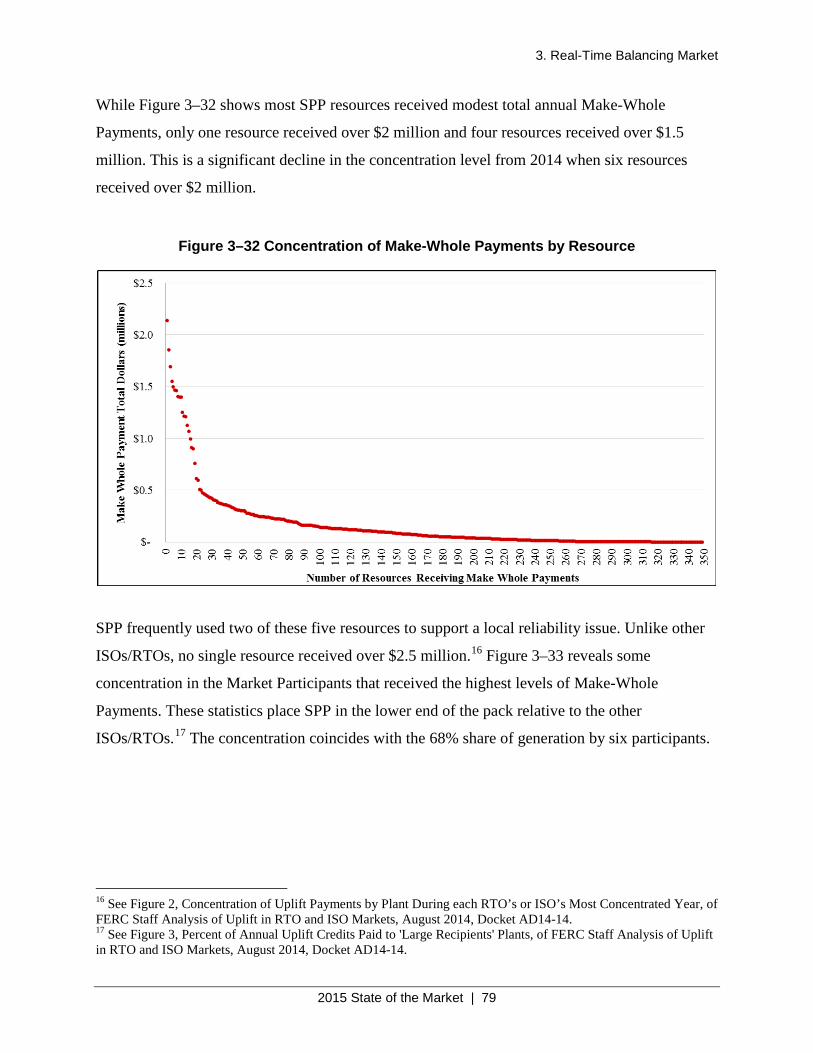
3. Real-Time Balancing Market
2015 State of the Market | 79
While Figure 3–32 shows most SPP resources received modest total annual Make-Whole
Payments, only one resource received over $2 million and four resources received over $1.5
million. This is a significant decline in the concentration level from 2014 when six resources
received over $2 million.
Figure 3–32 Concentration of Make-Whole Payments by Resource
SPP frequently used two of these five resources to support a local reliability issue. Unlike other
ISOs/RTOs, no single resource received over $2.5 million.16 Figure 3–33 reveals some
concentration in the Market Participants that received the highest levels of Make-Whole
Payments. These statistics place SPP in the lower end of the pack relative to the other
ISOs/RTOs.17 The concentration coincides with the 68% share of generation by six participants.
16 See Figure 2, Concentration of Uplift Payments by Plant During each RTO’s or ISO’s Most Concentrated Year, of FERC Staff Analysis of Uplift in RTO and ISO Markets, August 2014, Docket AD14-14. 17 See Figure 3, Percent of Annual Uplift Credits Paid to 'Large Recipients' Plants, of FERC Staff Analysis of Uplift in RTO and ISO Markets, August 2014, Docket AD14-14.
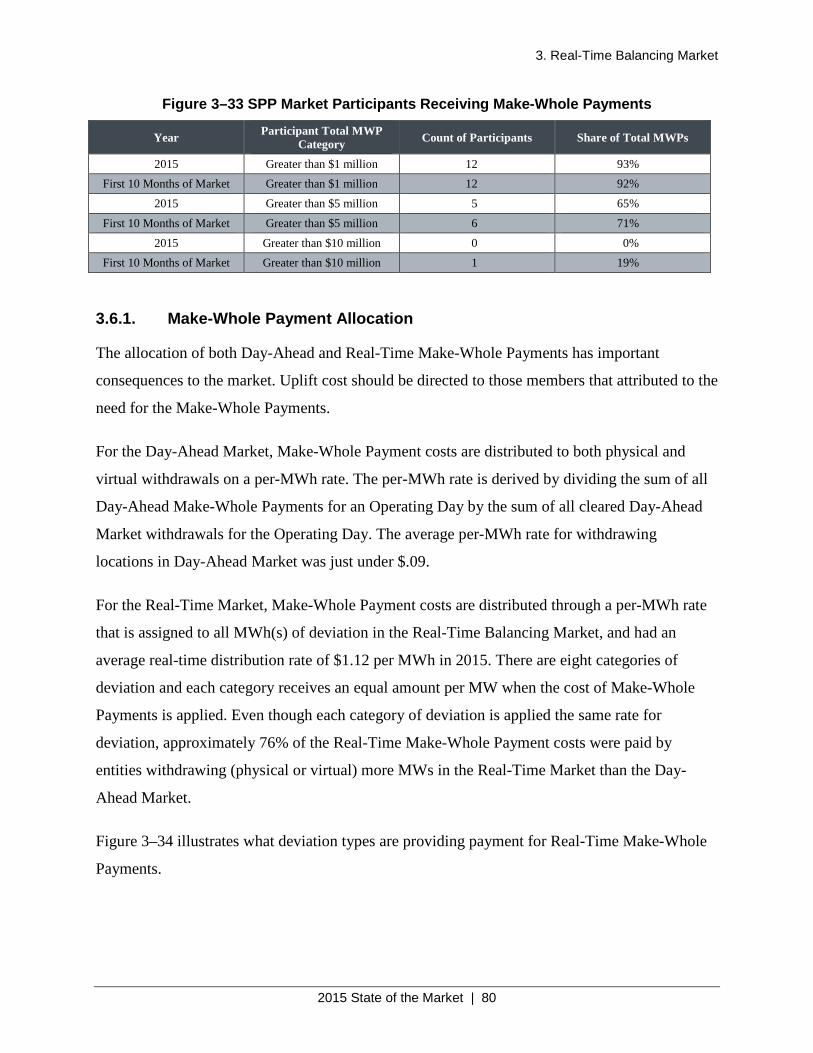
3. Real-Time Balancing Market
2015 State of the Market | 80
Figure 3–33 SPP Market Participants Receiving Make-Whole Payments
Year Participant Total MWP Category Count of Participants Share of Total MWPs
2015 Greater than $1 million 12 93% First 10 Months of Market Greater than $1 million 12 92%
2015 Greater than $5 million 5 65%
First 10 Months of Market Greater than $5 million 6 71%
2015 Greater than $10 million 0 0% First 10 Months of Market Greater than $10 million 1 19%
3.6.1. Make-Whole Payment Allocation
The allocation of both Day-Ahead and Real-Time Make-Whole Payments has important
consequences to the market. Uplift cost should be directed to those members that attributed to the
need for the Make-Whole Payments.
For the Day-Ahead Market, Make-Whole Payment costs are distributed to both physical and
virtual withdrawals on a per-MWh rate. The per-MWh rate is derived by dividing the sum of all
Day-Ahead Make-Whole Payments for an Operating Day by the sum of all cleared Day-Ahead
Market withdrawals for the Operating Day. The average per-MWh rate for withdrawing
locations in Day-Ahead Market was just under $.09.
For the Real-Time Market, Make-Whole Payment costs are distributed through a per-MWh rate
that is assigned to all MWh(s) of deviation in the Real-Time Balancing Market, and had an
average real-time distribution rate of $1.12 per MWh in 2015. There are eight categories of
deviation and each category receives an equal amount per MW when the cost of Make-Whole
Payments is applied. Even though each category of deviation is applied the same rate for
deviation, approximately 76% of the Real-Time Make-Whole Payment costs were paid by
entities withdrawing (physical or virtual) more MWs in the Real-Time Market than the Day-
Ahead Market.
Figure 3–34 illustrates what deviation types are providing payment for Real-Time Make-Whole
Payments.
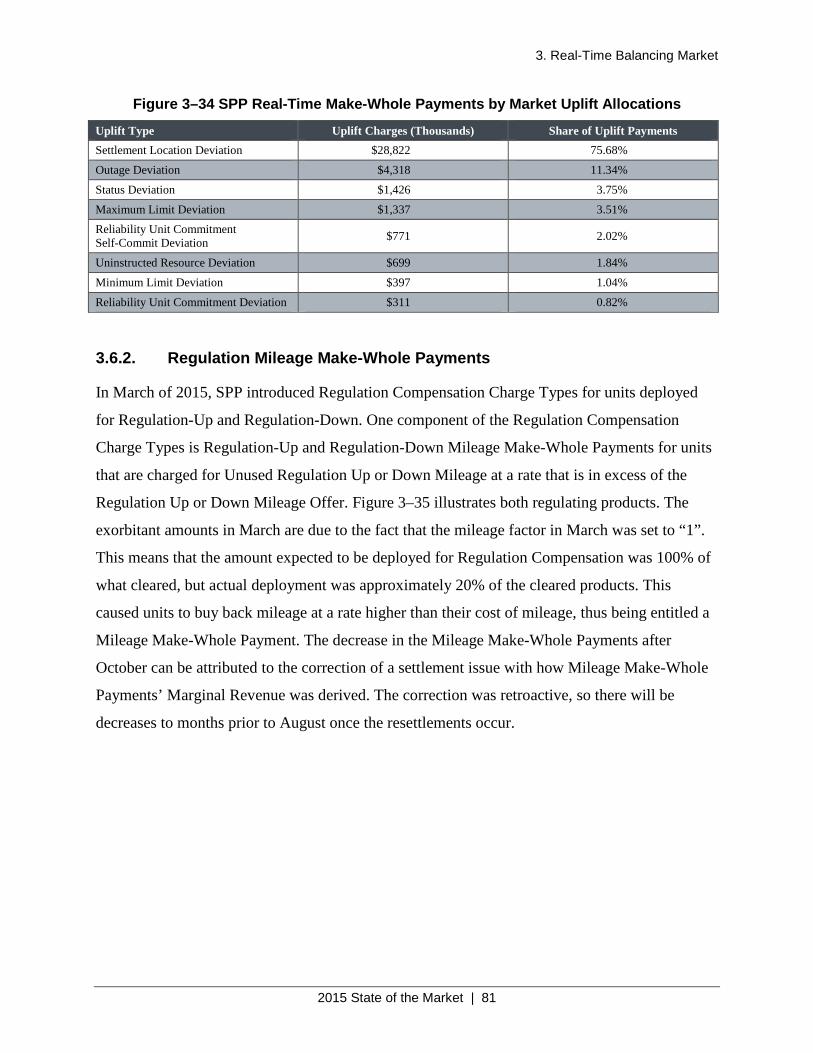
3. Real-Time Balancing Market
2015 State of the Market | 81
Figure 3–34 SPP Real-Time Make-Whole Payments by Market Uplift Allocations
Uplift Type Uplift Charges (Thousands) Share of Uplift Payments Settlement Location Deviation $28,822 75.68%
Outage Deviation $4,318 11.34%
Status Deviation $1,426 3.75%
Maximum Limit Deviation $1,337 3.51% Reliability Unit Commitment Self-Commit Deviation $771 2.02%
Uninstructed Resource Deviation $699 1.84%
Minimum Limit Deviation $397 1.04%
Reliability Unit Commitment Deviation $311 0.82%
3.6.2. Regulation Mileage Make-Whole Payments
In March of 2015, SPP introduced Regulation Compensation Charge Types for units deployed
for Regulation-Up and Regulation-Down. One component of the Regulation Compensation
Charge Types is Regulation-Up and Regulation-Down Mileage Make-Whole Payments for units
that are charged for Unused Regulation Up or Down Mileage at a rate that is in excess of the
Regulation Up or Down Mileage Offer. Figure 3–35 illustrates both regulating products. The
exorbitant amounts in March are due to the fact that the mileage factor in March was set to “1”.
This means that the amount expected to be deployed for Regulation Compensation was 100% of
what cleared, but actual deployment was approximately 20% of the cleared products. This
caused units to buy back mileage at a rate higher than their cost of mileage, thus being entitled a
Mileage Make-Whole Payment. The decrease in the Mileage Make-Whole Payments after
October can be attributed to the correction of a settlement issue with how Mileage Make-Whole
Payments’ Marginal Revenue was derived. The correction was retroactive, so there will be
decreases to months prior to August once the resettlements occur.
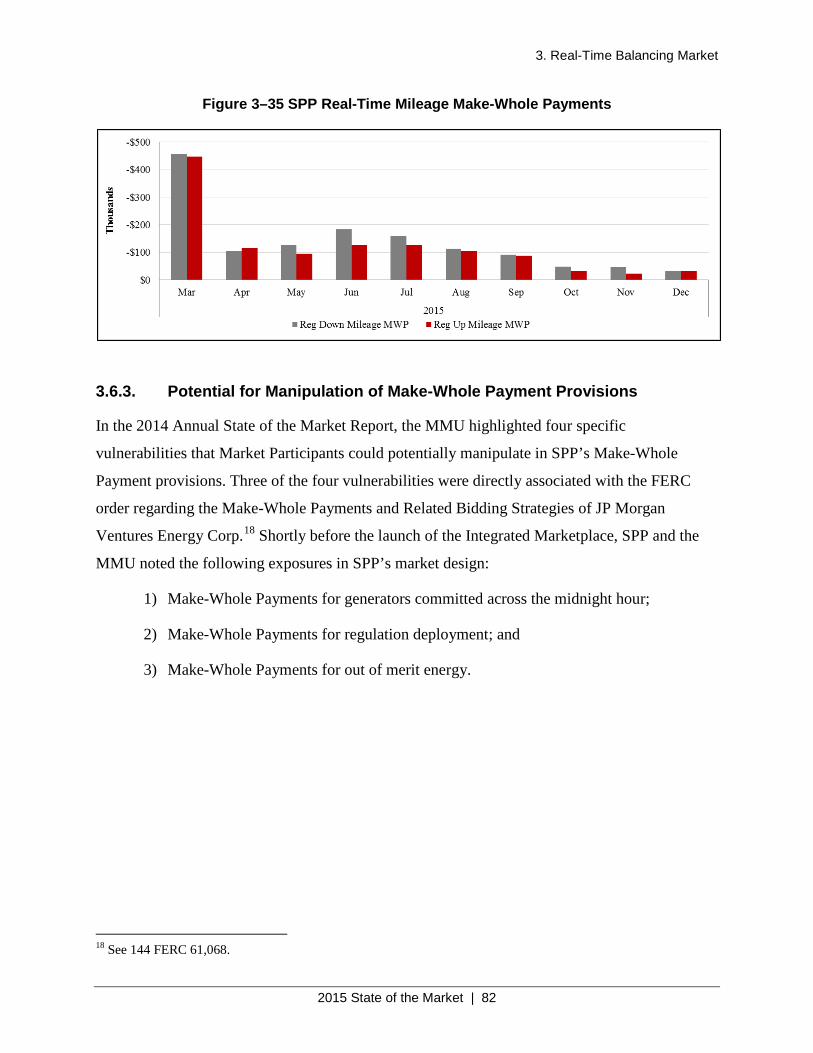
3. Real-Time Balancing Market
2015 State of the Market | 82
Figure 3–35 SPP Real-Time Mileage Make-Whole Payments
3.6.3. Potential for Manipulation of Make-Whole Payment Provisions
In the 2014 Annual State of the Market Report, the MMU highlighted four specific
vulnerabilities that Market Participants could potentially manipulate in SPP’s Make-Whole
Payment provisions. Three of the four vulnerabilities were directly associated with the FERC
order regarding the Make-Whole Payments and Related Bidding Strategies of JP Morgan
Ventures Energy Corp.18 Shortly before the launch of the Integrated Marketplace, SPP and the
MMU noted the following exposures in SPP’s market design:
1) Make-Whole Payments for generators committed across the midnight hour;
2) Make-Whole Payments for regulation deployment; and
3) Make-Whole Payments for out of merit energy.
18 See 144 FERC 61,068.
3. Real-Time Balancing Market
2015 State of the Market | 83
In 2014, MMU’s recommendation 3 covered the following with regard to the manipulations of
Make-Whole Payment Provisions:
• Evaluate solutions adopted by other RTOs to reduce exposure to market manipulation
opportunities in Make-Whole Payment provisions for resources committed across the
midnight hour.
• Disqualify resources with fixed Regulation bids from receiving the Regulation
Deployment Adjustment Charge.
• Utilize automatic mitigation provisions for local reliability commitments for local
reliability OOME events.
In each case, a Market Participant has the ability to situate its resource to receive a Make-Whole
Payment without economic evaluation of its offers by the market clearing engine. At the time of
the preparation of this report, SPP has not closed the vulnerability gaps for any of the three
issues, with the exception of rule changes that a self-committed resource is not recognized as
eligible for a Make-Whole Payment if it changes to Market commitment status prior to the
completion of its minimum run time.19 SPP’s Market Design Unit is currently working with the
MMU to gather details behind each vulnerability and draft design changes for each provision.
The MMU continues to monitor the market for all three gaps. Exposures to all three
vulnerabilities are still present; however, the MMU has not identified an OOME in the upward
direction for a local event at this time. This is a necessary event for the exploitation of
vulnerability gap number 3 concerning OOME Make-Whole Payments, stated above. Due to
infrequency of these events, the MMU will continue to monitor the gap, but feels that there may
not be a cost-benefit present to justify SPP addressing the issue via a design change at this time.
However, the MMU fully feels that the issues concerning commitments across the midnight hour
and the regulation deployment adjustment should be addressed as to remove the exposure of
exploitation.
In addition to these recommendations, the following recommendation was made concerning a
potential gap allowing the manipulation of Make-Whole Payments by jointly-owned units
19 See MRR 25/MPRR 211, Self-Commit Run Time Make-Whole Payment Exemption
3. Real-Time Balancing Market
2015 State of the Market | 84
though the combined resource option. The market commits these units as one, and it provides
separate dispatch instructions and Make-Whole Payments by ownership share. This allows a
shareowner to benefit from a higher energy offer than its co-owners through high minimum
energy costs in the Make-Whole Payment. At the time the 2014 report was released, SPP was
considering design alternatives through stakeholder process as follows:
• Remove the ability to manipulate Make-Whole Payments under the JOU Combined
Resource Option and improve market efficiency in the JOU design.
At the time this report was released, SPP had approved but not implemented MRR127, a change
in the market design to address this issue. The MMU review of this design indicates the change
will address this vulnerability.
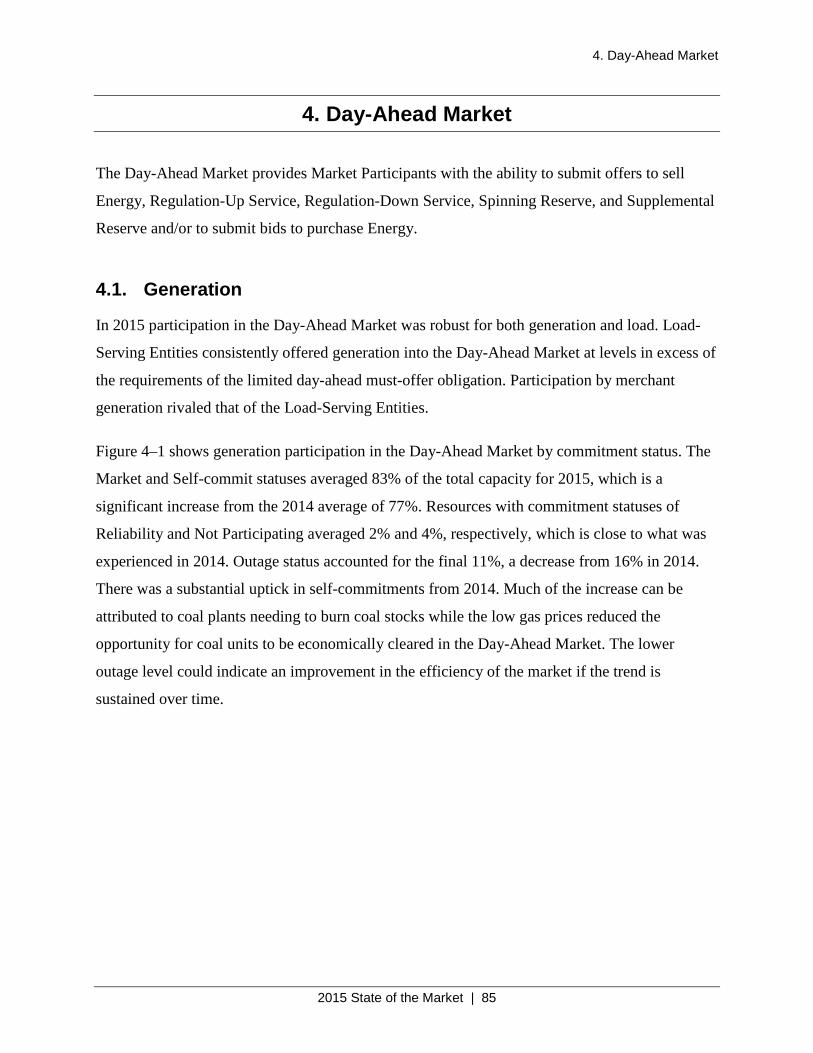
4. Day-Ahead Market
2015 State of the Market | 85
4. Day-Ahead Market
The Day-Ahead Market provides Market Participants with the ability to submit offers to sell
Energy, Regulation-Up Service, Regulation-Down Service, Spinning Reserve, and Supplemental
Reserve and/or to submit bids to purchase Energy.
4.1. Generation
In 2015 participation in the Day-Ahead Market was robust for both generation and load. Load-
Serving Entities consistently offered generation into the Day-Ahead Market at levels in excess of
the requirements of the limited day-ahead must-offer obligation. Participation by merchant
generation rivaled that of the Load-Serving Entities.
Figure 4–1 shows generation participation in the Day-Ahead Market by commitment status. The
Market and Self-commit statuses averaged 83% of the total capacity for 2015, which is a
significant increase from the 2014 average of 77%. Resources with commitment statuses of
Reliability and Not Participating averaged 2% and 4%, respectively, which is close to what was
experienced in 2014. Outage status accounted for the final 11%, a decrease from 16% in 2014.
There was a substantial uptick in self-commitments from 2014. Much of the increase can be
attributed to coal plants needing to burn coal stocks while the low gas prices reduced the
opportunity for coal units to be economically cleared in the Day-Ahead Market. The lower
outage level could indicate an improvement in the efficiency of the market if the trend is
sustained over time.
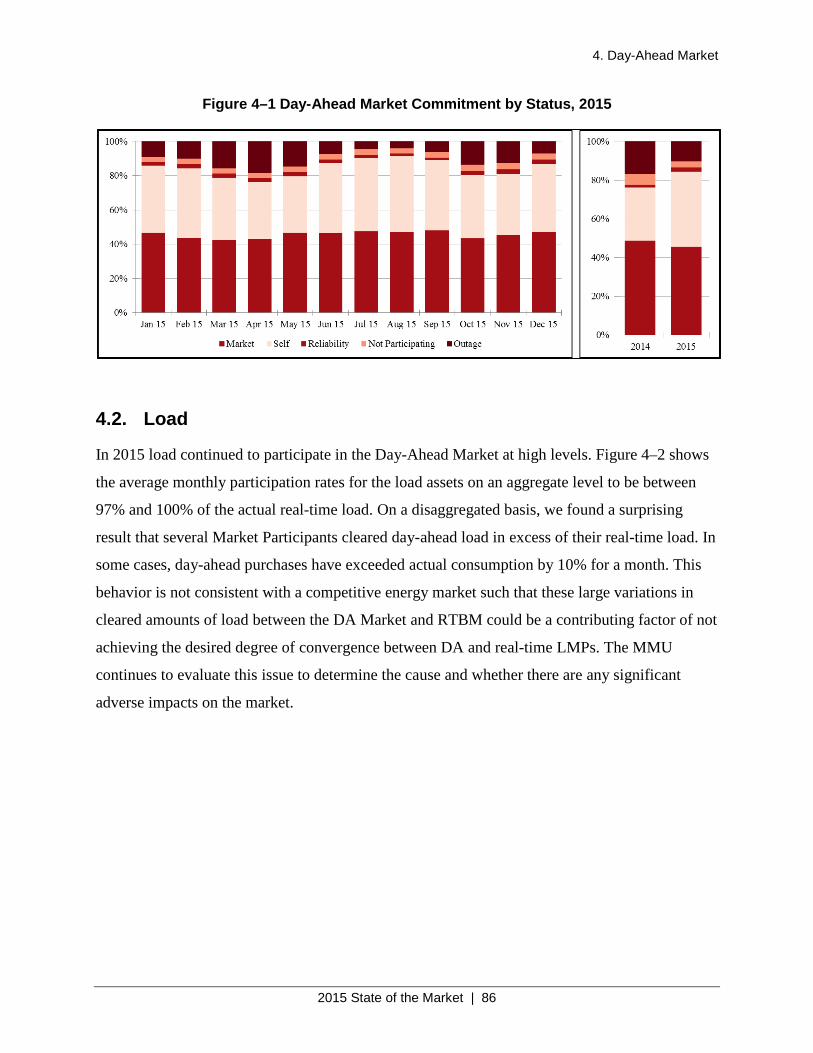
4. Day-Ahead Market
2015 State of the Market | 86
Figure 4–1 Day-Ahead Market Commitment by Status, 2015
4.2. Load
In 2015 load continued to participate in the Day-Ahead Market at high levels. Figure 4–2 shows
the average monthly participation rates for the load assets on an aggregate level to be between
97% and 100% of the actual real-time load. On a disaggregated basis, we found a surprising
result that several Market Participants cleared day-ahead load in excess of their real-time load. In
some cases, day-ahead purchases have exceeded actual consumption by 10% for a month. This
behavior is not consistent with a competitive energy market such that these large variations in
cleared amounts of load between the DA Market and RTBM could be a contributing factor of not
achieving the desired degree of convergence between DA and real-time LMPs. The MMU
continues to evaluate this issue to determine the cause and whether there are any significant
adverse impacts on the market.
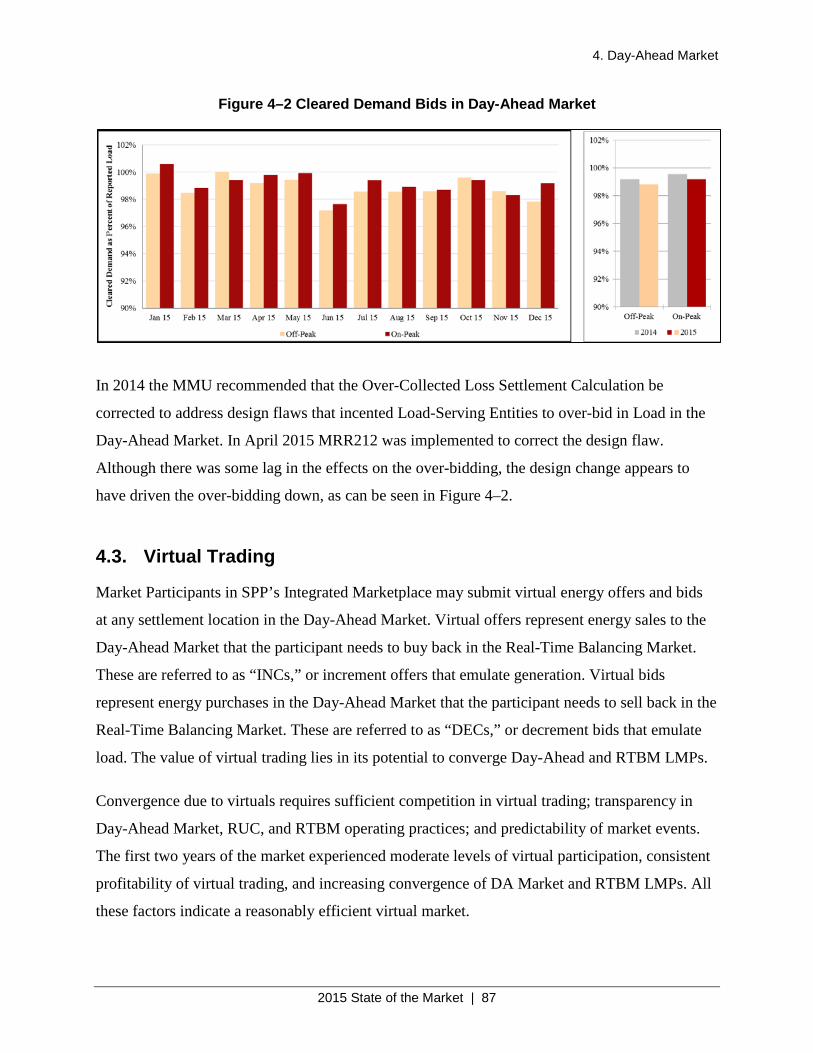
4. Day-Ahead Market
2015 State of the Market | 87
Figure 4–2 Cleared Demand Bids in Day-Ahead Market
In 2014 the MMU recommended that the Over-Collected Loss Settlement Calculation be
corrected to address design flaws that incented Load-Serving Entities to over-bid in Load in the
Day-Ahead Market. In April 2015 MRR212 was implemented to correct the design flaw.
Although there was some lag in the effects on the over-bidding, the design change appears to
have driven the over-bidding down, as can be seen in Figure 4–2.
4.3. Virtual Trading
Market Participants in SPP’s Integrated Marketplace may submit virtual energy offers and bids
at any settlement location in the Day-Ahead Market. Virtual offers represent energy sales to the
Day-Ahead Market that the participant needs to buy back in the Real-Time Balancing Market.
These are referred to as “INCs,” or increment offers that emulate generation. Virtual bids
represent energy purchases in the Day-Ahead Market that the participant needs to sell back in the
Real-Time Balancing Market. These are referred to as “DECs,” or decrement bids that emulate
load. The value of virtual trading lies in its potential to converge Day-Ahead and RTBM LMPs.
Convergence due to virtuals requires sufficient competition in virtual trading; transparency in
Day-Ahead Market, RUC, and RTBM operating practices; and predictability of market events.
The first two years of the market experienced moderate levels of virtual participation, consistent
profitability of virtual trading, and increasing convergence of DA Market and RTBM LMPs. All
these factors indicate a reasonably efficient virtual market.
4. Day-Ahead Market
2015 State of the Market | 88
Figure 4–3 displays the total volume of virtual transactions as a percentage of SPP market load.
It averaged 7.5% for 2015, compared to 6.8% for the period of March through December of
2014. The increase was in cleared virtual bids, 2.6% compared to 3.5%, where virtual offers
remained constant at 4%. In 2015 the monthly pattern of cleared virtuals realized the lowest
percentages during the summer and the highest during the spring and fall. This pattern is
consistent with what was seen in the first 10 months of the Integrated Marketplace in 2014.
Figure 4–3 Virtual Transactions as Percentage of SPP Market Load, 2014–2015
At about 7.5% of load, the average hourly total volume of cleared virtuals ranged from 1,550 to
2,735 MW. The average hourly volume that did not clear ranged from 1,911 to 3,059 MW. The
net cleared virtual positions in the market averaged about 127 MW, indicating that virtual trading
did not generally distort the relative DA Market to RTBM market load balance. As shown in
Figure 4–3 above, the percentage of cleared virtuals was lowest during summer months. Figure
4–4 below indicates that bids (cleared and uncleared) realize more fluctuation during these
summer months. November experienced the highest levels of virtual activity. This was the result
of increased activity at Settlement Locations in the Integrated System, particularly in the
congested North Dakota area.
Figure 4–4 also shows cleared demand bids that offered more than $30/MWh over the realized
real-time LMP, and the supply offers offered at less than $30/MWh under the realized real-time
LMP. These types of bids and offers are called “price-insensitive” and occur more often with
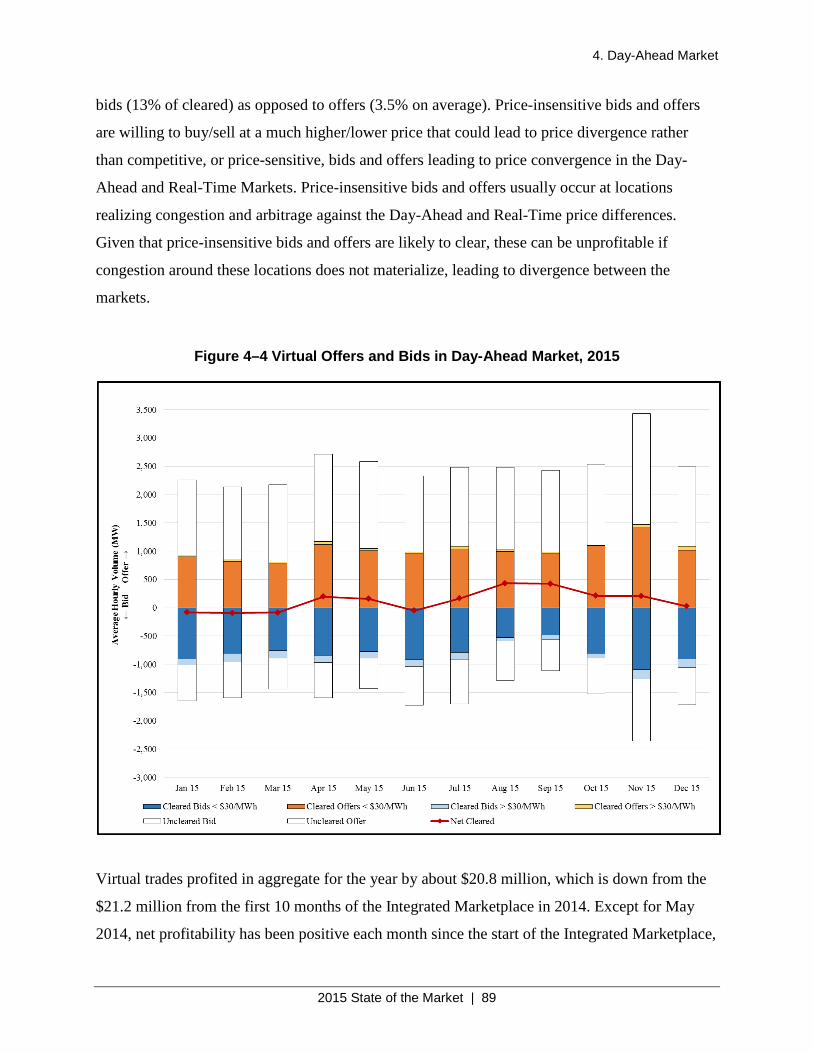
4. Day-Ahead Market
2015 State of the Market | 89
bids (13% of cleared) as opposed to offers (3.5% on average). Price-insensitive bids and offers
are willing to buy/sell at a much higher/lower price that could lead to price divergence rather
than competitive, or price-sensitive, bids and offers leading to price convergence in the Day-
Ahead and Real-Time Markets. Price-insensitive bids and offers usually occur at locations
realizing congestion and arbitrage against the Day-Ahead and Real-Time price differences.
Given that price-insensitive bids and offers are likely to clear, these can be unprofitable if
congestion around these locations does not materialize, leading to divergence between the
markets.
Figure 4–4 Virtual Offers and Bids in Day-Ahead Market, 2015
Virtual trades profited in aggregate for the year by about $20.8 million, which is down from the
$21.2 million from the first 10 months of the Integrated Marketplace in 2014. Except for May
2014, net profitability has been positive each month since the start of the Integrated Marketplace,
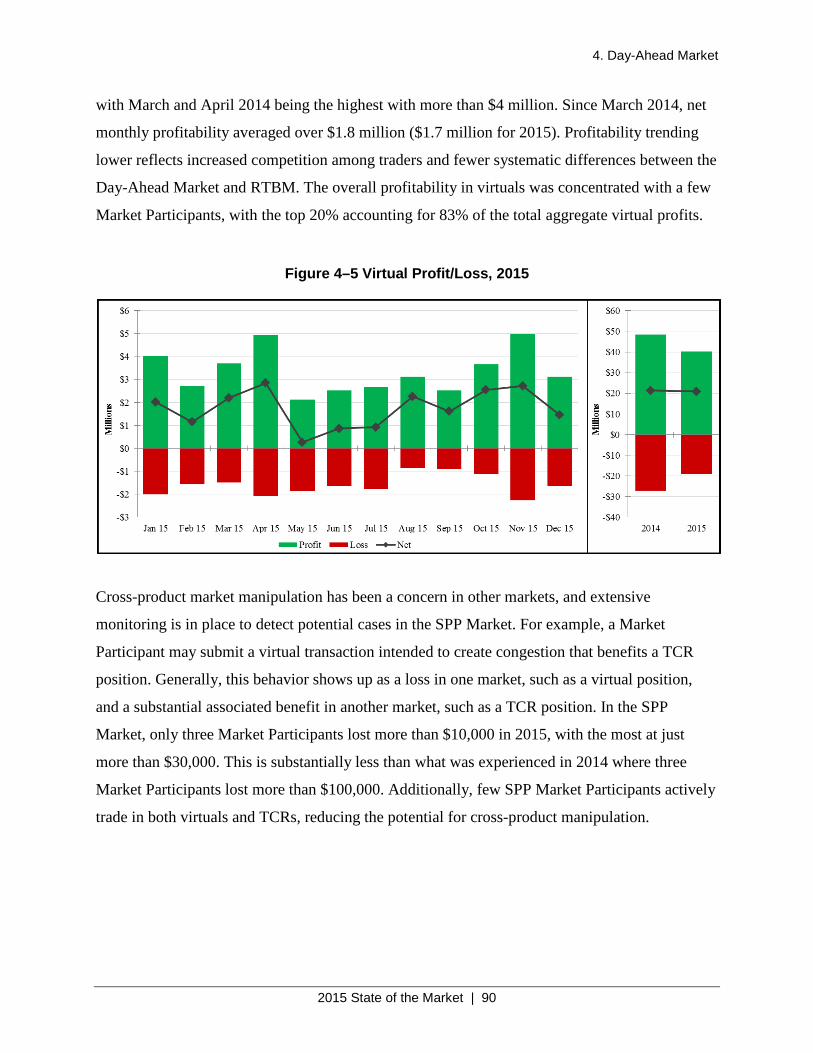
4. Day-Ahead Market
2015 State of the Market | 90
with March and April 2014 being the highest with more than $4 million. Since March 2014, net
monthly profitability averaged over $1.8 million ($1.7 million for 2015). Profitability trending
lower reflects increased competition among traders and fewer systematic differences between the
Day-Ahead Market and RTBM. The overall profitability in virtuals was concentrated with a few
Market Participants, with the top 20% accounting for 83% of the total aggregate virtual profits.
Figure 4–5 Virtual Profit/Loss, 2015
Cross-product market manipulation has been a concern in other markets, and extensive
monitoring is in place to detect potential cases in the SPP Market. For example, a Market
Participant may submit a virtual transaction intended to create congestion that benefits a TCR
position. Generally, this behavior shows up as a loss in one market, such as a virtual position,
and a substantial associated benefit in another market, such as a TCR position. In the SPP
Market, only three Market Participants lost more than $10,000 in 2015, with the most at just
more than $30,000. This is substantially less than what was experienced in 2014 where three
Market Participants lost more than $100,000. Additionally, few SPP Market Participants actively
trade in both virtuals and TCRs, reducing the potential for cross-product manipulation.
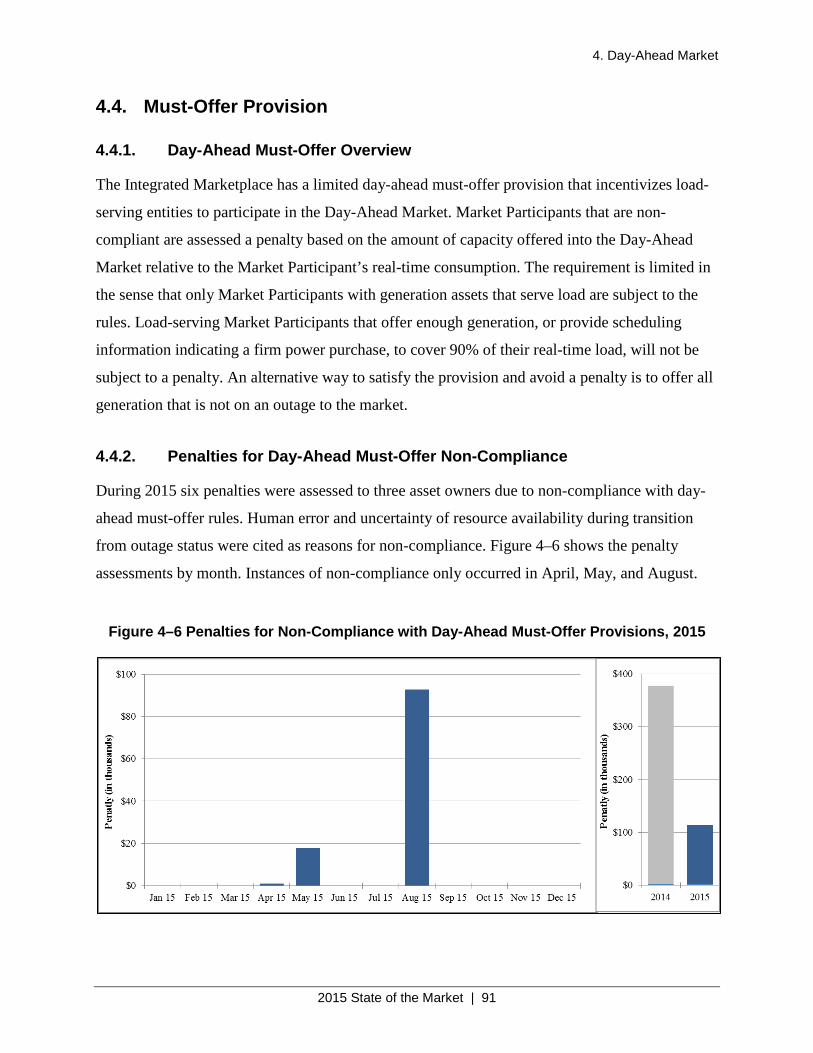
4. Day-Ahead Market
2015 State of the Market | 91
4.4. Must-Offer Provision
4.4.1. Day-Ahead Must-Offer Overview
The Integrated Marketplace has a limited day-ahead must-offer provision that incentivizes load-
serving entities to participate in the Day-Ahead Market. Market Participants that are non-
compliant are assessed a penalty based on the amount of capacity offered into the Day-Ahead
Market relative to the Market Participant’s real-time consumption. The requirement is limited in
the sense that only Market Participants with generation assets that serve load are subject to the
rules. Load-serving Market Participants that offer enough generation, or provide scheduling
information indicating a firm power purchase, to cover 90% of their real-time load, will not be
subject to a penalty. An alternative way to satisfy the provision and avoid a penalty is to offer all
generation that is not on an outage to the market.
4.4.2. Penalties for Day-Ahead Must-Offer Non-Compliance
During 2015 six penalties were assessed to three asset owners due to non-compliance with day-
ahead must-offer rules. Human error and uncertainty of resource availability during transition
from outage status were cited as reasons for non-compliance. Figure 4–6 shows the penalty
assessments by month. Instances of non-compliance only occurred in April, May, and August.
Figure 4–6 Penalties for Non-Compliance with Day-Ahead Must-Offer Provisions, 2015
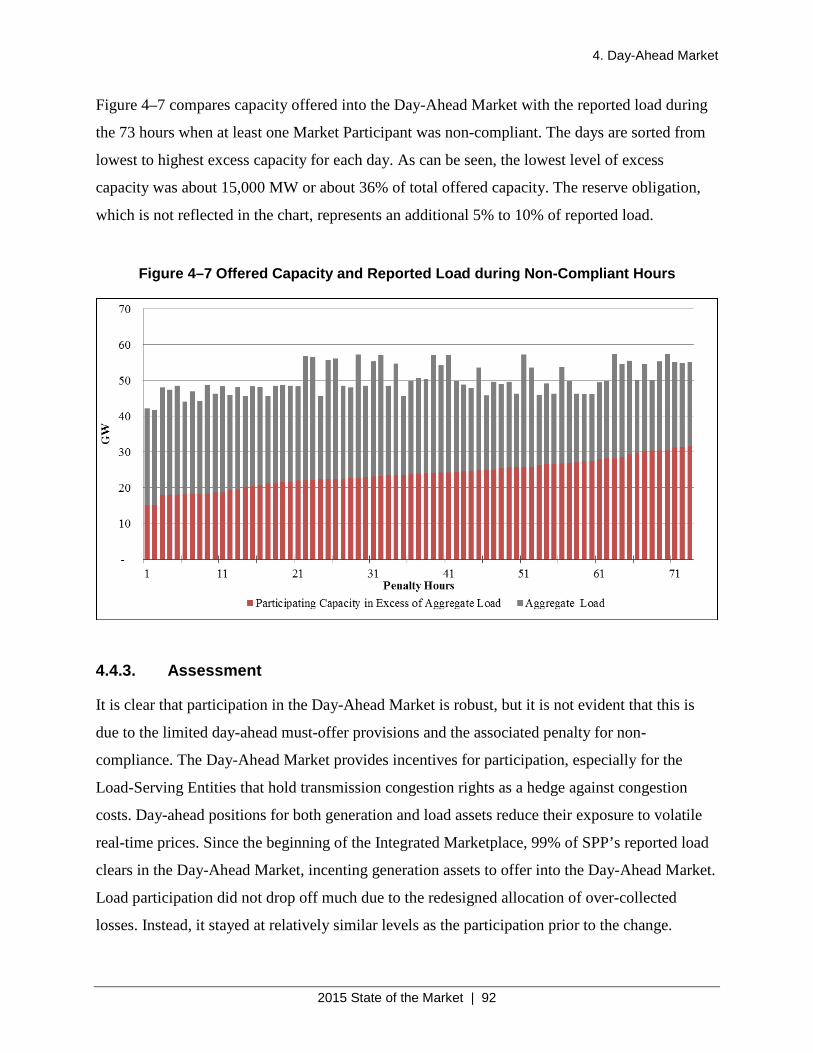
4. Day-Ahead Market
2015 State of the Market | 92
Figure 4–7 compares capacity offered into the Day-Ahead Market with the reported load during
the 73 hours when at least one Market Participant was non-compliant. The days are sorted from
lowest to highest excess capacity for each day. As can be seen, the lowest level of excess
capacity was about 15,000 MW or about 36% of total offered capacity. The reserve obligation,
which is not reflected in the chart, represents an additional 5% to 10% of reported load.
Figure 4–7 Offered Capacity and Reported Load during Non-Compliant Hours
4.4.3. Assessment
It is clear that participation in the Day-Ahead Market is robust, but it is not evident that this is
due to the limited day-ahead must-offer provisions and the associated penalty for non-
compliance. The Day-Ahead Market provides incentives for participation, especially for the
Load-Serving Entities that hold transmission congestion rights as a hedge against congestion
costs. Day-ahead positions for both generation and load assets reduce their exposure to volatile
real-time prices. Since the beginning of the Integrated Marketplace, 99% of SPP’s reported load
clears in the Day-Ahead Market, incenting generation assets to offer into the Day-Ahead Market.
Load participation did not drop off much due to the redesigned allocation of over-collected
losses. Instead, it stayed at relatively similar levels as the participation prior to the change.
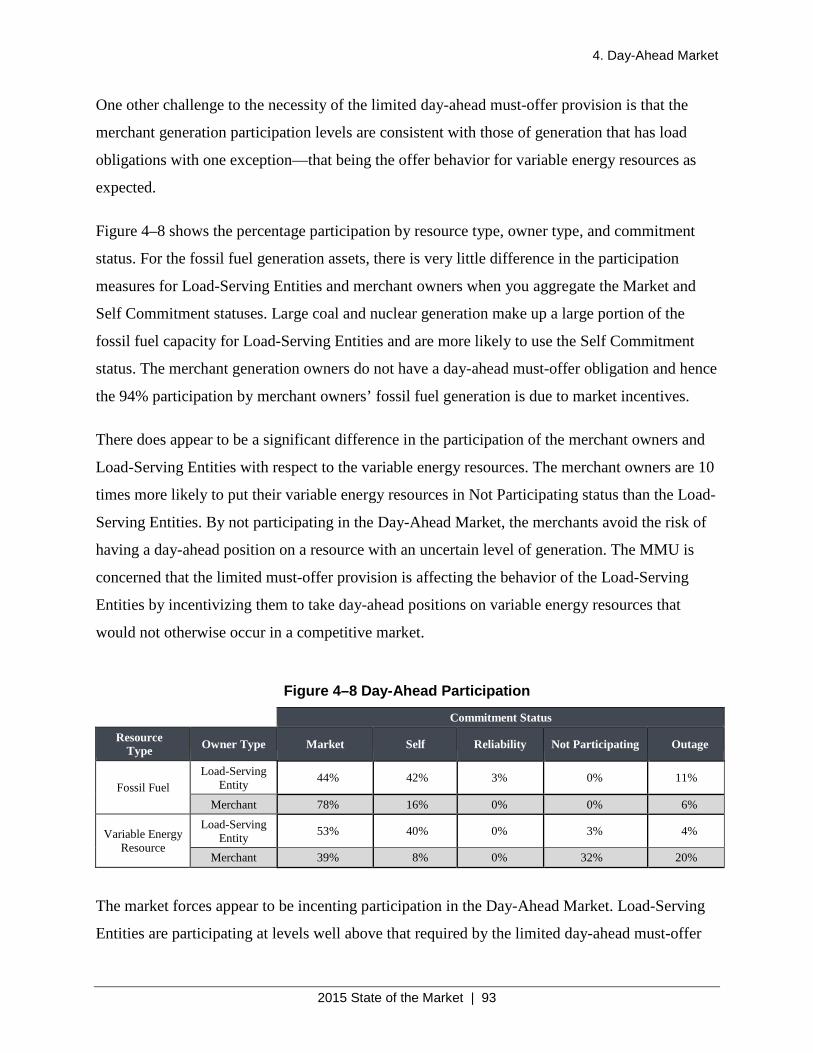
4. Day-Ahead Market
2015 State of the Market | 93
One other challenge to the necessity of the limited day-ahead must-offer provision is that the
merchant generation participation levels are consistent with those of generation that has load
obligations with one exception—that being the offer behavior for variable energy resources as
expected.
Figure 4–8 shows the percentage participation by resource type, owner type, and commitment
status. For the fossil fuel generation assets, there is very little difference in the participation
measures for Load-Serving Entities and merchant owners when you aggregate the Market and
Self Commitment statuses. Large coal and nuclear generation make up a large portion of the
fossil fuel capacity for Load-Serving Entities and are more likely to use the Self Commitment
status. The merchant generation owners do not have a day-ahead must-offer obligation and hence
the 94% participation by merchant owners’ fossil fuel generation is due to market incentives.
There does appear to be a significant difference in the participation of the merchant owners and
Load-Serving Entities with respect to the variable energy resources. The merchant owners are 10
times more likely to put their variable energy resources in Not Participating status than the Load-
Serving Entities. By not participating in the Day-Ahead Market, the merchants avoid the risk of
having a day-ahead position on a resource with an uncertain level of generation. The MMU is
concerned that the limited must-offer provision is affecting the behavior of the Load-Serving
Entities by incentivizing them to take day-ahead positions on variable energy resources that
would not otherwise occur in a competitive market.
Figure 4–8 Day-Ahead Participation
Commitment Status Resource
Type Owner Type Market Self Reliability Not Participating Outage
Fossil Fuel Load-Serving
Entity 44% 42% 3% 0% 11%
Merchant 78% 16% 0% 0% 6%
Variable Energy Resource
Load-Serving Entity 53% 40% 0% 3% 4%
Merchant 39% 8% 0% 32% 20%
The market forces appear to be incenting participation in the Day-Ahead Market. Load-Serving
Entities are participating at levels well above that required by the limited day-ahead must-offer
4. Day-Ahead Market
2015 State of the Market | 94
provisions. The merchant generation is choosing to participate in the Day-Ahead Market at levels
comparable to the Load-Serving Entities, and a very high level of load is clearing in the Day-
Ahead Market without any rules governing the participation of load. The SPP Market Working
Group has a pending revision request to remove the Day-Ahead Must-Offer provision.
4.4.4. Update on the 2014 Recommendation by the MMU on the Day-Ahead Must-Offer Requirement Provision
In 2014 the MMU recommended that SPP eliminate the limited day-ahead must-offer provision
and revise the physical withholding rules to include a penalty for non-compliance based on the
premise that the recommended penalty provision would be sufficient to ensure an efficient level
of participation in the Day-Ahead Market.
Market Participants approved a proposal to eliminate the current limited Day-Ahead Must-Offer
provision of the SPP Tariff. In the meantime, the MMU submitted a proposal that introduced
conduct thresholds and impact test requirement for physical withholding penalties in conjunction
with establishing a formula-based penalty structure.20 The MMU engaged in discussions with the
Market Participants through May 2016, at which time the MMU decided to withdraw its
proposal and perform studies including simulations regarding implementation and impact of the
new proposal on the marketplace.21 The MMU plans to bring back its proposal to Market
Participants as early as the intended work is completed.
Similarly, in 2014 the MMU made the assessment that in the event the limited must-offer
provision is continued, five weaknesses in the current provisions should be addressed, which still
remain valid:
1) A Market Participant with load assets can avoid a day-ahead must-offer obligation
entirely by registering its load assets and generation assets under different asset
owners.
2) There is no requirement or incentive for an SPP Market Participant with a day-ahead
must-offer obligation to report a firm power sale. For example, in the case that the 20 The MMU submitted RR135-Revision of Physical Withholding Rules to the MWG in December 2015. 21 The Market Working Group (MWG) approved Revision Request (RR)-125 Removal of Day-Ahead Limited Must-Offer in November 2015 and Markets and Operations Policy Committee (MOPC) tabled it in July 2016 until July 2017 or the MMU’s resubmission of RR135.
4. Day-Ahead Market
2015 State of the Market | 95
purchaser is an SPP Market Participant that chooses not to report the purchase, the
seller is not required to inform SPP or the MMU of this transaction and it may not be
properly accounted for with respect to the seller’s day-ahead must-offer obligation.
3) The current design forces Market Participants to take a day-ahead position on
Variable Energy Resources. These resources should be exempted from the must-offer
requirement.
4) There is no automated link between the must-offer penalty calculation and the
generation outages system. The current system is reliant on the Market Participant
correctly report the outage in the day-ahead market offer submissions.
5) The non-controlling asset owner of a jointly owned resource is at risk of being non-
compliant if the controlling asset owner chooses to put the resource in Not
Participating status.
5. Congestion and Losses
2015 State of the Market | 96
5. Congestion and Losses
The Locational Marginal Price (LMP) for the almost 19,000 pricing nodes in the SPP Market
reflects the sum of three components:
1) System-wide marginal cost of the energy required to serve the market (Marginal
Energy Component, or MEC)
2) The marginal cost of any increase or decrease in energy at a location with respect to
transmission constraints (Marginal Congestion Component, or MCC)
3) The marginal cost of any increase or decrease in energy to minimize system
transmission losses (Marginal Loss Component, or MLC)
Thus,
𝐿𝐿𝐿𝐿𝐿𝐿 = 𝐿𝐿𝑀𝑀𝑀𝑀 + 𝐿𝐿𝑀𝑀𝑀𝑀 + 𝐿𝐿𝐿𝐿𝑀𝑀
Locational prices are a key feature of electricity markets, providing price signals that ensure the
efficient scheduling, commitment, and dispatch of generation in the presence of reliability
constraints and efficient incentives for future investment. This section describes the many
aspects of LMP as:
• Geographic pattern of congestion and losses
• Changes in the transmission system that alter congestion patterns
• Congestion impacts on local market power
• Load-Serving Entities hedging congestion costs in the Transmission Congestion
Rights market
• Distribution of marginal congestion and loss revenues
5.1. Geographic Pricing Patterns
Figure 5–1 and Figure 5–2 are price contour maps showing the Day-Ahead Market and Real-
Time Balancing Market average LMPs in 2015. The annual average Day-Ahead Market LMP
ranges from $17/MWh–19/MWh in most of the Dakotas and Western Nebraska, to $40/MWh in
the Woodward area of Northwest Oklahoma. With the exception of the Northern area of North
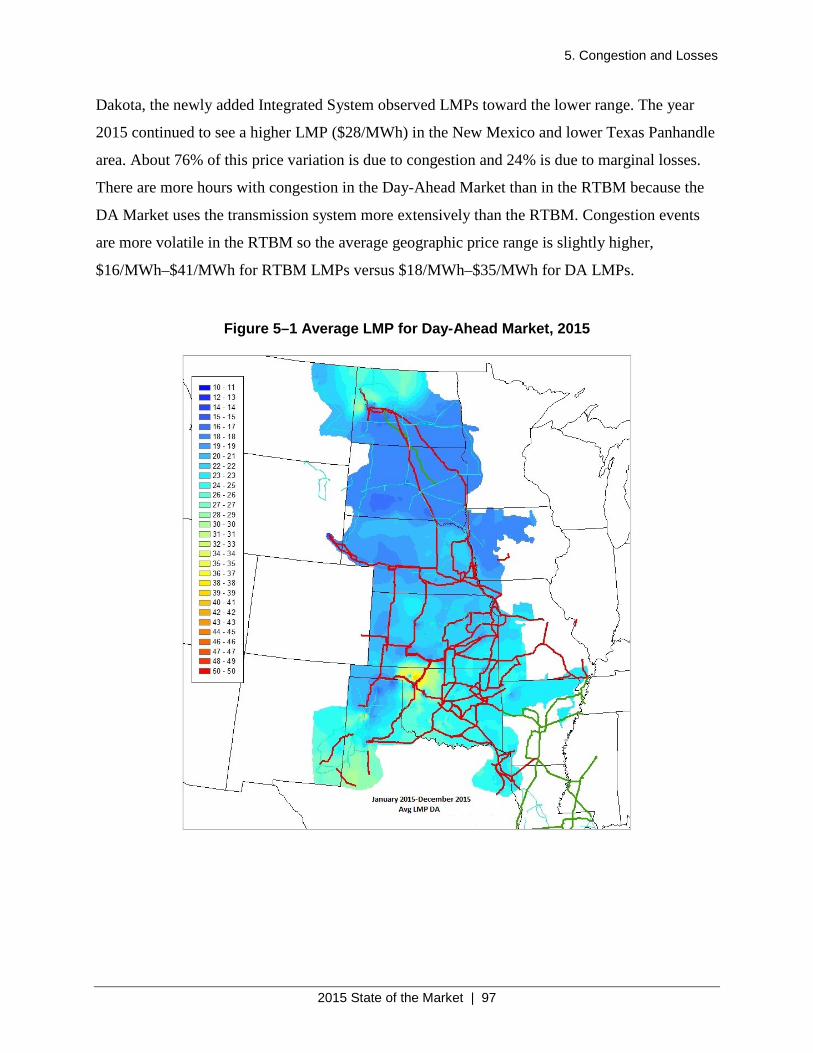
5. Congestion and Losses
2015 State of the Market | 97
Dakota, the newly added Integrated System observed LMPs toward the lower range. The year
2015 continued to see a higher LMP ($28/MWh) in the New Mexico and lower Texas Panhandle
area. About 76% of this price variation is due to congestion and 24% is due to marginal losses.
There are more hours with congestion in the Day-Ahead Market than in the RTBM because the
DA Market uses the transmission system more extensively than the RTBM. Congestion events
are more volatile in the RTBM so the average geographic price range is slightly higher,
$16/MWh–$41/MWh for RTBM LMPs versus $18/MWh–$35/MWh for DA LMPs.
Figure 5–1 Average LMP for Day-Ahead Market, 2015
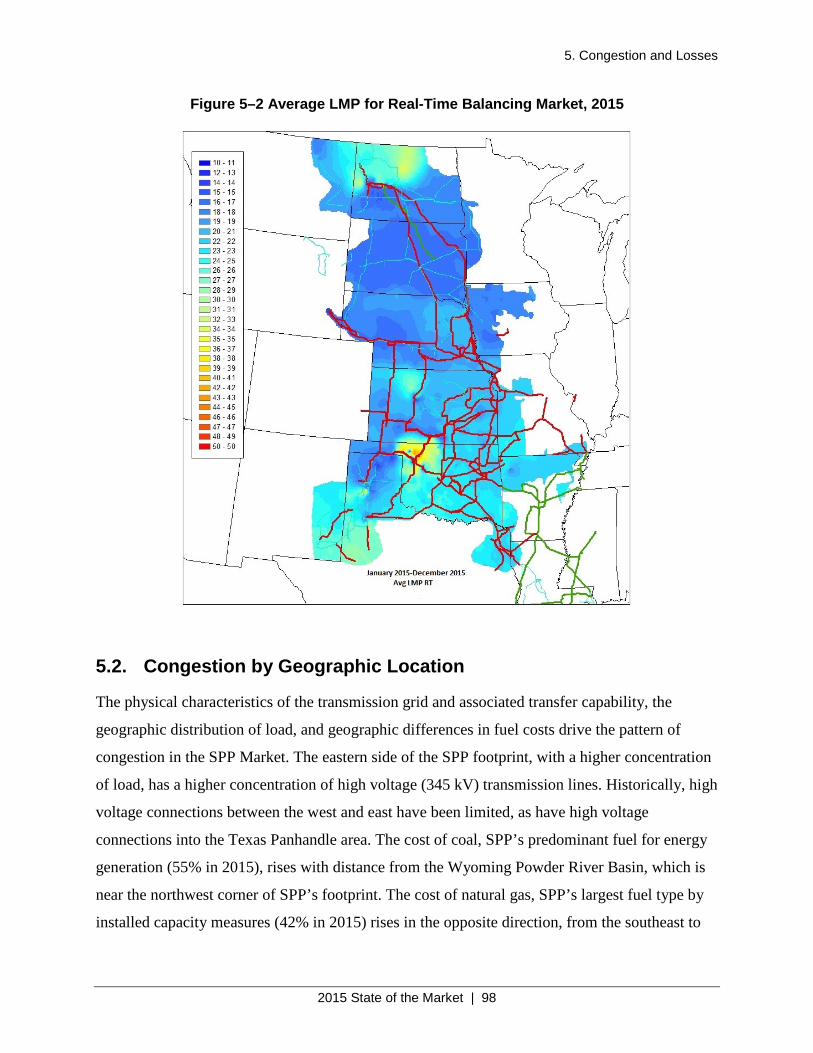
5. Congestion and Losses
2015 State of the Market | 98
Figure 5–2 Average LMP for Real-Time Balancing Market, 2015
5.2. Congestion by Geographic Location
The physical characteristics of the transmission grid and associated transfer capability, the
geographic distribution of load, and geographic differences in fuel costs drive the pattern of
congestion in the SPP Market. The eastern side of the SPP footprint, with a higher concentration
of load, has a higher concentration of high voltage (345 kV) transmission lines. Historically, high
voltage connections between the west and east have been limited, as have high voltage
connections into the Texas Panhandle area. The cost of coal, SPP’s predominant fuel for energy
generation (55% in 2015), rises with distance from the Wyoming Powder River Basin, which is
near the northwest corner of SPP’s footprint. The cost of natural gas, SPP’s largest fuel type by
installed capacity measures (42% in 2015) rises in the opposite direction, from the southeast to
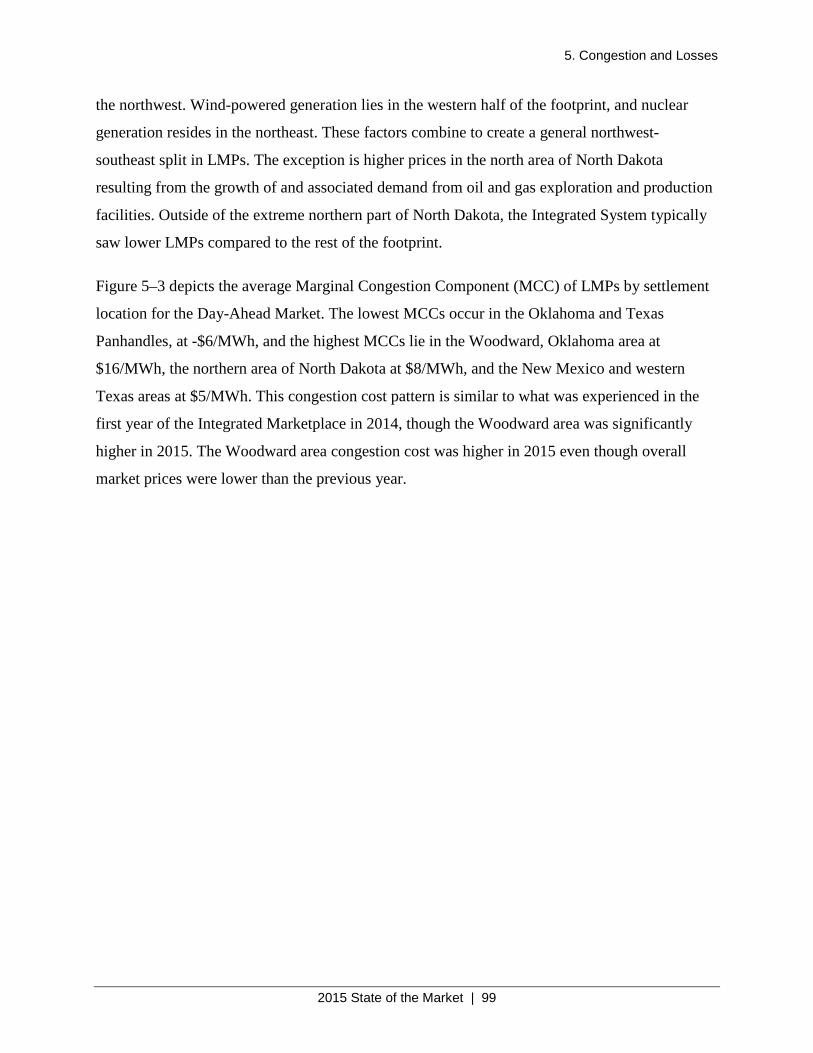
5. Congestion and Losses
2015 State of the Market | 99
the northwest. Wind-powered generation lies in the western half of the footprint, and nuclear
generation resides in the northeast. These factors combine to create a general northwest-
southeast split in LMPs. The exception is higher prices in the north area of North Dakota
resulting from the growth of and associated demand from oil and gas exploration and production
facilities. Outside of the extreme northern part of North Dakota, the Integrated System typically
saw lower LMPs compared to the rest of the footprint.
Figure 5–3 depicts the average Marginal Congestion Component (MCC) of LMPs by settlement
location for the Day-Ahead Market. The lowest MCCs occur in the Oklahoma and Texas
Panhandles, at -$6/MWh, and the highest MCCs lie in the Woodward, Oklahoma area at
$16/MWh, the northern area of North Dakota at $8/MWh, and the New Mexico and western
Texas areas at $5/MWh. This congestion cost pattern is similar to what was experienced in the
first year of the Integrated Marketplace in 2014, though the Woodward area was significantly
higher in 2015. The Woodward area congestion cost was higher in 2015 even though overall
market prices were lower than the previous year.
5. Congestion and Losses
2015 State of the Market | 100
Figure 5–3 Average MCC for Day-Ahead Market, 2015
SPP energized major transmission projects in 2014 that allowed for increased transfer of
inexpensive wind generation from the west. These impacts were observed when analyzing
congestion, losses, and Frequently Constrained Areas for 2015. The projects energized in 2015
are shown in Figure 5–4. New 345 kV lines brought into service are depicted in solid red and
230kV in solid green.
• Nashua 345kV Project
o Energized: April 2015
o Nashua 345/161kV transformer and tap between St. Joseph and Hawthorn 345kV
• Iatan – Nashua 345kVPotash Junction – Road Runner 345kV
o Energized: October 2015
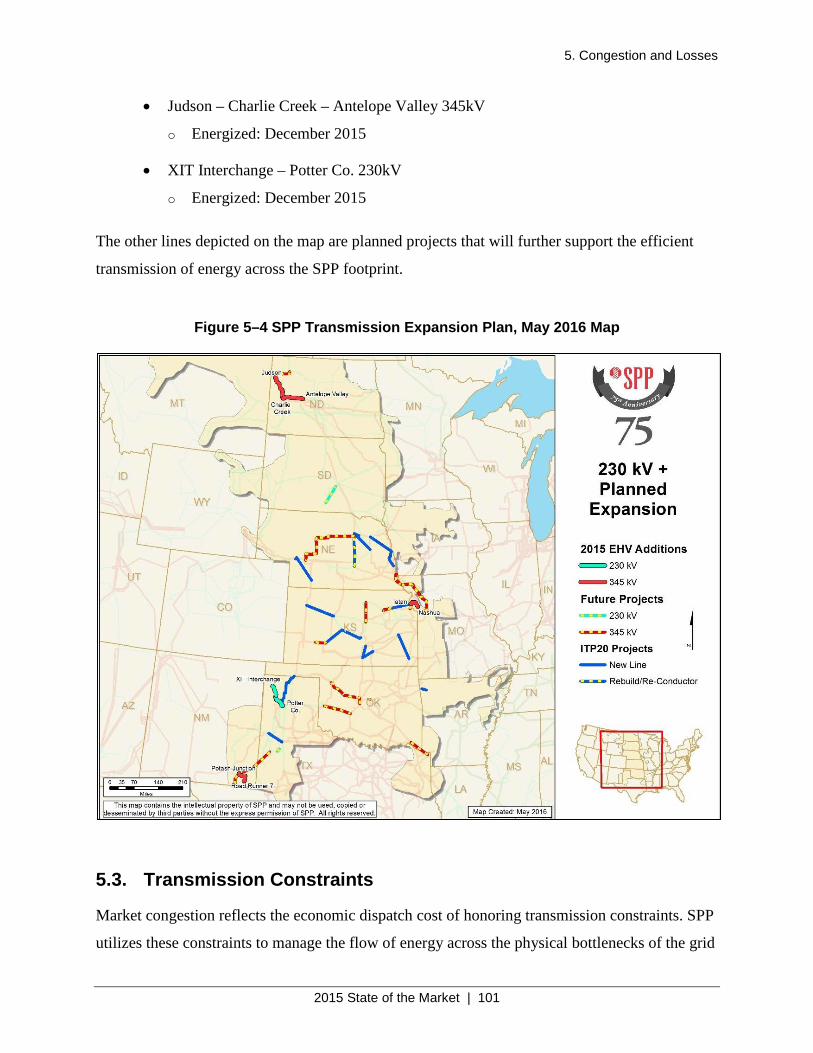
5. Congestion and Losses
2015 State of the Market | 101
• Judson – Charlie Creek – Antelope Valley 345kV
o Energized: December 2015
• XIT Interchange – Potter Co. 230kV
o Energized: December 2015
The other lines depicted on the map are planned projects that will further support the efficient
transmission of energy across the SPP footprint.
Figure 5–4 SPP Transmission Expansion Plan, May 2016 Map
5.3. Transmission Constraints
Market congestion reflects the economic dispatch cost of honoring transmission constraints. SPP
utilizes these constraints to manage the flow of energy across the physical bottlenecks of the grid
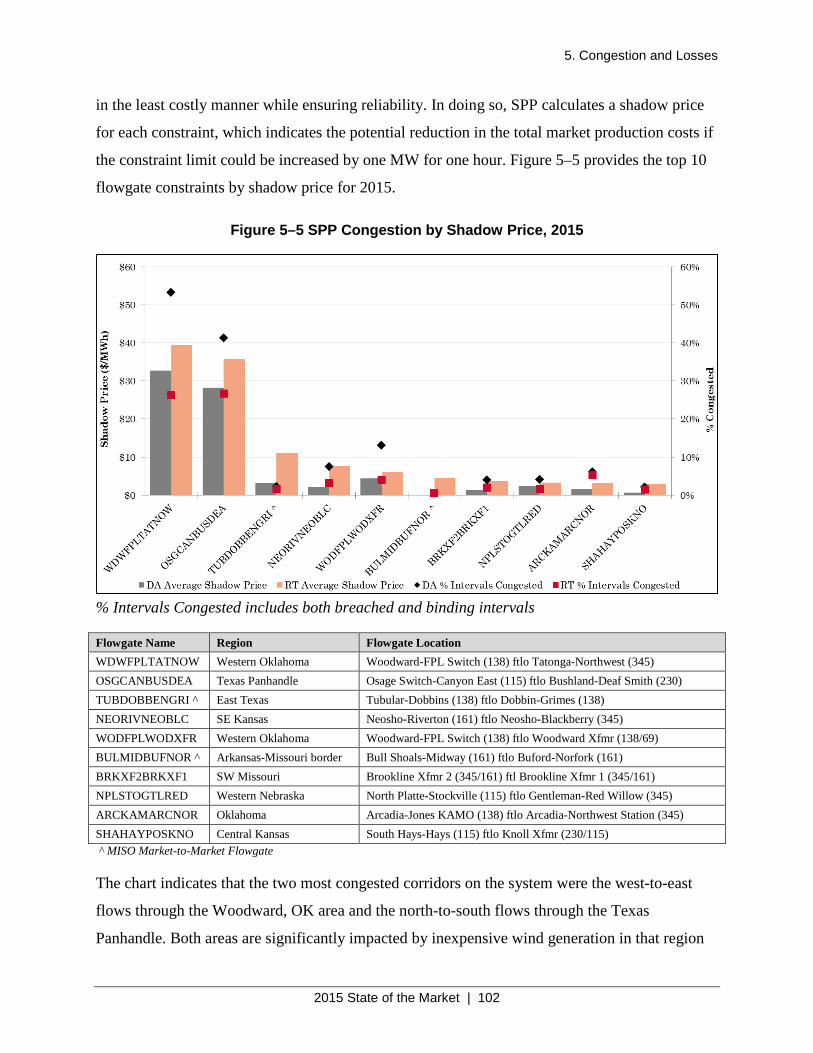
5. Congestion and Losses
2015 State of the Market | 102
in the least costly manner while ensuring reliability. In doing so, SPP calculates a shadow price
for each constraint, which indicates the potential reduction in the total market production costs if
the constraint limit could be increased by one MW for one hour. Figure 5–5 provides the top 10
flowgate constraints by shadow price for 2015.
Figure 5–5 SPP Congestion by Shadow Price, 2015
% Intervals Congested includes both breached and binding intervals
Flowgate Name Region Flowgate Location WDWFPLTATNOW Western Oklahoma Woodward-FPL Switch (138) ftlo Tatonga-Northwest (345) OSGCANBUSDEA Texas Panhandle Osage Switch-Canyon East (115) ftlo Bushland-Deaf Smith (230) TUBDOBBENGRI ^ East Texas Tubular-Dobbins (138) ftlo Dobbin-Grimes (138) NEORIVNEOBLC SE Kansas Neosho-Riverton (161) ftlo Neosho-Blackberry (345) WODFPLWODXFR Western Oklahoma Woodward-FPL Switch (138) ftlo Woodward Xfmr (138/69) BULMIDBUFNOR ^ Arkansas-Missouri border Bull Shoals-Midway (161) ftlo Buford-Norfork (161) BRKXF2BRKXF1 SW Missouri Brookline Xfmr 2 (345/161) ftl Brookline Xfmr 1 (345/161) NPLSTOGTLRED Western Nebraska North Platte-Stockville (115) ftlo Gentleman-Red Willow (345) ARCKAMARCNOR Oklahoma Arcadia-Jones KAMO (138) ftlo Arcadia-Northwest Station (345) SHAHAYPOSKNO Central Kansas South Hays-Hays (115) ftlo Knoll Xfmr (230/115) ^ MISO Market-to-Market Flowgate
The chart indicates that the two most congested corridors on the system were the west-to-east
flows through the Woodward, OK area and the north-to-south flows through the Texas
Panhandle. Both areas are significantly impacted by inexpensive wind generation in that region
5. Congestion and Losses
2015 State of the Market | 103
of the market. The Woodward, OK and surrounding areas had extensive 345kV buildouts
energized in 2014, allowing higher transfers of wind generation to the more populated and high-
cost eastern portion of SPP. The Texas Panhandle corridor relies mainly on 230 kV transmission
lines between Amarillo and Lubbock, TX. The transmission corridor is impacted by the
predominantly gas-fired generation in the south that is more expensive than wind generation to
the north. It is important to note that the Woodward and Texas Panhandle constraints occur in
over 25% of RTBM intervals and over 40% in the Day-Ahead Market. The next highest
constraints occur in only 5% of RTBM and 7% of Day-Ahead Market. The Woodward, OK and
surrounding areas had extensive 345kV buildouts energized in 2014, allowing higher transfers of
wind generation to the more populated eastern portion of SPP where more expensive gas and
coal-fired generation reside.
A notable constraint missing from the 2015 list is the Kansas City area constraint Iatan –
Stranger Creek 345kV for the loss of St. Joe – Hawthorn 345kV. The Nashua 345kV tap between
St. Joe – Hawthorn energized in April 2015 and the Iatan – Nashua 345kV line energized in May
2015 appear to have alleviated much of the loading in this area.
5.3.1. Texas Panhandle
The Texas Panhandle area from Lubbock southwest into southwest New Mexico has historically
been the most congested transmission corridor in the SPP Market. In 2015 it was the second
most congested area, which is represented by the high shadow price on the Osage Switch-
Canyon East Flowgate. The 2015 RTBM shadow price for this flowgate was about $36/MWh
compared to about $80/MWh in 2014 and about $44/MWh in 2013. The Day-Ahead Market also
realized a decrease from about $73/MWh for the first 12 months of the Market to $28/MWh in
2015. This significant decline in the cost of congestion for this is as would be expected given the
additional 345kV transmission facilities in the area and the overall lower electricity prices.
5. Congestion and Losses
2015 State of the Market | 104
Upgrades to the transmission system in the last three years that have helped address the
congestion in the Texas Panhandle area are:
• 230 kV line from the Randall County Interchange to the Amarillo South Interchange,
energized in April 2013, has eliminated the SPS North-South constraint from the top
ten flowgate list
• 345 kV line from the Tuco Interchange to Woodward, OK, energized in September
2014
5.3.2. Western Oklahoma
The most significant change to the SPP transmission system in 2014 and 2015 was the addition
of the 345kV double circuit from Hitchland to Woodward, which went into service in May 2014.
The line enables SPP to move more energy from the wind generation corridor in the west to the
load centers in the east. This buildout appears to have resulted in complications on the lower
voltage system in the Woodward area, as reflected in the significant increase in congestion. The
average Woodward-FPL Switch Flowgate shadow price for 2014 was about $19/MWh and
increased to about $39/MWh in 2015 even though overall electric price declined about 30%.
The west-east price differentials in this area create a transmission bottleneck at Woodward, as
indicated by two of the top 10 flowgates. The Woodward to FPL Switch 138kV for the loss of
Tatonga to Northwest 345kV had the highest shadow price, at $39/MWh in the RTBM and
$33/MWh in the Day-Ahead Market. This compares to $21/MWh and $14/MWh in 2014 for
RTBM and Day-Ahead, respectively. The Woodward to FPL Switch for the loss of Woodward
138/69kV transformer also appears in the top 10 congested constraints for 2015 with a shadow
price of $6/MWh in the RTBM and $4/MWh in the Day-Ahead Market. There is further
expansion planned in the Western Oklahoma area that provides for more transfer of wind
generation from west to east and is listed in Figure 5–6.
5.3.3. Southeast Kansas – Southwest Missouri
The Neosho – Riverton 161kV for the loss of Neosho – Blackberry 345kV in SE Kansas and the
Brookline 345/161kV #2 transformer for the loss of Brookline 345/161 #1 transformer in SW
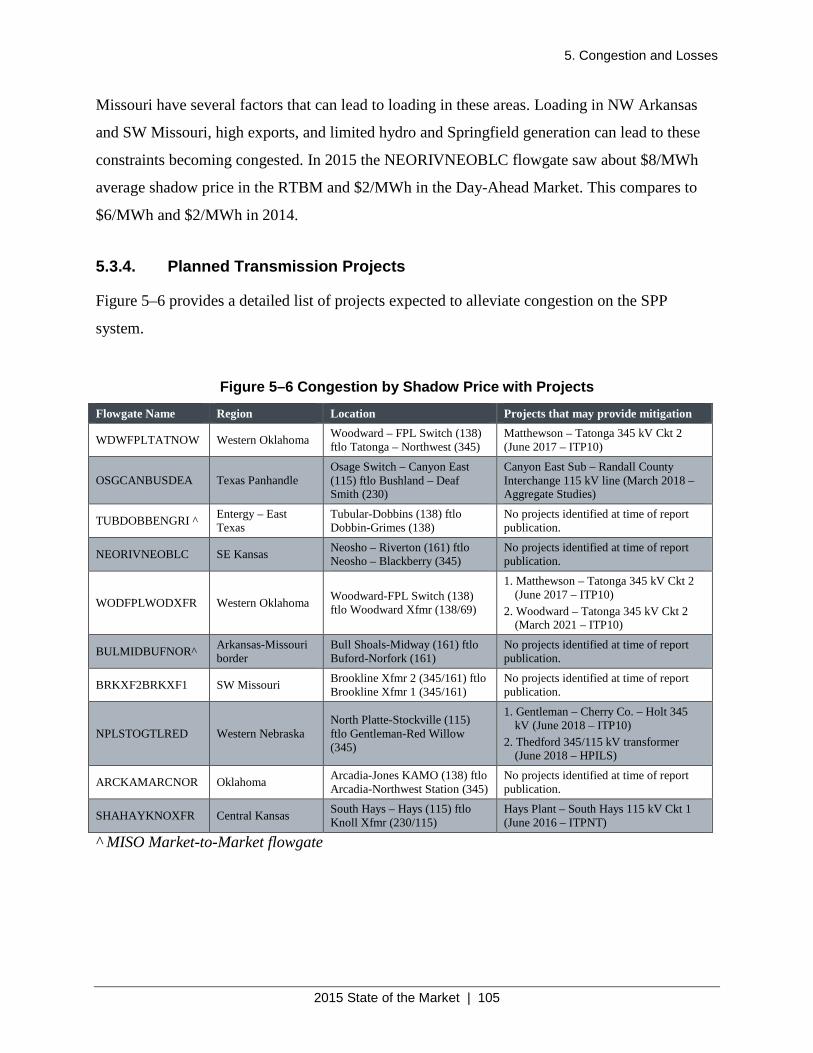
5. Congestion and Losses
2015 State of the Market | 105
Missouri have several factors that can lead to loading in these areas. Loading in NW Arkansas
and SW Missouri, high exports, and limited hydro and Springfield generation can lead to these
constraints becoming congested. In 2015 the NEORIVNEOBLC flowgate saw about $8/MWh
average shadow price in the RTBM and $2/MWh in the Day-Ahead Market. This compares to
$6/MWh and $2/MWh in 2014.
5.3.4. Planned Transmission Projects
Figure 5–6 provides a detailed list of projects expected to alleviate congestion on the SPP
system.
Figure 5–6 Congestion by Shadow Price with Projects
Flowgate Name Region Location Projects that may provide mitigation
WDWFPLTATNOW Western Oklahoma Woodward – FPL Switch (138) ftlo Tatonga – Northwest (345)
Matthewson – Tatonga 345 kV Ckt 2 (June 2017 – ITP10)
OSGCANBUSDEA Texas Panhandle Osage Switch – Canyon East (115) ftlo Bushland – Deaf Smith (230)
Canyon East Sub – Randall County Interchange 115 kV line (March 2018 – Aggregate Studies)
TUBDOBBENGRI ^ Entergy – East Texas
Tubular-Dobbins (138) ftlo Dobbin-Grimes (138)
No projects identified at time of report publication.
NEORIVNEOBLC SE Kansas Neosho – Riverton (161) ftlo Neosho – Blackberry (345)
No projects identified at time of report publication.
WODFPLWODXFR Western Oklahoma Woodward-FPL Switch (138) ftlo Woodward Xfmr (138/69)
1. Matthewson – Tatonga 345 kV Ckt 2 (June 2017 – ITP10)
2. Woodward – Tatonga 345 kV Ckt 2 (March 2021 – ITP10)
BULMIDBUFNOR^ Arkansas-Missouri border
Bull Shoals-Midway (161) ftlo Buford-Norfork (161)
No projects identified at time of report publication.
BRKXF2BRKXF1 SW Missouri Brookline Xfmr 2 (345/161) ftlo Brookline Xfmr 1 (345/161)
No projects identified at time of report publication.
NPLSTOGTLRED Western Nebraska North Platte-Stockville (115) ftlo Gentleman-Red Willow (345)
1. Gentleman – Cherry Co. – Holt 345 kV (June 2018 – ITP10)
2. Thedford 345/115 kV transformer (June 2018 – HPILS)
ARCKAMARCNOR Oklahoma Arcadia-Jones KAMO (138) ftlo Arcadia-Northwest Station (345)
No projects identified at time of report publication.
SHAHAYKNOXFR Central Kansas South Hays – Hays (115) ftlo Knoll Xfmr (230/115)
Hays Plant – South Hays 115 kV Ckt 1 (June 2016 – ITPNT)
^ MISO Market-to-Market flowgate
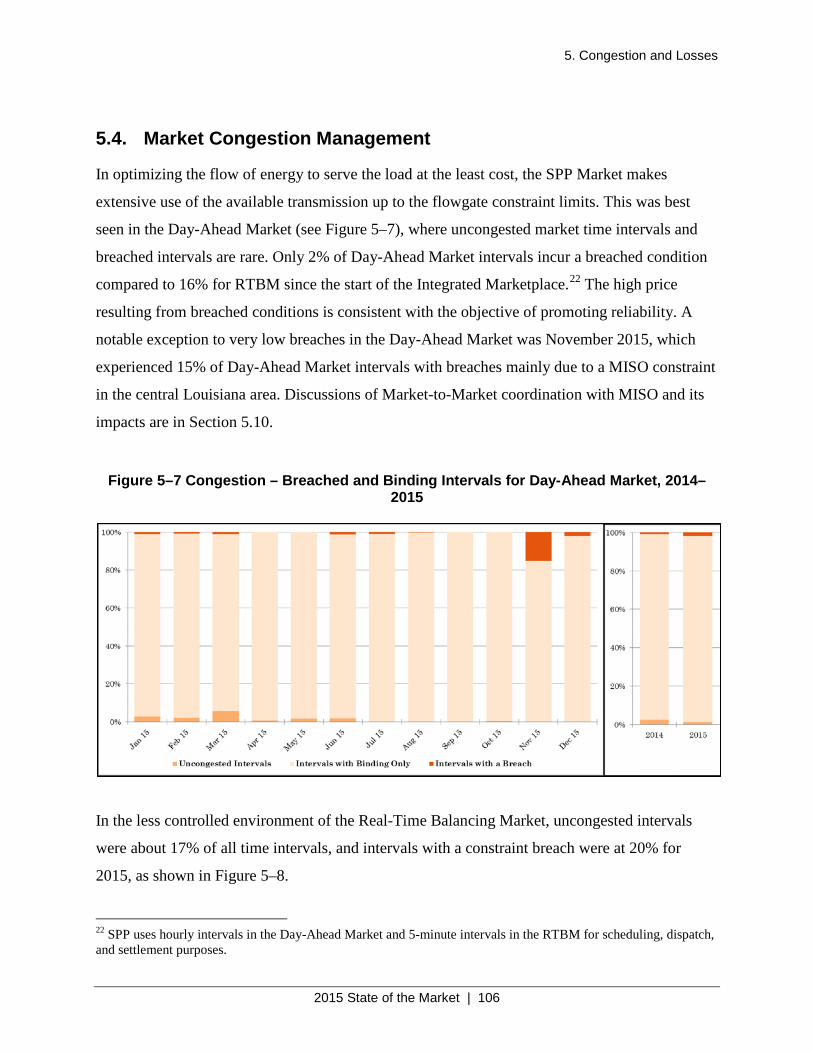
5. Congestion and Losses
2015 State of the Market | 106
5.4. Market Congestion Management
In optimizing the flow of energy to serve the load at the least cost, the SPP Market makes
extensive use of the available transmission up to the flowgate constraint limits. This was best
seen in the Day-Ahead Market (see Figure 5–7), where uncongested market time intervals and
breached intervals are rare. Only 2% of Day-Ahead Market intervals incur a breached condition
compared to 16% for RTBM since the start of the Integrated Marketplace.22 The high price
resulting from breached conditions is consistent with the objective of promoting reliability. A
notable exception to very low breaches in the Day-Ahead Market was November 2015, which
experienced 15% of Day-Ahead Market intervals with breaches mainly due to a MISO constraint
in the central Louisiana area. Discussions of Market-to-Market coordination with MISO and its
impacts are in Section 5.10.
Figure 5–7 Congestion – Breached and Binding Intervals for Day-Ahead Market, 2014–2015
In the less controlled environment of the Real-Time Balancing Market, uncongested intervals
were about 17% of all time intervals, and intervals with a constraint breach were at 20% for
2015, as shown in Figure 5–8.
22 SPP uses hourly intervals in the Day-Ahead Market and 5-minute intervals in the RTBM for scheduling, dispatch, and settlement purposes.
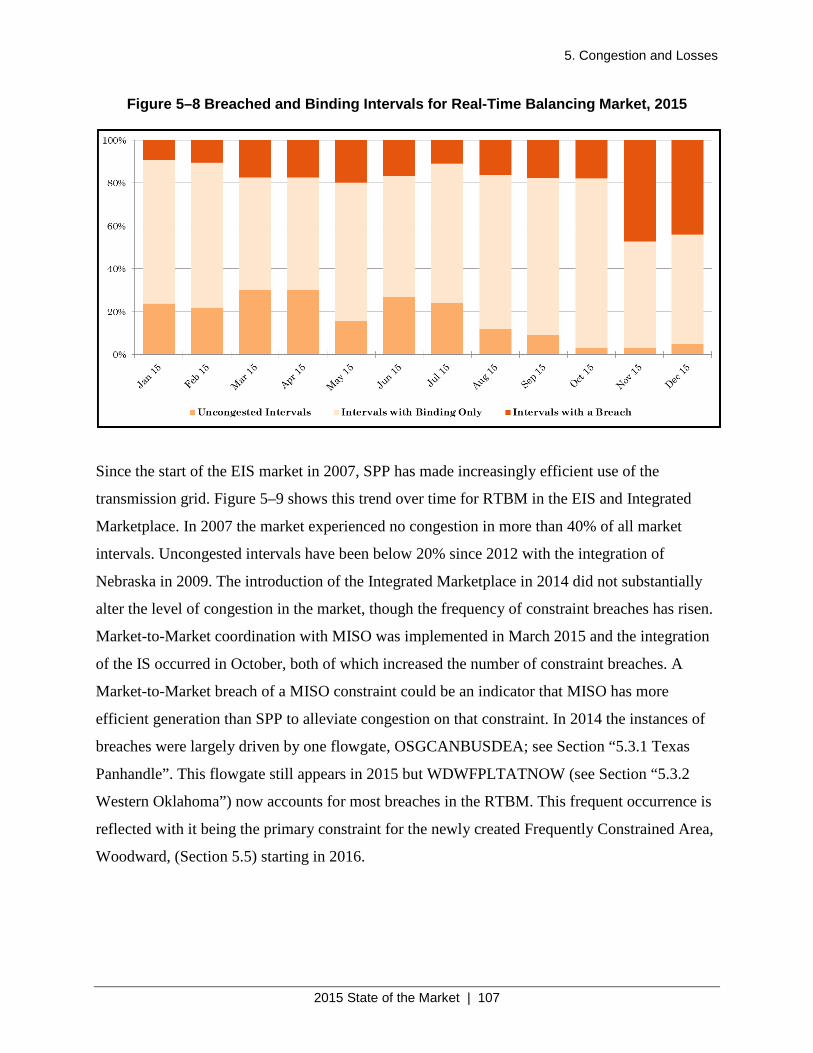
5. Congestion and Losses
2015 State of the Market | 107
Figure 5–8 Breached and Binding Intervals for Real-Time Balancing Market, 2015
Since the start of the EIS market in 2007, SPP has made increasingly efficient use of the
transmission grid. Figure 5–9 shows this trend over time for RTBM in the EIS and Integrated
Marketplace. In 2007 the market experienced no congestion in more than 40% of all market
intervals. Uncongested intervals have been below 20% since 2012 with the integration of
Nebraska in 2009. The introduction of the Integrated Marketplace in 2014 did not substantially
alter the level of congestion in the market, though the frequency of constraint breaches has risen.
Market-to-Market coordination with MISO was implemented in March 2015 and the integration
of the IS occurred in October, both of which increased the number of constraint breaches. A
Market-to-Market breach of a MISO constraint could be an indicator that MISO has more
efficient generation than SPP to alleviate congestion on that constraint. In 2014 the instances of
breaches were largely driven by one flowgate, OSGCANBUSDEA; see Section “5.3.1 Texas
Panhandle”. This flowgate still appears in 2015 but WDWFPLTATNOW (see Section “5.3.2
Western Oklahoma”) now accounts for most breaches in the RTBM. This frequent occurrence is
reflected with it being the primary constraint for the newly created Frequently Constrained Area,
Woodward, (Section 5.5) starting in 2016.
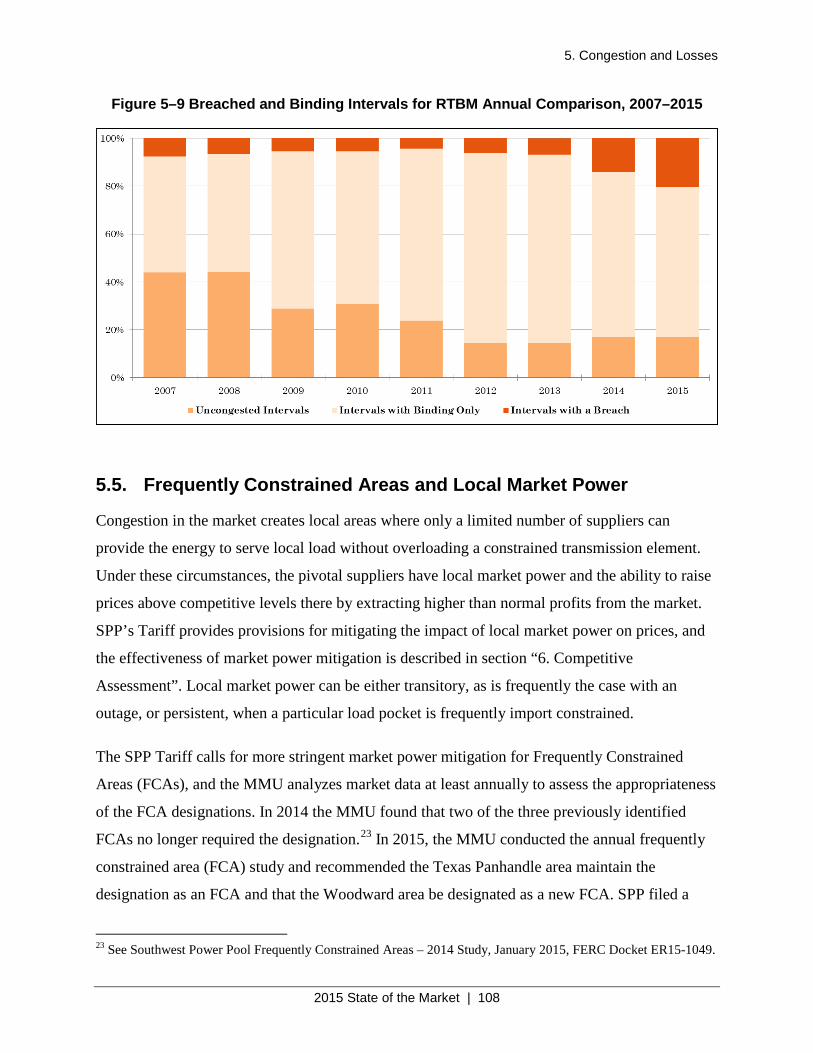
5. Congestion and Losses
2015 State of the Market | 108
Figure 5–9 Breached and Binding Intervals for RTBM Annual Comparison, 2007–2015
5.5. Frequently Constrained Areas and Local Market Power
Congestion in the market creates local areas where only a limited number of suppliers can
provide the energy to serve local load without overloading a constrained transmission element.
Under these circumstances, the pivotal suppliers have local market power and the ability to raise
prices above competitive levels there by extracting higher than normal profits from the market.
SPP’s Tariff provides provisions for mitigating the impact of local market power on prices, and
the effectiveness of market power mitigation is described in section “6. Competitive
Assessment”. Local market power can be either transitory, as is frequently the case with an
outage, or persistent, when a particular load pocket is frequently import constrained.
The SPP Tariff calls for more stringent market power mitigation for Frequently Constrained
Areas (FCAs), and the MMU analyzes market data at least annually to assess the appropriateness
of the FCA designations. In 2014 the MMU found that two of the three previously identified
FCAs no longer required the designation.23 In 2015, the MMU conducted the annual frequently
constrained area (FCA) study and recommended the Texas Panhandle area maintain the
designation as an FCA and that the Woodward area be designated as a new FCA. SPP filed a
23 See Southwest Power Pool Frequently Constrained Areas – 2014 Study, January 2015, FERC Docket ER15-1049.
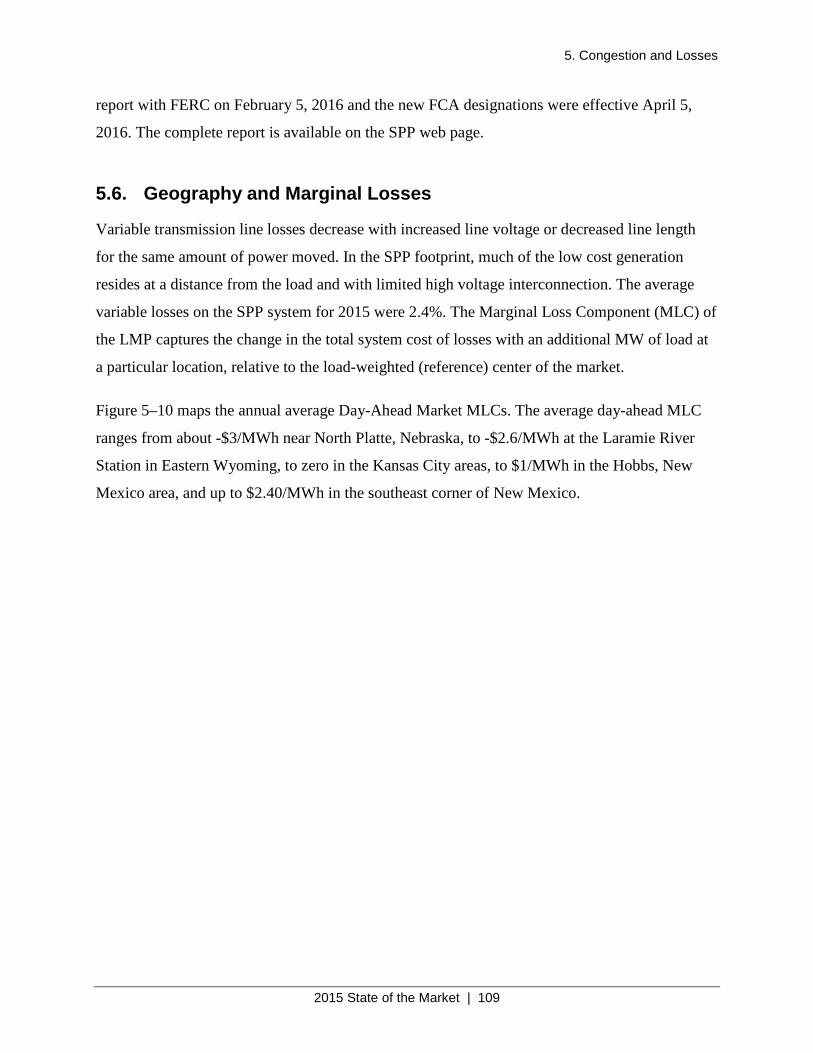
5. Congestion and Losses
2015 State of the Market | 109
report with FERC on February 5, 2016 and the new FCA designations were effective April 5,
2016. The complete report is available on the SPP web page.
5.6. Geography and Marginal Losses
Variable transmission line losses decrease with increased line voltage or decreased line length
for the same amount of power moved. In the SPP footprint, much of the low cost generation
resides at a distance from the load and with limited high voltage interconnection. The average
variable losses on the SPP system for 2015 were 2.4%. The Marginal Loss Component (MLC) of
the LMP captures the change in the total system cost of losses with an additional MW of load at
a particular location, relative to the load-weighted (reference) center of the market.
Figure 5–10 maps the annual average Day-Ahead Market MLCs. The average day-ahead MLC
ranges from about -$3/MWh near North Platte, Nebraska, to -$2.6/MWh at the Laramie River
Station in Eastern Wyoming, to zero in the Kansas City areas, to $1/MWh in the Hobbs, New
Mexico area, and up to $2.40/MWh in the southeast corner of New Mexico.
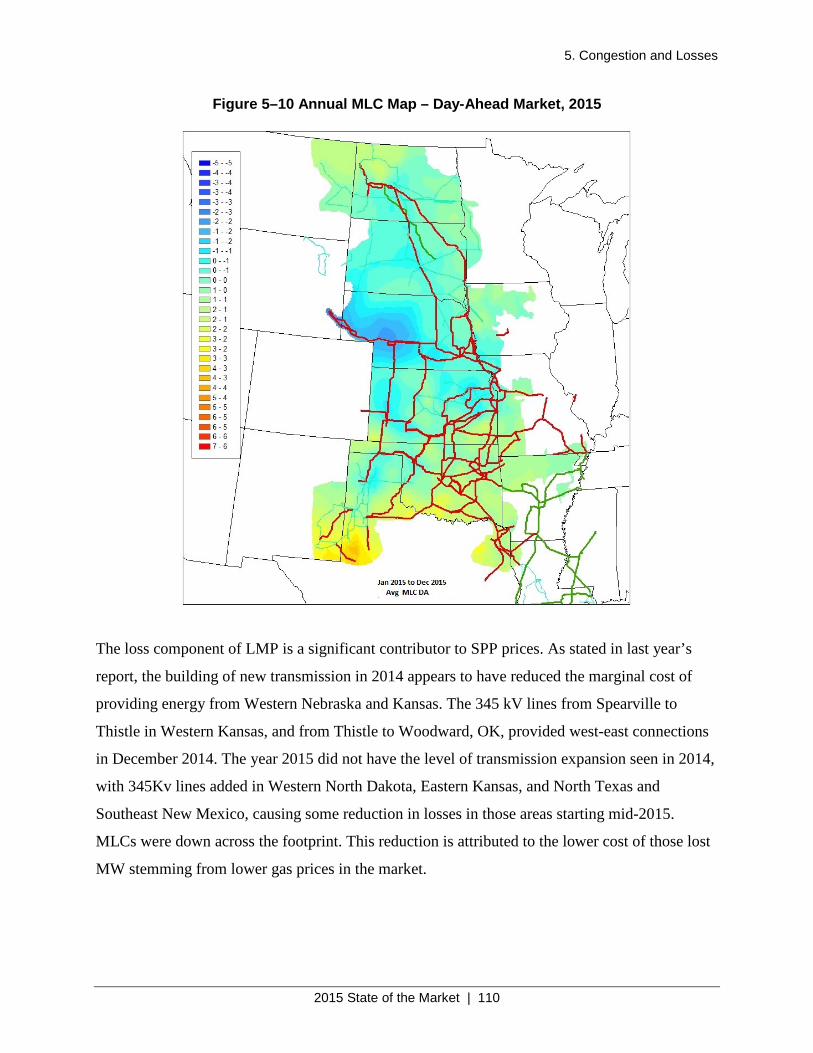
5. Congestion and Losses
2015 State of the Market | 110
Figure 5–10 Annual MLC Map – Day-Ahead Market, 2015
The loss component of LMP is a significant contributor to SPP prices. As stated in last year’s
report, the building of new transmission in 2014 appears to have reduced the marginal cost of
providing energy from Western Nebraska and Kansas. The 345 kV lines from Spearville to
Thistle in Western Kansas, and from Thistle to Woodward, OK, provided west-east connections
in December 2014. The year 2015 did not have the level of transmission expansion seen in 2014,
with 345Kv lines added in Western North Dakota, Eastern Kansas, and North Texas and
Southeast New Mexico, causing some reduction in losses in those areas starting mid-2015.
MLCs were down across the footprint. This reduction is attributed to the lower cost of those lost
MW stemming from lower gas prices in the market.
5. Congestion and Losses
2015 State of the Market | 111
5.7. Congestion Hedging and Revenue Distribution
Prior to the introduction of the Integrated Marketplace, SPP Load-Serving Entities scheduled
energy delivery from generation to load with no additional market charges above the cost of
transmission service. In the Integrated Marketplace, the market generally charges load a higher
LMP than it pays generation, as illustrated in the geographic congestion patterns described
above. Transmission service, no longer used for internal scheduling, now serves as the
underpinning of the Transmission Congestion Rights (TCR) Market, which provides Day-Ahead
Market payments to hedge the cost of congestion. Annual and monthly TCR auctions award the
“rights” to shares of Day-Ahead Market congestion revenue. SPP allocates Auction Revenue
Rights (ARRs) in annual and monthly processes based on transmission ownership, and ARR
holders receive payments from the auction revenue that offset the cost of TCR purchases and
conversions of ARRs into TCRs.
The purpose of the TCR market is to provide a market mechanism for SPP Load-Serving Entities
to hedge the cost of congestion in the market. The performance of the TCR market is expressed
by the degree to which TCRs and ARRs provided a congestion hedge to load customers as well
as the efficiency of the market. As in any market, efficiency means that the market maximizes
the total benefits to all Market Participants. In an efficient market, prices signal the marginal
value of the product, which requires competition and transparency of information. The degree to
which Day-Ahead Market congestion revenues sufficiently fund the TCRs awarded in the TCR
auctions serves as a measure of load hedging, market efficiency, and transparency.
At an aggregate level, the SPP load was hedged for the explicit congestion costs paid in the Day-
Ahead Market and Real-Time Balancing Market in the first year of the market. Figure 5–11
provides the aggregate congestion costs and hedging totals for Load-Serving Entities (LSEs) and
non-LSEs. It shows that the total of all TCR and ARR net payments to LSEs of $168 million
exceeded the total Day-Ahead Market and RTBM congestion costs of $152 million. In
aggregate, non-LSEs pay Day-Ahead Market congestion and receive RTBM congestion rents.
The net payments of $8.6 million are in addition to the total TCR market net payments of $12
million. The aggregate numbers do not reveal the underlying variation among Market
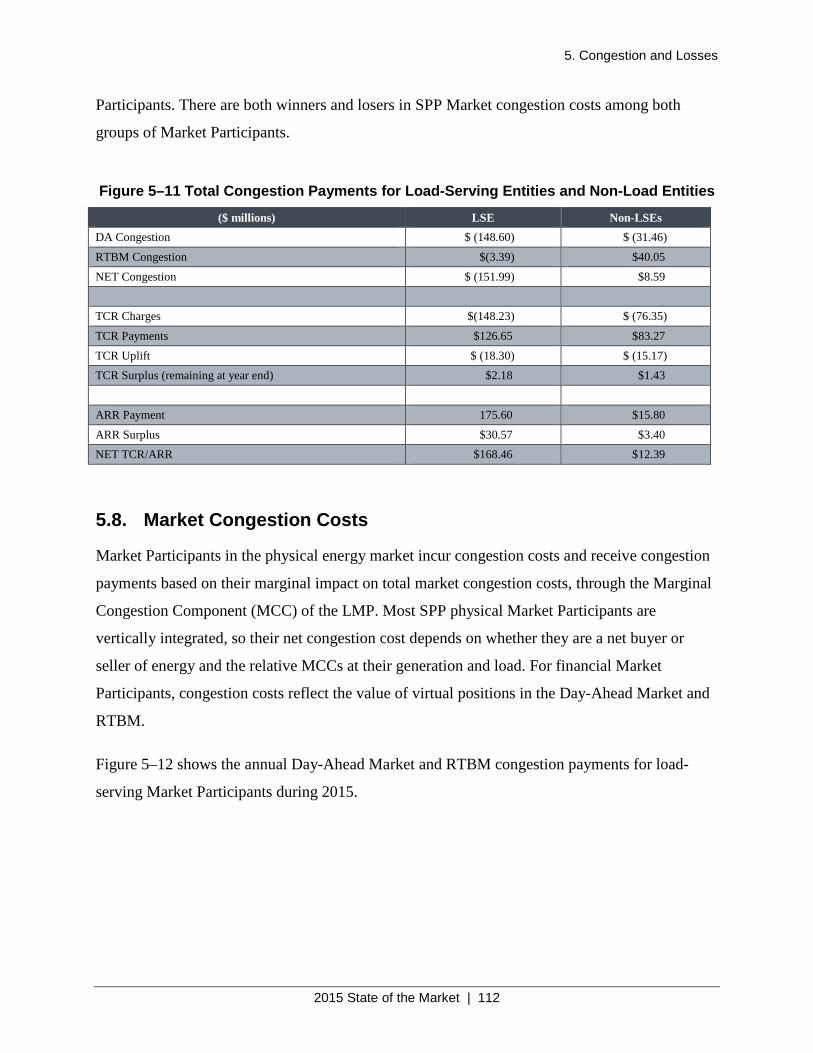
5. Congestion and Losses
2015 State of the Market | 112
Participants. There are both winners and losers in SPP Market congestion costs among both
groups of Market Participants.
Figure 5–11 Total Congestion Payments for Load-Serving Entities and Non-Load Entities
($ millions) LSE Non-LSEs DA Congestion $ (148.60) $ (31.46)
RTBM Congestion $(3.39) $40.05
NET Congestion $ (151.99) $8.59
TCR Charges $(148.23) $ (76.35)
TCR Payments $126.65 $83.27
TCR Uplift $ (18.30) $ (15.17) TCR Surplus (remaining at year end) $2.18 $1.43
ARR Payment 175.60 $15.80
ARR Surplus $30.57 $3.40 NET TCR/ARR $168.46 $12.39
5.8. Market Congestion Costs
Market Participants in the physical energy market incur congestion costs and receive congestion
payments based on their marginal impact on total market congestion costs, through the Marginal
Congestion Component (MCC) of the LMP. Most SPP physical Market Participants are
vertically integrated, so their net congestion cost depends on whether they are a net buyer or
seller of energy and the relative MCCs at their generation and load. For financial Market
Participants, congestion costs reflect the value of virtual positions in the Day-Ahead Market and
RTBM.
Figure 5–12 shows the annual Day-Ahead Market and RTBM congestion payments for load-
serving Market Participants during 2015.
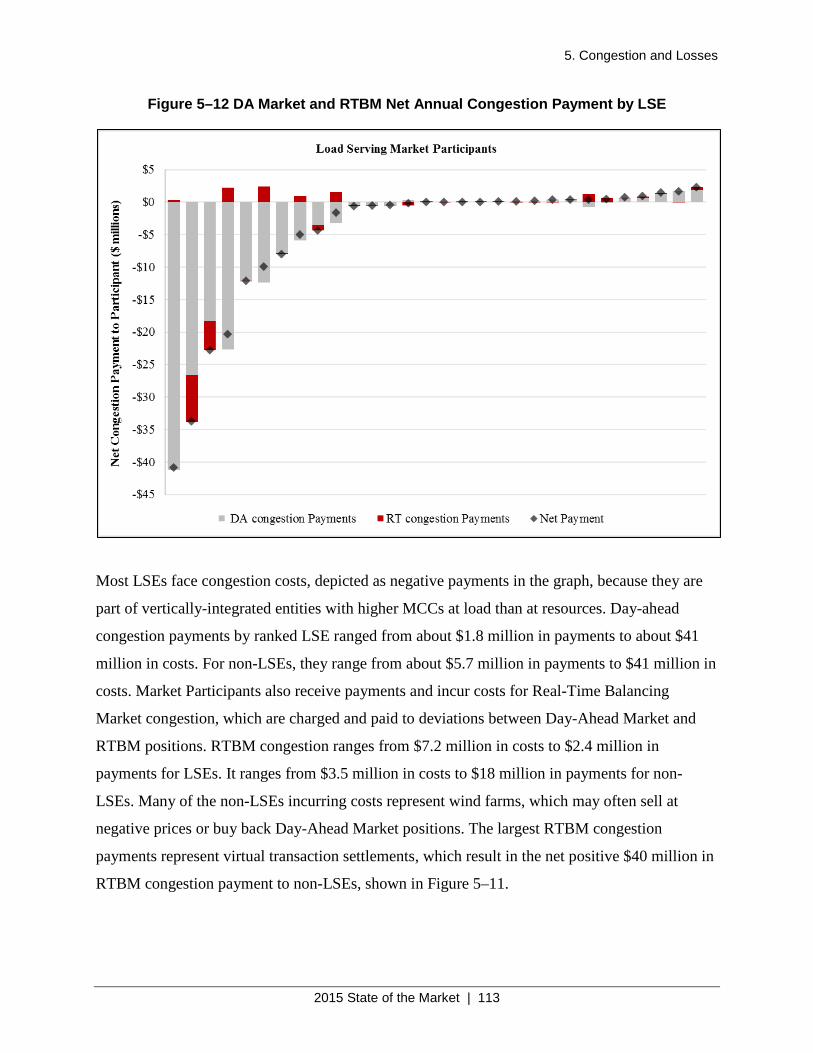
5. Congestion and Losses
2015 State of the Market | 113
Figure 5–12 DA Market and RTBM Net Annual Congestion Payment by LSE
Most LSEs face congestion costs, depicted as negative payments in the graph, because they are
part of vertically-integrated entities with higher MCCs at load than at resources. Day-ahead
congestion payments by ranked LSE ranged from about $1.8 million in payments to about $41
million in costs. For non-LSEs, they range from about $5.7 million in payments to $41 million in
costs. Market Participants also receive payments and incur costs for Real-Time Balancing
Market congestion, which are charged and paid to deviations between Day-Ahead Market and
RTBM positions. RTBM congestion ranges from $7.2 million in costs to $2.4 million in
payments for LSEs. It ranges from $3.5 million in costs to $18 million in payments for non-
LSEs. Many of the non-LSEs incurring costs represent wind farms, which may often sell at
negative prices or buy back Day-Ahead Market positions. The largest RTBM congestion
payments represent virtual transaction settlements, which result in the net positive $40 million in
RTBM congestion payment to non-LSEs, shown in Figure 5–11.
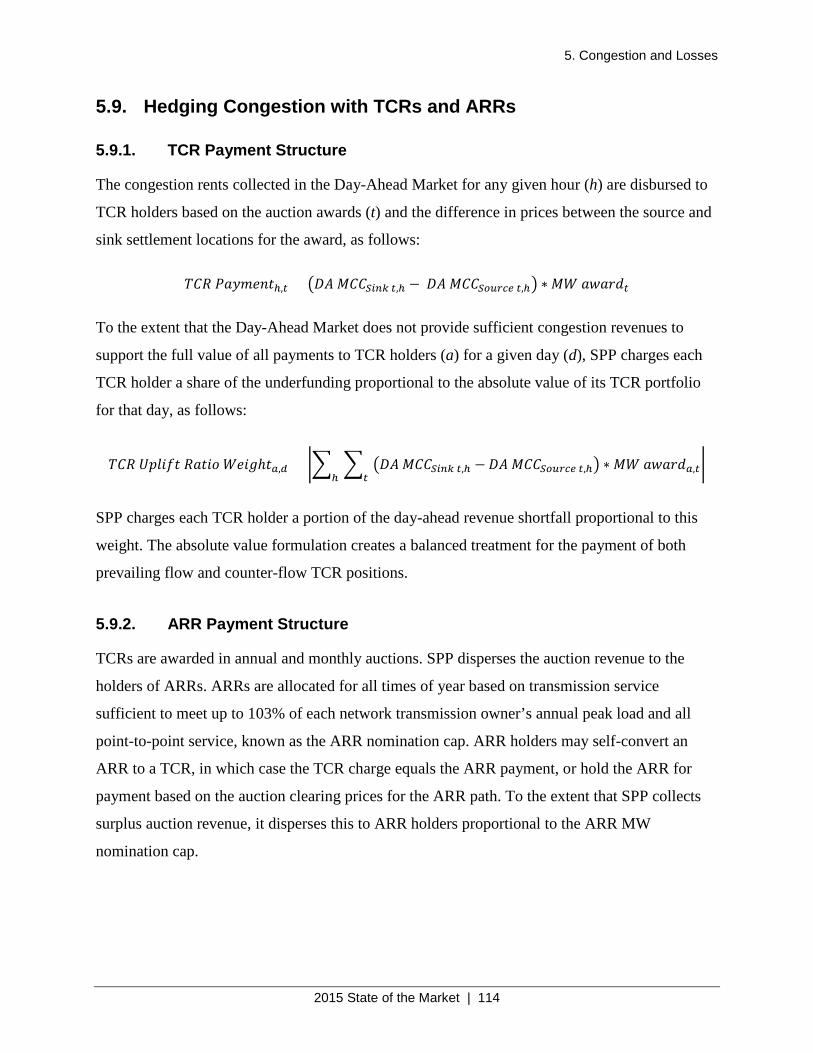
5. Congestion and Losses
2015 State of the Market | 114
5.9. Hedging Congestion with TCRs and ARRs
5.9.1. TCR Payment Structure
The congestion rents collected in the Day-Ahead Market for any given hour (h) are disbursed to
TCR holders based on the auction awards (t) and the difference in prices between the source and
sink settlement locations for the award, as follows:
𝑇𝑇𝑀𝑀𝑇𝑇 𝐿𝐿𝑃𝑃𝑃𝑃𝑃𝑃𝑃𝑃𝑃𝑃𝑃𝑃ℎ,𝑡𝑡 = �𝐷𝐷𝐷𝐷 𝐿𝐿𝑀𝑀𝑀𝑀𝑆𝑆𝑆𝑆𝑆𝑆𝑆𝑆 𝑡𝑡,ℎ − 𝐷𝐷𝐷𝐷 𝐿𝐿𝑀𝑀𝑀𝑀𝑆𝑆𝑆𝑆𝑆𝑆𝑆𝑆𝑆𝑆𝑆𝑆 𝑡𝑡,ℎ� ∗ 𝐿𝐿𝑀𝑀 𝑃𝑃𝑎𝑎𝑃𝑃𝑎𝑎𝑎𝑎𝑡𝑡
To the extent that the Day-Ahead Market does not provide sufficient congestion revenues to
support the full value of all payments to TCR holders (a) for a given day (d), SPP charges each
TCR holder a share of the underfunding proportional to the absolute value of its TCR portfolio
for that day, as follows:
𝑇𝑇𝑀𝑀𝑇𝑇 𝑈𝑈𝑈𝑈𝑈𝑈𝑈𝑈𝑈𝑈𝑃𝑃 𝑇𝑇𝑃𝑃𝑃𝑃𝑈𝑈𝑅𝑅 𝑀𝑀𝑃𝑃𝑈𝑈𝑔𝑔ℎ𝑃𝑃𝑎𝑎,𝑑𝑑 = �� � �𝐷𝐷𝐷𝐷 𝐿𝐿𝑀𝑀𝑀𝑀𝑆𝑆𝑆𝑆𝑆𝑆𝑆𝑆 𝑡𝑡,ℎ − 𝐷𝐷𝐷𝐷 𝐿𝐿𝑀𝑀𝑀𝑀𝑆𝑆𝑆𝑆𝑆𝑆𝑆𝑆𝑆𝑆𝑆𝑆 𝑡𝑡,ℎ� ∗ 𝐿𝐿𝑀𝑀 𝑃𝑃𝑎𝑎𝑃𝑃𝑎𝑎𝑎𝑎𝑎𝑎,𝑡𝑡𝑡𝑡ℎ
�
SPP charges each TCR holder a portion of the day-ahead revenue shortfall proportional to this
weight. The absolute value formulation creates a balanced treatment for the payment of both
prevailing flow and counter-flow TCR positions.
5.9.2. ARR Payment Structure
TCRs are awarded in annual and monthly auctions. SPP disperses the auction revenue to the
holders of ARRs. ARRs are allocated for all times of year based on transmission service
sufficient to meet up to 103% of each network transmission owner’s annual peak load and all
point-to-point service, known as the ARR nomination cap. ARR holders may self-convert an
ARR to a TCR, in which case the TCR charge equals the ARR payment, or hold the ARR for
payment based on the auction clearing prices for the ARR path. To the extent that SPP collects
surplus auction revenue, it disperses this to ARR holders proportional to the ARR MW
nomination cap.
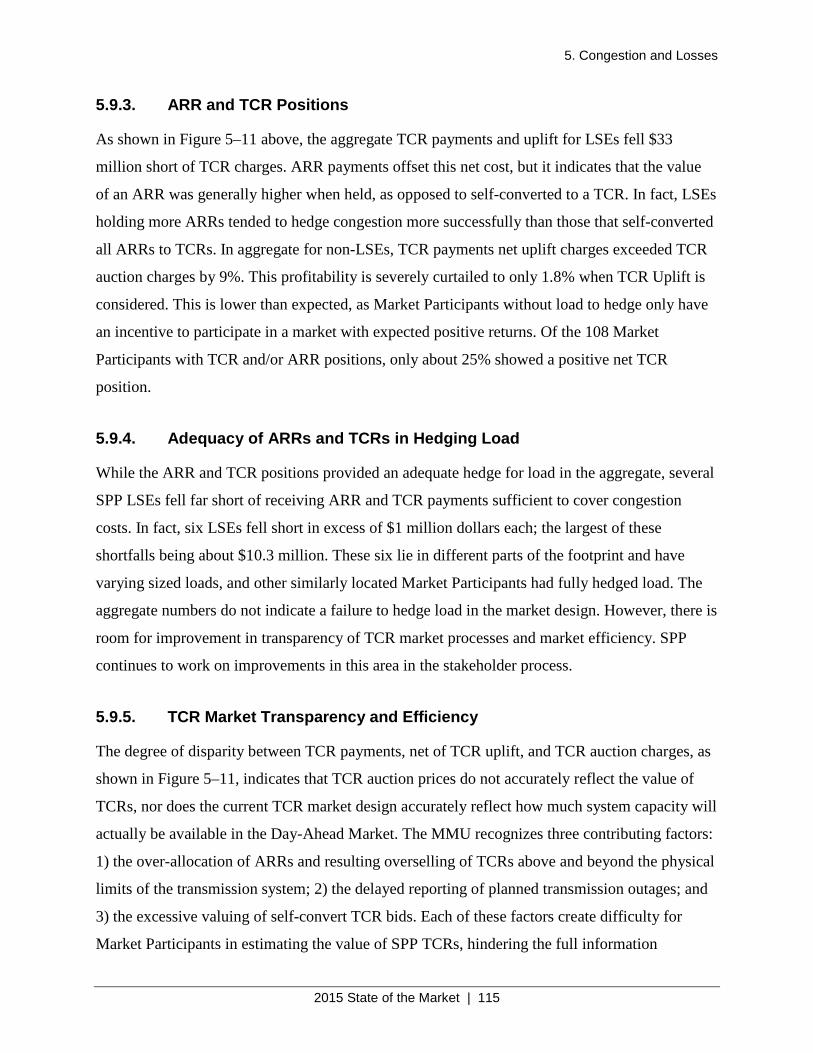
5. Congestion and Losses
2015 State of the Market | 115
5.9.3. ARR and TCR Positions
As shown in Figure 5–11 above, the aggregate TCR payments and uplift for LSEs fell $33
million short of TCR charges. ARR payments offset this net cost, but it indicates that the value
of an ARR was generally higher when held, as opposed to self-converted to a TCR. In fact, LSEs
holding more ARRs tended to hedge congestion more successfully than those that self-converted
all ARRs to TCRs. In aggregate for non-LSEs, TCR payments net uplift charges exceeded TCR
auction charges by 9%. This profitability is severely curtailed to only 1.8% when TCR Uplift is
considered. This is lower than expected, as Market Participants without load to hedge only have
an incentive to participate in a market with expected positive returns. Of the 108 Market
Participants with TCR and/or ARR positions, only about 25% showed a positive net TCR
position.
5.9.4. Adequacy of ARRs and TCRs in Hedging Load
While the ARR and TCR positions provided an adequate hedge for load in the aggregate, several
SPP LSEs fell far short of receiving ARR and TCR payments sufficient to cover congestion
costs. In fact, six LSEs fell short in excess of $1 million dollars each; the largest of these
shortfalls being about $10.3 million. These six lie in different parts of the footprint and have
varying sized loads, and other similarly located Market Participants had fully hedged load. The
aggregate numbers do not indicate a failure to hedge load in the market design. However, there is
room for improvement in transparency of TCR market processes and market efficiency. SPP
continues to work on improvements in this area in the stakeholder process.
5.9.5. TCR Market Transparency and Efficiency
The degree of disparity between TCR payments, net of TCR uplift, and TCR auction charges, as
shown in Figure 5–11, indicates that TCR auction prices do not accurately reflect the value of
TCRs, nor does the current TCR market design accurately reflect how much system capacity will
actually be available in the Day-Ahead Market. The MMU recognizes three contributing factors:
1) the over-allocation of ARRs and resulting overselling of TCRs above and beyond the physical
limits of the transmission system; 2) the delayed reporting of planned transmission outages; and
3) the excessive valuing of self-convert TCR bids. Each of these factors create difficulty for
Market Participants in estimating the value of SPP TCRs, hindering the full information
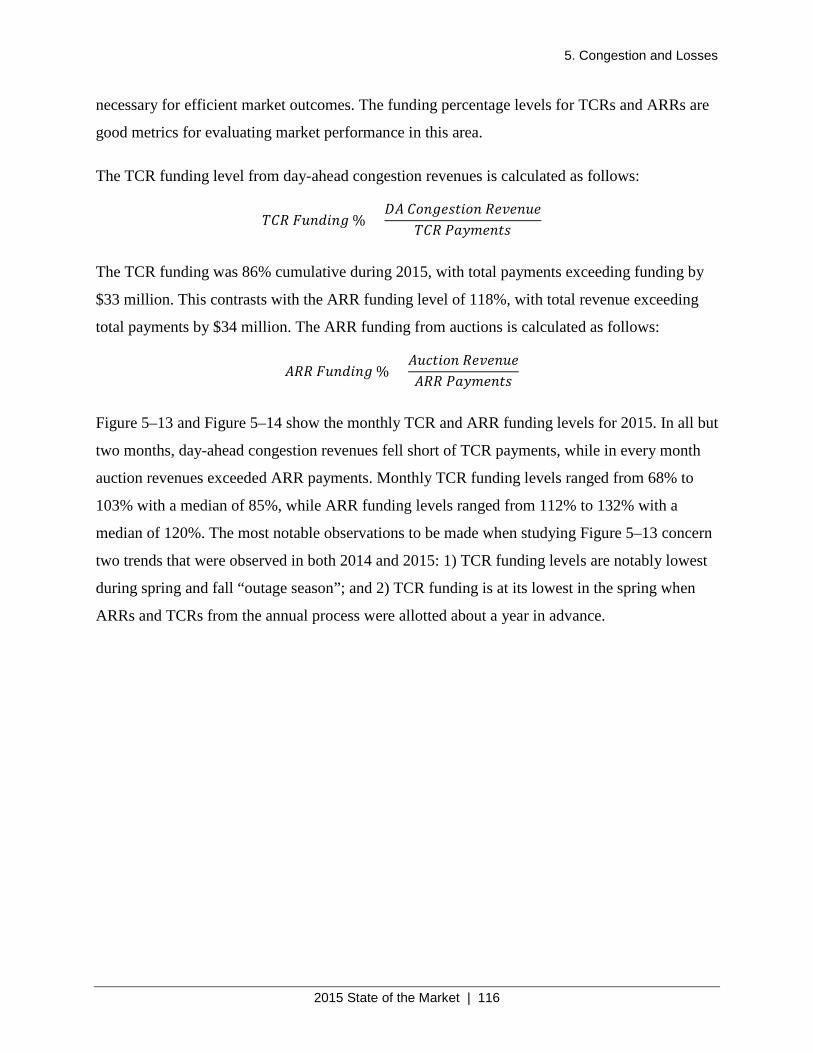
5. Congestion and Losses
2015 State of the Market | 116
necessary for efficient market outcomes. The funding percentage levels for TCRs and ARRs are
good metrics for evaluating market performance in this area.
The TCR funding level from day-ahead congestion revenues is calculated as follows:
𝑇𝑇𝑀𝑀𝑇𝑇 𝐹𝐹𝐹𝐹𝑃𝑃𝑎𝑎𝑈𝑈𝑃𝑃𝑔𝑔 % =𝐷𝐷𝐷𝐷 𝑀𝑀𝑅𝑅𝑃𝑃𝑔𝑔𝑃𝑃𝐶𝐶𝑃𝑃𝑈𝑈𝑅𝑅𝑃𝑃 𝑇𝑇𝑃𝑃𝑅𝑅𝑃𝑃𝑃𝑃𝐹𝐹𝑃𝑃
𝑇𝑇𝑀𝑀𝑇𝑇 𝐿𝐿𝑃𝑃𝑃𝑃𝑃𝑃𝑃𝑃𝑃𝑃𝑃𝑃𝐶𝐶
The TCR funding was 86% cumulative during 2015, with total payments exceeding funding by
$33 million. This contrasts with the ARR funding level of 118%, with total revenue exceeding
total payments by $34 million. The ARR funding from auctions is calculated as follows:
𝐷𝐷𝑇𝑇𝑇𝑇 𝐹𝐹𝐹𝐹𝑃𝑃𝑎𝑎𝑈𝑈𝑃𝑃𝑔𝑔 % =𝐷𝐷𝐹𝐹𝐴𝐴𝑃𝑃𝑈𝑈𝑅𝑅𝑃𝑃 𝑇𝑇𝑃𝑃𝑅𝑅𝑃𝑃𝑃𝑃𝐹𝐹𝑃𝑃𝐷𝐷𝑇𝑇𝑇𝑇 𝐿𝐿𝑃𝑃𝑃𝑃𝑃𝑃𝑃𝑃𝑃𝑃𝑃𝑃𝐶𝐶
Figure 5–13 and Figure 5–14 show the monthly TCR and ARR funding levels for 2015. In all but
two months, day-ahead congestion revenues fell short of TCR payments, while in every month
auction revenues exceeded ARR payments. Monthly TCR funding levels ranged from 68% to
103% with a median of 85%, while ARR funding levels ranged from 112% to 132% with a
median of 120%. The most notable observations to be made when studying Figure 5–13 concern
two trends that were observed in both 2014 and 2015: 1) TCR funding levels are notably lowest
during spring and fall “outage season”; and 2) TCR funding is at its lowest in the spring when
ARRs and TCRs from the annual process were allotted about a year in advance.
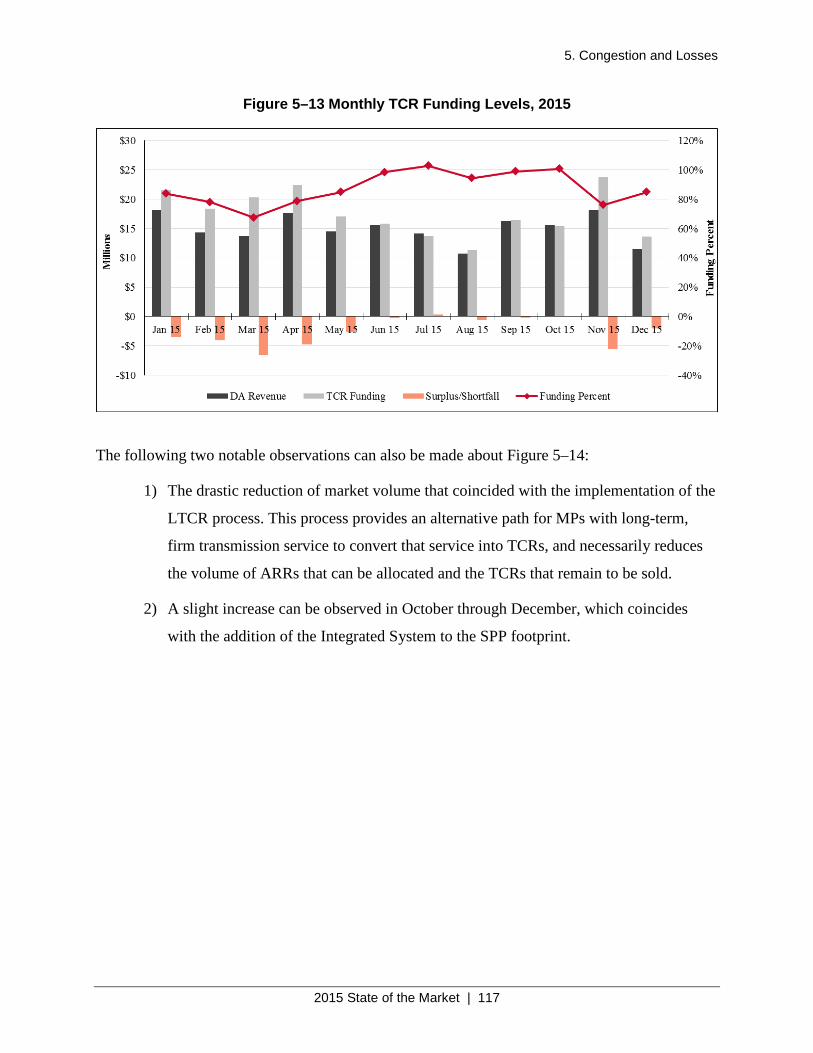
5. Congestion and Losses
2015 State of the Market | 117
Figure 5–13 Monthly TCR Funding Levels, 2015
The following two notable observations can also be made about Figure 5–14:
1) The drastic reduction of market volume that coincided with the implementation of the
LTCR process. This process provides an alternative path for MPs with long-term,
firm transmission service to convert that service into TCRs, and necessarily reduces
the volume of ARRs that can be allocated and the TCRs that remain to be sold.
2) A slight increase can be observed in October through December, which coincides
with the addition of the Integrated System to the SPP footprint.
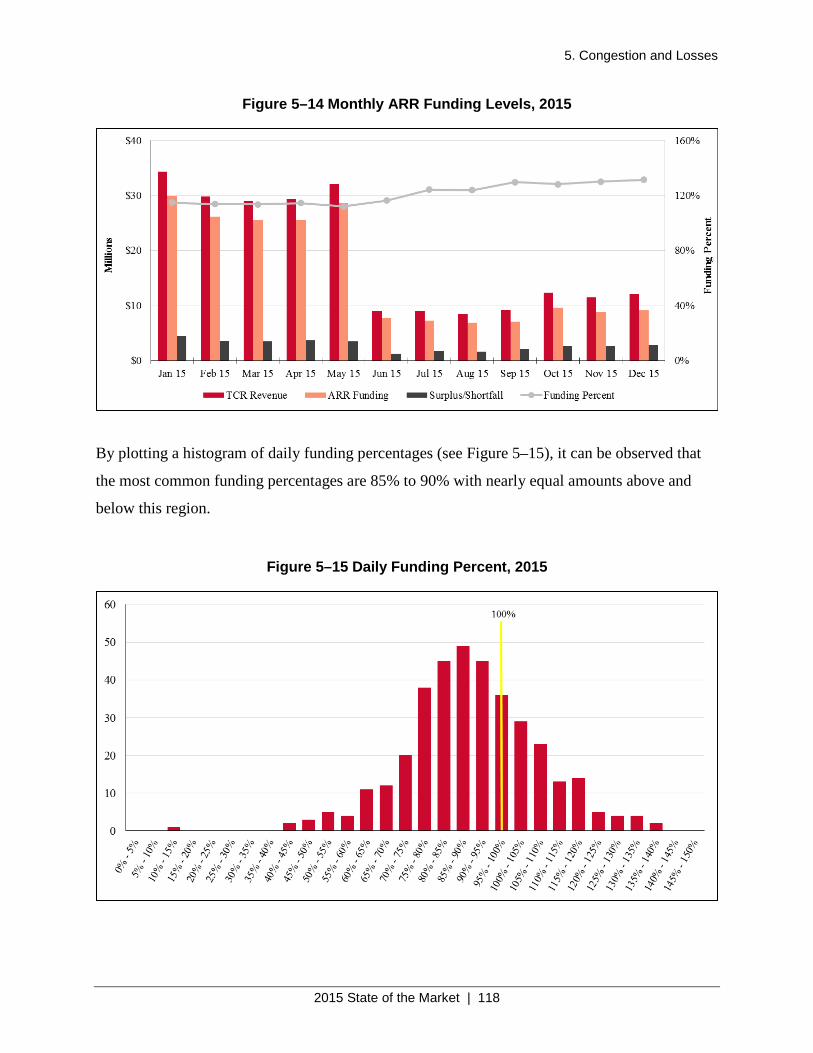
5. Congestion and Losses
2015 State of the Market | 118
Figure 5–14 Monthly ARR Funding Levels, 2015
By plotting a histogram of daily funding percentages (see Figure 5–15), it can be observed that
the most common funding percentages are 85% to 90% with nearly equal amounts above and
below this region.
Figure 5–15 Daily Funding Percent, 2015
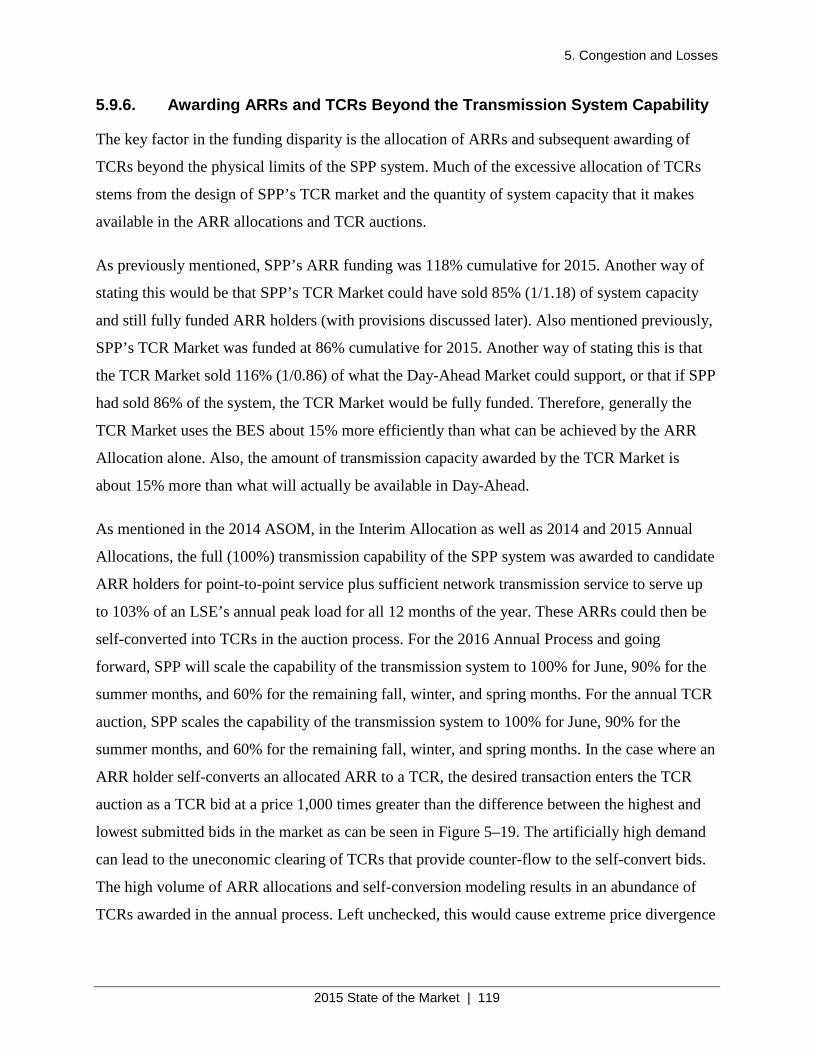
5. Congestion and Losses
2015 State of the Market | 119
5.9.6. Awarding ARRs and TCRs Beyond the Transmission System Capability
The key factor in the funding disparity is the allocation of ARRs and subsequent awarding of
TCRs beyond the physical limits of the SPP system. Much of the excessive allocation of TCRs
stems from the design of SPP’s TCR market and the quantity of system capacity that it makes
available in the ARR allocations and TCR auctions.
As previously mentioned, SPP’s ARR funding was 118% cumulative for 2015. Another way of
stating this would be that SPP’s TCR Market could have sold 85% (1/1.18) of system capacity
and still fully funded ARR holders (with provisions discussed later). Also mentioned previously,
SPP’s TCR Market was funded at 86% cumulative for 2015. Another way of stating this is that
the TCR Market sold 116% (1/0.86) of what the Day-Ahead Market could support, or that if SPP
had sold 86% of the system, the TCR Market would be fully funded. Therefore, generally the
TCR Market uses the BES about 15% more efficiently than what can be achieved by the ARR
Allocation alone. Also, the amount of transmission capacity awarded by the TCR Market is
about 15% more than what will actually be available in Day-Ahead.
As mentioned in the 2014 ASOM, in the Interim Allocation as well as 2014 and 2015 Annual
Allocations, the full (100%) transmission capability of the SPP system was awarded to candidate
ARR holders for point-to-point service plus sufficient network transmission service to serve up
to 103% of an LSE’s annual peak load for all 12 months of the year. These ARRs could then be
self-converted into TCRs in the auction process. For the 2016 Annual Process and going
forward, SPP will scale the capability of the transmission system to 100% for June, 90% for the
summer months, and 60% for the remaining fall, winter, and spring months. For the annual TCR
auction, SPP scales the capability of the transmission system to 100% for June, 90% for the
summer months, and 60% for the remaining fall, winter, and spring months. In the case where an
ARR holder self-converts an allocated ARR to a TCR, the desired transaction enters the TCR
auction as a TCR bid at a price 1,000 times greater than the difference between the highest and
lowest submitted bids in the market as can be seen in Figure 5–19. The artificially high demand
can lead to the uneconomic clearing of TCRs that provide counter-flow to the self-convert bids.
The high volume of ARR allocations and self-conversion modeling results in an abundance of
TCRs awarded in the annual process. Left unchecked, this would cause extreme price divergence
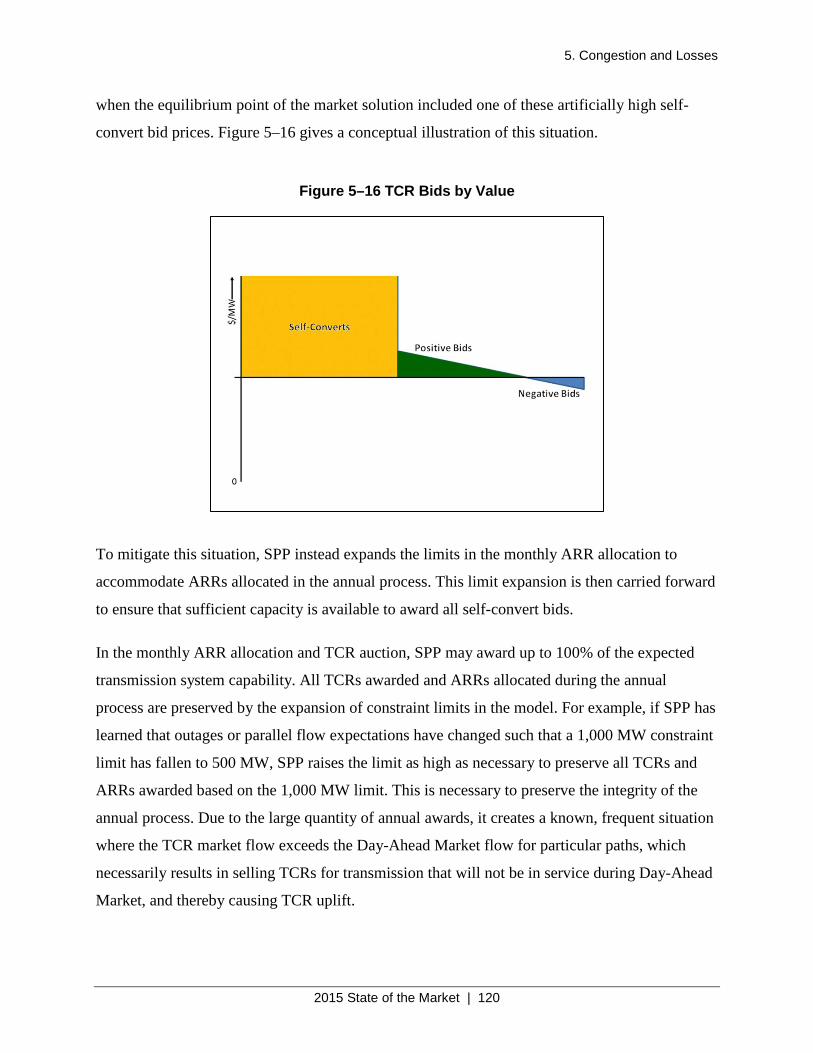
5. Congestion and Losses
2015 State of the Market | 120
when the equilibrium point of the market solution included one of these artificially high self-
convert bid prices. Figure 5–16 gives a conceptual illustration of this situation.
Figure 5–16 TCR Bids by Value
To mitigate this situation, SPP instead expands the limits in the monthly ARR allocation to
accommodate ARRs allocated in the annual process. This limit expansion is then carried forward
to ensure that sufficient capacity is available to award all self-convert bids.
In the monthly ARR allocation and TCR auction, SPP may award up to 100% of the expected
transmission system capability. All TCRs awarded and ARRs allocated during the annual
process are preserved by the expansion of constraint limits in the model. For example, if SPP has
learned that outages or parallel flow expectations have changed such that a 1,000 MW constraint
limit has fallen to 500 MW, SPP raises the limit as high as necessary to preserve all TCRs and
ARRs awarded based on the 1,000 MW limit. This is necessary to preserve the integrity of the
annual process. Due to the large quantity of annual awards, it creates a known, frequent situation
where the TCR market flow exceeds the Day-Ahead Market flow for particular paths, which
necessarily results in selling TCRs for transmission that will not be in service during Day-Ahead
Market, and thereby causing TCR uplift.
5. Congestion and Losses
2015 State of the Market | 121
An additional cause of overselling TCRs is the amount of system capacity made available in the
annual and monthly TCR auctions. Besides the 100% offered in the month of June, SPP’s market
design requires that 90% of system capacity be offered for the July, August, and September
months, and 60% of the system be offered for fall, winter, and spring seasons. Outages, parallel
flows, and other factors can contribute to system topology changes that make TCRs sold far in
advance infeasible. The MMU has noted cases in which flowgate ratings have been decreased to
a low of 50% of nominal value due to maintenance outages. Even if SPP knows the decreased
ratings in advance of the monthly TCR auction, it cannot expect to know many of the reductions
in ratings as far in advance as the annual auction. The MMU would like to withdraw its
recommendation for SPP to lower these limits at this time until the effect of reducing the ARR
capacity offered in the Annual Allocation can be analyzed. Since this change is taken into effect
during the 2015 Annual Allocation, the MMU will have ample data to analyze and determine if
lowering this limit is still necessary.
In July 2015 SPP stakeholders approved a change in market design expected to reduce the
required limit expansion in the monthly ARR allocations and TCR auctions. The MMU expects
improvement in the number of required limit expansions in many of the monthly TCR auctions
with this change. SPP should achieve further improvement in funding disparity by reducing full
system availability in the annual ARR allocation to match the system availability levels in the
annual TCR auction. The issue could still remain that SPP will not need to perform as much limit
expansion in Monthly Allocations/Auctions, but could still oversell the system by selling a flat
100% rather than using lower system scaling factors for June in the Annual TCR Auction,
Monthly ARR Allocations, and Monthly TCR Auctions.
The MMU expects some reduction in limit expansion due to implementation described above,
and a corresponding reduction in underfunding due to over-allocation in the annual process.
However, this does not address the issue of over-allocation of ARRs and TCRs in the monthly
process. The MMU expects TCR funding from day-ahead to be similar through the summer
months (i.e., 80%–100%) and an improvement in the remaining seasons (formerly 60%–80%) up
to a level nearer that of previous summers. Should this occur the MMU recommends that SPP
reduce the system capacity available in the monthly ARR/TCR processes so as not to oversell
TCRs in relation to day-ahead.
5. Congestion and Losses
2015 State of the Market | 122
MMU Recommendation – TCR and ARR System Availability in Annual Process • In the 2014 ASOM the MMU recommended that SPP match the ARR and TCR
system availability in the annual process to eliminate required limit expansion for
infeasible ARRs. This recommendation has been addressed with the passage and
implementation of RR91 – Annual Allocation Percent Change.
5.9.7. Transmission Outage Reporting and Modeling
As noted in the 2014 ASOM, SPP’s accommodating reporting requirements for transmission
outages and the exclusion of shorter duration outages from the TCR models exacerbated the
overall TCR and ARR funding discrepancies described above. Uncaptured outages in the first
year of the market created particularly low daily funding percentages, as low as 40%, when an
outage contributed significantly to local congestion. This local congestion curtailed the net
transfer capacity of the physical system in the Day-Ahead Market relative to the TCR auction
models, increasing the TCR payment for the path while also reducing the congestion rents
collected in the Day-Ahead Market. In several cases SPP could have adjusted the TCR models to
reflect the outages had they been reported sooner.
The monthly ARR allocations and TCR auctions only captured outages reported at least 45 days
prior to the first of the month. Transmission operators would have needed to report outages near
the end of the month as far as 75 days in advance for SPP to capture them in the TCR auction
models. Since the 2014 ASOM, SPP has increased the requirement from only seven days
advance reporting of planned outages out to 14 days advance reporting. However, this is still far
short of the needed 45- to 75-day advance notice. Figure 5–17 shows the lead time of planned
transmission outage reporting.
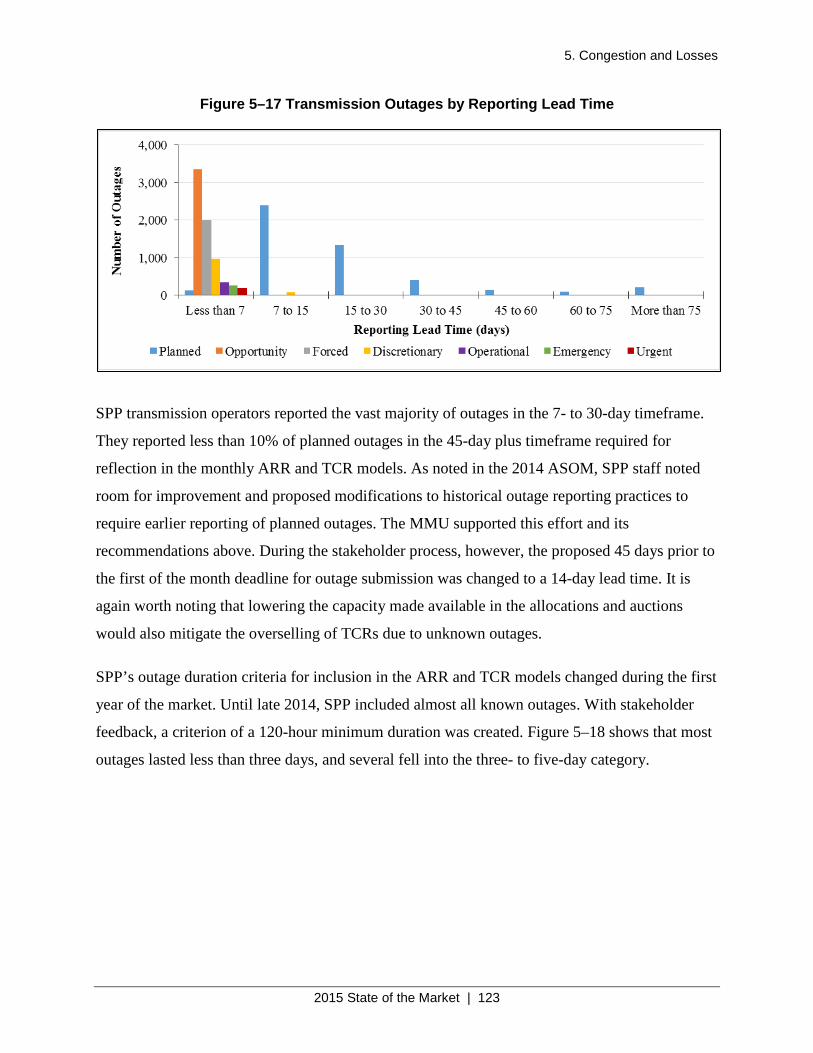
5. Congestion and Losses
2015 State of the Market | 123
Figure 5–17 Transmission Outages by Reporting Lead Time
SPP transmission operators reported the vast majority of outages in the 7- to 30-day timeframe.
They reported less than 10% of planned outages in the 45-day plus timeframe required for
reflection in the monthly ARR and TCR models. As noted in the 2014 ASOM, SPP staff noted
room for improvement and proposed modifications to historical outage reporting practices to
require earlier reporting of planned outages. The MMU supported this effort and its
recommendations above. During the stakeholder process, however, the proposed 45 days prior to
the first of the month deadline for outage submission was changed to a 14-day lead time. It is
again worth noting that lowering the capacity made available in the allocations and auctions
would also mitigate the overselling of TCRs due to unknown outages.
SPP’s outage duration criteria for inclusion in the ARR and TCR models changed during the first
year of the market. Until late 2014, SPP included almost all known outages. With stakeholder
feedback, a criterion of a 120-hour minimum duration was created. Figure 5–18 shows that most
outages lasted less than three days, and several fell into the three- to five-day category.
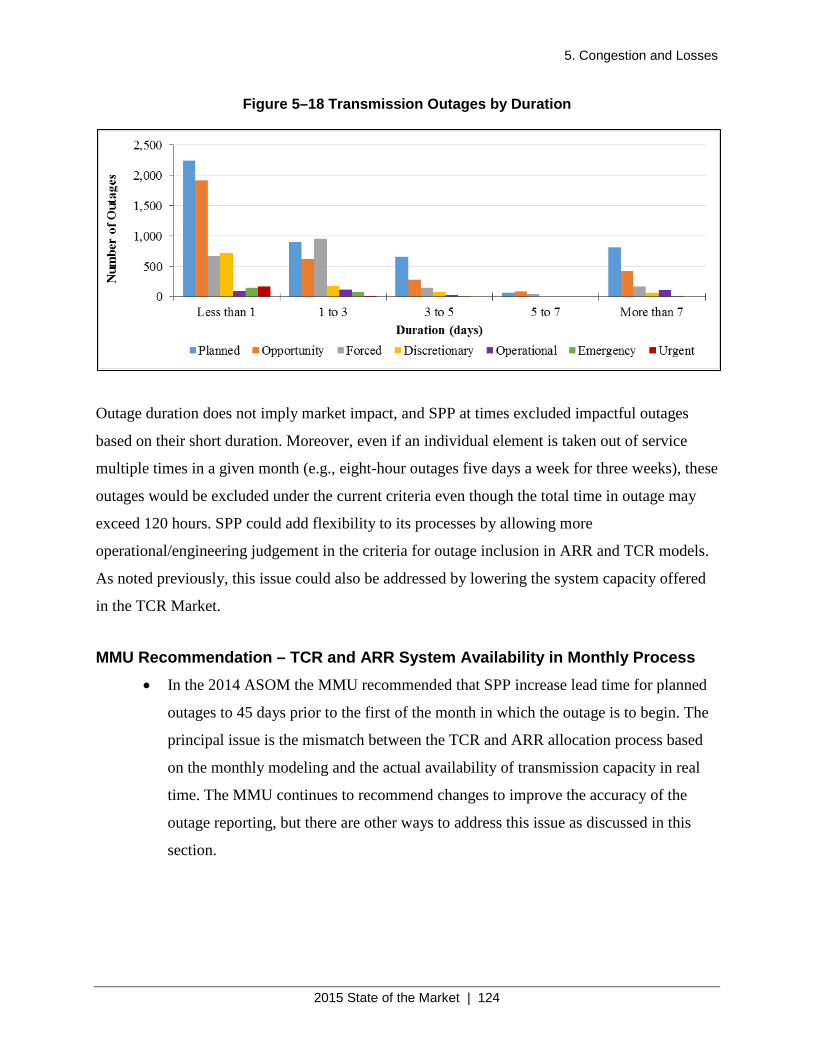
5. Congestion and Losses
2015 State of the Market | 124
Figure 5–18 Transmission Outages by Duration
Outage duration does not imply market impact, and SPP at times excluded impactful outages
based on their short duration. Moreover, even if an individual element is taken out of service
multiple times in a given month (e.g., eight-hour outages five days a week for three weeks), these
outages would be excluded under the current criteria even though the total time in outage may
exceed 120 hours. SPP could add flexibility to its processes by allowing more
operational/engineering judgement in the criteria for outage inclusion in ARR and TCR models.
As noted previously, this issue could also be addressed by lowering the system capacity offered
in the TCR Market.
MMU Recommendation – TCR and ARR System Availability in Monthly Process • In the 2014 ASOM the MMU recommended that SPP increase lead time for planned
outages to 45 days prior to the first of the month in which the outage is to begin. The
principal issue is the mismatch between the TCR and ARR allocation process based
on the monthly modeling and the actual availability of transmission capacity in real
time. The MMU continues to recommend changes to improve the accuracy of the
outage reporting, but there are other ways to address this issue as discussed in this
section.
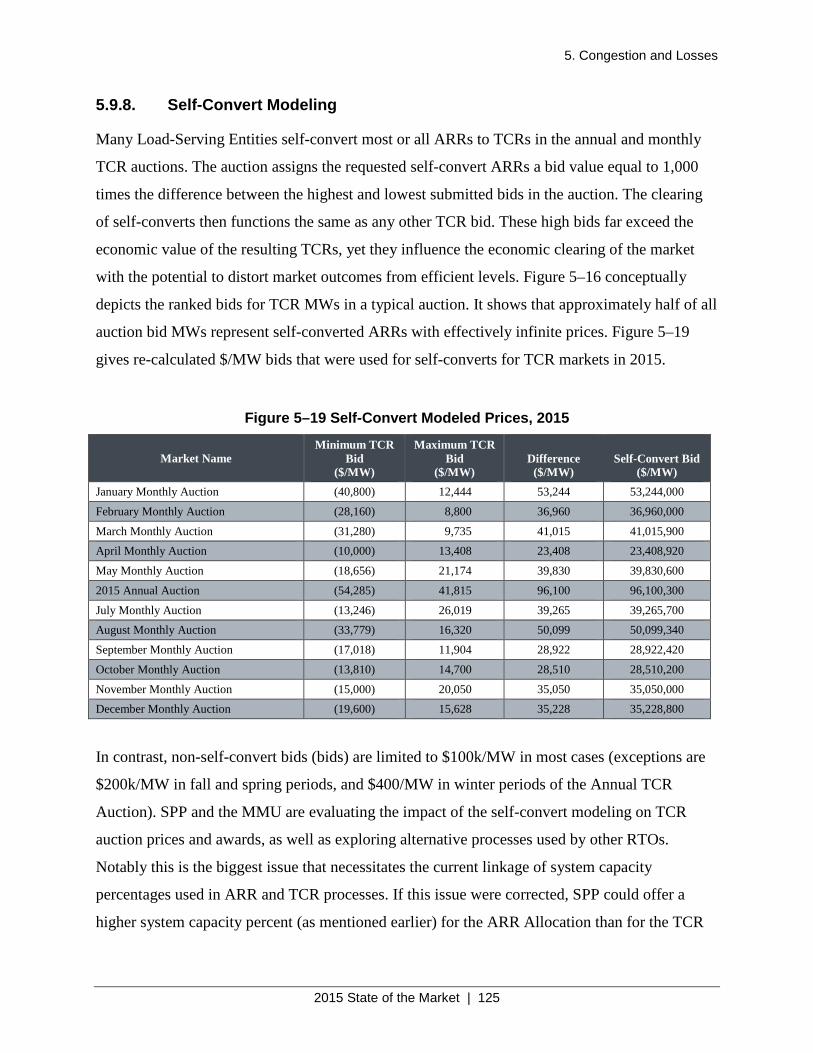
5. Congestion and Losses
2015 State of the Market | 125
5.9.8. Self-Convert Modeling
Many Load-Serving Entities self-convert most or all ARRs to TCRs in the annual and monthly
TCR auctions. The auction assigns the requested self-convert ARRs a bid value equal to 1,000
times the difference between the highest and lowest submitted bids in the auction. The clearing
of self-converts then functions the same as any other TCR bid. These high bids far exceed the
economic value of the resulting TCRs, yet they influence the economic clearing of the market
with the potential to distort market outcomes from efficient levels. Figure 5–16 conceptually
depicts the ranked bids for TCR MWs in a typical auction. It shows that approximately half of all
auction bid MWs represent self-converted ARRs with effectively infinite prices. Figure 5–19
gives re-calculated $/MW bids that were used for self-converts for TCR markets in 2015.
Figure 5–19 Self-Convert Modeled Prices, 2015
Market Name
Minimum TCR Bid
($/MW)
Maximum TCR Bid
($/MW)
Difference
($/MW)
Self-Convert Bid
($/MW) January Monthly Auction (40,800) 12,444 53,244 53,244,000
February Monthly Auction (28,160) 8,800 36,960 36,960,000
March Monthly Auction (31,280) 9,735 41,015 41,015,900 April Monthly Auction (10,000) 13,408 23,408 23,408,920
May Monthly Auction (18,656) 21,174 39,830 39,830,600
2015 Annual Auction (54,285) 41,815 96,100 96,100,300
July Monthly Auction (13,246) 26,019 39,265 39,265,700 August Monthly Auction (33,779) 16,320 50,099 50,099,340
September Monthly Auction (17,018) 11,904 28,922 28,922,420
October Monthly Auction (13,810) 14,700 28,510 28,510,200
November Monthly Auction (15,000) 20,050 35,050 35,050,000 December Monthly Auction (19,600) 15,628 35,228 35,228,800
In contrast, non-self-convert bids (bids) are limited to $100k/MW in most cases (exceptions are
$200k/MW in fall and spring periods, and $400/MW in winter periods of the Annual TCR
Auction). SPP and the MMU are evaluating the impact of the self-convert modeling on TCR
auction prices and awards, as well as exploring alternative processes used by other RTOs.
Notably this is the biggest issue that necessitates the current linkage of system capacity
percentages used in ARR and TCR processes. If this issue were corrected, SPP could offer a
higher system capacity percent (as mentioned earlier) for the ARR Allocation than for the TCR
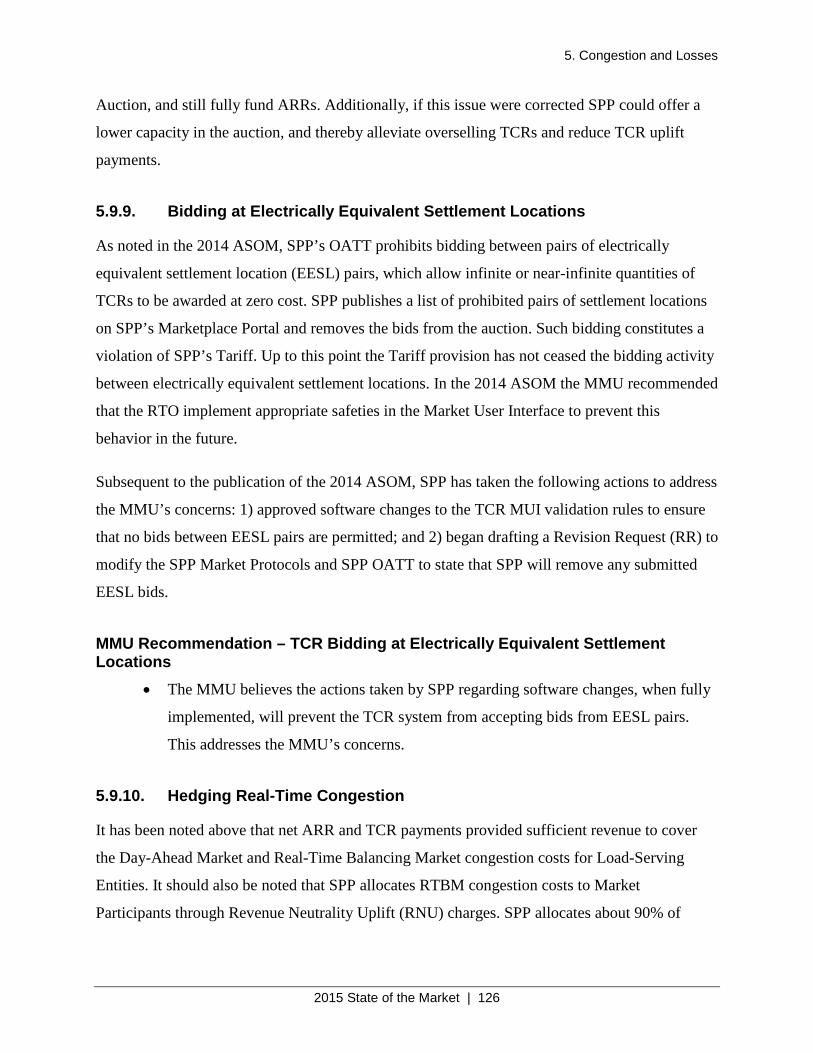
5. Congestion and Losses
2015 State of the Market | 126
Auction, and still fully fund ARRs. Additionally, if this issue were corrected SPP could offer a
lower capacity in the auction, and thereby alleviate overselling TCRs and reduce TCR uplift
payments.
5.9.9. Bidding at Electrically Equivalent Settlement Locations
As noted in the 2014 ASOM, SPP’s OATT prohibits bidding between pairs of electrically
equivalent settlement location (EESL) pairs, which allow infinite or near-infinite quantities of
TCRs to be awarded at zero cost. SPP publishes a list of prohibited pairs of settlement locations
on SPP’s Marketplace Portal and removes the bids from the auction. Such bidding constitutes a
violation of SPP’s Tariff. Up to this point the Tariff provision has not ceased the bidding activity
between electrically equivalent settlement locations. In the 2014 ASOM the MMU recommended
that the RTO implement appropriate safeties in the Market User Interface to prevent this
behavior in the future.
Subsequent to the publication of the 2014 ASOM, SPP has taken the following actions to address
the MMU’s concerns: 1) approved software changes to the TCR MUI validation rules to ensure
that no bids between EESL pairs are permitted; and 2) began drafting a Revision Request (RR) to
modify the SPP Market Protocols and SPP OATT to state that SPP will remove any submitted
EESL bids.
MMU Recommendation – TCR Bidding at Electrically Equivalent Settlement Locations
• The MMU believes the actions taken by SPP regarding software changes, when fully
implemented, will prevent the TCR system from accepting bids from EESL pairs.
This addresses the MMU’s concerns.
5.9.10. Hedging Real-Time Congestion
It has been noted above that net ARR and TCR payments provided sufficient revenue to cover
the Day-Ahead Market and Real-Time Balancing Market congestion costs for Load-Serving
Entities. It should also be noted that SPP allocates RTBM congestion costs to Market
Participants through Revenue Neutrality Uplift (RNU) charges. SPP allocates about 90% of
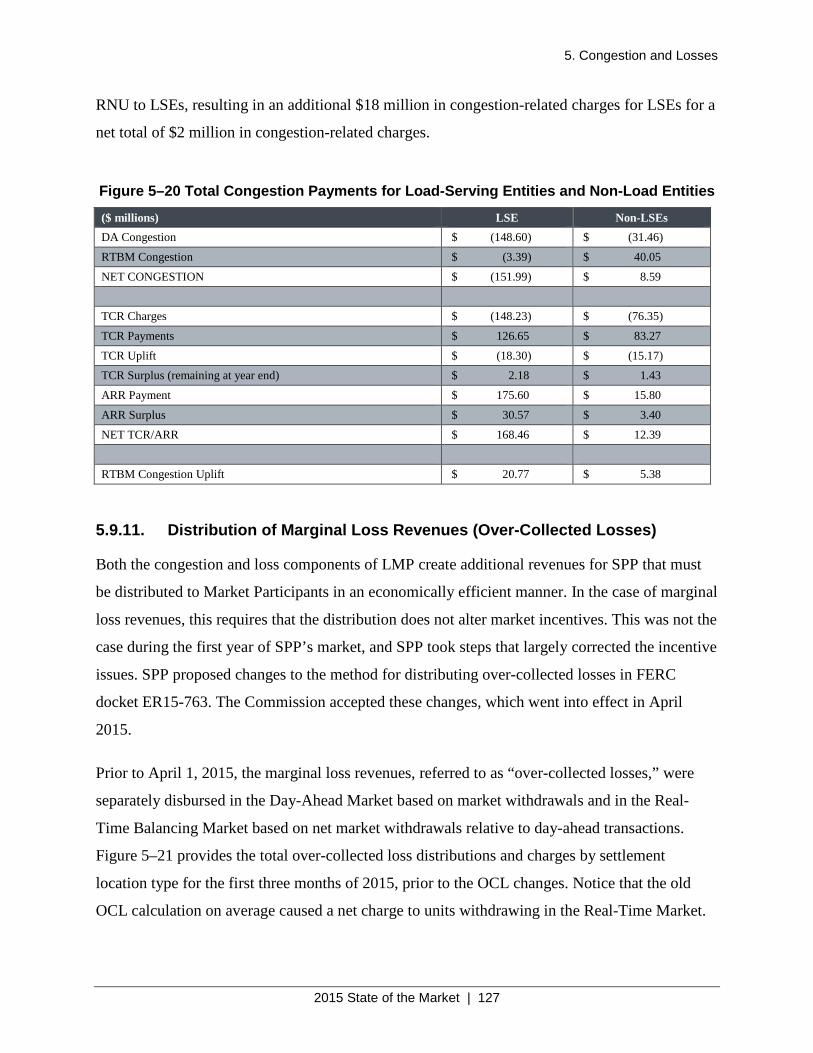
5. Congestion and Losses
2015 State of the Market | 127
RNU to LSEs, resulting in an additional $18 million in congestion-related charges for LSEs for a
net total of $2 million in congestion-related charges.
Figure 5–20 Total Congestion Payments for Load-Serving Entities and Non-Load Entities
($ millions) LSE Non-LSEs DA Congestion $ (148.60) $ (31.46)
RTBM Congestion $ (3.39) $ 40.05
NET CONGESTION $ (151.99) $ 8.59
TCR Charges $ (148.23) $ (76.35)
TCR Payments $ 126.65 $ 83.27
TCR Uplift $ (18.30) $ (15.17) TCR Surplus (remaining at year end) $ 2.18 $ 1.43
ARR Payment $ 175.60 $ 15.80
ARR Surplus $ 30.57 $ 3.40
NET TCR/ARR $ 168.46 $ 12.39
RTBM Congestion Uplift $ 20.77 $ 5.38
5.9.11. Distribution of Marginal Loss Revenues (Over-Collected Losses)
Both the congestion and loss components of LMP create additional revenues for SPP that must
be distributed to Market Participants in an economically efficient manner. In the case of marginal
loss revenues, this requires that the distribution does not alter market incentives. This was not the
case during the first year of SPP’s market, and SPP took steps that largely corrected the incentive
issues. SPP proposed changes to the method for distributing over-collected losses in FERC
docket ER15-763. The Commission accepted these changes, which went into effect in April
2015.
Prior to April 1, 2015, the marginal loss revenues, referred to as “over-collected losses,” were
separately disbursed in the Day-Ahead Market based on market withdrawals and in the Real-
Time Balancing Market based on net market withdrawals relative to day-ahead transactions.
Figure 5–21 provides the total over-collected loss distributions and charges by settlement
location type for the first three months of 2015, prior to the OCL changes. Notice that the old
OCL calculation on average caused a net charge to units withdrawing in the Real-Time Market.
5. Congestion and Losses
2015 State of the Market | 128
Figure 5–21 Over-Collected Losses Totals for January–March 2015
Due to high Day-Ahead Market load bids, the load received $27 million in January through
March, or 124% of all over-collected losses, while RTBM deviations from day-ahead positions
paid $7 million. As stated in last year’s ASOM, this real-time charge had significant impacts on
export and through transactions, causing an average charge of about $2.27/MWh with charges
sometimes exceeding $1,000/MWh.
The enhanced design consolidates the distributions of day-ahead and over-collected loss rebates
into only one distribution. Under this new design, both day-ahead and real-time over-collected
loss rebates are distributed on just real-time withdrawing MWs. This includes loads, substation
power, exports, throughs, Pseudo-Ties, and Bilateral Settlement Schedules (BSS). The only
exception is that both day-ahead and real-time BSS are entitled to the rebate. In addition to
consolidating the distributions to only real-time withdrawing MWs, changes were made to loss
pool allocations. Under the old method, virtual play drove up the SPP Loss Pools allocation of
OCL rebates, even though virtual activity was not eligible for rebates. This caused real-time
exporters to get a large percentage of the OCL rebates, which during that time were typically a
charge. Virtuals no longer play a role in the loss pool distributions. The MMU feels these design
enhancements better allocate the over-collected losses to the transactions that contributed to the
over-collection while removing some of the adverse incentives present under the former design.
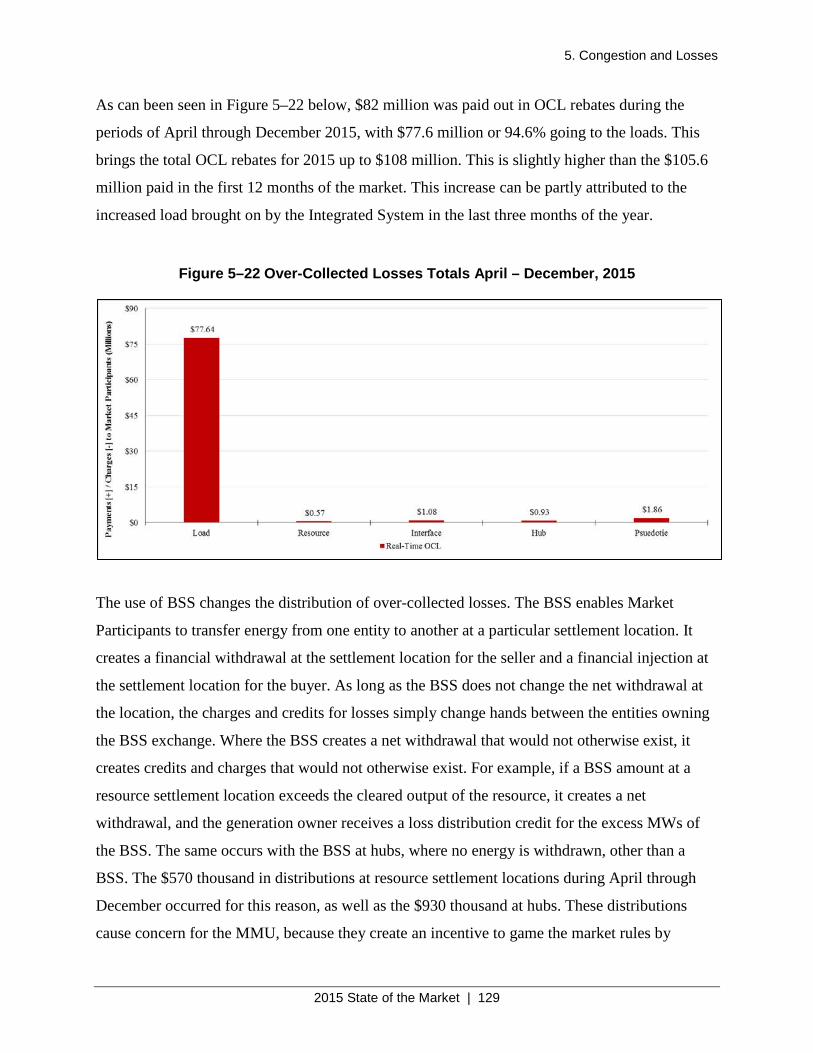
5. Congestion and Losses
2015 State of the Market | 129
As can been seen in Figure 5–22 below, $82 million was paid out in OCL rebates during the
periods of April through December 2015, with $77.6 million or 94.6% going to the loads. This
brings the total OCL rebates for 2015 up to $108 million. This is slightly higher than the $105.6
million paid in the first 12 months of the market. This increase can be partly attributed to the
increased load brought on by the Integrated System in the last three months of the year.
Figure 5–22 Over-Collected Losses Totals April – December, 2015
The use of BSS changes the distribution of over-collected losses. The BSS enables Market
Participants to transfer energy from one entity to another at a particular settlement location. It
creates a financial withdrawal at the settlement location for the seller and a financial injection at
the settlement location for the buyer. As long as the BSS does not change the net withdrawal at
the location, the charges and credits for losses simply change hands between the entities owning
the BSS exchange. Where the BSS creates a net withdrawal that would not otherwise exist, it
creates credits and charges that would not otherwise exist. For example, if a BSS amount at a
resource settlement location exceeds the cleared output of the resource, it creates a net
withdrawal, and the generation owner receives a loss distribution credit for the excess MWs of
the BSS. The same occurs with the BSS at hubs, where no energy is withdrawn, other than a
BSS. The $570 thousand in distributions at resource settlement locations during April through
December occurred for this reason, as well as the $930 thousand at hubs. These distributions
cause concern for the MMU, because they create an incentive to game the market rules by
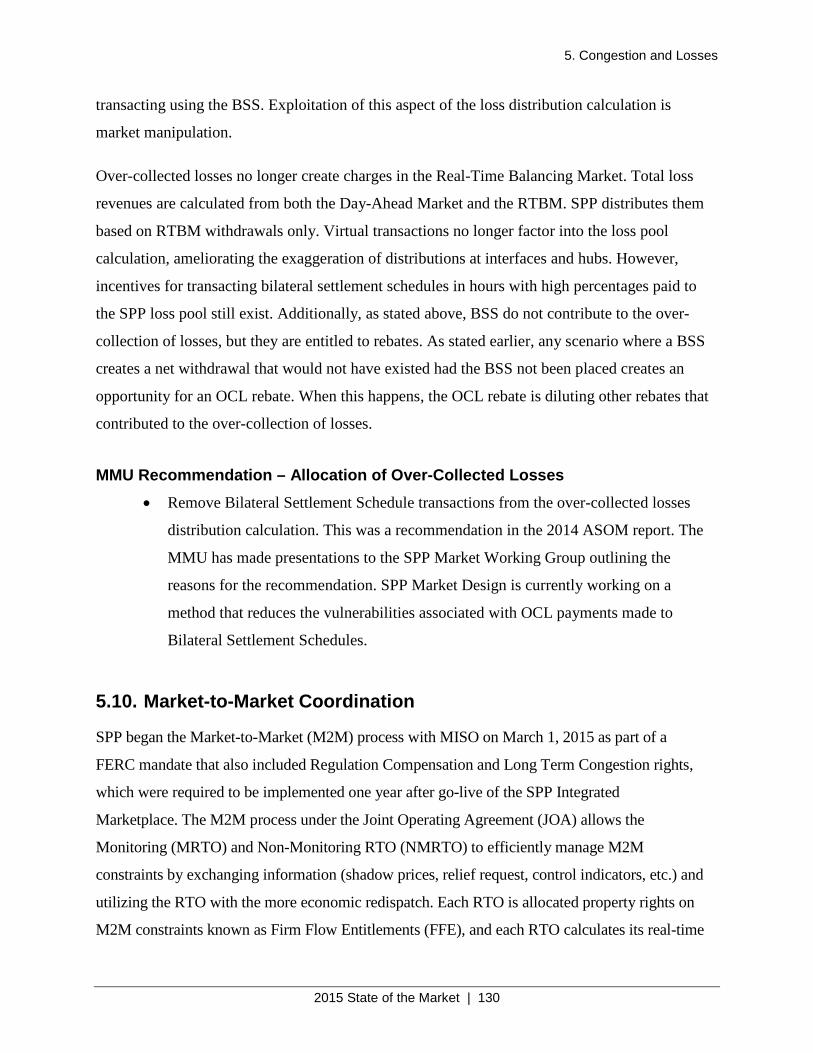
5. Congestion and Losses
2015 State of the Market | 130
transacting using the BSS. Exploitation of this aspect of the loss distribution calculation is
market manipulation.
Over-collected losses no longer create charges in the Real-Time Balancing Market. Total loss
revenues are calculated from both the Day-Ahead Market and the RTBM. SPP distributes them
based on RTBM withdrawals only. Virtual transactions no longer factor into the loss pool
calculation, ameliorating the exaggeration of distributions at interfaces and hubs. However,
incentives for transacting bilateral settlement schedules in hours with high percentages paid to
the SPP loss pool still exist. Additionally, as stated above, BSS do not contribute to the over-
collection of losses, but they are entitled to rebates. As stated earlier, any scenario where a BSS
creates a net withdrawal that would not have existed had the BSS not been placed creates an
opportunity for an OCL rebate. When this happens, the OCL rebate is diluting other rebates that
contributed to the over-collection of losses.
MMU Recommendation – Allocation of Over-Collected Losses • Remove Bilateral Settlement Schedule transactions from the over-collected losses
distribution calculation. This was a recommendation in the 2014 ASOM report. The
MMU has made presentations to the SPP Market Working Group outlining the
reasons for the recommendation. SPP Market Design is currently working on a
method that reduces the vulnerabilities associated with OCL payments made to
Bilateral Settlement Schedules.
5.10. Market-to-Market Coordination
SPP began the Market-to-Market (M2M) process with MISO on March 1, 2015 as part of a
FERC mandate that also included Regulation Compensation and Long Term Congestion rights,
which were required to be implemented one year after go-live of the SPP Integrated
Marketplace. The M2M process under the Joint Operating Agreement (JOA) allows the
Monitoring (MRTO) and Non-Monitoring RTO (NMRTO) to efficiently manage M2M
constraints by exchanging information (shadow prices, relief request, control indicators, etc.) and
utilizing the RTO with the more economic redispatch. Each RTO is allocated property rights on
M2M constraints known as Firm Flow Entitlements (FFE), and each RTO calculates its real-time
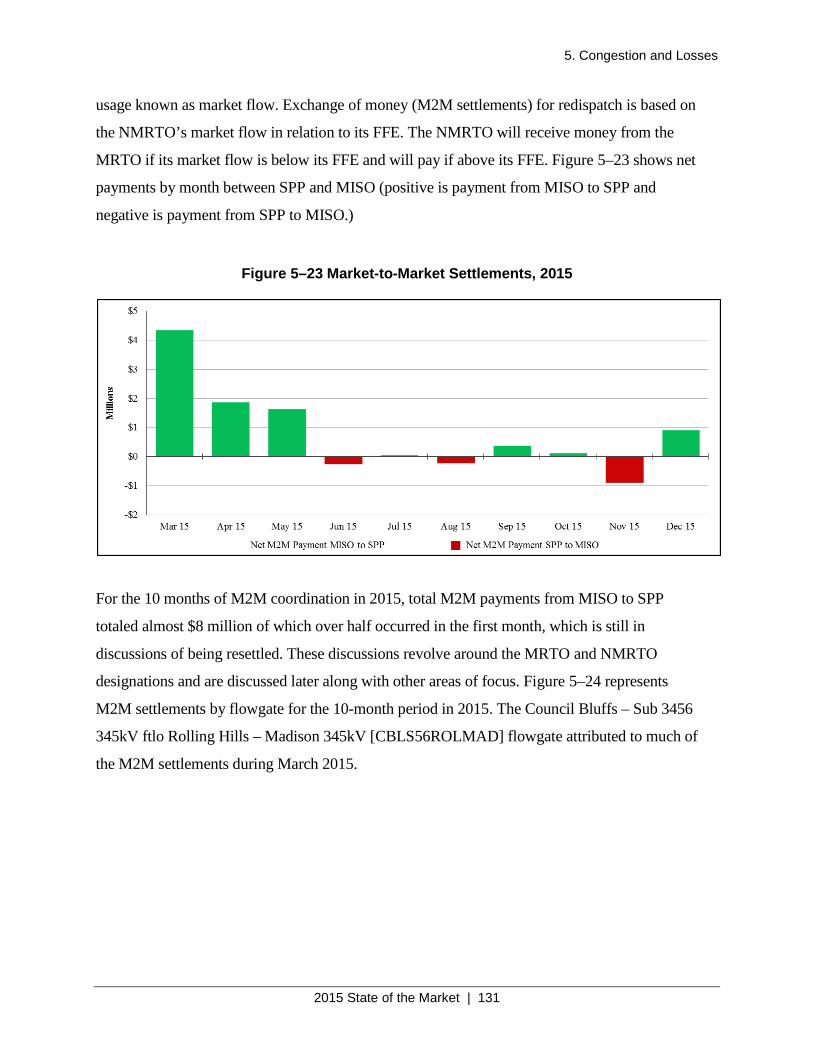
5. Congestion and Losses
2015 State of the Market | 131
usage known as market flow. Exchange of money (M2M settlements) for redispatch is based on
the NMRTO’s market flow in relation to its FFE. The NMRTO will receive money from the
MRTO if its market flow is below its FFE and will pay if above its FFE. Figure 5–23 shows net
payments by month between SPP and MISO (positive is payment from MISO to SPP and
negative is payment from SPP to MISO.)
Figure 5–23 Market-to-Market Settlements, 2015
For the 10 months of M2M coordination in 2015, total M2M payments from MISO to SPP
totaled almost $8 million of which over half occurred in the first month, which is still in
discussions of being resettled. These discussions revolve around the MRTO and NMRTO
designations and are discussed later along with other areas of focus. Figure 5–24 represents
M2M settlements by flowgate for the 10-month period in 2015. The Council Bluffs – Sub 3456
345kV ftlo Rolling Hills – Madison 345kV [CBLS56ROLMAD] flowgate attributed to much of
the M2M settlements during March 2015.
5. Congestion and Losses
2015 State of the Market | 132
Figure 5–24 Net Settlements by Flowgate
M2M allows for a coordinated approach between markets to provide a more economic dispatch
of generation to solve congestion. The following areas of focus were observed during the first 10
months of the M2M, while others were existing issues. Focus on these areas could lead to
improved benefits for both markets.
5.10.1. MRTO/NMRTO Designation
Essentially, the RTO, which manages the limiting element of the constraint, is the MRTO. In
most cases, the MRTO has most of the impact and resources that provide the most effective
relief. MISO and PJM currently implement a procedure on constraints where the MRTO
transfers control to the NMRTO when the NMRTO has what is referred to as “effective control.”
Effective control can be a number of things such as faster ramping resources or resources with
lower costs and/or higher impacts on the constraint. Changing the MRTO/NMRTO designation
has been discussed with SPP stakeholders but concerns over legal obligations (Transmission
Operators contract with SPP to manage their facilities) have delayed this between SPP and
MISO. The Market Monitor urges both SPP and MISO to continue discussions on a procedure to
explore this option and for it to be flexible enough to address temporary conditions.
5.10.2. Shadow Price Override
SPP and MISO have also adopted a mechanism used between MISO and PJM called shadow
price overrides. This mechanism requires the NMRTO to enter an agreed upon shadow price
5. Congestion and Losses
2015 State of the Market | 133
limit rather than the shadow price from the MRTO. This is utilized between SPP and MISO due
to oscillation of flows on a constraint. Although this alleviated the reliability issue of flow
oscillation, the observed shadow price from SPP was $0 and a non-zero shadow price from
MISO. In this scenario MISO provided all the relief at a level that kept SPP’s market from
binding (hence the $0 shadow price). This addresses the reliability issue of oscillation on the
facility but does not provide the correct price signals to both markets. This situation may be an
issue that can be addressed with the MRTO and NMRTO designations.
5.10.3. Use of TLR
SPP, per its Market Protocols, utilizes the TLR process when tagged impacts or other external
impacts are present on an SPP facility while MISO seldom utilizes this mechanism. The Market
Monitor believes that the TLR process is not needed when the SPP and MISO markets have the
majority of impacts but is still needed when external impacts from non-market (third party)
entities are significant. Assuming interface price definitions correctly reflect congestion, tagged
transactions would respond to the market conditions and either withdraw or delay submitting
tags during congestion, therefore alleviating the need for TLR when impacts on the constraint are
mostly between SPP and MISO. When third-party impacts exist, the Market Monitor feels a TLR
is warranted to subject the third party to redispatch. The scenario observed between SPP and
MISO entailed third-party firm Network and Native Load (NNL) impacts that is not subjected to
redispatch by either market. The third party does not have a disincentive in the form of a price
and by the absence of a TLR will not have an obligation to provide relief on the constraint.
Although TLR is not as efficient as a market using price and impacts to redispatch congestion on
a constraint, issuing a TLR (level 5 is required in this case) will subject the third party to a level
of redispatch based on an NNL relief obligation that both markets would no longer bear, which
would be reflected in lower shadow prices. M2M is the preferred method in addressing
congestion along the seams, but until further development is made in the NERC arena TLR is the
only mechanism to manage impacts between markets and non-markets.
5. Congestion and Losses
2015 State of the Market | 134
5.10.4. M2M Flowgate Coordination
Flowgates are subjected to a series of coordination tests to determine if they should become an
M2M flowgate. These tests are run ahead of time when a flowgate is created (reanalyzed
periodically), and in some cases a flowgate may pass for scenarios that are no longer present in
real-time (resource(s) out-of-service, N-1 condition in test not present in real-time, etc.). This
may cause the NMRTO to be asked to provide relief during a configuration when it physically
cannot provide relief (i.e., NMRTO asked to provide negative market flow and resource(s) is off-
line in real-time). The Market Monitor feels automated tests reflecting more recent topology
(possibly day-ahead or two-day ahead) could be used to determine when a flowgate should be
subject to M2M coordination.
5.10.5. Market Flow Methodology
Different methodologies used by each RTO can and often do have a significant impact on how
each RTO serves its load and can have a significant adverse impact on the efficiency of M2M
coordination. This condition has existed for years between SPP, MISO, and PJM. Discussions on
this issue ceased with all parties agreeing to accept the differences in each of their approaches.
MISO and PJM utilize a marginal zone methodology (although the marginal are derived in
different manners), and SPP uses a tagging impact approach. The Market Monitor does not feel
any method has proved to be consistently more accurate. Given the importance of the market
flow in M2M settlements (market flow is used to measure what portion of the NMRTO’s FFE is
being utilized), this topic should be revived to ensure consistency and equitable measurements
across RTOs.
6. Competitive Assessment
2015 State of the Market | 135
6. Competitive Assessment
The SPP Integrated Marketplace provides sufficient market incentives to produce competitive
market outcomes in regions and periods when there are no concerns with regard to local market
power. The MMU’s competitive assessment provides evidence that in 2015 market outcomes
were workably competitive and that the market required mitigation of local market power
infrequently to achieve those outcomes.
This market power analysis looks at both the structural and behavioral aspects of market power
concerns. The structural aspects can be detected by various techniques such as concentration
indices, Market Share Analysis, and Pivotal Supplier Analysis (PSA). The structural indicators
are used to look for the potential for market power without regard to the actual exercise of
market power. Behavioral aspects, on the other hand, assess the actual offer or bid behavior (i.e.,
conduct) of the Market Participants and the impact of such behavior on market prices by looking
for the exercise of market power. These behavioral indicators include Price-Cost Margin (or
markup), Economic Withholding Analysis (addressed through automated mitigation, see Section
6.2.1; and through the output gap analysis, see Section 6.2.3), and Physical Withholding
Analysis (addressed through FERC referrals).
The assessment of the competitive environment during 2015 establishes the level of structural
market power and then examines market prices for indications of market power impact.
Automatic market power mitigation processes limit the ability of generators with local market
power to raise prices above competitive levels. This section assesses the potential existence of
global market power and analyzes prices without regard to whether market power mitigation
measures were in place. Section 6.2 analyzes the behavioral aspects of market power. The
following subsections examine the effectiveness of local market power mitigation and the
significance of market power in the SPP Markets.
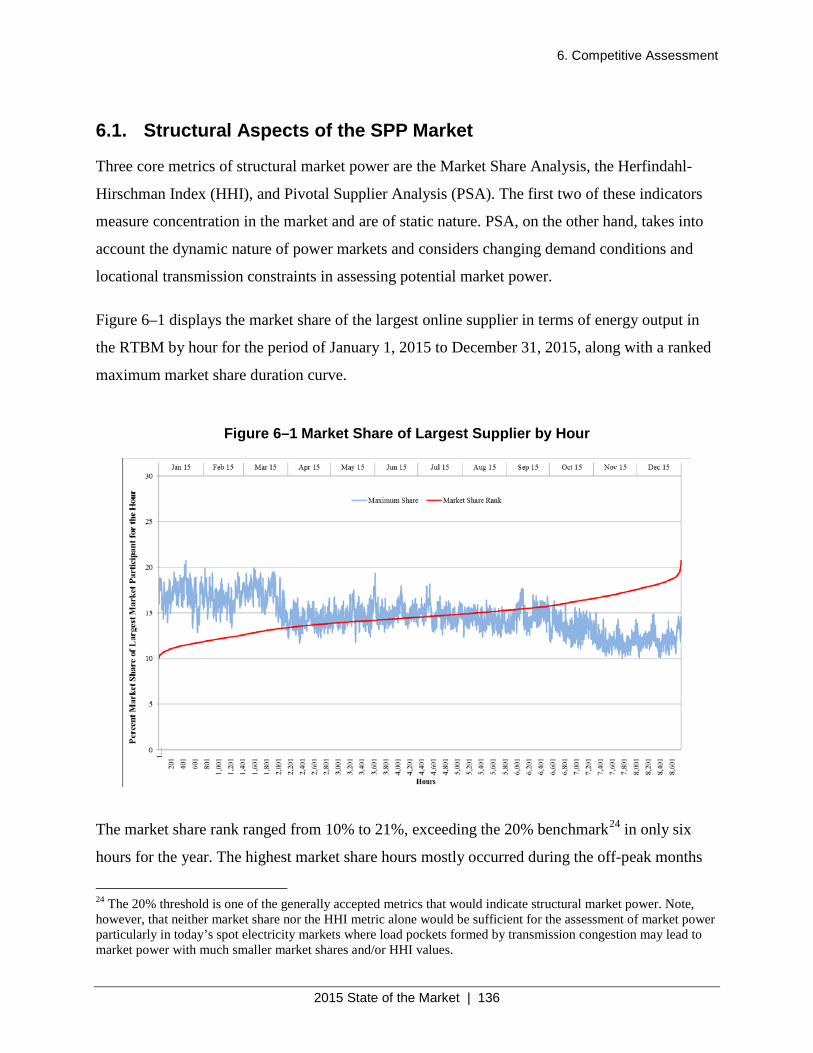
6. Competitive Assessment
2015 State of the Market | 136
6.1. Structural Aspects of the SPP Market
Three core metrics of structural market power are the Market Share Analysis, the Herfindahl-
Hirschman Index (HHI), and Pivotal Supplier Analysis (PSA). The first two of these indicators
measure concentration in the market and are of static nature. PSA, on the other hand, takes into
account the dynamic nature of power markets and considers changing demand conditions and
locational transmission constraints in assessing potential market power.
Figure 6–1 displays the market share of the largest online supplier in terms of energy output in
the RTBM by hour for the period of January 1, 2015 to December 31, 2015, along with a ranked
maximum market share duration curve.
Figure 6–1 Market Share of Largest Supplier by Hour
The market share rank ranged from 10% to 21%, exceeding the 20% benchmark24 in only six
hours for the year. The highest market share hours mostly occurred during the off-peak months
24 The 20% threshold is one of the generally accepted metrics that would indicate structural market power. Note, however, that neither market share nor the HHI metric alone would be sufficient for the assessment of market power particularly in today’s spot electricity markets where load pockets formed by transmission congestion may lead to market power with much smaller market shares and/or HHI values.
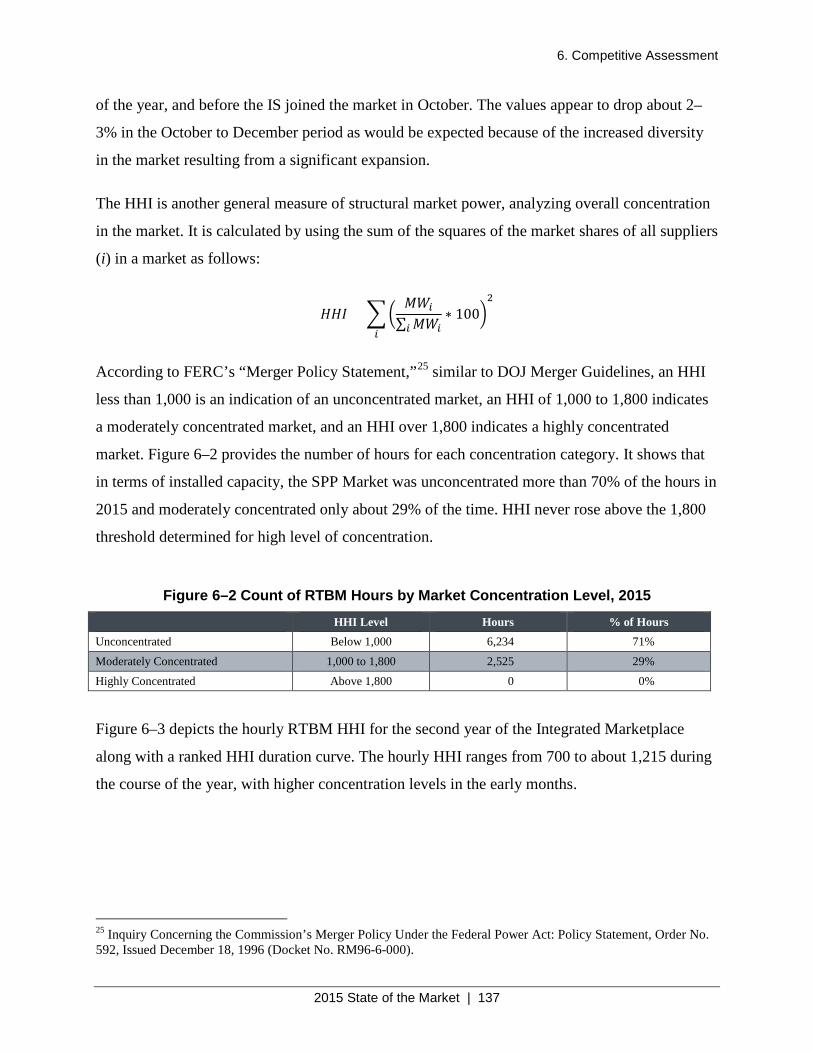
6. Competitive Assessment
2015 State of the Market | 137
of the year, and before the IS joined the market in October. The values appear to drop about 2–
3% in the October to December period as would be expected because of the increased diversity
in the market resulting from a significant expansion.
The HHI is another general measure of structural market power, analyzing overall concentration
in the market. It is calculated by using the sum of the squares of the market shares of all suppliers
(i) in a market as follows:
𝐻𝐻𝐻𝐻𝐻𝐻 = ��𝐿𝐿𝑀𝑀𝑆𝑆∑ 𝐿𝐿𝑀𝑀𝑆𝑆𝑆𝑆
∗ 100�2
𝑆𝑆
According to FERC’s “Merger Policy Statement,”25 similar to DOJ Merger Guidelines, an HHI
less than 1,000 is an indication of an unconcentrated market, an HHI of 1,000 to 1,800 indicates
a moderately concentrated market, and an HHI over 1,800 indicates a highly concentrated
market. Figure 6–2 provides the number of hours for each concentration category. It shows that
in terms of installed capacity, the SPP Market was unconcentrated more than 70% of the hours in
2015 and moderately concentrated only about 29% of the time. HHI never rose above the 1,800
threshold determined for high level of concentration.
Figure 6–2 Count of RTBM Hours by Market Concentration Level, 2015
HHI Level Hours % of Hours Unconcentrated Below 1,000 6,234 71%
Moderately Concentrated 1,000 to 1,800 2,525 29%
Highly Concentrated Above 1,800 0 0%
Figure 6–3 depicts the hourly RTBM HHI for the second year of the Integrated Marketplace
along with a ranked HHI duration curve. The hourly HHI ranges from 700 to about 1,215 during
the course of the year, with higher concentration levels in the early months.
25 Inquiry Concerning the Commission’s Merger Policy Under the Federal Power Act: Policy Statement, Order No. 592, Issued December 18, 1996 (Docket No. RM96-6-000).
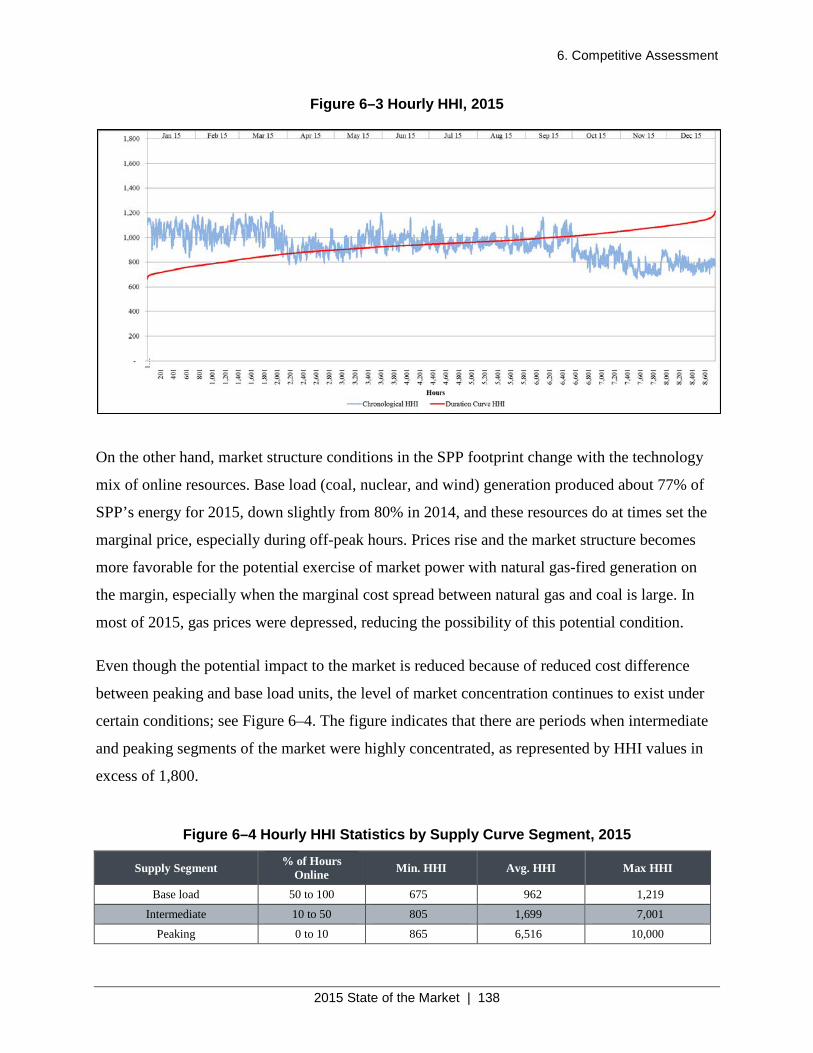
6. Competitive Assessment
2015 State of the Market | 138
Figure 6–3 Hourly HHI, 2015
On the other hand, market structure conditions in the SPP footprint change with the technology
mix of online resources. Base load (coal, nuclear, and wind) generation produced about 77% of
SPP’s energy for 2015, down slightly from 80% in 2014, and these resources do at times set the
marginal price, especially during off-peak hours. Prices rise and the market structure becomes
more favorable for the potential exercise of market power with natural gas-fired generation on
the margin, especially when the marginal cost spread between natural gas and coal is large. In
most of 2015, gas prices were depressed, reducing the possibility of this potential condition.
Even though the potential impact to the market is reduced because of reduced cost difference
between peaking and base load units, the level of market concentration continues to exist under
certain conditions; see Figure 6–4. The figure indicates that there are periods when intermediate
and peaking segments of the market were highly concentrated, as represented by HHI values in
excess of 1,800.
Figure 6–4 Hourly HHI Statistics by Supply Curve Segment, 2015
Supply Segment % of Hours Online Min. HHI Avg. HHI Max HHI
Base load 50 to 100 675 962 1,219
Intermediate 10 to 50 805 1,699 7,001
Peaking 0 to 10 865 6,516 10,000
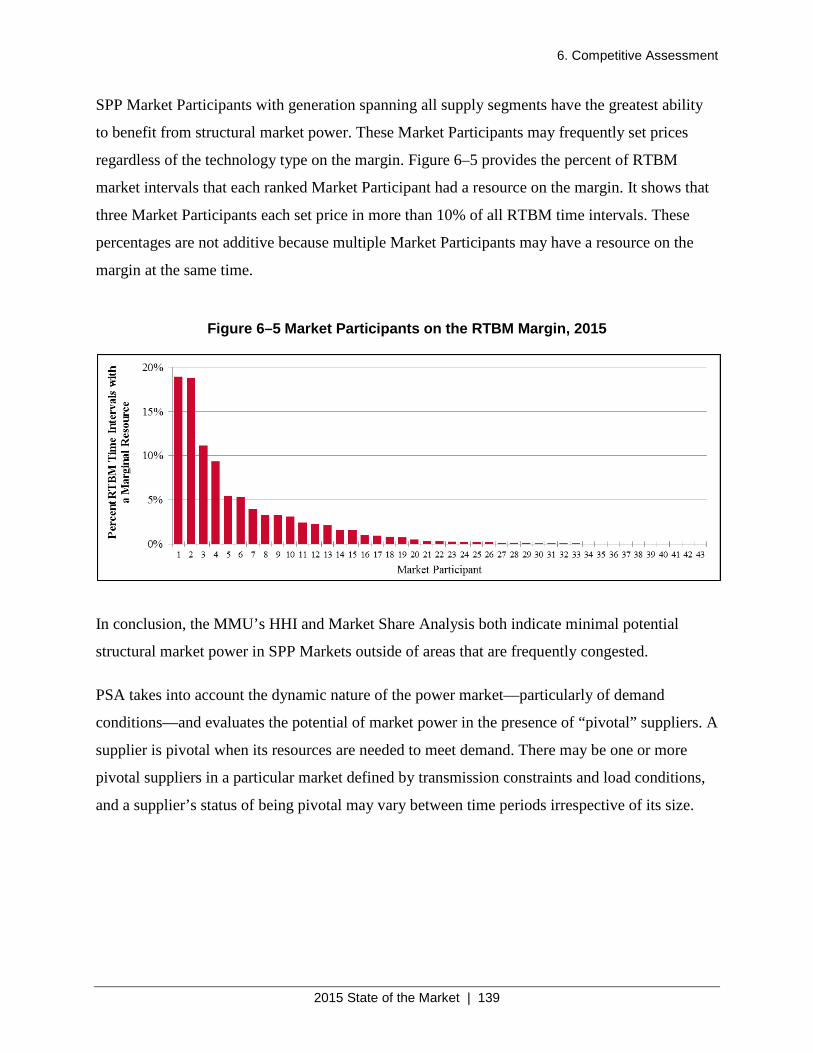
6. Competitive Assessment
2015 State of the Market | 139
SPP Market Participants with generation spanning all supply segments have the greatest ability
to benefit from structural market power. These Market Participants may frequently set prices
regardless of the technology type on the margin. Figure 6–5 provides the percent of RTBM
market intervals that each ranked Market Participant had a resource on the margin. It shows that
three Market Participants each set price in more than 10% of all RTBM time intervals. These
percentages are not additive because multiple Market Participants may have a resource on the
margin at the same time.
Figure 6–5 Market Participants on the RTBM Margin, 2015
In conclusion, the MMU’s HHI and Market Share Analysis both indicate minimal potential
structural market power in SPP Markets outside of areas that are frequently congested.
PSA takes into account the dynamic nature of the power market—particularly of demand
conditions—and evaluates the potential of market power in the presence of “pivotal” suppliers. A
supplier is pivotal when its resources are needed to meet demand. There may be one or more
pivotal suppliers in a particular market defined by transmission constraints and load conditions,
and a supplier’s status of being pivotal may vary between time periods irrespective of its size.
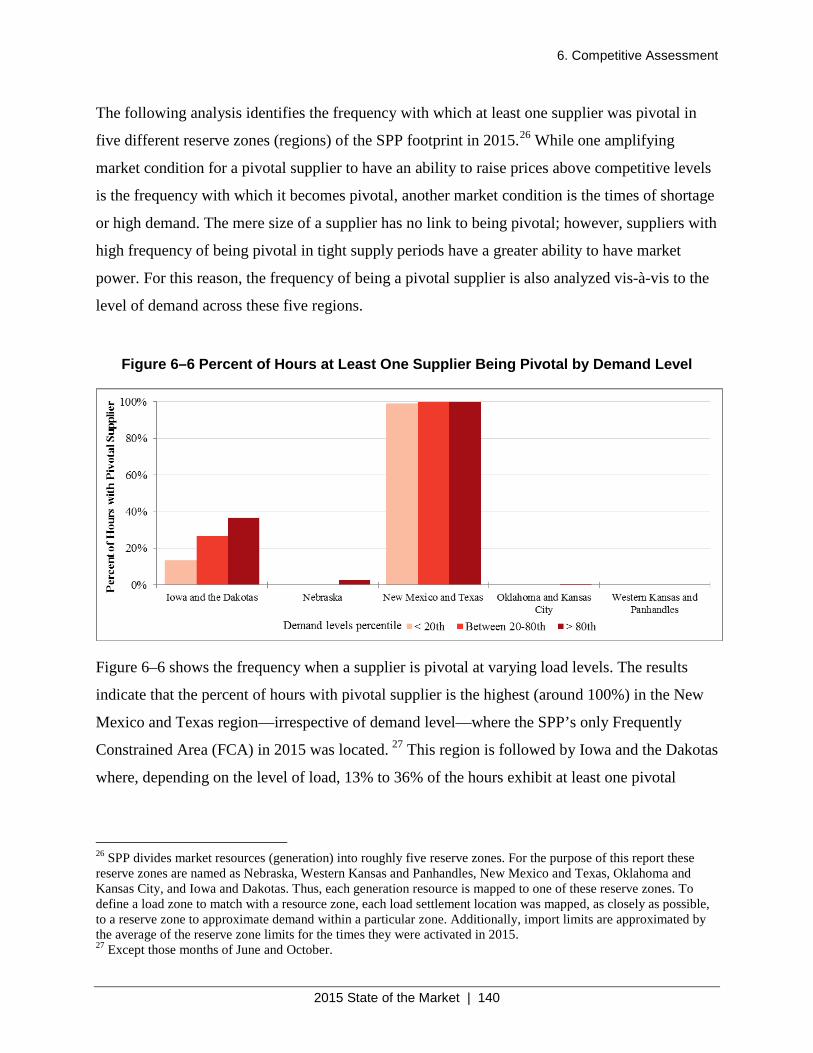
6. Competitive Assessment
2015 State of the Market | 140
The following analysis identifies the frequency with which at least one supplier was pivotal in
five different reserve zones (regions) of the SPP footprint in 2015.26 While one amplifying
market condition for a pivotal supplier to have an ability to raise prices above competitive levels
is the frequency with which it becomes pivotal, another market condition is the times of shortage
or high demand. The mere size of a supplier has no link to being pivotal; however, suppliers with
high frequency of being pivotal in tight supply periods have a greater ability to have market
power. For this reason, the frequency of being a pivotal supplier is also analyzed vis-à-vis to the
level of demand across these five regions.
Figure 6–6 Percent of Hours at Least One Supplier Being Pivotal by Demand Level
Figure 6–6 shows the frequency when a supplier is pivotal at varying load levels. The results
indicate that the percent of hours with pivotal supplier is the highest (around 100%) in the New
Mexico and Texas region—irrespective of demand level—where the SPP’s only Frequently
Constrained Area (FCA) in 2015 was located. 27 This region is followed by Iowa and the Dakotas
where, depending on the level of load, 13% to 36% of the hours exhibit at least one pivotal
26 SPP divides market resources (generation) into roughly five reserve zones. For the purpose of this report these reserve zones are named as Nebraska, Western Kansas and Panhandles, New Mexico and Texas, Oklahoma and Kansas City, and Iowa and Dakotas. Thus, each generation resource is mapped to one of these reserve zones. To define a load zone to match with a resource zone, each load settlement location was mapped, as closely as possible, to a reserve zone to approximate demand within a particular zone. Additionally, import limits are approximated by the average of the reserve zone limits for the times they were activated in 2015. 27 Except those months of June and October.
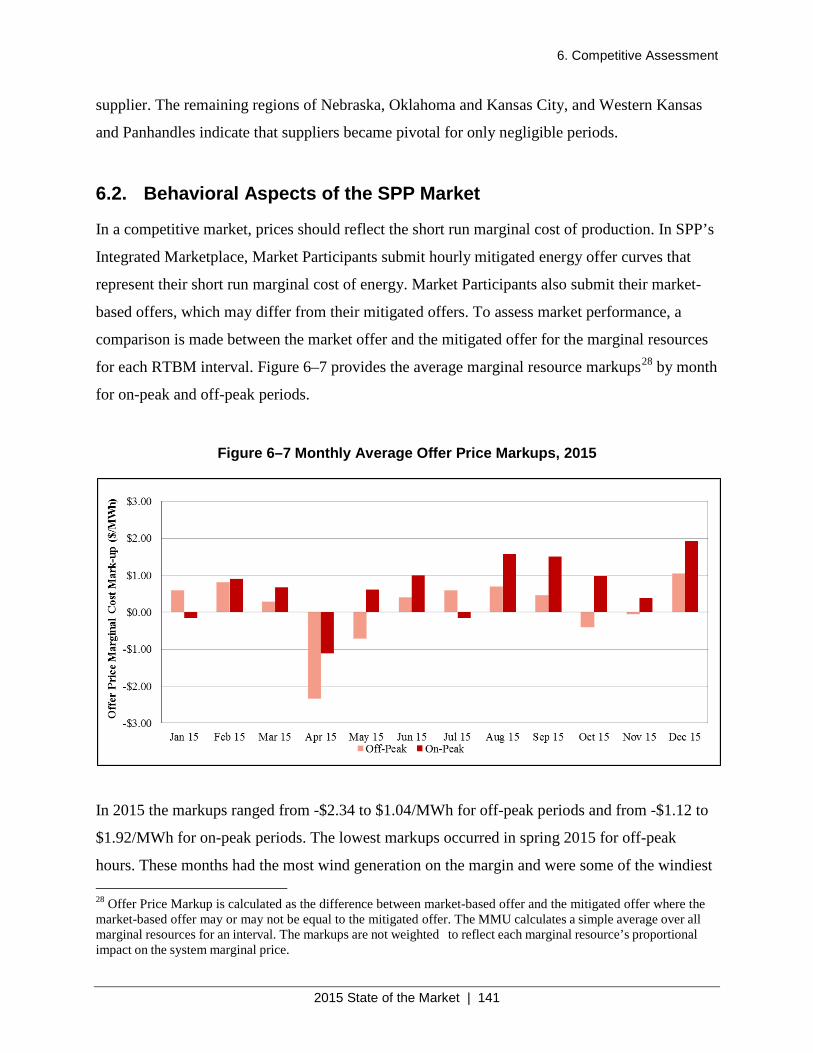
6. Competitive Assessment
2015 State of the Market | 141
supplier. The remaining regions of Nebraska, Oklahoma and Kansas City, and Western Kansas
and Panhandles indicate that suppliers became pivotal for only negligible periods.
6.2. Behavioral Aspects of the SPP Market
In a competitive market, prices should reflect the short run marginal cost of production. In SPP’s
Integrated Marketplace, Market Participants submit hourly mitigated energy offer curves that
represent their short run marginal cost of energy. Market Participants also submit their market-
based offers, which may differ from their mitigated offers. To assess market performance, a
comparison is made between the market offer and the mitigated offer for the marginal resources
for each RTBM interval. Figure 6–7 provides the average marginal resource markups28 by month
for on-peak and off-peak periods.
Figure 6–7 Monthly Average Offer Price Markups, 2015
In 2015 the markups ranged from -$2.34 to $1.04/MWh for off-peak periods and from -$1.12 to
$1.92/MWh for on-peak periods. The lowest markups occurred in spring 2015 for off-peak
hours. These months had the most wind generation on the margin and were some of the windiest 28 Offer Price Markup is calculated as the difference between market-based offer and the mitigated offer where the market-based offer may or may not be equal to the mitigated offer. The MMU calculates a simple average over all marginal resources for an interval. The markups are not weighted to reflect each marginal resource’s proportional impact on the system marginal price.
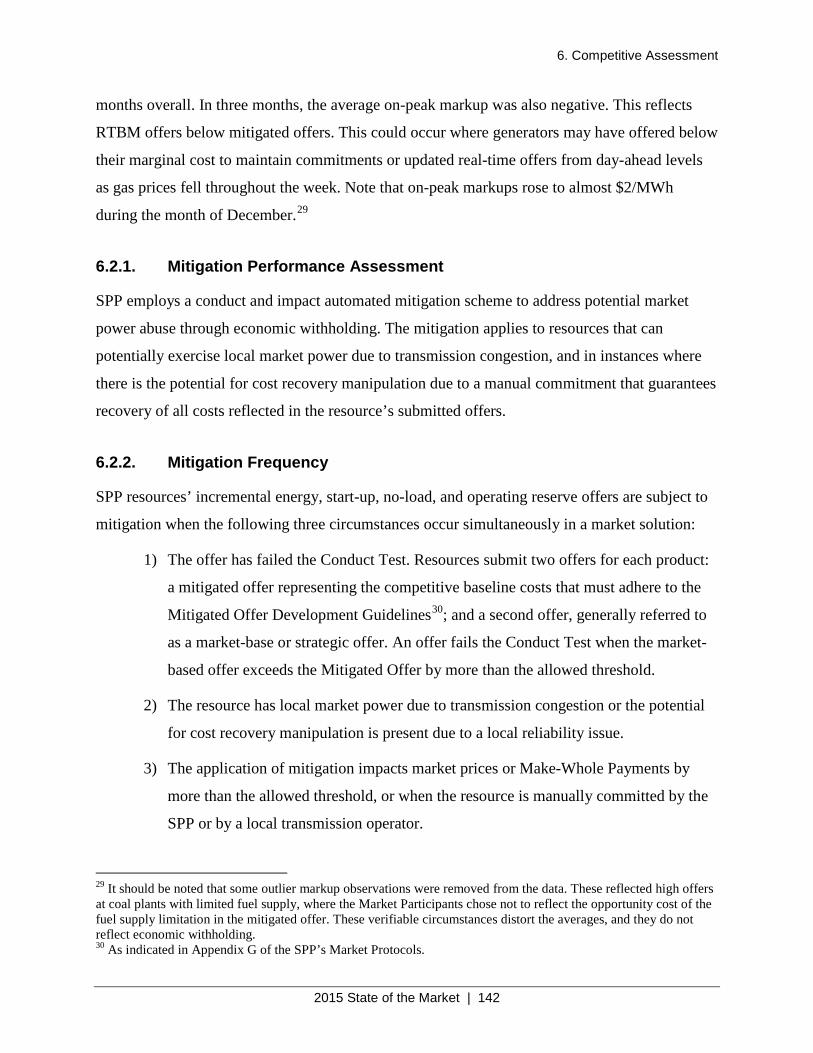
6. Competitive Assessment
2015 State of the Market | 142
months overall. In three months, the average on-peak markup was also negative. This reflects
RTBM offers below mitigated offers. This could occur where generators may have offered below
their marginal cost to maintain commitments or updated real-time offers from day-ahead levels
as gas prices fell throughout the week. Note that on-peak markups rose to almost $2/MWh
during the month of December.29
6.2.1. Mitigation Performance Assessment
SPP employs a conduct and impact automated mitigation scheme to address potential market
power abuse through economic withholding. The mitigation applies to resources that can
potentially exercise local market power due to transmission congestion, and in instances where
there is the potential for cost recovery manipulation due to a manual commitment that guarantees
recovery of all costs reflected in the resource’s submitted offers.
6.2.2. Mitigation Frequency
SPP resources’ incremental energy, start-up, no-load, and operating reserve offers are subject to
mitigation when the following three circumstances occur simultaneously in a market solution:
1) The offer has failed the Conduct Test. Resources submit two offers for each product:
a mitigated offer representing the competitive baseline costs that must adhere to the
Mitigated Offer Development Guidelines30; and a second offer, generally referred to
as a market-base or strategic offer. An offer fails the Conduct Test when the market-
based offer exceeds the Mitigated Offer by more than the allowed threshold.
2) The resource has local market power due to transmission congestion or the potential
for cost recovery manipulation is present due to a local reliability issue.
3) The application of mitigation impacts market prices or Make-Whole Payments by
more than the allowed threshold, or when the resource is manually committed by the
SPP or by a local transmission operator.
29 It should be noted that some outlier markup observations were removed from the data. These reflected high offers at coal plants with limited fuel supply, where the Market Participants chose not to reflect the opportunity cost of the fuel supply limitation in the mitigated offer. These verifiable circumstances distort the averages, and they do not reflect economic withholding. 30 As indicated in Appendix G of the SPP’s Market Protocols.
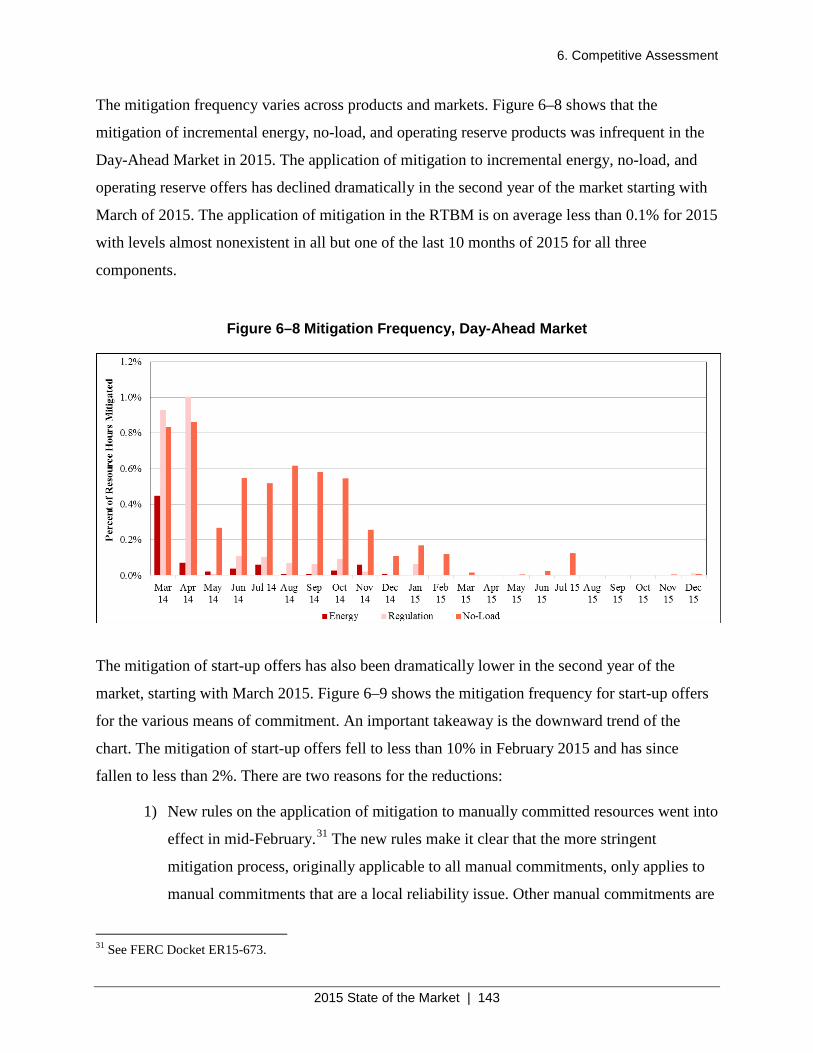
6. Competitive Assessment
2015 State of the Market | 143
The mitigation frequency varies across products and markets. Figure 6–8 shows that the
mitigation of incremental energy, no-load, and operating reserve products was infrequent in the
Day-Ahead Market in 2015. The application of mitigation to incremental energy, no-load, and
operating reserve offers has declined dramatically in the second year of the market starting with
March of 2015. The application of mitigation in the RTBM is on average less than 0.1% for 2015
with levels almost nonexistent in all but one of the last 10 months of 2015 for all three
components.
Figure 6–8 Mitigation Frequency, Day-Ahead Market
The mitigation of start-up offers has also been dramatically lower in the second year of the
market, starting with March 2015. Figure 6–9 shows the mitigation frequency for start-up offers
for the various means of commitment. An important takeaway is the downward trend of the
chart. The mitigation of start-up offers fell to less than 10% in February 2015 and has since
fallen to less than 2%. There are two reasons for the reductions:
1) New rules on the application of mitigation to manually committed resources went into
effect in mid-February.31 The new rules make it clear that the more stringent
mitigation process, originally applicable to all manual commitments, only applies to
manual commitments that are a local reliability issue. Other manual commitments are
31 See FERC Docket ER15-673.
6. Competitive Assessment
2015 State of the Market | 144
subject to mitigation procedures comparable to those applied in the Day-Ahead
Market and DA RUC, and ID RUC;
2) The other reason for the drop is the increase in the impact test threshold to $25/MWh.
Figure 6–9 Mitigation Frequency, Day-Ahead Market Start-Up Offers
6.2.3. Output Gap as a Measure for Economic Withholding
Economic withholding by a resource is defined as submitting offers that are unjustifiably high
such that either the resource is not or will not be scheduled/dispatched, or if dispatched such
offers will set a higher than competitive market clearing price. Accordingly, the output gap
metric aims to measure the amount of output that was withheld from the market by submitting
offers in excess of competitive levels. Competitive offers (i.e., mitigated offers) in the SPP
Market are determined at the level of short-run marginal cost of production and the output gap
corresponds to that withheld—not produced—output as a result of offers exceeding the mitigated
offer by a conduct threshold. In this report, the output gap is calculated as the difference between
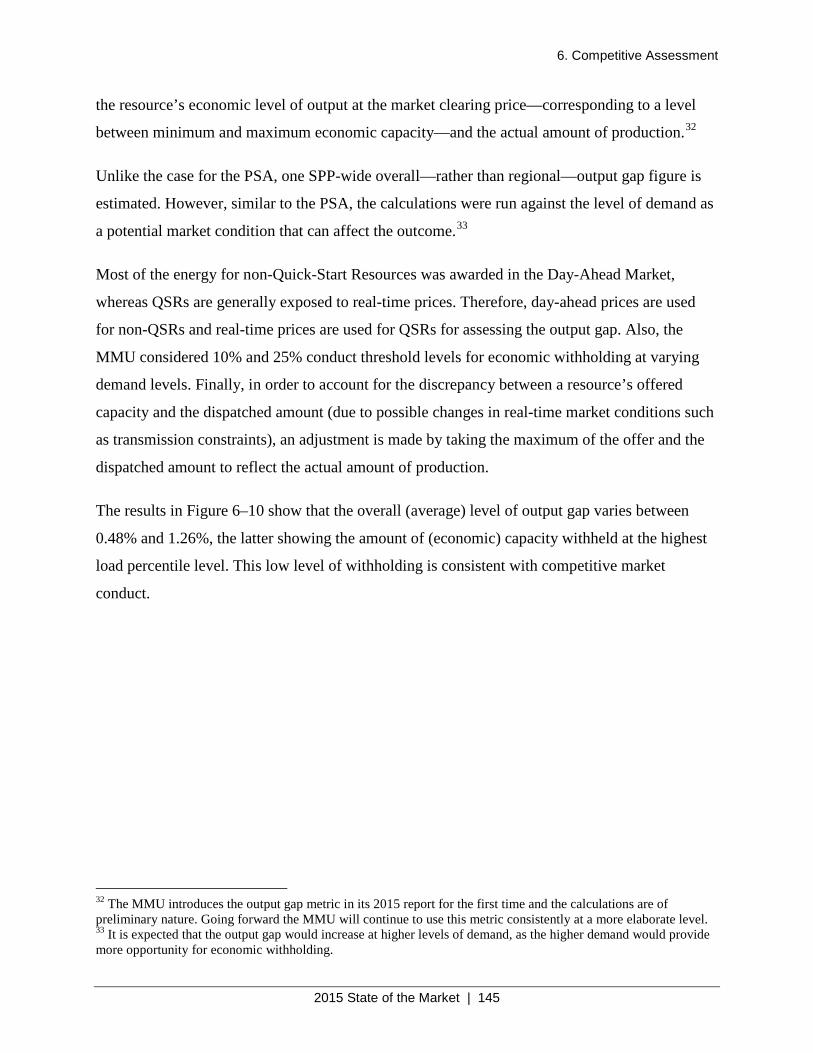
6. Competitive Assessment
2015 State of the Market | 145
the resource’s economic level of output at the market clearing price—corresponding to a level
between minimum and maximum economic capacity—and the actual amount of production.32
Unlike the case for the PSA, one SPP-wide overall—rather than regional—output gap figure is
estimated. However, similar to the PSA, the calculations were run against the level of demand as
a potential market condition that can affect the outcome.33
Most of the energy for non-Quick-Start Resources was awarded in the Day-Ahead Market,
whereas QSRs are generally exposed to real-time prices. Therefore, day-ahead prices are used
for non-QSRs and real-time prices are used for QSRs for assessing the output gap. Also, the
MMU considered 10% and 25% conduct threshold levels for economic withholding at varying
demand levels. Finally, in order to account for the discrepancy between a resource’s offered
capacity and the dispatched amount (due to possible changes in real-time market conditions such
as transmission constraints), an adjustment is made by taking the maximum of the offer and the
dispatched amount to reflect the actual amount of production.
The results in Figure 6–10 show that the overall (average) level of output gap varies between
0.48% and 1.26%, the latter showing the amount of (economic) capacity withheld at the highest
load percentile level. This low level of withholding is consistent with competitive market
conduct.
32 The MMU introduces the output gap metric in its 2015 report for the first time and the calculations are of preliminary nature. Going forward the MMU will continue to use this metric consistently at a more elaborate level. 33 It is expected that the output gap would increase at higher levels of demand, as the higher demand would provide more opportunity for economic withholding.
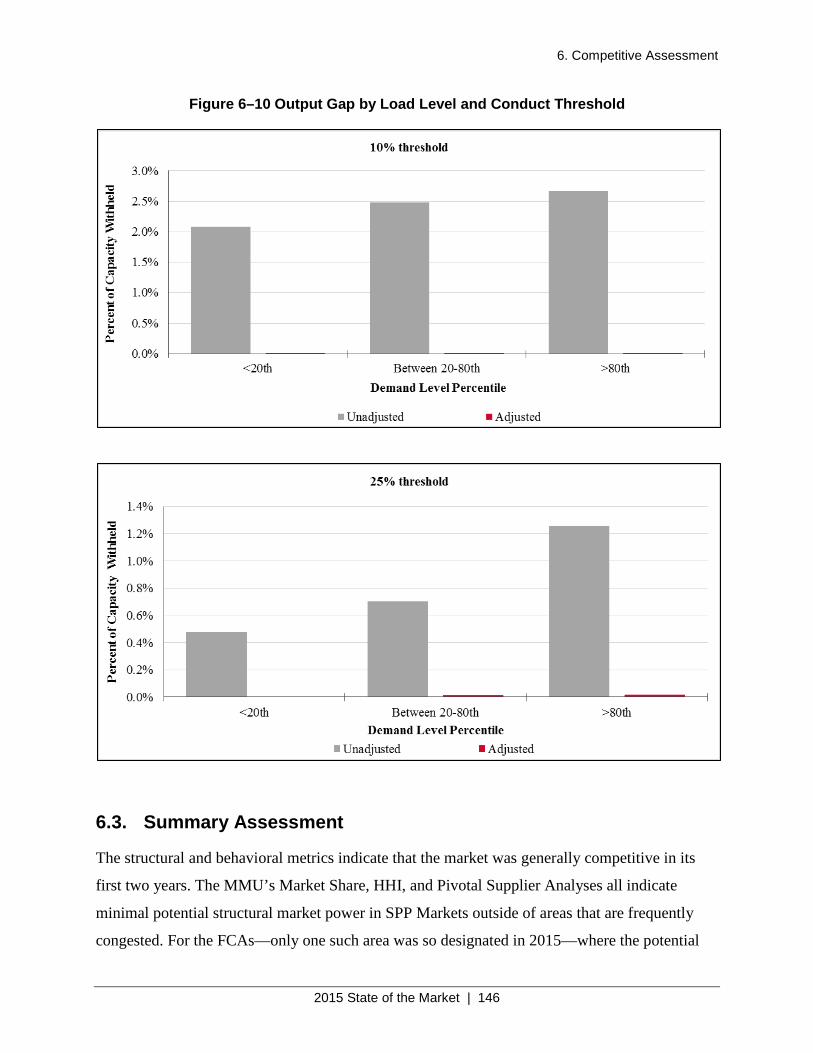
6. Competitive Assessment
2015 State of the Market | 146
Figure 6–10 Output Gap by Load Level and Conduct Threshold
6.3. Summary Assessment
The structural and behavioral metrics indicate that the market was generally competitive in its
first two years. The MMU’s Market Share, HHI, and Pivotal Supplier Analyses all indicate
minimal potential structural market power in SPP Markets outside of areas that are frequently
congested. For the FCAs—only one such area was so designated in 2015—where the potential
6. Competitive Assessment
2015 State of the Market | 147
for concerns of local market power is the highest, existing mitigation measures with relatively
tight thresholds provided an effective level of local market power mitigation in terms of
preventing pivotal suppliers unilaterally raising prices.
Behavioral indicators were also assessed through the analysis of actual offer or bid behavior (i.e.,
conduct) of the Market Participants and the impact of such behavior on market prices to look for
the exercise of market power. In that context, the frequency of mitigation in 2015 was
dramatically lower than that experienced in 2014. The mitigation for energy, regulation, and no-
load in 2015 was generally below the 0.1% level in many months, while the mitigation level for
these market components was virtually zero for all but one of the last eight months of the year.
This is in stark contrast to the mitigation levels in 2014 when some of these components
experienced mitigation levels approaching 1%. The decline in the frequency of start-up offer
mitigation in the Day-Ahead Market in 2015 is similar to that experienced for the other market
components, declining from 15–20% levels in 2014 to about the 1% level in 2015. This overall
decline in the level of mitigation of more than 90% is attributed to normal market maturing and
the addressing of some specific market implementation problems. The overall mitigation
frequency levels experienced in 2015 is consistent with those levels experienced in other
markets.
Finally, output gap as a measure for economic withholding was also calculated and the results
show that the overall (average) level of the output gap varies between 0.48% and 1.26%, the
latter showing the amount of (economic) capacity withheld at the highest load percentile level.
This low level of withholding is consistent with competitive market conduct.
Overall, the SPP Integrated Marketplace provides sufficient market incentives to produce
competitive market outcomes in regions and periods when there are no concerns with regard to
local market power. The MMU’s competitive assessment provides evidence that market results
in 2015 were workably competitive and that the market required mitigation of local market
power infrequently to achieve those outcomes. Nonetheless, mitigation remains an essential tool
in ensuring market results are competitive during periods of high demand and supply shortages
when such market conditions offer suppliers the potential to abuse local market power.
7. Recommendations
2015 State of the Market | 148
7. Recommendations
One of the core functions of a market monitor as defined by the FERC in Order No. 719 is “to
advise the Commission, the RTO or ISO, and other interested entities of its views regarding any
needed rule and tariff changes.” The MMU accomplishes this responsibility through many
forums, including but not limited to active participation in the SPP stakeholder meetings process,
commenting on FERC NOPERs, submitting comment at FERC on SPP filings, and making
recommendations in the Annual State of the Market report, to name some of the better known
forums. In order to be effective and efficient, the MMU identifies and uses the most appropriate
forum or combination of forums given the issue under consideration.
This section summarizes the status of previous recommendations, discusses revisions to previous
recommendations, identifies open issues, and presents new recommendations. The MMU has
determined several previous recommendations have been addressed to a satisfactory level and
that the MMU will monitor conditions as needed. Those topics, as well as others, will continue to
be monitored. Should those topics need to be addressed in future, then the MMU will present
new recommendations in a forum that is most appropriate for that issue.
The 2014 report contained a number of recommendations identified during or before the startup
of the Integrated Marketplace. As with the startup of any program the size of the Integrated
Marketplace, it was not surprising that there were a number of concerns identified by the MMU.
The SPP Board of Directors’ serious consideration of those recommendations is greatly
appreciated by the MMU. It is the opinion of the MMU that significant progress has been made
on many of the 2014 recommendations as described in this section. Some of the
recommendations have been revised given the changes in the market and are the result of
additional analysis by the MMU.
7.1. Quick-Start Logic
In the 2014 ASOM the MMU identified Quick-Start Resources as an area of concern and made
several recommendations. Analysis presented in the body of this report demonstrates that
significant progress has been made in addressing those concerns.
7. Recommendations
2015 State of the Market | 149
In 2015 SPP pursued two market design changes that should have a positive impact on the
commitment of and Make-Whole Payments to QSRs: 1) RR99 Short-Term RUC (ST RUC) with
Quick-Start Carve-Out, which is fully implemented as of April 2016; and 2) MPRR116 Quick-
Start Resource Enhancements, which is expected to be implemented by mid-2017. While these
design changes reduce QSRs’ inclusion for consideration in RUC processes, these resources will
still be subject to RTMB commitment and thus be eligible for Make-Whole Payments. Late in
2015, the MWG proposed to wait and see the results of RR99 and RR116 changes before taking
any further action related to QSRs.
Generally, the MMU supports the efforts of the RTO to shorten the time between QSR
commitment and dispatch to enable more economic commitments as forecast data improves. In
that context a trend of more economic dispatch is observed in 2015, and early indications are that
the trend continues in 2016. For the first 12 months of the Integrated Marketplace (March 2014
to March 2015), the share of QSR dispatches during intervals where the LMP was above the
market offers covers just over half of the power produced. During 2015 over two-thirds of the
power produced by QSRs corresponded to intervals where LMP was above the market offer
compared to the three quarters share of other types of resources. The MMU recognizes this as
progress towards more efficient use of these units, and encourages the RTO to implement the
planned changes quickly. The MMU also recognizes that there may be individual QSRs that fall
outside the general trend and need to be assessed individually.
An analysis of RUC Make-Whole Payments to QSRs shows the trend is down at the end of 2015,
and early indications in 2016 suggest the trend continues. As the Short-Term RUC process is
implemented in 2016, fewer Make-Whole Payments to QSRs may be observed. However, the
MMU will continue to follow the implementation of this process and evaluate the impact of the
changes.
Given the significant progress in addressing the identified concerns, and the pending
implementation of additional changes that should further advance the resolution of the issues
regarding QSRs, the MMU considers the recommendations regarding QSRs to be addressed. The
MMU will continue to monitor the participation of these resources in the market and make new
recommendations as needed.
7. Recommendations
2015 State of the Market | 150
7.2. Ramp-Constrained Shortage Pricing
The Market Monitor previously recommended pricing the ramp-constrained operating reserve
shortages in a manner similar to the operating reserve capacity shortages. Efficient prices reflect
the cost of the marginal action. Analysis presented in the body of this report indicates that ramp-
constrained shortage pricing continues to be low. The MMU is not aware of any direct action
with regard to this issue by the SPP during 2015.
The MMU is aware of the FERC issued Notice of Proposed Rulemaking (NOPR) and the
subsequently issued order on a closely related subject, “Settlement Intervals and Shortage
Pricing in Markets Operated by Regional Transmission Organizations and Independent System
Operators” (RM 15-24-000).34 The MMU is also aware of SPP’s preference to wait for the
FERC decision per this NOPR and the order before initiating discussions on this subject.
In the meantime, the MWG formed a Price Formation Task Force (PFTF) “to evaluate the
efficiency and transparency of Energy and Operating Reserve pricing,” which is expected to
complete its tasks by the end of 2016. The PFTF is expected to discuss and address various
pricing issues including the scarcity/shortage pricing, refinement of existing product pricing, and
the introduction of new products to the SPP Market.
The MMU will continue to track this issue, assess the results of the activities describe above, and
then determine if and which concerns outlined in the 2014 report are sufficiently addressed.
7.3. Manipulation of Make-Whole Payment Provisions
The MMU initiated discussion with the Market Working Group in late 2013 with regard to
potential market manipulation issues experienced in other markets with a Day-Ahead Market.
The MMU also identified a concern with potential manipulation of Make-Whole Payments for
the JOU Combined Resource Option.
The Market Working Group has approved a design change that addresses the manipulation issue
associated with the JOU Combined Resource, and most of the market efficiency concerns also
associated with this JOU issue. The change is scheduled to be implemented in the first quarter of 34 NOPR, RM 15-24-000 issued September 17, 2015 and Order No. 825 issued June 16, 2016.
7. Recommendations
2015 State of the Market | 151
2017, and the MMU continues to actively monitor this issue. The MMU considers this issue to
be resolved.
As of June 25, 2015 no solutions have been implemented to correct the other potential market
manipulation issues previously described. The RTO is currently in discussions with the MMU to
find the best measures for abating the risks associated with the local OOME events, resources
committed across the midnight hour, and the regulation deployment adjustment. The MMU
continues to actively monitor these issues pending the development of permanent rules to
directly address the concern.
7.4. Day-Ahead Must-Offer Requirement
The MMU recommended previously that SPP eliminate the limited day-ahead must-offer
provision and establish physical withholding rules to include a penalty for non-compliance.
These changes would ensure an efficient level of participation in the Day-Ahead Market and
enhance the protection against the potential exercise of market power abuse through physical
withholding. An incentive to withhold generation may exist if participation in the Day-Ahead
Market is voluntary. Thus, enhancing the physical withholding rules to include a penalty
provision will provide additional protection. The physical withholding rules are targeted to
identify withholding that directly impacts the competitive outcomes in the market. Assessing
penalties as a result of violating the physical withholding rules is a more efficient methodology
for ensuring efficient participation levels in the Day-Ahead Market.
In the event that the limited must-offer provision is continued, five weaknesses in the current
provisions should be addressed. See the 2014 report for details.
In 2015 Market Participants approved a proposal to eliminate the current limited Day-Ahead
Must-Offer provision of the SPP Tariff. In the meantime, the MMU submitted a proposal for
physical withholding penalties that included conduct thresholds and impact test requirements in
conjunction with establishing a formula-based penalty structure. The MMU engaged in
discussions with the Market Participants through May 2016, at which time the MMU withdrew
the proposal pending MMU’s development of impact simulations. The MMU plans to
reintroduce the proposal to Market Participants as early as appropriate studies are completed.
7. Recommendations
2015 State of the Market | 152
Meanwhile, the Day-Ahead Must-Offer elimination proposal was tabled by MOPC until July
2017 or the MMU’s resubmission of the physical withholding proposal. The five weaknesses in
the current day-ahead must-offer provision still remain valid.
7.5. TCR and ARR System Availability in Annual Process
The MMU, in concert with the SPP Congestion Hedging team, identified concerns regarding
over-collecting revenue in the ARR market while also under-collecting revenue in the TCR
market. Potential solutions included matching the ARR and TCR system availability in the
annual process to eliminate required limit expansion for infeasible ARRs, lowering the
transmission system capacity available for award in the annual ARR Allocation, and lowering
the transmission system capacity available for award in the monthly ARR allocations and TCR
auctions.
SPP filed and FERC approved a Tariff change that requires ARR system capacity to match the
TCR system capacity in the annual process. The MMU expects improvement in the number of
required limit expansions in many of the monthly TCR auctions with this change. SPP should
achieve further improvement in funding disparity by reducing full system availability in the
annual ARR allocation to match the system availability levels in the annual TCR auction.
The MMU will continue to monitor TCR market results in relation to day-ahead and ARR
settlements. The need for additional changes will depend on the effectiveness of the changes
already approved.
7.6. TCR and ARR System Availability in Monthly Process
The MMU continues to support SPP’s efforts to improve market efficiency and transparency in
the Monthly ARR/TCR Process. The MMU believes improved outage inclusion could help in
achieving this goal. Additionally, SPP could spread the reduced system capacity across
individual transmission elements and the system as a whole.
SPP submitted Revision Request (RR) 96 – Proposed Transmission Outage Scheduling to the
Operating Reliability Working Group (ORWG). This revision request included language that
7. Recommendations
2015 State of the Market | 153
would have extended the deadline for submitting planned outages from a seven-day lead time to
45 days prior to the first of the month in which the outage starts. This RR was modified and
approved by the ORWG to a 14-day lead time, which does nothing to address the MMU’s
concerns. The MMU maintains its recommendation to extend this deadline.
The MMU maintains its recommendation made in 2014 not to ignore outages based solely on
duration. Additionally, the MMU recommends that SPP give its operators the authority to
appropriately rate system elements and the system as a whole to prevent the overselling of TCRs.
Other changes worth considering include derating system components of the system as a whole if
overselling of ARRs/TCRs continues in the monthly ARR/TCR Process, and implementing a
different Self-Convert methodology than the “near-infinite price” method now used.
7.7. TCR Bidding at Electrically Equivalent Settlement Locations
In several forums the MMU recommended a system change to block all TCR bidding at
electrically equivalent settlement locations, thereby preventing ongoing tariff violations,
eliminating potential human errors, and improving operational efficiency. SPP’s MWG has
approved funding for development of a system change that will block these bids from being
submitted into the TCR Market User Interface. Detailed Tariff language and system
requirements are yet to be developed. This change fully addresses the MMU’s concerns. The
MMU will continue to monitor this issue until the system change is fully implemented and
tested.
7.8. Allocation of Over-Collected Losses
The use of Bilateral Settlement Schedule (BSS) transactions has been identified as a potential
way of distorting the distribution of over-collected losses. This market behavior issue would
adversely impact the equitable distribution of over-collected losses and potentially distort market
incentives.
There appears to be consensus in the stakeholder process that there is a flaw in the over-collected
losses distribution methodology, resulting in a gaming opportunity. SPP staff is in the process of
preparing a proposed solution that will remove the gaming opportunities of over-collected loss
7. Recommendations
2015 State of the Market | 154
payments to BSS transactions. The MMU’s initial assessment of the proposed changes indicates
the new measure will address this issue. The MMU will continue to monitor activities in this area
and assess the effectiveness of the final proposal as part of the stakeholder process. The MMU
will also monitor the efficiency of the actual implementation.
7.9. Market Power Mitigation Conduct Thresholds
The MMU previously recommended an increase in offer conduct thresholds for start-up offers,
regulation offers, and energy offers for Frequently Constrained Areas. The MMU is withdrawing
this recommendation. Having observed lower than expected mitigation levels during 2015, the
MMU decided to maintain a cautious approach to considering these items as potential issues.
7.10. NDVER Transition to DVER Status
The MMU has identified Non-Dispatchable Variable Energy Resources as a concern because of
their adverse impact on market price. When prices are depressed in high wind production regions
(LMP occurs below the short run marginal cost of wind resources), non-dispatchable resources
will have an adverse impact on prices in two ways. Some resources chase price, ignoring the
system pseudo dispatch (market system assumes the resources continue generating at the
previously known level), and self-dispatching to a lower level in an attempt to avoid the cost
associated with producing when prices are very low. This behavior at times causes unexpected
volatility on the system and distorts prices. The alternative behavior is for these units to continue
to produce as expected even when prices are below their true marginal cost. This uneconomic
level of production drives prices below what would be an appropriate market clearing price. Both
cases result in sub-optimal market results.
The MMU recommends SPP continue discussions to transition NDVER Resources to DVER
status and thereby lessen the negative impact of such resources on the market.
Appendix A. Common Acronyms
2015 State of the Market | 155
Appendix A. Common Acronyms
AEP American Electric Power
ARR Auction Revenue Rights
BSS Bilateral Settlement Schedules
BTU
CC
CDD
British Thermal Unit
Combined Cycle
Cooling Degree Days
CT
DA
DAMKT
DA RUC
DASMP
Combustion Turbine
Day-Ahead
Day-Ahead Market
Day-Ahead Reliability Unit Commitment
Day-Ahead System Marginal Price
DISIS Definitive Interconnection System Impact Study
EHV Extra High Voltage
EIA Energy Information Administration
EIS Energy Imbalance Service
ERCOT
FCA
Electric Reliability Council of Texas
Frequently Constrained Area
FERC
GI
Federal Energy Regulatory Commission
Generation Interconnection
GLDF Generator to Load Distribution Factor
GMOC Greater Missouri Operations Company
GW Gigawatt
GWh
HDD
Gigawatt Hour
Heating Degree Days
HHI
HVDC
Herfindahl-Hirschman Index
High-Voltage Direct Current
IA
ID RUC
IDC
Interconnection Agreement
Intra-Day Reliability Unit Commitment
Interchange Distribution Calculator
IS Integrated System
Appendix A. Common Acronyms
2015 State of the Market | 156
ISO
ITP
JOU
Independent System Operator
Integrated Transmission Plan
Jointly Owned Unit
KCPL Kansas City Power & Light
kV Kilovolt (1,000 volts)
LIP
LMP
Locational Imbalance Price
Locational Marginal Price
MISO Midcontinent Independent Transmission System Operator
MLC Marginal Loss Component
MM Million
MMBtu Million British Thermal Units (1,000,000 Btu)
MMU Market Monitoring Unit
MW Megawatt (1,000,000 watts)
MWh
MWP
NDVER
Megawatt Hour
Make-Whole Payment
Non-Dispatchable Variable Energy Resource
NERC
NOAA
North American Electric Reliability Corporation
National Oceanic and Atmospheric Administration
NPPD Nebraska Public Power District
O&M Operation and Maintenance
OGE Oklahoma Gas & Electric
OOME Out-of-Merit Energy
PJM
PEPL
Pennsylvania-New Jersey-Maryland Interconnection
Panhandle Eastern Pipe Line Company
PISIS Preliminary Interconnection System Impact Study
RNU
RT
RTBM
Revenue Neutrality Uplift
Real-Time
Real-Time Balancing Market
RTO
RTSMP
RUC
SC
Regional Transmission Organization
Real-Time System Marginal Price
Reliability Unit Commitment
Simple Cycle
Appendix A. Common Acronyms
2015 State of the Market | 157
SMP System Marginal Price
SPP Southwest Power Pool, Inc.
SPS Southwestern Public Service Company
SECI Sunflower Electric Power Corporation
TCR Transmission Congestion Right
WAPA Western Area Power Administration
WECC Western Electricity Coordinating Council
WR Westar Energy, Incorporated