Embed Size (px)
Citation preview
2015
RMIT Statisticsat a Glance
RMIT is a global university of technology, design and enterprise in which teaching, research and engagement are central to creating life-changing experiences for our students and achieving positive impact.
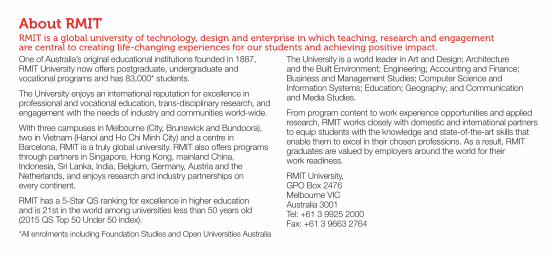
About RMIT
One of Australia’s original educational institutions founded in 1887, RMIT University now offers postgraduate, undergraduate and vocational programs and has 83,000* students.
The University enjoys an international reputation for excellence in professional and vocational education, trans-disciplinary research, and engagement with the needs of industry and communities world-wide.
With three campuses in Melbourne (City, Brunswick and Bundoora), two in Vietnam (Hanoi and Ho Chi Minh City) and a centre in Barcelona, RMIT is a truly global university. RMIT also offers programs through partners in Singapore, Hong Kong, mainland China, Indonesia, Sri Lanka, India, Belgium, Germany, Austria and the Netherlands, and enjoys research and industry partnerships on every continent.
RMIT has a 5-Star QS ranking for excellence in higher education and is 21st in the world among universities less than 50 years old (2015 QS Top 50 Under 50 index).
The University is a world leader in Art and Design; Architecture and the Built Environment; Engineering; Accounting and Finance; Business and Management Studies; Computer Science and Information Systems; Education; Geography; and Communication and Media Studies.
From program content to work experience opportunities and applied research, RMIT works closely with domestic and international partners to equip students with the knowledge and state-of-the-art skills that enable them to excel in their chosen professions. As a result, RMIT graduates are valued by employers around the world for their work readiness.
RMIT University, GPO Box 2476 Melbourne VIC Australia 3001 Tel: +61 3 9925 2000 Fax: +61 3 9663 2764
*All enrolments including Foundation Studies and Open Universities Australia

RMIT at a Glance
1. About RMIT > RMIT at a Glance
Student enrolments (headcount) 1 2014 2015
Higher Education (HE) 61 083 62 138 Vocational Education (VE) 14 324 15 179 Total 75 407 77 317 International Students
% International onshore students 15% 16%% International offshore students 23% 21%Student mobility
Undergraduate completions with mobility experience
18.9% 24.5%
Program Completions
Higher Education 16 846 16 432 Vocational Education 5 635 5 659 Total 22 481 22 091
1 Enrolments (headcount) represent full year data2 FTE = Full Time Equivalent 3 Refers to undergraduate applicants 1st to 3rd preferences (including
VTAC and direct applications) Places refers to the number of enrolments
Staff 2014 2015
Staff incl casual (Headcount) 11 148 10 754Student to Staff Ratio (Onshore) 21.3 19.7
Research
Research citations per academic FTE 2 16.2 N/A
Finance
Total Equity $1 882.2m $1 846.8mTotal Assets $2 683.2m $2 736.9mLibrary
Physical Visits 2 175 637 2,196 866Electronic Visits 1 961 144 1,979 179Loans 644 470 593 399Selectivity of Higher Education Students3
Undergraduate Applications per place 3.36 3.39

EnrolmentsBy Gender 2013 2014 2015
Female 36 082 35 593 36 081 Male 39 425 39 813 41 235 Unspecified 0 1 1
By Residence
Domestic 47 125 46 952 48 352 International Onshore 10 782 11 374 12 365 International Offshore 17 600 17 081 16 600
By Attendance Type/Mode
Full-time 51 488 53 553 54 742 Part-time 22 189 20 622 21 382 Distance/Fully Online 1 830 1 232 1 193
4 Undergraduate qualification with vocational outcomes5 Non-award programs / programs not elsewhere classified
By Award Level 2013 2014 2015
Higher EducationPostgraduate Research 1 886 1 944 2 115 Postgraduate Coursework 9 895 10 043 9 964 Undergraduate 44 661 45 922 46 650 Associate Degree 4 2 857 3 174 3 409
Vocational EducationDiploma and Advanced Diploma (AQF 5-6) 7 853 7 064 7 536 Certificates III and IV (AQF 3-4) 6 215 5 733 5 674 Certificates I and II (AQF 1-2) 912 314 320 VCE/VCAL 572 493 458 Other 5 656 720 1 191
Total 75 507 75 407 77 317
Enrolments
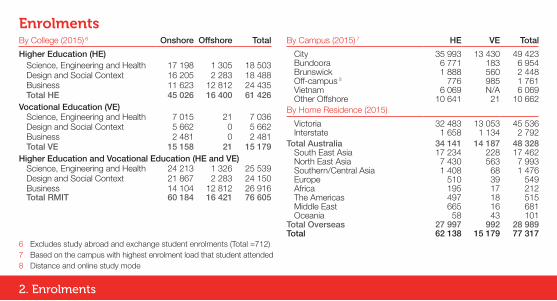
6 Excludes study abroad and exchange student enrolments (Total =712)7 Based on the campus with highest enrolment load that student attended8 Distance and online study mode
2. Enrolments
By College (2015) 6 Onshore Offshore Total
Higher Education (HE)Science, Engineering and Health 17 198 1 305 18 503Design and Social Context 16 205 2 283 18 488Business 11 623 12 812 24 435Total HE 45 026 16 400 61 426
Vocational Education (VE)Science, Engineering and Health 7 015 21 7 036Design and Social Context 5 662 0 5 662Business 2 481 0 2 481Total VE 15 158 21 15 179
Higher Education and Vocational Education (HE and VE)Science, Engineering and Health 24 213 1 326 25 539Design and Social Context 21 867 2 283 24 150Business 14 104 12 812 26 916Total RMIT 60 184 16 421 76 605
By Campus (2015) 7 HE VE Total
City 35 993 13 430 49 423 Bundoora 6 771 183 6 954 Brunswick 1 888 560 2 448 Off-campus 8 776 985 1 761 Vietnam 6 069 N/A 6 069 Other Offshore 10 641 21 10 662
By Home Residence (2015)
Victoria 32 483 13 053 45 536 Interstate 1 658 1 134 2 792
Total Australia 34 141 14 187 48 328 South East Asia 17 234 228 17 462 North East Asia 7 430 563 7 993 Southern/Central Asia 1 408 68 1 476 Europe 510 39 549 Africa 195 17 212 The Americas 497 18 515 Middle East 665 16 681 Oceania 58 43 101
Total Overseas 27 997 992 28 989 Total 62 138 15 179 77 317
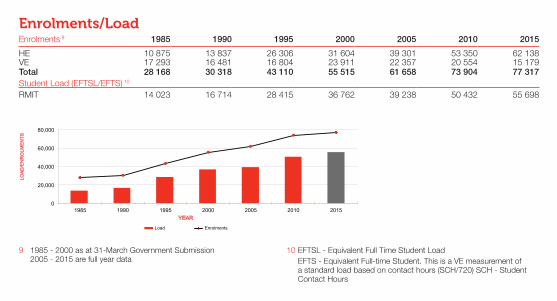
Enrolments/Load
9 1985 - 2000 as at 31-March Government Submission 2005 - 2015 are full year data
0
20,000
40,000
60,000
80,000
1985 1990 1995 2000 2005 2010 2015
LOA
D/E
NR
OLM
EN
TS
YEAR
Load Enrolments
10 EFTSL - Equivalent Full Time Student Load EFTS - Equivalent Full-time Student. This is a VE measurement of
a standard load based on contact hours (SCH/720) SCH - Student Contact Hours
Enrolments 9 1985 1990 1995 2000 2005 2010 2015
HE 10 875 13 837 26 306 31 604 39 301 53 350 62 138 VE 17 293 16 481 16 804 23 911 22 357 20 554 15 179 Total 28 168 30 318 43 110 55 515 61 658 73 904 77 317 Student Load (EFTSL/EFTS) 10
RMIT 14 023 16 714 28 415 36 762 39 238 50 432 55 698

Student Load
11 More than 50% delivered offshore (including Vietnam)12 VCE/VCAL students for VE13 VE measurement of a standard load based on contact hours
(SCH/720) SCH - Student Contact Hours
3. Enrolments/Load > Student Load
By Broad Field of Study (2015 Load in EFTSL/EFTS)
HE VE Total
Natural and Physical Sciences 2 413 111 2 524Information Technology 2 486 229 2 715Engineering and Related Technologies 6 671 2 129 8 800Architecture and Building 3 013 1 547 4 560Agriculture, Environmental and Related Studies
245 51 297
Health 2 644 858 3 502Education 1 259 76 1 335Management and Commerce 11 17 309 1 563 18 873Society and Culture 3 163 1 146 4 308Creative Arts 6 435 1 422 7 857Mixed Field Programs 12 368 559 927Total 46 007 9 691 55 698
Student Fee Type (2015 HE and VE Load in %)
HE VE Total
Government Supported 52% 75% 56%Australian Fee Paying 5% 17% 7%International 44% 8% 37%Other 0% 0% 0%
Student Load (2015)
Student Load (EFTSL) HE 46 007Student Contact Hours (EFTS) VE 13 9 691
Foundation Studies (2015)
Student Enrolments (headcount) 1 103Student Load (EFTSL) 1 233
Student Diversity
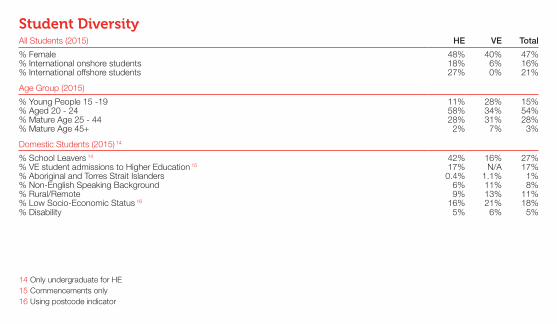
14 Only undergraduate for HE15 Commencements only16 Using postcode indicator
All Students (2015) HE VE Total
% Female 48% 40% 47%% International onshore students 18% 6% 16%% International offshore students 27% 0% 21%
Age Group (2015)
% Young People 15 -19 11% 28% 15%% Aged 20 - 24 58% 34% 54%% Mature Age 25 - 44 28% 31% 28%% Mature Age 45+ 2% 7% 3%
Domestic Students (2015) 14
% School Leavers 14 42% 16% 27%% VE student admissions to Higher Education 15 17% N/A 17%% Aboriginal and Torres Strait Islanders 0.4% 1.1% 1%% Non-English Speaking Background 6% 11% 8%% Rural/Remote 9% 13% 11%% Low Socio-Economic Status 16 16% 21% 18%% Disability 5% 6% 5%
Postgraduate Research
5 000
10 000
15 000
20 000
25 000
2013 2014 2015
CO
MP
LET
ION
S
YEAR
Postgraduate Coursework
Undergraduate
Associate Degree
Vocational Education
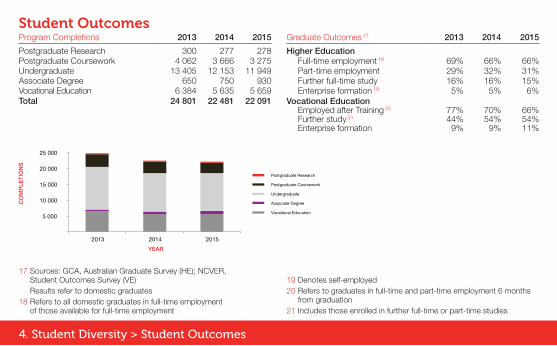
Program Completions 2013 2014 2015
Postgraduate Research 300 277 278 Postgraduate Coursework 4 062 3 666 3 275 Undergraduate 13 405 12 153 11 949 Associate Degree 650 750 930 Vocational Education 6 384 5 635 5 659 Total 24 801 22 481 22 091
Student Outcomes
17 Sources: GCA, Australian Graduate Survey (HE); NCVER, Student Outcomes Survey (VE)
Results refer to domestic graduates18 Refers to all domestic graduates in full-time employment
of those available for full-time employment
Graduate Outcomes 17 2013 2014 2015
Higher EducationFull-time employment 18 69% 66% 66%Part-time employment 29% 32% 31%Further full-time study 16% 16% 15%Enterprise formation 19 5% 5% 6%
Vocational EducationEmployed after Training 20 77% 70% 66%Further study 21 44% 54% 54%Enterprise formation 9% 9% 11%
19 Denotes self-employed20 Refers to graduates in full-time and part-time employment 6 months
from graduation21 Includes those enrolled in further full-time or part-time studies
4. Student Diversity > Student Outcomes
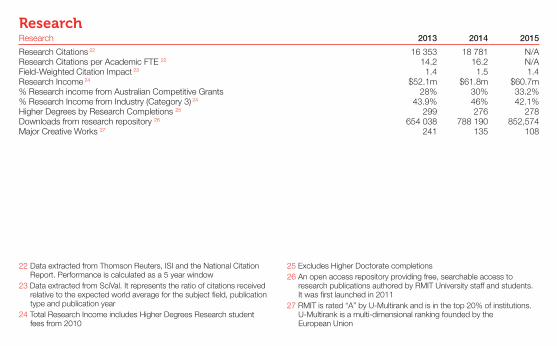
Research 2013 2014 2015
Research Citations 22 16 353 18 781 N/AResearch Citations per Academic FTE 22 14.2 16.2 N/AField-Weighted Citation Impact 23 1.4 1.5 1.4Research Income 24 $52.1m $61.8m $60.7m% Research income from Australian Competitive Grants 28% 30% 33.2%% Research Income from Industry (Category 3) 24 43.9% 46% 42.1%Higher Degrees by Research Completions 25 299 276 278Downloads from research repository 26 654 038 788 190 852,574Major Creative Works 27 241 135 108
Research
22 Data extracted from Thomson Reuters, ISI and the National Citation Report. Performance is calculated as a 5 year window
23 Data extracted from SciVal. It represents the ratio of citations received relative to the expected world average for the subject field, publication type and publication year
24 Total Research Income includes Higher Degrees Research student fees from 2010
25 Excludes Higher Doctorate completions26 An open access repository providing free, searchable access to
research publications authored by RMIT University staff and students. It was first launched in 2011
27 RMIT is rated “A” by U-Multirank and is in the top 20% of institutions. U-Multirank is a multi-dimensional ranking founded by the European Union
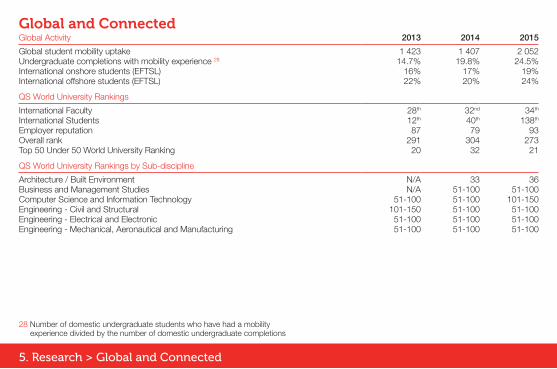
Global Activity 2013 2014 2015
Global student mobility uptake 1 423 1 407 2 052Undergraduate completions with mobility experience 28 14.7% 19.8% 24.5%International onshore students (EFTSL) 16% 17% 19%International offshore students (EFTSL) 22% 20% 24%
QS World University Rankings
International Faculty 28th 32nd 34th
International Students 12th 40th 138th
Employer reputation 87 79 93Overall rank 291 304 273Top 50 Under 50 World University Ranking 20 32 21
QS World University Rankings by Sub-discipline
Architecture / Built Environment N/A 33 36Business and Management Studies N/A 51-100 51-100Computer Science and Information Technology 51-100 51-100 101-150Engineering - Civil and Structural 101-150 51-100 51-100Engineering - Electrical and Electronic 51-100 51-100 51-100Engineering - Mechanical, Aeronautical and Manufacturing 51-100 51-100 51-100
28 Number of domestic undergraduate students who have had a mobility experience divided by the number of domestic undergraduate completions
Global and Connected
5. Research > Global and Connected

Staff FTE by Function (2015) 29 Female Male Total
AcademicTeaching & Research 404 621 1 025 Research only 76 178 254 Casual* 253 321 574 Total Academic 734 1 119 1 853
Vocational Education (VE)Teachers 190 239 429 Casual 123 106 229 Total VE 313 345 658
English Language Programs (ELP) (Vietnam)English Teaching 17 47 64 Total ELP 17 47 64
Professional, administrative and technical staffExecutive & College/School Support 522 277 798 Central Support 865 608 1474 Casual 135 121 256 English Support (Vietnam) 12 3 15 Total Professional, administrative and technical staff 1 534 1 009 2 543
Total 2 598 2 520 5 118
Staff
Academic staff born outside Australia 52% 53% 51%HE Academic Staff holding PhDs 30 79% 82% 86%
Staff
29 Staff FTE as at 30 September 2015 and casual as at 30 December 2015 Vietnam Staff FTE as at 31 December 2015 *Academic casual FTE using the revised 2013 working hours formula
30 Lecturer and above

Consumption and Emissions 2013 2014 2015
Energy intensity per floor area (GJ/GFA) 31 0.759 0.749 0.773Emissions intensity per floor area (t CO2-e/GFA ) 0.138 0.137 0.138Water consumption per student (kl/EFTSL) 32 5.1 5.8 5.2Greenhouse gas emissions (t CO2-e) 33 65 192 64 402 64 798
Change in consumption 34
Energy consumption per floor area (GJ/GFA) 31 -1% -2% 1%Emissions intensity per floor area (t CO2-e/GFA) -23% -23% -23%Water consumption per student (kl/EFTSL) 32 -10% +2% -13%Greenhouse gas emission (t CO2-e) 33 -18% -19% -18%
Sustainability
31 Energy conumption is measured in Gigajoules (GJ) and includes electricity and gas 32 Water consumption is measured in kilolitres (kl) 33 Greenhouse gas emissions are measured in tonnes of carbon dioxide equivalent (t CO2-e) 34 Change in consumption (%) based on 2007 baseline levels
6. Staff > Sustainability
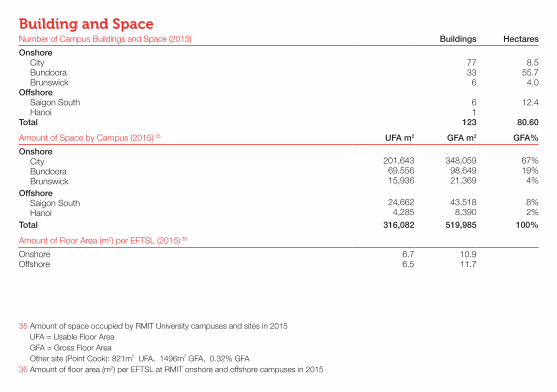
Number of Campus Buildings and Space (2015) Buildings Hectares
OnshoreCity 77 8.5Bundoora 33 55.7Brunswick 6 4.0
OffshoreSaigon South 6 12.4Hanoi 1
Total 123 80.60
Amount of Space by Campus (2015) 35 UFA m2 GFA m2 GFA%
OnshoreCity 201,643 348,059 67%Bundoora 69,556 98,649 19%Brunswick 15,936 21,369 4%
OffshoreSaigon South 24,662 43,518 8%Hanoi 4,285 8,390 2%
Total 316,082 519,985 100%
Amount of Floor Area (m2) per EFTSL (2015) 36
Onshore 6.7 10.9 Offshore 6.5 11.7
Building and Space
35 Amount of space occupied by RMIT University campuses and sites in 2015 UFA = Usable Floor Area GFA = Gross Floor Area Other site (Point Cook): 821m2 UFA, 1496m2 GFA, 0.32% GFA 36 Amount of floor area (m2) per EFTSL at RMIT onshore and offshore campuses in 2015
7. Building and Space > Ready for Life & Work
November 2015
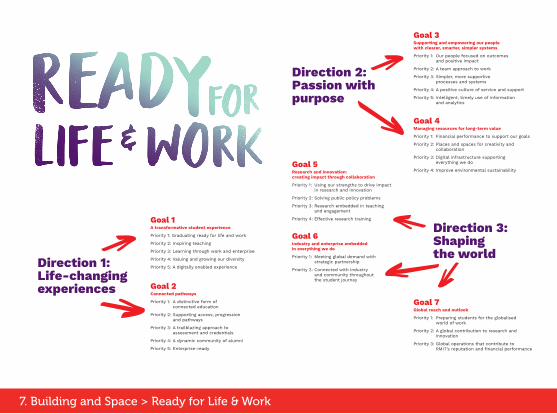
Direction 1: Life-changing experiences
Direction 3: Shaping the world
Goal 1A transformative student experience
Priority 1: Graduating ready for life and work
Priority 2: Inspiring teaching
Priority 3: Learning through work and enterprise
Priority 4: Valuing and growing our diversity
Priority 5: A digitally enabled experience
Goal 3Supporting and empowering our people with clearer, smarter, simpler systems
Priority 1: Our people focused on outcomes and positive impact
Priority 2: A team approach to work
Priority 3: Simpler, more supportive processes and systems
Priority 4: A positive culture of service and support
Priority 5: Intelligent, timely use of information and analytics
Goal 2Connected pathways
Priority 1: A distinctive form of connected education
Priority 2: Supporting access, progression and pathways
Priority 3: A trailblazing approach to assessment and credentials
Priority 4: A dynamic community of alumni
Priority 5: Enterprise-ready
Goal 4Managing resources for long-term value
Priority 1: Financial performance to support our goals
Priority 2: Places and spaces for creativity and collaboration
Priority 3: Digital infrastructure supporting everything we do
Priority 4: Improve environmental sustainability
Goal 6Industry and enterprise embedded in everything we do
Priority 1: Meeting global demand with strategic partnership
Priority 2: Connected with industry and community throughout the student journey
Goal 7Global reach and outlook
Priority 1: Preparing students for the globalised world of work
Priority 2: A global contribution to research and innovation
Priority 3: Global operations that contribute to RMIT’s reputation and financial performance
Direction 2: Passion with purpose
Goal 5Research and innovation: creating impact through collaboration
Priority 1: Using our strengths to drive impact in research and innovation
Priority 2: Solving public policy problems
Priority 3: Research embedded in teaching and engagement
Priority 4: Effective research training
November 2015
Direction 1: Life-changing experiences
Direction 3: Shaping the world
Goal 1A transformative student experience
Priority 1: Graduating ready for life and work
Priority 2: Inspiring teaching
Priority 3: Learning through work and enterprise
Priority 4: Valuing and growing our diversity
Priority 5: A digitally enabled experience
Goal 3Supporting and empowering our people with clearer, smarter, simpler systems
Priority 1: Our people focused on outcomes and positive impact
Priority 2: A team approach to work
Priority 3: Simpler, more supportive processes and systems
Priority 4: A positive culture of service and support
Priority 5: Intelligent, timely use of information and analytics
Goal 2Connected pathways
Priority 1: A distinctive form of connected education
Priority 2: Supporting access, progression and pathways
Priority 3: A trailblazing approach to assessment and credentials
Priority 4: A dynamic community of alumni
Priority 5: Enterprise-ready
Goal 4Managing resources for long-term value
Priority 1: Financial performance to support our goals
Priority 2: Places and spaces for creativity and collaboration
Priority 3: Digital infrastructure supporting everything we do
Priority 4: Improve environmental sustainability
Goal 6Industry and enterprise embedded in everything we do
Priority 1: Meeting global demand with strategic partnership
Priority 2: Connected with industry and community throughout the student journey
Goal 7Global reach and outlook
Priority 1: Preparing students for the globalised world of work
Priority 2: A global contribution to research and innovation
Priority 3: Global operations that contribute to RMIT’s reputation and financial performance
Direction 2: Passion with purpose
Goal 5Research and innovation: creating impact through collaboration
Priority 1: Using our strengths to drive impact in research and innovation
Priority 2: Solving public policy problems
Priority 3: Research embedded in teaching and engagement
Priority 4: Effective research training