Embed Size (px)
Citation preview
fi.IEGHALAYA AT A GLANCE 1989
MEGHALAYA AT A GLANCE 1989
2
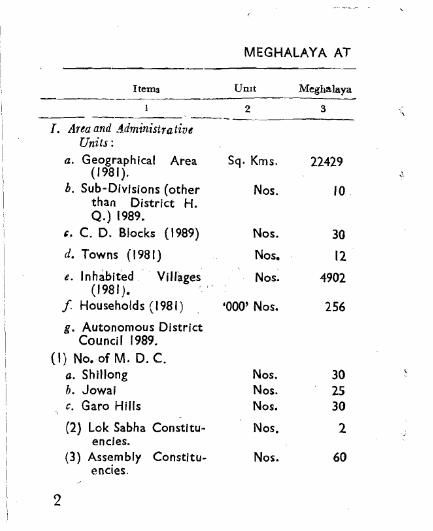
MEGHALAYA AT
Items Umt
2'--
l. Area and A.dministrative Units:
a. Geographical Area Sq. Kms. (1981).
b. Sub-Divisions (other Nos. than District H. Q.) 1989.
t. C. D. Blocks ( 1989) Nos.
d. Towns (1981) Nos.
e. Inhabited Villages Nos. (1981).
f Households (1981) '000' Nos.
g. Autonomous District Council 1989.
(I) No. of M. D. C. a. Shillong Nos. b. Jowai Nos. c. Garo Hills Nos.
(2) Lok Sabha Constitu- Nos. encies.
(3) Assembly Constitu- Nos. encies.
Meghalaya
3
22429 ..\
10
30
12
4902
256
30 25 30
2
60
.~
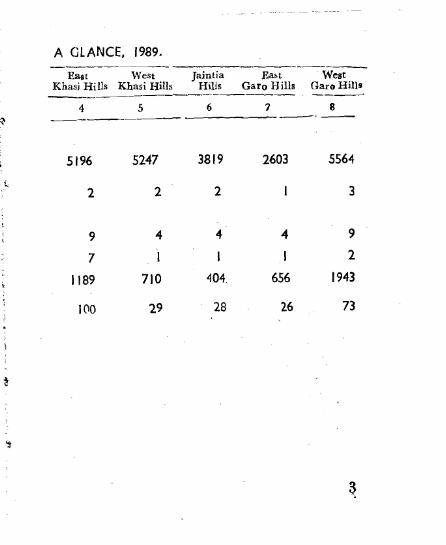
A GLANCE, 1989. ----_.
East West Khasi Hills Khasi Hills
4 5
Jaintia Hills
6
Ea~t West Garo Bills Garo Hills --
7 8-'-
5196 5247 3819 2603 5564
t2 2 2 3
9
7
1189
4
I
710
4
I
404
4
I
656
9
2
1943
100 29 28 26 73
4
1 2 3
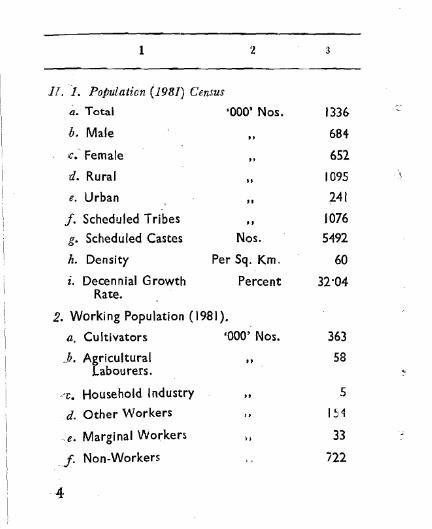
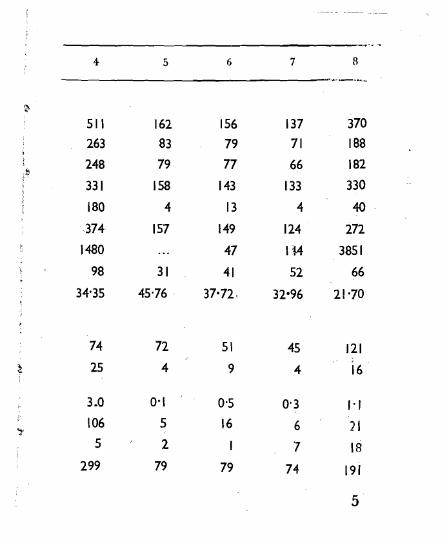
Jr. 1. Population (1981) Census _. ,a. Total '000' Nos. 1336
b. Male 684"
1(;. Female 652
d. Rural 1095.. e. Urban 241
" f. Scheduled Tribes .. 1076
g. Scheduled Castes Nos. 5492
h. Density Per Sq. Km. 60
i. Decennial Growth Percent 32·04 Rate.
2. Working Population (1981).
a. Cultivators '000' Nos. 363
.b. Agricultural .. 58 Labourers.
-T. Household Industry 5
d. Other Workers 154
.e. Marginal Workers 33" Non-Workers 722f
4 5 6 7 8
-"'... ,.-._,
~
511 263
248
331
180
374
1480
98
34-35
162 83
79
158
4
157
31
45'76
156 79
77
143
13
149
47
41
37'72 '
137 71
66
133
4
124
1M
52
32'96
370 188
182
330
40
272
3851
66
21-70
.
~
74
25
72
4
5\
9
45
4
121
16
",.
3.0
106
5
299
0-1
5
2
79
0'5
16
I
79
0'3
6 '7
74
,., 21
18
191
5
2 3
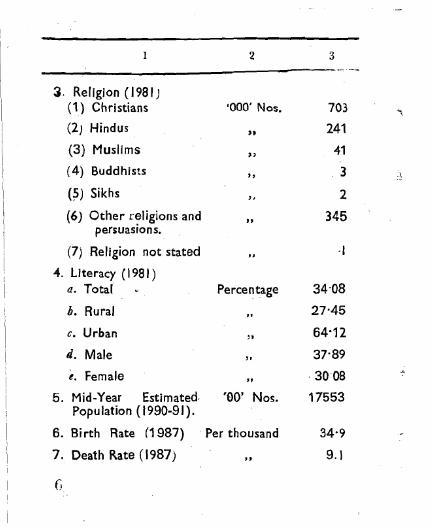
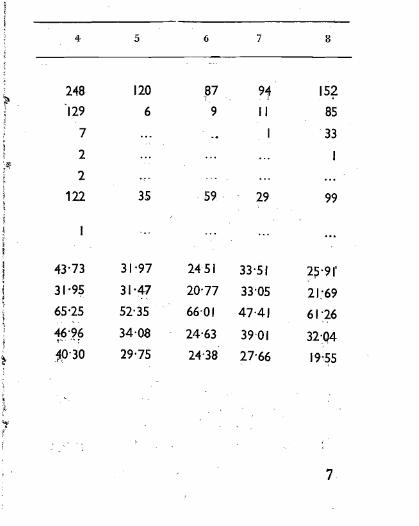
3. Religion (1981) (1) Christians '000' Nos. 703 ."
(2) Hindus ,. 241
(3) Muslims "
41
(4) Buddhists II . 3 .\
(?) Sikhs ,, 2
(6) Other religions and II 345 persuasions.
(7) Religion not stated -I
4_ Literacy (1981) a. Total Percentage 34-08
h. Rural 27'45
c. Urban "
64'12
4. Male ,, 37'89
e. Female " ·3008
5. Mid-Year Estimated. 'GO' Nos. 17553 Popu lation (1990-91).
6. Birth Rate (1987) Per thousand 34'9
7. Death Rate (1987) .. 9.1
()
8 4 5 6 7
248 ~
129
7
2 ~~ t: 2
122
43'73
31'95
65'25
46'96 T" "'-;'
} .1P'30
120
6
35
31'97
31'47 ..
52'35
34'08
29'75
~7
9
59 .
2451
20'77
66'01
24'63
24'38
91
II
I
157 85
33
I
29 99
33'51
33'05
47·41
39'01
27'66
2~'9r
21:69
61'26
32~Q4
19'55
7
2 3
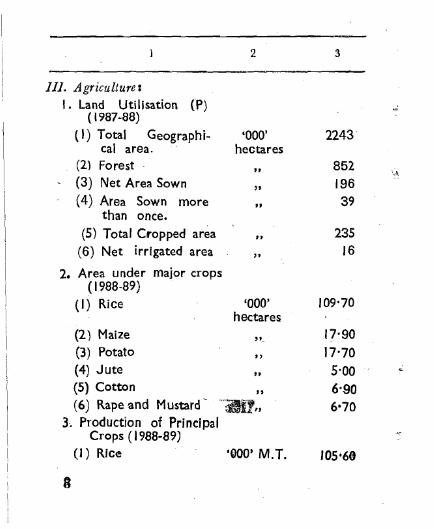
Ill. Agriculture: I, Land Utilisation (P)
( 1987-88) ~
(I) Total Geographi- '000' 2243 cal area. hectares
(2) Forest 852" ',,\
- (3) Net Area Sown 196" (4) Area Sown more 39" than once.
(5) Total Cropped area 235"
16(6) Net irrigated area "
2. Area under major crops ( 1988-89)
(I) Rice '000' 109'70 hectares
(2) Maize 17'90"'-(3) Potato 17'70" (4) Jute 5'00" (5) Cotton 6'90" (6) Rape and Mustard- 6-70-'iJU"
J. Production of Principal Crops (1988-89)
(I) Rice '000' M.T. 105'60
8
2 3
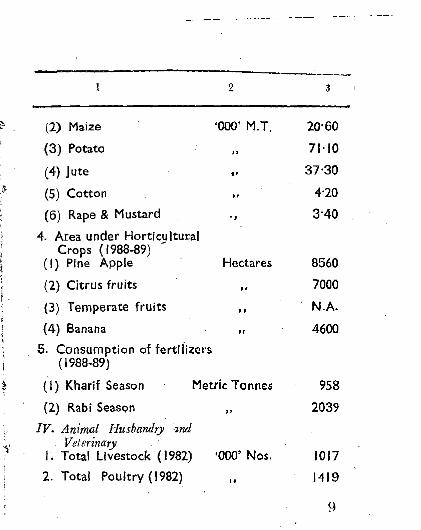
~ (1) Maize '000' M.T. 20'60
(3) Potato 71'10
(4) Jute .. 37'30 ,~ (5) Cotton .. 4'20
(6) Rape & Mustard ., 3'40
4. Area under Hortic9ltural Crops (1988-89)
( I) Pine Apple Hectares 8560
(2) Citrus fruits 7000
(3) Temperate fruits .. N.A.
(4) Banana 4600" . 5. Consumption of fertilizers
( 1988-89)
~ (I) Kharif Season Metric Tonnes 958
(2) Rabi Season 2039" IV. Animal Husbandry md
Veterinaryl' I. Total Livestock' ( 1982) '000' Nos. 1017
2. Total Poultry (1982) 1419 "
9
2 .
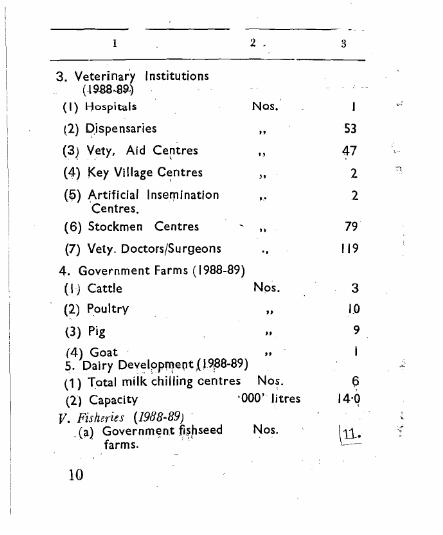
3. Veterinar'y Institutions p9.8S,S9.)
( I) I-Jospitals Nos.
t2) D.ispensaries " (3~ Vety, Aid Ceptres " (4) Key Village C~ntres
" (~) Artificial Inser:nination
Centres.
(6) Stockmen Centres " (7) Vety. Doctors/Surgeons
4. Government Farms (1988-89)
(I) Cattle Nps.
(2) Poultry " (3) Pig " (4) Goat ' " 5. Dairy DevelpPwetlt09~8-89)
(1) Total milk chilling centres Nos.
(2) Capacity -000' litres
V. Fisheries (1988-89) . .,(a) Governml;!nt fi.s,hseed Nos.
farms. . . "
10
3
,..,
S3
47
2 '.'1
2
79
119
3
LO
9
~:~
(3
14'q
.; ~. -
2 3
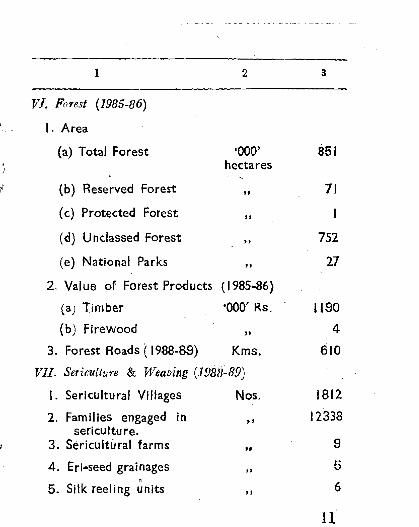
VI. FOf'est (1985-86)
'to, I. Area
(a) Total Forest '000' 851 hectares
(b) Reserved Forest 71" (c) Protected Forest
" (d) Uncfassed Forest 752" (e) National Parks 27
2. Value of Forest Products (/985-86)
Ca) Timber '000' Rs. 1190
(b) Firewood 4"
3. Forest Roads (1988-89) Kms. 610
VII. Sericulture & Weaving (19fJ8~89) ,~ '>-
/. Sericultura/ Villages Nos. 1812
2. Families engaged in 12338 sericu Itu reo "
3. Sericultural farms 9i' .. 4. Eri-seed grainages 5
5. Silk reeling units 6"
11
.12
2 3
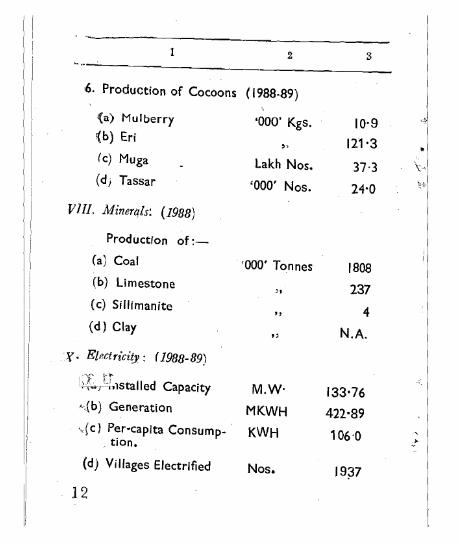
6. Production of Cocoons (1988-89)
{a) Mulberry
(b) Eri
(c) Muga
(dj Tassar
VllI, Minerals: (1988)
Production of:
(a) Coal
(b) Limestone
(c) Sillimanite
(d) Clay
.:y. Electricity: (1988-89)
,"\[' ~"'r
'<"~r'=i.lstalled Capacity
f·,(b) Generation
-"I c) Per-capita Consumption.
(d) Villages Electrified
'000' Kgs.
,. Lakh Nos.
'000' Nos.
'000' Tonnes
" t,
"
M.W·
MKWH
KWH
Nos.
10·9
121'3
37·3
24'0
1808
237
4
N.A.
133'76
422'89
106'0
19;37
2
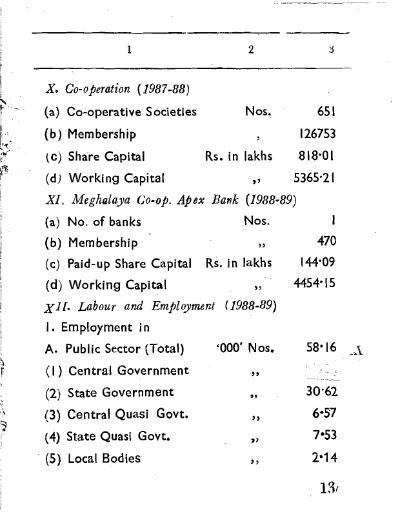
X. Co-operation (1987-88)
(a) Co-operative Societies Nos. 651
(b) Membership 126753
tc) Share Capital Rs. in lakhs 818'01
(d) Working Capital " 5365'21
XI. Meghalaya Co-op. Apex Bank (1988-89)
(a) No. of banks Nos. I
(b) Membership " 470
(c) Paid-Up Share Capital Rs. in lakhs 144'09
(d) Working Capital " 4454'15
XJ[. Labour and Employment (J988-89)
I. Employment in
A. Public Sector (Total) '000' Nos. 58'16 .•\
(I) Central Government ." (2) State Government 30'62
" (3) Central Quasi Govt. 6-57
" (4) State Quasi Govt. 7"53
" . (5) Local Bodies ,, 2-14
1231
14
2 3
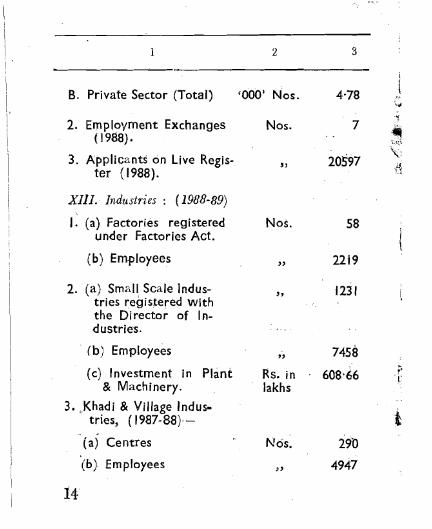
B. Private Sector (Total) '000' Nos. 4'78 r,' ~~
2. Employment Exchanges Nos. 7 ..(1988). 'U~" '\:
3. ApplicantS on live Regis- 20597 ter (1988). " '11
XIlI. Industries : (1988-89) ,
/. (a) Factories registered Nos. 58 under Factories Act.
(b) Employees 2219" 2. (a) SmalI Scale Indus- ,,
tries registered With the Director of Industries.
(b) Employees 7458"
(c) Investment in Plant Rs. in 608'66 T;.
& Machinery. lakhs
3. ,Khadi & ViI/age Industries, (1987-88)-- t
(a) Centres Nos. 290 (b) Employees 4947"
2 3
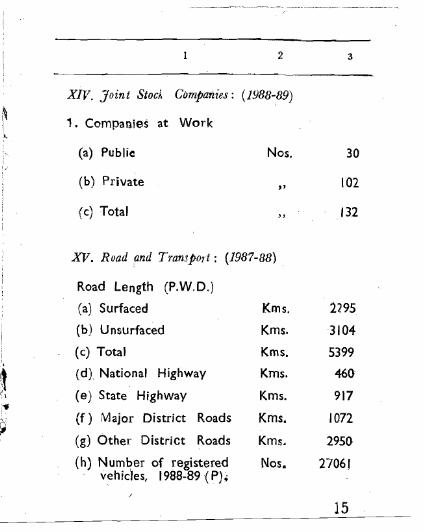
XlV. Joint Stod Companies: (1988-89)
1. Companies at Work
(a) Public Nos.
(b) Private ,J
(c) Total "
XV. Road and Transport: (1987-88)
~ i
,11
.~ :1
(f) Major District Roads
(g) Other District Roads
(h) Number of registered vehicles, 1988-89 (P);
Road Length (P.W.D.)
(a) Surfaced
(b) Unsurfaced
(c) Total
(d) National Highway
(e) State Highway
Kms.
Kms.
Kms.
Kms.
Kms.
Kms.
Kms.
Nos.
30
102
132
2295
3104
5399
460
917
1072
2950
27061
15
2 3
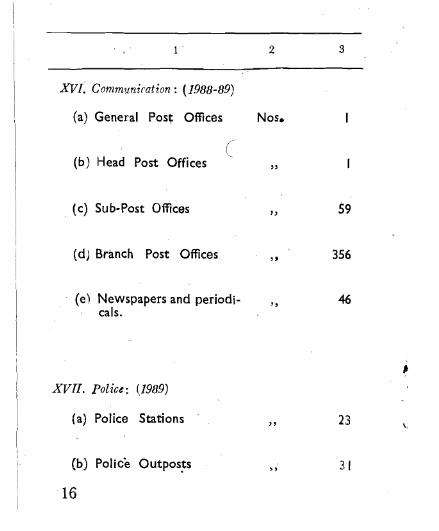
xvt Communiration: (1988-89)
(a) General Pos~ Offices
( (b) Head Post Offices
'
Nos.
"
(c) Sub·Post Offices " 59
(d) Branch Post Offices "
356
(e) Newspapers and periodicals.
,, 46
XVII.
(a)
Police:
Police
(1989)
Stations " 23
• \,
(b)
16
Police Outpos~s " 31
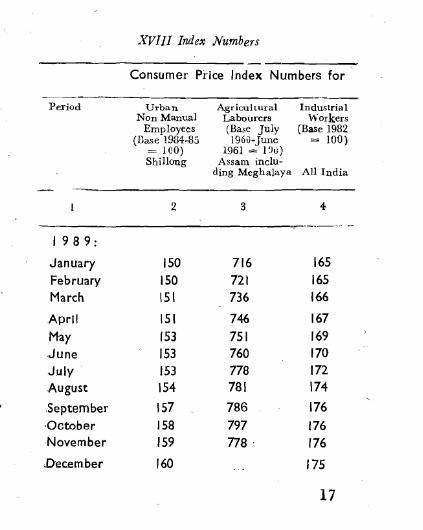
XVIII Index Numbers
Consumer Price Index Numbers for
Period Urban Non Manual
Employees (Base 1984-85
= 100) Shillong
Agricultural Labourers (Base July 1960-June
1961 = 19u) Assam inclu
ding Megha1aya
Industrial Workers
(Base 1982 = 100)
All India
2 3 4
._--~., -I 989:
January February March
150 150 151
716 721 736
165 165 166
~ ,.
April
May .June July .August
151 153 153 153 154
746 751 760 778 781
167 169 170 172 174
-, -September ,October November
157 158 159
786 797 n8
176 176 /76
December 160 175
17
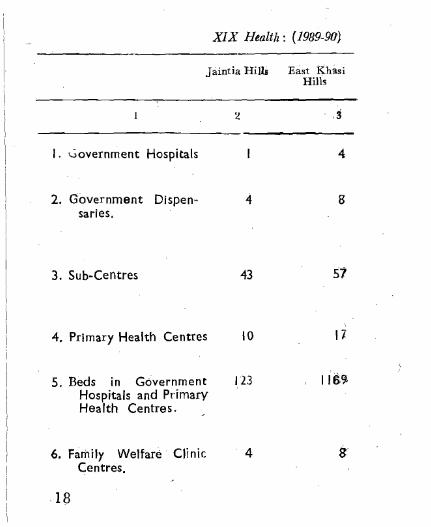
XIX Health: (1989-90)
Jaintia Hilis East Kh!lsi Hills
:! ,3
I. Government Hospitals 4:
2. Government saries.
Dispen 4 8
3. Sub-Centres 43 51
4. Primary Health Centres 10 I]
5. Beds in Government Hospitals and Primary Health Centres.
123
6. Family Welfare Centres.
18
Clinic 4
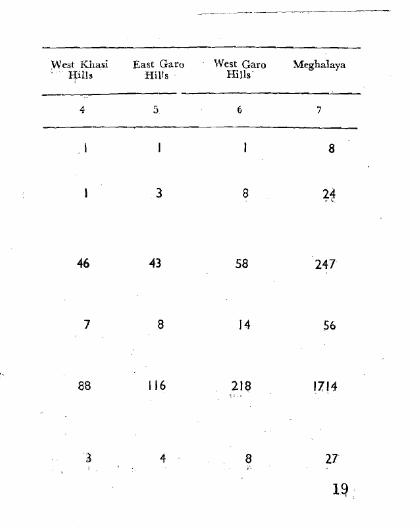
West Khasi East Garo West Garo Meghalaya Hills Hills . Hilk
4 5 6 7
I 8
3 8 ~1
46 43 58 247
7 8 14 56
88 116 218 17,14
4 8 27
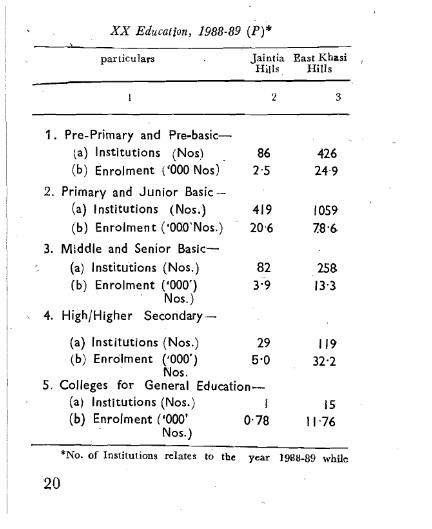
XX Education, 1988-89 (P)*
par tieu lars Jaintia East Khasi Hills Hills
:1 3
1. Pre-Primary and Pre-basic
(a) Institutions (Nos) 86 426
(b) Enrolment ('000 Nos) 1'5 24'9
2. Primary and Junior Basic
(a) Institutions (Nos.) 419 1059'
(b) Enrolment (·OaO'Nos.) 20'6 78'6
3. Middle and Senior Basic
(al Institutions (Nos.) 82 258
(b) Enrolment ('000') 3'9 13-:~
Nos.) , 4. High/Higher Secondary
(a) Institutions (Nos.) 29 1/9 (b) Enrolment
. ('000')Nos.
5'0 32'2
5. Colleges for General Education(a) Institutions (Nos.) / 15
(b) Enrolment ('000' 0·78 11'76 Nos.)
*No. of Institutions relates to tbe year 19811-89 while
20
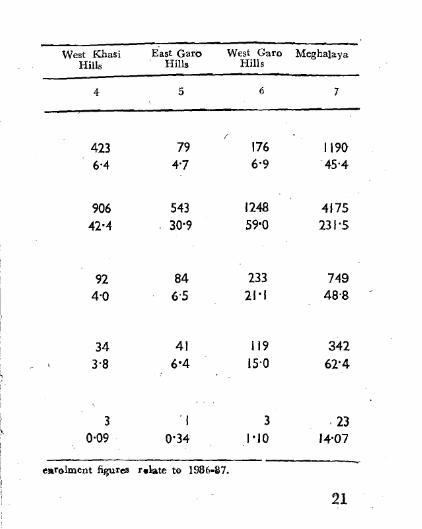
West Gara MeghalayaWest Khasi HillsHills
4 5 6 7
423 6'4
906 42'4
92 4'0
34 3'8
3 0'09
543 30'9
84 6'5
, I
0'34
176 6'9
1248
59'0
233
21'1
119
15'0
3
1'10
1190 45'4
4175 23/'5
749 48'8
342
62'4
,23
14'07
eRfolment fi~res r.late to 1986-27.
21
289
22
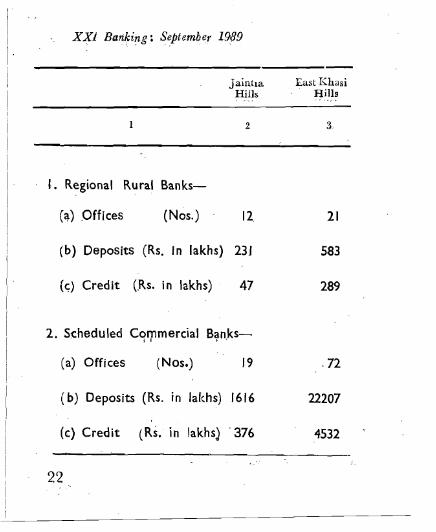
XXi Banking: September 1989
Jaintla East Khasi Hills Hills
2
I. Regional Rural Banks
(~) Offices (Nos.) Il 21
(b) Deposits (Rs. in lakhs) 231 583
(<:) Credit (Rs. in lakhs) 47
2. S~heduled C'?'Tlmercial B?n<ks
(a) Offices (Nos.) /9 .72
(b) Deposits (Rs. in lakhs) 1616 22207
(c) Credit (Rs. in lakhs) . 376 4532
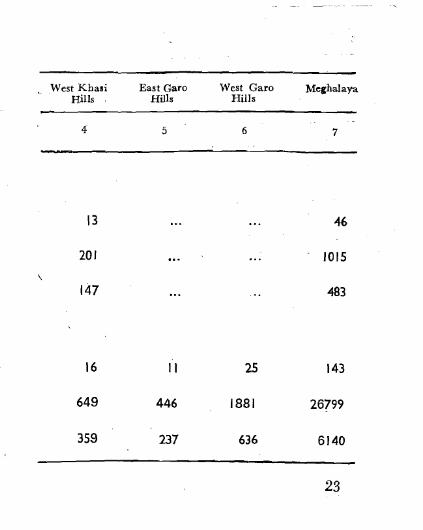
West Khasi East Garo West Garo Mechalaya Hills Hills Hills
5 6 7
13
201 \
147
16
649
359
46
1015
483
II 25 143
446 1881 26799
237 636 6140
23
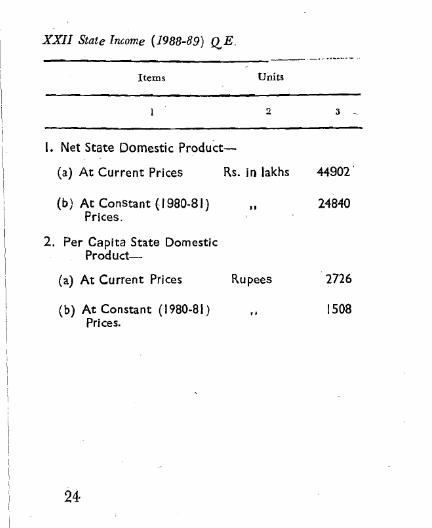
XXII State Income (1988-89) QE
Items Units
2 3
I. Net State Domestic Product
(a) At Current Prices Rs. iI} lakhs 44902'
(h) At ConStant (/980-81) Prices.
II 24840
2. Per Capita State Domestic Product
(a) At Current Prices Rupees 2726
(b) At Constant (1980-81) Prices. "
1508
24
---- -------
••
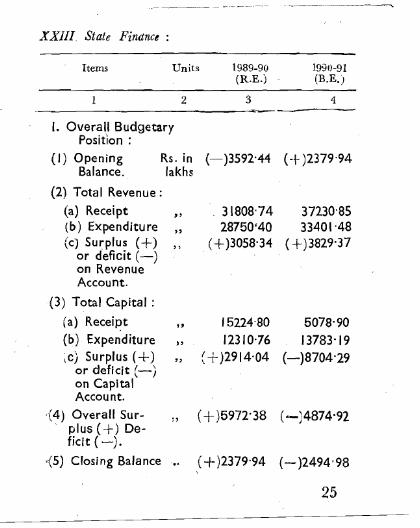
XXIII State Finance :
Items Units 1989-90 1990-91 (R.E.) (B.E.)
2 3 4
I. Overall Budgetary Position:
(I) Opening Rs. in Balance. lakhs
(2) Total Revenue:
(a) Receipt (b) Expenditure " (c) Surplus (+) "
or deficit (-) on Revenue Account.
(3) Total Capital:
(a) ReceiJ:>t " (b) Expenditure " ~c) Surplus (+) " or deficit (-)
on Capital Account.
,(4) Overall Sur. plus ( +) De "
ficit(-).
«5) Closing Balance
(-)3592'44
31808'74 28750'40
(+)3058'34
'5224-80 12310-76
(+ )2914'04
(+ )5972'38
(+ )2379'94
(+)2379'94
37230'85 33401'48
(+)3829'37
5078'90 13783'19
(-)8704'29
(·-)4874'92
(-)2494'98
25
i Items Units
\ I I 2
\
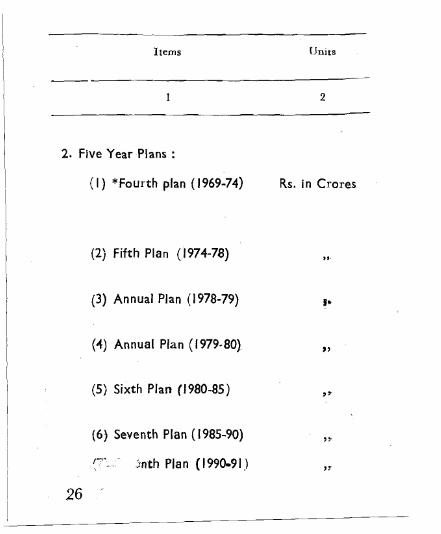
I 2. Five Year Plans :
I (I) *Fourth plan (1969-74) Rs. in Crores
I I I
I (2) Fifth Plan (1974-78) >I.
I i
I (3) Annual Plan (1978-79) f·i
I I (4) Annual Plan (1979-80)
" i
(5) Sixth Plan (1980-85) "
I I
(6) Seventh Plan (1985-90) I "
rrI Jnth Pia n (199Q.91.l I " I I 26 I
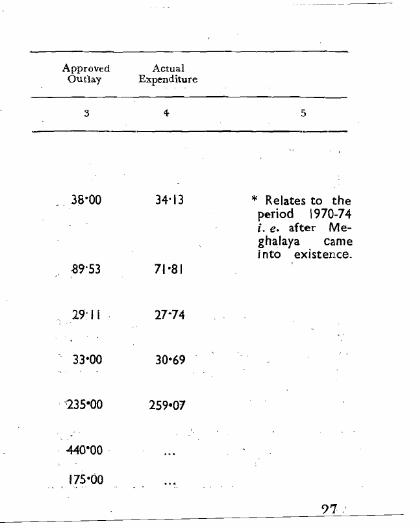
Approved Actual Outlay Expenditure
3 5
Items Units
2 3
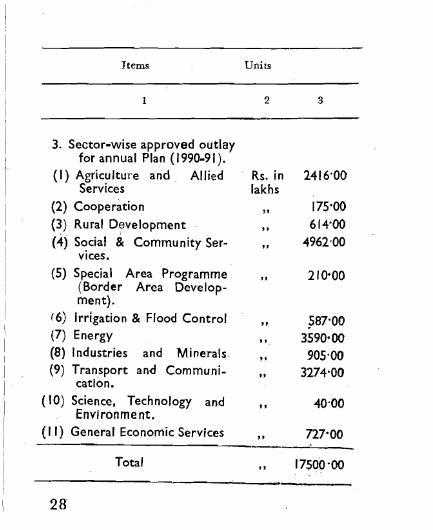
3. Sector-wise approved outlay for annual Plan (1990-91).
(I) Agriculture and Allied Services
(2) Cooperation
(3) Rural Development
(4) Social Be Community Services.
(5) Special Area Programme (Border Area Development).
(6) Irrigation & Flood Control (7) Energy
(8) Industries and Minerals,
(9) Transport and Communication.
(IO) Science, Technology and Environment.
(II) General Economic Services
Rs. in lakhs
.. "
.. " .. .. "
..
2416'00
175'00
614'00
4962'00
2/0'00
?87'OO 3590'00
905'00 3274'00
40'00
Total .. 17500'00
28
...-.--,----2 3
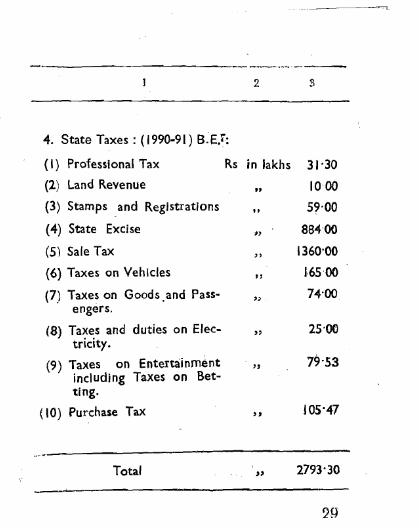
4, State Taxes: (1990-91) B.E.r:
(I) Professional Tax Rs in lakhs 31'30
(2) Land Revenue .. 1000
(3) Stamps and Registrations 59'00" (4) State Excise ., 88400
(5) Sale Tax 1360'00"
(6) Taxes on Vehicles 1·6500" (7) Taxes on Goods ,and Pass- 74'00
" engers.
(8) Ta~~s and duties on Elec- 25'00" trlClty.
(9) Taxes on Entertainment 79-53" including Taxes on Bet
ting.
( 10) Purchase Tax 105'47"
Total 2793'30
2 3
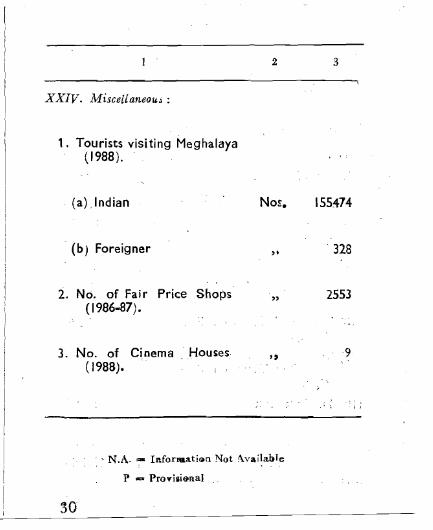
XXIV. Miscellaneou.i :
1. Tourists visiting Meghalaya ( 1988).
(a) Indian No~. 155474
(b) Foreigner ,. 328
2. No. of Fair Price Shops ( 1986-87). "
2553
3. No. of Cinema (1988)•
Houses "
9
. , N.A. ~ Il\forl'lu.ti~n Not !\vailab1e
P ... Pro"ilii&na!
30