Embed Size (px)
Citation preview
i
Report Prepared By :
Henri Sitorus, PhD., Circle Indonesia
June 2015
CROSS SECTORAL STRATEGIES FOR
CLIMATE CHANGE AND DISASTER RISK REDUCTION (CADRE) IN
INDONESIA
FINAL EVALUATION REPORT

i
Acknowledgement Circle Indonesia would like to thank all of the contributors to this evaluation. In particular, special thanks go to the informants, respondents and project beneficiaries who participated in the interviews and focus group discussions and provided input into the questionnaires during the field data collection process in three districts in Bengkulu Province: Bengkulu City; Bengkulu Utara and Kaur. This includes leaders of Disaster Risk Reduction and Climate Changes Adaptation Committees who enthusiastically provided rich information and data during the evaluation process. The consultant wishes to thank PCI and the CADRE Team (and KabaHill) for inviting Circle Indonesia to contribute to this project. Special thanks also go to enumerators who supported data collection during the evaluation. The consultant is equally grateful for the support and arrangements provided by staff of PCI/CADRE during the field study. Without such good facilitation, the fieldwork for data gathering would not have been as effective.
Finally, the evaluation team would like to acknowledge Dr. Jonathan Lassa, of Circle Indonesia, for his contributions to the final evaluation report.
June 2015
Henri Sitorus, PhD.
With Assistance of Sugi Astuti

ii
Abbreviations
APBD Anggaran Pengeluaran dan Belanja Daerah, District/Province Budget BAKORNAS PB Badan Koordinasi Penanggulanan Bencana, Coordinating body for
disaster response (Prior to BNPB) BAPPEDA Planning and Development Board BPBD Badan Penanggulangan Bencana Daerah/ Regional Disaster Management
Agency BKP Badan Ketahanan Pangan/Food Security Body BNPB Badan National PenanggulanganBencana / National Disaster Management
Agency BPS Biro Pusat Statistik/Centre Bureau of Statistics CADRE Climate Change Adaptation and Disaster Resilience CA Cooperative Agreement CCA Climate Change Adaptation CBDRM Community Based Disaster Risk Management DAC Development Assistance Committee of the OECD DNPI Dewan Nasional Perubahan Iklim/National Council for Climate Changes DRR Disaster Risk Reduction DRV Disaster Resilient Village CDRRC Community Disaster Risk Reduction Committee FFS Field Farmers School GOI the Government of Indonesia Ha Hectare HH Household HVCA Hazard, Vulnerability and Capacity Assessment KabaHill Local NGO partner Km Kilometer LG Local Government LGU Local Government Unit Mw Unit of earthquake measure known as Moment Magnitude (Symbolized as
Mw). The moment magnitude scale is the one used by seismologists to measure large earthquakes.
Musrenbangdes Musyawarah Rencana Pembangunan Desa, Village Development Planning
NGO Non-Governmental Organization IPTT Indicator Performance Tracking Table PCI Project Concern International Perda Peraturan Daerah/Local Government Regulation PNPM Program Nasional Pemberdayaan Masyarakat/ National Program for
Community Empowerment TOT Training of trainers
iii
Table of Contents
A. EXECUTIVE SUMMARY................................................................................................................... 1
B. EVALUATION OBJECTIVE AND METHODOLOGY ..................................................................... 2
C. PROGRAM OVERVIEW..................................................................................................................... 4
D. EVALUATION RESULTS: PROGRAM DESIGN ............................................................................. 7
E. EVALUATION RESULTS: PROGRAM RESULTS .......................................................................... 8
F. LESSONS LEARNED AND RECOMMENDATIONS FOR FUTURE PROGRAMMING ............ 19
List of Annexes
Annex 1: Indicator Performance Tracking Table ......................................................................... 23
Annex 2: Case Studies on Adaptive Livelihoods ......................................................................... 31
Annex 3: Scope of Work of the Evaluation .................................................................................. 32
Annex 4: Final Evaluation Schedule............................................................................................. 38
Annex 5: Map of Drought Risk in Bengkulu ................................................................................ 39
Annex 6: Village Committee on DRR .......................................................................................... 40
Annex 7: FGD Participants List .................................................................................................... 41
Annex 8: Endline Questionnaire ................................................................................................... 44
Annex 9: FGD and Interview Guide ............................................................................................. 60
iv
List of Tables
Table 1: Evaluation Specific Objectives ......................................................................................... 2
Table 2: FGD List ........................................................................................................................... 3
Table 3: Distribution of Respondents ............................................................................................. 4
Table 4: Project Results Framewor ................................................................................................. 5
Table 5: Activities implemented for IR 1 ....................................................................................... 5
Table 6: Activities implemented for IR 2 ....................................................................................... 6
Table 7: Activities Implemented for IR 3 ....................................................................................... 7
Table 8: Project Contribution toward Disaster Resilient Village ................................................. 11
Table 9: Key Adaptive Livelihood Indicators from Performance Monitoring Plan ..................... 12
Table 10: Adaptive Livelihoods Trainings ................................................................................... 12
Table 10: Outcomes of Alternative Livelihood Promotion .......................................................... 14
Table 11: Number of Adaptive Livelihood Groups and Members ............................................... 14
Table 12: Frequency of Participation in Disaster Related Trainings ............................................ 15
Table 14: Number of teachers and student received training on DRR/CCA ................................ 18
Table 14: Gender Outcomes ......................................................................................................... 19
List of Figures
Figure 1: Respondents Perception on the Roles of the Committee .............................................. 10
Figure 2: Committee Activities ..................................................................................................... 10
Figures 3: Improved Organic Agriculture Practices by District ................................................... 13
Figure 4: Respondents’ Ability to Identify Tsunami Sign ............................................................ 16
Figure 5: Perception on DRR ........................................................................................................ 17
Figure 6: Behavior in Household Disaster Preparedness .............................................................. 17
1
A. EXECUTIVE SUMMARY
In September 2011, Project Concern International began implementing the Cross Sectoral Strategies for Climate Change and Disaster Risk Reduction (CADRE) project in Indonesia, in response to the need to strengthen resilience of vulnerable rural populations in Bengkulu province to disaster and climate change. The U.S. Agency for International Development funded the CADRE project as a strategic collaboration between PCI, KabaHill Centre, universities, consultants, local communities and government to address the needs of 3 districts, 30 communities and an estimated 35,000 people in Bengkulu province – one of the most disaster prone provinces in the country. Specifically, the project sought to strengthen resilience of vulnerable rural populations in Bengkulu province to disaster and climate change.
Circle Indonesia was contracted by PCI to conduct the final evaluation of the CADRE project. The main objectives of the final evaluation included assessing the achievement of the program’s goal to strengthen resilience of rural communities to natural disasters in three districts (Bengkulu City, North Bengkulu and Kaur) in Bengkulu province, as well as the effectiveness of the program design in achieving the project goal.
Key Findings: IR1: Strengthen Institutional Capacity for Disaster Risk Management and Climate Change
Adaption
CADRE had a goal of forming thirty Community Disaster Risk Reduction Committees (CDRRCs). Through the life of the project, 32 CDRRCs were formed in three districts (2 dissolved before the end of the project), all of which completed the core activities of conducting DRR mapping assessments and developing comprehensive DRR action plans. Forty-six percent of those community DRR planning exercises were conducted with BPBD participation, an increase from 0% at baseline, demonstrating the linkages that CADRE helped build between community groups and government. In terms of strengthening institutional capacity at the government level, all three district BPBDs created strategic plans and at least 50% of the BPBD staff are trained in community-based disaster risk management. As a result of this capacity building, the final evaluation survey found that 64% of respondents in the target area believe that household vulnerability has decreased compared to three years ago
IR2: Reduced Exposure and Vulnerability through Adaptive Livelihoods
This final evaluation finds substantial evidence that CADRE was successful in building adaptive livelihoods as a way to build resilience to climate change related vulnerability. The final survey found that 68.1% of respondents in the target project area have made changes to their livelihood to reduce risk to disaster and climate change, compared to a baseline of 9.2% and well exceeding the target of 50%. In addition, 52%1 of the population practices adaptive livelihoods. To achievethese results, 49 adaptive livelihood groups were formed, for which 691 farmers were trained in adaptive farming techniques. Even more remarkably, 717 farmers accessed seed capital for adaptive livelihoods, and a total of $56,996 was leveraged for adaptive livelihoods to match project funds
1 +/- 3% margin of error

2
IR3: Improve Disaster Preparedness through Knowledge and Education
CADRE also focused on disaster preparedness to build resilient communities. Disaster simulation exercises were conducted each year for three years in 77 villages, 48% of which were conducted with Government of Indonesia (BPBD) participation. The final evaluation survey found that 99% of respondents reported having at least one specific planned response in the event of a disaster, compared to baselines of 21% (Bengkulu City), 22% (North Bengkulu) and 61% (Kaur). In addition, 88% of households reported that they perceived reduced vulnerability to shocks as a result of engagement in program activities, compared to 17.4% at baseline and a target of 75%
Cross Cutting Objective: Gender Empowerment
CADRE embedded gender empowerment into all activities to build resilient communities in the three target districts. Overall, 39% of CDRRC members in target communities were female, exceeding the target of 30%. In addition, 73% of livelihood group members were female, exceeding the target of 50%, with women also comprising 94% of lead farmers. Finally, 100% of DRR assessments and a resulting 100% of DRR community plans incorporated vulnerabilities specific to women.
B. EVALUATION OBJECTIVE AND METHODOLOGY
Evaluation Objectives
This evaluation addresses the achievement of the program’s goal to strengthen resilience of rural communities to natural disasters in three districts (Bengkulu City, North Bengkulu and Kaur) in Bengkulu province, and the effectiveness of the program design in achieving the program goal. More specifically, the evaluation seeks answer to the specific evaluation objectives, as shown by Table 1.
Table 1: Evaluation Specific Objectives No. Specific Objectives Aspect assessed 1. Program Design Program relevance to targeted beneficiaries
Program replicability and scalability 2. Program Coverage Identification of positive impact on DRR and CCA and project
components that have no/limited impact 3. Program Outcomes
and Impact Program achievement toward key performance indicators Program impact on institutional capacity for disaster and
climate change management Program impact on reduced exposure and vulnerability to
disaster as well as disaster preparedness practices Program impact on adaptive livelihoods Program impact on women beneficiaries to address gender-
specific needs to climate changes 4. Sustainability Independence of DRR, livelihoods groups and organic farming
groups Linkage to available institutions and services for sustainability Sustainable livelihoods impact
3
The evaluation was guided by the specific questions as indicated in the evaluation terms of references (TOR) which can be found as Annex 1. Evaluation Methodology
The evaluation employed mix-research methods (qualitative and quantitative) to achieve the above objectives. The fieldwork for the evaluation was organized in February 2015.
In-depth interviews
The consultant organized in-depth semi-structured interviews with the following agencies:
(1) Regional Board for Disaster Management (BPBD); (2) Agriculture Department/Office/Dinas; (3) Office/Dinas of Food Security and Extension Worker Department; (4) Education Office/Dinas and teachers; (5) Head of Villages; (6) Village DRR committees; (7) Representative of economic group; (8) Representative of district official;
Focus Group Discussions (FGDs)
FGDs were conducted with project beneficiaries, represented by Village DRR Committee, Organic Farming Groups and Adaptive Livelihoods Groups, as shown by Table 2
Table 2: FGD List No. Village Participants Male Female Total 1. Berkas - 8 8 2. Pasar Tebat - 4 4 3. Lubuk Tanjung 1 6 7 4. Lais and Dusun Raja 1 11 12 5. Lubuk Lesung - 4 4 6. Linau 1 8 9 7. Tanjung Besar - 7 7 8. Rawa Makmur 1 8 9 TOTAL 4 56 60
Document Review The evaluation reviewed relevant program documents including: (1) Project Progress Reports; (2) Project Annual Reports; (3) Baseline Data; (4) Activity Report and (5) Secondary Data. The project related documents review provided useful information on project rationale, baseline data and activities implemented. Data and information from secondary data such as statistical information, related government program gave useful information in terms of project relevance.

4
Questionnaire and Sampling Design
The study uses questionnaires to obtain project impact in 28 villages (project sites) in 3 Districts of Bengkulu. The questionnaire can be found at Annex 7. To obtain representative sampling, the evaluation use Slovin2 sampling size calculation method, with the following formula: N n = 1 + N 𝑒 2
N = Population n = sample 𝑒 = error tolerance
Based on the available data of the 28 villages, the total population is 9,894 household and with Slovin Method at 𝑒 = 0.05, this population is represented by 384. Considering the possibilities of non-returning questionnaires, the study involves 415 actual samples, which is far more than representative size, as illustrated by Table 3. The selection of sample is based on systematic random sampling. Table 3: Distribution of Respondents District Number of Respondents Percentage North Bengkulu 70 16.9 Kaur 86 20.7 Bengkulu City 259 62.4 Total 415 100.0
As can be seen from the above table, majority of the respondents reside in Bengkulu City. This is because the sampling selection use proportional to population size.
This final evaluation report is a collaboration between PCI and Circle Indonesia. The report was produced after document review, field data collection and discussion with CADRE team at PCI and KabaHill of Bengkulu. Circle Indonesia led the data collection and analysis process, while this report was prepared primarily by PCI. All data were independently collected and verified by the external evaluation consultant.
C. PROGRAM OVERVIEW
In September 2011, the U.S. Agency for International Development (USAID) Indonesia Mission awarded Project Concern International (PCI) a cooperative agreement to support the Cross Sectoral Strategies for Climate Change and Disaster Risk Reduction in Indonesia (CADRE) project. The CADRE project is a strategic collaboration between PCI, KabaHill Centre, universities, consultants, local communities and government to address the needs of three districts, 30 communities and an estimated 35,000 people in Bengkulu province – one of the most disaster‐prone provinces in the country. Specifically, the project sought to strengthen resilience of vulnerable rural populations in Bengkulu province to disaster and climate change. This was achieved through three intermediate results, as illustrated by Table 4. 2 Gizew, A. (2013) Determinants of Market Supply of Vegetables: A Case of Akaki-Kality Sub-City, Ethiopia. Journal of Rural Development, Vol. 32, No. (3) pp. 281 – 290; Guilford, J.P. and B. Fruchter, 1973. Fundamental Statistics in Psychology and Education. 5th Ed., McGraw-Hill Book Company, New York.
5
Strategic Objective:
Strengthened resilience of vulnerable populations in Bengkulu Province of Sumatra to disaster and climate
change
Intermediate Result 1:
Strengthened institutional capacity
for disaster & climate change
management
Intermediate Result 2:
Reduced exposure and
vulnerability through adaptive
livelihoods
Intermediate Result 3:
Improved disaster preparedness
practices of communities through
knowledge & education
1.1:
Disaster risk
reduction
committees
formed and
strengthened
1.2:
Vulnerabilitie
s mapped and
compiled
2.1:
Adaptive
livelihood
groups formed
2.2:
Training and
assistance for
adaptive
livelihoods
supported
3.1:
Improved
dissemination
and education
on DRR
3.2: Improved
community
knowledge on
early warning
response
1.3:
DRR plans developed and
initiated
2.3: Access to capital for adaptive
livelihoods increased
Table 4: Project Results Framework
Source: Project Technical Narrative
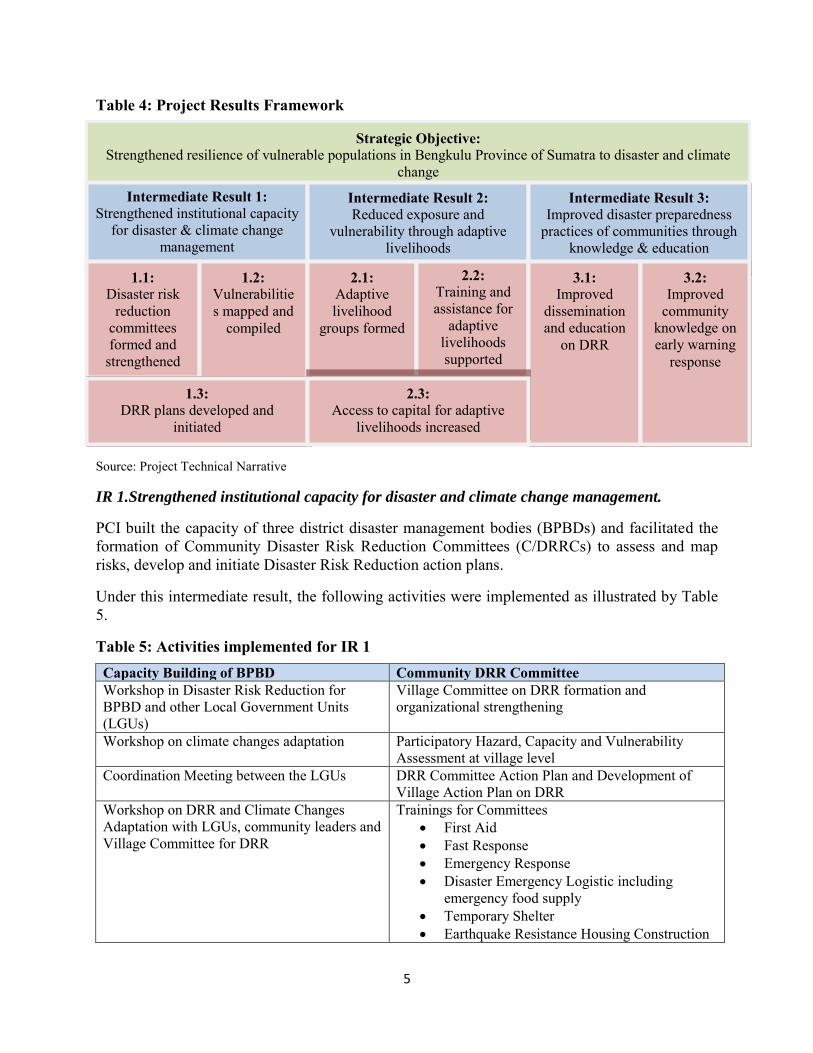
IR 1.Strengthened institutional capacity for disaster and climate change management.
PCI built the capacity of three district disaster management bodies (BPBDs) and facilitated the formation of Community Disaster Risk Reduction Committees (C/DRRCs) to assess and map risks, develop and initiate Disaster Risk Reduction action plans.
Under this intermediate result, the following activities were implemented as illustrated by Table 5.
Table 5: Activities implemented for IR 1 Capacity Building of BPBD Community DRR Committee Workshop in Disaster Risk Reduction for BPBD and other Local Government Units (LGUs)
Village Committee on DRR formation and organizational strengthening
Workshop on climate changes adaptation Participatory Hazard, Capacity and Vulnerability Assessment at village level
Coordination Meeting between the LGUs DRR Committee Action Plan and Development of Village Action Plan on DRR
Workshop on DRR and Climate Changes Adaptation with LGUs, community leaders and Village Committee for DRR
Trainings for Committees First Aid Fast Response Emergency Response Disaster Emergency Logistic including
emergency food supply Temporary Shelter Earthquake Resistance Housing Construction
6
In addition, the project strengthened committee and village communities’ linkage to public services on sustainable livelihoods including existing development schemes. Linkages were promoted through various meetings organized such as regular bi-annual meetings, monthly coordination meetings with BPBDs and related agencies, and advocating for disaster resilience on behalf of community groups.
IR 2.Reduced exposure and vulnerability through adaptive livelihoods
The project directly supported rural households affected by disaster and climate change to proactively begin to adapt livelihoods. This was achieved through the formation of adaptive livelihood groups of farmers who will be trained in the principles of permaculture and provided with technical assistance to access capital.
Table 6: Activities implemented for IR 2 Organic Farming Adaptive Livelihood Diversification Organic farming trainings
ToT of Permaculture for staff and lead farmers
Field Farmers School (FFS) organic farming which covered bio-pesticides, soil preparation, home garden design and Integrated Pest Management (IPM)
Advance organic farming training facilitated by University
Refresher permaculture training for lead farmers
Adaptive livelihoods training Assessment of potential livelihood
diversification Training on poultry management Training on mushroom cultivation Training for aquaculture (fresh water
fisheries) Biofloc technology training Training on cake and crackers production Book keeping management
Kitchen Garden and vegetable cultivation Adaptive livelihoods promotion Homemade cake and crackers production Catfish raising support Mushroom production support
Market promotion of organic vegetable Entrepreneurship trainings Training on Permit Requirement for
Home Industry Basic entrepreneurship training
IR 3. Improved disaster preparedness practices of communities through knowledge and
education
The project improved knowledge and education among targeted communities in several disaster preparedness competencies, including early warning readiness and disaster preparation and response. PCI utilized a variety of education and knowledge building activities including community radio, home visits, traditional theatre, art and other forms of community education. By the end of the project, all communities were expected to develop community-based early warning systems, conduct drills and simulations, and at least 50% of households should have a planned response in case of a disaster.

7
Table 7: Activities Implemented for IR 3 Mainstreaming disaster preparedness through school
Communities Education
Disaster Risk Reduction Training for School and School Level Disaster Simulation
Disaster Preparedness Capacity Development Village Level Disaster Simulation
Capacity Building for cultural and
religious leaders
DRR Training for Teacher DRR Training for Teachers Training on syllabi integrating DRR/CC
into existing curricula
Climate Changes and DRR Education Information dissemination through
cinema Information dissemination through
community meetings and discussions Information dissemination through
community religious activities DRR awareness raising through art competitions for pre-school children
DRR and CCA jamborees at district and province level
D. EVALUATION RESULTS: PROGRAM DESIGN
This section presents the evaluation findings on CADRE’s program design and relevance with local development challenges and agenda. The key themes for program design and relevance are identified as follows.
Bengkulu is one of the most disaster and climate change shock prone province in Indonesia. Bengkulu is located on the Southwest coast of Sumatra Island and has a coastline of 525 km that faces directly with the Indian Ocean.3 The disaster index of Bengkulu in 2013 listed that the three project site districts (Bengkulu City, North Bengkulu and Kaur) are among highest risk district in Bengkulu Province (BNPB, 2013).
The program was designed to respond the disaster and climate change vulnerability by building community resilience. The project promoted the mainstreaming of disaster risk reduction as an integral response in climate change adaptation.
Institutional capacity to respond to and manage natural disasters is relatively new in Indonesia. The Government of Indonesia has embarked on strengthening the capacity for disaster management though the adoption of Act No. 24 of 2007 concerning Disaster Management.4 At 3 Historical data record several tsunami disasters in Bengkulu with the 1883 tsunami as the most devastating one (Armiis, 2013). Bengkulu lies near the Sunda Subduction Zone and Sumatra Fault and therefore it is prone to possible earthquake and tsunami. The most recent disaster in June 2000 caused damage and the loss of at least 100 people. In 2007, an earthquake of 7.9 hit Bengkulu and West Sumatra causing lost of 25 lives (Bappenas, 2007) 4 The Law stipulates about the role of National and Local Governments Establishment of BNPB and BPBDs; Roles and Responsibility of Community in DM Roles of Private sectors and International in DM Implementation: pre-disaster, emergency response, and post-disaster Funding and Relief Assistance Management Controlling, Monitoring & Evaluation of DM implementation.

8
national level, National Agency for Disaster Management was established in 2008, through Presidential Regulation No. 8 of 2008.5 These indicated shift from a focus on disaster response to Disaster Risk Reduction and promotion of systematic approach to disaster management6. As newly created agency, there are still lack of capacity in disaster response. Since the capacity of disaster agency is key to effective disaster response including in the DRR and mitigation, the project targeted capacity building of the BPBD both at province and 3 districts. CADRE supported the three BPBD to encourage preparation of mid-term strarategic plan document as key road map and strategic guideline in disaster response program. Various activities supported by the project-stimulated awareness on the need for DRR and CCA and key personnel capacity development on DRR and CCA. In addition to enhancing district and provincial government institutional capacity, the project engaged in strengthening village and local community capacity in disaster risk reduction and climate changes adaptation. These include in preparation of village level disaster mapping and management plan, which also identified community vulnerability and capacity. There were 28 documents prepared in 28 villages in the three districts namely 8 villages in Bengkulu City, 10 villages in North Bengkulu and 10 villages in Kaur District.
Strategic partnership was a key focus of building capacity for both government and community-level stakeholders. The project signed a Memorandum of Understanding (MOU) with the governor at the province level and at the field-level the project maintained strategic collaboration with local government units such as BPBD, Bappeda and Agriculture related agencies. Project activities have demonstrated strategic intervention in enhancing capacity of BPBD, community based disaster management and develop linkage between community and local government.
The project design shows that project complemented the BPBDs capacity to carry out their core functions in the three districts. Similarly, the project built links resources from the Local Government Units relevant to agriculture (Office of Agriculture, extension workers and food security agency). For instance, the project developed linkages between farmers beneficiaries involved in organic farming and kitchen garden with agricultural extension services. Various adaptive livelihoods groups in Sumber Jaya, Rawa Makmur, Beringin raya, Teluk Sepang, Pasar Lais, air Padang, Sumber Harapan and Linau have been able to obtain financial resources and agricultural inputs such as seeds from local government to leverage their organic farming production. Existing expertise of agriculture services is also channeled in that organic farming groups benefited from expertise contributed by agriculture extension officer.
E. EVALUATION RESULTS: PROGRAM RESULTS
CADRE’s final evaluation consultant conducted an endline population based survey to understand the context of DRR/CCA capacity, adaptive livelihoods and disaster preparedness
5 UNDP – BNPB (2009) Lesson Learned: Disaster Management Legal Reform, The Indonesian Experience. Jakarta: UNDP – BNPB.
6 Under the Law No. 24 of 2007, three phases of systematic approach are identified, as: (1) pre-disaster planning and preparedness (DRR, mitigation, preparedness and contingency plan); (2) emergency responses, and (3) post-disaster recovery.

9
after the completion of the intervention. In order to measure overall impact on vulnerability, the survey asked if respondents believe that household vulnerability has decreased compared to three years ago. Sixty-four percent of respondents believe that it has decreased, while 36% do not believe that it decreased. While this question does not identify the specific mechanism that would decrease household vulnerability, it does provide strong evidence that the population of the intervention area perceive themselves as less vulnerable now than they did prior to the implementation of CADRE.
Institutional Capacity for Disaster and Climate Change Management
The project supported the capacity of village level institutions on disaster management by facilitating the formation of 307 village level CDRRCs in three districts in the provinces of Bengkulu. The list of these villages is shown in Annex 5.
The project facilitated the village committees to conduct risk assessment followed by production of hazard and disaster potential maps. The efforts focused on increasing CDRRCs knowledge on DRR and CCA, strengthening the committees’ organizational structure, developing DRR/CCA annual work-plans and developing a clear strategy to implement the plan. . Similarly, in each village, with collaboration among the Committee, village government and district government, village disaster management plans8 were prepared. These plans are official documents developed with participation of villagers to identify disaster risk and vulnerability using the Hazard, Vulnerability and Capacity Assessment (HVCA). The plan also incorporates village government’s plan and program on disaster risk reduction covering capacity building and physical activities. The disaster management plan is for 5-year period, functions as guideline for DRR and Disaster Responses. These have become remarkable project achievement as model in community based disaster management. [Indicators on BPBD integration into planning]
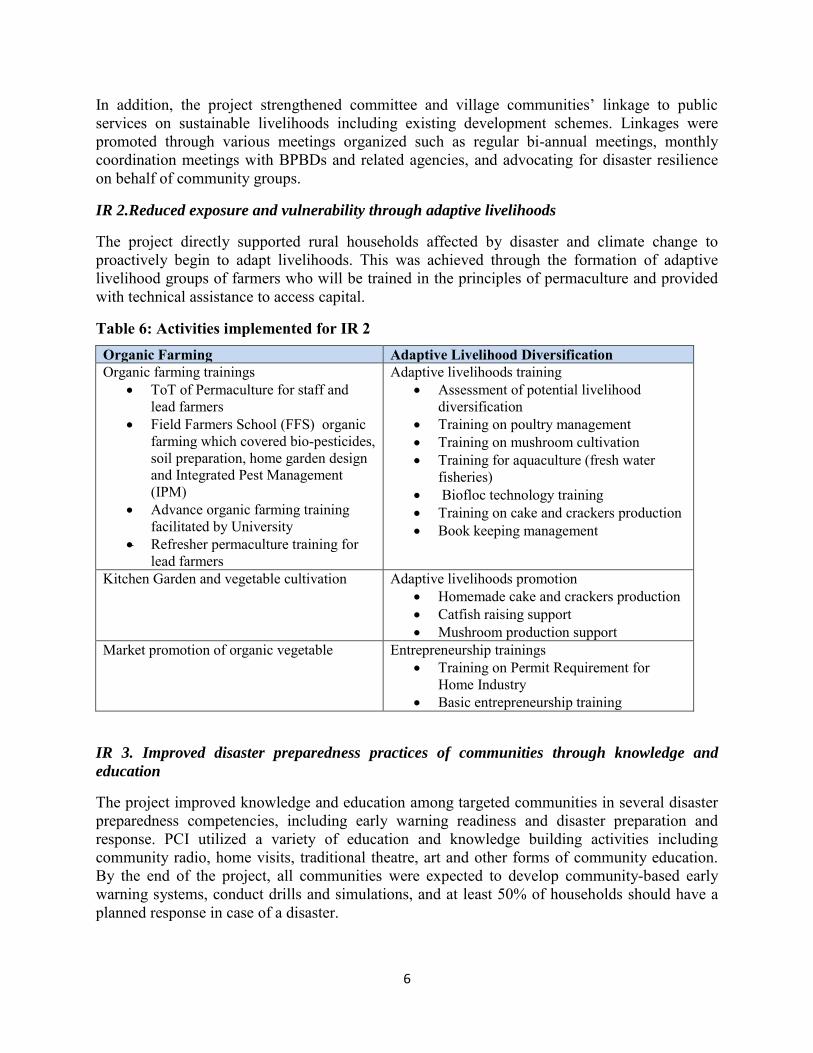
The survey found that 64% of respondents are aware of the presence of the committee. Given that the committees did not exist prior to the CADRE project, PCI considers this a success in raising the profile of the potential for communities to be the drivers of their own DRM and CCA agendas. Survey respondents felt that the committees fulfilled a variety of roles, as demonstrated in figure 5, demonstrating the variety of ways that committees can be a valuable resource for strengthening DRM and CCA capacity outside of the committees themselves.
7 In total CADRE facilitated the formation of 30 CDRRC and 1 replication CDRRC village in Kaur, and one village
has already established committee. However, there were 4 villages dropped their participation in Bengkulu City and
North Bengkulu. 8 The Act No. 24 of 2007 and the Presidential Regulation No. 21 of 2008 do not specifically mention the needs for
village level disaster
10
Figure 1: Respondents Perception on the Roles of the Committee
Source: CADRE Final Evaluation Survey, 2015
CADRE has strengthened local NGO organizational capacity by partnering with KabaHill in project implementation. At the start of the project, PCI conducted an organizational capacity assessment of KabaHill, which resulted in a capacity strengthening plan to be implemented throughout the life of the project through specific training and on the job learning. CADRE facilitated capacity-building activities for KabaHill in disaster response program management, financial management, and investment in local expertise on disaster preparedness, mitigation and emergency responses. As a result, KabaHill is equipped with adequate capacity to further implement DRR and Climate Changes program. KabaHill’s partnership on CADRE was also key to promoting the sustainability of the project results. KabaHill is currently constructing a disaster risk management and sustainability school that will bring together government, community and university representatives to build capacity in DRM, train people on alternative livelihoods, and further link community and government representatives.
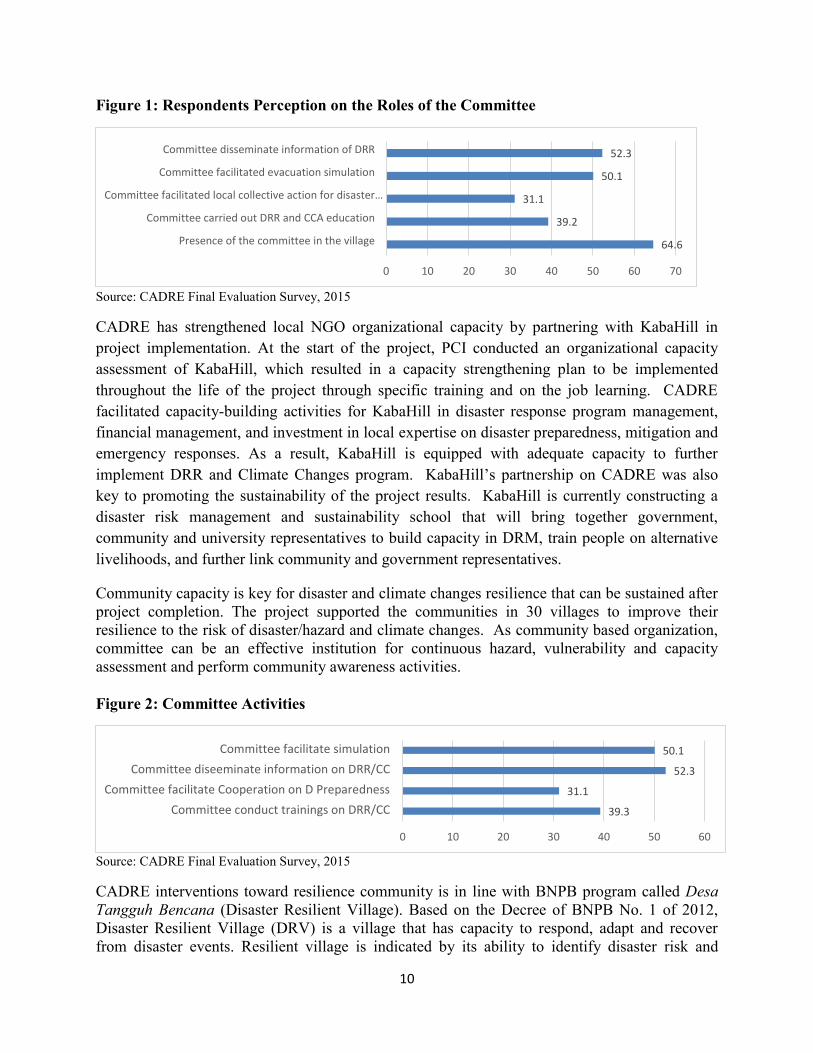
Community capacity is key for disaster and climate changes resilience that can be sustained after project completion. The project supported the communities in 30 villages to improve their resilience to the risk of disaster/hazard and climate changes. As community based organization, committee can be an effective institution for continuous hazard, vulnerability and capacity assessment and perform community awareness activities. Figure 2: Committee Activities
Source: CADRE Final Evaluation Survey, 2015
CADRE interventions toward resilience community is in line with BNPB program called Desa Tangguh Bencana (Disaster Resilient Village). Based on the Decree of BNPB No. 1 of 2012, Disaster Resilient Village (DRV) is a village that has capacity to respond, adapt and recover from disaster events. Resilient village is indicated by its ability to identify disaster risk and
64.6
39.2
31.1
50.1
52.3
0 10 20 30 40 50 60 70
Presence of the committee in the village
Committee carried out DRR and CCA education
Committee facilitated local collective action for disaster…
Committee facilitated evacuation simulation
Committee disseminate information of DRR
39.3
31.1
52.3
50.1
0 10 20 30 40 50 60
Committee conduct trainings on DRR/CC
Committee facilitate Cooperation on D Preparedness
Committee diseeminate information on DRR/CC
Committee facilitate simulation

11
organize its resources for disaster risk reduction and is able to develop further capacity for DRR. DRV promotes community based disaster management as has been also promoted by CADRE. This evaluation identified BNBP indicators on DRV and CADRE’s contribution to those indicators. Details are in the following table, which demonstrates that the project contributed significantly towards creating DRVs in 30 communities in the project intervention area.
Table 8: Project Contribution toward Disaster Resilient Village
Category Indicators for Disaster Resilience Village
Project contribution
Legislation/Regulation Village Disaster Management Policies or community disaster action plan
Project supported development of village/community disaster action plan
Planning Present of community disaster action plan
Project facilitated participatory process to develop disaster contingency plan in 30 villages
Institutional Village DRR Forum, Disaster Management Volunteers and partnership between villages and disaster management actors
Project facilitated establishment of DRR and Climate Changes Committee, equipped with voluntary committee members. Project also developed linkage between community and BPBD and Agricultural Services
Funding Emergency Response and DRR funding
Project advocated supportive political will among policy makers (coordination meeting); Project supported development of evacuation road in various villages
Capacity Development DRR training for village authorities
DRR training for community members and volunteers
Participation of community in DRR decision making
Women participation in volunteer groups
Project provided trainings for village officials in CCA/DRR
Project supported trainings for community members and volunteer
Project promoted participatory community action plan
Project promoted women participation in DRRCC Committee (See F.8.)
Disaster Risk Management
Local Disaster risk mapping evacuation maps, routes and sites; local early warning system
Economic resilience to reduce disaster impact and protection of local productive assets
Protection of vulnerable people
Project supported development of evacuation maps, routes and sites as well as early warning system
Project supported livelihoods resilience through organic farming and adaptive livelihoods activities
Project built evacuation road
Source: Prepared by Evaluation Consultant based on Comparison between BNPB DRV Indicators 9 and Project Activities and Results
9 As identified in BNPB Regulation No. 1 of 2012 Concerning Guideline for Disaster Resilient Village
12
Adaptive Livelihood Development
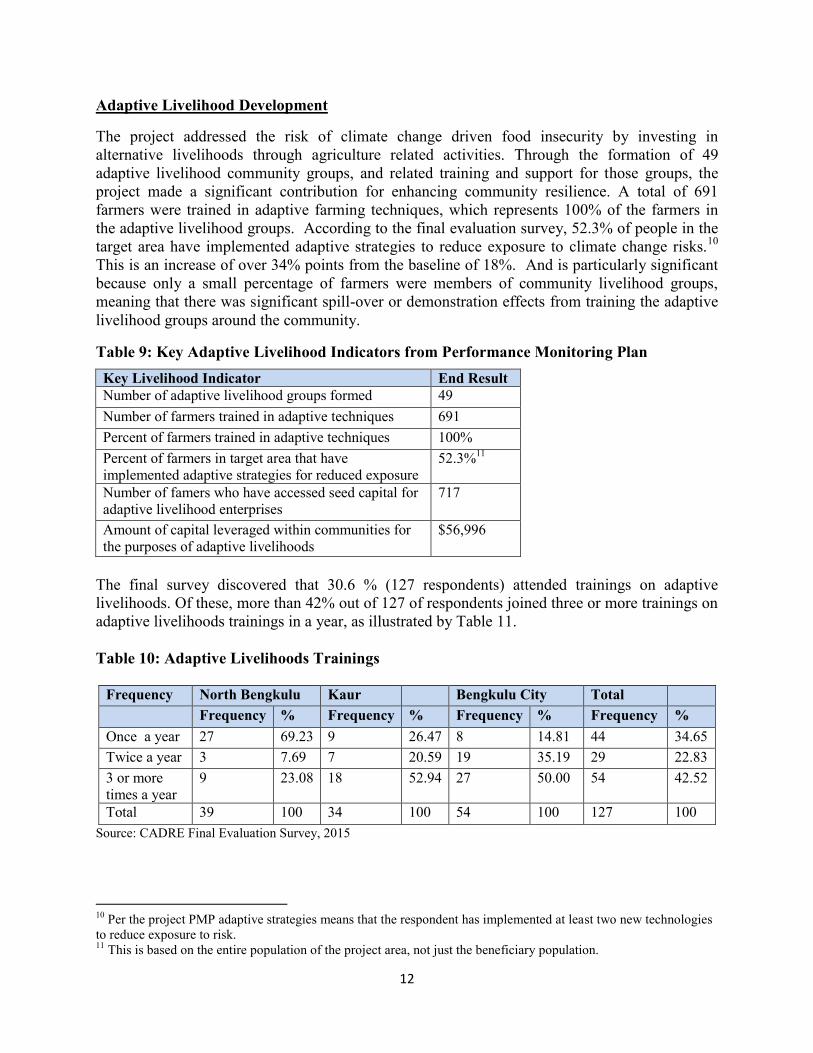
The project addressed the risk of climate change driven food insecurity by investing in alternative livelihoods through agriculture related activities. Through the formation of 49 adaptive livelihood community groups, and related training and support for those groups, the project made a significant contribution for enhancing community resilience. A total of 691 farmers were trained in adaptive farming techniques, which represents 100% of the farmers in the adaptive livelihood groups. According to the final evaluation survey, 52.3% of people in the target area have implemented adaptive strategies to reduce exposure to climate change risks.10 This is an increase of over 34% points from the baseline of 18%. And is particularly significant because only a small percentage of farmers were members of community livelihood groups, meaning that there was significant spill-over or demonstration effects from training the adaptive livelihood groups around the community.
Table 9: Key Adaptive Livelihood Indicators from Performance Monitoring Plan Key Livelihood Indicator End Result Number of adaptive livelihood groups formed 49 Number of farmers trained in adaptive techniques 691 Percent of farmers trained in adaptive techniques 100% Percent of farmers in target area that have implemented adaptive strategies for reduced exposure
52.3%11
Number of famers who have accessed seed capital for adaptive livelihood enterprises
717
Amount of capital leveraged within communities for the purposes of adaptive livelihoods
$56,996
The final survey discovered that 30.6 % (127 respondents) attended trainings on adaptive livelihoods. Of these, more than 42% out of 127 of respondents joined three or more trainings on adaptive livelihoods trainings in a year, as illustrated by Table 11.
Table 10: Adaptive Livelihoods Trainings
Source: CADRE Final Evaluation Survey, 2015
10 Per the project PMP adaptive strategies means that the respondent has implemented at least two new technologies to reduce exposure to risk. 11 This is based on the entire population of the project area, not just the beneficiary population.
Frequency North Bengkulu Kaur Bengkulu City Total Frequency % Frequency % Frequency % Frequency % Once a year 27 69.23 9 26.47 8 14.81 44 34.65 Twice a year 3 7.69 7 20.59 19 35.19 29 22.83 3 or more times a year
9 23.08 18 52.94 27 50.00 54 42.52
Total 39 100 34 100 54 100 127 100

13
Figures 3: Improved Organic Agriculture Practices by District
In comparing the use of certain organic agriculture practices and technology from baseline to endline, there was an increase in their use and deployment in both Kaur and North Bengkulu, but a decrease of use in Bengkulu City. The endline survey compared the use of bio-pesticides, locally adapted seeds, manure and organic fertilizer in each district. The results are displayed in the figure to the left.
It was not immediately clear why both Kaur and North Bengkulu had increased use of organic farming practices and Bengkulu City saw a decrease. One possible reason is that livelihoods and sources of income are significantly more diversified in Bengkulu City than they are in the other two districts. Only about 6% of respondents were farmers in Bengkulu City while 30% in North Bengkulu and 35% in Kaur are farmers. Given that only 6% of respondents in Bengkulu City classify themselves as farmers, it is still impressive that more than 6% of respondents reported using each of the four organic farming practices. For Kaur and North Bengkulu, although it is difficult to determine direct attribution, the results indicate that CADRE has a significant positive impact on the use of organic farming as an adaptive livelihood.
More importantly, results indicate that the trainings and implementation of adaptive livelihoods such as organic farming led to an increase in income among some respondents. Of the total
0%
16%
28%
2%
34% 30%
44% 40%
0%5%
10%15%20%25%30%35%40%45%50%
North BengkuluBaseline
North BengkuluEndline
0%
14%
0%
8% 14%
36%
62%
24%
0%
10%
20%
30%
40%
50%
60%
70%
Kaur Baseline
Kaur Endline
19% 22%
34%
53%
9% 14%
19%
12%
0%
10%
20%
30%
40%
50%
60%
BengkuluCityBaseline
BengkuluCity Endline

14
population in North Bengkulu 54% reported practicing adaptive livelihoods, and 33% reported increased income from adaptive livelihoods. Though a bit lower than in North Bengkulu, similar condition happened in Kaur and Bengkulu City. Bengkulu City is urban area with more population density than the other two districts.
The impact of CADRE on household economy occurred also from sales and decrease household expenditure for vegetable consumption. In this regard, PCI conducted a mini survey in October 2014 to get a better understanding of the organic farming practices that have been adopted by livelihood groups assisted by CADRE and the economic impact of this alternative livelihood. PCI sampled members from all livelihood groups and learned that all groups, and a strong majority of individuals within the groups, are continuing to implement organic farming practices. Furthermore, most are seeing economic benefits from this practice, as an average of $9.76 across the three areas is saved each month for each household that is implementing the organic farming practices.
Table 11: Outcomes of Alternative Livelihood Promotion
Organic Farming Indicator Bengkulu City
North Bengkulu
Kaur
Varieties of crops planted planting as a result of CADRE
15 8 6
Percentage of production for sale 38% 38% 35%
Saving made each month from the purchase of fruits and vegetables as a result of organic garden
$13.17 $4.82 $11.29
CADRE also implemented activities related to duck, poultry and catfish raising as part of adaptive livelihoods. Most successful of the interventions was the duck rearing, where CADRE helped develop a pass-on scheme where farmers would receive training in duck rearing and would also receive ducklings after training. Once they raised the ducks and had ducklings of their own, they would pass on some of those ducklings to new adaptive livelihood group members, who would then also receive training from CADRE. As a result, 145 farmers received ducklings and duck rearing training. The table below shows all adaptive livestock raising participants. Table 12: Number of Adaptive Livelihood Groups and Members
Activity No. of Groups
Participants Male Female Total
Catfish Farming 13 80 42 122 Duck Farming 16 24 121 145 Food Processing 14 78 139 217 Mushroom Farming
5 0 19 19
Total 48 182 321 503
15
CADRE’s approach to alternative livelihoods was to incorporate strategies into the local government agenda. An example of this integration came from interviews with the Indonesian Food Security Body (Badan Ketahanan Pangan – BKP) and Agricultural Office (Dinas Pertanian). 12 Interviews with the Food Security Body and Office of Agriculture of Kaur expressed that CADRE’s activities strengthened and complemented the program implemented by the government in promoting food security through utilization of home garden, as cited below.
“…CADRE has contributed to food security among the participating villages in Kaur. Un-utilized home compound has been transformed to organic vegetable plots which produced food sources for the participating households. Organic vegetable has also been promoted which help the household to reduce cost for household consumption because nowadays participants have enjoyed their own vegetable production…”
(Interview with Mr. Defrial, Head of Office of Agriculture, Kaur District, 2015).
By the end of the project, about $56,000 was invested by communities and government development funds to match project investments in adaptive livelihoods. These interventions helped diversify livelihoods, particularly women, as indicated by the case studies in Annex 2.
Improved Disaster Preparedness Through Knowledge and Education
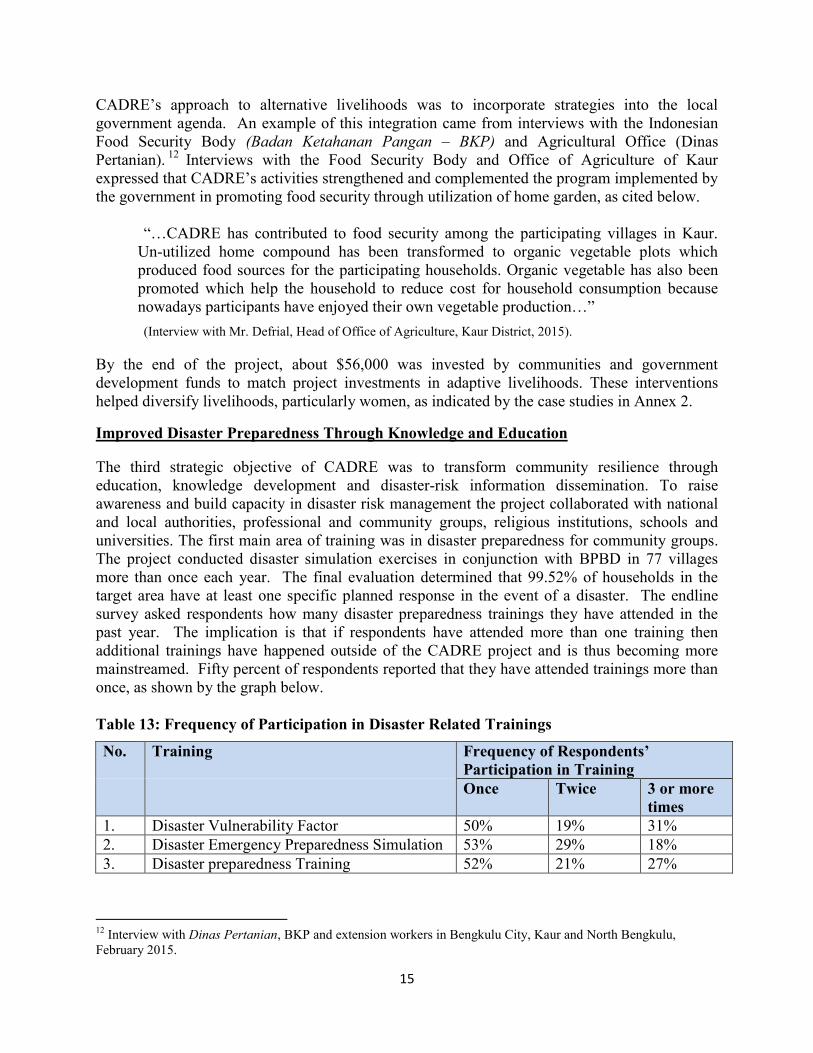
The third strategic objective of CADRE was to transform community resilience through education, knowledge development and disaster-risk information dissemination. To raise awareness and build capacity in disaster risk management the project collaborated with national and local authorities, professional and community groups, religious institutions, schools and universities. The first main area of training was in disaster preparedness for community groups. The project conducted disaster simulation exercises in conjunction with BPBD in 77 villages more than once each year. The final evaluation determined that 99.52% of households in the target area have at least one specific planned response in the event of a disaster. The endline survey asked respondents how many disaster preparedness trainings they have attended in the past year. The implication is that if respondents have attended more than one training then additional trainings have happened outside of the CADRE project and is thus becoming more mainstreamed. Fifty percent of respondents reported that they have attended trainings more than once, as shown by the graph below. Table 13: Frequency of Participation in Disaster Related Trainings
No. Training Frequency of Respondents’ Participation in Training
Once Twice 3 or more times
1. Disaster Vulnerability Factor 50% 19% 31% 2. Disaster Emergency Preparedness Simulation 53% 29% 18% 3. Disaster preparedness Training 52% 21% 27%
12 Interview with Dinas Pertanian, BKP and extension workers in Bengkulu City, Kaur and North Bengkulu, February 2015.
16
As indicated by the above table, 100% of respondent surveyed have attended at least one training on disaster vulnerability factors and disaster preparedness, and have done one disaster emergency preparedness simulation. More notable is that significant percentages of the population in the target project areas have attended two or more trainings and simulations.
Therefore, it is notable that CADRE has profound impact on knowledge development on DRR, as reflected in an interview with Senior Official of BPBD, as follow:
“…CADRE helped us to increase knowledge and capacity on DRR at the grassroots level. In my opinion, there is significant difference in terms of knowledge and capacity between village supported by CADRE and other non-covered villages. Participation in a number of activities like simulation, jamboree and CDRRC has increased community awareness on DRR issue…” (Interview with Sudiro, Secretary of BPBD North Bengkulu, 2015)
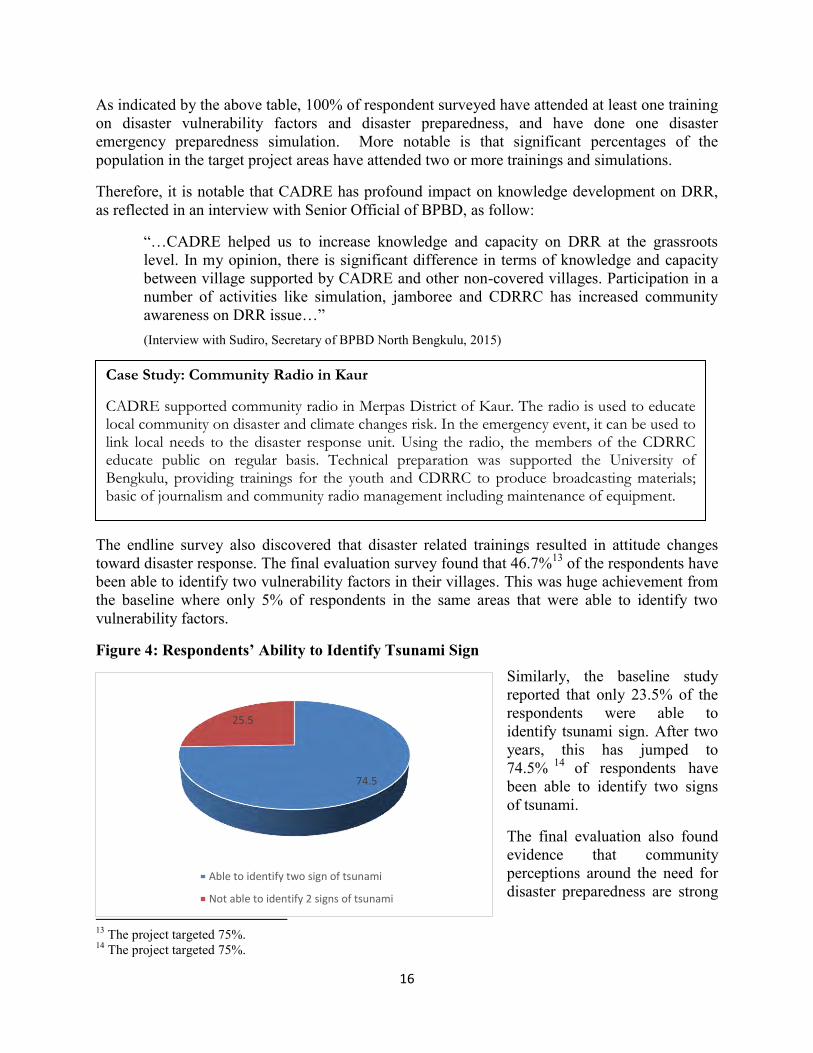
The endline survey also discovered that disaster related trainings resulted in attitude changes toward disaster response. The final evaluation survey found that 46.7%13 of the respondents have been able to identify two vulnerability factors in their villages. This was huge achievement from the baseline where only 5% of respondents in the same areas that were able to identify two vulnerability factors.
Figure 4: Respondents’ Ability to Identify Tsunami Sign Similarly, the baseline study reported that only 23.5% of the respondents were able to identify tsunami sign. After two years, this has jumped to 74.5% 14 of respondents have been able to identify two signs of tsunami.
The final evaluation also found evidence that community perceptions around the need for disaster preparedness are strong
13 The project targeted 75%. 14 The project targeted 75%.
Case Study: Community Radio in Kaur
CADRE supported community radio in Merpas District of Kaur. The radio is used to educate local community on disaster and climate changes risk. In the emergency event, it can be used to link local needs to the disaster response unit. Using the radio, the members of the CDRRC educate public on regular basis. Technical preparation was supported the University of Bengkulu, providing trainings for the youth and CDRRC to produce broadcasting materials; basic of journalism and community radio management including maintenance of equipment.
74.5
25.5
Able to identify two sign of tsunami
Not able to identify 2 signs of tsunami

17
in the community. The endline survey asked several questions related to people’s perceptions on the need for disaster risk reduction. Although there is no baseline to which endline data can be compared, the endline results are nonetheless very encouraging. For example, more than 90%15 off the total population of the intervention areas responded that every household needs to be involved in DRR and DRR related activities. Only 8.2% of household think that there is no need for disaster preparation.
Figure 5: Perception on DRR
Source: CADRE Final Evaluation Survey, 2015
In addition to perceptions, there is strong evidence that CADRE affected household behavior related to disaster preparedness. As demonstrated in the following graph, 88.2% of households have taken the proactive protective step of cleaning out drainage on their property to reduce the risk of flooding, and 80.2% of respondents reported that their household has a safety and evacuation plan in the case of emergency. Preparing with safety and evacuation equipment was practiced by the lowest percentage of the population (29%) likely due to the cost and availability of disaster preparedness equipment. Figure 6: Behavior in Household Disaster Preparedness
Source: CADRE Final Evaluation Survey, 2015
15 The evaluation could not find similar data at the baseline report.
74.9 15.4
4.1
7.2
3.4
3.6
8.2
85.8
84.6
82.7
85.1
8.9
7
14
9.2
0 10 20 30 40 50 60 70 80 90 100
No need for preparation
Every family needs to have simple safety and evacuationequiptment
Household needs to involve in DRR preparation andplannig
At least one HH member needs to learn on DRR
Every HH needs to involve in DRR
Strongly Disagree Disagree Agree Strongly Agree Not Known
80.2
29.9
33.5
52.2
78.1
88.2
83.4
0 10 20 30 40 50 60 70 80 90 100
HH has safety and evacuation plan
HH has saftety and evacuation equipment
HH stocks water
HH prepared emergency clothes
If plan to build house, perefer disatance from beach
Adjusted building and cleaned the drainage/sanitation
Has possibility of support from extended family in the event of…

18
CADRE supported BPBD to improve the capacity of teachers to disseminate DRR and CCA information to the students. CADRE conducted a series of trainings in the three districts, in collaboration with a number of government agencies, such as the Bengkulu District Office of Education, Social Welfare Department, and the Health Department. The training focused on integrating DRR/CCA topics into the current curriculum, basic first aid skills, school disaster mapping, and evacuation assistance and routes. As a result, a total of 10,402 students and 775 teachers at 49 schools received disaster preparedness training through specific skills training, disaster simulations, movies and school competitions.
Table 14: Number of teachers and student received training on DRR/CCA
No District No. of Schools
Teachers Students Male Female Male Female Total
1 Kaur 16 130 134 264 1318 1513 2831 2 Bengkulu 24 186 193 379 3060 2832 5892
3 Bengkulu Utara 9 63 69 132 823 856 1679
Total 49 379 396 775 5201 5,201 10,402 At the policy level, the project supported the establishment of Disaster Preparedness Committee within the Dinas Pendidikan/Education Services Unit of the local government. The disaster simulations facilitated in the school has also encouraged the schools to adopt specific disaster response policies, such as integrating disaster preparedness into curricula, identifying evacuation routes and safe zones, and having school wide disaster management plans. Of the 12 schools that CADRE worked with in Bengkulu city, all have identified safe zones and evacuation routes, 7 have school wide disaster response programs, and ten have integrated disaster preparedness into curricula. Key informant interview responses indicate that the CADRE school trainings will have a lasting impact on school disaster preparedness. For example, the principal of SD Negeri 10 primary school in Kaur commented that the CADRE training “made disaster management one of the management priorities in our school. We now have a designated teach for disaster related trainings…we have also mainstreamed disaster knowledge in our curricula.
Gender-Specific Outcomes
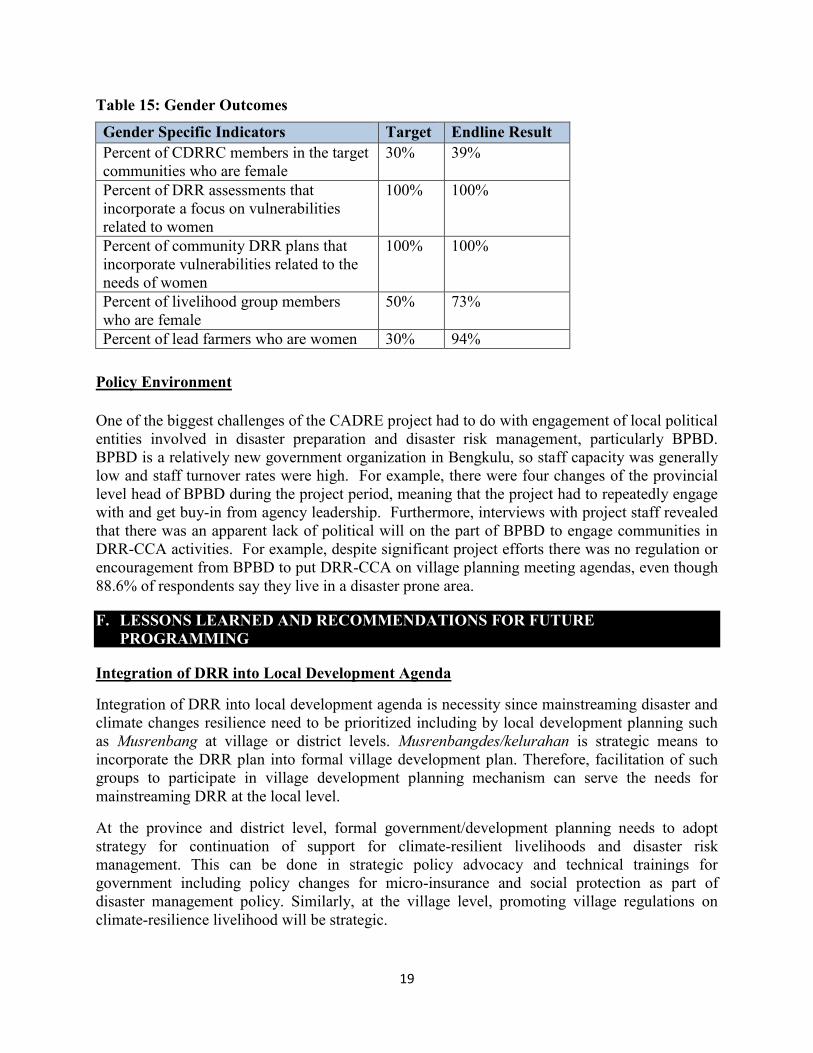
To strengthen women’s access to livelihoods and food security, the project has supported adaptive livelihoods which mostly implemented by women. The evaluation found that CADRE’s approach has proven to open access for women to engage in planning, implementation and evaluation activities of DRR/CCA. As demonstrated in the table below, CADRE met or exceed all performance indicator targets related to gender. Of particular note is that 94% of lead farmers were women, when the project initially targeted only 30%. Lead farmers are members of adaptive livelihood groups that participated in the organic farming field school, were experienced in planting vegetables using organic farming techniques and were selected by the communities to become trainers in their village. It is not clear why a strong majority of livelihood group members are female (73%) and an even stronger majority (94%) are lead farmers. However, it is clear that CADRE was successful in expanding the role of women as leaders in their communities.
19
Table 15: Gender Outcomes
Gender Specific Indicators Target Endline Result Percent of CDRRC members in the target communities who are female
30% 39%
Percent of DRR assessments that incorporate a focus on vulnerabilities related to women
100% 100%
Percent of community DRR plans that incorporate vulnerabilities related to the needs of women
100% 100%
Percent of livelihood group members who are female
50% 73%
Percent of lead farmers who are women 30% 94% Policy Environment
One of the biggest challenges of the CADRE project had to do with engagement of local political entities involved in disaster preparation and disaster risk management, particularly BPBD. BPBD is a relatively new government organization in Bengkulu, so staff capacity was generally low and staff turnover rates were high. For example, there were four changes of the provincial level head of BPBD during the project period, meaning that the project had to repeatedly engage with and get buy-in from agency leadership. Furthermore, interviews with project staff revealed that there was an apparent lack of political will on the part of BPBD to engage communities in DRR-CCA activities. For example, despite significant project efforts there was no regulation or encouragement from BPBD to put DRR-CCA on village planning meeting agendas, even though 88.6% of respondents say they live in a disaster prone area.
F. LESSONS LEARNED AND RECOMMENDATIONS FOR FUTURE PROGRAMMING
Integration of DRR into Local Development Agenda
Integration of DRR into local development agenda is necessity since mainstreaming disaster and climate changes resilience need to be prioritized including by local development planning such as Musrenbang at village or district levels. Musrenbangdes/kelurahan is strategic means to incorporate the DRR plan into formal village development plan. Therefore, facilitation of such groups to participate in village development planning mechanism can serve the needs for mainstreaming DRR at the local level.
At the province and district level, formal government/development planning needs to adopt strategy for continuation of support for climate-resilient livelihoods and disaster risk management. This can be done in strategic policy advocacy and technical trainings for government including policy changes for micro-insurance and social protection as part of disaster management policy. Similarly, at the village level, promoting village regulations on climate-resilience livelihood will be strategic.
20
Capacity Building for Village Administration
Since the new Village Law has been adopted by the government of Indonesia, there is huge potential including financial resources that have been made available to the village to support future activities on DRR and adaptive livelihoods. Hence, strengthening village administration capacity will be critically needed in the near future.
In the 2015 state budget, there has been allocation for village development budget which will be transferred from central government to village government. In 2015, a total of IDR 79.2 billion (about USD $6.3 million) is allocated for the villages in the province of Bengkulu. The villages entitled to this fund are those categorized as rural areas. Therefore, out of three project site districts, Kaur and North Bengkulu are included as recipient of the village funds. Kaur will receive a sum of IDR 11.1 billion (about USD $890,000), while North Bengkulu will receive IDR 12.5 billion (about USD $1 million) for one year period16.
Therefore, existing groups in two entitled districts can be linked with the village development fund, including integration or continuation of village disaster/contingency plan such as evacuation road and livelihoods activities. Existing community leaders and village government units can be prepared to anticipate the potential integration with the village development fund. Similarly, capacity development of village authorities to manage development funds will be necessary to ensure the effective use of these funds.
Wider Organic Farming Promotion
The project has promoted organic farming practices at the micro-level. However, large-scale transformation toward organic farming requires broader public action. Therefore, promotion of organic farming needs to be leveraged through broader changes including political support. Advocacy for adoption of local regulations (Peraturan Daerah) on organic farming practices will support broader transformation of heavy use of chemical agricultural inputs toward more sustainable agriculture practices.
Adaptive Livelihoods and Leverage Production and Marketing
The project has supported various adaptive livelihoods but there is common support delivered by the project. The potential of villages are different, and therefore participatory commodity/livestock will lead to identification of local potential in participatory way. This may require flexibility design of the project, which give rooms for variety of livelihoods interventions.
The project facilitated entrepreneurship training but not for all participating groups. In future programs, entrepreneurship skills need to be strengthened in order to leverage the productive capacity of women and community groups. Simultaneously, financial management 17 can be strengthened to prepare production growth. This may be supported with development of strong linkage to the traditional banking sector to provide financial services such as credit to support the productive capacity of the groups.
16 Ministry of Finance (2015) Village Fund allocation for District 2015. 17 This has been initiated in some groups.
21
CADRE has initiated the process of formation of a cooperative called Pre-Cooperative Group which involves government extension workers. However, these were not evenly applied in each villages. Building cooperatives could be a strategic initiative for graduating household beneficiaries to be more economically independent.
Capacity Building for Community Facilitators
The role of community self-help groups is important in community empowerment. Therefore, working through enhanced community groups will enable more sustainable project interventions. Community groups may be supported with strategic plan, organizational building, group leadership trainings and enhanced facilitation skills among group leaders.
22
References
Armis, R. (2013) Performance of Transportation Network for Pedestrian Evacuation in Tsunami Disaster. Case Study: City of Bengkulu. Thesis Prodi PWK SAPPK ITB & Ritsumeikan University.
Badan Ketahanan Pangan (2013). Meeting Note of Coordination Evaluation of Food Security Program in Bengkulu, 15 April 2013.
BNPB (2013) Indonesia Disaster Index. Jakarta: BNPB.
BPS (2014a) Berita Resmi Statistik Bengkulu: Keadaan Ketenagakerjaan Februari 2014.
BPS (2014b) Berita Resmi Statistik Bengkulu: Pertumbuhan Ekonomi Provinsi Bengkulu Tahun 2013.
Gizew, A. (2013) Determinants of Market Supply of Vegetables: A Case of Akaki-Kality Sub-City, Ethiopia. Journal of Rural Development, Vol. 32, No. (3) pp. 281 – 290.
Guilford, J.P. and B. Fruchter, 1973. Fundamental Statistics in Psychology and Education. 5th Edn.,McGraw-Hill Book Company, New York.
IPCC (2007). Climate Change 2007, IPCC Fourth Assessment Report. www.ipcc.ch UNDP – BNPB (2009) Lesson Learned: Disaster Management Legal Reform, The Indonesian Experience. Jakarta: UNDP – BNPB.
Mitchell, T., Van Aalst, M., & Silva Villanueva, P. (2010). Assessing progress on integrating disaster risk reduction and climate change adaptation in development processes.
Natawidjadja, D.H. (2015) The Sundaland plate boundary: earthquakes, volcanoes and gold. Abstract for Forthcoming July 2015 Asia Oceania Geosciences Society, 12th Conference. Available at: http://www.asiaoceania.org/aogs2015/doc/lecturers/SL/SE/SE2/SE2_Danny_Hilman_Natawidjaja_Abs.pdf
Twigg, J. (2004) Disaster Risk Reduction, Mitigation and Preparedness in Development and Emergency Programming. HPN Good Practice Review 9. London: ODI
UNDP – BNPB (2009) Lesson Learned: Disaster Management Legal Reform, The Indonesian Experience. Jakarta: UNDP – BNPB.
Müller, A. (2009). Benefits of organic agriculture as a climate change adaptation and mitigation strategy in developing countries. Discussion Paper Series. EFD and Resources for the Future. http://www.ifr.ac.uk/waste/Reports/BenefitsOfOrganicAgriculture.pdf
23
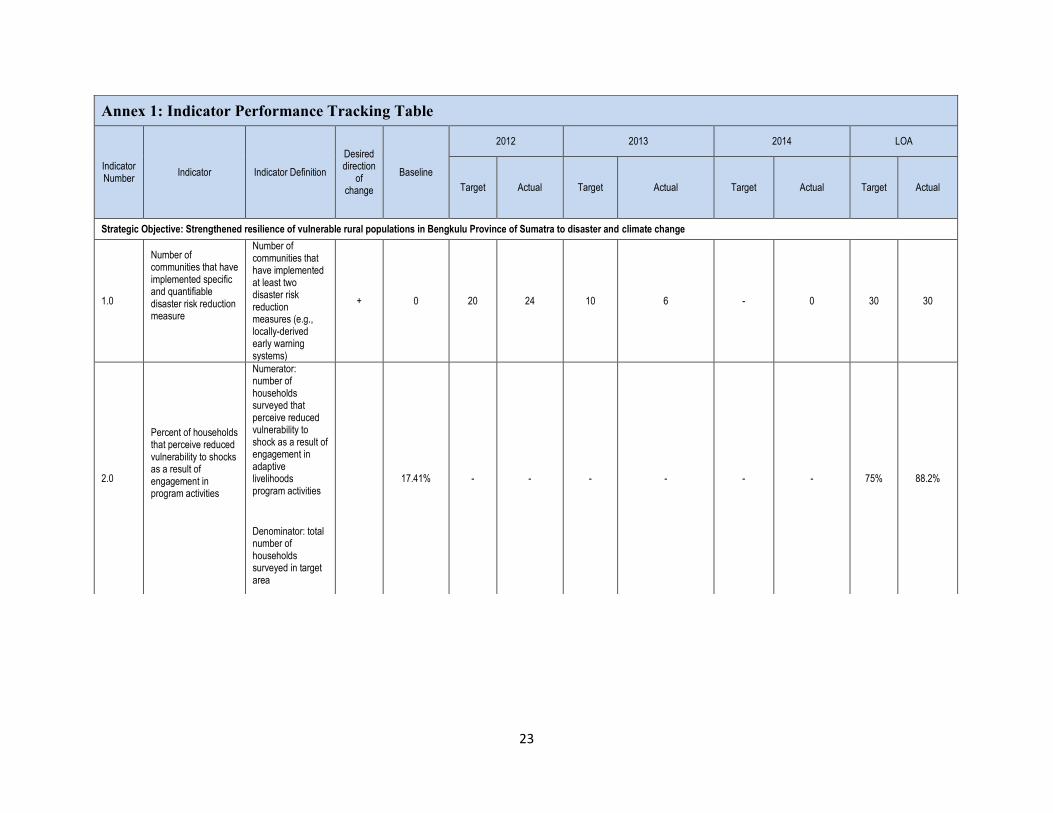
Annex 1: Indicator Performance Tracking Table
Indicator Number
Indicator Indicator Definition
Desired direction
of change
Baseline
2012 2013 2014 LOA
Target Actual Target Actual Target Actual Target Actual
Strategic Objective: Strengthened resilience of vulnerable rural populations in Bengkulu Province of Sumatra to disaster and climate change
1.0
Number of communities that have implemented specific and quantifiable disaster risk reduction measure
Number of communities that have implemented at least two disaster risk reduction measures (e.g., locally-derived early warning systems)
+ 0 20
24
10 6 - 0 30 30
2.0
Percent of households that perceive reduced vulnerability to shocks as a result of engagement in program activities
Numerator: number of households surveyed that perceive reduced vulnerability to shock as a result of engagement in adaptive livelihoods program activities
Denominator: total number of households surveyed in target area
17.41% - - - - - - 75% 88.2%

24
3.0
Percent of households that have made changes in their lives or livelihoods to improve readiness and reduce their risk to disaster and climate change
Numerator: number of households surveyed that have made at least two changes in lives or livelihoods to improve readiness/reduce risk
Denominator: total number of households surveyed in target area
+ 9.20% - - - 50% 74.95%
Intermediate Result (IR) 1 Strengthened institutional capacity for disaster and climate change management
1.0.1
Percent of village disaster risk reduction (DRR) planning exercises with BPBD (the regional disaster management body) involvement
Numerator: total number of village DRR planning exercises in which BPBD is actively involved in facilitating the exercise
Denominator: total number of village DRR planning exercises in target communities
+ 0 20% 0 40% 10% 50% 30% 50% 46%
1.0.2
Number of non-project villages where project interventions are replicated or planned for by the district BPBDs
Number of villages not directly receiving project assistance that have implemented DRR activities directly resulting from capacity building at the district level
+ 0 1 0 2 3 -
-
2 3
1.1.1
Number of community disaster risk reduction committees (C/DRRCs) formed
Total number of C/DRRCs formed in the target districts as a result of project intervention
+ 0 15 29 15 3 - 0 30 32

25
1.1.2
Number of BPBDs with strategic plans developed, and with staff trained in community-based disaster risk management (CBDRM)
Total number of BPBDs that, as a result of project activities, have developed strategic plans, and have at least 50% of staff trained in CBDRM
+ 0 2 1 1
2
-
0
3 3
1.1.3
Percent of C/DRRC members receiving capacity strengthening training on core competencies
Numerator: total number of C/DRRC members who have been trained on core competencies (e.g., vulnerability mapping, development of DRR plans)
Denominator: total number of C/DRRC members in target communities
+ 0 50% 31% 75%
100%
100%
100%
100%
100%
1.1.4
Percent of C/DRRC members in the target communities who are female
Numerator: number of C/DRRC members in target villages who are female
Denominator: total number of C/DRRC members in target communities
+ 0 20% 39% 25% - 30% - 30% 39%
LR 1.2 Vulnerabilities mapped and compiled
1.2.1
Number of village DRR mapping assessments conducted
Total number of village DRR mapping assessments conducted in target areas that are the direct result of project intervention
+ 0 15
26
15
4
-
0
30 30
26
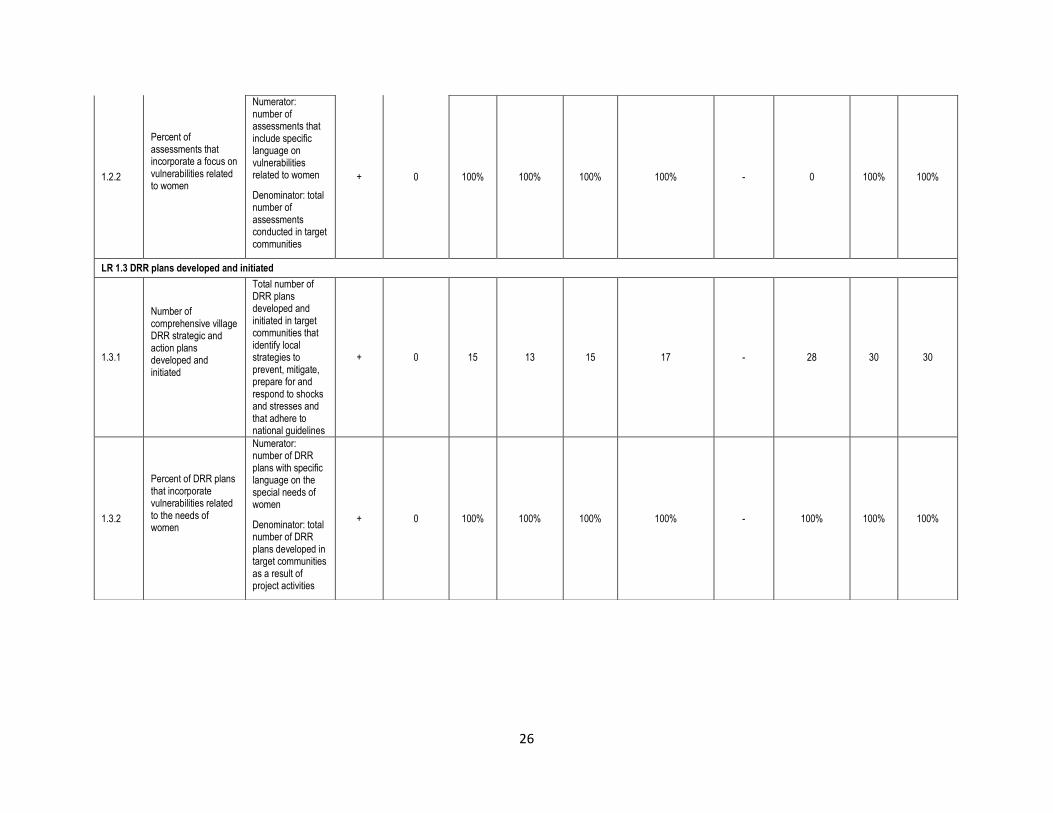
1.2.2
Percent of assessments that incorporate a focus on vulnerabilities related to women
Numerator: number of assessments that include specific language on vulnerabilities related to women
Denominator: total number of assessments conducted in target communities
+ 0 100% 100% 100% 100% - 0 100%
100%
LR 1.3 DRR plans developed and initiated
1.3.1
Number of comprehensive village DRR strategic and action plans developed and initiated
Total number of DRR plans developed and initiated in target communities that identify local strategies to prevent, mitigate, prepare for and respond to shocks and stresses and that adhere to national guidelines
+ 0 15 13 15 17 - 28 30 30
1.3.2
Percent of DRR plans that incorporate vulnerabilities related to the needs of women
Numerator: number of DRR plans with specific language on the special needs of women
Denominator: total number of DRR plans developed in target communities as a result of project activities
+ 0 100%
100%
100% 100% - 100% 100% 100%

27
1.3.3
Percent of DRR plans that include adaptive feedback mechanisms
Numerator: number of DRR plans that have language included in the plan that allow for modification based on lessons learned and changing needs
Denominator: total number of DRR plans developed in target communities as a result of project activities
+ 0 80% 100% 90% 100% 100% 100% 100% 100%
IR 2 Reduced exposure and vulnerability through adapted livelihoods
2.0.1
Percent of farmers that have implemented adaptive strategies for reduced exposure
Numerator: number of farmers surveyed who have implemented at least two adaptive strategies for reduced exposure to risk
Denominator: total number of farmers surveyed
+ 18% - - - 75% 52.3%
LR 2.1 Adaptive livelihood groups formed
2.1.1
Number of adaptive livelihood groups formed
Total number of livelihood groups formed in target communities as a result of project activities
+ 0 20 17 10 9 - 21 30 49
2.1.2 Percent of livelihood group members who are female
Numerator: number of livelihood group members who are female
Denominator: total membership of livelihood groups formed as a result of project activities
+ 0 30% 63% 40% 59% 50%
94%
50% 73%

28
LR 2.2 Training and assistance for adaptive livelihoods supported
2.2.1 Number of farmers trained in adaptive techniques
Total number of farmers trained in adaptive techniques (e.g., use of improved seeds, permaculture)
+ 0 125 26 125 380 50 691 300 691
2.2.2 Percent of lead farmers who are women
Numerator: number of lead farmers in target communities who are female
Denominator: total number of lead farmers in target communities
+ 0 10% 0 20% 94% 30% 0 30% 94%
LR 2.3 Access to capital for adaptive livelihoods increased
2.3.1
Number of famers who have accessed seed capital for adaptive livelihood enterprises
Total number of farmers who have accessed seed capital for the purpose of implementing approved adaptive livelihood enterprises
+ 0 50 0 50 380 50 717 150 717
2.3.2
Amount of capital leveraged within communities for the purposes of adaptive livelihoods
Total amount of capital originating from communities as match for project funds, used for the purposes of adaptive livelihood enterprises
+ 0 $20,000 $20,000 $60,000 $14.880 $90,000 $22,196 $90,000 $56,996
IR 3 Improved practices of communities through knowledge and education
3.0.1
Number of villages that have conducted disaster simulation exercises
Total number of villages in target communities that have conducted disaster simulation exercises more than once annually
+ 0 12
0
24 14 30 77 30 77

29
3.0.2
Percent of households with at least one specific planned response in the event of a disaster
Numerator: total number of households surveyed that report having at least one plan in place in the event of a disaster
Denominator: total number of households surveyed
+
Bengkulu City: 20.61%
North Bengkulu: 22.22%
Kaur: 60.98%
- - - 50%
Bengkulu City: 99.6%
North Bengkulu:
100%
Kaur: 100%
Overall: 99.75%
LR 3.1 Improved dissemination and education on DRR
3.1.1
Percent of households that have received at least two visits per year for the purposes of DRR education
Numerator: number of households surveyed that have received at least two visits per year for the purposes of DRR education
Denominator: total number of households surveyed in target communities
+
Bengkulu City:1.15%
North Bengkulu:
0%
Kaur: 12.20%
- - - 80% 93.48%
3.2.1
Percent of community members who can describe at least two vulnerability factors to climate change/disaster and two ways to reduce their risk
Numerator: number of community members surveyed who can identify at least two vulnerability factors to climate change/disaster and two ways to reduce their risk to these factors
Denominator: total number of community members surveyed
+ 5% - - - 75% 46.7%

30
3.2.2
Percent of community members who can describe at least two storm/tsunami early warning signals and correctly describe at least one appropriate response to each signal
Numerator: number of community members surveyed who can describe at least two storm/tsunami early warning signals and at least one appropriate response to each signal
Denominator: total number of community members surveyed
+ 23.53% - - - 75% 74.5%
3.2.3
Number of educational and/or entertainment activities undertaken to increase knowledge of early warning response
Total number of education-focused and educational entertainment activities (e.g., traditional theatre) in target communities to increase knowledge of early warning response
+ 0 20 0 20 204 20 273 60 477
31
Annex 2: Case Studies on Adaptive Livelihoods
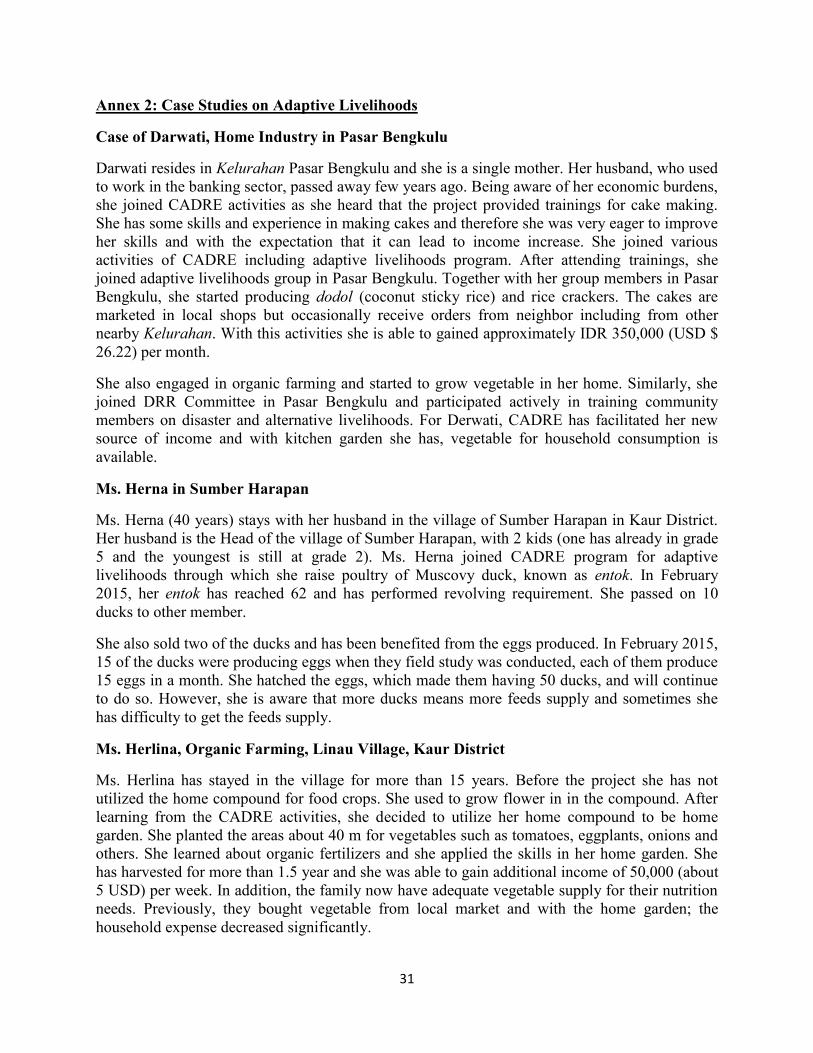
Case of Darwati, Home Industry in Pasar Bengkulu
Darwati resides in Kelurahan Pasar Bengkulu and she is a single mother. Her husband, who used to work in the banking sector, passed away few years ago. Being aware of her economic burdens, she joined CADRE activities as she heard that the project provided trainings for cake making. She has some skills and experience in making cakes and therefore she was very eager to improve her skills and with the expectation that it can lead to income increase. She joined various activities of CADRE including adaptive livelihoods program. After attending trainings, she joined adaptive livelihoods group in Pasar Bengkulu. Together with her group members in Pasar Bengkulu, she started producing dodol (coconut sticky rice) and rice crackers. The cakes are marketed in local shops but occasionally receive orders from neighbor including from other nearby Kelurahan. With this activities she is able to gained approximately IDR 350,000 (USD $ 26.22) per month.
She also engaged in organic farming and started to grow vegetable in her home. Similarly, she joined DRR Committee in Pasar Bengkulu and participated actively in training community members on disaster and alternative livelihoods. For Derwati, CADRE has facilitated her new source of income and with kitchen garden she has, vegetable for household consumption is available.
Ms. Herna in Sumber Harapan
Ms. Herna (40 years) stays with her husband in the village of Sumber Harapan in Kaur District. Her husband is the Head of the village of Sumber Harapan, with 2 kids (one has already in grade 5 and the youngest is still at grade 2). Ms. Herna joined CADRE program for adaptive livelihoods through which she raise poultry of Muscovy duck, known as entok. In February 2015, her entok has reached 62 and has performed revolving requirement. She passed on 10 ducks to other member.
She also sold two of the ducks and has been benefited from the eggs produced. In February 2015, 15 of the ducks were producing eggs when they field study was conducted, each of them produce 15 eggs in a month. She hatched the eggs, which made them having 50 ducks, and will continue to do so. However, she is aware that more ducks means more feeds supply and sometimes she has difficulty to get the feeds supply.
Ms. Herlina, Organic Farming, Linau Village, Kaur District
Ms. Herlina has stayed in the village for more than 15 years. Before the project she has not utilized the home compound for food crops. She used to grow flower in in the compound. After learning from the CADRE activities, she decided to utilize her home compound to be home garden. She planted the areas about 40 m for vegetables such as tomatoes, eggplants, onions and others. She learned about organic fertilizers and she applied the skills in her home garden. She has harvested for more than 1.5 year and she was able to gain additional income of 50,000 (about 5 USD) per week. In addition, the family now have adequate vegetable supply for their nutrition needs. Previously, they bought vegetable from local market and with the home garden; the household expense decreased significantly.

32
Annex 3: Scope of Work of the Evaluation
Scope of Work
Final Evaluation of the USAID-funded Cross Sectoral Strategies for Climate Change and Disaster Risk Reduction (CADRE) Program
I. Background
Funded by the United States Agency for International Development (USAID), the Cross Sectoral Strategies for Climate Change and Disaster Risk Reduction (CADRE) in Indonesia presents a strategic collaboration between Project Concern International (PCI), KabaHill Centre, universities, consultants, local communities and government to address the needs of 30 communities in three districts – Bengkulu City, North Bengkulu and Kaur – corresponding to an estimated 35,000 people in Bengkulu Province, one of the most disaster-prone provinces in the country. Specifically, the project seeks to achieve strengthened resilience of vulnerable populations in Bengkulu Province to disaster and climate change. This will be achieved through the following three intermediate results:
IR 1. Strengthened institutional capacity for disaster and climate change management.
PCI will build the capacity of three district disaster management bodies (BPBDs) and facilitate the formation of 30 Community Disaster Risk Reduction Committees (C/DRRCs) to assess and map risks, develop and initiate Disaster Risk Reduction action plans. By the end of the project, these committees will have been formed, risks mapped and quantifiable achievements made against their action plans.
IR 2. Reduced exposure and vulnerability through adaptive livelihoods.
The project will directly support rural households affected by disaster and climate change to proactively begin to adapt livelihoods (i.e. incorporation of crops and methods that build resiliency to disaster and climate change). This will be achieved through the formation of 30 adaptive livelihood groups of 300-450 farmers who will be trained in the principles of permaculture and provided with technical assistance to access capital. By the end of the project it is expected that at least 75% percent of participants will be incorporating adaptive methods into their livelihoods with more than $90,000 leveraged in capital to support these activities.
IR 3. Improved disaster preparedness practices of communities through knowledge and
education. The project will improve knowledge and education among targeted communities in several disaster preparedness competencies, including early warning readiness and disaster preparation and response. PCI utilizes a variety of education and knowledge building activities including community radio, home visits, traditional theatre, art and other forms of community education. By the end of the project, all communities will have developed community-based early warning systems, conducted drills and simulations, and at least 50% of households will have a planned response in case of a disaster.
33
In summary, key intervention areas are the following:
DRR capacity building at the community, government and school level, including the formation of C/DRRC at the village level
Information dissemination through various channels, including social group activities, religious leaders, school-based activities, and radio
DRR practices through the development of early warning systems and disaster simulations
Permaculture training and Farmer Field Schools Small economic development activities for alternative livelihoods such as food
processing, livestock, and catfish breeding Advocacy and networking with stakeholders through coordination meetings, seminars
and workshops with government agencies, universities, and local entrepreneurs
The program started effectively during the first quarter of 2012 and will end in March 2015. To measure the program’s impact and potential for sustainability, there is a need to carry out a final program evaluation.
II. Objective of Evaluation
This evaluation shall address the achievement of the program’s goal to strengthen resilience of rural communities to natural disasters in three districts (Bengkulu City, North Bengkulu and Kaur) in Bengkulu province, and the effectiveness of the program design in achieving the program goal. The detailed project monitoring plan (PMP) with performance indicators is attached.
The following questions should serve as guidelines to help the external consultant structure data collection tools. Key performance indicators specified in the PMP should also guide the focus of the evaluation. The external consultant is expected to refine and adapt the final research questions based on consultations with the CADRE team.
2.1. Overall Program Outcomes and Impact
2.1.1. Did the program meet targets and goals related to the performance indicators defined in the Performance Monitoring and Evaluation Plan? What were the reasons that key performance targets were or were not met?
2.1.2. To what extent did the program strengthen institutional capacity for disaster and climate change management among BPBDs and C/DRRCs? What have BPBDs and C/DRRCs achieved as a result of increased capacity? Specify how BPBDs are actively involved in community DRR, how the CADRE program facilitated linkages between the BPBDs and communities, and extent to which BPBD/village linkages were expanded to non-intervention communities
2.1.3. To what extent was the program able to reduce exposure and vulnerability to disaster by increasing technical knowledge of, adoption, and income from adaptive livelihoods? How well did the CADRE program promote positive behavior change in adaptive technologies and to what extent were these technologies adopted?
34
2.1.4. Quantify the economic impact of adaptive livelihood activities in terms of income generated and money saved.
2.1.5. To what extent did the program improve disaster preparedness practices among targeted communities through knowledge and education? What specific knowledge was gained and how was that knowledge used and shared?
2.1.6. To what extent did program interventions impact women beneficiaries in addressing gender-specific needs to climate change adaptation (CCA)? How did these interventions help women respond to shocks and stresses to mitigate their risks?
2.3. Relevance of the Design and Program Coverage
2.3.1. Was the program design relevant to the targeted beneficiaries? What are the key determining factors that make this program design relevant?
2.3.2. What components of the project design had a positive impact on DRR and CCA, and what components had little/no impact or could have been improved? Components include: community mobilization, constitution of DRM committees, approach to adaptive livelihoods, linking groups with other stakeholders, partner performance, and technical service provision to groups
2.3.3. How well was the program designed to improve government capacity building and linkages to community DRR? Quantify increased government capacity and linkages.
2.3.4. Is the program design replicable and scalable? If so, what factors will determine where this program can or cannot be replicated and scaled?
2.4. Sustainability
2.4.1. Are the groups formed during the program (DRR groups, Livelihood groups, and organic farming groups) functioning independently?
2.4.2. Have the above mentioned groups formed linkages to the available institutional and financial resources? If linkages have been formed with available resources, what outcomes have been generated, and are the linkages sustainable?
2.4.3. Have beneficiaries created any innovations based on the adaptive livelihood trainings that could make them more sustainable?
2.4.4. Did the adoption of adaptive livelihoods have any negative impacts that would affect their sustainability?
2.4.5. What is the current policy environment influencing the likelihood of sustainability for these groups?
2.4.6. Has the program created any “champions” who can continue to lead the process of developing resilient communities?
Through the process of responding to the research questions, the external evaluation consultant is expected to identify lessons learned, challenges and unexpected results to provide concrete
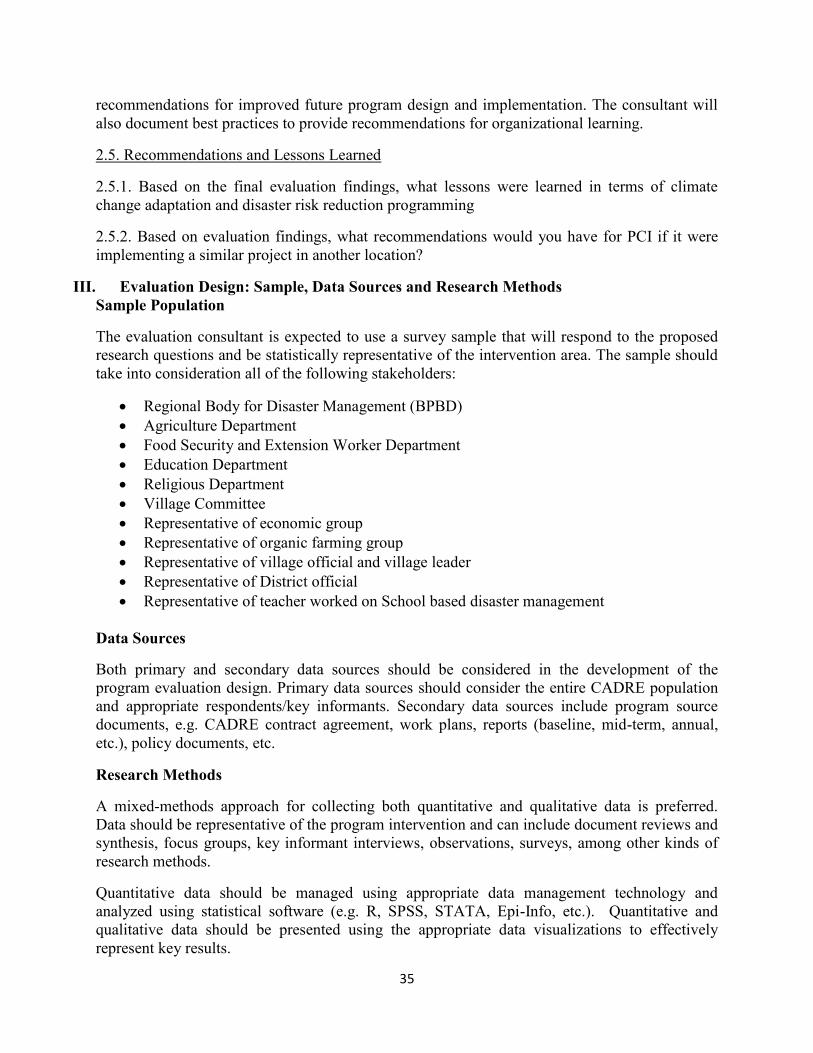
35
recommendations for improved future program design and implementation. The consultant will also document best practices to provide recommendations for organizational learning.
2.5. Recommendations and Lessons Learned
2.5.1. Based on the final evaluation findings, what lessons were learned in terms of climate change adaptation and disaster risk reduction programming
2.5.2. Based on evaluation findings, what recommendations would you have for PCI if it were implementing a similar project in another location?
III. Evaluation Design: Sample, Data Sources and Research Methods Sample Population
The evaluation consultant is expected to use a survey sample that will respond to the proposed research questions and be statistically representative of the intervention area. The sample should take into consideration all of the following stakeholders:
Regional Body for Disaster Management (BPBD) Agriculture Department Food Security and Extension Worker Department Education Department Religious Department Village Committee Representative of economic group Representative of organic farming group Representative of village official and village leader Representative of District official Representative of teacher worked on School based disaster management
Data Sources
Both primary and secondary data sources should be considered in the development of the program evaluation design. Primary data sources should consider the entire CADRE population and appropriate respondents/key informants. Secondary data sources include program source documents, e.g. CADRE contract agreement, work plans, reports (baseline, mid-term, annual, etc.), policy documents, etc.
Research Methods
A mixed-methods approach for collecting both quantitative and qualitative data is preferred. Data should be representative of the program intervention and can include document reviews and synthesis, focus groups, key informant interviews, observations, surveys, among other kinds of research methods.
Quantitative data should be managed using appropriate data management technology and analyzed using statistical software (e.g. R, SPSS, STATA, Epi-Info, etc.). Quantitative and qualitative data should be presented using the appropriate data visualizations to effectively represent key results.

36
IV. Duration of the Evaluation The overall timeline for the evaluation will be from February to March 2015. This includes the submission of the final report to PCI. The expected level of effort (LOE) in days is as follows:
No Item Time
1 Document Review for Evaluation Study Design 3
2 Submission of Final Study Design, including the sampling strategy, methodology(ies) to be utilized, analysis plans, and proposed work plan/timeline of key evaluation activities and deliverables (must be approved by PCI)
1
3 Data collection tools development, including validation testing 4
4 Field data administration 10
5 Data entry, cleaning and analysis 4
6 Presentation of key findings 1
7 Draft Report 8
8 Final Report (must be approved by PCI) 5
Timeline
Task Dates Desk study: 3-5 February Preparation and travel 7 February Data collection 8-22 February Final Report Outline 20 February Data Collection Process Review 22 February Internal Data Quality Assessment 22 February Data compilation 23-24 February Draft report/Initial debrief 25 February Report writing 26 Feb – 5 March Draft Report send 5 March Feedback 11 March Final Report 16 March
V. Deliverables
The evaluation team is expected to deliver following items:
Evaluation study design, including the sampling strategy, data collection protocol, and analysis plans
Data collection tools/instruments Work plan for the evaluation, including specific dates for submission of key deliverables Raw and cleaned data in MS Excel format

37
Data analysis outputs, including scripts for any quantitative analyses conducted with statistical software
Outline detailing final report sections Documented case studies and success stories focused on adaptive livelihoods, BPBD
involvement in communities, disaster awareness and preparation, to be included in the final report
Draft evaluation report Final draft evaluation report Short presentation in MS PowerPoint or similar program on key finding to PCI staff
All of the listed deliverables must be approved by PCI prior to administration.
Note that the final evaluation report should have the following composition and should be no longer than 30 pages, excluding annexes:
Cover page List of abbreviations Executive summary (1-2 pages maximum) Program background Evaluation objectives Evaluation methodology Evaluation Results (including successes and challenges) Finalized Indicator Performance Tracking Table (IPTT) Success stories Lessons Learned Recommendations Conclusions Annexes (raw data, photos, charts, graphs)

38
Annex 4: Final Evaluation Schedule
Date Activity 9 – 10 Feb Preparation
Instrument Development Coaching Instrument Pre-Test
11 Feb Briefing With Enumerator Attend Meeting Committee Meeting Pasar Bengkulu (Observation and Interview PO and MPA)
12 – 15 Feb Interviews, FGDs and Questionnaire Data Collection in Bengkulu City 16 -18 Feb Interviews, FGDs and Questionnaire Data Collection in North Bengkulu 19 – 22 Feb Interviews, FGDs and Questionnaire Data Collection in Kaur 23-24 Feb Data Analysis and Consolidation
25/27 Feb Debriefing with PCI
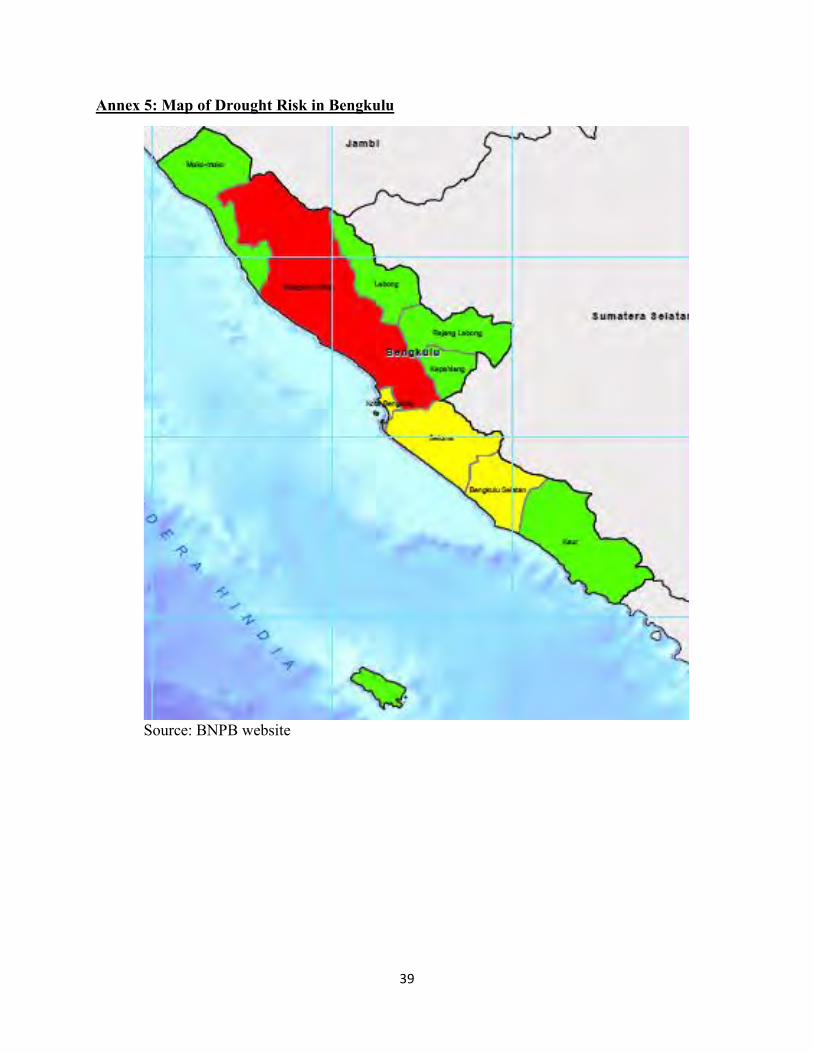
39
Annex 5: Map of Drought Risk in Bengkulu
Source: BNPB website
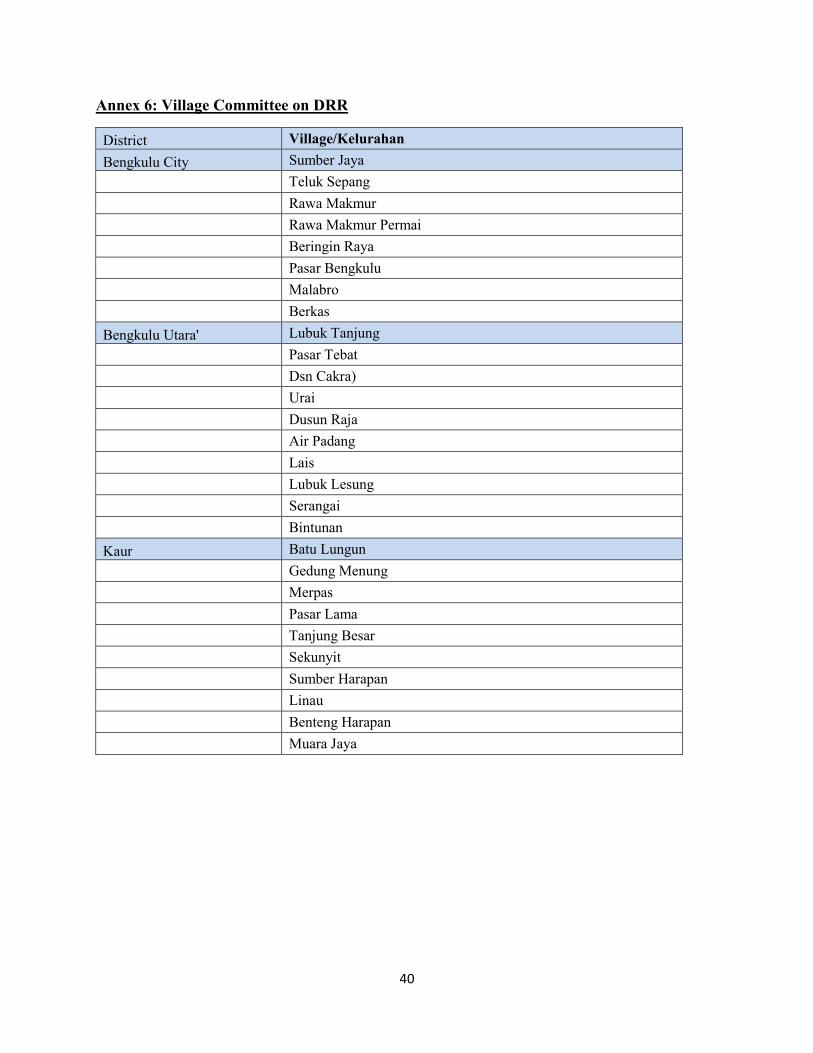
40
Annex 6: Village Committee on DRR
District Village/Kelurahan Bengkulu City Sumber Jaya Teluk Sepang Rawa Makmur Rawa Makmur Permai Beringin Raya Pasar Bengkulu Malabro Berkas Bengkulu Utara' Lubuk Tanjung Pasar Tebat Dsn Cakra) Urai Dusun Raja Air Padang Lais Lubuk Lesung Serangai Bintunan Kaur Batu Lungun Gedung Menung Merpas Pasar Lama Tanjung Besar Sekunyit Sumber Harapan Linau Benteng Harapan Muara Jaya
41
Annex 7: FGD Participants List
FGD IN DESA BERKAS
14 FEBRUARY 2015
No Name Village 1 Suniati Berkas 2 Rahmania Berkas 3 Seri hartati Berkas 4 Eriyanti Berkas 5 Tita Berkas 6 Suryanti Berkas 7 Dewi Berkas 8 Yeni Berkas
FGD IN PASAR TEBAT
18 February 2015
No Name Village 1 Susilianti Pasar tebat 2 Almi Pasar tebat 3 Rohana Pasar tebat 4 Gadis Pasar tebat
FGD IN LUBUK TANJUNG
18 February 2015
No Name Village 1 Biis mardini Lubuk tanjung 2 Rika herlina Lubuk tanjung 3 Yuliana Lubuk tanjung 4 Jhon riadi Lubuk tanjung 5 Teten Lubuk tanjung 6 Yanti Lubuk tanjung 7 Sri Lubuk tanjung
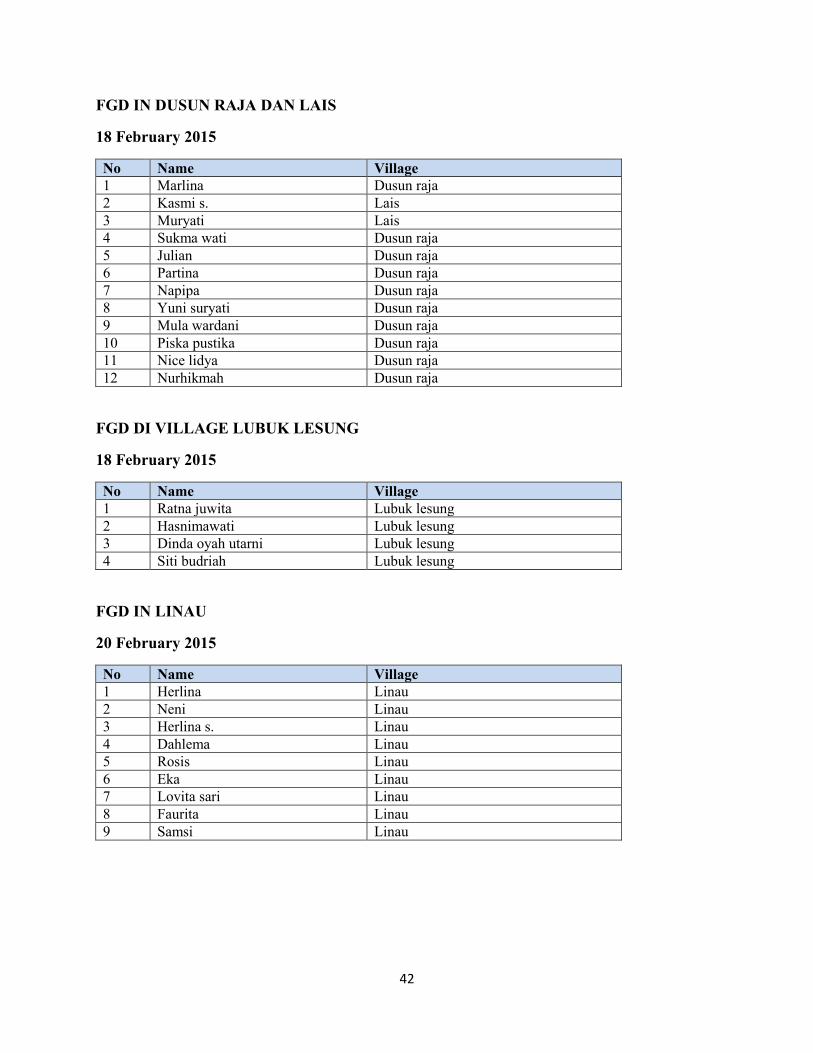
42
FGD IN DUSUN RAJA DAN LAIS
18 February 2015
No Name Village 1 Marlina Dusun raja 2 Kasmi s. Lais 3 Muryati Lais 4 Sukma wati Dusun raja 5 Julian Dusun raja 6 Partina Dusun raja 7 Napipa Dusun raja 8 Yuni suryati Dusun raja 9 Mula wardani Dusun raja 10 Piska pustika Dusun raja 11 Nice lidya Dusun raja 12 Nurhikmah Dusun raja
FGD DI VILLAGE LUBUK LESUNG
18 February 2015
No Name Village 1 Ratna juwita Lubuk lesung 2 Hasnimawati Lubuk lesung 3 Dinda oyah utarni Lubuk lesung 4 Siti budriah Lubuk lesung
FGD IN LINAU
20 February 2015
No Name Village 1 Herlina Linau 2 Neni Linau 3 Herlina s. Linau 4 Dahlema Linau 5 Rosis Linau 6 Eka Linau 7 Lovita sari Linau 8 Faurita Linau 9 Samsi Linau
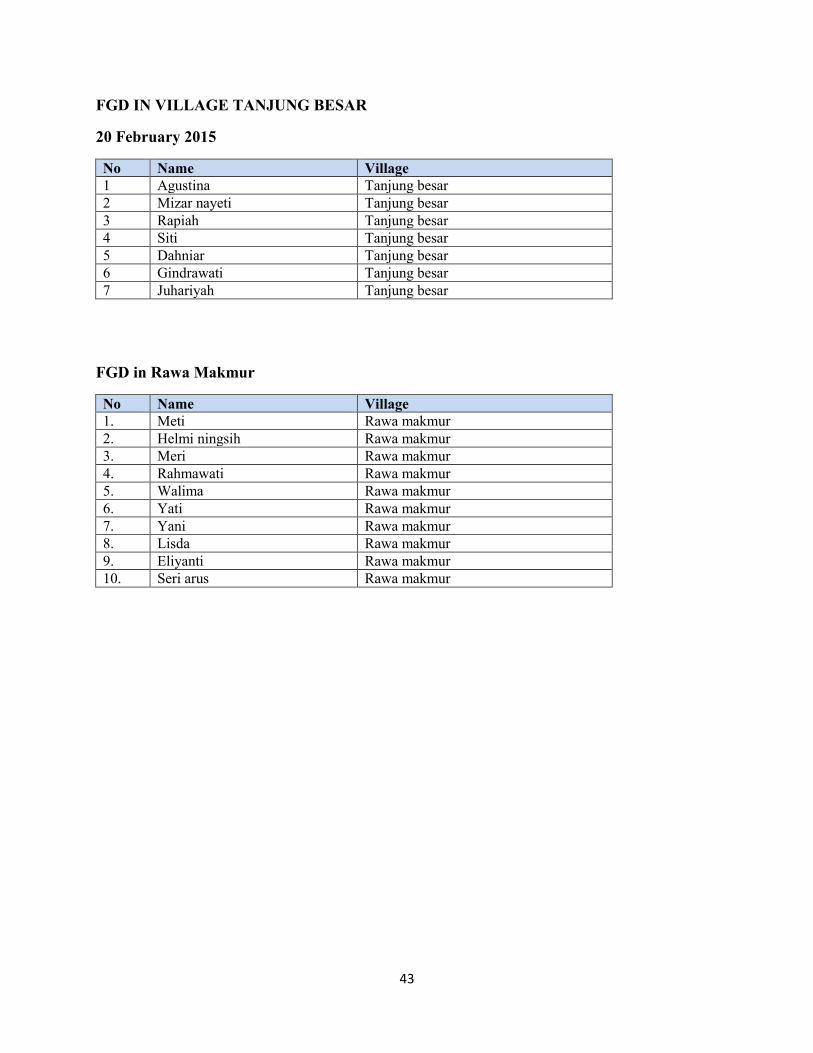
43
FGD IN VILLAGE TANJUNG BESAR
20 February 2015
No Name Village 1 Agustina Tanjung besar 2 Mizar nayeti Tanjung besar 3 Rapiah Tanjung besar 4 Siti Tanjung besar 5 Dahniar Tanjung besar 6 Gindrawati Tanjung besar 7 Juhariyah Tanjung besar
FGD in Rawa Makmur
No Name Village 1. Meti Rawa makmur 2. Helmi ningsih Rawa makmur 3. Meri Rawa makmur 4. Rahmawati Rawa makmur 5. Walima Rawa makmur 6. Yati Rawa makmur 7. Yani Rawa makmur 8. Lisda Rawa makmur 9. Eliyanti Rawa makmur 10. Seri arus Rawa makmur

44
Annex 8: Endline Questionnaire
FINAL EVALUATION CROSS SECTORAL STRATEGIES FOR CLIMATE CHANGE AND DISASTER RISK REDUCTION (CADRE) PCI
Respondent Data:
No. Ques:
Village : Sub-District:
Name of Respondent:
Date: Enumerator:
How long have stayed in the village:
Previous Village if Migrant:
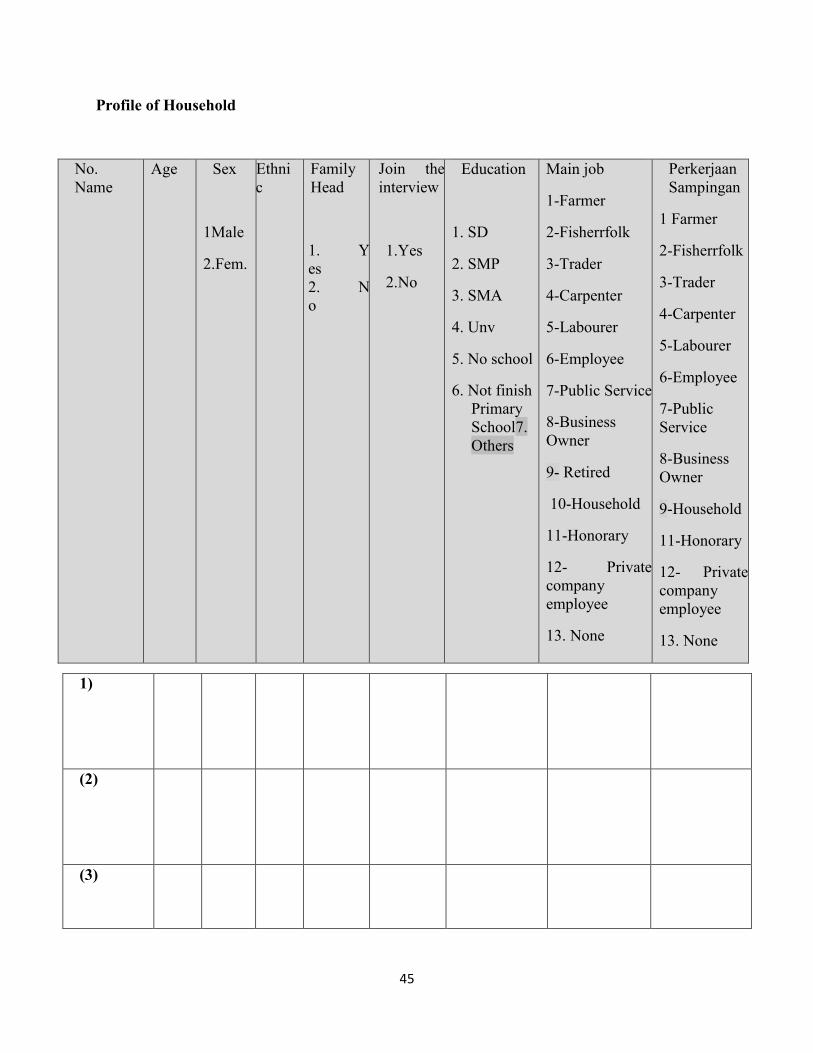
45
Profile of Household
No. Name
Age Sex
1Male
2.Fem.
Ethnic
Family Head
1. Yes 2. No
Join the interview
1.Yes
2.No
Education
1. SD
2. SMP
3. SMA
4. Unv
5. No school
6. Not finish Primary School7. Others
Main job
1-Farmer
2-Fisherrfolk
3-Trader
4-Carpenter
5-Labourer
6-Employee
7-Public Service
8-Business Owner
9- Retired
10-Household
11-Honorary
12- Private company employee
13. None
Perkerjaan Sampingan
1 Farmer
2-Fisherrfolk
3-Trader
4-Carpenter
5-Labourer
6-Employee
7-Public Service
8-Business Owner
9-Household
11-Honorary
12- Private company employee
13. None
1)
(2)
(3)

46
(4)
(5)
(6)
(7)
(8)
(9)
Total HH Members * (9)

47
Q.1 Household Characteristics and Assets
I. Housing conditions: Floor
Observation
Soil ............................................... □ 01 Wood ............................................ □ 03 Bamboo ........................................ □ 04 Cheramics .................................... □ 05 Cements........................................ □ 06 Others(mention) .......................... □ 07
II. Housing conditions: Roof
Catat Observasi
No Roof ........................................ □ 01 Leaves .......................................... □ 02 Zinc .............................................. □ 03 Cheramics .................................... □ 04 Cements........................................ □ 05 Others(mention) ............................... □ 06
III. Energy source for ccooking? Electricity ........................................ □ 01 Liquefied Petroleum Gas (LPG) ...... □ 02 Natural Gas ...................................... □ 03 Biogas .............................................. □ 04 Carosine ........................................... □ 05 Fuelwood ......................................... □ 07 Others(mention) ............................... □ 08
Q.2 FASILITY OWNED
i: Electricity 1: No 2: PLN 3: Village Electricity 4: Generator 5: Solar
ii: Water Source 1: No 2: PAM 3: Village Water 4: Well 5. Spring 6:Others
iii. Bathroom 1: No Bathrrom and Toilet 2: Has BR and Toilet 3:Just BR 4: Just Toilet
iv: Telpon atau HP 1: No 2: Yes
v: Television 1: No 2: Yes
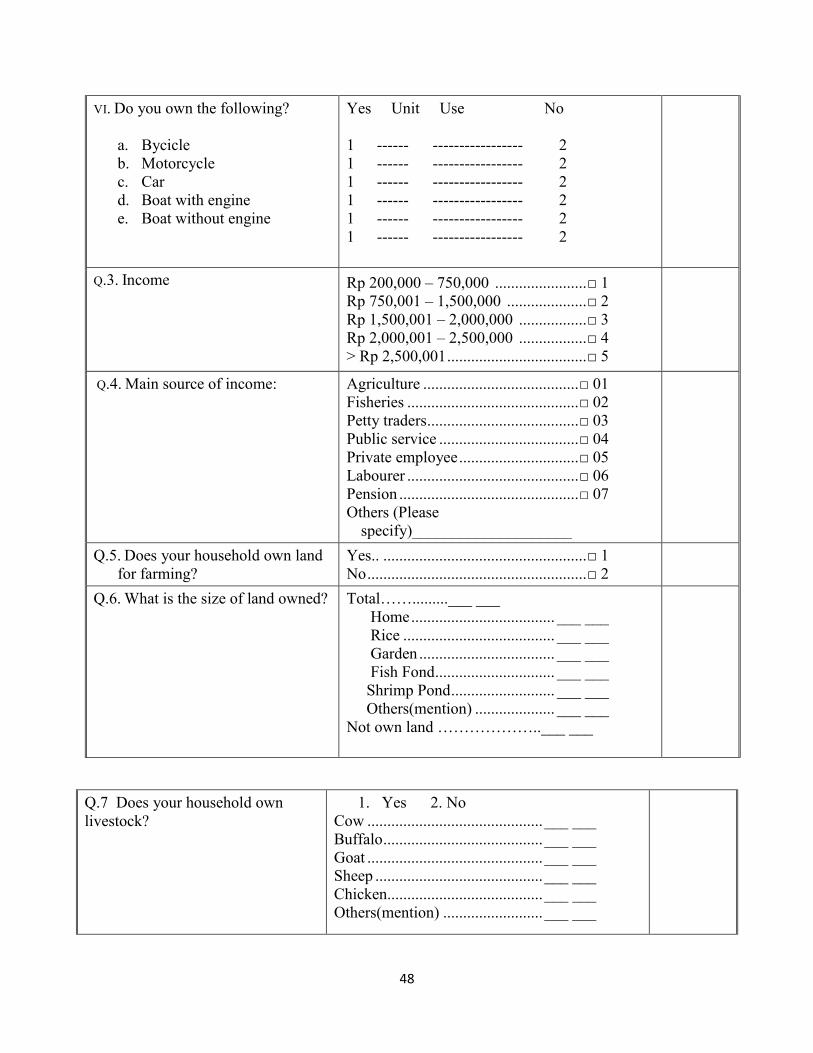
48
VI. Do you own the following?
a. Bycicle b. Motorcycle c. Car d. Boat with engine e. Boat without engine
Yes Unit Use No 1 ------ ----------------- 2 1 ------ ----------------- 2 1 ------ ----------------- 2 1 ------ ----------------- 2 1 ------ ----------------- 2 1 ------ ----------------- 2
Q.3. Income Rp 200,000 – 750,000 ....................... □ 1 Rp 750,001 – 1,500,000 .................... □ 2 Rp 1,500,001 – 2,000,000 ................. □ 3 Rp 2,000,001 – 2,500,000 ................. □ 4 > Rp 2,500,001 ................................... □ 5
Q.4. Main source of income: Agriculture ....................................... □ 01 Fisheries ........................................... □ 02 Petty traders ...................................... □ 03 Public service ................................... □ 04 Private employee .............................. □ 05 Labourer ........................................... □ 06 Pension ............................................. □ 07 Others (Please
specify)____________________
Q.5. Does your household own land for farming?
Yes.. ................................................... □ 1 No ....................................................... □ 2
Q.6. What is the size of land owned?
Total…….........___ ___ Home .................................... ___ ___ Rice ...................................... ___ ___ Garden .................................. ___ ___ Fish Fond .............................. ___ ___ Shrimp Pond .......................... ___ ___ Others(mention) .................... ___ ___ Not own land ………………..___ ___
Q.7 Does your household own livestock?
1. Yes 2. No Cow ............................................ ___ ___ Buffalo ........................................ ___ ___ Goat ............................................ ___ ___ Sheep .......................................... ___ ___ Chicken....................................... ___ ___ Others(mention) ......................... ___ ___

49
Q.8 DISASTER RISK
Q.8.1. Do you think that your residence locate in a vulnerable location?
Yes. .............................................. □ 1 No ................................................. □ 2
If Yes, what are the vulnerability factor? 1. …………………………………..
2. …………………………………..
3. …………………………………..
Q.8.2. In the last 1 year, which disasters did you encounter?
Vent Yes / No Impact
a. Earthquake b. Tsunami c. Floods d. Abrassion e. Drought f. Landslide g. Storm h. Extreme weather i. Volcano
j. House Fire k. Forest Fire l. Social conflict
Others(mention) 1. 2. 3.
Q. 8.3. Based on the above question, which disaster that you consider as the most serious impact?
1.
2.
3.
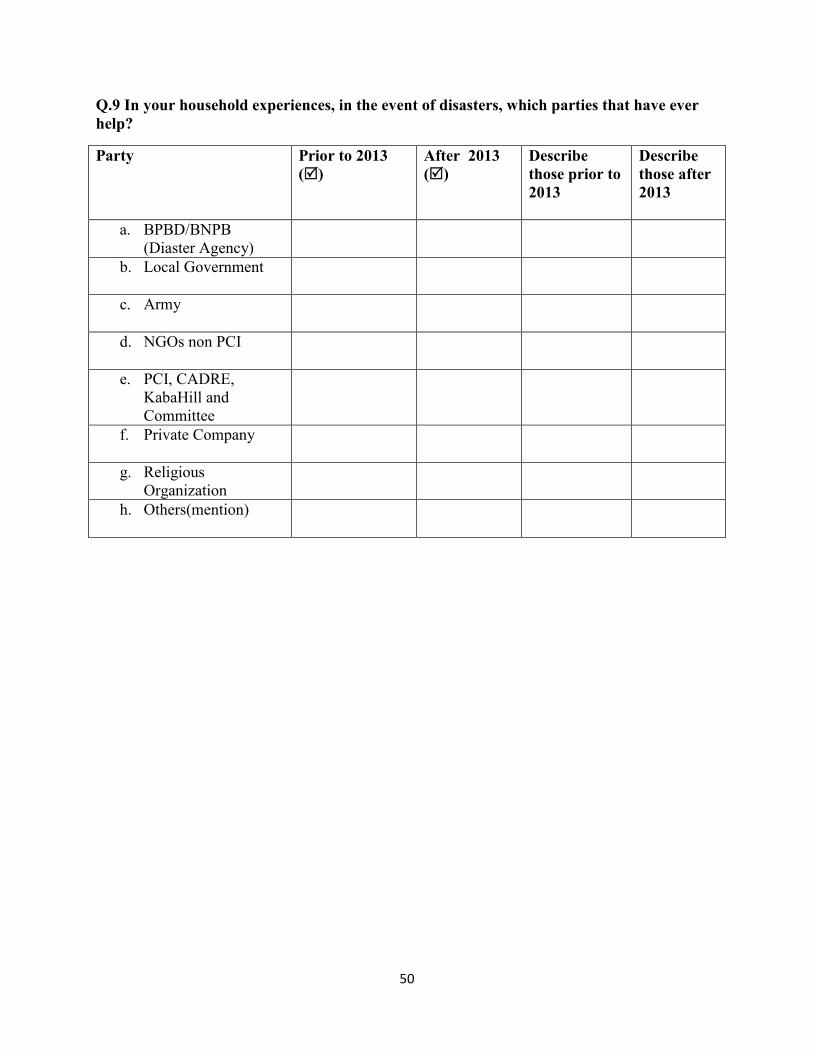
50
Q.9 In your household experiences, in the event of disasters, which parties that have ever help?
Party Prior to 2013 ()
After 2013 ()
Describe those prior to 2013
Describe those after 2013
a. BPBD/BNPB (Diaster Agency)
b. Local Government
c. Army
d. NGOs non PCI
e. PCI, CADRE, KabaHill and Committee
f. Private Company
g. Religious Organization
h. Others(mention)

51
Q.10 If you have financial difficulty, where did you get help from?
a. House damage b. Agriculture Land Damage c. Harvest failure b. Cannot fishing because of extreme weather c. Lost of livelihoods/livestock d. Finance needs f. Lainnya _________________
(1) Extended family members; (2) Neighbor; (3) Friends (4) Village official(s); (5) Adat (customary) leader;(6) Religious leader; (7) Employer; (8) Money lender (9) collector/locally known as toke; (10) bank; (11) pawner; (12) Cooperative (13)Not applicabe
1 2 3 4 5 6 7 8 9 10 11 12 13
1 2 3 4 5 6 7 8 9 10 11 12 13
1 2 3 4 5 6 7 8 9 10 11 12 13
1 2 3 4 5 6 7 8 9 10 11 12 13
1 2 3 4 5 6 7 8 9 10 11 12 13
1 2 3 4 5 6 7 8 9 10 11 12 13
1 2 3 4 5 6 7 8 9 10 11 12 13
Q.11 PARTICIPATION IN CADRE PROGRAM
i. Does your household member(s) join the CADRE PRogram?
Yes. .............................................. □ 1 No ................................................. □ 2
ii. Since when did your household member(s) join?
0 – 1 tahun ................................... □ 1 1 - 2 tahun .................................. □ 2 2 – 3 tahun ................................... □ 3

52
Q.12 Where did the HH member obtain information about disaster (mitigation, preparedness and prevention)?
Information source Prior to () After 2013 () Government Neighbour TV Radio PCI/KabaHill/Komite Newspaper Movie Others
Q.13 ATTITUDE TOWARD DISASTER
No Statement Strongly
Disagree
(1)
Disagree
(2)
Agree
(3)
Strongly
Agree
(4)
Not known
(5)
1 In a disaster, the appropriate behaviour is just waiting and no need to do preparedness/mitigation
2 Every family needs to have simple saftey and evacuation to anticipate disaster risk
3 Every member of society need to enage actively in the meetings on disaster risk reduction in their neigborhood
4 At least 1 member of HH need to learn about disaster risk and fisrt aid
5 Every member of society need to actively engage in disaster mitigation and risk reduction
Q.14 Attitude on Disaster Risk Reduction

53
No Behaviour Yes (1) No (2)
1 HH needs to have safety and evacuation plan in the event of disaster.
2 HH own their own equioment for safety and evacuation
3 HH need to store water and to prepare water (quality and quantity) in the event of disaster
4 HH need to have readiness for clothing and other personal needs prior to disaster.
5 If plan to build a house, it is better to choose location that have distance from beach and in the area of safe zones
6 Adjust building, floor and drainage
7 HH have prepared saving/insurance in the disastrous event
8 If a disaster occur, our HH has families, friends inside/outside the village to help
Q.15 Did your household member(s) participated in the following activities? (in the last 12 months)
No Participation Never Rarely
Often Always
1 Actively involve in meetings for preparation and planning on disaster risk reduction
2 Active in trainings or simulation on disaster risk reductio
3 Participate in collective action to improve drainage or sanitation for disaster risk reduction

54
4 Participate actively in building facilities related to disaster risk reduction
Q.16 Participation in Trainings/Education Activities
No Participation in Which agency?
No pernah
1 x/ tahun
2x /tahun
Lebih dari 2 x /tahun
1 Trainings on identification of vulnerability/causal factors
2
Trainings on disaster risk
3 Evacuation/Simulation training
4 Discussion on disaster risk reduction
5 Training on disaster preparedness
6 Training on alternative livelihoods (MPA)
7 Education through film and other media
Q.17. Understanding on disaster indicators
No Disaster Sign Yes (1) No (2)
1 Do you understand the sign of tsunami?
If Yes Please mention 2 signs:
1. __________________________________ 2. __________________________________
2 Do you understand the sign of floods?
If Yes Please mention 2 signs:

55
1. __________________________________ 2. __________________________________
3 Do you understand the sign of earthquake?
If Yes Please mention 2 signs:
:
1. __________________________________ 2. __________________________________
Q18. Program Impact
No Impact Indicator Yes (1) No (2)
1 Do you consider that at present HH vulnerability has decreased compare to condition 3 years ago?
2 Disaster preparedness has improved
3 Knowledge on disaster and strategies to respond enhanced?
4 Do you practice alternative livelihoods and adaptive (MPA, PO)
5 Do you think that your HH has income source in the event of disaster?
6 Do you think that DRR strategy has accommodated local custom and practices?
7 Do you think that DRR strategy has accommodated local custom and practices: mitigation?
8 Do you think that DRR strategy has accommodated local custom and practices? Preparedness
9 Our community has implemented simulation or evacuation training once in 6 months
Q19 Is there any other program impact in your areas? If yes please mention
1……………………………………………………………………………………………………
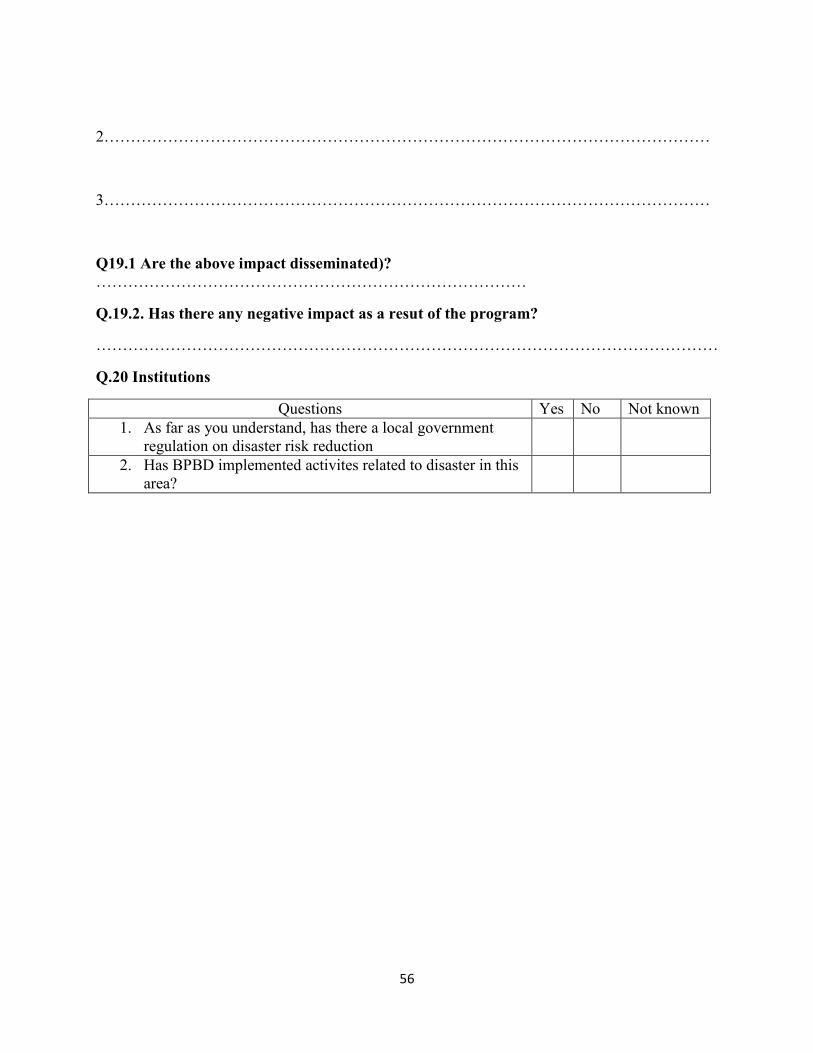
56
2……………………………………………………………………………………………………
3……………………………………………………………………………………………………
Q19.1 Are the above impact disseminated)? ………………………………………………………………………
Q.19.2. Has there any negative impact as a resut of the program?
………………………………………………………………………………………………………
Q.20 Institutions
Questions Yes No Not known 1. As far as you understand, has there a local government
regulation on disaster risk reduction
2. Has BPBD implemented activites related to disaster in this area?

57
Q.21. Committee Capacity
No Capacity Yes
(1)
No (2) No
Tahu
(3)
1. Is there a community committee for DRR and CC?
2. Has the committee implemented the following activities?
a. Training on disaster and climate changes b. Ennhance community cooperation for building
facilities related to disaster mitigation/preparedness c. Disseminate information on DRR and CC through
fim or other media d. Conduct simulation or evacuation
3 Are you a member of committee?
4 If yes, did you attend vunerability mapping training?
Did you attend training on DRR Action Planning?
Q.22 In terms of agriculture, did you apply the following agriculture techniques?
Agriculture Technology Prior to 2013()
After 2013 ()
Describe prior to 2013
Describe after 2013
1. Use of HYV 2. Use of local seeds that are
able to adapt
3. Use of organic manure 4. Use of other organic fertilizer 5. Use of MOL 6. Use of verticulture 7. Non-chemical pesticides
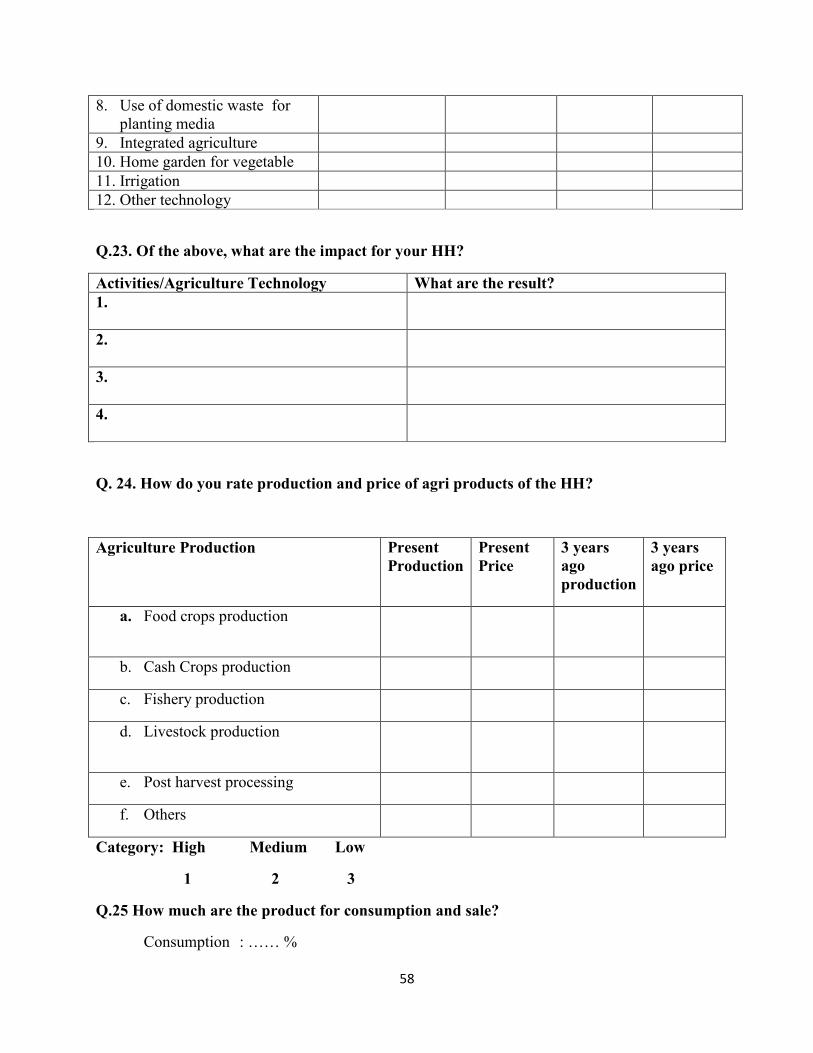
58
8. Use of domestic waste for planting media
9. Integrated agriculture 10. Home garden for vegetable 11. Irrigation 12. Other technology
Q.23. Of the above, what are the impact for your HH?
Activities/Agriculture Technology What are the result? 1.
2.
3.
4.
Q. 24. How do you rate production and price of agri products of the HH?
Agriculture Production Present Production
Present Price
3 years ago production
3 years ago price
a. Food crops production
b. Cash Crops production
c. Fishery production
d. Livestock production
e. Post harvest processing
f. Others
Category: High Medium Low
1 2 3
Q.25 How much are the product for consumption and sale?
Consumption : …… %
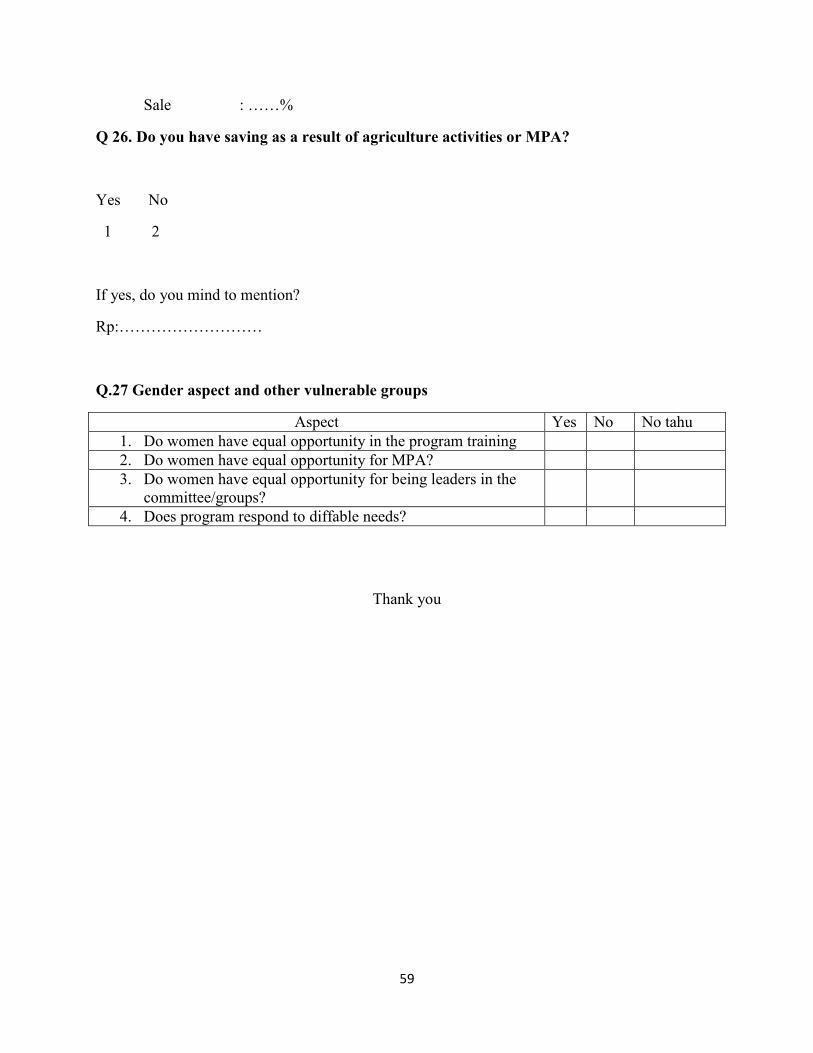
59
Sale : ……%
Q 26. Do you have saving as a result of agriculture activities or MPA?
Yes No
1 2
If yes, do you mind to mention?
Rp:………………………
Q.27 Gender aspect and other vulnerable groups
Aspect Yes No No tahu 1. Do women have equal opportunity in the program training 2. Do women have equal opportunity for MPA? 3. Do women have equal opportunity for being leaders in the
committee/groups?
4. Does program respond to diffable needs?
Thank you
60
Annex 9: FGD and Interview Guide
Introduction about the evaluation and the objectives of the focus group discussion. Thank you for your time in this FGD. The FGD is part of final evaluation of the CADRE which was implemented by PCI in Bengkulu. The rules for the discussion:
- One person should talk at a time. - We must welcome different points of view. - Your participation is completely voluntary. You do not have to agree to share any information,
and you can stop participating in the FGD at any time. - There is no right or wrong answer during discussion, and everyone’s opinion matters. You should
feel free to express their feelings and to voice their opinions. - At any time, feel free to ask questions to be repeated, give suggestions on how to improve the
discussion, and ask to stop/break the discussion if necessary. - Information gathered will not be used for personal use and your name will not be disclosed.
For Beneficiaries
1. Disaster Risk a. What type of disaster risks that may affect this area? b. When was the last disasters and how have these impacted the community and
livelihoods? c. What type of responses have been practiced by community members in the event of
disasters?
2. Livelihoods and Disaster Risk
a. What are the main livelihoods in this area? b. What are the main agricultural products, livestock and fisheries in the study sites? c. Are the products for consumption or sale? What are the proportion of the sales and self-
consumption? d. What technology have been practised? Which agencies do provide supports for livelihood
empowerment? e. In the event of disaster and climate changes, what are the impact being encountered by
farmers/fishermen? f. Is there any other shocks that are encountered?
3. Access for basic services and financial capital?
a. How are the community members’ access financial services? b. What about other basic services/facilities ie. Water electricity, health services etc? c. How are the infrastructures conditions? d. In terms of agricultural supplies/support, where do the community member gain such
support from? e. Who have access to land, sea or other natural resources?

61
4. Participation in the Program
a. Did you ever take part in the CADRE program? b. What training activities did you followed? c. After participating in the program, is there change in livelihood? d. Has there a program of activities impacted on livelihoods and food security
especially of those vulnerable groups? e. How does the current agricultural production compared to 3 years ago? f. Has there an increased of income compared to three years ago? Has adaptive
livelihoods practiced? What are the current sources of income? Has income diversification achieved?
g. What activities did you join in relation to disaster response? h. Has there been a change in attitude towards disaster? i. Has there been a change people's behavior in terms of disaster preparedness?
5. Sustainability
a. After joining trainings, has there any changes on skills following the training implementation?
b. What skills / skill that can be maintained or improved after the program? c. Which capacity has been built among stakeholders that promote sustainability?
6. Groups and network a. Has there an enhancement among households and between villages? b. With whom do you have network at present? c. What groups do exist in the village? d. Which groups are engaged in livelihoods? e. Has there any group associated with disaster response? f. Does the group have clear rules and mechanisms, including management? g. Does the group have both horizontal and vertical networks? h. What activities have been implemented to increase the capacity of the group? i. Have the group increased capacity for disaster risk reduction, emergency response
including mitigation and prevention?
7. Gender Aspect a. In a disaster event, is there any different experience of men and women? b. Do women participate in meetings / trainings on disaster management? Are there
barriers to women's participation? c. How are task division between women and men within household? d. Which resources can be accessed by women and which can be accessed by men?
(Is there is a difference on access to these resources)
62
e. How did women participate in disaster training? f. Are there barriers to women's participation? If there is, what are those barriers? g. What efforts have been made to reduce / overcome it? How is the result? h. What are the advantages received by women in the project?
Interview Guide for BPBD
1. Relevance
a. What type of disaster risk are common in Bengkulu? b. What activities are carried out by the PCI - CADRE along with BPBDs? c. Is the program relevant to the Bengkulu needs?
2. Program Impact: a. Did the program have an impact on the formation of DRR committee and action plan? b. Does the program have a reduced disaster vulnerability threats? c. Does the program contribute to the livelihoods? d. To what extent did the program impact prevention, mitigation and disaster
preparedness? e. Did the program have an impact on civil society? f. Did the program have an impact on the capacity BPBDs / local government?
3. Capacity of BPBD a. Did BPBDs conducted strategic planning? Did the program helped the
implementation of strategic planning workshop? b. Has there an increased capacity BPBDs compared to condition in 3 years ago? Has
program facilitated trainings and capacity building of BPBDs? c. Do you already have a regional initiative for disaster resilience village? d. Is there an adequate budget allocation for DRR in the area? e. Have there been any evacuation drills?
4. Disaster Risk Reduction for School a. Has BPBD engaged in promotion of school disaster preparedness? b. Has disaster preparedness and climate changes included in the school curricula and
extra-curricula activities in school? c. Has school practiced disaster preparedness?
63
A. Interview with School Principals, Teachers and Office of Education
1. Relevance a. Is your school vulnerable to disasters? b. Has the school ever experienced disaster event? If yes, when was it and how bad was the impact? c. What efforts have been made to respond the needs for emergency and rehabilitation, related to past disaster?
2. Participation in CADRE/PCI a. Did this school participated in CADRE activities? If yes, which activities? b. Did the school representative attended disaster preparedness training? c. Did the school representative attended disaster prevention and mitigation trainings? d. What activities have been conducted for teachers and students? e. Has school prepared evacuation route? f. Has the school practiced disaster simulation? g. Has vulnerability to disasters been reduced? h. What are other impact as a result of participation in CADRE program?
FGD with Committee
1. Roles of Committee
a. When was the committee established? b. What was the reason for the formation of the committee?
2. Capacity Development of Committee
a. What training activities have been participated by the committee? b. How has the committee prepared village level DRR and to what extent did the BPBDs supported the committee c. Has committee prepared vulnerability map and DRR action plan? e. What activities have been conducted to develop committee capacity?
3. Effectiveness
a. Had the program covers all vulnerable families in this location? b. Has the participating household received agricultural training or other activities? c. How has access to food improved as a result of program? d. Has lesson learned disseminated to other families in the community? e. What was the successes and challenges encountered by the program? f. Has the program enhanced knowledge for households/community members in terms of
prevention, mitigation and disaster risk reduction?
4. Challenges

64
a. What are the challenges faced by the committee? b. Is there barriers for women to be member of the committee or become group leaders?
5. Policy and Sustainability
a. Do you think that the committee will sustain? b. Has there any government policy to support sustainability of the committee?


![Database Peraturan [JDIH BPK RI] NO...BUPATI BOLAANG MONGONDOW PROVINSI SÙLAWESI UTARA PERATURAN DAERAH KABUPATEN BOLAANG MONGONDOW NOMOR L TAHUN 2018 TENTANG PEM'BEPAYAAN KOPERASI,](https://img.pdfslide.us/doc/110x75/600302cfec8b7c3bfd11d58f/database-peraturan-jdih-bpk-ri-no-bupati-bolaang-mongondow-provinsi-slawesi.jpg)