Embed Size (px)
Citation preview
2015 Needs AssessmentOur Strategy for Success
Scott TorpieWashington State Office of Drinking Water
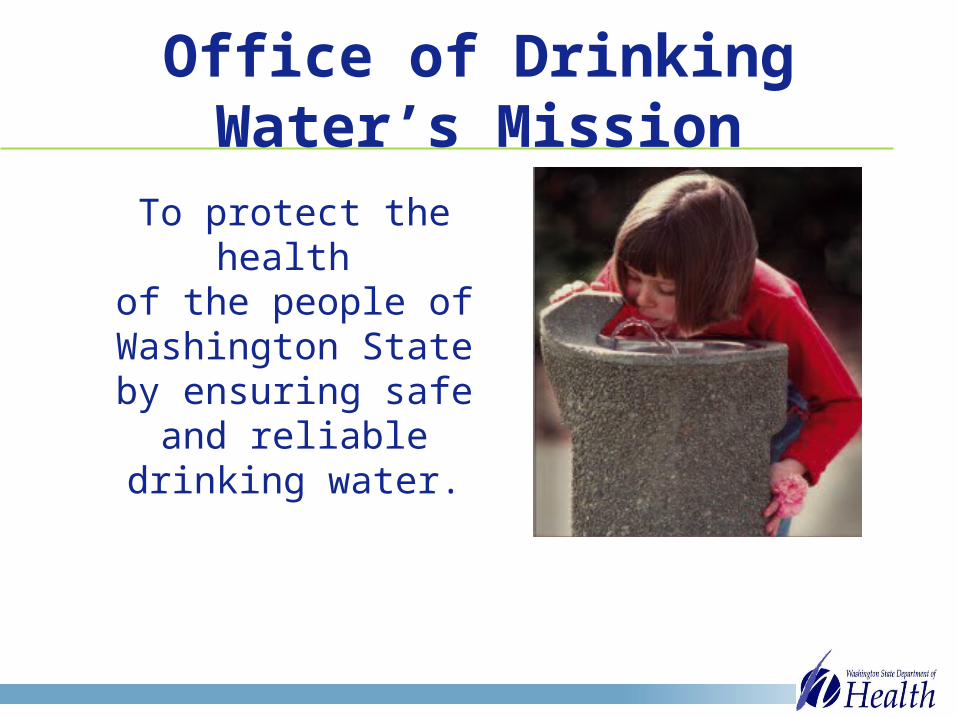
Office of Drinking Water’s Mission
To protect the health of the people of
Washington Stateby ensuring safe
and reliabledrinking water.
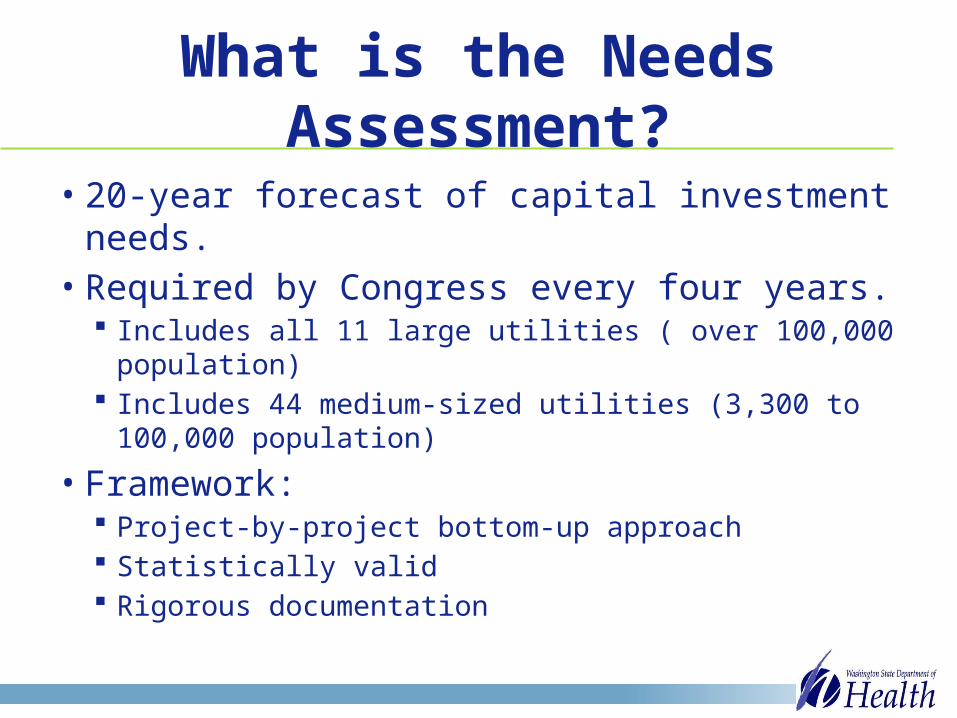
What is the Needs Assessment?
• 20-year forecast of capital investment needs.• Required by Congress every four years.
Includes all 11 large utilities ( over 100,000 population) Includes 44 medium-sized utilities (3,300 to 100,000
population)
• Framework: Project-by-project bottom-up approach Statistically valid Rigorous documentation
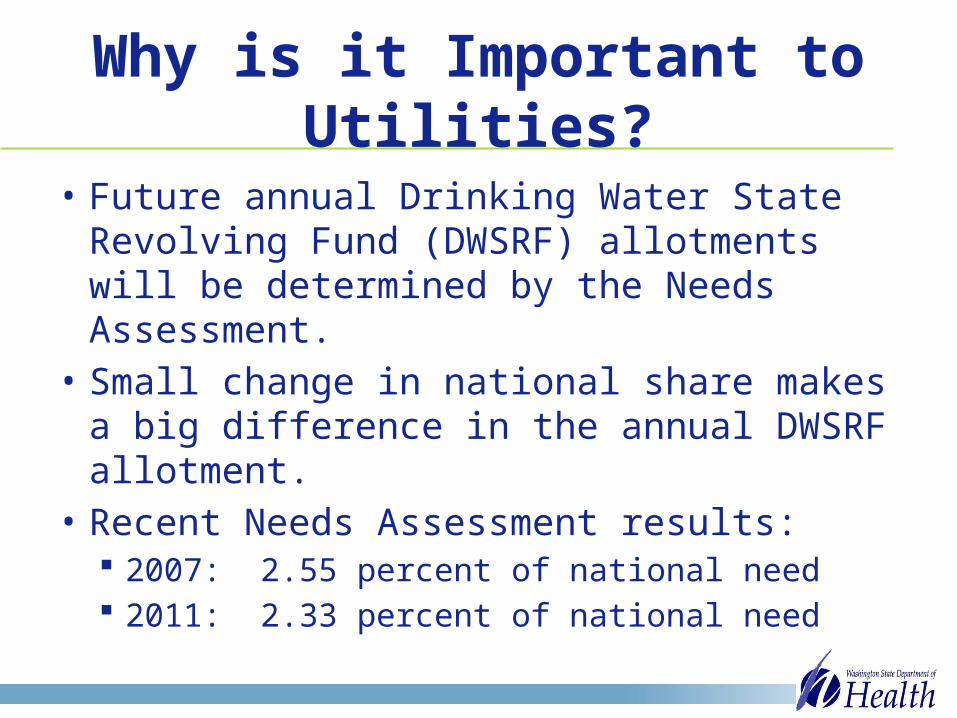
Why is it Important to Utilities?
• Future annual Drinking Water State Revolving Fund (DWSRF) allotments will be determined by the Needs Assessment.
• Small change in national share makes a big difference in the annual DWSRF allotment.
• Recent Needs Assessment results: 2007: 2.55 percent of national need 2011: 2.33 percent of national need

DWSRF AppropriationFY
2005
FY 20
06
FY 20
07
FY 20
08
FY 20
09
FY 20
10
FY 20
11
FY 20
12
FY 20
13
FY 20
14
$0
$200,000,000
$400,000,000
$600,000,000
$800,000,000
$1,000,000,000
$1,200,000,000
$1,400,000,000
$1,600,000,000
$0
$5,000,000
$10,000,000
$15,000,000
$20,000,000
$25,000,000
$30,000,000
$35,000,000
$40,000,000
DWSRF AppropriationNationwide vs Washington State
Nationwide Washington
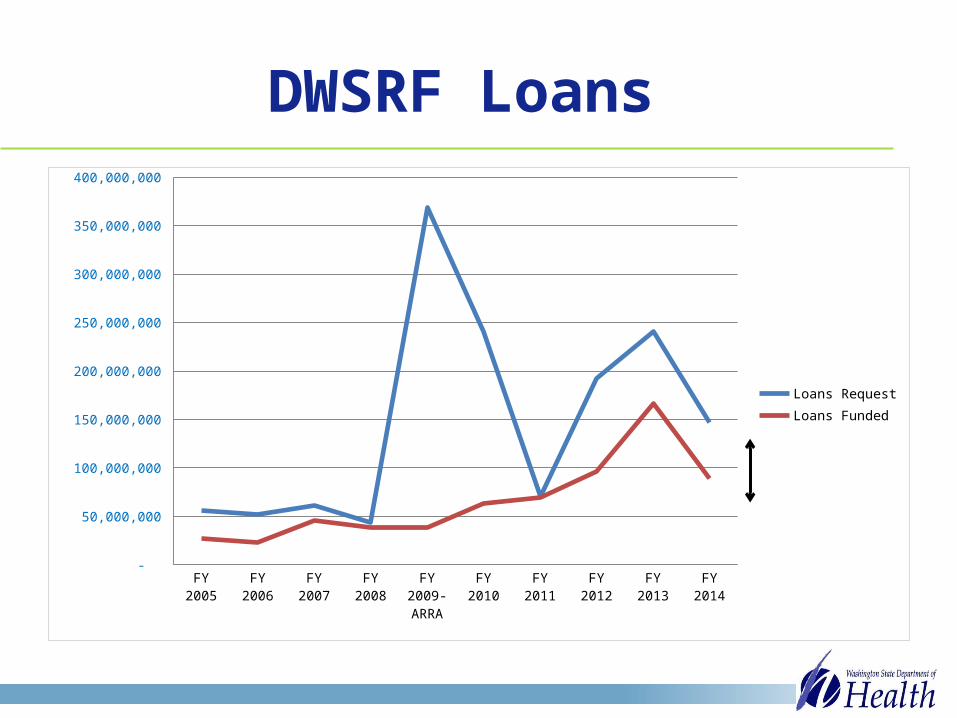
DWSRF Loans
FY 2005 FY 2006 FY 2007 FY 2008 FY 2009-ARRA
FY 2010 FY 2011 FY 2012 FY 2013 FY 2014 -
50,000,000
100,000,000
150,000,000
200,000,000
250,000,000
300,000,000
350,000,000
400,000,000
Loans RequestLoans Funded
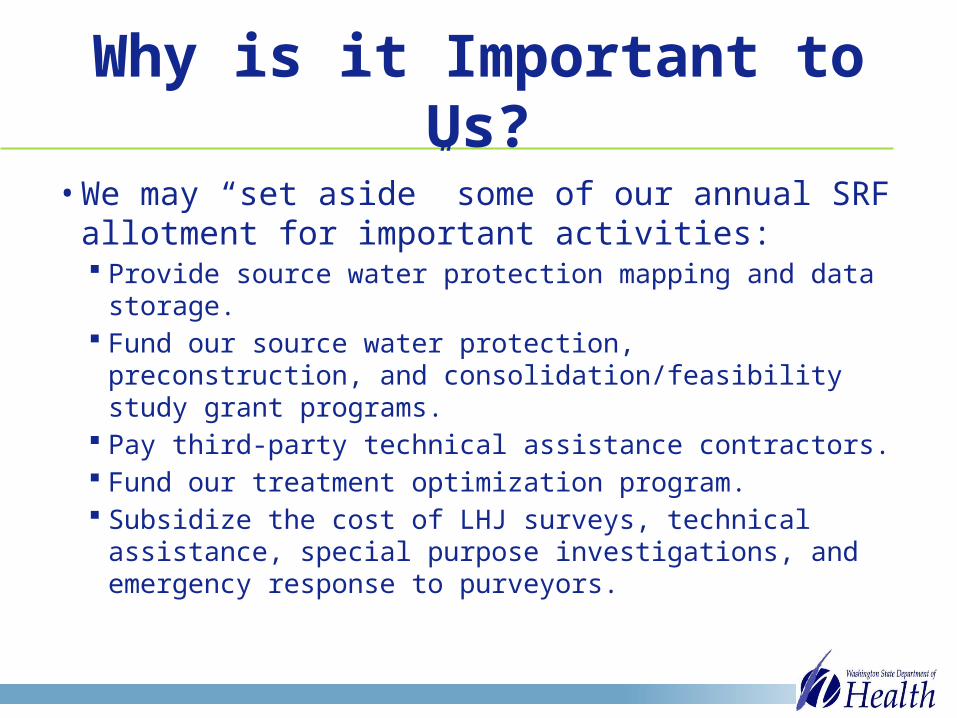
Why is it Important to Us?
• We may “set aside” some of our annual SRF allotment for important activities: Provide source water protection mapping and data
storage. Fund our source water protection, preconstruction, and
consolidation/feasibility study grant programs. Pay third-party technical assistance contractors. Fund our treatment optimization program. Subsidize the cost of LHJ surveys, technical assistance,
special purpose investigations, and emergency response to purveyors.
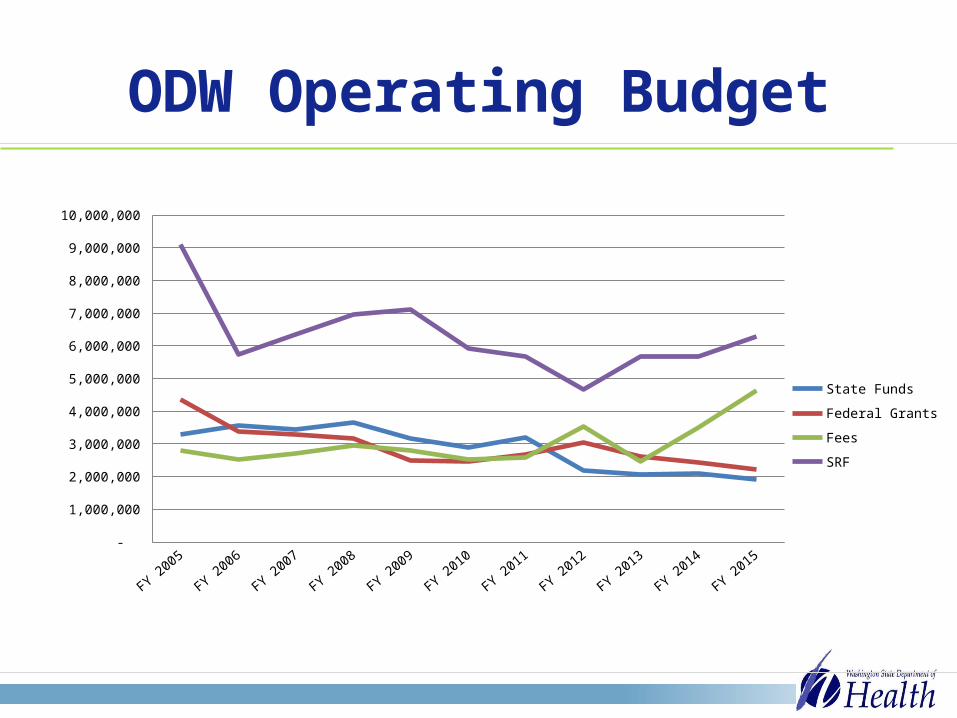
ODW Operating Budget
FY 2005
FY 2006
FY 2007
FY 2008
FY 2009
FY 2010
FY 2011
FY 2012
FY 2013
FY 2014
FY 2015 -
1,000,000
2,000,000
3,000,000
4,000,000
5,000,000
6,000,000
7,000,000
8,000,000
9,000,000
10,000,000
State Funds
Federal Grants
Fees
SRF
Strategy
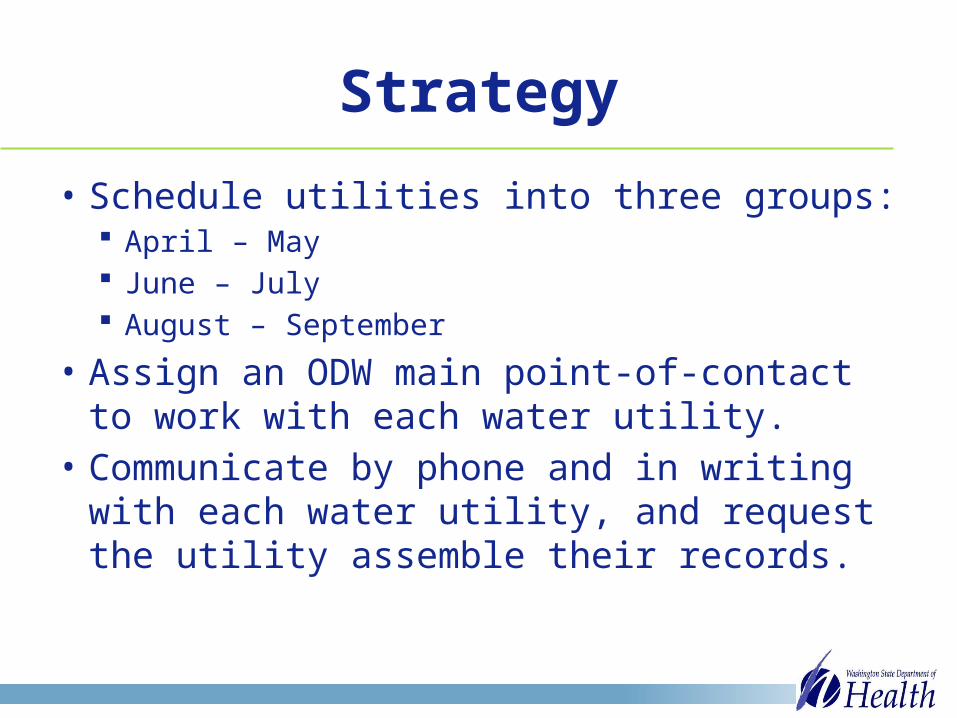
• Schedule utilities into three groups: April – May June – July August – September
• Assign an ODW main point-of-contact to work with each water utility.
• Communicate by phone and in writing with each water utility, and request the utility assemble their records.
Strategy (cont.)
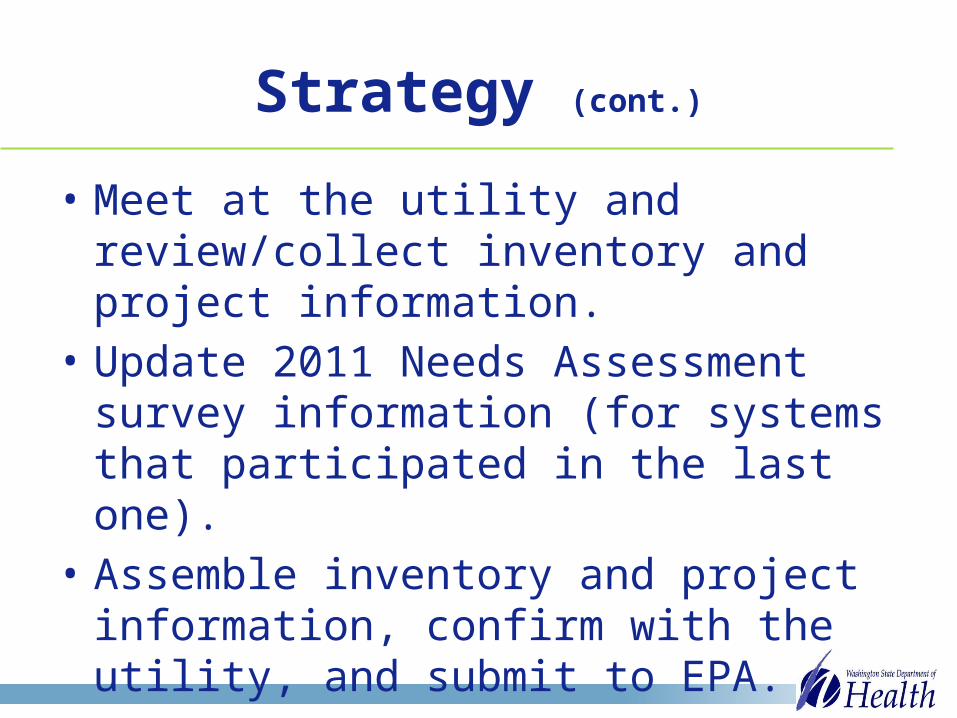
• Meet at the utility and review/collect inventory and project information.
• Update 2011 Needs Assessment survey information (for systems that participated in the last one).
• Assemble inventory and project information, confirm with the utility, and submit to EPA.
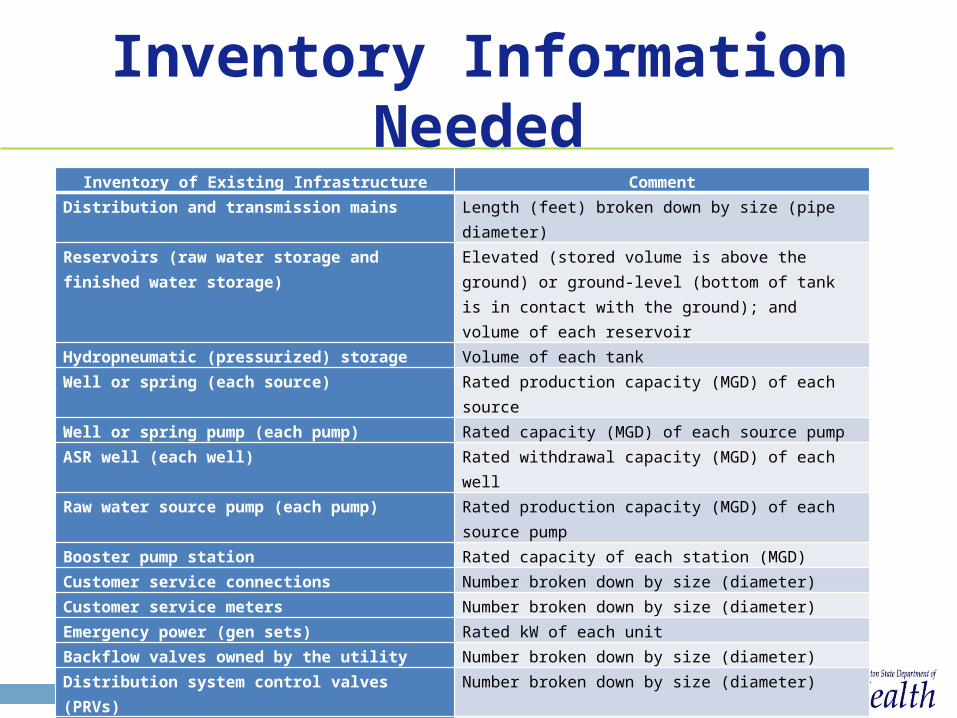
Inventory Information NeededInventory of Existing Infrastructure Comment
Distribution and transmission mains Length (feet) broken down by size (pipe diameter)Reservoirs (raw water storage and finished water storage) Elevated (stored volume is above the ground) or ground-level
(bottom of tank is in contact with the ground); and volume of each reservoir
Hydropneumatic (pressurized) storage Volume of each tankWell or spring (each source) Rated production capacity (MGD) of each sourceWell or spring pump (each pump) Rated capacity (MGD) of each source pumpASR well (each well) Rated withdrawal capacity (MGD) of each wellRaw water source pump (each pump) Rated production capacity (MGD) of each source pumpBooster pump station Rated capacity of each station (MGD)Customer service connections Number broken down by size (diameter)Customer service meters Number broken down by size (diameter)Emergency power (gen sets) Rated kW of each unitBackflow valves owned by the utility Number broken down by size (diameter)Distribution system control valves (PRVs) Number broken down by size (diameter)Treatment – complete system Rated treatment capacity (MGD) of each treatment plantTreatment – limited to chemical injection (e.g., disinfection, fluoridation)
Rated treatment capacity (MGD) of each treatment system
SCADA Yes, utility has SCADA; or No, utility doesn’t have SCADA
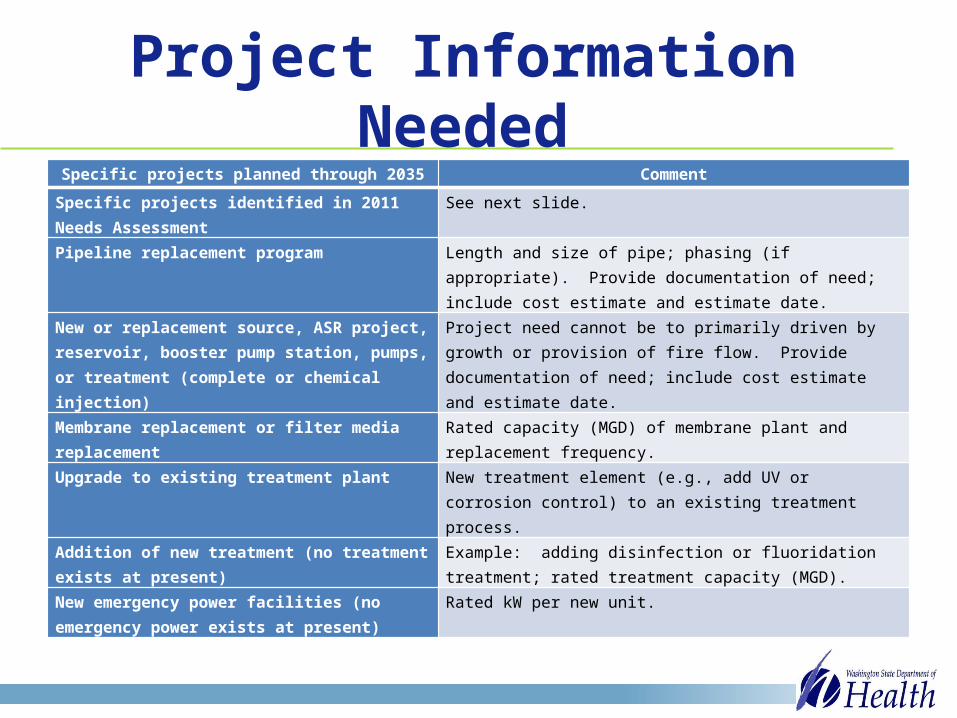
Project Information NeededSpecific projects planned through 2035 Comment
Specific projects identified in 2011 Needs Assessment See next slide.
Pipeline replacement program Length and size of pipe; phasing (if appropriate). Provide documentation of need; include cost estimate and estimate date.
New or replacement source, ASR project, reservoir, booster pump station, pumps, or treatment (complete or chemical injection)
Project need cannot be to primarily driven by growth or provision of fire flow. Provide documentation of need; include cost estimate and estimate date.
Membrane replacement or filter media replacement Rated capacity (MGD) of membrane plant and replacement frequency.Upgrade to existing treatment plant New treatment element (e.g., add UV or corrosion control) to an
existing treatment process.
Addition of new treatment (no treatment exists at present)
Example: adding disinfection or fluoridation treatment; rated treatment capacity (MGD).
New emergency power facilities (no emergency power exists at present)
Rated kW per new unit.

For 2011 Participating Utilities
• Identify capital projects:– Started before January 1, 2015.– Not started before January 1, and the utility is still
committed to completing the project: Scope of project unchanged. Scope of project changed since 2011.
– Not started, and the utility decided to abandon the project.

2011 Project Summary Examples
• City of WashougalS:\EPH\DW\Field Operations\Needs Assessment\Individual Water System Files\Washougal, City of\2011 Survey Information
• City of CheneyS:\EPH\DW\Field Operations\Needs Assessment\Individual Water System Files\Cheney, City of\2011 Survey Information
• City of AnacortesS:\EPH\DW\Field Operations\Needs Assessment\Individual Water System Files\Anacortes, City of\2011 Survey Information