Embed Size (px)
Citation preview

INCORPORATING THE REQUIREMENTS OF APPENDIX 4D
2015 Interim Financial Results
WESTPAC BANKING CORPORATIONABN 33 007 457 141

Results announcement to the market
ii | Westpac Group 2015 Interim Results Announcement
ASX Appendix 4D Results for announcement to the market1 Report for the half year ended 31 March 20152 Revenue from ordinary activities3,4 ($m) up 2% to $9,997
Profit from ordinary activities after tax attributable to equity holders4 ($m) dow n 0% to $3,609
Net profit for the period attributable to equity holders4 ($m) dow n 0% to $3,609
Dividend Distributions (cents per ordinary share)Interim Dividend
Record date for determining entitlements to the dividend15 May 2015 (Sydney)
14 May 2015 (New York)
Amount per security
Franked amount per security
93 93
1 This document comprises the Westpac Group 2015 Interim Financial Results, including the Interim Financial Report and is provided to
the Australian Securities Exchange under Listing Rule 4.2A. 2 This report should be read in conjunction with the Westpac Group Annual Report 2014 and any public announcements made in the
period by the Westpac Group in accordance with the continuous disclosure requirements of the Corporations Act 2001 and ASX Listing Rules.
3 Comprises reported interest income, interest expense and non-interest income. 4 All comparisons are with the reported results for the six months ended 31 March 2014.

Results announcement to the market Media release and outlook
Westpac Group 2015 Interim Results Announcement | iii
MediaRelease
4 May 2015
WESTPAC DELIVERS SOLID FIRST HALF 2015 OPERATING RESULT
Westpac Group today announced First Half 2015 cash earnings of $3,778 million, in line with the prior corresponding period. Statutory net profit was $3,609 million.
The Group’s operating businesses continued to perform well, particularly the Group’s retail and business banking divisions. However, the result was affected by a lower Treasury contribution and a $85 million (post-tax) charge following the introduction of the previously announced methodology changes to derivative valuations1 (derivative adjustments). Prior to the derivative adjustments, cash earnings were up 2%, compared to the prior corresponding period.
Key features of the result compared to the prior corresponding period included2:
Statutory net profit of $3,609 million, in line with the prior corresponding period;
Cash earnings per share of 121.3 cents, in line with the prior corresponding period;
Cash earnings of $3,778 million, in line with the prior corresponding period;
Interim fully franked dividend of 93 cents per share (cps) up 3%;
Common equity Tier 1 capital ratio of 8.8% down 6 basis points;
Cash return on equity (ROE) of 15.8% down 67 basis points;
Lending up 7%, customer deposits up 8%, funds under management up 25% and funds under administration up 17%;
Margins (ex-Treasury and Markets) unchanged at 2.01%;
Expense to income ratio at 42.5% from 41.2%; and
Further improvements in asset quality with impaired assets as a percentage of gross loans falling 16 basis points to 0.35%.
Westpac Chief Executive Officer, Brian Hartzer, said: “Our operating divisions, particularly retail and business banking, have continued to perform well during the period. However, the headline result was impacted by derivative adjustments in our WIB business and a lower Treasury result.
“Our primary goal is to continue to build the value of our franchise, and the drivers of value are heading in the right direction. We have grown our customer base and continued to improve customer service, while maintaining our disciplined approach to growth and margin management.
“At the same time we have delivered $230 million in efficiency gains over the year and further improved the quality of the portfolio through a reduction in stressed assets.
“In our retail and business banking divisions we had solid loan and deposit growth, along with well managed margins.
1 In First Half 2015 changes were made to derivative valuation methodologies, which include the first time adoption of a FVA to the fair
value of derivatives. The impact of these changes resulted in a $122 million (pre-tax) charge which reduced non-interest income. 2 Reported on a cash earnings basis unless otherwise stated. For an explanation of cash earnings and reconciliation to reported results
refer to pages 4 to 5 and 118 to 120 of the Group’s 2015 Interim Financial Results announcement.

Results announcement to the market
iv | Westpac Group 2015 Interim Results Announcement
“We are seeing the results of our Service Revolution program, with Westpac Retail & Business Banking delivering record customer growth and improved customer satisfaction. Our St.George Banking Group brands also contributed positively, with Bank of Melbourne continuing to grow market share.
“We achieved good growth in New Zealand, supported by changes to our distribution network and the increased use of digital channels.
“In WIB, cash earnings were 17% lower due to the $85 million post tax charge as a result of derivative adjustments and a lower impairment benefit. Customer revenues were up 6% with strong lending growth. That’s a good outcome given the competitive market.”
During the six-month period more than $450 million was invested in the business including initiatives to help transform the customer experience and drive growth. Highlights include:
Completed the roll-out of ‘Westpac Live’, the new mobile/online platform, to 3.1 million Westpac consumer customers. The migration of Westpac business customers is well underway, with 300,000 customers already on the enhanced platform. A new internet and mobile banking platform, Westpac One, was also launched in New Zealand;
Continued the redesign of the branch network to provide customers with a more efficient, accessible service, including: upgraded a further 49 branches to a new format with more 24/7 access options; launched an agreement with Australia Post to provide 3,000 more locations for customers to do over the counter banking; and opened a further seven Bank of Melbourne branches;
Introduced a number of initiatives within BT Financial Group including: rolled out the next phase of the new BT Wealth platform, ‘Panorama’, offering advisers and their clients a simple way to access shares, managed funds and cash through a range of professionally managed portfolios; expanded our insurance product set through our alliance with Allianz; and restructured mortgage insurance arrangements to give a better customer experience and improve returns;
Progressed the Asian strategy, completing the global trade platform and core banking systems in Singapore, Hong Kong and India, delivering faster processing and servicing times for customers; and
Continued to build on the productivity and simplification program, with $113 million in efficiencies including branch simplification, increased self-service options for customers, and product simplification.
Mr Hartzer said it was important that with intense competition in the mortgage, deposits and business lending markets, the Group is disciplined in its approach to returns and growth as well as maintaining prudent risk settings.
“We grew at system in household deposits, and slightly below system in mortgages, while holding our margin (excluding Treasury and Markets) flat. Our asset finance business has also grown strongly, leveraging the acquired Lloyds capability.
“The strength of our franchise and the disciplined implementation of our strategy are hallmarks of the Group. We’ve managed the transition to the new Liquidity Coverage Ratio framework well, with high levels of liquid assets and a well-diversified funding profile. Westpac also has a high quality credit portfolio, with asset quality metrics continuing to improve.”
CAPITAL POSITION AND DIVIDENDS
The Group’s common equity Tier 1 (CET1) capital ratio of 8.8% is well above regulatory minimums. However, due to other1 items, including changes in mortgage risk factors implemented during the half, the ratio is currently at the lower end of the Group’s preferred capital range of 8.75% to 9.25%.
There remains uncertainty over future capital settings, including the introduction of the next set of reforms from the Basel Committee on Banking Supervision, and the Federal Government’s assessment of the final recommendations from the Financial System Inquiry. As a result, the Board has decided it is appropriate for the Group to be operating at the upper end of the preferred capital range. In line with this, the Group will issue shares to satisfy the DRP for the interim dividend (at a 1.5% discount), and partially underwrite the DRP to increase CET1 capital by approximately $2 billion. The interim dividend has been increased by 3 cps, or 3%, on the First Half 2014.
1 Other items also include foreign currency translation impacts and revaluation of the defined benefit obligation.
Results announcement to the market
Westpac Group Interim 2015 ASX Profit Announcement | v
FINANCIAL HIGHLIGHTS
Key financial aspects of the First Half 2015 result1,2:
Net interest income of $6,934 million, up 4%, with a 7% rise in average interest-earning assets and a 6 basis points decrease in net interest margin to 2.05%. Margins (ex-Treasury and Markets) were unchanged at 2.01%;
Australian housing loans increased 7%, personal lending rose by 7% and business lending increased by 5%. Group-wide, customer deposits increased $31.4 billion to $420.3 billion, up 8%;
Non-interest income of $3,086 million, a 3% decrease, with a strong performance from our funds management business more than offset by methodology changes to derivative valuations and higher insurance claims this period;
An expense to income ratio of 42.5%; and
The Group’s high quality credit portfolio was reflected in the 11 basis points impairment charge relative to average gross loans. The Group has retained its strong provisioning coverage including economic overlays being maintained.
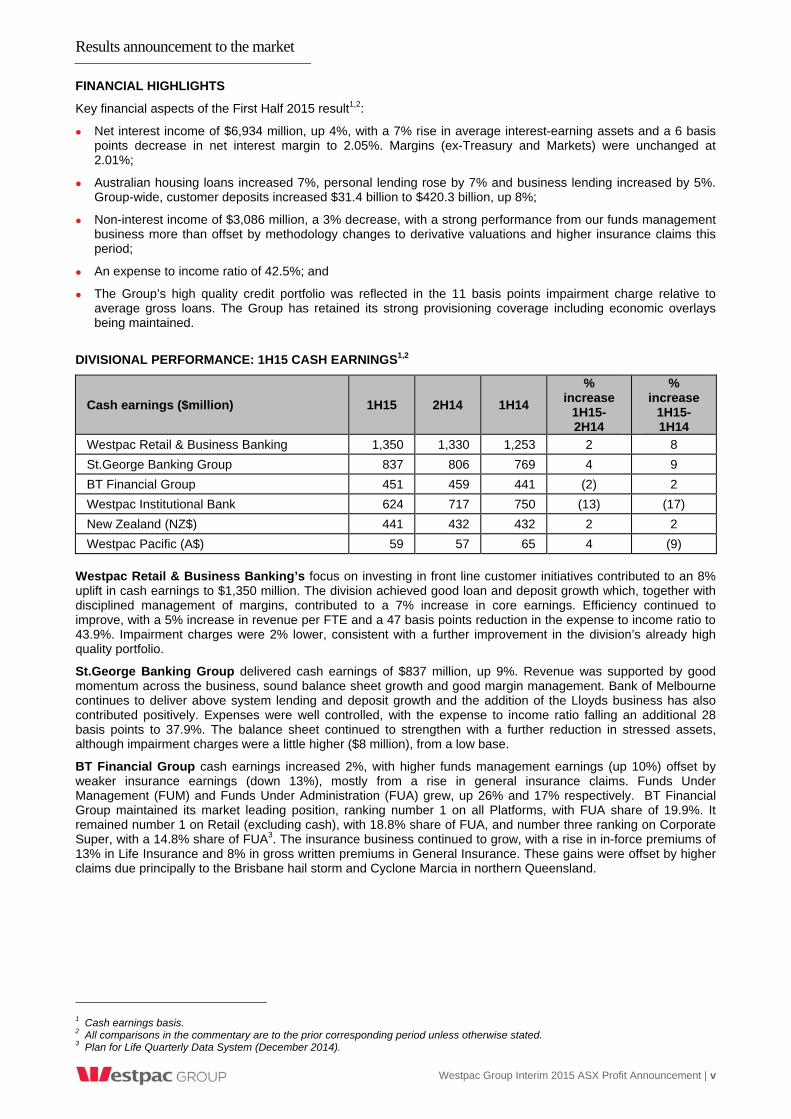
DIVISIONAL PERFORMANCE: 1H15 CASH EARNINGS1,2
Cash earnings ($million) 1H15 2H14 1H14
% increase
1H15-2H14
% increase
1H15-1H14
Westpac Retail & Business Banking 1,350 1,330 1,253 2 8
St.George Banking Group 837 806 769 4 9
BT Financial Group 451 459 441 (2) 2
Westpac Institutional Bank 624 717 750 (13) (17)
New Zealand (NZ$) 441 432 432 2 2
Westpac Pacific (A$) 59 57 65 4 (9)
Westpac Retail & Business Banking’s focus on investing in front line customer initiatives contributed to an 8% uplift in cash earnings to $1,350 million. The division achieved good loan and deposit growth which, together with disciplined management of margins, contributed to a 7% increase in core earnings. Efficiency continued to improve, with a 5% increase in revenue per FTE and a 47 basis points reduction in the expense to income ratio to 43.9%. Impairment charges were 2% lower, consistent with a further improvement in the division’s already high quality portfolio.
St.George Banking Group delivered cash earnings of $837 million, up 9%. Revenue was supported by good momentum across the business, sound balance sheet growth and good margin management. Bank of Melbourne continues to deliver above system lending and deposit growth and the addition of the Lloyds business has also contributed positively. Expenses were well controlled, with the expense to income ratio falling an additional 28 basis points to 37.9%. The balance sheet continued to strengthen with a further reduction in stressed assets, although impairment charges were a little higher ($8 million), from a low base.
BT Financial Group cash earnings increased 2%, with higher funds management earnings (up 10%) offset by weaker insurance earnings (down 13%), mostly from a rise in general insurance claims. Funds Under Management (FUM) and Funds Under Administration (FUA) grew, up 26% and 17% respectively. BT Financial Group maintained its market leading position, ranking number 1 on all Platforms, with FUA share of 19.9%. It remained number 1 on Retail (excluding cash), with 18.8% share of FUA, and number three ranking on Corporate Super, with a 14.8% share of FUA3. The insurance business continued to grow, with a rise in in-force premiums of 13% in Life Insurance and 8% in gross written premiums in General Insurance. These gains were offset by higher claims due principally to the Brisbane hail storm and Cyclone Marcia in northern Queensland.
1 Cash earnings basis. 2 All comparisons in the commentary are to the prior corresponding period unless otherwise stated. 3 Plan for Life Quarterly Data System (December 2014).

Results announcement to the market
vi | Westpac Group 2015 Interim Results Announcement
Westpac Institutional Bank delivered cash earnings of $624 million, down $126 million (17%). The lower result was driven by derivative adjustments equivalent to $122 million (pre-tax), $68 million lower impairment benefits over the period, and competition driving down margins. WIB continued to deliver solid growth in lending (up $6.1 billion or 10%), good customer related flows, and continued success in its Asian investment. WIB maintained its position as the number one lead domestic transactional bank1 for the 11th year in a row, and was ranked the number one Australian bank for FX globally2. Strong asset quality was maintained with a further reduction in stressed and impaired assets.
Westpac New Zealand delivered a 2% increase in cash earnings, to NZ$441 million, with 7% growth in core earnings on the back of solid loan growth and stable margins. This was partly offset by a rise in impairment charges off a very low base. Lending increased 5% (primarily due to mortgages up 5%), while deposits increased 6%. Disciplined expense growth of 4% helped deliver a 71 basis points reduction in the expense to income ratio to 40.6%.
Westpac Pacific cash earnings were down $6 million, negatively affected by foreign exchange controls introduced in Papua New Guinea in July 2014, offsetting a strong rise in net interest income. During the first half, we announced we had entered into an agreement to sell our banking operations in five Pacific Island Nations, while maintaining our presence in Fiji and Papua New Guinea. We also announced $100,000 in aid to Vanuatu in response to Cyclone Pam.
Group Businesses, which includes Treasury, reported cash earnings of $44 million, down $57 million on the First Half 2014 due to a lower Treasury result. This reflected lower returns from management of the liquids portfolio and balance sheet management activities.
OUTLOOK
Mr Hartzer said he was positive about the growth outlook for the Australian economy, with low interest rates, a lower Australian dollar and support from the housing sector.
“While I’m positive about the outlook, the economy is currently in transition and this means that we expect growth to be uneven across different industry sectors and geographies.
“Areas like housing, infrastructure, and agriculture will do relatively well, while other areas such as mining and resource-driven regions and adjacent service providers will find it tough.
“For Australian banks, this means that credit growth will be modest but positive with housing growing faster than business. Asset quality should remain strong, supported by low interest rates and healthy business balance sheets.
“This also means that banking competition will remain intense, including from new entrants.
“In this environment, and with considerable regulatory uncertainty, we will continue to run our businesses in a way that provides the headroom to manage volatility, while investing in our people and technology to build the value of the company.
“We are strongly positioned in our key markets and have set the clear ambition to be one of the world’s great service companies. When I look at every business across the franchise, we are moving in the right direction to achieve this and are delivering for all stakeholders. That, combined with the disciplined way we are managing the business, gives me confidence in the future,” Mr Hartzer said.
For Further Information
David Lording Media Relations T. 02 8219 8512 M. 0419 683 411 Andrew Tubb Media Relations T. 02 8219 8512 M. 0400 693 915
Andrew Bowden Investor Relations T. 02 8253 4008 M. 0438 284 863
1 Peter Lee Associates Large Corporate and Institutional Transactional Banking Survey Australia. Quantitative measure from 576 votes
in 2014. Westpac ranks number one for citations as a ‘lead’ domestic transactional bank 2004 – 2014. 2 Euromoney FX Poll 2014.

Results announcement to the market
Westpac Group 2015 Interim Results Announcement | vii
2015 Interim Financial Results
01 Group results
1. 1 Reported results
1. 2 Key financial data
1. 3 Cash earnings results
1. 4 Market share and system multiple metrics
1
1
2
3
6
02 Review of Group operations
2. 1 Performance overview
2. 2 Review of earnings
2. 3 Credit quality
2. 4 Balance sheet and funding
2. 5 Capital and dividends
2. 6 Sustainability performance
7
8
15
28
30
35
40
03 Divisional results
3. 1 Westpac Retail & Business Banking
3. 2 St. George Banking Group
3. 3 BT Financial Group (Australia)
3. 4 Westpac Institutional Bank
3. 5 Westpac New Zealand
3. 6 Westpac Pacific
3. 7 Group Businesses
42
42
45
48
55
58
61
63
04 2015 Interim financial report
4. 1 Directors report
4. 2 Consolidated income statement
4. 3 Consolidated statement of comprehensive income
4. 4 Consolidated balance sheet
4. 5 Consolidated statement of changes in equity
4. 6 Consolidated cash flow statement
4. 7 Notes to the consolidated financial statements
4. 8 Statutory statements
66
66
81
82
83
84
85
86
109
05 Cash earnings supplementary information 111
06 Other information
6. 1 Disclosure regarding forward-looking statements
6. 2 Credit ratings
6. 3 Dividend reinvestment plan
6. 4 Changes in control of Group entities
6. 5 Financial calendar and Share Registry details
6. 6 Exchange rates
122
122
123
123
123
124
126
07 Glossary 128
In this announcement references to ‘Westpac’, ‘WBC’, ‘Westpac Group’, ‘the Group’, ‘we’, ‘us’ and ‘our’ are to Westpac Banking Corporation and its controlled entities, unless it clearly means just Westpac Banking Corporation.
In this announcement references to ‘St. George’ refer to the division and its brands namely: ‘St. George Bank’, ‘Bank of Melbourne’, ‘BankSA’, and ‘RAMS’ unless it clearly means just the St. George Bank brand.
All references to $ in this document are to Australian dollars unless otherwise stated.
Financial calendar
Interim results announcement 4 May 2015
Ex-dividend date for interim dividend 13 May 2015
Record date for interim dividend (Sydney) 15 May 2015
Interim dividend payable 2 July 2015
Final results announcement 2 November 2015

Results announcement to the market
viii | Westpac Group 2015 Interim Results Announcement
[This page is intentionally blank]

Interim financial results 2015 Group results
Westpac Group 2015 Interim Results Announcement | 1
1.0 Group results
1.1 Reported results
Reported net profit attributable to owners of Westpac Banking Corporation is prepared in accordance with the requirements of Australian Accounting Standards (AAS) and regulations applicable to Australian Authorised Deposit-taking Institutions (ADIs).
% M ov't 1 % M ov't 1
$mHalf YearMarch 15
Half YearSept 14
Half YearMarch 14
Mar 15 -Sept 14
Mar 15 - Mar 14
Net interest income 6,984 6,903 6,639 1 5
Non-interest income 3,013 3,244 3,151 (7) (4)Net operating income before operating expenses and impairment charges 9,997 10,147 9,790 (1) 2
Operating expenses (4,410) (4,352) (4,195) 1 5Net profit before impairment charges and income taxexpense 5,587 5,795 5,595 (4) -
Impairment charges (341) (309) (341) 10 -
Profit before income tax 5,246 5,486 5,254 (4) -
Income tax expense (1,604) (1,520) (1,595) 6 1
Net profit for the period 3,642 3,966 3,659 (8) -
Net prof it attributable to non-controlling interests (33) (27) (37) 22 (11)NET PROFIT ATTRIBUTABLE TO OWNERS OF WESTPACBANKING CORPORATION 3,609 3,939 3,622 (8) -
Net profit attributable to owners for First Half 2015 was $3,609 million, a decrease of $13 million compared to First Half 2014. This half, the Group has made a number of methodology changes to derivative valuations. This includes introducing a Funding Valuation Adjustment (FVA)2 to the fair value of derivatives. The impact of these changes resulted in a $122 million (pre-tax) charge which reduced non-interest income. This item impacted trading income and the results of Westpac Institutional Bank. Excluding the impact of this item, net profit increased $72 million or 2%.
Net interest income increased $345 million compared to First Half 2014, with total loan growth of 7% and customer deposit growth of 8%. The benefit from volume growth was partially offset by a 3 basis point reduction in net interest margin. The reduction in net interest margin reflected lower Treasury income. Net interest income, loans, customer deposits and net interest margins are discussed further in Sections 2.2.1 to 2.2.4.
Non-interest income decreased $138 million or 4% compared to First Half 2014 primarily due to the impact of the methodology changes to derivative valuation adjustments (discussed above). Excluding these adjustments, non-interest income reduced $16 million reflecting lower profits from asset sales and impact of the fair value of economic hedges being partly offset by an increase in wealth management and banking fees. Non-interest income is discussed further in Section 2.2.5.
Operating expenses increased $215 million or 5% compared to First Half 2014, driven by foreign currency translation impacts, the full period impact of the Lloyds acquisition and higher investment related impacts, including increased software amortisation and hardware depreciation. Operating expenses are discussed further in Section 2.2.8.
Impairment charges were unchanged compared to First Half 2014. Asset quality improved this half, including stressed exposures as a percentage of total committed exposures reducing from 1.37% to 1.12%. Impairment charges are discussed further in Section 2.2.9.
The effective tax rate of 30.6% in First Half 2015 was slightly higher compared to 30.4% in First Half 2014. Income tax expense is discussed further in Section 2.2.10.
Net profit attributable to owners for First Half 2015 reduced $330 million or 8% compared to Second Half 2014. This reflected lower income, down 1%, as growth in the operating businesses was more than offset by lower asset sales, the impact of the methodology changes to derivative valuation adjustments and the impact of fair valuation of economic hedges. Impairment charges also increased 10% mostly from lower levels of recoveries and write-backs. Income tax expense was also higher following an increased effective tax rate (27.7% to 30.6%) as the release of provisions relating to the finalisation of prior period taxation matters in Second Half 2014 were not repeated in First Half 2015.
1 Percentage movement represents an increase / (decrease) to the relevant comparative period. 2 Refer to Glossary.

Interim financial results 2015 Group results
2 | Westpac Group 2015 Interim Results Announcement
1.2 Key financial data
% M ov't % M ov'tHalf YearMarch 15
Half YearSept 14
Half YearMarch 14
Mar 15 -Sept 14
Mar 15 - Mar 14
Shareholder value
Earnings per ordinary share (cents) 116.1 127.0 116.8 (9) (1)
Weighted average ordinary shares (millions)1 3,106 3,098 3,098 - -
Fully franked dividends per ordinary share (cents) 93 92 90 1 3
Return on average ordinary equity 15.10% 16.70% 15.82% (160bps) (72bps)
Average ordinary equity ($m) 47,920 47,044 45,907 2 4
Average total equity ($m) 48,777 47,905 46,770 2 4
Net tangible asset per ordinary share ($) 11.84 11.57 11.13 2 6
Productivity and efficiency
Expense to income ratio 44.1% 42.9% 42.8% 122bps 126bps
Business performance
Interest spread 1.89% 1.90% 1.90% (1bps) (1bps)
Benefit of net non-interest bearing assets, liabilities and equity 0.17% 0.19% 0.19% (2bps) (2bps)
Net interest margin 2.06% 2.09% 2.09% (3bps) (3bps)
Average interest-earning assets ($m) 678,568 659,003 635,657 3 7
Capital adequacy ratio
Common equity Tier 1 capital ratio
- APRA Basel III 8.76% 8.97% 8.82% (21bps) (6bps)
- Internationally comparable2 12.73% 13.09% 13.07% (36bps) (34bps)
Credit risk w eighted assets (credit RWA) ($m) 303,026 281,459 272,038 8 11
Total risk w eighted assets (RWA) ($m) 346,823 331,387 322,498 5 8
Asset quality
Total committed exposures (TCE) ($m) 910,551 880,213 843,956 3 8
Total impaired assets to gross loans 0.35% 0.40% 0.51% (5bps) (16bps)
Total impaired assets to equity and total provisions 4.0% 4.4% 5.6% (44bps) (159bps)
Total impaired asset provisions to total impaired assets 47.8% 44.8% 46.4% 305bps 139bps
Total stressed exposures as a % of total committed exposures 1.12% 1.24% 1.37% (12bps) (25bps)
Total provisions to gross loans 58bps 60bps 67bps (2bps) (9bps)Collectively assessed provisions to performing non-housingloans3 128bps 129bps 134bps (1bps) (6bps)
Mortgages 90 days past due 0.45% 0.45% 0.48% - (3bps)
Other consumer loans 90 days past due 1.17% 0.99% 1.12% 18bps 5bps
Collectively assessed provisions to credit RWA 89bps 93bps 97bps (4bps) (8bps)
Balance sheet4 ($m)
Loans 605,064 580,343 564,569 4 7
Total assets 795,961 770,842 729,375 3 9
Deposits and other borrow ings 466,743 460,822 437,405 1 7
Total liabilities 745,644 721,505 681,344 3 9
Total equity 50,317 49,337 48,031 2 5
1 Weighted average number of fully paid ordinary shares listed on the ASX for the relevant period less Westpac shares held by the
Group (“Treasury shares”). 2 Refer Glossary for definition. 3 Non-housing loans have been determined on a loan purpose basis. 4 Spot balances.

Interim financial results 2015 Group results
Westpac Group 2015 Interim Results Announcement | 3
1.3 Cash earnings results
Throughout this results announcement, reporting and commentary of financial performance for First Half 2015, Second Half 2014 and First Half 2014 will refer to “cash earnings results", unless otherwise stated.
% M ov't % M ov't
$mHalf YearMarch 15
Half YearSept 14
Half YearMarch 14
Mar 15 -Sept 14
Mar 15 - Mar 14
Net interest income 6,934 6,819 6,677 2 4
Non-interest income 3,086 3,142 3,182 (2) (3)
Net operating income 10,020 9,961 9,859 1 2
Operating expenses (4,254) (4,181) (4,065) 2 5
Core earnings 5,766 5,780 5,794 - -
Impairment charges (341) (309) (341) 10 -
Operating profit before income tax 5,425 5,471 5,453 (1) (1)
Income tax expense (1,613) (1,587) (1,643) 2 (2)
Net profit 3,812 3,884 3,810 (2) -
Net prof it attributable to non-controlling interests (34) (28) (38) 21 (11)
Cash earnings 3,778 3,856 3,772 (2) - 1.3.1 Key financial information
% M ov't % M ov't
Half YearMarch 15
Half YearSept 14
Half YearMarch 14
Mar 15 -Sept 14
Mar 15 - Mar 14
Shareholder value
Cash earnings per ordinary share (cents) 121.3 124.1 121.3 (2) -
Economic profit ($m) 2,122 2,241 2,250 (5) (6)
Weighted average ordinary shares (millions) - cash earnings1 3,115 3,109 3,109 - -
Dividend payout ratio - cash earnings 76.8% 74.2% 74.2% 263bps 263bps
Cash earnings return on average ordinary equity 15.81% 16.35% 16.48% (54bps) (67bps)
Cash earnings return on average tangible ordinary equity 20.26% 21.11% 21.40% (85bps) (114bps)
Average ordinary equity ($m) 47,920 47,044 45,907 2 4
Average tangible ordinary equity ($m)2 37,399 36,441 35,350 3 6
Productivity and efficiency
Expense to income ratio - cash earnings 42.5% 42.0% 41.2% 49bps 123bps
Total banking expense to income ratio - cash earnings 41.5% 41.1% 40.0% 43bps 151bps
Full time equivalent employees (FTE) 36,559 36,373 36,494 1 -
Revenue per FTE ($ '000's) 274 273 274 - -
Business performance
Interest spread 1.87% 1.87% 1.91% - (4bps)
Benefit of net non-interest bearing assets, liabilities and equity 0.18% 0.19% 0.20% (1bps) (2bps)
Net interest margin 2.05% 2.06% 2.11% (1bps) (6bps)
Average interest-earning assets ($m) 678,568 659,003 635,657 3 7
Effective tax rate 29.7% 29.0% 30.1% 72bps (40bps)
Impairment charges
Impairment charges to average loans annualised 11bps 11bps 12bps - (1bps)
Net w rite-offs to average loans annualised 16bps 25bps 22bps (9bps) (6bps)
1 Weighted average ordinary shares – cash earnings – weighted average number of fully paid ordinary shares listed on the ASX for the
relevant period. 2 Average tangible ordinary equity is calculated as average ordinary equity less goodwill and other intangible assets (excluding
capitalised software).

Interim financial results 2015 Group results
4 | Westpac Group 2015 Interim Results Announcement
Cash earnings policy
In assessing financial performance, including divisional results, Westpac Group uses a measure of performance referred to as “cash earnings”. Cash earnings is not a measure of cash flow or net profit determined on a cash accounting basis, as it includes non-cash items reflected in net profit determined in accordance with AAS. The specific adjustments outlined below include both cash and non-cash items. Cash earnings, as calculated by the Westpac Group, is viewed as a measure of the level of profit that is generated by ongoing operations and is therefore available for distribution to shareholders.
Management believes this allows the Group to more effectively assess performance for the current period against prior periods and to compare performance across business divisions and across peer companies.
Three categories of adjustments are made to reported results to determine cash earnings:
Material items that key decision makers at the Westpac Group believe do not reflect ongoing operations;
Items that are not considered when dividends are recommended, such as the amortisation of intangibles, impact of Treasury shares and economic hedging impacts; and
Accounting reclassifications between individual line items that do not impact reported results, such as policyholder tax recoveries1.
A full reconciliation of reported results to cash earnings is set out in Section 5, Note 8.
Reconciliation of reported results to cash earnings
% M ov't % M ov't
$mHalf YearMarch 15
Half YearSept 14
Half YearMarch 14
Mar 15 -Sept 14
Mar 15 - Mar 14
NET PROFIT ATTRIBUTABLE TO OWNERS OF WESTPAC BANKING CORPORATION 3,609 3,939 3,622 (8) -
Treasury shares 37 (6) 13 large 185
Ineffective hedges (1) 29 17 (103) (106)
Fair value on economic hedges 26 (151) 46 117 (43)
Buyback of government guaranteed debt (1) (12) (30) (92) (97)
Fair value amortisation of f inancial instruments - 8 9 (100) (100)
Amortisation of intangible assets 73 77 70 (5) 4
Acquisition, transaction and integration expenses 35 26 25 35 40
Bell litigation provision - (54) - (100) -
Westpac Bicentennial Foundation grant - 70 - (100) -
Prior period tax provisions - (70) - (100) -
Total cash earnings adjustments (post-tax) 169 (83) 150 large 13
Cash earnings 3,778 3,856 3,772 (2) -
Outlined below are the cash earnings adjustments to the reported result:
Treasury shares – Under AAS, Westpac shares held by the Group in the managed funds and life businesses are deemed to be Treasury shares and the results of holding these shares are not permitted to be recognised as income in the reported results. In deriving cash earnings, these results are included to ensure there is no asymmetrical impact on the Group’s profits because the Treasury shares support policyholder liabilities and equity derivative transactions which are re-valued in determining income;
Ineffective hedges – The (gain)/loss on ineffective hedges is reversed in deriving cash earnings for the period because the gain or loss arising from the fair value movement in these hedges reverses over time and does not affect the Group’s profits over time;
Fair value on economic hedges (which do not qualify for hedge accounting under AAS) comprise:
- The unrealised fair value (gain)/loss on foreign exchange hedges of future New Zealand earnings impacting non-interest income is reversed in deriving cash earnings as they may create a material timing difference on reported results but do not affect the Group’s cash earnings over the life of the hedge; and
- The unrealised fair value (gain)/loss on hedges of accrual accounted term funding transactions are reversed in deriving cash earnings as they may create a material timing difference on reported results but do not affect the Group’s cash earnings over the life of the hedge.
1 Policyholder tax recoveries – Income and tax amounts that are grossed up to comply with the AAS accounting standard covering Life
Insurance Business (policyholder tax recoveries) are reversed in deriving income and taxation expense on a cash earnings basis.

Interim financial results 2015 Group results
Westpac Group 2015 Interim Results Announcement | 5
Buyback of Government guaranteed debt – The Group bought back certain Government guaranteed debt issues which reduced Government guarantee fees (70 basis points) paid. In undertaking the buybacks, a cost was incurred reflecting the difference between current interest rates and the rate at which the debt was initially issued. In the reported result, the cost incurred was recognised at the time of the buyback. In cash earnings, the cost incurred was being amortised over the original term of the debt that was bought back, consistent with a 70 basis point saving being effectively spread over the remaining life of the issue. The cash earnings adjustment gives effect to the timing difference between reported results and cash earnings;
Fair value amortisation of financial instruments – The accounting for the merger with St.George resulted in the recognition of fair value adjustments on the St.George retail bank loans, deposits, wholesale funding and associated hedges, with these fair value adjustments being amortised over the life of the underlying transactions. The amortisation of these adjustments is considered to be a timing difference relating to non-cash flow items that do not affect cash distributions available to shareholders and therefore, have been treated as a cash earnings adjustment;
Amortisation of intangible assets - The merger with St.George, the acquisition of J O Hambro Capital Management (JOHCM) and the acquisition of Lloyds resulted in the recognition of identifiable intangible assets. These assets include intangibles related to core deposits, customer relationships, management contracts and distribution relationships. These intangible items are amortised over their useful lives, ranging between four and twenty years. The amortisation of these intangible assets (excluding capitalised software) is a cash earnings adjustment because it is a non-cash flow item and does not affect cash distributions available to shareholders;
Acquisition, transaction and integration expenses - Costs associated with the acquisition of Lloyds have been treated as a cash earnings adjustment as they do not reflect the earnings expected from the acquired businesses following the integration period;
Bell litigation provision – During 2012, the Group recognised additional provisions in respect of the long running Bell litigation. This was treated as a cash earnings adjustment at the time due to its size, historical nature and because it did not reflect ongoing operations. In Second Half 2014, the Bell litigation was settled and the release of provisions no longer required was treated as a cash earnings adjustment;
Westpac Bicentennial Foundation grant – In Second Half 2014, the Group provided a grant to establish the Westpac Bicentennial Foundation. The $100 million grant ($70 million after tax) has been treated as a cash earnings adjustment due to its size and because it does not reflect ongoing operations; and
Prior period tax provisions – During 2011, the Group raised provisions in respect of certain tax positions for transactions previously undertaken by the Group. In Second Half 2014, a number of these matters were resolved, resulting in a release of the provisions which were no longer required. As the provisions raised were treated as a cash earnings adjustment, the release was treated in a consistent manner.
The guidance provided in Australian Securities and Investments Commission Regulatory Guide 230 has been followed when presenting this information.
Review of 2015 Interim financial statements
PricewaterhouseCoopers has reviewed the 2015 interim financial statements contained within Section 4 of this interim results announcement and has issued an unmodified review report. Financial information contained in other sections of this interim results announcement has not been subject to review by PricewaterhouseCoopers. The financial information contained in sections other than Section 4 includes financial information extracted from the reviewed interim financial statements together with financial information that has not been reviewed. The cash earnings disclosed outside of Section 4 of this interim results announcement have not been separately reviewed, however they are consistent with the financial information included in Note 14 of the reviewed 2015 interim financial report contained in Section 4.

Interim financial results 2015 Group results
6 | Westpac Group 2015 Interim Results Announcement
1.4 Market share and system multiple metrics
1.4.1 Market share
As at As at As at31 March
201530 Sept
201431 March
2014
Australia
Banking system (APRA)1
Housing credit2 25% 25% 25%
Cards 23% 23% 23%
Household deposits 23% 23% 23%
Business deposits 20% 20% 20%
Financial system (RBA)3
Housing credit2 23% 23% 23%
Business credit 19% 19% 19%
Retail deposits4 21% 21% 21%
New Zealand5,6
Consumer lending 20% 20% 20%
Deposits 21% 21% 21%
Business lending 16% 16% 16%
Australian Wealth Management7
Platforms (includes Wrap and Corporate Super) 20% 20% 20%
Retail (excludes Cash) 19% 18% 19%
Corporate Super 15% 15% 14%
Funds Management - BTIM 5% 4% 5%
Wholesale - BTIM/Advance Asset Management 2% 3% 2%
Australian Life Insurance8
Life Insurance - in-force 9% 9% 9%
Life Insurance - new business 12% 11% 11% 1.4.2 System multiples
Half YearMarch 15
Half YearSept 14
Half YearMarch 14
Australia
Banking system (APRA)1
Housing credit2 0.9 1.0 0.9
Cards9 0.5 n/a 1.9
Household deposits 1.0 1.3 1.0
Business deposits9 1.2 1.0 n/a
Financial system (RBA)3
Housing credit2 0.9 1.0 0.9
Business credit 0.9 1.4 1.1
Retail deposits4 0.7 1.2 0.0
New Zealand5,6
Consumer lending 0.9 1.2 1.0
Deposits 1.1 0.6 1.0 1 Source: Australian Prudential Regulation Authority (APRA). 2 Includes securitised loans. 3 Source: Reserve Bank of Australia (RBA). 4 Retail deposits as measured by the RBA, financial system includes financial corporations deposits. 5 New Zealand comprises New Zealand banking operations. 6 Source: Reserve Bank of New Zealand (RBNZ). 7 Market Share Funds under Management/Funds under Administration based on published market share statistics from Plan for Life
and Morningstar as at 31 December 2014 (for First Half 2015), as at 30 June 2014 (for Second Half 2014), as at 31 December 2013 (for First Half 2014) and represents the BT Wealth business market share reported at these times.
8 Source: Life Insurance – Plan for Life 31 December 2014 (for First Half 2015), 30 June 2014 (for Second Half 2014), 31 December 2013 (for First Half 2014).
9 n/a indicates that system growth or Westpac growth was negative.

Interim financial results 2015 Review of Group operations
Westpac Group 2015 Interim Results Announcement | 7
2.0 Review of Group operations
Movement in cash earnings ($m)First Half 2015 - Second Half 2014
115
Operating expenses
Second Half 2014 cash earnings
(73)
Non-interest income
(56)
Net interest income
3,856
(78)
First Half 2015 cash earnings
3,778
(32)
Tax & non-controlling interests
Impairment charges
(32)
Movement in cash earnings ($m)First Half 2015 - First Half 2014
34257
+6
First Half 2015 cash earnings
3,778
Tax & non-controlling interests
Impairment charges
(0)
Operating expenses
(189)
Non-interest income
3,772
Net interest income
(96)
First Half 2014 cash earnings

Interim financial results 2015 Review of Group operations
8 | Westpac Group 2015 Interim Results Announcement
2.1 Performance overview
Overview
Westpac delivered cash earnings of $3,778 million, a reduction of $78 million or 2% compared to Second Half 2014. The result included a charge of $122 million ($85 million after tax) for the previously announced methodology changes to derivative valuation adjustments (derivative adjustments) which included the first time adoption of a funding valuation adjustment. Before this charge, cash earnings were little changed (up $7 million) compared to Second Half 2014. While cash earnings (before derivative adjustments) were flat, the quality of the result was sound with the improved financial operating performance across divisions offset by a lower contribution from Treasury, and a reduced benefit from infrequent and volatile items.
Solid operating performances across the Group’s retail and business banking divisions (representing around 70% of the Group’s cash earnings) were a highlight of the result. Compared to the prior half, St.George and Westpac New Zealand1 increased cash earnings by 4%, while Westpac RBB increased cash earnings by 2%. BT Financial Group (BTFG) and Westpac Institutional Bank (WIB) each reported lower cash earnings over the prior half.
BTFG delivered higher FUM and FUA balances (up 16% and 11% respectively) and increased insurance premium income, although these gains were offset by a rise in insurance claims, mostly related to the Brisbane hail storm in November and Cyclone Marcia (Queensland) in February. As a result, BTFG’s cash earnings were $8 million (or 2%) lower than the prior period.
WIB’s result was impacted by the derivative adjustments highlighted above and combined with a lower impairment benefit, contributed to a 13% decline in cash earnings over the prior half. Reflecting the strength of WIB’s customer franchise, WIB’s core earnings increased 4% over the prior half, before the derivative adjustments.
The Group’s cash earnings of $3,778 million for First Half 2015 translated to cash earnings per share of 121.3 cents and a return on equity of 15.8%. Cash earnings per share were down 2% compared to Second Half 2014 and flat on First Half 2014, consistent with the lower cash earnings.
The Board has determined an interim ordinary dividend of 93 cents per share, fully franked, up 1 cent or 1% on the 2014 final ordinary dividend. The interim ordinary dividend for First Half 2015 represents a payout ratio of 76.8% and a dividend yield of 4.7%2. The interim ordinary dividend will be paid on 2 July 2015 with the record date 15 May 20153. After allowing for the interim dividend, the Group’s adjusted franking account balance is $471 million.
Financial performance summary First Half 2015 – Second Half 2014
Net interest income was up 2% with average interest-earning assets rising 3% and net interest margins falling 1 basis point to 2.05%. Margins excluding Treasury and Markets were flat over the half with improved deposit spreads and lower wholesale funding costs offset by strong competition impacting asset spreads, lower returns on capital and an increase in liquidity costs.
Loan growth of 4% was supported by a 3% rise in Australian housing lending and a 2% lift in Australian business lending, with much of the business growth in corporate lending. New Zealand lending grew 3% over the last six months in NZ$, with the strengthening of the NZ$ seeing NZ lending increase 13% in A$ terms. Australian customer deposits grew 2% in First Half 2015 with particular strength in transaction accounts. New Zealand customer deposits grew 4% in NZ$ (14% in A$).
Non-interest income was down 2% following the derivative adjustments highlighted earlier. Before this impact, non-interest income was up 2% including higher foreign exchange income and a rise in business fees. These gains were partially offset by higher insurance claims, including severe weather events, which tend to be more prevalent in the first half of the year.
Expenses increased 2% (1% excluding foreign currency translation impacts), with most of the increase related to investment in growth areas including Asia, Wealth and Small and Medium Enterprises (SME). Operating expense increases were largely offset by $113 million in productivity savings.
While asset quality continued to improve over the half, impairment charges were $32 million higher, with the rise mostly due to lower provision recoveries. There was minimal change to economic overlay provisions.
The effective tax rate was 29.7% in First Half 2015 compared to 29.0% for Second Half 2014. The rise in the effective tax rate was principally because Second Half 2014 benefited from the finalisation of prior period taxation matters.
1 In A$ equivalent. 2 Based on closing share price on 31 March 2015 of $39.38. 3 Record date for 2015 interim dividend in New York is 14 May 2015.

Interim financial results 2015 Review of Group operations
Westpac Group 2015 Interim Results Announcement | 9
Financial performance summary First Half 2015 – First Half 2014
Cash earnings in First Half 2015 were little changed compared to First Half 2014 (up $6 million). The relatively flat result was mostly due to the impact of the derivative adjustments; before this impact cash earnings were 2% higher.
Net interest income was 4% higher, with a 7% rise in average interest-earning assets partially offset by a 6 basis point decline in net interest margins. The decline in margin was due to a lower Treasury and Markets contribution with margins excluding Treasury and Markets flat.
Lending increased 7% with Australian mortgages continuing to be the main area of growth. Australian business lending increased 5% with most growth recorded in infrastructure and property. Lending in New Zealand increased 6% (in NZ$) (10% in A$). Customer deposits rose $31.4 billion, or 8%, over the past year with the deposit to loan ratio at 69.5%.
Non-interest income was 3% lower, mostly due to the derivative adjustments. Excluding this, non-interest income was up 1%.
Expenses were 5% higher (4% excluding foreign currency translation impacts), with around 1% of the rise due to the acquisition of Lloyds in December 2013 and foreign currency translation impacts. Most expense growth continues to be driven by targeted investment associated with Asia, Wealth and Bank of Melbourne. Operating expense growth continues to be broadly offset by productivity benefits.
Impairment charges were unchanged over the past year with a reduction in charges associated with new impaired assets, largely offset by a reduction in the level of provision recoveries.
Strategic priorities
During the half the Group further reinforced its customer focus, adding the word “service” to its corporate vision which now reads:
To be one of the world’s great service companies, helping our customers, communities and people to prosper and grow.
To deliver on this vision the Group has refreshed its strategic priorities, which now include: performance discipline, service revolution, digital transformation, targeted growth and workforce revolution. Each of these are discussed below.
Performance discipline
The Group has continued to manage its business in a disciplined way across strength/return/productivity and growth.
For example, the Group has delivered sound growth in lending and deposits while managing margins consistently. The Group’s net interest margin excluding Treasury and Markets income has been unchanged for the last three halves.
Strength remains a hallmark of the Group. This includes: improved asset quality across all dimensions; a further strengthening of the Group’s funding and liquidity position; and maintaining capital ratios within the Group’s preferred range of 8.75% to 9.25%.
The improvement in asset quality was reflected in a further fall in the ratio of stressed assets to total committed exposures (TCE) to 1.12%. This ratio is down 12 basis points over the last six months and is 25 basis points lower than a year earlier. Consumer delinquencies have also remained low while 90+day mortgage delinquencies are unchanged compared to Second Half 2014.
Despite the improvement in asset quality, provisioning levels were a little higher. While the rise in provisions has been predominantly due to exchange rate movements, provision coverage ratios remain high. Almost half of the impaired portfolio is covered by individually assessed provisions with the ratio of provisions to impaired assets at 48%. The economic overlay was largely unchanged over the last six months (down $2 million to $387 million).
While capital ratios remain high, a number of regulatory changes are under discussion that are likely to impact future capital levels. Although these impacts remain somewhat uncertain, the Group has decided it is prudent to accelerate its capital generation and lift its CET1 capital ratio towards the upper end of its preferred range. To help achieve this objective the Group has introduced a 1.5% discount on its dividend reinvestment plan (DRP) and entered into an agreement to have the DRP on the interim dividend partially underwritten, which is over and above the participation in the DRP. It is estimated that $2 billion worth of Westpac ordinary shares will be issued under the DRP and the DRP partially underwritten, which equates to approximately a 60 basis point increase in the CET1 ratio.

Interim financial results 2015 Review of Group operations
10 | Westpac Group 2015 Interim Results Announcement
On 1 January 2015 the Liquidity Coverage Ratio (LCR) came into effect for Australian banks, requiring them to maintain a LCR greater than 100%. The LCR measures the level of qualifying liquid assets (defined by APRA) divided by the net cash outflows over an APRA-defined modelled 30 day stressed scenario. Maintaining an LCR above 100% improves the sustainability of a bank in response to extreme liquidity shocks. At 31 March 2015 Westpac’s LCR was 114%, comfortably above the prescribed minimum of 100%.
Service revolution
To support its vision of becoming one of the world’s great service companies, the Group has launched the ‘Service Revolution’ program which aims to: provide more personalised service; enable customers to manage their finances when and where they want; and to deliver outstanding customer experiences. The Group is making good progress on this program which is reflected across a range of metrics including:
St.George ranked above the major banks for consumer customer satisfaction1 and ranked equal number 1 for business customer satisfaction2. Westpac RBB ranked equal number 1 of the major banks for consumer1 and business2 customer satisfaction;
A rise in customer numbers, with total customers of 13.0 million (up 2% compared to Second Half 2014);
A reduction in complaints, which fell 35% compared to First Half 2014 across the Australian retail banking businesses; and
Numerous external service awards including: Westpac RBB awarded Best Retail Bank in Asia Pacific and Best Retail Bank in Australia; Westpac New Zealand awarded Best Retail Bank in New Zealand; St.George awarded Best Mobile Banking Platform; and BTFG awarded best Wealth provider in Asia Pacific by the Asian Banker magazine3.
Digital transformation
The Group has continued to roll-out a range of new and innovative technology solutions to provide enhanced services and more convenient access for customers. Over the prior half these have included:
Completed the migration of 3.1 million consumer customers to Westpac Live, a state of the art online and mobile banking platform in Westpac RBB;
Launched the second phase of Westpac Live, with 300,000 business customers migrated onto the Westpac Live platform;
Introduced additional online functionality including fingerprint recognition, customised alerts and new ways of grouping and sharing data;
Launched Westpac New Zealand’s new online and mobile banking platform (Westpac One), with over 500,000 customers or 39% having signed up for this platform;
Upgraded a further 49 branches, with 24/7 access and more self-serve options; and
Upgraded 249 branches to provide real time connectivity with financial services specialists across business banking, merchant services and advice.
The Group is continuing to see more customers take advantage of the increased convenience and access of its digital channels for sales and service. In First Half 2015 this has included:
4% of applications for mortgages, 33% of new credit card accounts and 15% of new transaction accounts were opened online during the half; and
More customers updating their details online with 1.9 million addresses and contact details updated, 148,000 advice of overseas travel plans and 34,000 notifications of stolen or missing credit cards performed online;
In addition to providing a better service experience for customers, the Group expects that increased use of digital will support steady productivity improvements.
Targeted growth
The Group achieved growth across banking, wealth, insurance and financial markets services over the half. The Group continues to focus on three areas of growth: Asia, Wealth and SME.
In Asia, the Group has continued to build its capability in the region and is continuing to grow its customer base, particularly with customers looking to do more business in Australia and New Zealand.
1 Source: Roy Morgan Research, March 2015, 6MMA. 2 Source: DBM Consultants, Business Financial Services Monitor, March 2015, 6MMA. 3 Source: Asian Banker Magazine March 2015.

Interim financial results 2015 Review of Group operations
Westpac Group 2015 Interim Results Announcement | 11
In Wealth, the Group already has a leading position in platforms and recorded a further uplift in the value of the franchise. During First Half 2015, the Group has seen:
FUM and FUA balances up 16% and 11% respectively; and
Life Insurance in-force premiums up 4% and General Insurance gross written premiums up 5%.
The Group is also developing a new wealth operating system that will significantly change how investment portfolios are managed. Called Panorama, the system was first launched in 2014, and new functionality is being progressively added to the system. In First Half 2015, this included the launch of managed portfolios, adding to the cash hub capability launched in 2014 that has now attracted over $1 billion in FUA. Over 1,300 advisors are now registered on the platform.
For SME customers, the Group is substantially increasing its reach and capability with its Business Connect and Connect Now models. These models are simplifying the account opening process for SME customers while giving them greater access to business specialists via video conferencing. The Group has also focused on using the expertise of WIB to selectively expand the services available to SME customers. This partnership between the Group’s retail and business banks (Westpac RBB and St.George) and the institutional bank has shown strong progress over the half and this has been reflected in a lift in financial markets product sales, supporting SME’s to better manage their currency and interest rate risks.
Workforce revolution
Successful achievement of the Group’s vision will depend on the quality of our people and culture with Westpac already regarded as a global leader in staff engagement, diversity and flexibility.
To support the performance, service and transformation ambitions described above, the Group is continuing to invest in the capabilities of its people and ‘One Team’ culture. The workforce revolution initiatives are designed to attract and retain the best leaders in banking. This will be achieved by providing employees with the skills and development they need to achieve their potential and ensure the Group continues to develop an engaging, inclusive and highly collaborative culture.
Key highlights for the half included:
Approximately 2,500 employees have completed the Best Banker program. This program provides market leading and externally recognised professional qualifications;
Women in leadership is 44%, up from 43% at 31 March 2014;
Employed 19 indigenous interns as part of CareerTrackers; and
High performer retention is 95.7%.
Divisional performance summary1
Westpac Retail and Business Banking
Westpac RBB delivered another solid performance with a 2% increase in both core and cash earnings. The division has now increased cash earnings for each of the last nine halves. The investment in the front line has continued to deliver with a 2% increase in average interest-earning assets and a 1 basis point increase in margin. Non-interest income was up 1%, with higher revenue from trade and merchant activity and from foreign exchange related sales. Expenses were well controlled with productivity initiatives partly offsetting operating expense increases and higher investment costs. This includes the further upgrade of the branch network and the roll-out of Westpac Live.
St.George
St.George continued to build on its momentum of recent halves with cash earnings up 4% and core earnings rising 3%. Revenue increased 1% as a 2% increase in average interest-earning assets was partly offset by a 2 basis point decline in margins. Expenses were lower, largely from benefits received from branch optimisation and synergies from the acquisition of Lloyds. This has led to a reduction in the expense to income ratio to 37.9%. Impairment charges were also lower reflecting further improvements in asset quality.
BT Financial Group
BTFG’s cash earnings were $8 million (or 2%) lower with a $17 million increase in Funds Management cash earnings and a rise in the contribution from capital more than fully offset by a $43 million reduction in insurance cash earnings. The lower insurance result was due to a seasonal rise in claims, mostly related to two severe weather events. The business has continued to expand with higher FUM and FUA balances (up 16% and 11% respectively) and increased insurance premiums.
1 Discussion relates to comparisons against Second Half 2014 unless stated otherwise.

Interim financial results 2015 Review of Group operations
12 | Westpac Group 2015 Interim Results Announcement
Westpac Institutional Bank (WIB)
WIB cash earnings were $93 million or 13% lower. The decline was principally due to the impact of the previously disclosed derivative adjustments and a lower impairment benefit. These items reduced cash earnings by $85 million and $16 million respectively. The business has achieved good growth in financial markets sales and lifted lending by 6%. However, intense competition, especially for quality assets, has contributed to an 11 basis point decline in net interest margins. Asset quality continues to improve and this contributed to the impairment benefit of $22 million in the current half.
Westpac New Zealand
Westpac New Zealand delivered another solid performance with cash earnings of NZ$441 million up 2% (up 4% in A$). The result was driven by a 3% lift in revenue and well managed expenses, which increased 2%. Revenue growth was supported by disciplined deposit and loan growth up 4% and 3% respectively, with deposits fully funding lending in the half. Net interest margins increased 2 basis points to 2.29%. Asset quality has remained strong although there has been a small rise in measures of stress (off a low base) which led to a NZ$9 million increase in impairment charges.
Westpac Pacific
Westpac Pacific increased cash earnings 4% to $59 million. The rise was supported by favourable exchange rate movements and good balance sheet growth with deposits up 15% and loans up 11%. These positive moves were partially offset by the introduction of foreign exchange controls in PNG in July 2014 which has reduced foreign exchange volumes and margins. The division has continued to expand, with customer numbers in PNG and Fiji growing 71,000 (or 18%) over the half.
Group Businesses
Cash earnings in Group Businesses were $46 million lower due to a $31 million reduction in the contribution from Treasury and a rise in the effective tax rate. The lower Treasury result was due to the challenging operating environment which impacted revenue across all Treasury portfolios. The higher effective tax rate was principally due to Second Half 2014 benefiting from the finalisation of prior period tax matters.
Interim financial results 2015 Review of Group operations
Westpac Group 2015 Interim Results Announcement | 13
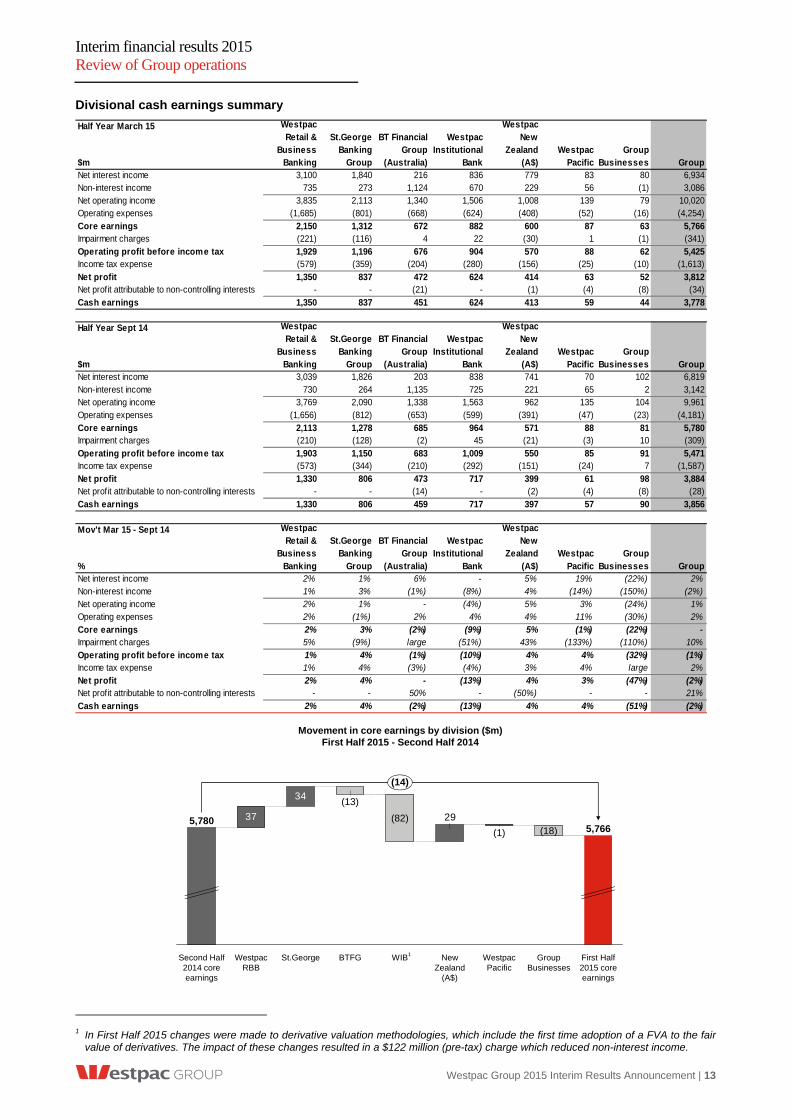
Divisional cash earnings summary
Half Year March 15
$mNet interest income 3,100 1,840 216 836 779 83 80 6,934Non-interest income 735 273 1,124 670 229 56 (1) 3,086Net operating income 3,835 2,113 1,340 1,506 1,008 139 79 10,020Operating expenses (1,685) (801) (668) (624) (408) (52) (16) (4,254)Core earnings 2,150 1,312 672 882 600 87 63 5,766Impairment charges (221) (116) 4 22 (30) 1 (1) (341)Operating profit before income tax 1,929 1,196 676 904 570 88 62 5,425Income tax expense (579) (359) (204) (280) (156) (25) (10) (1,613)Net profit 1,350 837 472 624 414 63 52 3,812Net prof it attributable to non-controlling interests - - (21) - (1) (4) (8) (34)Cash earnings 1,350 837 451 624 413 59 44 3,778
Half Year Sept 14
$mNet interest income 3,039 1,826 203 838 741 70 102 6,819Non-interest income 730 264 1,135 725 221 65 2 3,142Net operating income 3,769 2,090 1,338 1,563 962 135 104 9,961Operating expenses (1,656) (812) (653) (599) (391) (47) (23) (4,181)Core earnings 2,113 1,278 685 964 571 88 81 5,780Impairment charges (210) (128) (2) 45 (21) (3) 10 (309)Operating profit before income tax 1,903 1,150 683 1,009 550 85 91 5,471Income tax expense (573) (344) (210) (292) (151) (24) 7 (1,587)Net profit 1,330 806 473 717 399 61 98 3,884Net prof it attributable to non-controlling interests - - (14) - (2) (4) (8) (28)Cash earnings 1,330 806 459 717 397 57 90 3,856
Mov't Mar 15 - Sept 14
%Net interest income 2% 1% 6% - 5% 19% (22%) 2%Non-interest income 1% 3% (1%) (8%) 4% (14%) (150%) (2%)Net operating income 2% 1% - (4%) 5% 3% (24%) 1%Operating expenses 2% (1%) 2% 4% 4% 11% (30%) 2%Core earnings 2% 3% (2%) (9%) 5% (1%) (22%) -Impairment charges 5% (9%) large (51%) 43% (133%) (110%) 10%Operating profit before income tax 1% 4% (1%) (10%) 4% 4% (32%) (1%)Income tax expense 1% 4% (3%) (4%) 3% 4% large 2%Net profit 2% 4% - (13%) 4% 3% (47%) (2%)Net prof it attributable to non-controlling interests - - 50% - (50%) - - 21%Cash earnings 2% 4% (2%) (13%) 4% 4% (51%) (2%)
BT Financial Group
(Australia)
Westpac New
Zealand (A$)
Westpac Institutional
Bank
St.George Banking
Group
BT Financial Group
(Australia)
Westpac Retail &
Business Banking
St.George Banking
Group
Westpac Retail &
Business Banking
BT Financial Group
(Australia)
Westpac Retail &
Business Banking
Westpac Institutional
Bank
St.George Banking
Group
Westpac Institutional
Bank
Westpac New
Zealand (A$)
Westpac Pacific
Group Businesses
Westpac Pacific
Westpac New
Zealand (A$)
Group Businesses Group
Group
Westpac Pacific
Group Businesses Group
Movement in core earnings by division ($m)First Half 2015 - Second Half 2014
29
34
37
First Half 2015 core earnings
(14)
5,766
Group Businesses
(18)
Westpac Pacific
(1)
New Zealand
(A$)
WIB
(82)
BTFG
(13)
St.GeorgeWestpac RBB
Second Half 2014 core earnings
5,780
1
1 In First Half 2015 changes were made to derivative valuation methodologies, which include the first time adoption of a FVA to the fair
value of derivatives. The impact of these changes resulted in a $122 million (pre-tax) charge which reduced non-interest income.

Interim financial results 2015 Review of Group operations
14 | Westpac Group 2015 Interim Results Announcement
Divisional cash earnings summary (continued)
Half Year March 15
$mNet interest income 3,100 1,840 216 836 779 83 80 6,934Non-interest income 735 273 1,124 670 229 56 (1) 3,086Net operating income 3,835 2,113 1,340 1,506 1,008 139 79 10,020Operating expenses (1,685) (801) (668) (624) (408) (52) (16) (4,254)Core earnings 2,150 1,312 672 882 600 87 63 5,766Impairment charges (221) (116) 4 22 (30) 1 (1) (341)Operating profit before income tax 1,929 1,196 676 904 570 88 62 5,425Income tax expense (579) (359) (204) (280) (156) (25) (10) (1,613)Net profit 1,350 837 472 624 414 63 52 3,812Net prof it attributable to non-controlling interests - - (21) - (1) (4) (8) (34)Cash earnings 1,350 837 451 624 413 59 44 3,778
Half Year March 14
$mNet interest income 2,914 1,705 203 820 714 70 251 6,677Non-interest income 711 251 1,122 745 217 87 49 3,182Net operating income 3,625 1,956 1,325 1,565 931 157 300 9,859Operating expenses (1,610) (747) (670) (575) (385) (52) (26) (4,065)Core earnings 2,015 1,209 655 990 546 105 274 5,794Impairment charges (226) (108) 4 90 (3) (6) (92) (341)Operating profit before income tax 1,789 1,101 659 1,080 543 99 182 5,453Income tax expense (536) (332) (193) (330) (149) (29) (74) (1,643)Net profit 1,253 769 466 750 394 70 108 3,810Net prof it attributable to non-controlling interests - - (25) - (1) (5) (7) (38)Cash earnings 1,253 769 441 750 393 65 101 3,772
Mov't Mar 15 - Mar 14
%Net interest income 6% 8% 6% 2% 9% 19% (68%) 4%Non-interest income 3% 9% - (10%) 6% (36%) (102%) (3%)Net operating income 6% 8% 1% (4%) 8% (11%) (74%) 2%Operating expenses 5% 7% - 9% 6% - (38%) 5%Core earnings 7% 9% 3% (11%) 10% (17%) (77%) -Impairment charges (2%) 7% - (76%) large (117%) (99%) -Operating profit before income tax 8% 9% 3% (16%) 5% (11%) (66%) (1%)Income tax expense 8% 8% 6% (15%) 5% (14%) (86%) (2%)Net profit 8% 9% 1% (17%) 5% (10%) (52%) -Net prof it attributable to non-controlling interests - - (16%) - - (20%) 14% (11%)Cash earnings 8% 9% 2% (17%) 5% (9%) (56%) -
Westpac Retail &
Business Banking
Westpac Retail &
Business Banking
St.George Banking
Group
BT Financial Group
(Australia)
Westpac Institutional
Bank
Westpac New
Zealand (A$)
Westpac Pacific
Group Businesses Group
St.George Banking
Group
BT Financial Group
(Australia)
Westpac Institutional
Bank
Westpac New
Zealand (A$)
Westpac Pacific
Group Businesses Group
Westpac Retail &
Business Banking
St.George Banking
Group
BT Financial Group
(Australia)
Westpac Institutional
Bank
Westpac New
Zealand (A$)
Westpac Pacific
Group Businesses Group
Movement in core earnings by division ($m)First Half 2015 - First Half 2014
5417
103
135
Westpac RBB
First Half 2014 core earnings
5,794
First Half 2015 core earnings
(28)
5,766
Group Businesses
(211)
Westpac Pacific
(18)
New Zealand
(A$)
(108)
BTFGSt.George WIB1
1 In First Half 2015 changes were made to derivative valuation methodologies, which include the first time adoption of a FVA to the fair
value of derivatives. The impact of these changes resulted in a $122 million (pre-tax) charge which reduced non-interest income.

Interim financial results 2015 Review of Group operations
Westpac Group 2015 Interim Results Announcement | 15
2.2 Review of earnings
2.2.1 Net interest income1
% M ov't % M ov't
$mHalf YearMarch 15
Half YearSept 14
Half YearMarch 14
Mar 15 -Sept 14
Mar 15 - Mar 14
Net interest income
Net interest income excluding Treasury & Markets 6,787 6,633 6,382 2 6
Treasury net interest income2 92 129 250 (29) (63)
Markets net interest income 55 57 45 (4) 22
Net interest income 6,934 6,819 6,677 2 4
Average interest-earning assets
Loans 566,391 548,700 528,896 3 7
Third party liquid assets3 78,460 77,133 75,579 2 4
Other interest-earning assets 33,717 33,170 31,182 2 8
Average interest-earning assets 678,568 659,003 635,657 3 7
Net interest margin
Group net interest margin 2.05% 2.06% 2.11% (1bps) (6bps)
Group net interest margin excluding Treasury & Markets 2.01% 2.01% 2.01% - -
First Half 2015 – Second Half 2014
Net interest income increased $115 million or 2% compared to Second Half 2014. Key components included:
Net interest income excluding Treasury and Markets increased $154 million or 2%, reflecting 3% growth in average interest-earning assets (AIEA) and an unchanged Group net interest margin excluding Treasury and Markets; and
In aggregate, Treasury and Markets net interest income decreased $39 million or 21% due to lower returns in Treasury related to the liquid asset portfolio and balance sheet management activities.
First Half 2015 – First Half 2014
Net interest income increased $257 million or 4% compared to First Half 2014. Key components included:
Net interest income excluding Treasury and Markets increased $405 million or 6% reflecting a 7% growth in AIEA and unchanged Group net interest margin excluding Treasury and Markets; and
In aggregate, Treasury and Markets net interest income decreased $148 million or 50% due to lower returns in Treasury related to the liquid asset portfolio and balance sheet management activities.
1 Refer to Section 4 Note 3 for reported results breakdown. Refer to Section 5 Note 3 for cash earnings results breakdown. As
discussed in Section 1.3, commentary is reflected on a cash earnings basis. 2 Treasury net interest income excludes capital benefit. 3 Refer Glossary for definition.

Interim financial results 2015 Review of Group operations
16 | Westpac Group 2015 Interim Results Announcement
2.2.2 Loans1
As at As at As at % M ovt % M ov't
$m31 March
201530 Sept
201431 March
2014Mar 15 -Sept 14
Mar 15 - Mar 14
Australia 523,780 508,575 490,959 3 7Housing 362,779 351,037 338,036 3 7Personal (loans and cards) 21,952 21,242 20,524 3 7Business 139,677 136,903 133,197 2 5Margin lending 1,924 1,960 2,038 (2) (6)Other (including provisions) (2,552) (2,567) (2,836) (1) (10)
New Zealand (A$) 65,774 58,076 59,636 13 10
New Zealand (NZ$) 67,107 65,018 63,604 3 6Housing 40,800 39,705 38,669 3 6Personal (loans and cards) 1,894 1,832 1,786 3 6Business 24,769 23,821 23,493 4 5Other (including provisions) (356) (340) (344) 5 3
Other overseas 15,510 13,692 13,974 13 11Trade f inance 5,767 6,147 7,098 (6) (19)Other loans 9,743 7,545 6,876 29 42
Total loans 605,064 580,343 564,569 4 7
First Half 2015 – Second Half 2014
Total loans were $24.7 billion or 4% higher than Second Half 2014. Excluding foreign exchange translation impacts, total loans increased $17.1 billion or 3%.
Key features of total loan growth were:
Australian housing loans increased $11.7 billion or 3% at 0.9x system2. New lending volumes were similar whilst run-off increased 6% due to accelerated customer repayments;
Australian personal loans and cards increased $0.7 billion or 3%, mostly reflecting growth in the auto finance portfolio;
Australian business loans increased $2.8 billion or 2%, primarily in WIB in the property and natural resources segments;
New Zealand loans increased NZ$2.1 billion or 3%. Mortgages grew at 3% and business lending was up 4%, including growth in the agriculture sector; and
Other overseas lending increased $1.8 billion or 13%, with the majority of growth reflecting foreign exchange translation impacts. Trade finance volumes were lower, impacted by lower commodity prices.
First Half 2015 – First Half 2014
Total loans were $40.5 billion or 7% higher than First Half 2014. Excluding foreign exchange translation impacts, total loans increased $35.2 billion or 6%.
Key features of total loan growth were:
Australian housing loans increased $24.7 billion or 7%. New lending volumes increased 12%, whilst run-off increased 7% due to accelerated customer repayments;
Australian personal loans and cards increased $1.4 billion or 7%, reflecting growth in both the auto finance and credit card portfolios;
Australian business loans increased $6.5 billion or 5%. Growth was highest in the WIB portfolio mainly in infrastructure, property and natural resources, whilst Westpac RBB and St.George reported modest growth;
New Zealand lending increased NZ$3.5 billion or 6%. Mortgages grew at 6% and business lending increased 5%, including growth in agriculture lending; and
1 Spot loan balances. 2 Source: RBA.

Interim financial results 2015 Review of Group operations
Westpac Group 2015 Interim Results Announcement | 17
Other overseas loans increased $1.5 billion or 11%, with the majority of growth reflecting foreign currency translation impacts. Trade finance volumes reduced, impacted by lower commodity prices.
2.2.3 Deposits and other borrowings1
As at As at As at % M ovt % M ov't
$m31 March
201530 Sept
201431 March
2014Mar 15 -Sept 14
Mar 15 - Mar 14
Customer deposits
Australia 353,841 347,649 329,369 2 7
At call 196,292 187,904 178,755 4 10
Term 128,352 133,972 127,447 (4) 1
Non-interest bearing 29,197 25,773 23,167 13 26
New Zealand (A$) 50,431 44,135 45,344 14 11
New Zealand (NZ$) 51,452 49,410 48,359 4 6
At call 22,549 20,620 20,420 9 10
Term 25,057 25,189 24,481 (1) 2
Non-interest bearing 3,846 3,601 3,458 7 11
Other overseas (A$) 15,979 17,461 14,178 (8) 13
Total customer deposits 420,251 409,245 388,891 3 8
Certificates of deposit 46,492 51,577 48,514 (10) (4)
Australia 30,889 35,481 32,047 (13) (4)
New Zealand (A$) 1,428 1,031 1,225 39 17
Other overseas (A$) 14,175 15,065 15,242 (6) (7)
Total deposits and other borrowings 466,743 460,822 437,405 1 7 First Half 2015 – Second Half 2014
Total customer deposits were $11.0 billion or 3% higher compared to Second Half 2014. Excluding the impact of foreign currency translation, customer deposits increased $5.2 billion.
Key features of customer deposit growth were:
Australian customer deposits increased $6.2 billion or 2%. Household deposit growth of 5% was in line with system2, while financial institution deposits contracted as the Group adjusted pricing to reflect the deposits’ LCR value;
Customers continued to direct funds to mortgage offset accounts, reflected in growth of $3.4 billion or 13% in Australian non-interest bearing deposits;
New Zealand customer deposits increased NZ$2.0 billion or 4% with growth mainly from at call deposits with a focus on higher quality deposits; and
Other overseas customer deposits decreased $1.5 billion.
Certificates of deposits decreased $5.1 billion or 10%, reflecting decreased short term wholesale funding in this form.
1 Spot deposit balances. 2 Source: APRA.

Interim financial results 2015 Review of Group operations
18 | Westpac Group 2015 Interim Results Announcement
First Half 2015 – First Half 2014
Total customer deposits were $31.4 billion or 8% higher than First Half 2014. Excluding foreign exchange translation impacts, customer deposits increased $27.2 billion. Key features of the growth were:
Australian customer deposits increased $24.5 billion or 7%, with the majority of growth in LCR efficient transaction and savings balances. Australian non-interest bearing deposits increased from growth in mortgage offset accounts;
New Zealand customer deposits increased NZ$3.1 billion or 6%, across at call online savings and transaction accounts; and
Other overseas customer deposits increased $1.8 billion with growth mainly in term deposits.
Certificates of deposits were $2.0 billion lower reflecting reduced short term wholesale funding in this form.
2.2.4 Net interest margin
First Half 2015 – Second Half 2014
First Half 2015
Group Margin down 1bps
2.05%
2.01%
Treasury & Markets
(1bps)
Liquidity costs
(1bps)
Capital & other
(1bps)
Term wholesale
funding
3bps
Customer deposits
5bps
Assets
(6bps)
Second Half 2014
2.06%
2.01%
Excluding Treasury and Markets unchanged
Group net interest margin was 2.05%, a decrease of 1 basis point from Second Half 2014 as a result of lower Treasury income.
Net interest margin excluding Treasury and Markets was 2.01%, unchanged from Second Half 2014.
The components of the movement in net interest margin excluding Treasury and Markets were:
6 basis points decrease from asset spreads, primarily from the impact of competitive pricing in mortgages. Business, institutional and unsecured lending spreads were also lower;
5 basis points increase from improved customer deposit spreads across term deposits, online accounts and savings deposits. Improved deposit spreads were partially offset by a 1 basis point impact from a lower hedging benefit on low rate deposits;
3 basis points benefit from term wholesale funding, as pricing for new term senior issuances was lower than maturing deals;
1 basis point decline from lower returns on capital balances as lower interest rates saw hedge rates reduce over the half; and
1 basis point decline from increased holdings of high quality liquid assets in preparation for the introduction of the LCR and costs associated with the Committed Liquidity Facility (CLF).

Interim financial results 2015 Review of Group operations
Westpac Group 2015 Interim Results Announcement | 19
First Half 2015 – First Half 2014
Treasury & Markets
(6bps)
Liquidity costs
(1bps)
Capital & other
(2bps)
Term wholesale
funding
4bps
Customer deposits
10bps
Assets
(11bps)
First Half 2014
2.11%
2.01%
First Half 2015
Group margin down 6bps
2.05%
2.01%Excluding Treasury and
Markets unchanged
Group net interest margin was 2.05%, a decrease of 6 basis points from First Half 2014 as a result of lower Treasury income.
The contribution from Treasury and Markets reduced 6 basis points, with Treasury income impacted by lower returns related to the liquid asset portfolio and balance sheet management activities.
Net interest margin excluding Treasury and Markets, was 2.01% unchanged from First Half 2014.
The components of the movements in net interest margin excluding Treasury and Markets were:
11 basis points decrease from asset spreads. The primary driver was strong competition in mortgages, with business, institutional and unsecured lending spreads also lower;
10 basis points increase from customer deposit impacts, mostly from improved spreads on term deposits. Online accounts and savings deposit spreads were also higher;
4 basis points benefit from term wholesale funding, as pricing for new term senior issuances was lower than maturing deals;
2 basis points decline from lower returns on capital balances as lower interest rates saw hedge rates reduce over the period; and
1 basis point decline from increased holdings of high quality liquid assets in preparation for the introduction of the LCR and costs associated with the CLF.
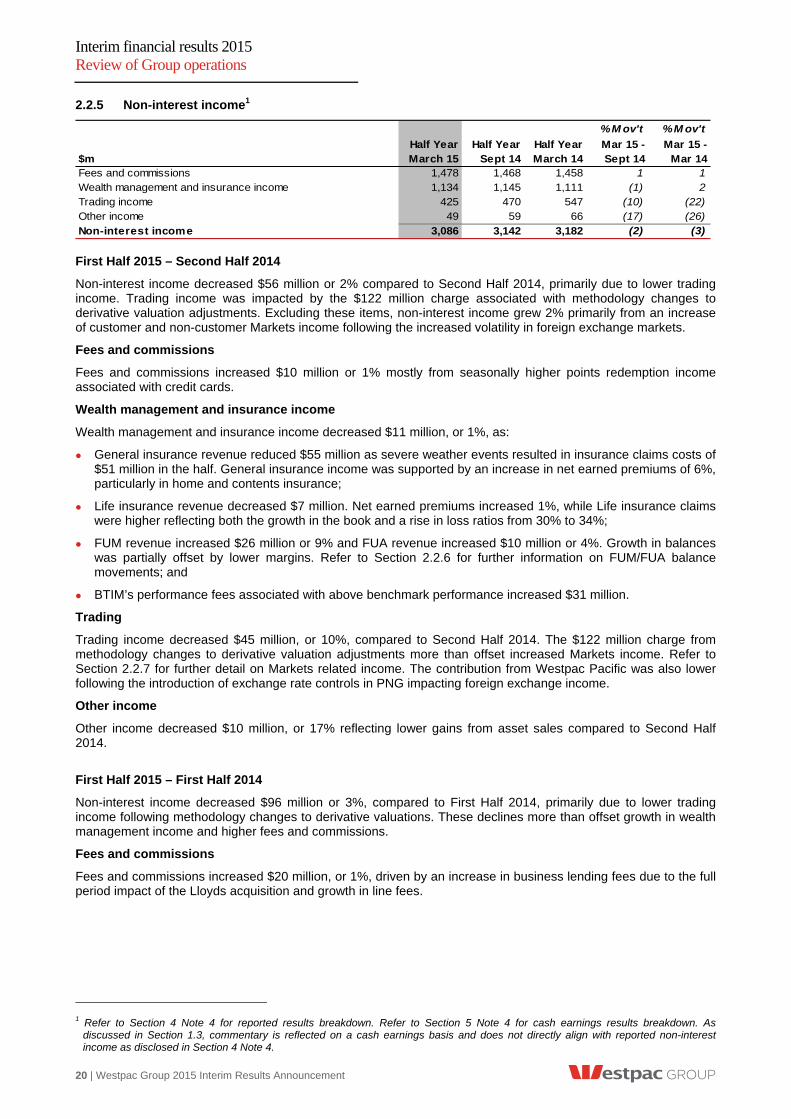
Interim financial results 2015 Review of Group operations
20 | Westpac Group 2015 Interim Results Announcement
2.2.5 Non-interest income1
% M ov't % M ov't
$mHalf YearMarch 15
Half YearSept 14
Half YearMarch 14
Mar 15 -Sept 14
Mar 15 - Mar 14
Fees and commissions 1,478 1,468 1,458 1 1Wealth management and insurance income 1,134 1,145 1,111 (1) 2Trading income 425 470 547 (10) (22)Other income 49 59 66 (17) (26)Non-interest income 3,086 3,142 3,182 (2) (3) First Half 2015 – Second Half 2014
Non-interest income decreased $56 million or 2% compared to Second Half 2014, primarily due to lower trading income. Trading income was impacted by the $122 million charge associated with methodology changes to derivative valuation adjustments. Excluding these items, non-interest income grew 2% primarily from an increase of customer and non-customer Markets income following the increased volatility in foreign exchange markets.
Fees and commissions
Fees and commissions increased $10 million or 1% mostly from seasonally higher points redemption income associated with credit cards.
Wealth management and insurance income
Wealth management and insurance income decreased $11 million, or 1%, as:
General insurance revenue reduced $55 million as severe weather events resulted in insurance claims costs of $51 million in the half. General insurance income was supported by an increase in net earned premiums of 6%, particularly in home and contents insurance;
Life insurance revenue decreased $7 million. Net earned premiums increased 1%, while Life insurance claims were higher reflecting both the growth in the book and a rise in loss ratios from 30% to 34%;
FUM revenue increased $26 million or 9% and FUA revenue increased $10 million or 4%. Growth in balances was partially offset by lower margins. Refer to Section 2.2.6 for further information on FUM/FUA balance movements; and
BTIM’s performance fees associated with above benchmark performance increased $31 million.
Trading
Trading income decreased $45 million, or 10%, compared to Second Half 2014. The $122 million charge from methodology changes to derivative valuation adjustments more than offset increased Markets income. Refer to Section 2.2.7 for further detail on Markets related income. The contribution from Westpac Pacific was also lower following the introduction of exchange rate controls in PNG impacting foreign exchange income.
Other income
Other income decreased $10 million, or 17% reflecting lower gains from asset sales compared to Second Half 2014.
First Half 2015 – First Half 2014
Non-interest income decreased $96 million or 3%, compared to First Half 2014, primarily due to lower trading income following methodology changes to derivative valuations. These declines more than offset growth in wealth management income and higher fees and commissions.
Fees and commissions
Fees and commissions increased $20 million, or 1%, driven by an increase in business lending fees due to the full period impact of the Lloyds acquisition and growth in line fees.
1 Refer to Section 4 Note 4 for reported results breakdown. Refer to Section 5 Note 4 for cash earnings results breakdown. As
discussed in Section 1.3, commentary is reflected on a cash earnings basis and does not directly align with reported non-interest income as disclosed in Section 4 Note 4.

Interim financial results 2015 Review of Group operations
Westpac Group 2015 Interim Results Announcement | 21
Wealth management and insurance income
Wealth management and insurance income increased $23 million or 2% from:
FUM/FUA related income increased $62 million, or 12% due to the benefit of positive net flows and improved investment markets. Margins were broadly unchanged compared to First Half 2014. Refer to Section 2.2.6 for further information on FUM/FUA balance movements;
Life Insurance income increased 4% due to growth in net earned premiums of 14% partly offset by increased claims;
General insurance income decreased $19 million reflecting a $33 million increase in insurance claims relating to severe weather events, more than offsetting 16% growth in net earned premiums related to home and content sales; and
Performance fee income reduced $56 million from lower BTIM performance fees ($77 million) more than offsetting higher Hastings performance fees ($21 million).
Trading
Trading income decreased $122 million, or 22%, compared to First Half 2014. The $122 million charge from methodology changes to derivative valuation adjustments offset higher Markets income from increased foreign exchange and interest rate risk sales. Refer to Section 2.2.7 for further detail on Markets related income. The contribution from Westpac Pacific was also lower following the introduction of exchange rate controls in PNG impacting foreign exchange income.
Other income
Other income decreased $17 million, or 26%, reflecting lower profits from asset sales partially offset by increased rental income from operating leases and the impact of hedging New Zealand earnings.
2.2.6 Funds Under Management / Funds Under Administration
As at As at As at % M ov't % M ov't
$bn31 March
201530 Sept
201431 March
2014Mar 15 -Sept 14
Mar 15 - Mar 14
Funds Under Management (FUM)
BT 90.3 77.6 71.4 16 26
Advance Asset Management 13.0 11.4 10.7 14 21
Westpac Institutional Bank 7.7 7.0 6.6 10 17
New Zealand (A$) 5.9 4.9 4.6 20 28
Group FUM 116.9 100.9 93.3 16 25
Funds Under Administration (FUA)
BT 87.5 77.7 72.9 13 20
Asgard 37.5 35.0 33.9 7 11
New Zealand (A$) 1.9 1.5 1.4 27 36
Group FUA 126.9 114.2 108.2 11 17
% M ov't % M ov't
$bnHalf YearMarch 15
Half YearSept 14
Half YearMarch 14
Mar 15 -Sept 14
Mar 15 - Mar 14
Average FUM for the Group1 108.8 97.4 91.3 12 19
Average FUA for the Group1 119.8 112.4 106.2 7 13
1 Average FUM and FUA for the Group for First Half 2015, Second Half 2014 and First Half 2014 is based on a six month average.

Interim financial results 2015 Review of Group operations
22 | Westpac Group 2015 Interim Results Announcement
2.2.7 Markets related income1
% M ov't % M ov't
$mHalf YearMarch 15
Half YearSept 14
Half YearMarch 14
Mar 15 -Sept 14
Mar 15 - Mar 14
Net interest income 55 57 45 (4) 22Non-interest income 394 413 483 (5) (18)Total Markets income 449 470 528 (4) (15)
Customer Income 455 420 389 8 17Non-customer Income 147 72 140 104 5
Derivative valuation adjustments2 (153) (22) (1) large largeTotal Markets income 449 470 528 (4) (15)
Markets income comprises sales and risk management revenue derived from the creation, pricing and distribution of risk management products to the Group’s business, corporate and institutional customers. Dedicated relationship specialists provide product solutions to these customers to help manage their interest rate, foreign exchange, commodity, credit and structured products risk exposures.
First Half 2015 - Second Half 2014
Total Markets income decreased $21 million, or 4%, compared to Second Half 2014 primarily due to the $122 million charge related to methodology changes to derivative valuation adjustments. Excluding these items, markets income increased $101 million or 21%.
Customer income increased $35 million or 8% compared to Second Half 2014 from growth in both foreign exchange and interest rate risk product sales. Foreign exchange sales benefited from increased customer demand as a result of volatility in a number of core currencies. Interest rate risk sales benefited from improved deal flows in the half, particularly related to infrastructure transactions.
Non-customer related income increased $75 million compared to Second Half 2014 from higher foreign exchange trading income.
In First Half 2015 changes were made to derivative valuation methodologies, which include the first time adoption of a FVA to the fair value of derivatives. The impact of these changes resulted in a $122 million charge which reduced non-interest income.
First Half 2015 – First Half 2014
Total Markets income decreased $79 million, or 15%, compared to First Half 2014.
Customer related income increased $66 million or 17% compared to First Half 2014. This outcome reflected increased interest rate risk sales, as a result of customer demand from infrastructure deals and higher foreign exchange income from increased customer demand associated with the more volatile currency environment.
Non-customer related income increased $7 million compared to First Half 2014 primarily from higher foreign exchange trading income.
In First Half 2015 changes were made to derivative valuation methodologies, which included the first time adoption of a FVA to the fair value of derivatives. The impact of these changes resulted in a $122 million charge which reduced non-interest income.
1 Markets income includes WIB Markets, Westpac RBB, St.George, BTFG and Westpac New Zealand markets. 2 Includes CVA and derivative valuation methodology changes.

Interim financial results 2015 Review of Group operations
Westpac Group 2015 Interim Results Announcement | 23
Markets Value at Risk (VaR)1
Risk, as measured by VaR, was lower than both Second Half 2014 and First Half 2014 and remains well within the Group’s risk appetite.
$m High Low Average
Six months ended 31 March 2015 10.7 5.9 7.9Six months ended 30 September 2014 14.1 5.9 8.5
Six months ended 31 March 2014 16.7 5.3 10.0
The components of Markets VaR are as follows:
Average Half Year Half Year Half Year
$mMarch
2015Sept2014
March2014
Interest rate risk 2.9 3.6 6.1
Foreign exchange risk 1.7 2.1 2.2
Equity risk 0.2 0.3 0.4
Commodity risk2 3.1 1.9 2.1
Credit and other market risks3 5.0 6.7 5.8
Diversif ication benefit (5.0) (6.1) (6.6)
Net market risk 7.9 8.5 10.0
1 The daily VaR presented above reflects a divisional view of VaR. It varies from presentations of VaR in Westpac’s 2014 Annual
Report and Australian Prudential Standard (APS) 330 Prudential Disclosure under Basel III where market risk disclosures are segregated as trading and banking book. VaR measures the potential for loss using a history of price movements. Therefore, price volatility is a key component of this measure.
2 Includes electricity risk. 3 Includes pre-payment risk and credit spread risk (exposures to generic credit rating bonds).

Interim financial results 2015 Review of Group operations
24 | Westpac Group 2015 Interim Results Announcement
2.2.8 Operating expenses1
% M ov't % M ov't
$mHalf YearMarch 15
Half YearSept 14
Half YearMarch 14
Mar 15 -Sept 14
Mar 15 - Mar 14
Salaries and other staff expenses (2,368) (2,294) (2,344) 3 1Equipment and occupancy expenses (790) (809) (692) (2) 14Other expenses (1,096) (1,078) (1,029) 2 7Total expenses (4,254) (4,181) (4,065) 2 5
First Half 2015 – Second Half 2014
Operating expenses increased $73 million or 2% compared with Second Half 2014. Excluding the impact of foreign currency translation ($23 million), operating expenses increased $50 million or 1% mostly related to investments. Productivity benefits of $113 million were delivered during the half.
Salaries and other staff expenses increased $74 million or 3% compared to Second Half 2014 primarily through impact of salary increases from January 2015, higher performance related payments in the wealth business associated with above benchmark performance fees earned and expansion in Asia. These increases were partly offset by productivity benefits.
Equipment and occupancy expenses reduced $19 million or 2% compared to Second Half 2014. Software amortisation expenses were slightly down, with the decrease due to lower software impairments. Lease consolidation also contributed to lower operating lease rentals.
Other expenses increased $18 million or 2% compared to Second Half 2014 due to higher technology costs and seasonally higher credit card reward program costs.
First Half 2015 – First Half 2014
Operating expenses increased $189 million or 5% compared to First Half 2014. Excluding the impact of foreign currency translation ($23 million), operating expenses increased 4%. The 4% growth in expenses was the result of the Group’s investment programs, with higher software amortisation and hardware depreciation contributing 2% of the growth.
Salaries and other staff expenses increased $24 million or 1% compared to First Half 2014. This result reflects annual salary increases and additional FTE to support the Group’s expansion in Bank of Melbourne and Asia. These increases were partly offset by lower performance related payments in the wealth business, delivery of productivity benefits and lower restructuring costs.
Equipment and occupancy expenses increased $98 million or 14% compared to First Half 2014. Software amortisation and hardware depreciation increased $61 million. Other increases include annual rental rate increases and higher depreciation costs associated with operating leases.
Other expenses increased $67 million or 7% compared to First Half 2014 from higher advertising and outsourced technology costs.
Full Time Equivalent Employees (FTE)
As at As at As at % M ov't % M ov't
Analysis of movement in FTE 31 March
201530 Sept
201431 March
2014Mar 15 -Sept 14
Mar 15 - Mar 14
Permanent employees 33,704 33,586 33,619 - -
Temporary employees 2,855 2,787 2,875 2 (1)
FTE 36,559 36,373 36,494 1 -
Average FTE2 36,549 36,443 35,962 - 2 First Half 2015 – Second Half 2014
FTE increased 186 FTE compared to Second Half 2014 to support growth related investments, including Asia (66 FTE), Bank of Melbourne (49 FTE), Wealth (22 FTE) and other increases for projects across the Group.
First Half 2015 – First Half 2014
FTE increased 65 compared to First Half 2014. Increases in FTE to support growth, including Bank of Melbourne (136 FTE) and expansion in Asia (108 FTE), have been more than offset by a range of productivity initiatives.
1 Refer to Section 4 Note 5 for reported results breakdown. Refer to Section 5 Note 5 for cash earnings breakdown. As discussed in
Section 1.3, commentary is on a cash earnings basis. 2 Based on a six month average.
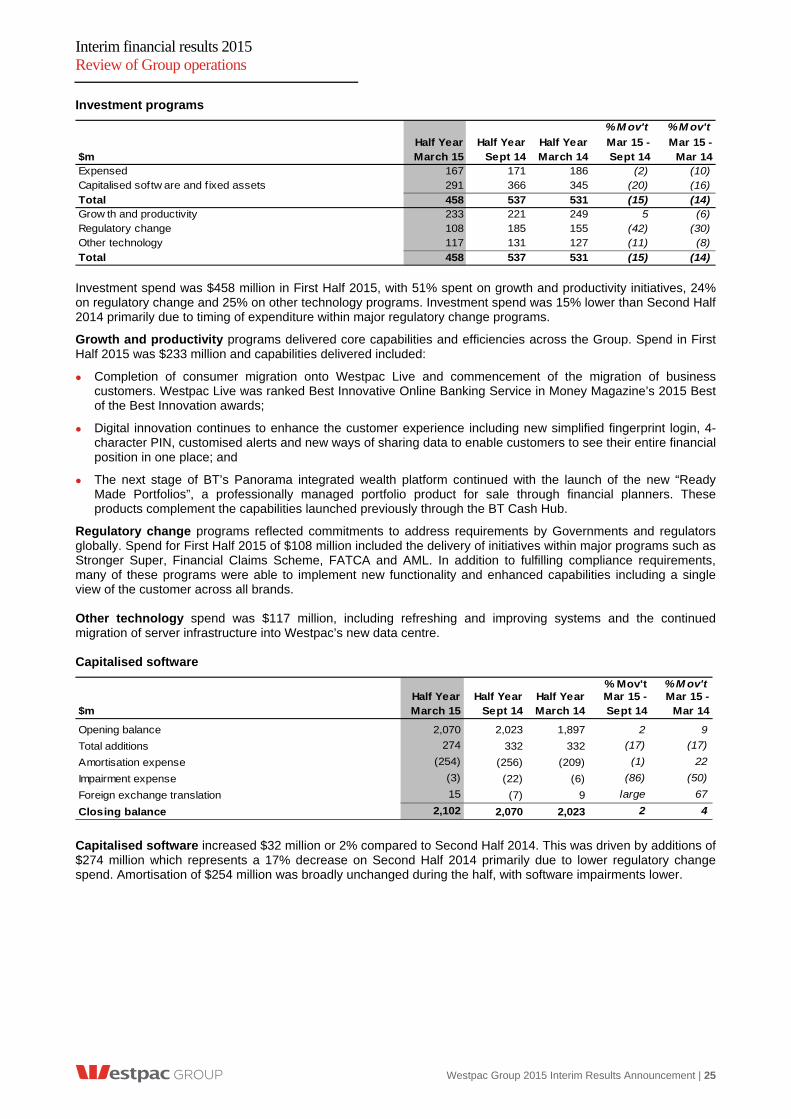
Interim financial results 2015 Review of Group operations
Westpac Group 2015 Interim Results Announcement | 25
Investment programs
% M ov't % M ov't
$mMar 15 -Sept 14
Mar 15 - Mar 14
Expensed 167 171 186 (2) (10)Capitalised softw are and f ixed assets 291 366 345 (20) (16)
Total 458 537 531 (15) (14)Grow th and productivity 233 221 249 5 (6)Regulatory change 108 185 155 (42) (30)Other technology 117 131 127 (11) (8)
Total 458 537 531 (15) (14)
Half YearMarch 15
Half YearSept 14
Half YearMarch 14
Investment spend was $458 million in First Half 2015, with 51% spent on growth and productivity initiatives, 24% on regulatory change and 25% on other technology programs. Investment spend was 15% lower than Second Half 2014 primarily due to timing of expenditure within major regulatory change programs.
Growth and productivity programs delivered core capabilities and efficiencies across the Group. Spend in First Half 2015 was $233 million and capabilities delivered included:
Completion of consumer migration onto Westpac Live and commencement of the migration of business customers. Westpac Live was ranked Best Innovative Online Banking Service in Money Magazine’s 2015 Best of the Best Innovation awards;
Digital innovation continues to enhance the customer experience including new simplified fingerprint login, 4-character PIN, customised alerts and new ways of sharing data to enable customers to see their entire financial position in one place; and
The next stage of BT’s Panorama integrated wealth platform continued with the launch of the new “Ready Made Portfolios”, a professionally managed portfolio product for sale through financial planners. These products complement the capabilities launched previously through the BT Cash Hub.
Regulatory change programs reflected commitments to address requirements by Governments and regulators globally. Spend for First Half 2015 of $108 million included the delivery of initiatives within major programs such as Stronger Super, Financial Claims Scheme, FATCA and AML. In addition to fulfilling compliance requirements, many of these programs were able to implement new functionality and enhanced capabilities including a single view of the customer across all brands. Other technology spend was $117 million, including refreshing and improving systems and the continued migration of server infrastructure into Westpac’s new data centre. Capitalised software
% Mov't % M ov't
$mMar 15 -Sept 14
Mar 15 - Mar 14
Opening balance 2,070 2,023 1,897 2 9
Total additions 274 332 332 (17) (17)
Amortisation expense (254) (256) (209) (1) 22
Impairment expense (3) (22) (6) (86) (50)
Foreign exchange translation 15 (7) 9 large 67
Closing balance 2,102 2,070 2,023 2 4
Half YearMarch 15
Half YearSept 14
Half YearMarch 14
Capitalised software increased $32 million or 2% compared to Second Half 2014. This was driven by additions of $274 million which represents a 17% decrease on Second Half 2014 primarily due to lower regulatory change spend. Amortisation of $254 million was broadly unchanged during the half, with software impairments lower.

Interim financial results 2015 Review of Group operations
26 | Westpac Group 2015 Interim Results Announcement
2.2.9 Impairment charges
% M ov't % M ov't
$mHalf YearMarch 15
Half YearSept 14
Half YearMarch 14
Mar 15 -Sept 14
Mar 15 - Mar 14
Individually assessed provisions (IAPs)
New IAPs (293) (335) (349) (13) (16)
Write-backs 155 189 244 (18) (36)
Recoveries 63 58 48 9 31
Total IAPs, write-backs and recoveries (75) (88) (57) (15) 32
Collectively assessed provisions (CAPs)
Write-offs (330) (371) (331) (11) -
Other changes in CAPs 64 150 47 (57) 36
Total new CAPs (266) (221) (284) 20 (6)
Total impairment charges (341) (309) (341) 10 -
The improvement in asset quality through First Half 2015, including lower levels of new impaired assets, has led to impairment charges relative to average gross loans remaining modest at 11 basis points. While the level of impairment charges was low, provisioning levels have been broadly maintained with the collectively assessed provisions rising $85 million and individually assessed provisions slightly lower, down $61 million. Economic overlays were little changed over First Half 2015 with a balance of $387 million at 31 March 2015.
First Half 2015 – Second Half 2014
Impairment charges for First Half 2015 were $341 million, up $32 million or 10% compared to Second Half 2014, and were equivalent to 11 basis points of average gross loans.
Key movements included:
Total new IAPs less write-backs and recoveries were $13 million lower than Second Half 2014 principally due to:
- New Zealand and St.George (down $20 million and $17 million respectively) as fewer facilities were downgraded to impaired. Total IAPs in Westpac RBB were flat with higher charges in the business portfolio (up $7 million) offset by lower charges in the consumer portfolio; and
- This was partially offset by higher total IAPs in WIB (up $27 million) principally because the level of new IAPs reported in Second Half 2014 was particularly low and write-backs and recoveries were lower.
Total new CAPs added $266 million to impairment charges in First Half 2015, $45 million more than recorded in Second Half 2014. Key movements included:
- Write-offs were lower in First Half 2015, consistent with normal seasonal patterns in unsecured personal lending; and
- Other changes in CAPs were positive as the improvement in asset quality across the portfolios continued. However, as the rate of improvement was at a slower rate than Second Half 2014, the CAP benefits were lower. Economic overlays were $2 million lower.
First Half 2015 – First Half 2014
Impairment charges of $341 million were unchanged when compared to First Half 2014.
Key movements included:
New IAPs less write-backs and recoveries were $18 million higher than First Half 2014, while new IAPs fell by $56 million, First Half 2014 benefited from a larger number of write-backs and recoveries which were $74 million higher than First Half 2015; and
Total new CAPs were $18 million lower than Half Year 2014. Write-offs were similar to First Half 2014, while other changes in CAPs were a larger benefit as portfolio quality improved. Total economic overlays were $11 million lower compared to First Half 2014 with a balance of $387 million.
Interim financial results 2015 Review of Group operations
Westpac Group 2015 Interim Results Announcement | 27
2.2.10 Tax expense
First Half 2015 – Second Half 2014
The effective tax rate of 29.7% in First Half 2015 was higher than 29.0% in Second Half 2014, as Second Half 2014 benefited from the finalisation of prior period taxation matters.
First Half 2015 – First Half 2014
The effective tax rate of 29.7% in First Half 2015 was slightly lower than the First Half 2014 effective tax rate of 30.1%.
2.2.11 Non-controlling interests
The non-controlling interests represent distributions on the Group’s hybrid equity instrument TPS 20061 and other non-controlling interests including the 40.9% portion of BTIM that Westpac does not own.
Non-controlling interests of $34 million for First Half 2015 were $6 million higher than Second Half 2014. Movements in non-controlling interests primarily relates to the earnings contribution of BTIM.
1 Non-controlling interests include distributions on 2006 Trust Preferred Securities (TPS):
Westpac TPS Trust issued 7,627,375 2006 TPS in Australia at $100 each on 21 June 2006. The 2006 TPS are preferred units in the Westpac TPS Trust, with non-cumulative floating rate distributions which are expected to be fully franked. Westpac TPS Trust also issued one ordinary unit with an issue price of $100 to Westpac. Westpac, as holder of the ordinary unit, is entitled to any residual income or assets of the Westpac TPS Trust not distributed to holders of 2006 TPS. The 2006 TPS are scheduled to pay quarterly distributions (30 September, 31 December, 31 March and 30 June) in arrears, subject to certain conditions being satisfied. The distribution rate on 2006 TPS, until 30 June 2016 (the step-up date) is calculated as the Australian 90 day bank bill rate plus 1% per annum (the initial margin), together multiplied by one minus the Australian corporate tax rate (30% during all periods). After the step-up date, the initial margin will increase by a one time step-up of 1% per annum.

Interim financial results 2015 Review of Group operations
28 | Westpac Group 2015 Interim Results Announcement
2.3 Credit quality
The improvement in quality of the portfolio seen over Full Year 2014 continued into First Half 2015, with a further reduction in stressed assets, the emergence of new problem facilities remaining low, and the additional resolution and work-out of impaired facilities.
Stressed assets reduced $0.7 billion during First Half 2015 with the ratio of stressed exposures to total committed exposures down 12 basis points to 1.12% at 31 March 2015 (see 2.3.1 Credit Quality Key Metrics). The largest improvements were seen in the watchlist and substandard facilities, which reduced 9 basis points to 0.62% and impaired assets, where the ratio of impaired assets was down 3 basis points to 0.24%.
Portfolio segments
The institutional and commercial segments continue to perform well as customers remain cautious and protective of their balance sheets. Stressed assets further reduced, with the work-out of facilities, often via asset sales and restructuring, continuing to exceed the emergence of new stress. Some stress is emerging in sectors impacted by the falling price of commodities, especially iron ore and coal. This includes both producers and suppliers to these industries.
Across the Group, there was only one new large (>$50 million) impaired facility that emerged during First Half 2015.
The commercial property segment has continued to show the greatest rate of asset quality improvement. After peaking in the midst of the financial crisis at 15.5% (stress as a per cent of total committed exposure) the ratio has now declined to 1.8%. The level of stress is now at its lowest point for over a decade.
The small and medium business portfolio has also performed well and the number of facilities in work-out reduced further during First Half 2015. Nevertheless, some stress is emerging in sectors impacted by the slowing of the mining investment cycle, lower commodity prices, those industries undergoing structural change (eg. manufacturing) and some elements of agriculture.
In the consumer sector, unsecured consumer delinquencies have trended higher over the First Half 2015 consistent with normal seasonal trends (which typically see delinquencies rise in the first half of the year). Group consumer unsecured 90+ day delinquencies increased 18 basis points since 30 September 2014 and 5 basis points since 31 March 2014. This trend was similar across the Australian and New Zealand portfolios.
Australian 90+ day mortgage delinquencies were at 0.47% at 31 March 2015, unchanged from 30 September 2014 and 3 basis points lower compared to 31 March 2014, as the portfolio continues to be supported by a strong property market and falling interest rates. The investment property segment has a 90+ day delinquency rate of 0.36% which is lower than the portfolio average. Despite the low delinquency rates, the modest pace of economic growth and rising unemployment has led to some increase in delinquencies especially in those states and regions closest to mining. This is being offset by robust conditions in NSW where economic activity has been stronger.
Australian properties in possession increased 69 over First Half 2015 to 263. Most of this growth was in regions of Queensland impacted by the slowing of the mining sector. Realised mortgage losses were $38 million for First Half 2015, equivalent to 2 basis points.
New Zealand mortgage 90+ day delinquencies improved 4 basis points since 31 March 2014. The low level of delinquencies over the year reflects the improving economy and the strong Auckland housing market.
Provisioning
Westpac has maintained adequate provisioning coverage with:
The ratio of impaired asset provisions to total impaired assets increasing 3 percentage points to 47.8% during the half; and
The ratio of collectively assessed provisions to credit risk weighted assets was 0.89% with the ratio lower than the 0.93% recorded at 30 September 2014. Whilst collectively assessed provisions were higher, the fall in the ratio was due to a rise in credit risk weighted assets. Much of the rise in risk weighted assets was due to foreign currency translation impacts, portfolio growth and a change in modelling factors, rather than any deterioration in quality.
Total impairment provisions were $3,505 million with individually assessed provisions of $806 million and collectively assessed provisions of $2,699 million.
Collectively assessed provision balances were higher compared to First Half 2014. Excluding foreign currency translation impacts, movements in collectively assessed provisions can principally be traced to:
Provision increases relating to growth in the portfolio were largely offset by the impact of run-off in watchlist and substandard exposures. Although continuing to perform, these exposures carry materially higher provision levels, compared to non-stressed exposures, as their probability of default is much higher;

Interim financial results 2015 Review of Group operations
Westpac Group 2015 Interim Results Announcement | 29
The economic overlay composition and balance was little changed during First Half 2015. The provision was $2 million lower at $387 million at 31 March 2015. Most of the economic overlay has been set for the mining and manufacturing sectors and for some elements of agriculture.
2.3.1 Credit quality key metrics
Half YearMarch 15
Half YearSept 14
Half YearMarch 14
Stressed exposures by credit grade as a % of total committed exposures:
Impaired 0.24% 0.27% 0.34%
90 days past due and not impaired 0.26% 0.26% 0.28%
Watchlist and substandard 0.62% 0.71% 0.75%
Total stressed exposures 1.12% 1.24% 1.37%
Impaired assets to total committed exposures for business and institutional:
Business Australia 0.75% 0.88% 1.20%
Business New Zealand 0.96% 0.92% 1.16%
Institutional 0.18% 0.25% 0.29%
90 days past due for mortgages:
Group 0.45% 0.45% 0.48%
Australia 0.47% 0.47% 0.50%
New Zealand 0.25% 0.21% 0.29%
90 days past due for other consumer loans:
Group 1.17% 0.99% 1.12%
Australia 1.20% 1.05% 1.15%
New Zealand 0.81% 0.75% 0.90%
Other:
Total impaired assets to gross loans 0.35% 0.40% 0.51%
Total impaired asset provisions to total impaired assets 47.8% 44.8% 46.4%
Total provisions to gross loans 58bps 60bps 67bps
Collectively assessed provisions to performing non-housing loans1 128bps 129bps 134bps
Collectively assessed provisions to risk w eighted assets 78bps 79bps 82bps
Collectively assessed provisions to credit risk w eighted assets 89bps 93bps 97bps
Total provisions to risk w eighted assets 101bps 105bps 118bps
Impairment charges to average loans annualised 11bps 11bps 12bps
Net w rite-offs to average loans annualised 16bps 25bps 22bps
1 Non-housing loans have been determined on a loan purpose basis.

Interim financial results 2015 Review of Group operations
30 | Westpac Group 2015 Interim Results Announcement
2.4 Balance sheet and funding
2.4.1 Balance sheet
As at As at As at % M ov't % M ov't
$m31 March
201530 Sept
201431 March
2014Mar 15 -Sept 14
Mar 15 - Mar 14
Assets
Cash and balances w ith central banks 14,738 25,760 16,375 (43) (10)
Receivables due from other f inancial institutions 13,637 7,424 8,744 84 56Trading securities, other f inancial assets designated at fairvalue and available-for-sale securities 82,625 81,933 79,392 1 4
Derivative f inancial instruments 45,702 41,404 26,207 10 74
Loans 605,064 580,343 564,569 4 7
Life insurance assets 12,348 11,007 12,841 12 (4)
Other assets 21,847 22,971 21,247 (5) 3
Total assets 795,961 770,842 729,375 3 9
Liabilities
Payables due to other f inancial institutions 15,421 18,636 15,211 (17) 1
Deposits and other borrow ings 466,743 460,822 437,405 1 7
Other f inancial liabilities at fair value through income statement 12,133 19,236 15,077 (37) (20)
Derivative f inancial instruments 50,510 39,539 31,330 28 61
Debt issues 168,151 152,251 150,098 10 12
Life insurance liabilities 10,945 9,637 11,594 14 (6)
Loan capital 11,905 10,858 10,320 10 15
Other liabilities 9,836 10,526 10,309 (7) (5)
Total liabilities 745,644 721,505 681,344 3 9
EquityTotal equity attributable to ow ners of Westpac Banking Corporation 49,405 48,456 47,165 2 5
Non-controlling interests 912 881 866 4 5
Total equity 50,317 49,337 48,031 2 5 First Half 2015 – Second Half 2014
Key movements during the half included:
Assets
Cash and balances with central banks decreased $11.0 billion or 43% reflecting lower liquid assets held in this form;
Receivables due from other financial institutions increased $6.2 billion or 84% largely reflecting higher collateral posted with derivative counterparties mainly related to foreign currency swaps and forward contracts;
Trading securities, other financial assets designated at fair value and available-for-sale securities increased $0.7 billion or 1%. Holdings of liquid assets increased $3.0 billion reflecting LCR requirements, partially offset by a reduction of $2.5 billion in bonds held for trading purposes;
Derivative assets increased $4.3 billion or 10% mainly due to foreign currency translation impacts on cross currency swaps and forward contracts, offset by an increase in netting for centrally cleared trades;
Loans increased $24.7 billion or 4%. Refer to Section 2.2.2 Loans for further information on movements; and
Life insurance assets increased $1.3 billion or 12% largely reflecting an increase in unit linked investments from favourable equity markets.
Liabilities
Payables due to other financial institutions decreased $3.2 billion or 17%, largely reflecting lower collateral received from derivative counterparties which decreased $1.9 billion;
Deposits and other borrowings increased $5.9 billion or 1%. Refer to Section 2.2.3 Deposits and other borrowings for further information on movements;
Other financial liabilities at fair value through the income statement decreased $7.1 billion or 37%. Securities sold under agreements to repurchase decreased $6.1 billion reflecting decreased funding in this form;

Interim financial results 2015 Review of Group operations
Westpac Group 2015 Interim Results Announcement | 31
Derivative liabilities increased $11.0 billion or 28% mainly due to foreign currency translation impacts on cross currency swaps and forward contracts, offset by an increase in netting for centrally cleared trades;
Debt issues increased $15.9 billion or 10% ($7.3 billion or 5% excluding foreign currency translation impacts) reflecting additional wholesale funding. Refer to Section 2.4.2 Funding and Liquidity Risk Management for further information;
Life insurance liabilities increased $1.3 billion or 14% largely reflecting an increase in unit linked liabilities from favourable equity markets; and
Loan capital increased $1.0 billion or 10% reflecting subordinated debt issuances of $0.6 billion and foreign currency translation impacts.
Equity increased $1.0 billion or 2% reflecting retained profits and shares issued in the DRP.
First Half 2015 – First Half 2014
Key movements included:
Assets
Cash and balances with central banks decreased $1.6 billion or 10% reflecting lower liquid assets held in this form;
Receivables due from other financial institutions increased $4.9 billion or 56% reflecting higher collateral posted relating to derivative movements;
Trading securities, other financial assets designated at fair value and available-for-sale securities increased $3.2 billion or 4%. Holdings of liquid assets increased $5.2 billion reflecting LCR requirements partially offset by a reduction of $1.6 billion in bonds held for trading purposes;
Derivative assets increased $19.5 billion or 74% mainly due to foreign currency translation impacts on cross currency swaps and forward contracts, offset by an increase in netting for centrally cleared trades;
Loans grew $40.5 billion or 7%. Refer to Section 2.2.2 Loans for further information on movements; and
Life insurance assets decreased $0.5 billion or 4% as two managed funds were deconsolidated during 2014, offset by an increase in unit linked investments from favourable equity markets.
Liabilities
Payables due to other financial institutions increased $0.2 billion or 1% reflecting higher collateral received from derivative counterparties;
Deposits and other borrowings increased $29.3 billion or 7%. Refer to Section 2.2.3 Deposits and other borrowings for further information on movements;
Other financial liabilities at fair value through the income statement decreased $2.9 billion or 20% reflecting reduced funding of securities through repurchase agreements;
Derivative liabilities increased $19.2 billion or 61% mainly due to foreign currency translation impacts on cross currency swaps and forward contracts, offset by an increase in netting for centrally cleared trades;
Debt issues increased $18.1 billion or 12%. This included long term issuance increases of $11.5 billion of which covered bond outstandings increased $8.6 billion. Refer to Section 2.4.2 Funding and Liquidity Risk Management for further information;
Life insurance liabilities decreased $0.6 billion as two managed funds were deconsolidated during 2014, offset by an increase in unit linked liabilities from favourable equity markets; and
Loan capital increased $1.6 billion or 15% reflecting the issuance of $1.3 billion Westpac Capital Notes 2, $0.6 billion of subordinated debt and foreign currency translation impacts, offset by the buy back and cancellation of $0.9 billion of Westpac SPS II.
Equity increased $2.3 billion or 5% largely from increased retained profits and shares issued in the DRP.
Interim financial results 2015 Review of Group operations
32 | Westpac Group 2015 Interim Results Announcement
2.4.2 Funding and liquidity risk management
Liquidity risk is the risk that the Group will be unable to fund assets and meet obligations as they become due. This type of risk is inherent in all banks through their role as intermediaries between depositors and borrowers. The Group has a liquidity risk management framework designed to maximise the Group’s ability to meet cash flow obligations under a wide range of market conditions, including name specific and market-wide stress scenarios, as well as meeting the requirements of the Liquidity Coverage Ratio (LCR)1.
Liquid Assets
As at 31 March 2015, Westpac held in total $136.7 billion in unencumbered liquid assets (30 September 2014: $134.4 billion). This portfolio provides a source of reserve liquidity as eligible collateral under the Central Bank repurchase agreement facility. At 31 March 2015 the portfolio was comprised of:
$57.0 billion of cash, deposits at Central Banks, Government and semi-Government bonds. This portfolio increased $2.4 billion during the half as the Group prepared for the introduction of the LCR;
$19.2 billion of repo-eligible private securities; and
$60.5 billion of self-originated AAA rated mortgage backed securities, which in extraordinary circumstances are eligible for repurchase with the RBA or the RBNZ.
LCR
From 1 January 2015, Westpac is required to meet a minimum LCR of 100% in accordance with the APRA liquidity standard (APS 210). The LCR requires banks to hold sufficient high-quality liquid assets (HQLA), as defined, to withstand 30 days under a regulator-defined acute stress scenario. Given the limited amount of qualifying HQLA available in Australia (due to relatively low levels of Government debt outstanding), the Reserve Bank of Australia (RBA) makes available to Australian institutions a Committed Liquidity Facility (CLF) that, subject to the satisfaction of qualifying conditions, can be accessed to assist meeting the LCR requirement. In order to have access to the CLF, Australian banks are required to pay a fee of 15 basis points (0.15%) per annum to the RBA on the approved CLF. Westpac has approval for a CLF of $66 billion for calendar year 2015. At 31 March 2015, the Group’s LCR, including the CLF of $66 billion, was 114%.
Funding
The Group monitors the composition and stability of its funding so that it remains within the Group’s funding risk appetite. This includes targeting a Stable Funding Ratio (SFR)2 of greater than 75%.
During First Half 2015, the Group continued to focus on funding asset growth through stable sources, maintaining its Stable Funding Ratio at 83.2%, unchanged from 30 September 2014.
The Group’s overall funding composition was little changed, with customer deposits representing 59.7% of the Group’s total funding at 31 March 2015 (30 September 2014: 60.2%), a further 1.8% from securitisation, 14.7% from long term funding with a residual maturity greater than one year and 7.0% from equity.
At 31 March 2015, the Group had $118.2 billion of wholesale funding with a residual maturity within one year, representing 16.8% of the Group’s total funding, little changed from 30 September 2014. This short term funding has a weighted average maturity of 130 days and is more than covered by the $136.7 billion of repo-eligible liquid assets held by the Group.
In First Half 2015, the Group raised $15.9 billion of term wholesale funding with a weighted average maturity of 4.6 years.
The Group’s approach to wholesale funding is to maintain diversity across product, tenor and currency. In First Half 2015, the Group executed benchmark senior bond trades in US$ and A$, benchmark covered bond trades in Euro and US$, an RMBS and an auto ABS transaction (both in A$), as well as smaller senior bond trades in Swiss Franc and Sterling. The Group also raised approximately $600 million in Basel III compliant Tier 2 capital.
Overall, support for Westpac remains across global funding markets and the Group is well positioned for the remainder of Full Year 2015.
1 Refer to Glossary for definition. 2 Stable funding ratio is total stable funding divided by total funding. Stable funding includes customer deposits, wholesale term funding
with a residual contractual maturity greater than 12 months, securitisation and equity. Total funding includes customer deposits, total wholesale funding (short and long term) and equity.

Interim financial results 2015 Review of Group operations
Westpac Group 2015 Interim Results Announcement | 33
Liquidity coverage ratio
$mAs at
31 March 15
Pro formaas at
30 Sept 14
% M ov'tMar 15 -Sept 14
High Quality Liquid Assets (HQLA)1 57,136 58,900 (3)
Committed Liquidity Facility (CLF)1 66,000 66,000 -Total LCR liquid assets 123,136 124,900 (1)Cash outflows in a modelled 30-day APRA defined stressed scenarioCustomer deposits 66,062 74,552 (11)Wholesale funding 17,218 20,360 (15)
Other f low s2 24,664 26,462 (7)Total 107,944 121,374 (11)
LCR3 114% 103% large Funding by residual maturity
$m Ratio % $m Ratio % $m Ratio %
Customer deposits 420,251 59.7 409,245 60.2 388,891 59.6
Wholesale funding - residual maturity
Securitisation 12,482 1.8 11,277 1.7 11,488 1.8
Greater than 12 months 103,294 14.7 96,364 14.2 96,592 14.8
Equity4 49,284 7.0 48,356 7.1 47,215 7.2
Stable Funding Ratio (SFR) 585,311 83.2 565,242 83.2 544,186 83.4
Less than 6 months 70,935 10.0 65,497 9.6 63,748 9.8
6 to 12 months 16,685 2.4 23,735 3.5 22,051 3.4
Long term to short term scroll5 30,613 4.4 25,482 3.7 22,415 3.4
Short term wholesale funding 118,233 16.8 114,714 16.8 108,214 16.6
Total funding6 703,544 100.0 679,956 100.0 652,400 100.0
As at 31 March 2015 As at 30 Sept 2014 As at 31 March 2014
Deposits to net loans ratio
$m Ratio % $m Ratio % $m Ratio %
Customer deposits 420,251 409,245 388,891
Net loans 605,064 69.5 580,343 70.5 564,569 68.9
As at 31 March 2015 As at 30 Sept 2014 As at 31 March 2014
1 Refer Glossary for definition. 2 Other flows includes credit and liquidity facilities, collateral outflows and inflows from customers. 3 Calculated on a spot basis. September 2014 LCR is on a pro forma basis. 4 Equity less FX translation, Available-for-Sale Securities and Cash Flow Hedging Reserves. 5 Scroll represents wholesale funding with an original maturity greater than 12 months that now has a residual maturity less than 12
months. 6 Including Equity as described in footnote 4. Hybrids in the amount of $0.9 billion have been included in wholesale funding.

Interim financial results 2015 Review of Group operations
34 | Westpac Group 2015 Interim Results Announcement
Funding view of the balance sheet
$mTotal liquid
assets1
Customer deposits
Wholesale funding
Customer franchise
Market inventory Total
As at 31 March 2015
Total assets 136,662 - - 559,296 100,003 795,961
Total liabilities - (420,251) (233,096) - (92,297) (745,644)
Total equity - - (912) (49,284) (121) (50,317)
Total 136,662 (420,251) (234,008) 510,012 7,585 -
Net loans2 60,733 - - 544,331 - 605,064
As at 30 Sept 2014
Total assets 134,445 - - 540,633 95,764 770,842
Total liabilities - (409,245) (221,474) - (90,786) (721,505)
Total equity - - (881) (48,356) (100) (49,337)
Total 134,445 (409,245) (222,355) 492,277 4,878 -
Net loans2 58,448 - - 521,895 - 580,343
As at 31 March 2014
Total assets 126,519 - - 526,055 76,801 729,375
Total liabilities - (388,891) (215,430) - (77,023) (681,344)
Total equity - - (866) (47,215) 50 (48,031)
Total 126,519 (388,891) (216,296) 478,840 (172) -
Net loans2 58,078 - - 506,491 - 564,569
1 Refer Glossary for definition. 2 Liquid assets in net loans include internally securitised assets that are eligible for re-purchase agreements with the RBA/RBNZ.

Interim financial results 2015 Review of Group operations
Westpac Group 2015 Interim Results Announcement | 35
2.5 Capital and Dividends
As at As at As at M ov't M ov't
31 March 2015
30 Sept 2014
31 March 2014
Mar 15 -Sept 14
Mar 15 - Mar 14
Regulatory capital structure
Common equity Tier 1 capital after deductions ($m) 30,388 29,724 28,455 2 7Risk w eighted assets (RWA) ($m) 346,823 331,387 322,498 5 8
Common equity Tier 1 capital ratio 8.8% 9.0% 8.8% (21bps) (6bps)
Additional Tier 1 capital 1.5% 1.6% 1.5% (4bps) 4bps
Tier 1 capital ratio 10.3% 10.6% 10.3% (25bps) (2bps)
Tier 2 capital 1.8% 1.7% 1.8% 11bps 6bps
Total regulatory capital ratio 12.1% 12.3% 12.1% (14bps) 4bps
Westpac’s preferred capital range
At 31 March 2015, Westpac’s preferred range for its common equity Tier 1 (CET1) capital ratio was 8.75% - 9.25%. The CET1 preferred range takes into consideration:
Current regulatory minimums, including capital conservation and D-SIB buffers;
Stress testing to calibrate an appropriate buffer against a downturn; and
Quarterly volatility of capital ratios under Basel III due to the half yearly cycle of dividend payments.
Common Equity Tier 1 capital ratio movement for First Half 2015
31 March 2015
8.76%
Defined benefit impact
(0.06%)
FX translation
impact
(0.14%)
Modelling changes
(0.19%)
Other movements
(0.12%)
Ordinary RWA
growth
(0.07%)
Dividend (Net of DRP)
(0.72%)
Cash earnings
1.09%
30 September
2014
8.97%
Organic(+18bps) Other items
(-39bps)
Westpac’s CET1 capital ratio was 8.76% at 31 March 2015, 21 basis points lower than recorded at 30 September 2014. This half, 18 basis points of organic capital generation was more than offset by a 39 basis point reduction from other items. Other items included implementing revised RWA models (19 basis point decrease), with residential mortgages model changes having the largest impact, foreign currency translation impacts on RWA (14 basis point decrease) and the impact of lower interest rates on the revaluation of the defined benefit accounting obligation (6 basis point decrease).
More specifically, the movement in the CET1 capital ratio over the half included:
Organic capital generation of 18 basis points from:
First Half 2015 cash earnings of $3.8 billion (109 basis point increase);
The 2014 final dividend payment net of DRP share issuance (72 basis point decrease);
Increases in RWA excluding modelling changes and foreign currency translation impacts (7 basis point decrease); and
Other movements include higher capitalised expenditure (6 basis point decrease), higher deduction for regulatory expected loss (2 basis point decrease) and other items (4 basis point decrease).

Interim financial results 2015 Review of Group operations
36 | Westpac Group 2015 Interim Results Announcement
Other items totalling a 39 basis point decrease:
Modelling changes for the determination of probability of default for residential mortgages increased RWA $8.5 billion (22 basis point decrease). Other modelling changes for specialised lending and other retail products had a net impact of reducing RWA by $1.1 billion (3 basis point increase);
Currency movements increased credit RWA $5.4 billion (14 basis point decrease), mostly reflecting the value of New Zealand exposures increasing from the depreciation of the A$ against the NZ$; and
An increase in the accounting obligation for the defined benefit plan reflecting the impact of lower interest rates (6 basis point decrease).
Additional Tier 1 and Tier 2 capital movement for First Half 2015
Key items impacting Additional Tier 1 and Tier 2 capital were:
Issuance of two Tier 2 instruments (Subordinated Notes);
- CNY1.25 billion (7 basis points increase in Tier 2); and
- A$0.35 billion (10 basis points increase in Tier 2).
Depreciation of the A$ against the US$ has increased the value of US$ denominated Additional Tier 1 and Tier 2 capital instruments by $0.2 billion over the half, increasing total regulatory capital by 5 basis points after allowing for the transitional arrangements for Basel III non-compliant instruments.
The Group is considering the issuance of a new ASX listed Additional Tier 1 capital security, subject to market conditions.
Dividends
% Mov't % Mov't
Half YearMarch 15
Half YearSept 14
Half YearMarch 14
Mar 15 -Sept 14
Mar 15 - Mar 14
Interim (fully franked) 93 - 90 - 3Final (fully franked) - 92 - - -Total ordinary dividend 93 92 90 1 3
Payout ratio (reported) 80.2% 72.5% 77.1% large 316bpsPayout ratio (cash earnings) 76.8% 74.2% 74.2% 263bps 263bpsAdjusted franking credit balance ($m) 471 565 315 (17) 50Imputation credit (cents per share - NZ) 6.0 6.0 6.0 - -
Ordinary dividend (cents per share)
The Board has announced an interim fully franked dividend of 93 cents per share, to be paid on 2 July 2015, to shareholders on the register at the record date of 15 May 20151. The interim dividend represents a payout ratio on a cash basis of 76.8%. In addition to being fully franked, the dividend will also carry NZ$0.06 in New Zealand imputation credits that may be used by New Zealand residents.
The Board has determined to satisfy the DRP for the 2015 interim dividend by issuing Westpac ordinary shares. The Market price used to determine the number of shares issued to DRP participants will be set over the 21 trading days commencing 20 May 2015. The Market price at which ordinary shares will be issued under the DRP will include a 1.5% discount.
Westpac has also entered into an agreement to have the DRP on the interim dividend partially underwritten, which is over and above the participation in the DRP. It is estimated that $2 billion worth of Westpac ordinary shares will be issued under the DRP and the DRP underwrite.
1 Record date in New York is 14 May 2015.

Interim financial results 2015 Review of Group operations
Westpac Group 2015 Interim Results Announcement | 37
Capital adequacy
As at As at As at
$m31 March
201530 Sept
201431 March
2014
Tier 1 capitalCommon equity Tier 1 capital
Paid up ordinary capital 27,237 26,943 26,954
Treasury shares (304) (239) (240)
Equity based remuneration 1,020 935 885
Foreign currency translation reserve (203) (240) (303)
Accumulated other comprehensive income 137 125 90
Non-controlling interests - other 63 60 48
Retained earnings 21,275 20,641 19,556Less retained earnings in life and general insurance, funds management andsecuritisation entities (1,286) (1,223) (1,124)
Deferred fees 107 135 118
Total common equity Tier 1 capital 48,046 47,137 45,984
Deductions from common equity Tier 1 capital
Goodw ill (excluding funds management entities) (9,019) (9,076) (9,196)
Deferred tax assets (1,330) (1,354) (1,401)Goodw ill in life and general insurance, funds management and securitisation entities (1,255) (1,253) (1,264)
Capitalised expenditure (1,404) (1,212) (1,076)
Capitalised softw are (1,932) (1,921) (1,903)
Investments in subsidiaries not consolidated for regulatory purposes (1,348) (1,327) (1,321)
Regulatory expected loss in excess of eligible provisions (734) (650) (694)
General reserve for credit losses adjustment (107) (133) (92)
Securitisation (7) (7) (8)
Equity investments (388) (341) (367)
Regulatory adjustments to fair value positions (127) (132) (203)
Other Tier 1 deductions (7) (7) (4)
Total deductions from common equity Tier 1 capital (17,658) (17,413) (17,529)
Total common equity Tier 1 capital after deductions 30,388 29,724 28,455
Additional Tier 1 capital
Basel III complying instruments 2,694 2,694 1,383
Basel III non complying instruments 2,660 2,579 3,466
Total Additional Tier 1 capital 5,354 5,273 4,849
Net Tier 1 regulatory capital 35,742 34,997 33,304
Tier 2 capital
Basel III complying instruments 2,538 1,925 1,925
Basel III non complying instruments 4,045 3,899 3,966
Eligible general reserve for credit loss 59 78 67
Basel III transitional adjustment (67) - -
Total Tier 2 capital 6,575 5,902 5,958
Deductions from Tier 2 capital
Investments in subsidiaries not consolidated for regulatory purposes (140) (140) (140)
Holdings of ow n and other f inancial institutions Tier 2 capital instruments (62) (58) (106)
Total deductions from Tier 2 capital (202) (198) (246)
Net Tier 2 regulatory capital 6,373 5,704 5,712
Total regulatory capital 42,115 40,701 39,016
Risk weighted assets 346,823 331,387 322,498
Common equity Tier 1 capital ratio 8.8% 9.0% 8.8%
Additional Tier 1 capital 1.5% 1.6% 1.5%
Tier 1 capital ratio 10.3% 10.6% 10.3%
Tier 2 capital 1.8% 1.7% 1.8%
Total regulatory capital ratio 12.1% 12.3% 12.1%

Interim financial results 2015 Review of Group operations
38 | Westpac Group 2015 Interim Results Announcement
Risk Weighted Assets (RWA)
As at As at As at % M ov't % M ov't
$m
31 March 2015
30 Sept 2014
31 March 2014
Mar 15 -Sept 14
Mar 15 - Mar 14
Corporate1 77,516 70,199 68,540 10 13
Business lending2 32,352 33,125 33,446 (2) (3)
Sovereign3 1,310 1,627 1,387 (19) (6)
Bank4 7,842 8,745 8,638 (10) (9)Residential mortgages 73,337 63,071 62,179 16 18Australian credit cards 6,432 6,069 6,188 6 4Other retail 12,095 10,653 10,265 14 18
Small business5 7,614 6,311 6,508 21 17
Specialised lending: Property and project f inance6 53,741 53,162 48,047 1 12
Securitisation7 4,431 4,845 5,521 (9) (20)Standardised 15,516 14,747 14,062 5 10Mark-to-market related credit risk 10,840 8,905 7,257 22 49
Credit risk 303,026 281,459 272,038 8 11Market risk 7,900 8,975 10,610 (12) (26)
Operational risk8 30,136 29,340 28,474 3 6Interest rate risk in the banking book (IRRBB) 1,596 7,316 8,459 (78) (81)Other 4,165 4,297 2,917 (3) 43
Total 346,823 331,387 322,498 5 8
Movements in RWA for the First Half 2015 were as follows:
Credit risk RWA increased $21.6 billion or 7.7% due to:
- Modelling changes increased RWA $7.4 billion. These included changes to the determination of probability of default for mortgages ($8.5 billion increase), changes to the approach to assigning exposures to regulatory slotting categories for specialised lending exposures ($1.7 billion decrease) and changes to risk estimates for other retail exposures ($0.6 billion increase);
- $5.4 billion from the depreciation in the A$ mostly related to our New Zealand operations;
- $1.9 billion from higher mark-to-market related credit risk related to derivative counterparty exposures;
- Improvements in asset quality led to a reduction in RWA of $2.1 billion; and
- Growth in the portfolio (excluding the above items) which added $9.0 billion to credit RWA over the half.
Non-credit RWA decreased $6.1 billion primarily due to:
- Interest rate risk in the banking book (IRRBB) RWA decreased $5.7 billion, due to a reduction in exposure to interest rate movements in the regulatory banking book and an increase in the embedded gain from falling market interest rates;
- Market risk RWA decreased $1.1 billion due to a reduction in the level of interest rate and credit spread risk exposure in the trading book; and
- Operational risk RWA increased $0.8 billion.
1 Corporate – Typically includes exposure where the borrower has annual turnover greater than $50 million, and other business
exposures not captured under the definitions of either Business lending or Small Business. 2 Business Lending – Includes exposures where the borrower has annual turnover less than or equal to $50 million and exposure
greater than $1 million. 3 Sovereign – includes exposures to Governments themselves and other non-commercial enterprises that are owned or controlled by
them. 4 Bank – includes exposures to licensed banks and their owned or controlled subsidiaries, and overseas central banks. 5 Small Business – includes exposures less than or equal to $1 million. 6 Specialised lending – property and project finance – includes exposures to entities created to finance and/or operates specific assets
where, apart from the income received from the assets being financed, the borrower has little or no independent capacity to repay from other activities or assets.
7 Securitisation – exposures reflect Westpac’s involvement in activities ranging from originator to investor and include the provision of securitisation services for clients wishing to access capital markets.
8 Operational risk – the risk of loss resulting from inadequate or failed internal processes, people and systems or from external events, including legal risk but excluding strategic or reputational risk.

Interim financial results 2015 Review of Group operations
Westpac Group 2015 Interim Results Announcement | 39
Capital deduction for regulatory expected credit loss
For capital adequacy purposes APRA requires the amount of regulatory expected credit losses in excess of eligible provisions to be deducted from CET1 capital. The table below shows the calculation of this capital deduction.
As at As at As at
$m31 March
201530 Sept
201431 March
2014Provisions associated w ith eligible portfolios
Total provisions for impairment charges (Section 4 Note 9) 3,505 3,481 3,791
plus general reserve for credit losses adjustment 107 133 92
plus provisions associated w ith partial w rite-offs 406 504 528
less ineligible provisions1 (131) (132) (141)
Total eligible provisions 3,887 3,986 4,270
Regulatory expected downturn loss 4,588 4,636 4,964 Shortfall in eligible provisions compared to regulatory expecteddownturn loss 701 650 694 Common equity Tier 1 capital deduction for regulatory expected downturn loss in excess of eligible provisions2 (734) (650) (694)
1 Provisions associated with portfolios subject to the Basel standardised approach to credit risk are not eligible. 2 Regulatory expected loss is calculated for portfolios subject to the Basel advanced capital IRB approach to credit risk. The
comparison between regulatory expected loss and eligible provisions is performed separately for defaulted and non-defaulted exposures. As at 31 March 2015, there was an excess of eligible provisions compared to regulatory expected loss for defaulted exposures of $33 million. This excess is not available to reduce the shortfall for non-defaulted exposures in the calculation of the common equity Tier 1 capital deduction.

Interim financial results 2015 Review of Group operations
40 | Westpac Group 2015 Interim Results Announcement
2.6 Sustainability performance
Approach to sustainability
The Group’s approach to operating sustainably, is outlined in its 2013-2017 sustainability strategy and is available on Westpac’s website. The Group’s approach is designed to anticipate and shape the most pressing emerging societal issues where the Group has the skills and experience to make a meaningful, positive difference.
The strategy is focused on three areas:
Embracing societal change: helping improve the way people work and live, as our society changes;
Environmental solutions: helping find solutions to environmental challenges; and
Better financial futures: helping customers to have a better relationship with money, for a better life.
These areas are supported by measurable objectives, which are regularly tracked and reported.
The Group’s identification of and responses to the most material current sustainability issues are subject to independent external assurance against the AA1000 AccountAbility Principles Standard (2008).
Key initiatives, awards and highlights
Assessed as the most sustainable bank globally in the 2014 Dow Jones Sustainability Indices (DJSI) and assigned a Gold Class ranking in the RobecoSam Sustainability Yearbook for 2014, released in January 2015. Westpac achieved its highest ever score of 93;
Ranked as one of the 2015 Global 100 Most Sustainable Corporations in the World list compiled by Corporate Knights, as announced at the World Economic Forum in January 2015. Westpac has featured in the Global 100 for nine of the last 10 years;
Westpac continued to support the Westpac Bicentennial Foundation who awarded the first 22 scholarships during First Half 2015. The Foundation expects to award 200 scholarships by 8 April 2017 and offer 100 scholarships per year thereafter;
Awarded a Certificate of Distinction in the 2015 United Nations Sasakawa Awards for Risk Reduction as a member of the Australian Business Roundtable for Disaster Resilience and Safer Communities, which comprises the CEO's of six major Australian organisations;
Received the Employer of Choice for Gender Equality citation by the Workplace Gender Equality Agency;
Signed a 10-year contract with CareerTrackers Indigenous Internship program to recruit at least 400 Aboriginal or Torres Strait Islander university student interns. The Group also received the CareerTrackers Corporate Plus award, recognising the substantial support provided since 2009;
Launched a Social Impact Framework to ensure the Group’s investment in community-focused products, partnerships and programs are weighted towards activity that will deliver the greatest social and business benefit. It includes an industry leading online evaluation tool, called OURImpact;
Released a Financing Agribusiness position statement, supporting delivery against the Group’s commitments under the Banking Environment Initiative’s Soft Commodities Compact; and
Received the highest Platinum LEED rating for the Group’s Singapore workplace, recognising its eco-efficiency.

Interim financial results 2015 Review of Group operations
Westpac Group 2015 Interim Results Announcement | 41
Performance against sustainability objectives1
Priority Objectives First Half 2015 progress
Help improve the way people work and live, as our society changes
Ensure our workforce is representative of the community
Women in leadership at 44%, up from 43% one year ago.
Recruited 67 additional Indigenous Australians.
Participation of mature aged workers (50+) has remained steady at 20.9%.
Extend length and quality of working lives
Employee mean retirement age of 61.5 years, down from 61.6 during the half (but up from 61.4 one year ago). Work has continued to promote flexible working including training for people leaders and the creation of an online hub which supports a gradual transition to retirement.
Anticipate the future product and service needs of ageing and culturally diverse customers
Launched BTFG’s ‘Changing the Face of Advice’ program in October 2014, incorporating the Adviser View register with planner qualifications and customer ratings. The program also covers higher minimum educational and ethical standards for all BTFG planners and the launch of an Advice Commitment customer charter. The intent of the program is to give Australians access to better information on financial planning and planners.
Help find solutions to environmental challenges
Provide products and services to help customers adapt to environmental challenges
Since 2013 launched four unique product/services including partnering with the World Bank to bring the first green bond to the Australian market and the introduction of energy efficient equipment finance.
Increase lending and investment in CleanTech and environmental services
TCE to the Cleantech and environmental services sector increased $50 million during First Half 2015, taking TCE to over $8 billion, 34% ahead of target.
Reduce our environmental footprint
On track to maintain the Group’s carbon neutral status for 2015.
Received the highest Platinum LEED rating for the Group’s Singapore workplace recognising its eco-efficiency.
Maintained power usage effectiveness at 1.70 across Westpac's data centres in line with target.
Paper and energy targets are on track, assisted by the move to a new six star Green Star rated building at 150 Collins Street, Melbourne.
Help customers to have a better relationship with money, for a better life
Ensure all our customers have access to the right advice to achieve a secure retirement
The proportion of Australia retail banking and wealth employees with wealth accreditation remains steady at 12%.
Help our customers meet their financial goals in retirement
The take-up of superannuation and retirement offers has been impacted by both regulatory changes affecting the industry, including the Future of Financial Advice reforms, and negative consumer sentiment. A new retention program commenced during the half.
Increase access to financial services in the Pacific
On track to meet the Group’s 2015 targets with over 257,000 basic banking customers and over 40,000 mobile banking activations. During First Half 2015, the number of mobile banking acquisitions has doubled to more than 40,000.
Help people gain access to social and affordable housing and services
$1 billion lent to the social and affordable housing sector as at 31 March 2015, up from $0.82 billion as at 30 September 2014. This includes a deal with SGCH to construct 275 new dwellings across Sydney, boosting the stock of affordable housing in NSW.
1 All results as at 31 March 2015 except environmental footprint which is as at 31 December 2014. Refer to
www.westpac.com.au/sustainability for glossary of terms and metric definitions.

Interim financial results 2015 Divisional results
42 | Westpac Group 2015 Interim Results Announcement
3.0 Divisional results1
3.1 Westpac Retail & Business Banking
Westpac Retail & Business Banking (Westpac RBB) is responsible for sales and service to consumer, SME, commercial and agribusiness customers (with turnover of up to around $100 million) in Australia under the Westpac brand. Activities are conducted through Westpac RBB’s network of branches, call centres, ATMs, EFTPOS terminals, internet and mobile banking services, business banking centres and via the division’s specialised consumer and business relationship managers. Support is also provided by cash flow, trade finance, transactional banking, financial markets, property finance and wealth specialists. Westpac RBB also works in an integrated way with BTFG and WIB in the sales and service of select financial services products. Much of the associated revenue from these products is retained by the product originators, BTFG and WIB.
% M ov't % M ov't
$mHalf YearMarch 15
Half YearSept 14
Half YearMarch 14
Mar 15 -Sept 14
Mar 15 - Mar 14
Net interest income 3,100 3,039 2,914 2 6
Non-interest income 735 730 711 1 3
Net operating income 3,835 3,769 3,625 2 6
Operating expenses (1,685) (1,656) (1,610) 2 5
Core earnings 2,150 2,113 2,015 2 7
Impairment charges (221) (210) (226) 5 (2)
Operating profit before tax 1,929 1,903 1,789 1 8
Tax and non-controlling interests (579) (573) (536) 1 8
Cash earnings 1,350 1,330 1,253 2 8
Economic profit 1,153 1,185 1,109 (3) 4
Expense to income ratio 43.9% 43.9% 44.4% - (47bps)
Net interest margin 2.41% 2.40% 2.37% 1bps 4bps
% M ov't % M ov't
$bnHalf YearMarch 15
Half YearSept 14
Half YearMarch 14
Mar 15 -Sept 14
Mar 15 - Mar 14
Deposits
Term deposits 54.5 56.4 53.3 (3) 2
Other 113.5 106.1 99.8 7 14
Total deposits 168.0 162.5 153.1 3 10
Net loans
Mortgages 219.7 213.5 206.1 3 7
Business 47.9 47.4 46.5 1 3
Other 10.0 9.8 9.6 2 4
Total net loans 277.6 270.7 262.2 3 6
Deposit to loan ratio 60.5% 60.0% 58.4% 49bps 213bps
Total assets 284.2 276.6 268.3 3 6
Total committed exposure 348.5 339.4 328.4 3 6
Average interest-earning assets 258.2 252.6 246.8 2 5
Half YearMarch 15
Half YearSept 14
Half YearMarch 14
Credit qualityMortgage delinquencies > 90 days 0.49% 0.47% 0.47%Other consumer loans delinquencies > 90 days 1.27% 1.03% 1.17%
Business impaired assets to total committed exposure 0.72% 0.72% 0.85%
Total stressed assets to total committed exposure 1.12% 1.17% 1.22%
1 Refer to Glossary for definition.

Interim financial results 2015 Divisional results
Westpac Group 2015 Interim Results Announcement | 43
Financial performance
First Half 2015 - Second Half 2014
Maintained earnings consistency with nine consecutive halves of cash and core earnings growth;
Cash and core earnings up 2% supported by balance sheet growth, disciplined management of margins and well controlled expenses; and
The division has continued to strengthen its franchise with more customers, lower complaints and a further rise in the deposit to loan ratio.
Westpac RBB has continued to be a consistent earnings driver for the Group with both core and cash earnings growth of 2%. Disciplined execution of the business strategy has led to an increase in customer numbers, balance sheet growth, little change in margins and strong asset quality. Highlights for the First Half 2015 included:
Delivered more for customers:
- Westpac has been recognised as the Best Retail Bank in Australia and the Asia-Pacific1, as well as Best Business Bank2 in 2015;
- Ranked equal number 1 of the major banks in customer satisfaction across consumer3 and business customers4 and ranked number 1 of the majors on net promoter score for business banking4 and third in consumer3;
- Reduced customer complaints by a third;
- Completed roll out of the new digital and mobile banking platform, Westpac Live, to consumers (3.1 million customers) and commenced the migration of business customers onto the platform (300,000 customers);
- Enhanced functionality of Westpac Live with simplified log-ons (including fingerprint recognition), customised alerts, and new ways of grouping and sharing data;
- Delivered more 24/7 capability with the upgrade of 19 branches to the division’s new Bank Now format. This included the installation of another 38 Smart ATMs, which now represents 23% of the ATM network;
- Connecting more businesses with financial specialists through Connect Now video conferencing facilities. 332 locations have now been upgraded representing 46% of the network;
Growing in target segments:
- Achieved disciplined growth across lending and deposits with both up 3%;
- Customer numbers increased 2% with a rise in customers joining via online channels;
- Continued to lead the sector in customers with a wealth product 21.8%5; and
- Helped more customers manage their foreign exchange risks, resulting in a 7% increase in foreign exchange income.
Net interest income increased 2% with average interest-earning assets rising 2% and margins up 1 basis point:
Net interest margins increased 1 basis point over the period to 2.41%:
- Funding costs improved 8 basis points from lower wholesale costs and improved deposit spreads. The improved deposit spreads were due to a reduction in term deposit rates and higher growth in transaction accounts; and
- Partly offset by 7 points fall in lending spreads from competition across mortgage and business lending, and lower card spreads from customers continuing to pay down their balances.
Lending grew 3% or $6.9 billion:
- Mortgages accounted for the majority of the growth, increasing $6.2 billion or 3%. The combination of low rates and ongoing consumer caution is seeing continued high levels of accelerated repayments;
- Business customers continue to be cautious with both gearing and investment and this has resulted in a lending increase of $0.5 billion or 1%; and
- Other consumer lending was up 2%, with growth in personal loans up 4%. 1 Source: Asian Banker Excellence in Retail Financial Services International Awards, March 2015. 2 Source: Asia-Pacific Banking and Finance (AB&F) Corporate and Business Banking Awards, March 2015. 3 Source: Roy Morgan Research, March 2015, 6MMA 4 Source: DBM Consultants, Business Financial Services Monitor, March 2015, 6MMA 5 Refer Glossary for full definition.

Interim financial results 2015 Divisional results
44 | Westpac Group 2015 Interim Results Announcement
Deposits grew $5.5 billion or 3%, with most of the increase in consumer and business transaction accounts.
Non-interest income increased 1% compared to Second Half 2014 from:
A rise in foreign exchange related income as increased currency volatility encouraged more customers to actively manage their exchange rate risks; and
An uplift in working capital revenue (merchant terminals and trade).
Operating expenses increased $29 million or 2%, with investment and operating cost increases partially offset by a range of productivity initiatives. The main drivers were:
Higher operating costs, including annual salary increases from 1 January, and annual rent and utility cost increases;
Higher investment related costs associated with the roll out of Connect Now and Westpac Live; partially offset by
Productivity benefits of $20 million from improved processes, efficiencies associated with the roll out of Bank Now branches and customers increasingly using more self-serve options including smart ATMs and Westpac Live. This has contributed to a 2% decline in FTE and a 3% increase in revenue per FTE.
Asset quality has been maintained with stressed assets continuing to fall and mortgage delinquencies little changed. Unsecured delinquencies were higher consistent with normal seasonality.
Impairment charges rose $11 million (or 5%):
Consumer impairment charges were $22 million higher, in line with portfolio growth and increasing seasonal delinquencies; and
Business impairment charges were $11 million lower, from improved quality in business lending portfolios with lower new individually assessed provisions.
Economic profit was lower over the half as capital allocated to the division increased 11%. The higher capital reflects modelling changes in the amount of capital being applied to mortgages.
First Half 2015 – First Half 2014
Westpac RBB’s focus on customer service and investment in distribution has continued to deliver with cash earnings up 8% and core earnings rising 7%; and
The result was supported by balance sheet growth, a rise in margins and improved productivity.
Westpac RBB increased cash earnings $97 million or 8%, with core earnings up $135 million or 7%.
Net interest income increased 6% from a 5% rise in average interest-earning assets and a 4 basis point improvement in net interest margins:
The 4 basis point rise in margins was due to improved deposit spreads, favourable deposit mix impacts and lower wholesale funding costs. Asset spreads were lower from competition for new lending, particularly in mortgages;
Mortgages were the main driver of increased lending, rising 7%. Small and medium business lending remains relatively subdued across the market and that has been reflected in the 3% rise in lending, while other lending (mostly cards and personal loans) grew at 4%; and
Deposits increased $14.9 billion, with most of the growth in high quality, more stable balances, particularly consumer savings and consumer and business transaction accounts.
Non-interest income increased $24 million or 3% with much of the increase due to business income from merchants, line fees and from more consumers and businesses actively managing their foreign exchange risks.
Operating expenses increased 5% from higher investment and regulatory change related spending along with a rise in the number of customer facing employees. This was partially offset by productivity savings.
There was further improvement in asset quality over the year with business impaired assets as a percent of total committed exposure falling 13 basis points to 0.72% and consumer delinquencies remaining low. This improvement contributed to the 2% fall in impairment charges.

Interim financial results 2015 Divisional results
Westpac Group 2015 Interim Results Announcement | 45
3.2 St.George Banking Group
St.George Banking Group (St.George) is responsible for sales and service to consumer, SME and corporate customers (businesses with facilities up to $150 million) in Australia under the St.George, BankSA, Bank of Melbourne and RAMS brands. Activities are conducted through St.George’s network of branches, third party distributors, call centres, ATMs, EFTPOS terminals, internet and mobile banking services, business banking centres and specialised consumer and business relationship managers. Support is provided by cash flow, trade finance, transactional banking, automotive and equipment finance, financial markets, property finance, and wealth specialists. St.George also works in an integrated way with BTFG and WIB in the sales and service of select financial services products. Much of the associated revenue from these products is retained by the product originators, BTFG and WIB.
% M ov't % M ov't
$mHalf YearMarch 15
Half YearSept 14
Half YearMarch 14
Mar 15 -Sept 14
Mar 15 - Mar 14
Net interest income 1,840 1,826 1,705 1 8
Non-interest income 273 264 251 3 9
Net operating income 2,113 2,090 1,956 1 8
Operating expenses (801) (812) (747) (1) 7
Core earnings 1,312 1,278 1,209 3 9
Impairment charges (116) (128) (108) (9) 7
Operating profit before tax 1,196 1,150 1,101 4 9
Tax and non-controlling interests (359) (344) (332) 4 8
Cash earnings 837 806 769 4 9
Economic profit 651 626 617 4 6
Expense to income ratio 37.9% 38.9% 38.2% (94bps) (28bps)
Net interest margin 2.28% 2.30% 2.27% (2bps) 1bps
% M ov't % M ov't
$bnHalf YearMarch 15
Half YearSept 14
Half YearMarch 14
Mar 15 -Sept 14
Mar 15 - Mar 14
Deposits
Term deposits 35.1 36.9 36.4 (5) (4)
Other 59.4 56.6 52.4 5 13
Total deposits 94.5 93.5 88.8 1 6
Net loans
Mortgages 130.1 125.2 120.2 4 8
Business 32.2 32.1 31.7 - 2
Other 11.4 11.0 10.5 4 9
Total net loans 173.7 168.3 162.4 3 7
Deposit to loan ratio 54.4% 55.6% 54.7% (116bps) (28bps)
Total assets 180.7 175.3 169.5 3 7
Total committed exposure 203.0 195.4 188.3 4 8
Average interest-earning assets 162.1 158.2 150.6 2 8
Half YearMarch 15
Half YearSept 14
Half YearMarch 14
Credit qualityMortgage delinquencies > 90 days 0.48% 0.51% 0.58%Other consumer loans delinquencies > 90 days 1.18% 1.01% 1.14%
Business impaired assets to total committed exposure 0.83% 1.22% 1.71%Total stressed assets to total committed exposure 1.28% 1.55% 1.79%
Interim financial results 2015 Divisional results
46 | Westpac Group 2015 Interim Results Announcement
Financial performance
First Half 2015 - Second Half 2014
Maintained momentum of recent halves, with cash earnings up 4% and core earnings up 3%;
Result supported by balance sheet growth, increased efficiency and a further improvement in asset quality which contributed to lower impairment charges.
St.George delivered cash earnings of $837 million in First Half 2015, up $31 million, or 4% with core earnings rising 3%. The cash earnings performance was supported by lower impairment charges from a further improvement in asset quality.
St.George has continued to build on its position as a strong local/regional alternative. The success of this approach is reflected in momentum across its brands, including above system growth in mortgages1 and improvement across a number of key metrics. Highlights for First Half 2015 included:
Enhanced customer proposition:
- Maintained leadership over the major banks in customer satisfaction for consumer2 and joint leadership in business3.
- Customer numbers increased 3%; and
- The proportion of bank customers with a wealth/insurance product has improved over recent years and as at 31 March 2015 was 17.1%4.
Continued to reconfigure the branch network and maintain leadership in digital innovation:
- A further 30 branches were upgraded in First Half 2015 under the FreshStart program. These branches provide more flexible service options, increased availability and efficiency, with 59% of the network now upgraded;
- Bank of Melbourne has continued to extend its reach in the Victorian market and now operates around 100 branches. The business has consistently grown ahead of system across both mortgages and deposits since its launch in 2011;
- Business Connect, St.George’s video capability for connecting small and medium business customers directly to business banking specialists, was extended to a further nine sites, with 55% of sites now connected; and
- Maintained the division’s track record of digital innovation including introducing biometric authentication and one-click payment capability. The Asian Banker has recently awarded St.George with the best mobile banking app in the Asia Pacific5.
Net interest income increased $14 million or 1%, with average interest-earning assets rising 2%, partially offset by a 2 basis point decline in net interest margins:
The decline in margins was due to lower lending spreads from competition for new lending in both mortgages and business lending and increased costs of liquidity. Partially offsetting this decline was higher deposit spreads from both repricing and mix impacts and lower funding costs;
Lending increased $5.4 billion or 3%:
- Mortgages accounted for the majority of growth, rising $4.9 billion up 4%, with all brands contributing;
- Business lending was flat over the half with a 7% increase in new lending offset by portfolio run-off; and
- Other lending rose 4% mostly from growth in auto finance loans. This growth was supported by the acquisition of the Lloyds business in 2014.
Deposits grew $1.0 billion or 1% with most of the rise recorded in consumer savings and transaction accounts. Term deposits declined 5% driven largely by a reduction in corporate term deposits as St.George chose not to pursue deposits with a lower relative value from an LCR perspective.
Non-interest income was up $9 million or 3%, from the repricing of business line fees including for undrawn commitments. Auto finance fees were also higher.
1 Source: APRA. 2 Source: Roy Morgan Research, March 2015, 6MMA. 3 Source: DBM Business Financial Services Monitor, March 2015, 6MMA. 4 Source: Refer Glossary for definition. 5 Source: The Asian Banker Magazine, March 2015.

Interim financial results 2015 Divisional results
Westpac Group 2015 Interim Results Announcement | 47
Operating expenses declined $11 million or 1%, with productivity initiatives including the benefits from the network reconfiguration and synergies associated with the acquisition of the Lloyds business. Partially offsetting these savings has been increases in operating costs and investment associated with the further roll out of FreshStart branches. First Half 2015 also benefited from the timing of some investment spending.
Asset quality improved over the half with stressed and impaired assets down while mortgage delinquencies were also lower. The rise in other consumer delinquencies was predominantly due to seasonality. Given these trends, impairment charges were $12 million lower with improvements in business impairments partly offset by an increase in consumer impairments from higher unsecured consumer delinquencies.
First Half 2015 – First Half 2014
A 9% rise in cash earnings supported by a 9% increase in core earnings including a lift in the contribution from the acquired Lloyds business; and
Revenue increased 8% from a 7% rise in lending a 1 basis point increase in margins, along with a 9% rise in non-interest income which was boosted by the Lloyds acquisition.
St.George delivered cash earnings of $837 million, up 9%. Core earnings were up $103 million or 9%, driven by volume growth and the full period impact of Lloyds ($41 million).
Net interest income was up $135 million or 8%, supported by an 8% rise in average interest-earning assets and a 1 basis point increase in net interest margins:
Improved deposit spreads and lower wholesale funding costs were partly offset by a reduction in spreads on new lending across both business and mortgages;
Lending was up $11.3 billion or 7%:
- Mortgages increased $9.9 billion (or 8%). Growth was achieved across all brands and proprietary channels, particularly in Bank of Melbourne who have continued to grow above system in the Victorian market;
- Business lending increased 2% over the period mostly from property and SME; and
- Other lending increased 9% primarily from growth in auto loans.
Deposits were up $5.7 billion or 6%, with most of the increase in at call savings and transaction accounts, including mortgage offset accounts.
Non-interest income was up $22 million or 9%, with around half of the rise due to the full period impact of the Lloyds acquisition. Business fees were also higher, including from undrawn commitment fees.
Operating expenses increased $54 million or 7%, with Lloyds contributing $17 million to the rise. Excluding Lloyds, expenses increased 5%. Operating expense increases were offset by productivity benefits, with most of the operating expense increase due to investments including:
Bank of Melbourne expansion has added around $23 million to expenses over the year including new branches, increased employee numbers and a rise in depreciation; and
Improving the customer experience including via new branch formats (FreshStart) and the Business Connect model for serving SME customers.
Impairment charges were up $8 million or 7% with most of the rise due to lower write-backs. Asset quality improved further over the year.

Interim financial results 2015 Divisional results
48 | Westpac Group 2015 Interim Results Announcement
3.3 BT Financial Group (Australia)
BT Financial Group (Australia) (BTFG) is Westpac’s Australian wealth division.
BTFG’s funds management operations include the manufacturing and distribution of investment, superannuation and retirement products, platforms including BT Wrap and Asgard, private banking, financial planning as well as Margin Lending and broking. BTFG’s insurance solutions cover the manufacturing and distribution of life, general and lenders mortgage insurance. BTFG’s brands include Advance Asset Management, Ascalon, Asgard, BT Investment Management Limited (59.1% owned by the Westpac Group and consolidated in BTFG’s Funds Management business), Licensee Select, BT Select and Securitor, as well as the Advice, Private Banking and Insurance operations of Westpac, St.George, Bank of Melbourne and BankSA.
% M ov't % M ov't
$mHalf YearMarch 15
Half YearSept 14
Half YearMarch 14
Mar 15 -Sept 14
Mar 15 - Mar 14
Net interest income 216 203 203 6 6
Non-interest income 1,124 1,135 1,122 (1) -
Net operating income 1,340 1,338 1,325 - 1
Operating expenses (668) (653) (670) 2 -
Core earnings 672 685 655 (2) 3
Impairment (charges) / benefits 4 (2) 4 large -
Operating profit before tax 676 683 659 (1) 3
Tax and non-controlling interests (225) (224) (218) - 3
Cash earnings 451 459 441 (2) 2
Economic profit 415 439 408 (5) 2
Expense to income ratio 49.9% 48.8% 50.6% 105bps (72bps)
Income on invested capital1 48 37 36 30 33
% M ov't % M ov't
$bnHalf YearMarch 15
Half YearSept 14
Half YearMarch 14
Mar 15 -Sept 14
Mar 15 - Mar 14
Deposits 23.6 22.4 20.8 5 13
Net loans 16.7 15.9 15.4 5 8
Deposit to loan ratio 141.3% 140.9% 135.1% 44bps large
Funds Under Management (FUM) 103.3 89.0 82.1 16 26
Average Funds Under Management2 95.6 86.4 80.5 11 19
Funds Under Administration (FUA) 125.0 112.7 106.8 11 17
Average Funds Under Administration2 118.1 111.7 104.8 6 13
Cash earnings % M ov't % M ov't
$mHalf YearMarch 15
Half YearSept 14
Half YearMarch 14
Mar 15 -Sept 14
Mar 15 - Mar 14
Funds management business 291 274 265 6 10
Insurance 131 174 150 (25) (13)
Total funds management and insurance 422 448 415 (6) 2
Capital and other 29 11 26 164 12
Total cash earnings 451 459 441 (2) 2
1 Income on Invested Capital represents revenue generated from investing BTFG’s capital balances (required for regulatory purposes). 2 Average Funds are based on six month averages for Half Year March 2015, Half Year September 2014 and Half Year March 2014.

Interim financial results 2015 Divisional results
Westpac Group 2015 Interim Results Announcement | 49
Financial performance
Given the normal seasonality in the wealth business associated with insurance claims and fund activity, cash earnings for BTFG is best compared to the prior corresponding period. This was particularly evident in BTFG’s First Half 2015 results which were impacted by higher claims associated with severe weather events.
First Half 2015 - Second Half 2014
Cash earnings decreased $8 million, or 2%;
Funds Management cash earnings increased $17 million or 6% from a higher BTIM contribution and growth in FUM and FUA related income. Average FUM and FUA increased 11% and 6% respectively supported by continued inflows, improved markets, and favourable exchange rate movements. These gains were partly offset by lower Advice income from reduced activity;
Insurance cash earnings were down $43 million or 25%. Claims increased $75 million, largely from the impact of two major weather events (Brisbane hail storm and Cyclone Marcia) and a rise in life insurance claims. The business has continued to expand with Life Insurance in-force premiums up 4% and General Insurance gross written premiums 5% higher. The prior decision to reduce risk in the LMI portfolio has seen earned premiums continue to reduce, although this was offset by a low loss rate for the half; and
The cash earnings contribution from Capital and other was up $18 million over First Half 2015, mostly due to higher returns on invested capital and a rise in retained earnings.
First Half 2015 – First Half 2014
Cash earnings increased $10 million or 2%;
Funds Management cash earnings were up $26 million or 10%, driven by increased net flows onto platforms and an increase in average FUM and FUA of 19% and 13% respectively. Partly offsetting this was a decrease in performance fees received in BTIM as the outperformance against benchmarks achieved in First Half 2014 was not matched;
The Insurance contribution was down $19 million or 13% largely from the impact of higher claims with more severe weather events occurring in First Half 2015 than in First Half 2014. Revenue was supported by a rise in net in-force premiums of 13% in Life Insurance and a rise in gross written premiums of 8% in General Insurance. The LMI contribution was $4 million lower, consistent with the prior decision to reduce risk in the portfolio; and
Cash earnings from Capital and other was up $3 million, mostly from improved returns on invested capital.

Interim financial results 2015 Divisional results
50 | Westpac Group 2015 Interim Results Announcement
3.3.1 Funds Management business
% M ov't % M ov't
$mHalf YearMarch 15
Half YearSept 14
Half YearMarch 14
Mar 15 -Sept 14
Mar 15 - Mar 14
Net interest income 194 189 176 3 10
Non-interest income 859 824 868 4 (1)
Net operating income 1,053 1,013 1,044 4 1
Operating expenses (611) (599) (634) 2 (4)
Core earnings 442 414 410 7 8
Impairment (charges) / benefits 4 (2) 4 large -
Operating profit before tax 446 412 414 8 8
Tax and non-controlling interests (155) (138) (149) 12 4
Cash earnings 291 274 265 6 10
Expense to income ratio 58.0% 59.1% 60.7% (111bps) (271bps)
Cash earnings % M ov't % M ov't
$mHalf YearMarch 15
Half YearSept 14
Half YearMarch 14
Mar 15 -Sept 14
Mar 15 - Mar 14
Funds Management business (ex BTIM) 248 242 208 2 19
BTIM 43 32 57 34 (25)
Total cash earnings 291 274 265 6 10
Movement of FUM/FUA
% M ov't % M ov'tMar 15 -Sept 14
Mar 15 - Mar 14
Retail2 16.7 0.8 (1.1) (0.3) 1.8 18.2 16.5 9 10
Institutional 23.4 3.8 (3.9) (0.1) 3.0 26.3 21.9 12 20
Wholesale 48.9 9.5 (5.4) 4.1 5.8 58.8 43.7 20 35
Total FUM 89.0 14.1 (10.4) 3.7 10.6 103.3 82.1 16 26
Wrap 91.7 13.4 (11.2) 2.2 7.6 101.5 86.6 11 17
Corporate Super 18.1 1.2 (0.9) 0.3 1.7 20.1 17.2 11 17
Other3 2.9 - - - 0.5 3.4 3.0 17 13
Total FUA 112.7 14.6 (12.1) 2.5 9.8 125.0 106.8 11 17
Other Mov't¹
March2015
March2014 $bn
Sept2014 Inflows Outflows
NetFlows
Market share in key Australian wealth products are displayed below.
Current Australian market share4
Product
Platforms (includes Wrap and Corporate Super) 19.9% 1
Retail (excludes Cash) 18.8% 1
Corporate Super 14.8% 3
Funds Management - BTIM 4.5% 7
Wholesale - BTIM/AAM 2.1% 17
Market share (%) Rank
1 Other movement includes market movement and other client transactions including fund transfers, account fees and distributions. 2 Retail includes Annuities, Retail Investment, Retirement Products and Retail Superannuation. 3 Other includes Capital and Reserves. 4 Market share FUM/FUA based on published market share statistics from Plan for Life and Morningstar as at 31 December 2014 and
represents the addition of St.George Wealth and BT Wealth business market share at this time.

Interim financial results 2015 Divisional results
Westpac Group 2015 Interim Results Announcement | 51
Financial performance
First Half 2015 - Second Half 2014
Continued positive FUM and FUA flows, combined with a rise in asset markets, contributed to a 6% increase in cash earnings to $291 million; and
The result was supported by an increased contribution from BTIM, a rise in lending in Private Wealth and higher income from increased FUA. Growth was partly offset by lower Advice income.
The Funds Management business delivered cash earnings of $291 million, up $17 million, or 6%.
Higher earnings from the Group’s Platforms and an improved contribution from asset management contributed to earnings growth. Higher asset markets and the decline in the Australian dollar contributed to increased FUA and FUM balances and returns from the Ascalon funds.
BTFG has continued to build on its market position over the half including:
Ranked number 1 on all Platforms (including Corporate Super) with FUA share of 19.9%1;
Ranked number 1 on Retail Super (excluding Cash) with 18.8% FUA1;
Ranked number 3 on Corporate Super with a 14.8% share of FUA1;
BT Super for Life retail balances were up a further 16% over the half to $5.7 billion. Asgard Infinity balances have now reached $8.7 billion since launching in October 2011; and
Continued the phased roll out of the Panorama platform with the launch of managed portfolios which complemented the launch of cash management capability in 2014. Panorama is designed to enhance the way investment portfolios, including superannuation, will be managed in the future.
Net interest income was $5 million or 3% higher, primarily from a 5% increase in mortgages and an 8% increase in business lending balances in Private Wealth.
Non-interest income increased $35 million, or 4%:
BTIM’s contribution increased with above benchmark performance2 in JOHCM contributing to higher performance fees earned;
FUM related revenue increased from greater inflows, improved markets and foreign currency translation impacts on Ascalon investments;
FUA related revenue was up $10 million or 4%, with positive inflows onto the BT Wrap platform and improved markets; and
Advice income was lower, down $17 million from reduced activity.
Operating expenses increased $12 million or 2%:
Performance related payments in BTIM (including JOHCM) were higher, associated with above benchmark performance; and
Other increases included higher salary expenses and investment costs associated with the Panorama platform were offset by productivity benefits.
Tax and other non-controlling interests increased $17 million or 12%, associated with higher earnings and a higher contribution from BTIM increasing distributions to non-controlling interests.
1 Source: Plan for Life as at December 2014. 2 JOHCM performance fees are determined in the first half of each year.

Interim financial results 2015 Divisional results
52 | Westpac Group 2015 Interim Results Announcement
First Half 2015 – First Half 2014
Cash earnings increased 10% with increases in FUM and FUA balances and growth in lending and deposits in Private Wealth; and
Earnings were partially offset by lower performance fees in BTIM which were particularly high in First Half 2014.
Net interest income was up 10% from higher lending and deposit volumes in Private Wealth.
Non-interest income decreased $9 million, or 1%:
In First Half 2015, BTIM generated performance fees from above benchmark performance, however they were significantly lower than the fees recorded in First Half 2014. Overall performance fees were $77 million lower;
Excluding performance fees, FUM related revenue increased $43 million, with a 19% rise in average FUM from inflows into Advance, Super and Investment Funds. Improved markets and positive foreign exchange movements also contributed to the rise;
FUA revenue increased $18 million, driven by platform flows and improved markets;
Increased Ascalon contribution with much of the increase from foreign currency translation impacts on the value of investments; and
Advice income was lower from reduced activity.
Operating expenses decreased $23 million or 4%, from lower performance fee related payments in BTIM. This decline was partially offset by increased investment related costs associated with regulatory change and the continued development of the Panorama platform.
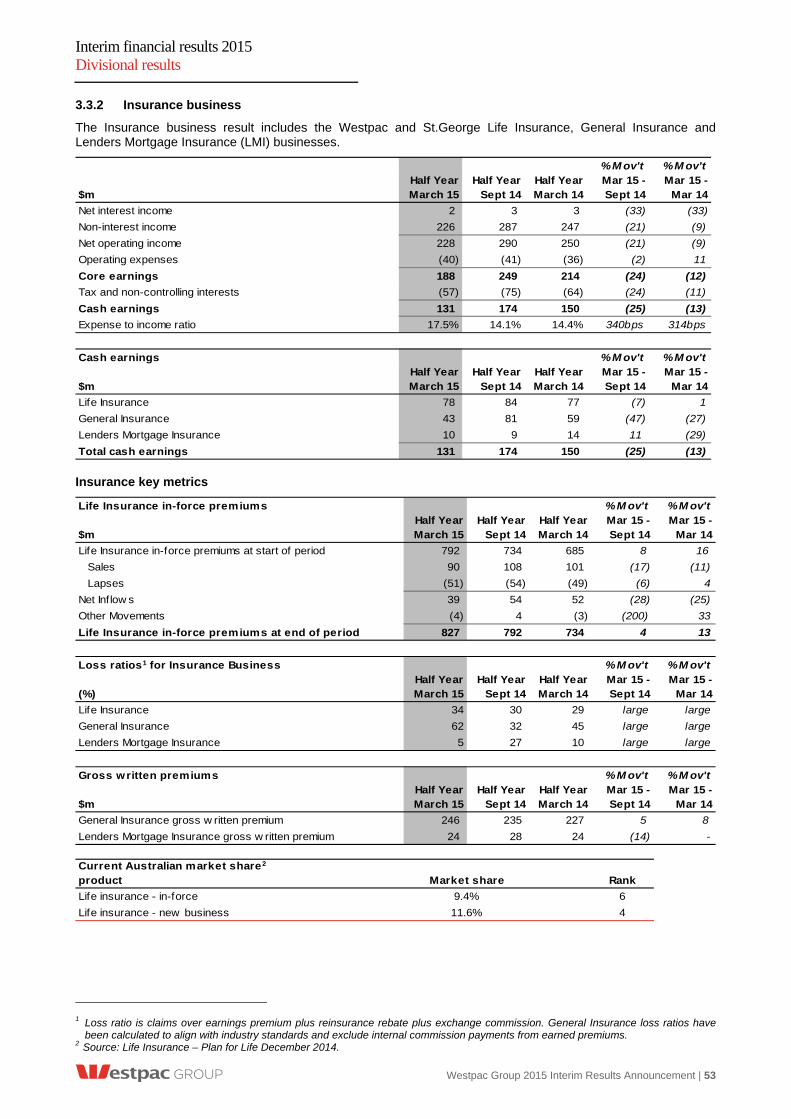
Interim financial results 2015 Divisional results
Westpac Group 2015 Interim Results Announcement | 53
3.3.2 Insurance business
The Insurance business result includes the Westpac and St.George Life Insurance, General Insurance and Lenders Mortgage Insurance (LMI) businesses.
% M ov't % M ov't
$mHalf YearMarch 15
Half YearSept 14
Half YearMarch 14
Mar 15 -Sept 14
Mar 15 - Mar 14
Net interest income 2 3 3 (33) (33)
Non-interest income 226 287 247 (21) (9)
Net operating income 228 290 250 (21) (9)
Operating expenses (40) (41) (36) (2) 11
Core earnings 188 249 214 (24) (12)
Tax and non-controlling interests (57) (75) (64) (24) (11)
Cash earnings 131 174 150 (25) (13)
Expense to income ratio 17.5% 14.1% 14.4% 340bps 314bps
Cash earnings % M ov't % M ov't
$mHalf YearMarch 15
Half YearSept 14
Half YearMarch 14
Mar 15 -Sept 14
Mar 15 - Mar 14
Life Insurance 78 84 77 (7) 1
General Insurance 43 81 59 (47) (27)
Lenders Mortgage Insurance 10 9 14 11 (29)
Total cash earnings 131 174 150 (25) (13) Insurance key metrics
Life Insurance in-force premiums % M ov't % M ov't
$mHalf YearMarch 15
Half YearSept 14
Half YearMarch 14
Mar 15 -Sept 14
Mar 15 - Mar 14
Life Insurance in-force premiums at start of period 792 734 685 8 16
Sales 90 108 101 (17) (11)
Lapses (51) (54) (49) (6) 4
Net Inflow s 39 54 52 (28) (25)
Other Movements (4) 4 (3) (200) 33
Life Insurance in-force premiums at end of period 827 792 734 4 13
Loss ratios1 for Insurance Business % M ov't % M ov't
(%)Half YearMarch 15
Half YearSept 14
Half YearMarch 14
Mar 15 -Sept 14
Mar 15 - Mar 14
Life Insurance 34 30 29 large large
General Insurance 62 32 45 large large
Lenders Mortgage Insurance 5 27 10 large large
Gross written premiums % M ov't % M ov't
$mHalf YearMarch 15
Half YearSept 14
Half YearMarch 14
Mar 15 -Sept 14
Mar 15 - Mar 14
General Insurance gross w ritten premium 246 235 227 5 8
Lenders Mortgage Insurance gross w ritten premium 24 28 24 (14) - Current Australian market share2
product Rank
Life insurance - in-force 6
Life insurance - new business 4
9.4%
11.6%
Market share
1 Loss ratio is claims over earnings premium plus reinsurance rebate plus exchange commission. General Insurance loss ratios have
been calculated to align with industry standards and exclude internal commission payments from earned premiums. 2 Source: Life Insurance – Plan for Life December 2014.

Interim financial results 2015 Divisional results
54 | Westpac Group 2015 Interim Results Announcement
Financial performance
First Half 2015 - Second Half 2014
Cash earnings were 25% lower, mostly from General Insurance claims which tend to be seasonal and occur in the first half of each year; and
The business continues to grow, with life insurance in-force premiums increasing by 4% and general insurance gross written premiums growing by 5%.
Higher claims from two significant weather events and a rise in life loss rates contributed to a 25% reduction in cash earnings in First Half 2015. Partially offsetting higher claims has been continued growth in Life Insurance in-force premiums and General Insurance gross written premiums.
Net operating income decreased $62 million or 21% to $228 million:
General Insurance claims increased $67 million, mostly from severe weather events which generated $51 million in claims during First Half 2015. This primarily related to a severe hailstorm in Brisbane and from Cyclone Marcia in northern Queensland;
General Insurance gross written premiums continued to rise, up 5%, particularly in home and contents insurance;
Life insurance in-force premiums increased 4%. However, new life sales were impacted from a decline in Advice sales. Life insurance claims were $14 million higher reflecting both the growth in the book and a rise in loss ratios from 30% to 34%. Westpac’s decision not to write Group insurance, combined with its relationship focus and claims management process has seen lapse rates and loss ratios remain below industry averages; and
LMI revenue was little changed with lower earned premiums (following the decision in 2009 to reduce risk in the portfolio) offset by lower loss rates. The low loss rate for the half was mostly due to a reduction in excess reserves.
Operating expenses decreased $1 million or 2%, as productivity initiatives offset salary and other expense increases.
First Half 2015 – First Half 2014
Cash earnings decreased $19 million, or 13% due to higher General Insurance claims partly offset by increased revenue from net earned premiums.
Net operating income decreased $22 million or 9%:
General Insurance claims were $49 million higher. This was mostly due to the two severe events in First Half 2015 being significantly larger than one event experienced in First Half 2014;
Life Insurance net earned premiums increased $42 million, with in-force premiums rising 13%. General Insurance premium revenue increased $30 million with gross written premiums rising 8% from growth in home and contents sales;
Higher premiums in Life Insurance were partially offset by a rise in claims consistent with the larger portfolio and a higher loss ratio; and
LMI revenue was down $6 million related to the continued impact of the decision to de-risk the portfolio in 2009.
Operating expenses increased $4 million or 11%, in line with increased volumes and higher employee costs in claims management to support the larger portfolio.

Interim financial results 2015 Divisional results
Westpac Group 2015 Interim Results Announcement | 55
3.4 Westpac Institutional Bank
Westpac Institutional Bank (WIB) delivers a broad range of financial services to commercial, corporate, institutional and Government customers with connections to Australia and New Zealand. WIB operates through dedicated industry relationship and specialist product teams, with expert knowledge in transactional banking, financial and debt capital markets, specialised capital, and alternative investment solutions. Customers are supported through branches and subsidiaries located in Australia, New Zealand, US, UK and Asia.
% M ov't % M ov't
$mHalf YearMarch 15
Half YearSept 14
Half YearMarch 14
Mar 15 -Sept 14
Mar 15 - Mar 14
Net interest income 836 838 820 - 2
Non-interest income 670 725 745 (8) (10)
Net operating income 1,506 1,563 1,565 (4) (4)
Operating expenses (624) (599) (575) 4 9
Core earnings 882 964 990 (9) (11)
Impairment benefits 22 45 90 (51) (76)
Operating profit before tax 904 1,009 1,080 (10) (16)
Tax and non-controlling interests (280) (292) (330) (4) (15)
Cash earnings 624 717 750 (13) (17)
Economic profit 334 472 537 (29) (38)
Expense to income ratio 41.4% 38.3% 36.7% 311bps large
Net interest margin 1.89% 2.00% 2.06% (11bps) (17bps)
% M ov't % M ov't
$bnHalf YearMarch 15
Half YearSept 14
Half YearMarch 14
Mar 15 -Sept 14
Mar 15 - Mar 14
Deposits 75.0 78.1 72.8 (4) 3
Net loans 70.1 66.2 64.0 6 10
Deposit to loan ratio 107.0% 118.0% 113.8% large large
Total assets 124.2 118.9 105.7 4 18
Total committed exposure 240.6 239.1 220.6 1 9
Average interest-earning assets 88.9 83.6 79.9 6 11
Impaired assets to total committed exposure 0.12% 0.23% 0.34% (11bps) (22bps)
Total stressed assets to total committed exposure 0.68% 0.89% 1.03% (21bps) (35bps)
Funds under management 7.7 7.0 6.6 10 17 Revenue contribution
% M ov't % M ov't
$mHalf YearMarch 15
Half YearSept 14
Half YearMarch 14
Mar 15 -Sept 14
Mar 15 - Mar 14
Lending revenue 580 579 548 - 6
Deposit revenue 242 249 252 (3) (4)
Markets sales and fee income 484 468 427 3 13
Total customer revenue 1,306 1,296 1,227 1 6
Derivative valuation adjustments1 (153) (22) (1) large large
Trading revenue 147 72 140 104 5
Hastings 54 45 22 20 145
Other2 152 172 177 (12) (14)
Total WIB revenue 1,506 1,563 1,565 (4) (4)
1 In First Half 2015 changes were made to derivative valuation methodologies, which include the first time adoption of a FVA for the fair
value of derivatives. The impact of these changes resulted in a $122 million (pre-tax) charge which reduced non-interest income. 2 Includes capital benefit.

Interim financial results 2015 Divisional results
56 | Westpac Group 2015 Interim Results Announcement
Financial performance
First Half 2015 - Second Half 2014
Cash earnings down 13% mainly due to derivative methodology adjustments; and
Excluding this, core earnings increased 4% supported by increased sales and trading income.
WIB delivered cash earnings of $624 million in First Half 2015, $93 million lower than Second Half 2014. The lower result was largely due to methodology changes to derivative valuation adjustments which reduced revenue by $122 million, a $9 million negative movement in CVA and a $23 million lower impairment benefit. Together these items reduced cash earnings by $108 million.
WIB further strengthened the business, maintaining its lead position in key markets, generating increased customer flows (particularly in target segments) and further improving asset quality. Highlights of the half included:
Infrastructure revenue up 40% largely from the completion of three major transactions with an enterprise value of $7.7 billion;
Successful integration of the Lloyds business, with asset finance revenue up 10%;
Implemented an automated payment system across Singapore, Hong Kong and India offering significantly faster end-to-end processing for customers;
A foundation bank to Australasia’s first Chinese renmimbi (RMB) Hub in Sydney supporting the internationalisation of China’s currency; and
Revenue from the WIB/Australian retail banking partnership up 2% mostly from retail foreign exchange sales.
Net interest income was flat as a 6% increase in average interest-earning assets was offset by an 11 basis point decline in net interest margin.
Lending increased 6% over the half driven mainly by growth in property and natural resources segments;
Deposits declined 4% as the business did not pursue lower LCR value deposits; and
Institutional margins continue to be impacted by higher levels of liquidity in the market from global quantitative easing. This is seeing tightened asset spreads for new lending, deposit spreads remain under pressure from competition for high LCR value deposits and lower returns on capital.
Non-interest income decreased $55 million or 8% driven by derivative valuation changes of $122 million, together with a negative CVA impact of $31 million compared to $22 million in Second Half 2014. Excluding these impacts, non-interest income rose $76 million or 10%:
Financial Markets income increased 32% from higher customer flows in both interest rate risk and foreign exchange sales. Foreign exchange income benefited from corporate and institutional customers seeking to actively manage their currency risks, as well as growth in flows originated through Westpac RBB and St.George. Interest rate risk sales were supported by involvement in infrastructure projects.
This was partly offset by a decrease in trade and transactional income.
Operating expenses increased $25 million or 4% with most of the rise due to increased investment, including expanding capabilities in Asia.
Asset quality in WIB continues to improve with a decline in both stressed assets and impaired assets. This improvement, combined with high levels of write-backs has seen WIB record an impairment benefit of $22 million. However, the First Half 2015 benefit was lower than the impairment benefit recorded in Second Half 2014 ($45 million) and so movements in impairment benefits had a negative $23 million impact.
Interim financial results 2015 Divisional results
Westpac Group 2015 Interim Results Announcement | 57
First Half 2015 – First Half 2014
Cash earnings were 17% lower, due to derivative valuation adjustments and a lower impairment benefit;
Excluding the impact of derivative methodology adjustments, core earnings increased 1%; and
Customer revenues were up 6%.
WIB delivered cash earnings of $624 million, down $126 million, or 17%. The lower result was largely due to methodology changes to derivative valuations, which reduced revenue by $122 million, a $30 million negative movement in CVA and a $68 million lower impairment benefit. Together these items reduced cash earnings by $154 million.
Net interest income increased $16 million, or 2%, with an 11% increase in average interest-earning assets partly offset by a 17 basis point decline in net interest margin.
Margin pressure has been experienced across both assets and liabilities. The decline in deposit margins was a result of competition for high quality LCR deposits;
Lending increased $6.1 billion or 10%, mainly from growth in property and infrastructure; and
Deposits increased $2.2 billion, or 3% with an increase in transactional and term deposits partly offset by a reduction in at call balances.
Non-interest income decreased $75 million or 10% driven by derivative valuation changes of $122 million, together with a negative CVA impact of $31 million compared to $1 million in First Half 2014. Excluding these items, non-interest income was up $77 million reflecting:
Financial Markets income increased 12% from improved customer flows, particularly foreign exchange sales; and
Hastings revenue increased $35 million.
Operating expenses increased $49 million or 9% from:
Increased investment, including further expansion in Asia and meeting additional regulatory and compliance requirements; and
A full period impact of Lloyds, including depreciation costs related to operating leases.
Asset quality continued to improve in First Half 2015 and, as a result, impairments contributed a $22 million benefit. This was lower than the impairment benefit of $90 million received in First Half 2014.

Interim financial results 2015 Divisional results
58 | Westpac Group 2015 Interim Results Announcement
3.5 Westpac New Zealand
Westpac New Zealand is responsible for sales and service of banking, wealth and insurance products for consumers, business and institutional customers in New Zealand. Westpac conducts its New Zealand banking business through two banks in New Zealand: Westpac New Zealand Limited, which is incorporated in New Zealand and Westpac Banking Corporation (NZ Division), a branch of Westpac, which is incorporated in Australia. The division operates via an extensive network of branches and ATMs across both the North and South Islands. Business and institutional customers are also served through relationship and specialist product teams. Banking products are provided under the Westpac brand while insurance and wealth products are provided under Westpac Life and BT brands, respectively. New Zealand also has its own infrastructure, including technology, operations and treasury. All figures are in New Zealand dollars (NZ$).
% M ov't % M ov't
NZ$mHalf YearMarch 15
Half YearSept 14
Half YearMarch 14
Mar 15 -Sept 14
Mar 15 - Mar 14
Net interest income 832 809 783 3 6
Non-interest income 245 240 239 2 3
Net operating income 1,077 1,049 1,022 3 5
Operating expenses (437) (427) (422) 2 4
Core earnings 640 622 600 3 7
Impairment charges (31) (22) (4) 41 large
Operating profit before tax 609 600 596 2 2
Tax and non-controlling interests (168) (168) (164) - 2
Cash earnings 441 432 432 2 2
Economic profit 228 205 208 11 10
Expense to income ratio 40.6% 40.7% 41.3% (13bps) (71bps)
Net interest margin1 2.29% 2.27% 2.28% 2bps 1bps
% M ov't % M ov't
NZ$bnHalf YearMarch 15
Half YearSept 14
Half YearMarch 14
Mar 15 -Sept 14
Mar 15 - Mar 14
Deposits
Term deposits 25.1 25.2 24.5 - 2
Other 26.4 24.2 23.9 9 10
Total deposits2 51.5 49.4 48.4 4 6
Net loans
Mortgages 40.7 39.6 38.6 3 5
Business 24.0 23.1 22.8 4 5
Other 1.9 1.9 1.8 - 6
Total net loans 66.6 64.6 63.2 3 5
Deposit to loan ratio 77.3% 76.5% 76.6% 86bps 75bps
Total assets1 76.5 73.7 71.3 4 7
Total committed exposure 94.9 92.7 90.1 2 5
Liquid assets1 7.5 7.7 7.6 (3) (1)
Average interest-earning assets1 73.0 71.2 68.8 3 6
Funds under management 6.0 5.5 4.9 9 22Funds under administration 1.9 1.7 1.5 12 27
Half YearMarch 15
Half YearSept 14
Half YearMarch 14
Credit quality
Mortgage delinquencies > 90 days 0.25% 0.21% 0.29%Other consumer loans delinquencies > 90 days 0.81% 0.75% 0.90%Impaired assets to total committed exposure 0.55% 0.48% 0.47%Total stressed assets to total committed exposure 1.75% 1.59% 1.85%
1 Second Half 2014 impacted by the transfer of NZ$1.1 billion of assets to Westpac New Zealand from Group Businesses (Treasury). 2 Total deposits in this table refers to total customer deposits.

Interim financial results 2015 Divisional results
Westpac Group 2015 Interim Results Announcement | 59
Financial performance (NZ$)
First Half 2015 - Second Half 2014
Cash earnings increased 2% with operating performance lifting core earnings by 3%, partially offset by higher impairment charges which increased from a low level; and
The continued transformation of the business using new digital innovations and 24/7 self-serve channels is helping to enhance the franchise, deepen customer relationships and improve efficiency.
Westpac New Zealand delivered cash earnings of $441 million in First Half 2015, up 2%. Core earnings were up $18 million or 3%.
Westpac New Zealand’s investment in digital innovation and self-serve channels over recent years is continuing to provide greater flexibility and convenience for customers by enabling banking anywhere, all the time. This investment has contributed to a further deepening of customer relationships and enhanced efficiency. Highlights in First Half 2015 included:
Delivering more for customers:
- Launched Westpac One, the division’s new internet and mobile banking platform providing customers with more functionality and consistent experience across all devices. Over 500,000 customers have migrated to the new platform which has contributed to:
o 52% rise (on average) in online applications across cards, personal loans and home lending;
o 40% of total applications are now being originated online; and
o 88% of online applications being conditionally approved instantly.
- Further expanded the fleet of Smart ATM’s (up 8%) to 143. The increased convenience for customers is reflected in the 33% of all deposits now being processed via this channel, of which more than one third are conducted outside normal business hours;
- Announced a new partnership with Air New Zealand to offer Airpoints rewards. This will provide customers more choice and enhance the value of their credit cards and mortgages;
- Streamlined broker originated applications with a new app that digitally captures a customer’s ID, signature and supporting documentation and via straight-through-processing completes the application; and
- Launched PayTag (a mobile sticker) in partnership with Mastercard, converting a phone into contactless payment device enabling customers to make fast, secure payments of up to $80 at contactless terminals;
Growing in target segments:
- Mortgages grew at 3% and business lending was up 4%, including agricultural lending which continues to grow above system1;
- Deposit growth fully funded loan growth in the half and increased deposit to loan ratio 86 basis points to 77.3%; and
- Continued to expand wealth with FUM and FUA up 9% and 12% respectively and a lift in wealth penetration up 69 basis points to 28.0%.
Improved efficiency with the investment in digital innovation and self-serve channels helping to enhance processes and contributing to a 13 basis point reduction in the expense to income ratio to 40.6%.
Net interest income increased $23 million or 3%, with average interest-earning assets rising 3% and net interest margins up 2 basis points. The lift in net interest margins was due to:
Lower funding costs supported by improved wholesale funding spreads and active management of deposit rates and portfolio mix; and
Partially offset by a reduction in asset spreads, with competition for new lending remaining intense.
Loans increased $2.0 billion, or 3%:
- Mortgages increased with most growth recorded in facilities with an LVR less than 80%. These mortgages now represent 83% of the mortgage portfolio; and
- Business lending was up $0.9 billion or 4%, with most of the growth in the food processing and agriculture sectors.
1 Source: RBNZ.

Interim financial results 2015 Divisional results
60 | Westpac Group 2015 Interim Results Announcement
Deposits grew $2.1 billion for the half fully funding loan growth. Most of the growth was recorded in at call deposits, particularly online accounts.
Non-interest income was up $5 million or 2%, supported by increased wealth income, driven by the lift in FUM and FUA, along with a higher insurance contribution.
Operating expenses increased 2% with most of the rise due to annual salary increases, advertising spend and launch costs associated with the new Airpoints rewards. These increases were partially offset by productivity benefits from ongoing investment in digital and self-service channels.
Asset quality has been maintained although there has been a small rise in measures of stress from a low base. Impairment charges for First Half 2015 increased $9 million to $31 million from the rise in stressed assets and higher delinquencies.
First Half 2015 – First Half 2014
Core earnings growth of 7% supported by margin management, balance sheet growth and improved efficiency; and
Cash earnings growth was 2% as core earnings growth was partially offset by higher impairment charges. First Half 2014 included a very low $4 million impairment charge that was supported by provision recoveries.
Westpac New Zealand delivered a $9 million rise in cash earnings up 2%. Core earnings were up 7%.
Net interest income was the driver of the increase rising 6%, with average interest-earning assets increasing 6% and net interest margin excluding Treasury increasing 3 basis points.
Asset spreads have continued to come under competitive pressure although this has been more than offset by reducing wholesale funding costs and improving deposit spreads.
Total lending increased $3.4 billion or 5%:
- Mortgages increased $2.1 billion or 5%, continuing to grow in line with system1; and
- Business lending increased $1.2 billion or 5% with around half the rise due to agricultural lending which has been a particular area of focus.
The majority of the 6% growth in deposits was in at call and transaction accounts which increased $2.5 billion. Term deposit growth was in line with system trends1.
Non-interest income increased $6 million or 3% driven by:
FUM and FUA balances up 22% and 27% respectively, more than offsetting some margin pressure;
Increase in insurance premium income; and
An increase in institutional income, related to an asset recovery.
Most of the increase in expenses has been due to investment related costs including higher depreciation and amortisation. Operating cost increases were largely offset by productivity gains associated with the continuing switch to digital and self-serve channels. As a result, the expense to income ratio reduced 71 basis points to 40.6%.
Asset quality improved over the year on almost every dimension and across business and consumer segments. Despite this improvement, impairment charges increased $27 million, as the First Half 2014 charge of $4 million was particularly low and was supported by write-back/recoveries that were not matched in the current half.
1 Source: RBNZ.

Interim financial results 2015 Divisional results
Westpac Group 2015 Interim Results Announcement | 61
3.6 Westpac Pacific
Westpac Pacific provides banking services for retail and business customers in seven Pacific Island Nations. Branches, ATMs, telephone banking and internet banking channels are used to deliver business activities in Fiji, Papua New Guinea (PNG), Vanuatu, Cook Islands, Tonga, Solomon Islands and Samoa. Westpac Pacific’s financial products include personal savings accounts, business transactional accounts, personal and business lending products, business services and a range of international products.
% M ov't % M ov't
$mHalf YearMarch 15
Half YearSept 14
Half YearMarch 14
Mar 15 -Sept 14
Mar 15 - Mar 14
Net interest income 83 70 70 19 19
Non-interest income 56 65 87 (14) (36)
Net operating income 139 135 157 3 (11)
Operating expenses (52) (47) (52) 11 -
Core earnings 87 88 105 (1) (17)
Impairment (charges) / benefit 1 (3) (6) (133) (117)
Operating profit before tax 88 85 99 4 (11)
Tax and non-controlling interests (29) (28) (34) 4 (15)
Cash earnings 59 57 65 4 (9)
Economic profit 38 35 44 9 (14)
Expense to income ratio 37.4% 34.8% 33.1% 260bps large
% M ov't % M ov't
$bnHalf YearMarch 15
Half YearSept 14
Half YearMarch 14
Mar 15 -Sept 14
Mar 15 - Mar 14
Deposits 3.1 2.7 2.5 15 24
Net loans 2.0 1.8 1.6 11 25
Deposit to loan ratio 155.0% 150.0% 156.3% large (125bps)
Total assets 3.8 3.3 3.0 15 27
Total committed exposure 3.8 3.2 3.0 19 27
Average interest-earning assets 3.2 2.8 2.9 14 10
In January 2015, Westpac announced that it had entered into an agreement to sell its banking operations in Samoa, Cook Islands, Solomon Islands, Vanuatu and Tonga to the Bank of South Pacific Limited for A$125 million. Completion of the sale is expected to occur in Second Half 2015 and is subject to the parties obtaining necessary statutory, regulatory and third party approvals. The above results include the First Half 2015 contribution from these countries. In First Half 2015, these countries accounted for around 14% of cash earnings and approximately $360 million of loans.
In March 2015 Cyclone Pam hit Vanuatu and had a significant impact on the main island, Efate and the country’s capital Port Vila. Our employees on the ground have done an outstanding job, assisting customers in the recovery process, including opening the main branch just days after the cyclone and helping to get the economy up and running. Cyclone Pam has had little impact on Westpac Pacific’s cash earnings in First Half 2015.
Financial performance
First Half 2015 – Second Half 2014
Cash earnings up $2 million with most of the increase due to movements in exchange rates over the half; and
Growth in loans, deposits and higher net interest margin have been partially offset by the impact of foreign exchange controls introduced in PNG in July 2014.
Westpac Pacific delivered cash earnings of $59 million in First Half 2015. Cash earnings were up $2 million, although the increase was predominantly due to translation impacts from movements between the A$ and local currencies which increased cash earnings $4 million. Excluding currency movements, the division recorded growth across the business, although this was offset by reduced foreign exchange income following the introduction of foreign exchange controls in PNG in July 2014. These controls reduced the supply of foreign currency and the spreads on foreign currency transactions.

Interim financial results 2015 Divisional results
62 | Westpac Group 2015 Interim Results Announcement
Net interest income increased 19% (9% excluding foreign currency impacts) from higher returns on the PNG Government securities portfolio, margin management and growth in both deposits and loans. Excluding currency movements, deposits rose 6%, largely in PNG, while loans rose 1%, mostly in Fiji.
Non-interest income was $9 million or 14% lower (18% excluding foreign currency translation impacts) driven by reduced foreign exchange income following the introduction of foreign exchange controls in PNG.
Operating expenses were $5 million or 11% higher (4% excluding foreign currency impacts). Most of the increase was due to increased salary costs, including government mandated superannuation increases in Fiji.
First Half 2015 reflected an impairment benefit of $1 million. Asset quality was maintained across the region.
First Half 2015 – First Half 2014
Cash earnings declined 9%, primarily due to lower foreign exchange income, following the introduction of exchange controls in PNG, partly offsetting net interest income growth and foreign currency translation movements.
Cash earnings were 9% lower with the main driver of the decline being the introduction of foreign exchange controls introduced in PNG. Excluding currency movements, cash earnings were 14% lower than First Half 2014.
Net interest income was up 19% (10% excluding currency movements) impacted by:
Net interest margins up 37 basis points over the prior corresponding period;
Lending growth of 25% (7% excluding foreign currency impacts), primarily in PNG and Fiji; and
24% growth in deposits primarily in PNG (3% excluding foreign currency impacts).
Non-interest income decreased $31 million, or 36% (down 38% excluding currency movements). The decline was mostly due to the impact of foreign exchange controls in PNG which contributed to a $35 million decline in foreign currency income.
Operating expenses were flat with productivity benefits offsetting increased investment spending, salary increases and currency impacts.
Asset quality was maintained across the region, with an impairment benefit of $1 million.

Interim financial results 2015 Divisional results
Westpac Group 2015 Interim Results Announcement | 63
3.7 Group Businesses
This segment comprises:
Group items, including earnings on capital not allocated to divisions, accounting entries for certain intra-group transactions that facilitate the presentation of the performance of the Group’s operating segments, earnings from non-core asset sales and certain other head office items such as centrally raised provisions;
Treasury, the primary focus of which is the management of the Group’s interest rate risk and funding requirements by managing the mismatch between Group assets and liabilities. Treasury’s earnings are primarily impacted by the hedging decisions taken on behalf of the Group to manage net interest income outcomes and assist net interest income growth;
Customer & Business Services1, which encompasses banking operations, customer contact centres, product marketing, compliance, legal and property services;
Group Technology1 which comprises functions responsible for technology strategy and architecture, infrastructure and operations, applications development and business integration; and
Core Support1, which comprises functions performed centrally, including finance, risk and human resources.
% M ov't % M ov't
$mHalf YearMarch 15
Half YearSept 14
Half YearMarch 14
Mar 15 -Sept 14
Mar 15 - Mar 14
Net interest income 80 102 251 (22) (68)
Non-interest income (1) 2 49 (150) (102)
Net operating income 79 104 300 (24) (74)
Operating expenses (16) (23) (26) (30) (38)
Core earnings 63 81 274 (22) (77)
Impairment (charges) / benefits (1) 10 (92) (110) (99)
Operating profit before tax 62 91 182 (32) (66)
Tax and non-controlling interests (18) (1) (81) large (78)
Cash earnings 44 90 101 (51) (56)
Treasury % M ov't % M ov't
$mHalf YearMarch 15
Half YearSept 14
Half YearMarch 14
Mar 15 -Sept 14
Mar 15 - Mar 14
Net interest income 120 165 292 (27) (59)
Non-interest income 3 5 11 (40) (73)
Net operating income 123 170 303 (28) (59)
Cash earnings 73 104 198 (30) (63)
Treasury Value at Risk (VaR)
Risk taking as measured by VaR was lower in First Half 2015 than both Second Half 2014 and First Half 2014.
$m High Low AverageSix months ended 31 March 2015 14.6 5.8 10.4 Six months ended 30 September 2014 35.5 5.8 17.6Six months ended 31 March 2014 24.0 11.2 15.5
Financial performance
First Half 2015 – Second Half 2014
Cash earnings down 51%, primarily from lower Treasury income and a higher tax rate as Second Half 2014 benefited from finalisation of prior period taxation matters.
Group Businesses delivered cash earnings of $44 million, down $46 million or 51% on Second Half 2014.
Net operating income decreased $25 million or 24% compared to Second Half 2014. The key driver of the decline was a reduction in Treasury income related to lower returns on the liquid asset portfolio and balance sheet management activities.
1 Costs are allocated to other divisions in the Group.

Interim financial results 2015 Divisional results
64 | Westpac Group 2015 Interim Results Announcement
Operating expenses reduced $7 million compared to Second Half 2014 due to lower employee provisions.
Impairment charges of $1 million reflected little change in central economic overlay provisions during the half.
The effective tax rate was higher, as Second Half 2014 benefited from the finalisation of prior period taxation matters.
First Half 2014 – First Half 2015
Cash earnings decreased 56% reflecting lower Treasury income (down 59%), partially offset by lower impairment charges.
Group Businesses delivered cash earnings of $44 million, down $57 million or 56% on First Half 2014.
Net interest income reduced $171 million compared with First Half 2014, with a reduction in Treasury income ($172 million lower) related to lower returns on the liquid asset portfolio and balance sheet management activities.
Non-interest income was $50 million lower than First Half 2014 as profits from asset sales in First Half 2014 were not repeated.
Operating expenses were $10 million lower due to a reduction in employee provisions and lower restructuring costs.
Impairment charges were lower. First Half 2014 saw a large increase in centrally held economic overlays which was not repeated in First Half 2015.

Interim financial report 2015 Table of contents
Westpac Group 2015 Interim Results Announcement | 65
4.0 Interim financial report 2015
4.1 Directors’ report 66
4.2 Consolidated income statement 81
4.3 Consolidated statement of comprehensive income 82
4.4 Consolidated balance sheet 83
4.5 Consolidated statement of changes in equity 84
4.6 Consolidated cash flow statement 85
4.7 Notes to the consolidated financial statements 86
Note 1 Basis of preparation of interim financial report 86
Note 2 Average balance sheet and interest rates 88
Note 3 Net interest income 89
Note 4 Non-interest income 90
Note 5 Operating expenses 91
Note 6 Income tax 92
Note 7 Earnings per share 93
Note 8 Loans 94
Note 9 Provisions for impairment charges 95
Note 10 Credit quality 96
Note 11 Deposits and other borrowings 98
Note 12 Share capital 99
Note 13 Fair values of financial assets and liabilities 99
Note 14 Group segment information 103
Note 15 Notes to the consolidated cash flow statement 106
Note 16 Contingent liabilities, contingent assets and credit commitments 107
Note 17 Events subsequent to balance date 108
4.8 Statutory statements 109

Interim financial report 2015 Directors’ report
66 | Westpac Group 2015 Interim Results Announcement
4.0 Interim financial report 2015
4.1 Directors’ report
The Directors of Westpac present their report together with the financial statements of Westpac and its controlled entities (collectively referred to as ‘the Group’) for the half year ended 31 March 2015.
Directors
The names of the Directors of Westpac holding office at any time during, and since the end of, the half year and the period for which each has served as a Director are set out below:
Name Position
Lindsay Maxsted Chairman since December 2011 and Director since March 2008.
Brian Hartzer Managing Director & Chief Executive Officer since February 2015.
Elizabeth Bryan Director since November 2006.
Ewen Crouch Director since February 2013.
Alison Deans Director since April 2014.
Robert Elstone Director since February 2012.
Peter Hawkins Director since December 2008.
Peter Marriott Director since June 2013.
Gail Kelly Retired in February 2015. Managing Director & Chief Executive Officer since February 2008.
Ann Pickard Retired in December 2014. Director since December 2011.
Review and results of the Group’s operations during the half year
Net profit attributable to owners of Westpac Banking Corporation for First Half 2015 was $3,609 million, a decrease of $13 million compared to First Half 2014. This half, the Group has made a number of methodology changes to derivative valuations. This includes introducing a Funding Valuation Adjustment (FVA)1 to the fair value of derivatives. The impact of these changes resulted in a $122 million (pre-tax) charge which reduced non-interest income. This item impacted trading income and the results of Westpac Institutional Bank. Excluding the impact of this item, net profit attributable to owners of Westpac Banking Corporation increased $72 million or 2%.
Net interest income increased $345 million compared to First Half 2014, with total loan growth of 7% and customer deposit growth of 8%. The benefit from volume growth was partially offset by a 3 basis point reduction in net interest margin. The reduction in net interest margin reflected lower Treasury income.
Non-interest income decreased $138 million or 4% compared to First Half 2014 primarily due to the impact of the methodology changes to derivative valuation adjustments (discussed above). Excluding these adjustments, non-interest income reduced $16 million reflecting lower profits from asset sales and impact of the fair value of economic hedges being partly offset by an increase in wealth management and banking fees.
Operating expenses increased $215 million or 5% compared to First Half 2014, driven by foreign currency translation impacts, the full period impact of the Lloyds acquisition and higher investment related impacts, including increased software amortisation and hardware depreciation.
Impairment charges were unchanged compared to First Half 2014. Asset quality improved this half, including stressed exposures as a percentage of total committed exposures reducing from 1.37% to 1.12%.
The effective tax rate of 30.6% in First Half 2015 was slightly higher compared to 30.4% in First Half 2014.
The Board has determined an interim dividend of 93 cents per share, an increase of 3% over the interim dividend determined for First Half 2014. The interim dividend is fully franked.
1 Refer to Glossary.

Interim financial report 2015 Directors’ report
Westpac Group 2015 Interim Results Announcement | 67
Significant developments during the half year ended 31 March
Corporate significant developments
Inquiry into Australia’s Financial System
On 20 November 2013, the Federal Government formally announced the appointment of Mr David Murray AO to head an inquiry into Australia’s financial system (Inquiry).
The Inquiry’s terms of reference, announced on 20 December 2013, charged the Inquiry with examining how the financial system could be positioned to best meet Australia’s evolving needs and support Australia’s economic growth. Recommendations were to be aimed at fostering an efficient, competitive and flexible financial system, consistent with financial stability, prudence, public confidence and capacity to meet the needs of users.
The Federal Treasurer released the Inquiry’s Final Report to Government on 7 December 2014 and announced a process of consultation on the Final Report’s recommendations to 31 March 2015. As part of this consultation process, Westpac has lodged a submission in response to the Inquiry’s Final Report. The Government will announce its formal policy response at some point in the future. The Final Report made 44 recommendations relating to a broad number of matters across the financial sector. It contains recommendations regarding additional capital requirements for Australian banks, which the Government has referred to APRA for consideration. Until the Government officially responds to the Inquiry’s recommendations, the final impact of this Inquiry is difficult to predict.
Appointment of new Chief Executive Officer
On 13 November 2014, Westpac announced the retirement of Gail Kelly as Chief Executive Officer effective 1 February 2015. The Westpac Board appointed Brian Hartzer as the Group’s CEO from 2 February 2015. Mr Hartzer was part of the Group’s executive team and was formerly the Chief Executive, Australian Financial Services, responsible for the Westpac Group’s retail, business banking and wealth businesses.
Sale of Westpac operations in five Pacific Island Nations
On 29 January 2015, Westpac announced it had entered into an agreement to sell its banking operations in Samoa, Cook Islands, Solomon Islands, Vanuatu and Tonga to the Bank of South Pacific Limited (BSP) for $125 million. Westpac will retain its operations in its largest Pacific markets of Fiji and Papua New Guinea (PNG).
Completion of the sale is expected to occur in mid-2015 and is subject to the parties obtaining necessary statutory, regulatory and third party approvals. The transaction will not have a material impact on the Westpac Group’s financial position and the transaction will be recognised in the financial statements, on completion of the sale.
Litigation
In 2011, Westpac was served with three class action proceedings brought on behalf of customers seeking to recover exception fees paid by those customers. Similar class actions have been commenced against several other Australian banks. Westpac has agreed with the plaintiffs to put the proceedings against Westpac on hold until at least June 2015, pending further developments in the litigation against one of those other banks. In April 2015, the Full Court of the Federal Court found all of the exception fees charged by that other bank to be lawful. IMF Bentham Limited, the litigation company that is funding the proceedings, has stated that this decision is likely to be the subject of an application for special leave to appeal to the High Court of Australia.
Changes to accounting standards
AASB 9 (December 2014) Financial Instruments will replace AASB 139 Financial Instruments: Recognition and Measurement. It includes a revised classification and measurement model, a forward looking ‘expected loss’ impairment model and modifies the approach to hedge accounting. Unless early adopted, the standard is effective for the 30 September 2019 financial year end.
The Group expects new accounting standards in the area of lease accounting and insurance accounting to be finalised in the next year. These standards will require further changes to the Group’s current accounting practices.
Tax developments
On 30 March 2015, the Australian Government released a Tax Discussion Paper that considers all aspects of the Australian tax system. It is intended to initiate debate on the future of Australia’s tax system. A public consultation process has commenced and is expected to continue over the next 12-18 months. The Discussion Paper does question the ongoing effectiveness of the dividend imputation system but it does not contain any recommendations or details of any proposed reforms. The impact of any changes to Westpac, its shareholders and customers cannot be determined until further details are released and any changes to the law made.

Interim financial report 2015 Directors’ report
68 | Westpac Group 2015 Interim Results Announcement
Regulatory significant developments
Basel Committee on Banking Supervision
Regulatory reforms and significant developments arising in relation to changes initiated by the Basel Committee on Banking Supervision (BCBS) include:
Liquidity
From 1 January 2015, Westpac was required to meet a minimum Liquidity Coverage Ratio (LCR) of 100% in accordance with the Australian Prudential Regulation Authority (APRA) liquidity standard (APS 210).
The LCR requires banks to hold sufficient high-quality liquid assets, as defined, to withstand 30 days under a regulator defined acute stress scenario. Given the limited amount of government debt in Australia, the Reserve Bank of Australia (RBA) makes available to Australian institutions a Committed Liquidity Facility (CLF) that, subject to the satisfaction of qualifying conditions, can be accessed to help meet the LCR requirement. In order to have access to the CLF, Australian banks are required to pay a fee of 15 basis points (0.15%) per annum to the RBA on the approved CLF. Westpac was granted access to a CLF of $66 billion for the 2015 calendar year.
The BCBS released a final standard on the Net Stable Funding Ratio (NSFR) on 31 October 2014. The NSFR requirement, designed to encourage longer-term funding resilience, has been excluded from APS 210, however, APRA has indicated an intention to implement this measure from 1 January 2018.
Global Systemically Important Financial Institutions (G-SIFIs)
In July 2013, the BCBS published an updated methodology for determining Global Systemically Important Banks (G-SIBs). Each year in November the Financial Stability Board (FSB) publishes the list of identified G-SIBs and specifies the higher capital requirements proposed for each. These increased capital requirements will be phased in from January 2016. Westpac has not been named as a G-SIB. However the BCBS has issued a framework for extending the SIFIs requirements to domestic systemically important banks (D-SIBs).
Capital
In 2010, the BCBS outlined the revised capital framework for banks globally as follows:
an increase in the minimum common equity requirement from 2.0% to 4.5%;
an increase in the minimum Tier 1 capital requirement from 4.0% to 6.0%;
a capital conservation buffer at 2.5%, to be met with common equity; and
a countercyclical buffer of between 0% to 2.5% to be met with common equity or other fully loss absorbing capital.
APRA’s adoption of the framework has required Australian Authorised Deposit-taking Institutions (ADIs) such as Westpac to meet the above minimum capital requirements from 1 January 2013 and the capital conservation buffer in full from its introduction date of 1 January 2016. In December 2013 APRA released its approach for implementing a D-SIB framework in Australia. Westpac is one of four Australian banks which APRA has identified as a D-SIB. APRA has proposed that each D-SIB, including Westpac, will have to meet a higher loss absorbency requirement of 1% to be met by common equity. The 1% requirement will be added to the capital conservation buffer effectively increasing the buffer from 2.5% to 3.5%. The countercyclical buffer is not currently required.
Westpac’s current capital levels are already above the regulatory requirement that will apply from 1 January 2016 (including the 3.5% capital conservation buffer).
For further details of Westpac’s regulatory capital disclosures refer to Section 2.5 ‘Capital and dividends’ in this Interim Financial Results Announcement or visit www.westpac.com.au/about-westpac/investor-centre/financial-information/basel-iii-risk-reports.
Increased loss absorbency
In November 2014 the FSB issued a consultation paper for enhancing the Total Loss Absorbing Capacity (TLAC) for G-SIBs to operate alongside the Basel III capital requirements. These proposals form part of the G20’s initiatives aimed at ‘Ending too-big-to-fail’ and ensuring that the resolution of a failing G-SIFI can be carried out without causing systemic disruption or resorting to taxpayer support. The FSB has stated that the TLAC requirement would not be introduced before 2019 and it is not known at this stage whether there is any intention to extend the requirement beyond G-SIBs.

Interim financial report 2015 Directors’ report
Westpac Group 2015 Interim Results Announcement | 69
Reform of the risk-based capital framework
In December 2014, the BCBS released two consultation papers on proposals for Capital Floors and proposed revisions to the Standardised Approach for Credit Risk, which puts forward possible amendments to the risk-weighted asset framework for capital. The measures are in addition to ongoing consultation work of the BCBS on reforms to capital treatment of operational risk and market risk. In combination these reform measures are intended to improve the consistency and comparability of bank capital ratios. However, further clarity from BCBS is not expected before the end of 2015 after which APRA will need to consult on, and then finalise, the Australian standards. Until that time, and given the early stage of the current consultation process, it is not possible to determine the impact on Westpac.
Leverage ratio
The Basel III capital framework also introduced a leverage ratio requirement. The BCBS proposes that introducing a simple, non-risk based leverage ratio requirement would act as a credible supplementary measure to the risk-based capital requirements. In January 2014, the BCBS published an amended leverage ratio framework. The proposed timetable for the leverage ratio provides for testing and recalibration of the framework to occur until 2017 and migration of the final standard to a Pillar 1 requirement from January 2018.
OECD Common Reporting Standard
The Organisation for Economic Cooperation and Development (OECD) has developed Common Reporting Standard (CRS) rules for the automatic exchange of financial account information amongst OECD member states.
CRS will require the Westpac Group to identify the tax residency of all customers and to report the tax residency and account details of non-resident customers to the relevant authorities in jurisdictions in which the CRS rules operate.
It is currently intended that Australian financial institutions can voluntarily implement the rules from 1 January 2017, but will have to be compliant from 1 January 2018. The rules could impose additional costs and operational burdens on Westpac.
OTC derivatives reform
The international regulatory reforms relating to over-the-counter (OTC) derivatives continue to be implemented by financial regulators across the globe.
In Australia, Westpac commenced reporting OTC derivatives transactions to a Prescribed Repository in accordance with the Derivative Transaction Rules (Reporting) 2013 on 1 October 2013. Westpac continues to work with ASIC and industry associations in relation to the implementation of these rules and the phase-in of requirements to other industry participants.
The Australian Treasury has issued two Proposal Papers on the Implementation of Australia’s G20 OTC derivatives commitments, in which they proposed a central clearing mandate for US dollar, Euro, British Pound, Yen (February 2014 Proposal Paper) and Australian dollar (July 2014 Proposal Paper) denominated interest rate derivatives traded between dealers with significant cross-border activities. It is expected that any such mandate would cover Westpac. The commencement of the central clearing mandates is expected to occur by mid-2015.
As a provisionally-registered Swap Dealer with the US Commodity Futures Trading Commission (CFTC), Westpac is subject to a range of entity-level and transaction-level requirements pursuant to the Dodd-Frank Act.
Pursuant to the European Market Infrastructure Regulations (EMIR) established by the European Securities and Markets Authority (ESMA), from October 2014, Westpac is subject to certain risk mitigation obligations in relation to OTC Derivatives traded with European counterparties or through its London Branch. Further, during 2015, Westpac will be subject to a central clearing mandate for certain interest rate derivatives with European counterparties.
Westpac continues to monitor developments in response to requirements imposed by international regulators. These include regulations published by the CFTC and the Securities and Exchange Commission under the Dodd-Frank Act; by the ESMA and local European financial regulators under the EMIR and Markets in Financial Instruments Directive (MiFID II); and by various financial regulators in Asia and Canada. Westpac also continues to monitor the international response to the final policy framework for establishing margin requirements for uncleared OTC derivatives as published by the Basel Committee on Banking Supervision (BCBS) and the International Organisation of Securities Commission (IOSCO) on 2 September 2013.

Interim financial report 2015 Directors’ report
70 | Westpac Group 2015 Interim Results Announcement
Australia
The Federal Government continues to implement a program of regulatory reform which will affect Westpac. In addition to the above, this includes:
Financial advice changes
The majority of the Future of Financial Advice (FOFA) reforms commenced for the Westpac Group on 1 July 2013. The Government announced proposed reforms to the FOFA laws on 20 December 2013 and a bill to amend FOFA (the Corporations Amendment (Streamlining of Future of Financial Advice) Bill 2014 (the Bill)) was introduced into parliament on 19 March 2014 and is yet to be passed. The Bill includes changes to remove the requirement to opt-in for ongoing fee arrangements every two years and also provides a general advice exemption from the ban on conflicted remuneration. Regulations which were effective on 1 July 2014 (the Streamlining Regulations) incorporated most of the changes set out in the Bill. These Streamlining Regulations were disallowed by the Senate on 19 November 2014, although some of these disallowed regulations were reinstated by the Corporations Amendment (Revising Future of Financial Advice) Regulation 2004 which commenced on 16 December 2014. Uncertainty still exists as to whether the Bill will pass at all given that the Streamlining Regulations were disallowed (with some aspects being reinstated). Regulations, which were proposed to become effective on 1 January 2015, and which were to provide for certain changes in relation to the receipt of client instructions and the content of a Statement of Advice, were repealed by the Government before they commenced.
United States
There are a number of significant regulatory reforms currently occurring in the United States (US). These include:
Dodd-Frank Act
Legislation designed to reform the system for supervision and regulation of financial firms in the US was signed into law on 21 July 2010. The Dodd-Frank Act contains a wide range of provisions that will affect financial institutions operating in the US, including foreign banks like Westpac. Included among its provisions are reforms designed to:
reduce systemic risk presented by very large financial institutions;
promote enhanced supervision, regulation, and prudential standards for financial institutions;
establish comprehensive supervision of financial markets;
impose new limits on permissible financial institution activities and investments;
expand regulation of the derivatives markets, protect consumers and investors from financial abuse; and
provide the US Government with the tools needed to manage a financial crisis.
Many of the provisions of the Dodd-Frank Act require extensive rulemaking by US regulatory agencies before the provisions become effective. The issuance of final rules under the Dodd-Frank Act remains far from complete, with the process continuing. US regulatory agencies have released final rules to implement Section 619 of the Dodd-Frank Act (the Volcker rule) and to strengthen the regulation of the US operations of non-US banks. At this time, apart from investments in compliance activities, we do not expect these rules to have a significant impact on our business activities.
Foreign Account Tax Compliance Act (FATCA)
Provisions commonly referred to as FATCA and related US Treasury regulations generally require Foreign Financial Institutions (FFIs), such as Westpac, to enter into an FFI agreement (if they are not subject to the provisions of a Model 1 Intergovernmental Agreement (IGA)) under which they agree to identify and provide the US Internal Revenue Service (IRS) with information on certain US connected accounts, or otherwise face 30% withholding tax on certain payments made to the FFI. In addition, FFIs that have entered into an FFI agreement will be required to withhold on certain payments made to FFIs that are neither party to an FFI agreement nor subject to an IGA and certain account holders that fail to provide prescribed information. The Australian Government signed an IGA with the United States on 28 April 2014, which came into force on 30 June 2014. The Australian IGA, and any IGAs that may be concluded between the US and other countries in which Westpac conducts business, will relieve Westpac of the requirement to withhold on payments to, or close, certain accounts, and will provide certain other benefits.
Westpac is implementing changes to its business operations to comply with the requirements of FATCA across all jurisdictions in which it operates. Westpac has entered into an FFI agreement with respect to its branches and affiliated FFIs not located in countries that have entered into an IGA. It is anticipated that compliance with FATCA will give rise to significant costs and operational burdens, but that IGAs will reduce those costs and burdens, where applicable.

Interim financial report 2015 Directors’ report
Westpac Group 2015 Interim Results Announcement | 71
New Zealand
Regulatory reforms and significant developments in New Zealand include:
Financial Markets Conduct Act (FMCA)
The FMCA overhauls the existing securities law regime in New Zealand and will impact various aspects of the wider Westpac New Zealand business. It introduces changes to product disclosure and governance together with new licensing and registration requirements as well as new fair dealing provisions. The existing prospectus/investment statement dual disclosure model will no longer apply. A single product disclosure statement is being implemented, supported by an online register of other material documentation. The FMCA was enacted in September 2013. Most of its provisions as well as new regulations setting out the detail of the regime came into force on 1 December 2014, subject to transitional provisions of up to two years. The majority of the fair dealing requirements in the FMCA came into force in April 2014.
Credit law reform/responsible lending
The Credit Contracts and Consumer Finance Amendment Act 2014 received Royal Assent in June 2014 and will come into full effect in June 2015. The Act reforms the entire suite of legislation that governs consumer credit contracts. It creates new responsible lending principles and provides for a regulatory responsible lending code, which was issued in March 2015. Existing consumer protections are also being strengthened by changing the current provisions on disclosure, fees, hardship and ‘oppressive’ contracts.
Consumer law reform
The Consumer Law Reform Bill was passed in December 2013. The Bill amended six separate Acts, including the Fair Trading Act. Among the amendments introduced into the Fair Trading Act were prohibitions on unfair contract terms and on making unsubstantiated representations about a product or service and new provisions regulating uninvited direct sales. The unfair contract terms provisions came into force in March 2015. The unsubstantiated representations prohibitions and uninvited direct sales provisions came into effect in June 2014.
RBNZ – housing review stage two – residential property investors
In March 2015 the RBNZ released a follow up consultation paper on stage two of its review of capital adequacy requirements for residential mortgage loans. The RBNZ is proposing a new asset class treatment for mortgage loans to residential property investors. The two options being considered are to group all non-owner occupier loans in a separate asset class or to have an income test whereby reliance on the rental income becomes the determining factor. The RBNZ is also consulting on the asset class treatment of these loans. Its preferred option is a new sub asset class within the retail asset class. The new rule would apply to all locally incorporated banks. The RBNZ notes that this new proposal would help it implement targeted macro-prudential policies if that becomes necessary. The RBNZ is also proposing that from 1 July 2015 banks that use the internal ratings based approach for calculating their capital ratio requirements should operate under the same risk weight requirements as standardised banks until their new capital models have been approved by the RBNZ. A nine month implementation period for those banks to change their models and implement the necessary change is being proposed.
Risk factors
Our business is subject to risks that can adversely impact our business, financial performance, financial condition and future performance. If any of the following risks occur, our business, prospects, financial performance or financial condition could be materially adversely affected, with the result that the trading price of our securities could decline and as a security holder you could lose all, or part, of your investment. You should carefully consider the risks described and the other information in this Interim Financial Results Announcement and our 2014 Annual Report before investing in our securities. The risks and uncertainties described below are not the only ones we face. Additional risks and uncertainties that we are unaware of, or that we currently deem to be immaterial, may also become important factors that affect us.
Risks relating to our business
Our businesses are highly regulated and we could be adversely affected by failing to comply with existing laws and regulations or by changes in laws, regulations or regulatory policy
As a financial institution, we are subject to detailed laws and regulations in each of the jurisdictions in which we operate or obtain funding, including Australia, New Zealand, the United States and Asia. We are also supervised by a number of different regulatory and supervisory authorities which have broad administrative powers over our businesses. In Australia, the relevant regulatory authorities include the Australian Prudential Regulation Authority (APRA), Reserve Bank of Australia (RBA), Australian Securities and Investments Commission (ASIC), Australian Securities Exchange (ASX), Australian Competition and Consumer Commission (ACCC), the Australian Transaction Reports and Analysis Centre (AUSTRAC) and the Australian Taxation Office (ATO). The Reserve Bank of New Zealand (RBNZ) and the Financial Markets Authority (FMA) have supervisory oversight of our New Zealand operations. In the United States we are subject to supervision and regulation by the US Office of the Comptroller of the Currency (OCC), the Board of Governors of the Federal Reserve System, the Commodity

Interim financial report 2015 Directors’ report
72 | Westpac Group 2015 Interim Results Announcement
Futures Trading Commission (CFTC) and the US Securities and Exchange Commission (SEC). In the United Kingdom, we are subject to supervision and regulation by the Financial Conduct Authority (FCA) and the Prudential Regulation Authority (PRA). In other jurisdictions in which we operate, including Asia and various Pacific countries, we are also required to comply with relevant requirements of the local regulatory bodies.
We are responsible for ensuring that we comply with all applicable legal and regulatory requirements (including accounting standards) and industry codes of practice in the jurisdictions in which we operate or obtain funding, as well as meeting our ethical standards.
Compliance risk arises from these legal and regulatory requirements. If we fail to comply, we may be subject to fines, penalties or restrictions on our ability to do business. In Australia, an example of the broad administrative power available to regulatory authorities is the power available to APRA under the Banking Act 1959 in certain circumstances to investigate our affairs and/or issue a direction to us (such as a direction to comply with a prudential requirement, to conduct an audit, to remove a Director, executive officer or employee or not to undertake transactions). Other regulators also have the power to investigate, including looking into past conduct. In recent years, there have been significant increases in the nature and scale of regulatory investigations, enforcement actions and the quantum of fines issued by global regulators. Regulatory investigations, fines, penalties or restrictions or regulator imposed conditions could adversely affect our business, reputation, prospects, financial performance or financial condition.
As with other financial services providers, we face increasing supervision and regulation in most of the jurisdictions in which we operate or obtain funding, particularly in the areas of funding, liquidity, capital adequacy, conduct and prudential regulation, anti-bribery and corruption, anti-money laundering and counter-terrorism financing and trade sanctions. In December 2010 the Basel Committee on Banking Supervision (BCBS) announced a revised global regulatory framework known as Basel III. Basel III, among other things, increases the required quality and quantity of capital held by banks and introduces new standards for the management of liquidity risk. APRA has now incorporated much of the framework into its prudential standards. Further details on the Basel III framework are set out in ‘Significant developments during the half year ended 31 March’.
During the half year ended 31 March 2015, there were also a series of other regulatory releases from authorities in the various jurisdictions in which we operate or obtain funding proposing significant regulatory change for financial institutions. This includes new accounting and reporting standards which have been finalised, global OTC derivatives reform and the US Dodd-Frank legislation, including the Volcker Rule promulgated thereunder. The latter is designed to reform the entire system for the supervision and regulation of financial firms that operate in or have a connection with the US, including non-US banks like Westpac. Other areas of proposed or potential change that could impact us include changes to tax legislation, regulation relating to remuneration, consumer protection and competition legislation, privacy and data protection, anti-bribery and corruption, anti-money laundering and counter-terrorism financing laws and trade sanctions. In addition, further changes may occur driven by policy, prudential or political factors. In 2013, the Australian Government commissioned a Financial System Inquiry with broad terms of reference. The Federal Treasurer released the Inquiry’s Final Report to Government on 7 December 2014, which was followed by a process of consultation on the Final Report’s recommendations to 31 March 2015. Until the Government officially responds to the Inquiry’s recommendations, the final impact of this Inquiry is difficult to predict but may result in substantial regulatory changes, including changes to capital requirements which could have a material impact on our business, prospects, financial performance or financial condition. Further details on the Inquiry are set out in ‘Significant developments during the half year ended 31 March’.
Regulation is becoming increasingly extensive and complex. Some areas of potential regulatory change involve multiple jurisdictions seeking to adopt a coordinated approach. This may result in conflicts with specific requirements of the jurisdictions in which we operate and, in addition, such changes may be inconsistently introduced across jurisdictions.
Changes may also occur in the oversight approach of regulators. It is possible that governments in jurisdictions in which we operate or obtain funding might revise their application of existing regulatory policies that apply to, or impact, Westpac’s business, including for reasons relating to national interest and/or systemic stability.
Regulatory changes and the timing of their introduction continue to evolve and we currently manage our businesses in the context of regulatory uncertainty. The nature and impact of future changes are not predictable and are beyond our control. Regulatory compliance and the management of regulatory change is an increasingly important part of our strategic planning. We expect that we will be required to continue to invest significantly in compliance and the management and implementation of regulatory change and, at the same time, significant management attention and resources will be required to update existing or implement new processes to comply with the new regulations.
Regulatory change may also impact our operations by requiring us to have increased levels of liquidity and higher levels of, and better quality, capital as well as place restrictions on the businesses we conduct, require us to amend our corporate structure or require us to alter our product or service offerings. If regulatory change has any such effect, it could adversely affect one or more of our businesses, restrict our flexibility, require us to incur

Interim financial report 2015 Directors’ report
Westpac Group 2015 Interim Results Announcement | 73
substantial costs and impact the profitability of one or more of our business lines. Any such costs or restrictions could adversely affect our business, prospects, financial performance or financial condition.
For further information refer to ‘Significant developments during the half year ended 31 March’ in this Interim Financial Results Announcement and our 2014 Annual Report, specifically ‘Significant developments’ in Section 1 and the sections ‘Critical accounting assumptions and estimates’ and ‘Future developments in accounting standards’ in Note 1 to the financial statements.
Adverse credit and capital market conditions may significantly affect our ability to meet funding and liquidity needs and may increase our cost of funding
We rely on credit and capital markets to fund our business and as a source of liquidity. Our liquidity and costs of obtaining funding are related to credit and capital market conditions.
Global credit and capital markets can experience periods of extreme volatility, disruption and decreased liquidity as was demonstrated during the Global Financial Crisis. While there have now been extended periods of stability in these markets, the environment has become more volatile and unpredictable. The main risks we face are damage to market confidence, changes to the access and cost of funding and a slowing in global activity or through other impacts on entities with whom we do business.
As of 31 March 2015, approximately 33% of our total funding originated from domestic and international wholesale markets, of this around 62% was sourced outside Australia and New Zealand.
A shift in investment preferences of businesses and consumers away from bank deposits towards other asset or investment classes could increase our need for funding from other, potentially less stable or more expensive forms of funding.
If market conditions deteriorate due to economic, financial, political or other reasons, our funding costs may be adversely affected and our liquidity and our funding and lending activities may be constrained.
If our current sources of funding prove to be insufficient, we may be forced to seek alternative financing. The availability of such alternative financing, and the terms on which it may be available, will depend on a variety of factors, including prevailing market conditions, the availability of credit, our credit ratings and credit market capacity. Even if available, the cost of these alternatives may be more expensive or on unfavourable terms, which could adversely affect our financial performance, liquidity, capital resources and financial condition. There is no assurance that we will be able to obtain adequate funding and do so at acceptable prices, nor that we will be able to recover any additional costs.
If Westpac is unable to source appropriate funding, we may also be forced to reduce our lending or begin selling liquid securities. Such actions may adversely impact our business, prospects, liquidity, capital resources, financial performance or financial condition.
Westpac enters into collateralised derivative obligations, which may require Westpac to post additional collateral based on movements in market rates, which have the potential to adversely affect Westpac’s liquidity.
For a more detailed description of liquidity risk, refer to the section ‘Funding and Liquidity risk’ in Note 27 to the financial statements in our 2014 Annual Report.
Sovereign risk may destabilise financial markets adversely
Sovereign risk is the risk that foreign governments will default on their debt obligations, will be unable to refinance their debts as they fall due, or will nationalise parts of their economy. Should one sovereign default, there could be a cascading effect to other markets and countries, the consequences of which, while difficult to predict, may be similar to or worse than those experienced during the Global Financial Crisis. Such an event could destabilise global financial markets adversely affecting our liquidity, financial performance or financial condition.
Failure to maintain credit ratings could adversely affect our cost of funds, liquidity, competitive position and access to capital markets
Credit ratings are independent opinions on our creditworthiness. Our credit ratings affect the cost and availability of our funding from capital markets and other funding sources and they may be important to customers or counterparties when evaluating our products and services. Therefore, maintaining high quality credit ratings is important.
The credit ratings assigned to us by rating agencies are based on an evaluation of a number of factors, including our financial strength, structural considerations regarding the Australian financial system and the credit rating of the Australian Government. A credit rating downgrade could be driven by the occurrence of one or more of the other risks identified in this section or by other events including changes to the methodologies used by the rating agencies to determine ratings.

Interim financial report 2015 Directors’ report
74 | Westpac Group 2015 Interim Results Announcement
Failure to maintain our current credit ratings could adversely affect our cost of funds and related margins, collateral requirements, liquidity, competitive position and our access to capital markets. The extent and nature of these impacts would depend on various factors, including the extent of any ratings change, whether our ratings differ among agencies (split ratings) and whether any ratings changes also impact our peers or the sector.
A systemic shock in relation to the Australian, New Zealand or other financial systems could have adverse consequences for Westpac or its customers or counterparties that would be difficult to predict and respond to
There is a risk that a major systemic shock could occur that causes an adverse impact on the Australian, New Zealand or other financial systems.
As outlined above, during the past decade the financial services industry and capital markets have been, and may continue to be, adversely affected by market volatility and the negative outlook for global economic conditions. A shock to one of the major global economies could again result in currency and interest rate fluctuations and operational disruptions that negatively impact the Group.
Any such market and economic disruptions could adversely affect financial institutions such as Westpac because consumer and business spending may decrease, unemployment may rise and demand for the products and services we provide may decline, thereby reducing our earnings. These conditions may also affect the ability of our borrowers to repay their loans or our counterparties to meet their obligations, causing us to incur higher credit losses. These events could also result in the undermining of confidence in the financial system, reducing liquidity, impairing our access to funding and impairing our customers and counterparties and their businesses. If this were to occur, our business, prospects, financial performance or financial condition could be adversely affected.
The nature and consequences of any such event are difficult to predict and there can be no certainty that we could respond effectively to any such event.
Declines in asset markets could adversely affect our operations or profitability
Declines in Australian, New Zealand or other asset markets, including equity, residential and commercial property and other asset markets, could adversely affect our operations and profitability.
Declining asset prices also impact our wealth management business. Earnings in our wealth management business are, in part, dependent on asset values because we typically receive fees based on the value of securities and/or assets held or managed. A decline in asset prices could negatively impact the earnings of this business.
Declining asset prices could also impact customers and counterparties and the value of security (including residential and commercial property) we hold against loans and derivatives which may impact our ability to recover amounts owing to us if customers or counterparties were to default. It may also affect our level of provisioning which in turn impacts our profitability and financial condition.
Our business is substantially dependent on the Australian and New Zealand economies
Our revenues and earnings are dependent on economic activity and the level of financial services our customers require. In particular, lending is dependent on various factors including economic growth, business investment, business and consumer sentiment, levels of employment, interest rates and trade flows in the countries in which we operate.
We conduct the majority of our business in Australia and New Zealand and, consequently, our performance is influenced by the level and cyclical nature of lending in these countries. These factors are in turn impacted by both domestic and international economic conditions, natural disasters and political events. A significant decrease in Australian and New Zealand housing valuations could adversely impact our home lending activities because borrowers with loans in excess of their property value show a higher propensity to default and in the event of defaults our security would be eroded, causing us to incur higher credit losses. The demand for our home lending products may also decline due to buyer concerns about decreases in values.
Adverse changes to the economic and business conditions in Australia and New Zealand and other countries such as China, India and Japan, could also adversely affect the Australian economy and our customers. In particular, due to the current relationship between Australia and China, particularly in the mining and resources sectors, a slowdown in China’s economic growth could negatively impact the Australian economy. Changes in economic conditions could in turn result in reduced demand for our products and services and affect the ability of our borrowers to repay their loans. If this were to occur, it could negatively impact our business, prospects, financial performance or financial condition.
An increase in defaults in credit exposures could adversely affect our liquidity, capital resources, financial performance or financial condition
Credit risk is a significant risk and arises primarily from our lending and derivatives activities. The risk arises from the possibility that some customers and counterparties will be unable to honour their obligations to us, including the repayment of loan principal and interest.

Interim financial report 2015 Directors’ report
Westpac Group 2015 Interim Results Announcement | 75
We establish provisions for credit impairment based on current information. If economic conditions deteriorate, some customers and/or counterparties could experience higher levels of financial stress and we may experience a significant increase in defaults and write-offs, and be required to increase our provisioning. Such events would diminish available capital and could adversely affect our liquidity, capital resources, financial performance or financial condition.
Credit risk also arises from certain derivative contracts we enter into and from our dealings with, and holdings of, debt securities issued by other banks, financial institutions, companies, governments and government bodies the financial conditions of which may be affected to varying degrees by economic conditions in global financial markets.
For a discussion of our risk management procedures, including the management of credit risk, refer to the ‘Risk management’ section and Note 27 to the financial statements in our 2014 Annual Report.
We face intense competition in all aspects of our business
The financial services industry is highly competitive. We compete, both domestically and internationally, with retail and commercial banks, asset managers, investment banking firms, brokerage firms, other financial service firms and businesses in other industries with emerging financial services aspirations. This includes specialist competitors that may not be subject to the same capital and regulatory requirements and therefore may be able to operate more efficiently. Digital technologies are changing consumer behaviour and the competitive environment. The use of digital channels by customers to conduct their banking continues to rise and emerging competitors are increasingly utilising new technologies and seeking to disrupt existing business models, including in relation to digital payment services. The Group faces competition from established providers of financial services as well as the threat of competition from banking businesses developed by non-financial services companies.
If we are unable to compete effectively in our various businesses and markets, our market share may decline. Increased competition may also adversely affect us by diverting business to our competitors or creating pressure to lower margins.
Increased competition for deposits could also increase our cost of funding and lead us to access other types of funding or reduce lending. We rely on bank deposits to fund a significant portion of our balance sheet and deposits have been a relatively stable source of funding. We compete with banks and other financial services firms for such deposits. To the extent that we are not able to successfully compete for deposits, we would be forced to rely more heavily on other, potentially less stable or more expensive forms of funding, or reduce lending.
We are also dependent on our ability to offer products and services that match evolving customer preferences. If we are not successful in developing or introducing new products and services or responding or adapting to changes in customer preferences and habits, we may lose customers to our competitors. This could adversely affect our business, prospects, financial performance or financial condition.
For more detail on how we address competitive pressures refer to ‘Competition’ in Section 1 of our 2014 Annual Report.
We could suffer losses due to market volatility
We are exposed to market risk as a consequence of our trading activities in financial markets and through the asset and liability management of our financial position. In our financial markets trading business, we are exposed to losses arising from adverse movements in levels and volatility of interest rates, foreign exchange rates, commodity prices, credit prices and equity prices. If we were to suffer substantial losses due to any market volatility it may adversely affect our business, prospects, liquidity, capital resources, financial performance or financial condition. For a discussion of our risk management procedures, including the management of market risk, refer to the ‘Risk management’ section in our 2014 Annual Report.
We could suffer losses due to operational risks
Operational risk is the risk of loss resulting from inadequate or failed internal processes, people and systems or from external events. It also includes, among other things, technology risk, model risk and outsourcing risk.
We are also highly dependent on the conduct of our employees, contractors and external service providers. We could, for example, be adversely affected in the event of human error, inadequate or failed processes or if an employee, contractor or external service provider engages in fraudulent conduct. We could incur losses from incorrect or fraudulent payments and settlements, particularly real-time payments. We could also incur losses from an unintentional or negligent failure to meet a professional obligation to specific clients, including fiduciary and suitability requirements, or from the nature or design of a product. These may include client, product and business practice risks such as product defects and unsuitability, market manipulation, insider trading, misleading or deceptive conduct, and inadequate or defective financial advice. While we have policies and processes to manage the risk of human error and employee, contractor or external service provider misconduct, these policies and processes may not always be effective.

Interim financial report 2015 Directors’ report
76 | Westpac Group 2015 Interim Results Announcement
Fraudulent conduct can also emerge from external parties seeking to access the bank’s systems and customers’ accounts. If systems, procedures and protocols for managing fraud fail, or are ineffective, they could lead to loss which could adversely affect our business, prospects, reputation, financial performance or financial condition.
Entities within the Group may be involved from time to time in legal proceedings arising from the conduct of their business. The Group’s material contingent liabilities are described in Note 16 to the financial statements. There is a risk that these contingent liabilities may be larger than anticipated or that additional litigation or other contingent liabilities may arise.
As a financial services organisation, Westpac is heavily reliant on the use of data and models in the conduct of its business. We are therefore exposed to model risk, being the risk of loss arising because of errors or inadequacies in data or a model, or in the control and use of the model.
Westpac relies on a number of suppliers, both in Australia and overseas, to provide services to it and its customers. Failure by these suppliers to deliver services as required could disrupt services and adversely impact Westpac’s operations, profitability or reputation.
Operational risks could impact on our operations or adversely affect demand for our products and services. Operational risks can directly impact our reputation and result in financial losses which would adversely affect our financial performance or financial condition.
For a discussion of our risk management procedures, including the management of operational risk, refer to the ‘Risk management’ section in our 2014 Annual Report.
We could suffer information security risks, including cyberattacks
The proliferation of new technologies, the increasing use of the internet and telecommunications to conduct financial transactions and the growing sophistication and activities of organised crime have resulted in increased information security risks for major financial institutions such as Westpac and our external service providers.
While Westpac has systems in place to detect and respond to cyberattacks, these systems may not always be effective and there can be no assurance that we will not suffer losses from cyberattacks or other information security breaches in the future.
Our operations rely on the secure processing, storage and transmission of information on our computer systems and networks, and the systems and networks of external suppliers. Although we implement measures to protect the security, integrity and confidentiality of our information, there is a risk that the computer systems, software and networks on which we rely may be subject to security breaches, unauthorised access, malicious software, external attacks or internal breaches that could have an adverse impact on our confidential information or that of our customers and counterparties.
Major banks in other jurisdictions have suffered security breaches from sophisticated cyberattacks. Our external service providers or other parties that facilitate our business activities (e.g. vendors, exchanges, clearing houses, central depositories and financial intermediaries) are also subject to the risk of cyberattacks. Any such security breach could result in the loss of customers and business opportunities, significant disruption to Westpac’s operations, misappropriation of Westpac’s confidential information and/or that of our customers and damage to Westpac’s computers or systems and/or those of our customers. Such a security breach could also result in reputational damage, claims for compensation and regulatory investigations and penalties, which could adversely affect our business, prospects, financial performance, or financial condition.
Our risk and exposure to such threats remains heightened because of the evolving nature of technology, Westpac’s prominence within the financial services industry, the prominence of our customers (including government, mining and health) and our plans to continue to improve and expand our internet and mobile banking infrastructure.
We continue to seek to strengthen and enhance our cybersecurity systems and investigate or remediate information security vulnerabilities, investing additional resources to endeavour to counter new and emerging threats as they continue to evolve.
We could suffer losses due to technology failures
The reliability and security of our information and technology infrastructure are crucial in maintaining our banking applications and processes. There is a risk that our information and technology systems might fail to operate properly or become disabled as a result of events that are wholly or partially beyond our control.
Further, our ability to develop and deliver products and services to customers is dependent upon technology that requires periodic renewal. We are constantly managing technology projects including projects to consolidate technology platforms, simplify and enhance our technology and operations environment, improve productivity and provide for a better customer experience. Failure to implement these projects or manage associated change effectively could result in cost overruns, a failure to achieve anticipated productivity, operational instability or reputational damage. In turn, this could place us at a competitive disadvantage and adversely affect our financial performance.

Interim financial report 2015 Directors’ report
Westpac Group 2015 Interim Results Announcement | 77
We could suffer losses due to failures in governance or risk management strategies
We have implemented risk management strategies and internal controls involving processes and procedures intended to identify, monitor and manage the risks to which we are subject, including liquidity risk, credit risk, market risk (such as interest rate, foreign exchange and equity risk), compliance risk, conduct risk and operational risk; all of which may impact the Group’s reputation.
However, there are inherent limitations with any risk management framework as there may exist, or emerge in the future, risks that we have not anticipated or identified.
If any of our governance or risk management processes and procedures prove ineffective or inadequate or are otherwise not appropriately implemented, we could suffer unexpected losses and reputational damage which could adversely affect our business, prospects, financial performance or financial condition.
For a discussion of our risk management procedures, refer to the ‘Risk management’ section in our 2014 Annual Report.
We could suffer losses due to insurance risk
We have exposure to insurance risk in our life insurance, general insurance and lenders mortgage insurance businesses, which may adversely affect our business, operations and financial condition.
Insurance risk is the risk of loss due to increases in policy benefits paid to customers arising from variations in the incidence or severity of insured events.
In the life insurance business, insurance risk arises primarily through mortality (death) and morbidity (illness and injury) risks being greater than expected.
In the general insurance business, insurance risk arises mainly through environmental factors (including floods and bushfires) and other calamities, such as earthquakes, tsunamis and volcanic activity, as well as general variability in home and contents insurance claim amounts. Further details on environmental risk factors are discussed below.
In the lenders mortgage insurance business, insurance risk arises primarily from an unexpected downturn in economic conditions.
We could also suffer losses if our reinsurance arrangements are not effective.
We could suffer losses due to environmental factors
We and our customers operate businesses and hold assets in a diverse range of geographic locations. Any significant environmental change or external event (including fire, storm, flood, earthquake or pandemic) in any of these locations has the potential to disrupt business activities, impact on our operations, damage property and otherwise affect the value of assets held in the affected locations and our ability to recover amounts owing to us. In addition, such an event could have an adverse impact on economic activity, consumer and investor confidence, or the levels of volatility in financial markets.
The risk of loss due to environmental factors is also relevant to our insurance business. The frequency and severity of external events such as natural disasters is difficult to predict and it is possible that the amounts we reserve for such events may not be adequate to cover actual claims that may arise, which could adversely affect our business, prospects, financial performance or financial condition.
Reputational damage could harm our business and prospects
Our ability to attract and retain customers and our prospects could be adversely affected if our reputation is damaged.
Reputation risk arises where there are differences between stakeholders’ current and emerging perceptions, beliefs and expectations and our current and planned activities, performance and behaviours.
There are various potential sources of reputational damage, including failure to effectively manage risks in accordance with our risk management frameworks, potential conflicts of interest, pricing policies, failure to comply with legal and regulatory requirements, regulatory investigations into past conduct, making inaccurate public statements, environmental, social and ethical issues, engagement and conduct of external suppliers, failure to comply with anti-money laundering and anti-bribery and corruption laws, trade sanctions and counter-terrorism finance legislation or privacy laws, litigation, failure of information security systems, improper sales and trading practices, failure to comply with personnel and supplier policies, improper conduct of companies in which we hold strategic investments, technology failures and security breaches. Our reputation could also be adversely affected by the actions of the financial services industry in general or from the actions of customers, suppliers and other counterparties.

Interim financial report 2015 Directors’ report
78 | Westpac Group 2015 Interim Results Announcement
Failure, or perceived failure, to appropriately address issues that could or do give rise to reputational risk could also impact the regulatory change agenda, give rise to additional legal risk, subject us to regulatory investigations, regulatory enforcement actions, fines and penalties, or remediation costs, or harm our reputation among customers, investors and the marketplace. This could lead to loss of business which could adversely affect our business, prospects, financial performance or financial condition.
We could suffer losses due to impairment to capitalised software, goodwill and other intangible assets that may adversely affect our business, operations and financial condition
In certain circumstances Westpac may be exposed to a reduction in the value of intangible assets. As at 31 March 2015, Westpac carried goodwill principally related to its investments in Australia, other intangible assets principally relating to assets recognised on acquisition of subsidiaries and capitalised software balances.
Westpac is required to assess the recoverability of the goodwill balances on at least an annual basis or wherever an indicator of impairment exists. For this purpose Westpac uses a discounted cash flow calculation. Changes in the assumptions upon which the calculation is based, together with expected changes in future cash flows, could materially impact this assessment, resulting in the potential write-off of part or all of the goodwill balances.
Capitalised software and other intangible assets are assessed for indicators of impairment at least annually or on indication of impairment. In the event that an asset is no longer in use, or that the cash flows generated by the asset do not support the carrying value, an impairment will be recorded, adversely impacting the Group’s financial condition.
We could suffer losses if we fail to syndicate or sell down underwritten securities
As a financial intermediary we underwrite listed and unlisted debt and equity securities. Underwriting activities include the development of solutions for corporate and institutional customers who need capital and investor customers who have an appetite for certain investment products. We may guarantee the pricing and placement of these facilities. We could suffer losses if we fail to syndicate or sell down our risk to other market participants. This risk is more pronounced in times of heightened market volatility.
Certain strategic decisions may have adverse effects on our business
Westpac, at times, evaluates and may implement strategic decisions which may include diversification or innovation objectives, in addition to business expansion, including acquisitions of businesses. The expansion or integration of a new business can be complex and costly and may require Westpac to comply with additional local or foreign regulatory requirements which may carry additional risks. These decisions may, for a variety of reasons, not deliver the anticipated positive business results and could have a negative impact on our business, prospects, engagement with regulators, financial performance or financial condition.
Auditor’s independence declaration
A copy of the auditor’s independence declaration as required under section 307C of the Corporations Act 2001 is set out on page 80 and forms part of this report.
Rounding of amounts
ASIC Class Order 98/100 applies to Westpac and in accordance with that Class Order all amounts have been rounded to the nearest million dollars unless otherwise stated.

Interim financial report 2015 Directors’ report
Westpac Group 2015 Interim Results Announcement | 79
Responsibility statement
The Directors of Westpac Banking Corporation confirm that to the best of their knowledge:
(i) the interim financial statements have been prepared in accordance with AASB 134 Interim Financial Reporting and are in compliance with IAS 34 Interim Financial Reporting issued by the International Accounting Standards Board; and
(ii) the Directors’ Report includes a fair review of the information required by the Disclosure and Transparency Rules 4.2.7R of the United Kingdom Financial Conduct Authority.
Signed in accordance with a resolution of the Board of Directors.
Lindsay Maxsted Chairman
Brian Hartzer Managing Director and Chief Executive Officer
Sydney, Australia 4 May 2015
Interim financial report 2015 Directors’ report
80 | Westpac Group 2015 Interim Results Announcement
Auditor’s Independence Declaration
As lead auditor for the review of Westpac Banking Corporation for the half year ended 31 March 2015, I declare that to the best of my knowledge and belief, there have been:
a) no contraventions of the auditor independence requirements of the Corporations Act 2001 in relation to the review; and
b) no contraventions of any applicable code of professional conduct in relation to the review.
This declaration is in respect of Westpac Banking Corporation and the entities it controlled during the period.
Michael Codling Partner PricewaterhouseCoopers
Sydney4 May 2015
PricewaterhouseCoopers, ABN 52 780 433 757Darling Park Tower 2, 201 Sussex Street, GPO BOX 2650, SYDNEY NSW 1171 T: +61 2 8266 0000, F: +61 2 8266 9999, www.pwc.com.au Liability limited by a scheme approved under Professional Standards Legislation.

Interim financial report 2015 Consolidated financial statements
Westpac Group 2015 Interim Results Announcement | 81
4.2 Consolidated income statement for the half year ended 31 March 2015
Westpac Banking Corporation and its controlled entities
% Mov't % Mov't
$m NoteHalf Year March 15
Half Year Sept 14
Half Year March 14
Mar 15 - Sept 14
Mar 15 - Mar 14
Interest income 3 16,531 16,384 15,864 1 4Interest expense 3 (9,547) (9,481) (9,225) 1 3Net interest income 6,984 6,903 6,639 1 5Non-interest income 4 3,013 3,244 3,151 (7) (4)
Net operating income before operating expenses andimpairment charges 9,997 10,147 9,790 (1) 2Operating expenses 5 (4,410) (4,352) (4,195) 1 5Impairment charges 9 (341) (309) (341) 10 -Profit before income tax 5,246 5,486 5,254 (4) -Income tax expense 6 (1,604) (1,520) (1,595) 6 1Net profit for the period 3,642 3,966 3,659 (8) -
Net profit attributable to non-controlling interests (33) (27) (37) 22 (11)Net profit attributable to owners of Westpac Banking Corporation 3,609 3,939 3,622 (8) -Earnings per share (cents)
Basic 7 116.1 127.0 116.8 (9) (1)Diluted 7 114.5 124.0 114.5 (8) -
The above consolidated income statement should be read in conjunction with the accompanying notes.
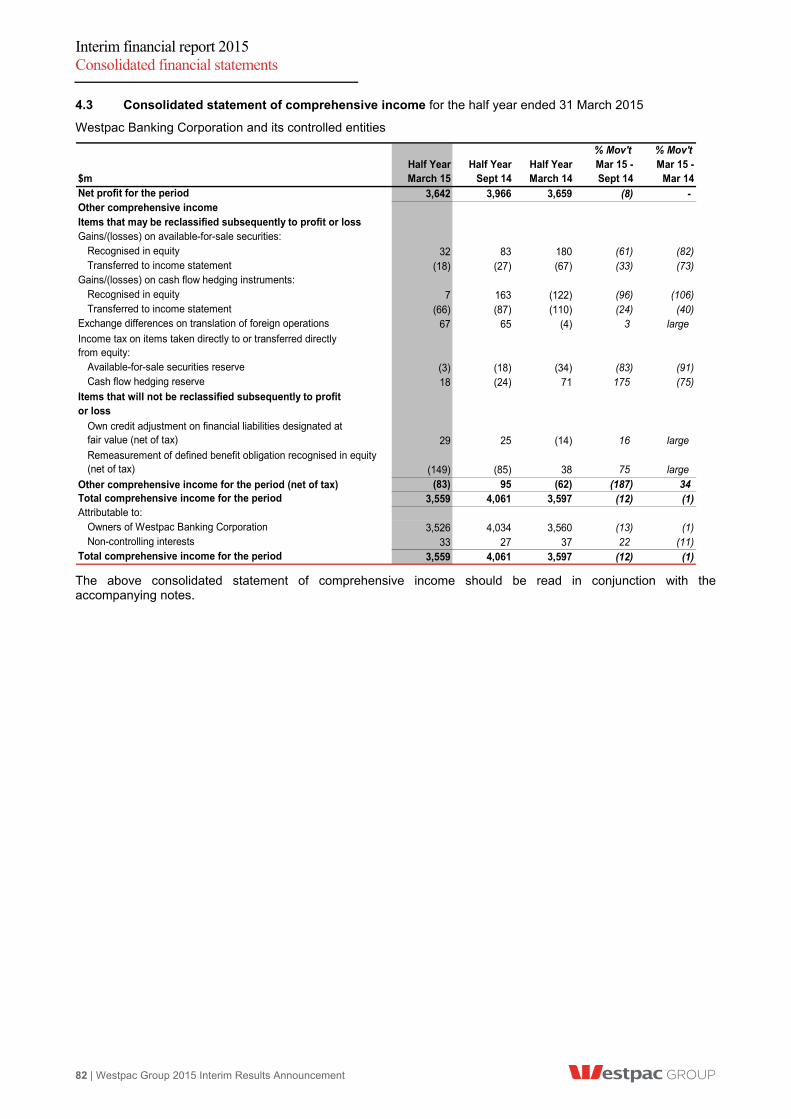
Interim financial report 2015 Consolidated financial statements
82 | Westpac Group 2015 Interim Results Announcement
4.3 Consolidated statement of comprehensive income for the half year ended 31 March 2015
Westpac Banking Corporation and its controlled entities
% Mov't % Mov't
$mHalf Year March 15
Half Year Sept 14
Half Year March 14
Mar 15 - Sept 14
Mar 15 - Mar 14
Net profit for the period 3,642 3,966 3,659 (8) - Other comprehensive incomeItems that may be reclassified subsequently to profit or lossGains/(losses) on available-for-sale securities:
Recognised in equity 32 83 180 (61) (82) Transferred to income statement (18) (27) (67) (33) (73)
Gains/(losses) on cash flow hedging instruments:Recognised in equity 7 163 (122) (96) (106) Transferred to income statement (66) (87) (110) (24) (40)
Exchange differences on translation of foreign operations 67 65 (4) 3 largeIncome tax on items taken directly to or transferred directly from equity:
Available-for-sale securities reserve (3) (18) (34) (83) (91) Cash flow hedging reserve 18 (24) 71 175 (75)
Items that will not be reclassified subsequently to profit or loss
Own credit adjustment on financial liabilities designated at fair value (net of tax) 29 25 (14) 16 largeRemeasurement of defined benefit obligation recognised in equity (net of tax) (149) (85) 38 75 large
Other comprehensive income for the period (net of tax) (83) 95 (62) (187) 34 Total comprehensive income for the period 3,559 4,061 3,597 (12) (1) Attributable to:
Owners of Westpac Banking Corporation 3,526 4,034 3,560 (13) (1) Non-controlling interests 33 27 37 22 (11)
Total comprehensive income for the period 3,559 4,061 3,597 (12) (1)
The above consolidated statement of comprehensive income should be read in conjunction with the accompanying notes.

Interim financial report 2015 Consolidated financial statements
Westpac Group 2015 Interim Results Announcement | 83
4.4 Consolidated balance sheet as at 31 March 2015
Westpac Banking Corporation and its controlled entities
As at As at As at % Mov't % Mov't
$m Note31 March
201530 Sept
201431 March
2014Mar 15 - Sept 14
Mar 15 - Mar 14
AssetsCash and balances with central banks 14,738 25,760 16,375 (43) (10) Receivables due from other financial institutions 13,637 7,424 8,744 84 56 Trading securities and other financial assets designated at fair value 38,329 45,909 46,207 (17) (17) Derivative financial instruments 45,702 41,404 26,207 10 74 Available-for-sale securities 44,296 36,024 33,185 23 33 Loans 8 605,064 580,343 564,569 4 7 Life insurance assets 12,348 11,007 12,841 12 (4) Regulatory deposits with central banks overseas 1,306 1,528 1,575 (15) (17) Property, plant and equipment 1,539 1,452 1,294 6 19 Deferred tax assets 1,368 1,397 1,395 (2) (2) Goodwill and other intangible assets 12,592 12,606 12,683 - (1) Other assets 5,042 5,988 4,300 (16) 17 Total assets 795,961 770,842 729,375 3 9 LiabilitiesPayables due to other financial institutions 15,421 18,636 15,211 (17) 1 Deposits and other borrowings 11 466,743 460,822 437,405 1 7 Other financial liabilities at fair value through income statement 12,133 19,236 15,077 (37) (20) Derivative financial instruments 50,510 39,539 31,330 28 61 Debt issues 168,151 152,251 150,098 10 12 Current tax liabilities 347 662 430 (48) (19) Life insurance liabilities 10,945 9,637 11,594 14 (6) Provisions 1,320 1,618 1,364 (18) (3) Deferred tax liabilities 52 55 27 (5) 93 Other liabilities 8,117 8,191 8,488 (1) (4) Total liabilities excluding loan capital 733,739 710,647 671,024 3 9 Loan capital 11,905 10,858 10,320 10 15 Total liabilities 745,644 721,505 681,344 3 9 Net assets 50,317 49,337 48,031 2 5 Shareholders’ equityShare capital:
Ordinary share capital 12 27,237 26,943 26,954 1 1 Treasury shares and RSP treasury shares 12 (390) (304) (305) (28) (28)
Reserves 1,283 1,176 960 9 34 Retained profits 21,275 20,641 19,556 3 9 Total equity attributable to owners of Westpac Banking Corporation 49,405 48,456 47,165 2 5 Non-controlling interests 912 881 866 4 5 Total shareholders' equity and non-controlling interests 50,317 49,337 48,031 2 5
The above consolidated balance sheet should be read in conjunction with the accompanying notes.

Interim financial report 2015 Consolidated financial statements
84 | Westpac Group 2015 Interim Results Announcement
4.5 Consolidated statement of changes in equity for the half year ended 31 March 2015
Westpac Banking Corporation and its controlled entities
% Mov't % Mov't
$mHalf Year March 15
Half Year Sept 14
Half Year March 14
Mar 15 - Sept 14
Mar 15 - Mar 14
Share capital
Balance as at beginning of period 26,639 26,649 26,768 - - Shares issued:
Dividend reinvestment plan 364 - - - - Exercise of employee share options and rights 14 24 25 (42) (44)
Shares purchased for delivery upon exercise of options andshare rights (net of tax) (57) (35) (65) 63 (12) Shares purchased for delivery of employee share plan (27) - (27) - - Acquisition of RSP treasury shares (65) - (59) - 10 Disposal/(acquisition) of other treasury shares (21) 1 7 large largeBalance as at period end 26,847 26,639 26,649 1 1 Available-for-sale securities reserveBalance as at beginning of period 129 91 12 42 largeCurrent period movement reflected in othercomprehensive income:
Net gains/(losses) from changes in fair value 32 83 180 (61) (82) Income tax effect (8) (25) (54) (68) (85) Transferred to income statement (18) (27) (67) (33) (73) Income tax effect 5 7 20 (29) (75)
Balance as at period end 140 129 91 9 54 Share-based payment reserve
Balance as at beginning of period 1,076 1,010 920 7 17 Current period movement due to transactions with employees (net of tax) 86 66 90 30 (4) Balance as at period end 1,162 1,076 1,010 8 15 Cash flow hedging reserveBalance as at beginning of period 162 110 271 47 (40) Current period movement reflected in othercomprehensive income:
Net gains/(losses) from changes in fair value 7 163 (122) (96) (106) Income tax effect (2) (50) 38 (96) (105) Transferred to income statement (66) (87) (110) (24) (40) Income tax effect 20 26 33 (23) (39)
Balance as at period end 121 162 110 (25) 10 Foreign currency translation reserve
Balance as at beginning of period (190) (255) (251) (25) (24) Current period movement reflected in othercomprehensive income:
Exchange differences on translation of foreign operations 67 65 (4) 3 largeBalance as at period end (123) (190) (255) (35) (52) Other reserves
Balance as at beginning of period (1) 4 1 (125) (200) Transactions with owners (16) (5) 3 large largeBalance as at period end (17) (1) 4 large largeTotal reserves 1,283 1,176 960 9 34 Movements in retained profits were as follows
Balance as at beginning of period 20,641 19,556 18,953 6 9 Current period movement reflected in othercomprehensive income:
Profit attributable to owners of Westpac Banking Corporation 3,609 3,939 3,622 (8) - Own credit adjustment on financial liabilities designatedat fair value (net of tax) 29 25 (14) 16 largeRemeasurement of defined benefit obligation recognisedin equity (net of tax) (149) (85) 38 75 large
Transaction with owners:Ordinary dividends paid (2,855) (2,794) (2,733) 2 4 Special dividends paid - - (310) - (100)
Balance as at period end 21,275 20,641 19,556 3 9 Total comprehensive income attributable to owners ofWestpac Banking Corporation 3,526 4,034 3,560 (13) (1) Total comprehensive income attributable tonon-controlling interests 33 27 37 22 (11) Total comprehensive income for the period 3,559 4,061 3,597 (12) (1)
The above consolidated statement of changes in equity should be read in conjunction with the accompanying notes.

Interim financial report 2015 Consolidated financial statements
Westpac Group 2015 Interim Results Announcement | 85
4.6 Consolidated cash flow statement1 for the half year ended 31 March 2015
Westpac Banking Corporation and its controlled entities
% Mov't % Mov't
$m NoteHalf Year March 15
Half Year Sept 14
Half Year March 14
Mar 15 - Sept 14
Mar 15 - Mar 14
Cash flows from operating activitiesInterest received 16,445 16,391 15,745 - 4 Interest paid (9,631) (9,480) (9,263) 2 4 Dividends received excluding life business 7 6 5 17 40 Other non-interest income received 2,867 2,962 2,770 (3) 4 Operating expenses paid (3,991) (3,403) (3,924) 17 2 Income tax paid excluding life business (1,735) (1,079) (1,581) 61 10 Life business:
Receipts from policyholders and customers 889 929 765 (4) 16 Interest and other items of similar nature 27 18 30 50 (10) Dividends received 107 205 92 (48) 16 Payments to policyholders and suppliers (923) (879) (844) 5 9 Income tax paid (48) (64) (59) (25) (19)
Cash flows from operating activities before changes in operating assets and liabilities 4,014 5,606 3,736 (28) 7Net (increase)/decrease in:
Trading securities and other financial assets designatedat fair value 10,103 (1,869) 3,593 large 181 Loans (18,788) (18,056) (17,678) 4 6 Receivables due from other financial institutions (5,350) 1,464 2,468 large largeLife insurance assets and liabilities (9) (135) (21) (93) (57) Regulatory deposits with central banks overseas 372 132 (6) 182 largeDerivative financial instruments 10,249 (4,266) 937 large largeOther assets (218) 202 (81) large 169
Net increase/(decrease) in:
Other financial liabilities at fair value through income statement (7,166) 4,239 4,840 large largeDeposits and other borrowings 101 23,976 10,253 (100) (99) Payables due to other financial institutions (3,757) 3,220 6,199 large (161) Other liabilities (64) (111) (271) (42) (76)
Net cash provided by/(used in) operating activities 15 (10,513) 14,402 13,969 (173) (175)Cash flows from investing activitiesProceeds from available-for-sale securities 2,212 3,233 3,535 (32) (37) Purchase of available-for-sale securities (9,121) (5,692) (6,751) 60 35 Purchase of intangible assets (275) (306) (358) (10) (23) Purchase of property, plant and equipment (261) (358) (157) (27) 66 Proceeds from disposal of property, plant and equipment 17 12 5 42 largePurchase of controlled entity, net of cash acquired 15 - - (7,744) - (100) Net cash (used in)/provided by investing activities (7,428) (3,111) (11,470) 139 (35)Cash flows from financing activitiesIssue of loan capital (net of issue costs) 614 770 998 (20) (38) Redemption of loan capital - (362) (23) (100) (100) Net increase/(decrease) in debt issues 7,329 (326) 4,004 large 83 Proceeds from exercise of employee options 14 24 25 (42) (44) Purchase of shares on exercise of employee options and rights (66) (40) (73) 65 (10) Shares purchased for delivery of employee share plan (27) - (27) - - Purchase of RSP treasury shares (65) - (59) - 10 Net sale/(purchase) of other treasury shares (21) 1 7 large largePayment of dividends (2,491) (2,794) (3,043) (11) (18) Payment of distributions to non-controlling interests (18) (17) (31) 6 (42) Net cash (used in)/provided by financing activities 5,269 (2,744) 1,778 large 196Net increase/(decrease) in cash and cash equivalents (12,672) 8,547 4,277 large largeEffect of exchange rate changes on cash and cash equivalents 1,650 838 399 97 largeCash and cash equivalents as at the beginning of the period 25,760 16,375 11,699 57 120 Cash and cash equivalents as at the end of the period 14,738 25,760 16,375 (43) (10)
The above consolidated cash flow statement should be read in conjunction with the accompanying notes.
Details of the reconciliation of net cash provided by operating activities to net profit attributable to owners of Westpac Banking Corporation are provided in Note 15.
1 The presentation of the consolidated cash flow statement has been revised this period to better reflect the nature of our business.
Certain cash flows have been reclassified between operating activities, and we have revised comparatives for Half Year March 2014 and Half Year Sept 2014 in order to ensure consistency. These changes have had no impact on the reported net increase/decrease in cash and cash equivalents.

Interim financial report 2015 Notes to the consolidated financial statements
86 | Westpac Group 2015 Interim Results Announcement
4.7 Notes to the consolidated financial statements
Note 1. Basis of preparation of interim financial report
This general purpose interim financial report for the half year ended 31 March 2015 has been prepared in accordance with Australian Accounting Standard AASB 134 Interim Financial Reporting and the Corporations Act 2001 which ensures compliance with International Accounting Standard IAS 34 Interim Financial Reporting.
The interim financial report does not include all the notes of the type normally included in an annual financial report. Accordingly, this interim report is to be read in conjunction with the annual financial report for the year ended 30 September 2014 and any relevant public announcements made by Westpac during the interim reporting period in accordance with the continuous disclosure requirements of the Corporations Act 2001 and the ASX Listing Rules.
The interim financial report complies with current Australian Accounting Standards (AAS) as they relate to interim financial reports.
The accounting policies and methods of computation adopted in this interim financial report are the same as those in the previous financial year and corresponding interim reporting period, unless specifically noted. Comparative information has been revised where appropriate to enhance comparability.
The interim financial report was authorised for issue by the Board of Directors on 4 May 2015.
ASIC Class Order 98/100 applies to Westpac, and in accordance with that Class Order all amounts have been rounded to the nearest million dollars unless otherwise stated.
Critical accounting estimates and significant judgments
In preparing the interim financial report, the application of the Group’s accounting policies requires the use of judgments, estimates and assumptions.
This half, the Group has made a number of methodology changes to derivative valuations. This includes introducing a Funding Valuation Adjustment (FVA)1 to the fair value of derivatives. The impact of these changes resulted in a $122 million (pre-tax) charge which reduced non-interest income. This item impacted trading income and is reflected in the results of Westpac Institutional Bank.
Other than the above, the areas of judgment, estimates and assumptions in the interim financial report, including the key sources of estimation uncertainty, are consistent with those in the annual financial report for the year ended 30 September 2014.
Amendments to Accounting Standards that are effective this period
The following amendments were adopted during the period:
AASB 2012-3 Amendments to Australian Accounting Standards – Offsetting Financial Assets and Financial Liabilities
The amendment was applied by the Group from 1 October 2014 and adds application guidance to AASB 132 Financial Instruments: Presentation. It provides guidance to applying the offsetting criteria of AASB 132, including clarifying the definition of ‘currently has a legally enforceable right of set-off’ and that some gross settlement systems may be considered the equivalent to net settlement. The application of AASB 2012-3 has not resulted in any material changes to the netting of balances presented on the Group’s balance sheet.
1 Refer to Glossary.

Interim financial report 2015 Notes to the consolidated financial statements
Westpac Group 2015 Interim Results Announcement | 87
Note 1. Basis of preparation of interim financial report (continued)
Future developments in accounting standards
The following new standards and interpretations which may have a material impact on the Group have been issued but are not yet effective, and unless otherwise stated, have not been early adopted by the Group:
AASB 9 Financial Instruments (December 2014) will replace AASB 139 Financial Instruments: Recognition and Measurement. It includes a revised classification and measurement model, a forward looking ‘expected loss’ impairment model and modifies the approach to hedge accounting. Unless early adopted the standard is effective for the 30 September 2019 financial year end. The major changes under the standard are:
replaces the multiple classification and measurement models in AASB 139 with a single model that has two classification categories: amortised cost and fair value;
a financial asset is measured at amortised cost if two criteria are met: a) the objective of the business model is to hold the financial asset for the collection of the contractual cash flows, and b) the contractual cash flows under the instrument solely represent the payment of principal and interest;
if a financial asset is eligible for amortised cost measurement, an entity can elect to measure it at fair value if it eliminates or significantly reduces an accounting mismatch;
requires more timely recognition of expected credit losses using a three stage approach. For financial assets where there has been no significant increase in credit risk since origination a provision for 12 months expected credit losses is required. For financial assets where there has been a significant increase in credit risk or where the asset is credit impaired a provision for full lifetime expected losses is required;
interest is calculated on the gross carrying amount of a financial assets, except where the asset is credit impaired;
there will be no separation of an embedded derivative where the instrument is a financial asset;
equity instruments must be measured at fair value, however an entity can elect on initial recognition to present the fair value changes on non-trading equity investments directly in other comprehensive income. There is no subsequent recycling of fair value gains and losses to profit or loss; however dividends from such investments will continue to be recognised in profit or loss;
if an entity holds an investment in asset-backed securities (ABS) it must determine the classification of that investment by looking through to the underlying assets and assess the credit quality of the investment compared with the underlying portfolio of assets. If an entity is unable to look through to the underlying assets, then the investment must be measured at fair value;
where the fair value option is used for valuing financial liabilities the change in fair value relating to the entity’s own credit risk is presented in other comprehensive income, except where it would create an accounting mismatch. If such a mismatch is created or enlarged, all changes in fair value (including the effects of changes in the credit risk) is recognised in profit or loss. The Group early adopted this amendment from 1 October 2013; and
aligns hedge accounting more closely with risk management activities by increasing the eligibility of both hedged items and hedging instruments and introducing a more principles-based approach to assessing hedge effectiveness.
AASB 9 will impact the classification and measurement of the Group’s financial instruments when the remainder of the standard is adopted.
AASB 15 Revenue from Contracts with Customers was issued on 28 May 2014 and will be effective for the 30 September 2018 financial year. The standard provides a single comprehensive model for revenue recognition. It replaces AASB 118 Revenue and related interpretations. The application of AASB 15 is not expected to have a material impact on the Group.
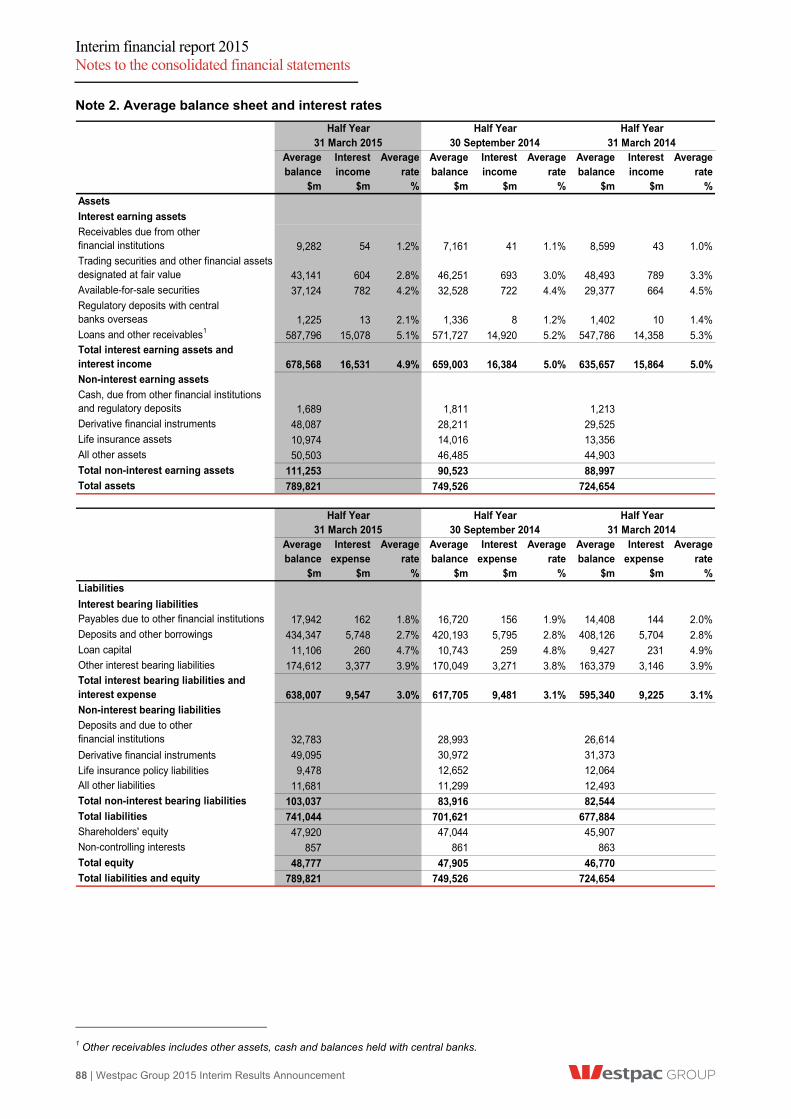
Interim financial report 2015 Notes to the consolidated financial statements
88 | Westpac Group 2015 Interim Results Announcement
Note 2. Average balance sheet and interest rates
Average Interest Average Average Interest Average Average Interest Average balance income rate balance income rate balance income rate $m $m % $m $m % $m $m %Assets
Interest earning assets
Receivables due from other financial institutions 9,282 54 1.2% 7,161 41 1.1% 8,599 43 1.0%Trading securities and other financial assets designated at fair value 43,141 604 2.8% 46,251 693 3.0% 48,493 789 3.3%Available-for-sale securities 37,124 782 4.2% 32,528 722 4.4% 29,377 664 4.5%Regulatory deposits with central banks overseas 1,225 13 2.1% 1,336 8 1.2% 1,402 10 1.4%Loans and other receivables1
587,796 15,078 5.1% 571,727 14,920 5.2% 547,786 14,358 5.3%Total interest earning assets and interest income 678,568 16,531 4.9% 659,003 16,384 5.0% 635,657 15,864 5.0%Non-interest earning assets
Cash, due from other financial institutions and regulatory deposits 1,689 1,811 1,213Derivative financial instruments 48,087 28,211 29,525Life insurance assets 10,974 14,016 13,356All other assets 50,503 46,485 44,903Total non-interest earning assets 111,253 90,523 88,997Total assets 789,821 749,526 724,654
Average Interest Average Average Interest Average Average Interest Average balance expense rate balance expense rate balance expense rate $m $m % $m $m % $m $m %Liabilities
Interest bearing liabilitiesPayables due to other financial institutions 17,942 162 1.8% 16,720 156 1.9% 14,408 144 2.0%Deposits and other borrowings 434,347 5,748 2.7% 420,193 5,795 2.8% 408,126 5,704 2.8%Loan capital 11,106 260 4.7% 10,743 259 4.8% 9,427 231 4.9%Other interest bearing liabilities 174,612 3,377 3.9% 170,049 3,271 3.8% 163,379 3,146 3.9%Total interest bearing liabilities and interest expense 638,007 9,547 3.0% 617,705 9,481 3.1% 595,340 9,225 3.1%Non-interest bearing liabilities
Deposits and due to other financial institutions 32,783 28,993 26,614
Derivative financial instruments 49,095 30,972 31,373
Life insurance policy liabilities 9,478 12,652 12,064All other liabilities 11,681 11,299 12,493Total non-interest bearing liabilities 103,037 83,916 82,544Total liabilities 741,044 701,621 677,884Shareholders' equity 47,920 47,044 45,907Non-controlling interests 857 861 863Total equity 48,777 47,905 46,770Total liabilities and equity 789,821 749,526 724,654
31 March 2015 30 September 2014
Half Year31 March 2014
Half Year Half Year31 March 2015 30 September 2014
Half Year Half Year Half Year31 March 2014
1 Other receivables includes other assets, cash and balances held with central banks.

Interim financial report 2015 Notes to the consolidated financial statements
Westpac Group 2015 Interim Results Announcement | 89
Note 3. Net interest income
% Mov't % Mov't
$mHalf Year March 15
Half Year Sept 14
Half Year March 14
Mar 15 - Sept 14
Mar 15 - Mar 14
Interest incomeCash and balances with central banks 120 121 104 (1) 15 Receivables due from other financial institutions 54 41 43 32 26 Net ineffectiveness on qualifying hedges (6) (36) (22) (83) (73) Trading securities and other financial assets designated at fair value 604 693 789 (13) (23) Available-for-sale securities 782 722 664 8 18 Loans 14,959 14,833 14,271 1 5 Regulatory deposits with central banks overseas 13 8 10 63 30 Other interest income 5 2 5 150 - Total interest income 16,531 16,384 15,864 1 4 Interest expensePayables due to other financial institutions (162) (156) (144) 4 13 Deposits and other borrowings (5,748) (5,795) (5,704) (1) 1 Trading liabilities (1,405) (1,280) (1,243) 10 13 Debt issues (1,915) (1,952) (1,861) (2) 3 Loan capital (260) (259) (231) - 13 Other interest expense (57) (39) (42) 46 36 Total interest expense (9,547) (9,481) (9,225) 1 3 Net interest income 6,984 6,903 6,639 1 5

Interim financial report 2015 Notes to the consolidated financial statements
90 | Westpac Group 2015 Interim Results Announcement
Note 4. Non-interest income
% Mov't % Mov't
$mHalf Year March 15
Half Year Sept 14
Half Year March 14
Mar 15 - Sept 14
Mar 15 - Mar 14
Fees and commissions
Facility fees 666 685 644 (3) 3
Transaction fees and commissions received 641 623 631 3 2
Other non-risk fee income 171 160 183 7 (7)
Total fees and commissions 1,478 1,468 1,458 1 1
Wealth management and insurance income
Life insurance and funds management net operating income11,059 1,010 990 5 7
General insurance and lenders mortgage insurance net operating income 87 142 112 (39) (22)
Total wealth management and insurance income 1,146 1,152 1,102 (1) 4
Trading income2
Foreign exchange income 323 256 274 26 18
Other trading products 102 215 272 (53) (63)
Total trading income 425 471 546 (10) (22)
Other income
Dividends received from other entities 7 6 5 17 40
Net gain on disposal of assets 15 44 53 (66) (72)
Net gain/(loss) on ineffective hedges 1 1 (1) - 200
Net gain/(loss) on hedging overseas operations (6) 8 4 (175) large
Net gain/(loss) on derivatives held for risk management purposes3(117) 44 (71) large 65
Net gain/(loss) on financial instruments designated at fair value (7) (12) (2) (42) large
Rental income on operating leases 23 20 12 15 92
Other 48 42 45 14 7
Total other income (36) 153 45 (124) (180)
Total non-interest income 3,013 3,244 3,151 (7) (4)
1 Wealth management and insurance income includes policyholder tax recoveries. 2 Trading income represents a component of total markets income from our WIB markets business, Westpac Pacific and Treasury
foreign exchange operations in Australia and New Zealand. 3 Income from derivatives held for risk management purposes reflects the impact of economic hedges of foreign currency capital and
earnings where hedge accounting is not achieved.
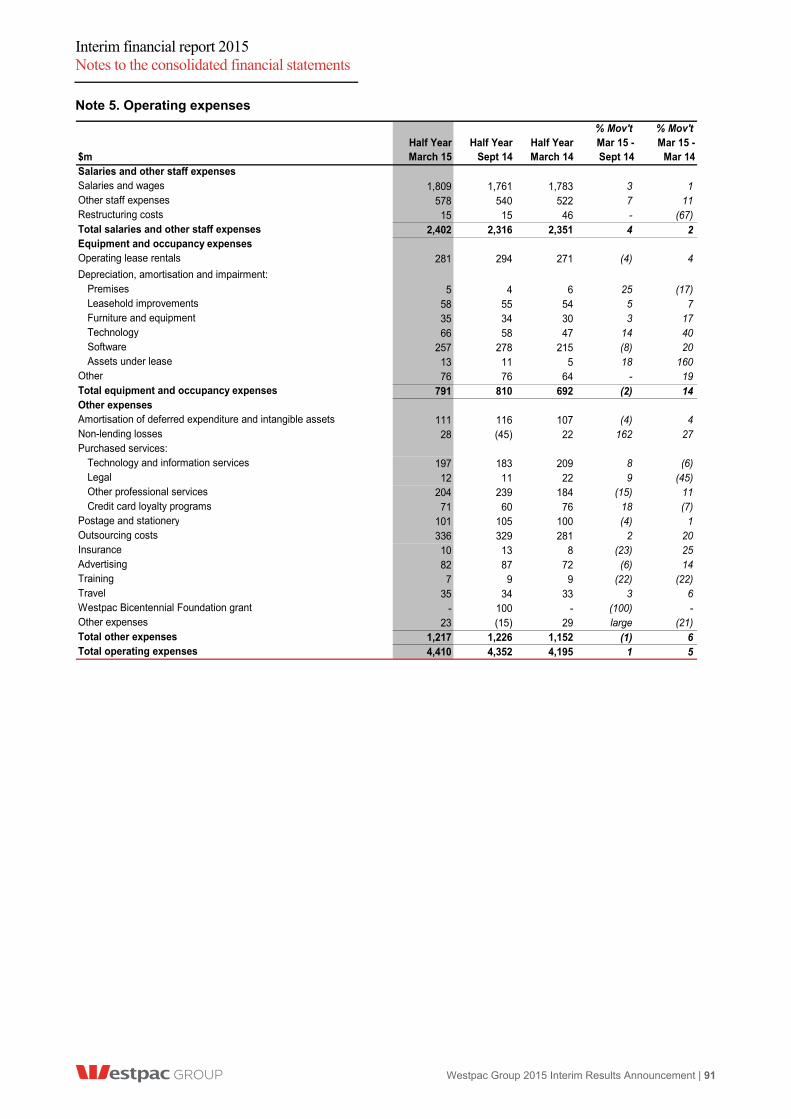
Interim financial report 2015 Notes to the consolidated financial statements
Westpac Group 2015 Interim Results Announcement | 91
Note 5. Operating expenses
% Mov't % Mov't
$mHalf Year March 15
Half Year Sept 14
Half Year March 14
Mar 15 - Sept 14
Mar 15 - Mar 14
Salaries and other staff expensesSalaries and wages 1,809 1,761 1,783 3 1Other staff expenses 578 540 522 7 11Restructuring costs 15 15 46 - (67)Total salaries and other staff expenses 2,402 2,316 2,351 4 2Equipment and occupancy expensesOperating lease rentals 281 294 271 (4) 4
Depreciation, amortisation and impairment:Premises 5 4 6 25 (17)Leasehold improvements 58 55 54 5 7Furniture and equipment 35 34 30 3 17Technology 66 58 47 14 40Software 257 278 215 (8) 20Assets under lease 13 11 5 18 160
Other 76 76 64 - 19Total equipment and occupancy expenses 791 810 692 (2) 14Other expensesAmortisation of deferred expenditure and intangible assets 111 116 107 (4) 4Non-lending losses 28 (45) 22 162 27Purchased services:
Technology and information services 197 183 209 8 (6)Legal 12 11 22 9 (45)Other professional services 204 239 184 (15) 11Credit card loyalty programs 71 60 76 18 (7)
Postage and stationery 101 105 100 (4) 1Outsourcing costs 336 329 281 2 20Insurance 10 13 8 (23) 25Advertising 82 87 72 (6) 14Training 7 9 9 (22) (22)Travel 35 34 33 3 6Westpac Bicentennial Foundation grant - 100 - (100) -Other expenses 23 (15) 29 large (21)Total other expenses 1,217 1,226 1,152 (1) 6Total operating expenses 4,410 4,352 4,195 1 5

Interim financial report 2015 Notes to the consolidated financial statements
92 | Westpac Group 2015 Interim Results Announcement
Note 6. Income tax
The income tax expense for the half year is reconciled to the profit before income tax as follows:
% Mov't % Mov't
$mHalf Year March 15
Half Year Sept 14
Half Year March 14
Mar 15 - Sept 14
Mar 15 - Mar 14
Profit before income tax 5,246 5,486 5,254 (4) -Prima facie income tax based on the Australian company tax rate of 30% 1,574 1,646 1,576 (4) -The effect of amounts which are not deductible/ (assessable) in calculating taxable income
Dividend adjustments 6 4 3 50 100
Life insurance:
Tax adjustment on policyholdersʼ earnings139 - 3 - large
Adjustment for life business tax rates (3) - (4) - (25)
Hybrid capital distributions224 20 16 20 50
Other non-assessable items (13) (10) (12) 30 8
Other non-deductible items 13 22 24 (41) (46)
Adjustment for overseas tax rates (14) (12) (10) 17 40
Income tax (over)/under provided in prior years (26) (13) (1) 100 large
Other items34 (137) - (103) -
Total income tax expense in the income statement 1,604 1,520 1,595 6 1
Effective income tax rate 30.6% 27.7% 30.4% large 22bps
1 In accordance with the requirements of AASB 1038, tax expense for 31 March 2015 includes a $55 million tax expense on
policyholders’ investment earnings (30 September 2014: nil, 31 March 2014: $5 million tax expense) of which $16 million is a prima facie tax expense (30 September 2014: nil, 31 March 2014: $2 million tax expense) and the balance of $39 million tax expense (30 September 2014: nil, 31 March 2014: $3 million tax expense) is shown here.
2 Reflects distributions on Westpac Convertible Preference Shares, Westpac Capital Notes and Westpac Capital Notes 2 which are not tax deductible.
3 Half Year Sept 2014 includes the release of provisions no longer required following the finalisation of prior period taxation matters.

Interim financial report 2015 Notes to the consolidated financial statements
Westpac Group 2015 Interim Results Announcement | 93
Note 7. Earnings per share
Basic earnings per share is calculated by dividing the net profit attributable to owners of Westpac by the weighted average number of ordinary shares on issue during the period, excluding the number of ordinary shares purchased by the Group and held as Treasury shares. Diluted earnings per share is calculated by adjusting the earnings and the weighted average number of ordinary shares outstanding to assume conversion of all dilutive potential ordinary shares.
Basic Diluted Basic Diluted Basic DilutedReconciliation of earnings used in the calculation of earnings per ordinary share ($m)
Net profit attributable to owners of Westpac Banking Corporation 3,609 3,609 3,939 3,939 3,622 3,622Restricted Share Plan (RSP) treasury shares distributions (2) - (6) - (4) -2004 Trust Preferred Securities (TPS 2004) distributions - 13 - 12 - 10Westpac stapled preferred securities II (SPS II) distributions - - - 10 - 14Westpac convertible preference shares (CPS) dividends - 25 - 25 - 24Westpac Capital Notes dividends - 28 - 28 - 28Westpac Capital Notes 2 distributions - 26 - 14 - -Net profit attributable to owners of Westpac Banking Corporation adjusted for the effect of dilution 3,607 3,701 3,933 4,028 3,618 3,698Weighted average number of ordinary shares (millions)
Weighted average number of ordinary shares 3,115 3,115 3,109 3,109 3,109 3,109Effect of own shares held (9) (9) (11) (11) (11) (11)Potential dilutive adjustment:
Exercise of options and share rights and vesting of restricted shares - 5 - 9 - 12Conversion of 2004 Trust Preferred Securities (TPS 2004) - 19 - 18 - 17Conversion of stapled preferred securities II (SPS II) - - - 23 - 27Conversion of convertible preference shares (CPS) - 31 - 36 - 35Conversion of Westpac Capital Notes - 36 - 42 - 41Conversion of Westpac Capital Notes 2 - 34 - 22 - -
Total weighted average number of ordinary shares 3,106 3,231 3,098 3,248 3,098 3,230Earnings per ordinary share (cents) 116.1 114.5 127.0 124.0 116.8 114.5
Half Year March 15 Half Year Sept 14 Half Year March 14

Interim financial report 2015 Notes to the consolidated financial statements
94 | Westpac Group 2015 Interim Results Announcement
Note 8. Loans
As at As at As at % Mov't % Mov't
$m Note31 March
201530 Sept
201431 March
2014Mar 15 - Sept 14
Mar 15 - Mar 14
AustraliaOverdrafts 2,391 2,589 2,789 (8) (14)Credit card outstandings 10,200 10,032 9,926 2 3Overnight and at call money market loans 19 26 55 (27) (65)Acceptance of finance 30,937 33,137 34,338 (7) (10)Term loans:
Housing 336,954 323,940 309,791 4 9Housing – line of credit 25,825 27,097 28,245 (5) (9)Total housing 362,779 351,037 338,036 3 7Non-housing 110,441 104,556 98,219 6 12
Finance leases 5,112 5,458 5,849 (6) (13)Margin lending 1,924 1,960 2,038 (2) (6)Trade finance 2,119 1,790 1,879 18 13Other 528 670 772 (21) (32)Total Australia 526,450 511,255 493,901 3 7 New ZealandOverdrafts 1,185 1,013 1,131 17 5Credit card outstandings 1,416 1,255 1,293 13 10Overnight and at call money market loans 1,725 1,400 1,352 23 28Term loans:
Housing 39,990 35,465 36,258 13 10Non-housing 21,377 18,888 19,603 13 9
Trade finance 342 289 262 18 31Other 191 160 164 19 16Total New Zealand 66,226 58,470 60,063 13 10 Other OverseasOverdrafts 159 161 147 (1) 8Term loans:
Housing 971 881 843 10 15Non-housing 8,605 6,515 5,934 32 45
Trade finance 5,767 6,147 7,098 (6) (19)Other 86 87 71 (1) 21Total Other Overseas 15,588 13,791 14,093 13 11 Total loans 608,264 583,516 568,057 4 7Provision on loans 9 (3,200) (3,173) (3,488) 1 (8)
Total net loans1 605,064 580,343 564,569 4 7
1 Total net loans include securitised loans of $12,149 million as at 31 March 2015 ($10,920 million as at 30 September 2014 and
$11,266 million as at 31 March 2014). The level of securitised loans excludes loans where Westpac is the holder of the related debt securities.

Interim financial report 2015 Notes to the consolidated financial statements
Westpac Group 2015 Interim Results Announcement | 95
Note 9. Provisions for impairment charges
$m Note
Half YearMarch 15
Half YearSept 14
Half YearMarch 14
Collectively assessed provisions
Balance at beginning of the period 2,614 2,652 2,585
Provisions raised 266 221 284
Write-offs (330) (371) (331)
Interest adjustment 98 98 91
Exchange rate and other adjustments 51 14 23
Closing balance 2,699 2,614 2,652
Individually assessed provisions
Balance at beginning of the period 867 1,139 1,364
Provisions raised 293 335 349
Write-backs (155) (189) (244)
Write-offs (204) (392) (314)
Interest adjustment (12) (11) (23)
Exchange rate and other adjustments 17 (15) 7
Closing balance 806 867 1,139
Total provisions for impairment charges on loans and credit commitments 3,505 3,481 3,791
Less: provisions for credit commitments (305) (308) (303)
Total provisions for impairment charges on loans 8 3,200 3,173 3,488
$mHalf YearMarch 15
Half YearSept 14
Half YearMarch 14
Reconciliation of impairment charges
Individually assessed provisions raised 293 335 349
Write-backs (155) (189) (244)
Recoveries (63) (58) (48)
Collectively assessed provisions raised/(released) 266 221 284
Impairment charges 341 309 341

Inte
rim
fina
ncia
l rep
ort 2
015
Not
es to
the
cons
olid
ated
fina
ncia
l sta
tem
ents
96 |
Wes
tpac
Gro
up 2
015
Inte
rim R
esul
ts A
nnou
ncem
ent
No
te 1
0. C
red
it q
ual
ity
Imp
aire
d lo
an
s
As
atA
s at
As
atA
s at
As
atA
s at
As
atA
s at
As
atA
s at
As
atA
s at
$m31
Mar
ch20
1530
Sep
t20
1431
Mar
ch20
1431
Mar
ch20
1530
Sep
t20
1431
Mar
ch20
1431
Mar
ch20
1530
Sep
t20
1431
Mar
ch20
1431
Mar
ch20
1530
Sep
t20
1431
Mar
ch20
14
No
n-P
erfo
rmin
g lo
ans:
Gro
ss a
mou
nt1,
281
1,58
02,
065
502
397
377
4753
105
1,83
02,
030
2,54
7
Impa
irmen
t pro
visi
ons1
(641
)(6
97)
(952
)(1
60)
(130
)(1
29)
(29)
(35)
(64)
(830
)(8
62)
(1,1
45)
Net
640
883
1,11
334
226
724
818
1841
1,00
01,
168
1,40
2
Res
tru
ctu
red
loan
s:
Gro
ss a
mou
nt25
3439
--
-3
5964
2893
103
Impa
irmen
t pro
visi
ons1
(12)
(23)
(23)
--
-(1
)(2
1)(2
0)(1
3)(4
4)(4
3)
Net
1311
16-
--
238
4415
4960
Ove
rdra
fts,
per
son
al lo
ans
and
rev
olv
ing
cre
dit
g
reat
er t
han
90
day
s p
ast
du
e:
Gro
ss a
mou
nt27
320
322
616
1316
11
129
021
724
3
Impa
irmen
t pro
visi
ons1
(172
)(1
32)
(142
)(1
1)(9
)(1
2)(1
)-
(1)
(184
)(1
41)
(155
)
Net
101
7184
54
4-
1-
106
7688
Tota
l im
pai
red
loan
s:
Gro
ss a
mou
nt1,
579
1,81
72,
330
518
410
393
5111
317
02,
148
2,34
02,
893
Impa
irmen
t pro
visi
ons1
(825
)(8
52)
(1,1
17)
(171
)(1
39)
(141
)(3
1)(5
6)(8
5)(1
,027
)(1
,047
)(1
,343
)
Net
754
965
1,21
334
727
125
220
5785
1,12
11,
293
1,55
0
Au
stra
liaTo
tal
Oth
er O
vers
eas
New
Zea
lan
d
1 I
nclu
des
indi
vidu
ally
ass
esse
d pr
ovis
ions
and
col
lect
ivel
y as
sess
ed p
rovi
sion
s on
impa
ired
loan
s.

Interim financial report 2015 Notes to the consolidated financial statements
Westpac Group 2015 Interim Results Announcement | 97
Note 10. Credit quality (continued)
Movement in gross impaired loans1
As at As at As at % Mov't % Mov't
$m31 March
201530 Sept
201431 March
2014Mar 15 - Sept 14
Mar 15 - Mar 14
Balance as at beginning of period 2,340 2,893 3,600 (19) (35)
New and increased 607 609 708 - (14)
Write-offs (534) (763) (645) (30) (17)
Returned to performing or repaid (726) (731) (1,179) (1) (38)
Portfolio managed - new/increased/returned/repaid 423 345 367 23 15
Exchange rate and other adjustments 38 (13) 42 large (10)
Balance as at period end 2,148 2,340 2,893 (8) (26)
Items past 90 days and not impaired
As at As at As at % Mov't % Mov't
$m31 March
201530 Sept
201431 March
2014Mar 15 - Sept 14
Mar 15 - Mar 14
Australia
Housing products 1,577 1,536 1,540 3 2
Other products 626 598 754 5 (17)
Total Australia 2,203 2,134 2,294 3 (4)
New Zealand
Housing products 105 71 76 48 38
Other products 71 14 24 large 196
Other overseas 22 22 18 - 22
Total overseas 198 107 118 85 68
Total 2,401 2,241 2,412 7 -
1 Movement represents a six month period.

Interim financial report 2015 Notes to the consolidated financial statements
98 | Westpac Group 2015 Interim Results Announcement
Note 11. Deposits and other borrowings
As at As at As at % Mov't % Mov't
$m31 March
201530 Sept
201431 March
2014Mar 15 - Sept 14
Mar 15 - Mar 14
AustraliaCertificates of deposit 30,889 35,481 32,047 (13) (4)
At call and term depositsNon-interest bearing, repayable at call 29,197 25,773 23,167 13 26Other interest bearing:
At call 196,292 187,904 178,755 4 10Term 128,352 133,972 127,447 (4) 1
Total at call and term deposits 353,841 347,649 329,369 2 7Total Australia 384,730 383,130 361,416 - 6
New ZealandCertificates of deposit 1,428 1,031 1,225 39 17
At call and term depositsNon-interest bearing, repayable at call 3,770 3,217 3,242 17 16Other interest bearing:
At call 22,102 18,418 19,147 20 15Term 24,559 22,500 22,955 9 7
Total at call and term deposits 50,431 44,135 45,344 14 11Total New Zealand 51,859 45,166 46,569 15 11
Other overseasCertificates of deposit 14,175 15,065 15,242 (6) (7)
At call and term depositsNon-interest bearing, repayable at call 1,105 914 798 21 38Other interest bearing:
At call 1,632 1,694 1,727 (4) (6)Term 13,242 14,853 11,653 (11) 14
Total at call and term deposits 15,979 17,461 14,178 (8) 13Total other overseas 30,154 32,526 29,420 (7) 2Total deposits and other borrowings 466,743 460,822 437,405 1 7Deposits and other borrowings at fair value 44,570 49,636 48,044 (10) (7)Deposits and other borrowings at amortised cost 422,173 411,186 389,361 3 8
Total deposits and other borrowings 466,743 460,822 437,405 1 7
Interim financial report 2015 Notes to the consolidated financial statements
Westpac Group 2015 Interim Results Announcement | 99
Note 12. Share capital
The total number of ordinary shares on issue as at 31 March 2015 by Westpac Banking Corporation was 3,120,176,969 (30 September 2014: 3,109,048,309, 31 March 2014: 3,109,048,309), of which 4,449,336 ordinary shares are Restricted Share Plan (RSP) treasury shares (30 September 2014: 6,327,116, 31 March 2014: 6,413,486) and 5,727,919 ordinary shares are other treasury shares (30 September 2014: 5,121,966, 31 March 2014: 5,167,593).
During the half year ended 31 March 2015, 11,128,660 ordinary shares were issued to equity holders in relation to the DRP at a price of $32.68.
During the half year ended 31 March 2015, 4,682,186 ordinary shares were purchased:
823,869 ordinary shares at an average price of $32.77 and delivered to eligible staff under the Employee Share Plan (ESP);
1,982,350 ordinary shares at an average price of $32.84 and allocated to employees under the RSP for nil consideration;
160,443 ordinary shares at an average price of $37.42 and delivered to employees upon the exercise of options under the Westpac Performance Plan (WPP) at an average exercise price of $22.40;
303,323 ordinary shares at an average price of $33.42 and delivered to employees upon the exercise of share rights under the WPP for nil consideration;
375,246 ordinary shares at an average price of $36.40 and delivered to employees upon the exercise of options under the Westpac Reward Plan (WRP) at an average exercise price of $27.36;
839,107 ordinary shares at an average price of $34.75 and delivered to employees upon the exercise of share rights under the WRP for nil consideration;
197,848 ordinary shares at an average price of $34.33 and delivered to CEO upon exercise of share rights under the Chief Executive Officer Performance Plan (CEOPP) for nil consideration; and
the purchase of existing ordinary shares in respect of employee share plans resulted in a tax benefit of $9.5 million being recognised as contributed equity.
Note 13. Fair values of financial assets and liabilities
Fair Valuation Control Framework
The Group’s control environment uses a well-established Fair Valuation Control Framework so that fair value is either determined or validated by a function independent of the party that undertakes the transaction. This framework formalises the policies and procedures used by the Group to achieve compliance with relevant accounting, industry and regulatory standards. The framework includes specific controls relating to the revaluation of financial instruments, independent price verification, fair value adjustments and financial reporting.
A key element of the Fair Valuation Control Framework is the WIB Revaluation Committee, comprising senior finance and risk valuation experts from within the Group. The WIB Revaluation Committee review the application of the agreed policies and procedures to ensure a fair value measurement basis is applied.
The method of determining fair value according to the Fair Valuation Control Framework differs depending on the information available.
Quoted price in an active market
The best evidence of fair value is a quoted price in an active market. Wherever possible the Group determines the fair value of a financial instrument based on the quoted price.
Valuation techniques
Where no direct quoted price in an active market is available, the Group applies present value estimates or other market accepted valuation techniques. The use of a market accepted valuation technique will typically involve the use of a valuation model and appropriate inputs to the model.
The majority of models used by the Group employ only observable market data as inputs. However, for certain financial instruments data may be employed which is not readily observable in current markets. Typically in these instances valuation inputs will be derived using alternative means (including extrapolation from other relevant market data) and tested against historic transactions. The use of these inputs requires a high degree of management judgment.

Interim financial report 2015 Notes to the consolidated financial statements
100 | Westpac Group 2015 Interim Results Announcement
Note 13. Fair values of financial assets and liabilities (continued)
In order to determine a reliable fair value for a financial instrument, where appropriate, management may apply adjustments to the techniques used above. These adjustments reflect the Group’s assessment of factors that market participants would consider in setting the fair value.
In determining the fair value of derivatives, the Group adjusts the mid-market valuations produced by derivative pricing models to the appropriate exit price valuation. These adjustments incorporate bid/offer spreads, credit valuation adjustments and funding valuation adjustments.
This half the Group has made a number of methodology changes to derivative valuations. This includes introducing a Funding Valuation Adjustment (FVA) to the fair valuation of derivatives. FVA represents an estimate of the adjustment to fair value that a market participant would make to incorporate funding costs and benefits that arise in relation to uncollateralised derivative positions.
Fair value hierarchy
The Group categorises all fair value instruments according to the following hierarchy:
Level 1
Financial instruments valued using recent unadjusted quoted prices in active markets for identical assets or liabilities. An active market is one in which prices are readily and regularly available and those prices represent actual and regularly occurring market transactions on an arm’s length basis.
Valuation of Level 1 instruments require little or no management judgment.
Financial instruments included in this class are Commonwealth of Australia and New Zealand Government bonds, spot and exchange traded derivatives for equities, foreign exchange, commodities and interest rate products.
Level 2
Valuation techniques utilising observable market prices applied to these assets or liabilities include the use of market standard discounting methodologies, option pricing models and other valuation techniques widely used and accepted by market participants.
The financial instruments included in this category are mainly over the counter (OTC) derivatives with observable market inputs and financial instruments with fair value derived from consensus pricing with sufficient contributors. Financial instruments included in the Level 2 category are:
- trading securities – including government bonds (excluding Australian and New Zealand government bonds), Australian state government bonds, corporate fixed rate bonds and floating rate bonds; and
- derivatives – including interest rate swaps, credit default swaps, foreign exchange swaps, foreign exchange options and equity options.
Level 3
Financial instruments valued using at least one input that could have a significant effect on the instrument’s valuation which is not based on observable market data (unobservable input). Unobservable inputs are those not readily available in an active market due to illiquidity or complexity of the product. These inputs are generally derived and extrapolated from other relevant market data and calibrated against current market trends and historic transactions.
These valuations are calculated using a high degree of management judgment.
Financial instruments included in the Level 3 category include some asset-backed products and non-Australian dollar-denominated government securities issued by governments where there are no observable secondary markets.
A financial instrument’s categorisation within the valuation hierarchy is based on the lowest level input that is significant to the fair value measurement.
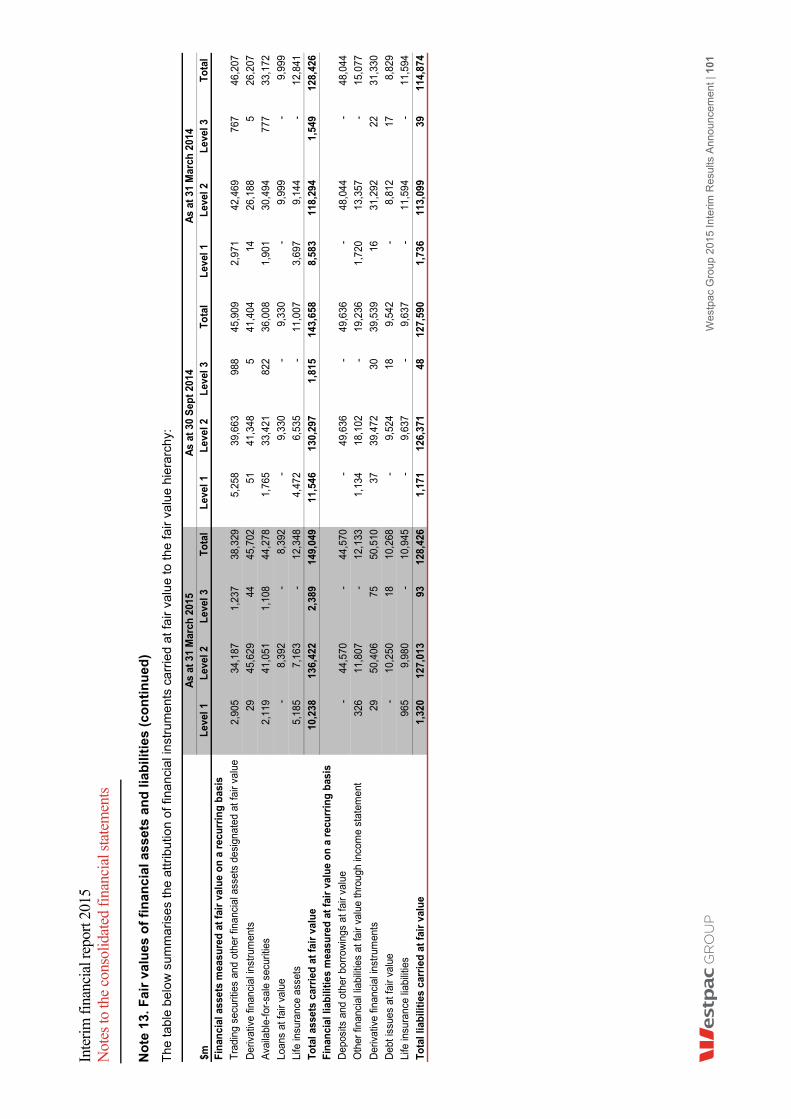
Inte
rim
fina
ncia
l rep
ort 2
015
Not
es to
the
cons
olid
ated
fina
ncia
l sta
tem
ents
Wes
tpac
Gro
up 2
015
Inte
rim R
esul
ts A
nnou
ncem
ent |
10
1
No
te 1
3. F
air
valu
es o
f fi
nan
cial
ass
ets
and
liab
iliti
es (
con
tin
ued
)
The
tabl
e be
low
sum
mar
ises
the
attr
ibut
ion
of fi
nanc
ial i
nst
rum
ents
car
ried
at fa
ir va
lue
to th
e fa
ir va
lue
hier
arch
y:
$mL
evel
1L
evel
2L
evel
3To
tal
Lev
el 1
Lev
el 2
Lev
el 3
Tota
lL
evel
1L
evel
2L
evel
3To
tal
Fin
anci
al a
sset
s m
easu
red
at
fair
val
ue
on
a r
ecu
rrin
g b
asis
Tra
ding
sec
uriti
es a
nd o
ther
fina
ncia
l ass
ets
desi
gnat
ed a
t fai
r va
lue
2,90
534
,187
1,23
738
,329
5,25
839
,663
988
45,9
092,
971
42,4
6976
746
,207
Der
ivat
ive
finan
cial
inst
rum
ents
2945
,629
4445
,702
5141
,348
541
,404
1426
,188
526
,207
Ava
ilabl
e-fo
r-sa
le s
ecur
ities
2,11
941
,051
1,10
844
,278
1,76
533
,421
822
36,0
081,
901
30,4
9477
733
,172
Loan
s at
fair
valu
e-
8,39
2-
8,39
2-
9,33
0-
9,33
0-
9,99
9-
9,99
9
Life
insu
ranc
e as
sets
5,18
57,
163
-12
,348
4,47
26,
535
-11
,007
3,69
79,
144
-12
,841
Tota
l ass
ets
carr
ied
at
fair
val
ue
10,2
3813
6,42
22,
389
149,
049
11,5
4613
0,29
71,
815
143,
658
8,58
311
8,29
41,
549
128,
426
Fin
anci
al li
abili
ties
mea
sure
d a
t fa
ir v
alu
e o
n a
rec
urr
ing
bas
is
Dep
osits
and
oth
er b
orro
win
gs a
t fai
r va
lue
-44
,570
-44
,570
-49
,636
-49
,636
-48
,044
-48
,044
Oth
er fi
nanc
ial l
iabi
litie
s at
fair
valu
e th
roug
h in
com
e st
atem
ent
326
11,8
07-
12,1
331,
134
18,1
02-
19,2
361,
720
13,3
57-
15,0
77
Der
ivat
ive
finan
cial
inst
rum
ents
2950
,406
7550
,510
3739
,472
3039
,539
1631
,292
2231
,330
Deb
t iss
ues
at fa
ir va
lue
-10
,250
1810
,268
-9,
524
189,
542
-8,
812
178,
829
Life
insu
ranc
e lia
bilit
ies
965
9,98
0-
10,9
45-
9,63
7-
9,63
7-
11,5
94-
11,5
94
Tota
l lia
bili
ties
car
ried
at
fair
val
ue
1,32
012
7,01
393
128,
426
1,17
112
6,37
148
127,
590
1,73
611
3,09
939
114,
874
As
at 3
1 M
arch
201
5A
s at
30
Sep
t 20
14A
s at
31
Mar
ch 2
014
Interim financial report 2015 Notes to the consolidated financial statements
102 | Westpac Group 2015 Interim Results Announcement
Note 13. Fair values of financial assets and liabilities (continued)
Analysis of movements between Fair Value Hierarchy Levels
During the period there were no material transfers between levels of the fair value hierarchy.
The table below summarises the changes in financial instruments carried at fair value derived from non-market observable valuation techniques (Level 3):
$m Derivatives
Available-for-Sale
Securities Total
Assets Derivatives
Debt Issuesat Fair Value
Total Liabilities
Balance as at 1 October 2014 988 5 822 1,815 30 18 48
Gains/(losses) on assets/(gains)/losses on liabilities recognised in:
Income statements 29 14 - 43 87 - 87Available-for-sale reserve - - 3 3 - - -
Acquisitions 272 7 505 784 - - -Issues 6 - - 6 - - -Disposals (117) (1) (16) (134) - - -Settlements (23) - (282) (305) (55) - (55)Transfers into or out ofnon-market observables 13 19 - 32 13 - 13Foreign currency translation impacts 69 - 76 145 - - -Balance as at 31 March 2015 1,237 44 1,108 2,389 75 18 93
Unrealised gains/(losses) recognised in the income statement for financial instrument held as at 31 March 2015 20 12 - 32 44 1 45
Trading Securities and Other Financial Assets
Designated at Fair Value
Half Year March 15
Transfers into and out of Level 3 have occurred due to changes in observability in the significant inputs into the valuation models used to determine the fair value of the related financial instruments. Transfers in and transfers out are reported using the end of period fair values.
Significant unobservable inputs
Sensitivities to reasonably possible changes in non-market observable valuation assumptions would not have a material impact on the Group’s reported results.
The following table summarises significant unobservable inputs used in the Level 3 valuations and the valuation techniques used to measure fair value of the instrument.
Range of Inputs
$m Assets Liabilities Valuation Technique(s)
Significant Unobservable Inputs
Minimum Value
Maximum Value
1,254 - Pricing model Yield to maturity 4.7% 8.0%Pricing model Discount margin 70 bps 105 bpsThird-party pricing n/a - -
Asset backed products 730 18 Pricing model Discount margin 76 bps 171 bpsPricing model Correlation 44.0% 55.3%Third-party pricing n/a n/a n/a
361 - Pricing model Interest rate margin 1.6% 15.9%Pricing model Earnings multiple 2 7.5Discounted cash flows Discount rate 14.5% 20.0%Third-party pricing n/a n/a n/a
Derivatives 44 75 Pricing Model Volatility 39.8% 56.9%Total 2,389 93
Non-asset backed debt instruments
Equity and equity linked products
As at 31 March 2015
Interim financial report 2015 Notes to the consolidated financial statements
Westpac Group 2015 Interim Results Announcement | 103
Note 13. Fair values of financial assets and liabilities (continued)
Day one profit or loss
Where the fair value of a financial instrument at initial recognition is determined using unobservable data that is significant to its valuation, the difference between the transaction price and the valuation (‘day one’ profit or loss) is recognised in the income statement when the inputs become observable, or over the life of the instrument. The closing balance of unrecognised day one profit for the period was $6 million (30 September 2014: $6 million profit).
Financial instruments not measured at fair value
The following table summarises the estimated fair value and fair value hierarchy of financial instruments not measured at fair value for the Group:
As at 31 March 2015 As at 30 Sept 2014 As at 31 March 2014
$mCarrying Amount Fair Value
Carrying Amount Fair Value
Carrying Amount Fair Value
Financial assets not measured at fair valueCash and balances with central banks 14,738 14,738 25,760 25,760 16,375 16,375Receivables due from other financial institutions 13,637 13,637 7,424 7,424 8,744 8,744Available-for-sale securities 18 18 16 16 13 13Loans 596,672 597,380 571,013 571,273 554,570 554,878Regulatory deposits with central banks overseas 1,306 1,306 1,528 1,528 1,575 1,575Other financial assets 3,910 3,910 5,093 5,093 3,388 3,388Total financial assets not measured at fair value 630,281 630,989 610,834 611,094 584,665 584,973Financial liabilities not measured at fair valuePayables due to other financial institutions 15,421 15,421 18,636 18,636 15,211 15,211Deposits and other borrowings 422,173 422,910 411,186 411,832 389,361 390,225Debt issues 157,883 159,366 142,709 144,337 141,269 143,409Loan capital 11,905 11,897 10,858 10,858 10,320 10,396Other financial liabilities 6,563 6,563 6,852 6,852 7,292 7,292Total financial liabilities not measured at fair value 613,945 616,157 590,241 592,515 563,453 566,533
A detailed description of how fair value is derived for financial instruments not measured at fair value is disclosed in Note 28 of the Group’s annual financial statements for the year ended 30 September 2014.
Note 14. Group segment information
Segment results are presented on a basis that is consistent with information provided internally to Westpac’s key decision makers.
In assessing financial performance, including divisional results, the Westpac Group uses a measure of performance referred to as ‘cash earnings’.
Cash earnings is not a measure of cash flow or net profit determined on a cash accounting basis, as it includes non-cash items reflected in net profit determined in accordance with AAS. The specific adjustments include both cash and non-cash items. Cash earnings, as calculated by Westpac, is viewed as a measure of the level of profit that is generated by ongoing operations and is therefore available for distribution to shareholders.
The basis of segment reporting reflects the management of the business, rather than the legal structure of the Group. The operating segment results have been presented on a management reporting basis and consequently internal charges and transfer pricing adjustments have been reflected in the performance of each operating segment. Inter-segment pricing is determined on an arm’s length basis.
In February 2015 following the appointment of Brian Hartzer as Chief Executive Officer, the Australian Financial Services segment was discontinued. The three businesses which comprised this segment being Westpac Retail & Business Banking, St.George Banking Group and BT Financial Group (Australia) are now individual reportable segments. A detailed description of each business and individual cash earnings adjustment is disclosed in Note 33 of the Group’s annual financial statements for the year ended 30 September 2014.
Prior period comparatives were restated during the half year ended 31 March 2015 for the following business structure transfers:
Private Bank Asia operations undertaken in Westpac Institutional Bank (WIB) to Westpac Retail & Business Banking (Westpac RBB);
Relationship management of a number of clients from WIB to Westpac RBB; and
BankSA general insurance activities from St.George to BT Financial Group (Australia).

Interim financial report 2015 Notes to the consolidated financial statements
104 | Westpac Group 2015 Interim Results Announcement
Note 14. Group segment information (continued)
The tables below present the segment results on a cash earnings basis for the Group:
$m
Westpac Retail &
Business Banking
St.George Banking
Group
BT Financial
Group (Australia)
Westpac Institutional
Bank
Westpac New
Zealand (A$)
Other Divisions Group
Net interest income 3,100 1,840 216 836 779 163 6,934Non-interest income 735 273 1,124 670 229 55 3,086Net operating income before operatingexpenses and impairment charges 3,835 2,113 1,340 1,506 1,008 218 10,020Operating expenses (1,685) (801) (668) (624) (408) (68) (4,254)Impairment charges (221) (116) 4 22 (30) - (341)Profit before income tax 1,929 1,196 676 904 570 150 5,425Income tax expense (579) (359) (204) (280) (156) (35) (1,613)Net profit attributable to non-controlling interests - - (21) - (1) (12) (34)Cash earnings for the period 1,350 837 451 624 413 103 3,778Net cash earnings adjustments - (63) (10) - - (96) (169)Net profit for the period attributable to owners of Westpac Banking Corporation 1,350 774 441 624 413 7 3,609Total assets 284,180 180,689 34,500 124,212 74,977 97,403 795,961Total liabilities 179,474 95,826 36,728 127,502 65,917 240,197 745,644
Half Year March 15
$m
Westpac Retail &
Business Banking
St.George Banking
Group
BT Financial
Group (Australia)
Westpac Institutional
Bank
Westpac New
Zealand (A$)
Other Divisions Group
Net interest income 3,039 1,826 203 838 741 172 6,819Non-interest income 730 264 1,135 725 221 67 3,142Net operating income before operatingexpenses and impairment charges 3,769 2,090 1,338 1,563 962 239 9,961Operating expenses (1,656) (812) (653) (599) (391) (70) (4,181)Impairment charges (210) (128) (2) 45 (21) 7 (309)Profit before income tax 1,903 1,150 683 1,009 550 176 5,471Income tax expense (573) (344) (210) (292) (151) (17) (1,587)Net profit attributable to non-controlling interests - - (14) - (2) (12) (28)Cash earnings for the period 1,330 806 459 717 397 147 3,856Net cash earnings adjustments - (66) (11) - - 160 83Net profit for the period attributable to owners of Westpac Banking Corporation 1,330 740 448 717 397 307 3,939Total assets 276,648 175,302 31,803 118,892 65,874 102,323 770,842Total liabilities 176,281 94,818 34,288 130,178 57,568 228,372 721,505
Half Year Sept 14 (Restated)

Interim financial report 2015 Notes to the consolidated financial statements
Westpac Group 2015 Interim Results Announcement | 105
Note 14. Group segment information (continued)
$m
Westpac Retail &
Business Banking
St.George Banking
Group
BT Financial
Group (Australia)
Westpac Institutional
Bank
Westpac New
Zealand (A$)
Other Divisions Group
Net interest income 2,914 1,705 203 820 714 321 6,677Non-interest income 711 251 1,122 745 217 136 3,182Net operating income before operatingexpenses and impairment charges 3,625 1,956 1,325 1,565 931 457 9,859Operating expenses (1,610) (747) (670) (575) (385) (78) (4,065)Impairment charges (226) (108) 4 90 (3) (98) (341)Profit before income tax 1,789 1,101 659 1,080 543 281 5,453Income tax expense (536) (332) (193) (330) (149) (103) (1,643)Net profit attributable to non-controlling interests - - (25) - (1) (12) (38)Cash earnings for the period 1,253 769 441 750 393 166 3,772Net cash earnings adjustments - (59) (11) - - (80) (150)Net profit for the period attributable to owners of Westpac Banking Corporation 1,253 710 430 750 393 86 3,622Total assets 268,345 169,490 28,802 105,661 66,880 90,197 729,375Total liabilities 167,094 90,257 29,638 114,773 58,750 220,832 681,344
Half Year March 14 (Restated)
Reconciliation of reported results to cash earnings
% Mov't % Mov't
$mHalf YearMarch 15
Half YearSept 14
Half YearMarch 14
Mar 15 -Sept 14
Mar 15 - Mar 14
NET PROFIT ATTRIBUTABLE TO OWNERS OF WESTPAC BANKING CORPORATION 3,609 3,939 3,622 (8) -
Treasury shares 37 (6) 13 large 185
Ineffective hedges (1) 29 17 (103) (106)
Fair value on economic hedges 26 (151) 46 117 (43)
Buyback of government guaranteed debt (1) (12) (30) (92) (97)
Fair value amortisation of financial instruments - 8 9 (100) (100)
Amortisation of intangible assets 73 77 70 (5) 4
Acquisition transaction and integration expenses 35 26 25 35 40
Bell litigation provision - (54) - (100) -
Westpac Bicentennial Foundation grant - 70 - (100) -
Prior period tax provisions - (70) - (100) -
Total cash earnings adjustments (post-tax) 169 (83) 150 large 13
Cash earnings 3,778 3,856 3,772 (2) -

Interim financial report 2015 Notes to the consolidated financial statements
106 | Westpac Group 2015 Interim Results Announcement
Note 15. Notes to the consolidated cash flow statement1
% Mov't % Mov't
$mHalf Year March 15
Half Year Sept 14
Half Year March 14
Mar 15 - Sept 14
Mar 15 - Mar 14
Reconciliation of net cash provided by/(used in) operating activities to net profit for the periodNet profit for the period 3,642 3,966 3,659 (8) -Adjustments:
Depreciation, amortisation and impairment 545 556 464 (2) 17(Decrease)/Increase in sundry provisions and other non-cash items (264) 182 (612) large 57Impairment charges 404 367 389 10 4(Increase)/decrease in accrued interest receivable (59) 25 (89) large (34)(Decrease)/increase in accrued interest payable (84) (2) (51) large 65(Decrease)/increase in current and deferred tax (179) 377 (45) (147) large(Increase)/decrease in trading securities and other financial assets designated at fair value 10,103 (1,869) 3,593 large 181(Increase)/decrease in loans (18,788) (18,056) (17,678) 4 6Decrease/(increase) in receivables due from other financial institutions (5,350) 1,464 2,468 large large(Increase)/decrease in regulatory deposits with central banks overseas 372 132 (6) 182 largeDecrease/(increase) in derivative financial instruments 10,249 (4,266) 937 large large(Increase)/decrease in other assets (218) 202 (81) large 169Increase/(decrease) in other financial liabilities at fair value through income statement (7,166) 4,239 4,840 large largeIncrease/(decrease) in deposits and other borrowings 101 23,976 10,253 (100) (99)Increase/(decrease) in payables due to other financial institutions (3,757) 3,220 6,199 large (161)Increase/(decrease) in other liabilities (64) (111) (271) (42) (76)
Net cash provided by/(used in) operating activities (10,513) 14,402 13,969 (173) (175)Fair value of assets and liabilities of controlled entities and
businesses acquired2
Assets acquired: Cash and cash equivalents - - 149 - (100) Derivative assets - - 30 - (100) Loans and advances - - 7,895 - (100) Identifiable intangible assets - - 56 - (100) Operating lease assets - - 80 - (100) Other assets and prepayments - - 6 - (100)Total assets acquired - - 8,216 - (100)Liabilities acquired: Trade creditors and other accrued expenses - - 24 - (100) Provisions - - 11 - (100) Deferred tax liabilities - - 25 - (100) Debt securities on issue - - 488 - (100) Borrowings - - 6,368 - (100)Total liabilities acquired - - 6,916 - (100)Fair value of identifiable net assets acquired - - 1,300 - (100)Goodwill - - 225 - (100)Total - - 1,525 - (100)Cash considerationPurchase of shares - - 1,525 - (100)Replacement of intergroup funding - - 6,368 - (100)Total cash consideration - - 7,893 - (100)Cash consideration - - 7,893 - (100)Less cash and cash equivalents acquired - - (149) - (100)Cash paid (net of cash acquired) - - 7,744 - (100)
1 The presentation of the consolidated cash flow statement has been revised this period to better reflect the nature of our business.
Certain cash flows have been reclassified between operating activities, and we have revised comparatives for Half Year March 14 and Half Year Sept 14 in order to ensure consistency. These changes have had no impact on the reported net increase/decrease in cash and cash equivalents.
2 Refers to the acquisition of select Australian businesses of Lloyds Banking Group. During the half year the acquisition accounting has been finalised with two adjustments made to the provisional accounting. The net impact of the two items is to increase goodwill by $2 million. Comparatives have not been revised as these adjustments were immaterial.
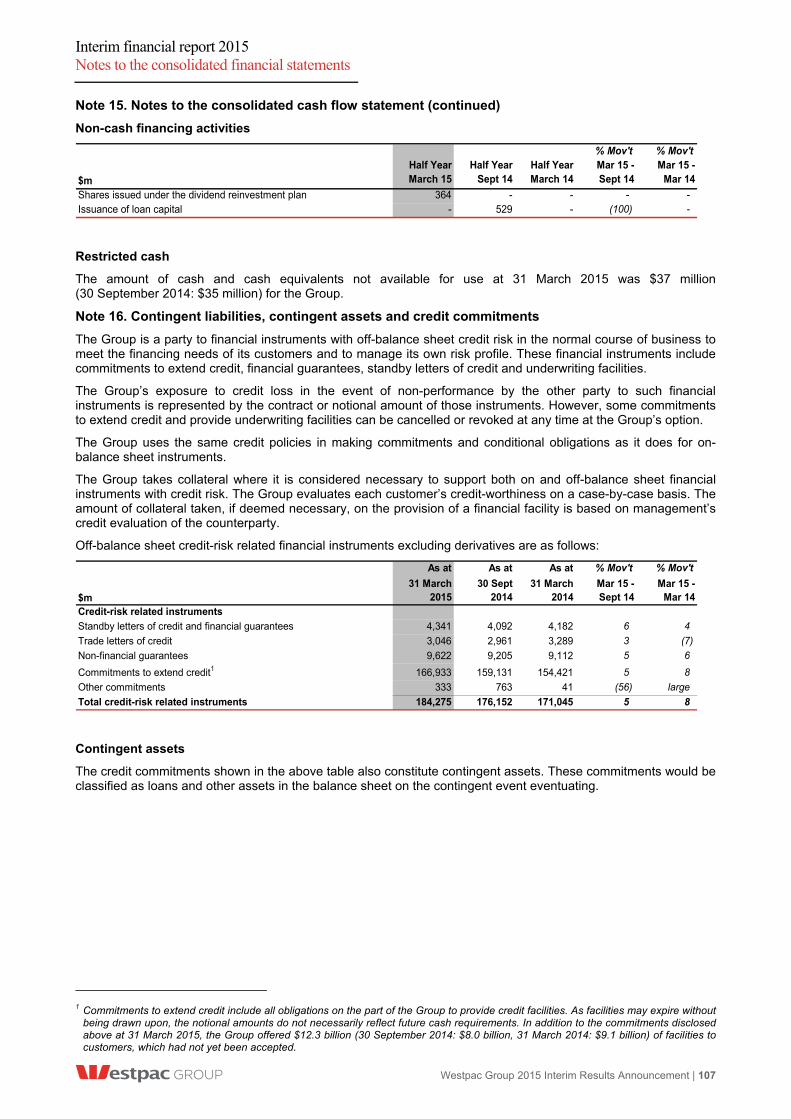
Interim financial report 2015 Notes to the consolidated financial statements
Westpac Group 2015 Interim Results Announcement | 107
Note 15. Notes to the consolidated cash flow statement (continued)
Non-cash financing activities
% Mov't % Mov't
$m
Half Year March 15
Half Year Sept 14
Half Year March 14
Mar 15 - Sept 14
Mar 15 - Mar 14
Shares issued under the dividend reinvestment plan 364 - - - -Issuance of loan capital - 529 - (100) -
Restricted cash
The amount of cash and cash equivalents not available for use at 31 March 2015 was $37 million (30 September 2014: $35 million) for the Group.
Note 16. Contingent liabilities, contingent assets and credit commitments
The Group is a party to financial instruments with off-balance sheet credit risk in the normal course of business to meet the financing needs of its customers and to manage its own risk profile. These financial instruments include commitments to extend credit, financial guarantees, standby letters of credit and underwriting facilities.
The Group’s exposure to credit loss in the event of non-performance by the other party to such financial instruments is represented by the contract or notional amount of those instruments. However, some commitments to extend credit and provide underwriting facilities can be cancelled or revoked at any time at the Group’s option.
The Group uses the same credit policies in making commitments and conditional obligations as it does for on-balance sheet instruments.
The Group takes collateral where it is considered necessary to support both on and off-balance sheet financial instruments with credit risk. The Group evaluates each customer’s credit-worthiness on a case-by-case basis. The amount of collateral taken, if deemed necessary, on the provision of a financial facility is based on management’s credit evaluation of the counterparty.
Off-balance sheet credit-risk related financial instruments excluding derivatives are as follows:
As at As at As at % Mov't % Mov't
$m31 March
201530 Sept
201431 March
2014Mar 15 - Sept 14
Mar 15 - Mar 14
Credit-risk related instruments
Standby letters of credit and financial guarantees 4,341 4,092 4,182 6 4
Trade letters of credit 3,046 2,961 3,289 3 (7)
Non-financial guarantees 9,622 9,205 9,112 5 6
Commitments to extend credit1 166,933 159,131 154,421 5 8
Other commitments 333 763 41 (56) large
Total credit-risk related instruments 184,275 176,152 171,045 5 8
Contingent assets
The credit commitments shown in the above table also constitute contingent assets. These commitments would be classified as loans and other assets in the balance sheet on the contingent event eventuating.
1 Commitments to extend credit include all obligations on the part of the Group to provide credit facilities. As facilities may expire without
being drawn upon, the notional amounts do not necessarily reflect future cash requirements. In addition to the commitments disclosed above at 31 March 2015, the Group offered $12.3 billion (30 September 2014: $8.0 billion, 31 March 2014: $9.1 billion) of facilities to customers, which had not yet been accepted.

Interim financial report 2015 Notes to the consolidated financial statements
108 | Westpac Group 2015 Interim Results Announcement
Note 16. Contingent liabilities, contingent assets and credit commitments (continued)
Additional liabilities and commitments
Litigation
Contingent liabilities exist in respect of actual and potential claims and proceedings. An assessment of the Group’s likely loss has been made on a case-by-case basis for the purpose of the financial statements and specific provisions have been made where appropriate.
Since 2011, Westpac has been served with three class action proceedings brought on behalf of customers seeking to recover exception fees paid by those customers. Similar class actions have been commenced against several other Australian banks. Westpac has agreed with the plaintiffs to put the proceedings against Westpac on hold until at least June 2015, pending further developments in the litigation against one of those other banks. In April 2015, the Full Court of the Federal Court found all of the exception fees charged by that other bank to be lawful. IMF Bentham Limited, the litigation company that is funding the proceedings, has stated that this decision is likely to be the subject of an application for special leave to appeal to the High Court of Australia.
Westpac has been served with a class action proceeding brought on behalf of Westpac customers who borrowed money to invest in Storm Financial-badged investments. Westpac intends to defend these proceedings. As the two named applicants have not quantified the damages that they seek, and given the preliminary nature of these proceedings, it is not possible to estimate any potential liability at this stage.
Financial Claims Scheme
Under the Financial Claims Scheme (FCS) the Australian Government provides depositors a free guarantee of deposits in eligible ADIs up to and including $250,000. The FCS applies to an eligible ADI if APRA has applied for the winding up of the ADI and the responsible Australian Government minister has declared that the FCS applies to the ADI.
The Financial Claims Scheme (ADIs) Levy Act 2008 provides for the imposition of a levy to fund the excess of certain APRA FCS costs connected to an ADI. The levy would be imposed on liabilities of eligible ADIs to their depositors and cannot be more than 0.5% of the amount of those liabilities.
Note 17. Events subsequent to balance date
Since the end of the half-year the directors have recommended the payment of an interim dividend of 93 cents per fully paid ordinary share (First Half 2014: 90 cents), fully franked. The aggregate amount of the proposed dividend expected to be paid on 2 July 2015 out of retained earnings at 31 March 2015, but not recognised as a liability, is $2,896 million.
The Board has determined to satisfy the DRP for the 2015 interim dividend by issuing Westpac ordinary shares. The Market Price used to determine the number of shares issued to DRP participants will be set over 21 trading days commencing on 20 May 2015 and will include a 1.5% discount.
Westpac has entered into an agreement to have the DRP on the interim dividend partially underwritten, which is over and above the participation in the DRP. It is estimated that $2 billion worth of Westpac ordinary shares will be issued under the DRP and the DRP partially underwritten, which is approximately a 60 basis point increase in the CET1 ratio.
No other matter or circumstance has arisen since half year ended 31 March 2015 which is not otherwise dealt with in this interim financial report, that has significantly affected or may significantly affect the operations of the Group, the results of its operations or the state of affairs of the Group in subsequent periods.
Interim financial report 2015 Statutory statements
Westpac Group 2015 Interim Results Announcement | 109
4.8 Statutory statements
Directors’ declaration
In the Directors’ opinion:
(i) the interim financial statements and notes set out on pages 81 to 108 are in accordance with the Corporations Act 2001, including that they:
a. comply with Australian Accounting Standards, the Corporations Regulations 2001 and other mandatory professional reporting requirements; and
b. give a true and fair view of the Group’s financial position as at 31 March 2015 and of its performance for the six months ended 31 March 2015; and
(ii) there are reasonable grounds to believe that Westpac will be able to pay its debts as and when they become due and payable.
This declaration is made in accordance with a resolution of the Directors.
For and on behalf of the Board.
Lindsay Maxsted Chairman
Brian Hartzer Managing Director and Chief Executive Officer
Sydney, Australia 4 May 2015

Interim financial report 2015 Statutory statements
110 | Westpac Group 2015 Interim Results Announcement
Independent auditor’s review report to the members ofWestpac Banking Corporation
Report on the interim financial report
We have reviewed the accompanying interim financial report of Westpac Banking Corporation (the Corporation), which comprises the consolidated balance sheet as at 31 March 2015, the consolidated income statement and consolidated statement of comprehensive income, consolidated statement of changes in equity and consolidated cash flow statement for the half year ended on that date, selected explanatory notes and the directors’ declaration for the Consolidated Entity. The Consolidated Entity comprises the Corporation and the entities it controlled during that half year.
Directors’ responsibility for the interim financial report
The directors of the Corporation are responsible for the preparation of the interim financial report that gives a true and fair view in accordance with Australian Accounting Standards (including the Australian Accounting Interpretations) and the Corporations Act 2001 and for such internal control as the directors determine is necessary to enable the preparation of the interim financial report that is free from material misstatement whether due to fraud or error.
Auditor’s responsibility
Our responsibility is to express a conclusion on the interim financial report based on our review. We conducted our review in accordance with Australian Auditing Standard on Review Engagements ASRE 2410 Review of a Financial Report Performed by the Independent Auditor of the Entity, in order to state whether, on the basis of the procedures described, we have become aware of any matter that makes us believe that the financial report is not in accordance with the Corporations Act 2001 including: giving a true and fair view of the Consolidated Entity’s financial position as at 31 March 2015 and its performance for the half year ended on that date; and complying with Accounting Standard AASB 134 Interim Financial Reporting and the Corporations Regulations 2001. As the auditor of Westpac Banking Corporation, ASRE 2410 requires that we comply with the ethical requirements relevant to the audit of the annual financial report.
A review of an interim financial report consists of making enquiries, primarily of persons responsible for financial and accounting matters, and applying analytical and other review procedures. A review is substantially less in scope than an audit conducted in accordance with Australian Auditing Standards and consequently does not enable us to obtain assurance that we would become aware of all significant matters that might be identified in an audit. Accordingly, we do not express an audit opinion.
Independence
In conducting our review, we have complied with the independence requirements of the Corporations Act 2001.
Conclusion
Based on our review, which is not an audit, we have not become aware of any matter that makes us believe that the interim financial report of Westpac Banking Corporation is not in accordance with the Corporations Act 2001 including:
a) giving a true and fair view of the Consolidated Entity’s financial position as at 31 March 2015 and of its performance for the half year ended on that date; and
b) complying with Accounting Standard AASB 134 Interim Financial Reporting and the Corporations Regulations 2001.
PricewaterhouseCoopers
Michael Codling Partner
Andrew Wilson Partner
Sydney, Australia4 May 2015
PricewaterhouseCoopers, ABN 52 780 433 757Darling Park Tower 2, 201 Sussex Street, GPO BOX 2650, SYDNEY NSW 1171 T: +61 2 8266 0000, F: +61 2 8266 9999, www.pwc.com.au Liability limited by a scheme approved under Professional Standards Legislation.

Interim financial results 2015 Cash earnings financial information
Westpac Group 2015 Interim Results Announcement | 111
5.0 Cash earnings supplementary information
Note 1 Interest spread and margin analysis (cash earnings basis) 112
Note 2 Average balance sheet 113
Note 3 Net interest income (cash earnings basis) 114
Note 4 Non-interest income (cash earnings basis) 115
Note 5 Operating expense analysis (cash earnings basis) 116
Note 6 Deferred expenses 116
Note 7 Earnings per share (cash earnings basis) 117
Note 8 Group earnings reconciliation 118
Note 9 Segment result and economic profit 121
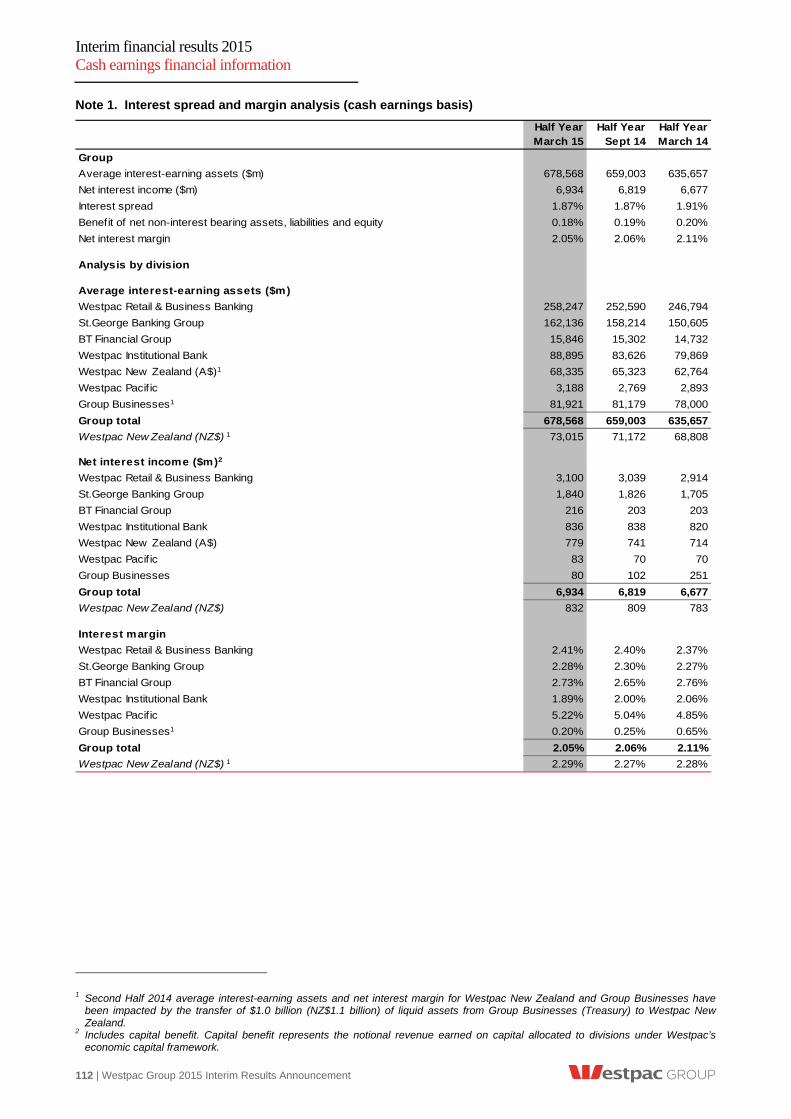
Interim financial results 2015 Cash earnings financial information
112 | Westpac Group 2015 Interim Results Announcement
Note 1. Interest spread and margin analysis (cash earnings basis)
Half YearMarch 15
Half YearSept 14
Half YearMarch 14
Group
Average interest-earning assets ($m) 678,568 659,003 635,657
Net interest income ($m) 6,934 6,819 6,677
Interest spread 1.87% 1.87% 1.91%
Benefit of net non-interest bearing assets, liabilities and equity 0.18% 0.19% 0.20%
Net interest margin 2.05% 2.06% 2.11%
Analysis by division
Average interest-earning assets ($m)
Westpac Retail & Business Banking 258,247 252,590 246,794
St.George Banking Group 162,136 158,214 150,605
BT Financial Group 15,846 15,302 14,732
Westpac Institutional Bank 88,895 83,626 79,869
Westpac New Zealand (A$)1 68,335 65,323 62,764
Westpac Pacif ic 3,188 2,769 2,893
Group Businesses1 81,921 81,179 78,000
Group total 678,568 659,003 635,657
Westpac New Zealand (NZ$) 1 73,015 71,172 68,808
Net interest income ($m)2
Westpac Retail & Business Banking 3,100 3,039 2,914
St.George Banking Group 1,840 1,826 1,705
BT Financial Group 216 203 203
Westpac Institutional Bank 836 838 820
Westpac New Zealand (A$) 779 741 714
Westpac Pacif ic 83 70 70
Group Businesses 80 102 251
Group total 6,934 6,819 6,677
Westpac New Zealand (NZ$) 832 809 783
Interest margin
Westpac Retail & Business Banking 2.41% 2.40% 2.37%
St.George Banking Group 2.28% 2.30% 2.27%
BT Financial Group 2.73% 2.65% 2.76%
Westpac Institutional Bank 1.89% 2.00% 2.06%
Westpac Pacif ic 5.22% 5.04% 4.85%
Group Businesses1 0.20% 0.25% 0.65%
Group total 2.05% 2.06% 2.11%
Westpac New Zealand (NZ$) 1 2.29% 2.27% 2.28%
1 Second Half 2014 average interest-earning assets and net interest margin for Westpac New Zealand and Group Businesses have been impacted by the transfer of $1.0 billion (NZ$1.1 billion) of liquid assets from Group Businesses (Treasury) to Westpac New Zealand.
2 Includes capital benefit. Capital benefit represents the notional revenue earned on capital allocated to divisions under Westpac’s economic capital framework.

Interim financial results 2015 Cash earnings financial information
Westpac Group 2015 Interim Results Announcement | 113
Note 2. Average balance sheet (cash earnings basis)
Average Interest Average Average Interest Average Average Interest Average
balance income rate balance income rate balance income rate
$m $m % $m $m % $m $m %
Assets
Interest earning assets
Receivables due from other f inancial institutions 9,282 54 1.2% 7,161 41 1.1% 8,599 43 1.0%Trading securities and Other f inancial assets designated atfair value 43,141 604 2.8% 46,251 693 3.0% 48,493 789 3.3%Available-for-sale securities 37,124 782 4.2% 32,528 722 4.4% 29,377 664 4.5%Regulatory deposits w ith central banks overseas 1,225 13 2.1% 1,336 8 1.2% 1,402 10 1.4%
Loans and other receivables1 587,796 15,077 5.1% 571,727 14,963 5.2% 547,786 14,382 5.3%
Total interest earning assets and interest income 678,568 16,530 4.9% 659,003 16,427 5.0% 635,657 15,888 5.0%Non-interest earning assetsCash, due from other f inancial institutions and regulatorydeposits 1,689 1,811 1,213Derivative financial instruments 48,087 28,211 29,525
Life insurance assets 10,974 14,016 13,356
All other assets2 50,503 46,485 44,903
Total non-interest earning assets 111,253 90,523 88,997Total assets 789,821 749,526 724,654
Half Year
31 March 2015
Half Year
30 September 2014
Half Year
31 March 2014
Average Interest Average Average Interest Average Average Interest Average balance expense rate balance expense rate balance expense rate $m $m % $m $m % $m $m %LiabilitiesInterest bearing liabilitiesPayables due to other f inancial institutions 17,942 162 1.8% 16,720 156 1.9% 14,408 144 2.0%Deposits and other borrow ings 434,347 5,748 2.7% 420,193 5,795 2.8% 408,126 5,704 2.8%Loan capital 11,106 260 4.7% 10,743 256 4.8% 9,427 218 4.6%
Other interest bearing liabilities3 174,612 3,426 3.9% 170,049 3,401 4.0% 163,379 3,145 3.9%
Total interest bearing liabilities and interest expense 638,007 9,596 3.0% 617,705 9,608 3.1% 595,340 9,211 3.1%Non-interest bearing liabilities
Deposits and due to other financial institutions 32,783 28,993 26,614Derivative financial instruments 49,095 30,972 31,373
Life insurance policy liabilities 9,478 12,652 12,064
All other liabilities4 11,681 11,299 12,493
Total non-interest bearing liabilities 103,037 83,916 82,544Total liabilities 741,044 701,621 677,884Shareholders' equity 47,920 47,044 45,907
Non-controlling interests 857 861 863
Total equity 48,777 47,905 46,770Total liabilities and equity 789,821 749,526 724,654
31 March 2014
Half Year
31 March 2015 30 September 2014
Half Year Half Year
1 Other receivables includes other assets, cash and balances held with central banks. 2 Includes property, plant and equipment, goodwill and intangibles, other assets, deferred tax and non-interest bearing loans relating to
mortgage offset accounts. 3 Includes net impact of Treasury balance sheet management activities. 4 Includes provisions for current and deferred income tax.

Interim financial results 2015 Cash earnings financial information
114 | Westpac Group 2015 Interim Results Announcement
Note 2. Average balance sheet (cash earnings basis)
Average Average Average Average Average Average
Balance Interest Rate Balance Interest Rate Balance Interest Rate
$m $m % $m $m % $m $m %
Loans and other receivables1
Australia 496,752 12,935 5.2% 483,473 12,990 5.4% 465,618 12,578 5.4%
New Zealand 63,037 1,933 6.1% 60,012 1,802 6.0% 58,464 1,644 5.6%
Other overseas 28,007 209 1.5% 28,242 171 1.2% 23,704 160 1.4%
Deposits and other borrowings
Australia 356,709 4,797 2.7% 346,149 4,922 2.8% 338,600 4,928 2.9%
New Zealand 45,394 845 3.7% 43,008 771 3.6% 41,877 682 3.3%
Other overseas 32,244 106 0.7% 31,036 102 0.7% 27,649 94 0.7%
Half Year
31 March 2014 30 September 2014
Half Year Half Year
31 March 2015
Note 3. Net interest income (cash earnings basis)
% M ov't % M ov't
$mHalf YearMarch 15
Half YearSept 14
Half YearMarch 14
Mar 15-Sept 14
Mar 15- Mar 14
Interest incomeCash 120 121 104 (1) 15 Loans 14,959 14,833 14,271 1 5 Receivables due from other f inancial institutions 54 41 43 32 26 Available-for-sale securities 782 722 664 8 18 Regulatory deposits w ith central banks overseas 13 8 10 63 30 Trading securities 568 654 753 (13) (25) Net ineffectiveness on qualifying hedges (7) 7 2 (200) largeOther f inancial assets designated at fair value 36 39 36 (8) - Other interest income 5 2 5 150 - Total interest income 16,530 16,427 15,888 1 4 Interest expenseAt call and term deposits (5,274) (5,309) (5,269) (1) - Certif icates of deposit (474) (486) (435) (2) 9 Payables due to other f inancial institutions (162) (156) (144) 4 13 Debt issues and acceptances (1,915) (1,944) (1,869) (1) 2 Loan capital (260) (256) (218) 2 19 Trading liabilities (1,454) (1,418) (1,242) 3 17 Other interest expense (57) (39) (34) 46 68 Total interest expense (9,596) (9,608) (9,211) - 4 Net interest income 6,934 6,819 6,677 2 4
1 Other receivables includes other assets, cash and balances held with central banks.
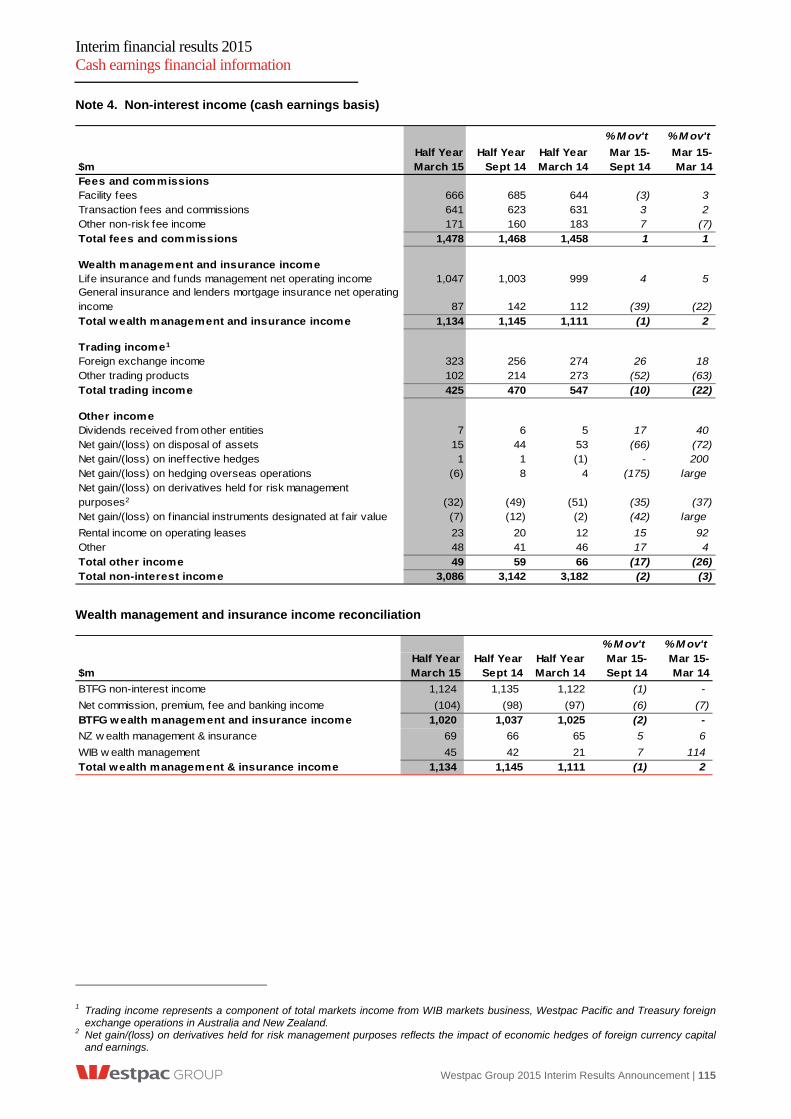
Interim financial results 2015 Cash earnings financial information
Westpac Group 2015 Interim Results Announcement | 115
Note 4. Non-interest income (cash earnings basis)
% M ov't % M ov't
$mHalf YearMarch 15
Half YearSept 14
Half YearMarch 14
Mar 15-Sept 14
Mar 15- Mar 14
Fees and commissionsFacility fees 666 685 644 (3) 3 Transaction fees and commissions 641 623 631 3 2 Other non-risk fee income 171 160 183 7 (7) Total fees and commissions 1,478 1,468 1,458 1 1
Wealth management and insurance incomeLife insurance and funds management net operating income 1,047 1,003 999 4 5 General insurance and lenders mortgage insurance net operatingincome 87 142 112 (39) (22)
Total wealth management and insurance income 1,134 1,145 1,111 (1) 2
Trading income1
Foreign exchange income 323 256 274 26 18 Other trading products 102 214 273 (52) (63) Total trading income 425 470 547 (10) (22)
Other incomeDividends received from other entities 7 6 5 17 40 Net gain/(loss) on disposal of assets 15 44 53 (66) (72) Net gain/(loss) on ineffective hedges 1 1 (1) - 200 Net gain/(loss) on hedging overseas operations (6) 8 4 (175) largeNet gain/(loss) on derivatives held for risk management purposes2 (32) (49) (51) (35) (37) Net gain/(loss) on f inancial instruments designated at fair value (7) (12) (2) (42) large
Rental income on operating leases 23 20 12 15 92 Other 48 41 46 17 4 Total other income 49 59 66 (17) (26) Total non-interest income 3,086 3,142 3,182 (2) (3)
Wealth management and insurance income reconciliation
% M ov't % M ov't
$mHalf YearMarch 15
Half YearSept 14
Half YearMarch 14
Mar 15-Sept 14
Mar 15- Mar 14
BTFG non-interest income 1,124 1,135 1,122 (1) -
Net commission, premium, fee and banking income (104) (98) (97) (6) (7)
BTFG wealth management and insurance income 1,020 1,037 1,025 (2) -
NZ w ealth management & insurance 69 66 65 5 6
WIB w ealth management 45 42 21 7 114 Total wealth management & insurance income 1,134 1,145 1,111 (1) 2
1 Trading income represents a component of total markets income from WIB markets business, Westpac Pacific and Treasury foreign exchange operations in Australia and New Zealand.
2 Net gain/(loss) on derivatives held for risk management purposes reflects the impact of economic hedges of foreign currency capital and earnings.

Interim financial results 2015 Cash earnings financial information
116 | Westpac Group 2015 Interim Results Announcement
Note 5. Operating expenses (cash earnings basis)
% M ov't % M ov't
$mHalf YearMarch 15
Half YearSept 14
Half YearMarch 14
Mar 15-Sept 14
Mar 15- Mar 14
Salaries and other staff expensesSalaries and w ages 1,778 1,742 1,776 2 -Other staff expenses 578 540 522 7 11Restructuring costs 12 12 46 - (74)
Total salaries and other staff expenses 2,368 2,294 2,344 3 1
Equipment and occupancy expensesOperating lease rentals 281 294 271 (4) 4
Depreciation, amortisation and impairment:Premises 5 4 6 25 (17)Leasehold improvements 58 55 54 5 7Furniture and equipment 35 34 30 3 17Technology 66 58 47 14 40Softw are 257 278 215 (8) 20Assets under lease 13 11 5 18 160
Other 75 75 64 - 17
Total equipment and occupancy expenses 790 809 692 (2) 14
Other expensesAmortisation of deferred expenditure and intangible assets 5 6 5 (17) -Non-lending losses 28 30 22 (7) 27Purchased services:
Technology and information services 195 180 209 8 (7)Legal 11 10 9 10 22Other professional services 191 230 181 (17) 6Credit card loyalty programs 71 60 76 18 (7)
Postage and stationery 101 105 100 (4) 1Outsourcing costs 336 329 281 2 20Insurance 10 13 8 (23) 25Advertising 82 87 72 (6) 14Training 7 9 9 (22) (22)Travel 35 34 33 3 6Other expenses 24 (15) 24 large -
Total other expenses 1,096 1,078 1,029 2 7Total operating expenses 4,254 4,181 4,065 2 5
Note 6. Deferred expenses
As at As at As at % M ov't % M ov't
$m31 March
201530 Sept
201431 March
2014Mar 15 - Sept 14
Mar 15 - Mar 14
Deferred acquisition costs 126 129 118 (2) 7Other deferred expenditure 14 11 28 27 (50)

Interim financial results 2015 Cash earnings financial information
Westpac Group 2015 Interim Results Announcement | 117
Note 7. Earnings per share (cash earnings basis)
% M ov't % M ov't
$mHalf YearMarch 15
Half YearSept 14
Half YearMarch 14
Mar 15-Sept 14
Mar 15- Mar 14
Cash earnings 3,778 3,856 3,772 (2) -
Weighted average number of fully paid ordinary shares (millions) 3,115 3,109 3,109 - -
Cash earnings per ordinary share (cents) 121.3 124.1 121.3 (2) -
Half YearMarch 15
Half YearSept 14
Half YearMarch 14
Reconciliation of ordinary shares on issue before the effect of own shares held (millions)Opening balance 3,109 3,109 3,109Number of shares issued under the Dividend Reinvestment Plan (DRP) 11 - -
Closing balance 3,120 3,109 3,109

Inte
rim
fina
ncia
l res
ults
201
5 C
ash
earn
ings
fina
ncia
l inf
orm
atio
n
118
| Wes
tpac
Gro
up 2
015
Inte
rim
Res
ults
Ann
ounc
emen
t
No
te 8
. G
rou
p e
arn
ing
s re
con
cili
atio
n
Six
mon
ths
to 3
1 M
arch
201
5
$mRe
port
edre
sults
Polic
yhol
der
tax
reco
veri
esTr
easu
rysh
ares
Inef
fect
ive
hedg
es
Fair
valu
eon
eco
nom
iche
dges
Buyb
ack
ofgo
vern
men
tgu
aran
teed
de
bt
Fair
valu
e am
ortis
atio
n offin
anci
al
inst
rum
ents
Amor
tisat
ion
of in
tang
ible
asse
ts1
Acqu
isiti
ontr
ansa
ctio
n an
din
tegr
atio
nex
pens
esBe
ll lit
igat
ion
prov
isio
n
Wes
tpac
Bi
cent
enni
alFo
unda
tion
gran
t
Prio
r per
iod
tax
prov
isio
nsCa
shea
rnin
gsNe
t int
eres
t inco
me6,
984
--
(1)
(47)
(2)
--
--
--
6,93
4Fe
es a
nd c
omm
issi
ons
1,47
8-
--
--
--
--
--
1,47
8W
ealth
man
agem
ent &
insu
ranc
e in
com
e1,
146
(55)
43-
--
--
--
--
1,13
4Tr
adin
g in
com
e42
5-
--
--
--
--
--
425
Oth
er in
com
e(3
6)-
--
85-
--
--
--
49No
n-int
eres
t inc
ome
3,01
3(5
5)43
-85
--
--
--
-3,
086
Net o
pera
ting
incom
e9,
997
(55)
43(1
)38
(2)
--
--
--
10,0
20Sa
larie
s an
d ot
her s
taff
expe
nses
(2,4
02)
--
--
--
-34
--
-(2
,368
)Eq
uipm
ent a
nd o
ccup
ancy
exp
ense
s(7
91)
--
--
--
-1
--
-(7
90)
Oth
er e
xpen
ses
(1,2
17)
--
--
--
106
15-
--
(1,0
96)
Oper
atin
g ex
pens
es(4
,410
)-
--
--
-10
650
--
-(4
,254
)
Core
ear
ning
s5,
587
(55)
43(1
)38
(2)
-10
650
--
-5,
766
Impa
irmen
t cha
rges
(341
)-
--
--
--
--
--
(341
)Op
erat
ing
prof
it be
fore
tax
5,24
6(5
5)43
(1)
38(2
)-
106
50-
--
5,42
5Inc
ome
tax
expe
nse
(1,6
04)
55(6
)-
(12)
1-
(32)
(15)
--
-(1
,613
)
Net p
rofit
3,64
2-
37(1
)26
(1)
-74
35-
--
3,81
2Ne
t pro
fit a
ttribu
table
to n
on-c
ontro
lling
inter
ests
(33)
--
--
--
(1)
--
--
(34)
NET
PROF
IT A
TTRI
BUTA
BLE
TO O
WNE
RS O
F W
BC3,
609
-37
(1)
26(1
)-
7335
--
-3,
778
WBC
Cas
h Ea
rnin
gs a
djus
tmen
ts:
--
-Tr
easu
ry s
hare
s37
-(3
7)-
--
--
--
--
-Ine
ffect
ive h
edge
s(1
)-
-1
--
--
--
--
-Fa
ir va
lue
on e
cono
mic
hedg
es26
--
-(2
6)-
--
--
--
-Bu
ybac
k of g
over
nmen
t gua
rant
eed
debt
(1)
--
--
1-
--
--
--
Fair
valu
e am
ortis
ation
of f
inan
cial
instru
men
ts-
--
--
--
--
--
--
Amor
tisat
ion o
f int
angi
ble a
sset
s173
--
--
--
(73)
--
--
-Ac
quisi
tion
trans
actio
n an
d int
egra
tion
expe
nses
35-
--
--
--
(35)
--
--
Bell l
itigat
ion p
rovis
ion-
--
--
--
--
--
--
Wes
tpac
Bic
ente
nnial
Fou
ndat
ion g
rant
--
--
--
--
--
--
-Pr
ior p
eriod
tax
prov
ision
s-
--
--
--
--
--
--
Cash
ear
ning
s3,
778
--
--
--
--
--
-3,
778
Cash
Ear
ning
s ad
just
men
ts
1 Am
ort
isat
ion
of i
ntan
gibl
e as
sets
ref
lect
s th
e a
mo
rtis
atio
n of
St.G
eor
ge i
ntan
gibl
e a
sset
s in
clud
ing
the
core
dep
osit
inta
ngib
le,
cred
it ca
rd a
nd f
inan
cial
pla
nner
rel
atio
nshi
ps a
s w
ell
as i
ntan
gibl
e as
sets
(m
anag
em
ent
con
trac
ts)
rela
ted
to t
he J
OH
CM
an
d Ll
oyds
acq
uisi
tion.

Inte
rim
fina
ncia
l res
ults
201
5 C
ash
earn
ings
fina
ncia
l inf
orm
atio
n
Wes
tpac
Gro
up 2
015
Inte
rim R
esul
ts A
nnou
ncem
ent |
11
9
No
te 8
. G
rou
p e
arn
ing
s re
con
cili
atio
n (
con
tin
ued
)
Six
mon
ths
to 3
0 Se
ptem
ber 2
014
$mRe
port
edre
sults
Polic
yhol
der
tax
reco
veri
esTr
easu
rysh
ares
Inef
fect
ive
hedg
es
Fair
valu
eon
eco
nom
iche
dges
Buyb
ack
ofgo
vern
men
tgu
aran
teed
de
bt
Fair
valu
e am
ortis
atio
n offin
anci
al
inst
rum
ents
Amor
tisat
ion
of in
tang
ible
asse
ts1
Acqu
isiti
ontr
ansa
ctio
n an
din
tegr
atio
nex
pens
esBe
ll lit
igat
ion
prov
isio
n
Wes
tpac
Bi
cent
enni
alFo
unda
tion
gran
t
Prio
r per
iod
tax
prov
isio
nsCa
shea
rnin
gsNe
t inte
rest
inco
me6,
903
--
43(1
21)
(17)
11-
--
--
6,81
9Fe
es a
nd c
omm
issi
ons
1,46
8-
--
--
--
--
--
1,46
8W
ealth
man
agem
ent &
insu
ranc
e in
com
e1,
152
1(8
)-
--
--
--
--
1,14
5Tr
adin
g in
com
e47
1-
--
(1)
--
--
--
-47
0O
ther
inco
me
153
--
-(9
4)-
--
--
--
59No
n-int
eres
t inco
me3,
244
1(8
)-
(95)
--
--
--
-3,
142
Net o
pera
ting
incom
e10
,147
1(8
)43
(216
)(1
7)11
--
--
-9,
961
Sala
ries
and
othe
r sta
ff ex
pens
es(2
,316
)-
--
--
--
22-
--
(2,2
94)
Equi
pmen
t and
occ
upan
cy e
xpen
ses
(810
)-
--
--
--
1-
--
(809
)O
ther
exp
ense
s(1
,226
)-
--
--
-11
013
(75)
100
-(1
,078
)Op
erat
ing e
xpen
ses
(4,3
52)
--
--
--
110
36(7
5)10
0-
(4,1
81)
Core
ear
ning
s5,
795
1(8
)43
(216
)(1
7)11
110
36(7
5)10
0-
5,78
0Im
pairm
ent c
harg
es(3
09)
--
--
--
--
--
-(3
09)
Oper
atin
g pr
ofit
befo
re ta
x5,
486
1(8
)43
(216
)(1
7)11
110
36(7
5)10
0-
5,47
1Inc
ome
tax
expe
nse
(1,5
20)
(1)
2(1
4)65
5(3
)(3
2)(1
0)21
(30)
(70)
(1,5
87)
Net p
rofit
3,96
6-
(6)
29(1
51)
(12)
878
26(5
4)70
(70)
3,88
4Ne
t pro
fit a
ttrib
utab
le to
non
-con
trollin
g int
eres
ts(2
7)-
--
--
-(1
)-
--
-(2
8)
NET
PROF
IT A
TTRI
BUTA
BLE
TO O
WNE
RS O
F W
BC3,
939
-(6
)29
(151
)(1
2)8
7726
(54)
70(7
0)3,
856
WBC
Cas
h Ea
rnin
gs a
djus
tmen
ts:
Trea
sury
sha
res
(6)
-6
--
--
--
--
--
Ineffe
ctive
hed
ges
29-
-(2
9)-
--
--
--
--
Fair
value
on
econ
omic
hedg
es(1
51)
--
-15
1-
--
--
--
-Bu
ybac
k of g
over
nmen
t gua
rant
eed
debt
(12)
--
--
12-
--
--
--
Fair
value
amo
rtisa
tion
of fi
nanc
ial in
stru
ment
s8
--
--
-(8
)-
--
--
-
Amor
tisat
ion o
f int
angib
le as
sets
177
--
--
--
(77)
--
--
-Ac
quisi
tion
trans
actio
n an
d in
tegr
atio
n ex
pens
es26
--
--
--
-(2
6)-
--
-Be
ll litig
ation
pro
vision
(54)
--
--
--
--
54-
--
Wes
tpac
Bice
nten
nial F
ound
ation
gra
nt70
--
--
--
--
-(7
0)-
-Pr
ior p
eriod
tax
prov
ision
s(7
0)-
--
--
--
--
-70
-
Cash
ear
ning
s3,
856
--
--
--
--
--
-3,
856
Cas
h Ea
rnin
gs a
djus
tmen
ts
1 Am
ort
isat
ion
of i
ntan
gibl
e as
sets
ref
lect
s th
e a
mo
rtis
atio
n of
St.G
eor
ge i
ntan
gibl
e a
sset
s in
clud
ing
the
core
dep
osit
inta
ngib
le,
cred
it ca
rd a
nd f
inan
cial
pla
nner
rel
atio
nshi
ps a
s w
ell
as i
ntan
gibl
e as
sets
(m
anag
em
ent
con
trac
ts)
rela
ted
to t
he J
OH
CM
an
d Ll
oyds
acq
uisi
tion.

Inte
rim
fina
ncia
l res
ults
201
5 C
ash
earn
ings
fina
ncia
l inf
orm
atio
n
120
| Wes
tpac
Gro
up 2
015
Inte
rim
Res
ults
Ann
ounc
emen
t
No
te 8
. G
rou
p e
arn
ing
s re
con
cili
atio
n (
con
tin
ued
)
Six
mon
ths
to 3
1 M
arch
201
4
$mRe
port
edre
sults
Polic
yhol
der
tax
reco
veri
esTr
easu
rysh
ares
Inef
fect
ive
hedg
es
Fair
valu
eon
eco
nom
iche
dges
Buyb
ack
ofgo
vern
men
tgu
aran
teed
de
bt
Fair
valu
e am
ortis
atio
n offin
anci
al
inst
rum
ents
Amor
tisat
ion
of in
tang
ible
asse
ts1
Acqu
isiti
ontr
ansa
ctio
n an
din
tegr
atio
nex
pens
esBe
ll lit
igat
ion
prov
isio
n
Wes
tpac
Bi
cent
enni
alFo
unda
tion
gran
t
Prio
r per
iod
tax
prov
isio
nsCa
shea
rnin
gsNe
t inte
rest
inco
me6,
639
--
2444
(43)
13-
--
--
6,67
7Fe
es a
nd c
omm
issi
ons
1,45
8-
--
--
--
--
--
1,45
8W
ealth
man
agem
ent &
insu
ranc
e in
com
e1,
102
(5)
14-
--
--
--
--
1,11
1Tr
adin
g in
com
e54
6-
--
1-
--
--
--
547
Oth
er in
com
e45
--
-21
--
--
--
-66
Non-
inter
est in
come
3,15
1(5
)14
-22
--
--
--
-3,
182
Net o
pera
ting
incom
e9,
790
(5)
1424
66(4
3)13
--
--
-9,
859
Sala
ries
and
othe
r sta
ff ex
pens
es(2
,351
)-
--
--
--
7-
--
(2,3
44)
Equi
pmen
t and
occ
upan
cy e
xpen
ses
(692
)-
--
--
--
--
--
(692
)O
ther
exp
ense
s(1
,152
)-
--
--
-10
221
--
-(1
,029
)Op
erat
ing e
xpen
ses
(4,1
95)
--
--
--
102
28-
--
(4,0
65)
Core
ear
ning
s5,
595
(5)
1424
66(4
3)13
102
28-
--
5,79
4Im
pairm
ent c
harg
es(3
41)
--
--
--
--
--
-(3
41)
Oper
atin
g pr
ofit
befo
re ta
x5,
254
(5)
1424
66(4
3)13
102
28-
--
5,45
3Inc
ome
tax
expe
nse
(1,5
95)
5(1
)(7
)(2
0)13
(4)
(31)
(3)
--
-(1
,643
)
Net p
rofit
3,65
9-
1317
46(3
0)9
7125
--
-3,
810
Net p
rofit
attr
ibut
able
to n
on-c
ontro
lling
inter
ests
(37)
--
--
--
(1)
--
--
(38)
NET
PROF
IT A
TTRI
BUTA
BLE
TO O
WNE
RS O
F W
BC3,
622
-13
1746
(30)
970
25-
--
3,77
2W
BC C
ash
Earn
ings
adj
ustm
ents
:Tr
easu
ry s
hare
s13
-(1
3)-
--
--
--
--
-Ine
ffect
ive h
edge
s17
--
(17)
--
--
--
--
-Fa
ir va
lue o
n ec
onom
ic he
dges
46-
--
(46)
--
--
--
--
Buyb
ack o
f gov
ernm
ent g
uara
ntee
d de
bt(3
0)-
--
-30
--
--
--
-Fa
ir va
lue a
morti
satio
n of
fina
ncial
inst
rume
nts
9-
--
--
(9)
--
--
--
Amor
tisat
ion o
f int
angib
le as
sets
170
--
--
--
(70)
--
--
-Ac
quisi
tion
trans
actio
n an
d in
tegr
atio
n ex
pens
es25
--
--
--
-(2
5)-
--
-Be
ll litig
ation
pro
vision
--
--
--
--
--
--
-W
estp
ac B
icent
ennia
l Fou
ndat
ion g
rant
--
--
--
--
--
--
-Pr
ior p
eriod
tax
prov
ision
s-
--
--
--
--
--
--
Cash
ear
ning
s3,
772
--
--
--
--
--
-3,
772
Cas
h Ea
rnin
gs a
djus
tmen
ts
1 Am
ort
isat
ion
of i
ntan
gibl
e as
sets
ref
lect
s th
e a
mo
rtis
atio
n of
St.G
eor
ge i
ntan
gibl
e a
sset
s in
clud
ing
the
core
dep
osit
inta
ngib
le,
cred
it ca
rd a
nd f
inan
cial
pla
nner
rel
atio
nshi
ps a
s w
ell
as i
ntan
gibl
e as
sets
(m
anag
em
ent
con
trac
ts)
rela
ted
to t
he J
OH
CM
an
d Ll
oyds
acq
uisi
tion.

Interim financial results 2015 Cash earnings financial information
Westpac Group 2015 Interim Results Announcement | 121
Note 9. Divisional result and economic profit
Group economic profit is defined as cash earnings plus a franking benefit equivalent of 70% of the value of Australian tax expense less a capital charge calculated at 11% of average ordinary equity.
Divisional economic profit is defined as cash earnings plus the franking benefit less a capital charge. The capital charge is calculated at 11% on allocated capital.
Economic profit is used as a key measure of financial performance because it focuses on shareholder value generated by requiring a return in excess of a risk-adjusted cost of capital.
Six months to31 March 2015$m Group
Westpac Retail &
Business Banking
St.George Banking Group1
BT Financial Group
(Australia)2
Westpac Institutional
Bank
WestpacNew
Zealand3
WestpacPacific
Reported results 3,609 1,350 774 441 624 413 59Cash earnings adjustments 169 - 63 10 - - -
Cash earnings 3,778 1,350 837 451 624 413 59Franking benefit 972 405 251 133 169 - -Adjusted cash earnings 4,750 1,755 1,088 584 793 413 59Average ordinary equity 47,920 10,983 7,973 3,090 8,367 3,619 385Equity charge (2,628) (602) (437) (169) (459) (198) (21)Economic profit 2,122 1,153 651 415 334 215 38
Six months to30 September 2014$m Group
Westpac Retail &
Business Banking
St.George Banking Group1
BT Financial Group
(Australia)2
Westpac Institutional
Bank
WestpacNew
Zealand3
WestpacPacific
Reported results 3,939 1,330 740 448 717 397 57Cash earnings adjustments (83) - 66 11 - - -Cash earnings 3,856 1,330 806 459 717 397 57Franking benefit 979 401 241 138 203 - -Adjusted cash earnings 4,835 1,731 1,047 597 920 397 57Average ordinary equity 47,044 9,905 7,630 2,850 8,119 3,778 393Equity charge (2,594) (546) (421) (158) (448) (209) (22)
Economic profit 2,241 1,185 626 439 472 188 35
Six months to31 March 2014$m Group
Westpac Retail &
Business Banking
St.George Banking Group1
BT Financial Group
(Australia)2
Westpac Institutional
Bank
WestpacNew
Zealand3
WestpacPacific
Reported results 3,622 1,253 710 430 750 393 65Cash earnings adjustments 150 - 59 11 - - -Cash earnings 3,772 1,253 769 441 750 393 65Franking benefit 996 375 232 122 216 - -Adjusted cash earnings 4,768 1,628 1,001 563 966 393 65Average ordinary equity 45,907 9,459 7,006 2,834 7,821 3,722 385Equity charge (2,518) (519) (384) (155) (429) (204) (21)
Economic profit 2,250 1,109 617 408 537 189 44
1 Cash earnings adjustment relates to amortisation of intangible assets including the core deposit intangible and credit cards related to the merger with St.George, as well as intangible assets related to Lloyds acquisition.
2 Cash earnings adjustment reflects amortisation of intangible assets related to financial planner relationships following merger with St.George, as well as intangible assets from JOHCM acquisition.
3 In A$ equivalents.

Interim financial results 2015 Other information
122 | Westpac Group 2015 Interim Results Announcement
6.0 Other information
6.1 Disclosure regarding forward-looking statements
This Interim Financial Results Announcement contains statements that constitute ‘forward-looking statements’ within the meaning of Section 21E of the US Securities Exchange Act of 1934.
Forward-looking statements are statements about matters that are not historical facts. Forward-looking statements appear in a number of places in this Interim Financial Results Announcement and include statements regarding Westpac’s intent, belief or current expectations with respect to its business and operations, market conditions, results of operations and financial condition, including, without limitation, future loan loss provisions and financial support to certain borrowers. Words such as ‘will’, ‘may’, ‘expect’, ‘intend’, ‘seek’, ‘would’, ‘should’, ‘could’, ‘continue’, ‘plan’, ‘estimate’, ‘anticipate’, ‘believe’, ‘probability’, ‘risk’ or other similar words are used to identify forward-looking statements. These forward-looking statements reflect Westpac’s current views with respect to future events and are subject to change, certain risks, uncertainties and assumptions which are, in many instances, beyond Westpac’s control, and have been made based upon management’s expectations and beliefs concerning future developments and their potential effect upon Westpac. There can be no assurance that future developments will be in accordance with Westpac’s expectations or that the effect of future developments on Westpac will be those anticipated. Actual results could differ materially from those expected, depending on the outcome of various factors, including, but not limited to:
the effect of, and changes in, laws, regulations, taxation or accounting standards or practices and government policy, particularly changes to liquidity, leverage and capital requirements;
the stability of Australian and international financial systems and disruptions to financial markets and any losses or business impacts Westpac or its customers or counterparties may experience as a result;
market volatility, including uncertain conditions in funding, equity and asset markets;
adverse asset, credit or capital market conditions;
changes to Westpac’s credit ratings;
levels of inflation, interest rates, exchange rates and market and monetary fluctuations;
market liquidity and investor confidence;
changes in economic conditions, consumer spending, saving and borrowing habits in Australia, New Zealand and in other countries in which Westpac or its customers or counterparties conduct their operations and Westpac’s ability to maintain or to increase market share and control expenses;
the effects of competition in the geographic and business areas in which Westpac conducts its operations;
information security breaches, including cyberattacks;
reliability and security of Westpac’s technology and risks associated with changes to technology systems;
the timely development and acceptance of new products and services and the perceived overall value of these products and services by customers;
the effectiveness of Westpac’s risk management policies, including internal processes, systems and employees;
the incidence or severity of Westpac insured events;
the occurrence of environmental change or external events in countries in which Westpac or its customers or counterparties conduct their operations;
internal and external events which may adversely impact Westpac’s reputation;
changes to the value of Westpac’s intangible assets;
changes in political, social or economic conditions in any of the major markets in which Westpac or its customers or counterparties operate;
the success of strategic decisions involving diversification or innovation, in addition to business expansion and integration of new businesses; and
various other factors beyond Westpac’s control.
The above list is not exhaustive. For certain other factors that may impact on forward-looking statements made by Westpac, refer to ‘Risk factors’ in the Directors’ report in this Interim Financial Results Announcement. When relying on forward-looking statements to make decisions with respect to Westpac, investors and others should carefully consider the foregoing factors and other uncertainties and events.

Interim financial results 2015 Other information
Westpac Group 2015 Interim Results Announcement | 123
6.1 Disclosure regarding forward-looking statements (continued)
Westpac is under no obligation to update any forward-looking statements contained in this Interim Financial Results Announcement, whether as a result of new information, future events or otherwise, after the date of this Interim Financial Results Announcement.
Websites
Information contained in or accessible through the websites mentioned in this Interim Financial Results Announcement does not form part of this Interim Financial Results Announcement unless specifically stating that it is incorporated by reference and forms part of this Interim Financial Results Announcement. All references in this Interim Financial Results Announcement to websites are inactive textual references and are for information only.
6.2 Credit ratings1
Rating agencyLong Term
Short Term
Fitch Ratings AA- F1+Moody's Investor Services Aa2 P-1Standard & Poor's AA- A-1+
6.3 Dividend reinvestment plan
The Group operates a DRP that is available to holders of fully paid ordinary shares who are resident in, or whose address on the register of shareholders is in Australia or New Zealand. As noted in Section 2.5, the Directors have made certain determinations in relation to the calculation of the Market Price which will apply to the DRP for the 2015 interim dividend only.
Shareholders who wish to commence participation in the DRP, or to vary their current participation election, must do so by 5.00pm (AEST) on 18 May 2015.
Shareholders can provide these instructions by:
For shareholders with holdings that have a market value of less than A$50,000 (for a single holding) or less than A$200,000 (per shareholding held within a Link Market Services portfolio), logging into the Westpac share registrar’s website at www.linkmarketservices.com.au and electing into the DRP or amending their existing instructions online; or
Completing and returning a DRP Application or Variation form to Westpac’s share registry. Registry contact details are listed in Section 6.5.
6.4 Changes in control of Group entities
During the six months ended 31 March 2015 the following controlled entities were incorporated, formed or acquired:
Crusade ABS Series 2015-1 Trust (formed 13 March 2015);
Data Republic Pty Limited (acquired 20 November 2014);
Series 2014-2 WST Trust (formed 4 December 2014); and
Westpac Notice Saver PIE Fund (formed 1 December 2014).
During the six months ended 31 March 2015 the following controlled entities ceased to be controlled:
BLE Capital Investments Pty Limited (deregistered 5 November 2014);
BLE Capital Limited (deregistered 14 January 2015);
BLE Development Pty Limited (deregistered 5 November 2014);
Packaging Properties 1 Pty Limited (deregistered 24 February 2015);
Packaging Properties 2 Pty Limited (deregistered 24 February 2015);
Packaging Properties 3 Pty Limited (deregistered 24 February 2015);
St.George Procurement Management Pty Limited (deregistered 30 March 2015);
Westpac Funding Holdings Pty Limited (deregistered 8 October 2014); and
Westpac Investments U.K. Limited (dissolved 21 October 2014).
1 As at 31 March 2015.

Interim financial results 2015 Other information
124 | Westpac Group 2015 Interim Results Announcement
6.5 Financial calendar and Share Registry details
Westpac shares are listed on the securities exchanges in Australia (ASX) and New Zealand and as American Depository Receipts in New York. Westpac Capital Notes, Westpac Convertible Preference Shares (Westpac CPS), Westpac Capital Notes 2, Westpac Subordinated Notes and Westpac Subordinated Notes II are listed on the ASX.
Important dates to note:
Westpac Ordinary Shares (ASX code: WBC)
Interim results and dividend announcement 4 May 2015 Ex-dividend date for interim dividend 13 May 2015 Record date for interim dividend 15 May 20151 Interim dividend payable 2 July 2015 Financial Year end 30 September 2015 Final results and dividend announcement 2 November 2015 Ex-dividend date for final dividend 11 November 2015 Record date for final dividend 13 November 20152,4 Annual General Meeting 11 December 20153 Final dividend payable 21 December 20154 Westpac Capital Notes (ASX code: WBCPD)
Ex-dividend date for quarterly distribution 27 May 2015 Record date for quarterly distribution 29 May 20155 Payment date for quarterly distribution 9 June 20156 Ex-dividend date for quarterly distribution 27 August 2015 Record date for quarterly distribution 31 August 2015 Payment date for quarterly distribution 8 September 2015 Ex-dividend date for quarterly distribution 26 November 2015 Record date for quarterly distribution 30 November 2015 Payment date for quarterly distribution 8 December 2015
Westpac Capital Notes 2 (ASX code: WBCPE)
Ex-dividend date for quarterly distribution 11 June 2015 Record date for quarterly distribution 15 June 2015 Payment date for quarterly distribution 23 June 2015 Ex-dividend date for quarterly distribution 11 September 2015 Record date for quarterly distribution 15 September 2015 Payment date for quarterly distribution 23 September 2015 Ex-dividend date for quarterly distribution 11 December 2015 Record date for quarterly distribution 15 December 2015 Payment date for quarterly distribution 23 December 2015 Westpac Convertible Preference Shares (Westpac CPS) (ASX code: WBCPC)
Ex-dividend date for semi-annual dividend 18 September 2015 Record date for semi-annual dividend 22 September 2015 Payment date for semi-annual dividend 30 September 2015
1 Record date for 2015 interim dividend in New York – 14 May 2015. 2 Record date for 2015 final dividend in New York – 12 November 2015. 3 Details regarding the location of this meeting and the business to be dealt with will be contained in the separate Notice of Meeting
sent to shareholders in November 2015. 4 Dates will be confirmed at the time of announcing the 2015 final results. 5 If record date does not fall on a business day, the immediately preceding business day will be used. 6 Next business day when payment date falls on a non-business day. No interest provided in respect of this delay.

Interim financial results 2015 Other information
Westpac Group 2015 Interim Results Announcement | 125
Westpac Subordinated Notes (ASX code: WBCHA)
Ex-interest date for quarterly interest payment 13 May 2015 Record date for quarterly interest payment 15 May 20151 Payment date for quarterly interest payment 25 May 20152 Ex-interest date for quarterly interest payment 12 August 2015 Record date for quarterly interest payment 14 August 20151 Payment date for quarterly interest payment 24 August 20152 Ex-dividend date for quarterly distribution 11 November 2015 Record date for quarterly distribution 13 November 20151 Payment date for quarterly distribution 23 November 2015 Westpac Subordinated Notes II (ASX code: WBCHB)
Ex-dividend date for quarterly distribution 12 May 2015 Record date for quarterly distribution 14 May 2015 Payment date for quarterly distribution 22 May 2015 Ex-dividend date for quarterly distribution 12 August 2015 Record date for quarterly distribution 14 August 20151 Payment date for quarterly distribution 24 August 20152 Ex-dividend date for quarterly distribution 11 November 2015 Record date for quarterly distribution 13 November 20151 Payment date for quarterly distribution 23 November 20152
Share Registries
Australia New Zealand
Ordinary shares on the main register, Westpac Capital Notes, Westpac Capital Notes 2, Westpac Convertible Preference Shares, Westpac Subordinated Notes and Westpac Subordinated Notes II
Ordinary shares on the New Zealand branch register
Link Market Services Limited Link Market Services Limited Level 12, 680 George Street Level 7, Zurich House, 21 Queens Street Sydney NSW 2000 Australia Auckland 1010 New Zealand Postal Address: Locked Bag A6015, Sydney South NSW 1235
Postal Address: P.O. Box 91976, Auckland 1142, New Zealand
Website: www.linkmarketservices.com.au Email: [email protected]
Website: www.linkmarketservices.co.nz Email: [email protected]
Telephone: 1800 804 255 (toll free in Australia) International: +61 1800 804 255
Telephone: 0800 002 727 (toll free in New Zealand) International: +64 9 375 5998
New York For further information contact:
Depositary in USA for American Depositary Shares The Bank of New York Mellon PO Box 358516 Pittsburgh PA 15252-8516
Media: David Lording, Westpac Media Relations, +61 2 8219 8512
USA Website: www.bnymellon.com/shareowner Analysts and Investors: Email: [email protected] Andrew Bowden, Head of Investor Relations, Telephone: +1 888 269 2377 (toll free in US) +61 2 8253 4008 International: +1 201 680 6825
1 If record date does not fall on a business day, the immediately preceding business day will be used. 2 Next business day when payment date falls on a non-business day. No interest provided in respect of this delay.

Interim financial results 2015 Other information
126 | Westpac Group 2015 Interim Results Announcement
6.6 Exchange rates
6.6.1 Exchange rates against A$
Six months to/as atCurrency Average Spot Average Spot Average SpotUS$ 0.8225 0.7635 0.9298 0.8768 0.9124 0.9230GBP 0.5302 0.5167 0.5542 0.5384 0.5578 0.5549NZ$ 1.0708 1.0202 1.0901 1.1195 1.0973 1.0665
31 March 2015 30 September 2014 31 March 2014
6.6.2 Westpac New Zealand division performance (A$ Equivalent to Section 3.5)
Westpac New Zealand operations provide banking, wealth and insurance products and services to New Zealand consumer, business and institutional customers. The New Zealand wealth business includes New Zealand Life Company and BT New Zealand. Results for the First Half 2015, Second Half 2014 and First Half 2014 have been converted into Australian dollars (A$) at the average exchange rates each month, the average rates for the reporting periods are: 1.0708, 1.0901 and 1.0973 respectively.
% M ov't % M ov't
$mHalf YearMarch 15
Half YearSept 14
Half YearMarch 14
Mar 15 -Sept 14
Mar 15 -Mar 14
Net interest income 779 741 714 5 9
Non-interest income 229 221 217 4 6
Net operating income 1,008 962 931 5 8
Operating expenses (408) (391) (385) 4 6
Core earnings 600 571 546 5 10
Impairment charges (30) (21) (3) 43 large
Operating profit before tax 570 550 543 4 5
Tax and non-controlling interests (157) (153) (150) 3 5
Cash earnings 413 397 393 4 5
Economic profit 215 188 189 14 14
Expense to income ratio 40.6% 40.7% 41.3% (13bps) (71bps)
Net interest margin1 2.29% 2.27% 2.28% 2bps 1bps
% M ov't % M ov't
$bnHalf YearMarch 15
Half YearSept 14
Half YearMarch 14
Mar 15 -Sept 14
Mar 15 -Mar 14
Deposits2 50.4 44.1 45.3 14 11
Net loans 65.3 57.7 59.2 13 10
Deposit to loan ratio 77.3% 76.5% 76.6% 86bps 75bps
Total assets1 75.0 65.9 66.9 14 12
Total committed exposure 93.0 82.8 84.5 12 10
Liquid assets1 7.4 6.9 6.8 7 9
Average interest-earning assets 68.3 65.3 62.8 5 9 Funds under management 5.9 4.9 4.6 20 28 Funds under administration 1.9 1.5 1.4 27 36
1 Second Half 2014 Net interest margin and total assets impacted by the transfer of A$1.0 billion of assets to Westpac New Zealand
from Group Businesses (Treasury). 2 Deposits refer to total customer deposits.

Interim financial results 2015 Other information
Westpac Group 2015 Interim Results Announcement | 127
6.6.3 Impact of exchange rate movements on Group results
Cashearnings
grow thFX impact
$mGrow th
ex-FX
Cashearnings
grow thFX impact
$mGrow th
ex-FX
Net interest income 2% 39 1% 4% 42 3%
Non-interest income (2%) 27 (3%) (3%) 26 (4%)
Net operating income 1% 66 (0%) 2% 68 1%
Operating expenses 2% (23) 1% 5% (23) 4%
Core earnings 0% 43 (1%) 0% 45 (1%)
Impairment charges 10% (1) 10% 0% (1) (0%)
Operating profit before income tax (1%) 42 (2%) (1%) 44 (1%)
Income tax expense 2% (14) 1% (2%) (14) (3%)
Net profit (2%) 28 (3%) 0% 30 (1%)
Net profit attributable to non-controlling interests 21% - 21% (11%) - (11%)
Cash earnings (2%) 28 (3%) 0% 30 (1%)
Half Year March 15 vs Half Year Sept 14
Half Year March 15 vsHalf Year March 14
6.6.4 Exchange rate risk on future NZ$ earnings
Westpac’s policy in relation to the hedging of the future earnings of the Group’s New Zealand division is to manage the economic risk where Westpac believes there is a likelihood of depreciation of NZ$ against A$. Westpac manages these flows over a time horizon under which up to 100% of the expected earnings for the following twelve months and 50% of the expected earnings for the subsequent twelve months can be hedged. As at 31 March 2015, Westpac had hedges in place for forecast Second Half 2015 earnings (average rate $1.11) and for forecast First Half 2016 earnings (average rate $1.10).

Interim financial results 2015 Glossary
128 | Westpac Group 2015 Interim Results Announcement
7.0 Glossary
Shareholder value
Earnings per ordinary share
Net profit attributable to the owners of WBC divided by the weighted average ordinary shares (reported).
Cash earnings per ordinary share
Cash earnings divided by the weighted average ordinary shares (cash earnings basis).
Weighted average ordinary shares (cash earnings)
Weighted average number of fully paid ordinary shares listed on the ASX for the relevant period.
Weighted average ordinary shares (reported)
Weighted average number of fully paid ordinary shares listed on the ASX for the relevant period less Westpac shares held by the Group (‘Treasury shares’).
Fully franked dividends per ordinary shares (cents)
Dividends paid out of retained profits which carry a credit for Australian company income tax paid by Westpac.
Dividend payout ratio – net profit
Ordinary dividend per share divided by net profit per share attributable to the owners of WBC.
Dividend payout ratio – cash earnings
Ordinary dividend to be paid divided by cash earnings.
Return on equity (ROE)
Net profit attributable to the owners of WBC divided by average ordinary equity.
Cash ROE Cash earnings divided by average ordinary equity.
Cash earnings to average tangible equity
Cash earnings divided by average tangible ordinary equity.
Economic profit – Group
Cash earnings less a capital charge calculated at 11% of average ordinary equity plus a value on franking credits calculated as 70% of the Group’s Australian tax expense.
Economic profit – Divisions
Cash earnings less a capital charge calculated at 11% of allocated capital plus 70% of the value of Australian tax expense.
Average ordinary equity
Average total equity less average non-controlling interests.
Average tangible ordinary equity
Average ordinary equity less average goodwill and other intangible assets (excluding capitalised software).
Net tangible assets per ordinary share
Net tangible assets (total equity less goodwill and other intangible assets less minority interests) divided by the number of ordinary shares on issue (reported).
Productivity and efficiency
Expense to income ratio
Operating expenses divided by net operating income.
Total banking expense to income ratio
Total banking operating expenses divided by total banking operating revenue. Total banking business includes Westpac RBB, St.George Banking Group, WIB (excluding Hastings), Private Bank (part of BTFG), New Zealand banking operations, Westpac Pacific and the Group Businesses.
Full-time equivalent employees (FTE)
A calculation based on the number of hours worked by full and part-time employees as part of their normal duties. For example, the full-time equivalent of one FTE is 76 hours paid work per fortnight.
Revenue per FTE Total operating income divided by the average number of FTE for the period.
Business performance
Net interest spread The difference between the average yield on all interest-earning assets and the average rate paid on interest bearing liabilities.
Net interest margin Calculated by dividing net interest income by average interest-earning assets.
Average interest-earning assets
The average balance of assets held by the Group that generate interest income. Where possible, daily balances are used to calculate the average balance for the period.
Average interest-bearing liabilities
The average balance of liabilities owed by the Group that incur an interest expense. Where possible, daily balances are used to calculate the average balance for the period.
Divisional margin Net interest income (including capital benefit) for a division as a percentage of the average interest earning assets for that division.
Interim financial results 2015 Glossary
Westpac Group 2015 Interim Results Announcement | 129
Capital adequacy
Total regulatory capital ratio
Total regulatory capital divided by risk weighted assets, as defined by APRA.
Tier 1 capital ratio Total tier 1 capital divided by risk weighted assets, as defined by APRA.
Common equity tier 1 capital ratio
Total common equity capital divided by risk weighted assets, as defined by APRA.
Risk weighted assets (RWA)
Assets (both on and off-balance sheet) are risk weighted according to each asset’s inherent potential for default and what the likely losses would be in case of default. In the case of non asset backed risks (ie. market and operational risk), RWA is determined by multiplying the capital requirements for those risks by 12.5.
Credit risk weighted assets (Credit RWA)
Credit risk weighted assets represent risk weighted assets (on-balance sheet and off-balance sheet) that relate to credit exposures and therefore exclude market risk, operational risk, interest rate risk in the banking book and other assets.
Internationally comparable capital ratios
The Internationally comparable common equity tier 1 (CET1) capital ratio is an estimate of Westpac’s CET1 ratio calculated on rules comparable with global peers. The ratio adjusts for differences between APRA’s rules and those applied to global peers. The adjustments are applied to both the determination of regulatory CET1 and the determination of risk weighted assets. The calculation is based on the methodology outlined in the August 2014 Australian Bankers Association report titled ‘International comparability of capital ratios of Australia’s major banks’ prepared by PwC.
Asset quality
Individually assessed provisions (IAPs)
Provisions raised for losses that have already been incurred on loans that are known to be impaired and are assessed on an individual basis. The estimated losses on these impaired loans is based on expected future cash flows discounted to their present value and, as this discount unwinds, interest will be recognised in the income statement.
Collectively assessed provisions (CAPs)
Loans not found to be individually impaired or significant will be collectively assessed in pools of similar assets with similar risk characteristics. The size of the provision is an estimate of the losses already incurred and will be estimated on the basis of historical loss experience for assets with credit characteristics similar to those in the collective pool. The historical loss experience will be adjusted based on current observable data.
Impaired assets Includes exposures that have deteriorated to the point where full collection of interest and principal is in doubt, based on an assessment of the customer’s outlook, cashflow, and the net realisation of value of assets to which recourse is held:
1. facilities 90 days or more past due, and full recovery is not in doubt: exposures where contractual payments are 90 or more days in arrears and the net realisable value of assets to which recourse is held may not be sufficient to allow full collection of interest and principal, including overdrafts or other revolving facilities that remain continuously outside approved limits by material amounts for 90 or more calendar days;
2. non-accrual assets: exposures with individually assessed impairment provisions held against them, excluding restructured loans;
3. restructured assets: exposures where the original contractual terms have been formally modified to provide for concessions of interest or principal for reasons related to the financial difficulties of the customer;
4. other assets acquired through security enforcement (includes other real estate owned): includes the value of any other assets acquired as full or partial settlement of outstanding obligations through the enforcement of security arrangements; and
5. any other assets where the full collection of interest and principal is in doubt.
90 days past due and not impaired
Includes facilities where:
1. contractual payments of interest and/or principal are 90 or more calendar days overdue, including overdrafts or other revolving facilities that remain continuously outside approved limits by material amounts for 90 or more calendar days; or
2. an order has been sought for the customer’s bankruptcy or similar legal action has been instituted which may avoid or delay repayment of its credit obligations; and
3. the estimated net realisable value of assets/security to which Westpac has recourse is sufficient to cover repayment of all principal and interest, or which are not secured but there is a reasonable expectation that full recovery or the amount due will be made and interest is being taken to profit on an accrual basis.
These facilities, while in default, are not treated as impaired for accounting purposes.
Watchlist and substandard
Loan facilities where customers are experiencing operating weakness and financial difficulty but are not expected to incur loss of interest or principal.
Stressed assets Watchlist and substandard, 90 days past due well secured and impaired assets.
Total committed exposure (TCE)
Represents the sum of the committed portion of direct lending (including funds placement overall and deposits placed), contingent and pre-settlement risk plus the committed portion of secondary market trading and underwriting risk.

Interim financial results 2015 Glossary
130 | Westpac Group 2015 Interim Results Announcement
Other
First Half 2015 Six months ended 31 March 2015.
Second Half 2014 Six months ended 30 September 2014.
First Half 2014 Six months ended 31 March 2014.
Prior corresponding period
Refers to the six months ended 31 March 2014.
Prior half / Prior period
Refers to the six months ended 30 September 2014.
JOHCM Refers to J O Hambro Capital Management, a company incorporated in the United Kingdom and acquired by BTIM in October 2011.
Lloyds Refers to the acquisition of select Australian businesses of Lloyds Banking Group including Capital Finance Australia Limited and BOS International (Australia) Ltd on 31 December 2013.
Products per customer
Roy Morgan Research, Products Per Customer, total Banking & Finance (incl Work Based Super) customers aged 18+, 6 month rolling average, March 2015. WRBB refers to Westpac Group (excl STG) and SGB refers to St.George Group) includes: Westpac; Bankers Trust; BT; BT Financial Group; RAMS (until December 11); Rothschild; Challenge Bank; Bank of Melbourne (to July 11). Note that St.George Group includes: Advance (Managed Investment and Superannuation only); Asgard; Bank of Melbourne (from Aug 11); BankSA; RAMS (from Jan 12); Sealcorp; St.George Bank; and Dragondirect.
Wealth penetration metric
Data based on Roy Morgan Research, Respondents aged 14+. Wealth penetration is defined as the number of Australians who have Wealth Management or Insurance with each Group and who also have Traditional Banking products with each Group as a proportion of the number of Australians who have Traditional Banking products with each Group, calculated as the 12 month rolling average to March 2015. Traditional Banking consists of Deposit or Transaction Accounts, Mortgages, Personal Lending or Major Cards. Wealth Management consists of Managed Investments or Superannuation. Insurance consists of Vehicle Insurance, Home Insurance (Building, Contents, Valuable Items), Life Insurance (Life Insurance, Disability Insurance, Income Protection or Replacement Insurance), Household and Property Insurance – Landlord, Business Insurance, Loan Insurance and Public Liability Insurance. WRBB includes Westpac, Bank of Melbourne (until Jul 2011), BT, Challenge Bank, RAMS (until Dec 2011) and Rothschild. SBG includes St.George, Advance Bank, ASGARD, BankSA, Bank of Melbourne (from Aug 2011), Barclays, Dragondirect, Sealcorp and RAMS (from Jan 2012). WBC Group includes WRBB and SBG.
Customer satisfaction – overall business
Source: DBM Consultants Business Financial Services Monitor, March 2015, 6MMA. MFI customers, all businesses. The Customer Satisfaction score is an average of customer satisfaction ratings of the customer’s main financial institution for business banking on a scale of 0 to 10 (0 means ‘extremely dissatisfied’ and 10 means ‘extremely satisfied’).
Customer satisfaction – overall consumer
Source: Roy Morgan Research, March 2015, 6MMA. Main Financial Institution (as defined by the customer). Satisfaction ratings are based on the relationship with the financial institution. Customers must have at least a Deposit/Transaction account relationship with the institution and are aged 14 or over. Satisfaction is the percentage of customers who answered ‘Very’ or ‘Fairly satisfied’ with their overall relationship with their MFI.
Business NPS Source: DBM Consultants Business Financial Services Monitor, March 2015, 6MMA, MFI customers, all businesses.
Consumer NPS Source: Roy Morgan Research, March 2015, six month moving average (6MMA). Main Financial Institution (MFI), as defined by the customer. Consumers aged 14 and over.
Women in Leadership The proportion of women (permanent and maximum term) in people leadership roles or senior roles of influence as a proportion of all leaders across the Group. Includes CEO, Executive Team, General Managers, Senior Managers as direct reports to General Managers and the next two levels of management. Excludes Westpac Pacific.
Run-off Scheduled and unscheduled repayments and debt repayments (from for example property sales, external refinancing), net of redraws.
Credit Value Adjustment (CVA)
CVA adjusts the fair value of over-the-counter derivatives for credit risk. CVA is employed on the majority of derivative positions and reflects the market view of the counterparty credit risk. A Debit Valuation Adjustment (DVA) is employed to adjust for our own credit risk.
Funding Valuation Adjustment (FVA)
FVA reflects the estimated present value of the future market funding cost or benefit associated with funding uncollateralised derivatives.
Liquidity Coverage Ratio (LCR)
An APRA requirement to maintain an adequate level of unencumbered high quality liquid assets, to meet liquidity needs for a 30 calendar day period under an APRA-defined severe stress scenario. Absent a situation of financial stress, the value of the LCR must not be less than 100%, effective 1 January 2015. LCR is calculated as the percentage ratio of stock of HQLA and CLF over the total net cash out flows in a modelled 30 day defined stressed scenario.
High Quality Liquid Assets (HQLA)
As defined by APRA in Australian Prudential Standard APS210 Liquidity, including BS-13 qualifying liquid assets, less RBA open repos funding end of day ESA balances with the RBA.
Third party liquid assets
HQLA and non LCR qualifying liquid assets, but excludes internally securitised assets that are eligible for a repurchase agreement with the RBA and RBNZ.
Interim financial results 2015 Glossary
Westpac Group 2015 Interim Results Announcement | 131
Other (continued)
Total liquid assets Third party liquid assets and internally securitised assets that are eligible for a repurchase agreement with the RBA and RBNZ.
Committed Liquidity Facility (CLF)
The RBA makes available to Australian Authorised Deposit-taking Institutions a CLF that, subject to qualifying conditions, can be accessed to meet LCR requirements under APS210 Liquidity.
Divisional results Divisional results are presented on a management reporting basis. Internal charges and transfer pricing adjustments are included in the performance of each division reflecting the management structure rather than the legal entity (these results cannot be compared to results for individual legal entities). Where management reporting structures or accounting classifications have changed, financial results for comparative periods have been revised and may differ from results previously reported. Overhead costs are allocated to revenue generating divisions.
The Group’s internal transfer pricing frameworks facilitate risk transfer, profitability measurement, capital allocation and divisional alignment, tailored to the jurisdictions in which the Group operates. Transfer pricing allows the Group to measure the relative contribution of products and divisions to the Group’s interest margin and other dimensions of performance. Key components of the Group’s transfer pricing frameworks are funds transfer pricing for interest rate and liquidity risk and allocation of basis and contingent liquidity costs, including capital allocation.