Embed Size (px)
Citation preview
Westpac Banking Corporation ABN 33 007 457 141
The Westpac Group Interim 2010 Results
This interim profit announcement has been prepared for distribution in the United States of America
Table of Contents
2
Half Year 2010 Results
1. Introduction ............................................................................................................................................................ 1
2. Reported Results ................................................................................................................................................... 4
2.1 Reported Results..................................................................................................................................................................4
2.2 Summary Balance Sheet......................................................................................................................................................5
2.3 Key Financial Data ...............................................................................................................................................................6
2.4 Risk Factors..........................................................................................................................................................................8
2.5 Market Share and System Multiple Metrics .......................................................................................................................12
2.6 Product Spread Metrics .....................................................................................................................................................13
3. Review of Group Operations ............................................................................................................................... 14
3.1 Reported Results Summary ...............................................................................................................................................14
3.2 Review of Reported Results ...............................................................................................................................................20
3.3 Credit Quality......................................................................................................................................................................32
3.4 Balance Sheet and Funding ...............................................................................................................................................35
3.5 Capital and Dividends.........................................................................................................................................................39
3.6 Other Regulatory Developments ........................................................................................................................................43
3.7 Sustainability Performance.................................................................................................................................................46
3.8 St.George Merger and Integration......................................................................................................................................49
4. Divisional Results................................................................................................................................................. 51
4.1 Divisional Results ...............................................................................................................................................................51
4.2 Westpac Retail and Business Banking...............................................................................................................................52
4.3 St.George Bank ..................................................................................................................................................................55
4.4 Westpac Institutional Bank .................................................................................................................................................57
4.5 BT Financial Group (Australia) ...........................................................................................................................................60
4.6 New Zealand ......................................................................................................................................................................62
4.7 Pacific Banking ...................................................................................................................................................................65
4.8 Group Businesses ..............................................................................................................................................................67
5. Reconciliation of Group Segment Information .................................................................................................. 69
5.1 Half Year Segment Result ..................................................................................................................................................69
5.2 Cash Earnings Adjustments ...............................................................................................................................................72
6. First Half 2010 Reported Financial Information ................................................................................................. 73
6.1 Consolidated Income Statement (unaudited) .....................................................................................................................74
6.2 Consolidated Balance Sheet (unaudited) ...........................................................................................................................75
6.3 Consolidated Cash Flow Statement (unaudited) ................................................................................................................76
6.4 Consolidated Statement of Other Comprehensive Income (unaudited) .............................................................................77
6.5 Consolidated Statement of Changes in Equity (unaudited)................................................................................................78
6.6 Notes to First Half 2010 Reported Financial Information (unaudited) ................................................................................79
6.7 Statement in Relation to the Review of the Financial Statements....................................................................................108
7. Other Information ............................................................................................................................................... 109
7.1 Credit Ratings and Exchange Rates ................................................................................................................................109
7.2 Financial Calendar............................................................................................................................................................110
8. Glossary .............................................................................................................................................................. 111 In this announcement references to ‘Westpac’, ‘WBC’, ‘the Westpac Group’, ‘the Group’, ‘we’, ‘us’ and ‘our’ are to Westpac Banking Corporation and its controlled entities.
Introduction
1
1. Introduction
This interim profit announcement has been prepared for distribution in the United States.
Our interim period refers to the six months ended 31 March 2010 (First Half 2010). Throughout this profit announcement we also refer to the six months ended 31 March 2009 (First Half 2009) and the six months ended 30 September 2009 (Second Half 2009).
The selected financial information for the First Half 2010, First Half 2009 and Second Half 2009 contained in this profit announcement is based on the financial statements contained in the unaudited consolidated interim financial report for Westpac Banking Corporation and its controlled entities (Group) for the six months ended 31 March 2010. The interim financial report has been prepared in accordance with Australian equivalents to International Financial Reporting Standards (AIFRS). The interim financial report also complies with International Financial Reporting Standards as issued by the International Accounting Standards Board (IASB).
The interim financial report reflects the merger with St.George Bank Limited (St.George) which for consolidation purposes was effective from close of business 17 November 2008. Therefore the statutory reported results of the Group incorporate the results of St.George from, and including, 18 November 2008. For the purpose of analysis throughout this profit announcement, it is important to recognise that the timing of the St.George merger has resulted in the inclusion of approximately six weeks of additional St.George results in First Half 2010 compared to First Half 2009.
All dollar values in this announcement are in Australian dollars unless otherwise noted. References to ‘US$’ or ‘US dollars’ are to United States dollars, references to ‘dollar amounts’, ‘$’, ‘AUD’ or ‘A$’ are to Australian dollars and references to ‘NZ$’ or ‘NZD’ are to New Zealand dollars. For the convenience of the reader, this profit announcement contains translations of certain Australian dollar amounts into US dollars at specified rates. These translations should not be construed as representations that the Australian dollar amounts actually represent such US dollar amounts or have been or could be converted into US dollars at the rate indicated. Unless otherwise stated, the translation of Australian dollars into US dollars has been made at the rate of A$1 = US$0.9169, the noon buying rate in New York City for cable transfers in Australian dollars as certified for customs purposes by the Federal Reserve Bank of New York (the ‘noon buying rate’) on 31 March 2010. Refer to Section 7.1, ‘Credit Ratings and Exchange Rates’ for information regarding the rates of exchange between the Australian dollar and the US dollar applied by the Group as part of its operating activities for the First Half 2009, the Second Half 2009 and the First Half 2010.
In addition to discussing the AIFRS financial information in this announcement, we also discuss the following non-AIFRS financial information:
Cash Earnings During the First Half 2010, the accounting standard AASB 8 Operating Segments was applied for the first time. This standard requires segment results to be presented on a basis that is consistent with information provided internally to Westpac’s key decision makers. In assessing the financial performance of our divisions, we use a measure of performance referred to as ‘Cash Earnings’. To calculate Cash Earnings we adjust the statutory results for the items outlined below. We believe this allows us to more effectively assess performance for First Half 2010 against prior periods and to compare performance across business divisions and across peer companies. A reconciliation of Cash Earnings to net profit attributable to owners of WBC for each business division is set forth in Section 5.
Three categories of adjustments are made to statutory results to determine Cash Earnings:
Material items that key decision makers at Westpac believe do not reflect ongoing operations;
Items that are not considered when dividends are recommended, such as the amortisation of intangibles and economic hedging impacts; and
Accounting reclassifications between individual line items that do not impact statutory results, such as policy holder tax recoveries.
Cash Earnings adjustments include the following:
Treasury Shares – Under AIFRS, Westpac shares held by the Group in the managed funds and life business are deemed to be Treasury shares and the results of holding these shares are not permitted to be recognised as income. In deriving Cash Earnings, these results are included to ensure there is no asymmetrical impact on the Group’s profits because the Treasury shares support policyholder liabilities and equity derivative transactions which are re-valued in deriving income;
Trust Preferred Securities (TPS) Revaluations – Adjustment for economic hedges, including associated tax effects impacting the Foreign Currency Translation Reserve, relating to hybrid instruments classified as non-controlling interests. The hybrid instrument is not fair valued, however, the hedge is fair valued and therefore there is a mismatch in the timing of income recognition in the statutory results. The mismatch is added back in deriving Cash Earnings as it does not affect the Group’s profits over time;
Introduction (continued)
2
Fair value gain/(loss) on other economic hedges (which do not qualify for hedge accounting under AIFRS) comprises:
- The unrealised fair value gain/(loss) on foreign exchange hedges of future New Zealand earnings impacting non-interest income is reversed in deriving Cash Earnings in the current period as they may potentially create a material timing difference on reported earnings but does not affect the Group’s profits over the life of the hedge;
- The unrealised fair value gain/(loss) on foreign exchange hedges of fees payable for the use of the government guarantee on foreign denominated wholesale funding is reversed in deriving Cash Earnings in the current period as it may potentially create a material timing difference on reported earnings but does not affect the Group’s profits over the life of the hedge; and
- The unrealised fair value gains/(losses) on cross currency swaps hedging accrual accounted term funding transactions are reversed in deriving Cash Earnings in the current period as it may potentially create a material timing difference on reported earnings but does not affect the Group’s profits over the life of the hedge.
Ineffective hedges – The gain/(loss) on ineffective hedges is reversed in deriving Cash Earnings for the period because the gain or loss arising from the fair value movement in these hedges reverses over time and does not affect the Group’s profits over the life of the hedge;
Amortisation of intangible assets – The merger with St.George resulted in the recognition of core deposits intangibles and relationships intangible assets that will be amortised over their useful lives ranging between 5 and 9 years. The amortisation of intangible assets (excluding software) is reversed in determining Cash Earnings because it is a non-cash item and does not affect the amount of cash the Group has available to pay as dividends to shareholders;
Significant items:
- As a result of the merger with St.George, we have incurred and expect to continue to incur transaction and integration expenses over a three year period. As these expenses are incurred they are being treated as Cash Earnings adjustments as they do not impact the earnings we expect St.George to generate following the integration period;
- In Second Half 2009, the Group increased tax provisioning by $703 million with respect to New Zealand structured finance transactions entered into between 1998 and 2002. The provision was increased in Second Half 2009 following the High Court in New Zealand finding in favour of the New Zealand Commissioner of Inland Revenue (CIR) in proceedings where Westpac challenged amended tax assessments in relation to these transactions. Due to the significant size and historical nature of the issue, it has been treated as a Cash Earnings adjustment. In First Half 2010, the Group reached a settlement with the CIR by agreeing to pay 80% of the full amount of primary tax and interest. The reversal of tax provision of $106 million in First Half 2010 has also been treated as a Cash Earnings adjustment;
- The deposit and short-term wholesale funding fair value adjustment associated with the accounting for the merger with St.George was fully amortised during the year ended 30 September 2009 reflecting the contractual maturity of the deposits and borrowings and increased net interest income by $55 million ($35 million after tax) in Second Half 2009 and $168 million ($118 million after tax) in First Half 2009. Due to the significant size and short-term nature of this adjustment, it has been treated as a Cash Earnings adjustment; and
- The Group recognised a provision of $121 million ($85 million after tax) with respect to long-standing legal proceedings, where a judgment was received during First Half 2009 with subsequent clarification of the judgement received during the Second Half 2009. This was treated as a Cash Earnings adjustment due to its size and historical nature of the proceeding.
Policyholder Tax Recoveries The Life Insurance Standard AASB 1038 requires the grossing up of tax expense and non-interest income for the tax on earnings applicable to holders of our life policies (policyholder tax recoveries). While this has no impact at the Cash Earnings level, we reverse the impact of this gross-up on a line item basis in the Cash Earnings results to provide comparability across reporting periods.
Average Ordinary Equity Average ordinary equity is calculated as the monthly average of ordinary shareholders’ equity less average non-controlling interests and average hybrid equity balances. Management believes this measure of average ordinary equity is useful in the calculation of return on equity as it removes the impact of equity attributable to non-controlling interests.
Other companies may use different methodologies to calculate average ordinary equity or similar non-AIFRS financial measures.
Introduction (continued)
3
Disclosure Regarding Forward-Looking Statements This profit announcement contains statements that constitute ‘forward-looking statements’ within the meaning of Section 21E of the US Securities Exchange Act of 1934.
Forward-looking statements are statements about matters that are not historical facts. Forward-looking statements appear in a number of places in this profit announcement and include statements regarding our intent, belief or current expectations with respect to our business and operations, market conditions, results of operations and financial condition, including, without limitation, future loan loss provisions and financial support to certain borrowers. This profit announcement uses words such as ‘will’, ‘may’, ‘expect’, ‘intend’, ‘seek’, ‘would’, ‘should’, ‘could’, ‘continue’, ‘plan’, ‘estimate’, ‘anticipate’, ‘believe’, ‘probability’, ‘risk’, or other similar words to identify forward-looking statements. These forward-looking statements reflect our current views with respect to future events and are subject to change, certain risks, uncertainties and assumptions which are, in many instances, beyond our control and have been made based upon management’s expectations and beliefs concerning future developments and their potential effect upon us. There can be no assurance that future developments will be in accordance with our expectations or that the effect of future developments on us will be those anticipated. Actual results may vary materially from those we expect, depending on the outcome of various factors, including, but are not limited to:
the effect of, and changes in, laws, regulations, taxation or accounting standards or practices and government policy, particularly changes to liquidity and capital requirements arising in response to the global financial crisis;
continuing impacts of the global financial crisis, including volatile conditions in funding, equity and asset markets;
our ability to successfully integrate St.George into our operations including our ability to realise anticipated synergies and the costs of achieving those synergies;
changes to our credit ratings;
inflation, interest rate, exchange rate, market and monetary fluctuations;
market liquidity and investor confidence;
changes in consumer spending, saving and borrowing habits in Australia, New Zealand and in other countries in which Westpac conducts its operations;
the effects of competition in the geographic and business areas in which Westpac conducts its operations;
the ability to maintain or to increase market share and control expenses;
the timely development of and acceptance of new products and services and the perceived overall value of these products and services by users;
technological changes and risks associated with changes to our technology systems;
demographic changes and changes in political, social or economic conditions in any of the major markets in which Westpac operates;
stability of Australian and international financial systems and disruptions to financial markets and any losses Westpac may experience as a result; and
various other factors beyond Westpac’s control.
The above list is not exhaustive. For certain other factors that may impact on forward-looking statements made by us, refer to Section 2.4 ‘Risk Factors’. When relying on forward-looking statements to make decisions with respect to us, investors and others should carefully consider the foregoing factors and other uncertainties and events.
Westpac is under no obligation, and does not intend, to update any forward-looking statements contained in this profit announcement, whether as a result of new information, future events or otherwise, after the date of this profit announcement.
Web sites Information contained in or otherwise accessible through the web sites mentioned in this profit announcement does not form part of this profit announcement unless we specifically state that the information is incorporated by reference thereby forming part of the report. All references in this profit announcement to web sites are inactive textual references and are for information only.
Reported Results
4
2. Reported Results
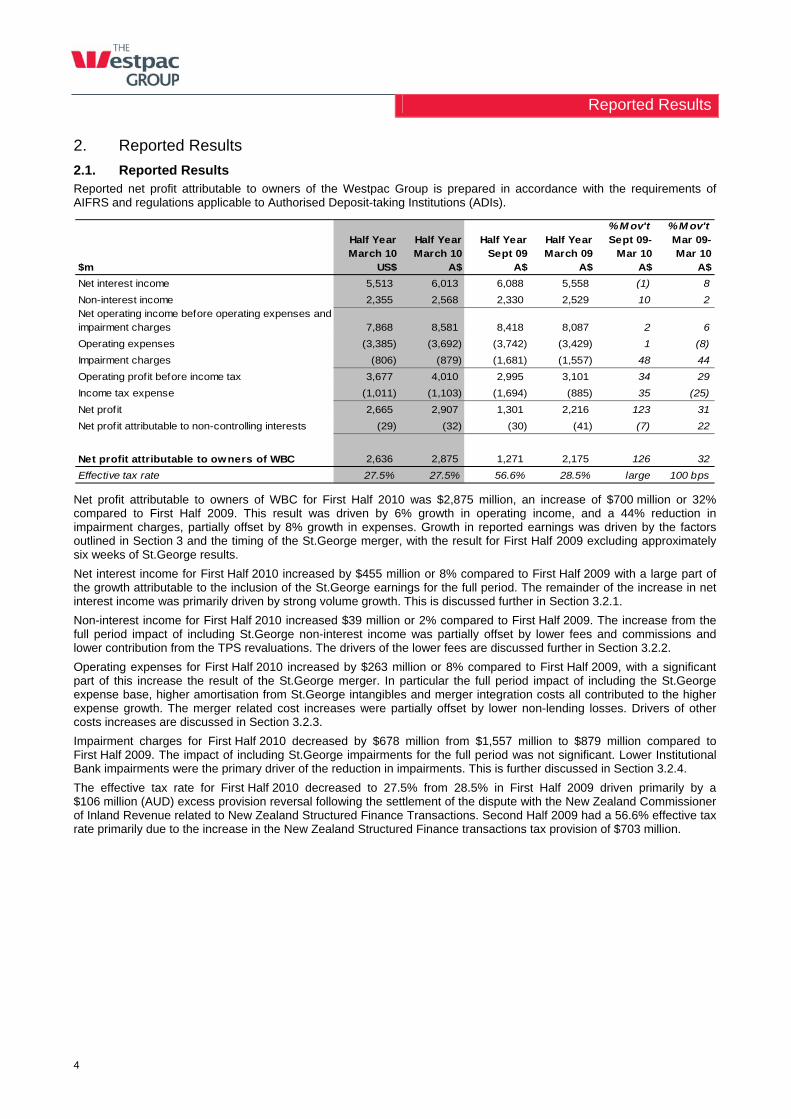
2.1. Reported Results Reported net profit attributable to owners of the Westpac Group is prepared in accordance with the requirements of AIFRS and regulations applicable to Authorised Deposit-taking Institutions (ADIs).
% M ov't % M ov'tHalf Year March 10
Half Year March 10
Half Year Sept 09
Half Year March 09
Sept 09-Mar 10
Mar 09-Mar 10
$m US$ A$ A$ A$ A$ A$
Net interest income 5,513 6,013 6,088 5,558 (1) 8
Non-interest income 2,355 2,568 2,330 2,529 10 2Net operating income before operating expenses and impairment charges 7,868 8,581 8,418 8,087 2 6
Operating expenses (3,385) (3,692) (3,742) (3,429) 1 (8)
Impairment charges (806) (879) (1,681) (1,557) 48 44
Operating profit before income tax 3,677 4,010 2,995 3,101 34 29
Income tax expense (1,011) (1,103) (1,694) (885) 35 (25)
Net profit 2,665 2,907 1,301 2,216 123 31
Net profit attributable to non-controlling interests (29) (32) (30) (41) (7) 22
Net profit attributable to owners of WBC 2,636 2,875 1,271 2,175 126 32
Effective tax rate 27.5% 27.5% 56.6% 28.5% large 100 bps
Net profit attributable to owners of WBC for First Half 2010 was $2,875 million, an increase of $700 million or 32% compared to First Half 2009. This result was driven by 6% growth in operating income, and a 44% reduction in impairment charges, partially offset by 8% growth in expenses. Growth in reported earnings was driven by the factors outlined in Section 3 and the timing of the St.George merger, with the result for First Half 2009 excluding approximately six weeks of St.George results.
Net interest income for First Half 2010 increased by $455 million or 8% compared to First Half 2009 with a large part of the growth attributable to the inclusion of the St.George earnings for the full period. The remainder of the increase in net interest income was primarily driven by strong volume growth. This is discussed further in Section 3.2.1.
Non-interest income for First Half 2010 increased $39 million or 2% compared to First Half 2009. The increase from the full period impact of including St.George non-interest income was partially offset by lower fees and commissions and lower contribution from the TPS revaluations. The drivers of the lower fees are discussed further in Section 3.2.2.
Operating expenses for First Half 2010 increased by $263 million or 8% compared to First Half 2009, with a significant part of this increase the result of the St.George merger. In particular the full period impact of including the St.George expense base, higher amortisation from St.George intangibles and merger integration costs all contributed to the higher expense growth. The merger related cost increases were partially offset by lower non-lending losses. Drivers of other costs increases are discussed in Section 3.2.3.
Impairment charges for First Half 2010 decreased by $678 million from $1,557 million to $879 million compared to First Half 2009. The impact of including St.George impairments for the full period was not significant. Lower Institutional Bank impairments were the primary driver of the reduction in impairments. This is further discussed in Section 3.2.4.
The effective tax rate for First Half 2010 decreased to 27.5% from 28.5% in First Half 2009 driven primarily by a $106 million (AUD) excess provision reversal following the settlement of the dispute with the New Zealand Commissioner of Inland Revenue related to New Zealand Structured Finance Transactions. Second Half 2009 had a 56.6% effective tax rate primarily due to the increase in the New Zealand Structured Finance transactions tax provision of $703 million.
Reported Results (continued)
5
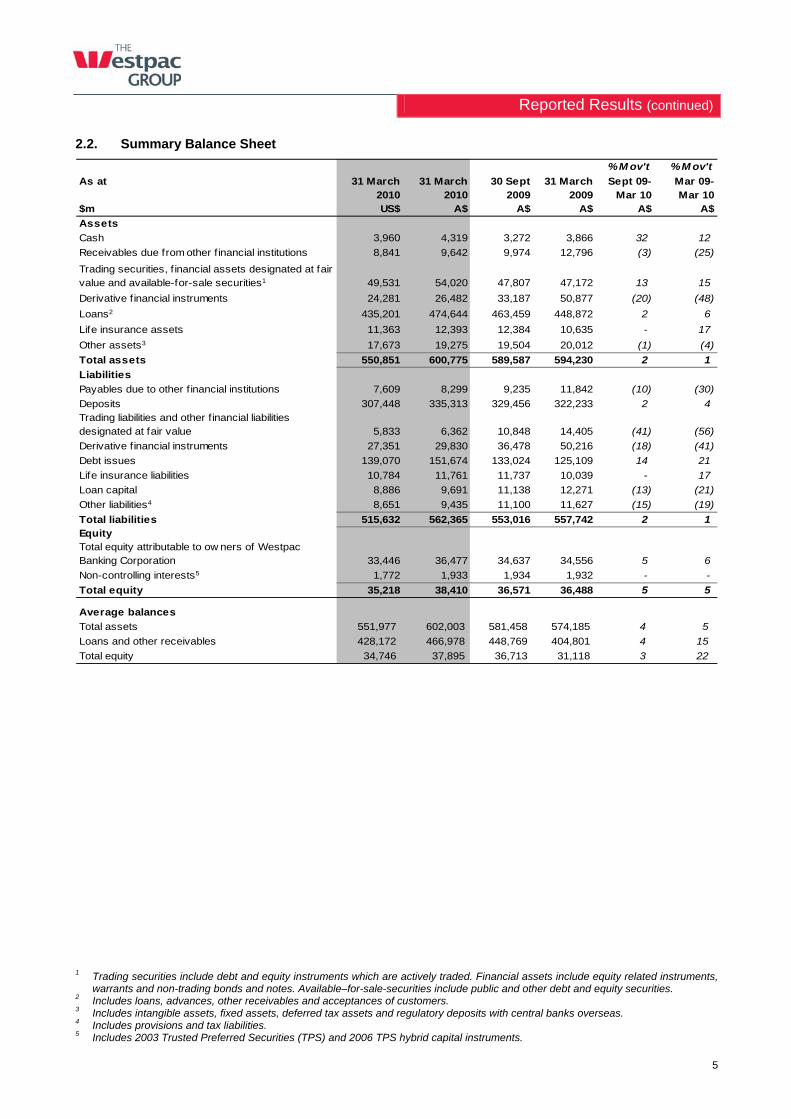
2.2. Summary Balance Sheet
% M ov't % M ov't
As at 31 March 2010
31 March 2010
30 Sept 2009
31 March2009
Sept 09-Mar 10
Mar 09-Mar 10
$m US$ A$ A$ A$ A$ A$
Assets
Cash 3,960 4,319 3,272 3,866 32 12
Receivables due from other f inancial institutions 8,841 9,642 9,974 12,796 (3) (25)
Trading securities, f inancial assets designated at fair value and available-for-sale securities1 49,531 54,020 47,807 47,172 13 15
Derivative financial instruments 24,281 26,482 33,187 50,877 (20) (48)
Loans2 435,201 474,644 463,459 448,872 2 6
Life insurance assets 11,363 12,393 12,384 10,635 - 17
Other assets3 17,673 19,275 19,504 20,012 (1) (4)
Total assets 550,851 600,775 589,587 594,230 2 1
Liabilities
Payables due to other financial institutions 7,609 8,299 9,235 11,842 (10) (30)
Deposits 307,448 335,313 329,456 322,233 2 4 Trading liabilities and other financial liabilities designated at fair value 5,833 6,362 10,848 14,405 (41) (56)
Derivative financial instruments 27,351 29,830 36,478 50,216 (18) (41)
Debt issues 139,070 151,674 133,024 125,109 14 21
Life insurance liabilities 10,784 11,761 11,737 10,039 - 17
Loan capital 8,886 9,691 11,138 12,271 (13) (21)
Other liabilities4 8,651 9,435 11,100 11,627 (15) (19)
Total liabilities 515,632 562,365 553,016 557,742 2 1 EquityTotal equity attributable to ow ners of Westpac Banking Corporation 33,446 36,477 34,637 34,556 5 6
Non-controlling interests5 1,772 1,933 1,934 1,932 - -
Total equity 35,218 38,410 36,571 36,488 5 5
Average balances
Total assets 551,977 602,003 581,458 574,185 4 5
Loans and other receivables 428,172 466,978 448,769 404,801 4 15
Total equity 34,746 37,895 36,713 31,118 3 22
1 Trading securities include debt and equity instruments which are actively traded. Financial assets include equity related instruments,
warrants and non-trading bonds and notes. Available–for-sale-securities include public and other debt and equity securities. 2 Includes loans, advances, other receivables and acceptances of customers. 3 Includes intangible assets, fixed assets, deferred tax assets and regulatory deposits with central banks overseas. 4 Includes provisions and tax liabilities. 5 Includes 2003 Trusted Preferred Securities (TPS) and 2006 TPS hybrid capital instruments.
Reported Results (continued)
6
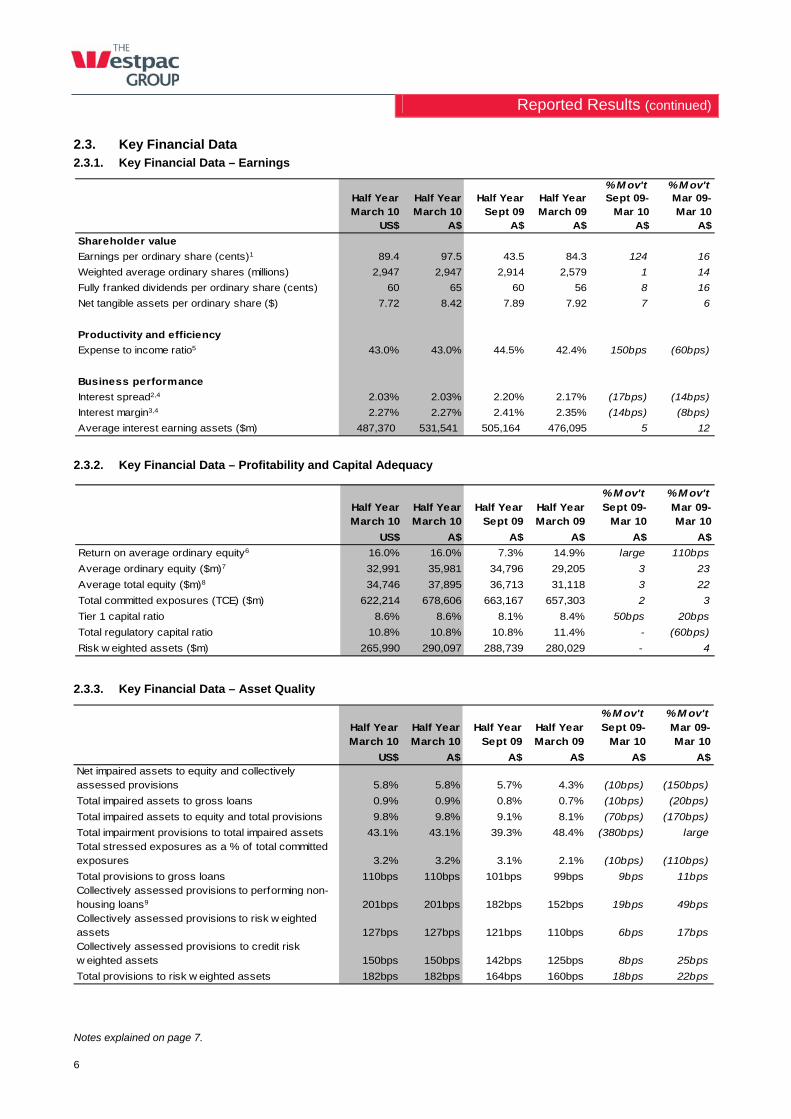
2.3. Key Financial Data 2.3.1. Key Financial Data – Earnings
% M ov't % M ov'tHalf Year March 10
Half Year March 10
Half Year Sept 09
Half Year March 09
Sept 09-Mar 10
Mar 09-Mar 10
US$ A$ A$ A$ A$ A$
Shareholder value
Earnings per ordinary share (cents)1 89.4 97.5 43.5 84.3 124 16
Weighted average ordinary shares (millions) 2,947 2,947 2,914 2,579 1 14
Fully franked dividends per ordinary share (cents) 60 65 60 56 8 16
Net tangible assets per ordinary share ($) 7.72 8.42 7.89 7.92 7 6
Productivity and efficiency
Expense to income ratio5 43.0% 43.0% 44.5% 42.4% 150bps (60bps)
Business performance
Interest spread2,4 2.03% 2.03% 2.20% 2.17% (17bps) (14bps)
Interest margin3,4 2.27% 2.27% 2.41% 2.35% (14bps) (8bps)
Average interest earning assets ($m) 487,370 531,541 505,164 476,095 5 12
2.3.2. Key Financial Data – Profitability and Capital Adequacy
% M ov't % M ov'tHalf Year March 10
Half Year March 10
Half Year Sept 09
Half Year March 09
Sept 09-Mar 10
Mar 09-Mar 10
US$ A$ A$ A$ A$ A$
Return on average ordinary equity6 16.0% 16.0% 7.3% 14.9% large 110bps
Average ordinary equity ($m)7 32,991 35,981 34,796 29,205 3 23
Average total equity ($m)8 34,746 37,895 36,713 31,118 3 22
Total committed exposures (TCE) ($m) 622,214 678,606 663,167 657,303 2 3
Tier 1 capital ratio 8.6% 8.6% 8.1% 8.4% 50bps 20bps
Total regulatory capital ratio 10.8% 10.8% 10.8% 11.4% - (60bps)
Risk w eighted assets ($m) 265,990 290,097 288,739 280,029 - 4
2.3.3. Key Financial Data – Asset Quality
% M ov't % M ov'tHalf Year March 10
Half Year March 10
Half Year Sept 09
Half Year March 09
Sept 09-Mar 10
Mar 09-Mar 10
US$ A$ A$ A$ A$ A$Net impaired assets to equity and collectively assessed provisions 5.8% 5.8% 5.7% 4.3% (10bps) (150bps)
Total impaired assets to gross loans 0.9% 0.9% 0.8% 0.7% (10bps) (20bps)
Total impaired assets to equity and total provisions 9.8% 9.8% 9.1% 8.1% (70bps) (170bps)
Total impairment provisions to total impaired assets 43.1% 43.1% 39.3% 48.4% (380bps) large Total stressed exposures as a % of total committed exposures 3.2% 3.2% 3.1% 2.1% (10bps) (110bps)
Total provisions to gross loans 110bps 110bps 101bps 99bps 9bps 11bpsCollectively assessed provisions to performing non-housing loans9 201bps 201bps 182bps 152bps 19bps 49bpsCollectively assessed provisions to risk w eighted assets 127bps 127bps 121bps 110bps 6bps 17bpsCollectively assessed provisions to credit risk w eighted assets 150bps 150bps 142bps 125bps 8bps 25bps
Total provisions to risk w eighted assets 182bps 182bps 164bps 160bps 18bps 22bps
Notes explained on page 7.
Reported Results (continued)
7
Notes to Section 2.3:
1 Based on the average number of fully paid ordinary shares outstanding for the relevant six month period. Earnings are calculated as net profit attributable to owners of WBC.
2 Calculated as the difference between the average yield (including tax equivalent gross up for the periods ended 30 September 2009 and 31 March 2009) on all interest earnings assets and the average rate paid on all interest bearing liabilities.
3 Calculated by dividing net interest income (including tax equivalent gross up for the periods ended 30 September 2009 and 31 March 2009) by average interest earning assets.
4 The tax equivalent gross up relating to Structured Finance transactions was discontinued in First Half 2010 reflecting the immaterial nature of the balance as the Group continues to run-down the related assets. For prior periods, net interest spread and margin are calculated on net interest income adjusted for tax equivalent gross up of $22 million for the Second Half 2009 and $23 million in the First Half 2009. In the presentation of the average balance sheet, net interest spread and net interest margin are also presented on a tax equivalent basis for the Second Half 2009 and the First Half 2009. Refer to Section 6, Note 3 Average Balance Sheet and Interest Rates, for a reconciliation of net interest income used in the calculation of net interest spread and net interest margin.
5 Calculated as Group operating expenses excluding impairment charges divided by Group net operating income before operating expenses and impairment charges.
6 Calculated as net profit attributable to owners of WBC divided by average ordinary equity (annualised). 7 Calculated as average total equity less average non-controlling interests. 8 Average total equity is the average balance of shareholders’ equity, including non-controlling interests. 9 Non-housing loans have been determined on a loan purpose basis.
Reported Results (continued)
8
2.4. Risk Factors
Principal risks and uncertainties Our business is subject to risks that can adversely impact our business, results of operations, financial condition and future performance. If any of the following risks occur, our business, results of operations or financial condition could be materially adversely affected, with the result that the trading price of our securities could decline and you could lose all, or part, of your investment. You should carefully consider the risks and the other information in this profit announcement and our 2009 Annual Report filed on form 20-F before investing in our securities. The risks and uncertainties described below are not the only ones we may face. Additional risks and uncertainties that we are unaware of, or that we currently deem to be immaterial, may also become important factors that affect us.
Risks relating to our business
Our businesses are highly regulated and we could be adversely affected by changes in regulations and regulatory policy Compliance risk arises from the regulatory standards that apply to us as a financial institution. All of our businesses are highly regulated in the jurisdictions in which we do business. We are responsible for ensuring that we comply with all applicable legal and regulatory requirements (including accounting standards) and industry codes of practice, as well as meeting our ethical standards. The nature and impact of future changes in such policies are not predictable and are beyond our control.
The recent global financial crisis is leading to changes in regulation in most markets in which we operate, particularly for financial institutions. These changes may include changes in capital adequacy and liquidity. Other changes to prudential requirements, accounting and reporting requirements, tax legislation, regulation relating to remuneration, consumer protection legislation, or changes in the oversight approach of regulators may also occur. It is also possible that governments in jurisdictions in which we do business or obtain funding might revise their application of existing regulatory policies that apply to, or impact, Westpac’s business, including for reasons relating to national and systemic stability.
Changes in law, regulations or regulatory policy could adversely affect one or more of our businesses, including limiting our ability to do business, and could require us to incur substantial costs to comply or impact our capital and liquidity requirements. The failure to comply with applicable regulations could result in fines and penalties or limitations on our ability to do business. These costs, expenses and limitations could have a material adverse effect on our business, financial performance or financial condition.
For further information regarding accounting standards refer to the sections ‘Adoption of new and revised accounting policies’, ‘Critical accounting assumptions and estimates’ and ‘Future accounting developments’ in Note 1 to the 2009 Financial Statements in our 2009 Annual Report.
Adverse credit and capital market conditions may significantly affect our ability to meet liquidity needs, adversely affect our access to domestic and international capital markets and increase our cost of funding Global credit and capital markets have experienced extreme volatility, disruption and decreased liquidity in recent years. While some stability has returned to markets in the last six months, the environment remains volatile. We rely on credit and capital markets to fund our business. As of 31 March 2010, approximately 43% of our total funding originated from domestic and international wholesale markets. As a result of the recent adverse global capital market conditions our funding costs have increased.
A shift in investment preferences of businesses and consumers away from bank deposits toward other asset or investment classes would increase our need for funding from wholesale markets.
The Australian Government withdrew the Australian government guarantee scheme for wholesale funding from 31 March 2010 and the New Zealand Government withdrew its wholesale funding guarantee facility from 30 April 2010. Although Westpac had not utilised either guarantee for new long term funding since January 2010, our continued access to the unguaranteed market is dependent on investor appetite.
If our current sources of funding prove to be insufficient, we may be forced to seek alternative financing. The availability of such alternative financing, and the terms on which it may be available, will depend on a variety of factors, including prevailing market conditions, the availability of credit, our credit ratings and credit capacity. Even if available, the cost of these alternatives may be more expensive or on unfavourable terms, which could adversely affect our results of operations, liquidity, capital resources and financial condition. There is no assurance that we will be able to obtain funding at acceptable prices.
If Westpac is unable to source appropriate funding, we may be forced to reduce our lending or begin to sell liquid securities. Such actions would adversely impact our business, results of operations, liquidity, capital resources and financial condition.
For a more detailed description of liquidity risk, refer to the section ‘Liquidity Risk’ in our 2009 Annual Report.
Reported Results (continued)
9
Failure to maintain credit ratings could adversely affect our cost of funds, liquidity, competitive position and access to capital markets The credit ratings assigned to us by rating agencies are based on an evaluation of a number of factors, including our financial strength.
In light of the recent difficulties in the banking sector and financial markets, one rating agency has indicated they remain concerned about the level of wholesale funding of the major Australian banks and are waiting for new regulations to be clarified to determine any rating implications.
Moodys has all the major Australian banks, including Westpac, on a negative outlook. A credit rating downgrade could also be driven by the occurrence of one or more of the other risks identified in this section or by other events.
If we fail to maintain our current credit ratings, this would adversely affect our cost of funds and related margins, liquidity, competitive position and our access to capital markets.
A systemic shock in relation to the Australian, New Zealand or global financial systems could have adverse consequences for Westpac that would be difficult to predict and respond to In the current global economic environment, there is a risk that another major systemic shock could occur that causes a further adverse impact on the Australian, New Zealand or global financial systems. Such an event could have a material adverse effect on financial institutions such as Westpac, including the undermining of confidence in the financial systems, reducing liquidity and impairing access to funding. The nature and consequences of any such event are difficult to predict and there can be no guarantee that we could respond effectively to any such event.
Declines in asset markets could adversely affect our operations or profitability Declines in Australian, New Zealand and other global asset markets, including equity, property and other asset markets, could adversely affect our operations and profitability.
Declining asset prices impact our wealth management business and other asset holdings. Earnings in our wealth management business are, in part, dependent on asset values, such as the value of securities held or managed. A decline in asset prices could negatively impact the earnings of the division.
Declining asset prices could also impact customers and the value of security we hold against loans which may impact our ability to recover amounts owing to us if customers were to default. It also affects our level of provisioning which in turn impacts on profitability.
Our business is substantially dependent on the Australian and New Zealand economies Our revenues and earnings are dependent on economic activity and the level of financial services our customers require. In particular, lending is dependent on customer confidence, economic activity, the state of the home lending market and prevailing market interest rates in the countries in which we operate.
We currently conduct the majority of our business in Australia and New Zealand and, consequently, our performance is influenced by the level and cyclical nature of business and home lending in these countries. These factors are in turn impacted by both domestic and international economic and political events. The global financial crisis adversely impacted global economic activity which, in turn, impacted the Australian and New Zealand economies. This has led to a slowdown in credit growth and an increase in impaired assets. While activity has improved there is the risk of further declines in economic activity, or recession, in international economies which could affect our financial performance if we operate in those regions or could lead to a similar effect in Australia and New Zealand. Should this occur, our results of operations, liquidity, capital resources and financial condition could be adversely affected.
An increase in defaults under our loan portfolio could adversely affect our results of operations, liquidity, capital resources and financial condition Credit risk is a significant risk and arises primarily from our lending activities. The risk arises from the likelihood that some customers will be unable to honour their obligations to us, including the repayment of loans and interest. Credit exposures also include our dealings with, and holdings of, debt securities issued by other banks and financial institutions whose conditions may be impacted to varying degrees by recent turmoil in the global financial markets.
We hold collective and individually assessed provisions for impaired assets. As a result of the recent market and economic conditions, we have increased our impairment provisions and, if economic conditions deteriorate, some customers could experience higher levels of financial stress and we may experience a significant increase in defaults and write-offs, and be required to increase our provisioning. Such actions would diminish available capital and would adversely affect our results of operations, liquidity, capital resources and financial condition.
For a discussion on our risk management procedures, including the management of credit risk, refer to the section ‘Risk management’ in our 2009 Annual Report.
The withdrawal of the actions implemented by the Australian, New Zealand, United States and other foreign governments and other governmental and regulatory bodies to stabilise financial markets could lead to a recurrence of instability in financial markets, which may adversely affect our business In response to the global financial crisis stabilising actions were taken by governments and regulatory bodies in Australia, New Zealand, the United States, the United Kingdom, Europe and other jurisdictions. These governments have begun to withdraw these measures.
Reported Results (continued)
10
There can be no assurance as to what effect the withdrawal or modification of stabilising actions will have on financial markets, consumer and investor confidence, or the levels of volatility in financial markets.
In the event of renewed economic deterioration there is no guarantee that governments and regulatory bodies would seek to, or be successful in, stabilising financial markets. Further declines in consumer and investor confidence and continued uncertainty and volatility could materially adversely affect our business, financial condition and results of operations.
We face intense competition in all aspects of our business We compete, both domestically and internationally, with asset managers, retail and commercial banks, investment banking firms, brokerage firms, and other financial service firms. In addition, the trend toward consolidation in the global financial services industry is creating competitors with broader ranges of product and service offerings, increased access to capital, and greater efficiency and pricing power.
If we are unable to compete effectively in our various businesses and markets, our business, results of operations and financial condition would be adversely affected.
For more detail on how we address competitive pressures refer to the section ‘Competition’ in our 2009 Annual Report.
We could suffer losses due to market volatility We are exposed to market risk as a consequence of our trading activities in financial markets and through the asset and liability management of our financial position. In our financial markets trading business, we are exposed to losses arising from adverse movements in levels and volatility of interest rates, foreign exchange rates, commodity prices, credit prices and equity prices. If we were to suffer substantial losses due to any market volatility it may adversely affect our results of operations, liquidity, capital resources and financial condition.
For a discussion of our risk management procedures, including the management of market risk, refer to the section ‘Risk management’ in our 2009 Annual Report.
We could suffer losses due to operational risks or environmental factors As a financial services organisation we are exposed to a variety of other risks including those resulting from process error, fraud, information technology instability and failure, system failure, security and physical protection, customer services, staff competence, external events (including fire, flood, earthquake or pandemic) that cause material damage, impact on our operations or adversely affect demand for our products and services, and product development and maintenance. Operational risks can directly impact our reputation and result in financial losses which would adversely affect our financial performance or financial condition.
In addition we and our customers operate businesses and hold assets in a diverse range of geographical locations. Any significant environmental change in any of these locations has the potential to disrupt business activities or affect the value of assets held in the affected locations. For a discussion of our risk management procedures, including the management of operational risk, refer to the section ‘Risk management’ in our 2009 Annual Report.
Technology Our ability to develop and deliver products and services to our customers is dependent upon technology that requires periodic renewal. We are constantly managing technology projects including projects to consolidate duplicate technology platforms, simplify and enhance our technology and operations environments, improve productivity and provide for a better customer experience. Failure to implement these projects effectively could result in cost overruns, operational instability, or operating technology that could place us at a competitive disadvantage and may adversely affect our results of operations.
Reputational damage could harm our business and prospects Various issues may give rise to reputational risk and cause harm to our business and our prospects. These issues include appropriately dealing with potential conflicts of interest, legal and regulatory requirements, ethical issues, money laundering laws, trade sanctions legislation, privacy laws, information security policies, sales and trading practices and conduct by companies in which we hold strategic investments. Failure to address these issues appropriately could also give rise to additional legal risk, subject us to regulatory enforcement actions, fines and penalties, or harm our reputation among our customers and our investors in the marketplace.
We could suffer losses if we fail to syndicate or sell down underwritten equity securities As a financial intermediary we underwrite listed and unlisted equity securities. Equity underwriting activities include the development of solutions for corporate and institutional customers who need equity capital and investor customers who have an appetite for equity-based investment products. We may guarantee the pricing and placement of these facilities. We could suffer losses if we fail to syndicate or sell down our risk to other market participants.
The integration of our operations and those of St.George presents significant challenges that could delay or diminish the anticipated benefits of the merger There are risks associated with the integration of two organisations of the size of Westpac and St.George. Particular areas of risk include: difficulties or unexpected costs relating to the integration of operating systems and processes; unexpected losses of key personnel; decrease in employee morale; senior management time requirements and

Reported Results (continued)
11
distraction from the day to day business; and potential damage to the reputation of brands due to actions from competitors, media and lobby groups in relation to the merger.
If any of these events should occur, or if there are unexpected delays in the integration process, the anticipated benefits of the merger may be delayed, which could have an adverse affect on our results of operations or financial condition.
The merger has resulted in additional concentration risk in the lending books of the combined business The lending books of each of Westpac and St.George have exposures to a range of clients, assets, industries and geographies which, now that they are combined, has resulted in additional concentration risk, in particular in the commercial property book.
Other risks Other risks that can adversely impact our performance and our financial position include insurance risk, model risk, business risk and contagion risk. Refer to the ‘Corporate governance’ and ‘Risk management’ sections in our 2009 Annual Report for more information on these risks.
Reported Results (continued)
12
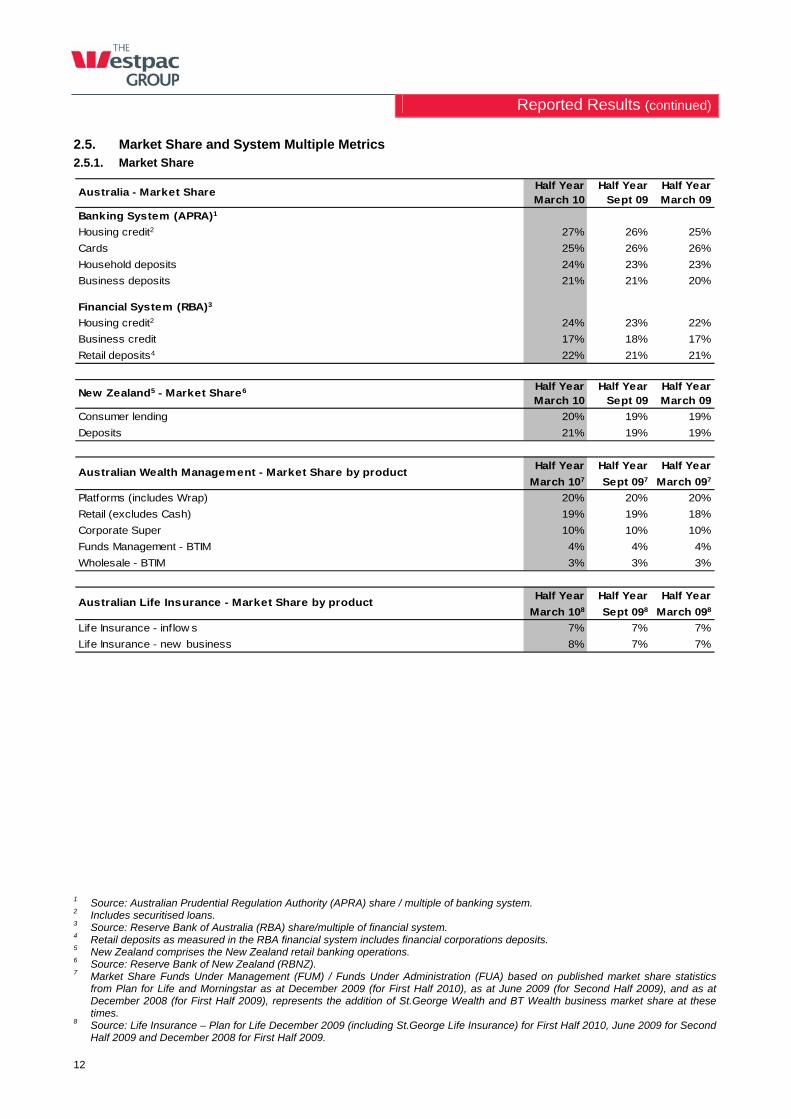
2.5. Market Share and System Multiple Metrics 2.5.1. Market Share
Australia - Market Share Half YearMarch 10
Half YearSept 09
Half YearMarch 09
Banking System (APRA)1
Housing credit2 27% 26% 25%
Cards 25% 26% 26%
Household deposits 24% 23% 23%
Business deposits 21% 21% 20%
Financial System (RBA)3
Housing credit2 24% 23% 22%
Business credit 17% 18% 17%
Retail deposits4 22% 21% 21%
New Zealand5 - Market Share6 Half YearMarch 10
Half YearSept 09
Half YearMarch 09
Consumer lending 20% 19% 19%
Deposits 21% 19% 19%
Half Year Half Year Half Year
March 107 Sept 097 March 097
Platforms (includes Wrap) 20% 20% 20%
Retail (excludes Cash) 19% 19% 18%
Corporate Super 10% 10% 10%
Funds Management - BTIM 4% 4% 4%
Wholesale - BTIM 3% 3% 3%
Half Year Half Year Half Year
March 108 Sept 098 March 098
Life Insurance - inf low s 7% 7% 7%
Life Insurance - new business 8% 7% 7%
Australian Wealth Management - Market Share by product
Australian Life Insurance - Market Share by product
1 Source: Australian Prudential Regulation Authority (APRA) share / multiple of banking system. 2 Includes securitised loans. 3 Source: Reserve Bank of Australia (RBA) share/multiple of financial system. 4 Retail deposits as measured in the RBA financial system includes financial corporations deposits. 5 New Zealand comprises the New Zealand retail banking operations. 6 Source: Reserve Bank of New Zealand (RBNZ). 7 Market Share Funds Under Management (FUM) / Funds Under Administration (FUA) based on published market share statistics
from Plan for Life and Morningstar as at December 2009 (for First Half 2010), as at June 2009 (for Second Half 2009), and as at December 2008 (for First Half 2009), represents the addition of St.George Wealth and BT Wealth business market share at these times.
8 Source: Life Insurance – Plan for Life December 2009 (including St.George Life Insurance) for First Half 2010, June 2009 for Second Half 2009 and December 2008 for First Half 2009.
Reported Results (continued)
13
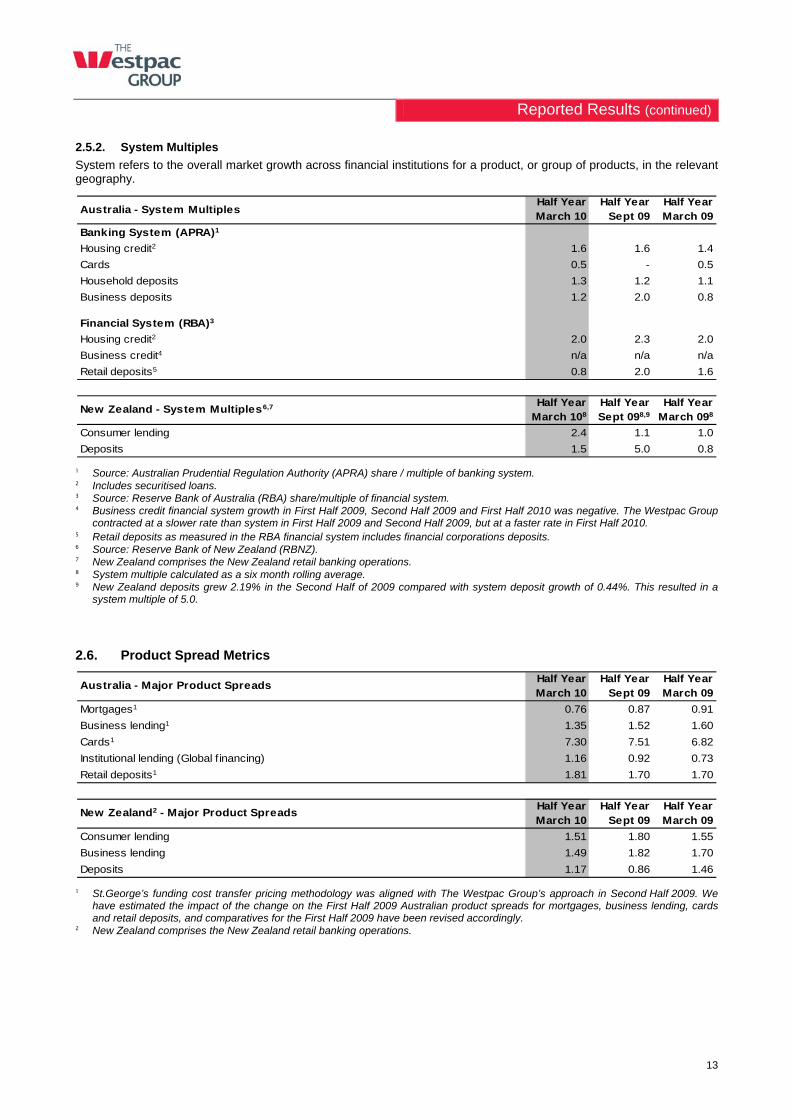
2.5.2. System Multiples
System refers to the overall market growth across financial institutions for a product, or group of products, in the relevant geography.
Australia - System MultiplesHalf YearMarch 10
Half YearSept 09
Half YearMarch 09
Banking System (APRA)1
Housing credit2 1.6 1.6 1.4
Cards 0.5 - 0.5
Household deposits 1.3 1.2 1.1
Business deposits 1.2 2.0 0.8
Financial System (RBA)3
Housing credit2 2.0 2.3 2.0
Business credit4 n/a n/a n/a
Retail deposits5 0.8 2.0 1.6
New Zealand - System Multiples6,7 Half YearMarch 108
Half YearSept 098,9
Half YearMarch 098
Consumer lending 2.4 1.1 1.0
Deposits 1.5 5.0 0.8 1 Source: Australian Prudential Regulation Authority (APRA) share / multiple of banking system. 2 Includes securitised loans. 3 Source: Reserve Bank of Australia (RBA) share/multiple of financial system. 4 Business credit financial system growth in First Half 2009, Second Half 2009 and First Half 2010 was negative. The Westpac Group
contracted at a slower rate than system in First Half 2009 and Second Half 2009, but at a faster rate in First Half 2010. 5 Retail deposits as measured in the RBA financial system includes financial corporations deposits. 6 Source: Reserve Bank of New Zealand (RBNZ). 7 New Zealand comprises the New Zealand retail banking operations. 8 System multiple calculated as a six month rolling average. 9 New Zealand deposits grew 2.19% in the Second Half of 2009 compared with system deposit growth of 0.44%. This resulted in a
system multiple of 5.0.
2.6. Product Spread Metrics
Australia - Major Product SpreadsHalf YearMarch 10
Half YearSept 09
Half YearMarch 09
Mortgages1 0.76 0.87 0.91
Business lending1 1.35 1.52 1.60
Cards1 7.30 7.51 6.82
Institutional lending (Global f inancing) 1.16 0.92 0.73
Retail deposits1 1.81 1.70 1.70
New Zealand2 - Major Product Spreads Half YearMarch 10
Half YearSept 09
Half YearMarch 09
Consumer lending 1.51 1.80 1.55
Business lending 1.49 1.82 1.70
Deposits 1.17 0.86 1.46 1 St.George’s funding cost transfer pricing methodology was aligned with The Westpac Group’s approach in Second Half 2009. We
have estimated the impact of the change on the First Half 2009 Australian product spreads for mortgages, business lending, cards and retail deposits, and comparatives for the First Half 2009 have been revised accordingly.
2 New Zealand comprises the New Zealand retail banking operations.
Review of Group Operations
14
3. Review of Group Operations
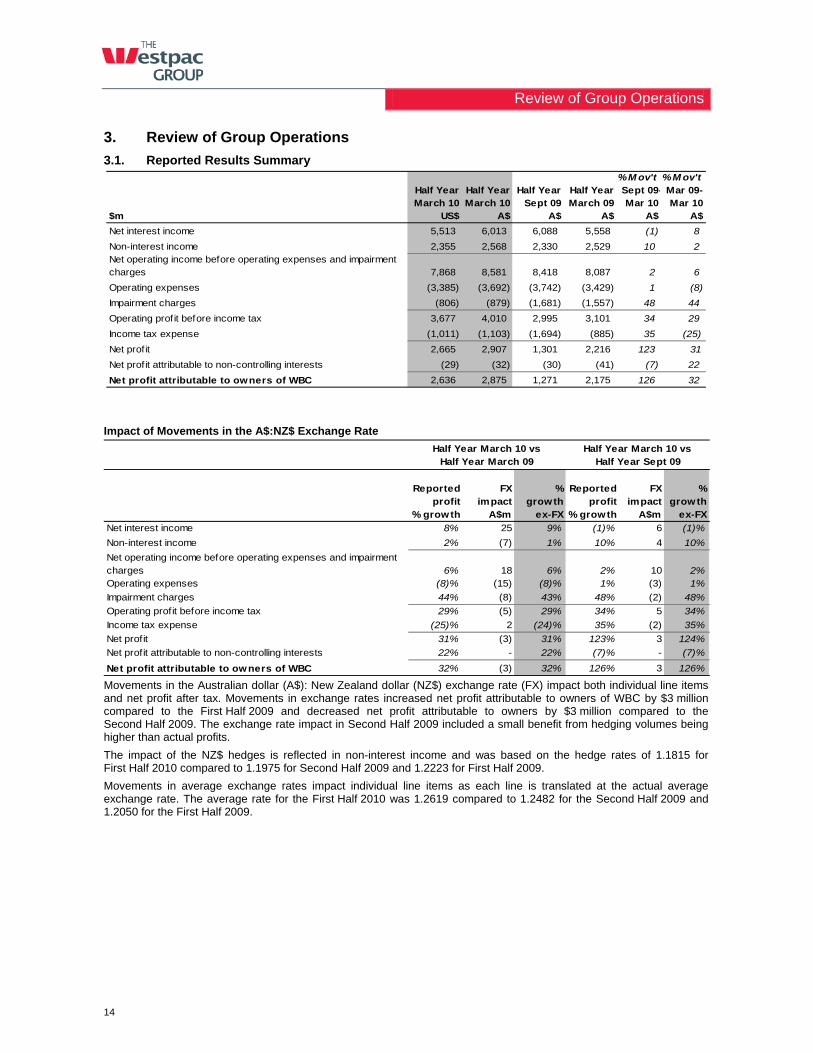
3.1. Reported Results Summary % M ov't % M ov't
Half Year March 10
Half Year March 10
Half Year Sept 09
Half Year March 09
Sept 09-Mar 10
Mar 09-Mar 10
$m US$ A$ A$ A$ A$ A$
Net interest income 5,513 6,013 6,088 5,558 (1) 8
Non-interest income 2,355 2,568 2,330 2,529 10 2 Net operating income before operating expenses and impairment charges 7,868 8,581 8,418 8,087 2 6
Operating expenses (3,385) (3,692) (3,742) (3,429) 1 (8)
Impairment charges (806) (879) (1,681) (1,557) 48 44
Operating prof it before income tax 3,677 4,010 2,995 3,101 34 29
Income tax expense (1,011) (1,103) (1,694) (885) 35 (25)
Net prof it 2,665 2,907 1,301 2,216 123 31
Net prof it attributable to non-controlling interests (29) (32) (30) (41) (7) 22
Net profit attributable to owners of WBC 2,636 2,875 1,271 2,175 126 32
Impact of Movements in the A$:NZ$ Exchange Rate
Reported profit
% growth
FXimpact
A$m
% growth
ex-FX
Reported profit
% growth
FXimpact
A$m
% growth
ex-FX
Net interest income 8% 25 9% (1)% 6 (1)%
Non-interest income 2% (7) 1% 10% 4 10%
Net operating income before operating expenses and impairment charges 6% 18 6% 2% 10 2%Operating expenses (8)% (15) (8)% 1% (3) 1%
Impairment charges 44% (8) 43% 48% (2) 48%
Operating profit before income tax 29% (5) 29% 34% 5 34%
Income tax expense (25)% 2 (24)% 35% (2) 35%
Net profit 31% (3) 31% 123% 3 124%
Net profit attributable to non-controlling interests 22% - 22% (7)% - (7)%
Net profit attributable to owners of WBC 32% (3) 32% 126% 3 126%
Half Year March 10 vsHalf Year March 09
Half Year March 10 vsHalf Year Sept 09
Movements in the Australian dollar (A$): New Zealand dollar (NZ$) exchange rate (FX) impact both individual line items and net profit after tax. Movements in exchange rates increased net profit attributable to owners of WBC by $3 million compared to the First Half 2009 and decreased net profit attributable to owners by $3 million compared to the Second Half 2009. The exchange rate impact in Second Half 2009 included a small benefit from hedging volumes being higher than actual profits.
The impact of the NZ$ hedges is reflected in non-interest income and was based on the hedge rates of 1.1815 for First Half 2010 compared to 1.1975 for Second Half 2009 and 1.2223 for First Half 2009.
Movements in average exchange rates impact individual line items as each line is translated at the actual average exchange rate. The average rate for the First Half 2010 was 1.2619 compared to 1.2482 for the Second Half 2009 and 1.2050 for the First Half 2009.
Review of Group Operations (continued)
15
Overview First Half 2010 has been a key turning point for the Australian economy. Early signs of improvement evident in the Second Half 2009 have consolidated and activity is on an improving path. Key Australian economic metrics, such as GDP growth, house prices, equity markets, the unemployment rate, and business and consumer confidence, have all performed strongly in First Half 2010.
At the same time, we believe that the global financial crisis (GFC) is likely to be largely behind us with more stable financial markets and governments withdrawing their support to the sector by removing the government guarantees for wholesale debt. In Australia, securitisation markets are becoming more accessible and Australian and New Zealand corporates are increasing their access to capital markets. Notwithstanding this, the recovery is likely to be volatile as demonstrated by recent events in relation to Greek Sovereign debt.
The GFC and associated economic impacts also led to a slowing in credit growth, particularly business, as companies reassessed what are acceptable levels of gearing. Housing credit growth has remained reasonably robust, with the government initially supporting the sector with stimulus packages, and then, as conditions improved, growth became more self-sustaining supported by good demand for housing. The strength of this sector has been central to the resilience of the Australian economy.
While we believe that the direct risks of the GFC appear to be largely behind us, the subsequent impact on the operating and regulatory environment will be more enduring.
Within markets, we expect conditions to remain more cautious with investors being more discerning about where they allocate funds and the price received for those funds. Offshore risks remain, including some caution around sovereign risks, especially in Europe.
For the banking sector, the more appropriate pricing for risk has seen average funding costs continue to rise as relatively cheap pre-GFC funding is replaced with higher cost post-GFC funding. Funding costs are also rising from a shift in the mix of funding to more high quality and higher cost term wholesale funding and from the increased competition for retail deposits.
Additionally, in seeking to manage potential flow-on effects from the GFC, the banking sector increased its capital levels and boosted its holdings of liquid assets. The higher levels are likely to be consistent with the direction of new regulatory requirements as global regulators seek to reduce the risks across the banking sector.
Westpac’s strategy has continued to be centred on the customer. Through the GFC this was evidenced by:
Building deeper relationships by pro-actively supporting customers through the GFC and meeting specific areas of demand. This included support for the First Home Buyer market and assisting corporate customers who needed time and support to reduce gearing over this period;
An across the board reduction in customer fees for both consumer and business customers. This has assisted customers in difficulty and reduced associated complaints by 80%;
Continuing to invest in the future including:
- Adding over 14 branches to our network which we believe makes us the only major Australian bank to organically expand branches over 2008/20091;
- Continuing to improve the capability of the sales force including 600 new bank managers for Westpac RBB;
- Successfully executing the St.George merger and further investing in St.George’s unique brand position; and
- Strengthening the Group’s financial position, including lifting capital levels, improving the stable funding ratio, increasing liquid assets and lifting provisioning cover ratios. We believe these measures have created a more sustainable base from which to continue supporting customers.
The Group has also further strengthened the quality of its funding base by increasing the duration of wholesale funding and lifting its market share of customer deposits. Both activities have increased the Group’s cost of funds trajectory but are important steps to sustainably support new loan growth, particularly mortgage lending.
The Westpac Group was recognised for its achievement in sustainably growing its business during the year at the World Economic Forum in Davos, where Westpac ranked 15th in the Top 100 global companies in sustainability. The Westpac Group was also the leading Australian company and the only bank in the Top 60.
As a result of its focussed strategy, the Group has emerged from the GFC with an enhanced market position. In addition to the benefits of the merger with St.George, other gains have included:
In mortgages, Australian market share has increased from 25% at 31 March 2009 to 27% at 31 March 2010, growing at around 1.6 times banking system;
In household deposits, the Group has increased Australian market share from 23% at 31 March 2009 to 24% at 31 March 2010, growing at around 1.3 times banking system;
In the Institutional Bank, Westpac believes it is a clear leader in relationship strength;
1 Source: APRA ‘ADI Points of Presence Report’.
Review of Group Operations (continued)
16
In Westpac New Zealand, the business showed early signs of a turnaround, with improvements in both business and consumer market share; and
In Wealth, the BT administration platforms continued to gather around 1 in every 4 dollars invested on platforms in Australia.
Financial Performance Summary In First Half 2010, Westpac delivered $2,875 million of net profit attributable to owners, up 32% compared to First Half 2009. This equated to a 16.0% return on equity, up from 14.9%.
Earnings per share was also up 16%, with no major equity raisings since early 2009, and only a small increase in shares on issue, mostly from Dividend Reinvestment Plan issuance.
A material $678 million decline in impairment charges in First Half 2010 compared to First Half 2009 was the key driver of the much stronger performance. With an improved operating environment and stabilising in asset quality, the growth of new customer stress has materially declined and this has been reflected in lower impairment charges.
Revenue growth has eased from prior periods due to the impact of higher funding costs, and from the decision to materially reduce customer fees paid by both consumer and business customers.
Margins in First Half 2010 deteriorated by 8 basis points compared to First Half 2009. This was largely driven by the benefit from fair valuation adjustments to St.George short-term wholesale funding and deposits in First Half 2009 associated with the St.George merger which were not repeated in First Half 2010. Margins were also impacted by a decline in consumer and business margins which resulted from higher funding costs as the cost of both wholesale funding and customer deposits continued to rise. Margin increases from higher Institutional Bank and Treasury revenue partially offset these declines.
On expenses, investment in customer facing capacity and capability increased. This has been made possible by the continued realisation of merger synergies and holding the fixed component of executive salaries constant in 2010.
For much of 2008 and 2009, investment focused on increasing the size and capability of customer facing resources. In 2010, investment has been directed more to projects focused on improving the customer experience, including enhancing branch technologies and development of a new sales and service platform.
The $678 million decline in impairment charges was led by the Institutional Bank as no new large impairments emerged during First Half 2010 and a reduction in lending in the Institutional Bank has led to an associated fall in collectively assessed provisions. The Institutional Bank also benefited from being well positioned through identifying potential areas of stress and provisioning quickly.
Across other banking divisions (Westpac RBB, St.George Bank and Westpac New Zealand), impairment charges were a little higher than First Half 2009 due to the lagged impact of slowing economic growth in 2009 and rising interest rates. While higher than First Half 2009, impairment charges were down from the peak in Second Half 2009.
Performance across Westpac’s businesses was varied, reflecting the way the GFC impacted the economy. Businesses most impacted by the GFC, the Institutional Bank and the Group’s wealth business, BTFG, have rebounded strongly as the conditions that led to lower earnings in 2009 have largely reverted. For the Institutional Bank, the absence of any new large impairments has been the key feature, while for BTFG the turnaround in asset markets was the main driver of improved performance.
Westpac RBB was less impacted by the GFC and strongly lifted core earnings during the 2009 financial year. In First Half 2010, the business consolidated its position, while absorbing the impact of cuts to customer fees, margin compression caused by rising average funding costs, and higher impairment charges.
St.George Bank delivered improved business momentum although this was offset by higher funding costs and cuts to customer fees. The tougher conditions in the commercial property sector also resulted in impairment charges remaining elevated.
In New Zealand, the prolonged recession and more difficult property markets had a significant impact on the business. As economic activity has begun to restore, the performance of the business is improving, although starting from a lower base.
One of the consequences of the GFC has been a focus on more conservatively managing the Group’s balance sheet. This has resulted in the Group increasing its capital ratios, strengthening its funding base, materially boosting liquid assets, and lifting provisioning cover. Key metrics across these dimensions were further strengthened over the First Half 2010 compared to the Second Half 2009, with:
A rise in the Tier 1 capital ratio to 8.6%, up from 8.1%;
Improved stable funding ratio at 79%, up from 78%;
Higher liquidity levels at $80 billion, up $6 billion; and
Higher provision cover with collective provisions to Credit RWA at 150 basis points, up from 142 basis points.
While the stresses of the GFC have largely passed, moves by governments and regulators globally to strengthen the prudential frameworks of banking systems are likely to require us to maintain this stronger balance sheet position.
Review of Group Operations (continued)
17
Although the final outcomes of regulatory change remain somewhat uncertain, Westpac is confident that measures already taken by the Group have positioned us well to respond to any further change.
Given the improved returns in First Half 2010, an interim dividend of 65 cents per share has been declared by the Board. The dividend is fully franked. This represents an increase of 16% over First Half 2009 and a pay-out ratio of 66.7%. In considering the interim dividend, the Board took into account that there still remains a degree of uncertainty over future bank regulatory requirements.
First Half 2010 – First Half 2009 Net profit attributable to owners of WBC for First Half 2010 was $2,875 million, an increase of $700 million or 32% compared to First Half 2009. This result was driven by a 44% reduction in impairment charges and the timing of the St.George merger, with the result for First Half 2009 excluding approximately six weeks of St.George earnings.
Net interest income $6,013 million (up 8%):
Approximately 5 percentage points of the growth is attributable to the inclusion of the St.George earnings for the full period in the First Half 2010;
Lending up 6%, with the majority of growth recorded in mortgages, partially offset by a decline in business lending;
Customer deposits up 6%, with Term Deposit growth accounting for all of the $15 billion increase; and
Margins deteriorated by 8 basis points largely driven by the benefit from fair valuation adjustments to St.George short-term wholesale funding and deposits in First Half 2009 associated with the St.George merger not being repeated in First Half 2010.
Non-interest income $2,568 million (up 2%):
First Half 2010 non-interest income increased by approximately 8 percentage points due to the impact of including St.George non-interest income for the full period;
The decision to reduce customer fees reduced Fees and Commissions income by $147 million over the half;
The 10% reduction in Fees and Commissions was also due to lower income from the redemption of credit card loyalty points, partly offset by higher fees on committed but undrawn line fees;
Lower trading income, principally as First Half 2009 recorded a very strong performance. Debt Markets earnings were strong while Foreign Exchange revenues were lower;
A significant improvement in Wealth as stronger asset markets boosted FUM and FUA balances and increased associated fees. Insurance earnings were also up benefiting from good cross sell; and
Stronger Other Income, as asset write-downs and mark to market losses on finance assets recorded in First Half 2009 were not repeated, partly offset by lower contributions from TPS revaluations.
Operating expenses $3,692 million (up 8%):
Approximately 6 percentage points of this growth is the result of including the St.George expense base for the full period in First Half 2010;
Salaries and other staff expenses were up 11%, primarily due to the impact of including the St.George expense base for the full period in the First Half 2010, combined with the continued investment in the customer facing employees, partly offset by holding the fixed component of executive salaries constant in 2010;
Equipment and occupancy expenses increased 21% primarily due to the increase in the number of branches and further branch refurbishments combined with the impact of St.George expenses for the full period in First Half 2010; and
Other expenses were down 2% mainly from lower costs from the redemption of credit card loyalty points.
Impairment charges $879 million (down 44%):
The impact of including St.George impairments for the full period in the First Half 2010 was not significant;
A stabilisation of asset quality resulted in a significant reduction in the growth in new stressed assets and an associated reduction in new impairment provisions; and
New collectively assessed provisions were lower as new stress slowed and a reduction in lending saw an associated fall in collective provisioning charges.
The effective tax rate decreased to 28% in the First Half 2010 from 29% in First Half 2009 driven primarily by a $106 million (AUD) excess provision reversal following the settlement of the dispute with the New Zealand Commissioner of Inland Revenue (CIR) related to New Zealand Structured Finance Transactions.
Review of Group Operations (continued)
18
First Half 2010 – Second Half 2009 Net profit attributable to owners of WBC for First Half 2010 increased by $1,604 million or 126% compared to Second Half 2009. This result was largely driven by a 48% reduction in impairment charges and the impact of a $703 million tax charge in the Second Half 2009 with respect to a tax provision raised in regards to New Zealand Structured Finance transactions.
Net interest income $6,013 million (down 1%):
Lending up 2% (with average interest earning assets 5% higher), with a 7% rise in mortgages partly offset by a 3% fall in business lending;
Customer deposits up 2%, with very strong term deposit growth; and
Higher funding costs combined with the unwind of merger accounting adjustments associated with the fair valuing of St.George short-term wholesale funding and deposits led to a 14 basis point decline in margins.
Non-interest income $2,568 million (up 10%):
Lower bank fees contributed to the reduction in Fee and Commission income of $62 million over First Half 2010;
Higher markets income with the narrowing of credit spreads assisting Debt Markets revenues;
Wealth earnings were flat, with improved FUM and FUA balances increasing Funds Management earnings offset by lower Lenders Mortgage Insurance earnings and a rise in insurance claims; and
Other income was up $98 million, from profit on asset sales ($25 million) and the absence of any significant asset write downs or mark to market losses which impacted Second Half 2009.
Operating expenses $3,692 million (down 1%):
Salaries and other staff expenses were up 1% with general salary rises and higher bonus accruals, consistent with the improved performance. Growth was moderated by lower merger integration costs and holding fixed executive salaries constant in 2010;
Further investment in the network and higher software amortisation increased equipment and occupancy expenses by 5%; and
Other expenses were down 7%, mainly from lower non-lending losses and a reduction in amortisation of deferred expenditure. These were partly offset by higher investment in front line projects.
Impairment charges $879 million (down 48%):
A reduction in new impaired assets saw a fall in individually assessed impairment provisions of $447 million; and
As a result of asset quality stabilising, new collectively assessed provisions were $399 million, a decline of $299 million.
The effective tax rate decreased from 57% in the Second Half 2009 to 28% in the First Half 2010. This movement was primarily driven by a $703 million tax expense in the Second Half 2009 with respect to the New Zealand High Court ruling in relation to Structured Finance transactions and a reversal of that tax provision of $106 million in the First Half 2010.
Review of Group Operations (continued)
19
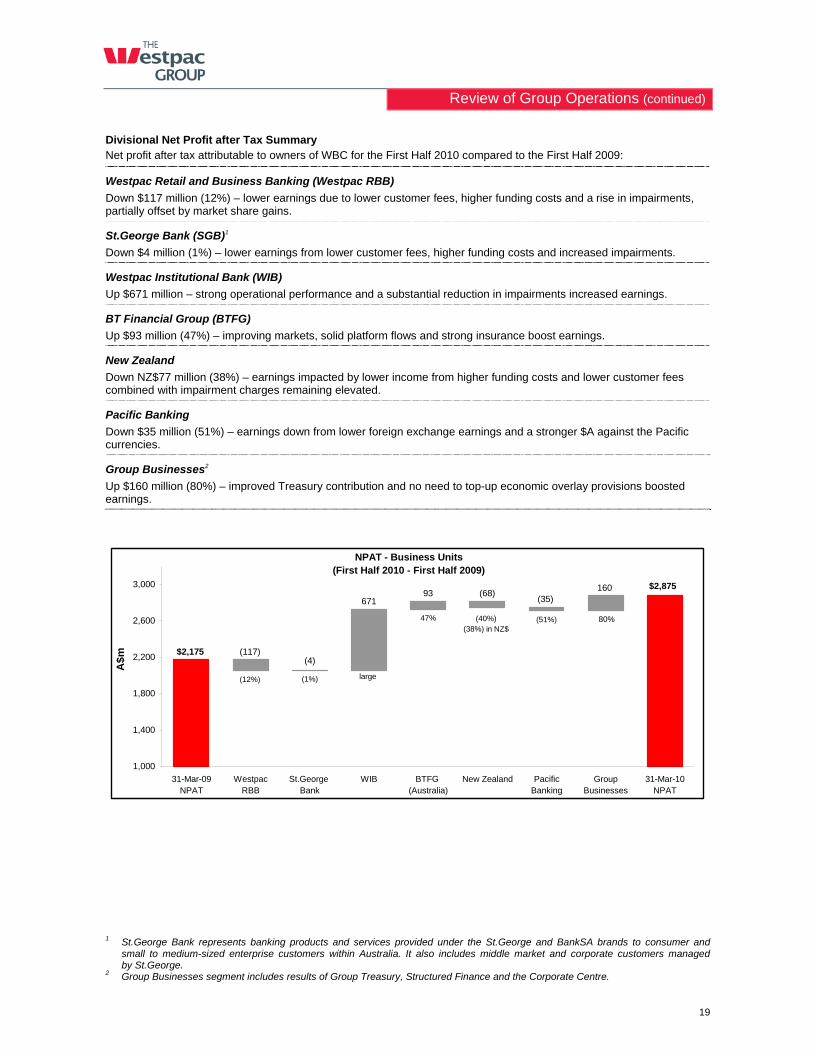
Divisional Net Profit after Tax Summary Net profit after tax attributable to owners of WBC for the First Half 2010 compared to the First Half 2009:
Westpac Retail and Business Banking (Westpac RBB)
Down $117 million (12%) – lower earnings due to lower customer fees, higher funding costs and a rise in impairments, partially offset by market share gains.
St.George Bank (SGB)1
Down $4 million (1%) – lower earnings from lower customer fees, higher funding costs and increased impairments.
Westpac Institutional Bank (WIB)
Up $671 million – strong operational performance and a substantial reduction in impairments increased earnings.
BT Financial Group (BTFG)
Up $93 million (47%) – improving markets, solid platform flows and strong insurance boost earnings.
New Zealand
Down NZ$77 million (38%) – earnings impacted by lower income from higher funding costs and lower customer fees combined with impairment charges remaining elevated.
Pacific Banking
Down $35 million (51%) – earnings down from lower foreign exchange earnings and a stronger $A against the Pacific currencies.
Group Businesses2
Up $160 million (80%) – improved Treasury contribution and no need to top-up economic overlay provisions boosted earnings.
NPAT - Business Units(First Half 2010 - First Half 2009)
80%
(1%)(12%) large
(40%)(38%) in NZ$
47% (51%)
$2,875(68)
(35)93
671
(4)(117)
160
$2,175
1,000
1,400
1,800
2,200
2,600
3,000
31-Mar-09NPAT
WestpacRBB
St.George Bank
WIB BTFG (Australia)
New Zealand PacificBanking
GroupBusinesses
31-Mar-10NPAT
A$
m
1 St.George Bank represents banking products and services provided under the St.George and BankSA brands to consumer and
small to medium-sized enterprise customers within Australia. It also includes middle market and corporate customers managed by St.George.
2 Group Businesses segment includes results of Group Treasury, Structured Finance and the Corporate Centre.
Review of Group Operations (continued)
20
3.2. Review of Reported Result Section 3 Review of Group Operations focuses on our Group results and key drivers for movements, with reference to our core business units. For more detailed commentary at the business unit level, refer to Section 4 Divisional Results.
3.2.1. Net Interest Income
First Half 2010 – First Half 2009 (up $455 million (8%)) Net interest income increased $455 million or 8% compared to the First Half 2009, with a large part of the growth attributable to the inclusion of the St.George earnings for the full period. Volume growth also contributed to the increase in net interest income.
First Half 2010 – Second Half 2009 (down $75 million (1%)) Net interest income decreased $75 million or 1% compared to the Second Half 2009. The key drivers of the result were a 14 basis point contraction in net interest margins partially offset by a 5% increase in average interest earning assets. Growth in average loans contributed 3.5% of the growth in average interest earning assets, with the remainder of the growth primarily from increases in Treasury liquid assets.
Loans1
As at As at As at % M ov't % M ov't
$m31 March
201030 Sept
200931 March
2009Sept 09-
Mar 10Mar 09-Mar 10
Australia 426,177 412,247 395,939 3 8
Housing 277,373 257,601 234,408 8 18
Personal (loans and cards) 15,734 15,215 15,094 3 4
Business 133,118 138,179 145,973 (4) (9)
Margin lending 3,996 3,900 4,074 2 (2)
Other (including provisions) (4,044) (2,648) (3,610) (53) (12)
New Zealand (NZ $)2 56,224 55,588 55,828 1 1
Housing 33,509 32,363 31,898 4 5
Personal (loans and cards) 1,601 1,548 1,522 3 5
Business 21,737 22,098 22,720 (2) (4)
Other (including provisions) (623) (421) (312) (48) (100)
Other overseas 4,885 5,633 6,710 (13) (27)
Total loans 474,644 463,459 448,872 2 6
First Half 2010 – First Half 2009 Loan growth of 6% for the 12 months to 31 March 2010 was well ahead of financial system credit growth, particularly in Australia where financial system growth was 2.0% in the 12 months to 31 March 20103. In New Zealand credit growth was also ahead of system.
In Australia, Westpac’s credit growth was 4.2 times financial system.
Loan growth had the following specific components:
Australian housing, up 18% or $43 billion. The Westpac Group housing credit growth was 2.2 times financial system and 1.6 times banking system4. Australian housing growth was 21% in Westpac RBB and 15% in St.George;
Australian personal lending increased 4% or $0.6 billion. The majority of this growth occurred in the St.George cards portfolio;
Business and corporate lending in Australia fell 9% or $12.9 billion. The WIB portfolio drove the majority of this reduction ($9.3 billion). This was primarily due to weak demand and corporates paying down debt to reduce gearing;
Housing lending in New Zealand grew 5% or NZ$1.6 billion, significantly ahead of system growth. Contributing to this growth was an improved distribution capability coupled with improving economic conditions; and
New Zealand business lending (including Institutional lending) fell 4% or NZ$1.0 billion. This movement was principally due to Institutional clients paying down debt to reduce gearing.
1 Spot loan balances. 2 New Zealand comprises WIB New Zealand, Treasury and our New Zealand retail banking operations and wealth
management business. 3 Source: Reserve Bank of Australia (RBA) 31 March 2010. 4 APRA system growth, 12 months to 31 March 2010.
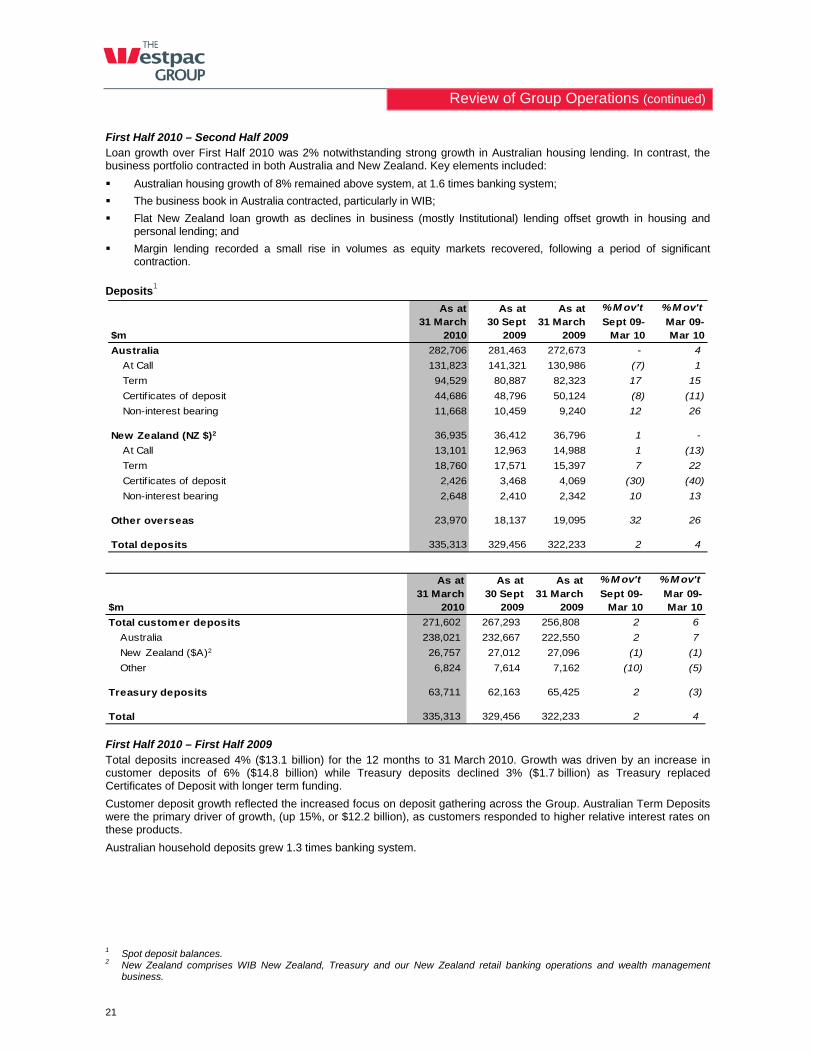
Review of Group Operations (continued)
21
First Half 2010 – Second Half 2009 Loan growth over First Half 2010 was 2% notwithstanding strong growth in Australian housing lending. In contrast, the business portfolio contracted in both Australia and New Zealand. Key elements included:
Australian housing growth of 8% remained above system, at 1.6 times banking system;
The business book in Australia contracted, particularly in WIB;
Flat New Zealand loan growth as declines in business (mostly Institutional) lending offset growth in housing and personal lending; and
Margin lending recorded a small rise in volumes as equity markets recovered, following a period of significant contraction.
Deposits1
As at As at As at % M ov't % M ov't
$m31 March
201030 Sept
200931 March
2009Sept 09-
Mar 10Mar 09-Mar 10
Australia 282,706 281,463 272,673 - 4
At Call 131,823 141,321 130,986 (7) 1
Term 94,529 80,887 82,323 17 15
Certif icates of deposit 44,686 48,796 50,124 (8) (11)
Non-interest bearing 11,668 10,459 9,240 12 26
New Zealand (NZ $)2 36,935 36,412 36,796 1 -
At Call 13,101 12,963 14,988 1 (13)
Term 18,760 17,571 15,397 7 22
Certif icates of deposit 2,426 3,468 4,069 (30) (40)
Non-interest bearing 2,648 2,410 2,342 10 13
Other overseas 23,970 18,137 19,095 32 26
Total deposits 335,313 329,456 322,233 2 4
As at As at As at % M ov't % M ov't
$m31 March
201030 Sept
200931 March
2009Sept 09-
Mar 10Mar 09-Mar 10
Total customer deposits 271,602 267,293 256,808 2 6
Australia 238,021 232,667 222,550 2 7
New Zealand ($A)2 26,757 27,012 27,096 (1) (1)
Other 6,824 7,614 7,162 (10) (5)
Treasury deposits 63,711 62,163 65,425 2 (3)
Total 335,313 329,456 322,233 2 4
First Half 2010 – First Half 2009 Total deposits increased 4% ($13.1 billion) for the 12 months to 31 March 2010. Growth was driven by an increase in customer deposits of 6% ($14.8 billion) while Treasury deposits declined 3% ($1.7 billion) as Treasury replaced Certificates of Deposit with longer term funding.
Customer deposit growth reflected the increased focus on deposit gathering across the Group. Australian Term Deposits were the primary driver of growth, (up 15%, or $12.2 billion), as customers responded to higher relative interest rates on these products.
Australian household deposits grew 1.3 times banking system.
1 Spot deposit balances. 2 New Zealand comprises WIB New Zealand, Treasury and our New Zealand retail banking operations and wealth management
business.
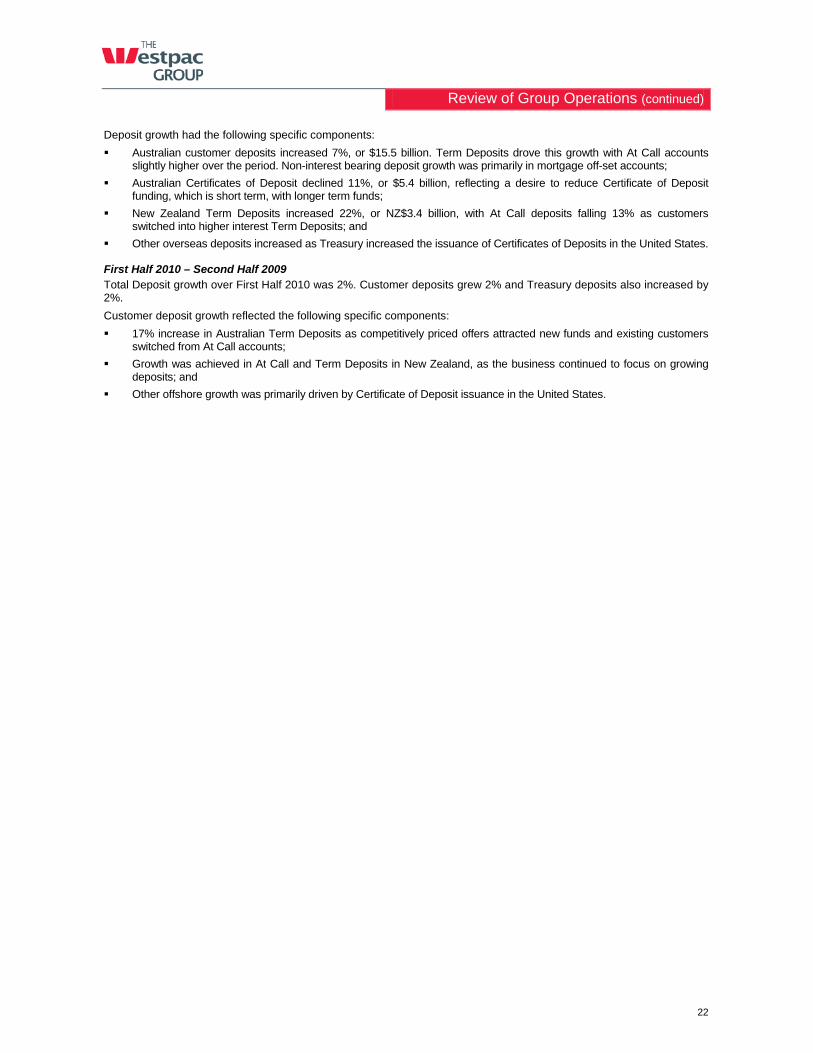
Review of Group Operations (continued)
22
Deposit growth had the following specific components:
Australian customer deposits increased 7%, or $15.5 billion. Term Deposits drove this growth with At Call accounts slightly higher over the period. Non-interest bearing deposit growth was primarily in mortgage off-set accounts;
Australian Certificates of Deposit declined 11%, or $5.4 billion, reflecting a desire to reduce Certificate of Deposit funding, which is short term, with longer term funds;
New Zealand Term Deposits increased 22%, or NZ$3.4 billion, with At Call deposits falling 13% as customers switched into higher interest Term Deposits; and
Other overseas deposits increased as Treasury increased the issuance of Certificates of Deposits in the United States.
First Half 2010 – Second Half 2009 Total Deposit growth over First Half 2010 was 2%. Customer deposits grew 2% and Treasury deposits also increased by 2%.
Customer deposit growth reflected the following specific components:
17% increase in Australian Term Deposits as competitively priced offers attracted new funds and existing customers switched from At Call accounts;
Growth was achieved in At Call and Term Deposits in New Zealand, as the business continued to focus on growing deposits; and
Other offshore growth was primarily driven by Certificate of Deposit issuance in the United States.
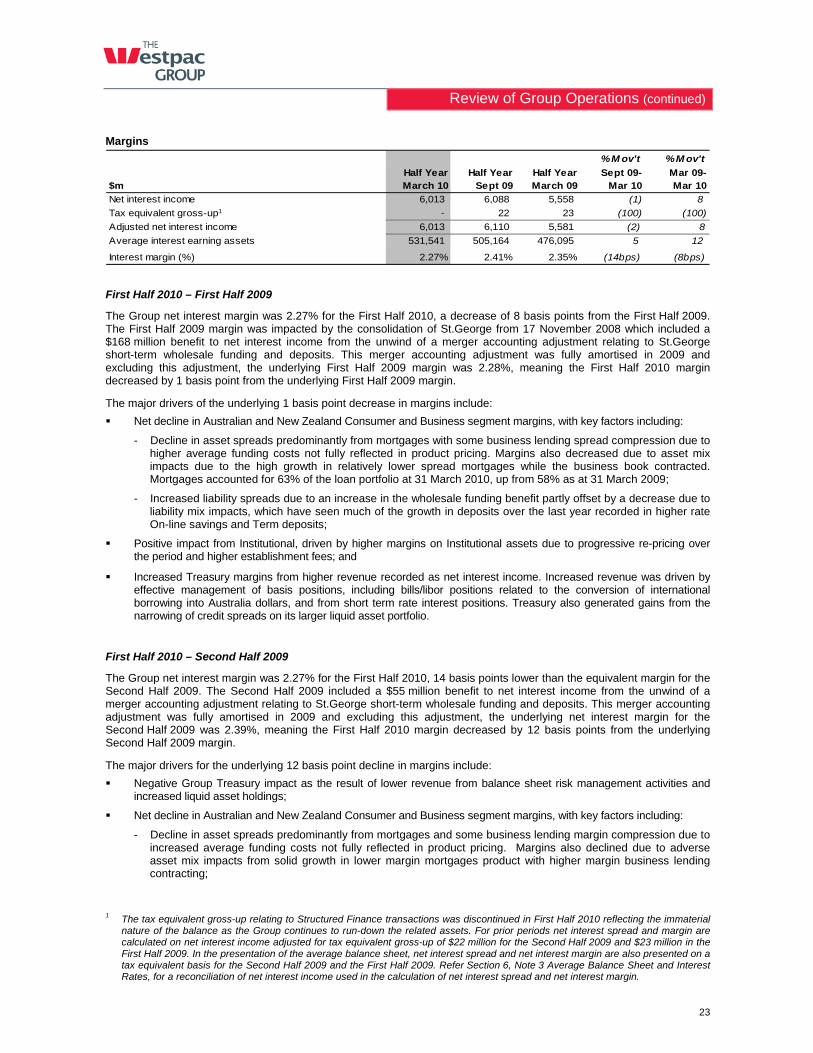
Review of Group Operations (continued)
23
Margins
% M ov't % M ov't
$mHalf Year March 10
Half Year Sept 09
Half Year March 09
Sept 09-Mar 10
Mar 09-Mar 10
Net interest income 6,013 6,088 5,558 (1) 8
Tax equivalent gross-up1 - 22 23 (100) (100)
Adjusted net interest income 6,013 6,110 5,581 (2) 8
Average interest earning assets 531,541 505,164 476,095 5 12
Interest margin (%) 2.27% 2.41% 2.35% (14bps) (8bps)
First Half 2010 – First Half 2009
The Group net interest margin was 2.27% for the First Half 2010, a decrease of 8 basis points from the First Half 2009. The First Half 2009 margin was impacted by the consolidation of St.George from 17 November 2008 which included a $168 million benefit to net interest income from the unwind of a merger accounting adjustment relating to St.George short-term wholesale funding and deposits. This merger accounting adjustment was fully amortised in 2009 and excluding this adjustment, the underlying First Half 2009 margin was 2.28%, meaning the First Half 2010 margin decreased by 1 basis point from the underlying First Half 2009 margin.
The major drivers of the underlying 1 basis point decrease in margins include:
Net decline in Australian and New Zealand Consumer and Business segment margins, with key factors including:
- Decline in asset spreads predominantly from mortgages with some business lending spread compression due to higher average funding costs not fully reflected in product pricing. Margins also decreased due to asset mix impacts due to the high growth in relatively lower spread mortgages while the business book contracted. Mortgages accounted for 63% of the loan portfolio at 31 March 2010, up from 58% as at 31 March 2009;
- Increased liability spreads due to an increase in the wholesale funding benefit partly offset by a decrease due to liability mix impacts, which have seen much of the growth in deposits over the last year recorded in higher rate On-line savings and Term deposits;
Positive impact from Institutional, driven by higher margins on Institutional assets due to progressive re-pricing over the period and higher establishment fees; and
Increased Treasury margins from higher revenue recorded as net interest income. Increased revenue was driven by effective management of basis positions, including bills/libor positions related to the conversion of international borrowing into Australia dollars, and from short term rate interest positions. Treasury also generated gains from the narrowing of credit spreads on its larger liquid asset portfolio.
First Half 2010 – Second Half 2009
The Group net interest margin was 2.27% for the First Half 2010, 14 basis points lower than the equivalent margin for the Second Half 2009. The Second Half 2009 included a $55 million benefit to net interest income from the unwind of a merger accounting adjustment relating to St.George short-term wholesale funding and deposits. This merger accounting adjustment was fully amortised in 2009 and excluding this adjustment, the underlying net interest margin for the Second Half 2009 was 2.39%, meaning the First Half 2010 margin decreased by 12 basis points from the underlying Second Half 2009 margin.
The major drivers for the underlying 12 basis point decline in margins include:
Negative Group Treasury impact as the result of lower revenue from balance sheet risk management activities and increased liquid asset holdings;
Net decline in Australian and New Zealand Consumer and Business segment margins, with key factors including:
- Decline in asset spreads predominantly from mortgages and some business lending margin compression due to increased average funding costs not fully reflected in product pricing. Margins also declined due to adverse asset mix impacts from solid growth in lower margin mortgages product with higher margin business lending contracting;
1 The tax equivalent gross-up relating to Structured Finance transactions was discontinued in First Half 2010 reflecting the immaterial
nature of the balance as the Group continues to run-down the related assets. For prior periods net interest spread and margin are calculated on net interest income adjusted for tax equivalent gross-up of $22 million for the Second Half 2009 and $23 million in the First Half 2009. In the presentation of the average balance sheet, net interest spread and net interest margin are also presented on a tax equivalent basis for the Second Half 2009 and the First Half 2009. Refer Section 6, Note 3 Average Balance Sheet and Interest Rates, for a reconciliation of net interest income used in the calculation of net interest spread and net interest margin.

Review of Group Operations (continued)
24
- Increased liability spreads due to an increase in the wholesale funding benefit generated by deposits partly offset by compression in spreads from increased competition in Term deposits and On-line savings accounts partly offset by adverse mix impacts, due primarily to the strong growth in higher rate On-line savings and Term deposits; and
Improved Institutional margins from the continued portfolio re-pricing over the period and higher establishment fees.
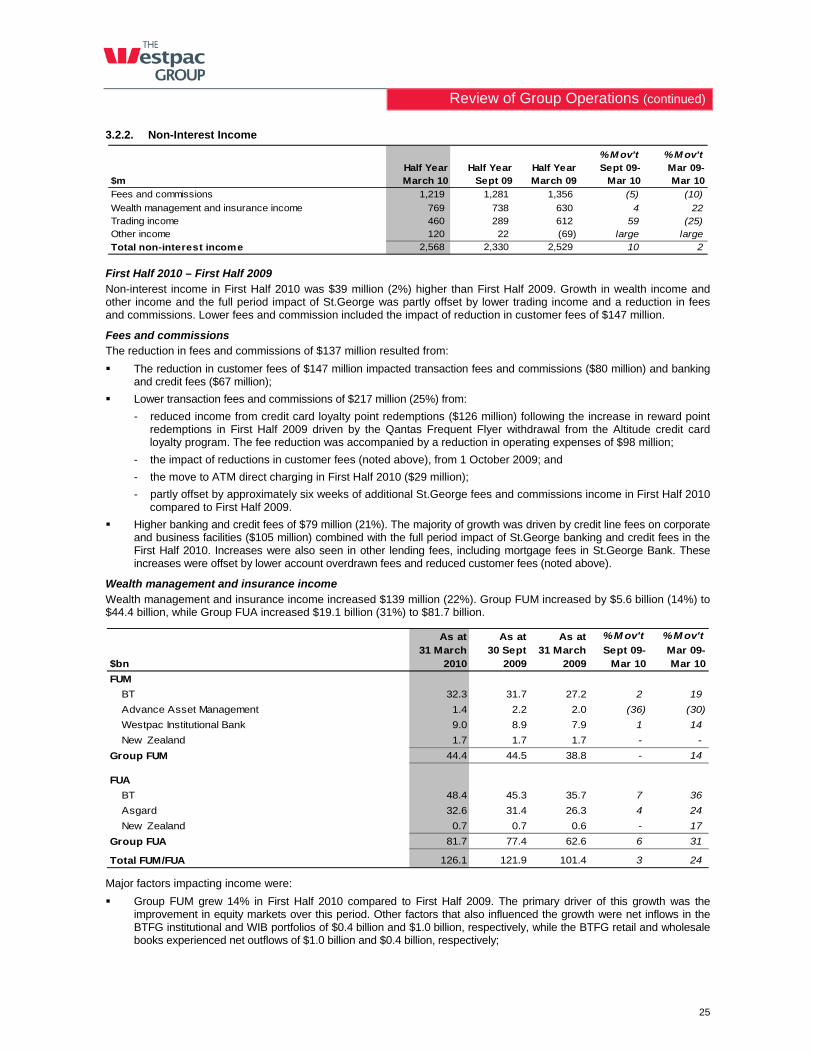
Review of Group Operations (continued)
25
3.2.2. Non-Interest Income
% M ov't % M ov't
$mHalf Year March 10
Half Year Sept 09
Half Year March 09
Sept 09-Mar 10
Mar 09-Mar 10
Fees and commissions 1,219 1,281 1,356 (5) (10)
Wealth management and insurance income 769 738 630 4 22Trading income 460 289 612 59 (25)Other income 120 22 (69) large largeTotal non-interest income 2,568 2,330 2,529 10 2
First Half 2010 – First Half 2009 Non-interest income in First Half 2010 was $39 million (2%) higher than First Half 2009. Growth in wealth income and other income and the full period impact of St.George was partly offset by lower trading income and a reduction in fees and commissions. Lower fees and commission included the impact of reduction in customer fees of $147 million.
Fees and commissions The reduction in fees and commissions of $137 million resulted from:
The reduction in customer fees of $147 million impacted transaction fees and commissions ($80 million) and banking and credit fees ($67 million);
Lower transaction fees and commissions of $217 million (25%) from:
- reduced income from credit card loyalty point redemptions ($126 million) following the increase in reward point redemptions in First Half 2009 driven by the Qantas Frequent Flyer withdrawal from the Altitude credit card loyalty program. The fee reduction was accompanied by a reduction in operating expenses of $98 million;
- the impact of reductions in customer fees (noted above), from 1 October 2009; and
- the move to ATM direct charging in First Half 2010 ($29 million);
- partly offset by approximately six weeks of additional St.George fees and commissions income in First Half 2010 compared to First Half 2009.
Higher banking and credit fees of $79 million (21%). The majority of growth was driven by credit line fees on corporate and business facilities ($105 million) combined with the full period impact of St.George banking and credit fees in the First Half 2010. Increases were also seen in other lending fees, including mortgage fees in St.George Bank. These increases were offset by lower account overdrawn fees and reduced customer fees (noted above).
Wealth management and insurance income Wealth management and insurance income increased $139 million (22%). Group FUM increased by $5.6 billion (14%) to $44.4 billion, while Group FUA increased $19.1 billion (31%) to $81.7 billion.
As at As at As at % M ov't % M ov't
$bn31 March
201030 Sept
200931 March
2009Sept 09-
Mar 10Mar 09-Mar 10
FUM
BT 32.3 31.7 27.2 2 19
Advance Asset Management 1.4 2.2 2.0 (36) (30)
Westpac Institutional Bank 9.0 8.9 7.9 1 14
New Zealand 1.7 1.7 1.7 - -
Group FUM 44.4 44.5 38.8 - 14
FUA
BT 48.4 45.3 35.7 7 36
Asgard 32.6 31.4 26.3 4 24
New Zealand 0.7 0.7 0.6 - 17
Group FUA 81.7 77.4 62.6 6 31
Total FUM/FUA 126.1 121.9 101.4 3 24
Major factors impacting income were:
Group FUM grew 14% in First Half 2010 compared to First Half 2009. The primary driver of this growth was the improvement in equity markets over this period. Other factors that also influenced the growth were net inflows in the BTFG institutional and WIB portfolios of $0.4 billion and $1.0 billion, respectively, while the BTFG retail and wholesale books experienced net outflows of $1.0 billion and $0.4 billion, respectively;
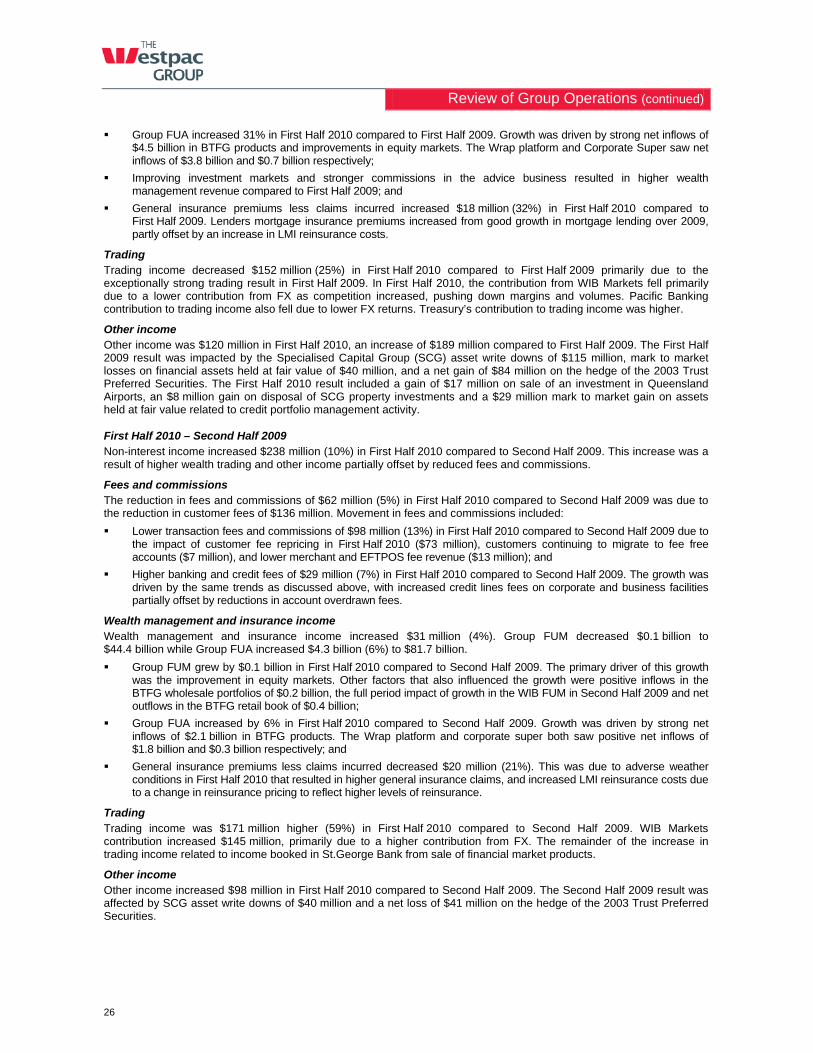
Review of Group Operations (continued)
26
Group FUA increased 31% in First Half 2010 compared to First Half 2009. Growth was driven by strong net inflows of $4.5 billion in BTFG products and improvements in equity markets. The Wrap platform and Corporate Super saw net inflows of $3.8 billion and $0.7 billion respectively;
Improving investment markets and stronger commissions in the advice business resulted in higher wealth management revenue compared to First Half 2009; and
General insurance premiums less claims incurred increased $18 million (32%) in First Half 2010 compared to First Half 2009. Lenders mortgage insurance premiums increased from good growth in mortgage lending over 2009, partly offset by an increase in LMI reinsurance costs.
Trading Trading income decreased $152 million (25%) in First Half 2010 compared to First Half 2009 primarily due to the exceptionally strong trading result in First Half 2009. In First Half 2010, the contribution from WIB Markets fell primarily due to a lower contribution from FX as competition increased, pushing down margins and volumes. Pacific Banking contribution to trading income also fell due to lower FX returns. Treasury’s contribution to trading income was higher.
Other income Other income was $120 million in First Half 2010, an increase of $189 million compared to First Half 2009. The First Half 2009 result was impacted by the Specialised Capital Group (SCG) asset write downs of $115 million, mark to market losses on financial assets held at fair value of $40 million, and a net gain of $84 million on the hedge of the 2003 Trust Preferred Securities. The First Half 2010 result included a gain of $17 million on sale of an investment in Queensland Airports, an $8 million gain on disposal of SCG property investments and a $29 million mark to market gain on assets held at fair value related to credit portfolio management activity.
First Half 2010 – Second Half 2009 Non-interest income increased $238 million (10%) in First Half 2010 compared to Second Half 2009. This increase was a result of higher wealth trading and other income partially offset by reduced fees and commissions.
Fees and commissions The reduction in fees and commissions of $62 million (5%) in First Half 2010 compared to Second Half 2009 was due to the reduction in customer fees of $136 million. Movement in fees and commissions included:
Lower transaction fees and commissions of $98 million (13%) in First Half 2010 compared to Second Half 2009 due to the impact of customer fee repricing in First Half 2010 ($73 million), customers continuing to migrate to fee free accounts ($7 million), and lower merchant and EFTPOS fee revenue ($13 million); and
Higher banking and credit fees of $29 million (7%) in First Half 2010 compared to Second Half 2009. The growth was driven by the same trends as discussed above, with increased credit lines fees on corporate and business facilities partially offset by reductions in account overdrawn fees.
Wealth management and insurance income Wealth management and insurance income increased $31 million (4%). Group FUM decreased $0.1 billion to $44.4 billion while Group FUA increased $4.3 billion (6%) to $81.7 billion.
Group FUM grew by $0.1 billion in First Half 2010 compared to Second Half 2009. The primary driver of this growth was the improvement in equity markets. Other factors that also influenced the growth were positive inflows in the BTFG wholesale portfolios of $0.2 billion, the full period impact of growth in the WIB FUM in Second Half 2009 and net outflows in the BTFG retail book of $0.4 billion;
Group FUA increased by 6% in First Half 2010 compared to Second Half 2009. Growth was driven by strong net inflows of $2.1 billion in BTFG products. The Wrap platform and corporate super both saw positive net inflows of $1.8 billion and $0.3 billion respectively; and
General insurance premiums less claims incurred decreased $20 million (21%). This was due to adverse weather conditions in First Half 2010 that resulted in higher general insurance claims, and increased LMI reinsurance costs due to a change in reinsurance pricing to reflect higher levels of reinsurance.
Trading Trading income was $171 million higher (59%) in First Half 2010 compared to Second Half 2009. WIB Markets contribution increased $145 million, primarily due to a higher contribution from FX. The remainder of the increase in trading income related to income booked in St.George Bank from sale of financial market products.
Other income Other income increased $98 million in First Half 2010 compared to Second Half 2009. The Second Half 2009 result was affected by SCG asset write downs of $40 million and a net loss of $41 million on the hedge of the 2003 Trust Preferred Securities.
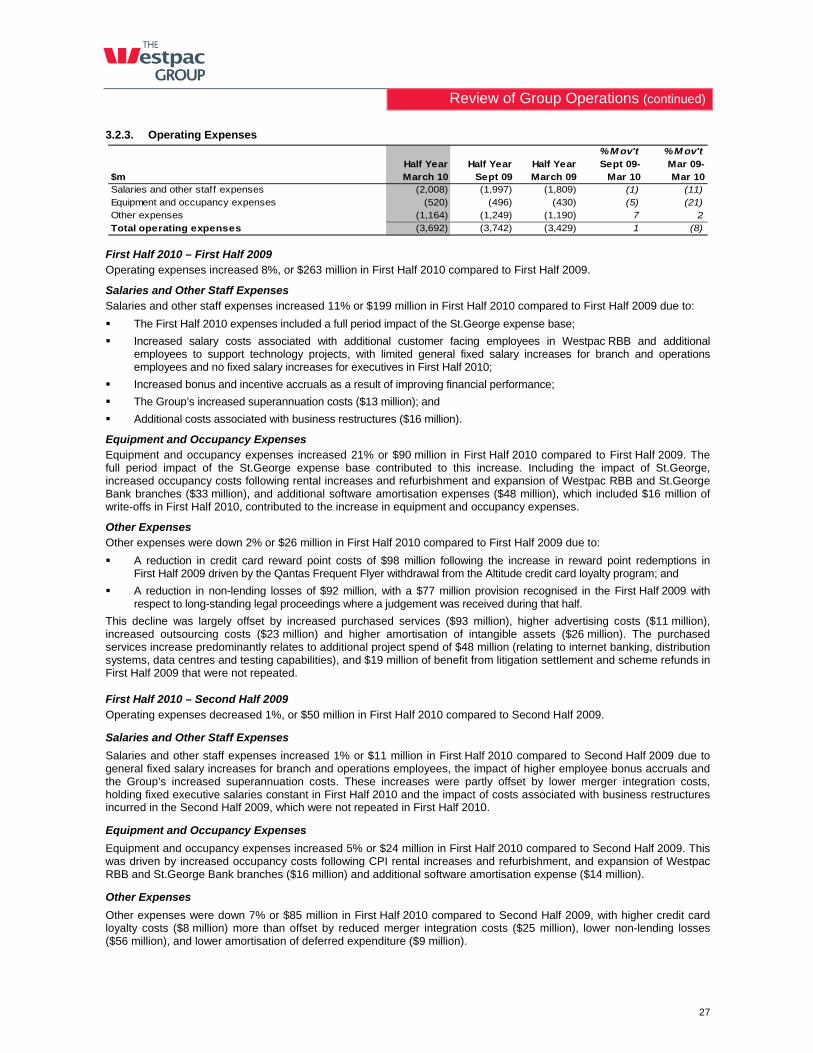
Review of Group Operations (continued)
27
3.2.3. Operating Expenses
% M ov't % M ov't
$mHalf Year March 10
Half Year Sept 09
Half Year March 09
Sept 09-Mar 10
Mar 09-Mar 10
Salaries and other staff expenses (2,008) (1,997) (1,809) (1) (11)Equipment and occupancy expenses (520) (496) (430) (5) (21)Other expenses (1,164) (1,249) (1,190) 7 2Total operating expenses (3,692) (3,742) (3,429) 1 (8)
First Half 2010 – First Half 2009 Operating expenses increased 8%, or $263 million in First Half 2010 compared to First Half 2009.
Salaries and Other Staff Expenses Salaries and other staff expenses increased 11% or $199 million in First Half 2010 compared to First Half 2009 due to:
The First Half 2010 expenses included a full period impact of the St.George expense base;
Increased salary costs associated with additional customer facing employees in Westpac RBB and additional employees to support technology projects, with limited general fixed salary increases for branch and operations employees and no fixed salary increases for executives in First Half 2010;
Increased bonus and incentive accruals as a result of improving financial performance;
The Group’s increased superannuation costs ($13 million); and
Additional costs associated with business restructures ($16 million).
Equipment and Occupancy Expenses Equipment and occupancy expenses increased 21% or $90 million in First Half 2010 compared to First Half 2009. The full period impact of the St.George expense base contributed to this increase. Including the impact of St.George, increased occupancy costs following rental increases and refurbishment and expansion of Westpac RBB and St.George Bank branches ($33 million), and additional software amortisation expenses ($48 million), which included $16 million of write-offs in First Half 2010, contributed to the increase in equipment and occupancy expenses.
Other Expenses Other expenses were down 2% or $26 million in First Half 2010 compared to First Half 2009 due to:
A reduction in credit card reward point costs of $98 million following the increase in reward point redemptions in First Half 2009 driven by the Qantas Frequent Flyer withdrawal from the Altitude credit card loyalty program; and
A reduction in non-lending losses of $92 million, with a $77 million provision recognised in the First Half 2009 with respect to long-standing legal proceedings where a judgement was received during that half.
This decline was largely offset by increased purchased services ($93 million), higher advertising costs ($11 million), increased outsourcing costs ($23 million) and higher amortisation of intangible assets ($26 million). The purchased services increase predominantly relates to additional project spend of $48 million (relating to internet banking, distribution systems, data centres and testing capabilities), and $19 million of benefit from litigation settlement and scheme refunds in First Half 2009 that were not repeated.
First Half 2010 – Second Half 2009 Operating expenses decreased 1%, or $50 million in First Half 2010 compared to Second Half 2009.
Salaries and Other Staff Expenses
Salaries and other staff expenses increased 1% or $11 million in First Half 2010 compared to Second Half 2009 due to general fixed salary increases for branch and operations employees, the impact of higher employee bonus accruals and the Group’s increased superannuation costs. These increases were partly offset by lower merger integration costs, holding fixed executive salaries constant in First Half 2010 and the impact of costs associated with business restructures incurred in the Second Half 2009, which were not repeated in First Half 2010.
Equipment and Occupancy Expenses
Equipment and occupancy expenses increased 5% or $24 million in First Half 2010 compared to Second Half 2009. This was driven by increased occupancy costs following CPI rental increases and refurbishment, and expansion of Westpac RBB and St.George Bank branches ($16 million) and additional software amortisation expense ($14 million).
Other Expenses
Other expenses were down 7% or $85 million in First Half 2010 compared to Second Half 2009, with higher credit card loyalty costs ($8 million) more than offset by reduced merger integration costs ($25 million), lower non-lending losses ($56 million), and lower amortisation of deferred expenditure ($9 million).
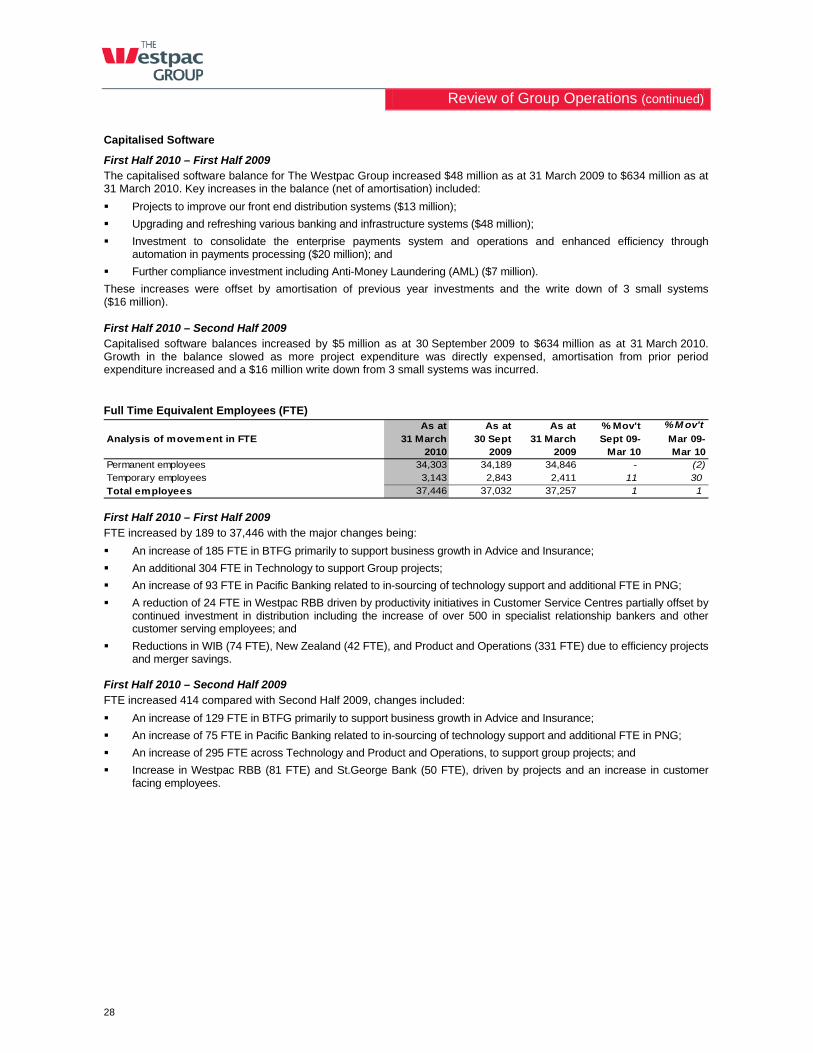
Review of Group Operations (continued)
28
Capitalised Software
First Half 2010 – First Half 2009 The capitalised software balance for The Westpac Group increased $48 million as at 31 March 2009 to $634 million as at 31 March 2010. Key increases in the balance (net of amortisation) included:
Projects to improve our front end distribution systems ($13 million);
Upgrading and refreshing various banking and infrastructure systems ($48 million);
Investment to consolidate the enterprise payments system and operations and enhanced efficiency through automation in payments processing ($20 million); and
Further compliance investment including Anti-Money Laundering (AML) ($7 million).
These increases were offset by amortisation of previous year investments and the write down of 3 small systems ($16 million).
First Half 2010 – Second Half 2009 Capitalised software balances increased by $5 million as at 30 September 2009 to $634 million as at 31 March 2010. Growth in the balance slowed as more project expenditure was directly expensed, amortisation from prior period expenditure increased and a $16 million write down from 3 small systems was incurred.
Full Time Equivalent Employees (FTE) As at As at As at % Mov't % M ov't
Analysis of movement in FTE 31 March 2010
30 Sept 2009
31 March2009
Sept 09-Mar 10
Mar 09-Mar 10
Permanent employees 34,303 34,189 34,846 - (2) Temporary employees 3,143 2,843 2,411 11 30 Total employees 37,446 37,032 37,257 1 1
First Half 2010 – First Half 2009 FTE increased by 189 to 37,446 with the major changes being:
An increase of 185 FTE in BTFG primarily to support business growth in Advice and Insurance;
An additional 304 FTE in Technology to support Group projects;
An increase of 93 FTE in Pacific Banking related to in-sourcing of technology support and additional FTE in PNG;
A reduction of 24 FTE in Westpac RBB driven by productivity initiatives in Customer Service Centres partially offset by continued investment in distribution including the increase of over 500 in specialist relationship bankers and other customer serving employees; and
Reductions in WIB (74 FTE), New Zealand (42 FTE), and Product and Operations (331 FTE) due to efficiency projects and merger savings.
First Half 2010 – Second Half 2009 FTE increased 414 compared with Second Half 2009, changes included:
An increase of 129 FTE in BTFG primarily to support business growth in Advice and Insurance;
An increase of 75 FTE in Pacific Banking related to in-sourcing of technology support and additional FTE in PNG;
An increase of 295 FTE across Technology and Product and Operations, to support group projects; and
Increase in Westpac RBB (81 FTE) and St.George Bank (50 FTE), driven by projects and an increase in customer facing employees.
Review of Group Operations (continued)
29
3.2.4. Impairment Charges
% M ov't % M ov't
$mHalf Year March 10
Half Year Sept 09
Half Year March 09
Sept 09-Mar 10
Mar 09-Mar 10
New individually assessed provisions (IAP) (637) (1,084) (1,027) 41 38Write-backs 136 70 36 94 largeRecoveries 21 31 18 (32) 17Total IAP, w rite-backs and recoveries (480) (983) (973) 51 51Write-offs (315) (371) (261) 15 (21)
Other changes in collectively assessed provisions (84) (327) (323) 74 74Total new collectively assessed provisions (399) (698) (584) 43 32Total impairment charges (879) (1,681) (1,557) 48 44
Impairment charges declined significantly in First Half 2010 compared to recent periods, as the increase in stress associated with the GFC and the economic slowdown abated. Most of the reduction has been due to fewer individually assessed provisions from larger institutional and corporate companies. These companies were first to feel the effects of the financial crisis and have been the first to benefit from the improved operating environment.
New collectively assessed provisions were also lower as the incidence of new stress has declined and the de-gearing by some corporates has improved their risk grading and reduced exposures. This has enabled some collective provisions to be released. There was no change in the economic overlay over the half.
While impairment charges have reduced significantly, they still remain elevated given more companies are being downgraded than upgraded. Importantly, of the companies being downgraded most were already identified as stressed. Consumer impairment charges including write-offs remain at a higher level than experienced prior to the GFC. This is principally due to the lagged impacts of the economic slowdown and from higher interest rates.
In First Half 2010 The Westpac Group made no change in its economic overlay with the balance unchanged at $502 million. More than half the balance of the economic overlay relates to provisions established through the GFC. While the operating environment has improved, some sectors remain fragile and Westpac has decided to maintain a conservative stance and not change the overlay at this time. Westpac conducts detailed reviews of its economic overlays every six months and a further review will be undertaken in the Second Half 2010.
First Half 2010 – First Half 2009 Total impairment charges of $879 million for First Half 2010 were down 44% from First Half 2009, and represented 37 basis points of average gross loans.
Key movements were:
New individually assessed provisions for First Half 2010 of $637 million were $390 million lower principally due to:
In WIB, the new individually assessed charge of $255 million was $492 million lower primarily due to the absence of any new large corporate impairment charges and no repeat of the margin lending losses recorded in First Half 2009;
In Westpac RBB, new individually assessed provisions of $114 million were $45 million higher principally from the lagged effect of the softer economic environment on small and medium businesses;
In St.George Bank, new individually assessed provisions of $166 million were $40 million higher given increased stress in the commercial property segment. The change in the provision charge was relatively small given the strong security supporting the exposures; and
New individually assessed provisions in New Zealand of $99 million were $26 million higher than First Half 2009 as some companies previously identified as stressed were downgraded to impaired.
The Group also benefited from higher write-backs and recoveries, principally from a positive reassessment of some security values due to the improving operating environment.
New collectively assessed provisions of $399 million were $185 million lower (down 32%) compared to First Half 2009. The Group regularly updates certain factors in its provisioning models to reflect model enhancements and increased or improved data. In First Half 2010, the Group processed a number of these factor changes. In aggregate, the changes had a small impact on new collectively assessed provisions but had a more significant impact on some divisions. The most significant movements were in WIB which had a $79 million benefit and New Zealand which had a negative impact of $48 million.
New collectively assessed provisions of $399 million were $185 million lower and included:
WIB had a write-back of collective provision in First Half 2010 of $103 million which was $277 million lower than the First Half 2009 charge. The positive contribution was due to the reduction in lending and a few companies moving from watchlist back to fully performing following equity raisings over the half. These movements allowed some collective provisions to be released;
In Westpac RBB, consumer asset quality deteriorated over the half primarily due to the delayed impact of the financial crisis, slightly higher unemployment and rising interest rates. This led to an increase in consumer write-offs direct and, combined with factor changes, led to a $54 million rise in new collectively assessed provisions to $224 million compared to First Half 2009;
Review of Group Operations (continued)
30
New collectively assessed provisions of $186 million in St.George Bank were $160 million higher compared to First Half 2009. The rise was due to higher write-offs direct in personal lending and credit cards and a further deterioration in the commercial property portfolio compared to First Half 2009;
In New Zealand, new collectively assessed provisions of $83 million were little changed compared to First Half 2009 at just $4 million lower. The higher factor changes were offset by companies moving to impaired, and an associated movement of provisions from collective to individually assessed; and
There was no further addition to the economic overlay in First Half 2010 following the $120 million raised in First Half 2009.
First Half 2010 – Second Half 2009 Total impairment charges for First Half 2010 were down 48% compared to Second Half 2009 although the composition of the movement across businesses was varied.
Key movements were:
New individually assessed provision charges for First Half 2010 were $447 million lower compared to Second Half 2009 principally due to:
WIB was $109 million lower, due to the absence of any large individually significant impairment charges;
In Westpac RBB, individually assessed provision charges were $31 million lower, principally in the business portfolio;
St.George Bank individually assessed provisions were $113 million lower, as Second Half 2009 was characterised by a significant deterioration in commercial property with security values falling. With the commercial property sector stabilising in First Half 2010, new individual provisions were lower; and
New Zealand individually assessed provision charges declined by $186 million compared to Second Half 2009, as New Zealand encountered two large problem facilities which required IAPs of $174 million in Second Half 2009.
Write-backs and recoveries were $56 million better than Second Half 2009 resulting from the improved operating environment.
New collectively assessed provisions for First Half 2010 were $299 million lower compared to Second Half 2009 with the factor changes detailed above having a similar impact. Key changes included:
The decline in new collectively assessed provisions for the Group was primarily due to a $385 million reduction in WIB. The Second Half 2009 saw a large increase in collective provisions for both commercial property and margin lending and these were not repeated in First Half 2010. Benefits from recapitalisations and factor changes also contributed to the significant reduction;
In Westpac RBB a more modest deterioration in the portfolio than experienced in Second Half 2009 offset the impact of factor changes which led to a $1 million reduction in new collectively assessed provisions;
New collectively assessed provisions in St.George Bank were $56 million higher than Second Half 2009 from a small rise in consumer stress and additional provisions required for commercial property lending as some facilities were further downgraded; and
The factor changes of $48 million largely accounted for $40 million rise in New Zealand new collectively assessed provisions over Second Half 2009.
Review of Group Operations (continued)
31
3.2.5. Income Tax Expense
% M ov't % M ov't
$mHalf Year March 10
Half Year Sept 09
Half Year March 09
Sept 09-Mar 10
Mar 09-Mar 10
Income tax expense (1,103) (1,694) (885) 35 (25)Effective tax rate (%) 27.5% 56.6% 28.5% large 100bps
First Half 2010 – First Half 2009 Income tax expense in First Half 2010 increased $218 million or 25% compared to the First Half 2009. The effective tax rate for the First Half 2010 was 100 basis points lower at 27.5% than for the First Half 2009. The effective income tax rate for the First Half 2010 was impacted by the reversal of a tax provision amounting to $106 million which reduced the reported effective tax rate for the Group.
First Half 2010 – Second Half 2009 Income tax expense in First Half 2010 decreased $591 million compared to the Second Half 2009. This movement was primarily driven by a $703 million tax charge in the Second Half 2009 with respect to the New Zealand High Court ruling on amended tax assessments issued by the CIR, in relation to Structured Finance transactions entered into between 1998 and 2002 and a reversal of that tax provision of $106 million in the First Half 2010.
3.2.6. Non-Controlling Interests
The non-controlling interests primarily represents distributions on hybrid equity instruments 2003 TPS1 and 2006 TPS1, as well as other non-controlling interests, including the 40% portion of BT Investment Management (BTIM) that Westpac does not own.
Non-controlling interests of $32 million for First Half 2010 was $2 million higher than Second Half 2009 and decreased $9 million compared to First Half 2009.
The $2 million increase for First Half 2010 compared to Second Half 2009 is primarily due to increased earnings in BTIM and a higher interest rate in Australia impacting distributions on 2006 TPS. This increase was partially offset by the weakening of the United States dollar (US$) against the A$ on the distributions paid on our 2003 TPS hybrid equity instruments.
The $9 million decrease for First Half 2010 compared to First Half 2009 is primarily due to the deterioration of the US$ against the A$.
1 Non-controlling interests include distributions on 2003 TPS and 2006 TPS.
There were 750,000 2003 TPS issued in the United States of America at US$1,000 each on 13 August 2003, with non-cumulative semi-annual distributions (31 March and 30 September) in arrears at the annual rate of 5.819% up to but excluding 30 September 2013. From, and including, 30 September 2013 the 2003 TPS will pay non-cumulative quarterly distributions (31 December, 31 March, 30 June and 30 September) payable in arrears at a floating rate of LIBOR plus 2.05% per year.
Westpac TPS Trust issued 7,627,375 2006 TPS in Australia at $100 each on 21 June 2006. The 2006 TPS are preferred units in the Westpac TPS Trust, with non-cumulative floating rate distributions which are expected to be fully franked. Westpac TPS Trust also issued one ordinary unit with an issue price of $100 to Westpac. Westpac, as holder of the ordinary unit, is entitled to any residual income or assets of the Westpac TPS Trust not distributed to holders of 2006 TPS. The 2006 TPS are scheduled to pay quarterly distributions (30 September, 31 December, 31 March and 30 June) in arrears, subject to certain conditions being satisfied. The distribution rate on 2006 TPS, until 30 June 2016 (the step-up date) is calculated as the Australian 90 day bank bill rate plus 1% per annum (the initial margin), together multiplied by one minus the Australian corporate tax rate (30% during the half year ended 31 March 2010.) After the step-up date, the initial margin will increase by a one time step-up of 1% per annum.
Review of Group Operations (continued)
32
3.3. Credit Quality First Half 2010 marked a material change in the asset quality environment. While the financial year ended 30 September 2009 was characterised by uncertainty and deteriorating portfolio quality, First Half 2010 was a period of portfolio stabilisation. In particular, an improved operating environment has assisted the financial health of both companies and consumers. New stress has declined particularly in the business portfolio.
With the stabilisation of the asset quality cycle, the Group is now more focused on actively managing its existing stressed facilities rather than a further significant deterioration in the portfolio.
While operating conditions have improved, stressed assets have continued to rise and are now over 3 times larger than before the GFC. In addition, on average, more facilities had their credit rating downgraded than upgraded over the half. Importantly, where downgrades occurred, they were predominantly from companies that were already identified as stressed.
This slowing in the growth of new stress partly reflects the significant efforts over 2009 to identify problem facilities and to fully assess the sectors and regions most at risk. The rigor applied to this assessment, along with the Group’s relatively high provision cover, contributed to the reduction in impairment charges in First Half 2010.
Looking across key portfolio segments The Institutional sector, which was the most impacted by the GFC, has also been the first sector to recover. No new large individual impairments were booked in First Half 2010, which was in contrast to First Half 2009 which saw a number of large single names become impaired. The sector also significantly benefited from highly active equity markets, which allowed some companies to raise capital to pay down debt and reduce gearing.
In the Australian corporate and commercial sectors, the improved environment has led to a significant reduction in new stress.
While new stress has eased, further downgrades in the corporate and commercial sectors continued to emerge over the half where customer’s income to support borrowings has been weak and/or security values have fallen. Commercial property continues to be the dominant source of new and downgraded stressed facilities.
Over the last 18 months the Group has sought to reduce its commercial property exposure and that continued over the half. The proportion of commercial property lending to gross loans has fallen, from a peak of 13% at 31 December 2008, to 9.6% at 31 March 2010.
The portion of the commercial property portfolio under stress has risen to 15% at 31 March 2010, from 12% at 30 September 2009. The increase in this ratio has in part been due to the decline in total commercial property lending.
The small business sector has performed solidly. Typically the last sector to feel the impact of an economic downturn, SME’s have benefited from relatively low unemployment and solid personal incomes, and this has assisted in minimising the impacts of slower growth.
Consumers have also continued to perform well through this cycle, with low interest rates and the fiscal stimulus assisting the sector. Actual losses and delinquencies have increased over the year, which is consistent with slightly higher unemployment and rising interest rates.
In New Zealand, the economy is improving however, because the downturn was more pronounced, the impact on business and consumer stress has been more severe. Stabilising the result has been that more companies have migrated from the Watchlist and Substandard category into Impaired. The more severe correction in asset prices has similarly led to a greater impact on the consumer sector, particularly in mortgages.
Key portfolio statistics Stressed assets, as a proportion of Total Committed Exposure (TCE), recorded a small increase (9 basis points) to 3.18% at 31 March 2010 compared to 30 September 2009. The key components of stressed assets include:
Impaired assets, as a proportion of TCE at 31 March 2010, increased to 63 basis points from 57 basis points at 30 September 2009, due to a 14% rise in impaired assets. The majority of new impaired assets were in the commercial property sector from companies previously identified as Watchlist or Substandard. Over First Half 2010 there were modest $125 million write-offs of impaired assets against impairment provisions. The impaired portfolio remains well provisioned with a coverage ratio of 43%, up from 39%.
90 Days past due but well secured, as a proportion of TCE at 31 March 2010 increased 7 basis points compared to 30 September 2009, to 36 basis points. This category includes a large portion of commercial property exposures that have very strong security but remain under stress.
Watchlist and Substandard facilities, as a proportion of TCE at 31 March 2010 declined 4 basis points compared to 30 September 2009, to 219 basis points as the incidence of new stress abated and companies previously identified as Watchlist and Substandard were downgraded into the impaired or 90 Days past due categories.
In mortgages, 90 day delinquencies at 31 March 2010 increased 3 basis points to 40 basis points compared to 30 September 2009 but remain modest and well below industry averages.
Other consumer delinquencies at 31 March 2010 also increased to 1.34%, up from 1.04% as at 30 September 2009. The rise in stress reflects higher interest rates and the lagged impact of slowing growth in 2009, including a reduction in hours worked and higher unemployment. The increase in delinquencies also reflects a rise in customers that have been unable
Review of Group Operations (continued)
33
to bring their accounts into order after benefiting from a period of hardship assistance. The normal seasonal delinquency pattern also contributed to the rise in 90 day delinquencies.
New Zealand mortgage 90 day delinquencies at 31 March 2010 changed little compared to 30 September 2009 but remain at a high level given the more protracted slow-down in that economy. A similar pattern is also evident in other consumer 90 day delinquencies, where the 90 day delinquency rate at 31 March 2010 has declined a modest 2 basis points compared to 30 September 2009 but the level of stress remains higher than in Australia.
Westpac maintained its high provisioning coverage, with the ratio of collectively assessed provisions to credit risk weighted assets increasing 8 basis points compared to 30 September 2009 to 150 basis points at 31 March 2010. Collectively assessed provisions of $3,697 million include an economic overlay of $502 million. No change was made to the economic overlay in First Half 2010.
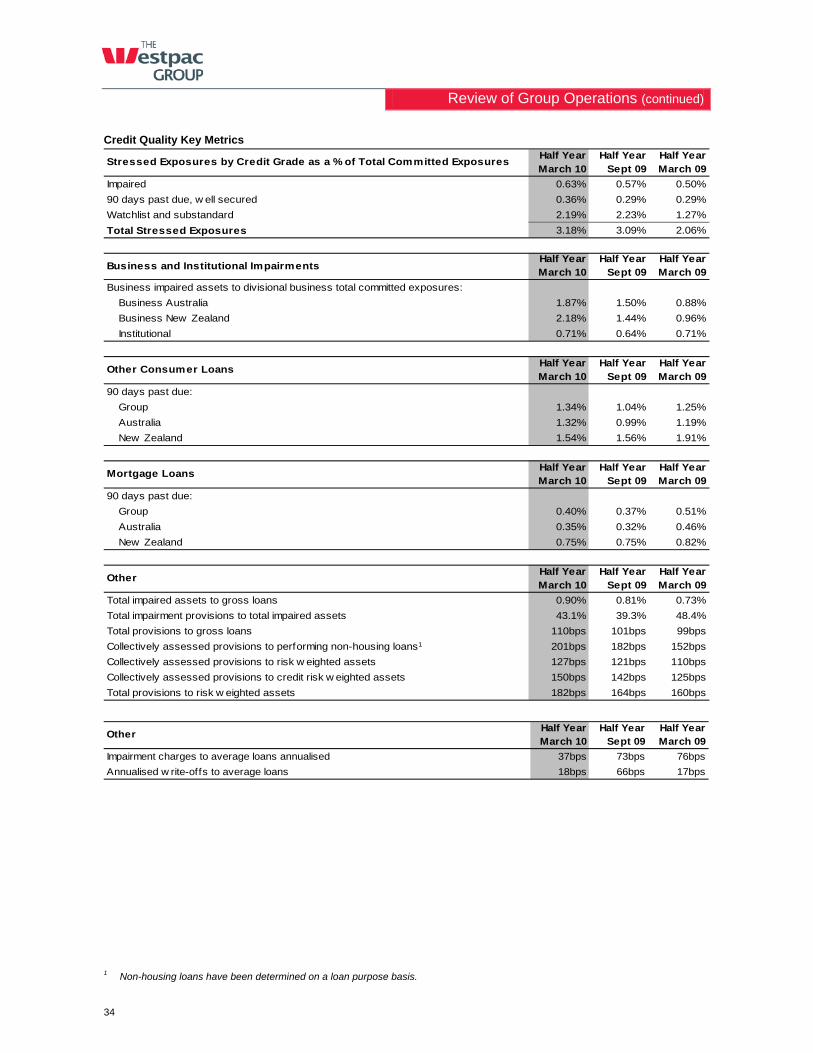
Review of Group Operations (continued)
34
Credit Quality Key Metrics
Stressed Exposures by Credit Grade as a % of Total Committed ExposuresHalf YearMarch 10
Half YearSept 09
Half YearMarch 09
Impaired 0.63% 0.57% 0.50%
90 days past due, w ell secured 0.36% 0.29% 0.29%
Watchlist and substandard 2.19% 2.23% 1.27%
Total Stressed Exposures 3.18% 3.09% 2.06%
Business and Institutional Impairments Half YearMarch 10
Half YearSept 09
Half YearMarch 09
Business impaired assets to divisional business total committed exposures:
Business Australia 1.87% 1.50% 0.88%
Business New Zealand 2.18% 1.44% 0.96%
Institutional 0.71% 0.64% 0.71%
Other Consumer LoansHalf YearMarch 10
Half YearSept 09
Half YearMarch 09
90 days past due:
Group 1.34% 1.04% 1.25%
Australia 1.32% 0.99% 1.19%
New Zealand 1.54% 1.56% 1.91%
Mortgage LoansHalf YearMarch 10
Half YearSept 09
Half YearMarch 09
90 days past due:
Group 0.40% 0.37% 0.51%
Australia 0.35% 0.32% 0.46%
New Zealand 0.75% 0.75% 0.82%
Other Half YearMarch 10
Half YearSept 09
Half YearMarch 09
Total impaired assets to gross loans 0.90% 0.81% 0.73%
Total impairment provisions to total impaired assets 43.1% 39.3% 48.4%
Total provisions to gross loans 110bps 101bps 99bps
Collectively assessed provisions to performing non-housing loans1 201bps 182bps 152bps
Collectively assessed provisions to risk w eighted assets 127bps 121bps 110bps
Collectively assessed provisions to credit risk w eighted assets 150bps 142bps 125bps
Total provisions to risk w eighted assets 182bps 164bps 160bps
OtherHalf YearMarch 10
Half YearSept 09
Half YearMarch 09
Impairment charges to average loans annualised 37bps 73bps 76bps
Annualised w rite-offs to average loans 18bps 66bps 17bps
1 Non-housing loans have been determined on a loan purpose basis.
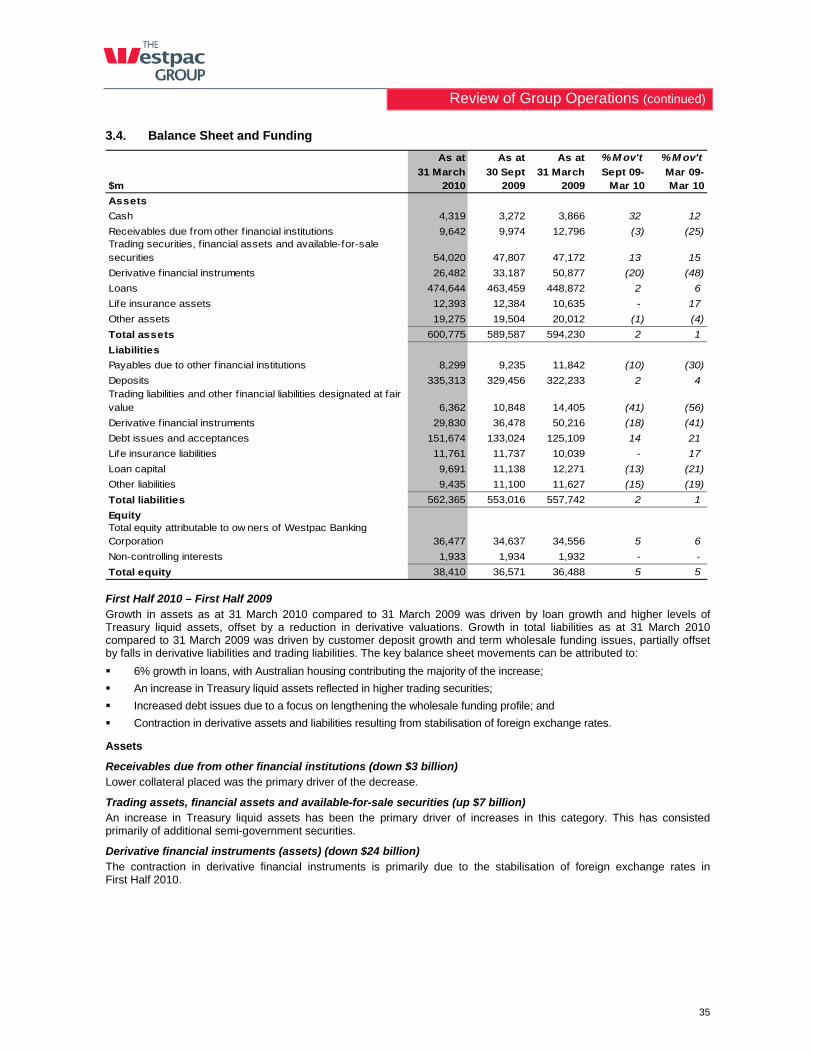
Review of Group Operations (continued)
35
3.4. Balance Sheet and Funding
As at As at As at % M ov't % M ov't
$m31 March
201030 Sept
200931 March
2009Sept 09-
Mar 10Mar 09-Mar 10
Assets
Cash 4,319 3,272 3,866 32 12
Receivables due from other f inancial institutions 9,642 9,974 12,796 (3) (25) Trading securities, f inancial assets and available-for-sale securities 54,020 47,807 47,172 13 15
Derivative f inancial instruments 26,482 33,187 50,877 (20) (48)
Loans 474,644 463,459 448,872 2 6
Life insurance assets 12,393 12,384 10,635 - 17
Other assets 19,275 19,504 20,012 (1) (4)
Total assets 600,775 589,587 594,230 2 1
Liabilities
Payables due to other f inancial institutions 8,299 9,235 11,842 (10) (30)
Deposits 335,313 329,456 322,233 2 4 Trading liabilities and other f inancial liabilities designated at fair value 6,362 10,848 14,405 (41) (56)
Derivative f inancial instruments 29,830 36,478 50,216 (18) (41)
Debt issues and acceptances 151,674 133,024 125,109 14 21
Life insurance liabilities 11,761 11,737 10,039 - 17
Loan capital 9,691 11,138 12,271 (13) (21)
Other liabilities 9,435 11,100 11,627 (15) (19)
Total liabilities 562,365 553,016 557,742 2 1
EquityTotal equity attributable to ow ners of Westpac Banking Corporation 36,477 34,637 34,556 5 6
Non-controlling interests 1,933 1,934 1,932 - -
Total equity 38,410 36,571 36,488 5 5
First Half 2010 – First Half 2009 Growth in assets as at 31 March 2010 compared to 31 March 2009 was driven by loan growth and higher levels of Treasury liquid assets, offset by a reduction in derivative valuations. Growth in total liabilities as at 31 March 2010 compared to 31 March 2009 was driven by customer deposit growth and term wholesale funding issues, partially offset by falls in derivative liabilities and trading liabilities. The key balance sheet movements can be attributed to:
6% growth in loans, with Australian housing contributing the majority of the increase;
An increase in Treasury liquid assets reflected in higher trading securities;
Increased debt issues due to a focus on lengthening the wholesale funding profile; and
Contraction in derivative assets and liabilities resulting from stabilisation of foreign exchange rates.
Assets
Receivables due from other financial institutions (down $3 billion) Lower collateral placed was the primary driver of the decrease.
Trading assets, financial assets and available-for-sale securities (up $7 billion) An increase in Treasury liquid assets has been the primary driver of increases in this category. This has consisted primarily of additional semi-government securities.
Derivative financial instruments (assets) (down $24 billion) The contraction in derivative financial instruments is primarily due to the stabilisation of foreign exchange rates in First Half 2010.
Review of Group Operations (continued)
36
Loans (up $26 billion) The growth in loans has been primarily driven by an 18% increase in Australian housing. Decreases in business lending of 9% in Australia and 4% in New Zealand have partially offset this loan growth.
Liabilities
Deposits (up $13 billion) The trend of increased retail deposits and reduced short-term funding has continued during First Half 2010. Australian Term Deposits have grown by 15%, while At Call accounts have remained relatively flat and Certificates of Deposits have fallen 11%.
Trading Liabilities and other financial liabilities (down $8 billion) This decrease is primarily the result of a lower level of securities sold under repurchase agreements.
Derivative financial instruments (liabilities) (down $20 billion) The reduction in derivative financial instruments is primarily due to the stabilisation of foreign exchange rates.
Debt Issues (up $27 billion) The increase in debt issues is the result of a focus on lengthening the term wholesale funding portfolio.
Loan Capital (down $3 billion) The decrease is primarily due to the redemption of subordinated notes and the impact of exchange rates.
Other Liabilities (down $2 billion) Primary drivers of this decrease are a decline in current tax liabilities, lower accrued expenses and a reduction in the Group’s superannuation obligations.
First Half 2010 – Second Half 2009 The key movements in the balance sheet generally reflected similar themes that impacted the movements from First Half 2010 to First Half 2009. These include:
Assets
Trading assets, financial assets and available-for-sale securities (up $6 billion) First Half 2010 saw a large increase in the Treasury liquid assets.
Derivative financial instruments (assets) (down $7 billion) The decline is primarily attributable to the impact of interest rates and foreign exchange movements.
Loans (up $11 billion) Australian housing grew 8% during First Half 2010. Business lending continued to contract, predominantly in the WIB business.
Liabilities
Deposits (up $6 billion) Term Deposit grew substantially, up 17%, however this was partially offset by a reduction in At Call deposits of 7%. Certificates of Deposit also fell 8%.
Trading liabilities and other financial liabilities (down $4 billion) Securities sold under agreements to repurchase continued to decrease in this period.
Derivative financial instruments (liabilities) (down $7 billion) The decline is primarily attributable to the impact of interest rates and foreign exchange movements.
Debt Issues (up $19 billion) The Group continued to lengthen its longer-term wholesale funding profile in First Half 2010.
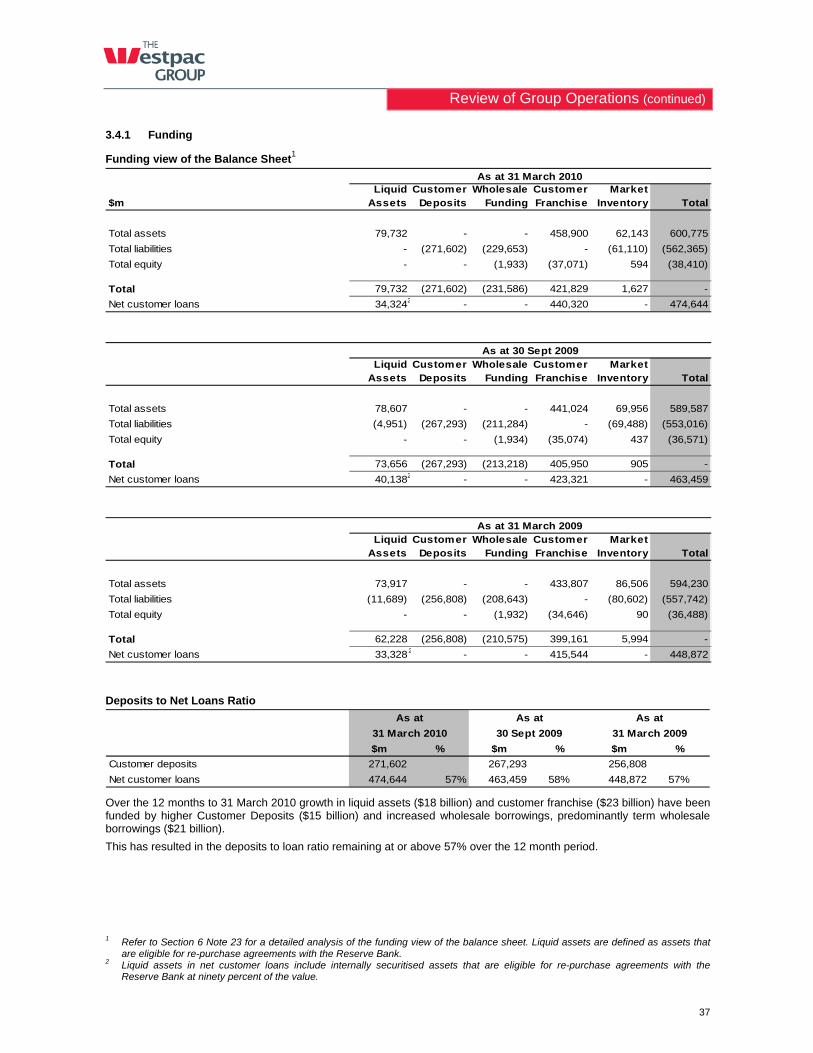
Review of Group Operations (continued)
37
3.4.1 Funding
Funding view of the Balance Sheet1
$m Liquid
AssetsCustomer
DepositsWholesale
FundingCustomer Franchise
Market Inventory Total
Total assets 79,732 - - 458,900 62,143 600,775
Total liabilities - (271,602) (229,653) - (61,110) (562,365)
Total equity - - (1,933) (37,071) 594 (38,410)
Total 79,732 (271,602) (231,586) 421,829 1,627 -
Net customer loans 34,324 - - 440,320 - 474,644
Liquid Assets
Customer Deposits
Wholesale Funding
Customer Franchise
Market Inventory Total
Total assets 78,607 - - 441,024 69,956 589,587
Total liabilities (4,951) (267,293) (211,284) - (69,488) (553,016)
Total equity - - (1,934) (35,074) 437 (36,571)
Total 73,656 (267,293) (213,218) 405,950 905 -
Net customer loans 40,138 - - 423,321 - 463,459
Liquid Assets
Customer Deposits
Wholesale Funding
Customer Franchise
Market Inventory Total
Total assets 73,917 - - 433,807 86,506 594,230
Total liabilities (11,689) (256,808) (208,643) - (80,602) (557,742)
Total equity - - (1,932) (34,646) 90 (36,488)
Total 62,228 (256,808) (210,575) 399,161 5,994 -
Net customer loans 33,328 - - 415,544 - 448,872
As at 31 March 2009
As at 30 Sept 2009
As at 31 March 2010
2
2
2
Deposits to Net Loans Ratio
$m % $m % $m %
Customer deposits 271,602 267,293 256,808
Net customer loans 474,644 57% 463,459 58% 448,872 57%
31 March 2010 30 Sept 2009 31 March 2009
As at As at As at
Over the 12 months to 31 March 2010 growth in liquid assets ($18 billion) and customer franchise ($23 billion) have been funded by higher Customer Deposits ($15 billion) and increased wholesale borrowings, predominantly term wholesale borrowings ($21 billion).
This has resulted in the deposits to loan ratio remaining at or above 57% over the 12 month period.
1 Refer to Section 6 Note 23 for a detailed analysis of the funding view of the balance sheet. Liquid assets are defined as assets that
are eligible for re-purchase agreements with the Reserve Bank. 2 Liquid assets in net customer loans include internally securitised assets that are eligible for re-purchase agreements with the
Reserve Bank at ninety percent of the value.
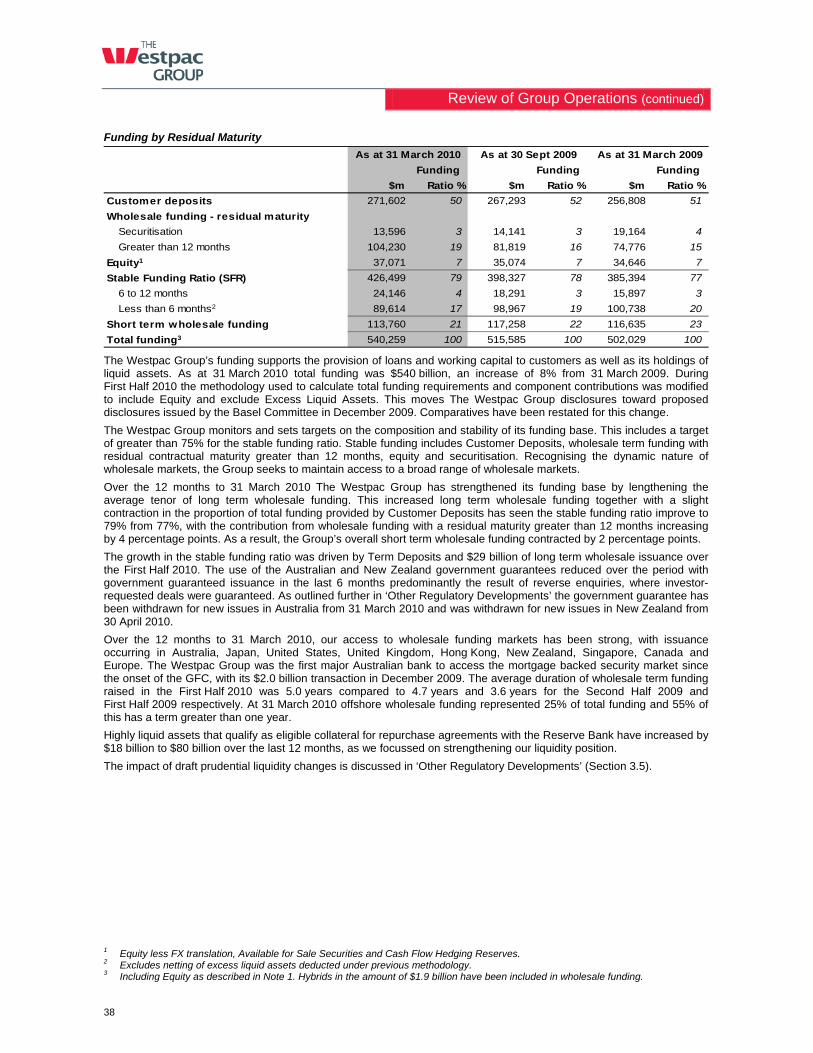
Review of Group Operations (continued)
38
Funding by Residual Maturity
Funding Funding Funding
$m Ratio % $m Ratio % $m Ratio %
Customer deposits 271,602 50 267,293 52 256,808 51
Wholesale funding - residual maturity
Securitisation 13,596 3 14,141 3 19,164 4
Greater than 12 months 104,230 19 81,819 16 74,776 15
Equity1 37,071 7 35,074 7 34,646 7
Stable Funding Ratio (SFR) 426,499 79 398,327 78 385,394 77
6 to 12 months 24,146 4 18,291 3 15,897 3
Less than 6 months2 89,614 17 98,967 19 100,738 20
Short term wholesale funding 113,760 21 117,258 22 116,635 23
Total funding3 540,259 100 515,585 100 502,029 100
As at 31 March 2009As at 31 March 2010 As at 30 Sept 2009
The Westpac Group’s funding supports the provision of loans and working capital to customers as well as its holdings of liquid assets. As at 31 March 2010 total funding was $540 billion, an increase of 8% from 31 March 2009. During First Half 2010 the methodology used to calculate total funding requirements and component contributions was modified to include Equity and exclude Excess Liquid Assets. This moves The Westpac Group disclosures toward proposed disclosures issued by the Basel Committee in December 2009. Comparatives have been restated for this change.
The Westpac Group monitors and sets targets on the composition and stability of its funding base. This includes a target of greater than 75% for the stable funding ratio. Stable funding includes Customer Deposits, wholesale term funding with residual contractual maturity greater than 12 months, equity and securitisation. Recognising the dynamic nature of wholesale markets, the Group seeks to maintain access to a broad range of wholesale markets.
Over the 12 months to 31 March 2010 The Westpac Group has strengthened its funding base by lengthening the average tenor of long term wholesale funding. This increased long term wholesale funding together with a slight contraction in the proportion of total funding provided by Customer Deposits has seen the stable funding ratio improve to 79% from 77%, with the contribution from wholesale funding with a residual maturity greater than 12 months increasing by 4 percentage points. As a result, the Group’s overall short term wholesale funding contracted by 2 percentage points.
The growth in the stable funding ratio was driven by Term Deposits and $29 billion of long term wholesale issuance over the First Half 2010. The use of the Australian and New Zealand government guarantees reduced over the period with government guaranteed issuance in the last 6 months predominantly the result of reverse enquiries, where investor-requested deals were guaranteed. As outlined further in ‘Other Regulatory Developments’ the government guarantee has been withdrawn for new issues in Australia from 31 March 2010 and was withdrawn for new issues in New Zealand from 30 April 2010.
Over the 12 months to 31 March 2010, our access to wholesale funding markets has been strong, with issuance occurring in Australia, Japan, United States, United Kingdom, Hong Kong, New Zealand, Singapore, Canada and Europe. The Westpac Group was the first major Australian bank to access the mortgage backed security market since the onset of the GFC, with its $2.0 billion transaction in December 2009. The average duration of wholesale term funding raised in the First Half 2010 was 5.0 years compared to 4.7 years and 3.6 years for the Second Half 2009 and First Half 2009 respectively. At 31 March 2010 offshore wholesale funding represented 25% of total funding and 55% of this has a term greater than one year.
Highly liquid assets that qualify as eligible collateral for repurchase agreements with the Reserve Bank have increased by $18 billion to $80 billion over the last 12 months, as we focussed on strengthening our liquidity position.
The impact of draft prudential liquidity changes is discussed in ‘Other Regulatory Developments’ (Section 3.5).
1 Equity less FX translation, Available for Sale Securities and Cash Flow Hedging Reserves. 2 Excludes netting of excess liquid assets deducted under previous methodology. 3 Including Equity as described in Note 1. Hybrids in the amount of $1.9 billion have been included in wholesale funding.
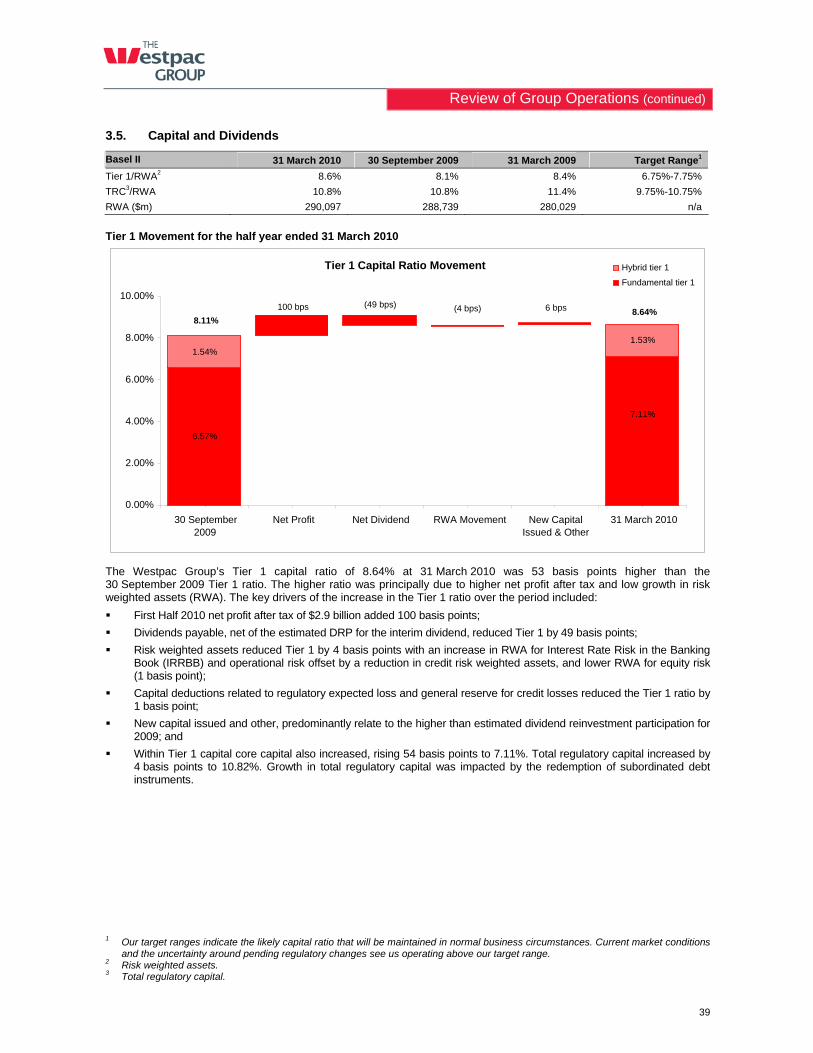
Review of Group Operations (continued)
39
3.5. Capital and Dividends
Basel II 31 March 2010 30 September 2009 31 March 2009 Target Range1
Tier 1/RWA2 8.6% 8.1% 8.4% 6.75%-7.75%
TRC3/RWA 10.8% 10.8% 11.4% 9.75%-10.75%
RWA ($m) 290,097 288,739 280,029 n/a
Tier 1 Movement for the half year ended 31 March 2010
The Westpac Group’s Tier 1 capital ratio of 8.64% at 31 March 2010 was 53 basis points higher than the 30 September 2009 Tier 1 ratio. The higher ratio was principally due to higher net profit after tax and low growth in risk weighted assets (RWA). The key drivers of the increase in the Tier 1 ratio over the period included:
First Half 2010 net profit after tax of $2.9 billion added 100 basis points;
Dividends payable, net of the estimated DRP for the interim dividend, reduced Tier 1 by 49 basis points;
Risk weighted assets reduced Tier 1 by 4 basis points with an increase in RWA for Interest Rate Risk in the Banking Book (IRRBB) and operational risk offset by a reduction in credit risk weighted assets, and lower RWA for equity risk (1 basis point);
Capital deductions related to regulatory expected loss and general reserve for credit losses reduced the Tier 1 ratio by 1 basis point;
New capital issued and other, predominantly relate to the higher than estimated dividend reinvestment participation for 2009; and
Within Tier 1 capital core capital also increased, rising 54 basis points to 7.11%. Total regulatory capital increased by 4 basis points to 10.82%. Growth in total regulatory capital was impacted by the redemption of subordinated debt instruments.
1 Our target ranges indicate the likely capital ratio that will be maintained in normal business circumstances. Current market conditions
and the uncertainty around pending regulatory changes see us operating above our target range. 2 Risk weighted assets. 3 Total regulatory capital.
Tier 1 Capital Ratio Movement
6.57%
1.53%
8.64% 8.11%
7.11%
6 bps (4 bps)(49 bps) 100 bps
1.54%
0.00%
2.00%
4.00%
6.00%
8.00%
10.00%
30 September 2009
Net Profit Net Dividend RWA Movement New Capital Issued & Other
31 March 2010
Hybrid tier 1
Fundamental tier 1
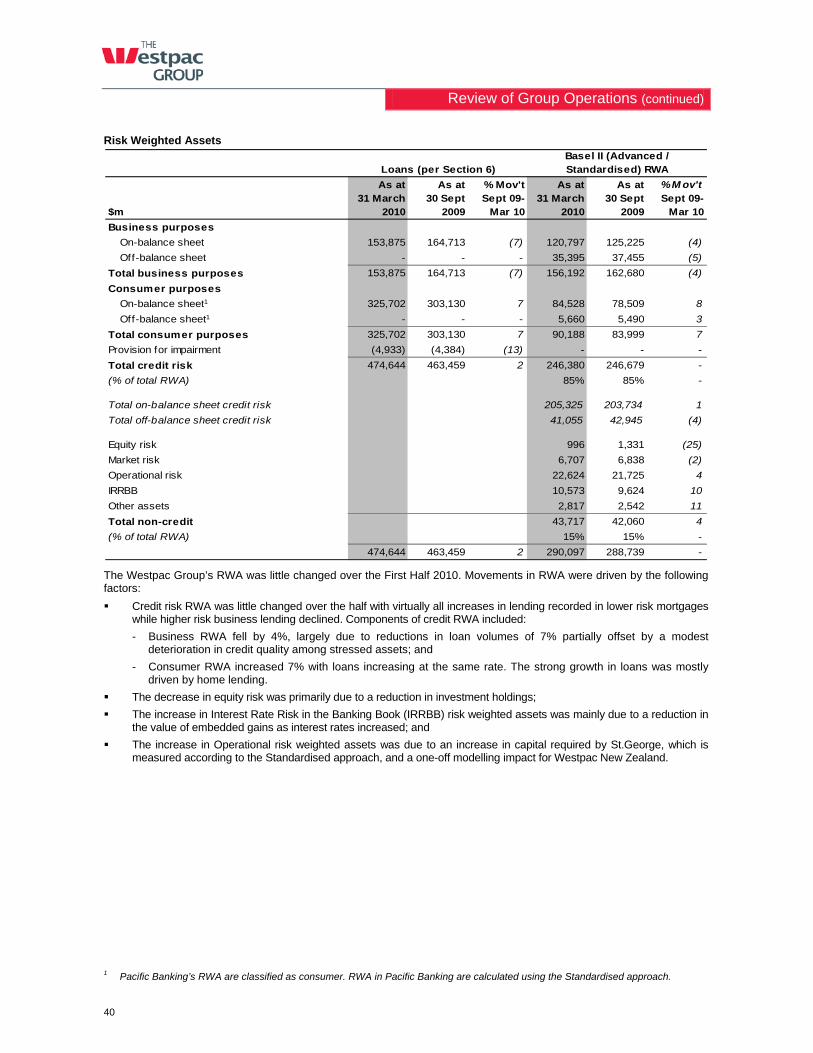
Review of Group Operations (continued)
40
Risk Weighted Assets
As at As at % Mov't As at As at % M ov't
$m31 March
201030 Sept
2009Sept 09-
Mar 1031 March
201030 Sept
2009Sept 09-
Mar 10
Business purposes
On-balance sheet 153,875 164,713 (7) 120,797 125,225 (4)
Off-balance sheet - - - 35,395 37,455 (5)
Total business purposes 153,875 164,713 (7) 156,192 162,680 (4)
Consumer purposes
On-balance sheet1 325,702 303,130 7 84,528 78,509 8
Off-balance sheet1 - - - 5,660 5,490 3
Total consumer purposes 325,702 303,130 7 90,188 83,999 7
Provision for impairment (4,933) (4,384) (13) - - -
Total credit risk 474,644 463,459 2 246,380 246,679 -
(% of total RWA) 85% 85% -
Total on-balance sheet credit risk 205,325 203,734 1
Total off-balance sheet credit risk 41,055 42,945 (4)
Equity risk 996 1,331 (25)
Market risk 6,707 6,838 (2)
Operational risk 22,624 21,725 4
IRRBB 10,573 9,624 10
Other assets 2,817 2,542 11
Total non-credit 43,717 42,060 4
(% of total RWA) 15% 15% -
474,644 463,459 2 290,097 288,739 -
Loans (per Section 6)Basel II (Advanced / Standardised) RWA
The Westpac Group’s RWA was little changed over the First Half 2010. Movements in RWA were driven by the following factors:
Credit risk RWA was little changed over the half with virtually all increases in lending recorded in lower risk mortgages while higher risk business lending declined. Components of credit RWA included:
- Business RWA fell by 4%, largely due to reductions in loan volumes of 7% partially offset by a modest deterioration in credit quality among stressed assets; and
- Consumer RWA increased 7% with loans increasing at the same rate. The strong growth in loans was mostly driven by home lending.
The decrease in equity risk was primarily due to a reduction in investment holdings;
The increase in Interest Rate Risk in the Banking Book (IRRBB) risk weighted assets was mainly due to a reduction in the value of embedded gains as interest rates increased; and
The increase in Operational risk weighted assets was due to an increase in capital required by St.George, which is measured according to the Standardised approach, and a one-off modelling impact for Westpac New Zealand.
1 Pacific Banking’s RWA are classified as consumer. RWA in Pacific Banking are calculated using the Standardised approach.
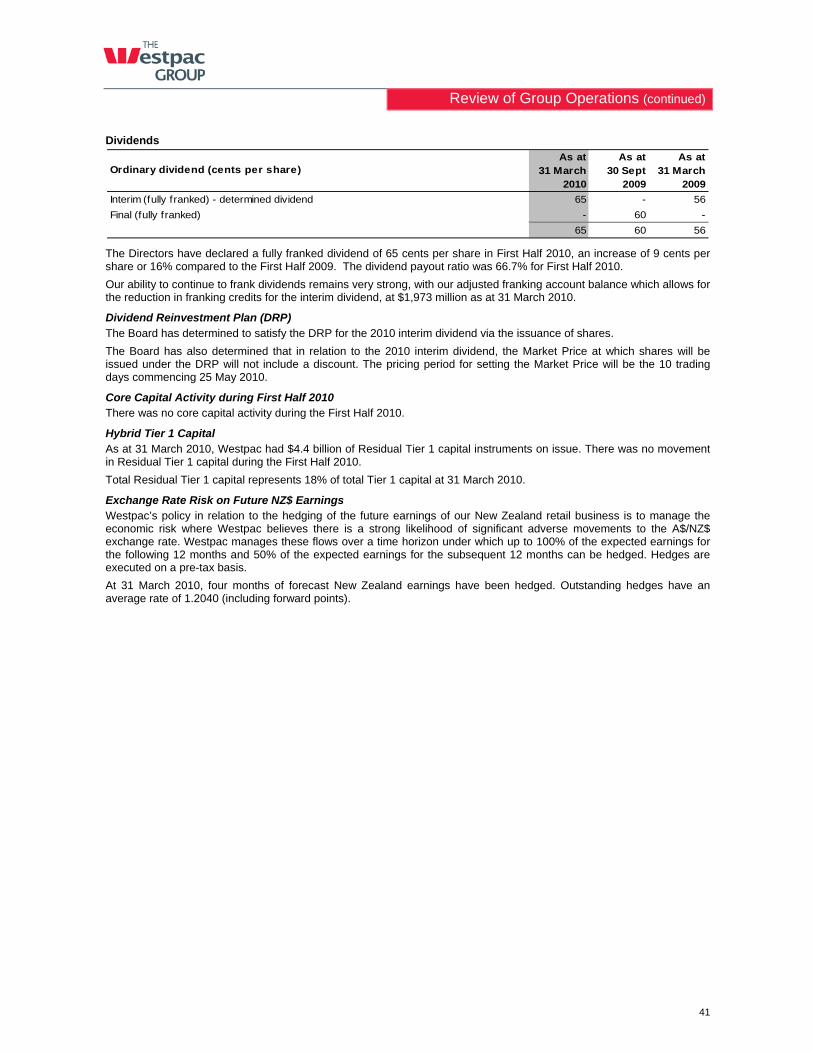
Review of Group Operations (continued)
41
Dividends
Ordinary dividend (cents per share)As at
31 March2010
As at 30 Sept
2009
As at 31 March
2009
Interim (fully franked) - determined dividend 65 - 56
Final (fully franked) - 60 -
65 60 56
The Directors have declared a fully franked dividend of 65 cents per share in First Half 2010, an increase of 9 cents per share or 16% compared to the First Half 2009. The dividend payout ratio was 66.7% for First Half 2010.
Our ability to continue to frank dividends remains very strong, with our adjusted franking account balance which allows for the reduction in franking credits for the interim dividend, at $1,973 million as at 31 March 2010.
Dividend Reinvestment Plan (DRP) The Board has determined to satisfy the DRP for the 2010 interim dividend via the issuance of shares.
The Board has also determined that in relation to the 2010 interim dividend, the Market Price at which shares will be issued under the DRP will not include a discount. The pricing period for setting the Market Price will be the 10 trading days commencing 25 May 2010.
Core Capital Activity during First Half 2010 There was no core capital activity during the First Half 2010.
Hybrid Tier 1 Capital As at 31 March 2010, Westpac had $4.4 billion of Residual Tier 1 capital instruments on issue. There was no movement in Residual Tier 1 capital during the First Half 2010.
Total Residual Tier 1 capital represents 18% of total Tier 1 capital at 31 March 2010.
Exchange Rate Risk on Future NZ$ Earnings Westpac’s policy in relation to the hedging of the future earnings of our New Zealand retail business is to manage the economic risk where Westpac believes there is a strong likelihood of significant adverse movements to the A$/NZ$ exchange rate. Westpac manages these flows over a time horizon under which up to 100% of the expected earnings for the following 12 months and 50% of the expected earnings for the subsequent 12 months can be hedged. Hedges are executed on a pre-tax basis.
At 31 March 2010, four months of forecast New Zealand earnings have been hedged. Outstanding hedges have an average rate of 1.2040 (including forward points).
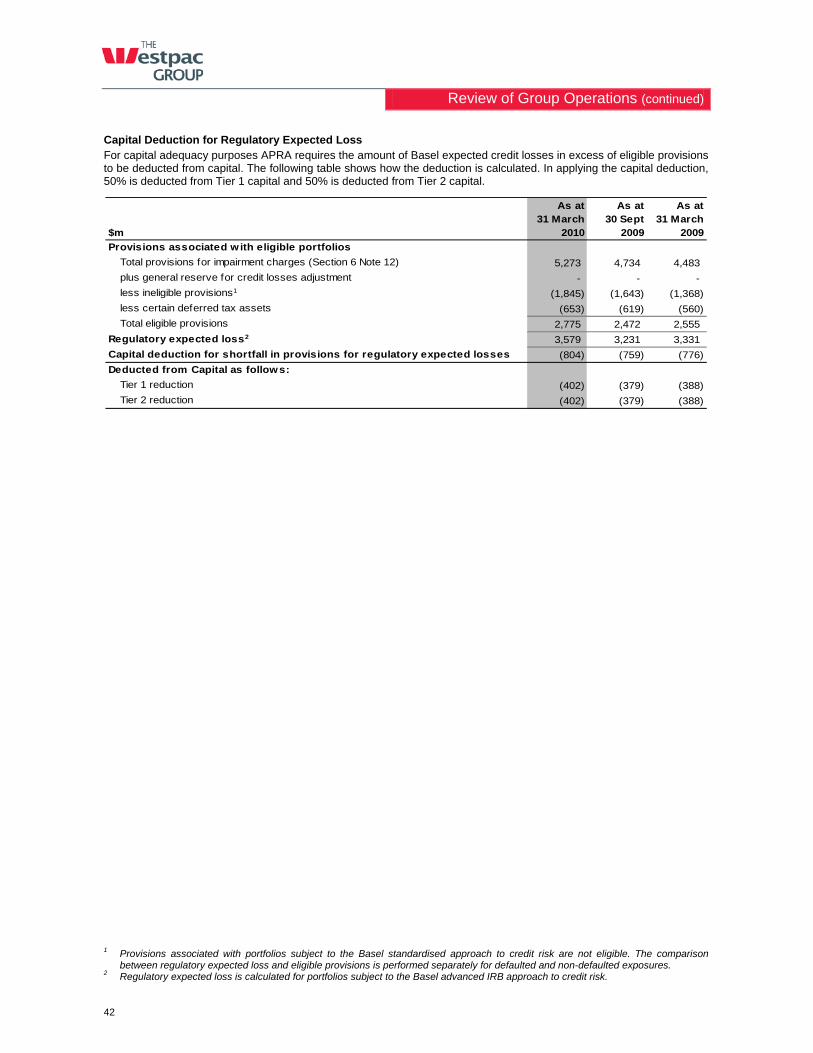
Review of Group Operations (continued)
42
Capital Deduction for Regulatory Expected Loss For capital adequacy purposes APRA requires the amount of Basel expected credit losses in excess of eligible provisions to be deducted from capital. The following table shows how the deduction is calculated. In applying the capital deduction, 50% is deducted from Tier 1 capital and 50% is deducted from Tier 2 capital.
As at As at As at
$m31 March
201030 Sept
200931 March
2009
Provisions associated with eligible portfolios
Total provisions for impairment charges (Section 6 Note 12) 5,273 4,734 4,483
plus general reserve for credit losses adjustment - - -
less ineligible provisions1 (1,845) (1,643) (1,368)
less certain deferred tax assets (653) (619) (560)
Total eligible provisions 2,775 2,472 2,555
Regulatory expected loss2 3,579 3,231 3,331
Capital deduction for shortfall in provisions for regulatory expected losses (804) (759) (776)
Deducted from Capital as follows:
Tier 1 reduction (402) (379) (388)
Tier 2 reduction (402) (379) (388)
1 Provisions associated with portfolios subject to the Basel standardised approach to credit risk are not eligible. The comparison
between regulatory expected loss and eligible provisions is performed separately for defaulted and non-defaulted exposures. 2 Regulatory expected loss is calculated for portfolios subject to the Basel advanced IRB approach to credit risk.
Review of Group Operations (continued)
43
3.6. Other Regulatory Developments
Australian government guarantee scheme On 7 February 2010, the Australian Government announced that the Guarantee Scheme for Large Deposits and Wholesale Funding (the Guarantee Scheme) would close to new liabilities from 31 March 2010. The Guarantee Scheme, originally announced in October 2008, provided a guarantee facility for deposits of amounts over $1 million and wholesale funding of an eligible ADI, in return for a fee payable by the eligible ADI.
Deposit balances above $1 million covered by the Guarantee Scheme as at 31 March 2010 will be covered until maturity (for Term Deposits) or until October 2015 (for at call deposits). For at call deposits, the amount covered will be capped at the closing guaranteed amount on 31 March 2010. Deposits and interest payments after this date will only be covered (up to the capped amount) if the guaranteed balance has fallen below the capped amount. For Term Deposits, interest due after 31 March 2010 will be guaranteed to maturity. Statutory trust accounts will be treated in the same way as other large deposits. Guaranteed wholesale liabilities as at 31 March 2010 will also be guaranteed to the earlier of maturity or five years.
Guarantee Scheme fees based on eligible ADIs’ long term credit rating will continue to apply throughout the period for which the guarantee applies to the respective deposits. ADIs administer this fee on behalf of the Australian Government. At Westpac this fee is calculated daily and paid monthly in arrears. The monthly payment is calculated on the basis of the funds to be guaranteed, multiplied by the Guarantee Scheme fee. The Guarantee Scheme fee applicable to Westpac, based on its current long term rating by Standard and Poor’s of AA, is 70 basis points or (0.70%) per annum. The fee waiver for guaranteed amounts held in statutory trust accounts will continue to apply.
The closure of the Guarantee Scheme does not affect the Financial Claims Scheme (FCS), administered by the Australian Prudential Regulation Authority (APRA), which will continue to provide depositors a free guarantee of deposits up to and including $1 million in eligible ADIs. The FCS applies to an eligible ADI if APRA has applied for the winding up of the ADI and the responsible Australian Government minister has declared that the FCS applies to that ADI. The Financial Claims Scheme (ADIs) Levy Act 2008 provides for the imposition of a levy to fund the excess of certain of APRA’s financial claims scheme costs connected with the ADI. The levy is imposed on liabilities of eligible ADIs to their depositors and cannot be more than 0.5% of the amount of those liabilities. The $1 million FCS cap will be reviewed by the Australian Government in October 2011.
New Zealand government guarantee scheme Westpac New Zealand Limited (WNZL) opted into the NZ deposit guarantee scheme that the NZ Government originally announced on 12 October 2008. The scheme was for a two year period from that date. WNZL entered into a Crown Deed of Guarantee on 11 November 2008, which was amended by a Supplemental Deed dated 24 November 2008. The Crown withdrew the original deed in respect of indebtedness incurred on or after 1 January 2010 and entered into a revised deed of guarantee with WNZL dated 16 December 2009. The expiry date of the scheme remains 12 October 2010.
The NZ deposit guarantee extends to debt securities issued by WNZL in any currency (which includes deposits and other amounts lent to WNZL), other than debt securities issued to excluded creditors such as financial institutions and related parties of a participating entity. It does not extend to subordinated debt obligations. The debt securities covered by the NZ deposit guarantees are limited to an amount of NZ$1 million per creditor per approved institution. Under the original NZ deposit guarantee, WNZL was required to pay a fee of 10 basis points (or 0.1%) on the amounts owing to creditors covered by that guarantee to the extent that amount exceeded NZ$5 billion as at 12 October 2008. A similar additional fee was payable in respect of the position as at 12 October 2009.
On 25 August 2009 the Crown announced an extension of the deposit guarantee scheme. The extension scheme is effectively a new scheme that will commence on 12 October 2010 and end on 31 December 2011. Institutions must re-apply to have a guarantee under the extension scheme. As at the date of this report, WNZL and Westpac Banking Corporation's NZ Branch have not applied for the extension scheme.
On 1 November 2008, the New Zealand Government announced details of a wholesale funding guarantee facility (Facility) to investment-grade financial institutions that have substantial New Zealand borrowing and lending operations. The Crown entered into a Crown Wholesale Funding Guarantee Facility Deed with WNZL on 23 February 2009 and has provided a Crown Wholesale Funding Guarantee in respect of WNZL dated the same date. The Facility operated on an opt-in basis, by institution and by instrument. Wholesale funding liabilities of WNZL (which could include amounts guaranteed by WNZL) only have the benefit of the Facility where a Guarantee Eligibility Certificate has been issued in respect of those liabilities. Copies of the Guarantee Eligibility Certificates issued in respect of WNZL obligations are available on the NZ Treasury internet site. A guarantee fee is charged for each Guarantee Eligibility Certificate issued under the Facility, differentiated by the credit rating of the issuer of the relevant securities, the term of the security being guaranteed and, in the case of issues with terms of more than one year, between New Zealand dollar and non-New Zealand dollar issues. The maximum term of securities guaranteed is five years.
The Facility closed on 30 April 2010. From that time no new Guarantee Eligibility Certificates will be issued but existing guaranteed liabilities will not be affected. Westpac Banking Corporation’s New Zealand Branch did not participate in the scheme.
Review of Group Operations (continued)
44
Further information about the NZ deposit guarantee and the Facility may be obtained from WNZL’s General Short Form Disclosure Statement for the three months ended 31 December 2009 and the New Zealand Treasury internet site ‘www.treasury.govt.nz’.
Liquidity On 17 December 2009 the Basel Committee on Banking Supervision (BCBS) released a consultative document titled ‘International framework for liquidity risk measurement, standards and monitoring’. The BCBS intends to release final standards by December 2010, with implementation by national jurisdictions before December 2012.
APRA has indicated that it will release revised liquidity standards for consultation following the finalisation of the BCBS standards. It is expected that APRA will release final standards by December 2011.
A consultation process and Quantitative Impact Study is currently being undertaken by the BCBS and details of the proposed enhanced liquidity requirements may change through that process. Until there is greater clarity regarding the new prudential requirements, any impact on Westpac cannot be determined.
Capital It is currently anticipated that APRA amendments to the methodology for calculating risk-weighted assets for market risk in the bank trading books will be implemented from 1 January 2011. The final version of these changes is expected during 2010. It is likely that the new methodology will increase the risk-weighted assets reported for market risk.
On 17 December 2009 the BCBS also released a consultative document titled ‘Strengthening the Resilience of the Banking Sector’. New prudential requirements for regulatory capital and the measurement of risk-weighted assets are expected to be released by 2010, with implementation targeted for the end of 2012. At this stage, it is uncertain how many of the proposed changes in the consultative document will be translated into prudential requirements for banks and for supervisors. Until there is greater clarity, any impact on Westpac cannot be determined.
Further standards are anticipated from the BCBS during 2010, with attention expected to be paid to the prudential requirements for systemically important banks, including Westpac.
Tax Developments The Australian Federal Government commissioned Australia’s Future Tax System Review (the Review) which is a comprehensive review of the Australian taxation system (except GST), chaired by the Secretary to the Treasurer, Dr Ken Henry AC.
On 2 May 2010 the Federal Government released the Review and its initial response. A large proportion of the Review’s 138 recommendations are not dealt with in the Government’s initial response. Of the recommendations addressed in its initial response, the Government recommends reducing the company tax rate to 29% for the 2013-2014 income year and to 28% from the 2014-15 income year (28% for small business by 2012), and the gradual increase of the employers’ compulsory superannuation guarantee from 9% to 12% by 2020. Detail of these proposed reforms, and the Government’s response to the other recommendations, are expected to be released progressively. Until further detail is released, and any changes to the law finalised, any impact on Westpac cannot be determined.
Changes to Accounting Standards In further response to the global financial crisis, governments, regulators and accounting standard setters are working to revise certain accounting standards. The objective is to achieve convergence towards a single set of high-quality, global and independent accounting standards. The specific areas that have been targeted include accounting for financial instruments, loan-loss provisioning, off-balance sheet exposures and the impairment and valuation of financial assets. The Group expects that there will be a number of new standards issued in calendar years 2010 and 2011 and that these may require changes to our current accounting approaches.
Further Regulatory Developments The Australian Federal Government has embarked on a program of regulatory reform which will affect Westpac. This includes:
credit law reform;
the introduction of an unfair contracts regime in relation to contracts with consumers;
margin lending reform;
superannuation changes;
changes to the regulation of the financial planning sector and the provision of financial advice, including obligations to promote advisors acting in the best interests of their clients and a prospective ban on remuneration structures perceived to give rise to undue conflicts of interest; and
the introduction of a new regulatory framework for personal property securities.
Westpac continues to monitor and review the above developments and is, or will amend its systems, processes and operations to implement regulatory changes as they occur.
Review of Group Operations (continued)
45
Operating Model Review in New Zealand Until 1 November 2006, Westpac Banking Corporation (WBC) conducted its banking operations within New Zealand in a branch structure. On that date, and after extensive consultation with the Reserve Bank of New Zealand (RBNZ), Westpac adopted a dual registration operating model including a locally incorporated subsidiary, Westpac New Zealand Limited (WNZL), to conduct its retail and business banking activities in New Zealand, and a branch, Westpac Banking Corporation New Zealand Branch (NZ Branch) to conduct its Institutional and financial markets activities. The conditions of registration of each of WNZL and NZ Branch are consistent with these operating model arrangements. In 2008, it became apparent that both WNZL and NZ Branch had been non-compliant with certain of their conditions of registration. Consequently, the RBNZ asked Westpac to review the structure of its operating model in New Zealand to ensure that it is able to sustain durable compliance with the RBNZ's prudential policies. Accordingly, it was agreed that an independent review would take place, with the terms of reference for the review established through consultation between the RBNZ, WNZL and NZ Branch. The RBNZ, WNZL and WBC have now reached agreement on changes to the operating model and an implementation programme is currently being developed. As a result, there will be a transfer of assets and liabilities from NZ Branch to WNZL, with WNZL then assuming most of the lending and deposit-taking activities, and certain other activities, currently conducted by the NZ Branch. The NZ Branch will continue to provide full financial markets functionality to its customers. The new operating model is currently expected to be in place by the end of 2011.
Review of Group Operations (continued)
46
3.7. Sustainability Performance At The Westpac Group, our sustainability strategy covers six key areas of performance to drive value for the business and its stakeholders. These focus areas address emerging material issues for the business and the associated risks and opportunities.
This section reviews our progress against these six areas of focus and some of the objectives for each.
Environment
2010 Objective Progress
1. Climate change – transitioning to a low carbon future
Launch carbon hedging and risk management solutions for customers
On track for product delivery for the commencement of market trading in Australia and New Zealand. Trading documentation completed and being rolled out to customers.
Engage with impacted clients Continued engagement with customers in Australia and New Zealand who are likely to be impacted by the introduction of emissions trading and other policy measures.
Incorporate carbon considerations into credit and risk processes and sector strategies
Carbon risk has been incorporated into sector strategy and credit submission templates. Carbon risk management incorporated into specific high risk transactions.
2. Treading lightly – environmental footprint1
Reduce Scope 1 and 2 emissions2 by 12.5% from 2008 levels for Australia and New Zealand
Emissions decreased by 9,915 tonnes in 2009.
Reduce paper consumption by 7% from 2008 levels for Australia and New Zealand (8,791 tonnes)
Paper consumption has decreased by more than 10%.
Increased measurement of indirect emissions
Reporting of Scope 3 emissions2 expanded to include new categories, including taxis as well as indirect emissions from St.George and BankSA.
Indicator1 Target1
Latest
Available42009
Pro Forma2008
Total Electricity Consumption (Aust & NZ) (GJ) 693,885 375,732 793,118 793,011
Greenhouse gas emissions (Aust & NZ) (Equivalent tonnes of CO2)3 165,305 92,958 187,239 188,920
1 Objectives are for the reporting period ending 30 June 2010 in line with the requirements of the National Greenhouse and Energy
Reporting Act. 2 Scope 1 emissions are all direct green house gas (GHG) emissions generated by the organisation. Scope 2 emissions are GHG
emissions from energy (typically electricity) purchased by the organisation. Scope 3 emissions are GHG emissions from other indirect sources (typically from purchased materials, products or services).
3 The 2009 figure includes 8,082 tonnes of CO2 emissions associated with facilities and categories that were not included in the pro forma 2008 reported figures that are now required following the implementation of the National Greenhouse and Energy Reporting Act.
4 Latest available figures are for the period 1 July 2009 to 31 December 2009 and are unaudited at the time of publication.
Review of Group Operations
47
Social
2010 Objective Progress
3. Going mainstream – sustainable products
Launch an innovative savings product
In October 2009, St.George Bank and BankSA launched SENSE, a savings product with in-built tools to save and improve their customers’ money management. Winner of a 2010 Canstar Cannex Innovation Excellence Award.
Launch energy efficiency products
First major bank to participate in the Federal Government’s Green Loan program and a participant in the New Zealand Government’s ‘Warm Up New Zealand’ campaign to encourage the installation of heat pumps and insulation.
4. Speaking out – in support of sustainable business practice
Advocate for continued action on climate change
Founding partner of the Advance Green Network linking Australians around the world involved in sustainability. Events have already been held in New York and London.
Released Westpac Charles Sturt University Index on the views of farmers on climate change and the impact it will have on their business.
Assist SMEs to adopt more sustainable business practices
Involved in the National SME Project and the launch of the Good Business Register for SMEs.
Promote use of Environmental, Social and Governance (ESG) factors in investment decision making
Sustainability performance integrated into the 2009 Annual Review.
Hosted an analyst briefing on sustainability in the finance sector presented by the SAM Group sector analyst.
5. People and Places – social sustainability
Roll out of local social engagement and investment model
“Westpac Local” model focuses on local community involvement through greater local accountability and deeper local engagement.
Maintain employee engagement Employee engagement increased to 81%, up from 78% in 2008, and now equal to the Towers Perrin-ISR Global High Performing Companies norm.
Indicator
Latest
Available 2009 2008
Community contributions – Australia (A$m) 805 801 562
Employee turnover % (total) 166 143 19
Employee engagement (% employees reporting a favourable score)4 81 81 78
Lost Time Injury Frequency Rate (Injuries per one million hours worked) 3.36 2.8 3.4
1 Includes St.George Bank Community contributions – unaudited figure. Includes $48.9 million from foregone revenue for the fee free
accounts for non-profit organisations and low income earners in 2009 (2008: $36 million). 2 Figures for 2008 based on Westpac stand-alone. 3 Based on a 12 month rolling average. This result includes St.George Bank. 4 Annual Staff Perspectives Survey (SPS) is conducted in May each year. 2008 figure does not include St.George Bank.
Source: Towers Perrin-ISR. 5 Data available as at 30 September 2009. 6 Based on a 12 month rolling average as at 31 March 2010.
Review of Group Operations (continued)
48
Governance
2010 Objective Progress
6. Solid Foundations – governance and risk
Develop a consistent framework for Environmental, Social and Governance (ESG) credit risk analysis across all business units
A draft framework has been developed and is currently being reviewed by key stakeholders.
Implement Sustainable Supply Chain Management across all countries and brands
The Sustainable Supply Chain Management policy applies across all countries and brands. Implemented in all Australian brands and to high spend suppliers in Pacific Banking. Detailed sustainability assessments are currently being carried out with high risk and high spend suppliers in New Zealand.
Review of Group Operations
49
3.8. St.George Merger and Integration The merger has significantly enhanced The Westpac Group by increasing its scale, growing the customer base, and improving the Group’s capacity to meet customer needs and preferences via a multi-brand strategy. In particular, the merger has led to:
A 40% increase in customer numbers to around 10 million, along with a 40% increase in Australian distribution capacity, including more branches, more business banking centres and a significant increase in ATMs; and
Enhanced revenue opportunities, including the sharing of best practice and the roll out of additional banking and wealth products across the St.George network.
The development of a multi-brand strategy has been a key element of the merger, allowing The Westpac Group to meet the specific needs of a broader range of customers. As a result, the merger has seen:
Retention of all the brands including Westpac, RAMS, BTFG, St.George, BankSA and Asgard;
Retention of the branch and ATM networks of both major brands. Indeed, over the year, both Westpac and St.George have expanded their respective branch networks by 11 and 2 branches respectively; and
Retained a corporate presence in Kogarah, a key corporate office of St.George.
The merger integration project remains on track. In First Half 2010, the following key integration milestones were achieved:
Moved to a single Authorised Deposit-taking Institution (ADI) on 1 March 2010;
Expanded products available to St.George Bank and BankSA customers, including BT Super for Life and multi-branded general insurance products;
The successful consolidation of the Wealth contact centre operations;
Integrated Single Group capabilities across Finance (single general ledger), Human Resources (single payroll, recruitment and people management systems) and Risk systems to enable effective governance and consolidated reporting; and
Sharing of best practices, including enhanced customer capabilities for Call Centre and Customer Resolution and Support between brands.
In addition to the delivery of the above milestones, we continue to progress well on other key milestones, including working with APRA towards achieving Basel II Advanced Accreditation for St.George Bank for credit, market and operational risk.
Customer retention In the merger business case, customer attrition of 4% of St.George customers was assumed. This estimate took into account the maintenance of separate brands and past merger and acquisition experience in the financial services sector. Since the merger date, there has been no net loss of St.George customers as a result of the merger.
Since the merger, the focus on customer retention and the increased investment in the St.George brand has resulted in an improvement in business momentum and an increase in customer numbers.
This has significantly improved the merger benefit profile.
Customer segment As at As at As at
31 March 30 Sept 31 March
Number of customers ('000) 2010 2009 2009
St.George retail and small business 2,175 2,156 2,133
BankSA retail 450 448 447
Total 2,625 2,604 2,580
Westpac RBB 4,955 4,903 4,809
St.George wealth and insurance 180 157 128
Review of Group Operations (continued)
50
Merger Benefits Expense synergies for the First Half 2010 reached $142 million.
At 31 March 2010, the merger delivered a reduction of 1,488 permanent roles and contractors delivering annualised run-rate savings of $231 million in personnel expense synergies. These savings constitute the majority of the planned cost synergies achieved since the inception of the merger.
In addition, non-personnel expense run-rate synergies of $77 million have also been achieved from a review of our key sourcing contracts and the rationalisation of areas of duplicate expenditure.
Merger Integration Costs In announcing the merger, The Westpac Group indicated that it expected to spend $700 million in integration costs. To 31 March 2010, $543 million or 78% of the estimated amount has been spent. $151 million was spent in the First Half 2010. The majority of the spend has been on integration of IT platforms and product systems ($46 million), and consolidation of Treasury, risk, finance and HR teams and systems ($40 million). Costs to further consolidate teams ($23 million) and other initiatives including moving to one ADI ($23 million) and roll out of BTFG wealth capabilities to St.George ($9 million). Integration costs are treated as a Cash Earnings adjustment in Section 4 Divisional Results. Details of the costs include:
$mHalf YearMarch 10
Half YearSept 09
Half YearMarch 09
Half YearSept 08
Total to date
IT, systems and operations 108 116 30 - 254
Restructuring and outsourcing 16 57 46 - 119
Program governance and strategy development 15 29 39 6 89
Transaction costs and stamp duty 11 1 28 25 65
Revenue and retention investment 1 6 9 - 16
Total cash spend 151 209 152 31 543
Divisional Results
51
4. Divisional Results
4.1. Divisional Results During First Half 2010, the accounting standard AASB 8 Operating Segments was applied for the first time. This standard requires segment results to be presented on a basis that is consistent with information provided internally to Westpac’s key decision makers. In assessing the financial performance of our divisions, we use a measure of performance referred to as ‘Cash Earnings’. To calculate Cash Earnings we adjust the statutory results for the items outlined below. This allows us to more effectively assess performance for the current period against prior periods and to compare performance across business divisions and across peer companies. A reconciliation of Cash Earnings to net profit attributable to equity holders for each business division is set forth in Section 5. Refer to the Introduction on page 1 and Section 5.2 for a more detailed explanation of Cash Earnings adjustments.
Three categories of adjustments are made to statutory results to determine Cash Earnings:
Material items that key decision makers believe do not reflect ongoing operations;
Items that are not considered when dividends are recommended, such as the amortisation of intangibles and economic hedging impacts; and
Accounting reclassifications between individual line items that do not impact statutory results, such as policy holder tax recoveries.
Internal charges and transfer pricing adjustments are included in the performance of each business reflecting a management rather than a legal structure (these results cannot be compared to results for individual legal entities). Where management reporting structures or accounting classifications have changed, comparatives have been restated and may differ from results previously reported.
Our internal transfer-pricing framework attributes value between divisions. Its primary attributes are:
Treasury funding product balances are fully transfer-priced at inter-bank rates according to the tenor of the underlying transactions; and
All overhead costs are allocated to revenue generating businesses, and capital is allocated to business groups using designated risk factors.
Cash Earnings % M ov't % M ov't
$mHalf Year March 10
Half Year Sept 09
Half Year March 09
Sept 09-Mar 10
Mar 09-Mar 10
Westpac Retail & Business Banking 873 918 990 (5) (12) St.George Bank 472 470 460 - 3 Westpac Institutional Bank 807 203 136 large largeBT Financial Group (Australia) 301 278 206 8 46 New Zealand1 100 26 168 large (40) Pacif ic Banking 34 33 69 3 (51) Group businesses 396 404 103 (2) largeTotal Group Cash Earnings 2,983 2,332 2,132 28 40
Expense to income ratio % M ov't % M ov't
%Half Year March 10
Half Year Sept 09
Half Year March 09
Sept 09-Mar 10
Mar 09-Mar 10
Westpac Retail & Business Banking 49.5% 47.2% 47.4% (230bps) (210bps)St.George Bank 37.3% 36.2% 34.3% (110bps) (300bps)Westpac Institutional Bank 30.1% 36.6% 30.9% large 80bpsBT Financial Group (Australia) 48.8% 51.1% 56.5% 230bps large New Zealand1 49.2% 46.7% 43.7% (250bps) large Pacif ic Banking 40.6% 39.6% 29.6% (100bps) large Group ratio (Cash Earnings) 39.9% 40.1% 40.3% 20bps 40bps
The discussion of our divisional results and certain data in Sections 4 and 5 are presented on a Cash Earnings basis, unless otherwise stated. Cash Earnings is not directly comparable to statutory results presented in other parts of this profit announcement.
1 New Zealand comprises our New Zealand retail banking operations and wealth management businesses including our New Zealand
Life business and BT New Zealand. New Zealand results for the First Half 2010, Second Half 2009 and First Half 2009 have been converted to Australian dollars at the actual average exchange rates of 1.2619, 1.2482 and 1.2050 for the respective periods. Refer section 4.6 for New Zealand segment results in New Zealand dollars.
Divisional Results (continued)
52
4.2. Westpac Retail and Business Banking Westpac Retail and Business Banking (Westpac RBB) is responsible for sales and servicing for our consumer, small to medium enterprise customers and commercial customers (typically with turnover up to $50 million) in Australia under the ‘Westpac’ and ‘RAMS’ brands. Activities are conducted through our nationwide network of branches and business banking centres, home finance managers (HFMs), specialised consumer and business relationship managers with the support of Cash Flow, Financial Markets and Wealth specialists, customer service centres, automatic teller machines (ATMs), and internet channels.
% M ov't % M ov't
$mHalf Year March 10
Half Year Sept 09
Half Year March 09
Sept 09-Mar 10
Mar 09-Mar 10
Net interest income 2,572 2,533 2,410 2 7
Non-interest income 501 568 706 (12) (29) Net operating income before operating expenses and impairment charges 3,073 3,101 3,116 (1) (1)
Operating expenses (1,521) (1,465) (1,478) (4) (3) Profit before impairment charges and income tax expense 1,552 1,636 1,638 (5) (5)
Impairment charges (302) (327) (224) 8 (35)
Operating profit before tax 1,250 1,309 1,414 (5) (12)
Tax and non-controlling interests (377) (391) (424) 4 11
Cash Earnings 873 918 990 (5) (12)
Less: Cash Earnings adjustments - - - - - Net profit after tax 873 918 990 (5) (12)
Expense to income ratio (%) (Cash Earnings basis) 49.5% 47.2% 47.4% (230bps) (210bps)
Deposits $bn $bn $bn
Term deposits 43.3 34.7 35.6 25 22
Other 65.7 69.1 62.9 (5) 4
Total deposits 109.0 103.8 98.5 5 11
Net loans
Mortgages 179.2 164.9 148.6 9 21
Business 40.1 41.3 42.1 (3) (5)
Other 9.6 9.4 9.3 2 3
Total net loans 228.9 215.6 200.0 6 14
Total assets 233.7 219.6 203.9 6 15
Financial Performance
First Half 2010 – First Half 2009
Features:
Cash Earnings 12% lower due to reductions in customer fees (overdrawn, missed payment fees etc) and the lagged impact of slowing economic activity leading to a rise in impairment charges
Profit before impairment charges and income tax expense down 5% due to higher funding costs, and the significant decline in customer fees partially offset by strong mortgage and term deposit growth
Westpac RBB delivered Cash Earnings of $873 million for the First Half 2010, down $117 million, or 12% compared to First Half 2009.
Net interest income in the First Half 2010 grew 7% compared to First Half 2009, driven by a 14% increase in lending partially offset a 13 basis point fall in margins. Virtually all of the growth in lending was due to mortgages, with cards and other personal lending up marginally, and business lending 5% lower. In business lending, demand has remained low and customers have remained cautious about the operating environment and as a result have sought to reduce gearing. Through the period the relationship with a small number of larger customers were transferred to WIB contributing $1.1 billion to the business lending decline.
Westpac RBB has largely completed the recruitment of Bank Managers, HFMs and Local Business Bankers as part of the Westpac Local strategy. The Westpac Local business model provides local Bank Managers with the authority and resources to meet the needs of their local markets. The associated increase in the size and capability of our customer facing sales force has contributed to expanding our customer reach and deepening our relationships with customers.
Divisional Results (continued)
53
The success of this approach can be seen in:
21% growth in mortgages, equating to 1.8 times banking system growth. Mortgages originated via third parties was little changed at 41%, but trended lower through the First Half 2010 from peak levels of 45% in Second Half 2009;
11% rise in deposits, equating to 1.5 times financial system growth;
Average products per customer increasing to 2.54, which is the highest of the major Australian banks; and
Strong cross sell of insurance and superannuation.
Within Westpac RBB, RAMS delivered a sound performance, after taking into account the withdrawal from the broker channel in January 2010 and the tempered growth in housing following withdrawal of government stimulus packages. RAMS represented 5% of Westpac RBB mortgage growth.
Margins over the period were down 13 basis points, principally due to a 12 basis point decline in spreads on mortgages and a 30 basis point decline in business spreads. Higher funding costs were the main reason for the decline and these were only partly offset by repricing of the mortgage portfolio in December 2009. Mix impacts also had an impact on margins as portfolio growth was concentrated in lower spread products, particularly mortgages and Term Deposits.
Non-interest income in the First Half 2010 was significantly lower (down 29%) compared to First Half 2009 due to:
Reductions to customer fees from an average of around $40 to a flat fee of $9, for both consumer and business customers, including overdrawn account fees, missed payments, and dishonoured cheques (approximately $100 million). These changes led to a 80% reduction in associated complaints;
One-off income received in First Half 2009 (approximately $130 million) from our cards rewards program related to the redemption of points into the Qantas frequent flyer program (with similar one-off in expenses);
Lower fees from the foreign ATM charges ($22 million); and
Partially offsetting the reduction in fees was higher revenue from business fees for undrawn credit lines and improved credit card interchange fees.
Operating expenses in the First Half 2010 were up 3% compared to First Half 2009. This modest rate of growth was due to the absence of expenses associated with the one-off redemption of credit card loyalty points (approximately $100 million). The rise in expenses reflects:
Salary increases for most roles from 1 January 2009 of 4% and from 1 January 2010 of 2%;
Further investment associated with Westpac Local, including a net increase of 377 customer facing employees and specialist relationship bankers; and
Higher project investment to increase front-line capability, including the roll-out of new telephony infrastructure across the network and the development of the sales and service desktop.
Impairment charges in the First Half 2010 were $78 million higher compared to First Half 2009 with both business and consumer impairments rising.
New individually assessed provisions increased $45 million, with most of the increase due to the economic environment. The increase in impaired assets was primarily business related, mainly in property.
Business impaired assets to total committed exposures increased from 0.42% at 31 March 2009 to 0.89% as at 31 March 2010.
New collectively assessed provisions increased $54 million. The rise was due to:
The delayed reaction to rising unemployment over 2009 and to higher interest rates;
Some customers that came under stress in 2009, and were provided hardship assistance, have been unable to bring their accounts into order; and
Factor changes which increased the charge by $10 million.
We believe the credit quality of the consumer portfolio continues to remain sound. 90 day delinquencies in the mortgage portfolio declined 11 basis points to 0.34% at 31 March 2010. 90 day delinquencies in credit cards were up 25 basis points to 1.15% compared to 31 March 2009. This was due to the factors indicated above. Actual losses on the mortgage portfolio were $4 million and on the credit card portfolio were $53 million.
Divisional Results (continued)
54
First Half 2010 – Second Half 2009
Features:
Cash Earnings down 5% with revenue impacted by a decline in customer fees and higher funding costs
Impairment charges were lower
Westpac RBB delivered Cash Earnings of $873 million in the First Half 2010, down $45 million, or 5% compared to Second Half 2009.
Net interest income in the First Half 2010 increased 2% compared to Second Half 2009, driven by a 6% increase in lending partially offset by an 11 basis point fall in margins.
Mortgages continued to be the driver of lending growth, with Westpac continuing to grow above banking system (1.8 times). The proportion of mortgages written via brokers also moderated, from 45% to 41%.
Business lending was down 3%. Most of the decline was due to the transfer of the relationship with some customers (and their loan balances) to WIB.
Other personal lending, including credit cards, increased by 2% over First Half 2010.
Deposits grew by 5%, 0.6 times financial system, with Term Deposit growth a primary driver of the increase (up 25%).
Margins were down 11 basis points compared to the Second Half 2009 as the higher funding costs from both customer deposits and wholesale funding were only partially recouped from increases in lending rates. Mix impacts continued to have an impact as growth in lower spread mortgages offset a decline in higher spread business lending.
Non-interest income was down 12%, with the reduction in customer fees the main contributor.
Operating expenses were up 4%, compared to Second Half 2009, with the major drivers being:
The full period impact from the roll-out of Westpac Local initiatives; and
Increased investment in a number of frontline projects which include telephony infrastructure and sales and services desktops.
Impairment charges fell $25 million from Second Half 2009 to $302 million, with the majority of the fall associated with business impairments, due to a slow down in the growth of new stressed assets.
New individually assessed provisions decreased $31 million over First Half 2010 primarily due to the change in ‘mix’ as the effects of the GFC moved from the medium corporates to smaller corporates. Write-backs and recoveries were $3 million lower than Second Half 2009.
Business impaired assets to total committed exposures increased modestly from 0.79% at 30 September 2009 to 0.89% as at 31 March 2010.
New collectively assessed provisions decreased by $1 million over First Half 2010 with a more modest deterioration in the portfolio, requiring lower new collectively assessed provisions, which was partially offset by the increase from factor changes.

Divisional Results (continued)
55
4.3. St.George Bank St.George Bank (St.George) is responsible for sales and service for consumer, business and corporate customers in Australia under the St.George and BankSA brands.
Consumer activities are conducted through a network of branches, third party distributors, call centres, ATMs, EFTPOS terminals and internet banking services. Business and corporate customers (businesses with facilities typically up to $150 million) are provided with a wide range of banking and financial products and services including specialist advice for Cash Flow Finance, Trade Finance, Automotive and Equipment Finance, Property Finance, Transaction Banking and Treasury Services. Sales and service activities for business and corporate customers are conducted by relationship managers via business banking centres, internet and customer service centre channels.
% M ov't % M ov't
$mHalf Year March 10
Half Year Sept 09
Half Year March 09
Sept 09-Mar 10
Mar 09-Mar 10
Net interest income 1,327 1,340 973 (1) 36
Non-interest income 287 331 258 (13) 11Net operating income before operating expenses and impairment charges 1,614 1,671 1,231 (3) 31
Operating expenses (602) (605) (422) - (43)
Profit before impairment charges and income tax expense 1,012 1,066 809 (5) 25
Impairment charges (331) (396) (151) 16 (119)
Operating profit before tax 681 670 658 2 3
Tax and non-controlling interests (209) (200) (198) (5) (6)
Cash Earnings 472 470 460 - 3
Less: Cash Earnings adjustments (64) (65) (48) 2 (33)
Net profit after tax 408 405 412 1 (1)
Expense to income ratio (%) (Cash Earnings basis) 37.3% 36.2% 34.3% (110bps) (300bps)
Deposits $bn $bn $bn
Term deposits 28.1 24.5 22.2 15 27
Other 35.6 36.6 34.6 (3) 3
Total deposits 63.7 61.1 56.8 4 12
Net loans
Mortgages 87.7 82.7 76.4 6 15
Business 32.1 33.3 33.5 (4) (4)
Other 5.4 5.2 5.0 4 8
Total net loans 125.2 121.2 114.9 3 9
Total assets 132.8 127.6 118.3 4 12
Financial Performance
First Half 2010 – First Half 2009
Features:
Cash Earnings up 3%, with profit before impairment charges and income tax expense up 25% and higher impairment charges
Net operating income before operating expenses and impairment charges up 31% with sound mortgage and deposit growth offset by higher funding costs and the reduction in customer fees
The results of St.George for First Half 2009 were impacted by the merger being effective from close of business 17 November 2008. Therefore, the results of St.George for First Half 2010 incorporate approximately six weeks of additional results compared to the results for First Half 2009.
St.George delivered Cash Earnings of $472 million, up $12 million, or 3% compared to First Half 2009.
Net interest income increased 36% in First Half 2010 compared to First Half 2009 due to approximately six weeks additional net interest income in First Half 2010 and the 9% increase in lending and a 12% rise in deposits. Mortgages and other personal lending were the key drivers of the improvement up 15% and 8% respectively while business lending was lower, down 4%. In business lending, demand remained modest, and with many businesses continuing to reduce gearing, balances were lower. The commercial property sector experienced much of the decline, in part due to the Group’s preference to reduce its exposure to this segment.
Divisional Results (continued)
56
Behind this growth has been St.George’s unique market position, as being ‘big enough yet small enough’, which contributed to:
15% rise in mortgages. 12% rise in deposits, primarily driven by Term Deposits; Growth in customer numbers of 1.7%; Deeper customer relationships with the proportion of customers holding 4 products or more rising from 20% to 23%,
benefiting from increased insurance cross sell, credit cards and the launch of Super for Life; and Net Promoter Score (NPS) which is the highest of majors and increasing its lead above the nearest major bank.
St.George Bank margins in First Half 2010 compared to First Half 2009 were down as higher funding costs from both higher wholesale costs and a highly competitive deposit market, were only partially offset by repricing of business lending and mortgages. The high relative growth in mortgages and Term Deposits (products with lower spreads) also led to a negative mix impact on margins.
Non-interest income rose 11% in First Half 2010 compared to First Half 2009, due to approximately six weeks of additional non-interest income in First Half 2010 partially offset by the negative impact of the comprehensive reductions in customer fees effective from 1 October 2009 along with lower foreign ATM fees and lower card merchant income. Income associated with interest rate and foreign exchange hedging was also lower consistent with the decline in business activity and more stable markets over the half. Partly offsetting these declines was an improvement in loan fees, including fees for undrawn credit lines.
Operating expenses were up 43% in First Half 2010 compared to First Half 2009 reflecting approximately six weeks of additional expenses in First Half 2010, the 4% annual salary increase for most employees and the further investment in St.George. In particular, 3 new branches were opened and the business increased its investment in projects delivering improved front line capability. Offsetting these increases was the realisation of further merger synergies.
Impairment charges were $180 million higher in First Half 2010 compared to First Half 2009 at $331 million, but were down from Second Half 2009 peak.
Business impaired assets to total committed exposures increased from 1.46% at 31 March 2009 to 3.05% as at 31 March 2010.
New collectively assessed provisions increased in First Half 2010 compared to First Half 2009. Contributing to the rise has been an increase in hire purchase provisions, along with downgrades to companies in the commercial property sector mostly from valuation adjustments.
Consumer credit quality continues to remain sound. 90 day delinquencies have declined for mortgages by 16 basis points to 0.36% at 31 March 2010, and credit card 90 day delinquencies declined by 4 basis points to 1.35% in First Half 2010 compared to First Half 2009. Actual losses on the mortgage portfolio were $4 million, with a decline in the numbers of property in possession by 27 to 65. Losses on the credit card portfolio were $22 million.
First Half 2010 – Second Half 2009 Features: Cash Earnings were little changed compared to the Second Half 2009, up $2 million, with lower revenues offset by a
fall in impairment charges Revenues were down 3% mostly from higher funding costs and the impact of reductions in customer fees
St.George delivered Cash Earnings of $472 million in the First Half 2010, up $2 million compared to Second Half 2009, due to a 16% reduction in impairment charges, partially offset by a decline in profit before impairment charges and income tax expense.
Net interest income declined $13 million, or 1%, compared to the Second Half 2009, with higher funding costs more than offsetting the 6% growth in mortgages and 4% growth in deposits. Business lending was also lower over the period, principally from a reduction in short term bill finance as some companies continued to reduce gearing.
Non-interest income fell $44 million, or 13%, compared to the Second Half 2009, mainly attributable to reductions in customer fees introduced in October 2009. Lower business activity also contributed to the fall in non-interest income, principally from lower financial market product sales and reduced merchant fee income.
Operating expenses were down $3 million compared to the Second Half 2009, principally from the realisation of merger synergies in support areas. Merger savings allowed the division to increase its distribution presence and increase project investment.
Impairment charges fell $65 million from Second Half 2009 to $331 million, with most of the decrease associated with a slowing in the incidence of new stress in commercial property. Most of the increase in impaired assets (impaired assets to total committed exposures increased to 3.05% from 2.35%) has been due to the further downgrade of companies already identified as being under stress.
Consumer impairment charges were higher, reflecting delayed impact from rising unemployment in 2009, higher interest rates over the period, and a reduction in the benefits from fiscal stimulus measures.
Divisional Results (continued)
57
4.4. Westpac Institutional Bank Westpac Institutional Bank (WIB) delivers a broad range of financial services to commercial, corporate, institutional and government customers either based in or with interest in Australia and New Zealand. WIB operates through dedicated sales industry teams, supported by specialist knowledge in financial and debt capital markets, transactional banking, specialised capital, margin lending, broking and alternative investment solutions. Customers are supported through branches and subsidiaries located in Australia, New Zealand, New York, London and Asia.
% M ov't % M ov't
$mHalf Year March 10
Half Year Sept 09
Half Year March 09
Sept 09-Mar 10
Mar 09-Mar 10
Net interest income 916 880 881 4 4 Non-interest income 811 544 705 49 15 Net operating income before operating expenses and impairment charges 1,727 1,424 1,586 21 9 Operating expenses (519) (521) (490) - (6) Profit before impairment charges and income tax expense 1,208 903 1,096 34 10 Impairment charges (73) (621) (895) 88 92 Operating profit before tax 1,135 282 201 large largeTax and non-controlling interests (328) (79) (65) large large
Cash Earnings 807 203 136 large large
Less: Cash Earnings adjustments - - - - -
Net profit after tax 807 203 136 large large
Expense to income ratio (%) (Cash Earnings basis) 30.1% 36.6% 30.9% large 80bps
$bn $bn $bn
Deposits 48.0 51.0 48.6 (6) (1)
Net loans 70.2 75.3 82.7 (7) (15)
Total assets 103.0 114.6 132.7 (10) (22)
Funds under management 9.0 8.9 7.9 1 14
Financial Performance
First Half 2010 – First Half 2009
Features:
Strong operational performance with broad based improvement in customer revenue from higher margins and stronger fee income supported by modest growth in expenses
Significant decline in impairments
Westpac Institutional Bank had a very strong First Half 2010, with a Cash Earnings increase of $671 million compared to First Half 2009 to $807 million. This result was well above earnings generated by WIB prior to the GFC. Lower impairment charges were the key driver of the higher result. Operating income was also up 9% in First Half 2010 compared to First Half 2009, with 4 percentage points of the growth due to approximately six weeks of additional St.George results being incorporated in First Half 2010 but excluded from First Half 2009 results.
Through the GFC, WIB was focused on fully supporting customers through the more difficult conditions. This included increased customer contact and working constructively with companies to develop and implement solutions that best suited their needs. This approach has contributed to improved customer relationships and has seen WIB extend the lead in key customer metrics including Relationship Strength1 and Lead Bank1. These improvements have been a major contributor to the improved results in the half.
Net interest income was up $35 million or 4% in First Half 2010 compared to First Half 2009, with improved margins offsetting the reduction in lending over the year. The inclusion of St.George results for the full period in First Half 2010 also contributed to the improved net interest income.
Through much of calendar year 2009, Institutional customers were focused on reducing gearing, predominantly via equity raisings, and this led to a significant reduction in loans. From 31 March 2009 to 30 September 2009 net loans declined by just over $7 billion and declined a further $5 billion by 31 March 2010. The reduction in lending was particularly evident in the first quarter of the year in the commercial property, financial institutions and the industrials and materials sectors. While lending was lower, the repricing of facilities to reflect higher risk premiums led to higher lending spreads. Net
1 Source: Peter Lee Associates Large Corporate and Institutional Relationship Banking Survey – Australia.
Divisional Results (continued)
58
interest income (and margins) also benefited from higher line fees and the early repayment of debt, which saw capitalised establishment fees (normally amortised over the life of a loan) being brought to account early.
Reflecting the strong relationship focus, transactional and client services had a solid performance with improved spreads contributing to a rise in revenue, mostly in net interest income.
Non-interest income was $811 million in First Half 2010, up 15% over First Half 2009, with 6 percentage points of the growth due to approximately six weeks of additional St.George income in First Half 2010. This was a particularly good performance given that First Half 2009 was also a strong performance. The Debt Markets business drove much of the performance with narrowing credit spreads, good customer flows and solid trading income.
Foreign exchange earnings were lower in First Half 2010 compared to First Half 2009 as that period significantly benefited from the extreme currency market conditions associated with the GFC, including higher volatility and wider market spreads. In First Half 2010 currency volatility reduced and competition has intensified leading to a reduction in Foreign Exchange market spreads and lower volumes. These factors contributed to lower revenues in First Half 2010.
The Hastings business recorded much improved income in First Half 2010 assisted by a $17 million gain on asset sales.
The Equities business also had a strong First Half 2010, with increased sales of structured products and improved margins. In First Half 2009, the Equities business incurred $156 million in impairment charges from a small number of concentrated accounts, while in First Half 2010 there was a small write-back in provisions, with a $10 million impairment charge benefit. As a result, Cash Earnings in the Equities business in First Half 2010 was $43 million compared to a loss in First Half 2009.
Expenses were up 6% in First Half 2010 compared to First Half 2009, with 4 percentage points of the growth driven by the inclusion of St.George for the full period in First Half 2010. The remaining increases were principally due to increased accruals for performance related pay consistent with the improved operating results. Expense growth also benefited from the realisation of merger benefits and the effect of translating international expenses into AUD. The combination of solid revenues and low costs has led to the cost to income ratio falling to 30.1%.
The improved operating environment has contributed to a material $822 million reduction in impairment charges to $73 million in First Half 2010 compared to First Half 2009. This reduction can be principally traced back to the following factors:
First Half 2010 was not impacted by any large individual impairment charges, whereas First Half 2009 saw three large corporates contributing $372 million to impairment charges;
The improved environment has seen a reduction in corporate downgrades leading to lower individually assessed and collectively assessed charges;
The reduction in lending has reduced associated collective provisions;
Margin lending impairment charges were a write-back of collective provisions; and
An update of factor changes has led to a $79 million reduction in new collectively assessed provisions.
First Half 2010 – Second Half 2009
Features:
Cash Earnings up $604 million, with lower impairment charges and stronger revenues
A 21% rise in net operating income before operating expenses and impairment charges from higher margins, strong Debt Markets income, increased line fees and the absence of any asset write-downs in the First Half 2010.
Cash Earnings increased significantly compared to Second Half 2009, with profit before impairment charges and income tax expense up 34% (driven by very strong revenues and flat expenses) and a $548 million reduction in impairment charges.
Net interest income increased by 4% compared to Second Half 2009, driven by higher margins partially offset by a reduction in lending. Contributing to higher margins has been:
Improved lending spreads as the repricing of lending for higher risk premiums continued. Most of the portfolio has now been repriced;
Deposit spreads were higher, particularly in the transactional portfolio; and
Higher establishment fees.
Non-interest income in the First Half 2010 was particularly strong compared to Second Half 2009, up 49%. The key drivers of the improvement included:
Higher fee income, principally committed but undrawn limit fees; and
A strong Debt Markets income performance, principally related to the improvement in credit spreads, which led to a positive counterparty fair value adjustment. Foreign Exchange income was also higher after a weak performance in Second Half 2009.

Divisional Results (continued)
59
Expenses were flat compared to Second Half 2009 due to stable employee levels and holding fixed executive salaries constant. Higher accruals for performance related pay, consistent with the stronger result, was offset by favourable exchange rate translation impacts on offshore expenses.
Impairment charges were very low in First Half 2010 at $73 million. New individually assessed provisions of $255 million were incurred as some companies were downgraded to impaired.
New collectively assessed provisions were a benefit $103 million, principally from a reduction in balances following equity capital raisings over the half. The lower balances had two impacts on credit provisions:
Lower balances allowed the release of associated provisions; and
Reduced gearing following capital raisings enabled a small number of companies to be upgraded allowing the provisioning cover to be reduced.
The update to factor changes also led to lower collective provisions.
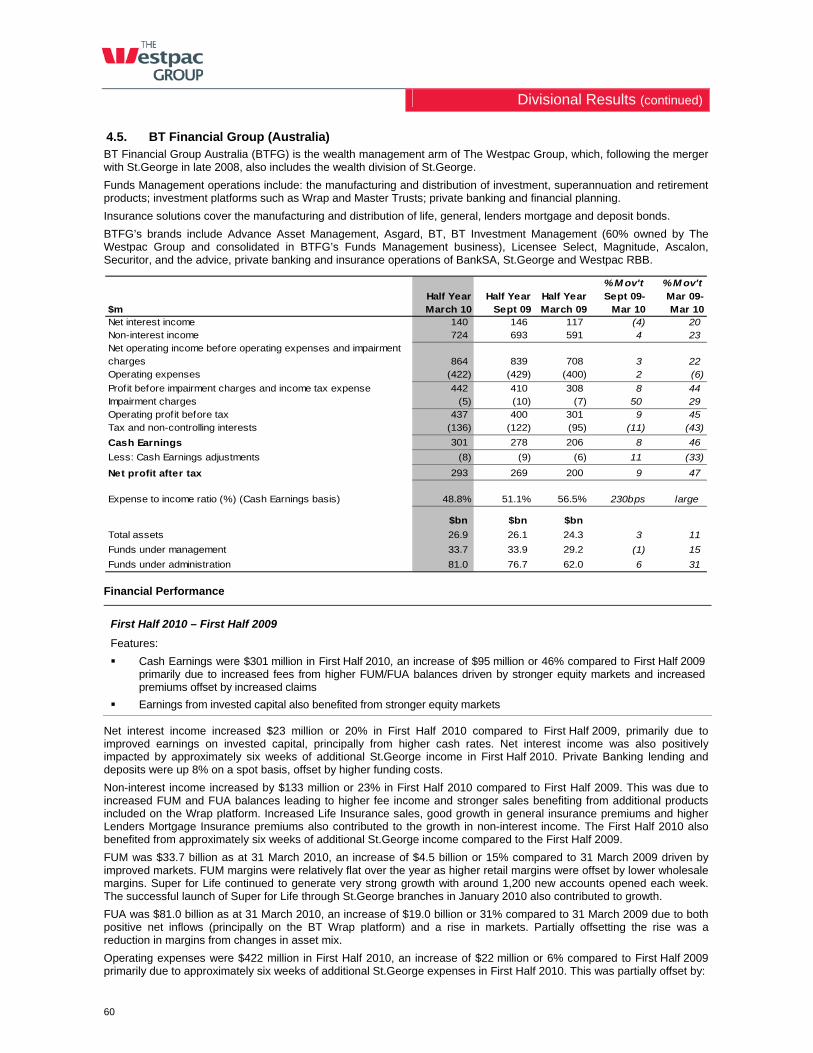
Divisional Results (continued)
60
4.5. BT Financial Group (Australia) BT Financial Group Australia (BTFG) is the wealth management arm of The Westpac Group, which, following the merger with St.George in late 2008, also includes the wealth division of St.George.
Funds Management operations include: the manufacturing and distribution of investment, superannuation and retirement products; investment platforms such as Wrap and Master Trusts; private banking and financial planning.
Insurance solutions cover the manufacturing and distribution of life, general, lenders mortgage and deposit bonds.
BTFG’s brands include Advance Asset Management, Asgard, BT, BT Investment Management (60% owned by The Westpac Group and consolidated in BTFG’s Funds Management business), Licensee Select, Magnitude, Ascalon, Securitor, and the advice, private banking and insurance operations of BankSA, St.George and Westpac RBB.
% M ov't % M ov't
$mHalf Year March 10
Half Year Sept 09
Half Year March 09
Sept 09-Mar 10
Mar 09-Mar 10
Net interest income 140 146 117 (4) 20 Non-interest income 724 693 591 4 23 Net operating income before operating expenses and impairment charges 864 839 708 3 22 Operating expenses (422) (429) (400) 2 (6)
Profit before impairment charges and income tax expense 442 410 308 8 44 Impairment charges (5) (10) (7) 50 29 Operating profit before tax 437 400 301 9 45 Tax and non-controlling interests (136) (122) (95) (11) (43)
Cash Earnings 301 278 206 8 46
Less: Cash Earnings adjustments (8) (9) (6) 11 (33)
Net profit after tax 293 269 200 9 47
Expense to income ratio (%) (Cash Earnings basis) 48.8% 51.1% 56.5% 230bps large
$bn $bn $bn
Total assets 26.9 26.1 24.3 3 11
Funds under management 33.7 33.9 29.2 (1) 15
Funds under administration 81.0 76.7 62.0 6 31
Financial Performance
First Half 2010 – First Half 2009
Features:
Cash Earnings were $301 million in First Half 2010, an increase of $95 million or 46% compared to First Half 2009 primarily due to increased fees from higher FUM/FUA balances driven by stronger equity markets and increased premiums offset by increased claims
Earnings from invested capital also benefited from stronger equity markets
Net interest income increased $23 million or 20% in First Half 2010 compared to First Half 2009, primarily due to improved earnings on invested capital, principally from higher cash rates. Net interest income was also positively impacted by approximately six weeks of additional St.George income in First Half 2010. Private Banking lending and deposits were up 8% on a spot basis, offset by higher funding costs.
Non-interest income increased by $133 million or 23% in First Half 2010 compared to First Half 2009. This was due to increased FUM and FUA balances leading to higher fee income and stronger sales benefiting from additional products included on the Wrap platform. Increased Life Insurance sales, good growth in general insurance premiums and higher Lenders Mortgage Insurance premiums also contributed to the growth in non-interest income. The First Half 2010 also benefited from approximately six weeks of additional St.George income compared to the First Half 2009.
FUM was $33.7 billion as at 31 March 2010, an increase of $4.5 billion or 15% compared to 31 March 2009 driven by improved markets. FUM margins were relatively flat over the year as higher retail margins were offset by lower wholesale margins. Super for Life continued to generate very strong growth with around 1,200 new accounts opened each week. The successful launch of Super for Life through St.George branches in January 2010 also contributed to growth.
FUA was $81.0 billion as at 31 March 2010, an increase of $19.0 billion or 31% compared to 31 March 2009 due to both positive net inflows (principally on the BT Wrap platform) and a rise in markets. Partially offsetting the rise was a reduction in margins from changes in asset mix.
Operating expenses were $422 million in First Half 2010, an increase of $22 million or 6% compared to First Half 2009 primarily due to approximately six weeks of additional St.George expenses in First Half 2010. This was partially offset by:
Divisional Results (continued)
61
Lower funds management expenses, despite higher volumes, increased advertising spend and further investment in advisors during the period. The higher costs were more than offset by additional synergies associated with the St.George merger as well as more streamlined processing across our FUA platforms; and
A one off payment of $10 million to AIA Australia to terminate a contract to distribute certain insurance products which occurred in First Half 2009.
Impairment charges were $5 million in First Half 2010, a decrease of $2 million or 29% compared to First Half 2009, with no new impaired assets in First Half 2010.
Income tax expense was $132 million in First Half 2010, an increase of $39 million or 42% compared to First Half 2009. This equates to an effective tax rate of 30% for First Half 2010 compared to 31% in First Half 2009.
First Half 2010 – Second Half 2009
Features:
Cash Earnings were $301 million in First Half 2010, an increase of $23 million or 8% compared to Second Half 2009 driven by increased fees from higher FUM FUA balances driven by stronger equity markets offset by lower General Insurance and Lenders Mortgage Insurance earnings
Decline in operating expenses (2%)
Net interest income decreased by $6 million or 4% in First Half 2010 compared to Second Half 2009, with higher funding costs offsetting higher loan balances in Private Banking.
Non-interest income increased $31 million or 4% in First Half 2010 compared to Second Half 2009. This was driven by higher fee income in the Funds Management business, largely from increased average FUM/FUA balances, higher fees from stronger Advice sales and life sales on Wrap which also contributed. This was partially offset by:
Higher claims in the General Insurance business in First Half 2010 associated with the Melbourne and Perth storms;
Increased reinsurance costs from the finalisation of stop loss insurance contracts in the Lenders Mortgage Insurance (LMI) business. The decision to outsource a higher portion of LMI business also contributed to lower revenues; and
Higher commission expenses.
FUM was $33.7 billion as at 31 March 2010, a decrease of $0.2 billion or 1% compared to 30 September 2009 with net outflows of $0.2 billion.
FUA was $81.0 billion as at 31 March 2010, an increase of $4.3 billion or 6% compared to 30 September 2009. Positive net flows of $2.1 billion in the half were driven by higher Wrap sales as investor confidence returned. FUA margins were down 2 basis points largely from mix impacts.
Operating expenses were $422 million in First Half 2010, a decrease of $7 million or 2% compared to Second Half 2009 predominantly due to seasonal volume based expenses associated with the end of the year and lower project spending. The full period impact of St.George merger synergies also contributed to the decline.
Impairment charges were $5 million in First Half 2010, a decrease of $5 million or 50% compared to Second Half 2009.
Income tax expense was $132 million in First Half 2010, an increase of $12 million or 10% compared to Second Half 2009. The effective tax rate for both halves was 30%.
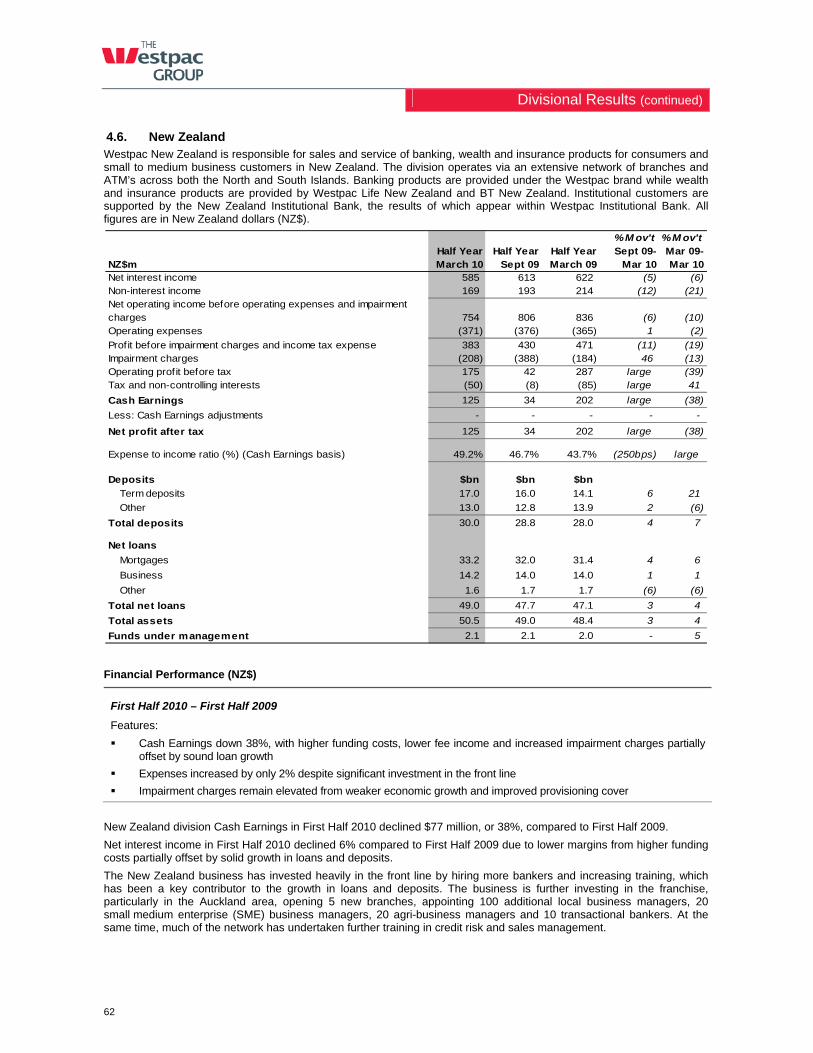
Divisional Results (continued)
62
4.6. New Zealand Westpac New Zealand is responsible for sales and service of banking, wealth and insurance products for consumers and small to medium business customers in New Zealand. The division operates via an extensive network of branches and ATM’s across both the North and South Islands. Banking products are provided under the Westpac brand while wealth and insurance products are provided by Westpac Life New Zealand and BT New Zealand. Institutional customers are supported by the New Zealand Institutional Bank, the results of which appear within Westpac Institutional Bank. All figures are in New Zealand dollars (NZ$).
% M ov't % M ov't
NZ$mHalf Year March 10
Half Year Sept 09
Half Year March 09
Sept 09-Mar 10
Mar 09-Mar 10
Net interest income 585 613 622 (5) (6) Non-interest income 169 193 214 (12) (21) Net operating income before operating expenses and impairment charges 754 806 836 (6) (10) Operating expenses (371) (376) (365) 1 (2)
Profit before impairment charges and income tax expense 383 430 471 (11) (19) Impairment charges (208) (388) (184) 46 (13) Operating profit before tax 175 42 287 large (39) Tax and non-controlling interests (50) (8) (85) large 41
Cash Earnings 125 34 202 large (38)
Less: Cash Earnings adjustments - - - - -
Net profit after tax 125 34 202 large (38)
Expense to income ratio (%) (Cash Earnings basis) 49.2% 46.7% 43.7% (250bps) large
Deposits $bn $bn $bn
Term deposits 17.0 16.0 14.1 6 21
Other 13.0 12.8 13.9 2 (6)
Total deposits 30.0 28.8 28.0 4 7
Net loans
Mortgages 33.2 32.0 31.4 4 6
Business 14.2 14.0 14.0 1 1
Other 1.6 1.7 1.7 (6) (6)
Total net loans 49.0 47.7 47.1 3 4
Total assets 50.5 49.0 48.4 3 4
Funds under management 2.1 2.1 2.0 - 5
Financial Performance (NZ$)
First Half 2010 – First Half 2009
Features:
Cash Earnings down 38%, with higher funding costs, lower fee income and increased impairment charges partially offset by sound loan growth
Expenses increased by only 2% despite significant investment in the front line
Impairment charges remain elevated from weaker economic growth and improved provisioning cover
New Zealand division Cash Earnings in First Half 2010 declined $77 million, or 38%, compared to First Half 2009.
Net interest income in First Half 2010 declined 6% compared to First Half 2009 due to lower margins from higher funding costs partially offset by solid growth in loans and deposits.
The New Zealand business has invested heavily in the front line by hiring more bankers and increasing training, which has been a key contributor to the growth in loans and deposits. The business is further investing in the franchise, particularly in the Auckland area, opening 5 new branches, appointing 100 additional local business managers, 20 small medium enterprise (SME) business managers, 20 agri-business managers and 10 transactional bankers. At the same time, much of the network has undertaken further training in credit risk and sales management.
Divisional Results (continued)
63
There have been signs of improvement in the customer experience through process simplification and fee reductions.
The success of this investment is evidenced by:
Reduced complaints which have been achieved through customer fee reductions and changes to the automatic payments process;
Mortgages at 31 March 2010 grew 6% compared to 31 March 2009, against a system growth of 1.5% with a trend towards more floating rate in the owner-occupier segment, particularly in Auckland;
Business lending at 31 March 2010 grew 1% compared to 31 March 2009, compared to the system that has been contracting; and
Deposits at 31 March 2010 grew 7% compared to 31 March 2009. Good growth was achieved in Term Deposits although savings account balances were lower.
While these measures have been positive they are yet to be reflected in the Net Promoter Score. While the division has been able to partly reprice lending, this has been more than offset by higher funding costs leading to an 18 basis point contraction in margins compared with First Half 2009. Higher wholesale funding costs were the main contributor to the decline and is reflected in both lower consumer and business lending spreads, which were down 4 basis points and 21 basis points respectively.
Intense competition for Term Deposits has led to deposit spreads contracting 29 basis points compared to First Half 2009.
Non-interest income in First Half 2010 fell 21% compared to First Half 2009, mainly due to a $49 million reduction in fee income from lower customer fee income (down $30 million) following the changes to fee structures introduced in October 2009 and lower income from mortgage funds. These falls were partly offset by improved insurance income.
Despite significant investment in the front line, expenses grew by only 2%, with the increase primarily due to the investment in training and in the franchise, along with costs associated with building the new headquarters in Auckland. These expenses were partly offset by efficiencies achieved in head office expenses and re-designing core processes.
Impairment charges in First Half 2010 were 13% higher than experienced in First Half 2009 but down from the Second Half 2009 peak. The rise was driven by higher individually assessed provisions and by an update to factor changes in our provisioning models which led to a $60 million increase in new collectively assessed provisions. Impaired assets as a percentage of Total Committed Exposures (TCE) at 31 March 2010 increased compared to 31 March 2009 as some facilities identified as watchlist and substandard were downgraded to impaired.
Housing and other consumer delinquencies were improved.
First Half 2010 – Second Half 2009
Features:
Cash Earnings up $91 million with significantly lower impairment charges more than offsetting lower profit before impairment charges and income tax expense
Lower revenues from lower margins, and from lower customer fees following changes in fee structures in October 2009
New Zealand division delivered Cash Earnings in First Half 2010 of $125 million, up $91 million from Second Half 2009, driven primarily by significantly lower impairment charges.
Net interest income in First Half 2010 was 5% lower compared to Second Half 2009 as higher funding costs more than offset an improvement in lending and deposit balances. Total lending was up 3% with both mortgages and business lending recording positive growth. A 15 basis point reduction in margins led to the $28 million decline in net interest income.
Non-interest income in First Half 2010 was down $24 million or 12% compared to Second Half 2009 due to the first full period impact of the customer fee reductions introduced in October 2009. The reduction in customer fees (account overdrawn, missed payments, dishonours etc.) of $23 million has had an impact on revenues but has also led to a significant reduction in associated complaints, which are down by 32%.
Operating expenses were well contained (down $5 million) compared to Second Half 2009, with employee expenses little changed. Lower software amortisation and improved management of equipment spending offset higher leasehold improvement expenses.
The large drop in impairment charges principally reflects the absence of two large impaired facilities totalling $199 million incurred in Second Half 2009. Partially offsetting this were higher collectively assessed provisions associated with the factor change update.
Impaired assets to TCE at 31 March 2010 were higher compared to 30 September 2009 for the reasons stated earlier while consumer delinquencies were largely unchanged.
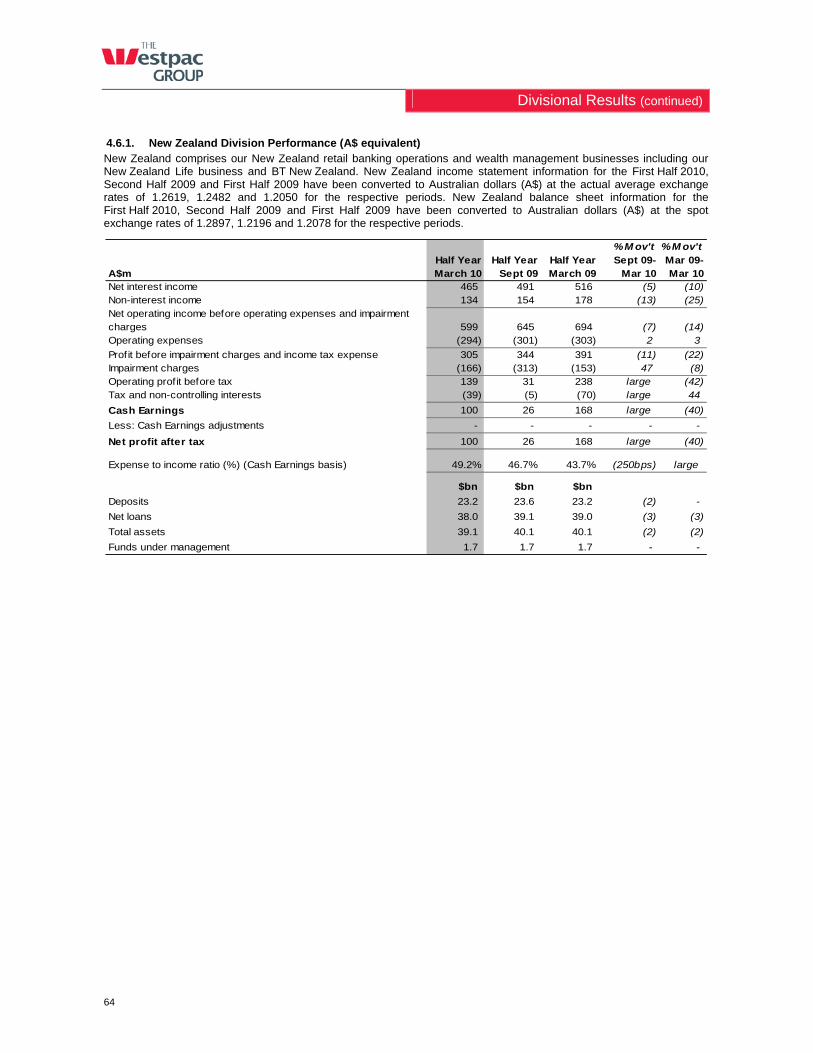
Divisional Results (continued)
64
4.6.1. New Zealand Division Performance (A$ equivalent) New Zealand comprises our New Zealand retail banking operations and wealth management businesses including our New Zealand Life business and BT New Zealand. New Zealand income statement information for the First Half 2010, Second Half 2009 and First Half 2009 have been converted to Australian dollars (A$) at the actual average exchange rates of 1.2619, 1.2482 and 1.2050 for the respective periods. New Zealand balance sheet information for the First Half 2010, Second Half 2009 and First Half 2009 have been converted to Australian dollars (A$) at the spot exchange rates of 1.2897, 1.2196 and 1.2078 for the respective periods.
% M ov't % M ov't
A$mHalf Year March 10
Half Year Sept 09
Half Year March 09
Sept 09-Mar 10
Mar 09-Mar 10
Net interest income 465 491 516 (5) (10) Non-interest income 134 154 178 (13) (25) Net operating income before operating expenses and impairment charges 599 645 694 (7) (14) Operating expenses (294) (301) (303) 2 3
Profit before impairment charges and income tax expense 305 344 391 (11) (22) Impairment charges (166) (313) (153) 47 (8) Operating profit before tax 139 31 238 large (42) Tax and non-controlling interests (39) (5) (70) large 44
Cash Earnings 100 26 168 large (40)
Less: Cash Earnings adjustments - - - - -
Net profit after tax 100 26 168 large (40)
Expense to income ratio (%) (Cash Earnings basis) 49.2% 46.7% 43.7% (250bps) large
$bn $bn $bn
Deposits 23.2 23.6 23.2 (2) -
Net loans 38.0 39.1 39.0 (3) (3)
Total assets 39.1 40.1 40.1 (2) (2)
Funds under management 1.7 1.7 1.7 - -
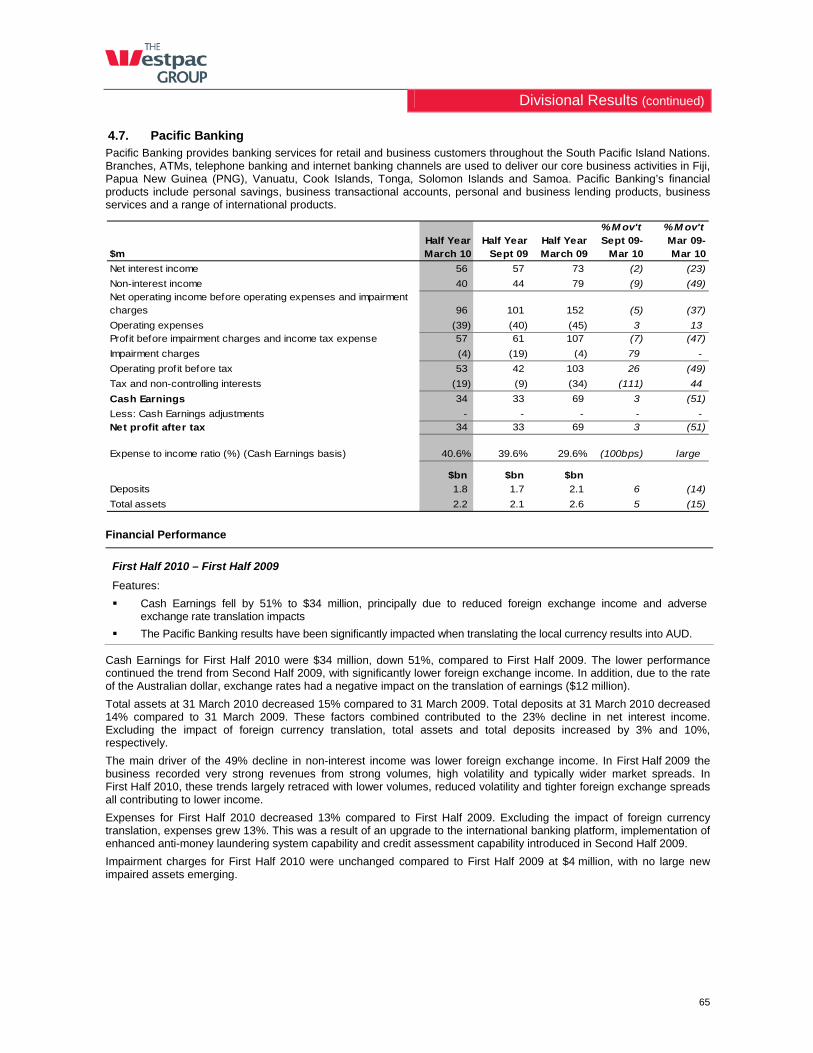
Divisional Results (continued)
65
4.7. Pacific Banking Pacific Banking provides banking services for retail and business customers throughout the South Pacific Island Nations. Branches, ATMs, telephone banking and internet banking channels are used to deliver our core business activities in Fiji, Papua New Guinea (PNG), Vanuatu, Cook Islands, Tonga, Solomon Islands and Samoa. Pacific Banking’s financial products include personal savings, business transactional accounts, personal and business lending products, business services and a range of international products.
% M ov't % M ov't
$mHalf Year March 10
Half Year Sept 09
Half Year March 09
Sept 09-Mar 10
Mar 09-Mar 10
Net interest income 56 57 73 (2) (23)
Non-interest income 40 44 79 (9) (49) Net operating income before operating expenses and impairment charges 96 101 152 (5) (37)
Operating expenses (39) (40) (45) 3 13 Profit before impairment charges and income tax expense 57 61 107 (7) (47)
Impairment charges (4) (19) (4) 79 -
Operating prof it before tax 53 42 103 26 (49)
Tax and non-controlling interests (19) (9) (34) (111) 44
Cash Earnings 34 33 69 3 (51)
Less: Cash Earnings adjustments - - - - - Net profit after tax 34 33 69 3 (51)
Expense to income ratio (%) (Cash Earnings basis) 40.6% 39.6% 29.6% (100bps) large
$bn $bn $bn
Deposits 1.8 1.7 2.1 6 (14)
Total assets 2.2 2.1 2.6 5 (15)
Financial Performance
First Half 2010 – First Half 2009
Features:
Cash Earnings fell by 51% to $34 million, principally due to reduced foreign exchange income and adverse exchange rate translation impacts
The Pacific Banking results have been significantly impacted when translating the local currency results into AUD.
Cash Earnings for First Half 2010 were $34 million, down 51%, compared to First Half 2009. The lower performance continued the trend from Second Half 2009, with significantly lower foreign exchange income. In addition, due to the rate of the Australian dollar, exchange rates had a negative impact on the translation of earnings ($12 million).
Total assets at 31 March 2010 decreased 15% compared to 31 March 2009. Total deposits at 31 March 2010 decreased 14% compared to 31 March 2009. These factors combined contributed to the 23% decline in net interest income. Excluding the impact of foreign currency translation, total assets and total deposits increased by 3% and 10%, respectively.
The main driver of the 49% decline in non-interest income was lower foreign exchange income. In First Half 2009 the business recorded very strong revenues from strong volumes, high volatility and typically wider market spreads. In First Half 2010, these trends largely retraced with lower volumes, reduced volatility and tighter foreign exchange spreads all contributing to lower income.
Expenses for First Half 2010 decreased 13% compared to First Half 2009. Excluding the impact of foreign currency translation, expenses grew 13%. This was a result of an upgrade to the international banking platform, implementation of enhanced anti-money laundering system capability and credit assessment capability introduced in Second Half 2009.
Impairment charges for First Half 2010 were unchanged compared to First Half 2009 at $4 million, with no large new impaired assets emerging.
Divisional Results (continued)
66
First Half 2010 – Second Half 2009
Features:
Cash Earnings were little changed over Second Half 2009 but excluding the impact of foreign currency translation, cash earnings increased 24%
Lower impairment charges were the main driver of the improved performance
Cash Earnings in the First Half 2010 increased $1 million compared to Second Half 2009. Excluding the impact of foreign currency translation, cash earnings increased 24%.
Net interest income was down moderately (2%). Excluding the impact of foreign currency translation, net interest income increased 16%, reflecting good growth in loans (3%) and deposits (8%). Non-interest income was impacted by lower trading volumes, and the significantly lower market spreads referred to previously.
Operating expenses in First Half 2010 declined 3% compared to Second Half 2009. Excluding the impact of foreign currency translation, operating expenses were higher due to continued business investment and higher personnel costs associated with annual fixed salary movement for local Pacific employees, and investment in increased capability and capacity across the Region.
Impairment charges were down 79%. Second Half 2009 was particularly impacted by the downgrade in Fiji’s country rating.
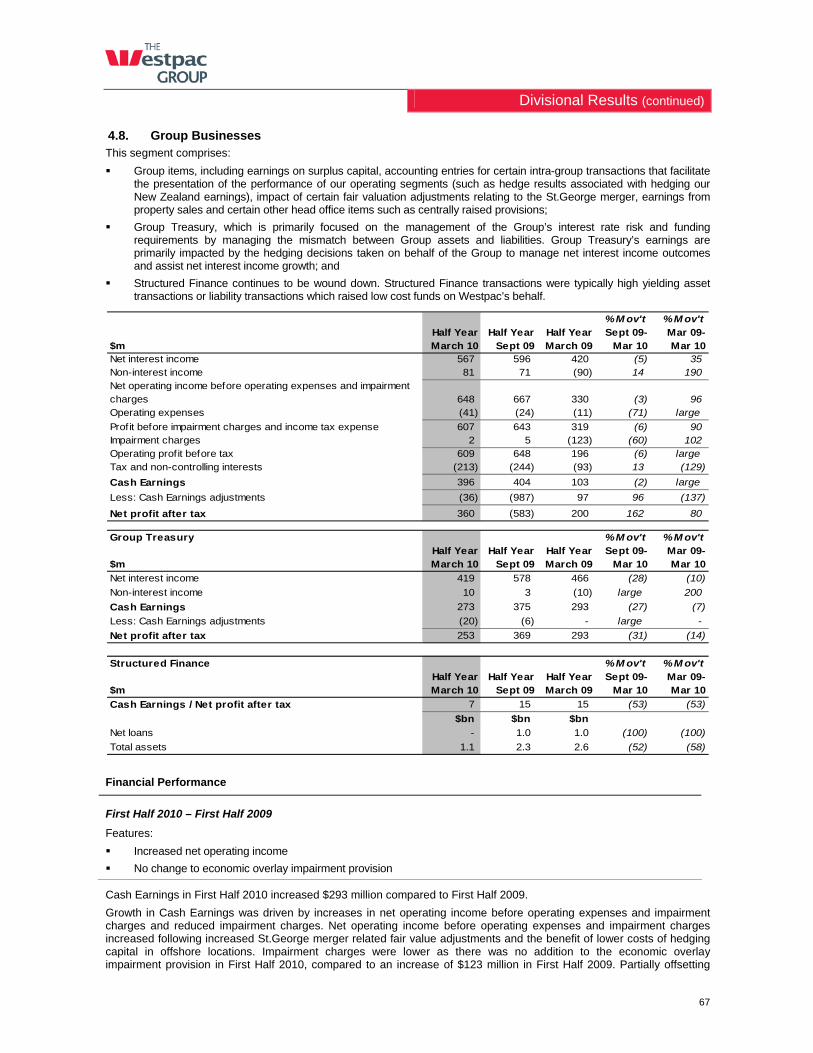
Divisional Results (continued)
67
4.8. Group Businesses This segment comprises:
Group items, including earnings on surplus capital, accounting entries for certain intra-group transactions that facilitate the presentation of the performance of our operating segments (such as hedge results associated with hedging our New Zealand earnings), impact of certain fair valuation adjustments relating to the St.George merger, earnings from property sales and certain other head office items such as centrally raised provisions;
Group Treasury, which is primarily focused on the management of the Group’s interest rate risk and funding requirements by managing the mismatch between Group assets and liabilities. Group Treasury’s earnings are primarily impacted by the hedging decisions taken on behalf of the Group to manage net interest income outcomes and assist net interest income growth; and
Structured Finance continues to be wound down. Structured Finance transactions were typically high yielding asset transactions or liability transactions which raised low cost funds on Westpac’s behalf.
% M ov't % M ov't
$mHalf Year March 10
Half Year Sept 09
Half Year March 09
Sept 09-Mar 10
Mar 09-Mar 10
Net interest income 567 596 420 (5) 35 Non-interest income 81 71 (90) 14 190 Net operating income before operating expenses and impairment charges 648 667 330 (3) 96 Operating expenses (41) (24) (11) (71) large
Profit before impairment charges and income tax expense 607 643 319 (6) 90 Impairment charges 2 5 (123) (60) 102 Operating profit before tax 609 648 196 (6) largeTax and non-controlling interests (213) (244) (93) 13 (129)
Cash Earnings 396 404 103 (2) large
Less: Cash Earnings adjustments (36) (987) 97 96 (137)
Net profit after tax 360 (583) 200 162 80
Group Treasury % M ov't % M ov't
$mHalf Year March 10
Half Year Sept 09
Half Year March 09
Sept 09-Mar 10
Mar 09-Mar 10
Net interest income 419 578 466 (28) (10)
Non-interest income 10 3 (10) large 200
Cash Earnings 273 375 293 (27) (7)
Less: Cash Earnings adjustments (20) (6) - large -
Net profit after tax 253 369 293 (31) (14)
Structured Finance % M ov't % M ov't
$mHalf Year March 10
Half Year Sept 09
Half Year March 09
Sept 09-Mar 10
Mar 09-Mar 10
Cash Earnings / Net profit after tax 7 15 15 (53) (53)
$bn $bn $bn
Net loans - 1.0 1.0 (100) (100)
Total assets 1.1 2.3 2.6 (52) (58)
Financial Performance
First Half 2010 – First Half 2009
Features:
Increased net operating income
No change to economic overlay impairment provision
Cash Earnings in First Half 2010 increased $293 million compared to First Half 2009.
Growth in Cash Earnings was driven by increases in net operating income before operating expenses and impairment charges and reduced impairment charges. Net operating income before operating expenses and impairment charges increased following increased St.George merger related fair value adjustments and the benefit of lower costs of hedging capital in offshore locations. Impairment charges were lower as there was no addition to the economic overlay impairment provision in First Half 2010, compared to an increase of $123 million in First Half 2009. Partially offsetting
Divisional Results (continued)
68
these items were higher expenses following increased project spend in relation to data centre improvements and additional spend on Group system security. Cash Earnings from the Structured Finance business declined by $8 million as the business continues to be wound down.
First Half 2010 – Second Half 2009
Features:
Reduced contribution from Group Treasury
No change to the economic overlay impairment provision
Cash Earnings in First Half 2010 decreased $8 million compared to Second Half 2009.
Net operating income before operating expenses and impairment charges declined as a result of lower contribution from Group Treasury following an exceptional performance in Second Half 2009 ($152 million). Partially offsetting this was higher net operating income from St.George merger related fair value adjustments, which increased to $48 million, higher returns on capital and lower costs of funds charges.
Increases in expenses were driven by the projects mentioned previously.
Group Treasury Value at Risk (VaR)
A decrease in average daily VaR from $38.6 million for the 2009 financial year to $29.5 million for First Half 2010 reflected broadly unchanged risk positions offset by reductions in market volatility as the impacts of extreme volatility during the GFC are being replaced by more normal periods of volatility in the VaR calculation.
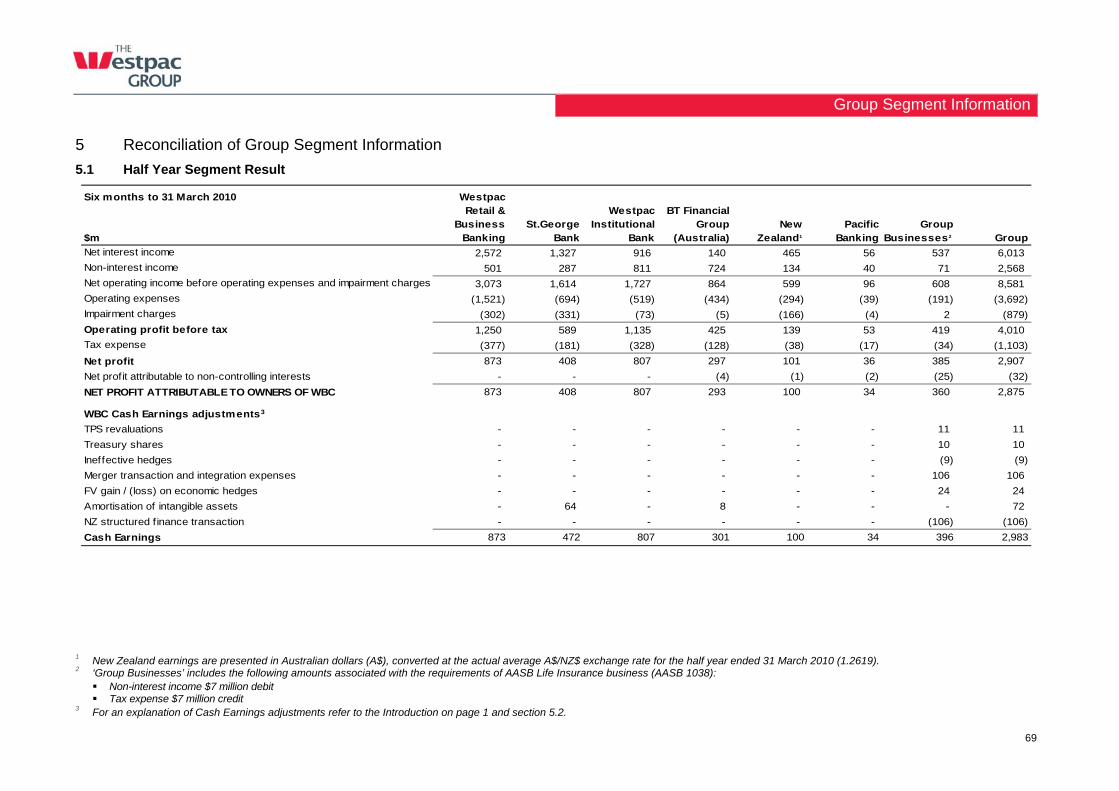
Group Segment Information
69
5 Reconciliation of Group Segment Information
5.1 Half Year Segment Result
Six months to 31 March 2010
$m
Westpac Retail &
Business Banking
St.George Bank
Westpac Institutional
Bank
BT Financial Group
(Australia) New
Zealand1
Pacific Banking
Group Businesses2 Group
Net interest income 2,572 1,327 916 140 465 56 537 6,013
Non-interest income 501 287 811 724 134 40 71 2,568
Net operating income before operating expenses and impairment charges 3,073 1,614 1,727 864 599 96 608 8,581
Operating expenses (1,521) (694) (519) (434) (294) (39) (191) (3,692)
Impairment charges (302) (331) (73) (5) (166) (4) 2 (879)
Operating profit before tax 1,250 589 1,135 425 139 53 419 4,010
Tax expense (377) (181) (328) (128) (38) (17) (34) (1,103)
Net profit 873 408 807 297 101 36 385 2,907
Net profit attributable to non-controlling interests - - - (4) (1) (2) (25) (32)
NET PROFIT ATTRIBUTABLE TO OWNERS OF WBC 873 408 807 293 100 34 360 2,875
WBC Cash Earnings adjustments3
TPS revaluations - - - - - - 11 11
Treasury shares - - - - - - 10 10
Ineffective hedges - - - - - - (9) (9)
Merger transaction and integration expenses - - - - - - 106 106
FV gain / (loss) on economic hedges - - - - - - 24 24
Amortisation of intangible assets - 64 - 8 - - - 72
NZ structured finance transaction - - - - - - (106) (106)
Cash Earnings 873 472 807 301 100 34 396 2,983
1 New Zealand earnings are presented in Australian dollars (A$), converted at the actual average A$/NZ$ exchange rate for the half year ended 31 March 2010 (1.2619). 2 ‘Group Businesses’ includes the following amounts associated with the requirements of AASB Life Insurance business (AASB 1038): Non-interest income $7 million debit Tax expense $7 million credit
3 For an explanation of Cash Earnings adjustments refer to the Introduction on page 1 and section 5.2.
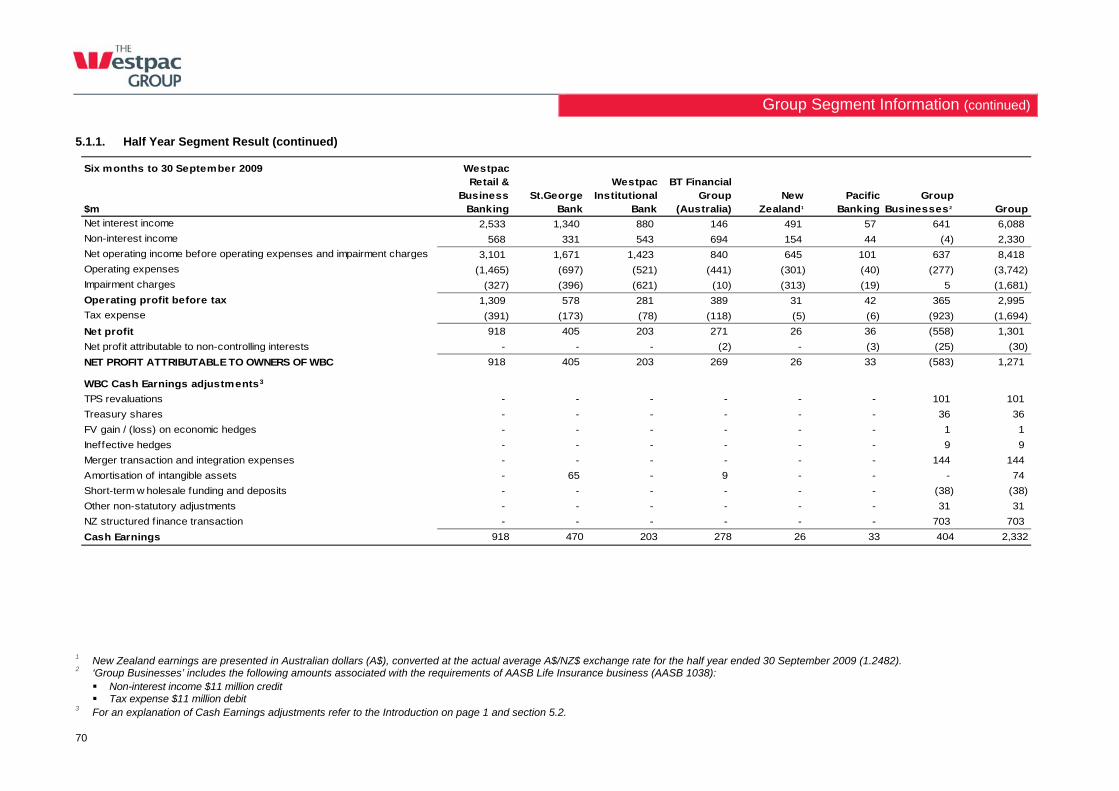
Group Segment Information (continued)
70
5.1.1. Half Year Segment Result (continued)
Six months to 30 September 2009
$m
Westpac Retail &
Business Banking
St.George Bank
Westpac Institutional
Bank
BT Financial Group
(Australia) New
Zealand1
Pacific Banking
Group Businesses2 Group
Net interest income 2,533 1,340 880 146 491 57 641 6,088
Non-interest income 568 331 543 694 154 44 (4) 2,330
Net operating income before operating expenses and impairment charges 3,101 1,671 1,423 840 645 101 637 8,418
Operating expenses (1,465) (697) (521) (441) (301) (40) (277) (3,742)
Impairment charges (327) (396) (621) (10) (313) (19) 5 (1,681)
Operating profit before tax 1,309 578 281 389 31 42 365 2,995
Tax expense (391) (173) (78) (118) (5) (6) (923) (1,694)
Net profit 918 405 203 271 26 36 (558) 1,301
Net profit attributable to non-controlling interests - - - (2) - (3) (25) (30)
NET PROFIT ATTRIBUTABLE TO OWNERS OF WBC 918 405 203 269 26 33 (583) 1,271
WBC Cash Earnings adjustments3
TPS revaluations - - - - - - 101 101
Treasury shares - - - - - - 36 36
FV gain / (loss) on economic hedges - - - - - - 1 1
Ineffective hedges - - - - - - 9 9
Merger transaction and integration expenses - - - - - - 144 144
Amortisation of intangible assets - 65 - 9 - - - 74
Short-term w holesale funding and deposits - - - - - - (38) (38)
Other non-statutory adjustments - - - - - - 31 31
NZ structured f inance transaction - - - - - - 703 703
Cash Earnings 918 470 203 278 26 33 404 2,332
1 New Zealand earnings are presented in Australian dollars (A$), converted at the actual average A$/NZ$ exchange rate for the half year ended 30 September 2009 (1.2482). 2 ‘Group Businesses’ includes the following amounts associated with the requirements of AASB Life Insurance business (AASB 1038): Non-interest income $11 million credit Tax expense $11 million debit
3 For an explanation of Cash Earnings adjustments refer to the Introduction on page 1 and section 5.2.
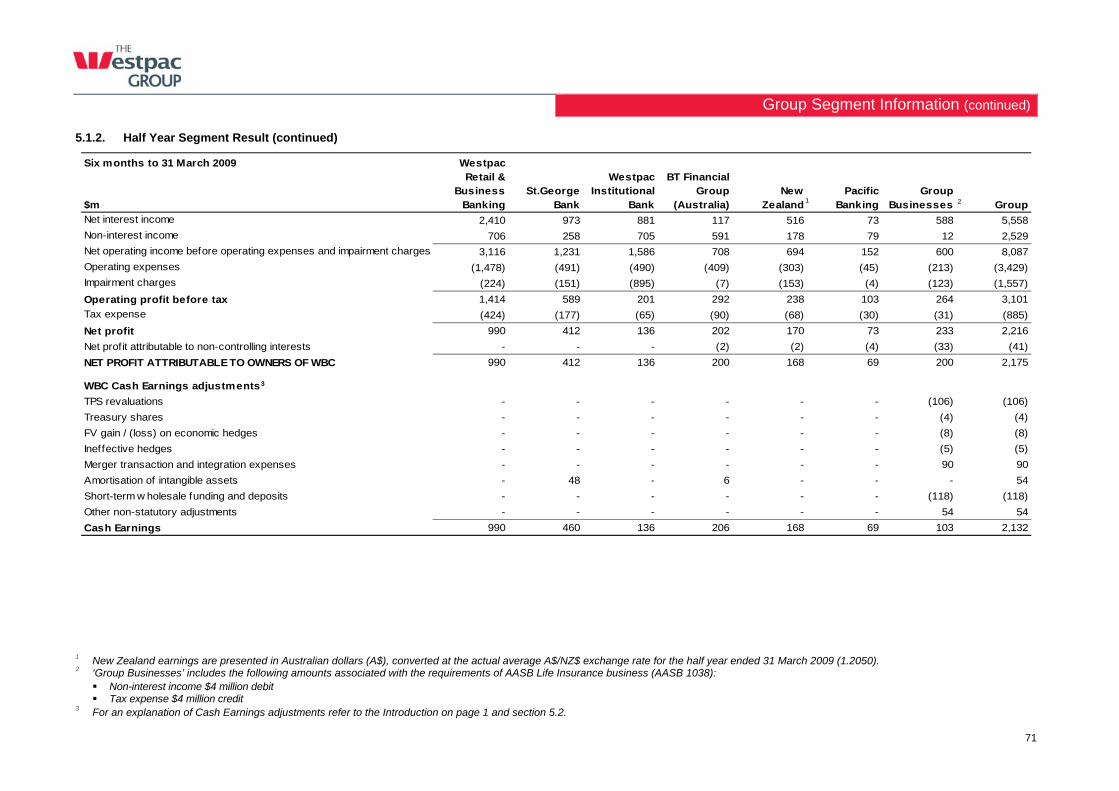
Group Segment Information (continued)
71
5.1.2. Half Year Segment Result (continued)
Six months to 31 March 2009
$m
Westpac Retail &
Business Banking
St.George Bank
Westpac Institutional
Bank
BT Financial Group
(Australia) New
Zealand Pacific
Banking Group
Businesses Group
Net interest income 2,410 973 881 117 516 73 588 5,558
Non-interest income 706 258 705 591 178 79 12 2,529
Net operating income before operating expenses and impairment charges 3,116 1,231 1,586 708 694 152 600 8,087
Operating expenses (1,478) (491) (490) (409) (303) (45) (213) (3,429)
Impairment charges (224) (151) (895) (7) (153) (4) (123) (1,557)
Operating profit before tax 1,414 589 201 292 238 103 264 3,101
Tax expense (424) (177) (65) (90) (68) (30) (31) (885)
Net profit 990 412 136 202 170 73 233 2,216
Net profit attributable to non-controlling interests - - - (2) (2) (4) (33) (41)
NET PROFIT ATTRIBUTABLE TO OWNERS OF WBC 990 412 136 200 168 69 200 2,175
WBC Cash Earnings adjustments3
TPS revaluations - - - - - - (106) (106)
Treasury shares - - - - - - (4) (4)
FV gain / (loss) on economic hedges - - - - - - (8) (8)
Ineffective hedges - - - - - - (5) (5)
Merger transaction and integration expenses - - - - - - 90 90
Amortisation of intangible assets - 48 - 6 - - - 54
Short-term w holesale funding and deposits - - - - - - (118) (118)
Other non-statutory adjustments - - - - - - 54 54
Cash Earnings 990 460 136 206 168 69 103 2,132
1 2
1 New Zealand earnings are presented in Australian dollars (A$), converted at the actual average A$/NZ$ exchange rate for the half year ended 31 March 2009 (1.2050). 2 ‘Group Businesses’ includes the following amounts associated with the requirements of AASB Life Insurance business (AASB 1038): Non-interest income $4 million debit Tax expense $4 million credit
3 For an explanation of Cash Earnings adjustments refer to the Introduction on page 1 and section 5.2.
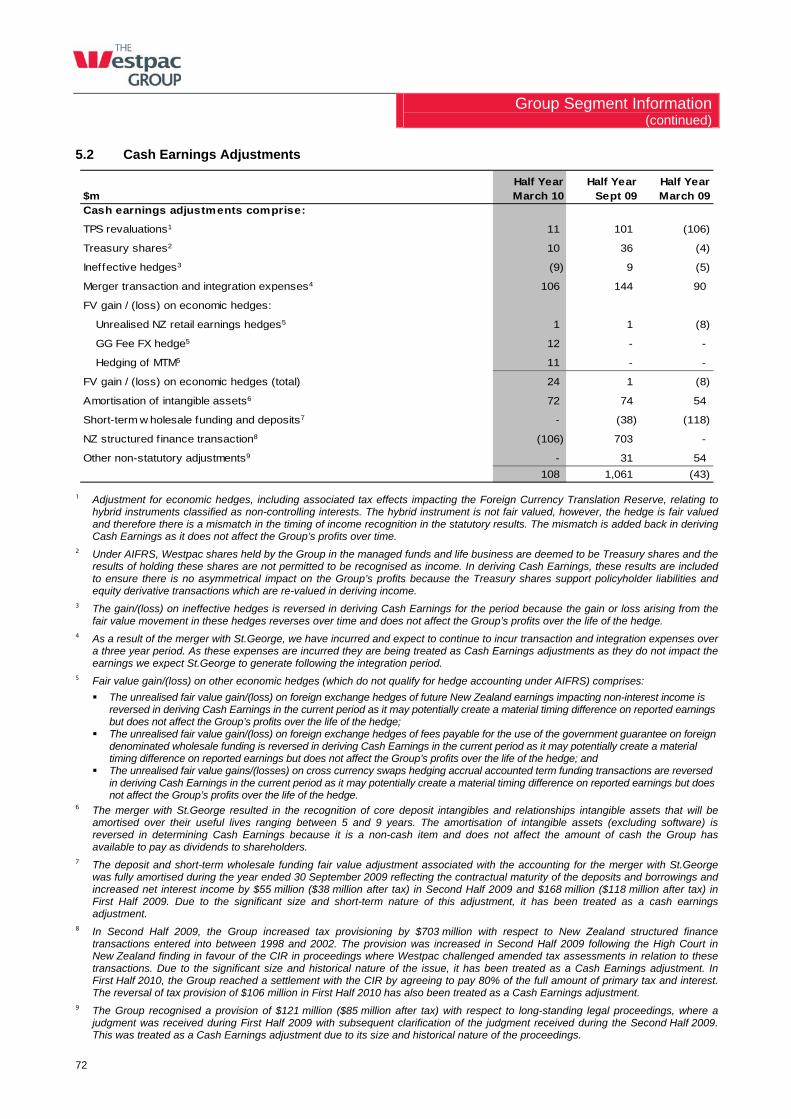
Group Segment Information (continued)
72
5.2 Cash Earnings Adjustments
$mHalf Year March 10
Half Year Sept 09
Half Year March 09
Cash earnings adjustments comprise:
TPS revaluations1 11 101 (106)
Treasury shares2 10 36 (4)
Ineffective hedges3 (9) 9 (5)
Merger transaction and integration expenses4 106 144 90
FV gain / (loss) on economic hedges:
Unrealised NZ retail earnings hedges5 1 1 (8)
GG Fee FX hedge5 12 - -
Hedging of MTM5 11 - -
FV gain / (loss) on economic hedges (total) 24 1 (8)
Amortisation of intangible assets6 72 74 54
Short-term w holesale funding and deposits7 - (38) (118)
NZ structured finance transaction8 (106) 703 -
Other non-statutory adjustments9 - 31 54
108 1,061 (43) 1 Adjustment for economic hedges, including associated tax effects impacting the Foreign Currency Translation Reserve, relating to
hybrid instruments classified as non-controlling interests. The hybrid instrument is not fair valued, however, the hedge is fair valued and therefore there is a mismatch in the timing of income recognition in the statutory results. The mismatch is added back in deriving Cash Earnings as it does not affect the Group’s profits over time.
2 Under AIFRS, Westpac shares held by the Group in the managed funds and life business are deemed to be Treasury shares and the results of holding these shares are not permitted to be recognised as income. In deriving Cash Earnings, these results are included to ensure there is no asymmetrical impact on the Group’s profits because the Treasury shares support policyholder liabilities and equity derivative transactions which are re-valued in deriving income.
3 The gain/(loss) on ineffective hedges is reversed in deriving Cash Earnings for the period because the gain or loss arising from the fair value movement in these hedges reverses over time and does not affect the Group’s profits over the life of the hedge.
4 As a result of the merger with St.George, we have incurred and expect to continue to incur transaction and integration expenses over a three year period. As these expenses are incurred they are being treated as Cash Earnings adjustments as they do not impact the earnings we expect St.George to generate following the integration period.
5 Fair value gain/(loss) on other economic hedges (which do not qualify for hedge accounting under AIFRS) comprises:
The unrealised fair value gain/(loss) on foreign exchange hedges of future New Zealand earnings impacting non-interest income is reversed in deriving Cash Earnings in the current period as it may potentially create a material timing difference on reported earnings but does not affect the Group’s profits over the life of the hedge;
The unrealised fair value gain/(loss) on foreign exchange hedges of fees payable for the use of the government guarantee on foreign denominated wholesale funding is reversed in deriving Cash Earnings in the current period as it may potentially create a material timing difference on reported earnings but does not affect the Group’s profits over the life of the hedge; and
The unrealised fair value gains/(losses) on cross currency swaps hedging accrual accounted term funding transactions are reversed in deriving Cash Earnings in the current period as it may potentially create a material timing difference on reported earnings but does not affect the Group’s profits over the life of the hedge.
6 The merger with St.George resulted in the recognition of core deposit intangibles and relationships intangible assets that will be amortised over their useful lives ranging between 5 and 9 years. The amortisation of intangible assets (excluding software) is reversed in determining Cash Earnings because it is a non-cash item and does not affect the amount of cash the Group has available to pay as dividends to shareholders.
7 The deposit and short-term wholesale funding fair value adjustment associated with the accounting for the merger with St.George was fully amortised during the year ended 30 September 2009 reflecting the contractual maturity of the deposits and borrowings and increased net interest income by $55 million ($38 million after tax) in Second Half 2009 and $168 million ($118 million after tax) in First Half 2009. Due to the significant size and short-term nature of this adjustment, it has been treated as a cash earnings adjustment.
8 In Second Half 2009, the Group increased tax provisioning by $703 million with respect to New Zealand structured finance transactions entered into between 1998 and 2002. The provision was increased in Second Half 2009 following the High Court in New Zealand finding in favour of the CIR in proceedings where Westpac challenged amended tax assessments in relation to these transactions. Due to the significant size and historical nature of the issue, it has been treated as a Cash Earnings adjustment. In First Half 2010, the Group reached a settlement with the CIR by agreeing to pay 80% of the full amount of primary tax and interest. The reversal of tax provision of $106 million in First Half 2010 has also been treated as a Cash Earnings adjustment.
9 The Group recognised a provision of $121 million ($85 million after tax) with respect to long-standing legal proceedings, where a judgment was received during First Half 2009 with subsequent clarification of the judgment received during the Second Half 2009. This was treated as a Cash Earnings adjustment due to its size and historical nature of the proceedings.
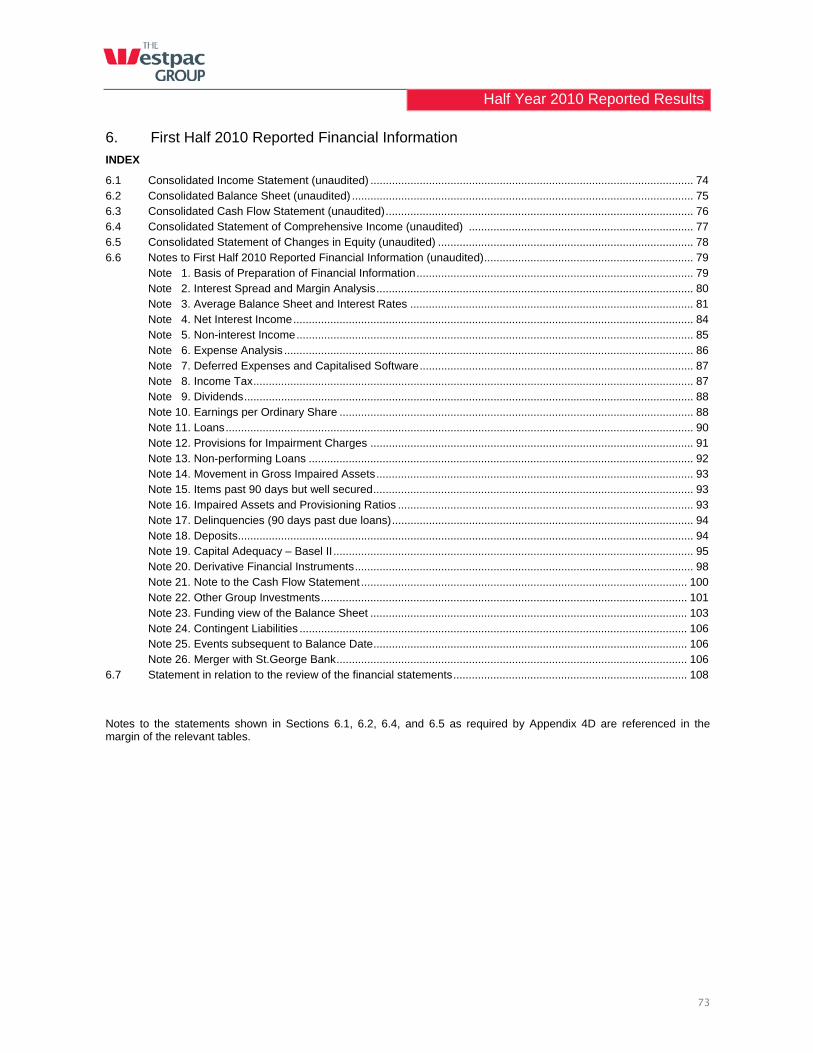
Half Year 2010 Reported Results
73
6. First Half 2010 Reported Financial Information
INDEX
6.1 Consolidated Income Statement (unaudited) ......................................................................................................... 74 6.2 Consolidated Balance Sheet (unaudited) ............................................................................................................... 75 6.3 Consolidated Cash Flow Statement (unaudited).................................................................................................... 76 6.4 Consolidated Statement of Comprehensive Income (unaudited) ......................................................................... 77 6.5 Consolidated Statement of Changes in Equity (unaudited) ................................................................................... 78 6.6 Notes to First Half 2010 Reported Financial Information (unaudited).................................................................... 79 Note 1. Basis of Preparation of Financial Information.......................................................................................... 79 Note 2. Interest Spread and Margin Analysis....................................................................................................... 80 Note 3. Average Balance Sheet and Interest Rates ............................................................................................ 81 Note 4. Net Interest Income.................................................................................................................................. 84 Note 5. Non-interest Income................................................................................................................................. 85 Note 6. Expense Analysis ..................................................................................................................................... 86 Note 7. Deferred Expenses and Capitalised Software......................................................................................... 87 Note 8. Income Tax............................................................................................................................................... 87 Note 9. Dividends.................................................................................................................................................. 88 Note 10. Earnings per Ordinary Share ................................................................................................................... 88 Note 11. Loans........................................................................................................................................................ 90 Note 12. Provisions for Impairment Charges ......................................................................................................... 91 Note 13. Non-performing Loans ............................................................................................................................. 92 Note 14. Movement in Gross Impaired Assets....................................................................................................... 93 Note 15. Items past 90 days but well secured........................................................................................................ 93 Note 16. Impaired Assets and Provisioning Ratios ................................................................................................ 93 Note 17. Delinquencies (90 days past due loans).................................................................................................. 94 Note 18. Deposits.................................................................................................................................................... 94 Note 19. Capital Adequacy – Basel II ..................................................................................................................... 95 Note 20. Derivative Financial Instruments.............................................................................................................. 98 Note 21. Note to the Cash Flow Statement .......................................................................................................... 100 Note 22. Other Group Investments....................................................................................................................... 101 Note 23. Funding view of the Balance Sheet ....................................................................................................... 103 Note 24. Contingent Liabilities .............................................................................................................................. 106 Note 25. Events subsequent to Balance Date...................................................................................................... 106 Note 26. Merger with St.George Bank.................................................................................................................. 106 6.7 Statement in relation to the review of the financial statements............................................................................ 108
Notes to the statements shown in Sections 6.1, 6.2, 6.4, and 6.5 as required by Appendix 4D are referenced in the margin of the relevant tables.
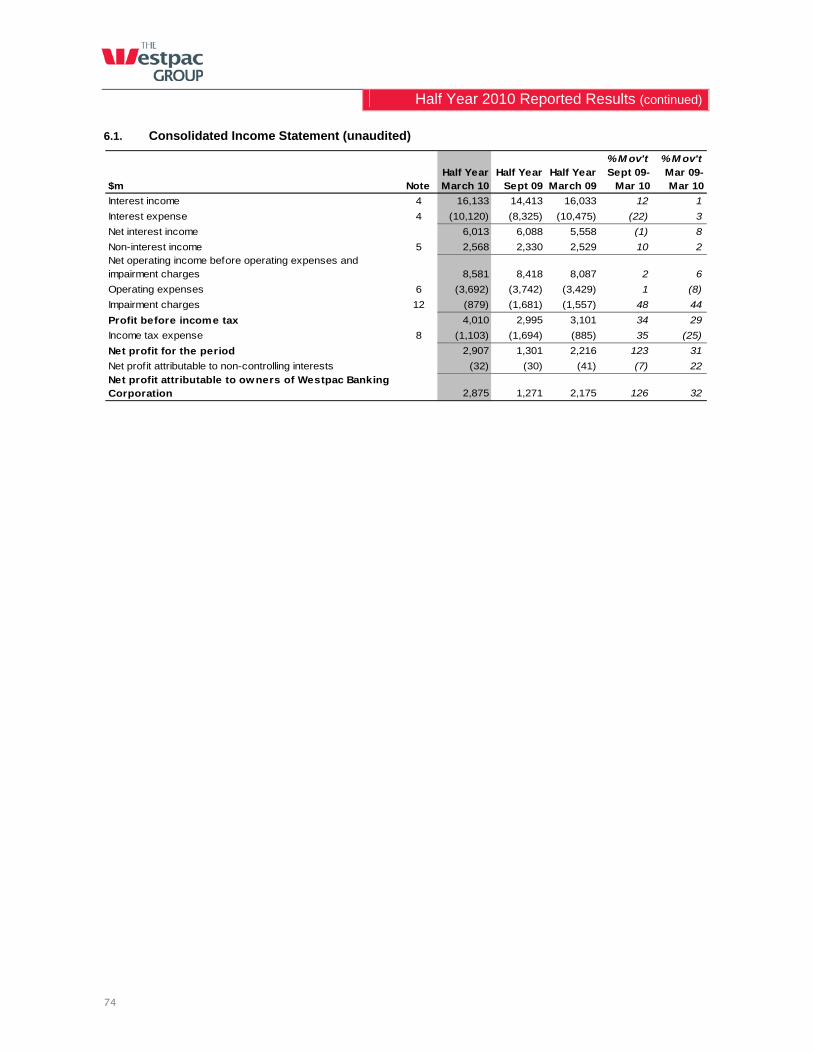
Half Year 2010 Reported Results (continued)
74
6.1. Consolidated Income Statement (unaudited)
% M ov't % M ov't
$m NoteHalf YearMarch 10
Half YearSept 09
Half YearMarch 09
Sept 09- Mar 10
Mar 09-Mar 10
Interest income 4 16,133 14,413 16,033 12 1
Interest expense 4 (10,120) (8,325) (10,475) (22) 3
Net interest income 6,013 6,088 5,558 (1) 8
Non-interest income 5 2,568 2,330 2,529 10 2Net operating income before operating expenses and impairment charges 8,581 8,418 8,087 2 6
Operating expenses 6 (3,692) (3,742) (3,429) 1 (8)
Impairment charges 12 (879) (1,681) (1,557) 48 44
Profit before income tax 4,010 2,995 3,101 34 29
Income tax expense 8 (1,103) (1,694) (885) 35 (25)
Net profit for the period 2,907 1,301 2,216 123 31
Net profit attributable to non-controlling interests (32) (30) (41) (7) 22
Net profit attributable to owners of Westpac Banking Corporation 2,875 1,271 2,175 126 32
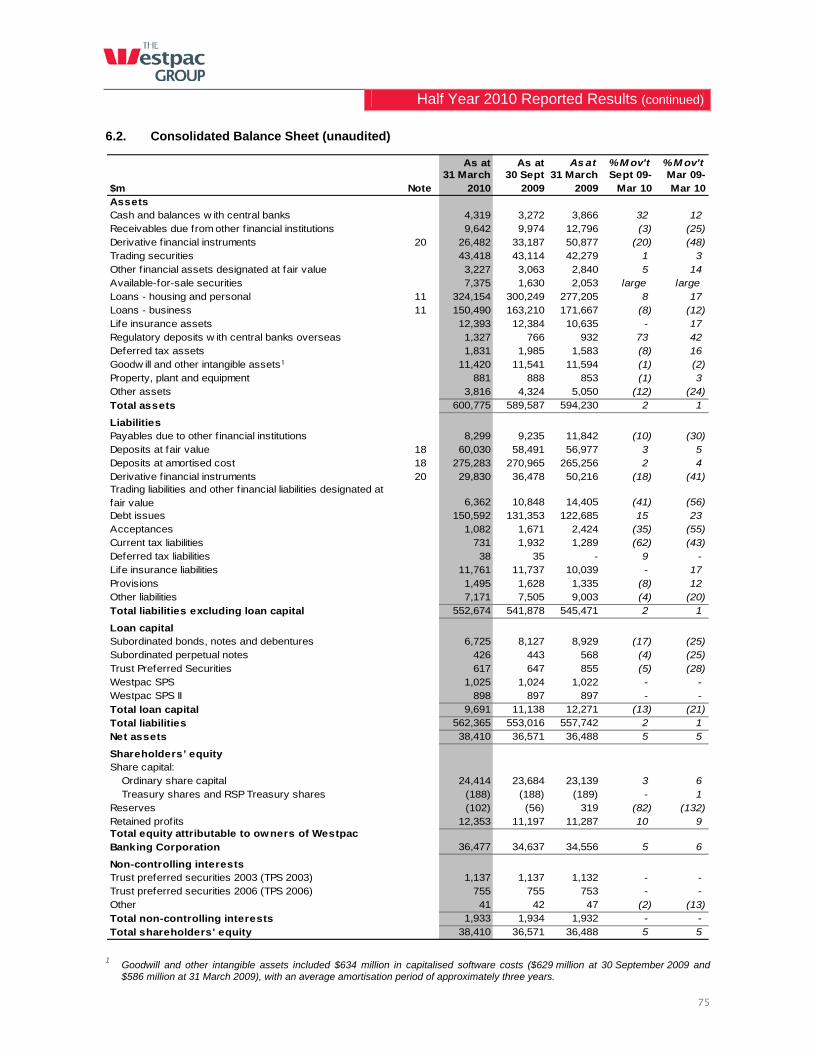
Half Year 2010 Reported Results (continued)
75
6.2. Consolidated Balance Sheet (unaudited)
As at As at As at % M ov't % M ov't
$m Note31 March
201030 Sept
200931 March
2009Sept 09-
Mar 10Mar 09-Mar 10
AssetsCash and balances w ith central banks 4,319 3,272 3,866 32 12 Receivables due from other f inancial institutions 9,642 9,974 12,796 (3) (25) Derivative f inancial instruments 20 26,482 33,187 50,877 (20) (48) Trading securities 43,418 43,114 42,279 1 3 Other f inancial assets designated at fair value 3,227 3,063 2,840 5 14 Available-for-sale securities 7,375 1,630 2,053 large largeLoans - housing and personal 11 324,154 300,249 277,205 8 17 Loans - business 11 150,490 163,210 171,667 (8) (12) Life insurance assets 12,393 12,384 10,635 - 17 Regulatory deposits w ith central banks overseas 1,327 766 932 73 42 Deferred tax assets 1,831 1,985 1,583 (8) 16 Goodw ill and other intangible assets1 11,420 11,541 11,594 (1) (2) Property, plant and equipment 881 888 853 (1) 3 Other assets 3,816 4,324 5,050 (12) (24)
Total assets 600,775 589,587 594,230 2 1
LiabilitiesPayables due to other f inancial institutions 8,299 9,235 11,842 (10) (30) Deposits at fair value 18 60,030 58,491 56,977 3 5 Deposits at amortised cost 18 275,283 270,965 265,256 2 4 Derivative f inancial instruments 20 29,830 36,478 50,216 (18) (41) Trading liabilities and other f inancial liabilities designated at fair value 6,362 10,848 14,405 (41) (56) Debt issues 150,592 131,353 122,685 15 23 Acceptances 1,082 1,671 2,424 (35) (55) Current tax liabilities 731 1,932 1,289 (62) (43) Deferred tax liabilities 38 35 - 9 - Life insurance liabilities 11,761 11,737 10,039 - 17 Provisions 1,495 1,628 1,335 (8) 12 Other liabilities 7,171 7,505 9,003 (4) (20) Total liabilities excluding loan capital 552,674 541,878 545,471 2 1
Loan capitalSubordinated bonds, notes and debentures 6,725 8,127 8,929 (17) (25) Subordinated perpetual notes 426 443 568 (4) (25) Trust Preferred Securities 617 647 855 (5) (28) Westpac SPS 1,025 1,024 1,022 - - Westpac SPS II 898 897 897 - - Total loan capital 9,691 11,138 12,271 (13) (21) Total liabilities 562,365 553,016 557,742 2 1 Net assets 38,410 36,571 36,488 5 5
Shareholders’ equityShare capital:
Ordinary share capital 24,414 23,684 23,139 3 6 Treasury shares and RSP Treasury shares (188) (188) (189) - 1
Reserves (102) (56) 319 (82) (132) Retained profits 12,353 11,197 11,287 10 9 Total equity attributable to owners of Westpac Banking Corporation 36,477 34,637 34,556 5 6
Non-controlling interestsTrust preferred securities 2003 (TPS 2003) 1,137 1,137 1,132 - - Trust preferred securities 2006 (TPS 2006) 755 755 753 - - Other 41 42 47 (2) (13) Total non-controlling interests 1,933 1,934 1,932 - -
Total shareholders' equity 38,410 36,571 36,488 5 5
1 Goodwill and other intangible assets included $634 million in capitalised software costs ($629 million at 30 September 2009 and
$586 million at 31 March 2009), with an average amortisation period of approximately three years.
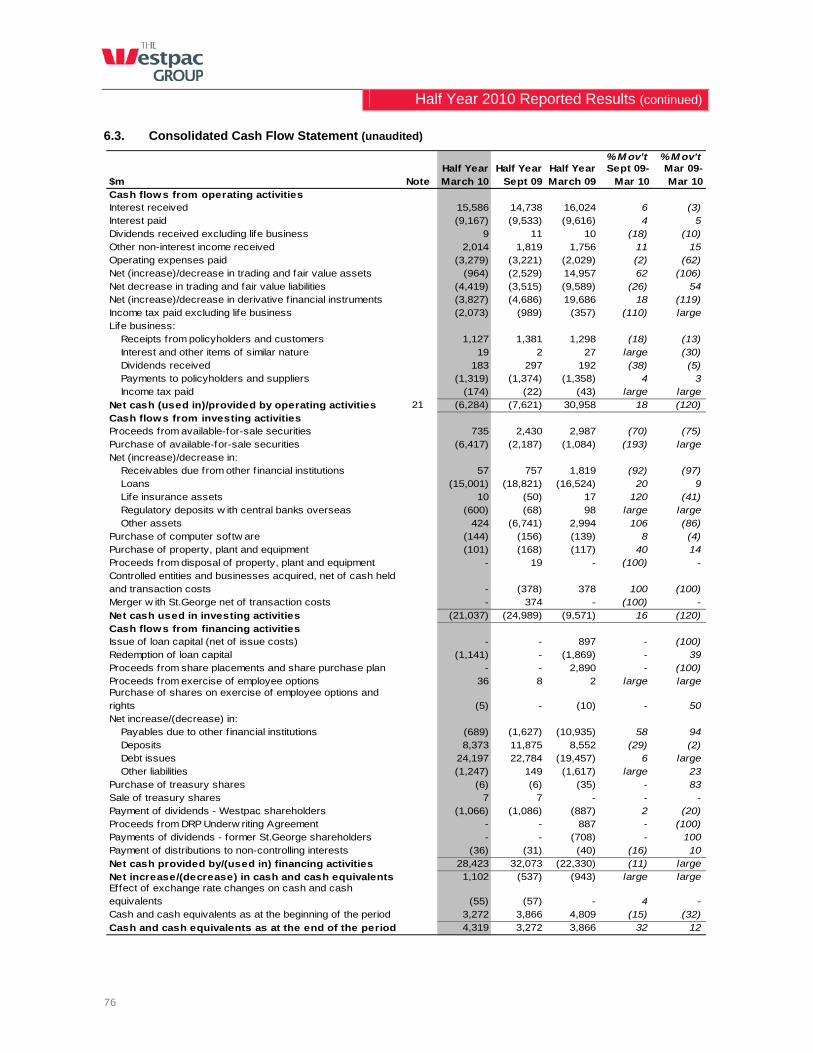
Half Year 2010 Reported Results (continued)
76
6.3. Consolidated Cash Flow Statement (unaudited)
% M ov't % M ov't
$m NoteHalf YearMarch 10
Half YearSept 09
Half YearMarch 09
Sept 09- Mar 10
Mar 09-Mar 10
Cash flows from operating activitiesInterest received 15,586 14,738 16,024 6 (3)Interest paid (9,167) (9,533) (9,616) 4 5Dividends received excluding life business 9 11 10 (18) (10)Other non-interest income received 2,014 1,819 1,756 11 15Operating expenses paid (3,279) (3,221) (2,029) (2) (62)Net (increase)/decrease in trading and fair value assets (964) (2,529) 14,957 62 (106)Net decrease in trading and fair value liabilities (4,419) (3,515) (9,589) (26) 54Net (increase)/decrease in derivative f inancial instruments (3,827) (4,686) 19,686 18 (119)Income tax paid excluding life business (2,073) (989) (357) (110) largeLife business:
Receipts from policyholders and customers 1,127 1,381 1,298 (18) (13)Interest and other items of similar nature 19 2 27 large (30)Dividends received 183 297 192 (38) (5)Payments to policyholders and suppliers (1,319) (1,374) (1,358) 4 3Income tax paid (174) (22) (43) large large
Net cash (used in)/provided by operating activities 21 (6,284) (7,621) 30,958 18 (120)
Cash flows from investing activitiesProceeds from available-for-sale securities 735 2,430 2,987 (70) (75)Purchase of available-for-sale securities (6,417) (2,187) (1,084) (193) largeNet (increase)/decrease in:
Receivables due from other f inancial institutions 57 757 1,819 (92) (97)Loans (15,001) (18,821) (16,524) 20 9Life insurance assets 10 (50) 17 120 (41)Regulatory deposits w ith central banks overseas (600) (68) 98 large largeOther assets 424 (6,741) 2,994 106 (86)
Purchase of computer softw are (144) (156) (139) 8 (4)Purchase of property, plant and equipment (101) (168) (117) 40 14Proceeds from disposal of property, plant and equipment - 19 - (100) -Controlled entities and businesses acquired, net of cash held and transaction costs - (378) 378 100 (100)Merger w ith St.George net of transaction costs - 374 - (100) -
Net cash used in investing activities (21,037) (24,989) (9,571) 16 (120)
Cash flows from financing activitiesIssue of loan capital (net of issue costs) - - 897 - (100)Redemption of loan capital (1,141) - (1,869) - 39Proceeds from share placements and share purchase plan - - 2,890 - (100)Proceeds from exercise of employee options 36 8 2 large largePurchase of shares on exercise of employee options and rights (5) - (10) - 50Net increase/(decrease) in:
Payables due to other f inancial institutions (689) (1,627) (10,935) 58 94Deposits 8,373 11,875 8,552 (29) (2)Debt issues 24,197 22,784 (19,457) 6 largeOther liabilities (1,247) 149 (1,617) large 23
Purchase of treasury shares (6) (6) (35) - 83Sale of treasury shares 7 7 - - -Payment of dividends - Westpac shareholders (1,066) (1,086) (887) 2 (20)Proceeds from DRP Underw riting Agreement - - 887 - (100)Payments of dividends - former St.George shareholders - - (708) - 100Payment of distributions to non-controlling interests (36) (31) (40) (16) 10
Net cash provided by/(used in) financing activities 28,423 32,073 (22,330) (11) large
Net increase/(decrease) in cash and cash equivalents 1,102 (537) (943) large largeEffect of exchange rate changes on cash and cash equivalents (55) (57) - 4 -Cash and cash equivalents as at the beginning of the period 3,272 3,866 4,809 (15) (32)
Cash and cash equivalents as at the end of the period 4,319 3,272 3,866 32 12
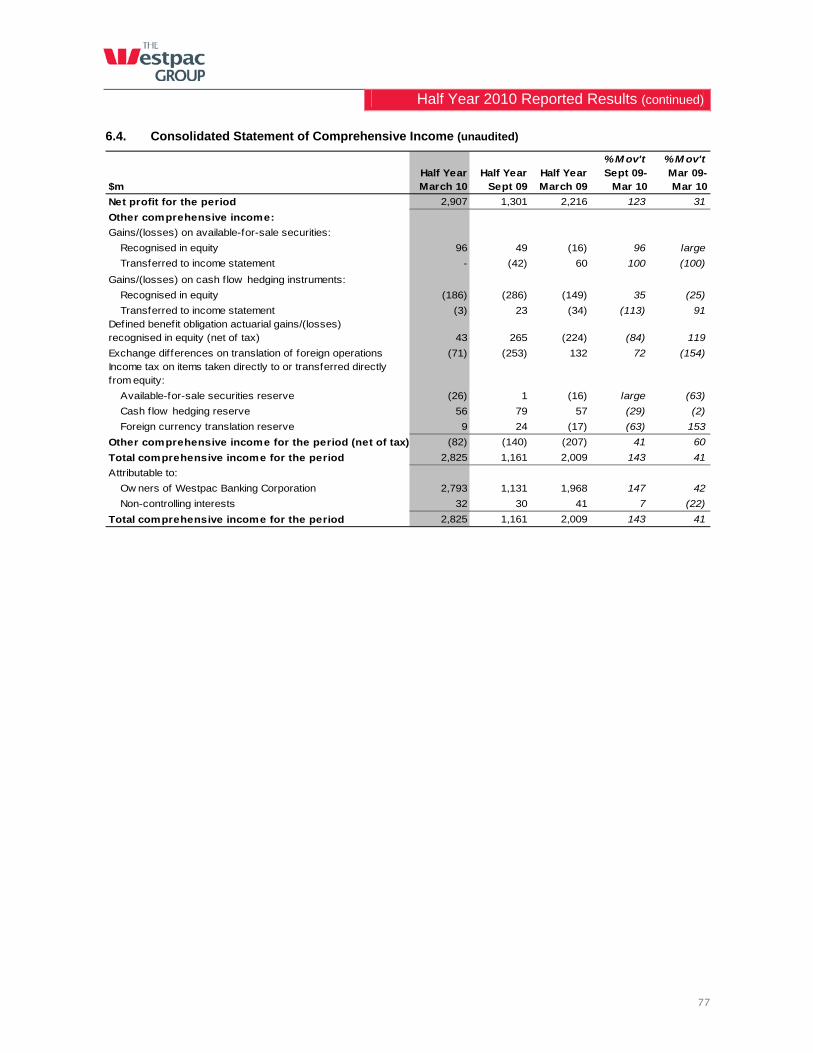
Half Year 2010 Reported Results (continued)
77
6.4. Consolidated Statement of Comprehensive Income (unaudited)
% M ov't % M ov't
$mHalf YearMarch 10
Half YearSept 09
Half YearMarch 09
Sept 09- Mar 10
Mar 09-Mar 10
Net profit for the period 2,907 1,301 2,216 123 31
Other comprehensive income:
Gains/(losses) on available-for-sale securities:
Recognised in equity 96 49 (16) 96 large
Transferred to income statement - (42) 60 100 (100)
Gains/(losses) on cash flow hedging instruments:
Recognised in equity (186) (286) (149) 35 (25)
Transferred to income statement (3) 23 (34) (113) 91Defined benefit obligation actuarial gains/(losses)recognised in equity (net of tax) 43 265 (224) (84) 119
Exchange differences on translation of foreign operations (71) (253) 132 72 (154)Income tax on items taken directly to or transferred directly from equity:
Available-for-sale securities reserve (26) 1 (16) large (63)
Cash flow hedging reserve 56 79 57 (29) (2)
Foreign currency translation reserve 9 24 (17) (63) 153
Other comprehensive income for the period (net of tax) (82) (140) (207) 41 60
Total comprehensive income for the period 2,825 1,161 2,009 143 41
Attributable to:
Ow ners of Westpac Banking Corporation 2,793 1,131 1,968 147 42
Non-controlling interests 32 30 41 7 (22)
Total comprehensive income for the period 2,825 1,161 2,009 143 41
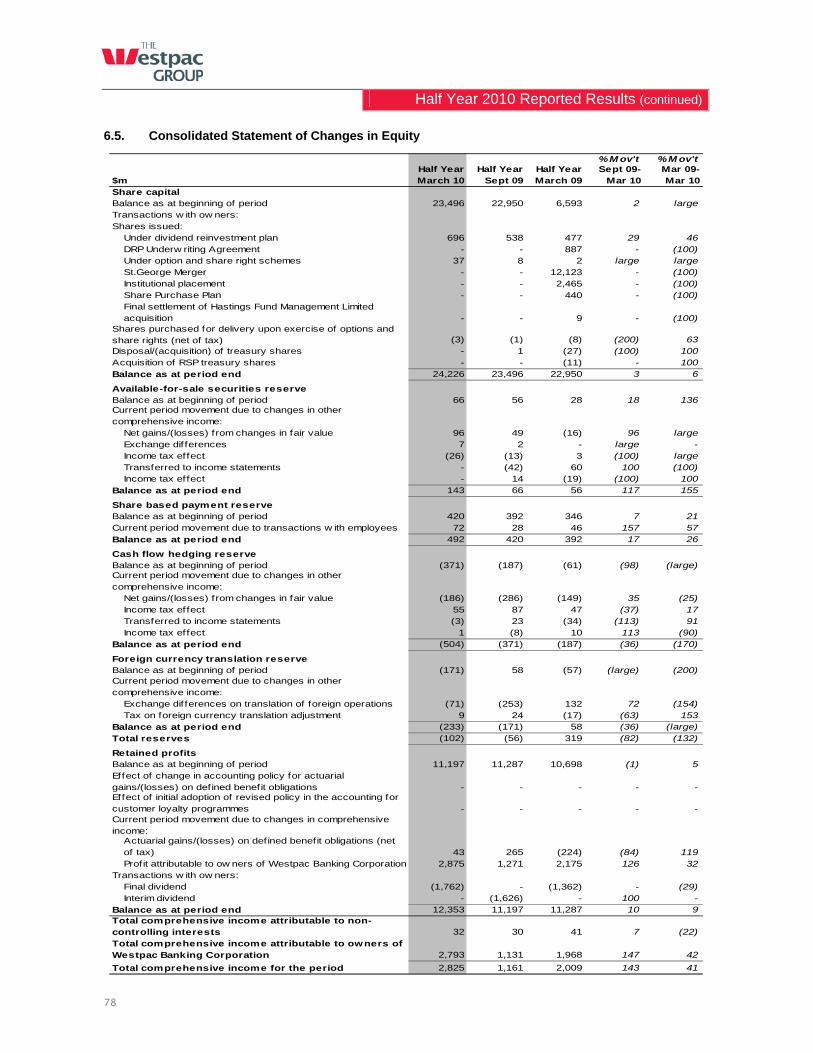
Half Year 2010 Reported Results (continued)
78
6.5. Consolidated Statement of Changes in Equity
% M ov't % M ov't
$mHalf YearMarch 10
Half YearSept 09
Half YearMarch 09
Sept 09- Mar 10
Mar 09-Mar 10
Share capitalBalance as at beginning of period 23,496 22,950 6,593 2 largeTransactions w ith ow ners:Shares issued:
Under dividend reinvestment plan 696 538 477 29 46DRP Underw riting Agreement - - 887 - (100)Under option and share right schemes 37 8 2 large largeSt.George Merger - - 12,123 - (100)Institutional placement - - 2,465 - (100)Share Purchase Plan - - 440 - (100)Final settlement of Hastings Fund Management Limited acquisition - - 9 - (100)
Shares purchased for delivery upon exercise of options and share rights (net of tax) (3) (1) (8) (200) 63Disposal/(acquisition) of treasury shares - 1 (27) (100) 100Acquisition of RSP treasury shares - - (11) - 100Balance as at period end 24,226 23,496 22,950 3 6
Available-for-sale securities reserveBalance as at beginning of period 66 56 28 18 136Current period movement due to changes in other comprehensive income:
Net gains/(losses) from changes in fair value 96 49 (16) 96 largeExchange dif ferences 7 2 - large -Income tax effect (26) (13) 3 (100) largeTransferred to income statements - (42) 60 100 (100)Income tax effect - 14 (19) (100) 100
Balance as at period end 143 66 56 117 155
Share based payment reserveBalance as at beginning of period 420 392 346 7 21Current period movement due to transactions w ith employees 72 28 46 157 57Balance as at period end 492 420 392 17 26
Cash flow hedging reserveBalance as at beginning of period (371) (187) (61) (98) (large)Current period movement due to changes in other comprehensive income:
Net gains/(losses) from changes in fair value (186) (286) (149) 35 (25)Income tax effect 55 87 47 (37) 17Transferred to income statements (3) 23 (34) (113) 91Income tax effect 1 (8) 10 113 (90)
Balance as at period end (504) (371) (187) (36) (170)
Foreign currency translation reserveBalance as at beginning of period (171) 58 (57) (large) (200)Current period movement due to changes in other comprehensive income:
Exchange dif ferences on translation of foreign operations (71) (253) 132 72 (154)Tax on foreign currency translation adjustment 9 24 (17) (63) 153
Balance as at period end (233) (171) 58 (36) (large)Total reserves (102) (56) 319 (82) (132)
Retained profitsBalance as at beginning of period 11,197 11,287 10,698 (1) 5Effect of change in accounting policy for actuarial gains/(losses) on defined benefit obligations - - - - -Effect of initial adoption of revised policy in the accounting for customer loyalty programmes - - - - -Current period movement due to changes in comprehensive income:
Actuarial gains/(losses) on defined benefit obligations (net of tax) 43 265 (224) (84) 119Profit attributable to ow ners of Westpac Banking Corporation 2,875 1,271 2,175 126 32
Transactions w ith ow ners:Final dividend (1,762) - (1,362) - (29)Interim dividend - (1,626) - 100 -
Balance as at period end 12,353 11,197 11,287 10 9Total comprehensive income attributable to non-controlling interests 32 30 41 7 (22)Total comprehensive income attributable to owners of Westpac Banking Corporation 2,793 1,131 1,968 147 42
Total comprehensive income for the period 2,825 1,161 2,009 143 41
Half Year 2010 Reported Results (continued)
79
6.6. Notes to First Half 2010 Reported Financial Information (unaudited)
Note 1. Basis of preparation of financial information
The accounting policies and methods of computation adopted in the preparation of the First Half 2010 Financial Information are the same as those in the previous financial year and corresponding interim reporting period. Where necessary, comparative figures have been adjusted to conform to changes in presentation in the current period. The accounting policies and methods of computation adopted in the previous financial year were in accordance with the Australian equivalents to International Financial Reporting Standards, other authoritative pronouncements of the Australian Accounting Standards Board, Urgent Issues Group Interpretations and the Corporations Act. Westpac’s consolidated financial statements for the previous financial year also comply with International Financial Reporting Standards and interpretations issued by the International Accounting Standards Board. All amounts have been rounded to the nearest million dollars unless otherwise stated.
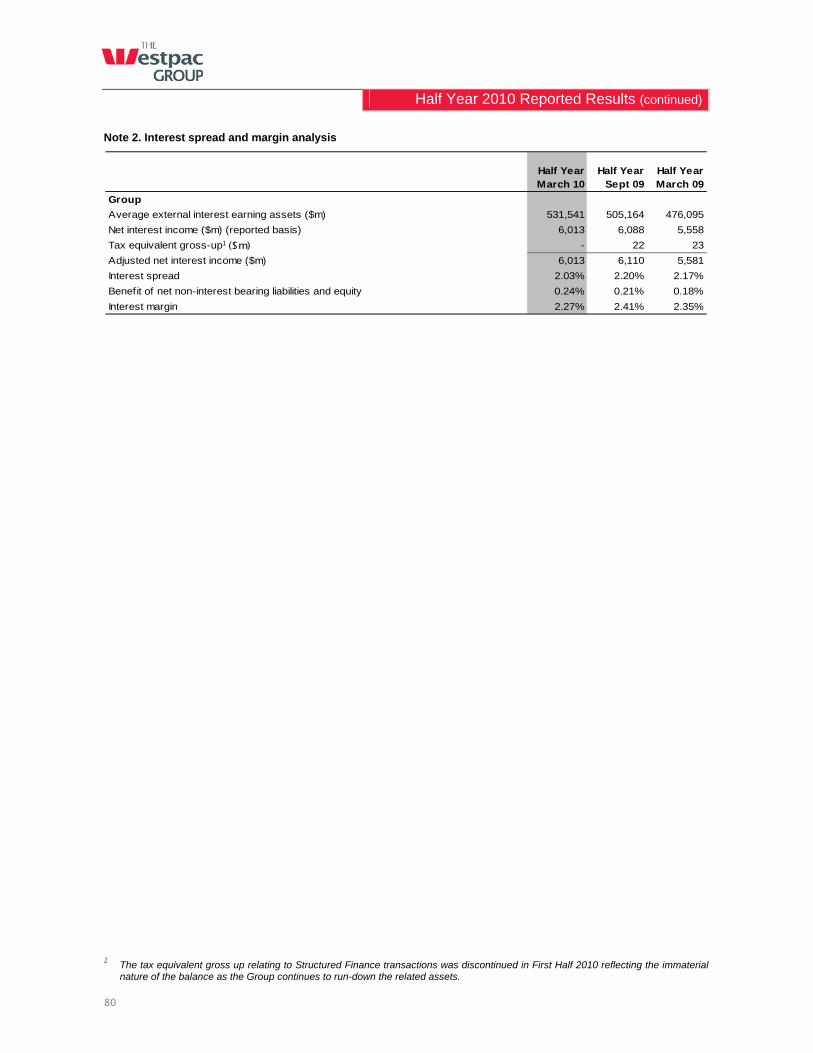
Half Year 2010 Reported Results (continued)
80
Note 2. Interest spread and margin analysis
Half YearMarch 10
Half YearSept 09
Half YearMarch 09
Group
Average external interest earning assets ($m) 531,541 505,164 476,095
Net interest income ($m) (reported basis) 6,013 6,088 5,558
Tax equivalent gross-up1 ($m) - 22 23
Adjusted net interest income ($m) 6,013 6,110 5,581
Interest spread 2.03% 2.20% 2.17%
Benefit of net non-interest bearing liabilities and equity 0.24% 0.21% 0.18%
Interest margin 2.27% 2.41% 2.35%
1 The tax equivalent gross up relating to Structured Finance transactions was discontinued in First Half 2010 reflecting the immaterial
nature of the balance as the Group continues to run-down the related assets.
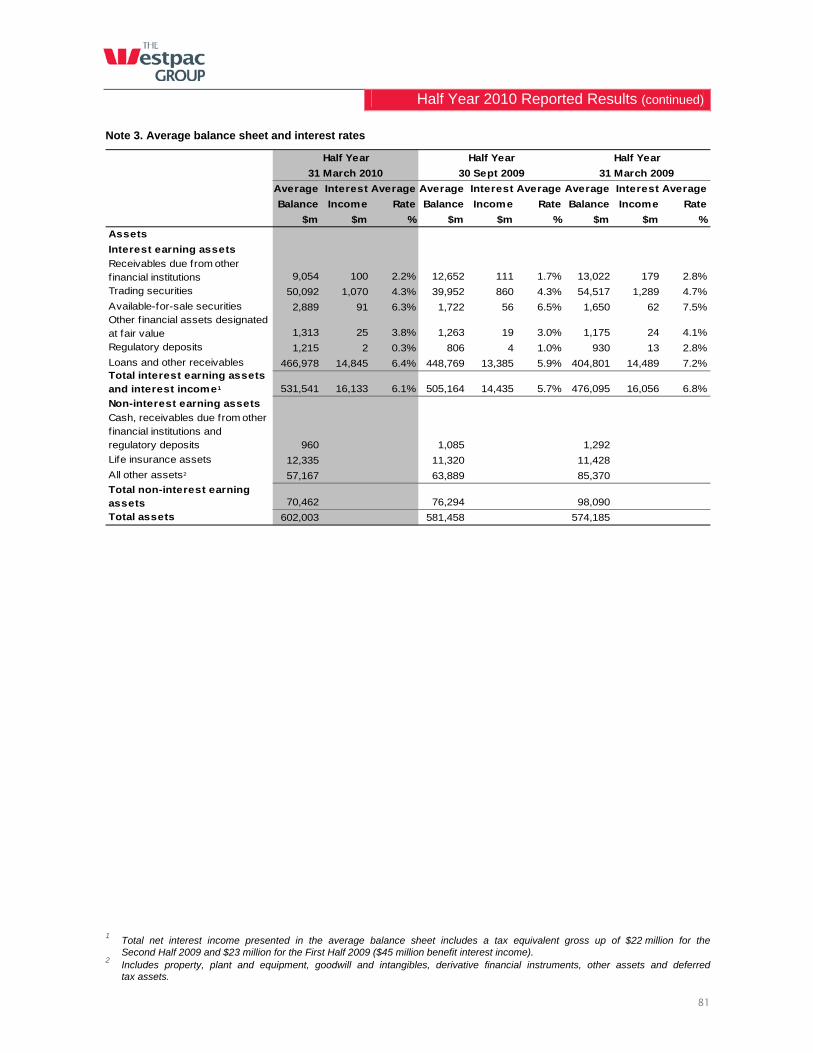
Half Year 2010 Reported Results (continued)
81
Note 3. Average balance sheet and interest rates
Average Interest Average Average Interest Average Average Interest Average
Balance Income Rate Balance Income Rate Balance Income Rate
$m $m % $m $m % $m $m %
Assets
Interest earning assets
Receivables due from other f inancial institutions 9,054 100 2.2% 12,652 111 1.7% 13,022 179 2.8%
Trading securities 50,092 1,070 4.3% 39,952 860 4.3% 54,517 1,289 4.7%
Available-for-sale securities 2,889 91 6.3% 1,722 56 6.5% 1,650 62 7.5%Other f inancial assets designated at fair value 1,313 25 3.8% 1,263 19 3.0% 1,175 24 4.1%
Regulatory deposits 1,215 2 0.3% 806 4 1.0% 930 13 2.8%
Loans and other receivables 466,978 14,845 6.4% 448,769 13,385 5.9% 404,801 14,489 7.2%Total interest earning assets and interest income1 531,541 16,133 6.1% 505,164 14,435 5.7% 476,095 16,056 6.8%
Non-interest earning assets
Cash, receivables due from other f inancial institutions and regulatory deposits 960 1,085 1,292
Life insurance assets 12,335 11,320 11,428
All other assets2 57,167 63,889 85,370
Total non-interest earning assets 70,462 76,294 98,090
Total assets 602,003 581,458 574,185
31 March 2009
Half Year Half Year
31 March 2010 30 Sept 2009
Half Year
1 Total net interest income presented in the average balance sheet includes a tax equivalent gross up of $22 million for the
Second Half 2009 and $23 million for the First Half 2009 ($45 million benefit interest income). 2 Includes property, plant and equipment, goodwill and intangibles, derivative financial instruments, other assets and deferred
tax assets.
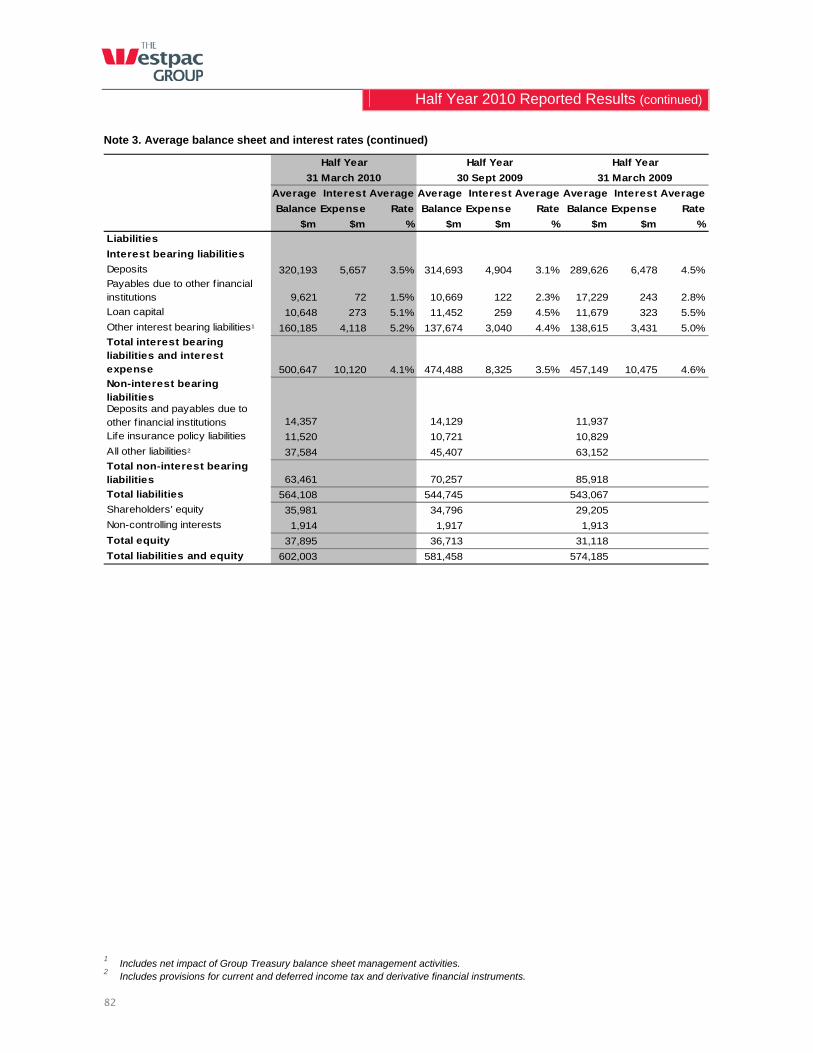
Half Year 2010 Reported Results (continued)
82
Note 3. Average balance sheet and interest rates (continued)
Average Interest Average Average Interest Average Average Interest Average
Balance Expense Rate Balance Expense Rate Balance Expense Rate
$m $m % $m $m % $m $m %
Liabilities
Interest bearing liabilities
Deposits 320,193 5,657 3.5% 314,693 4,904 3.1% 289,626 6,478 4.5%Payables due to other f inancial institutions 9,621 72 1.5% 10,669 122 2.3% 17,229 243 2.8%
Loan capital 10,648 273 5.1% 11,452 259 4.5% 11,679 323 5.5%
Other interest bearing liabilities1 160,185 4,118 5.2% 137,674 3,040 4.4% 138,615 3,431 5.0%Total interest bearing liabilities and interest expense 500,647 10,120 4.1% 474,488 8,325 3.5% 457,149 10,475 4.6%Non-interest bearing liabilitiesDeposits and payables due to other f inancial institutions 14,357 14,129 11,937
Life insurance policy liabilities 11,520 10,721 10,829
All other liabilities2 37,584 45,407 63,152Total non-interest bearing liabilities 63,461 70,257 85,918
Total liabilities 564,108 544,745 543,067
Shareholders' equity 35,981 34,796 29,205
Non-controlling interests 1,914 1,917 1,913
Total equity 37,895 36,713 31,118
Total liabilities and equity 602,003 581,458 574,185
Half Year
31 March 2009
Half Year Half Year
31 March 2010 30 Sept 2009
1 Includes net impact of Group Treasury balance sheet management activities.
2 Includes provisions for current and deferred income tax and derivative financial instruments.
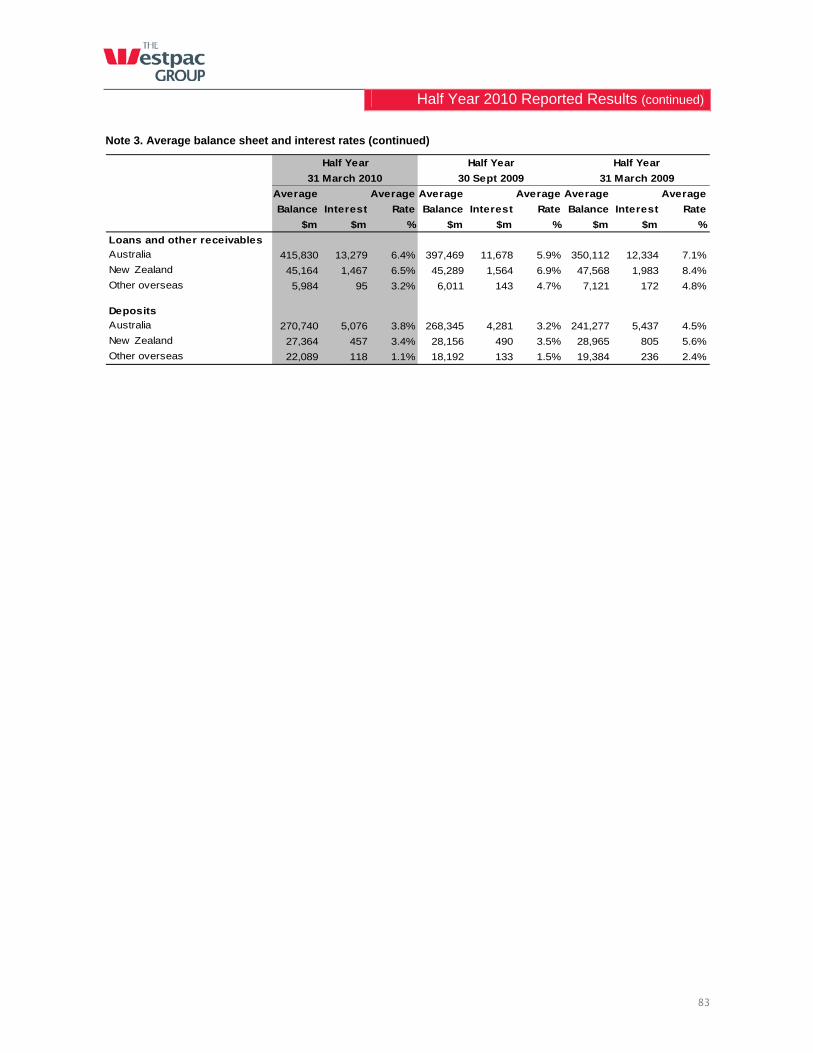
Half Year 2010 Reported Results (continued)
83
Note 3. Average balance sheet and interest rates (continued)
Average Average Average Average Average Average
Balance Interest Rate Balance Interest Rate Balance Interest Rate
$m $m % $m $m % $m $m %
Loans and other receivables
Australia 415,830 13,279 6.4% 397,469 11,678 5.9% 350,112 12,334 7.1%
New Zealand 45,164 1,467 6.5% 45,289 1,564 6.9% 47,568 1,983 8.4%
Other overseas 5,984 95 3.2% 6,011 143 4.7% 7,121 172 4.8%
Deposits
Australia 270,740 5,076 3.8% 268,345 4,281 3.2% 241,277 5,437 4.5%
New Zealand 27,364 457 3.4% 28,156 490 3.5% 28,965 805 5.6%
Other overseas 22,089 118 1.1% 18,192 133 1.5% 19,384 236 2.4%
Half Year Half Year
31 March 2010 30 Sept 2009
Half Year
31 March 2009
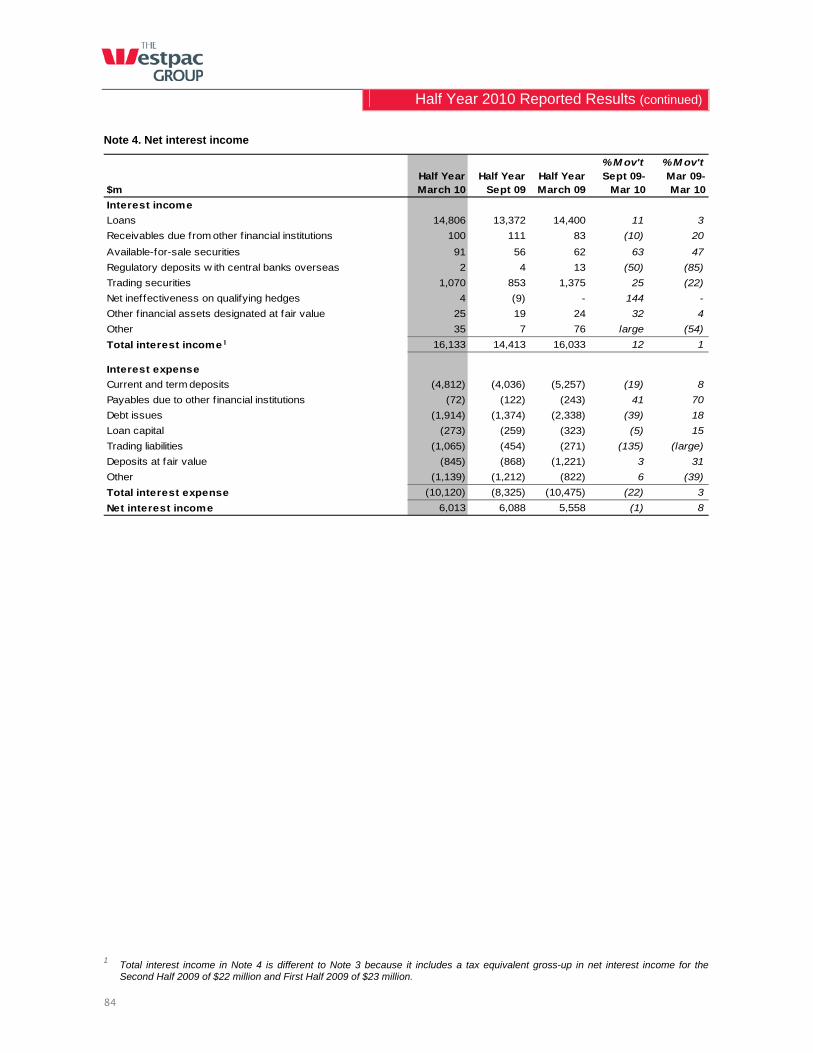
Half Year 2010 Reported Results (continued)
84
Note 4. Net interest income
% M ov't % M ov't
$mHalf YearMarch 10
Half YearSept 09
Half YearMarch 09
Sept 09- Mar 10
Mar 09-Mar 10
Interest income
Loans 14,806 13,372 14,400 11 3
Receivables due from other f inancial institutions 100 111 83 (10) 20
Available-for-sale securities 91 56 62 63 47
Regulatory deposits w ith central banks overseas 2 4 13 (50) (85)
Trading securities 1,070 853 1,375 25 (22)
Net ineffectiveness on qualifying hedges 4 (9) - 144 -
Other f inancial assets designated at fair value 25 19 24 32 4
Other 35 7 76 large (54)
Total interest income1 16,133 14,413 16,033 12 1
Interest expense
Current and term deposits (4,812) (4,036) (5,257) (19) 8
Payables due to other f inancial institutions (72) (122) (243) 41 70
Debt issues (1,914) (1,374) (2,338) (39) 18
Loan capital (273) (259) (323) (5) 15
Trading liabilities (1,065) (454) (271) (135) (large)
Deposits at fair value (845) (868) (1,221) 3 31
Other (1,139) (1,212) (822) 6 (39)
Total interest expense (10,120) (8,325) (10,475) (22) 3
Net interest income 6,013 6,088 5,558 (1) 8
1 Total interest income in Note 4 is different to Note 3 because it includes a tax equivalent gross-up in net interest income for the
Second Half 2009 of $22 million and First Half 2009 of $23 million.
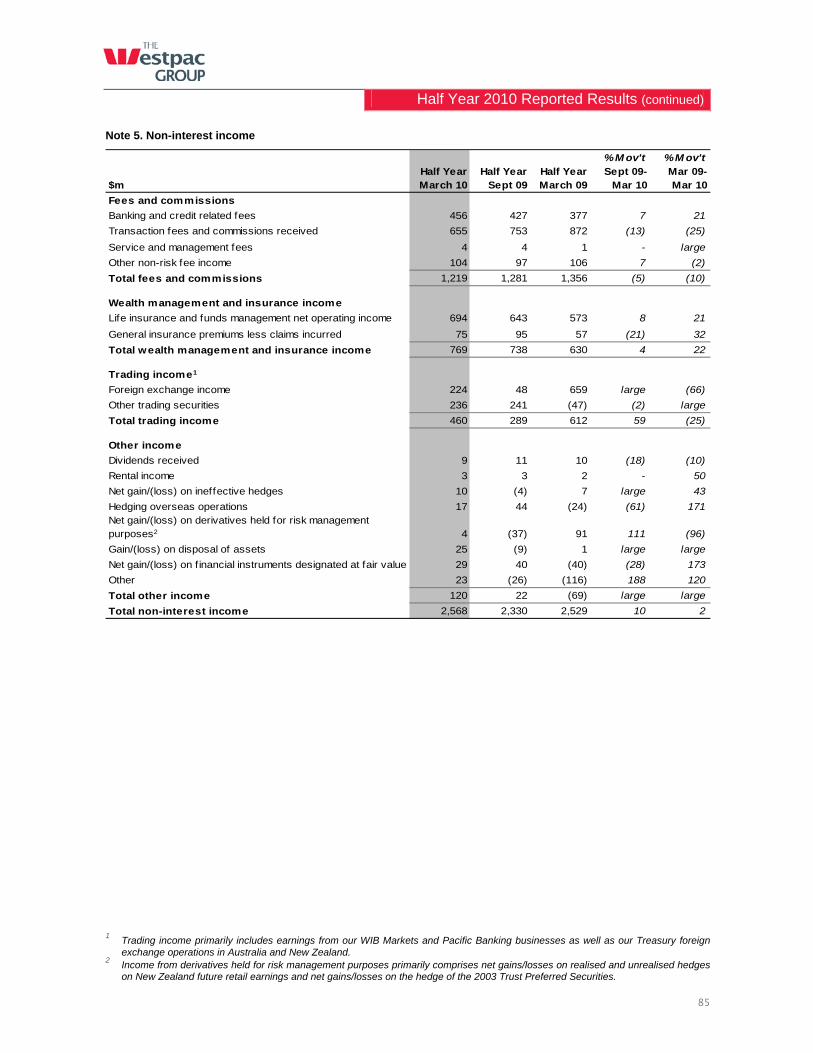
Half Year 2010 Reported Results (continued)
85
Note 5. Non-interest income
% M ov't % M ov't
$mHalf YearMarch 10
Half YearSept 09
Half YearMarch 09
Sept 09- Mar 10
Mar 09-Mar 10
Fees and commissions
Banking and credit related fees 456 427 377 7 21
Transaction fees and commissions received 655 753 872 (13) (25)
Service and management fees 4 4 1 - large
Other non-risk fee income 104 97 106 7 (2)
Total fees and commissions 1,219 1,281 1,356 (5) (10)
Wealth management and insurance income
Life insurance and funds management net operating income 694 643 573 8 21
General insurance premiums less claims incurred 75 95 57 (21) 32
Total wealth management and insurance income 769 738 630 4 22
Trading income1
Foreign exchange income 224 48 659 large (66)
Other trading securities 236 241 (47) (2) large
Total trading income 460 289 612 59 (25)
Other income
Dividends received 9 11 10 (18) (10)
Rental income 3 3 2 - 50
Net gain/(loss) on ineffective hedges 10 (4) 7 large 43
Hedging overseas operations 17 44 (24) (61) 171Net gain/(loss) on derivatives held for risk management purposes2 4 (37) 91 111 (96)
Gain/(loss) on disposal of assets 25 (9) 1 large large
Net gain/(loss) on f inancial instruments designated at fair value 29 40 (40) (28) 173
Other 23 (26) (116) 188 120
Total other income 120 22 (69) large large
Total non-interest income 2,568 2,330 2,529 10 2
1 Trading income primarily includes earnings from our WIB Markets and Pacific Banking businesses as well as our Treasury foreign
exchange operations in Australia and New Zealand. 2 Income from derivatives held for risk management purposes primarily comprises net gains/losses on realised and unrealised hedges
on New Zealand future retail earnings and net gains/losses on the hedge of the 2003 Trust Preferred Securities.
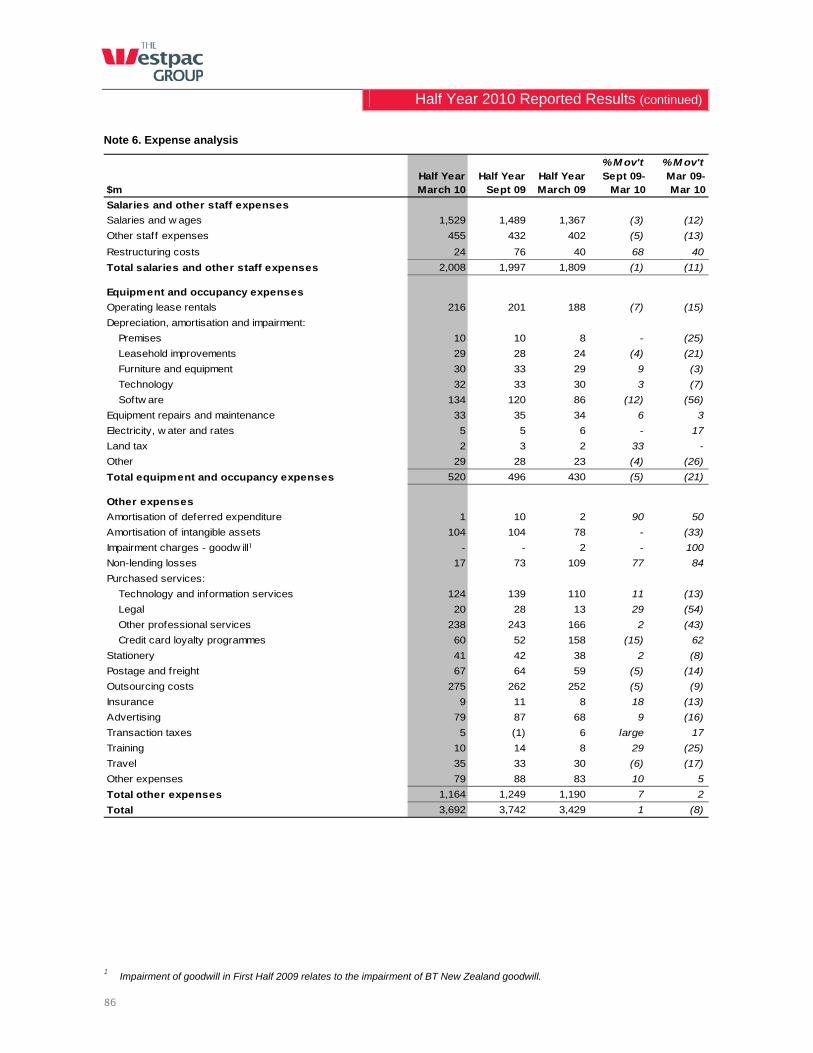
Half Year 2010 Reported Results (continued)
86
Note 6. Expense analysis
% M ov't % M ov't
$mHalf YearMarch 10
Half YearSept 09
Half YearMarch 09
Sept 09- Mar 10
Mar 09-Mar 10
Salaries and other staff expenses
Salaries and w ages 1,529 1,489 1,367 (3) (12)
Other staff expenses 455 432 402 (5) (13)
Restructuring costs 24 76 40 68 40
Total salaries and other staff expenses 2,008 1,997 1,809 (1) (11)
Equipment and occupancy expenses
Operating lease rentals 216 201 188 (7) (15)
Depreciation, amortisation and impairment:
Premises 10 10 8 - (25)
Leasehold improvements 29 28 24 (4) (21)
Furniture and equipment 30 33 29 9 (3)
Technology 32 33 30 3 (7)
Softw are 134 120 86 (12) (56)
Equipment repairs and maintenance 33 35 34 6 3
Electricity, w ater and rates 5 5 6 - 17
Land tax 2 3 2 33 -
Other 29 28 23 (4) (26)
Total equipment and occupancy expenses 520 496 430 (5) (21)
Other expenses
Amortisation of deferred expenditure 1 10 2 90 50
Amortisation of intangible assets 104 104 78 - (33)
Impairment charges - goodw ill1 - - 2 - 100
Non-lending losses 17 73 109 77 84
Purchased services:
Technology and information services 124 139 110 11 (13)
Legal 20 28 13 29 (54)
Other professional services 238 243 166 2 (43)
Credit card loyalty programmes 60 52 158 (15) 62
Stationery 41 42 38 2 (8)
Postage and freight 67 64 59 (5) (14)
Outsourcing costs 275 262 252 (5) (9)
Insurance 9 11 8 18 (13)
Advertising 79 87 68 9 (16)
Transaction taxes 5 (1) 6 large 17
Training 10 14 8 29 (25)
Travel 35 33 30 (6) (17)
Other expenses 79 88 83 10 5
Total other expenses 1,164 1,249 1,190 7 2
Total 3,692 3,742 3,429 1 (8)
1 Impairment of goodwill in First Half 2009 relates to the impairment of BT New Zealand goodwill.
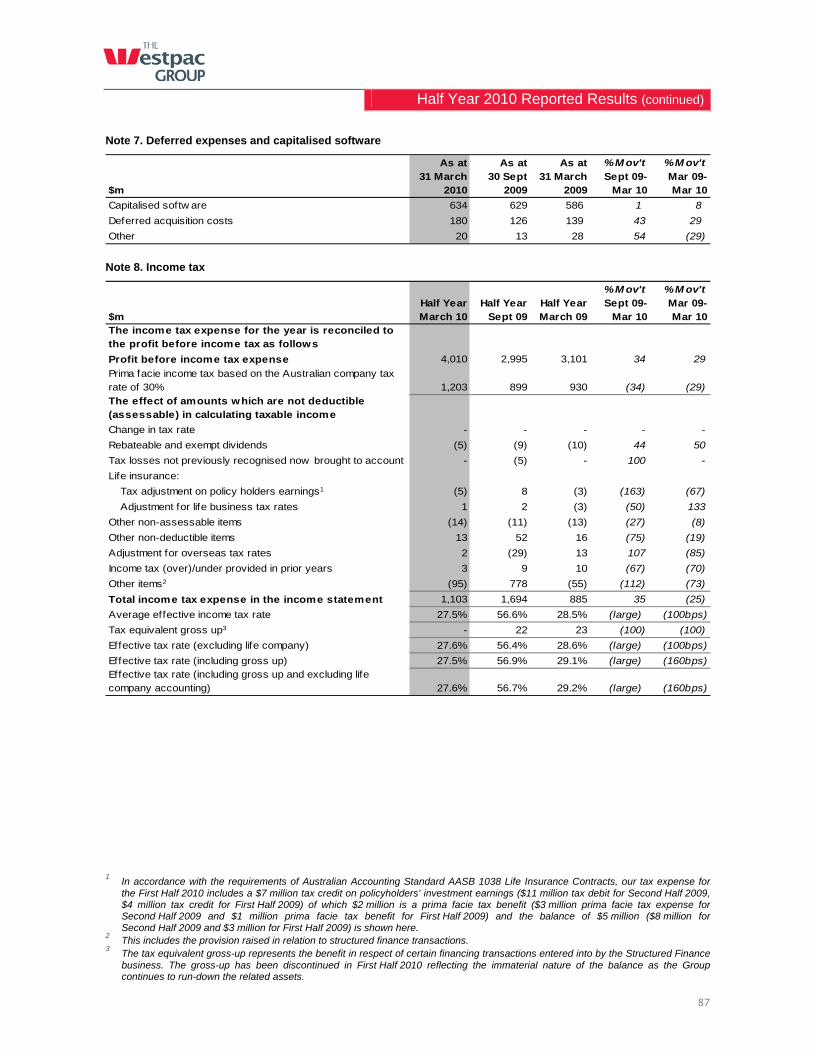
Half Year 2010 Reported Results (continued)
87
Note 7. Deferred expenses and capitalised software
As at As at As at % M ov't % M ov't
$m31 March
201030 Sept
200931 March
2009Sept 09-
Mar 10Mar 09-Mar 10
Capitalised softw are 634 629 586 1 8
Deferred acquisition costs 180 126 139 43 29
Other 20 13 28 54 (29)
Note 8. Income tax
% M ov't % M ov't
$mHalf YearMarch 10
Half YearSept 09
Half YearMarch 09
Sept 09- Mar 10
Mar 09-Mar 10
The income tax expense for the year is reconciled to the profit before income tax as follows
Profit before income tax expense 4,010 2,995 3,101 34 29
Prima facie income tax based on the Australian company tax rate of 30% 1,203 899 930 (34) (29)The effect of amounts which are not deductible (assessable) in calculating taxable income
Change in tax rate - - - - -
Rebateable and exempt dividends (5) (9) (10) 44 50
Tax losses not previously recognised now brought to account - (5) - 100 -
Life insurance:
Tax adjustment on policy holders earnings1 (5) 8 (3) (163) (67)
Adjustment for life business tax rates 1 2 (3) (50) 133
Other non-assessable items (14) (11) (13) (27) (8)
Other non-deductible items 13 52 16 (75) (19)
Adjustment for overseas tax rates 2 (29) 13 107 (85)
Income tax (over)/under provided in prior years 3 9 10 (67) (70)
Other items2 (95) 778 (55) (112) (73)
Total income tax expense in the income statement 1,103 1,694 885 35 (25)
Average effective income tax rate 27.5% 56.6% 28.5% (large) (100bps)
Tax equivalent gross up3 - 22 23 (100) (100)
Effective tax rate (excluding life company) 27.6% 56.4% 28.6% (large) (100bps)
Effective tax rate (including gross up) 27.5% 56.9% 29.1% (large) (160bps) Effective tax rate (including gross up and excluding life company accounting) 27.6% 56.7% 29.2% (large) (160bps)
1 In accordance with the requirements of Australian Accounting Standard AASB 1038 Life Insurance Contracts, our tax expense for
the First Half 2010 includes a $7 million tax credit on policyholders’ investment earnings ($11 million tax debit for Second Half 2009, $4 million tax credit for First Half 2009) of which $2 million is a prima facie tax benefit ($3 million prima facie tax expense for Second Half 2009 and $1 million prima facie tax benefit for First Half 2009) and the balance of $5 million ($8 million for Second Half 2009 and $3 million for First Half 2009) is shown here.
2 This includes the provision raised in relation to structured finance transactions.
3 The tax equivalent gross-up represents the benefit in respect of certain financing transactions entered into by the Structured Finance
business. The gross-up has been discontinued in First Half 2010 reflecting the immaterial nature of the balance as the Group continues to run-down the related assets.
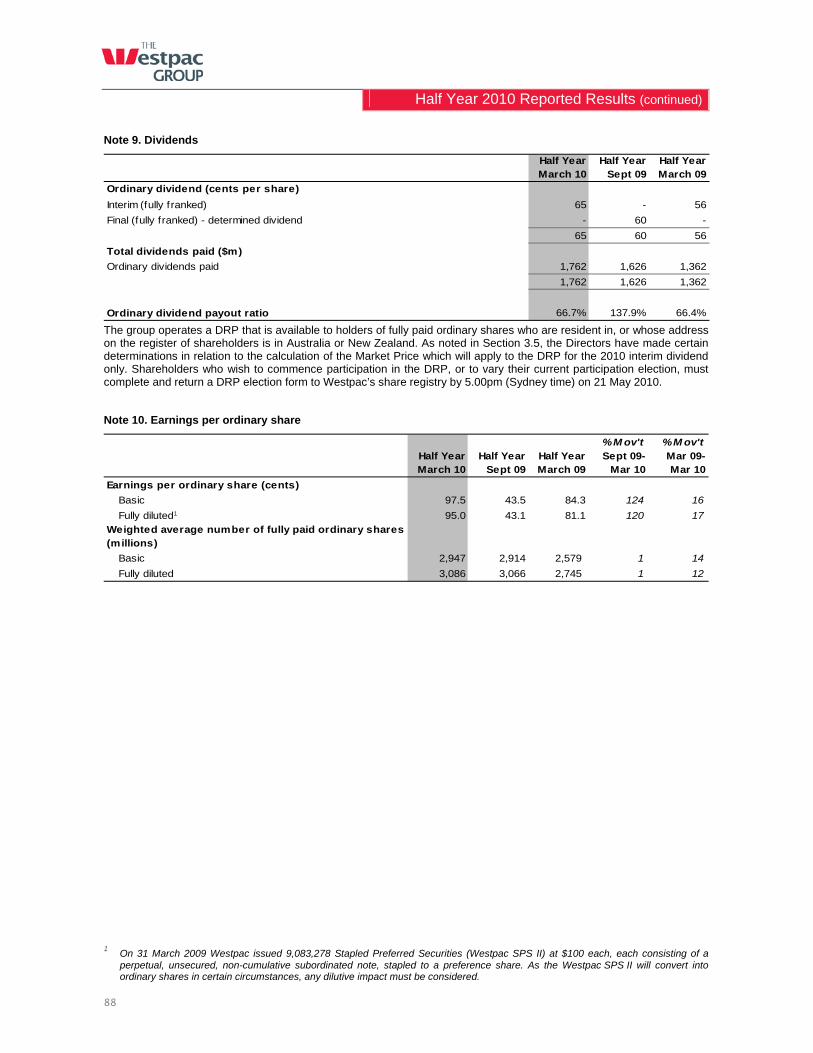
Half Year 2010 Reported Results (continued)
88
Note 9. Dividends
Half YearMarch 10
Half YearSept 09
Half YearMarch 09
Ordinary dividend (cents per share)
Interim (fully franked) 65 - 56
Final (fully franked) - determined dividend - 60 -
65 60 56
Total dividends paid ($m)
Ordinary dividends paid 1,762 1,626 1,362
1,762 1,626 1,362
Ordinary dividend payout ratio 66.7% 137.9% 66.4% The group operates a DRP that is available to holders of fully paid ordinary shares who are resident in, or whose address on the register of shareholders is in Australia or New Zealand. As noted in Section 3.5, the Directors have made certain determinations in relation to the calculation of the Market Price which will apply to the DRP for the 2010 interim dividend only. Shareholders who wish to commence participation in the DRP, or to vary their current participation election, must complete and return a DRP election form to Westpac’s share registry by 5.00pm (Sydney time) on 21 May 2010.
Note 10. Earnings per ordinary share
% M ov't % M ov'tHalf YearMarch 10
Half YearSept 09
Half YearMarch 09
Sept 09- Mar 10
Mar 09-Mar 10
Earnings per ordinary share (cents)
Basic 97.5 43.5 84.3 124 16
Fully diluted1 95.0 43.1 81.1 120 17
Weighted average number of fully paid ordinary shares (millions)
Basic 2,947 2,914 2,579 1 14
Fully diluted 3,086 3,066 2,745 1 12
1 On 31 March 2009 Westpac issued 9,083,278 Stapled Preferred Securities (Westpac SPS II) at $100 each, each consisting of a
perpetual, unsecured, non-cumulative subordinated note, stapled to a preference share. As the Westpac SPS II will convert into ordinary shares in certain circumstances, any dilutive impact must be considered.
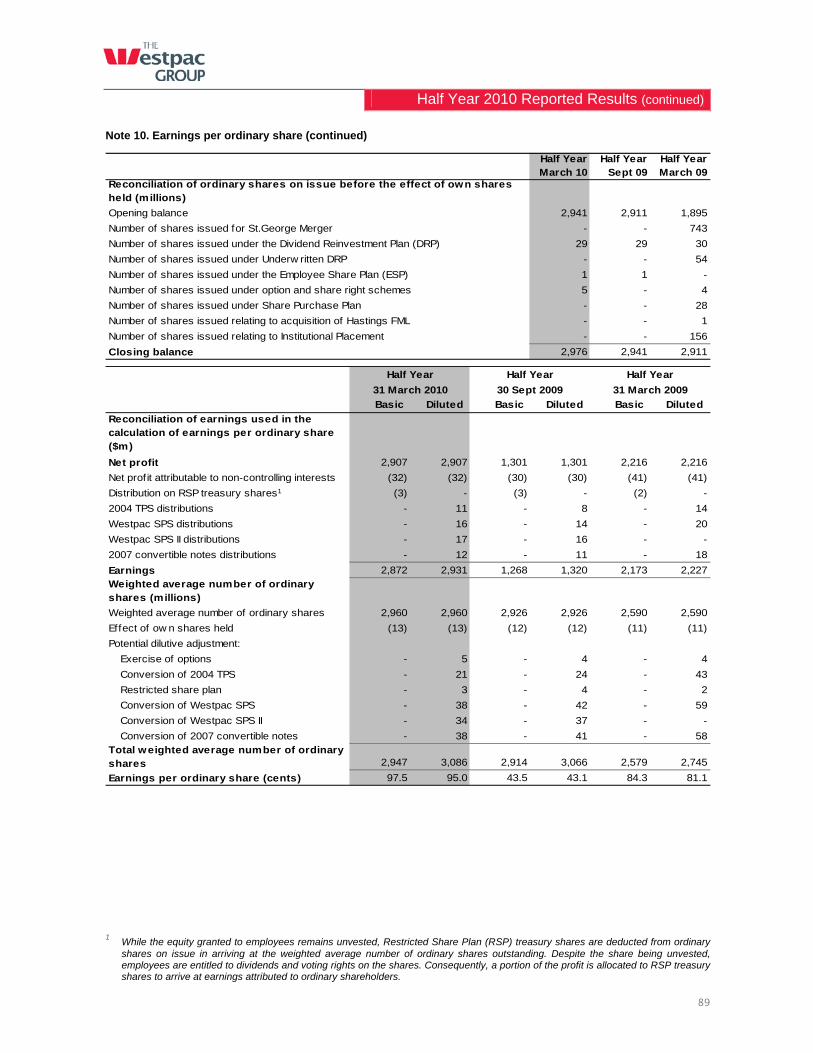
Half Year 2010 Reported Results (continued)
89
Note 10. Earnings per ordinary share (continued)
Half YearMarch 10
Half YearSept 09
Half YearMarch 09
Opening balance 2,941 2,911 1,895
Number of shares issued for St.George Merger - - 743
29 29 30
Number of shares issued under Underw ritten DRP - - 54
1 1 -
5 - 4
Number of shares issued under Share Purchase Plan - - 28
- - 1
Number of shares issued relating to Institutional Placement - - 156
Closing balance 2,976 2,941 2,911
Number of shares issued under the Dividend Reinvestment Plan (DRP)
Number of shares issued under option and share right schemes
Number of shares issued relating to acquisition of Hastings FML
Reconciliation of ordinary shares on issue before the effect of own shares held (millions)
Number of shares issued under the Employee Share Plan (ESP)
Basic Diluted Basic Diluted Basic Diluted
Reconciliation of earnings used in the calculation of earnings per ordinary share ($m)
Net profit 2,907 2,907 1,301 1,301 2,216 2,216
Net prof it attributable to non-controlling interests (32) (32) (30) (30) (41) (41)
Distribution on RSP treasury shares1 (3) - (3) - (2) -
2004 TPS distributions - 11 - 8 - 14
Westpac SPS distributions - 16 - 14 - 20
Westpac SPS II distributions - 17 - 16 - -
2007 convertible notes distributions - 12 - 11 - 18
Earnings 2,872 2,931 1,268 1,320 2,173 2,227Weighted average number of ordinary shares (millions)
Weighted average number of ordinary shares 2,960 2,960 2,926 2,926 2,590 2,590
Effect of ow n shares held (13) (13) (12) (12) (11) (11)
Potential dilutive adjustment:
Exercise of options - 5 - 4 - 4
Conversion of 2004 TPS - 21 - 24 - 43
Restricted share plan - 3 - 4 - 2
Conversion of Westpac SPS - 38 - 42 - 59
Conversion of Westpac SPS II - 34 - 37 - -
Conversion of 2007 convertible notes - 38 - 41 - 58Total weighted average number of ordinary shares 2,947 3,086 2,914 3,066 2,579 2,745
Earnings per ordinary share (cents) 97.5 95.0 43.5 43.1 84.3 81.1
30 Sept 2009 31 March 2009
Half Year
31 March 2010
Half YearHalf Year
1 While the equity granted to employees remains unvested, Restricted Share Plan (RSP) treasury shares are deducted from ordinary
shares on issue in arriving at the weighted average number of ordinary shares outstanding. Despite the share being unvested, employees are entitled to dividends and voting rights on the shares. Consequently, a portion of the profit is allocated to RSP treasury shares to arrive at earnings attributed to ordinary shareholders.
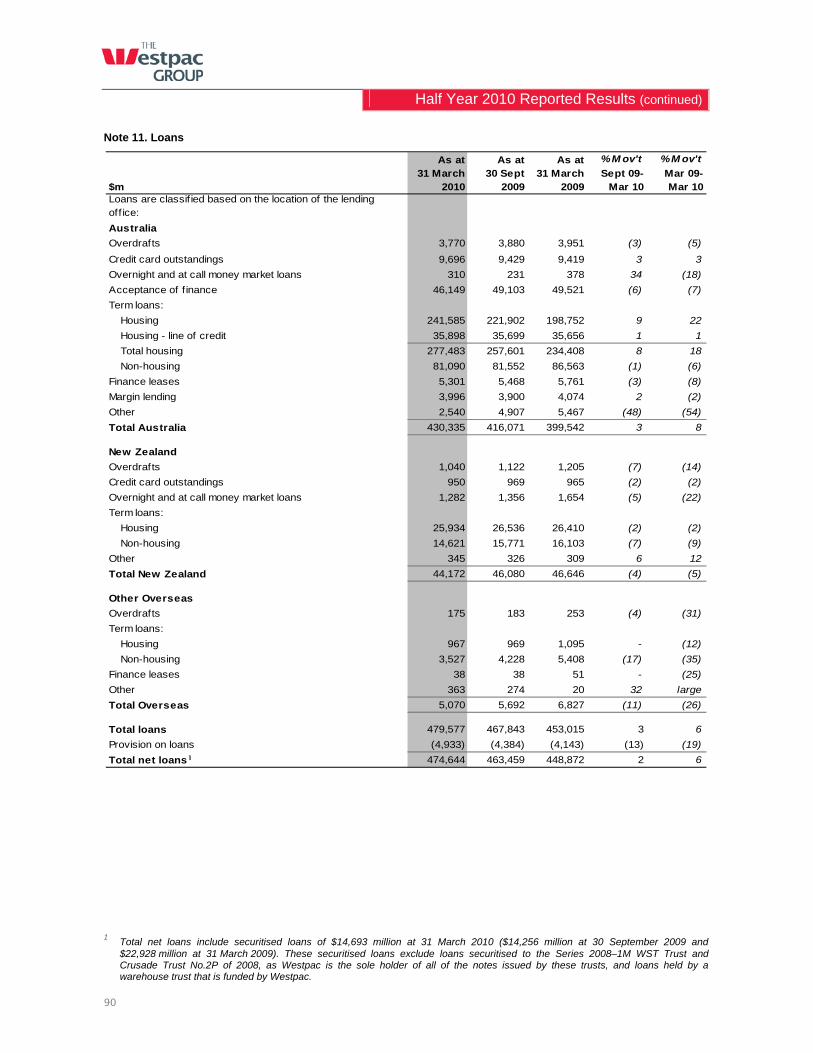
Half Year 2010 Reported Results (continued)
90
Note 11. Loans
As at As at As at % M ov't % M ov't
$m31 March
201030 Sept
200931 March
2009Sept 09-
Mar 10Mar 09-Mar 10
Loans are classif ied based on the location of the lending off ice:
Australia
Overdrafts 3,770 3,880 3,951 (3) (5)
Credit card outstandings 9,696 9,429 9,419 3 3
Overnight and at call money market loans 310 231 378 34 (18)
Acceptance of finance 46,149 49,103 49,521 (6) (7)
Term loans:
Housing 241,585 221,902 198,752 9 22
Housing - line of credit 35,898 35,699 35,656 1 1
Total housing 277,483 257,601 234,408 8 18
Non-housing 81,090 81,552 86,563 (1) (6)
Finance leases 5,301 5,468 5,761 (3) (8)
Margin lending 3,996 3,900 4,074 2 (2)
Other 2,540 4,907 5,467 (48) (54)
Total Australia 430,335 416,071 399,542 3 8
New Zealand
Overdrafts 1,040 1,122 1,205 (7) (14)
Credit card outstandings 950 969 965 (2) (2)
Overnight and at call money market loans 1,282 1,356 1,654 (5) (22)
Term loans:
Housing 25,934 26,536 26,410 (2) (2)
Non-housing 14,621 15,771 16,103 (7) (9)
Other 345 326 309 6 12
Total New Zealand 44,172 46,080 46,646 (4) (5)
Other Overseas
Overdrafts 175 183 253 (4) (31)
Term loans:
Housing 967 969 1,095 - (12)
Non-housing 3,527 4,228 5,408 (17) (35)
Finance leases 38 38 51 - (25)
Other 363 274 20 32 large
Total Overseas 5,070 5,692 6,827 (11) (26)
Total loans 479,577 467,843 453,015 3 6
Provision on loans (4,933) (4,384) (4,143) (13) (19)
Total net loans1 474,644 463,459 448,872 2 6
1 Total net loans include securitised loans of $14,693 million at 31 March 2010 ($14,256 million at 30 September 2009 and
$22,928 million at 31 March 2009). These securitised loans exclude loans securitised to the Series 2008–1M WST Trust and Crusade Trust No.2P of 2008, as Westpac is the sole holder of all of the notes issued by these trusts, and loans held by a warehouse trust that is funded by Westpac.
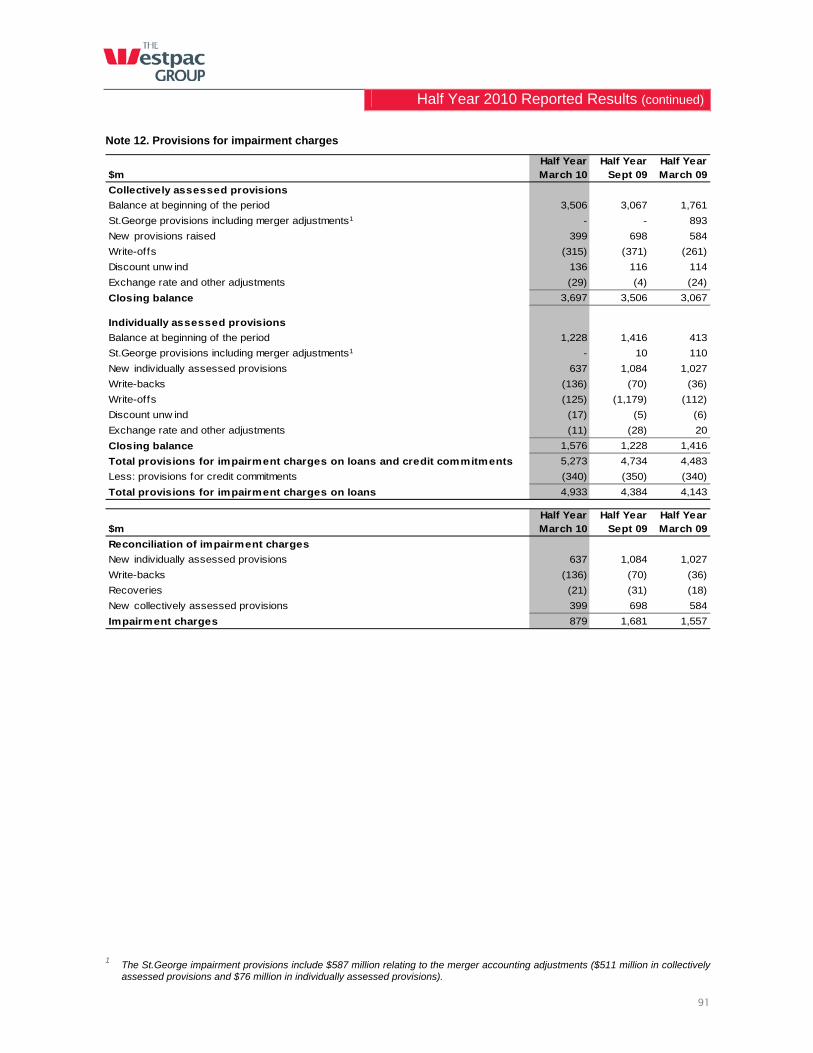
Half Year 2010 Reported Results (continued)
91
Note 12. Provisions for impairment charges
$mHalf YearMarch 10
Half YearSept 09
Half YearMarch 09
Collectively assessed provisions
Balance at beginning of the period 3,506 3,067 1,761
St.George provisions including merger adjustments1 - - 893
New provisions raised 399 698 584
Write-offs (315) (371) (261)
Discount unw ind 136 116 114
Exchange rate and other adjustments (29) (4) (24)
Closing balance 3,697 3,506 3,067
Individually assessed provisions
Balance at beginning of the period 1,228 1,416 413
St.George provisions including merger adjustments1 - 10 110
New individually assessed provisions 637 1,084 1,027
Write-backs (136) (70) (36)
Write-offs (125) (1,179) (112)
Discount unw ind (17) (5) (6)
Exchange rate and other adjustments (11) (28) 20
Closing balance 1,576 1,228 1,416
Total provisions for impairment charges on loans and credit commitments 5,273 4,734 4,483
Less: provisions for credit commitments (340) (350) (340)
Total provisions for impairment charges on loans 4,933 4,384 4,143
$mHalf YearMarch 10
Half YearSept 09
Half YearMarch 09
Reconciliation of impairment charges
New individually assessed provisions 637 1,084 1,027
Write-backs (136) (70) (36)
Recoveries (21) (31) (18)
New collectively assessed provisions 399 698 584
Impairment charges 879 1,681 1,557
1 The St.George impairment provisions include $587 million relating to the merger accounting adjustments ($511 million in collectively
assessed provisions and $76 million in individually assessed provisions).
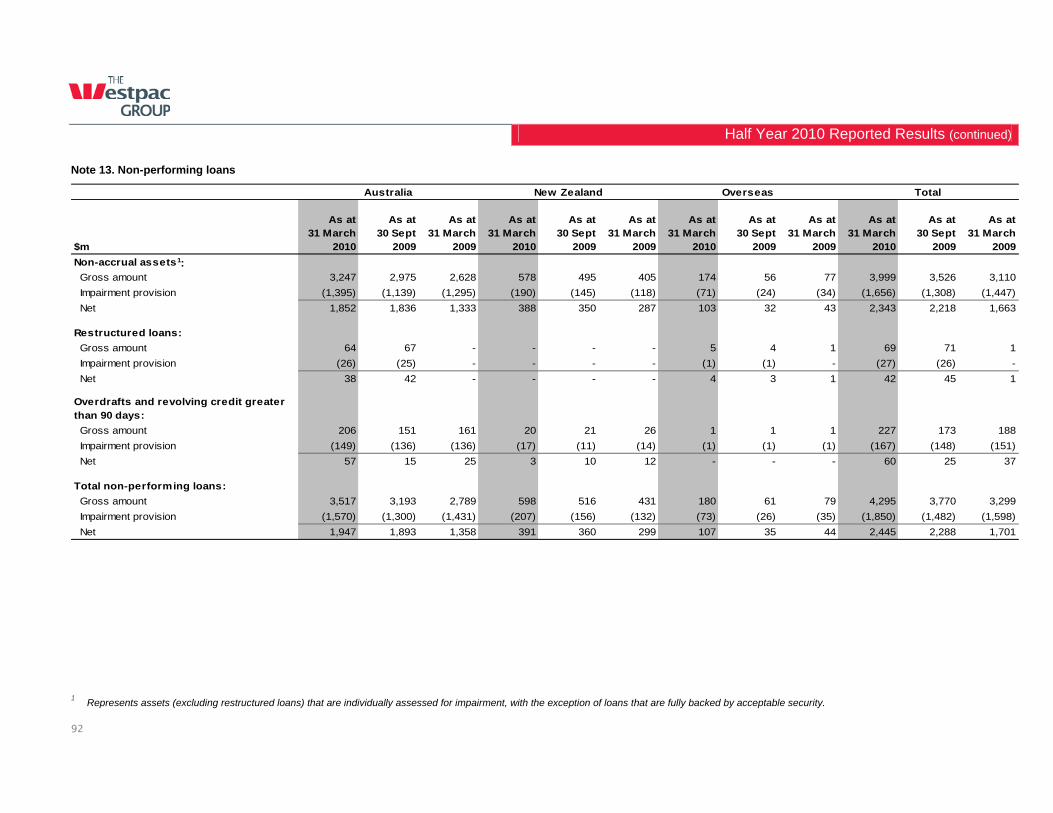
Half Year 2010 Reported Results (continued)
92
Note 13. Non-performing loans
As at As at As at As at As at As at As at As at As at As at As at As at
$m31 March
201030 Sept
200931 March
200931 March
201030 Sept
200931 March
200931 March
201030 Sept
200931 March
200931 March
201030 Sept
200931 March
2009
Non-accrual assets1: -
Gross amount 3,247 2,975 2,628 578 495 405 174 56 77 3,999 3,526 3,110
Impairment provision (1,395) (1,139) (1,295) (190) (145) (118) (71) (24) (34) (1,656) (1,308) (1,447)
Net 1,852 1,836 1,333 388 350 287 103 32 43 2,343 2,218 1,663
Restructured loans:
Gross amount 64 67 - - - - 5 4 1 69 71 1
Impairment provision (26) (25) - - - - (1) (1) - (27) (26) -
Net 38 42 - - - - 4 3 1 42 45 1
Overdrafts and revolving credit greater than 90 days:
Gross amount 206 151 161 20 21 26 1 1 1 227 173 188
Impairment provision (149) (136) (136) (17) (11) (14) (1) (1) (1) (167) (148) (151)
Net 57 15 25 3 10 12 - - - 60 25 37
Total non-performing loans:
Gross amount 3,517 3,193 2,789 598 516 431 180 61 79 4,295 3,770 3,299
Impairment provision (1,570) (1,300) (1,431) (207) (156) (132) (73) (26) (35) (1,850) (1,482) (1,598)
Net 1,947 1,893 1,358 391 360 299 107 35 44 2,445 2,288 1,701
Australia New Zealand Overseas Total
1 Represents assets (excluding restructured loans) that are individually assessed for impairment, with the exception of loans that are fully backed by acceptable security.
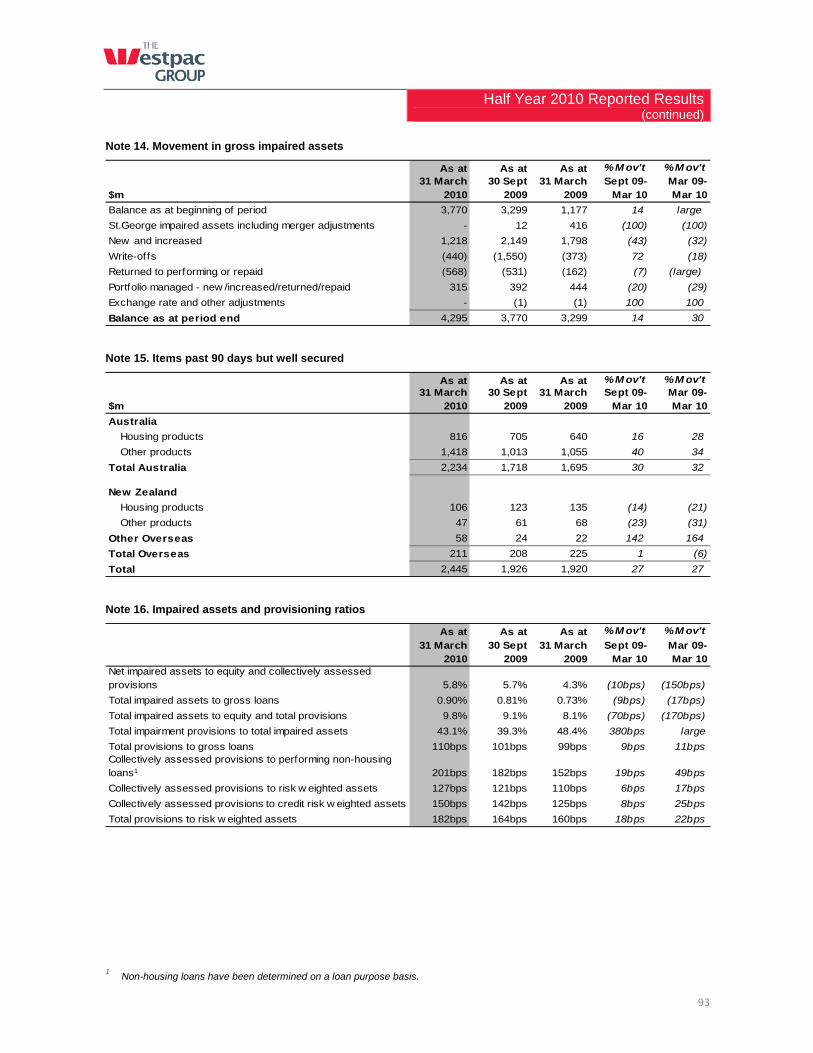
Half Year 2010 Reported Results (continued)
93
Note 14. Movement in gross impaired assets
As at As at As at % M ov't % M ov't
$m31 March
201030 Sept
200931 March
2009Sept 09-
Mar 10Mar 09-Mar 10
Balance as at beginning of period 3,770 3,299 1,177 14 large
St.George impaired assets including merger adjustments - 12 416 (100) (100)
New and increased 1,218 2,149 1,798 (43) (32)
Write-offs (440) (1,550) (373) 72 (18)
Returned to performing or repaid (568) (531) (162) (7) (large)
Portfolio managed - new /increased/returned/repaid 315 392 444 (20) (29)
Exchange rate and other adjustments - (1) (1) 100 100
Balance as at period end 4,295 3,770 3,299 14 30
Note 15. Items past 90 days but well secured
As at As at As at % M ov't % M ov't
$m31 March
201030 Sept
200931 March
2009Sept 09-
Mar 10Mar 09-Mar 10
Australia
Housing products 816 705 640 16 28
Other products 1,418 1,013 1,055 40 34
Total Australia 2,234 1,718 1,695 30 32
New Zealand
Housing products 106 123 135 (14) (21)
Other products 47 61 68 (23) (31)
Other Overseas 58 24 22 142 164
Total Overseas 211 208 225 1 (6)
Total 2,445 1,926 1,920 27 27
Note 16. Impaired assets and provisioning ratios
As at As at As at % M ov't % M ov't
31 March2010
30 Sept2009
31 March2009
Sept 09-Mar 10
Mar 09-Mar 10
Net impaired assets to equity and collectively assessed provisions 5.8% 5.7% 4.3% (10bps) (150bps)
Total impaired assets to gross loans 0.90% 0.81% 0.73% (9bps) (17bps)
Total impaired assets to equity and total provisions 9.8% 9.1% 8.1% (70bps) (170bps)
Total impairment provisions to total impaired assets 43.1% 39.3% 48.4% 380bps large
Total provisions to gross loans 110bps 101bps 99bps 9bps 11bpsCollectively assessed provisions to performing non-housing loans1 201bps 182bps 152bps 19bps 49bps
Collectively assessed provisions to risk w eighted assets 127bps 121bps 110bps 6bps 17bps
Collectively assessed provisions to credit risk w eighted assets 150bps 142bps 125bps 8bps 25bps
Total provisions to risk w eighted assets 182bps 164bps 160bps 18bps 22bps
1 Non-housing loans have been determined on a loan purpose basis.
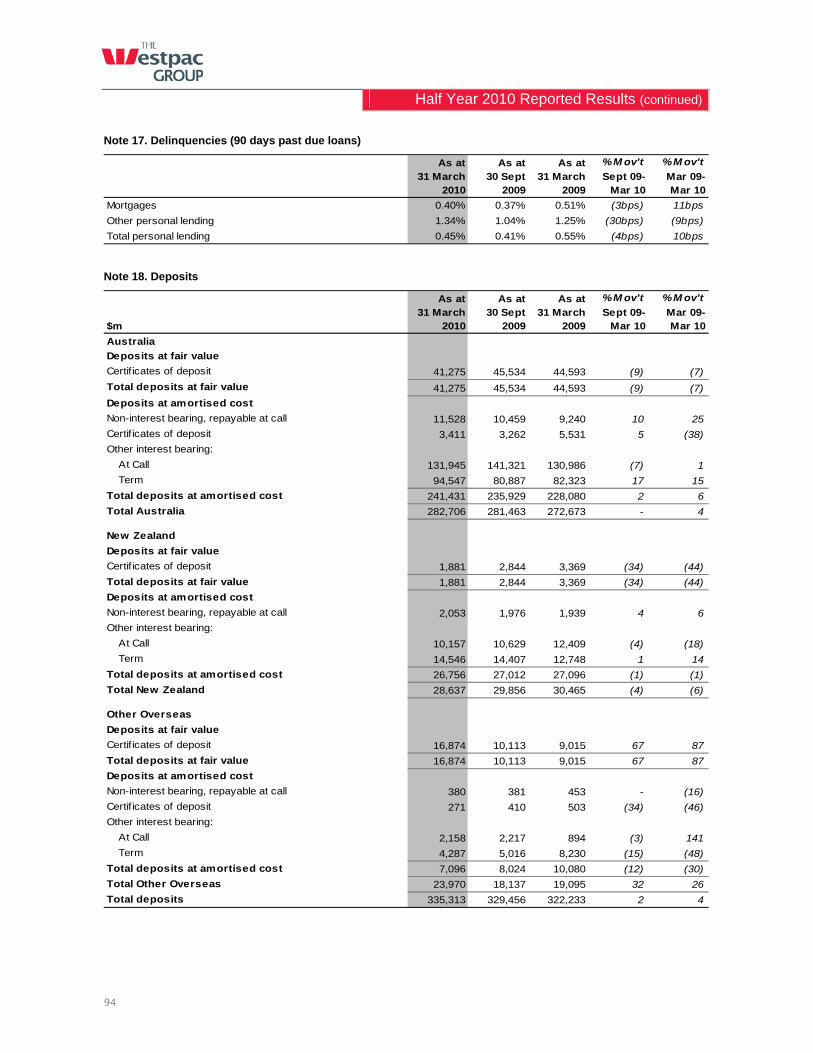
Half Year 2010 Reported Results (continued)
94
Note 17. Delinquencies (90 days past due loans)
As at As at As at % M ov't % M ov't
31 March2010
30 Sept2009
31 March2009
Sept 09-Mar 10
Mar 09-Mar 10
Mortgages 0.40% 0.37% 0.51% (3bps) 11bps
Other personal lending 1.34% 1.04% 1.25% (30bps) (9bps)
Total personal lending 0.45% 0.41% 0.55% (4bps) 10bps
Note 18. Deposits
As at As at As at % M ov't % M ov't
$m31 March
201030 Sept
200931 March
2009Sept 09-
Mar 10Mar 09-Mar 10
Australia
Deposits at fair value
Certif icates of deposit 41,275 45,534 44,593 (9) (7)
Total deposits at fair value 41,275 45,534 44,593 (9) (7)
Deposits at amortised cost
Non-interest bearing, repayable at call 11,528 10,459 9,240 10 25
Certif icates of deposit 3,411 3,262 5,531 5 (38)
Other interest bearing:
At Call 131,945 141,321 130,986 (7) 1
Term 94,547 80,887 82,323 17 15
Total deposits at amortised cost 241,431 235,929 228,080 2 6
Total Australia 282,706 281,463 272,673 - 4
New Zealand
Deposits at fair value
Certif icates of deposit 1,881 2,844 3,369 (34) (44)
Total deposits at fair value 1,881 2,844 3,369 (34) (44)
Deposits at amortised cost
Non-interest bearing, repayable at call 2,053 1,976 1,939 4 6
Other interest bearing:
At Call 10,157 10,629 12,409 (4) (18)
Term 14,546 14,407 12,748 1 14
Total deposits at amortised cost 26,756 27,012 27,096 (1) (1)
Total New Zealand 28,637 29,856 30,465 (4) (6)
Other Overseas
Deposits at fair value
Certif icates of deposit 16,874 10,113 9,015 67 87
Total deposits at fair value 16,874 10,113 9,015 67 87
Deposits at amortised cost
Non-interest bearing, repayable at call 380 381 453 - (16)
Certif icates of deposit 271 410 503 (34) (46)
Other interest bearing:
At Call 2,158 2,217 894 (3) 141
Term 4,287 5,016 8,230 (15) (48)
Total deposits at amortised cost 7,096 8,024 10,080 (12) (30)
Total Other Overseas 23,970 18,137 19,095 32 26
Total deposits 335,313 329,456 322,233 2 4
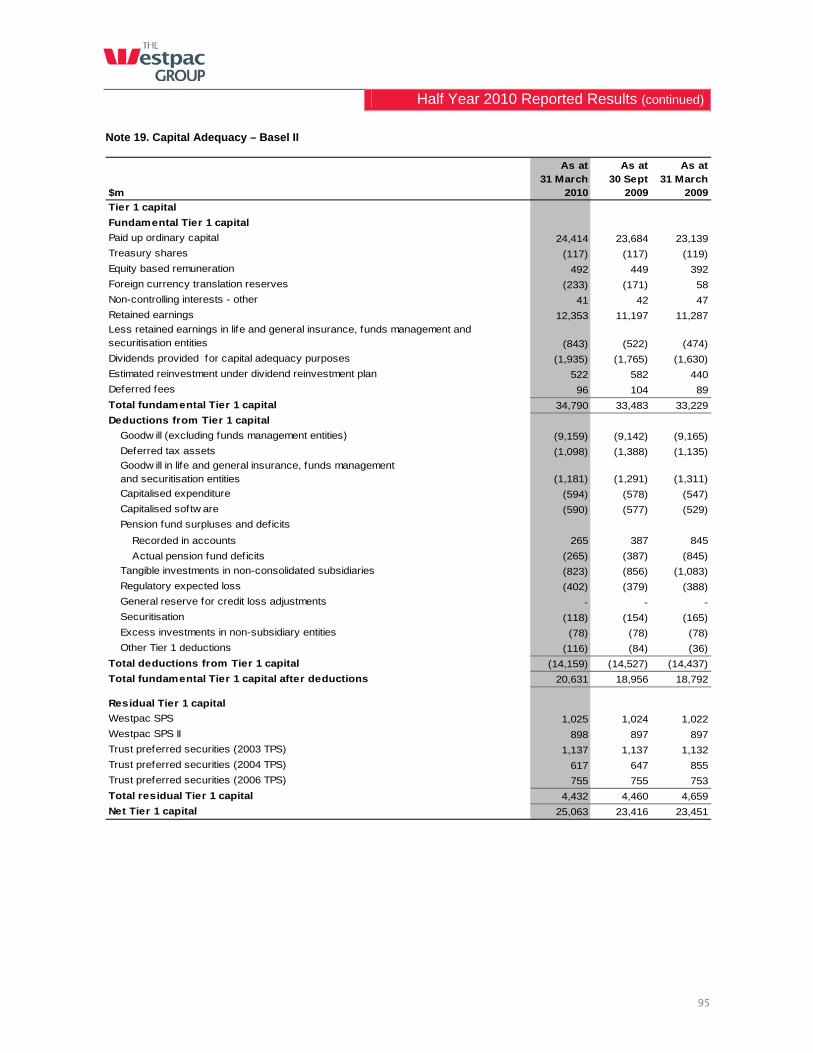
Half Year 2010 Reported Results (continued)
95
Note 19. Capital Adequacy – Basel II
As at As at As at
$m31 March
201030 Sept
200931 March
2009
Tier 1 capital
Fundamental Tier 1 capital
Paid up ordinary capital 24,414 23,684 23,139
Treasury shares (117) (117) (119)
Equity based remuneration 492 449 392
Foreign currency translation reserves (233) (171) 58
Non-controlling interests - other 41 42 47
Retained earnings 12,353 11,197 11,287Less retained earnings in life and general insurance, funds management and securitisation entities (843) (522) (474)
Dividends provided for capital adequacy purposes (1,935) (1,765) (1,630)
Estimated reinvestment under dividend reinvestment plan 522 582 440
Deferred fees 96 104 89
Total fundamental Tier 1 capital 34,790 33,483 33,229
Deductions from Tier 1 capital
Goodw ill (excluding funds management entities) (9,159) (9,142) (9,165)
Deferred tax assets (1,098) (1,388) (1,135)Goodw ill in life and general insurance, funds managementand securitisation entities (1,181) (1,291) (1,311)
Capitalised expenditure (594) (578) (547)
Capitalised softw are (590) (577) (529)
Pension fund surpluses and deficits
Recorded in accounts 265 387 845
Actual pension fund deficits (265) (387) (845)
Tangible investments in non-consolidated subsidiaries (823) (856) (1,083)
Regulatory expected loss (402) (379) (388)
General reserve for credit loss adjustments - - -
Securitisation (118) (154) (165)
Excess investments in non-subsidiary entities (78) (78) (78)
Other Tier 1 deductions (116) (84) (36)
Total deductions from Tier 1 capital (14,159) (14,527) (14,437)
Total fundamental Tier 1 capital after deductions 20,631 18,956 18,792
Residual Tier 1 capital
Westpac SPS 1,025 1,024 1,022
Westpac SPS II 898 897 897
Trust preferred securities (2003 TPS) 1,137 1,137 1,132
Trust preferred securities (2004 TPS) 617 647 855
Trust preferred securities (2006 TPS) 755 755 753
Total residual Tier 1 capital 4,432 4,460 4,659
Net Tier 1 capital 25,063 23,416 23,451
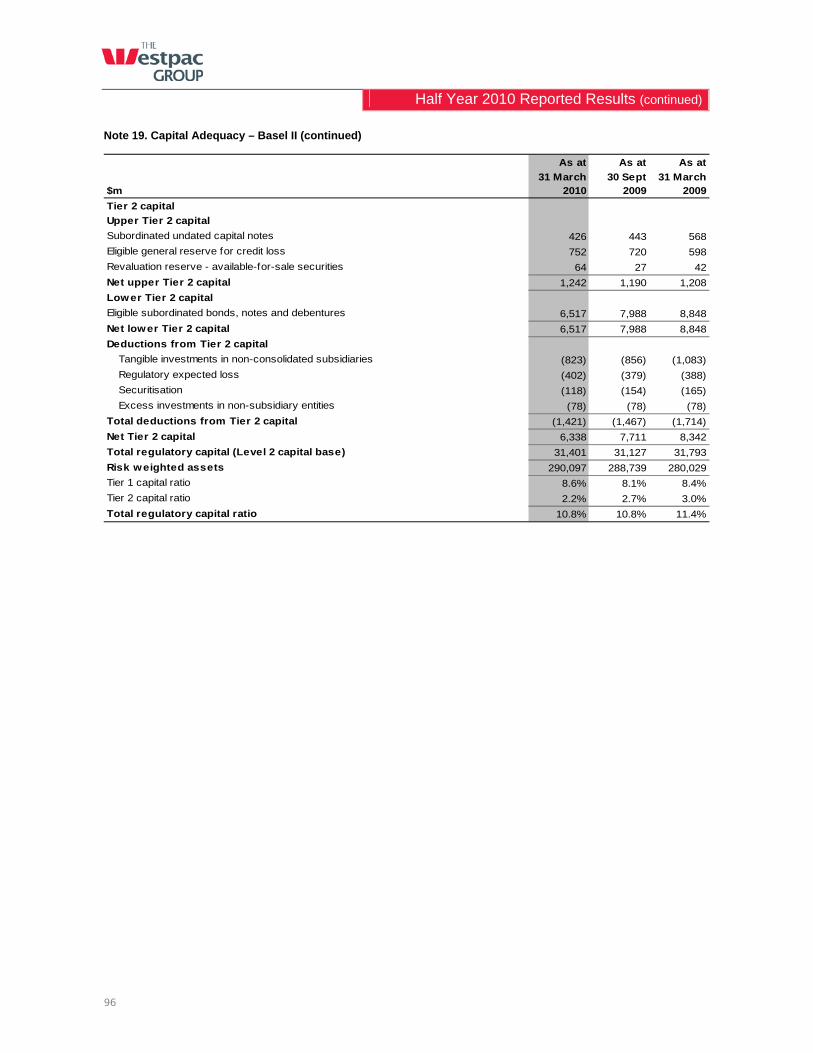
Half Year 2010 Reported Results (continued)
96
Note 19. Capital Adequacy – Basel II (continued)
As at As at As at
$m31 March
201030 Sept
200931 March
2009
Tier 2 capital
Upper Tier 2 capital
Subordinated undated capital notes 426 443 568
Eligible general reserve for credit loss 752 720 598
Revaluation reserve - available-for-sale securities 64 27 42
Net upper Tier 2 capital 1,242 1,190 1,208
Lower Tier 2 capital
Eligible subordinated bonds, notes and debentures 6,517 7,988 8,848
Net lower Tier 2 capital 6,517 7,988 8,848
Deductions from Tier 2 capital
Tangible investments in non-consolidated subsidiaries (823) (856) (1,083)
Regulatory expected loss (402) (379) (388)
Securitisation (118) (154) (165)
Excess investments in non-subsidiary entities (78) (78) (78)
Total deductions from Tier 2 capital (1,421) (1,467) (1,714)
Net Tier 2 capital 6,338 7,711 8,342
Total regulatory capital (Level 2 capital base) 31,401 31,127 31,793
Risk weighted assets 290,097 288,739 280,029
Tier 1 capital ratio 8.6% 8.1% 8.4%
Tier 2 capital ratio 2.2% 2.7% 3.0%
Total regulatory capital ratio 10.8% 10.8% 11.4%
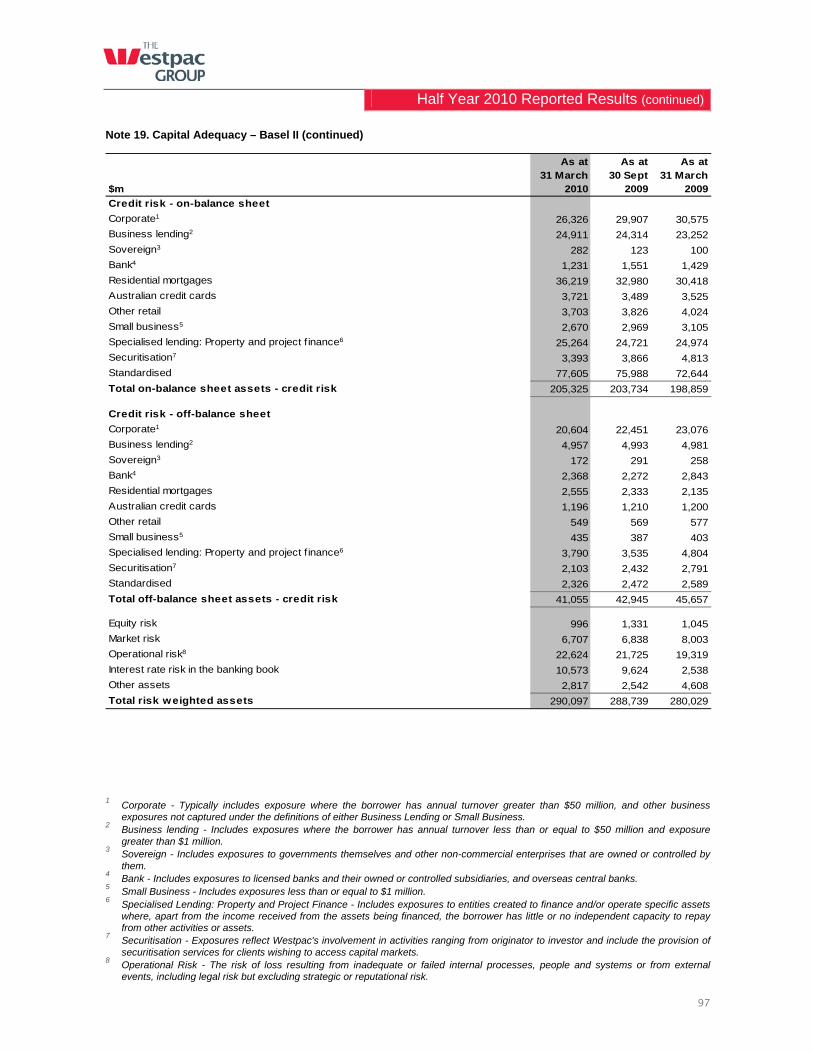
Half Year 2010 Reported Results (continued)
97
Note 19. Capital Adequacy – Basel II (continued)
As at As at As at
$m31 March
201030 Sept
200931 March
2009
Credit risk - on-balance sheet
Corporate1 26,326 29,907 30,575
Business lending2 24,911 24,314 23,252
Sovereign3 282 123 100
Bank4 1,231 1,551 1,429
Residential mortgages 36,219 32,980 30,418
Australian credit cards 3,721 3,489 3,525
Other retail 3,703 3,826 4,024
Small business5 2,670 2,969 3,105
Specialised lending: Property and project f inance6 25,264 24,721 24,974
Securitisation7 3,393 3,866 4,813
Standardised 77,605 75,988 72,644
Total on-balance sheet assets - credit risk 205,325 203,734 198,859
Credit risk - off-balance sheet
Corporate1 20,604 22,451 23,076
Business lending2 4,957 4,993 4,981
Sovereign3 172 291 258
Bank4 2,368 2,272 2,843
Residential mortgages 2,555 2,333 2,135
Australian credit cards 1,196 1,210 1,200
Other retail 549 569 577
Small business5 435 387 403
Specialised lending: Property and project f inance6 3,790 3,535 4,804
Securitisation7 2,103 2,432 2,791
Standardised 2,326 2,472 2,589
Total off-balance sheet assets - credit risk 41,055 42,945 45,657
Equity risk 996 1,331 1,045
Market risk 6,707 6,838 8,003
Operational risk8 22,624 21,725 19,319
Interest rate risk in the banking book 10,573 9,624 2,538
Other assets 2,817 2,542 4,608
Total risk weighted assets 290,097 288,739 280,029
1 Corporate - Typically includes exposure where the borrower has annual turnover greater than $50 million, and other business
exposures not captured under the definitions of either Business Lending or Small Business. 2 Business lending - Includes exposures where the borrower has annual turnover less than or equal to $50 million and exposure
greater than $1 million. 3 Sovereign - Includes exposures to governments themselves and other non-commercial enterprises that are owned or controlled by
them. 4 Bank - Includes exposures to licensed banks and their owned or controlled subsidiaries, and overseas central banks.
5 Small Business - Includes exposures less than or equal to $1 million.
6 Specialised Lending: Property and Project Finance - Includes exposures to entities created to finance and/or operate specific assets
where, apart from the income received from the assets being financed, the borrower has little or no independent capacity to repay from other activities or assets.
7 Securitisation - Exposures reflect Westpac's involvement in activities ranging from originator to investor and include the provision of
securitisation services for clients wishing to access capital markets. 8 Operational Risk - The risk of loss resulting from inadequate or failed internal processes, people and systems or from external
events, including legal risk but excluding strategic or reputational risk.
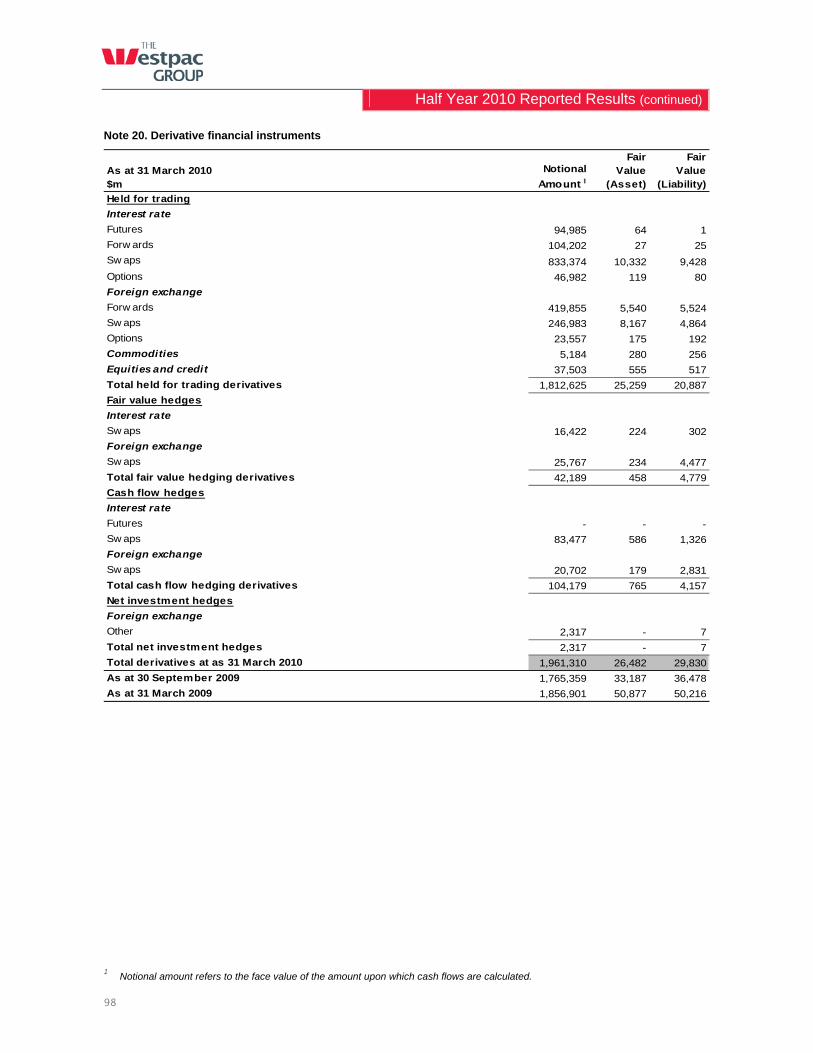
Half Year 2010 Reported Results (continued)
98
Note 20. Derivative financial instruments
As at 31 March 2010$m
Notional
Amount 1
Fair Value
(Asset)
Fair Value
(Liability)
Held for trading
Interest rate
Futures 94,985 64 1
Forw ards 104,202 27 25
Sw aps 833,374 10,332 9,428
Options 46,982 119 80
Foreign exchange
Forw ards 419,855 5,540 5,524
Sw aps 246,983 8,167 4,864
Options 23,557 175 192
Commodities 5,184 280 256
Equities and credit 37,503 555 517
Total held for trading derivatives 1,812,625 25,259 20,887
Fair value hedges
Interest rate
Sw aps 16,422 224 302
Foreign exchange
Sw aps 25,767 234 4,477
Total fair value hedging derivatives 42,189 458 4,779
Cash flow hedges
Interest rate
Futures - - -
Sw aps 83,477 586 1,326
Foreign exchange
Sw aps 20,702 179 2,831
Total cash flow hedging derivatives 104,179 765 4,157
Net investment hedges
Foreign exchange
Other 2,317 - 7
Total net investment hedges 2,317 - 7
Total derivatives at as 31 March 2010 1,961,310 26,482 29,830
As at 30 September 2009 1,765,359 33,187 36,478
As at 31 March 2009 1,856,901 50,877 50,216
1 Notional amount refers to the face value of the amount upon which cash flows are calculated.
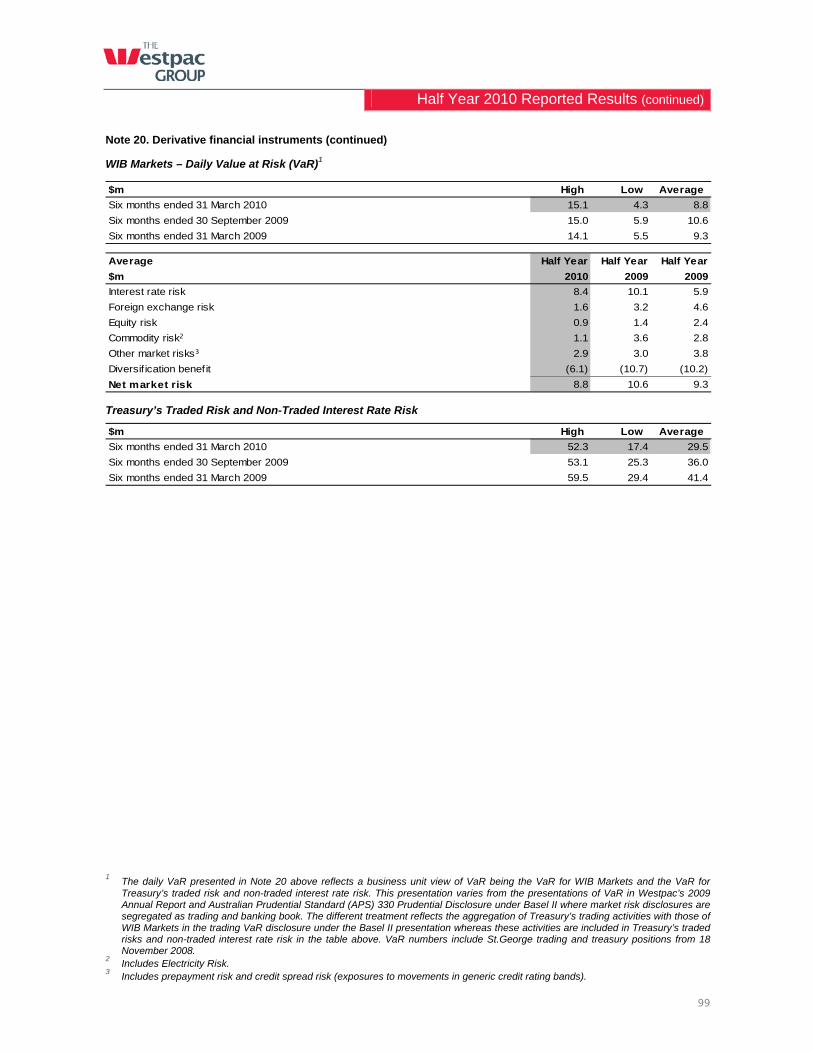
Half Year 2010 Reported Results (continued)
99
Note 20. Derivative financial instruments (continued)
WIB Markets – Daily Value at Risk (VaR)1
$m High Low Average
Six months ended 31 March 2010 15.1 4.3 8.8
Six months ended 30 September 2009 15.0 5.9 10.6
Six months ended 31 March 2009 14.1 5.5 9.3
Average Half Year Half Year Half Year
$m 2010 2009 2009
Interest rate risk 8.4 10.1 5.9
Foreign exchange risk 1.6 3.2 4.6
Equity risk 0.9 1.4 2.4
Commodity risk2 1.1 3.6 2.8
Other market risks3 2.9 3.0 3.8
Diversif ication benefit (6.1) (10.7) (10.2)
Net market risk 8.8 10.6 9.3
Treasury’s Traded Risk and Non-Traded Interest Rate Risk
$m High Low Average
Six months ended 31 March 2010 52.3 17.4 29.5
Six months ended 30 September 2009 53.1 25.3 36.0
Six months ended 31 March 2009 59.5 29.4 41.4
1 The daily VaR presented in Note 20 above reflects a business unit view of VaR being the VaR for WIB Markets and the VaR for
Treasury’s traded risk and non-traded interest rate risk. This presentation varies from the presentations of VaR in Westpac’s 2009 Annual Report and Australian Prudential Standard (APS) 330 Prudential Disclosure under Basel II where market risk disclosures are segregated as trading and banking book. The different treatment reflects the aggregation of Treasury’s trading activities with those of WIB Markets in the trading VaR disclosure under the Basel II presentation whereas these activities are included in Treasury’s traded risks and non-traded interest rate risk in the table above. VaR numbers include St.George trading and treasury positions from 18 November 2008.
2 Includes Electricity Risk.
3 Includes prepayment risk and credit spread risk (exposures to movements in generic credit rating bands).
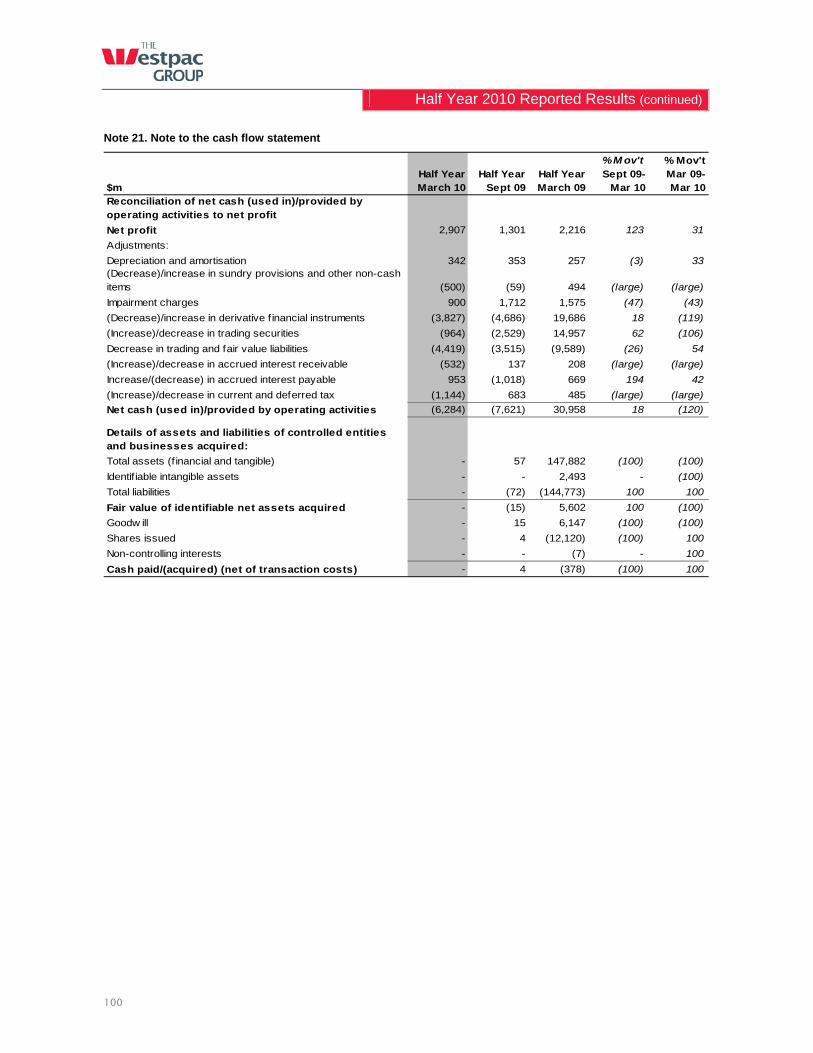
Half Year 2010 Reported Results (continued)
100
Note 21. Note to the cash flow statement
% M ov't % Mov't
$mHalf YearMarch 10
Half YearSept 09
Half YearMarch 09
Sept 09- Mar 10
Mar 09-Mar 10
Reconciliation of net cash (used in)/provided by operating activities to net profit
Net profit 2,907 1,301 2,216 123 31
Adjustments:
Depreciation and amortisation 342 353 257 (3) 33(Decrease)/increase in sundry provisions and other non-cash items (500) (59) 494 (large) (large)
Impairment charges 900 1,712 1,575 (47) (43)
(Decrease)/increase in derivative f inancial instruments (3,827) (4,686) 19,686 18 (119)
(Increase)/decrease in trading securities (964) (2,529) 14,957 62 (106)
Decrease in trading and fair value liabilities (4,419) (3,515) (9,589) (26) 54
(Increase)/decrease in accrued interest receivable (532) 137 208 (large) (large)
Increase/(decrease) in accrued interest payable 953 (1,018) 669 194 42
(Increase)/decrease in current and deferred tax (1,144) 683 485 (large) (large)
Net cash (used in)/provided by operating activities (6,284) (7,621) 30,958 18 (120)
Details of assets and liabilities of controlled entities and businesses acquired:
Total assets (f inancial and tangible) - 57 147,882 (100) (100)
Identif iable intangible assets - - 2,493 - (100)
Total liabilities - (72) (144,773) 100 100
Fair value of identifiable net assets acquired - (15) 5,602 100 (100)
Goodw ill - 15 6,147 (100) (100)
Shares issued - 4 (12,120) (100) 100
Non-controlling interests - - (7) - 100
Cash paid/(acquired) (net of transaction costs) - 4 (378) (100) 100
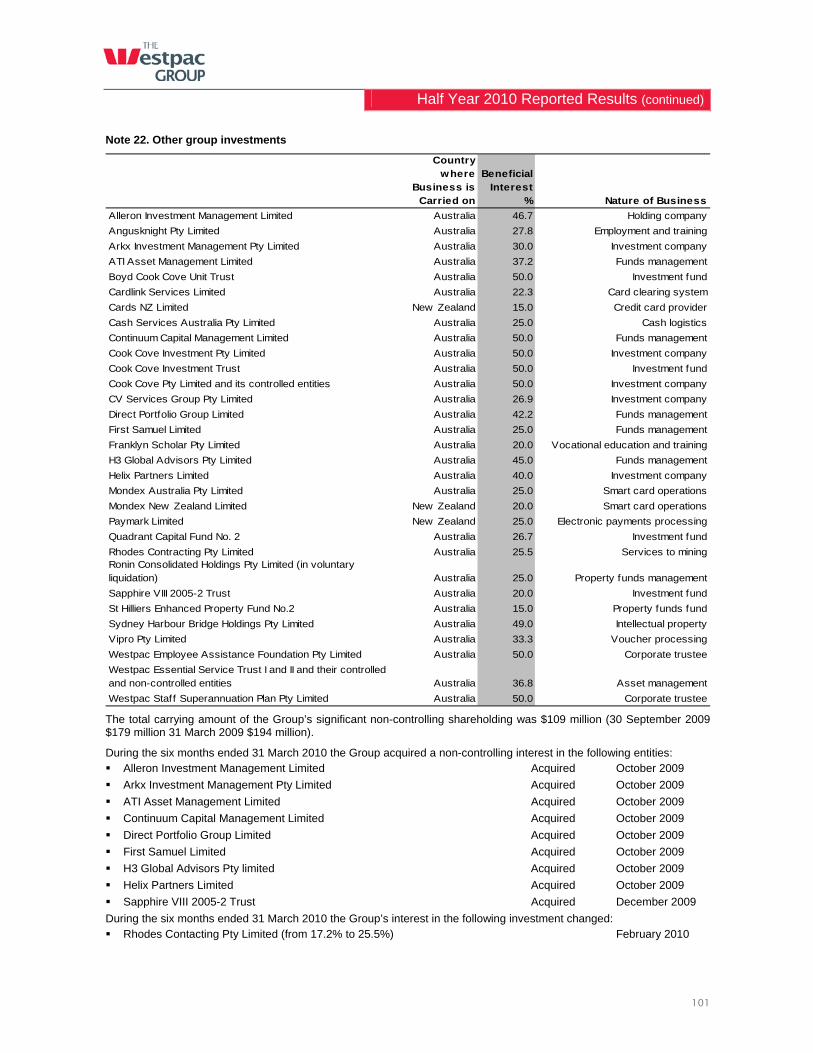
Half Year 2010 Reported Results (continued)
101
Note 22. Other group investments
Country where
Beneficial
Business is Interest Carried on %
Alleron Investment Management Limited Australia 46.7
Angusknight Pty Limited Australia 27.8
Arkx Investment Management Pty Limited Australia 30.0
ATI Asset Management Limited Australia 37.2
Boyd Cook Cove Unit Trust Australia 50.0
Cardlink Services Limited Australia 22.3
Cards NZ Limited New Zealand 15.0
Cash Services Australia Pty Limited Australia 25.0
Continuum Capital Management Limited Australia 50.0
Cook Cove Investment Pty Limited Australia 50.0
Cook Cove Investment Trust Australia 50.0
Cook Cove Pty Limited and its controlled entities Australia 50.0
CV Services Group Pty Limited Australia 26.9
Direct Portfolio Group Limited Australia 42.2
First Samuel Limited Australia 25.0
Franklyn Scholar Pty Limited Australia 20.0
H3 Global Advisors Pty Limited Australia 45.0
Helix Partners Limited Australia 40.0
Mondex Australia Pty Limited Australia 25.0
Mondex New Zealand Limited New Zealand 20.0
Paymark Limited New Zealand 25.0
Quadrant Capital Fund No. 2 Australia 26.7
Rhodes Contracting Pty Limited Australia 25.5Ronin Consolidated Holdings Pty Limited (in voluntary liquidation) Australia 25.0
Sapphire VIII 2005-2 Trust Australia 20.0
St Hilliers Enhanced Property Fund No.2 Australia 15.0
Sydney Harbour Bridge Holdings Pty Limited Australia 49.0
Vipro Pty Limited Australia 33.3
Westpac Employee Assistance Foundation Pty Limited Australia 50.0
Westpac Essential Service Trust I and II and their controlled and non-controlled entities Australia 36.8
Westpac Staff Superannuation Plan Pty Limited Australia 50.0
Funds management
Investment company
Corporate trustee
Asset management
Property funds management
Investment fund
Property funds fund
Intellectual property
Investment fund
Services to mining
Voucher processing
Funds management
Smart card operations
Smart card operations
Electronic payments processing
Investment company
Funds management
Funds management
Vocational education and training
Funds management
Investment company
Investment fund
Investment company
Holding company
Employment and training
Corporate trustee
Nature of Business
Investment company
Investment fund
Card clearing system
Credit card provider
Cash logistics
The total carrying amount of the Group’s significant non-controlling shareholding was $109 million (30 September 2009 $179 million 31 March 2009 $194 million).
During the six months ended 31 March 2010 the Group acquired a non-controlling interest in the following entities: Alleron Investment Management Limited Acquired October 2009
Arkx Investment Management Pty Limited Acquired October 2009
ATI Asset Management Limited Acquired October 2009
Continuum Capital Management Limited Acquired October 2009
Direct Portfolio Group Limited Acquired October 2009
First Samuel Limited Acquired October 2009
H3 Global Advisors Pty limited Acquired October 2009
Helix Partners Limited Acquired October 2009
Sapphire VIII 2005-2 Trust Acquired December 2009
During the six months ended 31 March 2010 the Group’s interest in the following investment changed: Rhodes Contacting Pty Limited (from 17.2% to 25.5%) February 2010
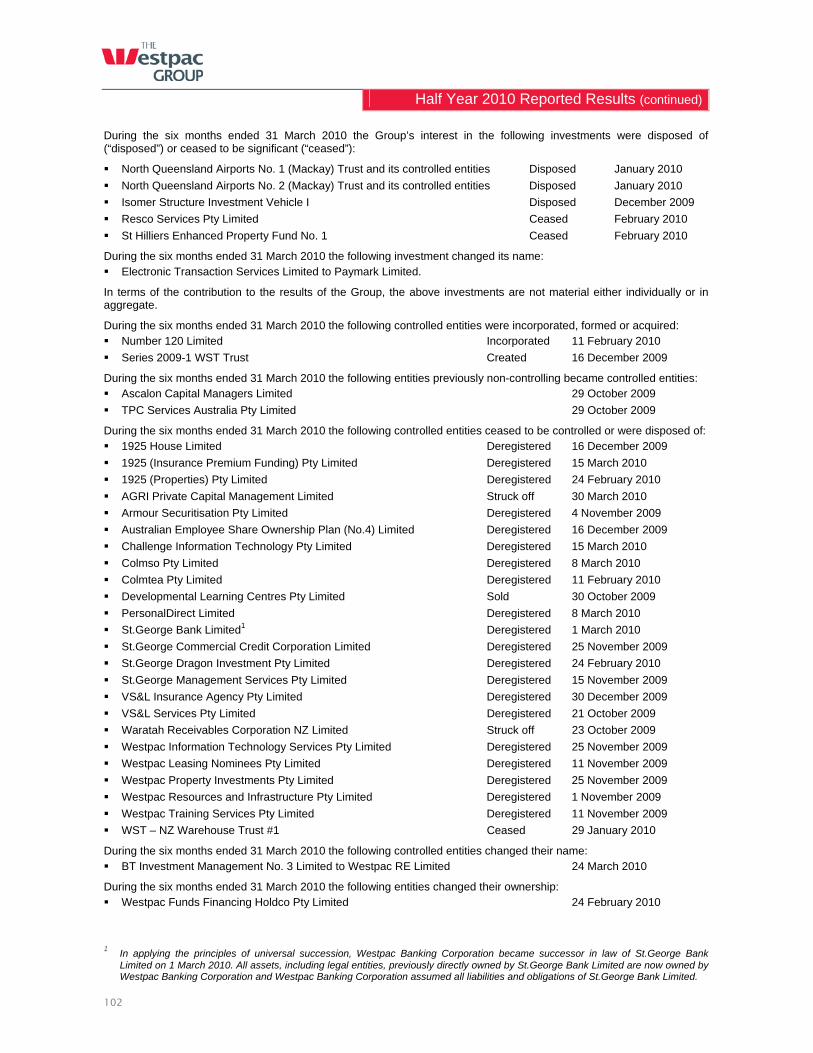
Half Year 2010 Reported Results (continued)
102
During the six months ended 31 March 2010 the Group’s interest in the following investments were disposed of (“disposed”) or ceased to be significant (“ceased”):
North Queensland Airports No. 1 (Mackay) Trust and its controlled entities Disposed January 2010
North Queensland Airports No. 2 (Mackay) Trust and its controlled entities Disposed January 2010
Isomer Structure Investment Vehicle I Disposed December 2009
Resco Services Pty Limited Ceased February 2010
St Hilliers Enhanced Property Fund No. 1 Ceased February 2010
During the six months ended 31 March 2010 the following investment changed its name: Electronic Transaction Services Limited to Paymark Limited.
In terms of the contribution to the results of the Group, the above investments are not material either individually or in aggregate.
During the six months ended 31 March 2010 the following controlled entities were incorporated, formed or acquired: Number 120 Limited Incorporated 11 February 2010
Series 2009-1 WST Trust Created 16 December 2009
During the six months ended 31 March 2010 the following entities previously non-controlling became controlled entities: Ascalon Capital Managers Limited 29 October 2009
TPC Services Australia Pty Limited 29 October 2009
During the six months ended 31 March 2010 the following controlled entities ceased to be controlled or were disposed of: 1925 House Limited Deregistered 16 December 2009
1925 (Insurance Premium Funding) Pty Limited Deregistered 15 March 2010
1925 (Properties) Pty Limited Deregistered 24 February 2010
AGRI Private Capital Management Limited Struck off 30 March 2010
Armour Securitisation Pty Limited Deregistered 4 November 2009
Australian Employee Share Ownership Plan (No.4) Limited Deregistered 16 December 2009
Challenge Information Technology Pty Limited Deregistered 15 March 2010
Colmso Pty Limited Deregistered 8 March 2010
Colmtea Pty Limited Deregistered 11 February 2010
Developmental Learning Centres Pty Limited Sold 30 October 2009
PersonalDirect Limited Deregistered 8 March 2010
St.George Bank Limited1 Deregistered 1 March 2010
St.George Commercial Credit Corporation Limited Deregistered 25 November 2009
St.George Dragon Investment Pty Limited Deregistered 24 February 2010
St.George Management Services Pty Limited Deregistered 15 November 2009
VS&L Insurance Agency Pty Limited Deregistered 30 December 2009
VS&L Services Pty Limited Deregistered 21 October 2009
Waratah Receivables Corporation NZ Limited Struck off 23 October 2009
Westpac Information Technology Services Pty Limited Deregistered 25 November 2009
Westpac Leasing Nominees Pty Limited Deregistered 11 November 2009
Westpac Property Investments Pty Limited Deregistered 25 November 2009
Westpac Resources and Infrastructure Pty Limited Deregistered 1 November 2009
Westpac Training Services Pty Limited Deregistered 11 November 2009
WST – NZ Warehouse Trust #1 Ceased 29 January 2010
During the six months ended 31 March 2010 the following controlled entities changed their name: BT Investment Management No. 3 Limited to Westpac RE Limited 24 March 2010
During the six months ended 31 March 2010 the following entities changed their ownership: Westpac Funds Financing Holdco Pty Limited 24 February 2010
1 In applying the principles of universal succession, Westpac Banking Corporation became successor in law of St.George Bank
Limited on 1 March 2010. All assets, including legal entities, previously directly owned by St.George Bank Limited are now owned by Westpac Banking Corporation and Westpac Banking Corporation assumed all liabilities and obligations of St.George Bank Limited.
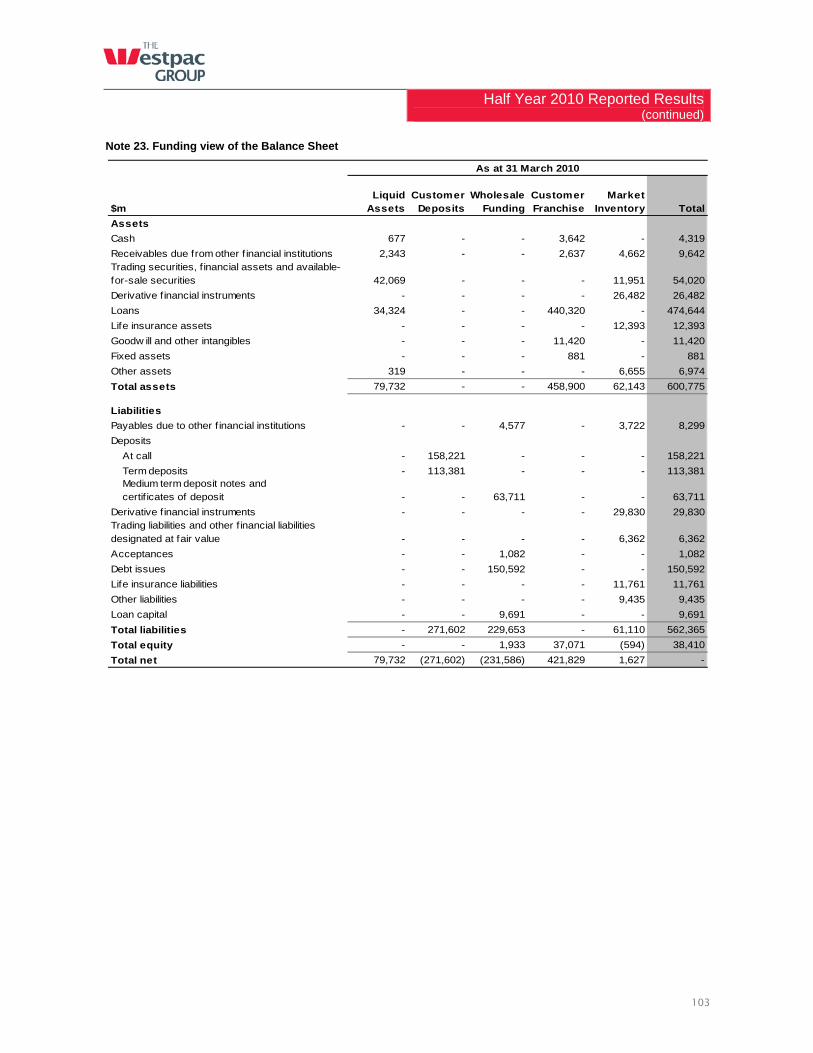
Half Year 2010 Reported Results (continued)
103
Note 23. Funding view of the Balance Sheet
$mLiquid
AssetsCustomer
DepositsWholesale
FundingCustomer Franchise
Market Inventory Total
Assets
Cash 677 - - 3,642 - 4,319
Receivables due from other f inancial institutions 2,343 - - 2,637 4,662 9,642Trading securities, f inancial assets and available-for-sale securities 42,069 - - - 11,951 54,020
Derivative f inancial instruments - - - - 26,482 26,482
Loans 34,324 - - 440,320 - 474,644
Life insurance assets - - - - 12,393 12,393
Goodw ill and other intangibles - - - 11,420 - 11,420
Fixed assets - - - 881 - 881
Other assets 319 - - - 6,655 6,974
Total assets 79,732 - - 458,900 62,143 600,775
Liabilities
Payables due to other f inancial institutions - - 4,577 - 3,722 8,299
Deposits
At call - 158,221 - - - 158,221
Term deposits - 113,381 - - - 113,381Medium term deposit notes and certif icates of deposit - - 63,711 - - 63,711
Derivative f inancial instruments - - - - 29,830 29,830Trading liabilities and other f inancial liabilities designated at fair value - - - - 6,362 6,362
Acceptances - - 1,082 - - 1,082
Debt issues - - 150,592 - - 150,592
Life insurance liabilities - - - - 11,761 11,761
Other liabilities - - - - 9,435 9,435
Loan capital - - 9,691 - - 9,691
Total liabilities - 271,602 229,653 - 61,110 562,365
Total equity - - 1,933 37,071 (594) 38,410
Total net 79,732 (271,602) (231,586) 421,829 1,627 -
As at 31 March 2010

Half Year 2010 Reported Results (continued)
104
Note 23. Funding view of the Balance Sheet (continued)
$mLiquid
AssetsCustomer
DepositsWholesale
FundingCustomer Franchise
Market Inventory Total
Assets
Cash 356 - - 2,916 - 3,272
Receivables due from other f inancial institutions 2,286 - - 2,358 5,330 9,974
Trading securities, f inancial assets and available-for-sale securities 35,734 - - - 12,073 47,807
Derivative f inancial instruments - - - - 33,187 33,187
Loans 40,138 - - 423,321 - 463,459
Life insurance assets - - - - 12,384 12,384
Goodw ill and other intangibles - - - 11,541 - 11,541
Fixed assets - - - 888 - 888
Other assets 93 - - - 6,982 7,075
Total assets 78,607 - - 441,024 69,956 589,587
Liabilities
Payables due to other f inancial institutions - - 4,959 - 4,276 9,235
Deposits
At call - 166,983 - - - 166,983
Term deposits - 100,310 - - - 100,310
Medium term deposit notes - - 170 - - 170
Certif icates of deposit - - 61,993 - - 61,993
Derivative f inancial instruments - - - - 36,478 36,478Trading liabilities and other f inancial liabilities designated at fair value 4,951 - - - 5,897 10,848
Acceptances - - 1,671 - - 1,671
Debt issues - - 131,353 - - 131,353
Life insurance liabilities - - - - 11,737 11,737
Other liabilities - - - - 11,100 11,100
Loan capital - - 11,138 - - 11,138
Total liabilities 4,951 267,293 211,284 - 69,488 553,016
Total equity - - 1,934 35,074 (437) 36,571
Total net 73,656 (267,293) (213,218) 405,950 905 -
As at 30 Sept 2009
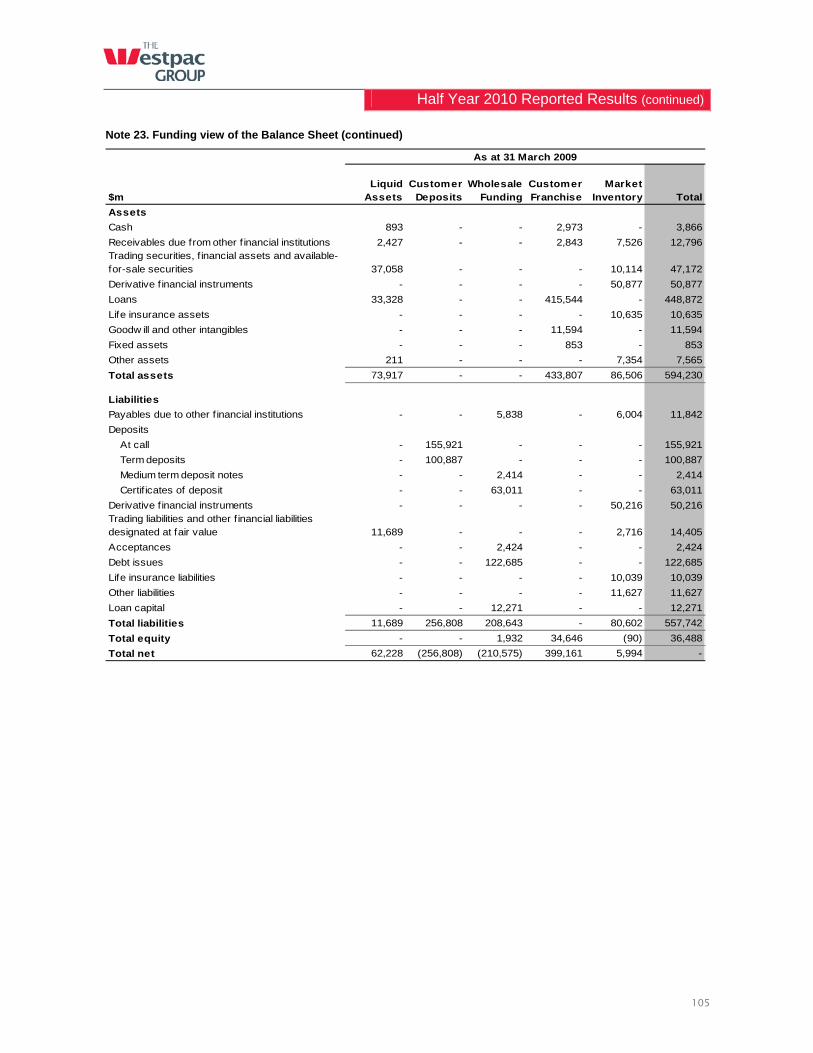
Half Year 2010 Reported Results (continued)
105
Note 23. Funding view of the Balance Sheet (continued)
$mLiquid
AssetsCustomer
DepositsWholesale
FundingCustomer Franchise
Market Inventory Total
Assets
Cash 893 - - 2,973 - 3,866
Receivables due from other f inancial institutions 2,427 - - 2,843 7,526 12,796Trading securities, f inancial assets and available-for-sale securities 37,058 - - - 10,114 47,172
Derivative f inancial instruments - - - - 50,877 50,877
Loans 33,328 - - 415,544 - 448,872
Life insurance assets - - - - 10,635 10,635
Goodw ill and other intangibles - - - 11,594 - 11,594
Fixed assets - - - 853 - 853
Other assets 211 - - - 7,354 7,565
Total assets 73,917 - - 433,807 86,506 594,230
Liabilities
Payables due to other f inancial institutions - - 5,838 - 6,004 11,842
Deposits
At call - 155,921 - - - 155,921
Term deposits - 100,887 - - - 100,887
Medium term deposit notes - - 2,414 - - 2,414
Certif icates of deposit - - 63,011 - - 63,011
Derivative f inancial instruments - - - - 50,216 50,216Trading liabilities and other f inancial liabilities designated at fair value 11,689 - - - 2,716 14,405
Acceptances - - 2,424 - - 2,424
Debt issues - - 122,685 - - 122,685
Life insurance liabilities - - - - 10,039 10,039
Other liabilities - - - - 11,627 11,627
Loan capital - - 12,271 - - 12,271
Total liabilities 11,689 256,808 208,643 - 80,602 557,742
Total equity - - 1,932 34,646 (90) 36,488
Total net 62,228 (256,808) (210,575) 399,161 5,994 -
As at 31 March 2009
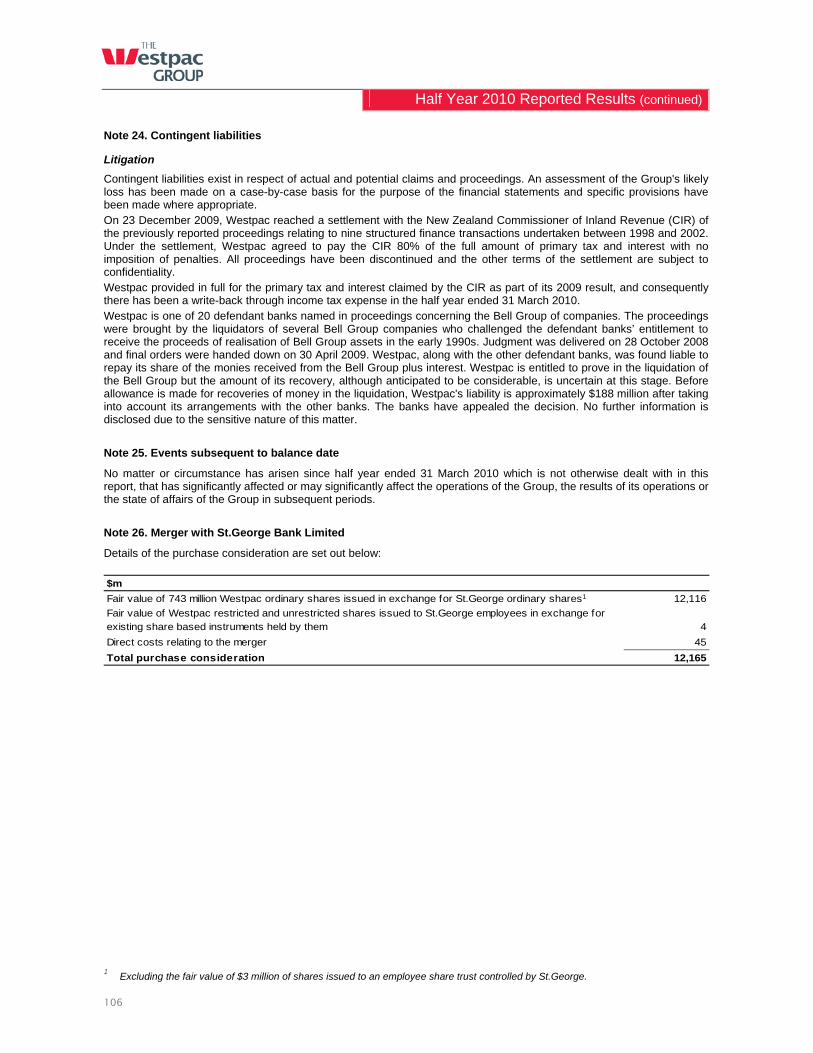
Half Year 2010 Reported Results (continued)
106
Note 24. Contingent liabilities
Litigation
Contingent liabilities exist in respect of actual and potential claims and proceedings. An assessment of the Group's likely loss has been made on a case-by-case basis for the purpose of the financial statements and specific provisions have been made where appropriate. On 23 December 2009, Westpac reached a settlement with the New Zealand Commissioner of Inland Revenue (CIR) of the previously reported proceedings relating to nine structured finance transactions undertaken between 1998 and 2002. Under the settlement, Westpac agreed to pay the CIR 80% of the full amount of primary tax and interest with no imposition of penalties. All proceedings have been discontinued and the other terms of the settlement are subject to confidentiality. Westpac provided in full for the primary tax and interest claimed by the CIR as part of its 2009 result, and consequently there has been a write-back through income tax expense in the half year ended 31 March 2010. Westpac is one of 20 defendant banks named in proceedings concerning the Bell Group of companies. The proceedings were brought by the liquidators of several Bell Group companies who challenged the defendant banks’ entitlement to receive the proceeds of realisation of Bell Group assets in the early 1990s. Judgment was delivered on 28 October 2008 and final orders were handed down on 30 April 2009. Westpac, along with the other defendant banks, was found liable to repay its share of the monies received from the Bell Group plus interest. Westpac is entitled to prove in the liquidation of the Bell Group but the amount of its recovery, although anticipated to be considerable, is uncertain at this stage. Before allowance is made for recoveries of money in the liquidation, Westpac's liability is approximately $188 million after taking into account its arrangements with the other banks. The banks have appealed the decision. No further information is disclosed due to the sensitive nature of this matter.
Note 25. Events subsequent to balance date
No matter or circumstance has arisen since half year ended 31 March 2010 which is not otherwise dealt with in this report, that has significantly affected or may significantly affect the operations of the Group, the results of its operations or the state of affairs of the Group in subsequent periods.
Note 26. Merger with St.George Bank Limited
Details of the purchase consideration are set out below: $m
12,116
4
Direct costs relating to the merger 45
12,165
Fair value of 743 million Westpac ordinary shares issued in exchange for St.George ordinary shares1
Fair value of Westpac restricted and unrestricted shares issued to St.George employees in exchange for existing share based instruments held by them
Total purchase consideration
1 Excluding the fair value of $3 million of shares issued to an employee share trust controlled by St.George.
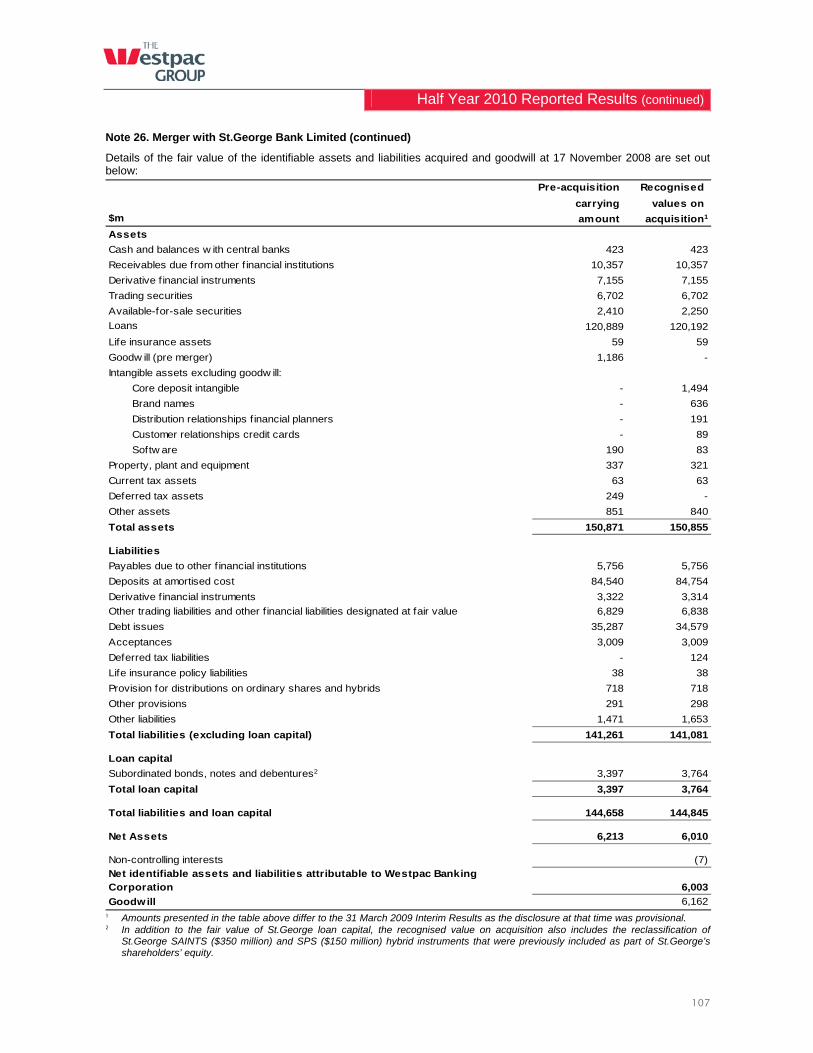
Half Year 2010 Reported Results (continued)
107
Note 26. Merger with St.George Bank Limited (continued)
Details of the fair value of the identifiable assets and liabilities acquired and goodwill at 17 November 2008 are set out below:
Pre-acquisition Recognised
carrying values on
$m amount acquisition1
Assets
Cash and balances w ith central banks 423 423
Receivables due from other f inancial institutions 10,357 10,357
Derivative f inancial instruments 7,155 7,155
Trading securities 6,702 6,702
Available-for-sale securities 2,410 2,250
Loans 120,889 120,192
Life insurance assets 59 59
Goodw ill (pre merger) 1,186 -
Intangible assets excluding goodw ill:
Core deposit intangible - 1,494
Brand names - 636
Distribution relationships f inancial planners - 191
Customer relationships credit cards - 89
Softw are 190 83
Property, plant and equipment 337 321
Current tax assets 63 63
Deferred tax assets 249 -
Other assets 851 840
Total assets 150,871 150,855
Liabilities
Payables due to other f inancial institutions 5,756 5,756
Deposits at amortised cost 84,540 84,754
Derivative f inancial instruments 3,322 3,314
Other trading liabilities and other f inancial liabilities designated at fair value 6,829 6,838
Debt issues 35,287 34,579
Acceptances 3,009 3,009
Deferred tax liabilities - 124
Life insurance policy liabilities 38 38
Provision for distributions on ordinary shares and hybrids 718 718
Other provisions 291 298
Other liabilities 1,471 1,653
Total liabilities (excluding loan capital) 141,261 141,081
Loan capital
Subordinated bonds, notes and debentures2 3,397 3,764
Total loan capital 3,397 3,764
Total liabilities and loan capital 144,658 144,845
Net Assets 6,213 6,010
Non-controlling interests (7)Net identifiable assets and liabilities attributable to Westpac Banking Corporation 6,003
Goodwill 6,162 1 Amounts presented in the table above differ to the 31 March 2009 Interim Results as the disclosure at that time was provisional. 2 In addition to the fair value of St.George loan capital, the recognised value on acquisition also includes the reclassification of
St.George SAINTS ($350 million) and SPS ($150 million) hybrid instruments that were previously included as part of St.George’s shareholders’ equity.

Half Year 2010 Reported Results (continued)
108
6.7. Statement in Relation to the Review of the Financial Statements
PricewaterhouseCoopers has reviewed the financial statements contained within the Westpac 2010 Interim Financial Report and has issued an unqualified review report. A copy of their report is available with the Interim Financial Report. This profit announcement has not been subject to review by PricewaterhouseCoopers. The preceding financial information contained in Section 6 “First Half 2010 Reported Financial Information” includes financial information extracted from the reviewed financial statements together with financial information that has not been reviewed. Dated at Sydney this 13th day of May 2010 for and on behalf of the Board.
Rebecca Farrell Company Secretary
Other Information
109
7 Other Information
7.1 Credit Ratings1 and Exchange Rates
Rating agencyLong Term
Short Term
Fitch Ratings AA F1+
Moody's Investor Services Aa1 P -1
Standard & Poor's AA A -1 +
Six months to/as at
Currency Average Spot Average Spot Average Spot
US$ 0.9070 0.9155 0.7971 0.8800 0.6683 0.6865
GBP 0.5680 0.6073 0.4995 0.5482 0.4445 0.4807
NZ$ 1.2619 1.2897 1.2482 1.2196 1.2050 1.2078
31 March 200931 March 2010 30 Sept 2009
1 As at March 2010.
Other Information (continued)
110
7.2 Financial Calendar
Westpac shares are listed on the securities exchanges in Australia (ASX) and New Zealand and as American Depositary Receipts in New York. Westpac Stapled Preferred Securities (Westpac SPS and Westpac SPS II) are listed on the ASX.
Important dates for shareholders to note over the following months are:
Ex-dividend date for interim dividend 17 May 2010
Record date for interim dividend (Sydney)1 21 May 2010
Record date for interim dividend (New York)2 20 May 2010
Interim dividend payable 2 July 2010
Financial year end 30 September 2010
Final results and ordinary share dividend announcement3 3 November 2010
Ex-dividend date for final dividend3 8 November 2010
Record date for final dividend (Sydney)1,3 12 November 2010
Record date for final dividend (New York)2,3 11 November 2010
Annual General Meeting4 15 December 2010
Final dividend payable3 20 December 2010
Important dates for Westpac SPS and Westpac SPS II investors to note over the following months are:
Record date for June quarter distribution 23 June 2010
Payment date for June quarter distribution 30 June 2010
Record date for September quarter distribution 23 September 2010
Payment date for September quarter distribution 30 September 2010
Record date for December quarter distribution 24 December 2010
Payment date for December quarter distribution 31 December 2010
Share Registries
Australia New Zealand Ordinary shares on the main register, and Westpac SPS and Westpac SPS II
Ordinary shares on the New Zealand branch register
Link Market Services Limited Link Market Services Limited Level 12, 680 George Street Level 16, Brookfields House, 19 Victoria Street West Sydney NSW 2000 Australia Auckland 1010 New Zealand Postal Address: Locked Bag A6015, Sydney South NSW 1235
Postal Address: P.O. Box 91976, Auckland 1142, New Zealand
Website: www.linkmarketservices.com.au Website: www.linkmarketservices.com Telephone: 1800 804 255 (toll free in Australia) International: +61 2 8280 7070
Telephone: 1800 002 727 (toll free in New Zealand) International: +64 9 375 5998
New York For further information contact: Depositary in USA for American Depositary Receipts JP Morgan Chase Bank, N.A. Media:
David Lording, Head of Media Relations, +61 2 8253 3510 PO Box 64504 St Paul MN 55164-0504 Analysts and Investors: USA Andrew Bowden, (TBA) Website: www.adr.com Email: [email protected] Telephone: +1 800 990 1135 (toll free in US and Canada) International: + 1 651 453 2128
Head of Investor Relations, +61 2 8253 4008
1 Final participation date for DRP. 2 Dividends will be converted to local currency at the ruling rate on the day of record. 3 Dates will be confirmed at the time of announcing the 2010 final results. 4 Details regarding the date of this meeting and the business to be dealt with, will be contained in the separate Notice of Meeting sent
to Shareholders in November 2010.
Glossary
111
8 Glossary
Earnings Cash Earnings Net profit attributable to owners of WBC adjusted for the impact of the economic hedges related to TPS, gain/losses on ineffective hedges, the impact of unrealised New Zealand earnings hedges gains/losses, and the impact of the integration costs and the amortisation of certain intangibles in relation to the merger with St.George. Refer to the Introduction on page 1 and Section 5.2 for a more detailed explanation.
Shareholder Value Earnings per ordinary share Net profit attributable to owners of WBC divided by the weighted average ordinary shares (statutory basis).
Weighted average ordinary shares (statutory)
Weighted average number of fully paid ordinary shares listed on the ASX for the relevant period less Westpac shares held by the Group (Treasury shares).
Fully franked dividends per ordinary shares (cents)
Dividends paid out of retained profits which carry a credit for Australian company income tax paid by Westpac.
Dividend payout ratio – net profit
Ordinary dividend per share divided by net profit per share attributable to the owners of WBC.
Return on equity (ROE) Net profit attributable to owners of WBC divided by average ordinary equity.
Average ordinary equity Average total equity less average non-controlling interests.
Productivity and Efficiency
Operating expenses Operating expenses do not include impairment losses on loans.
Expense to income ratio Operating expenses divided by net operating income.
Full-time equivalent employees (FTE)
A calculation based on the number of hours worked by full and part-time employees as part of their normal duties. For example, the full-time equivalent of one FTE is 76 hours paid work per fortnight.
Business Performance
Net interest spread The difference between the average yield on all interest bearing assets and the average rate paid on interest bearing liabilities.
Net interest margin The net interest spread plus the benefit of net non-interest bearing liabilities and equity.
Average interest earning assets
The average balance of assets held by the Group that generate interest income. Where possible, daily balances are used to calculate the average balance for the period.
Average interest bearing liabilities
The average balance of liabilities owed by the Group that incur an interest expense. Where possible, daily balances are used to calculate the average balance for the period.
Divisional margin Net interest income (excluding capital benefit) for a business unit as a percentage of the average interest earning assets for that division.
Capital Adequacy Total capital ratio Total regulatory capital as defined by APRA divided by risk weighted assets.
Tier 1 capital ratio Total Tier 1 capital as defined by APRA divided by risk weighted assets.
Risk Weighted Assets (RWA)
Assets (both on and off-balance sheet) of Westpac are assigned within a certain category, amounts included in these categories are multiplied by a risk weighting, and with the resulting weighted values added together to arrive at total risk weighted assets.
Credit Risk Weighted Assets
Credit risk weighted assets represent risk weighted assets (on-balance sheet and off-balance sheet) that relate to credit exposures and therefore exclude equity risk, market risk, operational risk, interest rate risk in the banking book and other assets. Note 19 in section 6 provides a breakdown of risk weighted assets between credit risk weighted assets and other risk weighted assets.
Glossary (continued)
112
Asset Quality Individually assessed provisions (IAPs)
Provisions raised for losses that have already been incurred on loans that are known to be impaired and are individually significant. The estimated losses on these impaired loans will be based on expected future cash flows discounted to their present value and as this discount unwinds, interest will be recognised in the statement of financial performance.
Collectively assessed provisions (CAPs)
Loans not found to be individually impaired or significant will be collectively assessed in pools of similar assets with similar risk characteristics. The size of the provision is an estimate of the losses already incurred and will be estimated on the basis of historical loss experience for assets with credit characteristics similar to those in the collective pool. The historical loss experience will be adjusted based on current observable data.
Impaired assets Includes exposures that have deteriorated to the point where full collection of interest and principal is in doubt, based on a conservative assessment of the customer’s outlook, cashflow, and the net realisation of value of assets to which recourse is held:
• Facilities 90 days or more past due, and not well secured – exposures where contractual payments are 90 or more days in arrears and the net realisable value of assets to which recourse is held may not be sufficient to allow full collection of interest and principal, including overdrafts or other revolving facilities that remain continuously outside approved limits by material amounts for 90 or more calendar days;
• Non-accrual assets – exposures with individually assessed impairment provisions held against them, excluding restructured loans;
• Restructured assets – exposures where the original contractual terms have been formally modified to provide for concessions of interest or principal for reasons related to the financial difficulties of the customer;
• Other assets acquired through security enforcement (includes other real estate owned) – includes the value of any other assets acquired as full or partial settlement of outstanding obligations through the enforcement of security arrangements; and
• Any other assets where the full collection of interest and principal is in doubt.
90 days past due – well secured
Includes facilities where:
• Contractual payments of interest and/or principal are 90 or more calendar days overdue, including overdrafts or other revolving facilities that remain continuously outside approved limits by material amounts for 90 or more calendar days; or
• An order has been sought for the customer’s bankruptcy or similar legal action has been instituted which may avoid or delay repayment of its credit obligations; and
• The estimated net realisable value of assets/security to which Westpac has recourse is sufficient to cover repayment of all principal and interest, and interest is being taken to profit on an accrual basis.
These facilities, while in default, are not treated as impaired for accounting purposes.
Watchlist and Substandard Loan facilities where customers are experiencing operating weakness and financial difficulty but are not expected to incur loss of interest or principal.
Stressed loans Stressed loans are Watchlist and Substandard, 90 days past due well secured and impaired assets.
Total Committed Exposure (TCE)
Total Committed Exposure (TCE) represents the sum of the committed portion of direct lending (including funds placement overall and deposits placed), contingent and pre-settlement risk plus the committed portion of secondary market trading and underwriting risk.
Other Accounting reclassifications Adjustments made for accounting treatments that have the effect of grossing up the income statement (primarily between income and tax expense/profits attributable to non-controlling interest). Key reclassifications include gross-ups for policyholder tax recoveries and the impact of Treasury shares. These adjustments have no impact on Cash Earnings.
Net Promoter Score (NPS)1 Refers to an external measure of customer advocacy which looks at how
willing our customers are to recommend Westpac to their family and friends.
1 Net Promoter ScoreSM and NPSSM is a service mark of Bain and Company Inc, Satmetrix Systems Inc. and Mr Frederick Reichheld.