Embed Size (px)
Citation preview

2015 Input-Output Tables for Japan
Joint Compilation
Ministry of Internal Affairs and Communications
Cabinet Office
Financial Services Agency
Ministry of Finance
Ministry of Education, Culture, Sports, Science and Technology
Ministry of Health, Labour and Welfare
Ministry of Agriculture, Forestry and Fisheries
Ministry of Economy, Trade and Industry
Ministry of Land, Infrastructure, Transport and Tourism
Ministry of the Environment
February 2021
Ministry of Internal Affairs and Communications
Japan


Contents
EXPLANATORY NOTES ····················································································································· 1
CHAPTER Ⅰ JAPAN’S ECONOMIC STRUCTURE AS VIEWED FROM 2015 INPUT-OUTPUT TABLES ················· 3
1 Overview ······························································································································· 4
2 Total Supply and Growth ··········································································································· 10
3 Composition and Growth of Total Demand ······················································································ 11
4 Domestic Production by Industry ·································································································· 12
Reference: Domestic Production Trend ························································································· 13
5 Growth of Domestic Production by Industry ····················································································· 14
6 Intermediate Inputs and Gross Value Added ····················································································· 15
7 Intermediate Input Ratio by Industry ······························································································ 16
8 Intermediate Input Ratios of Services by Industry ·············································································· 17
9 Composition and Growth Rates of Gross Value Added ········································································ 18
10 Composition and Growth of Final Demand ····················································································· 19
11 Growth Rate and Contribution of Exports by Commodity ···································································· 20
12 Commodity Export Ratios of Domestic Products ·············································································· 21
13 Growth Rate and Contribution of Imports by Commodity ···································································· 22
14 Commodity Import Ratios of Domestic Demand ·············································································· 23
15 Intensity of Product Impact ······································································································· 24
16 Final Demand and Induced Domestic Production ·············································································· 25
17 Final Demand and Induced Gross Value Added ··············································································· 26
18 Final Demand and Induced Imports ······························································································ 27
CHAPTER Ⅱ ORGANIZATIONAL STRUCTURE AND COMPILATION PROCESS ············································ 29
§1 Organizational Structure ·············································································································· 29
1 A Joint Undertaking Organizational Structure ··················································································· 29
2 Organizational Structure and Tasks ······························································································· 29
3 Operating Budget ···················································································································· 29
§2 Overview of Compilation Project ··································································································· 30
1 Determination of Basic Guidelines ································································································ 30
2 Determination of the Basic Outline of Compilation ············································································· 33
3 Collection and Arrangement of Basic Data ······················································································· 33
4 Compilation and Balancing Figures ······························································································· 35
5 Compilation of Various Coefficients Tables ····················································································· 37
6 Compilation of Various Supplementary Tables ················································································· 37
7 Publication of the Results ··········································································································· 37
8 Compilation and Publication of the Linked Input-Output Tables ····························································· 38
§3 Basic Framework of the Basic Transaction Tables ··············································································· 38
1 Duration, Scope, and Timing of Recording ······················································································ 38
2 Evaluation Methods ·················································································································· 38
3 Basic Structure of Basic Transaction Tables ····················································································· 39

4 Sector Classification ················································································································· 40
5 Special Treatment ···················································································································· 41
Reference 1 The History of Input-Output Tables for Japan ···································································· 42
CHAPTER Ⅲ THEORY OF INPUT-OUTPUT TABLES ············································································· 49
1 Period Covered ······················································································································· 49
2 Geographical Coverage ············································································································· 49
3 Timing for Recording ··············································································································· 50
4 Units of Assessment ················································································································· 51
5 Sector Classification ················································································································· 51
6 Basic Structure of the Basic Transaction Table ·················································································· 56
7 Price Valuation of Domestic Production ·························································································· 61
8 Recording Transactions in Endogenous Sectors and Final Demand Sectors ················································ 65
9 Price Valuation of Exports and Imports ··························································································· 66
10 Special Handling in Compiling the Basic Transaction Table ································································· 66
CHAPTER Ⅳ COEFFICIENTS FOR INPUT-OUTPUT ANALYSIS AND COMPUTATION METHODS ····················· 79
§1 Input Coefficients ······················································································································ 79
1 Calculating Input Coefficients ····································································································· 79
2 Definition of Input Coefficients ···································································································· 80
3 Stability of Input Coefficients ······································································································ 81
§2 Inverse Matrix Coefficients ·········································································································· 82
1 Definition and Computation of Inverse Matrix Coefficients ··································································· 82
2 Types of Inverse Matrix Coefficients (Handling of Imports) ································································· 83
3 Index of the Power of Dispersion and Index of the Sensitivity of Dispersion ··············································· 85
§3 Relationship Between Final Demand and Domestic Production ································································ 88
1 Domestic Production Induced by Individual Final Demand Items ···························································· 88
2 Domestic Production Inducement Coefficients by Individual Final Demand Items ········································ 89
3 Domestic Production Inducement Distribution Ratios by Individual Final Demand Items ································ 89
§4 Relationship Between Final Demand and Gross Value Added ·································································· 90
§5 Relationship Between Final Demand and Imports ················································································ 90
1 Imports Induced, Imports Inducement Coefficients and Imports Inducement Distribution Ratios by
Individual Final Demand Items ····································································································· 90
2 Comprehensive Imports Coefficients ····························································································· 91
§6 Labor Input-Output Analysis Coefficients ························································································· 91
1 Labor Inducement Coefficients ···································································································· 91
2 Labor-Related Indices of Power and Sensitivity of Dispersion ································································ 92
3 Occupation Inducement Coefficients ······························································································ 93
4 Labor and Occupation Inducement Coefficients by Individual Final Demand Items ······································· 94
§7 Problem of Sector Integration ········································································································ 94
1 Introduction ··························································································································· 94
2 Theoretical Aspects of Sector Integration ························································································ 94
3 Example of Sector Integration ······································································································ 97
4 Summary ······························································································································ 97

§8 Precautions for Input-Output Analysis ······························································································· 99
1 Stability of Input Coefficients ······································································································ 99
2 Other Points to Note ················································································································· 99
CHAPTER Ⅴ SUPPLEMENTARY TABLES ························································································· 101
1 Table on Value and Quantity ····································································································· 101
2 Table on Scrap and By-Products ································································································· 102
3 Table on Employees Engaged in Production Activities (by Occupation) ·················································· 104
4 Employment Matrix (Table on Employees Engaged in Production Activities [by Occupation]) ······················· 105
5 Fixed Capital Matrix (Table on Fixed Capital Formation) ··································································· 106
6 Table on Commodity Output by Industry (Make table) ······································································ 108
7 Table on Self-Transports ·········································································································· 109
Reference 2 Table on Trade Margins and Table on Domestic Freights ····················································· 111
Reference 3 Table on Imports ······································································································ 114
CHAPTER Ⅵ SECTOR CLASSIFICATION (Basic Sector, Aggregated Sector, and Special Classification) ·············· 115
Reference 4 Corresponding Table of 187 Sector Classification in 2015 Input-Output Tables and International
Standard Industrial Classification ·················································································· 126
CHAPTER Ⅶ CONCEPT, DEFINITION AND SCOPE BY SECTOR ····························································· 137
§1 Endogenous Sectors ··············································································································· 138
01 Agriculture, forestry and fishery ······························································································· 138
06 Mining ····························································································································· 144
11 Beverages and Foods ············································································································· 145
15 Textile products ···················································································································· 152
16 Pulp, paper and wooden products ······························································································ 155
20 Chemical products ················································································································ 159
21 Petroleum and coal products ···································································································· 165
22 Plastic products and rubber products ·························································································· 166
25 Ceramic, stone and clay products ······························································································ 168
26 Iron and steel ······················································································································ 170
27 Non-ferrous metals ··············································································································· 173
28 Metal products ···················································································································· 175
29 General-purpose machinery ····································································································· 177
30 Production machinery ············································································································ 180
31 Business oriented machinery ···································································································· 183
32 Electronic components ··········································································································· 185
33 Electrical machinery ············································································································· 187
34 Information and communication electronics equipment ···································································· 190
35 Transportation equipment ······································································································· 193
39 Miscellaneous manufacturing products ························································································ 196
41 Construction ······················································································································· 201
46 Electricity, gas and heat supply ································································································· 205
47 Water supply ······················································································································ 206
48 Waste management service ····································································································· 207
51 Commerce ························································································································· 207

53 Finance and insurance ··········································································································· 208
55 Real estate ························································································································· 210
57 Transport and postal services ··································································································· 211
59 Information and communications ······························································································ 217
61 Public administration ············································································································· 220
63 Education and research ·········································································································· 221
64 Medical, health care and welfare ······························································································· 226
65 Membership-based associations, n.e.c. ························································································ 230
66 Business services ················································································································· 231
67 Personal services ·················································································································· 235
68 Office supplies ···················································································································· 239
69 Activities not elsewhere classified ····························································································· 240
§2 Final Demand Sectors ············································································································· 240
§3 Gross Value Added Sectors ······································································································· 250

EXPLANATORY NOTES
- 1 -

- 2 -

CHAPTER Ⅰ
JAPAN’S ECONOMIC STRUCTURE AS VIEWED FROM 2015 INPUT-OUTPUT
TABLES
1 Overview ································································································ 4
2 Total Supply and Growth ·············································································· 10
3 Composition and Growth of Total Demand ·························································· 11
4 Domestic Production by Industry ····································································· 12
4 Reference: Domestic Production Trend ······························································· 13
5 Growth of Domestic Production by Industry ························································· 14
6 Intermediate Inputs and Gross Value Added ·························································· 15
7 Intermediate Input Ratio by Industry ·································································· 16
8 Intermediate Input Ratios of Services by Industry ··················································· 17
9 Composition and Growth Rates of Gross Value Added ·············································· 18
10 Composition and Growth of Final Demand ························································· 19
11 Growth Rate and Contribution of Exports by Commodity ········································· 20
12 Commodity Export Ratios of Domestic Products ··················································· 21
13 Growth Rate and Contribution of Imports by Commodity ········································· 22
14 Commodity Import Ratios of Domestic Demand ··················································· 23
15 Intensity of Products Impact ········································································· 24
16 Final Demand and Induced Domestic Production ·················································· 25
17 Final Demand and Induced Gross Value Added ······················································ 26
18 Final Demand and Induced Imports ································································· 27
- 3 -

1. Overview
The economic status quo of a particular economy for a particular period of time (normally on a yearly duration basis) may be
inferred from the input-output tables (I-O tables) by analyzing the inter-industrial good and service transactions as recorded under the
matrix column. As an illustration, a straightforward overall picture of the 2015 I-O tables for Japan with 13 sectors is depicted in
Table 1 and the economic structure as inferred from the aforesaid tables is shown in Chart 1-1.
The values of Domestic production as well as the input components (for goods and services) of the individual sector may be
inferred from the figures as appeared in the column sector of the I-O Tables. Moreover, the sales amount of Domestic production as
well as import of the respective goods and service demanded may be inferred from the row sector of the tables.
To begin with, as deduced from the aforesaid tables, the Total supply of goods and services in 2015 was 1119.99 trillion yen out of
which the Domestic production amounted to 1017.82 trillion yen (90.9% of the Total supply value) while the Imports valued at
102.17 trillion yen (9.1% of the Total supply value). As compared to 2011, Total supply has increased by 9.5% due to increases in
Domestic production and in the values of Imports by 8.3% and 22.9%, respectively.
In light of the cost structure for Domestic production, Intermediate input of goods and services used in production, such as raw
materials and fuels, amounted to 469.58 trillion yen. The Ratio of intermediate input, which represents the ratio of Domestic
production accounted for by Intermediate inputs, decreased from 49.2% in 2011 to 46.1% in 2015.
Gross value added, which is another structural element for Domestic production, amounted to 548.24 trillion yen, and the Ratio of
gross value added, which represents the ratio accounted for by gross value added in Domestic production, was 53.9%. In addition,
Gross value added is broken down into Compensation of employees (48.5%), Operating surplus (19.0%), and Consumption of fixed
capital (23.9%). Operating surplus and Consumption of fixed capital increased compared to 2011, while Compensation of Employees
decreased.
Furthermore, observing from the demand side, the total demand of goods and services demanded in 2015 is 1119.99 trillion yen, of
which the value of intermediate demand for goods and services used in production activities, such as raw materials and fuels,
amounted to 469.58 trillion yen (41.9% of the Total demand value). Domestic final demand amounted to 563.64 trillion yen (50.3%
of the Total demand value), and exports amounted to 86.77 trillion yen (7.7% of the Total demand value). Observing the breakdown
of Domestic final demand, Consumption amounted to 426.20 trillion yen (75.6% of the Domestic final demand), and Investments
amounted to 137.44 trillion yen (24.4% of the Domestic final demand).
Comparing these figures to those from 2011, Intermediate demand increased by 1.5%. Within Domestic final demand,
Consumption and Investments increased by 8.9% and 43.0%, respectively. Exports increased by 19.7%, and accounted for 7.7% of
the value of Total demand, showing an increase of 0.6 points from the ratio in 2011.
Explanations regarding each item are given starting on the following page.
(Note) Table 1-1 is the “Input-Output Table Valued at Producers’ Prices” that evaluates transactions in terms of producers’ shipment
price. Table 1-2 is the “Input-Output Table Valued at Purchasers’ Prices” that evaluates shipment prices using prices that include
marketing costs (commercial margin and domestic freights). In this chapter, statements are made based on the Input-Output
Table Valued at Producers’ Prices unless otherwise specifically stated.
- 4 -

Chart 1-1. Flowchart of Goods and Services in Light of the 2015 Input-Output Tables
(trillion yen)
Domestic Production (90.9%)
Domestic Production 1017.8
Goods
377.4
(37.1%)
Services
640.4
(62.9%)
Imports (9.1%)
Total Supply 1120.0 (100.0%)
Total Demand 1120.0 (100.0%)
Intermediate Demand (41.9%)
Final Demand 650.4
Domestic final demand 563.6
Consumption 426.2
(75.6%)
Investment 137.4
(24.4%)
Exports
86.8
Final Demand (58.1%)
Domestic final demand (50.3%)
Exports (7.7%)
Intermediate Input Rate
(46.1%)
Gross Value Added Rate (53.9%)
Gross Value Added
548.2
Compensation
of Employees
265.8
(48.5%)
Consumption
of fixed capital
131.1
(23.9%)
Others
47.5
(8.7%)
Operating
Surplus
103.9
(19.0%)
Intermediate Inputs 469.6
Goods
239.0
(50.9%)
Services
230.6
(49.1%)
Imports
102.2
Notes:
1: ‘Goods’ refers to sector 01 to 41 and 68 of the 37 sector classification, while ‘Services’ refers to sector
46 to 67 and 69.
2: In this Chart, consumption is the total of “Consumption expenditure outside households, ” “Consumption
expenditure (private),” and “Consumption expenditure of general government ,” while investment is the
total of “Gross domestic fixed capital formation ,” and “Increase in stocks.”
3: Component figures may not add up to the total, because of rounding.
- 5 -
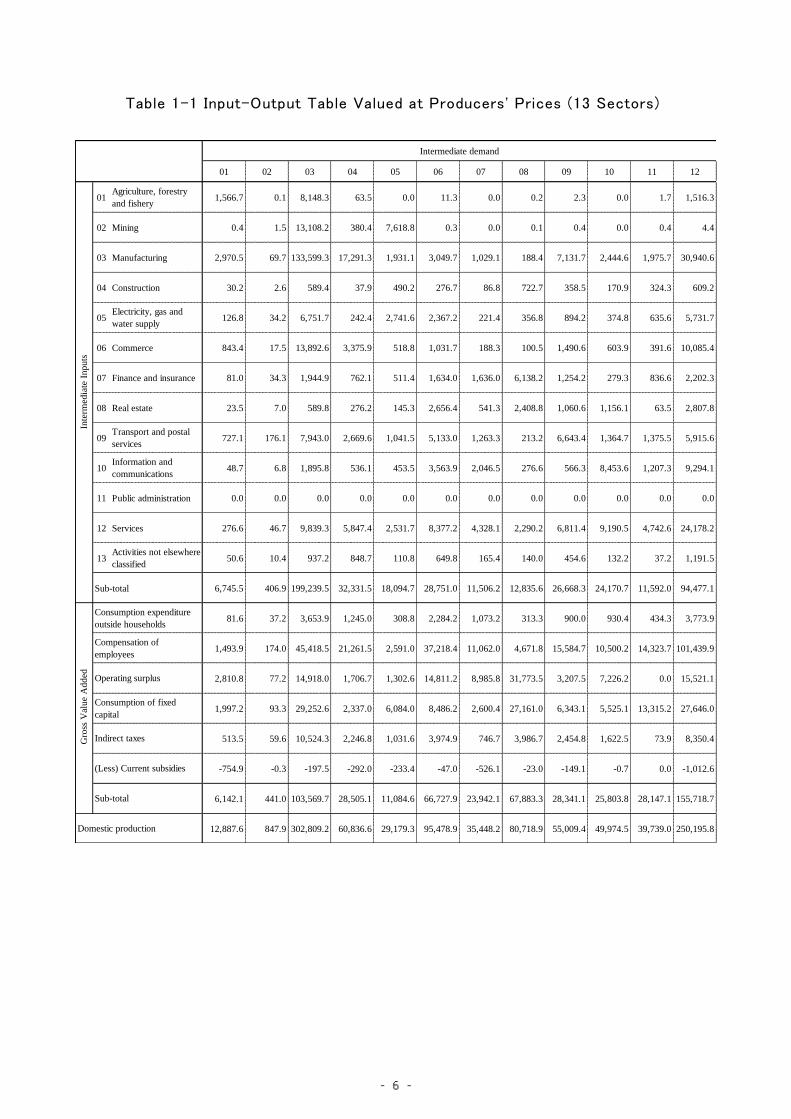
Table 1-1 Input-Output Table Valued at Producers' Prices (13 Sectors)
01 02 03 04 05 06 07 08 09 10 11 12
01Agriculture, forestry
and fishery1,566.7 0.1 8,148.3 63.5 0.0 11.3 0.0 0.2 2.3 0.0 1.7 1,516.3
02 Mining 0.4 1.5 13,108.2 380.4 7,618.8 0.3 0.0 0.1 0.4 0.0 0.4 4.4
03 Manufacturing 2,970.5 69.7 133,599.3 17,291.3 1,931.1 3,049.7 1,029.1 188.4 7,131.7 2,444.6 1,975.7 30,940.6
04 Construction 30.2 2.6 589.4 37.9 490.2 276.7 86.8 722.7 358.5 170.9 324.3 609.2
05Electricity, gas and
water supply126.8 34.2 6,751.7 242.4 2,741.6 2,367.2 221.4 356.8 894.2 374.8 635.6 5,731.7
06 Commerce 843.4 17.5 13,892.6 3,375.9 518.8 1,031.7 188.3 100.5 1,490.6 603.9 391.6 10,085.4
07 Finance and insurance 81.0 34.3 1,944.9 762.1 511.4 1,634.0 1,636.0 6,138.2 1,254.2 279.3 836.6 2,202.3
08 Real estate 23.5 7.0 589.8 276.2 145.3 2,656.4 541.3 2,408.8 1,060.6 1,156.1 63.5 2,807.8
09Transport and postal
services727.1 176.1 7,943.0 2,669.6 1,041.5 5,133.0 1,263.3 213.2 6,643.4 1,364.7 1,375.5 5,915.6
10Information and
communications48.7 6.8 1,895.8 536.1 453.5 3,563.9 2,046.5 276.6 566.3 8,453.6 1,207.3 9,294.1
11 Public administration 0.0 0.0 0.0 0.0 0.0 0.0 0.0 0.0 0.0 0.0 0.0 0.0
12 Services 276.6 46.7 9,839.3 5,847.4 2,531.7 8,377.2 4,328.1 2,290.2 6,811.4 9,190.5 4,742.6 24,178.2
13Activities not elsewhere
classified50.6 10.4 937.2 848.7 110.8 649.8 165.4 140.0 454.6 132.2 37.2 1,191.5
Sub-total 6,745.5 406.9 199,239.5 32,331.5 18,094.7 28,751.0 11,506.2 12,835.6 26,668.3 24,170.7 11,592.0 94,477.1
81.6 37.2 3,653.9 1,245.0 308.8 2,284.2 1,073.2 313.3 900.0 930.4 434.3 3,773.9
1,493.9 174.0 45,418.5 21,261.5 2,591.0 37,218.4 11,062.0 4,671.8 15,584.7 10,500.2 14,323.7 101,439.9
2,810.8 77.2 14,918.0 1,706.7 1,302.6 14,811.2 8,985.8 31,773.5 3,207.5 7,226.2 0.0 15,521.1
1,997.2 93.3 29,252.6 2,337.0 6,084.0 8,486.2 2,600.4 27,161.0 6,343.1 5,525.1 13,315.2 27,646.0
513.5 59.6 10,524.3 2,246.8 1,031.6 3,974.9 746.7 3,986.7 2,454.8 1,622.5 73.9 8,350.4
-754.9 -0.3 -197.5 -292.0 -233.4 -47.0 -526.1 -23.0 -149.1 -0.7 0.0 -1,012.6
6,142.1 441.0 103,569.7 28,505.1 11,084.6 66,727.9 23,942.1 67,883.3 28,341.1 25,803.8 28,147.1 155,718.7
12,887.6 847.9 302,809.2 60,836.6 29,179.3 95,478.9 35,448.2 80,718.9 55,009.4 49,974.5 39,739.0 250,195.8
Intermediate demand
Compensation of
employees
Operating surplus
Consumption of fixed
capital
Indirect taxes
(Less) Current subsidies
Sub-total
Domestic production
Inte
rmed
iate
In
pu
tsG
ross
Val
ue
Ad
ded
Consumption expenditure
outside households
- 6 -

(billion Yen)
13 Sub-Total a b c d e f g Sub-total
0.0 11,310.4 68.0 3,821.8 0.0 193.4 189.3 4,272.5 112.6 4,385.1 15,695.5 -2,807.9 12,887.6
1.0 21,116.0 -5.4 -6.1 0.0 -6.5 -1.9 -19.9 45.1 25.2 21,141.3 -20,293.3 847.9
270.5 202,892.3 1,639.3 57,442.5 6.8 39,357.7 110.8 98,557.2 65,612.6 164,169.7 367,062.0 -64,252.8 302,809.2
0.0 3,699.4 0.0 0.0 0.0 57,137.2 0.0 57,137.2 0.0 57,137.2 60,836.6 0.0 60,836.6
27.8 20,506.3 9.4 8,797.6 -212.4 0.0 0.0 8,594.6 81.7 8,676.3 29,182.6 -3.3 29,179.3
47.2 32,587.1 1,663.5 48,154.7 10.3 7,396.2 181.6 57,406.4 5,674.9 63,081.3 95,668.4 -189.5 95,478.9
13.4 17,327.8 0.3 17,774.6 0.0 0.0 0.0 17,774.9 1,744.9 19,519.8 36,847.6 -1,399.4 35,448.2
147.8 11,884.1 0.0 65,914.1 22.0 2,853.7 0.0 68,789.8 46.9 68,836.6 80,720.7 -1.8 80,718.9
443.8 34,909.6 416.1 15,055.3 52.5 830.9 50.4 16,405.2 7,303.9 23,709.1 58,618.8 -3,609.4 55,009.4
354.4 28,703.7 180.6 13,261.5 36.2 9,377.9 -27.0 22,829.3 763.1 23,592.5 52,296.2 -2,321.7 49,974.5
1,157.3 1,157.3 0.0 1,167.7 37,414.0 0.0 0.0 38,581.7 0.0 38,581.7 39,739.0 0.0 39,739.0
297.3 78,757.3 11,083.5 74,222.6 68,199.9 19,792.4 0.0 173,298.4 5,378.5 178,676.9 257,434.2 -7,238.4 250,195.8
0.0 4,728.3 0.0 10.0 0.0 0.0 0.0 10.0 5.3 15.3 4,743.6 -50.6 4,693.0
2,760.6 469,579.7 15,055.5 305,616.4 105,529.3 136,932.9 503.3 563,637.4 86,769.4 650,406.8 1,119,986.5 -102,168.1 1,017,818.4
19.6 15,055.5
59.4 265,799.2
1,564.8 103,905.3
230.1 131,071.1
82.1 35,668.0
-0.0 -3,260.4
1,932.4 548,238.7
4,693.0 1,017,818.4
Final demandh ji
Column Codes are:
a : Consumption expenditure outside households
b : Consumption expenditure (private)
c : Consumption expenditure of general government
d : Gross domestic fixed capital formation
e : Increase in stocks
f : Total Domestic final demand
g : Exports
h : Total demand
i : (Less) Imports
j : Domestic production
Notes:
1. Component figures may not add up to the total because of rounding.
2. The values of intermediate transactions include consumption tax. However,
exports exclude consumption tax because they are duty free.
- 7 -

Table 1-2 Input-Output Table Valued at Purchasers' Prices (13 Sectors)
01 02 03 04 05 06 07 08 09 10 11 12
01Agriculture, forestry
and fishery1,709.3 0.1 9,731.9 133.1 0.0 23.9 0.0 0.4 3.8 0.0 3.0 2,625.3
02 Mining 0.6 2.2 13,864.1 588.2 8,698.2 0.3 0.0 0.1 0.5 0.0 0.8 5.3
03 Manufacturing 3,996.8 89.0 149,830.0 21,612.6 2,167.7 3,905.7 1,221.6 285.7 8,745.4 3,120.5 2,329.0 40,870.0
04 Construction 30.2 2.6 589.4 37.9 490.2 276.7 86.8 722.7 358.5 170.9 324.3 609.2
05Electricity, gas and
water supply126.8 34.2 6,751.7 242.4 2,741.6 2,367.2 221.4 356.8 894.2 374.8 635.6 5,731.7
06 Commerce 0.0 0.0 0.0 0.0 0.0 189.5 0.0 0.0 0.0 0.0 0.0 0.0
07 Finance and insurance 81.0 34.3 1,944.9 762.1 511.4 1,634.0 1,636.0 6,138.2 1,254.2 279.3 836.6 2,202.3
08 Real estate 23.5 7.0 589.8 276.2 145.3 2,656.4 541.3 2,408.8 1,060.6 1,156.1 63.5 2,807.8
09Transport and postal
services393.6 172.5 3,093.5 1,358.7 232.3 4,927.5 1,210.2 197.7 6,454.2 1,179.3 1,305.4 4,445.0
10Information and
communications53.7 7.2 2,016.9 575.0 459.1 3,705.2 2,088.0 287.0 604.6 8,559.3 1,311.8 9,741.8
11 Public administration 0.0 0.0 0.0 0.0 0.0 0.0 0.0 0.0 0.0 0.0 0.0 0.0
12 Services 276.6 46.7 9,839.3 5,847.4 2,531.7 8,377.2 4,328.1 2,290.2 6,811.4 9,190.5 4,742.6 24,178.2
13Activities not elsewhere
classified53.4 11.0 988.0 897.9 117.2 687.5 172.6 148.1 480.9 139.9 39.3 1,260.4
Sub-total 6,745.5 406.9 199,239.5 32,331.5 18,094.7 28,751.0 11,506.2 12,835.6 26,668.3 24,170.7 11,592.0 94,477.1
81.6 37.2 3,653.9 1,245.0 308.8 2,284.2 1,073.2 313.3 900.0 930.4 434.3 3,773.9
1,493.9 174.0 45,418.5 21,261.5 2,591.0 37,218.4 11,062.0 4,671.8 15,584.7 10,500.2 14,323.7 101,439.9
2,810.8 77.2 14,918.0 1,706.7 1,302.6 14,811.2 8,985.8 31,773.5 3,207.5 7,226.2 0.0 15,521.1
1,997.2 93.3 29,252.6 2,337.0 6,084.0 8,486.2 2,600.4 27,161.0 6,343.1 5,525.1 13,315.2 27,646.0
513.5 59.6 10,524.3 2,246.8 1,031.6 3,974.9 746.7 3,986.7 2,454.8 1,622.5 73.9 8,350.4
-754.9 -0.3 -197.5 -292.0 -233.4 -47.0 -526.1 -23.0 -149.1 -0.7 0.0 -1,012.6
6,142.1 441.0 103,569.7 28,505.1 11,084.6 66,727.9 23,942.1 67,883.3 28,341.1 25,803.8 28,147.1 155,718.7
12,887.6 847.9 302,809.2 60,836.6 29,179.3 95,478.9 35,448.2 80,718.9 55,009.4 49,974.5 39,739.0 250,195.8
Compensation of
employees
Operating surplus
Consumption of fixed
capital
Gro
ss V
alu
e A
dd
ed
Consumption expenditure
outside households
Indirect taxes
(Less) Current subsidies
Intermediate demand
Sub-total
Domestic production
Inte
rmed
iate
In
pu
ts
- 8 -

(billion Yen)
13 Sub-Total a b c d e f g Sub-total
0.0 14,230.7 145.5 7,402.1 0.0 193.4 193.4 7,934.4 146.1 8,080.5 22,311.1 -2,807.9 -5,735.5 -880.2 12,887.6
1.7 23,162.0 -5.4 -5.7 0.0 -6.5 9.5 -8.1 51.0 42.9 23,204.9 -20,293.3 -522.8 -1,540.9 847.9
322.9 238,497.0 3,288.9 102,050.4 15.7 47,231.7 325.0 152,911.8 73,738.1 226,649.9 465,146.9 -64,252.8 -86,452.3 -11,632.6 302,809.2
0.0 3,699.4 0.0 0.0 0.0 57,137.2 0.0 57,137.2 0.0 57,137.2 60,836.6 0.0 0.0 0.0 60,836.6
27.8 20,506.3 9.4 8,797.6 -212.4 0.0 0.0 8,594.6 81.7 8,676.3 29,182.6 -3.3 0.0 0.0 29,179.3
0.0 189.5 0.0 1,102.7 0.0 291.2 0.0 1,394.0 -1,033.7 360.2 549.7 -189.5 95,118.7 0.0 95,478.9
13.4 17,327.8 0.3 17,774.6 0.0 0.0 0.0 17,774.9 1,744.9 19,519.8 36,847.6 -1,399.4 0.0 0.0 35,448.2
147.8 11,884.1 0.0 65,914.1 22.0 2,853.7 0.0 68,789.8 46.9 68,836.6 80,720.7 -1.8 0.0 0.0 80,718.9
432.8 25,402.7 326.1 12,595.5 49.6 0.0 0.0 12,971.2 5,814.2 18,785.4 44,188.1 -3,609.4 0.0 14,430.7 55,009.4
359.7 29,769.4 207.1 14,584.1 40.0 9,439.8 -24.6 24,246.3 795.0 25,041.4 54,810.7 -2,321.7 -2,289.4 -225.2 49,974.5
1,157.3 1,157.3 0.0 1,167.7 37,414.0 0.0 0.0 38,581.7 0.0 38,581.7 39,739.0 0.0 0.0 0.0 39,739.0
297.3 78,757.3 11,083.5 74,222.7 68,200.4 19,792.4 0.0 173,299.1 5,379.8 178,678.9 257,436.2 -7,238.4 -1.0 -1.0 250,195.8
0.0 4,996.3 0.0 10.6 0.0 0.0 0.0 10.6 5.4 16.0 5,012.3 -50.6 -117.8 -150.9 4,693.0
2,760.6 469,579.7 15,055.5 305,616.4 105,529.3 136,932.9 503.3 563,637.4 86,769.4 650,406.8 1,119,986.5 -102,168.1 0.0 0.0 1,017,818.4
19.6 15,055.5
59.4 265,799.2
1,564.8 103,905.3
230.1 131,071.1
82.1 35,668.0
-0.0 -3,260.4
1,932.4 548,238.7
4,693.0 1,017,818.4
Final demand
h lj ki
Column Codes are:
a : Consumption expenditure outside households
b : Consumption expenditure (private)
c : Consumption expenditure of general government
d : Gross domestic fixed capital formation
e : Increase in stocks
f : Total Domestic final demand
g : Exports
h : Total demand
i : (Less) Imports
j : (Less) Trade margin
k : (Less) Trade margin
l : Domestic production
Notes:
1. Component figures may not add up to the total because of rounding.
2. Treatment of consumption tax is the same as Table Valued at Producer's Price
- 9 -

2. Total Supply and Growth
Total supply of Domestic production and Imports reached 1119.9865 trillion yen, of which domestic production is 1017.8184
trillion yen (90.9% of the total supply value) and imports is 102.1681 trillion yen (9.1% of the total supply value). Compared to
2011, the composition of Total supply for Domestic production decreased by 1.0 points.
With respect to growth from 2011 levels, Domestic production increased by 8.3% and Imports increased by 22.9%, resulting in
a 9.5% increase of Total supply.
Chart 1-2 Composition of the Total Supply Chart 1-3 Growth of the Total Supply
Table 1-3 Composition and Growth of the Total Supply
(6.9) (8.1) (9.1)
(93.1) (91.9)
(90.9)
0
200
400
600
800
1,000
1,200
2005 2011 2015
(trillion yen)
Domestic production
Imports
-10
0
10
20
30
Total supply Domestic
production
Imports
2011~2015
2005~2011
(%)
2005 2011 2015 2005 2011 20152005~
2011
2011~
2015
1,044,497.8 1,022,832.9 1,119,986.5 100.0 100.0 100.0 △ 2.1 9.5
Domestic
production972,014.6 939,674.9 1,017,818.4 93.1 91.9 90.9 △ 3.3 8.3
Imports 72,483.1 83,158.1 102,168.1 6.9 8.1 9.1 14.7 22.9
Total supply
Value(billion yen) Distribution ratio(%) Growth rate(%)
- 10 -

3. Composition and Growth of Total Demand
Total demand for 2015 was 1119.9865 trillion yen with the breakdown figures as 469.5797 trillion yen (41.9%) for Intermediate
demand, 563.6374 trillion yen (50.3%) for Domestic final demand (of which, 426.2012 trillion yen is Consumption (38.1%) and
137.4362 trillion yen is Investments (12.3%)), and 86.7694 trillion yen for Exports (7.7%).
As compared to 2011, Intermediate demand decreased by 3.3 points, Domestic final consumption increased by 2.6 points (of
which, Consumption decreased by 0.2 points and Investments increased by 2.9 points), and Exports increased by 0.6 points.
With respect to growth from the 2011 levels, Total demand, Intermediate demand, and Exports increased by 9.5%, 1.5%, and
19.7%, respectively. For Domestic final demand, Consumption and Investments increased by 8.9% and 43.0%, respectively, resulting
in a 15.6% increase in Domestic final demand.
Chart 1-5 Growth of Total Demand
Table 1-4 Composition and Growth of Total Demand
Chart 1-4 Composition of Total Demand
44.6
45.2
41.9
36.9
38.3
38.1
11.5
9.4
12.3
7.1
7.1
7.7
0 10 20 30 40 50 60 70 80 90 100
2005
2011
2015
(%)
Intermediate demand ExportsConsumption Investment
-30
-20
-10
0
10
20
30
40
50
Total demand Intermediate
demand
Domestic final
demand
Consumption Investment Exports
(%)
2005~2011
2011~2015
2005 2011 2015 2005 2011 20152005~
2011
2011~
2015
1,044,497.8 1,022,832.9 1,119,986.5 100.0 100.0 100.0 △ 2.1 9.5
466,140.6 462,769.6 469,579.7 44.6 45.2 41.9 △ 0.7 1.5
578,357.2 560,063.3 650,406.8 55.4 54.8 58.1 △ 3.2 16.1
504,588.5 487,555.4 563,637.4 48.3 47.7 50.3 △ 3.4 15.6
Consumption 384,928.0 391,421.4 426,201.2 36.9 38.3 38.1 1.7 8.9
Investment 119,660.5 96,134.0 137,436.2 11.5 9.4 12.3 △ 19.7 43.0
73,768.7 72,507.9 86,769.4 7.1 7.1 7.7 △ 1.7 19.7
970,729.1 950,325.0 1,033,217.1 92.9 92.9 92.3 △ 2.1 8.7
Exports
Growth rate(%)
Domestic demand
Total demand
Value(billion yen) Distribution ratio(%)
Intermediate demand
Final demand
Domestic final demand
- 11 -

4. Domestic Production by Industry
Observing Domestic production in 2015 by the 13 sectors, the Manufacturing sector has the highest ratio (29.8%, 302.8092 trillion
yen), followed by Services (24.6%, 250.1958 trillion yen), Commerce (9.4%, 95.4789 trillion yen), and Real Estate (7.9%, 80.7189
trillion yen).
When comparing this to the 2011 levels, industries that increased include Service (0.8 points), Construction (0.4 points), Real
Estate (0.3 points), and Transport and postal services (0.3 points); sectors that decreased include Manufacturing (1.0 points),
Commerce (0.6 points), and Public administration (0.3 points).
Observing industries as primary, secondary, or tertiary industries, the primary industries accounted for 1.3% of Domestic
production (12.8876 trillion yen), the secondary industries accounted for 35.8% (364.4937 trillion yen), and the tertiary industries
accounted for 62.9% (640.4371 trillion yen), indicating that there continues to be an increasing trend in the component ratio of
tertiary industries.
Chart 1-6 Domestic Production by Industrial Classification
Table 1-5 Domestic Production by Industrial Classification
Notes: Primary industries : a
Secondary industries: b, c, d,
Tertiary industries : e, f, g, h, i, j, k, l, m
31.5
30.8
29.8
6.5
5.6
6.0
10.9
10.0
9.4
6.8
7.6
7.9
5.4
5.1
5.4
4.5
4.9
4.9
4.0
4.2
3.9
21.8
23.8
24.6
0 10 20 30 40 50 60 70 80 90 100
2005
2011
2015ic d f h l
a(1.3)
b(0.1)
j k
g(3.5)m(0.5)
e(2.9)
2005 2011 2015 2005 2011 2015
972,014.6 939,674.9 1,017,818.4 100.0 100.0 100.0
a Agriculture, forestry and fishery 13,154.6 12,036.0 12,887.6 1.4 1.3 1.3
b Mining 1,008.4 760.0 847.9 0.1 0.1 0.1
c Manufacturing 306,322.4 289,241.3 302,809.2 31.5 30.8 29.8
d Construction 63,237.3 52,514.5 60,836.6 6.5 5.6 6.0
e Electricity, gas and water supply 23,235.7 25,754.7 29,179.3 2.4 2.7 2.9
f Commerce 106,274.5 93,655.8 95,478.9 10.9 10.0 9.4
g Finance and insurance 41,751.5 32,332.3 35,448.2 4.3 3.4 3.5
h Real estate 66,205.9 71,187.5 80,718.9 6.8 7.6 7.9
i Transport and postal services 52,661.4 48,257.6 55,009.4 5.4 5.1 5.4
j Information and communications 43,940.2 46,136.7 49,974.5 4.5 4.9 4.9
k Public administration 38,537.9 39,405.2 39,739.0 4.0 4.2 3.9
l Services 211,716.8 223,383.1 250,195.8 21.8 23.8 24.6
m Activities not elsewhere classified 3,968.0 5,010.3 4,693.0 0.4 0.5 0.5
13,154.6 12,036.0 12,887.6 1.4 1.3 1.3
370,568.1 342,515.7 364,493.7 38.1 36.5 35.8
588,291.9 585,123.2 640,437.1 60.5 62.3 62.9
Total
Domestic production(billion yen) Distribution ratio(%)
Tertiary industries
Secondary industries
Primary industries
(%)
- 12 -

Reference: Domestic Production Trend
Domestic production for the year 2015 increased to 1,017.8184 trillion yen, 8.3% higher than the 2011 figures. This increase
translates to an average annual growth rate of 2.0% for the four years from 2011 to 2015.
In terms of the historical development of the average annual growth rate, growth from 1990 showed a slower increase, and turned
to a decrease of 0.6% from 2005 to 2011. However, the growth shifted to an increase of 2.0% from 2011 to 2015.
Table 1-6 Domestic Production Trend
Table 1-7 Annual Change of Domestic Production
Chart 1-7 Domestic Production Trend
678.5
872.2
937.1958.9 972.0
939.7
1017.8
0
200
400
600
800
1,000
1,200
1985 1990 1995 2000 2005 2011 2015
(trillion yen)
Domestic production
1985 1990 1995 2000 2005 2011 2015
Domestic production(billion yen) 678,544.1 872,212.2 937,100.6 958,886.5 972,014.6 939,674.9 1,017,818.4
1980~1985 1985~1990 1990~1995 1995~2000 2000~2005 2005~2011 2011~2015
Growth rate(%) 22.3 28.5 7.4 2.3 1.4 -3.3 8.3
Average annual growth rate(%) 4.1 5.1 1.4 0.5 0.3 -0.6 2.0
- 13 -

5. Growth of Domestic Production by Industry
Observing domestic production in 2015 based on the 37-sector classification table, Commerce has the highest domestic production
with 95.4789 trillion yen, followed by Real estate (80.7189 trillion yen), Business services (74.7886 trillion yen), and Medical, health
care and welfare (67.5868 trillion yen).
With regard to growth as compared to 2011, domestic production is increasing in sectors such as Waste management service
(30.2%), Education and research (23.0%), Transportation equipment (21.5%), while decreasing in sectors such as Information and
communication electronics equipment (31.0%), Petroleum and coal products (15.2%) and Membership-based associations, n.e.c.
(14.2%).
Observing the extent of the impacts (contribution level) of each industry on the domestic production growth rate (8.3% increase),
Transportation equipment (1.04%) and Real estate (1.01%) have been contributing to the increase.
Table 1-8 Growth of Domestic Production by Industrial Classification
Chart 1-8 Growth of Domestic Production by Industrial Classification
2005 2011 20152005~
2011
2011~
2015
A Total 972,014.6 939,674.9 1,017,818.4 △ 3.3 8.3
01 Agriculture, forestry and fishery 13,154.6 12,036.0 12,887.6 △ 8.5 7.1 0.09
06 Mining 1,008.4 760.0 847.9 △ 24.6 11.6 0.01
11 Beverages and Foods 35,140.9 34,877.7 38,348.6 △ 0.7 9.9 0.37
15 Textile products 4,374.8 3,354.1 3,586.0 △ 23.3 6.9 0.02
16 Pulp, paper and wooden products 12,829.6 11,068.5 11,953.6 △ 13.7 8.0 0.09
20 Chemical products 27,487.0 27,633.9 28,006.9 0.5 1.3 0.04
21 Petroleum and coal products 16,920.2 19,857.2 16,834.6 17.4 △ 15.2 △ 0.32
22 Plastic products and rubber products 13,636.1 12,906.1 13,998.0 △ 5.4 8.5 0.12
25 Ceramic, stone and clay products 7,155.9 6,439.5 6,310.6 △ 10.0 △ 2.0 △ 0.01
26 Iron and steel 25,314.0 30,487.2 27,342.7 20.4 △ 10.3 △ 0.33
27 Non-ferrous metals 7,330.0 9,061.9 8,806.6 23.6 △ 2.8 △ 0.03
28 Metal products 12,484.4 10,131.3 11,736.9 △ 18.8 15.8 0.17
29 General-purpose machinery 10,474.7 9,424.8 10,458.6 △ 10.0 11.0 0.11
30 Production machinery 15,905.4 14,359.1 16,704.9 △ 9.7 16.3 0.25
31 Business oriented machinery 7,843.6 6,433.8 6,903.3 △ 18.0 7.3 0.05
32 Electronic components 16,701.5 13,408.4 13,536.1 △ 19.7 1.0 0.01
33 Electrical machinery 15,272.4 15,042.7 16,062.7 △ 1.5 6.8 0.11
34Information and communication
electronics equipment11,081.6 7,902.4 5,456.5 △ 28.7 △ 31.0 △ 0.26
35 Transportation equipment 53,016.3 45,571.5 55,377.7 △ 14.0 21.5 1.04
39 Miscellaneous manufacturing products 11,836.2 9,956.2 9,929.3 △ 15.9 △ 0.3 △ 0.00
41 Construction 63,237.3 52,514.5 60,836.6 △ 17.0 15.8 0.89
46 Electricity, gas and heat supply 18,677.2 21,187.3 24,633.7 13.4 16.3 0.37
47 Water supply 4,558.5 4,567.4 4,545.6 0.2 △ 0.5 △ 0.00
48 Waste management service 3,748.0 3,765.1 4,902.0 0.5 30.2 0.12
51 Commerce 106,274.5 93,655.8 95,478.9 △ 11.9 1.9 0.19
53 Finance and insurance 41,751.5 32,332.3 35,448.2 △ 22.6 9.6 0.33
55 Real estate 66,205.9 71,187.5 80,718.9 7.5 13.4 1.01
57 Transport and postal services 52,661.4 48,257.6 55,009.4 △ 8.4 14.0 0.72
59 Information and communications 43,940.2 46,136.7 49,974.5 5.0 8.3 0.41
61 Public administration 38,537.9 39,405.2 39,739.0 2.3 0.8 0.04
63 Education and research 37,041.6 35,500.4 43,680.5 △ 4.2 23.0 0.87
64 Medical, health care and welfare 50,046.6 60,036.7 67,586.8 20.0 12.6 0.80
65 Membership-based associations, n.e.c. 5,030.6 5,165.6 4,431.8 2.7 △ 14.2 △ 0.08
66 Business services 63,827.9 66,161.2 74,788.6 3.7 13.0 0.92
67 Personal services 52,022.0 52,754.1 54,806.1 1.4 3.9 0.22
Growth rate (%)Domestic production(billion yen)Contributions
to changes (%)
-40
-30
-20
-10
0
10
20
30
40
A 01 06 11 15 16 20 21 22 25 26 27 28 29 30 31 32 33 34 35 39 41 46 47 48 51 53 55 57 59 61 63 64 65 66 67
2011~2015
2005~2011
(%)
- 14 -

6. Intermediate Inputs and Gross Value Added
Of the 1017.8184 trillion yen worth of domestic production in 2015, the expenditure (intermediate input) of goods and services
required for production accounted for 469.5797 trillion yen (ratio for intermediate input of 46.1%), while the gross value added,
which increased through production activities, amounted to 548.2387 trillion yen (ratio for gross value added of 53.9%).
The ratio of intermediate input decreased by 3.1 points from that of 2011.
Chart 1-9 Intermediate Inputs and Gross Value Added
Table 1-9 Intermediate Inputs and Gross Value Added
48.0
49.2
46.1
52.0
50.8
53.9
0 10 20 30 40 50 60 70 80 90 100
2005
2011
2015
Gross value addedIntermediate inputs
(%)
2005 2011 2015 2005 2011 20152005~
2011
2011~
2015
972,014.6 939,674.9 1,017,818.4 100.0 100.0 100.0 △ 3.3 8.3
Intermediate inputs 466,140.6 462,769.6 469,579.7 48.0 49.2 46.1 △ 0.7 1.5
Gross value added 505,874.1 476,905.3 548,238.7 52.0 50.8 53.9 △ 5.7 15.0
Domestic production
Distribution ratio (%) Growth rate(%)Value (billion yen)
- 15 -

7. Intermediate Input Ratio by Industry
Observing the intermediate input ratio by industry based on the 37-sector classification table 2015, shows high trends in the
manufacturing sector, including Transportation equipment (75.8%), Non-ferrous metals (75.4%), and Iron and steel (73.6%). For
sectors other than manufacturing, Electricity, gas and heat supply (64.2%), Construction (53.1%), and Agriculture, forestry and
fishery (52.3%) also show high trends.
However, Real estate (15.9%) and Education and research (26.8%) remain low.
When compared to 2011, the range of decrease in Electricity, gas and heat supply (down by 13.3 points) is the largest, followed
by Electronic components (9.6 points), and Business oriented machinery (9.5 points).
Chart 1-10 Intermediate Input Ratio by Industry
(%)
48.0 49.2 46.1
01 Agriculture, forestry and fishery 47.2 51.5 52.3
06 Mining 57.0 55.2 48.0
11 Beverages and Foods 61.9 63.5 62.8
15 Textile products 66.1 66.1 59.7
16 Pulp, paper and wooden products 65.3 68.7 64.3
20 Chemical products 73.3 75.3 66.5
21 Petroleum and coal products 70.2 77.7 69.9
22 Plastic products and rubber products 66.9 68.9 61.7
25 Ceramic, stone and clay products 56.1 56.1 51.5
26 Iron and steel 76.1 81.3 73.6
27 Non-ferrous metals 76.9 76.7 75.4
28 Metal products 56.7 62.4 55.1
29 General-purpose machinery 64.2 61.9 55.8
30 Production machinery 62.4 59.3 53.8
31 Business oriented machinery 70.2 68.0 58.5
32 Electronic components 73.0 71.9 62.3
33 Electrical machinery 68.8 69.6 63.7
34 Information and communication electronics equipment 76.1 73.3 64.7
35 Transportation equipment 80.7 80.1 75.8
39 Miscellaneous manufacturing products 52.6 57.4 53.5
41 Construction 53.8 54.8 53.1
46 Electricity, gas and heat supply 56.5 77.5 64.2
47 Water supply 48.0 52.0 50.1
48 Waste management service 27.7 27.3 33.8
51 Commerce 31.5 31.5 30.1
53 Finance and insurance 36.3 34.2 32.5
55 Real estate 14.6 19.4 15.9
57 Transport and postal services 51.0 49.7 48.5
59 Information and communications 41.9 47.4 48.4
61 Public administration 26.3 31.7 29.2
63 Education and research 25.9 25.2 26.8
64 Medical, health care and welfare 40.0 40.8 38.0
65 Membership-based associations, n.e.c. 36.0 41.4 40.0
66 Business services 40.6 38.6 37.5
67 Personal services 42.2 45.0 46.8
Total
2005 2011 20150 20 40 60 80 100
2015
2011
(%)
2005
- 16 -

8. Intermediate Input Ratios of Services by Industry
Observing the intermediate input ratios of services by industry in 2015 after dividing intermediate inputs into “goods” and
“services,” the intermediate input ratio for the industry total is 22.7%, indicating a decrease of 1.2 points as compared to 2011
(23.9%).
In terms of the 37-sector classification table, Information and communications has the highest intermediate input ratio at 43.1%,
followed by Mining at 39.3%, Water supply at 38.9%, Transport and postal services at 34.9%, and Finance and Insurance at 29.3%.
On the other hand, the intermediate input ratio is lowest for Petroleum and coal products at 4.8%, followed by Transportation
equipment at 10.5%, Iron and steel at 11.0%, Production machinery at 13.2%, and Information and communication electronics
equipment at 13.7%.
Compared to 2011, sectors that increased include Waste management service (by 7.3 points), Education and research (by 2.6
points), and Personal services (by 1.6 points), while those that decreased include Information and communication electronics
equipment (by 8.5 points), Electronic components (by 8.1 points), Chemical products (by 7.8 points), and Business oriented
machinery (by 7.8 points).
Chart 1-11 Intermediate Input Ratios of Services by Industry
(%)
23.8 23.9 22.7
01 Agriculture, forestry and fishery 14.7 16.8 16.9
06 Mining 49.1 45.4 39.3
11 Beverages and Foods 18.8 18.1 17.4
15 Textile products 22.6 23.4 19.6
16 Pulp, paper and wooden products 23.2 23.5 20.7
20 Chemical products 26.0 24.8 17.0
21 Petroleum and coal products 6.1 4.6 4.8
22 Plastic products and rubber products 19.5 20.1 16.3
25 Ceramic, stone and clay products 28.5 25.7 23.6
26 Iron and steel 13.8 10.9 11.0
27 Non-ferrous metals 18.5 16.1 13.9
28 Metal products 18.3 18.1 15.3
29 General-purpose machinery 20.2 19.0 14.4
30 Production machinery 20.3 18.3 13.2
31 Business oriented machinery 23.9 21.8 14.0
32 Electronic components 25.4 23.7 15.6
33 Electrical machinery 26.1 21.6 14.5
34 Information and communication electronics equipment 24.7 22.2 13.7
35 Transportation equipment 15.3 15.0 10.5
39 Miscellaneous manufacturing products 25.1 28.1 24.7
41 Construction 24.3 26.5 23.9
46 Electricity, gas and heat supply 26.0 31.7 25.5
47 Water supply 34.8 37.6 38.9
48 Waste management service 21.5 21.0 28.3
51 Commerce 27.6 27.6 26.6
53 Finance and insurance 32.7 30.6 29.3
55 Real estate 9.7 14.7 14.8
57 Transport and postal services 37.0 33.7 34.9
59 Information and communications 35.2 41.8 43.1
61 Public administration 17.3 22.9 23.4
63 Education and research 18.8 18.2 20.8
64 Medical, health care and welfare 21.3 23.1 20.4
65 Membership-based associations, n.e.c. 25.4 30.5 28.2
66 Business services 28.8 27.1 27.9
67 Personal services 25.2 25.9 27.5
Total
2005 2011 20150 20 40 60
2015
2011
(%)
2005
- 17 -

9. Composition and Growth Rates of Gross Value Added
The amount of gross value added for 2015 is 548.2387 trillion yen. This figure breaks down into 265.7992 trillion yen for
Compensation of employees (48.5%), 131.0711 trillion yen for Consumption of fixed capital (23.9%), 103.9053 trillion yen for
Operating surplus (19.0%), and 35.6680 trillion yen for Indirect taxes (6.5%).
Compared to 2011, the amount of gross value added as a whole increased by 15.0%.
Observing the contribution ratio in relation to this growth rate (15.0% increase), Consumption of fixed capital (6.58%) and
Compensation of employees (3.60%) etc. were the factors in the increase.
Chart 1-12 Composition of Gross Value Added
Chart 1-13 Growth of Gross Value Added
Table 1-10 Composition and Rate of Gross Value Added
51.2
52.1
48.5
19.7
18.2
19.0
19.1
20.9
23.9
0 10 20 30 40 50 60 70 80 90 100
2005
2011
2015
(%)
Consumption expenditure
outside households
Consumption of
employeesOperating surplus Consumption of
fixed capital
Indirect taxes
- Current
subsidies
-20
-10
0
10
20
30
40
2011~20152005~2011
(%)
Contributions to
changes (%)
2005 2011 2015 2005 2011 20152005~
2011
2011~
20152011~2015
505,874.1 476,905.3 548,238.7 100.0 100.0 100.0 △ 5.7 15.0
Consumption expenditure
outside households16,543.8 13,402.1 15,055.5 3.3 2.8 2.7 △ 19.0 12.3 0.35
Consumption of employees 259,076.4 248,652.2 265,799.2 51.2 52.1 48.5 △ 4.0 6.9 3.60
Operating surplus 99,584.6 86,806.1 103,905.3 19.7 18.2 19.0 △ 12.8 19.7 3.59
Consumption of fixed
capital96,644.8 99,708.0 131,071.1 19.1 20.9 23.9 3.2 31.5 6.58
Indirect taxes 37,531.1 31,934.1 35,668.0 7.4 6.7 6.5 △ 14.9 11.7 0.78
(less)Current subsidies △ 3,506.7 △ 3,597.2 △ 3,260.4 △ 0.7 △ 0.8 △ 0.6 2.6 △ 9.4 0.07
Total of gross value added
Value (billion yen) Distribution ratio (%) Growth rate (%)
- 18 -

10. Composition and Growth of Final Demand
The amount of final demand for 2015 was 650.4068 trillion yen. This figure breaks down into 305.6164 trillion yen for
Consumption expenditures (private) (47.0%), followed by 136.9329 trillion yen for Gross domestic fixed capital formation (21.1%),
105.5293 trillion yen for Consumption expenditures of the general government (16.2%), and 86.7694 trillion yen for Exports
(13.3%).
As compared to 2011, the final demand as a whole increased by 16.1%.
Observing the level of contribution to this growth rate (an increase of 16.1%), both Gross domestic fixed capital formation
(7.46%) and Consumption expenditures (private) (4.24%) contributed.
Table 1-11 Composition and Growth of Final Demand
Chart 1-14 Composition of Final Demand Chart 1-15 Growth of Final Demand
48.4
50.3
47.0
15.2
17.1
16.2
20.3
17.0
21.1
12.8
12.9
13.3
0 20 40 60 80 100
2005
2001
2015
(%)
u v w x y z
Contributions to
changes (%)
2005 2011 2015 2005 2001 20152005~
2011
2011~
20152011~2015
A Total final demand 578,357.2 560,063.3 650,406.8 100.0 100.0 100.0 △ 3.2 16.1
u Consumption expenditure outside households 16,802.7 13,633.3 15,055.5 2.9 2.4 2.3 △18.9 10.4 0.25
v Consumption expenditure (private) 279,979.0 281,880.6 305,616.4 48.4 50.3 47.0 0.7 8.4 4.24
wConsumption expenditure of general
government88,146.3 95,907.6 105,529.3 15.2 17.1 16.2 8.8 10.0 1.72
x Gross domestic fixed capital formation 117,591.1 95,154.2 136,932.9 20.3 17.0 21.1 △19.1 43.9 7.46
y Increase in stocks 2,069.4 979.8 503.3 0.4 0.2 0.1 △52.7 △48.6 △ 0.09
z Exports 73,768.7 72,507.9 86,769.4 12.8 12.9 13.3 △ 1.7 19.7 2.55
Value (billion yen) Distribution ratio (%) Growth rate (%)
-100
-50
0
50
100
2005~2011
2011~2015
(%)
A u v w x y z
- 19 -

11. Growth Rate and Contribution of Exports by Commodity
The amount of exports in 2015 was 86.7694 trillion yen, and when looking at the composition of exports by commodity
classification as shown in the 37-sector classification, Transportation equipment accounted for the highest (21.3%) for the whole
commodity export industry, followed by Electronic components (7.8%), Production machinery (7.4%), and Chemical products
(7.3%).
As compared to 2011, the sectors in which exports increased consisted of Transportation equipment (0.9 points), Chemical
products (0.5 points) and Electrical machinery (0.4 points), while those that decreased include Information and communication
electronics equipment (1.3 points) and Production machinery (1.1 points).
When looking at the growth rate in relation to 2011, Agriculture, forestry and fishery (124.2%) and Beverages and foods (101.8%
increase) both rose, while Information and communication electronics equipment (30.4%) and Petroleum and coal products (5.9%
decrease) dropped.
When looking at the level of contribution to the overall growth rate of industries (19.7% increase), Transportation equipment
(5.09%) and Chemical products (1.95%) both contributed.
Chart 1-16 Growth of Exports by Commodity Classification
Table 1-12 Values, Distribution Ratio, Growth, and Contribution to Changes of Imports by Commodity Classification
-60
-40
-20
0
20
40
60
80
100
120
140
(%)
2005~2011
2011~2015
Total 01 06 11 15 16 20 21 22 25 26 27 28 29 30 31 32 33 34 35 39 other
Contributions to
changes (%)
2005 2011 2015 2005 2011 20152005~
2011
2011~
20152011~2015
73,768.7 72,507.9 86,769.4 100.0 100.0 100.0 △ 1.7 19.7
01 Agriculture, forestry and fishery 62.5 50.2 112.6 0.1 0.1 0.1 △ 19.6 124.2 0.09
06 Mining 31.1 37.3 45.1 0.0 0.1 0.1 20.0 20.8 0.01
11 Beverages and Foods 265.1 342.3 690.9 0.4 0.5 0.8 29.2 101.8 0.48
15 Textile products 545.7 500.3 647.8 0.7 0.7 0.7 △ 8.3 29.5 0.20
16 Pulp, paper and wooden products 354.7 369.5 591.2 0.5 0.5 0.7 4.2 60.0 0.31
20 Chemical products 4,850.3 4,933.3 6,349.5 6.6 6.8 7.3 1.7 28.7 1.95
21 Petroleum and coal products 884.8 1,534.6 1,444.2 1.2 2.1 1.7 73.4 △ 5.9 △ 0.12
22 Plastic products and rubber products 1,812.8 2,090.6 2,462.7 2.5 2.9 2.8 15.3 17.8 0.51
25 Ceramic, stone and clay products 748.5 884.9 931.6 1.0 1.2 1.1 18.2 5.3 0.06
26 Iron and steel 2,772.7 3,403.8 3,584.6 3.8 4.7 4.1 22.8 5.3 0.25
27 Non-ferrous metals 1,227.4 2,291.4 2,394.1 1.7 3.2 2.8 86.7 4.5 0.14
28 Metal products 642.1 641.2 863.6 0.9 0.9 1.0 △ 0.1 34.7 0.31
29 General-purpose machinery 2,738.3 3,104.3 3,372.3 3.7 4.3 3.9 13.4 8.6 0.37
30 Production machinery 5,464.8 6,199.4 6,445.9 7.4 8.5 7.4 13.4 4.0 0.34
31 Business oriented machinery 1,461.4 1,427.2 2,027.4 2.0 2.0 2.3 △ 2.3 42.0 0.83
32 Electronic components 6,760.8 5,766.5 6,762.6 9.2 8.0 7.8 △ 14.7 17.3 1.37
33 Electrical machinery 5,116.3 4,843.1 6,173.9 6.9 6.7 7.1 △ 5.3 27.5 1.84
34 Information and communication electronics equipment 4,164.9 2,346.7 1,632.4 5.6 3.2 1.9 △ 43.7 △ 30.4 △ 0.99
35 Transportation equipment 15,359.2 14,777.9 18,471.9 20.8 20.4 21.3 △ 3.8 25.0 5.09
39 Miscellaneous manufacturing products 1,079.4 537.7 766.1 1.5 0.7 0.9 △ 50.2 42.5 0.32
17,426.2 16,425.5 20,999.2 23.6 22.7 24.2 △ 5.7 27.8 6.31Other
Value (billion yen) Distribution ratio (%) Growth rate (%)
Total
- 20 -

12. Commodity Export Ratios of Domestic Products
When looking at the commodity export ratios of domestic production in 2015 as categorized in the 37-sector classification table,
Electronic components had the highest ratio at 50.0%, followed by Production machinery (38.6%), Electrical machinery (38.4%),
Transportation equipment (33.4%), and General-purpose machinery (32.2%).
Compared to 2011, the ratios that increased consist of Business oriented machinery (7.2 points), Electronic components (7.0
points), and Electrical machinery (6.2 points), while ratios that decreased consist of Production machinery (4.6 points) and General-
purpose machinery (0.7 points).
Chart 1-17 Commodity Export Ratios of Domestic Products
01 Agriculture, forestry and fishery
06 Mining
11 Beverages and Foods
15 Textile products
16 Pulp, paper and wooden products
20 Chemical products
21 Petroleum and coal products
22 Plastic products and rubber products
25 Ceramic, stone and clay products
26 Iron and steel
27 Non-ferrous metals
28 Metal products
29 General-purpose machinery
30 Production machinery
31 Business oriented machinery
32 Electronic components
33 Electrical machinery
34 Information and communication electronics equipment
35 Transportation equipment
39 Miscellaneous manufacturing products
Total
Other
0 5 10 15 20 25 30 35 40 45 50 55
2005
2015
2011
(%) (%)
7.6 7.7 8.5
0.5 0.4 0.9
3.1 4.9 5.3
0.8 1.0 1.8
12.5 14.9 18.1
2.8 3.3 4.9
17.6 17.9 22.7
5.2 7.7 8.6
13.3 16.2 17.6
10.5 13.7 14.8
11.0 11.2 13.1
16.7 25.3 27.2
5.1 6.3 7.4
26.1 32.9 32.2
34.4 43.2 38.6
18.6 22.2 29.4
40.5 43.0 50.0
33.5 32.2 38.4
37.6 29.7 29.9
29.0 32.4 33.4
9.1 5.4 7.7
2.7 2.6 3.0
2005 2011 2015
- 21 -

13. Growth Rate and Contribution of Imports by Commodity
Imports in 2015 amounted to 102.1681 trillion yen, and by Commodity classification in the 37-sector classification table, the
composition of imports for Mining has the highest ratio (19.9%), followed by Beverages and Foods (7.6%), Chemical products
(7.6%), Information and communication electronics equipment (6.3%), and Textile products (5.0%).
As compared to 2011, increases in the import ratio were seen in Transportation equipment (1.6 points) and Electrical machinery
(1.0 points), while decreases in the import ratio were seen in Mining (8.1 points) and Petroleum and coal products (1.2 points).
When looking at the growth rates of imports by commodity in relation to 2011, there are increases in Transportation equipment
(88.3%), Production machinery (61.0%) and Metal products (60.6%), while decreases were seen in Mining (12.9%), Petroleum
and coal products (11.2%), and Iron and steel (6.7%).
When looking at the level of contribution to the growth rate (22.9%) of the industry total, both Transportation equipment
(2.59%) and Chemical products (2.38%) contributed.
Chart 1-18 Growth of Imports by Commodity Classification
Table 1-13 Values, Distribution Ratio, Growth, and Contribution to Changes of Imports by Commodity Classification
-40
-20
0
20
40
60
80
100
(%)
2005~20112011~2015
Total 01 06 11 15 16 20 21 22 25 26 27 28 29 30 31 32 33 34 35 39 other
Contributions to
changes (%)
2005 2011 2015 2005 2011 20152005~
2011
2011~
20152011~2015
72,483.1 83,158.1 102,168.1 100.0 100.0 100.0 14.7 22.9
01 Agriculture, forestry and fishery 2,241.8 2,562.8 2,807.9 3.1 3.1 2.7 14.3 9.6 0.29
06 Mining 15,360.2 23,309.6 20,293.3 21.2 28.0 19.9 51.8 △ 12.9 △ 3.63
11 Beverages and Foods 5,667.3 6,497.4 7,806.3 7.8 7.8 7.6 14.6 20.1 1.57
15 Textile products 3,598.6 3,819.9 5,154.5 5.0 4.6 5.0 6.2 34.9 1.60
16 Pulp, paper and wooden products 2,037.4 1,929.3 2,566.4 2.8 2.3 2.5 △ 5.3 33.0 0.77
20 Chemical products 4,035.0 5,744.1 7,726.1 5.6 6.9 7.6 42.4 34.5 2.38
21 Petroleum and coal products 2,738.6 3,775.7 3,351.7 3.8 4.5 3.3 37.9 △ 11.2 △ 0.51
22 Plastic products and rubber products 1,091.0 1,294.2 1,953.0 1.5 1.6 1.9 18.6 50.9 0.79
25 Ceramic, stone and clay products 532.6 556.9 740.2 0.7 0.7 0.7 4.6 32.9 0.22
26 Iron and steel 949.5 1,119.7 1,045.2 1.3 1.3 1.0 17.9 △ 6.7 △ 0.09
27 Non-ferrous metals 2,607.0 3,588.0 3,653.7 3.6 4.3 3.6 37.6 1.8 0.08
28 Metal products 665.6 774.9 1,244.9 0.9 0.9 1.2 16.4 60.6 0.57
29 General-purpose machinery 837.6 988.2 1,538.7 1.2 1.2 1.5 18.0 55.7 0.66
30 Production machinery 1,718.6 1,258.6 2,026.2 2.4 1.5 2.0 △ 26.8 61.0 0.92
31 Business oriented machinery 1,387.3 1,445.6 2,109.1 1.9 1.7 2.1 4.2 45.9 0.80
32 Electronic components 3,859.6 3,072.1 4,174.2 5.3 3.7 4.1 △ 20.4 35.9 1.33
33 Electrical machinery 2,501.0 2,973.6 4,723.0 3.5 3.6 4.6 18.9 58.8 2.10
34 Information and communication electronics equipment 4,326.7 4,616.3 6,412.4 6.0 5.6 6.3 6.7 38.9 2.16
35 Transportation equipment 2,804.7 2,437.2 4,588.5 3.9 2.9 4.5 △ 13.1 88.3 2.59
39 Miscellaneous manufacturing products 2,677.3 2,472.6 3,438.8 3.7 3.0 3.4 △ 7.6 39.1 1.16
10,845.8 8,921.6 14,814.1 15.0 10.7 14.5 △ 17.7 66.0 7.09Other
Total
Value (billion yen) Distribution ratio (%) Growth rate (%)
- 22 -

14. Commodity Import Ratios of Domestic Demand
As categorized in the 37-sector classification table, the commodity import ratios of domestic demand in 2015 showed the highest
for Mining (96.2%), followed by Textile products (63.7%), Information and communication electronics equipment (62.6%), and
Electronic components (38.1%).
As compared to 2011, commodity import ratios of domestic demand increased for all the sectors including Information and
communication electronics equipment (17.2 points), Electrical machinery (9.7 points), Electronic components (9.4 points), and
Business oriented machinery (7.8 points), except for Mining (0.8 points decrease).
Chart 1-19 Commodity Import Ratios of Domestic Demand
01 Agriculture, forestry and fishery
06 Mining
11 Beverages and Foods
15 Textile products
16 Pulp, paper and wooden products
20 Chemical products
21 Petroleum and coal products
22 Plastic products and rubber products
25 Ceramic, stone and clay products
26 Iron and steel
27 Non-ferrous metals
28 Metal products
29 General-purpose machinery
30 Production machinery
31 Business oriented machinery
32 Electronic components
33 Electrical machinery
34 Information and communication electronics equipment
35 Transportation equipment
39 Miscellaneous manufacturing products
Total
Other
0 10 20 30 40 50 60 70 80 90 100
2005
2015
2011
(%)
(%)
7.5 8.8 9.9
14.6 17.6 18.0
94.0 97.0 96.2
14.0 15.8 17.2
48.4 57.2 63.7
14.0 15.3 18.4
15.1 20.2 26.3
14.6 17.1 17.9
8.4 10.7 14.5
7.7 9.1 12.1
4.0 4.0 4.2
29.9 34.6 36.3
5.3 7.5 10.3
9.8 13.5 17.8
14.1 13.4 16.5
17.9 22.4 30.2
28.0 28.7 38.1
19.8 22.6 32.3
38.5 45.4 62.6
6.9 7.3 11.1
19.9 20.8 27.3
1.7 1.4 2.1
2005 2011 2015
- 23 -
15. Intensity of Product Impact
As inferred from the 2015 inverse coefficient matrix in the 37-sector classification table, a unit of increase in final demand has
produced 1.7746 times the impact on the average of all industries. By industry, there are sectors in the manufacturing industry that
has a larger impact than the average, including Transportation equipment (2.4822 times), Iron and steel (2.4718 times), and Metal
products (2.0193 times). Outside of the manufacturing industry, Construction (1.8365 times) receives a high impact.
Compared to 2011, the intensity of product impact by industry in 2015 shows decreases in all sectors excluding Waste
Management Services.
Chart 1-20 Intensity of Product Impact
1.9347 1.9183 1.7746
01 Agriculture, forestry and fishery 1.7806 1.8345 1.7928
06 Mining 1.9374 1.8882 1.7290
11 Beverages and Foods 2.0130 2.0271 1.9652
15 Textile products 1.9308 1.8691 1.6750
16 Pulp, paper and wooden products 2.1254 2.1800 2.0001
20 Chemical products 2.2219 2.2024 1.9325
21 Petroleum and coal products 1.2169 1.1838 1.1783
22 Plastic products and rubber products 2.2225 2.2035 1.9446
25 Ceramic, stone and clay products 1.8287 1.8232 1.6786
26 Iron and steel 2.6453 2.7875 2.4718
27 Non-ferrous metals 1.9647 1.8712 1.7735
28 Metal products 2.1273 2.2862 2.0193
29 General-purpose machinery 2.2150 2.1828 1.9442
30 Production machinery 2.1574 2.1198 1.9015
31 Business oriented machinery 2.1875 2.1234 1.8284
32 Electronic components 2.1640 2.1306 1.8214
33 Electrical machinery 2.1579 2.1641 1.9076
34 Information and communication electronics equipment 2.2144 2.1515 1.8371
35 Transportation equipment 2.8323 2.7755 2.4822
39 Miscellaneous manufacturing products 1.8869 1.9578 1.8105
41 Construction 1.9366 1.9463 1.8365
46 Electricity, gas and heat supply 1.6300 1.7139 1.4999
47 Water supply 1.8369 1.9056 1.7984
48 Waste management service 1.4640 1.4490 1.5189
51 Commerce 1.5130 1.5104 1.4566
53 Finance and insurance 1.5921 1.5568 1.4962
55 Real estate 1.2499 1.3171 1.2307
57 Transport and postal services 1.7940 1.7486 1.6967
59 Information and communications 1.6925 1.7860 1.7528
61 Public administration 1.4527 1.5216 1.4436
63 Education and research 1.4363 1.4195 1.4142
64 Medical, health care and welfare 1.6844 1.6746 1.5601
65 Membership-based associations, n.e.c. 1.5742 1.6538 1.5860
66 Business services 1.7046 1.6668 1.5861
67 Personal services 1.6886 1.7290 1.7205
Total
2005 2011 20150.0 0.5 1.0 1.5 2.0 2.5 3.0
2005
2015
2011
- 24 -

16. Final Demand and Induced Domestic Production
When looking at ratios by final demand item to determine which final demand items induced the domestic production of 1017.8184
trillion yen in 2015 (Domestic production inducement distribution ratios by Individual final demand items), Consumption
expenditure (private) (43.8%) was the highest, followed by Gross domestic fixed capital formation (21.8%), Exports (16.6%), and
Consumption expenditure of general government (15.4%).
As compared to 2011, the Domestic products inducement distribution ratios attributable to Gross domestic fixed capital formation
rose by 3.4 points.
When looking at the extent to which a unit of change in the final demand induced domestic production (Domestic Production
Inducement Coefficients by Individual final demand items), Exports exerted the greatest influence (1.9516 times), followed by
Consumption expenditures outside households (1.6202 times) and Gross domestic fixed capital formation (1.6189 times).
As compared to 2011, the Domestic products inducement coefficients decreased for all individual final demand items.
Chart 1-21 Domestic Production Inducement Distribution Ratios by Individual Final Demand Items
Chart 1-22 Domestic Production Inducement Coefficients by Individual Final Demand Items
Table 1-14 Domestic Production Induced, Domestic Production Inducement Distribution Ratios
and Domestic Production Inducement Coefficients by Individual Final Demand Items
2.7
2.4
2.4
44.1
46.3
43.8
14.0
16.1
15.4
22.2
18.4
21.8
16.5
16.6
16.6
0 10 20 30 40 50 60 70 80 90 100
2005
2011
2015
(%)
Consumption expenditure outside households
Consumption expenditure (private)
Consumption expenditure of general government
Gross domesticfixed capitalformation
Increase in
stocksExports
0.0
0.5
1.0
1.5
2.0
2.5
Consumption expenditure outside households
Consumption expenditure (private)
Consumption expenditure of general government
Gross domesticfixed capitalformation
Increase in
stocksExportsTotal final demand
2015
20112005
2005 2011 2015 2005 2011 2015 2005 2011 2015
972,014.6 939,674.9 1,017,818.4 100.0 100.0 100.0 1.6806 1.6778 1.5649
26,663.1 22,601.4 24,392.8 2.7 2.4 2.4 1.5868 1.6578 1.6202
428,740.0 435,256.4 445,402.6 44.1 46.3 43.8 1.5313 1.5441 1.4574
135,696.2 150,826.3 156,504.7 14.0 16.1 15.4 1.5394 1.5726 1.4830
215,934.1 173,163.3 221,685.8 22.2 18.4 21.8 1.8363 1.8198 1.6189
4,216.8 1,641.1 491.6 0.4 0.2 0.0 2.0376 1.6749 0.9769
160,764.5 156,186.5 169,340.9 16.5 16.6 16.6 2.1793 2.1541 1.9516
Consumption expenditure (private)
Consumption expenditure of general government
Gross domestic fixed capital formation
Increase in stocks
Exports
Domestic Production
Induced (billion yen)
Domestic Production
Inducement Distribution Ratio(%)
Domestic Production
Inducement Coefficient
Total final demand
Consumption expenditure outside households
- 25 -

17. Final Demand and Induced Gross Value Added
When looking at ratios by final demand item to determine which final demand items induced the gross value added of 548.2387
trillion yen in 2015 (Gross value added inducement ratio by Individual final demand items), Consumption expenditure (private)
(47.4%) was the highest, followed by Gross domestic fixed capital formation (20.0%), Consumption expenditure of general
government (17.7%), and Exports (12.6%).
As compared to 2011, the inducement impact of Gross domestic fixed capital formation and Exports on the gross value added
increased.
In so far as the impact of the induced gross value added attributable to a unit of change in the final demand is concerned (Gross
value added inducement coefficients by final demand item), Consumption expenditure of general government was the greatest
influence at 0.9171 times, followed by Consumption expenditure outside households at 0.8564 points and Consumption expenditure
(private) at 0.8495 points.
As compared to 2011, the gross value-added inducement coefficients became smaller for all individual final demand items.
Chart 1-23 Gross Value Added Inducement Ratio by Individual Final Demand Items
Chart 1-24 Gross Value Added Inducement Coefficients by The Final Demand Items
Table 1-15 Gross Value Added Induced, Gross Value Added Inducement Distribution Ratios
and Gross Value Added Inducement Coefficients by Individual Final Demand Items
2.8
2.5
2.4
48.5
50.4
47.4
16.4
18.7
17.7
19.7
16.2
20.0
12.3
12.1
12.6
0 10 20 30 40 50 60 70 80 90 100
2005
2011
2015
(%)
Consumption expenditure outside households
Consumption expenditure (private)
Consumption expenditure of general government
Gross domesticfixed capitalformation
Increase
in stocksExports
0.0
0.2
0.4
0.6
0.8
1.0201520112005
Consumption expenditure outside households
Consumption expenditure (private)
Consumption expenditure of general government
Gross domesticfixed capitalformation
Increase in
stocks
ExportsTotal final demand
2005 2011 2015 2005 2011 2015 2005 2011 2015
505,874.1 476,905.3 548,238.7 100.0 100.0 100.0 0.8747 0.8515 0.8429
14,128.4 11,763.9 12,893.7 2.8 2.5 2.4 0.8408 0.8629 0.8564
245,155.6 240,548.4 259,620.0 48.5 50.4 47.4 0.8756 0.8534 0.8495
82,904.2 89,018.0 96,784.8 16.4 18.7 17.7 0.9405 0.9282 0.9171
99,813.1 77,064.6 109,582.7 19.7 16.2 20.0 0.8488 0.8099 0.8003
1,773.1 731.3 352.8 0.4 0.2 0.1 0.8568 0.7464 0.7010
62,099.6 57,778.9 69,004.6 12.3 12.1 12.6 0.8418 0.7969 0.7953
Gross Value Added
Inducement Coefficient
Total final demand
Gross Value Added
Induced (billion yen)
Gross Value Added
Inducement Distribution
Ratio(%)
Exports
Consumption expenditure outside households
Consumption expenditure (private)
Consumption expenditure of general government
Gross domestic fixed capital formation
Increase in stocks
- 26 -

18 Final Demand and Induced Imports
When looking at ratios by final demand item to determine which final demand items induced the value of Imports of 102.1681
trillion yen in 2015 (Import inducement distribution ratios by Individual final demand items), Consumption expenditures (private)
was the highest (45.0%), followed by Gross domestic fixed capital formation (26.8%), Exports (17.4%) and Consumption
expenditures of the general government (8.6%).
As compared to 2011, the Imports inducement distribution ratios attributable to Consumption expenditure of general government,
and Gross domestic fixed capital formation increased.
The impact of the Imports inducement coefficients attributable to a unit of change in the final demand (Imports inducement
coefficients by Individual final demand items) may be traced back to such sectors as Increase in stocks (0.2990 points), followed by
Exports (0.2047 points) and Gross domestic fixed capital formation (0.1997 points).
As compared to 2011, the imports inducement coefficients increased for all individual final demand items.
Chart 1-25 Import Inducement Distribution Ratios by Individual Final Demand Items
Table 1-16 Import Induced, Import Inducement Distribution Ratios and Imports Inducement Coefficients
by Individual Final Demand Items
3.7
2.2
2.1
48.0
49.7
45.0
7.2
8.3
8.6
24.5
21.8
26.8
16.1
17.7
17.4
0 10 20 30 40 50 60 70 80 90 100
2005
2011
2015
(%)
Consumption expenditure outside households
Consumption expenditure (private)
Consumption expenditure of general government
Gross domesticfixed capitalformation
Increase
in stocksExports
0
0.1
0.2
0.3
0.4
20152011
2005
Consumption expenditure outside households
Consumption expenditure (private)
Consumption expenditure of general government
Gross domesticfixed capitalformation
Increase in
stocks
ExportsTotal final demand
2005 2011 2015 2005 2011 2015 2005 2011 2015
72,483.1 83,158.1 102,168.1 100.0 100.0 100.0 0.1253 0.1485 0.1571
2,674.3 1,869.4 2,161.8 3.7 2.2 2.1 0.1592 0.1371 0.1436
34,823.4 41,332.2 45,996.4 48.0 49.7 45.0 0.1244 0.1466 0.1505
5,242.1 6,889.5 8,744.5 7.2 8.3 8.6 0.0595 0.0718 0.0829
17,778.0 18,089.5 27,350.2 24.5 21.8 26.8 0.1512 0.1901 0.1997
296.3 248.5 150.5 0.4 0.3 0.1 0.1432 0.2536 0.2990
11,669.1 14,729.0 17,764.8 16.1 17.7 17.4 0.1582 0.2031 0.2047
Total final demand
Imports Induced (billion yen)Imports Inducement
Distribution Ratio(%)Imports Inducement Coefficient
Exports
Consumption expenditure outside households
Consumption expenditure (private)
Consumption expenditure of general government
Gross domestic fixed capital formation
Increase in stocks
Chart 1-26 Imports Inducement Coefficients by Individual Final Demand Items
- 27 -

- 28 -

CHAPTER Ⅱ
ORGANIZATIONAL STRUCTURE AND COMPILATION PROCESS
§1 Organizational Structure
1 A Joint Undertaking Organizational Structure
Since initial publication in 1955, Input-Output Tables for
Japan have been compiled jointly by various pertinent
authorities, including the Ministry of Internal Affairs and
Communications.
The 2015 Input-Output Tables were compiled as part of a
five-year project starting in 2016 involving ten Office,
Ministries and Agencies: The Ministry of Internal Affairs and
Communications; Cabinet Office; Financial Services Agency;
Mistry of Finance; Ministry of Education, Culture, Sports,
Science and Technology; Ministry of Health, Labour and
Welfare; Ministry of Agriculture, Forestry and Fisheries;
Ministry of Economy, Trade and Industry; Ministry of Land,
Infrastructure Transport and Tourism; and Ministry of the
Environment.
2 Organizational Structure and Tasks
To enable smooth compilation, the Department Head
Committee and other committees entrusted with various
relevant functions were established as indicated in Chart 2-1.
Table 2-1 gives the functional assignments to Office,
Ministries and Agencies.
Chart 2-1 Work Implementation Structure
Notes: 1 Technical Committee
Comprised of a panel of specialists capable of advising the
Department Head Committee on technical matters related to
the I-O Tables.
2 Management Committee
Comprised of representatives of authorities participating in
joint projects.
3 Operating Budget
For the operating budgets for compiling Input-Output Tables,
necessary expenses (excluding personnel labor costs) are
earmarked in a lump sum to the Ministry of Internal Affairs and
Communications, which in turn distributes the funds to the
appropriate authorities in accordance with operational specifics.
Table 2-1 Major Assignments of Operations
Name Primary Operations
Ministry of
Internal Affairs
and
Communications
Planning, liaising, coordination, and
publication
Computerized tabulation and analysis
calculations
Postal services and mail delivery,
information and communications
(exclusive of those covered by the
Cabinet Office and other ministries and
agencies)
Export and import sectors, within final
demand sectors
Cabinet Office Sewage disposal, public administration,
miscellaneous non-profit services,
personal services (exclusive of those
covered by other ministries and agencies)
Final demand sectors (exclusive of export
and import sectors)
Gross value added sectors (exclusive of
employee compensation)
Financial
Services
Agency
Finance and insurance sectors
Ministry of
Finance
Salt, alcohol, tobacco, legal, financial and
accounting service sectors
Ministry of
Education,
Culture, Sports,
Science and
Technology
Education and research
Ministry of
Health, Labour
and Welfare
Medicaments, water supply including
private water supply, medical and welfare
services, worker dispatch services,
building maintenance services, life and
hygiene related services
Total of compensation of employees, of
gross value added sectors
Ministry of
Agriculture,
Forestry and
Fisheries
Agriculture, forestry and fishery, beverage
and food manufacturing industries
(exclusive of liquors and tobacco),
lumber, and eating and drinking services
Ministry of
Economy, Trade
and Industry
Mining and manufacturing industries
(exclusive of those covered by the
Cabinet Office and other ministries and
agencies), recovery and processing of
Department Head Committee
Division Head Committee Technical Committee
Management Committee
- 29 -

recycled resources, electricity, gas and
heat supply, industrial water supply,
commerce, information services,
newspapers, publication, business services
(exclusive of those covered by the
Cabinet Office and other ministries and
agencies)
Office supplies
Ministry of
Land,
Infrastructure,
Transport and
Tourism
Construction, real estate and civil
engineering sectors
Transport, ships and repair of ships,
rolling stock and repair of rolling stock
Ministry of the
Environment
Waste treatment services
§2 Overview of Compilation Project
As shown in Table 2-2, the compilation of Input-Output
tables can be categorized into “I Review of Framework and
Preliminary Work”, “II Main Work for Compiling input-Output
tables” and “III Compilation of Linked Input-Output tables”,
but as enormous amounts of materials are handled, and work
contents cover a broad range of topics, compilation was
implemented as a joint project by the 10 authorities, and the
project period extended for more than 4 years.
In addition, among the various statistical tables created as
Input-Output tables, the “Basic Transaction Table,” which
serves as the most basic table, was compiled based on the
procedure shown in Chart 2-2.
An overview is shown below for each work category.
1 Determination of Basic Guidelines
Since the first publication in 1955, Input-Output tables for
Japan have been compiled roughly every five years as a joint
project by relevant authorities. However, the compilation
cycle and work structure are not legally specified. Since the
tables are a large-scale project spanning over five years as a
joint project by relevant authorities, in order to systematically
and rationally carry out work, it is necessary to create a
framework beforehand regarding the format of the Input-
Output tables, the division of work, and the schedule. In
addition, as Input-Output tables are positioned as part of the
SNA (System of National Accounts) and it is necessary to
achieve consistency with the Japan Standard Industrial
Classification and the International Standard Industrial
Classification in establishing sectors, it is also necessary to
organize review topics in the compilation process.
To support such requirements, the Basic Guidelines are
what are decided on by the Department Head Committee as
something that indicates the fundamental design for when
starting work to compile Input-Output tables. For the 2015
tables, the “2015 Basic Guidelines for Input-Output tables”
were decided on in March 2016.
In these Basic Guidelines, the following points were
clarified as basic recognition for when compiling the 2015
tables:
[1] “Master Plan Concerning the Development of Official
Statistics” of 2014, (approved by the Cabinet on March
25, 2014) incorporating various issues related to Input-
Output tables was formulated.
[2] The 2008 United Nation recommendations for SNA
which needs to comply with the concepts, definitions,
etc. of the Input-Output tables classifications, and the
2013 revision of the Japan Standard Industrial
Classification should be addressed.
[3] Changes in the survey timing of the Economic Census
for Business Activity should be addressed. (The current
census targeting 2015 will be postponed for 4 months
(June 2016) unlike the previous census targeting for
2011 which was conducted in February 2012.
On that basis, major topics for review are as follows.
[1] Issues raised in “Master Plan Concerning the Development
of Official Statistics” of 2014 should be addressed.
[2] Issues associated with 2008 United Nation
recommendation and the revision, etc. of the Japan
Standard Industrial Classification should be addressed.
In addition, with regard to the project structure, it was
specified that the project will be implemented as a joint
project by the ten authorities, including the Ministry of
Internal Affairs and Communications, in continuation of the
previous 2011 Input-Output tables.
- 30 -

Table 2-2 Compilation Workflow for Input-Output Tables
Work category Major contents of work Work period
Ⅰ Review of Framework and Preliminary Work
① Determination of Basic Guidelines
Formulation of basic design for compiling Input-Output tables,
such as project implementation structure, points to consider in
compiling tables, major review items, compilation schedule, etc.
2016.3 Determination
② Determination of Basic Outline of
compilation
Organization and refinement of the following items, based on the
basic design presented in the Basic Guidelines
・Basic framework for compilation
・Changes from the previous tables
・Compilation procedure, work contents
・Establishment of sector classifications, concept/definition/scope
of each sector, etc.
2016.3~2017.8 Review
2017.8 Determination
Based on the determination on the Basic Outline, the Minister of
Internal Affairs and Communications is notified of compilation
method (change) based on Article 26 of the Statistics Act
2019.4
③ Collection and Arrangement of
Basic Data
・Statistical data
・Administrative record
・Reclassified counting
・Surveys on Input-Output structure
・Industry data
2016.4~2018.12
Ⅱ Main Work for Compiling Input-Output tables
④ Estimating and balancing of figures
・Estimating domestic production
・Estimating input
・Estimating output
・Balancing of input and output
2018.1~2019.5
⑤ Compilation of various coefficients
tables
・Input coefficients table
・Inverse matrix coefficients table
・Domestic production inducement coefficients table
・Gross Value added inducement coefficients table
・Import inducement coefficients table
・Others
⑥ Compilation of various
supplementary tables
・Table on value and Quantity
・Table on scrap and by-products
・Table on employees engaged in production activities(by
Occupation)
・Employment matrix
・Fixed capital matrix
・Table on commodity output by industry
・Table on self-transport
2019.3~2019.6
⑦ Publication of the results and
preparation of report
・Publishing the results
・Distributing materials in the Cabinet meeting (points and
summary)
2019.6
2019.7
Ⅲ Tabulation of the Linked I-O Tables
⑧ Compilation and Publication of the
Linked I-O Tables
・Establishing the sector classification for the Linked I-O Tables
・Compiling Linked I-O Tables at current price
・Computing Inflator
・Compiling Linked I-O Tables at constant price
・Publishing the results
2019.7~2020.8
- 31 -

Chart 2-2 Overview of Input-Output Table Compilation Procedure
(Note) The following explanations concern [1]–[6] above.
[1] Establishing sector classifications
Various statistics based on different classifications are used as the basic data for the Input-Output Tables. It is therefore necessary to establish
sector classifications in terms of their concept, definition, and scope in order to record Japan’s industry activity in a well-integrated manner. The
following work is performed in accordance with these sector classifications.
[2] Collection and Arrangement of Basic Data
In addition to gathering information related to existing statistics, such as information on administrative records and information on primary
statistics, which are represented in the Economic Census, information on input structure and output structure, which are not obtained in existing
statistics, is obtained by carrying out “Survey on Input-Output Structure.”
For existing statistics, reclassified counting is carried out so that values correspond to the sectors in the Input-Output tables.
[3] Estimating domestic production
Domestic production is estimated by sector using the basic data.
[4] Estimating input
The breakdown (detailed breakdown of raw materials and gross value added) of the domestic productions by column sectors (goods or
services) is estimated based on the surveys of production costs and the Survey on Input-Output Structure. The Input Table is then compiled.
[5] Estimating output
The breakdown of customers by row sectors (goods or services) is estimated based on the surveys of product supply and demand. The Output
Table is then compiled.
[6] Balancing input and output
The figures given in the Input and Output Tables differ, as they are estimated from different statistical data. The figures for all sectors are
reconciled, made consistent, and compiled. Both are cross-checked, and the figures that are thought to be more adequate are used.
Ag
ricu
ltu
re,f
ore
sty
an
d
fish
ery
Min
ing
Man
ufa
cturi
ng
・・・・・
To
tal
Consu
mpti
on e
xpen
dit
ure
ou
tsid
e h
ou
seh
old
s
Pri
vat
e co
nsu
mp
tion
exp
end
itu
re
Consu
mpti
on e
xpen
dit
ure
of
gen
eral
go
ver
nm
ent
Gro
ss d
om
esti
c
fix
ed c
apit
al f
orm
atio
n
Incr
ease
in
sto
cks
Ex
po
rts
To
tal
A B C
↓ Column
→ Row
計 D
[6] Balancing input and output
Column (A sector)
Total E
Row (B sector)
[4]E
stim
atin
g i
np
ut
Gro
ss v
alu
e ad
ded
Estimating input from one statistics (A-sector side)
In this case, the estimates from one statistics do not match
those from another. For this reason, they are adjusted and
fixed at single figure by determining which data is more
appropriate for this grid in terms of method of estimating
coverage ratio of the statistics and definition of commodity
Demand sector (buyer) Intermediate demand Final demand
(Less)
ImportsDomestic
production
A+B-C
Supply sector (seller)
[1] Establishing sector classificationsIn
term
edia
te i
np
ut
Agriculture,foresty
and fishery
[3]
Estimating
production
Mining
Consumption
expenditure
Compensation of
employees
Operating surplus Estimating input from another statistics
・・・・・
[3] Estimating domestic productionDomestic production D+E
Estimating output
from another statistics
(Less) Current
subsidies
[1]
Est
abli
shin
g s
ecto
r cl
assi
fica
tio
ns
Manufacturing [5]Estimating output
・・・・・
[2] Collection and Arrangement of Basic Data
[2] Collection and Arrangement of Basic Data
- 32 -

2 Determination of the Basic Outline of
Compilation
(1) Determination of the Basic Outline of
Compilation
The Basic Guidelines described in the preceding section
specify the major orientation and review topics in starting
work to compile the Input-Output tables. Input-Output tables
cover domestic economic activities, estimate various
transactions concerning goods and services using various
statistics and other materials in the light of input and output,
and compile the results into tables. In order to carry out
concrete work for compiling Input-Output tables, it is
necessary to set details beforehand, such as how to
comprehend transaction activities, of what kind of scope,
based on what kinds of principles, as well as what kind of
estimation method to use, and as a result, what kind of
statistical tables to compile.
Based on these kinds of necessities, the Basic Outline of
Compilation specifies “detailed designs” for compiling
Input-Output tables, such as (1) the basic framework for
compilation, (2) changes from previous tables, (3)
compilation procedure and work contents, (4) establishment
of sector classifications and the concept/definition/scope of
each sector, etc.
For the 2015 Input-Output tables, the Management
Committee conducted reviews while obtaining advice from
the Technical Committee regarding specialized technical
matter, and specified the “Basic Outline for Compiling 2015
Input-Output Tables,” which was determined at the
Department Head Committee in August 2017.
(2) Changes in Sector Classifications
In the process of reviewing the Basic Outline of
Compilation, sector classifications were reexamined.
A list of sector classifications used in the 2015 Input-
Output tables is shown in Chapter VI.
(3) Notification of Compilation Method Based on
Article 26 of the Statistics Act
In the Statistics Act, among the statistics compiled by the
government’s administrative agencies, those that are
particularly important are oriented as “fundamental
statistics,” and the procedures for when statistics that are
compiled based on a method other than statistical surveys
(so-called processed statistics and administrative statistics)
are designated as “core statistics.” Concretely, based on
Article 26 of the Statistics Act, it is necessary to notify the
Minister for Internal Affairs and Communications
beforehand regarding the method for compiling statistics.
Even for the Input-Output tables, this procedure has
become necessary due to their designation as fundamental
statistics in July 2010. The Minister for Internal Affairs and
Communications was notified of the compilation method
(change) in response to the determination of the Basic
Outline of Compilation.
3 Collection and Arrangement of Basic Data
Input-Output tables are processed statistics that are
compiled using all production activities and transactions
carried out domestically over the course of a year. Thus, in
order to carry out highly accurate estimations, it is important
to systematically gather and organize materials from a wide
range of sectors, and enable for them to be used in estimation
work.
In compiling the 2015 tables, all usable data has been
collected, such as information on administrative records that
are obtained in association with procedures for permits and
approvals, as well as industry data (Refer to Table 2-3 for a
list of major data).
In addition, for sectors where there would be insufficient
information if existing data is used, “Survey on Input-Output
Structure” (Note) (Table 2-4) is carried out, and where necessary,
hearings with relevant industries were also carried out.
In estimation work, reclassified counting was carried out
for “Economic Census for Business Activity” and “Trade
Statistics” data that are used in a cross-sectoral manner across
many sectors, after replacing them for the sector
classifications in Input-Output tables.
(Note) Up until the point of compilation of the 2005 tables, this was
collectively referred to as “Special Surveys for Compilation of
Input-Output Tables,” but it has been collectively referred to as
the “Survey on Input-Output Structure” since the 2011 tables.
Table 2-3 Data Sources Used to Compile the 2015 Input-
Output Tables
Organization Title of Material
Cabinet Office National Accounts
Fact-finding Survey of Private-
sector Non-profit Institutions
Ministry of Internal
Affairs and
Population Census
Housing and Land Survey
- 33 -

Communications Labour Force Survey
Family Income and Expenditure
Survey
Employment Status Survey
Survey of Research and
Development
Yearbook of Local Financial
Statistics
Yearbook of Local Public
Enterprises
Ministry of Internal
Affairs and
Communications and
Ministry of Economy,
Trade and Industry
Economic Census
Basic Survey on the Information
and Communications Industry
Ministry of Finance Financial Statement Statistics of
Corporations by Industry
Detailed Statements on Settled
Accounts
Annual Report on Settled
Accounts of Ministries and
Agencies
Foreign Trade Statistics
Situation of Incorporated
Enterprises Based on Tax
Statistics
National Tax Agency Annual
Statistics Report
Ministry of Education,
Culture, Sports,
Science and
Technology
School Basic Survey
Social Education Survey
Current Status Survey on
School lunch
Survey of Household
Expenditure on Education per
Student
Survey on Local Education
Expenditure
Ministry of Health,
Labour and Welfare
Monthly Labour Survey
Production Statistics by
Pharmaceutical Industry
Basic Survey on Wage Structure
Survey on Economic Conditions
in Health Care (Survey on Health
Care Facilities)
Fact-finding Survey on Project of
Long-term Care (Briefing Survey
on Economic Conditions in
Long-Term Care)
Status report on Long-term Care
Insurance
Estimates of National Medical
Care Expenditure
General Survey on Working
Conditions
Water Supply Statistics
Report on worker dispatching
undertakings
Ministry of
Agriculture, Forestry
and Fisheries
Statistical Crops Survey
Statistical Survey on Milk and
Dairy Products
Statistical Lumber Survey
Statistics survey on Commodity
Price in Agriculture
Statistics of Agricultural Income
Produced
Statistics of Forestry Income
Produced
Fishery Output
Survey on Livestock Products
Marketing
Survey on Marketing of Fishery
Products
Statistics on Production Costs of
Crops
Statistics on Production Costs of
Livestock
Survey on Forestry Households
Economy
Survey on Fishery Management
Food Balance Sheets
Ministry of Economy, Trade and Industry
Statistics Survey of Current Industrial Production
Current Survey of Commerce
Survey of Selected Service Industries
Current Survey of Energy Consumption in the Selected Industries
Report concerning the State of Operations by Quarry Owners
Crushed Stone Statistics Survey
Survey on Precious Metals Distribution
Iron and Steel Supply and Demand Statistics
Non-Ferrous Metal Supply and Demand Statistics
Ready-mixed Concrete Statistics Survey
General Energy Statistics
Structural Survey of Energy Consumption
Ministry of Land, Infrastructure, Transport and Tourism
Survey on Shipbuilding and
Engineering
Survey on Current Rolling Stock Production
Annual Railroad Statistics
Survey on Railway Transport
Survey on Motor Vehicle
- 34 -

Transport
Survey on Coastwise Vessel Transport Survey on Air Transport
Consumption Trend Survey for Foreigners Visiting Japan
National Tourism Survey
Building Starts
Statistics on Construction Works
Quick Estimate of Construction Investment
Corporation Survey on Land and Buildings
Table 2-4 Surveys on Input-Output Structure Conducted for
Compilation of the 2015 Input-Output Tables
Organization/ Survey on Input-Output
Structure
Implementation
Period
<Ministry of Internal Affairs and Communications>
Survey of Service Industries and Non-Profit Organizations
2017.10~11
Survey on Management Activities of Enterprises
2016.10~11
Input Survey of Communication, Broadcasting
2016.9~10
<Ministry of Finance>
Input Survey of Liquor Industry 2016.9~12
<Ministry of Health, Labour and Welfare>
Input Survey of Medical and Social welfare
2016.9~10
<Ministry of Agriculture, Forestry and Fisheries>
Input Survey of Agricultural Service 2016.8~9
Input Survey of Seed and Seeding 〃
Input Survey of Log Production (Non-national forest)
Input Survey on Mushroom Cultivation and Production
〃
〃
〃
Input Survey of Inland Water Aquaculture
〃
Input Survey on Agriculture, Forestry and Fisheries related Manufacturing Industry
〃
Input Survey of Agricultural Construction
〃
Input Survey of Forestry Construction Ordered by Government
〃
<Ministry of Economy, Trade and Industry>
Input Survey of Mining and Manufacturing Industry
2015.10~12
Survey on Capital Goods Demand 2016.10~12
Survey on Profit Margins of Commerce 2017.10~12
Survey on Sale Destination of Import Goods
〃
<Ministry of Land, Infrastructure, Transport and Tourism>
Survey on Inland Shipping Charges by Articles
2015.10
Survey Concerning Charged Parking Lots 2016.5~7
Input Survey Concerning Packing Industry
〃
Survey on Transport-related Facilities of Local Governments
〃
Survey on Transport-related Business Input
2016.9~11
Survey on the Breakdown of Construction Ordered by Government (Preliminary Survey)
2016.4~5
Input Survey of Public Construction Works
2016.8~11
Breakdown Survey of Indirect Expenses on Civil Engineering Works
2016.9~11
Input Survey of Civil Engineering Work
2016.9~2017.1
Breakdown Survey Expenses on Civil Engineering Works ordered by incorporated administrative agencies
2016.8~10
Input Survey of Building Expenses 2016.10~2017.2
Fact-finding Survey on Real Estate Industry
〃
4 Compilation and Balancing Figures
At each stage when various basic data becomes available,
estimation work is carried out sequentially. Among the various
statistics that are compiled for Input-Output tables, the “Basic
Transaction Table” that serves as the most basic statistics was
compiled based on the following procedure. (See Chart 2-2)
[1] Estimation of domestic production
[2] Estimation of input and output(Note)
[3] Balancing of input and output
(Note) “Input” and “Output” are both terms that bear in mind the
breakdown for each of the sectors of endogenous sectors
(intermediate demand sectors, intermediate input sectors), but in
actual work to compile Input-Output tables, the breakdown of
vertical figures in the column sectors are referred to as “Input”
and the breakdown of horizontal figures in the row sectors are
referred to as “Output,” regardless of whether they are
endogenous sectors or exogenous sectors (final demand sectors,
gross value added sectors).
(1) Estimating the Domestic production
First, the value of the domestic production by sector that
is recorded in the very right and very bottom of the Basic
- 35 -

Transaction Table was estimated.
Simply put, domestic production is the total amount of
production and transactions over the course of one year for
each sector.
Domestic production by sector is a number that is first
estimated when carrying out estimation work for the Basic
Transaction Table, and after establishing this domestic
production value, input and output are estimated as its
breakdown. For this reason, errors in the value of domestic
production may affect not only input and output of its own
sector, but those for other sectors as well. In such a way,
domestic production is very important as a “control value”
for both the row sectors and column sectors in the Basic
Transaction Table, and due to such a positioning, they are
often referred to as control totals (CT).
In estimating domestic production by sector, it is better
to divide and comprehend the goods and services that are
included in each sector in as detailed of a manner as
possible in order to increase accuracy of the Basic
Transaction table. Thus, estimations were carried out of
approximately 3,400 detailed items, which were then
cumulated and domestic production was estimated by row
sector and column sector of the basic sector classification.
When doing so, in principle, production was estimated
for goods using “production quantity × unit price” for each
detailed item. Because quantitative units are irrelevant in
many service items, values are estimated directly based on
the sales amount of the respective detailed items.
Production values concerning the activities of non-market
producers of the general government and private non-profit
institutions serving households were estimated by
accumulating the cost of their activities.
(2) Input Estimates
Input estimation refers to the breakdown of the cost
composition (including gross value added composition) for
domestic production of column sectors (vertical sectors in
Basic Transaction Table).
As the general procedure for estimations, an overall
picture such as of intermediate input of raw materials, fuel,
etc. and gross value added such as compensation of
employees, etc. is estimated, and detailed items are then
estimated.
For example, for the majority of industrial products, results
of reclassified counting for the Economic Census for
Business Activity are used to estimate the overall picture of
major raw material usage, fuel consumption, cash salaries,
depreciation, etc. Next, data related to raw materials statistics
and production technology, and results of the Survey on
Input-Output Structure that was implemented separately
were used to estimate detailed expense breakdowns.
(3) Output Estimates
Output estimation refers to estimating the breakdown of
the sales channel composition, or to which intermediate
demand sector of final demand sector domestic production
in the row sectors (horizontal sectors in the Basic
Transaction table) was sold
The basic estimation method is to establish “Total supply”
as imports (absolute value) added to domestic production
by sector, from which exports are deducted to estimate the
“Gross domestic supply.” Next, this gross domestic supply
is distributed to the respective demand sectors using a wide
range of supply and demand statistics, depending on
product characteristics for detailed items.
(4) Balancing of Input and Output
Input and output values are estimated separately by
different methods, using separate basic data. As a result,
even for the same cell in the Basic Transaction Table, the
amount estimated from the input side and the amount
estimated from the output side differ at first. Hence, for
each of the cells in the Basic Transaction Table, the input is
cross-checked with the output, and balancing to conform
figures with the amounts that are thought to be more
adequate is carried out.
[Reference] Method for compiling Input-Output tables
as advocated by the United Nations
With regard to the compiling of Input-Output tables, in
the United Nations’ “Handbook of Input Output Table
Compilation and Analysis,” it is advocated that the
“supply Table” (equivalent, in terms of content, to what
used to be referred to as the “V table” (table on
commodity output by industry) and the “use table”
(equivalent to what used to be referred to as the “U table”
(table on commodity input by industry) are first compiled,
after which a “symmetric Input-output table” for
commodity × commodity (table where column sectors
and row sectors are supported one-on-one) is compiled
based on either an industrial technology assumption or
- 36 -

product technology assumption.
In Japan, however, since the 1955 tables that were
compiled as a joint project by relevant authorities, a table
of [row] commodities and [column] activities
(commodities) was “directly” compiled, based on the
methods described in (1) to (4) above, without compiling
U tables and V tables. This is thought to derive from the
fact that in Japan, there was an environment where
various statistics centering on the manufacturing industry
were developed to a significant extent, such as data
related to production for each commodity.
5 Compilation of Various Coefficients
Tables
In the process for compiling Input-Output tables, in addition
to the Basic Transaction Tables based on the basic sector
classification, Basic Transaction Tables based on aggregated
sector classifications are also compiled, depending on their
usage purpose. Basic Transaction Tables represent economic
structures for the years covered, and can be used independently
to elicit useful information. However, their use is limited to the
scope of the original tables. On the other hand, Input-Output
tables are used primarily for measuring policy effects through
analysis of the multiplier effect.
Thus, following the compilation of the Basic Transaction
Tables based on aggregated sector classifications, various
coefficients tables, such as the input coefficients tables and the
inverse matrix coefficients tables that are required for various
analyses, are compiled.
6 Compilation of Various Supplementary
Tables
The Basic Transaction Tables for Input-Output tables
summarize the state of transactions of goods and services as a
list. In order to carry out various input-output analyses,
however, there are times when supplementary information is
necessary.
Thus, in order to enable for multi-faceted use of Input-Output
tables, the following supplementary tables have been compiled.
An overview of the structure and compilation method, etc. for
each supplementary table is given in Chapter V.
[1] Table on Value and Quantity
[2] Table on Scrap and By-products
[3] Table on Employees Engaged in Production Activities (by
Occupation)
[4] Employment Matrix (Table on Employees Engaged in
Production Activities [by Occupation])
[5] Fixed Capital Matrix (Table on Fixed Capital Formation)
[6] Table on Commodity Output by Industry (Make table)
[7] Table on Self-Transports
The “Table on Trade Margins,” “Table on Domestic
Freights” and “Table on Imports” were categorized as
supplementary tables up until the 2005 tables. In terms of
content, however, information related to the trade margin,
domestic freight, and imports that are included in the Basic
Transaction Tables based on the basic sector classification is
aggregated as part of the medium aggregated classification
(107 sectors). Thus, in and after the 2011 tables, these three
tables have been sectioned as part of the statistical tables for
the medium aggregated classification, and are no longer
handled as supplementary tables.
7 Publication of the Results
Before, publication of the estimation results of the Input-
Output tables was divided into a preliminary report and final
report, based on the progress of the work. This time, as the
survey period for “Economic Census for Business Activity”
was postponed, the publication in two phases, namely the
preliminary and final reports, was integrated into one final
report to put the publication ahead compared to the 2011
tables.
The report summarizes various coefficient tables such as
the Basic Transaction Tables of the basic sector classification
(509 sectors [rows] x 391 sectors [columns]) and the minor
aggregated classification (187 sectors), as well as various
supplementary tables, all of which were compiled and
published on June 27, 2019.
Statistical tables published for the compilation of the 2015
Input-Output tables are as indicated in Table 2-5. These tables
can be obtained in Excel format from the Ministry of Internal
Affairs and Communications homepage (MIC HP:
http://www.soumu.go.jp/toukei_toukatsu/data/io/index.htm)
and is published as printed matter titled, “2015 Input-Output
Tables: Data Report.” In addition, the “2015 Input-Output
Tables: An Explanatory Report,” a comprehensive
explanatory report about the Input-Output Tables, can be
referred to on the same homepage.
- 37 -
8 Compilation and Publication of the
Linked Input-Output Tables
Although there are no major differences in the basic frame
of the Input-Output Tables compiled every five years, several
changes have been made in sector setups, as well as concepts,
definitions, and scope of respective sectors. A direct
comparison of tables from different periods is therefore not
possible.
To analyze economic structures or other aspects with
historical comparisons of these Input-Output Tables, the
sectors, concepts, definitions, and so on must be made
consistent for past tables and the newly compiled tables.
Comparable values must be projected for past tables or for
newly compiled tables.
Thus, Linked Input-Output Tables have been compiled to
enable comparisons of different points in time by reclassifying
the past Input-Output Tables for consistency with the newest
sector classifications.
The Linked Input-Output Tables produce two different
kinds of tables in accordance with price evaluation methods.
The first is “Linked Input-Output Tables at current price,” in
which tables for respective years are evaluated in terms of the
prices for those years. The other is “Linked Input-Output
tables at constant price,” in which past transaction prices are
reevaluated (inflated) to permit historical comparisons in
accordance with those in newly compiled tables.
Following the publication of the 2015 tables, the “2005-
2011-2015 Linked input-output tables” were published in
August 2020.
§ 3 Basic Framework of the Basic
Transaction Tables
The “Basic Transaction Table” that serves as the core for
various statistical tables that are compiled for the 2015 tables
were compiled based on establishing the following concepts. For
the general theory of Input-Output tables ((1) structure and how
to view the tables, (2) fundamental theory of Input-Output
tables), refer to Chapter III.
1 Duration, Scope, and Timing of Recording
The 2015 Input-Output tables cover production activities
and transactions of goods and services for Japan in the year
2015.
The accrual basis was used to determine the points in time
at which productions and transactions occurred.
2 Evaluation Methods
The size of transaction activities was evaluated based on
monetary amounts.
Domestic transactions were evaluated based on the prices
of actual transactions (actual prices).
Price evaluation of imported and exported goods was
carried out based on CIF prices for imports in ordinary trade,
and on FOB prices for exports in ordinary trade.
- 38 -

Table 2-5 List of Statistical Tables for Compilation of the 2015 Input-Output Tables
Titles of Statistical Tables Basic
(509×391)
Minor
(187)
Medium
(107)
Major
(37) Model
(1) “Self-transports” sector represented
① Basic Transaction Tables Input Table ○ ○
Output Table ○ ○
Input-Output Table Valued at Producers’
Prices ◆ ◆ ○ ○ ○
Input-Output Table Valued at Purchasers’
Prices ○ ○ ○
② Input Coefficients at Producers’ Prices ○ ○ ○ ○
③ Inverse Matrix Coefficients
Table
[I-(I-M)A]-1 ○ ○ ○ ○
(I-Ad)-1 ○ ○ ◆
(I-A)-1 ○ ○ ◆
④ Table on Production Inducement by Individual Final Demand Items ○ ○ ○ ○
⑤ Table on Gross Value Added Inducement by Individual Final Demand Items ○ ○ ○ ○
⑥ Table on Import Inducement by Individual Final Demand Items ○ ○ ○ ○
⑦ Import Coefficients, Input Coefficients of Imported Goods ○ ○ ○
⑧ Table on Trade Margins
○ ○
◆
⑨ Table on Domestic Freights ◆
⑩ Table on Imports ◆
Supplementary
tables
⑪ Table on Value and Quantity ○
⑫ Table on Scrap and By-products ○
⑬ Table on Employees Engaged in Production Activities (by Occupation) ○ ○ ○
⑭ Employment Matrix(Table on Employees Engaged in Production Activities[by
Occupation]) ○
⑮ Fixed Capital Matrix(Table on Fixed Capital Formation) ○
⑯ Table on Commodity Output by Industry ○
⑰ Table on Self-Transports ○
(2) “Self-transports” sector not represented
① Basic Transaction Tables Input Table ◆ ◆
Input-Output Table Valued at Producers’
Prices ◆ ◆
② Inverse Matrix Coefficients
Table
[I-(I-M)A]-1 ◆ ◆ ◆
(I-Ad)-1 ◆ ◆ ◆
(I-A)-1 ◆ ◆ ◆
(Note) 1 ○: Published on both the Internet and printer matter
2 ◆: Published only on the Internet
3 In addition to the statistical tables listed in this Table, “Table on Domestic Production by Sector and Commodity” was also published as a
compilation of domestic production used in compiling the 2015 tables.
3 Basic Structure of Basic Transaction
Tables
i) The Basic Transaction Table is compiled as a table of
Commodity (row) × Activity (or commodity) (column).
ii) As with the 2011 tables, both Input-Output tables at
producers’ prices(Note) and Input-Output tables at purchasers’
prices in which the respective transaction values include
trade margins and domestic freights have been compiled.
(Note) For Input-Output tables at producers’ prices, trade margins and
domestic freights that are incurred when commodities are
distributed are collectively recorded in the Commerce sector
and Transport sector, respectively (both row sectors).
iii) In order to accurately represent the size of the actual
transaction amounts, each transaction amount is
represented as the amount that includes consumption tax,
and the tax amount is included in the indirect taxes of the
gross value-added sectors.
iv) Representations related to imports are recorded as the
“competitive import type,” with the domestic products and
imported goods recorded together.
Before the 2011 table, they were represented by the
“competitive and non-competitive mixed import type”
which separately indicated partial imports (wheat, beans,
etc.).
- 39 -

4 Sector Classification
(1) Principle of Sector Classification
[1] Among the sectors that make up the Input-Output tables,
row sectors (horizontal) are sectors that represent the
sales channel structure of commodities, and are, in
principle, classified based on commodities. Column
sectors (vertical) represent the cost structure for each
production activity, and are, in principle, based on “units
of production activity,” or “activity-based” (Note).
(Note) For sectors where a single activity corresponds to a single
commodity, classifications are made based on commodities
even for column sectors.
[2] In addition to the sectors based on [1]) above, “basic
sector classification,” which are the most detailed sectors
when publishing Input-Output tables, possess
classification functions (transactor-based productivity
unit sectors) that are focused on the unit that carries out
production activity in order to promote consistency with
the System of National Accounts (SNA) indicated by the
UN Statistical Commission. (Refer to Chapter III, 5 (3))
Classifications for production activity units are
categorized based on a method of adding “*” to the end of
the basic sector classification name as follows, in
consideration of the marketability of the provided products.
・**: Non-market producers (General government)
・ *: Non-market producers (Private non-profit
institutions serving households)
・No symbol: Market producers
(2) Basic Sector Classification and Aggregated
Classification
[1] System of classifications
The basic sector classification is comprised of 509
sectors (rows) and 391 sectors (columns).
The aggregated classification combines sectors with
similar activities based on this basic sector classification
and is made up of minor aggregated classifications (187
sectors), medium aggregated classifications (107 sectors),
and major aggregated classifications (37 sectors). In
addition, a 13-sector classification was also established
as one that further combines the major aggregated
classifications with the purpose of representing an
explanatory template for the Input-Output Tables. (As for
the sector classification table for 2015, refer to Chapter
Ⅵ.)
Changes in the numbers of sector classifications for the
basic sector classification and aggregate classification
among the latest 2015 tables and previous tables (2011
tables and 2005 tables) are as shown in Table 2-6 below.
Table 2-6 Development of the Number of Sector Classifications
2005
Tables
2011
Tables
2015
Tables
(1) Basic sector classification
(row) 520 518 509
(column) 407 397 391
(2) Minor Aggregated Classification 190 190 187
(3) Medium Aggregated Classification 108 108 107
(4) Major Aggregated Classification 34 37 37
[2] Modifications in Sector Classifications
Taking changes in the economic structure into
consideration, the sector classifications in the 2015 table
were reviewed. The major modifications are as follows.
i) Basic sector classification
a Nurseries, which belonged to “Social welfare
(public) **,” “Social welfare (private, non-profit) *”
and “Social welfare (profitmaking)” in the 2011
tables, have been removed and included in the new
sector “Nursery.”
b “Eating and drinking services” in the 2011 tables
were divided into “Eating and drinking places,” and
“Food take out and delivery services.”
ii) Aggregated classification
a The “School lunch” sector in the 2011 tables was
moved from “Manufacturing” to “Services” in the
13-sector classification, and was moved from “1119
Miscellaneous foods” to “6311 School education”
in the minor-aggregated classification.
(3) Final Demand Sectors and Gross Value Added
Sectors
In principle, classifications were made such that there is
consistency with the System of National Accounts.
However, from the perspective of stability of input
coefficients, “Consumption expenditure outside households”
was established for both the final demand sector and gross
value added sector. Also, to evaluate imported goods with the
same standard as that for domestic goods, and to clarify each
transaction amount, custom duties and commodity taxes on
imported goods were set for the final demand sector (part of
total imports), rather than the gross value added sector.
- 40 -

5 Special Treatment
(1) Imputation
Imputations are conducted for the following:
[1] Financial mediation services
[2] Insurance services such as life insurance and non-life
insurance
[3] House rents of owner-occupied dwellings and company
housing units
(2) Establishment of Dummy Sectors
The intermediate sectors in the Input-Output tables were
established based on commodity or activity. Among these,
there are those listed below that cannot be thought of as
independent, single industry sectors. These were established
as “Dummy sectors,” taking into consideration convenience,
etc. in compiling and utilizing Input-Output sectors. Gross
value added is not recorded in dummy sectors.
[1] Used paper, scrap iron, non-ferrous metal scraps
[2] Self-transport (passengers and freight)
[3] Office Supplies
(3) Handling of Goods Rental and Leasing
For the goods rental and leasing industry, for which there
are two schools of thought—“user principle” and “owner
principle,” estimations were made based on “owner
principle.” In addition, estimations for real estate rental
service and worker dispatching services were also made
based on “owner principle.”
- 41 -

〔Reference1〕 The History of Input-Output Tables
for Japan
(1) The History of Input-Output Tables
The Input-Output Tables was developed by Dr. W. Leontief
(1906~1999), the winner of Nobel Memorial Prize in
Economic Science. In 1931, he started to make Input-Output
Tables about the US economy. He announced the plan in the
magazine, “Review of Economics and Statistics” in 1936. It is
said that the Input-Output Tables was an attempt of adjusting
“General Equilibrium Theory” of L. Walras (1834~1910) to
real national economy, and an attempt of making “Tableau
Economique” of F. Quesnay (1694~1774) for the US
economy.
This technique of Leontief`s Input-Output Analysis was
admitted by U.S. Department of Labor, Bureau of Labor
Statistics. After 1941, the technique was developed with the
support of Bureau of Labor Statistics. When the economic
forecast for the post World-War-II was made by the Planning
Committee of U.S. War Production Board, the Input-Output
Analysis showed higher degree of accuracy than other
analysis techniques. Then, the utility and importance of the
Input-Output Analysis came to be admitted widely. Since then,
the theory of the Input-Output Analysis has been researched
by U.S. government offices of the United States, and many
countries has come to compile the Input-Output Tables and
utilized the Input-Output analysis for the national economy of
each country in the world.
(2) The History of Input-Output Tables for Japan
The first compilation of the Input-Output Tables for Japan
dates back to 1955 for the reference year. When the Economic
Planning Agency ( current Cabinet Office ) and the
Ministry of International Trade and Industry ( current
Ministry of Economy, Trade and Industry ) and others
complied provisional tables respectively. Thereafter, the
Input-Output Tables came to be compiled as a joint work by
the related ministries and agencies every five years.
A. 1951 Input-Output Tables
The 1951 Input-Output Tables was compiled abridged
tables for the year 1951 by the Economic Planning Agency
(EPA) and the Ministry of International Trade and Industry
(MITI) respectively, and published in 1955. At the same time,
the Ministry of Agriculture and Forestry ( current the
Ministry of Agriculture, Forestry and Fisheries)compiled
the abridged tables focused on the sector of agriculture and
forestry.
While the tables compiled by the EPA covered 9 sections
responding to the System of National Accounts, those by
METI contained 182 detailed sections. Although both tables
similarly dealt with all industries, they were compiled in
accordance with different classifications, concepts,
definitions, and different estimation methods. As a result,
there are inevitable differences in the figures between the
two tables.
The differences might be unavoidable, because both tables
were compiled with different purposes. But, having two
different kinds of figures for the same economy and the same
reference year was undesirable. Therefore, the Statistics
Council of the Administrative Management Agency (current
Ministry of Internal Affairs and Communications) was
reported as of 30 June 1955 that the related ministries should
compile the integrated and unified Input-Output tables.
B. 1955 Input-Output Tables
After the publication of 1951 Input-Output tables, the
Ministry of International Trade and Industry compiled 1954
abridged extension tables and 1955 preliminary tables. The
Economic Planning Agency also compiled 1953 Input-
Output tables and 1955 abridged tables. As the Input-Output
tables shifted from the experimentation phase to the stage of
practical use, it came to be requested strongly to compile the
Input-Output Tables with high accuracy. In response to the
report of the Statistics Council and the requests on accuracy,
the related ministries submitted the integrated budgetary
appropriation for the compilation of 1955 tables. And, the
meeting of the related ministries was taken place on March
1957, and the meeting decided to compile the next Input-
Output tables as a joint work.
Therefore, the working group was organized by 6
ministries and agencies, i.e., the Administrative
Management Agency、the Economic Planning Agency, the
Ministry of Agriculture and Forestry, the Ministry of
International Trade and Industry and the Statistics Bureau in
change of tabulation. The meeting discussed the setting,
concept, and definition of sector classification, the method
of evaluation of production, and the availability of the basic
date, etc. Based on the result, it had been come to start full-
dress collaboration work since April 1958.
The joint work continued from 1958 F.Y to 1959 F.Y., and
it was decided that the reference year was to be 1955 year.
The reasons were as follows.
・ In 1958, almost all the data available were for the year
- 42 -

1955.
・ Economic situations in 1955 were comparatively normal.
・ The bench-mark year of national income statistics and
other economic indexes were expected to be 1955.
As a result of work over a period 2 fiscal years, the
preliminary tables were published in June 1960, and the final
tables were published in June 1961 respectively.
C. 1960 Input-Output Tables
The 1960 Input-Output Tables was the first publication
which was compiled by a joint work of the related ministries.
In those days, however, they did not necessarily recognize
that compilation would continue in the following phases. But,
the 1960 Input-Output Tables had problems to be improved
in respect of the consistency with national income statistics,
which was the main account of the SNA, and sector
classification. In addition, there were remarkable change in
industrial structure according to technical innovation, and
they needed materials for reviewing the Input-Output Tables
as of the doubling national income plan. Therefore, the
compilation of the Input-Output Tables for new reference
year came to be requested strongly.
As the background of such situations, the budgetary
appropriation for compiling 1960 Input-Output Tables was
admitted. At the same time, the present system of the Input-
Output Tables was established as being compiled by the joint
work of the related ministries every five years.
The work was executed as continuous project for 2 fiscal
years, 1962 to 1963. Then, the role of the Statistics Bureau
of the Prime Minister’s office, which had been in change of
data processing by computer, was succeeded by The
Ministry of International Trade and Industry. And, the
Ministry of Transport (current the Statistics Bureau of the
Ministry of Land, Infrastructure, Transport and Tourism)
and the Ministry of Labour (current the Ministry of Health,
Labour and Welfare) participated newly in joint work in
addition to the ministries participated in compiling the 1955
Input-Output Tables. Thus, the 1960 Input-Output Tables
was complied by joint work of seven ministries and agencies.
Under the cooperation of the experts and ministries
concerned, detailed reviews were done for desirable Input-
Output Tables to be useful as basic statistics standard tables
that were able to be used over a long period of time.
As a result, the frame of Input-Output Tables, which had
consistency with SNA, came to be compiled. And, the sector
classifications, concepts and definitions were basically
improved in respect of comparability of long term time series
and international comparability. As a rule, the sector
classification was adopted on the basis of the Standard
Industrial Classification for Japan and the International
Standard Industrial Classification of all Economic Activities.
D. 1965 Input-Output Tables
The 1965 Input-Output Tables did not change greatly
compared with the 1960 Input-Output Tables established as
the standard of SNA. The basic frame did not change so as
not to spoil the time series analysis, the basic frame did not
change. But, it changed only to improve remaining issues,
and establishment, division, and integration of sectors were
undertaken according to appearance of new industries and
growing industries.
The publication of result tables was made in July 1965. As
methods of use were upgrade, the basic transaction tables,
consisting of 456 row sectors×339 column sectors based on
basic sector classification, were published for the first time.
And, after the publication of 1965 Input-Output tables, the
1960-1965 extension tables were compiled for the first time
for time-series comparison with the 1960 Input-Output
tables.
E. 1970 Input-Output Tables
The 1970 Input-Output Tables were basically compiled by
using the frame of 1960 Input-Output Tables in the same way
as the 1965 Input-Output Tables. But, International Standard
Industrial Classification of all Economic Activities has
revised in 1968, and 68SNA was presented. Therefore, the
1970 Input-Output Tables were improved in handling of
sector classification. As a supplementary table, Fixed Assets
Matrix was newly compiled.
F. 1975 Input-Output Tables
The characteristics of 1975 Input-Output Tables was that
endogenous sectors were divided into 3 groups, i)industry,
ii)producers of government services, iii)producers of the
private nonprofit services to household. Particularly, as for
producers of government services including a part of
government services, which were not classified as
production activities, were coded to the endogenous sectors,
and “the producers of government services” were divided
into “public” services and “non-public” services.
And, it was expanded from the system of 7 ministries to
the system of 11 ministries till then. In other words, for the
compilation of 1975 Input-Output Tables, the Ministry of
Finance (current Department of the Treasury), the Ministry
of Education (current the Ministry of Education, Culture,
- 43 -

Sports, Science and Technology), the Ministry of Health
(current the Ministry of Health, Labour and Welfare) and
The Ministry of Posts and Telecommunications (current the
Ministry of Internal Affairs and Communications)
participated newly in a joint work.
G. 1980 Input-Output Tables
Compared with the 1975 Input-Output Tables, the 1980
Input-Output Tables had no substantial changes except the
concept of producers of government services corresponding
to division, integration of the sectors according to the
increase and decrease in the amount of production, and the
arrangement of “non-public” of producers of government
services corresponding to 68 SNA.
And, the Administrative Management Agency took over
the works of data processing by computer from the Ministry
of International Trade and Industry.
And, the result was published in the form of magnetic tape
in advance of the publication in the form of hardcopy, when
the figures were fixed.
H. 1985 Input-Output Tables
After 1980, the Japanese Industries structure changed
rapidly. And, the Standard Industrial Classification for Japan
was revised in January 1984 and enforced in April 1985.
Therefore, the sector classification, mainly the
manufacturing sector, was substantially revised, taking into
consideration the compilation and use of tables.
The sector codes of basic classification were
systematically arranged, and the endogenous sectors were
revised all over on domestic sector.
I. 1990 Input-Output Tables
The method of estimation of service sector was improved
on the 1990 Input-Output Tables. For example, based on the
1985 Input-Output Tables, service sector was divided and
new sector was established on the 1990 Input-Output Tables,
and basic materials concerning the service industry to
estimate was enhanced. As for “Rental and leasing of goods
and services”, the estimation by the former user principle
was renewed to the estimation by the owner principle, and
the self-activity sector was renewed.
The consumption tax adopted in 1989 was included in the
“Operating surplus” range.
J. 1995 Input-Output Tables
The basic framework of the 1995 Input-Output Tables
followed the former ones, but the sector classifications such
as was set up corresponding to the outline of the
recommendations of 93 SNA and to the revision of Standard
Industrial Classification for Japan (1993, Oct.), and service
sector was expanded, and the basic materials for estimation
was also enhanced.
The method of accounting indirect taxes was changed to
that of accounting inclusive consumption tax.
K.2000 Input-Output Tables
The basic framework of the 2000 Input-Output Tables
followed the former ones, and corresponded to the outline of
the recommendations of 93 SNA. To reflect economic social
structure of Japan in recent years, new sector classifications,
such as “Reuse and recycling” and “Nursing care”, were set
up.
Mechanical balance-adjustment “Lagrange’s method of
indeterminate Multipliers” was used for aggregation of
preliminary figures. Though, this method had the problem in
processing techniques, it contributed to the early release of
preliminary reports.
According to the reorganization of ministries and agencies
in January 2001, the 2000 Input-Output Tables was
accomplished as a joint work of ten office, ministries, and
agencies including the Ministry of Internal Affairs and
Communications (The name changed from the Ministry of
Internal Affairs and Communications as of September 10,
2004) instead of the former joint work of 11 ministries and
agencies.
L.2005 Input-Output Tables
In the 2005 tables, there were no large changes from the
2000 tables, but in line with the revision of the Japan
Standard Industrial Classification (March 2002), and in
association with sophistication of information and
communications, reorganization of sectors related to
information and communications and of sectors related to
information-related manufacturing was carried out.
M.2011 Input-Output Tables
In the 2011 tables, the basic framework adheres to
conventional policies, and sector classifications were
established so that they correspond to the revision of the
- 44 -

Table 2-7 Supplementary Tables Yet Compiled
Various Supplementary Tables ‘55 ‘60 ‘65 ‘70 ‘75 ‘80 ‘85 ‘90 ‘95 ‘00 ‘05 ‘11 ‘15
1 Table on Value and Quantity ○ ○ ○ ○ ○ ○ ○ ○ ○ ○ ○ ○ ○
2 Table on Scrap and By-Products ○ ○ ○ ○ ○ ○ ○ ○ ○ ○ ○ ○
3 Table on Employees Engaged in Production
Activities(by Occupation) ○ ○ ○ ○ ○ ○ ○ ○ ○ ○ ○ ○
4 Employment Matrix ○ ○ ○ ○ ○ ○ ○ ○ ○ ○
5 Fixed Capital Matrix ○ ○ ○ ○ ○ ○ ○ ○ ○ ○
6 Table on Commodity Output by Industry ○ ○ ○ ○ ○ ○ ○ ○
7 Table on Self-Transports ○ ○ ○ ○ ○ ○ ○ ○
8 Table on Trade Margins ○ ○ ○ ○ ○ ○ ○ ○ ○ ○
(Note) (Note) 9 Table on Domestic Freights ○ ○ ○ ○ ○ ○ ○ ○ ○ ○
10 Table on Imports ○ ○ ○ ○ ○ ○ ○ ○ ○ ○
(Note) The “Table of Trade Margins,” “Table of Domestic Freight,” and “Table of Imports” were categorized as supplementary tables until the 2005 tables. In terms of
content, however, information related to the trade margin, domestic freight, and imports that are included in the Basic Transaction Tables based on the basic sector
classification is aggregated as part of the medium aggregated classification. Thus, from the 2011 tables, these three tables were sectioned as part of the statistical tables
for the medium aggregated classification, and are no longer handled as supplementary tables. Publication of these tables are on the Internet only.
Japan Standard Industrial Classification (November 2007).
In addition, as an approach that is based on the general
meaning of the 93SNA, the “imputed interest” method for
“Financial service” was amended, and the “FISIM (Financial
Intermediation Services Indirectly Measured)” method was
introduced.
With regard to the code numbers for sectors up until the
2005 tables, there was reciprocal consistency between the
basic sector classification and minor aggregated
classification, but for the medium aggregated classification
and major aggregated classification, sequential numbers
were added mechanically, and thus, considerations were not
made to their relationship with the basic sector classification
and minor aggregated classification. Hence, in the 2011
tables, complete reexaminations were carried out so that the
correspondence relationships of code numbers, from the
basic sector classification to the major aggregated
classification, have consistency.
There were also large changes in the estimation materials,
estimation methods, etc., such as using the “Economic
Census for Business Activity” that was implemented for the
first time for 2011 as important basic data.
N.2015 Input-Output Tables
In the 2015 tables, the basic framework adheres to the
conventional policies in the 2011 tables, and sector
classifications were reviewed so that they correspond to the
revisions of the Japan Standard Industrial Classification
(October 2013).
In addition, as an approach based on the general meaning
of the 2008 SNA, the following matters were addressed:
1) Assign research and development as fixed capital
2) Refine the handling of ownership transfer costs
3) Assign defense equipment expenditures to gross
domestic fixed capital formation and increase in stocks
of raw materials and supplies
4) Assign a part of the repair of construction (renovation
and renewal of construction) to gross domestic fixed
capital formation
To be consistent with the 2008 SNA, the names of the
transactor-based productivity classification have been
changed from “Producer of government services” to “Non-
market producer (General government)”; “Producer of
private non-profit services for households” to “Non-market
producer (Private non-profit institutions serving
households)”; and “Industry” to “Market producer.”
In addition, the “Balancing sector” sector which had been
contained in the Tables up to 2011 was deleted, but the sums
corresponding the Balancing sector were allocated to the
export sector without being deleted from the transaction
amount of each sector.
- 45 -

Table 2-8 Flow of the Input-Output Tables for Japan
1951 1955 1960 1965 1970 1975
Number of sectors
(Basic sector
classification)
Row9×Column9
(Economic Planning Agency)
Row182×Column182
(Ministry of International
Trade and Industry)
Row62×Column62
(Ministry of Agriculture,
Forestry and Fisheries)
Row310×Column278 Row453×Column339 Row447×Column341 Row541×Column407 Row554×Column407
Transactions within
own sector
All are included in
principle.
All are included in
principle, except for those
values of parts and semi-
finished goods that are
consumed within sector.
Same as 1955. Same as 1955. Same as 1955. Same as 1955.
Scrap and By-products
Those are in principle
dealt with by Transfer
method. For MITI table,
scrap is classified under
the scrap sector.
Transfer method Those are in principle
dealt with by Stone's
method.
Same as 1960. Same as 1960. Same as 1960.
Valuation
Actual producers' prices. Uniform producers'
prices.
Actual producers' prices
(tables valued at actual
purchasers' prices are also
compiled.).
Same as 1960. Same as 1960. Same as 1960.
Imports
Competing and non-
competing inclusive
(mixed method)
Mixed method. Simplified
non-competing type tables
are also estimated.
Competing.
Non-competing imports
are also compiled.
Same as 1960. Same as 1960. Mixed method(A partial
non-competing tables are
also compiled.).
Consumption
expenditure outside
households
Treated as an endogenous
sector.
Same as 1951. Treated as an exogenous
sector.
Same as 1960. Same as 1960. Same as 1960.
Public school, hospital
services and others
The output is treated as
government consumption
expenditure. Treated as
industrial sector.
The output is treated as
households consumption
expenditure. Treated as
industrial sector.
The output is treated as
government consumption
expenditure. Treated as
industrial sector.
Same as 1960. Same as 1960. The portion borne by the
households is treated as
household consumption
expenditure, while the
balance is treated as
government consumption
expenditure.
Public administration
and defense
Treated as government
consumption expenditure.
Same as 1951. Endogenous sector for
public administration and
defense is set up, but only
value added items are
estimated. The output is
treated as government
consumption expenditure.
Same as 1960. Same as 1960. Same as 1960, however,
for these sectors are
treated intermediate
consumption expenditure.
Imputed services of
financial institutions
All are charged to the
households for
convenience purpose.
Same as 1951. Charged to the depositors
who receive the service
either in the industrial or
household sector.
Same as 1960, but are
oviated at intersections
between financial sectors.
Charged to the current
depositors which first
receive the services, and
the balance charged to the
industrial or household
sector. But the services
are again oviated between
financial sectors.
Same as 1970, but are not
shown in the final demand
sectors. Charged to
intersections between
financial sectors.
Re-exports and re-
imports
Included in exports and
imports sectors.
Same as 1951. Excluded from the
exports and imports
sectors.
Imports and exports are
included to re-exports and
re-imports sectors.
Re-exports and re-imports
of vessels are excluded
with the balance treated as
unidentified items.
Same as 1970.
Custom duties
Inclusive of indirect taxes
is treated in the household
sector.
Same as 1951. The "(less) Custom
duties" sector is set up in
final demand and treated
minus input at each
import items. Import
items are broken down in
detail and compiled
respectively.
Same as 1960. Same as 1960. Same as 1960.
- 46 -

1980 1985 1990 1995 2000 2005 2011 2015
Row541×Column406 Row529×Column408 Row527×Column411 Row519×Column403 Row517×Column405 Row520×Column407 Row518×Column397 Row509×Column391
Same as 1955, but
production for farm and
fishery households is
computed irrespective
of self-product or
selling.
Same as 1980. Same as 1980. Same as 1980. Same as 1980. Same as 1980. Same as 1980. Same as 1980.
Same as 1960. Same as 1960. Same as 1960. Same as 1960. Those are output to the
newly created "Reuse
and recycling" sector,
and further output
through the sector to
respective input
sectors.
Only costs related to
collection and
processing of scraps
and by-products are
counted towards the
"Reuse and recycling"
sector. Counted based
on the negative input
method as in Input-
Output Tables up until
1995.
Same as 2005 Same as 2005
Same as 1960. Same as 1960. Same as 1960. Same as 1960. Same as 1960. Same as 1960. Same as 1960. Same as 1960.
Same as 1975. Same as 1975. Same as 1975. Same as 1975. Same as 1975. Same as 1975. Same as 1975. Competitive import
type table (partial
imports posted
separately are
integrated)
Same as 1960. Same as 1960. Same as 1960. Same as 1960. Same as 1960. Same as 1960. Same as 1960. Same as 1960.
Same as 1975. Same as 1975. Same as 1975. Same as 1975.
Medical service is
treated as the industrial
sector.
Same as 1995. Same as 1995. Same as 1995. Same as 1995.
Same as 1975. Same as 1975. Same as 1975. Same as 1975.
The final government
consumption
expenditure divides
into individual and
collective expenditure
respectively.
Same as 1995.
Social overhead capital
consumption
incorporates.
Same as 2000. Same as 2000. Same as 2000.
Same as 1975. Lending
and imputed interest
are treated in
intermediate
consumption of
industrial sectors.
Same as 1975. Same as 1975. Housing
loan are treated in
intersection between
housing charges and
financial sector.
Same as 1990.
nonbank financing of
household estimates
and records in
Activities not
elsewhere classified.
Same as 1995. Same as 1995. The imputed interest
method for Financial
service was amended, and
the FISIM (Financial
Intermediation Services
Indirectly Measured)
method was introduced.
Same as 2011.
Same as 1970. Same as 1970. Same as 1970. The value of imports
and exports of vessels
are excluded. With the
exception of the value
of vessels, the re-
exports and re-imports
value are deducted
from the exports value
and imports value
respectively.
Same as 1995. Same as 1995. Same as 1995. Same as 1995.
Same as 1960. Same as 1960. Same as 1960. Same as 1960. Same as 1960. Same as 1960. Same as 1960. Same as 1960.
- 47 -

- 48 -

CHAPTER Ⅲ THEORY OF INPUT-OUTPUT TABLES
Since the 1955 Input-Output Tables, which were the first ta-
bles that were compiled based on a joint project by relevant min-
istries, gradual improvements have been made in Japan’s Input-
Output Tables, taking into account economic conditions and the
actual state of production activities at the points in time when the
tables are compiled, as well as consistency with the SNA and
Japan Standard Industrial Classification. Under the Statistics Act,
Input-Output Tables are designated as “fundamental statistics,”
or particularly important statistics that make up the core of offi-
cial statistics (July, 2010).
In this chapter, explanations are provided on basic theories
related to the “Basic transaction Table,” which is the core of var-
ious statistical tables that are compiled as Input-Output Tables.
1 Period Covered
The Basic Transaction Table covers production activities
and transactions involving goods and services conducted for
one year from January to December (calendar year).
In principle, the Basic Transaction Table has been compiled
every five years (years ending with either a 0 or 5) since their
first publication in 1955. However, the Basic Transaction Ta-
ble that was compiled last time was implemented as an excep-
tion with 2011 as the target year since the target year of the
important basic data, the Economic Census for Business Ac-
tivity, was 2011. This time, it returns to following the conven-
tional principle and the Basic Transaction Table is compiled
with 2015 as the target year, as the relevant census targets
2015.
2 Geographical Coverage
(1) Domestic Concept and National Concept
In terms of perception of geographical scope when com-
piling the Basic Transaction Table, there is “domestic con-
cept” and “national concept.”
Simply put, the domestic concept is a concept where the
scope covers economic activities that were carried out
within the territory of a given country. For example, alt-
hough activities of foreign companies that were carried out
on Japanese territory are included, activities that were car-
ried out by Japanese companies on foreign territory are ex-
cluded. However, although activities carried out by Japa-
nese diplomatic missions are included, activities by foreign
+ Japanese embassies
Activities within Japan, regardless of whether the
activities are conducted by the Japanese people or not,
excluding the following
・Foreign embassies and consulates
・Foreign military forces
Activities deemed within Japan
・Japanese embassies and consulates
・Activities of ships and airplanes, including charted ships and airplanes,
operated by Japanese companies
Other than those above activities conducted by the Japanese people in
foreign countries are excluded
Territory of Japan Others
Domestic area
Chart 3-1 Domestic Area in the Input-Output Tables
- 49 -

armed forces and diplomats of foreign governments resid-
ing in Japan are not included (see Chart 3-1).
In relation to this, the national concept is a concept that
focuses on the residents of a country (the term “national” is
sometimes used in the meaning of “people who have citi-
zenship of a given country,” but please note that the mean-
ing differs here). “Resident” refers to an individual who has
been living within the applicable country for a long period
of time, and who is engaged in economic activities of a sub-
stantial scope. For example, a Japanese citizen who lives in
Japan, foreigner who has been living for a long period of
time in Japan, and a Japanese company or organization, or
foreign company or organization that is conducting activi-
ties in Japan are included as residents, as well as Japanese
citizens who have only been living abroad for a short period
of time. On the other hand, foreigners who are living in Ja-
pan for the purpose of studying abroad and medical treat-
ment, etc. are not included in as residents.
(2) Handling of the Basic Transaction Table for
Japan
Since the past, the domestic concept has been used for
the Basic Transaction Table for Japan, and production ac-
tivities and transactions that occurred in Japan are subject
to recording. However, for only “Consumption expenditure
of households,” the national concept is represented and
consumption overseas by resident households is recorded
as “(less) Imports (direct purchase),” while consumption in
Japan by non-resident households is recorded as “Exports
(direct purchase).” Based on this it is possible to convert
“Consumption expenditure of households” to the domestic
concept.
3 Timing for Recording
(1) Accrual Basis and Cash Basis
In principle, production activities and transactions are
recorded on an accrual basis in the Input-Output Tables,
meaning that they are recorded at the time a transaction oc-
curs. With the cash basis, on the other hand, production ac-
tivities and transactions are recorded at the time earnings
from and payments for production activities are actually
paid. The equivalence of two aspects in the Input-Output
Tables cannot be obtained on a cash basis (the respective
totals of the gross added-value sector and the final demand
sector (imports deducted) do not correspond) due to a time
lag in the flow of accrual and distribution of earnings from
production activities. However, the equivalence of two as-
pects in the Input-Output Tables can be obtained by record-
ing on an accrual basis.
(2) Handling in the Basic Transaction Table for
Japan
To maintain the equivalence of two aspects, accrual basis
has been used since the past. Specific points in time of re-
cording are as follows.
[1] Production activities and transaction for goods
Production activities for goods are recorded at the time
they are produced, while those for services are recorded at
the time they are performed during the year.
[2] Transactions for intermediate products
Transactions for intermediate products are recorded as
the intermediate transaction value at the time intermediate
products are actually consumed in each column sector dur-
ing the year (Note).
(Note) These are handled as “stocks” up until the point when col-
umn sectors are used in actual production after intermediate
products are purchased.
[3] Output to the final demand sectors
i) In the output to the final demand sectors, consump-
tion expenditure, including consumption expenditure
outside household, private consumption expenditure,
and consumption expenditure of general government,
is recorded at the time bargains are concluded, even in
cases in which deliveries of applicable goods are de-
layed.
ii) Gross domestic fixed capital formation is recorded
at the time of transactions in capital goods.
iii) Output to “Increase in stocks” is recorded at the
point in time when the producer or distributor pos-
sesses ownership of a product subject to transaction.
iv) Exports (ordinary trade) and imports (ordinary
trade) are recorded at the time of customs clearance.
[4] Goods with a production period of one year or more
(long-term products)
i) Goods with a production period of one year or more
(long-term products) are recorded as stocks under the
domestic production until the ownership is transferred
to the final users. The production value of finished
goods of such long-term products is recorded as value
of finished goods minus value of semi-finished goods
and work in progress.
- 50 -

ii) For capital production for the own account (produc-
tion of goods and intellectual asset products for per-
sonal consumption), basically even in the case of the
goods in progress, the progress levels for a period of
one year are recorded as the “Gross domestic fixed
capital formation,” as the final users retain ownership.
However, in the case of buildings, progress levels in
constructions shall be recorded as domestic production
in the “Gross domestic fixed capital formation” even
if the ownership has not been transferred.
iii) This principle is applied to animal growths: animals
providing services (animals for draft, breeding or races,
wool, fruit-trees, mulberry, tea leaves, etc.) are rec-
orded in the “Gross domestic fixed capital formation”
and growths rendered by other specialized producers
are recorded in the “Increase in stocks of semi-finished
goods and work-in-progress.”
[5] Services with a production period of one year or more
Services with a production period of one year or more
are recorded as produced when the services are offered
(completion of production), therefore no stocks are rec-
orded
4 Units of Assessment
The Basic Transaction Table is a record of the actual state
of production activities and transactions that were carried out
over a year. In assessing the magnitude of such activities and
transactions, there are two methods of assessment—one that
is based on numerical quantities, and another that is based on
monetary amounts.
Goods have a specific unit of quantity. The valuation of
each transaction based on the unit of quantity would allow us
to perform a quantitative input-output analysis based on pro-
duction technologies, free from seasonal fluctuations in prices
and regional differences. However, many services do not have
specific units of quantity. The same is true of goods in the sec-
tor composed of detailed items, as not all items in one sector
(row) have a uniform unit of quantity. In addition to the above,
calculation based on a uniform unit of quantity is impossible
in the column sector, in which a wide variety of raw materials
is entered as inputs.
Therefore, the “monetary term” is a common criterion for
the valuation of the scale of each transaction activity in com-
pilation of the Basic Transaction Table. Furthermore, to sup-
plement the Basic Transaction Table in monetary terms, a “ta-
ble on the value and quantity” of selected goods is compiled
as a supplementary table.
5 Sector Classification
(1) Concept of Sector Classification
Although various economic activities are carried out in
this world, in order to express them in the form of the Basic
Transaction Table, it is necessary to categorize economic
activities into a given number of items. These items are
called “sectors.”
(2) Principles for Sector Classification
[1] Classification of units of products and classification of
units of production activities
i) In the Basic Transaction Table for Japan, row sectors
indicate the intended purpose and sales channel com-
position of products that were produced over the
course of a year. Thus, in principle, classifications are
made based on product classifications. On the other
hand, column sectors indicate the cost composition for
each production activity, and in principle, classifica-
tions are made in “units of production activities,” or
on an activity basis. There are many sectors where a
single product corresponds to a single activity.
ii) Classifications based on units of production activi-
ties are classifications that focus on similarities with
input structure, which is represented based on the input
coefficients.
Accordingly, in classifications based on units of
production activities,
(a) Same products that are produced using the same
production technology are classified in the same
sector, regardless of the industry in which they were
produced.
(b) On the other hand, if the production technology
differs even for the same product, the products are
classified in separate sectors (for example, thermal
power and water power).
(c) If multiple products are produced within the same
business site, allocation to multiple sectors is possi-
ble depending on differences in production technol-
ogy. This point differs from the concept of classify-
ing in the Japan Standard Industrial Classification,
- 51 -

where business sites that carry out multiple eco-
nomic activities are classified depending on its main
economic activity.
[2] Standards for sector classifications
As described above, in the Basic Transaction Table, row
sectors are classified in units of products, and column sec-
tors are classified in units of production activities. How-
ever, for new establishment, separation and integration of
sectors, and changes such as to the concept, definition and
scope, classification is carried out taking into account the
similarities of the input structure and output structure,
magnitude of domestic production and total demand, the
latest state of the Japan Standard Industrial Classification,
time-series nature, state of maintenance of estimation ma-
terials, etc. each time Input-Output Tables are compiled.
[3] Correspondence relationship between row sectors and
column sectors
Many of the row sectors and the column sectors for en-
dogenous sectors correspond to each other 1-on-1.
However, in cases such as with petroleum refining
where multiple products that differ in terms of both unit
price and intended use are produced from the same pro-
duction process, or in cases such as industry machinery
where multiple products with different unit prices and
functions are produced by consuming raw materials that
were purchased commonly at a single business site, row
sectors are divided by product for a single column sector.
At the same time, as with electricity, when the same
product (in this case, electricity) is produced from differ-
ent production facilities and production processes such as
thermal power, water power, etc., the column sector is di-
vided based on the production facility and production pro-
cess, and the row sector is organized into a single sector.
As a result, in the basic sector classification for the 2015
Input-Output Tables, there are more row sectors (509 sec-
tors) than column sectors (391 sectors) (in the Basic Trans-
action Table, which is based on integrated classifications;
the table is one where a single row sector corresponds to a
single column sector).
(3) Transactor-Based Production Activity Classi-
fication
[1] Definition of transactor-based production activity clas-
sification
Many of the products that are subject to recording in the
Basic Transaction Table are “goods and services that are
produced for the purpose of being sold in the market at a
price where the costs spent in their production are recov-
ered” and the production/supply entities of these products
are entirely “market producers.” However, in the Basic
Transaction Table, in addition to these, the following
goods and services supplied by the general government
and private non-profit institutions serving households are
recorded as one of the “products”:
i) Prices that are not commensurate with the costs, or
goods and services that are provided free of charge
ii) Goods and services that are not sold on the market are
subject to recording as one of the products.
In the Basic Transaction Table for Japan, these various
products are classified as basic sector classification. In
basic sector classification, the principle is to classify based
on the difference of products for row sectors and the dif-
ference of production structures for column sectors, or in
other words, units of production activities (activity basis).
If left as is, differences in the transactor-based produc-
tion/supply (i.e., the general government, private non-
profit institutions serving households, and market produc-
ers) for the product are not taken into consideration.
Thus, starting with the 1975 Tables, classification func-
tions based on “transactor-based production activities”
that focus on the transactor-based production/supply of the
product were given to basic sector classifications, as part
of approaches to the SNA indicated by the United Nations
(68SNA at the time), and remain as such to this day.
Concretely, adding a “**” or “*” to the end of the name
of a basic sector classification serves as an index for clas-
sification of transactor-based production activities.
Through this, basic sector classifications are considered as
having classification functions based on the transactor-
based production activities, rather than primarily being
classifications based on products or units of production ac-
tivity.
[2] System of transactor-based production activity classifi-
cation
In the system of transactor-based production activity
classification that was used in the 2015 Tables, such activ-
ities are broadly divided into the following three catego-
ries as shown in Chart 3-2.
i) Non-market producers (general government)
⇒ “**” is added to the end of the basic sector clas-
sification name
ii) Non-market producers (private non-profit institutions
serving households)
- 52 -

⇒ “*” is added to the end of the basic sector clas-
sification name.
iii) Market producers
⇒ No symbol
(Note) Previous to the 2011 Table, as with the “Classification by
economic activities” in the System of National Accounts, the
transactor-based production activity classification system was
generally divided into three sections, namely “Producers of
government services activity,” “Producers of private non-profit
services for households,” and “Industries.” However, based on
the revision of the standards for the System of National Ac-
counts conducted in 2016, such classification, in light of eco-
nomic activities, was abolished and the section names in the
transactor-based production activity classification were estab-
lished.
Note that the classification system other than the section
names has not changed from the 2011 Table.
Chart 3-2 System of Transactor-Based Production Ac-
tivity Classification
Among these, with regard to non-market producers
(general government), the subcategories of “Government
services,” “Quasi-government services,” and “Social se-
curity funds” (Note) are further established. For market
producers, the subcategories of “public activities” and
“private-sector activities” are established.
An overview of these categories is described below.
(Note) With regard to school meals, although they are something
that are fundamentally implemented by educational institu-
tions, the actual state is one where there are cases where
school meals are directly implemented by educational insti-
tutions, and other cases where they are entrusted to an exter-
nal institution such as a food service center. However, if clas-
sifying based on the institution that actually carries out the
service, not only will interferences arise, in terms of estima-
tions, there is also the possibility of confusion arising in terms
of usage. As a result, in the Basic Transaction Table, “School
lunch (public institution) **” and “School lunch (private) *”
are used, indicating that school meals are categorized based
on the transactor-based production activity classification for
educational institutions, which are the institutions that should
fundamentally be implementing school lunches.
[3] Non-market producers (general government)
i) “Non-market producers (general government)” refer
to those who fulfill the requirements in the table below,
according to international standards.
Category Requirement
“Social security
funds”
(a) There is imposition/control by the
government
(b) Covers the entire society or a specific
portion of society
(c) There is a system of mandatory enroll-
ment/burden
Non-market pro-
ducers (general
government)
other than “social
security funds”
(a) Does not correspond to social security
funds
(b) Does not correspond to financial insti-
tutions
(c) There is no marketability in the activ-
ities contents
(d) There is ownership/control by the
government
Non-market producers (general government) other
than social security funds also include some activities
of incorporated administrative agencies, special ad-
ministrative corporations, etc., in addition to activities
carried out generally by administrative agencies.
ii) Activities of “Non-market producers (general gov-
ernment)” include the two services of “collective ser-
vices” and “individual services,” from the perspective
of receivers of benefits and collection of costs.
[Collective services] Refers to services for the entire
society, such as defense, legal system, mainte-
nance of social order, lawmaking, and general ad-
ministrative activities. As they were services for
the entire society, they are provided based on rev-
enue from tax and other government revenue.
[Individual services] Refers to services where citizens
receive benefits individually, such as education
and health and hygiene. There are cases where
some costs are collected depending on the ser-
vices that are provided.
iii) In the Basic Transaction Table for Japan, “Non-
market producers (general government)” other than
- 53 -
social security funds is further categorized into “gov-
ernment services” and “quasi-government services” as
unique categories that do not exist in the SNA, for the
purpose of analysis. The contents and concept behind
ranking of each category are as follows.
[Government services] refers to services directly pro-
vided by the government and incorporated admin-
istrative agencies and special administrative cor-
porations, etc, and there are no sectors that pro-
vide similar services in the “market producers.”
[Quasi-government services] refers to services di-
rectly provided by the government and incorpo-
rated administrative agencies and special admin-
istrative corporations, etc, although there are sec-
tors that provide similar services in the “market
producers.” However, prices or charges are set at
much lower levels than actual costs for social and
public services.
For example, social and public services such as
health care, education, and culture, for which
prices and charges are set at a much lower level
than actual cost, are included in this category.
In cases where conditions such as those given
below are fulfilled, they can be classified as
“quasi-government services,” even if there are no
sectors where services similar to “market produc-
ers” are provided (For example, “Sewage dis-
posal”).
(a) The input and output structures differ signifi-
cantly from “Public administration (central)”
or “Public administration (local)”.
(b) There exist reasonable classifications other
than public administration in the Japan Stand-
ard Industrial Classification.
[4] Non-market producers (private non-profit institutions
serving households)
“Non-market producers (private non-profit institutions
serving households)” refers to those who fulfill require-
ments (a) to (d) below, based on international standards.
(a) Does not correspond to social security funds, nor finan-
cial institutions
(b) There is no marketability in the activities contents
(c) There is no ownership/control by the government
(d) Services are provided exclusively to households
(Note) Governments and independent administrative agencies, etc.
are classified by every institution; however, it is practically
difficult to determine marketability etc. of each of many non-
profit organizations. Thus, among labor unions, political par-
ties, religious organizations, private schools (except hospi-
tals), etc., those excluding individuals, companies, the na-
tional government, offices of public enterprises and local
public organizations, namely, “corporate bodies other than
companies” and “organizations which are not corporate bod-
ies” are classified in a range of “private non-profit institutions
serving households.”
[5] Market producers
i) General theory
“Market producers” mainly refers to production ac-
tivities and transactions of goods and services that are
carried out with the purpose of selling them on the
market at a price that covers production costs (In the
standards of the 2008 SNA, they are considered as
having marketability if sales equal more than 50 per-
cent of production costs).
Among these activities and transactions, in cases
where ownership or control by the government is rec-
ognized, such as the government owning the majority
of voting rights pertaining to the activity, are classified
as “public activities,” and other cases are classified as
“private-sector activities.” Among these, “public ac-
tivities” correspond mainly to activities such as of in-
corporated administrative agencies and special admin-
istrative corporations, etc.; financial intermediation
activities and non-financial activities with marketabil-
ity, among special accounts of the central government
and accounts of publicly owned entities of local gov-
ernments; and those where a relationship with owner-
ship or control by the government exists.
ii) In addition to i) above, the following is also handled
as “market producers.”
(a) Even when it is considered that rent does not gen-
erally arise, such as when a person owns his/her
own house, etc., imputation is carried out by deem-
ing that the resident is paying rent, in the same way
as with rental housing, and such cases are handled
as “Market producers” (“House rent (imputed house
rent)”).
(b) Activities where an agricultural, forestry, and fish-
eries household produces agricultural, forestry, and
fisheries products for personal consumption are also
handled as “Market producers.”
(c) With regard to various economic organizations,
burden charges and membership dues from relevant
- 54 -
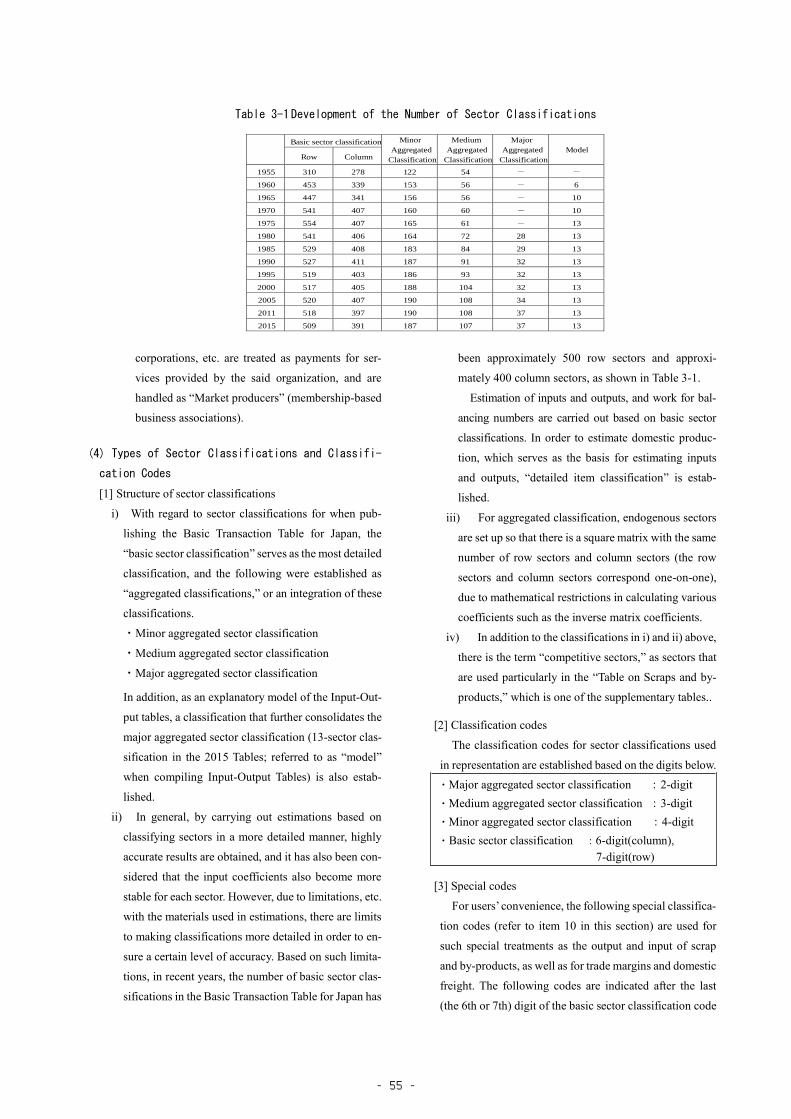
corporations, etc. are treated as payments for ser-
vices provided by the said organization, and are
handled as “Market producers” (membership-based
business associations).
(4) Types of Sector Classifications and Classifi-
cation Codes
[1] Structure of sector classifications
i) With regard to sector classifications for when pub-
lishing the Basic Transaction Table for Japan, the
“basic sector classification” serves as the most detailed
classification, and the following were established as
“aggregated classifications,” or an integration of these
classifications.
・Minor aggregated sector classification
・Medium aggregated sector classification
・Major aggregated sector classification
In addition, as an explanatory model of the Input-Out-
put tables, a classification that further consolidates the
major aggregated sector classification (13-sector clas-
sification in the 2015 Tables; referred to as “model”
when compiling Input-Output Tables) is also estab-
lished.
ii) In general, by carrying out estimations based on
classifying sectors in a more detailed manner, highly
accurate results are obtained, and it has also been con-
sidered that the input coefficients also become more
stable for each sector. However, due to limitations, etc.
with the materials used in estimations, there are limits
to making classifications more detailed in order to en-
sure a certain level of accuracy. Based on such limita-
tions, in recent years, the number of basic sector clas-
sifications in the Basic Transaction Table for Japan has
been approximately 500 row sectors and approxi-
mately 400 column sectors, as shown in Table 3-1.
Estimation of inputs and outputs, and work for bal-
ancing numbers are carried out based on basic sector
classifications. In order to estimate domestic produc-
tion, which serves as the basis for estimating inputs
and outputs, “detailed item classification” is estab-
lished.
iii) For aggregated classification, endogenous sectors
are set up so that there is a square matrix with the same
number of row sectors and column sectors (the row
sectors and column sectors correspond one-on-one),
due to mathematical restrictions in calculating various
coefficients such as the inverse matrix coefficients.
iv) In addition to the classifications in i) and ii) above,
there is the term “competitive sectors,” as sectors that
are used particularly in the “Table on Scraps and by-
products,” which is one of the supplementary tables..
[2] Classification codes
The classification codes for sector classifications used
in representation are established based on the digits below.
・Major aggregated sector classification :2-digit
・Medium aggregated sector classification :3-digit
・Minor aggregated sector classification :4-digit
・Basic sector classification :6-digit(column),
7-digit(row)
[3] Special codes
For users’ convenience, the following special classifica-
tion codes (refer to item 10 in this section) are used for
such special treatments as the output and input of scrap
and by-products, as well as for trade margins and domestic
freight. The following codes are indicated after the last
(the 6th or 7th) digit of the basic sector classification code
Table 3-1 Development of the Number of Sector Classifications
Basic sector classification Minor
Aggregated
Classification
Medium
Aggregated
Classification
Major
Aggregated
Classification
Model
Row Column
1955 310 278 122 54 - -
1960 453 339 153 56 - 6
1965 447 341 156 56 - 10
1970 541 407 160 60 - 10
1975 554 407 165 61 - 13
1980 541 406 164 72 28 13
1985 529 408 183 84 29 13
1990 527 411 187 91 32 13
1995 519 403 186 93 32 13
2000 517 405 188 104 32 13
2005 520 407 190 108 34 13
2011 518 397 190 108 37 13
2015 509 391 187 107 37 13
- 55 -

(the codes are referred to as “2 attached” or “3 attached,”
for example).
・Scrap input ········· 2
・Scrap output ······· 3
・By-product input ·· 4
・By-product output 5
・Trade margin ······ 6
・Domestic freight ·· 7
(5) Final Demand Sectors and Gross Value Added
Sectors
[1] As shown in Table 3-2, the final demand sectors and
gross value added sectors, which are exogenous sectors
of the Basic Transaction Table, correspond, for the most
part, to each of the items in the System of National Ac-
counts compiled by the Cabinet Office, despite differ-
ences in names and excluding consumption expenditure
outside households.
[2] Consumption expenditure outside households
Consumption expenditure outside households is also
known as “business consumption.” A breakdown of busi-
ness consumption, such as lodging expenses and daily al-
lowances, entertainment allowances, and welfare ex-
penses, is entered as an item of consumption expenditure
outside households in the final demand sector (column) by
goods and services.
On the other hand, lodging expenses and daily allow-
ances, entertainment allowances, and welfare expenses are
recorded by column sector in “Consumption expenditure
outside households (row)” in gross value added sectors. In
other words, the amounts that were spent by each produc-
tion sector (column sector) towards these expenses are
recorded.
In the System of National Accounts, based on interna-
tional standards, consumption expenditure outside house-
holds is classified as an endogenous sector (intermediate
consumption, intermediate input), an expenditure that is
necessary to carry out production activities, and is not in-
cluded in the exogenous sectors (final demand sectors and
gross value added sectors).
However, in the Basic Transaction Table for Japan, ex-
penditures that are the equivalent of consumption expendi-
ture outside households are considered as (a) allocated
from part of operating surplus, rather than being directly
necessary for production activities, and (b) not being input
at a given proportion in carrying out production activities,
similar to general raw materials. Based on reasons such
that making these exogenous will make input coefficients
(production structure in endogenous sectors) more stable,
they are oriented as exogenous sectors.
6 Basic Structure of the Basic Transaction
Table
(1) Price Valuations and Table Formats (Input-Out-
put Table at Producers’ Prices and Input-Output
Table at Purchasers’ Prices)
[1] Valuation methods for prices
As described in 4 above, in the Basic Transaction Table
for Japan, the size of each transaction is recorded using
“monetary amount,” which is a unit of measurement com-
mon to products. When doing so, the size and manner of
representation of transaction amounts changes depending
on the stage/price at which the “monetary amount” is per-
ceived.
Not all goods of the same type or quantity are traded at
the same price in the actual economy. The prices of com-
modities vary according to factors such as regional and
seasonal fluctuations, as well as differences in the struc-
ture of supply and demand or transaction patterns.
For example, the shipment prices of producers and pur-
chase prices of consumers often differ depending on ex-
penditures in the distribution stage. In addition, there are
also cases where prices for the same product differ depend-
ing on whether the target is large user or small user.
As such, there are two perspectives as shown below
with regard to price valuation when recording in the Basic
Transaction Table.
(a) Using either “actual prices” or “unified prices”
“Actual prices” is a method for evaluating prices
at which transactions actually occurred, while “uni-
fied prices” is a method for evaluating based on
separately establishing unified prices, regardless of
the transaction destination or transaction format.
(b) Using either “producers’ prices” or “purchasers’
prices”
“Producers’ prices” is a method for evaluating
using shipment prices, while “purchasers’ prices”
is a method for evaluating using prices at the final
stage of transactions.
- 56 -

Between these, only tables based on actual prices with
regard to (a) are compiled in Japan. Thus, for the Basic
Transaction Table, two types are compiled:
・ Input-output tables at producers’ prices based on ac-
tual prices
・ Input-output tables at purchasers’ prices based on ac-
tual prices
The former is referred to as “Input-Output Tables at pro-
ducers’ prices,” while the latter is referred to as “Input-
Output Tables at purchasers’ prices.”
The reason why the valuation method based on unified
prices is not used is because while the data on transactions
obtained from primary statistics is an accumulation of ac-
tual prices, it is necessary to separately solve the issue of
“how to establish uniform prices” in order to make valua-
tions based on uniform prices.
[2] Input-Output Table at producers’ prices and Input-Out-
put Table at purchasers’ prices
i) Formats of the two tables and differences between
them
The difference between the two prices can be as-
cribed to the fact that the purchasers’ price is inclusive
of such distributive costs as trade margins and domes-
tic freight, while the producers’ price is not.
We compile both types of tables as the Basic Trans-
action Tables for Japan. In the Input-Output Table at
producers’ prices, each transaction is recorded at the
producers’ delivery price. Trade margins and domestic
freight, incurred before purchasers buy products, are
added at the intersection of the purchasers’ sector (col-
umn), the commerce sector (row), and the transport
sector (row) (see Chart 3-3[2]).
In the Input-Output Table at the purchasers’ prices,
each transaction is recorded at prices including trade
margins and domestic freight. As a result, only “Cost
trade margins,” and “Cost transport margins” (see 10
(2) in this chapter) are recorded in the row sector for
commerce and transport. Trade margins and domestic
freight are not recorded in the row sector for com-
merce and transport.
In the Basic Transaction Table for Japan, the basis
for domestic production is valuated at producers’
prices based on actual prices, as will be described in 7
(2) hereinafter. Thus, in each row sector for Input-Out-
put Tables at purchasers’ prices, it is ensured that do-
mestic production is at producers’ prices by excluding
trade margins and domestic freights in exogenous sec-
tors (see Chart 3-3[3]).
ii) Characteristics of use
Use of the Input-Output Table at producers’ prices
and the Input-Output Table at purchasers’ prices has
the following features.
It is possible to understand the composition of the
manufacturing costs in each column sector, as the In-
put-Output Table at purchasers’ prices is recorded at
prices that are nearly equal to the prices of the form of
actual transactions.
On the other hand, the amount of domestic freight
and trade margins differs not only depending on the
type of goods and services, but also, in many cases,
depending on transaction patterns even if goods and
services are identical. Thus, the amount of domestic
freight and trade margins is unstable and consequently,
to stabilize input coefficients (as technical coeffi-
cients) by making the input coefficients as close as
possible to the physical quantities, it is more conven-
ient to use the producers’ price as a basis for calcula-
tion in the Basic Transaction Table.
Even in the Input-Output Tables for Japan, the input
coefficient tables and inverse matrix coefficient tables
are compiled from Input-Output Tables at producers’
prices, and analysis of Input-Output Tables is often
carried out using Input-Output Tables at producers’
prices as a basis.
- 57 -

Table 3-2 Input-Output Tables and Correspondence to National Accounts
Consumption expenditure of households Final consumption expenditure of households
Consumption expenditure of private non-profit Consumption expenditure of private non-profit
institutions serving households institutions
Collective consumption expenditure of central government Collective consumption expenditure of central government
Collective consumption expenditure of central government Individual consumption expenditure of central government
(CFC of capital fixed capital) Collective consumption expenditure of local government
Individual consumption expenditure of central government Individual consumption expenditure of local government
Individual consumption expenditure of central government
(CFC of capital fixed capital)
Collective consumption expenditure of local government
Collective consumption expenditure of local government
(CFC of capital fixed capital)
Individual consumption expenditure of local government
Individual consumption expenditure of local government
(CFC of capital fixed capital)
Gross domestic fixed capital formation
Gross domestic fixed capital formation
General government
Plant and equipment
Dwellings
Plant and equipment
Dwellings
Increase in producers' stocks of finished goods Private sectors
Increase in stocks of semi-finished goods and work-in-process Public corporations
Increase in dealer's stocks of goods General government
Increase in stocks of raw materials and supplies
Exports (ordinary trade) Goods
Exports (special trade) Transport, travel, telecommunication, insurance, others
Exports (direct purchase) (Recorded once again) Direct purchase
Imports (ordinary trade) Goods
Imports (special trade) Transport, travel, telecommunication, insurance, others
Imports (direct purchase) (Recorded once again) Direct purchase
Notes: Encircled items in the I-O Tables correspond to the items involving final demand under the major aggregated sector classification.
Changes in inventories
Exports of goods and services
(less) Custom duties
(less) Commodity taxes on imported goods
Imports of goods and services
[Included in “the tax on production and imported goods” of the value added]
[Included in “the tax on production and imported goods” of the value added]
(Classified into the endogenous sectors)
Increase in stocks
Exports
(less) Imports
Consumption expenditure of general government Final consumption expenditure of government
Gross domestic fixed capital formation (public)
Gross domestic fixed capital formation (private)
public sectors
Private sectors
Consumption expenditure of households
Consumption expenditure(private) Private final consumption expenditure
National Accounts (Cabinet Office)Input-Output Tables
Lodging expenses and daily allowances
Social expenses
Welfare expenses
Wages and salaries Wages and salaries
Contribution of employers to social insurance Employers’ actual social contribution
Other payments and allowances Employers’ imputed social contribution
Input-Output Tables National Accounts (Cabinet Office)
(Classified into the endogenous sectors)Consumption expenditure outside households (row)
Compensation of employees
Operating surplus
Consumption of fixed capital Consumption of fixed capital
Notes: Encircled items in the Input-Output Tables are elements of the gross value added corresponding to the major aggregated sector classification.
Operating surplus and mixed income
Consumption of fixed capital
Consumption of fixed capital (Social overhead capital consumption)
(less) Current subsidies
Indirect taxes (except custom duties and commodity
taxes on imported goods)Taxes on production and imports
(less) Subsidies
Compensation of employees
- 58 -

[Appendix] Basic price
While the Basic Transaction Table for Japan calculates
the domestic production amount using the “producers’
price,” the SNA has been recommending that the trans-
action value be calculated using the “basic price” since
the establishment of 68SNA.
The basic price is the producers’ price minus commod-
ity taxes such as consumption, tobacco, liquor, and other
indirect taxes, plus subsidies.
The use of the “basic price” is recommended because
when commodity taxes are included in the transaction
value, the commodity tax rates are not necessarily stable
and are subject to variations depending on factors other
than the production structure.
However, in the Basic Transaction Table for Japan, ta-
bles based on basic prices have not been compiled thus
far due to data limitations, etc.
(2) Handling of Consumption Tax
Among the value-added taxes, individual indirect taxes
such as liquor tax and tobacco tax, where specific goods
and services are subject to taxation, are indicated as-is as
input costs, as the taxation amount (= amount of tax pay-
ment) is imputed to the price of the product, and the good
or service is sold at a price inclusive of tax, regardless of
destination between intermediate demand or final demand.
In relation to this, consumption tax is an indirect tax of
a multi-stage taxation method that is imposed at all trans-
action stages that are carried out domestically, in principle.
In addition, as tax is not accumulated during the stage of
intermediate transactions, the purchase-related taxes are
excluded. In other words, the tax that is paid by the person
who purchased the product is calculated as a subtraction
of the tax that was paid in the prior stage of distribution
from the tax incurred on the sales amount.
As a result, with regard to how consumption tax is han-
dled in the Basic Transaction Table, there are different con-
cepts—a method where the monetary amount that actually
moved is evaluated as is, and another method of valuation
based on the monetary amount that is recognized as being
original costs.
In the Basic Transaction Table for Japan, due to the ben-
efit of not being able to read the magnitude of the actual
transaction amount, the method of displaying the
sales/purchase price as is at the distribution stage (tax-in-
clusive display) has been adopted since the consumption
tax system was introduced. In the transaction amount, the
amount that is subtracted in calculations at the tax pay-
ment stage is also included and recorded.
(3) Treatment of Imports and Table Types
[1] Competitive import type table and non-competitive im-
port type table
There are two methods for treating imports in the Basic
Transaction Tables. One is the “competitive import type
table,” in which imports and domestic products are treated
as identical if they are the same type of goods (see Chart
3-4[1]). The other is the “non-competitive import type ta-
ble,” in which imports and domestic products are treated
differently despite the fact that they are the same type of
goods (see Chart 3-4[1]).
[2] Table type for Japan
The Basic Transaction Table for Japan is the “competi-
tive import type table,” in which the input and output of
domestic products, as well as imports, are treated collec-
tively.
However, the above table can easily be converted into a
non-competitive import type table, as the import value of
each transaction is recorded as a breakdown item.
(Note) Until the compilation of the 2011 Table, a part of im-
ported goods (wheat, soybeans, etc.) had been recorded separately
under the row sector for imported goods; therefore, the Basic
Transaction Tables for Japan is accurately described as a “mixed-
type table of competitive and non-competitive imports.”
- 59 -

Chart 3-3 Input-Output Table at Producers’ Prices and Input-Output Table at Purchasers’ Prices
[1]Flow of price setting-temporary example-
@10,000yen @12,000yen Purchase volume:120,000yen
Manufacturing
industry 1
Quantity:10t
freight 2,000yen/t Price:12,000yen/t
10t Freight(2,000yen/t) is included.
@10,000yen
Trade marginsManufacturing
industry X
1,500yen/t
Prudction volume:1 million yen 30t
Quantity:100t
Price:10,000yen/t
Note:@ indicates the price per ton at each stage.
Shop A
Household
@11,000yen
freight 1,000yen/t
@12,500yen @13,500yen
freight 1,000yen/t
Manufacturing
industry 2
Purchase volume:405,000yen
Quantity:30t
Price:13,500yen/t
Trade margins (1,500yen/t) and
Freight(2,000yen/t) is included.@10,000yen
60t
freight 1,000yen/t
@11,000yen
Shop B
50t
Trade margins
1,000yen
@12,000yen
freight 1,000yen/t
Manufacturing
industry 3
Purchase volume:650,000yen
Quantity:50t
Price:13,000yen/t
Trade margins (1,000yen/t) and
Freight(2,000yen/t) is included.
10t
Trade margins
3,000yen
@14,000yenPurchase volume:140,000yen
Quantity:10t
Price:14,000yen/t
Trade margins (3,000yen/t) and
Freight(1,000yen/t) is included.
@13,000yen
[2] Input-Output Table at Producers’ Prices ― Model ―
(unit: 1,000 yen)
[3] Input-Output Table at Purchasers’ Prices ― Model ―
(unit: 1,000 yen)
Do
mes
tic
pro
du
ctio
n
…
Co
nsu
mp
tio
n
Inv
estm
ent
Ex
po
rts
…
Man
ufa
ctu
rin
g
Ind
ust
ry 1
Man
ufa
ctu
rin
g
Ind
ust
ry 2
Man
ufa
ctu
rin
g
Ind
ust
ry 3
… …
Intermediate demand Final demandT
ota
l d
eman
d
Imp
ort
s
(Les
s)
100 0 0 1000 0 1000
Inte
rmed
iate
in
pu
t Commodity “X” 100 300 500 0
Commerce 0 45 50
0 190
Gro
ss v
alu
e
add
ed Note: This table is based on the figures in Chart 3-3 [1]
Domestic production
125
Transport 20 60 100 0 10 0 0 190
0 30 0 0 125 0
Intermediate demand Final demand
To
tal
dem
and
Less
Do
mes
tic
pro
du
ctio
n
…
Man
ufa
ctu
rin
g
Ind
ust
ry 1
Man
ufa
ctu
rin
g
Ind
ust
ry 2
Man
ufa
ctu
rin
g
Ind
ust
ry 3
…
0 0 190
100
1000
Tra
de
mar
gin
s
Fre
igh
ts
Inte
rmed
iate
in
pu
t Commodity “X” 120 405 650 0 140 0
… …
Co
nsu
mp
tio
n
Inv
estm
ent
Ex
po
rts
Imp
ort
s
100 300 500
0
1315 0 -125 -190
0 0
0
+20 +60 +100
+45 +50 +30
190
+10
Gro
ss v
alu
e
add
ed Note: This table is based on the figures in Chart 3-3 [1]
The trade margins and freights are included in the row for the transaction value of
commodity” X.”
Domestic production
125
Transport 0 0 0 0 0 0 0 0
0 0 0 0 125 0Commerce 0 0
- 60 -

7 Price Valuation of Domestic Production
(1) Importance of Domestic Production
In a single word, “domestic production” is the total
amount of production and transactions for each sector over
the course of a year.
Domestic production by sector is a number that is esti-
mated first when carrying out estimation work for the Basic
Transaction Table, and inputs and outputs are estimated as
its breakdown upon establishing this domestic production
amount. As a result, when there is an error in domestic pro-
duction, it is not only necessary to re-estimate inputs and
outputs of its own sector; even inputs and outputs of other
sectors are affected, and the accuracy of the entire Basic
Transaction Table is influenced. In such a way, domestic
production is extremely important as a “control value” for
both the row sectors and column sectors of the Basic Trans-
action table. Based on such a positioning, they are often re-
ferred to as “CT,” which is an abbreviation of control totals.
(2) Price Evaluations Related to Domestic
Production
In the Basic Transaction Table for Japan, domestic pro-
duction is fundamentally evaluated using producers’ prices
based on actual prices.
Fundamental concepts related to estimation of domestic
production for each major sector type are as follows.
[1] Goods
In principle, with regard to goods, domestic production
is estimated in the form of “Production quantity × Unit
price” for each detailed item classification. When doing so,
the factory shipment price is the unit price of products in
the manufacturing industry.
[1] Perfectly Competitive Import Type Table (Model)
A B C D Consumption Investment Exports(Less)
Imports
Domestic
production
10 60 30 40 10 0 0 -100 50
20 10 50 10 20 15 10 -35 100
5 10 5 50 60 40 40 -50 160
5 5 20 15 70 30 30 -25 150
10 15 55 35
50 100 160 150
[2] Mixed-Type Table of Competitive and Non-Competitive Imports (Model)
A B C D Consumption Investment Exports(Less)
Imports
Domestic
production
5 10 20 10 5 0 0 0 50
5 50 10 30 5 0 0 -100 0
20 10 50 10 20 15 10 -35 100
5 10 5 50 60 40 40 -50 160
5 5 20 15 70 30 30 -25 150
10 15 55 35
50 100 160 150
[3] Perfectly Non-Competitive Import Type Table (Basic Type) (Model)
A B C D Consumption Investment Exports(Less)
Imports
Domestic
production
A 5 10 20 10 5 0 0 0 50
B 10 10 30 10 20 10 10 0 100
C 5 10 5 40 30 30 40 0 160
D 5 5 15 15 55 25 30 0 150
A 5 50 10 30 5 0 0 -100 0
B 10 0 20 0 0 5 0 -35 0
C 0 0 0 10 30 10 0 -50 0
D 0 0 5 0 15 5 0 -25 0
10 15 55 35
50 100 160 150
Gross value
added
Domestic
production
Domestic
production
A
A (Imports)
B
C
D
Gross value
added
Domestic
production
Gross value
added
A
B
Dom
estic
Impo
rts
C
D
Note:The figure in each grid is the total of domestic products and imported goods,
except for the figures in the gross value-added sector and the import sector.
Note:In Japan, a supplementary table (table on imports) enables compilation of the
perfectly non-competitive import type table as above for the Basic Transaction
Tables.
Note:The Imports of Commodity “A” are recorded separately under the row sector,
while the total of their domestic products and imported goods are recorded for
Commodities “B,” “C,” and “D.”
[4] Non-Competitive Import Type Table (Simplified Type) (Model)
A B C D Consumption Investment Exports(Less)
Imports
Domestic
production
A 5 10 20 10 5 0 0 0 50
B 10 10 30 10 20 10 10 0 100
C 5 10 5 40 30 30 40 0 160
D 5 5 15 15 55 25 30 0 150
15 50 35 40 50 20 0 -210 0
10 15 55 35
50 100 160 150Domestic
production
Imports
Gross value
added
Dom
estic
Note:Only the sectoral total of imports is shown. No breakdown by item is included.
Chart 3-4 Tabular Formats According to Handling of Imports
- 61 -

For products of industries where the area of the business
site is not clear, such as in forestry, gravel quarrying, etc.,
valuations are made using prices at the market closest to
the production site. The transportation cost from the pro-
duction site to the market is added to domestic production
as “Cost transport margins.”
[2] Manufacturer-sellers
Manufacturing activities and retail activities are sepa-
rated, and the respective amounts are recorded in domestic
production of the corresponding sector.
[3] Secondhand goods
The prices of secondhand goods are not recorded in do-
mestic product, and only transaction margins are recorded
in domestic production of the commerce sector as “Cost
trade margins.”
[4] Old buildings
The prices of old buildings are not recorded in domestic
production. Only the transaction processing fee is rec-
orded in domestic production of the real estate sector.
In cases where old buildings are repaired and sold, the
repair costs are recorded in domestic production of “Re-
pair of construction.”
[5] Services
Since services often do not have a unit of quantity, the
domestic production for each detailed item classification
is directly estimated. When doing so, fundamentally, val-
uation is carried out at the price at which the receiver of
the service paid. Services are directly provided by produc-
ers to final consumers, and often do not incur trade mar-
gins and domestic freights. Thus, for many sectors related
to services, the producers’ price is equivalent to the pur-
chasers’ price.(Note)
(Note) Even for service-related sectors, in some sectors such as
“Image information, sound information and character infor-
mation production (except newspaper or publication)” (since
sale of recording media for image and sound contents is in-
cluded in the activities contents, this portion is subject to
trade margins and domestic freights), the producers’ price is
not equivalent to the purchasers’ price.
[6] Commerce
Most of the domestic production for the commerce sec-
tor is the trade margins determined based on “sales amount
– cost of goods sold,” but in addition to this, an amount
equivalent to “cost trade margins” is included.
[7] For financing for which imputation has been carried out,
insurance, and house rent, see 10(4) below.
[8] Activities of non-market producers (general govern-
ment) and non-market producers (private non-profit in-
stitutions serving households)
Normally, transactions involving commodity are con-
ducted at a price that will compensate for the cost of their
production. However, in the actual economic activities,
there are commodities provided free of charge or at prices
that are too low for their actual cost, such as services pro-
vided by non-market producers (general government) and
non-market producers (private non-profit institutions serv-
ing households).
The Basic Transaction Table includes the activities of
non-market producers (general government) and non-mar-
ket producers (private non-profit institutions serving
households), and their domestic productions are calculated
based on their total production costs.
[9] Self-produced and self-consumed goods
Self-produced and self-consumed goods, which are in-
termediate products in the production process that are all
self-consumed in the corresponding sector, are, in princi-
ple, not recorded as domestic production. The reason is
that, if domestic production for each detailed item classi-
fication were estimated using shipment-based statistics
such as the Economic Census for Business Activity, there
would be no method for comprehending the domestic pro-
duction of self-produced and self-consumed goods. (They
are not recorded in the statistics as they are not shipped).
However, even for goods that are consumed immedi-
ately in the next production process, such as pig iron and
crude steel in the production process for iron and steel, if
the input and output structures differ, the products are di-
vided respectively, and recorded in domestic production.
When recording, the product price in the market is used as
the standard.
For self-produced and self-consumed goods in house-
holds, only self-consumption by agricultural, forestry, and
fisheries households is handled as “market producers,”
and thus, only the portion corresponding to this is recorded.
[10] Treatment of Manufacturing Commissioned to Other
Establishments
The production value, the intermediate input required
for production, and the value added of products in each
sector are included in the Basic Transaction Table, regard-
- 62 -

less of whether the products in each sector are manufac-
tured in-house or outsourced.
However, in a sector in which the Economic Census for
Business Activity is used as basic data for the estimation
of domestic production, only income from the processing
of goods other than raw materials is included in the pro-
duction value of the entrusted industry.
As a result, in sectors where domestic production is es-
timated using the Census, it is not possible to comprehend
the amount of raw materials, etc. related to contract man-
ufacturing.
The domestic production of non-manufacturing indus-
tries that consign production (such as the wholesale and
retail trade, including trading companies and department
stores) are as follows: sales amount minus purchase
amount equals margins.
Therefore, the cost of purchased materials required for
consignment production is excluded from the intermediate
input. As a result, in the production sector for raw materi-
als, the sale of raw materials to such consignors as trading
companies for consignment production lose their output
destination if no reconciliation is conducted. In the sector
for commissioned manufacturing, the domestic produc-
tion is underestimated while the ratio of the value added is
overestimated.
For value of consignment production from the non-
manufacturing industry, the domestic production that in-
cludes the cost of raw materials is reproduced by multiply-
ing the income from the processing of goods by the recip-
rocal of the value-added ratio, as based on the following
formula.
domestic production
= Income by processing goods
×Product price
Product price − Cost of raw materials
Although such handling can be applied in general to the
manufacturing industry conceptually, in actuality, it corre-
sponds in particular in relation to textile products. Based
on this, the “Notes” for the sector related to fiber fabrics
and wearing apparel in “15 Textile products” of Chapter 7,
Section 1 include the statement, “The production value in-
cludes those products commissioned from non-manufac-
turing businesses.”
[11] Scraps and by-products
Scraps and by-products are, in principle, handled by the
“negative input method.” Thus, the values of scraps and
by-products obtained from using the “negative input
method” are not recorded as domestic production. For
“Reuse and recycling,” scraps and by-products are not in-
put, and only expenditures related to reuse and recycling
are recorded.
[12] Plant engineering
For domestic production of plant engineering, which is
included in “Miscellaneous business services,” only the
monetary amount related to engineering services not in-
cluding construction costs is recorded.
[13] Fluctuations in stocks of semi-finished goods and work
in progress
Fluctuations in stocks of semi-finished goods and work
in progress are valued at the average of the opening and
closing price for that year.
[14] Indirect taxes
Indirect taxes imposed during the process of producing
goods are included in the production value of the produc-
tion sector that pays them. Taxes levied in the process of
distribution are included in the domestic production of
commerce. (Note that light-oil delivery tax is treated as the
tax imposed in the production process, taking into account
other petroleum products manufactured by the same pro-
duction process.) Consumption tax is included in the val-
uation.
[15] Land transactions
In the valuation of land transactions, the cost of land ac-
quisition is not recorded, and only brokerage commissions
and improvement expenses are recorded in their respective
sectors of the domestic production.
- 63 -
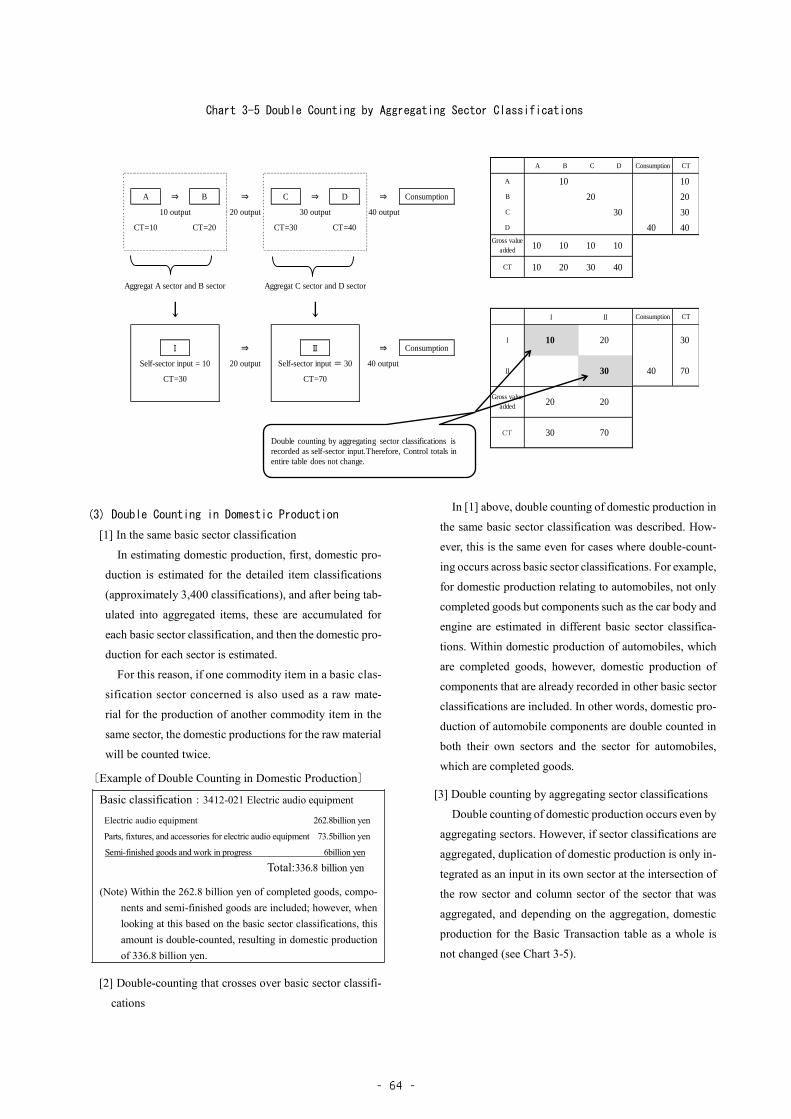
(3) Double Counting in Domestic Production
[1] In the same basic sector classification
In estimating domestic production, first, domestic pro-
duction is estimated for the detailed item classifications
(approximately 3,400 classifications), and after being tab-
ulated into aggregated items, these are accumulated for
each basic sector classification, and then the domestic pro-
duction for each sector is estimated.
For this reason, if one commodity item in a basic clas-
sification sector concerned is also used as a raw mate-
rial for the production of another commodity item in the
same sector, the domestic productions for the raw material
will be counted twice.
〔Example of Double Counting in Domestic Production〕
Basic classification:3412-021 Electric audio equipment
Electric audio equipment 262.8billion yen
Parts, fixtures, and accessories for electric audio equipment 73.5billion yen
Semi-finished goods and work in progress 6billion yen
Total:336.8 billion yen
(Note) Within the 262.8 billion yen of completed goods, compo-
nents and semi-finished goods are included; however, when
looking at this based on the basic sector classifications, this
amount is double-counted, resulting in domestic production
of 336.8 billion yen.
[2] Double-counting that crosses over basic sector classifi-
cations
In [1] above, double counting of domestic production in
the same basic sector classification was described. How-
ever, this is the same even for cases where double-count-
ing occurs across basic sector classifications. For example,
for domestic production relating to automobiles, not only
completed goods but components such as the car body and
engine are estimated in different basic sector classifica-
tions. Within domestic production of automobiles, which
are completed goods, however, domestic production of
components that are already recorded in other basic sector
classifications are included. In other words, domestic pro-
duction of automobile components are double counted in
both their own sectors and the sector for automobiles,
which are completed goods.
[3] Double counting by aggregating sector classifications
Double counting of domestic production occurs even by
aggregating sectors. However, if sector classifications are
aggregated, duplication of domestic production is only in-
tegrated as an input in its own sector at the intersection of
the row sector and column sector of the sector that was
aggregated, and depending on the aggregation, domestic
production for the Basic Transaction table as a whole is
not changed (see Chart 3-5).
A B C D Consumption CT
A 10 10
A ⇒ B ⇒ C ⇒ D ⇒ Consumption B 20 20
10 output 20 output 30 output 40 output C 30 30
CT=10 CT=20 CT=30 CT=40 D 40 40
Aggregat A sector and B sector Aggregat C sector and D sector
Consumption CT
Ⅰ ⇒ Ⅱ ⇒ Consumption
Self-sector input = 10 20 output Self-sector input = 30 40 output
CT=30 CT=70
↓ ↓ Ⅰ Ⅱ
Gross value
added10 10 10 10
CT 10 20 30 40
Ⅱ 30 40 70
Ⅰ 10 20 30
Gross value
added20 20
CT 30 70Double counting by aggregating sector classifications is
recorded as self-sector input.Therefore, Control totals in
entire table does not change.
Chart 3-5 Double Counting by Aggregating Sector Classifications
- 64 -

8 Recording Transactions in Endogenous Sec-
tors and Final Demand Sectors
(1) Endogenous Sectors
Basically, the figures shown in the cell in the endogenous
sector of the Basic Transaction Tables represent the trans-
action values of goods and services conducted between
sectors. However, the transaction value recorded in the en-
dogenous sector is the value of consumption required for
the year. Therefore, the transaction value (purchase value)
for the year is not recorded directly.
(2) Transactions in Capital Goods
[1] Transactions involving “capital goods,” that is, goods
used for production activities and purchased by any sec-
tor are recorded in the gross domestic fixed capital for-
mation of the final demand sector and are not treated as
the transaction value of endogenous sectors. (For the de-
tails of the range, etc. of capital goods, refer to Chapter
VII §2, “7411-00 Gross domestic fixed capital for-
mation (public sector)” and “7511-00 Gross domestic
fixed capital formation (private sector).”
〔Transaction of capital goods recorded in endogenous sec-
tors〕
i) Built into machinery:
Elements built into another piece of machinery; nor-
mally capital goods
ii) Construction bypass
Capital formation of such capital goods as elevators
and boilers that bypass construction activities. In other
words, builders purchase these capital goods as inter-
mediate input.
iii) Civil engineering bypass
Such capital goods as bridges and floodgates that
require civil engineering work for their construction,
despite the fact that they are capital goods. Capital
goods treated as items of the construction cost are ap-
plicable.
iv) Shipbuilding bypass
Such capital goods as boilers and telecommunica-
tion equipment installed in ships are applicable.
[2] The fixed capital matrix, which are compiled as sup-
plementary tables, indicate the amount and type of capi-
tal goods purchased by their respective sectors.
[3] The allowance for the depreciation of capital goods in
each column sector (the depreciation caused by using the
capital goods for the year) is recorded under “Consump-
tion of fixed capital” in the gross value added sectors.
(3) Stocks
Stocks are treated as “Increase in stocks” in Input-Output
Tables.
“Increase in stocks” refer to fluctuations in stocks that
remain after subtracting the stocks as of the end of the pre-
vious year (for example, the end of 2010) from the stocks
Example of the increase in stocks: a producer of wooden furniture purchased domestic or imported materials through
the commerce sector and the stocks increased at each stage in the process of producing wooden furniture.
Notes:1 The increase in goods of dealer's stocks of the commerce is recorded at the intersection of the sector of
materials (row) and the increase in dealer’s stocks ([3],[4]).
2 The increase in raw material stocks of the wooden furniture is recorded at the intersection of the sector of
materials (row) and the increase in raw material stocks ([5],[6]).
3 Imports are not recorded in “Increase in producer's stocks of finished goods” or “Increase in semi-finished
goods and work-in-progress.”
Chart 3-6 Example of Increase in Stocks
Intermediate
demand
Increase in
producer's stocks
of finished goods
Increase in semi-
finished goods and
work-in-progress
Increase in
dealer's stocks of
goods (Notes:1)
Increase in stocks
of raw materials and
supplies (Notes:2)
Domestic [3] [5]
Imported [4] [6]
[1] [2]
Final demand
Inte
rmed
iate
in
pu
t
Materials(Notes:3)
Wooden furniture
Commerce
・・・
- 65 -

as of the end of the year covered (for example, 2011) (year-
end balance of year covered minus year-end balance of pre-
vious year).
[1] Products that were produced but were not sold to any
sectors or were not used for self-consumption during the
year covered are recorded in the “Increase in stocks of
producers’ stocks of finished goods” (refer to [1] in Chart
3-6).
[2] For “Increase in semi-finished goods and work-in-progress,”
the increase and decrease in goods that are in production
and that cannot be sold or shipped without further work-
ing on them are recorded, as production activities of the
target year (refer to [2] in Chart 3-6).
[3] Commodities that were purchased by wholesale and re-
tail trades but were not sold are recorded in the “In-
crease in dealers’ stocks of goods” In this case, such com-
modities are recorded at the intersection with the row
sector (sector before sale or shipment) to which the com-
modity originally belongs, rather than being recorded at
the intersection with the commerce sector in which it was
purchased (refer to [3] and [4] in Chart 3-6).
[4] Raw materials that were purchased but not used in the
reference year are recorded in the “Increase in stocks of
raw materials and supplies”. However, the raw materials
are recorded at the intersection of the row sector to which
the goods made from the raw materials belong, not at the
intersection of the industry (row) sector that purchased
the raw materials (refer to [5] and [6] in Chart 3-6).
In addition, stocks of imported goods are divided into
the “Increase in stocks of raw materials and supplies” and
the “Increase in dealers’ stocks of goods”.
9 Price Valuation of Exports and Imports
(1) Exported Goods by Ordinary Trade
In the Input-Output Table at producers’ prices, the prices
of exports in ordinary trade are valued at producers’ ex-fac-
tory prices, in the same way as in the case of the prices of
goods for domestic demand. On the other hand, in the Input-
Output Table at purchasers’ prices, they are valued at FOB
(Free on Board) prices.
As Trade Statistics published by the Ministry of Finance
value exports in ordinary trade at FOB prices, their prices
are directly applicable in the Input-Output Table at purchas-
ers’ prices. However, domestic freight and trade margins for
transporting goods from the factory to the ship must be de-
ducted from the FOB prices in the Input-Output Table at
producers’ prices.
For the treatment of the “Balancing sector” in the 2015
Tables, refer to “8011-01 Exports (ordinary trade)” in Chap-
ter Ⅵ for more detail.
(2) Imported Goods by Ordinary Trade
The prices of imports in ordinary trade in the Input-Out-
put Tables both at the producers’ prices and at the purchas-
ers’ prices are valued at CIF prices (inclusive of freight and
insurance: Cost, Insurance, and Freight).
The transaction amount in each cell of the Basic Transac-
tion Table includes not only the amount of the imported good,
but the custom duties and commodity taxes on imported
goods related to the imported good. As a result, in the Basic
Transaction Table, “Imports,” “Custom duties,” and “Com-
modity taxes on imported goods” are established as exclusion
items in the final demand sectors, to ensure that domestic pro-
duction of the row sectors matches the total of the breakdown.
(3) Imports and Exports by Special Trade and Direct
Purchase
The values of imports and exports by special trade and
direct purchase, that is, imports and exports of services and
the transaction value of goods that are not recorded by or-
dinary trade, are estimated based on the Balance of Pay-
ments Table.
10 Special Handling in Compiling the Basic
Transaction Table
In compiling the Basic Transaction Table, there are some
items that are specially handled based on the concept of the
SNA as well as in terms of convenience for compiling and an-
alyzing Input-Output Tables.
Explanations on (1) to (7) are given below.
(1) Commerce and Transport Sectors
(2) Cost Trade Margins and Cost Transport Margins
(3) Scrap and By-Products
(4) Imputation
(5) Dummy Sectors
(6) Usership and Ownership
(7) Activities of non-market producers
- 66 -

(1) Commerce and Transport Sectors
We compile the Basic Transaction Tables in order to rec-
ord the current status of transactions between sectors. Most
actual transactions are conducted through the commerce
and transport sectors. If actual transactions are recorded in
line with this flow of transactions, trade relations between
sectors will be very difficult to understand on the Basic
Transaction Tables. For example, look at the following flow
of commodity transactions that sector “B” purchased Com-
modity (value: 100) produced by sector “A” through com-
merce sector
[1] First, Commodity produced by sector “A” is sold to
commerce through transport (freight: 10).
[2] The purchase price of commerce is 110.
[3] Next, Commodity is sold to sector “B” through
transport (freight: 10) again after commerce adds
margins (margins: 20).
[4] The purchase price of sector “B” is 140.
It is very difficult to determine the relationship between
A and B in Chart 3-7 (1), which records the above transac-
tion process directly.
To avoid such a complicated indication, trade margins
and domestic freight are collectively recorded by demand
sector, as if direct transactions were conducted between
sectors (for example, between sector “A” and sector “B”)
without going through the commerce and transportation
sectors in the Input-Output Tables.
Concretely speaking, in the Input-Output Table at pro-
ducers’ prices, the total amount of trade margins and do-
mestic freight added in the process of a transaction is rec-
orded at the intersection of the sector on the purchasers’
side (B), commerce, and transport (refer to [2] in Chart 3-7).
With regard to Input-Output Tables at purchasers’ prices,
trade margins and domestic freights are included in individ-
ual transaction amounts. Thus, in the row sectors of com-
merce and transport, trade margins and domestic freights
are not recorded (In the case of Chart 3-7 [2], 140 is rec-
orded at the intersection between [row] A sector and [col-
umn] B sector, and the intersection with [row] Commerce
and [row] Transport becomes 0.)
(2) Cost Trade Margins and Cost Transport Margins
Special commercial and transport activities that differ
from the normal distribution costs specified in (1) above are
treated as direct costs. These expenses are recorded at the
intersection of the “commerce” and “transport” row sectors
as “cost trade margins” and “cost transport margins,” that
is, the cost for production activities in respective column
sectors in the Input-Output Tables both at producers’ prices
and at purchasers’ prices.
Chart 3-7 Treatment of Sectors of Commerce and Transport
[1] Cost Trade Margins
Amounts that can be considered as being the equivalent
of “cost trade margins” are, for example, transaction
amounts for secondhand goods.
Secondhand goods themselves are fundamentally not
products of the target year for compiling Input-Output Ta-
bles, and are not subject to being recorded in the Basic
Transaction Table(Note). However, commercial activities as-
sociated with transactions of secondhand goods are activi-
ties of the applicable year, and thus only the transaction
margins are recorded as “cost trade margins” (see Chart 3-
8).
Specifically, transaction margins for purchases of used
automobiles by households, and for used buses and trucks
that correspond to fixed capital formation are equivalent to
cost trade margins.
[1] Direct indication
Final
demand
Value
added
Domestic
production
[2] Actual indication (Input-Output Table producers' prices)
Final
demand
Value
added
Domestic
production
Do
mes
tic
pro
du
ctio
n
B
A B
Co
mm
erce
Tra
nsp
ort
A 100
B
The relationship between A and B are not clear.
Transport 10 10
Commerce 130
A 100
Commerce 20
Tra
nsp
ort
A B
Co
mm
erce
Transport 20
Transaction between commerce margin and freight becomes
clear. In addition, commerce margin and freight with the
transaction can be displayed briefly
Do
mes
tic
pro
du
ctio
n
(Flow of transaction)↓
Sector "A"
(ⅰ) 100↓
(Transport:+10)
↓
(ⅱ)110
Commerce(+20)
(ⅲ)130↓
(Transport:+10)↓
Sector "B"
(ⅳ)140
- 67 -

Chart 3-8 Differences in the Basic Transaction Table when
a household purchases a new car and a used car
(Note) Although there are cases where an automobile is resold as a
used car in the same year as being transacted as a new product in
the year targeted for compilation, in such a case, the price at
which the automobile was transacted as a new product (price of
the good itself and the trade margins) is recorded in the Basic
Transaction Table, and only the cost trade margins of the trans-
action as a used automobile are recorded.
[2] Cost Transport Margins
The following can be given as corresponding to “cost
transport margins.”
i) Costs for transportation activity that is part of the
production process (that is, transportation activity that
forms a part of costs for production activities)
(a) Costs for transporting such commodities as timber
from the places of production to the collection points
where producers’ prices for such commodities are
determined
(b) Costs for transporting raw materials and semi-fin-
ished products such as iron and steel, as well as ships,
within a large-scale factory for their manufacture
(c) Costs for transporting such production equipment as
construction machinery and scaffolding
(ii) Costs for transporting goods to be moved, trip
cargo, mail, secondhand goods, coffins, waste, and con-
struction waste soil
(a) Transporting goods to be moved and trip cargo is not
regarded as a transaction between sectors that gener-
ates freight, since they are for purposes of moving
from one residence to another or for moving belong-
ings (as in the case of travelers). Such transportation
costs are regarded as cost transport margins.
Note that home delivery services are treated either
as distribution costs for domestic freight or as cost
transport margins, depending on the type of transac-
tion of the cargo. If home delivery is used as a
means of transportation that accompanies a transac-
tion between industry sectors, the costs are regarded
as domestic freight. If travelers themselves use home
delivery in order to send souvenirs bought on a jour-
ney to their home or to friends, the costs are regarded
as the cost transport margins of households. In busi-
ness activities, if a company uses home delivery in
order to send documents and electromagnetic tapes
between the headquarters and the branch offices, the
costs are regarded as the cost transport margins of the
company.
(b) Costs for transporting secondhand goods are treated
similarly to cost trade margins.
(c) Waste and construction waste soil, which account
for a large portion of the cargo transported by truck,
are treated not as scrap but as goods without value,
and are thus not recorded as transactions in the I-O
Tables. Therefore, costs for transporting waste and
construction waste soil are recorded as cost transport
margins at the intersection of the waste-generating
sector and the transport sector. That is, the disposal
of waste and construction waste soil (payment to the
carrier) in one industry is regarded as a part of the
production costs of the industry.
(3) Scrap and By-Products
[1] Various methods related to handling of scraps and by-
products
When certain goods are produced, in some cases the
production technologies inevitably produce goods other
than those intended. If such goods are produced as prod-
ucts in different sectors, they are referred to as “By-prod-
ucts”; if not, they are referred to as “Scraps.” Scraps and
by-products are classified as “Valuable goods,” which
maintain residual value, or “Non-valuable goods,” which
Trade margins
Purchaser's price = 2.0 million yen
Consumption expenditure of Households
Cost trade margins
No speial codes are attached.
Car
Commerce
= 2.5 million yen
= 0.5 million yen
[1] New car: Price of car
Trade margins
50
50
Trade margins
Commerce
Speial code 6 is attached.
250
= 3.0 million yen
Car
Consumption expenditure of Households
= 1.5 million yen
= 0.5 million yen
Purchaser's price
[1] New car: Price of car
(10,000yen)
(10,000yen)
- 68 -

are discarded or burned as waste. In the Basic Transac-
tion Table for Japan, valuable goods and those identifia-
ble by statistical materials, etc. are the subject of calcu-
lation.
In the Basic Transaction Table for Japan, the sectors
in rows are formulated according to product classifica-
tions. Thus, products resulting from production activities
must be assigned to a row sector. Scraps and by-products
are treated by the following four methods:
i) Negative input method (Stone’s method)
ii) Lump method
iii) Transfer method
iv) Separation method
Explained below are representations by these four
methods with an example of the “Petrochemical sector
producing 100 units of synthetic resin as its main product
and 10 units of LPG as a by-product, and selling the pet-
rochemical product to the resin sector and LPG to house-
holds, respectively.” (refer to Chart 3-9)
i) Negative input method (Stone’s method)
This method records negative inputs to the column
sectors in which by-products were generated, and rec-
ords positive inputs to the column sectors in which the
said by-products were input. This is a method where the
net value is made to be 0, and is referred to as “Stone’s
method,” taking after Richard Stone (1913-1991), who
contrived this method. In Japan, this method is funda-
mentally used to process scraps and by-products.
Concretely, in terms of production in the petrochem-
icals sector, only the 100 of the synthetic resin that is
the main product is recorded. On the other hand, the
LPG (10 units) that was generated as a by-product of
the petrochemical sector is recorded as a minus input in
the [column] petrochemical sector from the [row] LPG
sector (in other words, sold from the petrochemical sec-
tor to the LPG sector). Furthermore, (10 units) is rec-
orded at the intersection between [column] household
consumption sector to which the LPG was actually input
and [row] LPG sector. Based on this, the generation and
input of by-products is cancelled out in [row] LPG sector,
and ultimately, the production of LPG, which is a by-
product, becomes zero.
According to this tabular format, the monetary
amount of the by-product is not recorded in domestic
production, but it is possible to perceive the generation
source and input destination by “Scrap and by-product.”
In addition, from the perspective of analysis, (1) de-
mand pertaining to synthetic resin increases supply of
LPG as it induced demand in the petrochemical sector,
resulting in control of production in the LPG sector; (2)
on the other hand, production of LPG as a by-product
is not included in domestic production for the LPG sec-
tor, and with regard to demand in the LPG sector, only
demand for LPG as a main product can be purified as
being subject to spread calculation, and does not di-
rectly affect production in the petrochemical sector.
However, this method may reflect actual economic
conditions if LPG as a by-product is more competitive
than LPG produced by specialty enterprises. However,
it may cause problems involving inadequate balance of
supply and demand unless production in the LPG sector
is negative if there is significant demand for resin and
low demand for LPG.
After the 2000 Tables, a “Reuse and recycling” sec-
tor was established in relation to processing based on
this method (see [2] hereinafter).
ii) Lump method
Under this method, the main product (synthetic
resin) and by-product (LPG) are treated as a single en-
tity, not differentiated. Domestic production in the pet-
rochemical sector is as follows: resin (100) + LPG (10)
= 110. The LPG (10) sold to the household sector is
recorded as a sale for the petrochemical sector.
Since this treatment assumes that LPG production in
the petrochemical sector does not affect the LPG sec-
tor, it may be acceptable if the amounts of by-products
are negligible.
In the basic transaction tables for Japan, the lump
method applies, for example, to “Stable manure” in the
“Livestock” sector.
iii) Transfer method
With regard to LPG (10 units) that is produced as a
by-product of the petrochemical sector, there is a
method of outputting the LPG in the LPG sector where
it is produced as a main product, and then recording it
as being sold to households from the said LPG sector.
The LPG that is produced as a by-product is “trans-
ferred” and output in the sector where it is treated as a
main product, which is why this is referred to as the
transfer method.
In this case, LPG produced by the petrochemical
sector is included in domestic production, both for the
petrochemical sector and for the LPG sector.
- 69 -

Based on this method, since the petrochemical sector
that is input in the synthetic resins sector does not con-
tain the input of LPG within its input structure, even
when demand pertaining to synthetic resins raw mate-
rials arises, there is no induction pertaining to LPG. On
the other hand, as there is input (10 units) from petro-
chemicals in the input structure of the LPG sector, when
demand for LPG arises, this results in induction of pro-
duction in the petrochemicals sector.
(Note) In the Basic Transaction Table for Japan, although there
are no scraps and by-products in advertisement activities
that are carried out within the activities of “Private broad-
casting,” “Newspapers,” and “Publication,” the same kind
of representation as the transfer method is used. This is be-
cause (1) monetary amounts are considerably large, and (2)
the sense of transactions is such that even for advertising
that is included in media such as private broadcasting,
newspapers, and publication, rather than paying fees for
private broadcasting, newspapers, publication, etc. in each
column sector, fees are paid to the “Advertising services”
sector.
iv) Separation method
This method is one where main products and by-
products are separated, and each is recorded in their re-
spective sectors. Specifically, under this method, pro-
duction activities in the petrochemical sector are di-
vided into those for the primary product (synthetic
resin) and the by-product (LPG), and the results are rec-
orded in their respective sectors.
Production of synthetic resin and that of LPG are,
essentially, inseparable. Even if provisionally separated,
their production structures should maintain certain ra-
tios; but different demand ratios for synthetic resin and
LPG may suggest seemingly different production struc-
tures.
As a result, this method is not used in the Basic
Transaction Table for Japan.
Chart 3-9 Representation Formats for Scrap and By-Products
i) Negative input method (Stone's method)
ii) Lump mthod
iii) Transfer method
iv) Separation method
10 110
… PetrochemicalSyntehtic
resinLPG … …
Household
consumption…
Domestic
production
LPG
Domestic
production110
Petrochemical 100
Domestic
production… Petrochemical
Syntehtic
resinLPG … …
Domestic
production… Petrochemical
Syntehtic
resin
Domestic
production100 (0)
LPG -10 10 (0)
Petrochemical 100 100
Household
consumption…
LPG … …Household
consumption…
Domestic
production110 (10)
10 110
LPG 10 (10)
Petrochemical 100
Domestic
production
Petrochemical 100 100
Syntehtic
resinLPG … …
Household
consumption…… Petrochemical
(10)
Domestic
production100 (10)
LPG 10
- 70 -

[2] Handling of “Reuse and recycling”
As described in [1] above, the negative input method is
fundamentally used for scraps and by-products in the Basic
Transaction Table for Japan, but in anticipation of the in-
creasing importance of recycling activities, “Reuse and re-
cycling” is established as a sector, in relation to represent-
ing scraps and by-products that are processed using this
method, starting with the 2000 Tables.
Using the following example as a model case, an ex-
planation on the concrete representation method for this
sector and its transitions is provided (refer to Chart 3-10).
[Example]
In a case where the petrochemical sector produced
100 units of synthetic resin as a main product and 10
units of LPG as a by-product, the synthetic resin was
sold in the synthetic resins sector, and LPG was sold
to the household consumption sector; 8 units is re-
quired as expenditures for recycling and reusing LPG
Chart 3-10 Presentation Method for the “Reuse and Re-
cycling” Sector
i) The 2000 Tables
In the 2000 Tables, a method was used where the
LPG that was generated as a by-product from the pet-
rochemicals sector was negatively recorded (-10 units)
at the intersection with [row] LGP sector, and the
amount that was generated was collectively input (10
units) into [column] “Reuse and recycling,” after which
the amount to which reuse and recycling was added (18
units) was output from [row] “Reuse and recycling,” to
the household consumption sector, which is a demand
sector.
Based on this, the import and export of scraps and
by-products, which had been recorded individually in
existing row sectors to which the scraps and by-prod-
ucts corresponded up until the 1995 Tables, were col-
lectively recorded in “Reuse and recycling,” with an
aim to stabilize the import coefficients.
However, since all scraps and by-products are input
under this method in a lump sum to the “Reuse and re-
cycling” sector and output from there to demand sectors,
it becomes impossible to maintain the basic principle of
the Input-Output Tables: that “one product should be
treated in one sector.”
In other words, the state became one where it was un-
clear what kinds of scraps and by-products were in-
cluded in the individual production amounts of [row]
“Reuse and recycling” (in the example of Chart 3-10,
although the model is a simple one where the by-prod-
uct is a type of LPG, and the output destination is only
the household consumption sector, in actuality, various
scraps and by-products are output to various sectors, re-
gardless of endogenous sectors or exogenous sectors).
As a result, unless the “Table on Scraps and By-Prod-
ucts,” which is compiled separately as a supplementary
table, is used, it is not possible to perceive inputs of each
scrap and by-product. In addition, there was also the
problem that reuse and recycling could not be separated
due to data restrictions, even though they are intrinsi-
cally separate activities.
Even from the perspective of analysis, the following
kinds of problems were evident.
(a) Since generation of by-products is displayed as a
negative value, based on the perspective of analyzing
multiplier effects, there are many negative numbers
in inverse matrices and there is no longer significance
as coefficients.
(b) Various scraps and by-products are collectively han-
dled as “Reuse and recycling,” thus resulting in prob-
lems from the perspectives of stability of input coef-
ficients and analysis of multiplier effects.
(c) The scraps and by-products that were generated are
output via “Reuse and recycling,” and even for spill-
over effects, all scraps and by-products are affected.
i) Presentation method applied to the 2000 Input-Output Table
ii) Presentation method applied to the 2005 Input-Output Table and later
Collection and
processing cost 5
Employees
compensation 3
Domestic
production100 (8)
LPG -10 10 (0)
Reuse and
recycling8 (8)
Petrochemical 100 100
Domestic
production 100 (18)
… PetrochemicalSyntehtic
resinLPG
Reuse and
recycling… …
Household
consumption…
Domestic
production
Employees
compensation3
Domestic
production
Petrochemical 100 100
LPG -10 10 (0)
Reuse and
recycling18 (18)
Collection and
processing cost 5
… …Household
consumption…Petrochemical
Syntehtic
resinLPG
Reuse and
recycling…
- 71 -

ii) After the 2005 Tables
Based on such problems in the 2000 Tables, only ex-
penditures related to reuse and recycling activities came
to be recorded in “Reuse and recycling” from the 2005
Tables onward. Expenditures were output in association
with scraps and by-products.
Concretely, as with [1] i) above, only synthetic resin
(100 units), which is a main product, is recorded as pro-
duction in the petrochemical sector, while the LPG (10
units) that was generated as a by-product from the pet-
rochemical sector is recorded as having been negatively
input from [row] LPG sector to [column] petrochemical
sector (in other words, sold from the petrochemical sec-
tor to the LPG sector). Furthermore, (10 units) is rec-
orded at the intersection of [column] household con-
sumption sector where the LPG was actually input and
[row] LPG sector. Based on this, generation and input
of the by-product is cancelled out within [row] LPG
sector, and ultimately, the production amount of LPG,
which is a by-product, becomes zero. Separately from
this, expenditures for reuse, etc. of LPG are recorded in
“Reuse and recycling,” and output to the household
consumption sector, which is the demand destination
for LPG.
In other words, this is a format based on the negative
input method described in [1] iii) above, but with reuse
and recycling added as a separate sector.
(4) Imputation
In cases in which transactions are not apparently con-
ducted but utilities are actually produced and there are peo-
ple who receive these utilities, “Imputation” is conducted.
“Imputation” is for valuing utilities at the market price and
calculating such value as domestic production for the sec-
tors producing the utilities.
The output sectors, which receive the utilities, are listed
below.
This is an effort to try to comprehend the economic ac-
tivities that are hidden in the phenomena that are actually
observed. Based on this, time-series comparisons and
global comparisons are possible, regardless of changes and
differences in social conditions and systems.
Specifically, imputation is carried out for the following:
○ Financial intermediation services
○ Insurance services including life insurance and non-life
insurance
○ House rents of owner-occupied dwellings and employee
housing
[1] Financial intermediation services
Activities in the financial service sector can be broadly
divided into the following two categories.
i) Management, reception, and financing services for
deposits and savings
ii) Remittance services and sale and purchase of secu-
rities, etc.
Among these, revenue from processing fees associated
with ii) can be considered purely as compensation for pro-
vision of services; however, “profit margins” associated
with i) simply arise due to transfer of ownership, when
looking at it from the perspective of receiving and paying
interest as property income, and cannot always be consid-
ered as formation of new added value. However, when
thinking about operating activities in the financial service
sector, earnings from “profit margins” is extremely im-
portant. As a result, even since before, profit margins are
deemed as being compensation for services generated by
the financial service sector, and were included in domestic
production. In other words, the financial service sector is
considered as conducting intermediary services that link
transactions between borrowers and lenders of funds. As a
result, such activities related to the financial service sector
are referred to as “Financial intermediation services,” and
associated added values are imputed.
Until the compilation of the 2005 Tables, domestic
production had been recorded as shown below based on
the imputed interest method:
Imputed interest = (Interest earnings from loans) -
(Interest paid in relation to deposits and savings)
The output destination was limited to the intermediate
demand sector (industry sector), and allocated depending
on the loan balance. This is because those that receive fi-
nancial intermediation services are deemed as being com-
panies that receive loans, and because this conforms to the
68SNA that proposes for all of the monetary amount to be
processed as intermediate consumption for industry. Based
on this method, amounts in the exogenous sectors are not
affected by financial intermediation services, and thus, it
was beneficial in that the amounts in exogenous sectors do
not increase or decrease depending on changes in interest.
However, with the imputed interest method, the exist-
ence of depositors are not taken into consideration, and
- 72 -

there were issues such that the actual state of the econ-
omy in which even households were borrowers of funds
was not followed.
Beginning with the 2011 Tables, the concept that was
proposed in the 93SNA “FISIM” (Financial Intermedia-
tion Services Indirectly Measured) was newly adopted.
In FISIM, domestic production is calculated as follows.
[Domestic production = FISIM on borrower side +
FISIM on lender side]
FISIM on borrower side = Total loan balance ×
(Investment interest rate - Reference interest
rate)
FISIM on borrower side = Total deposits balance ×
(Reference interest rate - Procurement interest rate)
Investment interest rate = Total interest received from
loans/Total loan balance
Procurement interest rate = Total interest paid on depos-
its/Total deposits balance
Reference interest rate = Total interest for calculating
reference interest rate / Total balance for calculating refer-
ence interest rate
In this method, there are no limitations to the output
destination as with the imputed interest method, contrib-
uting to representation of output structure that follows
the actual state more closely.
[2] Life and non-life insurance
We treat the sector for life and non-life insurance as pro-
ducing imputed insurance services calculated based on
the following:
(Premiums received + Earnings from asset manage-
ment) - (Loss paid + Increase in reserves)
All imputed services for life insurance are recorded as
consumption expenditure of households, while those for
non-life insurance are recorded in the endogenous sectors
in addition to consumption expenditure of households.
[3] House rents of owner-occupied dwellings and employee
housing
The format of owner-occupied dwellings, etc. differs
in terms of economic transactions from rental housing, in
that there is generally no rent payment for house owner-
ship, while rental housing is associated with the actual
payment of rent. However, even with regard to owner-
occupied dwellings, etc. it is thought that the same utility
as rental housing is generated with respect to the resident
receiving the benefits of housing services. In the SNA,
even for house ownership, etc., it is deemed that one pays
rent that follows market prices for rental housing and
lives in his/her house, and an amount (imputed rent) is
recorded (Note1).
Even in the Basic Transaction Table for Japan, im-
puted rent has been recorded in line with this concept
since the past, and a sector referred to as “House rent (im-
puted house rent)” has been established(Note 2). This sector
is one where a person living in an owner-occupied dwell-
ing, etc. is operating a house rental business in relation to
himself/herself, and expenditures for residing in and
maintaining the said owner-occupied dwelling, etc. are
recorded as inputs. Specifically, most of the monetary
amount is recorded in the gross value added sector, but
repair of construction and financial service (interest pay-
ment related to housing loans) are recorded as intermedi-
ate input. With regard to the output, since the services are
provided to the resident himself/herself, the total mone-
tary amount is output to “Consumption expenditure of
households” (see Chart 3-11).
(Notes)1 For employee housing and dormitories where there
is actual payment of rent by residents, the difference
between the market price of a housing facility equiva-
lent to the said employee housing or dormitory and the
amount that was actually paid as rent is recorded as im-
puted house rent.
2 “House rent (imputed house rent)” became inde-
pendent from “House rent” starting with the 2000 Ta-
bles, but corresponding monetary amounts were rec-
orded as “House rent” even before then.
Chart 3-11 Representation Format for Imputed Rent and
House Rent
Domestic
production
Cost of repair and the like
(Repair of construction)
Interest payment of home
loan
(Financial service)
Example
・Interest payment of home loan: 100,000 yen / year
・Cost of repair: 100,000 yen / year
Maintenance cost of housing
・2 million yen / year
Evaluate home rent equivalent by market rate
10
10
House rent
(imputed house rent)
Consumption expenditure
of households
200 200
180
200
House rent
(imputed house rent)
Value Added
Domestic production
(10,000yen)
- 73 -

(5) Dummy Sectors
Among the respective sectors within the endogenous sec-
tor of the Basic Transaction Table based on production ac-
tivities, some sectors are not considered independent indus-
trial sectors. “Dummy sectors” are established to accommo-
date the aforementioned activities in order to facilitate com-
pilation of the Basic Transaction Tables.
In the dummy sectors, the identification code “P” is at-
tached at the end of the basic sector classification code.
Specifically, the following sectors are established:
・ “Office supplies”
・ “Self-transport (passengers)”
・ “Self-transport (freight)”
・ “Used paper”
・ “Scrap iron”
・ “Non-ferrous metal scrap”
Since the dummy sectors are not sectors that independently
generate added value as they are characteristically “Dum-
mies,” only endogenous sectors are recorded in terms of
numbers, and gross value added is not recorded.
[1] Office supplies
Office supplies such as pencils, erasers, notebooks, etc.
that are used commonly in each sector are often collec-
tively processed as “Consumables” in corporate account-
ing. In the Basic Transaction Table, these office supplies
are output from each row sector to [column] “Office sup-
plies” that was established as a dummy sector. On top of
this, the corresponding monetary amount is collectively
output from [row] “Office supplies” to each column sec-
tor in which the office supplies were actually purchased.
By doing so, a representation that is close to the collec-
tive processing used in corporate accounting was
achieved.
The differences in the representation formats for cases
where office supplies is established and where it is not
established are shown in Chart 3-12. Special treatment of
the office supplies sector as a dummy sector allows us to
regard the sector as performing independent production
activities. Note that the domestic production in the Input-
Output Tables will increase by the value of office sup-
plies, although there will be no changes to the gross value
added.
[2] Self-transport (passengers, freight)
i) Definition of the self-activities sectors
In some cases, companies cover the activities in one
industrial field in-house. For example, companies cover
such activities as transport, packing, in-house education,
in-house research and development, advertising, and
data-processing services themselves, or in-house, etc.
As the Basic Transaction Table are classified by pro-
duction activities, strictly speaking, the aforementioned
self-activities should be recorded in the respective sec-
tors for transport, education, research, and data pro-
cessing. However, these activities are absorbed as
Chart 3-12 Representation Formats for Office Supplies
part of the activities of the respective sectors. There-
fore, it is almost impossible for us to gain an under-
standing of the entire input structure by separating
them. Due to such circumstances, only self-transport
is established as a dummy sector at the present mo-
ment.
The state of establishment of the self-transport sector
up to now is as indicated below.
[1] When the office supplies sector is not established
[2] When the office supplies sector is established
Value added 40 0
Domestic production 100 10
Notebook 5 (5)
Office supplies 10 (10)
Pencils 5 (5)
Value added 40
Domestic production 100
Sector "A"Office
supplies
Domestic
production
Raw material 1 30
Raw material 2 20
Pencils 5 (5)
Notebook 5 (5)
Raw material 2 20
Sector "A"Domestic
production
Raw material 1 30
- 74 -

Sector Setting year
Self-transport
(passengers)
1975, '80, '85, '90, '95, 2000, '05,
'11, '15
Self-transport
(freight)
1975, '80, '85, '90, '95, 2000, '05,
'11, '15
Self-education 1975, '80, '85
Self-research 1975, '80, '85
Self-packing 1975, '80
Self-warehouse 1975
(Note) Beginning with the 1990 Tables onward, gross value
added amount has been calculated and included in “Re-
search and development” in the industry sector.
ii) Representation format
The products that are necessary for carrying out self-
activities are represented in a format where they are out-
put to [column] self-activities sector, after which they
are purchased collectively by each demand sector (col-
umn sectors that are carrying out self-activities in the
process of production activities) from [row] self-activi-
ties sector.
The differences in representation formats for when
the self-activities sectors are established and when they
are not established are as shown in Chart 3-13. Spe-
cially targeting these self-activities sectors as dummy
sectors means that their status as independent produc-
tion activities is recognized within this extent. Accord-
ingly, domestic production for the table as a whole be-
comes large only for the self-activities sectors, but as
the gross value added amount is not recorded in dummy
sectors, there are no changes to the gross value added
amount.
[3] Scrap iron, non-ferrous metal scrap, and used paper
In principle, scrap and by-products are treated as mi-
nus input, and are input the same amount to the “Reuse
and recycling” sector. The amount to which the cost of
collection and treatment is add is output from that sector
to each input sector. In this case, by-products can be rec-
orded in the sectors (row) in which the products are pri-
marily produced. In the case of scrap iron, non-ferrous
metal scrap, and used paper, however, there is no sector
in which these are the main products. Therefore, their
output and input cannot be recorded. We will establish
the row sectors for scrap iron, non-ferrous metal scrap,
and used paper as dummy sectors.
Other scrap should be recorded in the sectors for sim-
ilar raw materials. For example, the scrap of glass bottles
should be recorded in the sector for other glass products.
(6) Usership and Ownership
[1] Concepts of usership and ownership
There are two methods for treating the current ex-
penses of production facilities in the goods rental and
leasing sectors: “Usership” and “Ownership.”
With “Usership,” the cost of using production facilities
is recorded in the sector that uses them, regardless of who
owns them and who directly pays the cost. As for rented
production facilities, we record the rental expense com-
posed of the cost of maintenance and consumption, as well
as the net rental (the amount after deduction of the cost of
maintenance and consumption from the gross rental), in
the sector that uses the production facilities as the cost or
the operating surplus (the portion of the net rental) . As a
result, the rental sector does not work out to be a sector,
Chart 3-13 Representation Formats of Self-Transport Sector
i) When the self-transport sector is not established
ii) When the self-transport sector is established as a dummy sector
Raw material 2 20
Note: If sector "A" spends 10units of petroleum for self-transport, another 10 units
of the self-transport sector will be recorded in the total domestic products in
addition to the 10 units of petroleum invested
Sector "A"Domestic
production
Raw material 1 25
Petroleum 15 (15)
Petroleum 5 10
Domestic production
Comprised of 5 for
raw material and 10
for transport
Value added 40
Domestic production 100
Value added 40 0
(15)
100 (10)
Self-transport 10
Domestic
production
Raw material 1 25
Raw material 2
(10)
Sector "A"Self-
transport
20
- 75 -

but it is advantageous in that production and capital that
is used for production can be processed together, and
there is increased stability of input coefficients.
“Ownership,” on the other hand, is a concept where
expenditures, etc. are recorded in the sector that owns the
production facility, and it is necessary to establish a sec-
tor that carries out rental and leasing of goods. In this
case, the total of revenues from goods rental and leasing
becomes the domestic production for the sector carrying
out the goods rental and leasing, and on the other hand,
the amount equivalent to goods rental and leasing (pay-
ment) is recorded in the column sectors corresponding to
the users (borrowers) as intermediate input from the row
sectors carrying out goods rental and leasing. In terms of
the actual economic state, as there is considerable weight
of the goods rental and leasing business making up the
industry as a whole, in cases where it is necessary to rec-
ord domestic production and gross value added from sec-
tors carrying out goods rental and leasing separately, the
concept of ownership is used.
[2] Treatment in the Basic Transaction Table for Japan
In the Basic Transaction Table for Japan, both con-
cepts were used together(Note1) up until the 1985 Tables,
but starting with the 1990 Tables, estimations are made
based on “ownership” as a whole (Note 2).
This is because, as described above, there was a neces-
sity to perceive goods rental and leasing as an independ-
ent sector, due to a rise in the weight of the goods rental
and leasing business. At the same time, estimations based
on “usership” were judged as being extremely difficult
when looking at the current state of basic statistics.
Differences in representation formats based on us-
ership and ownership are indicated in Chart 3-14.
Note:1 Until compilation of the 1985 tables, the following goods
rental and leasing sectors had been estimated based on
“ownership”: “Electronic computing equipment rental and
leasing,” “Office machines rental and leasing (except
electronic computing equipment)”, and “Car rental and leas-
ing,” as well as “Real estate rental service.” On the other
hand, the industries included in “General goods rental and
leasing” and “Industrial equipment and machinery rental
and leasing” in the Japan Standard Industrial Classification
had been estimated based on “usership.”
2 There are two formats for goods rental and leasing—“op-
erating lease” and “finance lease.”
Operating lease is a type of rental and lease that is gener-
ally imagined, where machinery and facilities are leased for
a period of time that is shorter than their useful life. This is
a format of production activity where the owner (lender)
provides services of goods rental and leasing to a user (bor-
rower) (as part such services, there are often cases where the
user is responsible for maintenance and repair of machinery
or facilities), and domestic production is valuated based on
the rent that is paid by the user to the owner.
In relation to this, finance lease is a “lease transaction
where the corresponding contract cannot be dissolved dur-
ing the lease period based on the least contract, or a lease
transaction conforming to such a lease, where the lender can
substantially receive the economic benefits that are yielded
from the property that is used based on the said contract, and
is substantially responsible for the costs that are incurred in
accordance with use of the said property” (Accounting
Standards for Lease Transactions (Corporate Accounting
Standard No. 13) Paragraph 5).
In Japan, accounting processing related to finance leases
was, in principle, changed from leasing to sale and purchase,
in accordance with changes in accounting standards related
to lease transactions in 2008. Even within the same goods
rental and leasing business, handling in terms of accounting
has come to be divided. However, due to restrictions in basic
statistics, finance leases continue to be handled as the goods
rental and leasing business in the Basic Transaction Table,
and are recorded as “ownership” for the goods rental and
leasing business as a whole.
Chart 3-14 Representation Formats of Usership and Ownership
Sector "A"
Machine repair services (15)
[1] Usership(recorded as if sector "A" owns the machinery.)
Note: The cost of the rental services is added to the cost for the original activities
of sector "A".
Example: When sector "A" rents industrial machinery at the rental expense
of 100 from the company of goods rental and leasing
Goods rental and leasing 100
Operating surplus (65)
Consumption of fixed capital (20)
Domestic production (100)
[2] Ownership (The company of goods rental and leasing is recorded as
the owner of the machines.)
Note: Represented in the same way as in normal purchase of services
Sector "A"
Goods rental and
leasing
Machine repair services 15
Domestic production 100
Compensation for employees 50
Operating surplus 15
Consumption of fixed capital 20
- 76 -

(7) Activities of Non-market Producers
[1] Activities that are carried out by the government and in-
dependent administrative agencies, etc. are broadly cate-
gorized into (1) non-market producers (general govern-
ment), (2) non-market producers (private non-profit in-
stitutions serving households), and (3) market producers.
(1) and (2) differ from general industry in terms of the
cost structure and source of funds for activities. As a re-
sult, special handling is implemented.
[2] The sectors that are associated with the * symbol, such
as “School education (private),” to which private schools
correspond, and “Private non-profit institutions serving
households,” to which academic organizations corre-
spond, are handled as non-market producers (private
non-profit institutions serving households) in terms of
transactor-based production activity classification. These
kinds of sectors are handled in a special manner as fol-
lows (see Chart 3-15).
i) Domestic production is measured using gross pro-
duction expenditures, and operating surplus is not rec-
orded.
ii) For output destinations, the amount paid for service
activities of the corresponding sector is recorded in its
burden sector (or in other words, the column sector for
the industry or household that paid the fee,) and the
remaining amount is recorded at the intersection of the
row sector and “Consumption expenditure of private
non-profit institutions serving households.”
iii) For output destinations of “Research institutes for
natural sciences (NPI)*” and “Research institutes for
cultural and social sciences (NPI),*” the amount paid
for service activities of the corresponding sector is rec-
orded in its burden sector, the amount paid for research
and development is recorded in “Gross domestic fixed
capital formation (private sector),” and remaining
amount is recorded at the intersection of the row sector
and “Consumption expenditure of private non-profit
institutions serving households.”
Chart 3-15 Representation Format of the Activity of Non-
market Producers (Private Non-Profit Institutions
Serving Households)
Domestic
production100
40 100
80
0
60
Compensation of
employees
Operating surplus
Goods 1 10
Goods 2 10
Private university
Consumption
expenditure of
households
Consumption expenditure
of private non-profit
institutions serving
Domestic
production
Example: A private university conducts an activity of 100, 60 of which are income from tuition.
Private
university
- 77 -

- 78 -
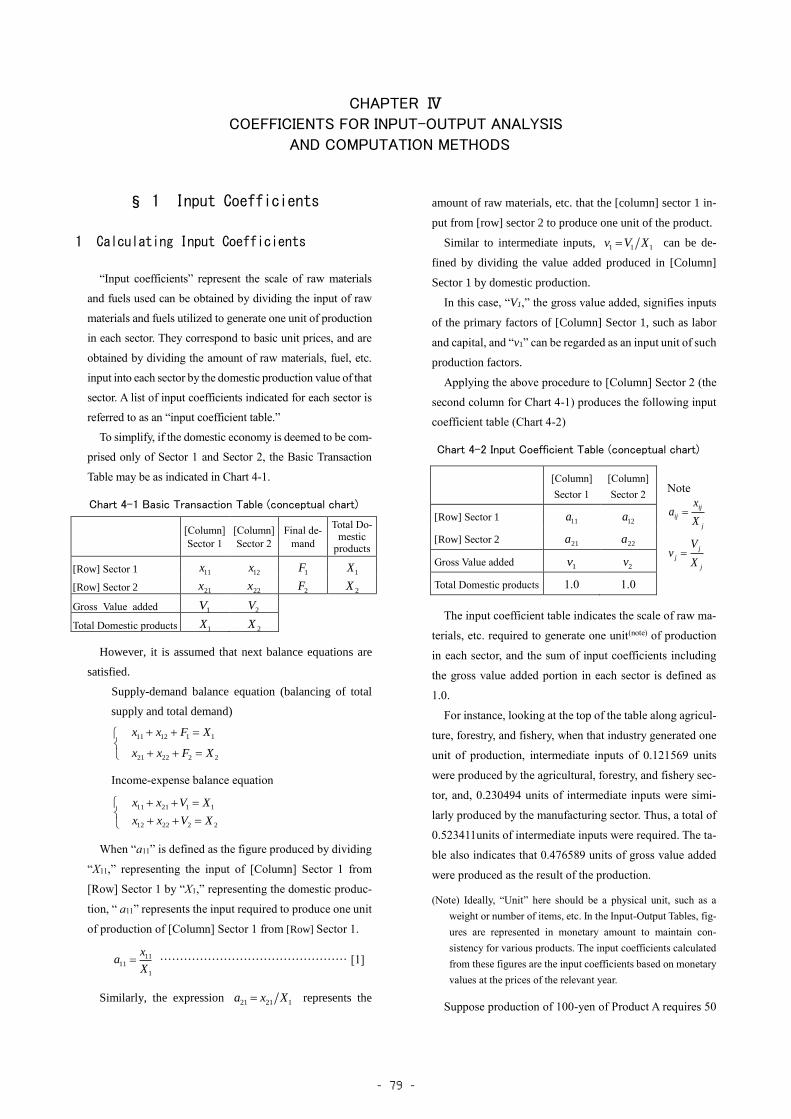
CHAPTER Ⅳ
COEFFICIENTS FOR INPUT-OUTPUT ANALYSIS
AND COMPUTATION METHODS
§ 1 Input Coefficients
1 Calculating Input Coefficients
“Input coefficients” represent the scale of raw materials
and fuels used can be obtained by dividing the input of raw
materials and fuels utilized to generate one unit of production
in each sector. They correspond to basic unit prices, and are
obtained by dividing the amount of raw materials, fuel, etc.
input into each sector by the domestic production value of that
sector. A list of input coefficients indicated for each sector is
referred to as an “input coefficient table.”
To simplify, if the domestic economy is deemed to be com-
prised only of Sector 1 and Sector 2, the Basic Transaction
Table may be as indicated in Chart 4-1.
Chart 4-1 Basic Transaction Table (conceptual chart)
[Column]
Sector 1
[Column]
Sector 2
Final de-
mand
Total Do-mestic
products
[Row] Sector 1 11x 12x 1F 1X
[Row] Sector 2 21x 22x 2F 2X
Gross Value added 1V 2V
Total Domestic products 1X 2X
However, it is assumed that next balance equations are
satisfied.
Supply-demand balance equation (balancing of total
supply and total demand)
222221
111211
XFxx
XFxx
Income-expense balance equation
222212
112111
XVxx
XVxx
When “a11” is defined as the figure produced by dividing
“X11,” representing the input of [Column] Sector 1 from
[Row] Sector 1 by “X1,” representing the domestic produc-
tion, “ a11” represents the input required to produce one unit
of production of [Column] Sector 1 from [Row] Sector 1.
1
1111
X
xa ··············································· [1]
Similarly, the expression 12121 Xxa represents the
amount of raw materials, etc. that the [column] sector 1 in-
put from [row] sector 2 to produce one unit of the product.
Similar to intermediate inputs, 111 XVv can be de-
fined by dividing the value added produced in [Column]
Sector 1 by domestic production.
In this case, “V1,” the gross value added, signifies inputs
of the primary factors of [Column] Sector 1, such as labor
and capital, and “v1” can be regarded as an input unit of such
production factors.
Applying the above procedure to [Column] Sector 2 (the
second column for Chart 4-1) produces the following input
coefficient table (Chart 4-2)
Chart 4-2 Input Coefficient Table (conceptual chart)
j
j
j
j
ij
ij
X
Vv
X
xa
The input coefficient table indicates the scale of raw ma-
terials, etc. required to generate one unit(note) of production
in each sector, and the sum of input coefficients including
the gross value added portion in each sector is defined as
1.0.
For instance, looking at the top of the table along agricul-
ture, forestry, and fishery, when that industry generated one
unit of production, intermediate inputs of 0.121569 units
were produced by the agricultural, forestry, and fishery sec-
tor, and, 0.230494 units of intermediate inputs were simi-
larly produced by the manufacturing sector. Thus, a total of
0.523411units of intermediate inputs were required. The ta-
ble also indicates that 0.476589 units of gross value added
were produced as the result of the production.
(Note) Ideally, “Unit” here should be a physical unit, such as a
weight or number of items, etc. In the Input-Output Tables, fig-
ures are represented in monetary amount to maintain con-
sistency for various products. The input coefficients calculated
from these figures are the input coefficients based on monetary
values at the prices of the relevant year.
Suppose production of 100-yen of Product A requires 50
[Column]
Sector 1
[Column]
Sector 2
[Row] Sector 1 11a 12a
[Row] Sector 2 21a 22a
Gross Value added 1v 2v
Total Domestic products 1.0 1.0
Note
- 79 -

yen of Product B. If the prices of all products can be ex-
pressed through “amount-by-unit price,” this situation may
be equivalent to a hypothetical situation in which 50 of
“Product B that can be purchased at one yen” was input to
produce 100 of “Product A that can be purchased at one yen.”
Production volumes of all industries are valued at the unit
of quantity equivalent to one yen (or one dollar or one mil-
lion yen or other consistent monetary units), to allow com-
parison of industry production units. This system is called
Input-Output Tables at the “yen value unit.” Valuation by
the “yen value unit” for the base year represents the nominal
value itself. If the “yen value unit” in the base year is applied
to the year to be compared, “real evaluation” based on the
valuation at yen value in the table for the base timetable can
be obtained.
2 Definition of Input Coefficients
(1) Measurement of Effects of Input Coefficients
on Production
Next, the meanings of input coefficients are considered with
Chart 4-1 and Chart 4-2 mentioned above.
Suppose demand for Sector 1 has increased by one unit.
Sector 1 require raw materials, etc. to generate one unit of pro-
duction. Sector 1 thus generate intermediate demands of “a11”
and “a21” units of raw materials to Sector 1 and Sector 2, re-
spectively, in accordance with the input coefficients, which
is the primary production repercussion. Receiving the de-
mands, Sector 1 and Sector 2 will further generate the second-
ary production repercussions, in accordance with the respec-
tive input coefficients to produce “a11” and “a21” units. This
series of production repercussions continues infinitely, until
domestic production levels for the respective sectors can ul-
timately be calculated as the summation of all production
repercussions.
In this manner, input coefficients are crucial to measuring
how much production can be ultimately induced at each sector
when certain levels of final demand are generated in an indus-
trial sector.
However, it is all but impossible and unfeasible to trace and
calculate each process of production repercussion occurrences.
The following inverse matrix coefficients are prepared to
simplify such production repercussion calculations. As a
preparatory step, it is necessary to explain the process of pro-
duction repercussions.
(2) Mathematical Computation of Effects on
Production
In Chart 4-1 above, the mathematical formula of the
balance for every row is described by the following equa-
tions:
222221
111211
XFxx
XFxx ·························· [2]
As in the case of equation [1], “a21,” “a12,” and “a22”
are calculated and substituted into equation [2], resulting
in the following modifications:
22222121
11212111
XFXaXa
XFXaXa ······················· [3]
As indicated in equation [3], certain relationship ex-
ists between final demand and domestic production. The
relationship is defined by “input coefficients.”
Equation [3] can be expressed in a matrix, as follows:
2
1
2
1
2
1
2221
1211
X
X
F
F
X
X
aa
aa
2221
1211
aa
aaA
This is referred to as the input coefficient matrix.
Assigning specific figures to the final demands repre-
sented by “F1” and “F2” in the simultaneous equations of
[3] and solving them makes it possible to obtain domestic
production that meets final demand. This calculation pro-
duces the domestic production levels in Sector 1 and Sec-
tor 2 resulting from production repercussion effects.
Demand increases in a certain industrial sector will re-
quire inputs of raw materials and fuels, etc. from other
industries for production activities, and thereby affecting
not just sector production but those of the other industries,
which will further generate additional demands in the
original sector as repercussion effects. Equation [3] indi-
cates a mechanism for calculating the cumulative effects
of these repercussions. This is the fundamental approach
and constitutes the basis of input-output analyses based
on input coefficients.
However, it is important that this approach is based on
the premise of stable input coefficients, as indicated be-
low. If there are constant fluctuations in the input coeffi-
cients, itis impossible to determine the above-mentioned
relationships between final demand and domestic produc-
tion.
- 80 -

3 Stability of Input Coefficients
(1) Consistency of Production Technology Levels
In the Input-Output Tables, input ratios of raw materi-
als and fuels, etc. required to produce goods and services
represented by the input coefficients are assumed not to
fluctuate significantly between the year to be analyzed
and the year referred to when the table was compiled.
Input coefficients, in short, reflect production technol-
ogies adopted in a certain year. Changes in production
technologies may naturally change the input coefficients.
Although drastic changes are generally not supposed to
occur in production technologies in short timeframes, in
industries and regions that undergo rapid technological
advancements, it becomes necessary, as the year sub-
jected to analyses falls behind the year to be referred to
for compiling tables, to acquire information on changes
in input coefficients somehow and make proper adjust-
ments.
(2) Consistency of Production Scale
Each industrial sector is comprised of various enter-
prises and establishments with different production scales.
Even if the same products are produced, different produc-
tion scales will inevitably lead to different input struc-
tures among enterprises and establishments due to the dif-
ferent technological structures for production and econ-
omy-of-scale levels.
However, the Input-Output Tables are compiled while
reflecting the average production structures in the pro-
duction scale in the years referred to for compiling tables.
In input-output analyses, therefore, the production scales
of enterprises and establishments allocated to their re-
spective industrial sectors are assumed not to have under-
gone significant changes between the years to be ana-
lyzed and those referred to when tables were compiled.
(3) Change Factors of Input Coefficients
It is assumed that there are few changes in input coef-
ficients between the year to be analyzed and the year re-
ferred to for compilating tables. In reality, however, in ad-
dition to the (1) and (2) above, input coefficients may
change over time due to the following factors:
[1] Changing Relative Prices
Since individual transactions in the Basic Transaction
Tables are valued at prices in the year referred to when
the tables were compiled, changing the relative prices of
goods and services will change the input coefficients,
even if the technological structures for production re-
main constant.
Historical comparisons would require Linked Input-
Output Tables based on fixed price valuations, in which
effects of fluctuating relative prices are eliminated.
[2] Changing Product Mixes
If multiple products with different input structures
and unit prices are placed in the same sector (which is
referred to as a “product mix”), changes in product
structures within the sector will change the input coeffi-
cients of the entire sector, even if there is no change in
input structure or unit price of each product.
- 81 -

§2 Inverse Matrix Coefficients
1 Definition and Computation of Inverse
Matrix Coefficients
One of the important analyses in input-output analyses is
to analyze the direct and indirect effects of certain final de-
mands that occurred in an industrial sector on other indus-
trial sectors. As stated before, input coefficients in the re-
spective industrial sector may play crucial roles.
Suppose the domestic economy is comprised only of Sec-
tor 1 and Sector 2. As stated in section 1, when the final
demand is given, solving the following simultaneous equa-
tions will give the domestic production levels of Sector 1
and Sector 2.
22222121
11212111
XFXaXa
XFXaXa ························· [3]
Indeed, if the entire structure were composed only of
these two sectors, calculations would be quite simple. In re-
ality, even the medium aggregated Sector Classification has
as many as 107 sectors, which makes solving simultaneous
equations for all of them impractical and makes it almost
impossible to conduct proper analyses.
If calculations can be made in advance, as to what kind
of production repercussions on various sectors may be ex-
pected if one unit of final demand is produced for a certain
sector, and how much domestic production will be finally
expected in each sector, analyses could be significantly ex-
pedited. “Inverse matrix coefficient tables” are compiled in
response to this need.
In the matrix indication for equation [3] above,
2
1
2
1
2
1
2221
1211
X
X
F
F
X
X
aa
aa ····················· [3]’
when the input coefficient matrix is defined as
Aaa
aa
2221
1211
the final demand column vector is defined as
FF
F
2
1
and the domestic production column vector is defined as
XX
X
2
1
XFAX ············································ [3]’’
can be obtained. The solution for X is
FAIX
FXAI
FAXX
1
where “I” is an Identity matrix, 1
AI is the inverse
matrix of (I – A), as follows:
1
2221
12111
1
1
aa
aaAI
The factors of this matrix are referred to as “inverse ma-
trix coefficients,” a listing of which is the “Inverse Matrix
Coefficient Table.” This table indicates how much produc-
tion will be ultimately induced in what sector by a demand
increase of one unit in a certain sector. Once the inverse ma-
trix coefficients are calculated, the simultaneous equations
in [3] do not need to be solved independently. When the fi-
nal demand in a sector is given, the domestic production at
each sector, corresponding to the final demand, can be im-
mediately calculated.
(Note) For the equation of [3], to be able to give a non-negative
solution for a certain F (non-negative), the necessary and suf-
ficient condition will be that all principal minors in the matrix
(I – A) in the matrices need to be positive (Hawkins-Simon’s
condition). For all the principal minors in matrix (I – A) to be
positive, the sufficient condition will be
n,,,jan
i
ij 2111
Here the sum of input coefficients should always be less
than 1 (Solow’s condition).That is necessary condition.
Sectors at the top of the inverse matrix coefficient table
are those in which one unit of the final demand has been
generated; sectors at the side indicate those in which pro-
duction can somehow be induced by generation. For in-
stance, in examining the agriculture, forestry, and fishery
from the top of the table down, one unit of final demand in
the agriculture, forestry, and fishery sector can ultimately
generate 1.119526 units of production inducement in the ag-
riculture, forestry, and fishery sector itself; and production
inducements in the mining, manufacturing, and construction
industries will be 0. 000838 units, 0.344368 units, and 0.
004946 units, respectively, resulting in a total of 1.797141
units of production inducements, which can be interpreted
as corresponding to the vertical sum.
Input coefficients introduced in §1 indicate the amount of
raw materials and other factors directly required to produce
one unit of certain goods or services. The inverse matrix co-
efficients indicate the magnitude of the ultimate direct and
- 82 -

indirect production repercussions on various industrial sec-
tors when there is one unit of final demand for a certain sec-
tor.
(Note) In this way, when inverse matrix coefficients are observed
in relation to production repercussions, for instance, when
one unit of final demand is generated in agriculture, forestry,
and fishery, production in the sector must increase (direct ef-
fect) to satisfy demand.
Due to agriculture, forestry, and fishery to increase produc-
tion, other sectors must increase production, the effects of
which further increase production in agriculture, forestry, and
fishery (indirect effects). As a result, the production increase
in the agriculture, forestry, and fishery sector usually exceeds
one unit. Thus, the diagonal elements in the inverse matrix
coefficients indicating the production increase in the self-ac-
tivity sector commonly exceed 1.
A column vector with the inverse matrix defined as B, the
diagonal element as bii, and the column vector as (ui), in
which the i-th element is 1 and the other elements are 0, can
be describe as follows:
ni
ii
i
nnnin
iniii
ni
i
b
b
b
bbb
bbb
bbb
Bu
1
1
1
1111
0
1
0
It can be concluded from the above that the i-th column
vector of the inverse matrix B indicates the production in-
crease units at each sector when one unit of final demand is
generated in the sectors. (For the reasons mentioned above,
1≧iib )
The vertical sum of aggregated i-th column in the inverse
matrix B corresponds to the production inducement coeffi-
cient of the i-th sector (please refer to §3).
2 Types of Inverse Matrix Coefficients
(Handling of Imports)
In analyses of production repercussions with Input-Out-
put Tables, a major issue is import handling. §2 above the
mentioned the so-called Type 1
AI model, which is a
simplified model excluding imports. Basically various
goods are imported and consumed in parallel with domestic
products in industries and households.
Chart 4-3 shows the model for Basic Transaction Tables,
clearly indicating imports. For row items, both intermediate
demand (𝑥𝑖𝑗) and final demand (𝐹𝑖) are supplies including
imports, and columns and rows (production) offset each
other because imports are indicated negative values.
Chart 4-3 Basic Transaction Table(conceptual chart that
import is demonstrated)
Sector 1 Sector 2 Final de-
mand Import
Domestic production
Sector 1
11x 12x 1F 1M 1X
Sector 2 21x
22x 2F
2M 2X
Gross value added 1V
2V
Domestic production 1X
2X
Input coefficients include imports. This implies that all
repercussions derived from final demand do not necessarily
induce domestic production; some effects may induce im-
ports.
In other words, for accurate determination of domestic
production inducements, import inducements must be de-
ducted.
It is thus necessary to provide a calculation method for
inverse matrix coefficients that accounts for import inputs.
The inverse matrix coefficients in the 1)( 〕〔 AM̂II
Type are commonly utilized in Japan. Several inverse ma-
trix coefficient calculation methods are also used, as fol-
lows:
(1) 1
AI Type
This model suggests that imports are handled exoge-
nously (meaning that changes are irrespective of domes-
tic production activities).
The supply-demand balance equation can be presented
as follows:
222222121
111212111
XMFXaXa
XMFXaXa ················· [4]
The matrix denotation is as indicated below.
XMFAX ·································· [4]’
This is a “Competitive import type” model in which
intermediate demand (AX) and final demand (F) include
a certain volume of imports.
The solution for X is:
MFAIX
MFXAI
MFAXX
1
In this model, both final demand and imports can be
determined exogenously. Imports, however, can gener-
ally be induced by domestic production. In other words,
it is to regard them as endogenously determined (meaning
that changes are respective of domestic production activ-
ities). Thus, this model is used infrequently in general
multiplier effect analyses.
- 83 -

(2) 1)( 〕〔 AM̂II Type
This model divides final demand (F) into domestic fi-
nal demand (Y) and export (E), giving the following equa-
tion:
EYF
This is substituted into [4]’ above. The supply-demand
balance equation can be expressed as follows:
AX + Y + E = X ................................................ [5]
In the tables, mere transit transactions are not supposed
to be incorporated into exports. Thus, it can be assumed
that exports do not include imports. Import coefficients
by row can be defined as follows:
jijij
i
iYXa
Mm
That is, “mi” represents the ratio of imports in product
“i” within total domestic demands, or ratios of depend-
ence on imports; while (1-mi) represents self-sufficiency
ratios.
When [5] is represented for “i” row,
j
iiiijji XMEYXa ..................... [6]
From the definition of import coefficients,
)( ij
j
ijii YXamM ............................... [7]
[7] is substituted into [6], and the equation is as fol-
lows:
j
iiijijii EYmXamX )1()1( ....... [8]
The diagonal matrix ( M̂ ) can be assumed to have an
import coefficient (mi) as the diagonal element and zero
as the non-diagonal element.
nm
m
M
0
0
ˆ1
From [8] above, the following equation can be ob-
tained:
EYMIXAMII )ˆ()ˆ( 〕〔 .................. [9]
From [9], the following equation can be obtained:
〕〔〕〔 EYMIAMIIX )ˆ()ˆ( 1 ............ [10]
Giving domestic final demand (Y) and export (E) pro-
duces domestic production (X).
Here, AMI )ˆ( indicates the input ratio of domestic
products when the import input ratio is assumed to be
constant in all sectors, whether they are for intermediate
demand or final demand. YMI )ˆ( indicates domestic
final demand for domestic products under the same as-
sumption. In other words, this is the “competitive import
type” model when import ratios for individual items (for
rows) (or import coefficients) are assumed to be identical
in all output sectors.
Inverse matrix coefficient tables based on this model
are commonly used in Japan.
(Note) "Transit transactions" means that imported products are
exported as they are, without being processed domestically,
implying that the products merely pass through the country.
(3) 1 )( dAI Type
This inverse matrix coefficients is the “non-competi-
tive import type,” which can be used for analysis when
the input ratios of imports differ from sector to sector.
Chart 4-4 shows simplified non-competitive Import
Basic Transaction Table.
Chart 4-4 Basic Transaction Table (conceptual chart of
Non-Competitive Import Type)
Naturally, the following equations can be defined:
mij
dijji xxx
m
i
d
ii FFF
The supply-demand balance for domestic products can
be presented as follows:
111211 XFxx ddd
222221 XFxx ddd
Where input coefficient for domestic intermediate
goods is defined as follows:
j
dijd
ijX
xa
Then, the equations [11] can be as follows:
11212111 XFXaXa ddd
22222121 XFXaXa ddd
This can be represented by the following matrix:
Industry 1 Industry 2
Final
demand Import
Domestic
production
Domestic Industry 1
dx11 dx12
dF1 — X1
Industry 2 dx21
dx22 dF2 — X2
Import Industry 1
mx11 mx12
mF1 -M1 —
Industry 2 mx21
mx22 mF2 -M2 —
Gross value added V1 V2
Domestic production X1 X2
.............................. [11]
...................... [11]’
- 84 -

AdX + Fd = X ........................................................ [11]”
This is the “non-competitive import type” model. Both
intermediate demand (AdX) and final demand (Fd) cover
domestic products and exclude imports.
The solution of [11]” for X is as follows:
X – AdX = Fd
(I – Ad)X = F
X = (I – Ad)-1 Fd
When the final demand for domestic products (Fd) is
given, the domestic production level (X) can be obtained:
The relationship with the competitive import type
model may be presented as follows: When the input co-
efficient matrix for import is defined as (Am) and the final
demand colum vector for imports is defined as (Fm), the
following equations can be derived:
A = Ad + Am
F = Fd + Fm
Based on the above equations, the following supply-
demand balance can be obtained:
(Ad + Am)X + (Fd + Fm) = X + M
This is the basic equation of the competitive import
type of model.
Input ratios of domestic and imported products in the
actual economy may generally differ from sector to sector.
Inverse matrix coefficients based on this model represent
this situation as is. When this type of inverse matrix co-
efficients are compared with (2) 1])ˆ([ AMII , sig-
nificant differences may be observed at times in certain
sectors.
In the Input-Output Tables compiled as a joint project
by related authorities, inputs and outputs are divided into
domestic and imported products, making it possible to
use two different types of inverse matrix tables, namely,
“competitive import type” and “non-competitive import
type.” Which is appropriate will depend on the purpose
of the analysis and considerations regarding consistency
with the assumptions.
3 Index of the Power of Dispersion and
Index of the Sensitivity of Dispersion
(1) Index of the Power of Dispersion
The figure in each column in the inverse matrix coef-
ficient table indicates the production required directly and
indirectly at each row sector when the final demand for
the column sector (that is, demand for domestic produc-
tion) increases by one unit. The total (sum of column) in-
dicates the scale of production repercussions on entire in-
dustries, caused by one unit of final demand for the col-
umn sector.
The vertical sum of every column sector of the inverse
matrix coefficients is divided by the mean value of the
entire sum of column to produce a ratio. This ratio indi-
cates the relative magnitudes of production repercus-
sions; that is, which sector’s final demand can exert the
greatest production repercussions on entire industries.
This is called the “Index of the Power of Dispersion” and
can be calculated as follows: (Please refer to Chart 4-5)
t tablecoefficienmatrix inverse in the sum verticalentire of Mean value
t tablecoefficienmatrix inversein cloumn of sumEach
sectorby dispersion ofpower theofIndex
B
b j*=
Here,
i
jij* bb
j i j
ijjb
nb
nB
11*
The index of the power of dispersion indicated above
is referred to as the “first category index of the power of
dispersion.” Table 4-1 indicates the calculation of the in-
dex of the power of dispersion by utilizing as the inverse
matrix in the 37 sector table of the 2015 Input-Output Ta-
bles. This indicates that the indices for iron and steel and
transportation machinery, etc. have relatively high indi-
ces of the power of dispersion, indicating that both sec-
tors exert great production repercussions on entire indus-
tries.
Conversely, sectors indicating small indices of the
power of dispersion are petroleum and coal products, real
estate, education and research, etc. Service-related sec-
tors generally have slight production repercussions on en-
tire industries.
However, the sum of column of inverse matrix coeffi-
cients tends to increase as the intermediate input ratios
increase. In addition, since intermediate input includes
the “Self-sector input,” representing inter-industrial
transactions, which may significantly affect intermediate
input ratios, the “Self-sector input” may sometimes be ex-
- 85 -
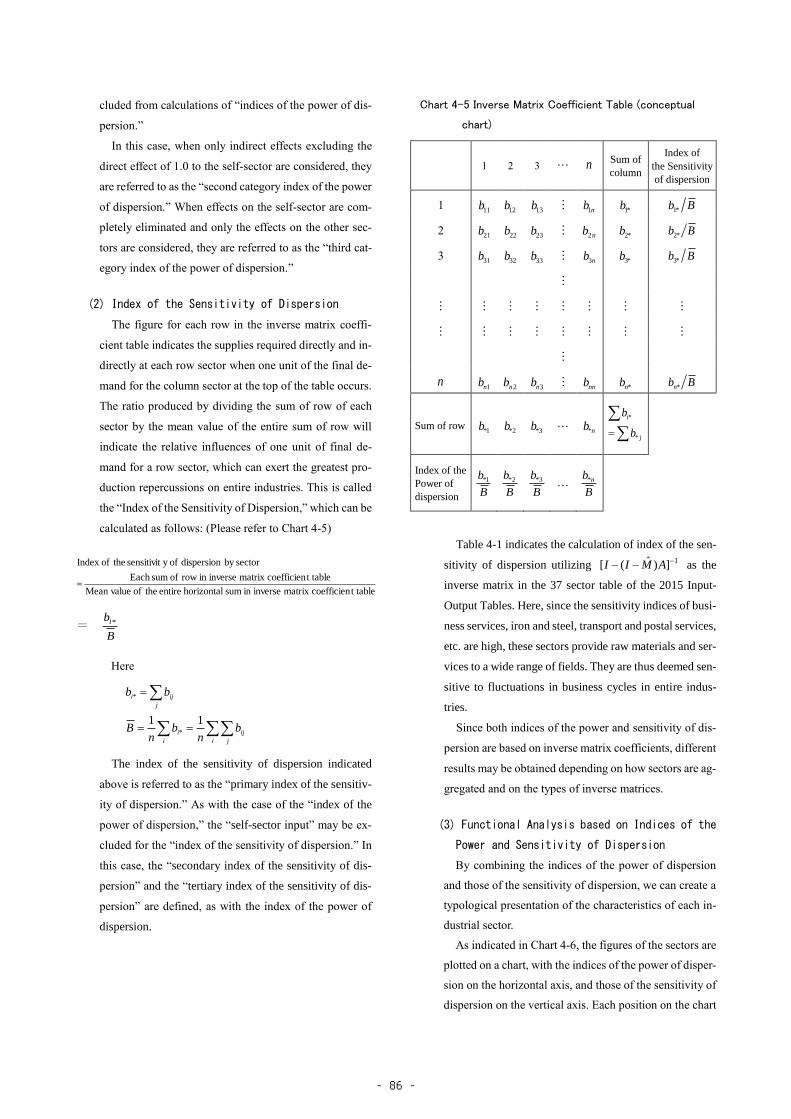
cluded from calculations of “indices of the power of dis-
persion.”
In this case, when only indirect effects excluding the
direct effect of 1.0 to the self-sector are considered, they
are referred to as the “second category index of the power
of dispersion.” When effects on the self-sector are com-
pletely eliminated and only the effects on the other sec-
tors are considered, they are referred to as the “third cat-
egory index of the power of dispersion.”
(2) Index of the Sensitivity of Dispersion
The figure for each row in the inverse matrix coeffi-
cient table indicates the supplies required directly and in-
directly at each row sector when one unit of the final de-
mand for the column sector at the top of the table occurs.
The ratio produced by dividing the sum of row of each
sector by the mean value of the entire sum of row will
indicate the relative influences of one unit of final de-
mand for a row sector, which can exert the greatest pro-
duction repercussions on entire industries. This is called
the “Index of the Sensitivity of Dispersion,” which can be
calculated as follows: (Please refer to Chart 4-5)
t tablecoefficienmatrix inversein sum horizontal entire theof Mean value
t tablecoefficienmatrix inversein row of sumEach
sectorby dispersion ofy sensitivit theofIndex
B
bi*=
Here
i j
ij
i
*i
j
ij*i
bn
bn
B
bb
11
The index of the sensitivity of dispersion indicated
above is referred to as the “primary index of the sensitiv-
ity of dispersion.” As with the case of the “index of the
power of dispersion,” the “self-sector input” may be ex-
cluded for the “index of the sensitivity of dispersion.” In
this case, the “secondary index of the sensitivity of dis-
persion” and the “tertiary index of the sensitivity of dis-
persion” are defined, as with the index of the power of
dispersion.
Chart 4-5 Inverse Matrix Coefficient Table (conceptual
chart)
1 2 3 n Sum of
column
Index of
the Sensitivity
of dispersion
1 11b
12b 13b
nb1
*b1 Bb*1
2 21b 22b 23b nb2 *b2 Bb *2
3 31b
32b 33b
nb3
*b3 Bb *3
n 1nb 2nb 3nb nnb *nb Bb *n
Sum of row 1*b 2*b 3*b n*b
j*
*i
b
b
Index of the
Power of
dispersion B
b*1 B
b*2 B
b*3 B
b n*
Table 4-1 indicates the calculation of index of the sen-
sitivity of dispersion utilizing 1])ˆ([ AMII as the
inverse matrix in the 37 sector table of the 2015 Input-
Output Tables. Here, since the sensitivity indices of busi-
ness services, iron and steel, transport and postal services,
etc. are high, these sectors provide raw materials and ser-
vices to a wide range of fields. They are thus deemed sen-
sitive to fluctuations in business cycles in entire indus-
tries.
Since both indices of the power and sensitivity of dis-
persion are based on inverse matrix coefficients, different
results may be obtained depending on how sectors are ag-
gregated and on the types of inverse matrices.
(3) Functional Analysis based on Indices of the
Power and Sensitivity of Dispersion
By combining the indices of the power of dispersion
and those of the sensitivity of dispersion, we can create a
typological presentation of the characteristics of each in-
dustrial sector.
As indicated in Chart 4-6, the figures of the sectors are
plotted on a chart, with the indices of the power of disper-
sion on the horizontal axis, and those of the sensitivity of
dispersion on the vertical axis. Each position on the chart
- 86 -

can reveal characteristics of the industrial sector.
Sectors plotted in Quadrant “I” can both exert strong
influence on entire industries and are most affected to ex-
ternal influences. Typically, these are the raw materials
manufacturing sectors, including basic materials such as
iron and steel, chemical products, pulp, paper and
wooden products, etc.
Quadrant “II” includes sectors whose influence on en-
tire industries is weak, but whose sensitivity is high. Typ-
ically, these sectors provide services to other sectors, such
as business services, transport and postal services and
commerce.
Quadrant “III” includes sectors whose influence on en-
tire industries is weak and whose sensitivity is low; typi-
cally, these are primary industrial sectors such as mining,
ceramic, stone and clay products, as well as independent-
type industrial sectors such as real estate and education
and research.
Quadrant “IV” includes sectors with strong influence
on entire industries but with relatively low sensitivity.
Typically, these sectors involve the manufacture of final
goods, including metal products, general-purpose ma-
chinery, electrical machinery, production machinery, and
electronics equipment for information and communica-
tions.
Table 4-1 Tables of Indices of Power of Dispersion and of the
Sensitivity of Dispersion for 2015
Index of
Power of
Dispersion
Index of the
Sensitivity of
Dispersion
01 Agriculture, forestry and fishery 1.010260 0.858539
06 Mining 0.974293 0.616348
11 Beverages and Foods 1.107423 0.866508
15 Textile products 0.943860 0.657103
16 Pulp, paper and wooden products 1.127075 1.340074
20 Chemical products 1.089006 1.425355
21 Petroleum and coal products 0.664006 1.073498
22 Plastic products and rubber products 1.095830 1.158925
25 Ceramic, stone and clay products 0.945928 0.768289
26 Iron and steel 1.392897 2.109189
27 Non-ferrous metals 0.999369 1.040784
28 Metal products 1.137873 0.903461
29 General-purpose machinery 1.095575 0.735453
30 Production machinery 1.071537 0.683843
31 Business oriented machinery 1.030321 0.631975
32 Electronic components 1.026357 1.019865
33 Electrical machinery 1.074946 0.712558
34 Information and communication
electronics equipment
1.035224 0.574928
35 Transportation equipment 1.398763 1.089517
39 Miscellaneous manufacturing products 1.020225 0.880569
41 Construction 1.034871 0.703655
46 Electricity, gas and heat supply 0.845210 1.408634
47 Water supply 1.013427 0.690441
48 Waste management service 0.855902 0.659584
51 Commerce 0.820816 1.922362
53 Finance and insurance 0.843133 1.041588
55 Real estate 0.693512 0.866016
57 Transport and postal services 0.956132 1.943733
59 Information and communications 0.987709 1.467155
61 Public administration 0.813507 0.741778
63 Education and research 0.796899 0.580674
64 Medical, health care and welfare 0.879110 0.578521
65 Membership-based associations, n.e.c. 0.893744 0.611857
66 Business services 0.893801 2.697929
67 Personal services 0.969546 0.609651
68 Office supplies 1.405265 0.606738
69 Activities not elsewhere classified 1.056648 0.722902
Sector
(Note) Derived from the 37-Sector Table
- 87 -

§3 Relationship Between Final De-mand and Domestic Production
1 Domestic Production Induced by Individual
Final Demand Items
Every sector in the endogenous sector supplies goods and
services to each industrial sector as well as final demand
sectors. On the whole, however, the industrial activities of
the endogenous sectors produce to just satisfy the final de-
mand, and their production levels depend on the size of the
respective final demands. Based on the competitive import
model and when imports fluctuate in proportion to domestic
demand, the following relationship holds in the Input-Out-
put Tables, as indicated by equation [10] of §2, through the
inverse matrix coefficients:
X = [𝐼 − (𝐼 − �̂�)𝐴]−1 [(𝐼 − �̂�)𝑌 + 𝐸]−1
Total domestic
products
Inverse matrix Value of final
demand
Here, final demand (F) can be classified into six catego-
ries: [1] consumption expenditure outside households; [2]
private consumption expenditures; [3] consumption ex-
penditure of general government; [4] gross domestic fixed
capital formation; [5] increase in stock; and [6] exports (E).
Domestic products induced by individual final demand
items refer to the production of every sector induced by in-
dividual final demand items.
Domestic products induced by individual final demand
items can be an indication for analyzing and analyzing the
items in the final demand that influence value fluctuations
in domestic production, and can be calculated as follows:
As mentioned above, the final demand vector F may be
divided into domestic final demand vector Y and export vec-
tor E. Domestic final demand vector Y can be dissolved into
various vectors of domestic final demand items (e.g., private
consumption expenditure and gross domestic fixed capital
formation, etc.), which may be represented as follows:
NYYYYY 321
Given that XK represents the induced production value de-
rived from the respective domestic final demands, domestic
final demand may be expressed as follows:
Chart 4-6 Indices of the Power of Dispersion and the Sensitivity of Dispersion
Agriculture, forestry and fishery
Mining
Beverages and Foods
Textile products
Pulp, paper and
wooden productsChemical products
Petroleum and
coal products
Plastic products and rubber products
Ceramic, stone and
clay products
Iron and steel
Non-ferrous metals
Metal products
General-purpose machinery
Production machinery
Business oriented machinery
Electronic components
Electrical machinery
Information and communication
electronics equipment
Transportation equipment
Miscellaneous
manufacturing products
Construction
Electricity, gas and heat
Water supply
Waste management service
Commerce
Finance and
insurance
Real estate
Transport and postal services
Information and
communications
Public administration
Education and research
Medical, health care
and welfare
Membership-based
associations, n.e.c.
Bissness services
Personal services
Office supplies
0.0
1.0
2.0
3.0
0.0 1.0 2.0
Ind
ex o
f th
e Se
nsi
tivi
tyo
f D
isp
ersi
on
ⅠⅡ
Ⅲ Ⅳ
ⅠⅡ
Ⅲ Ⅳ
ⅠⅡ
Ⅲ Ⅳ
ⅠⅡ
Ⅲ Ⅳ
ⅠⅡ
Ⅲ Ⅳ
ⅠⅡ
Ⅲ Ⅳ
ⅠⅡ
Ⅲ Ⅳ
Index of Power of Dispersion
ⅠⅡ
Ⅲ Ⅳ
● Goods sector △ Service sector
c
Activities not elsewhere classified
- 88 -

N,,,kYM̂IAM̂IIX kk 21)()( 1 〕〔
Production value induced by exports E can be expressed as
follows:
EAM̂IIX E
1)( 〕〔
Since the aggregate of induced production values by the re-
spective final demand items is equivalent to the value of do-
mestic production, we derive the following equation:
E
N
k
k XXX 1
It is also possible to use (I – Ad)-1 as the inverse matrix.
In that case, the final demand vector multiplying on the right
side represents the final demand for domestic items (Fd).
2 Domestic Production Inducement
Coefficients by Individual Final
Demand Items
“Production inducement coefficient by final demand item”
is defined as the domestic products induced by individual
final demand items divided by the total for corresponding
final demand.
Given that:
items) demand final (Domestic
2111
N,,,k
X
X
X,
Y
Y
Y
nk
k
k
nk
k
k
And
1
111
N,n
N,
E
n X
X
X,
E
E
E
Then, the domestic production of sector “i” induced by do-
mestic final demand item “K” and exports will be Xik and
Xi,N+1, respectively, and the production inducement coeffi-
cients can be expressed as follows:
n
jjk
ik
Y
X
1
n
jj
Ni
E
X
1
1,
Production inducement coefficients
by final demand items
(Domestic final demand)
(Exports)
=
This indicates the rate of increase of domestic production
in an sector, derived from the total increase of one unit of a
certain final demand item (within the same item).
The aggregated production inducement coefficients by fi-
nal demand items for the respective sectors—that is,
n
j
j
n
i
N,i
n
j
jk
n
i
ik
E
X
and
Y
X
1
1
1
1
1
may sometimes be called “Production inducement coef-
ficients.”
Chart 4-7 Domestic Production Inducement Coefficients by
Individual Final Demand Items (conceptual chart)
Final demand item
1 2 3 N 1N
Industrial
sector
1 Production inducement coefficient by
final demand item
2
n
j
j
N,i
n
j
jk
ik
E
X
Y
X
1
1
1
3
n
Total
(Note) 1N,iik X,X : Production inducements by fi-
nal demand item
n
j
j
n
j
jk E,Y11
: Total of Final demands
3 Domestic Production Inducement
Distribution Ratios by Individual
Final Demand Items
“Production inducement distribution ratios by final de-
mand items” are defined as the proportion ratios of induced
production value derived from the respective industrial sec-
tors. They indicate the degree of influence or weighting of
the respective final demand items on the domestic produc-
tions in industrial sectors.
- 89 -

),,2,1(
0
0
ˆ3
2
1
njX
Vv
v
v
v
v
vj
j
j
n
n
j
ijij
ii
YXa
Mm
1
nm
m
M
0
0
ˆ1
)(ˆ YAXMM
Chart 4-8 Domestic production Inducement Distribution Ra-
tios by Individual Final Demand Items (conceptual
chart)
Final demand item Total
1 2 3 N 1N
Indus-
trial
sector
1 Production inducement distribution
ratio by final demand item
1.0
2
i
N,i
i
ik
X
X
X
X 1
3
n
(Note) 1N,iik X,X : Production inducement by final de-mand item
iX : Total of production inducement (total domestic products)
§4 Relationship Between Final Demand and Gross Value Added
The domestic production of each sector is comprised of in-
termediate input and gross value added. Since domestic pro-
duction can be induced by final demand, we can assume that
gross value added, which is part of domestic production, can
be similarly induced by final demand.
It is thus possible to apply the relational expression between
domestic production and final demand, introduced in §3, to
gross value added and final demand in exactly the same man-
ner.
The ratio of gross value added is defined as the gross value
added of each sector divided by the domestic production of the
sector. This is the gross value added per unit of production, the
elements of which can be represented in a diagonal matrix “ .”
Therefore, when V is defined as a vector of gross value added,
XvV ・ˆ
Thus, the supply-demand balance equation mentioned in §3
can be indicated for the gross value added, as follows:
〕〔〕・〔 EYMIAMIIvV )ˆ()ˆ(ˆ 1
This equation can be used to define the following, as in the
case of production inducement:
[1] Gross value added inducement
[2] Gross value added inducement coefficient
[3] Gross value added inducement distribution ratio
When comparing the production inducement coefficient
with the gross value added inducement coefficient, it is obvi-
ous that “Exports” and “Gross domestic fixed capital for-
mation,” which indicate larger figures among the final demand
items for production inducement coefficients, give smaller fig-
ures than “Consumption” for gross value added inducement
coefficient. This implies that policies such as increasing public
sector investment and promoting exports would stimulate the
economy, but that stimulating consumption is more effective
for added value levels (GDP levels).
§5 Relationship Between Final De-mand and Imports
1 Imports Induced, Imports Inducement
Coefficients and Imports Inducement
Distribution Ratios by Individual Final
Demand Items
When certain final demands are generated, not all are usu-
ally satisfied by domestic production. Some are met by imports.
A fundamental field within input-output analyses is a meas-
urement of the scale of production induced at each sector by
generation of a certain final demand. It is also possible to de-
termine the scale of imports induced by the same cause. This
requires the import coefficient of each sector. The scale of im-
ports induced by one unit of final demand can be calculated
with the import coefficients.
In the inverse matrix coefficients based on the
1)ˆ( 〕〔 AMII type, commonly utilized in Japan, as ex-
plained in §2, the Input-Output Tables do not cover re-exports
of imported goods (that is, exports exclude all imports). Thus,
import coefficients are defined as ratios to domestic demand,
as follows:
・・・・・・・・・・・・・・・・・・ [12]
Total domestic products X can be expressed as follows:
〕〔〕〔 EYMIAMIIX )ˆ()ˆ( 1 ・・・・・・・・・ [13]
- 90 -

The inverse matrix coefficient 1)ˆ( 〕〔 AMII is expressed
as B and replaces [12] above and expanded as follows:
YMABEMYMIABMM ˆˆ)ˆ(ˆ
ABEMYMMIABMM ˆˆ)ˆ(ˆ 〕〔 ・・・・・・・・・ [14]
In other words, imports can be divided into those induced
by domestic final demand, excluding exports (the first term
of the right side of M in the equation [14]), and those
induced by exports E (the second term on the right side of
[14]).
ABM̂ can be regarded as the inverse matrix coefficient
B multiplied by the input coefficient AM̂ .
The breakdown of the import inducement by each of the
final demand items is presented as the “import inducement
coefficient by final demand item.” As indicated in equation
[14], imports M can be resolved as follows:
ABEMYMMIABMM ˆˆ)ˆ(ˆ 〕〔
As is apparent from this equation, these factors are given by
multiplying the final demands of the relevant items, re-
spectively. Namely, they are given by multiplying the
respective final demand item vectors from the “Con-
sumption expenditure outside households” to “Increase
in stocks,” which are domestic final demands by the matrix
〕〔 MMIABM ˆ)ˆ(ˆ , and for “Exports” by multiplying the
export vector by the matrix ABM̂ .
Import inducement coefficients by final demand items
and import inducement distribution ratios by final demand
items are not explained here, as they can be calculated
in the same as in the case of production inducement co-
efficients and production inducement distribution ratios in
§3.
2 Comprehensive Imports Coefficients
The sum of column of the matrix 〕〔 MMIABM ˆ)ˆ(ˆ ,
ABM̂ are coefficients that indicate the size of import in-
ducements due to generation of one unit of “final de-
mand excluding exports” and “Exports” (the same item-
ized structure), and are referred to as “comprehensive im-
port coefficients.”.
§ 6 Labor Input-Output Analysis Coefficients
1 Labor Inducement Coefficients
In the Input-Output Tables, as mentioned, the following
relationship holds between domestic production and final
demand through the inverse matrix coefficients, and pro-
duction inducement coefficients on final demand can be
calculated as:
〕〔〕〔 EYM̂IAM̂IIX )()( 1 ・・・・・・・・・[15]
X :Total domestic products
1)( 〕〔 AM̂II :Inverse matrix
〕〔 EYM̂I )( :Final demand
Labor input coefficients and labor inducement coeffi-
cients are obtained by applying labor input, which is one of
the supplementary tables for the Input-Output Tables, or the
labor matrix.
Here, each row of matrix L of the labor input (man-year)
for each sector is divided by domestic production to give the
labor input coefficient matrix L’.
The labor input coefficient represents the amount of labor
directly necessary for each unit of production and generally
corresponds to the inverse of labor productivity.
(Labor input L)
Sector
1
Sector
2
Sector
3 .....
Sector
n
Total employees 11l 12l 13l ・・・・・ nl1
Self-employed 21l 22l 23l ・・・・・ nl2
Family worker 31l 32l 33l ・・・・・ nl3
Total domestic products 1X 2X 3X ・・・・・ nX
(Labor input coefficient, L’)
Sector
1
Sector
2
Sector
3 .....
Sector
n
Total employees 11l 12l 13l ・・・・・ nl1
Self-employed 21l 22l 23l ・・・・・ nl2
Family worker 31l 32l 33l ・・・・・ nl3
- 91 -

(Note) j
ij
ijX
ll
Here, the total number of employees and the i-th em-
ployee position are analyzed. The i-th row of L is placed
vertically to produce vector Li, and the i-th element of L’ is
placed diagonally to produce matrix iL̂ , as follows:
in
i
i
i
in
i
i
i
l
l
l
L̂,
l
l
l
L
0
0
2
1
2
1
XL̂L ii
〕〔〕〔 EYM̂IAM̂IIL̂i )()( 1
〕〔 EYM̂IBL̂i )( ・・・・・・・・・・・・・・・・・・・[16]
Here, the following equation is defined.
1)( 〕〔 AM̂IIB
Each column of the matrix BLiˆ indicates the size of la-
bor demand required directly and indirectly at each sector
when one unit of final demand is generated for each sector.
The elements of this matrix BLiˆ are commonly referred to
as “labor inducement coefficients.”
At the same time, each column of matrix BL indicates
the scale of labor demand by occupational positions re-
quired directly and indirectly when one unit of final de-
mand is generated for each sector. This may also be referred
to as “labor inducement coefficients.” “Occupation induce-
ment coefficients” to be explained later are based on the lat-
ter concept.
Domestic final demand Y is comprised of consumption
expenditure of households, consumption expenditure of
general government, gross domestic fixed capital for-
mation and exports, etc., and can be expressed as follows:
NYYYY 21・・・・・・・・・・・・・・・・・・・・・・・[17]
From [16] and [17], the following equation can be ob-
tained:
〕〔 EYYYM̂IBL̂L Nii 21)(
BEL̂YM̂IBL̂YM̂IBL̂ iNii )()( 1 ・・[18]
Each term on the right-hand side indicates the comprising
item of the final demand of labor induced.
In input-output analyses, it is assumed that input coeffi-
cients are stable and that no significant differences exist
among them between the time at which the tables are com-
piled and the time at which analyses are made. A similar as-
sumption is applied to labor-related input-output analyses;
labor input coefficients are assumed to be stable.
However, unlike input coefficients, labor input coeffi-
cients cannot always be stable. For instance, even if produc-
tion in a certain sector has doubled, the labor input may not
necessarily double when measures such as installing indus-
trial robots and improving the operating ratios are instituted.
In conducting labor-related input-output analyses, therefore,
it is necessary to fully consider factors such as changes in
operating ratios and labor productivity.
2 Labor-Related Indices of Power and Sen-
sitivity of Dispersion
As the indices of the power of dispersion and those of the
sensitivity of dispersion can be obtained from the in-
verse matrix coefficients, the indices of the power of dis-
persion and those of the sensitivity of dispersion con-
cerning labor inducements can also be obtained from the la-
bor inducement coefficient matrix BLiˆ .
(1) Index of the Power of Dispersion for Labor
Inducement
This index is used to compare the sizes of effects at
different sectors of an increase of one unit of final de-
mand at a certain sector on labor demand at the re-
spective row sectors.
The “primary index of the power of dispersion for
labor inducement” can be calculated as follows:
C
C j
matrixt coefficien inducementlabor
of sum verticalentire theofMean
matrixt coefficien
inducementlabor of sum calEach verti
sectorby inducementlabor
for dispersion ofpower theofindex Primary
Here,
j
j
i
ijj
iji
Cn
C,CC
CBL̂C
1
〕〔
The bigger the index of the power of dispersion, the
greater the labor demand at each sector, induced by one
- 92 -

unit of final demand at the sector.
While the “primary index of the power of dispersion
for labor inducement” indicates the direct and indirect ef-
fects of labor inducement, including the self-sector, the
“tertiary index of the power of dispersion for labor in-
ducement” completely eliminates the effects on the self-
sector and concentrates on labor inducement effects on
the other sectors. It is calculated by replacing the diagonal
element on the labor inducement coefficient matrix with
zero, and using a similar method to that applied for the
primary index of the power of dispersion. The bigger the
index of the tertiary index of the power of dispersion, the
greater the labor inducement effects on the other sectors.
(2) Index of the Sensitivity of Dispersion for
Labor Inducement
The index of the power of dispersion is calculated from
each vertical sum (column) of the labor inducement coef-
ficients. Also from each horizontal sum (row) of the labor
inducement coefficients, the “index of the sensitivity of
dispersion” can be calculated. Used to compare labor in-
ducement effects received at different sectors from one
unit of final demand generated at each sector, the “pri-
mary index of the sensitivity of dispersion for labor in-
ducement” is calculated as follows:
C
Ci
matrixt coefficien inducementlabor
of sums horizontal entire theofMean
matrixt coefficien inducementlabor
of sum horizontalEach
sectorby inducementlabor
for dispersion ofy sensitivit theofindex Primary
Here,
i
i
j
iji Cn
C,CC1
Sectors indicating higher “primary indices of the sen-
sitivity of dispersion for labor inducement” are more sus-
ceptible to labor inducement effects.
As with the case of the “index of the power of disper-
sion for labor inducement,” the “secondary index of the
sensitivity of dispersion of labor inducement” and the
“tertiary index of the sensitivity of dispersion for labor
inducement” are also calculated for the index of sensitiv-
ity of dispersion for labor inducement.
3 Occupation Inducement Coefficients
The Employment matrix (table on employees engaged in
production activities [by occupation]) makes it possible to
calculate the employment inducement coefficient by occu-
pation.
The occupational input coefficient matrix can be derived
by dividing each element of the employment matrix S by
domestic production at each sector.
(Employment Matrix S)
Sector
1
Sector
2
Sector
3 .....
Sector
n
Occupation 1 11S
12S 13S ・・・・・
nS1
Occupation 2 21S
22S 23S ・・・・・
nS2
Occupation 3 31S
32S 33S ・・・・・
nS3
Domestic production 1X
2X 3X ・・・・・
nX
(Note) Employees include paid officers.
(Occupation Input Coefficient S’)
Sector
1
Sector
2
Sector
3 .....
Sector
n
Occupation 1 11S
12S 13S ・・・・・
nS1
Occupation 2 21S
22S 23S ・・・・・
nS2
Occupation 3 31S
32S 33S ・・・・・
nS3
(Note) j
ij
ijX
SS
The vector S* comprised of the sum of row of S may be
expressed as follows:
〕〔 EYM̂IBSS* )( ・・・・・・・・・・・・・・・・・・・[19]
Here, 1)( 〕〔 AM̂IIB
The matrix S’B is the “occupation inducement coeffi-
cients” matrix, representing the number of employees by oc-
cupation, to be required directly and indirectly by one unit
of final demand at each sector.
- 93 -

21
2
21
1
XX
X
XX
X
SddQ
raal
raal
RuuP
A
21
222212
112111
21
4 Labor and Occupation Inducement Coeffi-
cients by Individual Final Demand Items
As stated earlier, domestic final demand Y can be re-
solved for each item and represented as follows:
NYYYY 21・・・・・・・・・・・・・・・・・・・・・・[17]
BEL̂YM̂IBL̂YM̂IBL̂L iNiii )()( 1 ・[18]
The above equations can be used to obtain the labor in-
ducement coefficient by final demand items. They can also
indicate which final demand items and how many employ-
ees or workers in the respective sectors will be required, as
well as their respective occupational positions.
In the equation [19], final demands can be resolved for
the respective items, as follows:
BESYM̂IBSYM̂IBSS N
* )()( 1
This obtains the number of employees by occupations re-
quired for specific final demand items (occupation induce-
ment coefficients by final demand items).
§7 Problem of Sector Integration
1 Introduction
In the 2015 Input-Output Tables, the 187 sector tables, the
107 sector tables, 37 sector tables and 13 sector classifica-
tion tables were compiled based on a basic sector classifica-
tion comprised of 509 rows and 391 columns. In addition,
users can easily compile aggregated sector classification ta-
bles for their own purposes just by adding up the figures of
relevant sectors:
If the objective is to read the Input-Output Tables as they
are, sector integration is simply how accuracy the tabula-
tions should be. However, the most important things in us-
ing Input-Output Tables is conducting economic forecasts,
measuring the mode of specific economic policies, or ana-
lyzing prices using input coefficients, inverse matrix coeffi-
cients, production inducement coefficients by final demand
item, etc. If Input-Output Tables are to be useful for these
purposes, the manner in which the sectors for Input-Output
Tables are defined will be crucial.
Therefore, for compiling aggregated sector classification
tables on their own, it is important that the sectors subjected
to analysis be set as independent sectors while the other sec-
tors are integrated properly for ease of handling, etc. It must
be noted that, for calculations of production inducement and
other effects with Input-Output Tables (to calculate inverse
matrix coefficients), different results are generally obtained
from different sector establishments.
This was once pointed out by W. Leontief, founder of In-
put-Output Tables, as follows:
Industrial classifications for input-output analyses are led
by considerations of technical homogeneity. Integration
problems may arise from scaling down the matrix by inte-
grating the columns in input-output matrix and the related
several rows. The relationship between the nature of the in-
tegrated matrix and that of the non-integrated ones depends
on the positions at which the input columns of the integrated
sectors are placed within the non-integrated matrix. Under
certain ideal conditions, the integrated inverse matrix of the
original matrix corresponds to the inverse matrix of the in-
tegrated matrix. If these conditions are met not completely
but approximately, that correspondence has been realized
only approximately.
Which sector should be established to eliminate produc-
tion repercussions? What needs to be kept in mind when in-
tegrating sectors? These points will be addressed in the fol-
lowing sections.
2 Theoretical Aspects of Sector Integration
(1) Integration of Two Sectors
We will discuss a case of integrating Sector 1 and Sector
2 by defining an input coefficient matrix A as follows
Sector l Sector 1 Sector 2 Sector r
Sector l
Sector 1
Sector 2
Sector r
Here, X1 and X2 are defined as domestic productions
of Sector 1 and Sector 2, respectively, and the following
relationships are established.
In this case, the input coefficient matrix when Sector 1
and Sector 2 are integrated can be represented in the fol-
lowing matrix:
- 94 -

rl
rl
rl
rl
r
l
SFFdFdQF
FrFaFaFl
FrFaFaFl
RFFuFuPF
AFX
XXXX
2211
22221212
12121111
2211
1
1
2
1
1
1
1
r
l
F
FF
F
F 21
l
l
l
r
l
QF
Fll
PF
FA
X
X
X
X )( 21
1
121
1
1
r
r
r
SFFFdd
FrrFFaaaa
RFFFuu
))((
)()()()(
))((
2121
212122122111
2121
21
22122111
21
dd
aaaa
uu
11
ll XX
SddQ
rraa
aall
RuuP
A
21
21
2212
2111
21
21
)(
)(
r
l
r
l
F
F
F
F
F
F
F
F
F
2
1
2
1
11
1
21
1
2
1
1
11
rr
ll
XX
XXX
XX
Here, final demand can be expressed as follows:
Final demand for Sector l
Final demand for Sector 1
Final demand for Sector 2
Final demand for Sector r
In the above inverse matrix model considering, the
conditions required to make production inducements in
A and
A identical for a certain final demand F
First, the input coefficient matrix A prior to the sector
integration is used to calculate the primary repercussion
on final demand F. When X1 is defined as the vector of
domestic production induced by the primary repercus-
sion on the relevant sectors, the following can be de-
fined:
・・・・・・・・・・・・・・・・・ [20]
Next, the input coefficient matrix
A after the sec-
tor integration is used to calculate the primary repercus-
sion on final demand F:
Here,
When
1X is defined as the vector of domestic pro-
duction induced by the primary repercussion on the rel-
evant sectors, we can define the following:
・・・・・・・・・・・・・・・・・ [21]
Here, regardless of the status of integration, any F
should meet the following conditions to make production
inducements by the primary repercussion coincide:
・・・・・・・・・・・・・・・・・ [22]
If we substitute [20] and [21] into [22], we obtain the fol-
lowing from
・・・・・・・・・・・・・ [22]’
As mentioned above, the equations in [22]’ indicate
conditions under which sector integration does not af-
fect the magnitude of the primary repercussions. They
can also be the conditions for the coincidence of the do-
mestic production inducements. They can also be the
conditions for the coincidence of the domestic production
inducements, X2 and
2X , due to the secondary reper-
cussions obtained by replacing F of [20] and F
of [21]
into X1 and
1X , respectively, and furthermore the con-
ditions for the coincidence of the sizes of the ultimate re-
percussions (so-called “production inducements”). The
conditions under which integration will not change pro-
duction inducements at each sector specified in [22]’; that
is, input coefficients of the respective sectors to be inte-
grated should coincide with the input coefficients of the
relevant sectors after integration. In other words, there are
no changes in production inducements before and after
integration only when the input coefficients representing
the technological structures for production are identical.
Classifications of sectors in the Input-Output Tables
for Japan are based on activities relating the types of
goods and services. The above conditions indicate that
the activity-based homogeneity is required for defining
sectors. In this sense, they indicate the criteria and prin-
ciples of section definition.
(2) Effects of Production Inducements on Other
Sectors due to Sector Integration
Next, effects of sector integration on production induce-
ments of other sectors will be considered. Here, to simplify
the discussion, a certain sector (sector “ l ”) is represented
all sectors.
The conditions under which the sizes of primary reper-
cussions before and after sector integration are identical are
the ones give below from [22] above.
- 95 -
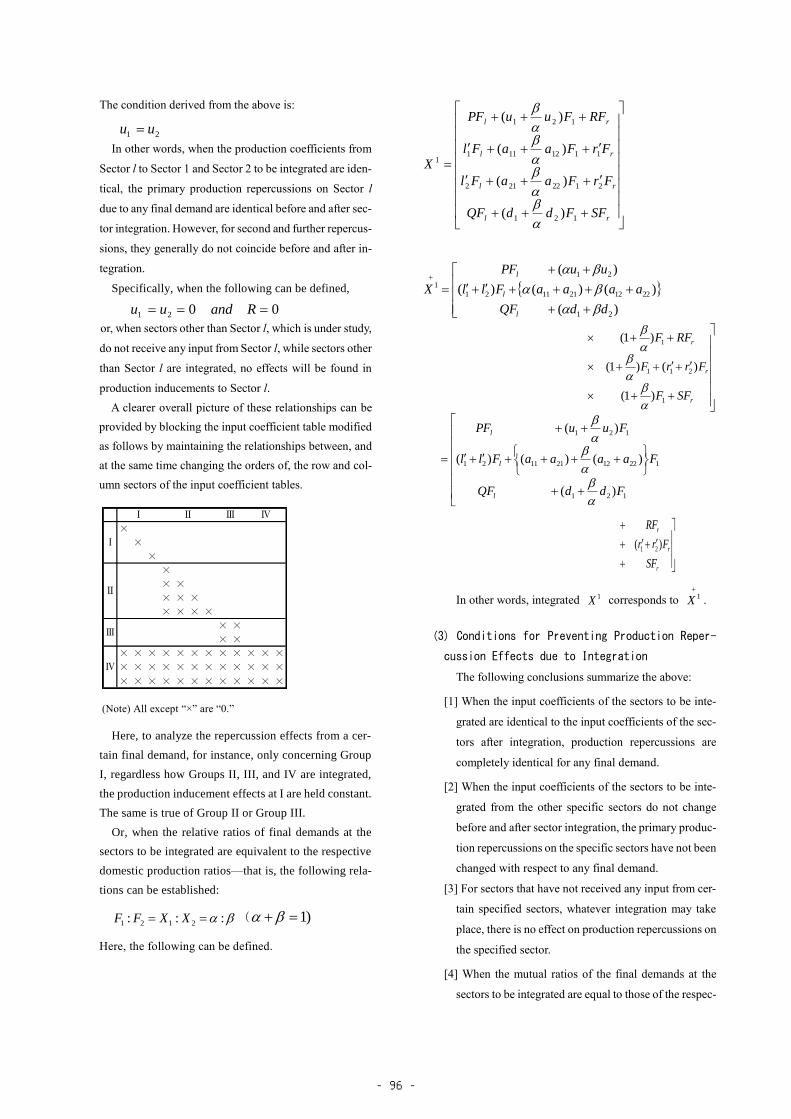
21 uu
0021 Randuu
)(
)()()(
)(
21
2212211121
21
1
ddQF
aaaaFll
uuPF
X
l
l
l
r
r
r
SFF
FrrF
RFF
1
211
1
)1(
)()1(
)1(
r
r
r
SF
Frr
RF
)( 21
rl
rl
rl
rl
SFFddQF
FrFaaFl
FrFaaFl
RFFuuPF
X
121
2122212
1112111
121
1
)(
)(
)(
)(
1
121
2212211121
121
)(
)()()(
)(
F
FddQF
aaaaFll
FuuPF
l
l
l
The condition derived from the above is:
In other words, when the production coefficients from
Sector l to Sector 1 and Sector 2 to be integrated are iden-
tical, the primary production repercussions on Sector l
due to any final demand are identical before and after sec-
tor integration. However, for second and further repercus-
sions, they generally do not coincide before and after in-
tegration.
Specifically, when the following can be defined,
or, when sectors other than Sector l, which is under study,
do not receive any input from Sector l, while sectors other
than Sector l are integrated, no effects will be found in
production inducements to Sector l.
A clearer overall picture of these relationships can be
provided by blocking the input coefficient table modified
as follows by maintaining the relationships between, and
at the same time changing the orders of, the row and col-
umn sectors of the input coefficient tables.
(Note) All except “×” are “0.”
Here, to analyze the repercussion effects from a cer-
tain final demand, for instance, only concerning Group
I, regardless how Groups II, III, and IV are integrated,
the production inducement effects at I are held constant.
The same is true of Group II or Group III.
Or, when the relative ratios of final demands at the
sectors to be integrated are equivalent to the respective
domestic production ratios—that is, the following rela-
tions can be established:
::: 2121 XXFF ( )1
Here, the following can be defined.
In other words, integrated 1X corresponds to
1X .
(3) Conditions for Preventing Production Reper-
cussion Effects due to Integration
The following conclusions summarize the above:
[1] When the input coefficients of the sectors to be inte-
grated are identical to the input coefficients of the sec-
tors after integration, production repercussions are
completely identical for any final demand.
[2] When the input coefficients of the sectors to be inte-
grated from the other specific sectors do not change
before and after sector integration, the primary produc-
tion repercussions on the specific sectors have not been
changed with respect to any final demand.
[3] For sectors that have not received any input from cer-
tain specified sectors, whatever integration may take
place, there is no effect on production repercussions on
the specified sector.
[4] When the mutual ratios of the final demands at the
sectors to be integrated are equal to those of the respec-
×
×
×
×
× ×
× × ×
× × × ×
× ×
× ×
× × × × × × × × × × × ×
× × × × × × × × × × × ×
× × × × × × × × × × × ×
Ⅰ
Ⅱ
Ⅲ
Ⅳ
Ⅰ Ⅱ Ⅲ Ⅳ
- 96 -

tive domestic productions, the primary production re-
percussions due to the final demands are identical in all
relevant sectors.
Furthermore, when considering the inverse matrix
model that accounts for imports, except for [3] above,
another condition is added: that import ratios of the
sectors to be affected by 1)ˆ( 〕--〔 AMII of the in-
tegration are equal. In this manner, except for such
highly unusual cases in which input structures do not
change before and after integration, it should always
be kept in mind that the integration (or establishment)
of sectors may cause different results to production re-
percussions and inducements.
3 Example of Sector Integration
Effects of example sector integration will be investigated
using the 2015 Input-Output Table. The following two
methods are used to calculate production inducements (by
final demand item) of the 13 sectors classification and com-
pare the results.
The 1)ˆ( 〕--〔 AMII type inverse matrix coefficient is
used.
[1] Calculations are conducted with 187 sectors classifica-
tion, then the results are integrated into 13 sectors classi-
fication.
[2] Calculations are conducted with 13 sectors classifica-
tion from the beginning.
The comparison results are as indicated in Table 4-2, the
figures represent the difference ratios of [2] against [1].
These figures make it quite clear that significant differences
exist, particularly in the mining and the agriculture, forestry,
and fishery sectors, suggesting notable effects from sector
integration. In addition, looking at the weighted average fig-
ures of the absolute values of the above ratios by the weights
of production inducements derived from [1] for each row
and column (referred to as “deviation rates”), for which “In-
crease in stocks” in particular indicates greater figures for
the respective final demand items.
In addition, instead of [2] above, the following were com-
pared against [1]:
[2]′ After calculations are conducted with the major aggre-
gated sector classification (37 sectors), the results are in-
tegrated into 13 sectors classification;
[2]″After calculations are conducted with the medium ag-
gregated sector classification (107 sectors), the results are
integrated into 13 sectors classification.
The results presented only in the form of deviation rates by
the final demand items are shown in Table 4-3.
4 Summary
In Section 3 above, the integration to 13 sectors classifi-
cation was reviewed for the sake of convenience. In actual
analyses, however, integration is commonly conducted to 37
or more sectors classification. Still, the basic premise re-
mains the same.
Given the recent remarkable progress in computing
power, it is now recommended that integration be conducted
after calculating as many sectors as possible. Computations
should at least be performed for sector tables one stage
higher than the one required for analysis at hand, specifi-
cally, when the results need to be compared for final demand
items and respective sectors. However, in sector integration
within the scope in which conditions specified in “2” may
be satisfied even approximately, the production repercus-
sion effects are not exceptional. Specifically, when only cer-
tain sectors are analyzed, “blocking” may realize effective
sector integration.
- 97 -

i* =j
|ij|×
j
Zij
Z ij
*j =i
|ij|×
i
Zij
Z ij
Difference ratio: 1001 ZZ ijijij
Deviation rate:
Table 4-2 Difference in Production Inducement due to Sector Integration (Difference Ratio)
Note: i:Industrial sectors,j:Final demand sectors
Z ij is calculated by 187 sectors and is integrated by 13 sectors.
Z’ij is calculated by 13 sectors.
Table 4-3 Deviation Rates by Final Demand Item at Each Aggregated Sector
ij =ij
|ij|×
ij
Zij
Z ij
(%)
(%)
Consumption
expenditure
outside
households
Consumption
expenditure
(private)
Consumption
expenditure
of general
government
Gross
domestic
fixed capital
formation
Increase in
stocksExports total
Devitation
rate
(λi*)
01 Agriculture, forestry and fishery -71.45 -37.77 119.87 294.03 -5.62 503.42 70.52
02 Mining 157.13 171.92 179.89 -67.39 -105.54 63.15 84.95
03 Manufacturing -14.11 9.68 16.92 0.19 -232.46 -9.25 7.41
04 Construction 1.74 -3.32 -1.40 0.07 -273.11 6.88 0.24
05 Electricity, gas and water supply -36.17 -3.28 9.30 17.55 -167.10 0.65 5.99
06 Commerce -23.31 -2.03 5.86 5.92 8.53 7.05 4.16
07 Finance and insurance -17.84 0.87 -1.16 -4.53 -4.85 -1.02 1.33
08 Real estate -4.21 0.63 -4.39 -5.28 1.43 -7.98 1.13
09 Transport and postal services -21.61 -0.38 11.30 -2.81 44.87 1.22 2.38
10 Information and communications 1.17 -7.85 50.05 6.29 9.08 -12.71 10.71
11 Public administration 2.94 0.22 -0.01 -3.00 138.50 5.94 0.07
12 Services 0.54 0.43 -0.38 -1.29 24.66 1.83 0.63
13 Activities not elsewhere classified 2.94 0.78 -1.77 -3.00 138.62 5.94 2.38
Devitation rate(λ*j) 11.00 4.09 3.99 2.60 -125.63 9.00 4.70
Consumption
expenditure
outside
households
Consumption
expenditure
(private)
Consumption
expenditure
of general
government
Gross
domestic
fixed capital
formation
Increase in
stocksExports total
Devitation
rate
(λi*)
11.00 4.09 3.99 2.60 -125.63 9.00 4.70
5.49 1.22 2.09 2.34 -44.61 1.64 1.76
0.48 0.47 0.45 1.26 -7.99 1.74 0.85
CASE [2] ( 13/190)
CASE [2]′ ( 37/190)
CASE [2]″(108/190)
- 98 -

§8 Precautions for Input-Output
Analysis
Input-output analysis conducted by using input coeffi-
cients and inverse matrix coefficients plays an essential role
in utilizing the Input-Output Tables. However, it must be
noted that the following preconditions have to be considered
in using the Tables.
1 Stability of Input Coefficients
As described in §1-3 in this Chapter, the input-output
analysis is conducted on the premise of the stability of the
input coefficients. In fact, however, it should be noted that
the input coefficients may change as the year subjected to
the analysis deviates from the year referred to for compil-
ing the Table.
In addition, if the scale of production, demands, etc. is
extremely different from that of the year referred to for
table compilation, there is the possibility that the input
structure has changed due to the effect of economies of
scale. Accordingly, the analysis results should be inter-
preted and used with care.
Note that the “stability of input coefficients” is not dis-
cussed in terms of comparison with past tables; but, that
does not mean that “the input structure is the same as that
in the Input-Output Tables of the past year.” The Input-
Output Tables should be compiled based on the data of
the year of compilation and even if the calculation result
shows a change from the past tables in the input structure,
that is not a problem in and of itself.
2 Other Points to Note
In addition to the notes about the stability of input coef-
ficients stated in 1 above, note the following considera-
tions:
(1) The Source of Generated Final Demand should
not be Searched.
Multiplier effect analysis begins with providing the
amount of demand as given data, but what gave rise to
that demand is not considered.
For instance, in a household economy, an increase in
some expenditures results in a decrease in other expend-
itures if there is no change in the income. The decrease
in expenditure can be considered to cause a minus eco-
nomic multiplier effect. Even if the consumption is con-
tinued by spending down the savings, the decrease in the
savings may generate a minus economic multiplier effect
via reduced investment.
Input-output analysis is assumed to be just an analysis
in which just a part of a cycle of production, distribution
and expenditure is highlighted with other parts being un-
changed.
(2) Interruptions, etc. to the Multiplier Effect
In the following cases, there may be less multiplier ef-
fect than the analysis results in the short term due to in-
terruptions, etc. to the multiplier effect:
[1] Even if demand rises, there is not always sufficient
production capacity to respond to the relevant demand
in each sector. When the risen demand exceeds the pro-
duction capacity, interruption of the multiplier effect
may actually occur.
[2] Even if demand rises, some sectors with surplus
stocks might respond by releasing stocks. In that case,
a strong multiplier effect should not be expected.
[3] As for the increase in employees that would be antic-
ipated due to the increased demand, if the current em-
ployees are assigned to work overtime, the number of
employees may not increase.
(3) Effect by Dummy Sectors, etc.
As for the endogenous sectors in the Basic Transac-
tion Table, the sectors are classified based on activities.
Among these, for the convenience of compilation of
the Table, a “Dummy sector” is established, which
cannot be considered an independent industrial sector.
This increases the intermediate input ratios, thus ex-
panding the multiplier effect.
(4) Period When Multiplier Effect is Seen
In input-output analysis, when the multiplier effect
will be seen is not clear.
- 99 -

- 100 -

CHAPTER Ⅴ
SUPPLEMENTARY TABLES
The Basic Transaction Tables summarize transactions
involving all goods and services produced for a period of one
year, based on all available data. The 2015 Input-Output Tables
are comprised of 509 row sectors and 391column sectors.
The core of the Input-Output Tables, the Basic Transaction
Tables are compiled in accordance with certain rules, based on
68 SNA, 93 SNA and 2008 SNA advocated by the United
Nations, as well as Input-Output Table compilation theories
accumulated so far. However, it is difficult to incorporate all
information into Basic Transaction Tables. To meet the
purposes of various input-output analyses, supplementary
information is required to compensate for the limitations of the
Basic Transaction Tables.
Thus, in the 2015 Tables, the various supplementary tables
below are compiled in accordance with their respective
intended usage.
The “Table on Trade Margins,” “Table on Domestic Freights,”
and “Table on Imports” represent a consolidation of
information related to trade margins, domestic freights, and
imports included in the Basic Transaction Table for the basic
sector classification by each of the medium aggregated
classifications (107 sectors), thus, following the 2011 Tables,
they were categorized as part of the statistical tables for the
medium aggregated classifications (provided only on the
Internet). As a result, separate explanations of these tables are
provided at the end of this chapter in [Reference 2] and
[Reference 3].
1 Table on Value and Quantity
(1) Concepts
This table indicates the transacted quantities of major
goods listed in the Basic Transaction Tables (Chart 5-1 [1]).
Ideally, in input-output analyses, Basic Transaction Ta-
bles would be based on the quantity of transactions be-
tween sectors to ensure the stability of input coefficients.
Actually, given the various input materials in the column
sectors, it is impossible to measure their size in a single
numerical unit. The Basic Transaction Tables are thus
based on monetary amounts. The tables on values and
quantities are compiled to present quantitative data con-
cerning the Basic Transaction Tables, although to limited
extent.
Compiling tables on values and quantities of selected
goods are compiled to provide physical data related to the
Basic Transaction Tables, and make it possible to conduct
Chart 5-1 Relationship Between Transaction Table and Table on Value and Quantity
A … … … … … … … …
B 600 150 500 250 120 180 100 1900
(40×15) (10×15) (25×20) (10×25) (4×30) (9×20) (5×20)
C … … … … … … … …
D … … … … … … … …
… … … …
… … … …
… … … …
Domestic
production… 1900 … …
Domestic
production
Gross
value
added
ConsumptionFixed capital
formation, etc.ExportsA B C D
Quantity (unit price) … … … … … … … …
A
Monetary value (million yen) … … … … … … … …
Quantity (unit price) 40 10 25 10 4 9 5 103
B
Monetary value (million yen) 600 150 500 250 120 180 100 1900
Quantity (unit price) … … … … … … … …
C
Monetary value (million yen) … … … … … … … …
ExportsDomestic
productionA B C D
Sec
tors
for
maj
or g
oods
…
ConsumptionFixed capital
formation, etc.
[1] Input-Output Tables at Producers’ Prices
[2] Table on Value and Quantity
(Note) Figures in parentheses are quantity multiplied by unit price. The table on value and
quantity of selected goods extracts and lists these parts.
- 101 -

physical analyses of the prospects of supply and demand
in energy and other subjects.
(2) Compilation Method
[1] The sectors for which the table on value and quantity
of selected goods is compiled are producers of major
materials, primarily basic materials, among the row sectors
in the Basic Transaction Tables. Those with significant
differences in price levels of detailed items comprising
the row sectors and those for which multiple quantitative
units are used to estimate detailed items are generally
excluded.
[2] The table on value and quantity of selected goods is
basically compiled by estimating transaction units for
individual output destinations and using these units to
calculate transaction quantities by output destination
(monetary transaction amounts/transaction unit prices).
The following was done for the 2015 Input-Output
Tables.
i) Imported productions and domestic productions
are separated and the transaction quantities by
output destinations estimated.
ii) For imported productions, the quantities of ordi-
nary trade are, in principle, taken from the Foreign
Trade Statistics. The amounts of special trade and di-
rect purchases are divided by the average unit prices
of the ordinary trade to estimate the quantities. The
total import quantities (ordinary trade, special trade
and direct purchases) were estimated as import quan-
tities by row. Then the import quantities are allocated
to each column sector based on the proportion of im-
port transactions in the output tables.
iii) For domestic production, the quantities of ordinary
trades among exported productions are taken from
the Foreign Trade Statistics. The amounts of special
trades and direct purchases are derived from the
average unit prices of the ordinary trades to estimate
quantities, as in the case of estimates of import quan-
tities. The domestic supply quantities for row section
of the domestic production are estimated by deducting
export quantities from the domestic production quan-
tities by row acquired from Domestic Production
Table by Sector and Commodity. Finally, the domestic
supply quantities are allocated to each column sector
based on the proportion of domestic transactions
(transaction amounts at producers’ prices – transac-
tion amounts of imports) in output tables.
iv) For the transactions in which the amount, etc., of
raw material input could be identified by various sta-
tistics, etc., [ii] and [iii] were compensated to the ex-
tent possible.
v) The quantities of domestic productions and import-
ed productions compensated in iv) above are added to
compile the tables on value and quantity.
(3) Precautions When Using
Tables on value and quantity are tables that express the
transactions that are possible from among the individual
transactions listed in the Basic Transaction Tables.
At this time, it is impossible to compile tables on values
and quantities for all sectors for the following reasons:
[1] When compiling tables on value and quantity, it is
presumed that transaction amounts for each commodity
can be comprehended by “Quantity × Unit price.” For
services among the row sectors, however, it is extremely
difficult to measure quantity units.
[2] In the goods sectors, there are cases in which multiple
commodities are included in the same sector, making it
impossible to calculate the amounts by row sector units.
[3] In sectors represented as “Miscellaneous …” and those
related to processing and assembling, various commodities
with different unit prices and units may be combined. In
these sectors, quantity-based indication by row sector is
almost meaningless.
[4] The availability of quantity-related information by
output destination is significantly reduced.
Also, the limitations of the table on value and quantity
must be kept in mind, since quantitative estimates are
limited to specified sectors and estimation methods tend to
be mechanical.
2 Table on Scrap and By-Products
(1) Concepts of Table on Scraps and By-products
“Scraps” and “By-products” may be treated in compiling
the basic transaction tables by several different methods.
The method applied in Japan is the “negative input method”
(Stone method; refer to CHAPTER III). In the table of
conventional basic transaction tables based on the negative
- 102 -

Chart 5-2 Relationship Between Transaction Table and Table on Scrap and By-Products
[1] Input-Output Tables at Producers’ Price (Image of the 2000 Tables)
[2] Input-Output Tables at Producers’ Price (Image of the 2005 and Later Tables)
(Notes) 1 “Reuse and recycling” represents the “Reuse and recycling” sector. (same in table [2])
2 As for the figures in parentheses, the negative values (shown as △) are generated values of scrap and by-products while
the positive values are input values before adding the processing costs (includes numbers).
3 Scrap and by-products generated are input into each sector via “Reuse and recycling.”
A B C D
Reuse andRecycling
Finaldemands
ImportsDomestic
production
A 65 5 ・・・ 5 25 100
(5) (△5) (0)
B 45 20 △10 50 35 60 200
(△30) (35) (△5) (0)
C ・・・ 40 ・・・ ・・・ 10 ・・・ ・・・
(0) (0)
D 18 30 ・・・ ・・・ 5 ・・・ ・・・
(△5) (5) (0)
Reuse and Recycling 18 18 ・・・ 34 ・・・ ・・・ △5 65
(15) (15) (20) (△5) (45)
Totalvalue added
19 27 ・・・ ・・・ 10
Domesticproduction
100 200 ・・・ ・・・ 65
A B C DReuse andRecycling
Finaldemands
ImportsDomestic
production
A 70 5 0 25 100
(5) (△5) (0)
B 60 20 △10 70 0 60 200
(15) (△30) (20) (△5) (0)
C ・・・ 40 ・・・ ・・・ 10 ・・・ ・・・
(0)
D 18 40 ・・・ ・・・ 0 ・・・ △5 ・・・
(△5) (10) (△5) (0)
Reuse and Recycling 3 3 ・・・ 14 ・・・ ・・・ 20
Totalvalue added
19 27 ・・・ ・・・ 10
Domesticproduction
100 200 ・・・ ・・・ 20
(Note) 1 Output scraps and by-products are directly input into sectors without going through “Reuse and recycling”
2 Only collection and processing are recorded in “Reuse and recycling.”
[3] Table on scraps and by-products (Image of the 2005 and Later Tables)
Competing sector Output Input
A △ 5 5
B △ 30 15
△ 5 20
△ 35 35
C ・・・ ・・・
D △ 5 10
△ 5
△ 10 10
Output Sector
Final demands
C
Final demands
Total
Input Sector
B
A
D
Total
・・・
B
Total
・・・
A
Import
Total
(Note 1) 1 “Competing sector” represents row sectors, and “Output Sector” represents column sectors.
2 “Competing sector” refers to sectors with a special number (“2” to “5”) attached to the row sector classification code (7 digits),
as outputs and inputs of scraps and by-products are recorded in such sectors.
For “By-products,” although there are row sectors where such by-products are considered as being the main product, in
terms of representation in the Basic Transaction Table based on basic sector classification, in order to distinctively record
numbers related to output of main products and numbers related to output and input of by-products, sectors (competing sec-
tors) with a special symbol (“4” or “5”) attached to the classification code for row sectors related to main products are estab-
lished separately, and figures are recorded in these sectors. The reason why they are referred to as “competing sectors” derives
from the fact that although there is a difference depending on whether there is a special symbol attached, these sectors are es-
tablished (competing) as row sectors of the same name as those for main products. “2111-018-4 LPG (liquefied petroleum
gas)” and “2111-018-5 LPG (liquefied petroleum gas)” in Table 5-1 correspond to “Competing sectors.”
For “Scraps,” on the other hand, there are no sectors where scraps are treated as main products, and thus, only row sectors
of “Used paper,” “Scrap iron,” and “Non-ferrous metal scrap” were established as dummy sectors. For other scraps, sectors for
raw materials with which they are closely associated were established as competing sectors, and outputs and inputs are record-
ed in the corresponding sectors. To ensure uniformity with the terms that are used for by-products, row sectors related to
scraps are also referred to as “competing sectors,” and special symbols (“2” or “3”) are also attached to the classification codes
of the said sectors.
- 103 -

input method, the output of scraps and by-products is
recorded as a negative value at the intersection of the
competing sector (row) and the output sector (column),
while the input is recorded as a positive value at the inter-
section of the competing sector (row) and demand sector
(column), and production is offset to be zero.
Table 5-1 Example of Normal Sector and Competing Sectors
in an Input Table
In light of the increasing interest in the environment in
recent years, the “Reuse and recycling” sector was estab-
lished in the 2000 Input-Output Tables. All scrap and by-
products generated (negative) were output (positive) in the
basic transaction tables to the said sector, and through that
sector, output to each input sector, while generally maintain-
ing the negative -input method. Imports/exports of scrap and
by-products were recorded as a lump sum in the “Reuse and
recycling” sector to stabilize the import coefficient and
ensure analytical consistency. (Chart 5-2 [1]). However, in
this table, all scraps and by-products were output from the
single sector of “Reuse and recycling,” making it impossible
to determine specific goods and input values.
Accordingly, in the 2005 and Later Input-Output Tables,
it was decided not to input the value of scrap and by-
products to the “Reuse and recycling” sector, and only
related expenses were counted. As with the 1995 Input-
Output Tables and prior tables, the negative input method
has been used for output and input of scraps and by-
products. As a result, the output sector, output amount, input
sector and input amount of “Scraps and by-products” by
type of scrap or by-product, and the expenditures related to
each were recorded respectively in the Basic Transaction
Tables (Chart 5-2 [2]).
The “Table on scraps and by-products” thus clarifies the
generation and input status of scraps and by-products by
compiling the generated and input values of scraps and by-
products, as compiled in Chart 5-2 [3].
(2) How to Compile the Table on Scraps and By-
Products
Scraps and by-products can be distinguished from other
transactions by appending the following special codes to
sector codes when compiling the basic transaction tables.
Special code Special classification
2
3
4
5
Scrap input
Scrap output
By-product input
By-product output
Actually, estimates involving to which column sectors
output or input what types of scraps and by-products are
generated as follows.
[1] Consumption of scraps and by-products is converted to
a monetary value from various current surveys of
industrial production. The generated monetary values
were estimated through correspondence to the specific
column sectors from the production technology structure.
[2] Of all the scrap, for scrap iron and non-ferrous metal
scrap, consumption by each column sector was esti-
mated from the Statistical Yearbook of Iron and Steel,
Non-ferrous Metals, and Metal Products. Generated
monetary values were estimated for each sector from
the shipment amount of scrap in the Economic Census
for Business Activity and input value of iron, etc., at
each industrial sector.
[3] For used paper, the consumption values are estimated
from consumption derived from the annual statistics, etc.
on paper, printing, plastic products and rubber products.
3 Table on Employees Engaged in Production
Activities (by Occupation)
(1) Concepts
The “Table on employees engaged in production activi-
ties” shows the amount of labor input in terms of the
average number of people by each sector for production
activities during one year by employment status, such as
the number of employees (full-time, part-time, and day
workers), number of paid directors, number of self-
employed workers, and number of family workers. As in
the Basic Transaction Table, the sector classifications of
this table are based on activities.
The incomes of employees and paid directors corre-
spond to the “compensation of employees” in the Basic
Transaction Table, while those of self-employed workers
and family workers are included in the “operating surplus.”
From the table on persons engaged in production activi-
Column code and name Transaction value
Row code and name (Producers’Prices)
2031-01 Petrochemical basic products
…
2111-018 LPG
(liquefied petroleum gas)49
Purchasing LPG from the sector that core
business is producting LPG
2111-018-4 LPG
(liquefied petroleum gas)12714
Purchasing LPG that is generated as a by-
product from the sector except LPG sector,
2111-018-5 LPG
(liquefied petroleum gas)-231734
LPG that is generated as a by-product in the
process of the production activities of the
petrochemical basic products
(Reference) How to read this table
Competingsector
- 104 -

ties, the labor input coefficients and labor inducement
coefficients corresponding to the input coefficients and
production inducement coefficients, among others, are
calculated. Labor input coefficients indicate the labor
directly required for unit production, generally corre-
sponding to the inverse of labor productivity. Labor
inducement coefficients indicate how much labor is
required for each sector to produce goods and services
directly and indirectly induced by the increase of one unit
of final demand.
These coefficients are used to identify the repercussion
processes of changes in final demand on employment
demand and entire employment demand figures, which
enable analyses of labor force flow and employment
structures, analyses of the effects of economic fluctuations
on employment and employment demand prospects
outlook, etc.
(2) Compilation Method
In compiling the table on persons engaged in production
activities, firstly, the number of employees is estimated
based on industrial classifications (does not necessary
match the activity) using the Population Census, Employ-
ment Status Survey, Economic Census for Business Frame,
and Labour Force Survey.
Then, a correspondence table consisting of industrial
classifications and sector classifications is compiled, and
the number of employees by industry is converted to the
number of industries by column sector of the Basic Trans-
action Table. When doing so, the attempts are made to
bring the industrial classifications as close as possible to
activity concepts, by taking occupational structure and
management structure into consideration.
In the end, if there is data from which activities can be
further accurately comprehended, figures are replaced by
values that are estimated based on such other data where
necessary. In addition, consistency with employer income
and wage per capita is also verified and revised.
4 Employment Matrix (Table on Employees
Engaged in Production Activities [by
Occupation])
(1) Concepts
The employment matrix gives a breakdown into occu-
pational categories of paid directors and employees by
production activity sectors, obtained from the above table
on persons engaged in production activities. The employ-
ment matrix can indicate the number of employees by
occupation and in terms of production activities. In addi-
tion, calculating occupational inducement coefficients
makes it possible to analyze how many of what types of
employees is required due to changing economic struc-
tures or other factors.
(2) Compilation Method
To compile the employment matrix, the occupational
component ratios by industries are compiled for paid
directors and employees from the Population Census data.
Next, by using the correspondence between “Sectors”
of the Input-Output Tables and “Industries” of the Popula-
tion Census, obtained during the employment table compi-
lation process, the occupational component ratios by
industries are transformed in accordance with the sector
concepts of the medium aggregated sectors (107 sectors)
of the Input-Output Tables (104 sectors in actuality, as
“House rent (imputed rent),” “Self-transport,” and “Office
supplies” are excluded).
- 105 -

Chart 5-3 Relationship Between Basic Transaction Table,
Table on Persons Engaged in Production Activities
and Employment Matrix
[1] Basic Transaction Table
A B C… Final
demand
Domestic
production
A
B
C
…
Gross
Value
Added
Compensation of employees
Operating surplus
Domestic
production
[2] Table on Employees Engaged
in Production Activities
T0
tal
Per
cap
ita
com
pen
sati
on o
f
pai
d d
irec
tors
an
d e
mp
loy
ees
Per
cap
ita
wag
es o
f re
gu
lar
emplo
yee
s
Sel
f-em
plo
yed
wo
rker
s
Fam
ily
wo
rker
s
Pai
d d
irec
tors・
emplo
yee
s
Pai
d d
irec
tors
Em
plo
yee
s
Reg
ula
r em
plo
yee
s
Tem
po
rary
em
plo
yee
s
Fu
ll-t
ime
emplo
yee
s
Par
t-ti
me
emplo
yee
s
A
… … … … … … … … … …
B
75 10 5 60 10 50 35 23 12 15
C
… … … … … … … … … …
…
… … … … … … … … … …
Total … … … … … … … … … …
(Note) Since the incomes of self-employed workers occupy only
part of the operating surpluses, and since family workers
are in principle unpaid, these numbers are estimated,
regardless of the gross value added.
[3] Table on Employees Engaged in Production Activities Occupation
Res
earc
her
s
Eng
inee
rs
Hea
lth c
are
wo
rker
s
・・・・・・・・・・・
To
tal
A … … … …
B 5 12 8 ・・・・・・・・・・・ 60
C … … … ・・・・・・・・・・・ …
…
… … … ・・・・・・・・・・・ …
計 … … … ・・・・・・・・・・・ …
(Note) The “Occupation” is classified into 227 types, including
“Unable to classify.”
Production activity sectors are comprised of 107 sectors
of medium aggregated sector classifications (since “House
rent (imputed rent),” “Self-transport” and “Office supplies”
are excluded, the actual number is 104).
When making converting these ratios mechanically,
there are instances where there is no consistency between
the activity and occupation. Thus, by taking the definition
of sectors into consideration, a process of eliminating
occupations that should be categorized under other sectors
and adding occupations that have been omitted is carried
out.
Next adjustments are made so that the figures match
with the range of the number of employees by sector
estimated in the employment matrix.
Finally, consistency between the numbers of employees
by occupation estimated by considering the number of
those with public qualifications and the status of main and
subsidiary businesses and the numbers of employees by
occupation in respective sectors obtained above should be
flowed up and reconciled.
5 Fixed Capital Matrix (Table on Fixed Capital
Formation)
(1) Concepts
The “Gross domestic fixed capital formation” in the
Input-Output Tables basically covers the transaction
values of reproducible capital assets used for production
repeatedly or continuously for one year or longer, includ-
ing buildings, machinery, and equipment as well as growth
and the increase of productive capital services provided by
livestock and fruit trees. (please refer to “7411-00 Gross
domestic fixed capital formation (public)” and “7511-00
Gross domestic fixed capital formation (private)” in
Section 2, Chapter 7).
Beginning with the 1995 Input-Output Tables, the soft-
ware industry has also been covered and mineral explora-
tion is included under “Miscellaneous business services.”
Further, starting with the 2015 Input-Output Tables,
research and development and defense equipment were
capitalized. Also included in the Tables were brokerage
fees, etc. on real estate transactions and remodeling and
repair involving the enhancement of the functionality
and/or life expectancy of buildings categorized in the
“Repair of construction.”
In the Basic Transaction Table, fixed capital formation
is treated as “Total domestic fixed capital formation
(public)” and “Total domestic fixed capital formation
(private)” merely to record the total capital goods in the
column vectors. It is thus impossible to identify how much
capital formation has occurred in which sector.
- 106 -

The table on fixed capital formation (fixed capital ma-
trix) supplements the Basic Transaction Tables. As indi-
cated in Chart 5-4[2], the fixed capital matrix can indicate
which and how much capital goods and have been pur-
chased (“Capital formation”) by which column sectors
(“Capital formation sectors”) for different investment
entities (public or private). This data then makes it possi-
ble to conduct dynamic input-output analyses that treat
capital formation values at column sectors as endogenous
variables, and cost analyses including capital formation,
etc.
The capital formation sectors at the top of the fixed cap-
ital matrix in Chart 5-4[2] are based in principle on the
medium aggregated sector classifications (105 sectors).
Chart 5-4 Relationship Between the Basic Transaction
Table and Fixed Capital Matrix
[1] Basic Transaction Table
(Note) The fixed capital formation recorded in the final demand
in a lump sum is distributed to output destinations to
formulate the “Fixed capital matrix.”
[2] Fixed Capital Matrix
(Note) Three types of tables are compiled: public, private, and
public + private
Table 5-2 Detailed Classification and Scope in
“Other”
Classification Scope
Road
Road businesses (including mainte-
nance, repair, restoration after disaster
operations, etc.) and street business.
However, toll road businesses are
classified under “transportation services”
Housing
Owner-occupied units, built-for-sale
units (urban renaissance agency, and
private) (sold urban renaissance agency
units are “private,” but unsold ones are
“public”). Rental units and company
housing units are included in the “real
estate (rental housing rents).
Environment
and hygiene
City parks (including maintenance,
repair, restoration after disaster
operations, etc.), natural parks, public
parks, drainage. Water-supply facilities
and waste disposal facilities are
classified under “water supply”
Land
conservation
Soil conservation (including mainte-
nance, repair and restoration after
disaster operations), water control, and
coastal preservation business
Land
development
Residential land development, industrial
land development, reclamation
Fixed capital formation includes general social capital,
which cannot be treated as capital for production activities
at specific sectors such as housing, roads, and parks. Such
capital is defined as “Other” under the medium aggregated
sector classification. The classifications and scopes are as
indicated in Table 5-2.
Furthermore, in the fixed capital formation, the generat-
ed monetary value of scrap and by-products and cost trade
are excluded from the scope of the fixed capital ma-
trix.(Note)
(Note) The fixed capital matrix targets capital goods that were
produced in the target year for compilation of Input-Output
Tables, and that were recorded as domestic production.
Scraps and by-products consist of those that were output
in the target year for compilation of Input-Output Tables,
but as they were output collaterally in the process of produc-
tion activities of other goods, they are recorded based on the
negative input method and, as a result, are not included in
domestic production of row sectors. As a result, they are ex-
cluded from the fixed capital matrix.
Cost trade is associated with, for example, transaction of
secondhand goods, but the secondhand goods themselves
that are subject to transactions are fundamentally not those
that are produced in the target year for compilation of Input-
Output Tables, and their prices are not recorded in the Basic
Transaction Table. Accordingly, cost trade is not targeted in
the fixed capital matrix.
Capital formation sector
Sector of capital goods
Ro
ad
Ho
usi
ng
…
200 50 100 50
500 50 200 100 150
Total
C
D
・・・・・・
…
Other
A
B
Total
Ag
ricu
ltu
re
Ste
el
Co
nst
ructi
on
A B C D … Consumption
Domestic total
fixed capital
formation
(public)
Domestic total
fixed capital
formation
(private)
ExportsDomestic
production
A … … … … … 200
B … … … … … 500
C
D
・
・
・
Gross value
added
Domestic
production
- 107 -

(2) Compilation Method
Compilation of the fixed capital matrix for both the
public and private sector capitals begins with estimates of
breakdowns by output destination for the respective
capital goods (capital formation sectors) undertaken by the
relevant ministries and agencies of each kind of capital
goods, based on data such as the Survey of Capital Goods
Demand Structure, Economic Census for Business Activi-
ty, Survey of Building Construction Started, and domestic
production in detailed items, etc. Necessary adjustments
are then made between the relevant ministries and agen-
cies of the capital formation sectors (column sectors).
All capital goods concerning the goods rental and leas-
ing sectors are estimated by the Ownership approach.
6 Table on Commodity Output by Industry
(Make table)
(1) Concepts
The Basic Transaction Table is a table of [row] com-
modity × [column] unit of production activity (activity).
For activities of business sites that are producing and
providing multiple types of goods and services, the table is
compiled by classifying such goods and services in the
corresponding multiple sectors in accordance with the type
of each.
As a result, when analyzing the kinds of effects of pro-
duction multiplier that will be obtained due to the results
of analysis of Input-Output Tables in relation to each
industry that is classified as a unit of business site, sepa-
rate information that indicates the relationship between
business sites and commodities becomes necessary.
In order to meet this kind of request, the table on com-
modity output by industry (hereinafter referred to as “V
table”) indicates what kinds of goods and services are
produced and provided by each industry, regardless of
whether they are produced and provided as a main busi-
ness or side business, by industry classifying of the busi-
ness site (for activities of business sites that produce and
provide multiple types of goods and services, industry
classifying is based on the main types of goods and ser-
vices).
The V table is a matrix representation where the side
(rows) represents industry sectors and head (columns)
represents commodity sectors. Accordingly, the row sum
represents the total output by industry, and the column
sum represents the total output by commodity.
The industry sectors on the side of the table are broadly
divided into [1] market producers, [2] non-market produc-
ers (general government),** and [3] non-market producers
(private non-profit institutions serving households),*
depending on the transactor-based production activity
classification. In principle, although these are established
in a format where they correspond to medium aggregated
classifications (107 sectors), segmentalization is carried
out for some sectors. Also, the commodity sectors in the
table head are set so that they correspond one-on-one in
terms of format with the industry sectors on the side of the
table. Accordingly, the V table is a square matrix table
(table of 123 sectors) where rows are industry classifica-
tions and columns are commodity classifications.
(2) Compilation Method
In compiling V table, the necessary numbers are ob-
tained by carrying out recombined tabulation of shipment
amounts by industry and by commodity that are obtained
from the results of the Economic Census for Business
Activity in accordance with the sector classifications of
the V table. Furthermore, various statistical materials are
used to carry out estimations and adjustments, and figures
are established.
In the Basic Transaction Table, outputs of scraps and
by-products that use the negative input method are not
included in domestic production. However, the V table is
compiled by including the outputs (absolute values) of
scraps and by-products. As a result, the total by commodity
(output by commodity = each row total in the V table)
matches the total of “domestic production + the value of
scraps and by-products (endogenous sectors)” (the value
of scraps and by-products in the final demand sector are
not recorded since they do not fall under the concept of the
V table) (Chart 5-5[3]).
- 108 -

Chart 5-5 Enterprises and Production Activity Units
[1] Case
[2] Basic Transaction Table
[3] Ⅴ Table
[Explanation]
Here, as shown in [1], a business site that produces Commodity
A and Commodity B is envisioned.
At this business site, one unit of Commodity B is produced as a
by-product in the process for producing 20 units of Commodity A.
At the same time, 10 units of Commodity A are produced as a by-
product in the process for producing 15 units of Commodity B.
As a result, as a whole, the business site produces 30 units of
Commodity A and 16 units of Commodity B. Since Commodity A
is the main product, the business site is classified as being of
Industry A.
In the Basic Transaction Table ([2]), the by-product is nega-
tively recorded in the output sector, and by recording this as a
positive in the output destination, it is canceled out for the row
sector. As a result, Commodity B (by-product) that is produced in
production activities for Commodity A is recorded as “△1”
at the intersection of [column] Sector A and [row] Sector B, and
at the same time, “1” is recorded at the intersection of the
output destination [column] F and [row] B, canceling each other
out. In addition, Commodity A (by-product) that is output in the
process of production activities for Commodity B is recorded as
“△10” at the intersection of [column] Sector B and [row]
Sector A. At the same time, “7” and “3” are included at
the intersection of the output destinations [column] Y and [col-
umn] Z, respectively, with [row] B. As a result, in the Basic
Transaction Table, domestic production of Commodity A is 20
and that of Commodity B is 15.
In the V table, ([3]), since the side of the table represents the
industry classifying of the business site, the activities of this
business site are all recorded in row A. Since the production
amount of Commodity A was 30 units, including the output
(absolute value) of by-products, and the production amount of
Commodity B was 16 units, including the output (absolute value)
of by-products, “30” is recorded at the intersection of [row]
Sector A and [column] Sector A, and “16” is recorded at the
intersection of [row] Sector A and [column] Sector B.
7 Table on Self-Transports
(1) Concepts
The table on self-transports indicates the detailed goods
and services input for activities related to “Self-transport
by private cars (passengers)” and “Self-transport by
private cars (freight), ” which are dummy sectors
representing self-activities, under the column sector of the
Basic Transaction Table (refer to Chart 5-6).
In Basic Transaction Table, expenses for fuel, non-life
insurance, and auto repairs, etc., input by each column
sector to conduct self-transport activities are not recorded
directly at the intersection of the respective column sectors
and the rows of the goods and services. Instead, the ex-
penses required for self-transport activities for passenger
and freight services are aggregated and the “Self-transport
by private cars (passengers)” and “Self-transport by
private cars (freight)” are regarded as input in a lump sum.
It is thus impossible to identify the breakdown of the
expenses required for the self-transport activities in each
Commodity A : 20Y : 5
Production of Commodity A Output to Z : 5(Production activity unit:A) F : 10
By-product B : 1 Output to F : 1
Commodity B : 15Y : 10
Production of Commodity B Z : 5(Production activity unit:B) By-product A : 1
Output to Y : 7Z : 3
Enterprise (industry)
Output to
A B Y Z
A 30 16 … … … 46
B … … … … … …
… … … … … …
Y … … … … … …
Z … … … … … …
30 16 … … … …
Domestic
production
… …
20 15 … … … …
Total
Scrap and
by-products10 1 … …
Product(goods and services)Total
Ind
ust
ry
Final
demand
A B Y Z F
A 0 △10 … 12 8 10 20
B △1 … … 10 5 1 15
… … … … … … …
Y 5 3 … … … … …
Z 10 12 … … … … …
6 10 … … …
Domestic
production
Domestic
production…20 15 … …
Intermediate demand
Inte
rmed
iate
in
pu
tG
ross
valu
e a
dd
ed
… … … … …
… … … … …
- 109 -

column sector.
The table on self-transports is compiled as a supplemen-
tary table to fill the gap, revealing the input structure of
goods and services required for self-transport activities at
each column sector and the status of the output of goods
and services required for self-transport activities to each
column sector.
“Self-Transport” sector is dummy sector, and doesn’t
record value added.
(2) Compilation Method
The table on self-transports is compiled in parallel with
the compilation of the Basic Transaction Table, as follows.
i) Each column sector distributes the expenses required for
self-transport proportionately from the goods and
services input to date, accumulates these figures, and
estimates the inputs for “Self-transport by private cars
(passengers)” and “Self-transport by private cars
(freight).”
ii) In parallel with i), inputs of goods and services are
estimated from various data for private automobiles
in both sectors of “Self-transport by private cars
(passengers)” and “Self-transport by private cars
(freight).” The output of each column is also estimated.
Input and output to the private automobile sector are
established by making the necessary adjustments with
the relevant sectors.
iii) With the input of the self-transport sector obtained in
ii) above and the output of the self-transport sector to
each column as CT (Control Totals), the table on
self-transport of the preceding table and various data on
the subsequent changes of the self-transport activities at
each industry are used to distribute the input of the
column sectors, which are then adjusted with the output
sectors (including readjustments for cases in which the
figures of ii) need to be changed at this stage) to
complete the table on self-transport.
The Basic Transaction Table has been compiled in
two formats: one indicating the self-transport sectors at
columns and rows, and one not setting self-transport
sectors, with each sector directly inputting goods and
services related to self-transport. The two formats are
offered to meet varying needs.
Chart 5-6 Relationship Between Basic Transaction Table
and Table on Self-Transports
[1] Basic Transaction Table
(Note) Expenses concerning self-transport aggregated and
recorded in the self-transport sectors in the rows of the
Basic Transaction Table are disaggregated into each row
sector to produce the table on self-transports.
[2] Table on Self-Transports
(Note) [2] is a representational image of Sector C from [1]
A B C D E Total
A ・・・ ・・・ 5 ・・・ ・・・ 20
B ・・・ ・・・ 20 ・・・ ・・・ 80
C 4 8 5 10 3 30
D ・・・ ・・・ 0 ・・・ ・・・ 10
E ・・・ ・・・ 0 ・・・ ・・・ 10
Total 20 40 30 50 10 150
- 110 -

〔Reference 2〕 Table on Trade Margins and
Table on Domestic Freights
(1) Concepts
These two tables show, in matrix form, distribution
expenses, or trade margins and domestic freight, for
transactions involving goods between each sector recorded
in the Basic Transaction Table.
In the Basic Transaction Table (output table), trade
margins (wholesale and retail trade margins) and domestic
freights (freights for seven transport modes) that are
included in individual transaction amounts are represented
in the basic sector classification (509 row sectors × 391
column sectors) and minor aggregated classification (187
sectors). However, it is not possible to extract and form a
list of only the state of trade margins and domestic freights.
Thus, the “Table on Trade Margins” and “Table on
Domestic Freights” are compiled (provided on the
Internet), in which the trade margin amounts and domestic
freight amounts that are included in individual transaction
amounts are extracted and made into a list using medium
aggregated classification (107 sectors).
(2) Types and Scopes of Tables on Trade Margins
and Tables on Domestic Freights
[1] Tables on trade margins
Tables on trade margins are compiled for wholesale
margins and retail trade margins. They do not include
commissions received by agencies from the import and
export of goods (recorded in “special trade”) and cost trade
margins, such as trade margins derived from second-hand
goods. In addition, freight paid by trade sectors is excluded
from trade margins that treated as domestic freight.
[2] Tables on domestic freights
Tables on domestic freights are compiled for domestic
freight and fees derived from operating transportation
activities.
Freight incurred outside the Japanese territory in
international transportation and “cost transport margins”
are not counted as domestic freight.
Tables on domestic freights are compiled by estimating
the transportation expenses incurred in each transaction
by the following seven transport modes:
i) Railway freight transport
ii) Road freight transport (except self-transport)
iii) Coastal and inland water freight transport
iv) Port transport
v) Domestic air freight transport
vi) Handling of freight transport
vii) Warehouse
Chart 5-7 Relationships Between Basic Transaction Tables
and Tables on Trade Margins and Tables on
Domestic Freights
[1] Input-Output Table at Producers’ Prices (Model)
(Note) Input-Output Tables at purchasers’ prices can be compiled by
recording the trade margins and domestic freights recorded as a
lump sum at the intersections of the commerce (row) and the
transport (row) at each demanding sector (column) in the Basic
Transaction Tables, by input goods of the relevant column
sectors.
[2] Input-Output Table at Purchasers’ Price (Model)
(Note) The values inside the parentheses ( ) signify “(Trade margins +
Domestic freights),” and schematically indicate the relationship
that they are numbers included in transaction amounts. These
values are extracted and turned into the lists in “Table on Trade
Margins” ([3]) and “Table on Domestic Freights” ([4]) based on
the medium aggregated classification.
In the actual Input-Output Table at purchasers’ price, the trade
margins (wholesale and retail trade margins) and domestic
freights (freights for seven transport modes) for individual
transaction amounts are represented in the output tables for basic
sector classification and minor aggregated classification.
A 20
B 40 40 70 40 10 300
C 110
50 ・・・ 900
30 ・・・ 700
50
300
Intermediate demand Final demand DomesticproductionA B C ・・・・・Commerce Transport
Domesticproduction
Inte
rmed
iate
inpu
t ・・・・・ 100
Trade margins
Domestic freightsTransport
Commerce
Gro
ss v
alue
add
ed ・・・・・・・
・・・・・
A 30
B 55 55 90 70 15 410 -70 -40 300
C 165
Commerce 0 0 900 0 9000 0 700 700
Transport 0
50
Total demand
Deduction
TransportDomestic
productionTrade
marginsDomestic freight
Intermediate demand Final demand
A B C ・・・・・Commerce
Inte
rmed
iate
inpu
t (5+5)・・・・・ 125
(10+5) (10+5) (12+8) (18+12)
Domesticproduction
300
(3+2) (17+8)
(35+20)
Gro
ss v
alue
add
ed ・・・・・・・
・・・・・・
- 111 -

[3] Table on Trade Margins (Model)
(Note) This is compiled by removing trade margins from the Input-Output Table at purchasers’ price.
[4] Table on Domestic Freights (Model))
(Note) This is compiled by taking out domestic freight from the Input-Output Table at purchasers’ price.
(3) Compilation Method of Table on Trade Margins
Tables on trade margins are compiled in the following
manner.
[1] Estimating the total trade margins by wholesale and
retail trade
By correcting the results of recombined tabulation of
the “Economic Census for Business Activity,” the total
trade margins by wholesale and retail are estimated.
This total amount is the domestic production amount for
the wholesale and retail industries. (Cost trade is not
included.)
[2] Estimating the total trade margins by row sector
The total trade margins by wholesale and retail are
estimated by each row sector in the Input-Output
Tables. However, there is an irregularity between the
treatment of the trade items in the Economic Census
for Business Activity and the row sectors in the Input-
Output Tables; thus, the trade margins by row sector is
estimated by also referring to the result of the trade
margin survey (margin ratios by goods).
[3] Estimating the transaction value subject to trade
margins
For the transactions of goods, trade margins are not
necessarily applied to all goods and even if applied, the
margin ratios differ between transactions. So, the “Table
of Ratios Not Subject to Trade Margins” is compiled by
estimating which transactions are free from the trade
margins.
The factors generating difference in the ratios not
subject to trade margins in different transactions may
include the following:
i) Consumption in one’s own factory
ii) Consumption in other factories of one’s own company
iii) Direct sales to other companies (without intermediary
wholesale or retail trade; as for wholesale trade, direct
sales without intermediary retail trade)
iv) Whether there is a ratio of discount margins
v) Whether there is a kickback
vi) Differences between distribution systems
vii) Whether there is multistage distribution (such as first,
second, and third wholesale)
viii) Differences due to large- and small-sized transactions
[4] Estimating trade margins by each transaction
Wholesale and retail trade margins are estimated by
each transaction based on the results of [2] and [3].
(4) Compilation Method of Table on Domestic Freights
Overviews of the method of compiling the tables on
domestic freight are as follows.
[1] Estimating domestic production in the transport sector
“Total freight charges” as domestic production in
transport sectors, including cost transport margins, is
estimated for seven transport modes.
Aggregate domestic production in the transport sector
(CT) ① for the seven transport modes.
[2] Estimating freight by row sector (transport commodities)
First, classify the freight established by the seven
transport modes broadly for the respective transport
commodity groups, then gradually divide into smaller
commodity groups. Finally, estimate freight by row sector
(transport commodities).
Next, estimate the freight by row sector (F) ②. The
total of ② is equal to ①.
A 5
B 10 10 12 18 3 17 70
C 35
Commerce -50 -900
Transport 0
0 0
Inte
rmed
iate
inpu
t
Total
TransportCommerce
Intermediate demand Final demandTotal
A B C ・・・・・
A 5
B 5 5 8 12 2 8 40
C 20
Commerce 0 0
Transport -30 -700
0 0
Inte
rmed
iate
in
put
Total
Commerce Transport
Intermediate demand Final demandTotal
A B C ・・・・・
CT
Transport ①
CT
- 112 -

i
iijij X
FXF
=
[3] Separation of cost transport margins
From the freight established for the respective row
sectors, deduct the cost transport margins by row sector
(commodities) estimated separately. Estimate the freight
by row sector to be covered by the freight.
[4] Estimating the transaction value subject to freight
Not all transactions involving goods require
transportation charges, nor is the ratio of freight in all
transactions constant. In consideration of these facts,
assess which part of each transaction value, by each
commodity, is subject to freight and, contrarily, which
part is not subject to freight. At the same time, the
“Table of the Ratio Not Subject to Freight” by each
transaction is compiled in view of the ratio of freight in
the transactions subject to freight.
The following factors presumably caused the
differences in the ratio not subject to freight in different
transactions:
・ Whether the portion was consumed in one’s own
factory and its ratio
・ The ratio of the self-transport portion
・ Whether pipeline transport is involved
・ Difference in the distance of transport
・ Whether discount freight is applied
Next, the “transaction value subject to freight in each
transaction” is computed by multiplying each
transaction value by [1 - the ratio not subject to freight].
Then, this is totaled by row sector, and the “transaction
value subject to freight by row sector” is estimated.
[5] Computation of freight by each transaction
The ratio of freight by row sector to the transaction
value subject to freight by row sector is defined as the
“ratio of freight by row sector.” “freight by each
transaction” is computed by multiplying the “ratio of
freight by row sector” by the transaction value subject to
freight by each transaction obtained in iv).
Notes:
ijF ' : Freight by each transaction excluding cost transport
margins
ijX ' : Transaction value subject to freight by each
transaction excluding cost transport margins
iF ' : Freight by row sector excluding cost transport
margins
iX ' : Transaction value subject to freight by row sector
excluding cost transport margins
=運=④
ijij
nX
Freight non-coverage ratios
==XX ij
ij Transaction to be covered by freight in Sector i
=X
F
i
i
Freight ratio in Sector i
CT F
②
Transport ①
②
F ’
F i′ ③
Transport ①
F i′ ③
CT
F Domestic freight
Cost transport margin
④
Sector CT
Sector
CT
ijX
ijX
jX
ijX
iXi
j
- 113 -
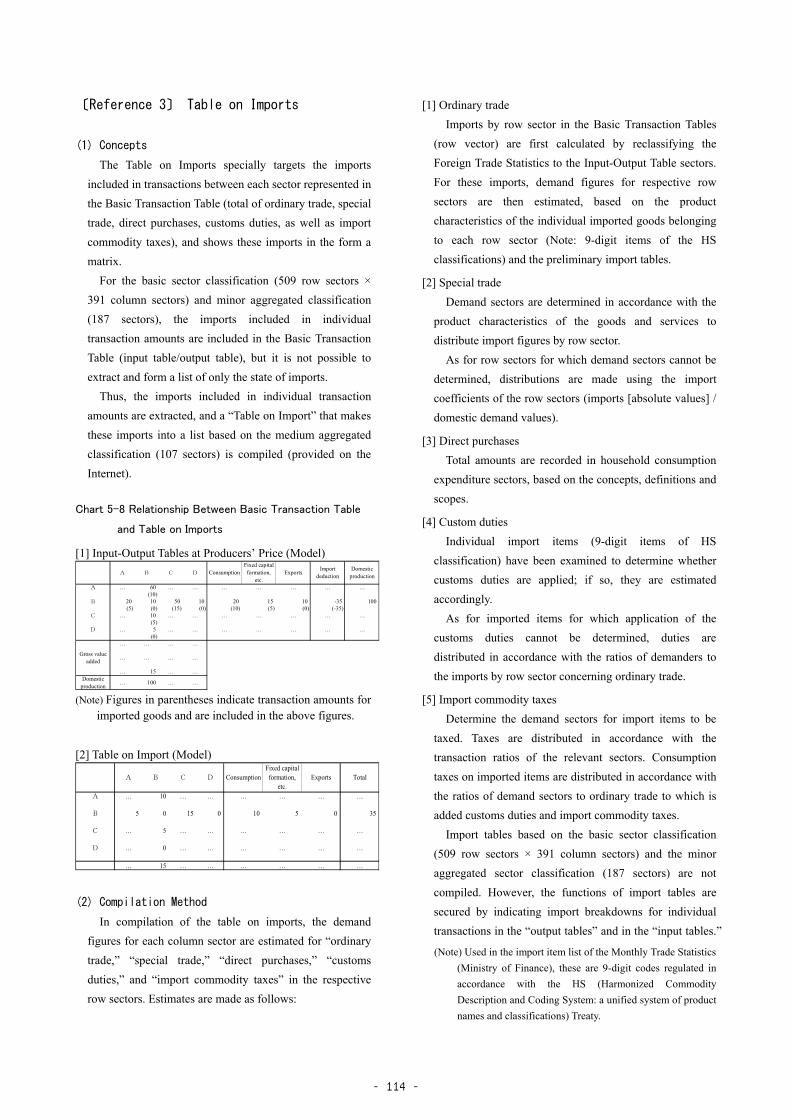
〔Reference 3〕 Table on Imports
(1) Concepts
The Table on Imports specially targets the imports
included in transactions between each sector represented in
the Basic Transaction Table (total of ordinary trade, special
trade, direct purchases, customs duties, as well as import
commodity taxes), and shows these imports in the form a
matrix.
For the basic sector classification (509 row sectors ×
391 column sectors) and minor aggregated classification
(187 sectors), the imports included in individual
transaction amounts are included in the Basic Transaction
Table (input table/output table), but it is not possible to
extract and form a list of only the state of imports.
Thus, the imports included in individual transaction
amounts are extracted, and a “Table on Import” that makes
these imports into a list based on the medium aggregated
classification (107 sectors) is compiled (provided on the
Internet).
Chart 5-8 Relationship Between Basic Transaction Table
and Table on Imports
[1] Input-Output Tables at Producers’ Price (Model)
(Note) Figures in parentheses indicate transaction amounts for
imported goods and are included in the above figures.
[2] Table on Import (Model)
(2) Compilation Method
In compilation of the table on imports, the demand
figures for each column sector are estimated for “ordinary
trade,” “special trade,” “direct purchases,” “customs
duties,” and “import commodity taxes” in the respective
row sectors. Estimates are made as follows:
[1] Ordinary trade
Imports by row sector in the Basic Transaction Tables
(row vector) are first calculated by reclassifying the
Foreign Trade Statistics to the Input-Output Table sectors.
For these imports, demand figures for respective row
sectors are then estimated, based on the product
characteristics of the individual imported goods belonging
to each row sector (Note: 9-digit items of the HS
classifications) and the preliminary import tables.
[2] Special trade
Demand sectors are determined in accordance with the
product characteristics of the goods and services to
distribute import figures by row sector.
As for row sectors for which demand sectors cannot be
determined, distributions are made using the import
coefficients of the row sectors (imports [absolute values] /
domestic demand values).
[3] Direct purchases
Total amounts are recorded in household consumption
expenditure sectors, based on the concepts, definitions and
scopes.
[4] Custom duties
Individual import items (9-digit items of HS
classification) have been examined to determine whether
customs duties are applied; if so, they are estimated
accordingly.
As for imported items for which application of the
customs duties cannot be determined, duties are
distributed in accordance with the ratios of demanders to
the imports by row sector concerning ordinary trade.
[5] Import commodity taxes
Determine the demand sectors for import items to be
taxed. Taxes are distributed in accordance with the
transaction ratios of the relevant sectors. Consumption
taxes on imported items are distributed in accordance with
the ratios of demand sectors to ordinary trade to which is
added customs duties and import commodity taxes.
Import tables based on the basic sector classification
(509 row sectors × 391 column sectors) and the minor
aggregated sector classification (187 sectors) are not
compiled. However, the functions of import tables are
secured by indicating import breakdowns for individual
transactions in the “output tables” and in the “input tables.”
(Note) Used in the import item list of the Monthly Trade Statistics
(Ministry of Finance), these are 9-digit codes regulated in
accordance with the HS (Harmonized Commodity
Description and Coding System: a unified system of product
names and classifications) Treaty.
A … 60 … … … … … … … (10)B 20 10 50 10 20 15 10 -35 100
(5) (0) (15) (0) (10) (5) (0) (-35)C … 10 … … … … … … …
(5)D … 5 … … … … … … …
(0)… … … …
… … … …
… 15 … …Domestic
production… 100 … …
A B C D ConsumptionFixed capital
formation,etc.
ExportsImport
deductionDomestic
production
Gross valueadded
A … 10 … … … … … … B 5 0 15 0 10 5 0 35
C … 5 … … … … … …
D … 0 … … … … … …
… 15 … … … … … …
A B C D ConsumptionFixed capital
formation,etc.
Exports Total
- 114 -

Endogeneous Sectors
0111 -01 Rice 0111 Grains 011 Crop cultivation 01
0111 -011 Rice
0111 -012 Rice straw
0111 -02 Wheat, barley and the like
0111 -021 Wheat
0111 -022 Barley
0112 -01 Potatoes and sweet potatoes 0112 Potatoes, beans
0112 -011 Sweet potatoes
0112 -012 Potatoes
0112 -02 Pulses
0112 -021 Soybeans
0112 -029 Miscellaneous pulses
0113 -001 Vegetables 0113 Vegetables
0113 -01 Vegetables (outdoor)
0113 -02 Vegetables (under facilities)
0114 -01 0114 -011 Fruits 0114 Fruits
0115 -01 0115 -011 Sugar crops 0115
0115 -02 Crops for beverages
0115 -021 Green coffee and cocoa beans (imported)
0115 -029 Miscellaneous crops for beverages
0115 -09 Miscellaneous edible crops
0115 -091 Miscellaneous cereals
0115 -099 Edible crops, n.e.c.
0116 -01 0116 -011 Feed and forage crops 0116 Inedible crops
0116 -02 0116 -021 Seeds and seedlings
0116 -03 0116 -031 Flowers and plants
0116 -09 Miscellaneous inedible crops
0116 -091 Leaf tobacco
0116 -092 Raw rubber (imported)
0116 -093 Raw cotton (imported)
0116 -099 Inedible crops, n.e.c.
0121 -01 Dairy cattle farming 0121 Livestock 012 Livestock
0121 -011 Raw milk
0121 -019 Miscellaneous dairy farming products
0121 -02 0121 -021 Beef cattle
0121 -03 0121 -031 Hogs
0121 -04 0121 -041 Hen eggs
0121 -05 0121 -051 Chickens
0121 -09 0121 -099 Miscellaneous livestock
0131 -01 0131 -011 Veterinary service 0131 Agricultural services 013 Agricultural services
0131 -02 0131 -021 Agricultural services (except veterinary service)
0151 -01 0151 -011 Silviculture 0151 Silviculture 015 Forestry
0152 -01 0152 -011 Logs 0152 Logs
0153 -01 0153 -011 Special forest products (including hunting) 0153 Special forest products
0171 -01 0171 -011 Marine fishery 0171 Marine fishery 017 Fishery
0171 -02 0171 -021 Marine aquaculture
0172 -001 Inland water fishery and inland water aquaculture 0172 Inland water fishery
0172 -01 Inland water fishery
0172 -02 Inland water aquaculture
0611 -01 Coal mining, crude petroleum and natural gas 0611 061 06 Mining
0611 -011 Coal mining
0611 -012 Crude petroleum
0611 -013 Natural gas
0621 -01 0621 -011 Gravel and quarrying 0621 Gravel and quarrying 062
0621 -02 0621 -021 Crushed stones
0629 -09 Miscellaneous ores 0629 Miscellaneous ores
0629 -091 Iron ores
0629 -092 Non-ferrous metallic ores
0629 -093 Limestone
0629 -094 Materials for ceramics (except limestone)
0629 -099 Ores, n.e.c.
1111 -01 Meat 1111 Dairy products 111 Foods 11 Beverages and Foods
1111 -011 Beef
1111 -012 Pork
1111 -013 Chicken meat
1111 -014 Miscellaneous meat
1111 -015 By-products of slaughtering and meat processing
1111 -02 Dairy farm products
1111 -021 Drinking milk
1111 -022 Dairy products
1111 -09 1111 -099 Miscellaneous livestock products
Agriculture, forestry and
fishery
Coal mining, crude
petroleum and natural gas
Coal mining, crude
petroleum and natural gas
Miscellaneous mining
industry
Miscellaneous edible crops
187 Sector Classification 107 Sector Classification1 Basic Sector Classification (509 Rows x 391 Columns)
CHAPTER ⅥSECTOR CLASSIFICATION (Basic Sector, Aggregated Sector, and Special Classification)
37 Sector Classification
2 Aggregated Sector Classification
Sector Name Code Sector NameColumn Code Row Code
Classification CodeSector Name Code Sector Name Code
1 Basic Sector Classification and Aggregated Sector Classification
- 115 -

187 Sector Classification 107 Sector Classification1 Basic Sector Classification (509 Rows x 391 Columns)
37 Sector Classification
2 Aggregated Sector Classification
Sector Name Code Sector NameColumn Code Row Code
Classification CodeSector Name Code Sector Name Code
1112 -01 1112 -011 Frozen fish and shellfish 1112 Processed seafood
1112 -02 1112 -021 Salted, dried or smoked seafood
1112 -03 1112 -031 Bottled or canned seafood
1112 -04 1112 -041 Fish paste
1112 -09 1112 -099 Miscellaneous processed seafood
1113 -01 Grain milling 1113 Grain milling
1113 -011 Milled rice
1113 -019 Miscellaneous grain milling
1113 -02 Flour and miscellaneous grain milled products
1113 -021 Wheat flour
1113 -029 Miscellaneous grain milled products
1114 -01 1114 -011 Noodles 1114
1114 -02 1114 -021 Bread
1114 -03 1114 -031 Confectionery
1115 -01 1115 -011 Preserved agricultural foodstuffs 1115 Preserved agricultural food
stuffs
1116 -01 Sugar 1116
1116 -011 Refined sugar
1116 -019Miscellaneous sugar and by-products of sugar
manufacturing
1116 -02 1116 -021 Starch
1116 -03 1116 -031 Dextrose, syrup and isomerized sugar
1116 -04 Animal oil and fats, vegetable oil and meal
1116 -041 Vegetable oil
1116 -042 Animal oils and fats
1116 -043 Cooking oil
1116 -044 Vegetable meal
1116 -05 1116 -051 Condiments and seasonings
1119 -01 1119 -011 Prepared frozen foods 1119 Miscellaneous foods
1119 -02 1119 -021 Retort foods
1119 -03 1119 -031 Dishes, sushi and lunch boxes
1119 -09 1119 -099 Miscellaneous foods
1121 -01 1121 -011 Refined sake 1121 Liquors 112 Beverage
1121 -02 1121 -021 Malt liquors
1121 -03 1121 -031 Whiskey and brandy
1121 -09 1121 -099 Miscellaneous liquors
1129 -01 1129 -011 Tea and roasted coffee 1129 Miscellaneous drinks
1129 -02 1129 -021 Soft drinks
1129 -03 1129 -031 Manufactured ice
1131 -01 1131 -011 Feeds 1131 113
1131 -02 1131 -021 Organic fertilizers, n.e.c.
1141 -01 1141 -011 Tobacco 1141 Tobacco 114 Tobacco
1511 -01 1511 -011 Fiber yarns 1511 Fiber yarns 151 Textile products 15 Textile products
1512 -01 1512 -011 Cotton and staple fiber fabrics (including fabrics of
synthetic spun fibers)
1512 Fiber fabrics
1512 -02 1512 -021 Silk and artificial silk fabrics (including fabrics of
synthetic filament fibers)
1512 -09 1512 -099 Miscellaneous fabrics
1513 -01 1513 -011 Knitting fabrics 1513 Knitting fabrics
1514 -01 1514 -011 Yarn and fabric dyeing and finishing (processing on
commission only)
1514 Yarn and fabric dyeing and
finishing
1519 -09 Miscellaneous fabricated textile products 1519
1519 -091 Ropes and nets
1519 -099 Fabricated textiles products, n.e.c.
1521 -01 1521 -011 Woven fabric apparel 1521 152
1521 -02 1521 -021 Knitted apparel
1522 -09 1522 -099 Miscellaneous wearing apparel and clothing
accessories
1522 Miscellaneous wearing
apparel and clothing
accessories
1529 -01 1529 -011 Bedding 1529
1529 -02 1529 -021 Carpets and floor mats
1529 -09 Miscellaneous ready-made textile products
1529 -091 Fabricated textiles for medical use
1529 -099 Ready-made textile products, n.e.c.
1611 -01 1611 -011 Timber 1611 Lumber 161 Lumber and wood products 16
1611 -02 1611 -021 Plywood, glued laminated timber
1611 -03 1611 -031 Wooden chips
1619 -09 Miscellaneous wooden products 1619
1619 -091 Wooden products for construction
1619 -099 Wooden products, n.e.c.
1621 -01 1621 -011 Wooden furniture 1621 Furniture and fixtures 162 Furniture and fixtures
1621 -02 1621 -021 Metallic furniture
1621 -03 1621 -031 Wooden fixtures
1621 -09 1621 -099 Miscellaneous furniture and fixtures
1631 -01 1631 -011 Pulp 1631 Pulp 163
1631 -021P Used paper
Pulp, paper, paperboard,
coated and glazed paper
Miscellaneous fabricated
textile products
Woven fabric and knitted
Apparel
Miscellaneous ready-made
textile products
Pulp, paper and wooden
products
Miscellaneous wooden
products
Noodles, bread,
confectionery
Sugar, oils, condiments and
seasoning
Feeds and organic
fertilizers, n.e.c.
Feeds and organic
fertilizer, n.e.c.
Wearing apparel and
miscellaneous ready-made
textile products
- 116 -

187 Sector Classification 107 Sector Classification1 Basic Sector Classification (509 Rows x 391 Columns)
37 Sector Classification
2 Aggregated Sector Classification
Sector Name Code Sector NameColumn Code Row Code
Classification CodeSector Name Code Sector Name Code
1632 -01 1632 -011 Paper 1632 Paper, paperboard
1632 -02 1632 -021 Paperboard
1633 -01 1633 -011 Corrugated cardboard 1633 Coated and glazed paper
1633 -02 1633 -021 Coated paper and building (construction) paper
1641 -01 1641 -011 Corrugated card board boxes 1641 Paper containers 164 Paper products
1641 -09 1641 -099 Miscellaneous paper containers
1649 -01 1649 -011 Paper textile for medical use 1649
1649 -09 1649 -099 Miscellaneous pulp, paper and processed paper
products
1911 -01 1911 -011 Printing, plate making and book binding 1911 Printing, plate making and
book binding
191 Printing, plate making and
book binding
39 Miscellaneous
manufacturing products
2011 -01 2011 -011 Chemical fertilizer 2011 Chemical fertilizer 201 Chemical fertilizer 20 Chemical products
2021 -01 Industrial soda chemicals 2021 Industrial soda chemicals 202
2021 -011 Soda ash
2021 -012 Caustic soda
2021 -013 Liquid chlorine
2021 -019 Miscellaneous industrial soda chemicals
2029 -01 Inorganic pigment 2029
2029 -011 Titanium oxide
2029 -012 Carbon black
2029 -019 Miscellaneous inorganic pigments
2029 -02 2029 -021 Compressed gas and liquefied gas
2029 -03 Salt
2029 -031 Crude salt
2029 -032 Salt
2029 -09 2029 -099 Miscellaneous industrial inorganic chemicals
2031 -01 Petrochemical basic products 2031 203
2031 -011 Ethylene
2031 -012 Propylene
2031 -019 Miscellaneous petrochemical basic products
2031 -02 Petrochemical aromatic products (except synthetic
resin)
2031 -021 Pure benzene
2031 -022 Pure toluene
2031 -023 Xylene
2031 -029 Miscellaneous petrochemical aromatic products
2041 -01 Aliphatic intermediates 2041 204
2041 -011 Synthetic octanol and synthetic butanol
2041 -012 Acetic acid
2041 -013 Ethylene dichloride
2041 -014 Acrylonitrile
2041 -015 Ethylene glycol
2041 -016 Acetic acid vinyl monomer
2041 -019 Miscellaneous aliphatic intermediates
2041 -02 Cyclic intermediates, synthetic dyes and organic
pigments
2041 -021 Synthetic dyes and organic pigments
2041 -022 Styrene monomer
2041 -023 Synthetic phenol
2041 -024 Terephthalic acid and dimethyl terephthalate
2041 -025 Capro lactam
2041 -029 Miscellaneous cyclic intermediates
2042 -01 2042 -011 Synthetic rubber 2042 Synthetic rubber
2049 -01 2049 -011 Methane derivatives 2049
2049 -02 2049 -021 Plasticizers
2049 -09 2049 -099 Miscellaneous industrial organic chemicals
2051 -01 2051 -011 Thermo-setting resins 2051 Synthetic resins 205 Synthetic resins
2051 -02 Thermoplastics resins
2051 -021 Polyethylene (low density)
2051 -022 Polyethylene (high density)
2051 -023 Polystyrene
2051 -024 Polypropylene
2051 -025 Vinyl chloride resins
2051 -03 2051 -031 High function resins
2051 -09 2051 -099 Miscellaneous synthetic resins
2061 -01 Chemical fibers 2061 Synthetic fibers 206 Synthetic fibers
2061 -011 Rayon and acetate
2061 -012 Synthetic fibers
2071 -01 2071 -011 Medicaments 2071 Medicaments 207 Medicaments
2081 -01 Oil and fat products and surface-active agents 2081 208
2081 -011 Oil and fat products
2081 -012 Soap and synthetic detergents
2081 -013 Surface-active agents (except soap or synthetic
detergents)
2082 -01 2082 -011 Cosmetics, toilet preparations and dentifrices 2082 Cosmetics, toilet preparations
and dentifrices
Miscellaneous basic
organic chemical products
Final chemical products
(except medicaments)
Oil and fat products and
surface-active agents
Miscellaneous processed
paper products
Miscellaneous industrial
inorganic chemicals
Petrochemical basic
products
Aliphatic intermediates,
cyclic intermediates,
synthetic dyes and organic
pigments
Industrial inorganic
chemicals
Petrochemical basic
products
Organic chemical products
(except petrochemical basic
products or synthetic
resins)
- 117 -

187 Sector Classification 107 Sector Classification1 Basic Sector Classification (509 Rows x 391 Columns)
37 Sector Classification
2 Aggregated Sector Classification
Sector Name Code Sector NameColumn Code Row Code
Classification CodeSector Name Code Sector Name Code
2083 -01 2083 -011 Paint and varnishes 2083
2083 -02 2083 -021 Printing ink
2084 -01 2084 -011 Agricultural chemicals 2084 Agricultural chemicals
2089 -01 2089 -011 Gelatin and adhesives 2089
2089 -02 2089 -021 Photographic sensitive materials
2089 -09 Miscellaneous final chemical products
2089 -091 Catalyzer
2089 -099 Final chemical products, n.e.c.
2111 -01 Petroleum refinery products (including greases) 2111 211 21
2111 -011 Gasoline
2111 -012 Jet fuel oils
2111 -013 Kerosene
2111 -014 Light oils
2111 -015 Heavy oil A
2111 -016 Heavy oil B and C
2111 -017 Naphtha
2111 -018 LPG (liquefied petroleum gas)
2111 -019 Miscellaneous petroleum refinery products
2121 -01 Coal products 2121 Coal products 212 Coal products
2121 -011 Coke
2121 -019 Miscellaneous coal products
2121 -02 2121 -021 Paving materials
2211 -01 Plastic products 2211 Plastic products 221 Plastic products 22
2211 -011 Plastic films and sheets
2211 -012 Plastic plates, pipes and bars
2211 -013 Foamed plastic products
2211 -014 Industrial plastic products
2211 -015 Reinforced plastic products
2211 -016 Plastic containers
2211 -017 Plastic table ware, kitchen ware and miscellaneous
household articles
2211 -019 Miscellaneous plastic products
2221 -01 2221 -011 Tires and inner tubes 2221 Tires and inner tubes 222 Rubber products
2229 -09 Miscellaneous rubber products 2229
2229 -091 Rubber and plastic footwear
2229 -099 Rubber products, n.e.c.
2311 -01 2311 -011 Leather footwear 2311 Leather footwear 231 39
2312 -01 Leather tanning, leather products and fur skins
(except leather footwear)
2312
2312 -011 Leather and fur skins
2312 -012 Baggage, handbags, small leather cases and
miscellaneous leather products
2511 -01 Sheet glass and safety glass 2511 Glass and glass products 251 Glass and glass products 25
2511 -011 Sheet glass
2511 -012 Safety glass and multilayered glass
2511 -02 2511 -021 Glass fiber and glass fiber products, n.e.c.
2511 -09 Miscellaneous glass products
2511 -091 Glass processing materials
2511 -099 Glass products, n.e.c.
2521 -01 2521 -011 Cement 2521 252
2521 -02 2521 -021 Ready mixed concrete
2521 -03 2521 -031 Cement products
2531 -01 Pottery, china and earthenware 2531 253
2531 -011 Pottery, china and earthenware for construction
2531 -012 Pottery, china and earthenware for industry
2531 -013 Pottery, china and earthenware for home use
2591 -01 2591 -011 Clay refractories 2591 Structural clay products 259
2591 -09 2591 -099 Miscellaneous structural clay products
2599 -01 2599 -011 Carbon and graphite products 2599
2599 -02 2599 -021 Abrasive and its products
2599 -09 2599 -099 Miscellaneous ceramic, stone and clay products
2611 -01 2611 -011 Pig iron 2611 Pig iron and crude steel 261 Pig iron and crude steel 26 Iron and steel
2611 -02 2611 -021 Ferro-alloys
2611 -03 2611 -031 Crude steel (converters)
2611 -04 2611 -041 Crude steel (electric furnaces)
2612 -011P Scrap iron 2612 Scrap iron
2621 -01 Hot rolled steel 2621 Hot rolled steel 262 Steel products
2621 -011 Section steel (ordinary steel)
2621 -012 Steep plate (ordinary steel)
2621 -013 Steel strip (ordinary steel)
2621 -014 Steel bar (ordinary steel)
2621 -015 Miscellaneous hot rolled steel (ordinary steel)
2621 -016 Hot rolled steel (special steel)
2622 -01 Steel pipes and tubes 2622 Steel pipes and tubes
2622 -011 Steel pipes and tubes (ordinary steel)
2622 -012 Steel pipes and tubes (special steel)
Miscellaneous ceramic,
stone and clay products
Miscellaneous ceramic,
stone and clay products
Ceramic, stone and clay
products
Cement and cement
products
Cement and cement
products
Pottery, china and
earthenware
Pottery, china and
earthenware
Petroleum refinery products
Plastic products and rubber
products
Miscellaneous rubber
products
Tanned leather, leather
products and fur skins
(except leather footwear)
Tanned leather, leather
products and fur skins
Miscellaneous
manufacturing products
Petroleum refinery products Petroleum and coal
products
Paint and varnishes,
printing ink
Miscellaneous final
chemical products
- 118 -

187 Sector Classification 107 Sector Classification1 Basic Sector Classification (509 Rows x 391 Columns)
37 Sector Classification
2 Aggregated Sector Classification
Sector Name Code Sector NameColumn Code Row Code
Classification CodeSector Name Code Sector Name Code
2623 -01 Cold-finished steel 2623
2623 -011 Cold-finished steel (ordinary steel)
2623 -012 Cold-finished steel (special steel)
2623 -02 2623 -021 Coated steel
2631 -01 Cast and forged steel 2631 263
2631 -011 Forged steel
2631 -012 Cast steel
2631 -02 2631 -021 Cast iron pipes and tubes
2631 -03 Cast and forged materials (iron)
2631 -031 Cast materials (iron)
2631 -032 Forged materials (iron)
2699 -01 2699 -011 Iron and steel shearing and slitting 2699 269
2699 -09 2699 -099 Miscellaneous iron or steel products
2711 -01 2711 -011 Copper 2711 Non-ferrous metals 271 Non-ferrous metals 27 Non-ferrous metals
2711 -02 2711 -021 Lead and zinc (including regenerated lead)
2711 -03 2711 -031 Aluminum (including regenerated aluminum)
2711 -09 2711 -099 Miscellaneous non-ferrous metals
2712 -011P Non-ferrous metal scrap 2712 Non-ferrous metal scrap
2721 -01 2721 -011 Electric wires and cables 2721 Electric wires and cables 272 Non-ferrous metal products
2721 -02 2721 -021 Optical fiber cables
2729 -01 2729 -011 Rolled and drawn copper and copper alloys 2729
2729 -02 2729 -021 Rolled and drawn aluminum
2729 -03 2729 -031 Non-ferrous metal castings and forgings
2729 -04 2729 -041 Nuclear fuels
2729 -09 2729 -099 Miscellaneous non-ferrous metal products
2811 -01 2811 -011 Fabricated construction-use metal products 2811 Fabricated construction-use
metal products
281 28 Metal products
2812 -01 2812 -011 Fabricated architectural metal products 2812 Fabricated architectural
metal products
2891 -01 2891 -011 Gas and oil appliances, heating and cooking
apparatus
2891 Gas and oil appliances,
heating and cooking
apparatus
289 Miscellaneous metal
products
2899 -01 2899 -011 Bolts, nuts, rivets and springs 2899
2899 -02 2899 -021 Metal containers, fabricated plate and sheet metal
2899 -03 Plumbing accessories, powder metallurgy products
and tools
2899 -031 Plumbing accessories
2899 -032 Powder metallurgy products
2899 -033 Cutlery and tools
2899 -09 Miscellaneous metal products
2899 -091 Stamped and pressed metal products
2899 -092 Fabricated wire products
2899 -099 Metal products, n.e.c.
2911 -01 2911 -011 Boilers 2911 Boilers and Engines 291 General-purpose machinery 29
2911 -02 2911 -021 Turbines
2911 -03 2911 -031 Engines
2912 -01 2912 -011 Pumps and compressors 2912 Pumps and compressors
2913 -01 2913 -011 Conveyors 2913 Conveyors
2914 -01 2914 -011 Refrigerators and air conditioning apparatus2914
Refrigerators and air
conditioning apparatus
2919 -01 2919 -011 Bearings 2919
2919 -09 Miscellaneous general-purpose machinery
2919 -091 Mechanical power transmission equipment
2919 -099 General-purpose machinery, n.e.c.
3011 -01 3011 -011 Machinery for agricultural use 3011 Machinery for agricultural
use
301 Production machinery 30 Production machinery
3012 -01 3012 -011 Machinery and equipment for construction and
mining
3012 Machinery and equipment for
construction and mining
3013 -01 3013 -011 Textile machinery 3013 Textile machinery
3014 -01 Daily lives industry machinery 3014
3014 -011 Food processing machinery and equipment
3014 -012 Wood working machinery
3014 -013 Pulp equipment and paper machinery
3014 -014 Printing, bookbinding and paper-converting
machinery
3014 -015 Packing machinery
3015 -01 3015 -011 Chemical machinery 3015
3015 -02 Casting equipment and plastic processing
machinery
3015 -021 Casting equipment
3015 -022 Plastic processing machinery
3016 -01 3016 -011 Metal machine tools 3016
3016 -02 3016 -021 Metal processing machinery
3016 -03 3016 -031 Machinists' precision tools
3017 -01 3017 -011 Semiconductor making equipment 3017 Semiconductor making
equipment
Miscellaneous general-
purpose machinery
Daily lives industry
machinary
Basic material industry
machinery
Metal processing
machinery
Miscellaneous iron or steel
products
Miscellaneous iron or steel
products
Miscellaneous non-ferrous
metal products
Fabricated constructional
and architectural metal
products
Miscellaneous metal
products
Cold-finished steel, coated
steel
Cast and forged steel
products (iron)
Cast and forged steel
products (iron)
General-purpose machinery
- 119 -

187 Sector Classification 107 Sector Classification1 Basic Sector Classification (509 Rows x 391 Columns)
37 Sector Classification
2 Aggregated Sector Classification
Sector Name Code Sector NameColumn Code Row Code
Classification CodeSector Name Code Sector Name Code
3019 -01 3019 -011 Metal molds 3019
3019 -02 3019 -021 Vacuum equipment and vacuum component
3019 -03 3019 -031 Robots
3019 -09 3019 -099 Miscellaneous production machinery
3111 -01 3111 -011 Copy machine 3111 Office machines 311 31
3111 -09 3111 -099 Miscellaneous office machines
3112 -01 Service industry and amusement machines 3112
3112 -011 Vending machines
3112 -012 Amusement machinery
3112 -019 Miscellaneous machinery for service industry
3113 -01 3113 -011 Measuring instruments 3113 Measuring instruments
3114 -01 3114 -011 Medical instruments 3114 Medical instruments
3115 -01 3115 -011 Optical instruments and lenses 3115 Optical instruments and
lenses
3116 -01 3116 -011 Ordnance 3116 Ordnance
3211 -01 3211 -011 Semiconductor devices 3211 Electronic devices 321 Electronic devices 32 Electronic components
3211 -02 3211 -021 Integrated circuits
3211 -03 3211 -031 Liquid crystal panel
3211 -04 3211 -041 Flat-panel and electron tubes
3299 -01 3299 -011 Storage media 3299 329
3299 -02 3299 -021 Electric circuit
3299 -09 3299 -099 Miscellaneous electronic components
3311 -01 Rotating electrical equipment 3311 331 Electrical devices and parts 33 Electrical machinery
3311 -011 Generators
3311 -012 Electric motors
3311 -02 3311 -021 Transformers and reactors
3311 -03 3311 -031 Relay switches and switchboards
3311 -04 3311 -041 Wiring devices and supplies
3311 -05 3311 -051 Electrical equipment for internal combustion
engines
3311 -09 3311 -099 Miscellaneous electrical devices and parts
3321 -01 3321 -011 Household air-conditioners 3321 332
3321 -02 3321 -021 Household electric appliances (except air-
conditioners)
3331 -01 3331 -011 Applied electronic equipment 3331 Applied electronic
equipment
333
3332 -01 3332 -011 Electric measuring instruments 3332 Electric measuring
instruments
3399 -01 3399 -011 Electric bulbs 3399 339
3399 -02 3399 -021 Electric lighting fixtures and apparatus
3399 -03 3399 -031 Batteries
3399 -09 3399 -099 Miscellaneous electrical devices and parts
3411 -01 3411 -011 Wired communication equipment 3411 341 34
3411 -02 3411 -021 Mobile phone
3411 -03 3411 -031 Radio communication equipment (except mobile
phone)
3411 -04 3411 -041 Radio and television sets
3411 -09 3411 -099 Miscellaneous communication equipment
3412 -01 3412 -011 Video equipment and digital camera 3412
3412 -02 3412 -021 Electric audio equipment
3421 -01 3421 -011 Personal Computers 3421 342
3421 -02 3421 -021 Electronic computing equipment (except personal
computers)
3421 -03 3421 -031 Electronic computing equipment (accessory
equipment)
3511 -01 3511 -011 Passenger motor cars 3511 Passenger motor cars 351 Passenger motor cars 35 Transportation equipment
3521 -01 3521 -011 Trucks, buses and miscellaneous cars 3521 Trucks, buses and
miscellaneous cars
352 Miscellaneous cars
3522 -01 3522 -011 Two-wheel motor vehicles 3522 Two-wheel motor vehicles
3531 -01 3531 -011 Internal combustion engines for motor vehicles 3531 353
3531 -02 3531 -021 Motor vehicle parts and accessories
3541 -01 3541 -011 Steel ships 3541 Ships and repair of ships 354 Ships and repair of ships
3541 -02 3541 -021 Miscellaneous Ships (except steel ships)
3541 -03 3541 -031 Internal combustion engines for vessels
3541 -10 3541 -101 Repair of ships
3591 -01 3591 -011 Rolling stock 3591 359
3591 -10 3591 -101 Repair of rolling stock
3592 -01 3592 -011 Aircrafts 3592
3592 -10 3592 -101 Repair of aircrafts
3599 -01 3599 -011 Bicycles 3599
3599 -09 Miscellaneous transport equipment
3599 -091 Transport equipment for industrial use
3599 -099 Transpot equipment, n.e.c.
Communication, image and
audio equipment
Electronic computing
equipment and accessory
equipment of electronic
computing equipment
Electronic computing
equipment and accessory
equipment of electronic
computing equipment
Miscellaneous
transportation equipment
and repair of transportation
equipment
Information and
communication electronics
equipment
Motor vehicle parts and
accessories
Motor vehicle parts and
accessories
Rolling stock and repair of
rolling stock
Aircrafts and repair of air
crafts
Miscellaneous transport
equipment
Communication equipment
Image and audio equipment
Applied electronic
equipment and electric
measuring instruments
Household electric
appliances
Miscellaneous production
machinery
Business oriented
machinery
Miscellaneous electrical
machinery
Miscellaneous electrical
machinery
Business oriented
machinery
Household electric
appliances
Service industry and
amusement machines
Miscellaneous electronic
components
Miscellaneous electronic
components
Electrical devices and parts
- 120 -

187 Sector Classification 107 Sector Classification1 Basic Sector Classification (509 Rows x 391 Columns)
37 Sector Classification
2 Aggregated Sector Classification
Sector Name Code Sector NameColumn Code Row Code
Classification CodeSector Name Code Sector Name Code
3911 -01 3911 -011 Toys and games 3911 391 39
3911 -02 3911 -021 Sporting and athletic goods
3919 -01 3919 -011 Jewelry and adornments 3919
3919 -02 3919 -021 Watches and clocks
3919 -03 3919 -031 Musical instruments
3919 -04 3919 -041 Stationery
3919 -05 3919 -051 "Tatami" (straw matting) and straw products
3919 -06 3919 -061 Audio and video records, other information
recording media
3919 -09 3919 -099 Miscellaneous manufacturing products
3921 -01 3921 -011 Reuse and recycling 3921 Reuse and recycling 392 Reuse and recycling
4111 -01 4111 -011 Residential construction (wooden) 4111 Residential construction 411 Building construction 41 Construction
4111 -02 4111 -021 Residential construction (non-wooden)
4112 -01 4112 -011 Non-residential construction (wooden) 4112
4112 -02 4112 -021 Non-residential construction (non-wooden)
4121 -01 4121 -011 Repair of construction 4121 Repair of construction 412 Repair of construction
4131 -01 4131 -011 Public construction of roads 4131 Public construction 413 Public construction
4131 -02 4131 -021 Public construction of rivers, drainages and
miscellaneous public construction
4131 -03 4131 -031 Agricultural public construction
4191 -01 4191 -011 Railway construction 4191 419
4191 -02 4191 -021 Electric power facilities construction
4191 -03 4191 -031 Telecommunication facilities construction
4191 -09 4191 -099 Miscellaneous civil engineering and construction
4611 -001 Electricity 4611 Electricity 461 Electricity 46
4611 -01 Electricity (thermal power)
4611 -02 Electricity (except thermal power)
4611 -03 4611 -031 Private power generation
4621 -01 4621 -011 Gas supply 4621 Gas supply 462 Gas and heat supply
4622 -01 4622 -011 Steam and hot water supply 4622 Steam and hot water supply
4711 -01 4711 -011 Water supply 4711 Water supply 471 Water supply 47 Water supply
4711 -02 4711 -021 Industrial water supply
4711 -03 4711 -031 Sewage disposal **
4811 -01 4811 -011 Waste management services (public corporation) ** 4811 Waste management service 481 Waste management service 48 Waste management service
4811 -02 4811 -021 Waste management services
5111 -01 5111 -011 Wholesale trade 5111 Wholesale trade 511 Commerce 51 Commerce
5112 -01 5112 -011 Retail trade 5112 Retail trade
5311 -01 Financial service 5311 Financial service 531 Finance and insurance 53 Finance and insurance
5311 -011 Financial service (FISIM), public
5311 -012 Financial service (FISIM), private
5311 -013 Financial service (commission), public
5311 -014 Financial service (commission), private
5312 -01 5312 -011 Life insurance 5312 Insurance
5312 -02 5312 -021 Non-life insurance
5511 -01 5511 -011 Real estate agencies and managers 5511 551 55 Real estate
5511 -02 5511 -021 Real estate rental service
5521 -01 5521 -011 House rent 5521 House rent 552 House rent
5531 -01 5531 -011 House rent (imputed house rent) 5531 House rent (imputed house
rent)
553 House rent (imputed house
rent)
5711 -01 5711 -011 Railway transport (passengers) 5711 Railway transport
(passengers)
571 Railway transport 57 Transport and postal
services
5712 -01 5712 -011 Railway transport (freight) 5712 Railway transport (freight)
5721 -01 5721 -011 Bus transport service 5721 Road transport service 572
5721 -02 5721 -021 Hired car and taxi transport
5722 -01 5722 -011 Road freight transport (except self-transport) 5722 Road freight transport
(except self-transport)
5731 -01P 5731 -011P Self-transport (passengers) 5731 Self-transport (passengers) 573 Self-transport
5732 -01P 5732 -011P Self-transport (freight) 5732 Self-transport (freight)
5741 -01 5741 -011 International shipping 5741 International shipping 574 Water transport
5742 -01 Coastal and inland water transport 5742
5742 -011 Coastal and inland water transport (passengers)
5742 -012 Coastal and inland water transport (freight)
5743 -01 5743 -011 Harbor transport service 5743 Harbor transport service
5751 -01 Air transport 5751 Air transport 575 Air transport
5751 -011 International air transport
5751 -012 Domestic air transport (passengers)
5751 -013 Domestic air transport (freight)
5751 -014 Aircraft service except air transport
5761 -01 5761 -011 Consigned freight forwarding 5761 Freight forwarding 576 Freight forwarding
5771 -01 5771 -011 Storage facility service 5771 Storage facility service 577 Storage facility service
Electricity, gas and heat
supply
Real estate agencies and
rental services
Real estate agencies and
rental services
Road transport (except self-
transport)
Miscellaneous
manufacturing products
Coastal and inland water
transport
Non-residential
construction
Miscellaneous civil
engineering and
construction
Miscellaneous civil
engineering and
construction
Toys and games, sporting
and athletic goods
Miscellaneous
manufacturing products
Miscellaneous
manufacturing products
- 121 -

187 Sector Classification 107 Sector Classification1 Basic Sector Classification (509 Rows x 391 Columns)
37 Sector Classification
2 Aggregated Sector Classification
Sector Name Code Sector NameColumn Code Row Code
Classification CodeSector Name Code Sector Name Code
5781 -01 5781 -011 Packing service 5781 Packing service 578
5789 -01 5789 -011 Facility service for road transport 5789
5789 -02 5789 -021 Port and water traffic control (public corporation)
**
5789 -03 5789 -031 Port and water traffic control
5789 -04 5789 -041 Services relating to water transport
5789 -05 5789 -051 Airport and air traffic control (public corporation)
**
5789 -06 5789 -061 Airport and air traffic control
5789 -07 5789 -071 Services relating to air transport
5789 -09 5789 -099 Travel agency and miscellaneous services relating to
transport
5791 -01 5791 -011 Postal services and mail delivery 5791 Postal services and mail
delivery
579 Postal services and mail
delivery
5911 -01 5911 -011 Fixed telecommunications 5911 Communications 591 Communications 59
5911 -02 5911 -021 Mobile telecommunications
5911 -03 5911 -031 Services relating to telecommunications
5921 -01 5921 -011 Public broadcasting 5921 Broadcasting 592 Broadcasting
5921 -02 5921 -021 Private broadcasting
5921 -03 5921 -031 Cable broadcasting
5931 -01 Information services 5931 Information services 593 Information services
5931 -011 Computer programming and miscellaneous
software services
5931 -012 Data processing, research and information services
5941 -01 5941 -011 Internet based services 5941 Internet based services 594 Internet based services
5951 -01 5951 -011 Video picture, sound information, character
information production (except newspaper or
publication)
5951 Image information, sound
information and character
information production
595 Image information, sound
information and character
information production
5951 -02 5951 -021 Newspaper
5951 -03 5951 -031 Publication
6111 -01 6111 -011 Public administration (central government) ** 6111 Public administration
(central government)
611 Public administration 61 Public administration
6112 -01 6112 -011 Public administration (local government) ** 6112 Public administration (local
government)
6311 -01 6311 -011 School education (public institution) ** 6311 School education 631 Education 63 Education and research
6311 -02 6311 -021 School education (NPI) *
6311 -03 6311 -031 School lunch (public institution) **
6311 -04 6311 -041 School lunch (NPI) *
6312 -01 6312 -011 Social education (public institution) ** 6312
6312 -02 6312 -021 Social education (NPI) *
6312 -03 6312 -031 Miscellaneous educational and training institutions
(public institution) **
6312 -04 6312 -041 Miscellaneous educational and training institutions
6321 -01 6321 -011 Research institutes for natural science (public
institution) **
6321 Research institutes 632 Research
6321 -02 6321 -021 Research institutes for cultural and social science
(public institution) **
6321 -03 6321 -031 Research institutes for natural sciences (NPI) *
6321 -04 6321 -041 Research institutes for cultural and social science
(NPI) *
6321 -05 6321 -051 Research institutes for natural sciences
6321 -06 6321 -061 Research institutes for cultural and social science
6322 -01 6322 -011 Research and development (intra-enterprise) 6322 Research and development
6411 -01 6411 -011 Medical service (hospitalization) 6411 Medical service 641 Medical service 64
6411 -02 6411 -021 Medical service (except hospitalization)
6411 -03 6411 -031 Medical service (dentistry)
6411 -04 6411 -041 Medical service (pharmacy dispensing)
6411 -05 6411 -051 Medical service (miscellaneous medical service)
6421 -01 6421 -011 Health and hygiene (public institution) ** 6421 Health and hygiene 642 Health and hygiene6421 -02 6421 -021 Health and hygiene
6431 -01 6431 -011 Social insurance ** 6431 643
6431 -02 6431 -021 Social welfare (public institution) **
6431 -03 6431 -031 Social welfare (NPI) *
6431 -04 6431 -041 Social welfare
6431 -05 6431 -051 Nursery
6441 -01 6441 -011 Nursing care (facility services) 6441 Nursing care 644 Nursing care
6441 -02 6441 -021 Nursing care (except facility services)
6599 -01 6599 -011 Membership-based business associations 6599 659 65
6599 -02 6599 -021 Private non-profit institutions serving households,
n.e.c. *
Medical, health care and
welfare
Social insurance and social
welfare
Membership-based
associations, n.e.c.
Membership-based
associations, n.e.c.
Membership-based
associations, n.e.c.
Services relating to
transport
Information and
communications
Social education and
miscellaneous educational
and training
Social insurance and social
welfare
Miscellaneous services
relating to transport
- 122 -

187 Sector Classification 107 Sector Classification1 Basic Sector Classification (509 Rows x 391 Columns)
37 Sector Classification
2 Aggregated Sector Classification
Sector Name Code Sector NameColumn Code Row Code
Classification CodeSector Name Code Sector Name Code
6611 -01 Goods rental and leasing (except car rental) 6611 661 66 Business services
6611 -011 Industrial equipment and machinery rental and
leasing (except construction machinery)
6611 -012 Construction machine rental and leasing
6611 -013 Electronic computing equipment rental and leasing
6611 -014 Office machines rental and leasing (except
electronic computing equipment)
6611 -015 Sports goods, recreation goods and miscellaneous
goods rental and leasing
6612 -01 6612 -011 Car rental and leasing 6612 Car rental and leasing
6621 -01 Advertising services 6621 Advertising services 662 Advertising services
6621 -011 Television and radio advertising services
6621 -012 Newspaper, magazine and miscellaneous
advertising services
6631 -10 6631 -101 Motor vehicle maintenance services 6631 Motor vehicle maintenance
services
663 Motor vehicle maintenance
and machine repair services
6632 -10 6632 -101 Machine repair services 6632 Machine repair services
6699 -01 6699 -011 Judicial, financial and accounting services 6699 669
6699 -02 6699 -021 Civil engineering and construction services
6699 -03 6699 -031 Worker dispatching services
6699 -04 6699 -041 Building maintenance services
6699 -05 6699 -051 Guard services
6699 -09 6699 -099 Miscellaneous business services
6711 -01 6711 -011 Hotels 6711 Hotels 671 Hotels 67 Personal services
6721 -01 6721 -011 Eating and drinking places 6721 672
6721 -02 6721 -021 Food take out and delivery services
6731 -01 6731 -011 Cleaning 6731 673
6731 -02 6731 -021 Barber shops
6731 -03 6731 -031 Beauty shops
6731 -04 6731 -041 Public baths
6731 -09 6731 -099 Miscellaneous cleaning, barber shops, beauty shops
and public baths
6741 -01 6741 -011 Movie theaters 6741 674
6741 -02 6741 -021 Performances (except movie theaters), theatrical
comranies
6741 -03 6741 -031 Stadiums and companies of bicycle, horse, motorcar
and motorboat races
6741 -04 6741 -041 Sport facility service, public gardens and
amusement parks
6741 -05 6741 -051 Amusement and recreation facilities
6741 -09 6741 -099 Miscellaneous amusement and recreation services
6799 -01 6799 -011 Photographic studios 6799 679
6799 -02 6799 -021 Ceremonial occasions
6799 -03 6799 -031 Supplementary tutorial schools, instruction services
for arts, culture and technical skills
6799 -04 6799 -041 Miscellaneous repairs, n.e.c.
6799 -09 6799 -099 Miscellaneous personal services
6811 -00P 6811 -000P Office supplies 6811 Office supplies 681 Office supplies 68 Office supplies
6911 -00 6911 -000 Activities not elsewhere classified 6911 Activities not elsewhere
classified
691 Activities not elsewhere
classified
69 Activities not elsewhere
classified
7000 -00 7000 -000 Total of intermediate sectors 7000 Total of intermediate
sectors
700 Total of intermediate
sectors
70 Total of intermediate
sectors
(Notes)
1. Meanings of the symbols are as follows;
**: general government sector
*: non-profit institutions, or NPIs sector
2. "P" which placed next to the last digit of the Basic Sector Classification Code means "Dummy sector (provisional sector)".
Miscellaneous business
services
Amusement and
recreational services
Amusement and
recreational services
Miscellaneous personal
services
Miscellaneous personal
services
Goods rental and leasing
(except car rental)
Goods rental and leasing
services
Miscellaneous business
services
Cleaning, barber shops,
beauty shops and public
baths
Cleaning, barber shops,
beauty shops and public
baths
Eating and drinking
services
Eating and drinking
services
- 123 -

Final Demand Sectors
7111 -00 Consumption expenditure outside households
(column)
7111 Consumption expenditure
outside households (column)
711 Consumption expenditure
outside households (column)
71 Consumption expenditure
outside households (column)
7211 -00 Consumption expenditure of households 7211 Consumption expenditure
of households
721 72
7212 -00 Consumption expenditure of private non-profit
institutions serving households
7212 Consumption expenditure
of private non-profit
institutions serving
households
7311 -01 Collective consumption expenditure of central government 7311 731 73
7311 -02 Collective consumption expenditure of local government
7311 -03 Individual consumption expenditure of central government
7311 -04 Individual consumption expenditure of local government
7321 -01 Collective consumption expenditure of central
government (CFC of social fixed capital)
7321 732
7321 -02 Collective consumption expenditure of local
government (CFC of social fixed capital)
7321 -03 Individual consumption expenditure of central
government (CFC of social fixed capital)
7321 -04 Individual consumption expenditure of local
government (CFC of social fixed capital)
7411 -00 Gross domestic fixed capital formation (public
sector)
7411 Gross domestic fixed
capital formation (public
sector)
741 Gross domestic fixed
capital formation (public
sector)
74 Gross domestic fixed
capital formation (public
sector)
7511 -00 Gross domestic fixed capital formation (private
sector)
7511 Gross domestic fixed
capital formation (private
sector)
751 Gross domestic fixed
capital formation (private
sector)
75 Gross domestic fixed
capital formation (private
sector)
7611 -01 Increase in producer's stocks of finished goods 7611 Increase in stocks 761 Increase in stocks 76 Increase in stocks
7611 -02 Increase in semi-finished goods and work-in-progress
7611 -03 Increase in dealer's stocks of goods
7611 -04 Increase in stocks of raw materials and supplies
7800 -00 Total domestic final demand 7800 Total domestic final demand 780 Total domestic final demand 78 Total domestic final demand
7900 -00 Total domestic demand 7900 Total domestic demand 790 Total domestic demand 79 Total domestic demand
8011 -01 Exports (ordinary trade) 8011 Exports 801 Exports 80 Exports
8011 -02 Exports (special trade)
8012 -00 Exports (direct purchase) 8012 Exports (direct purchase)
8100 -00 Exports total 8100 Exports total 810 Exports total 81 Exports total
8200 -00 Total Final demand 8200 Total Final demand 820 Total Final demand 82 Total Final demand
8300 -00 Total demand 8300 Total demand 830 Total demand 83 Total demand
8411 -01 (less) Imports (ordinary trade) 8411 (less) Imports 841 (less) Imports 84 (less) Imports
8411 -02 (less) Imports (special trade)
8412 -00 (less) Imports (direct purchase) 8412 (less) Imports (direct
purchase)
8511 -00 (less) Custom duties 8511 (less) Custom duties 851 (less) Custom duties 85 (less) Custom duties
8611 -00 (less) Commodity taxes on imported goods 8611 (less) Commodity taxes on
imported goods
861 (less) Commodity taxes on
imported goods
86 (less) Commodity taxes on
imported goods
8700 -00 (less) Total imports 8700 (less) Total imports 870 (less) Total imports 87 (less) Total imports
8800 -00 Total of final demand sectors 8800 Total of final demand sectors 880 Total of final demand sectors 88 Total of final demand sectors
8911 -00 Trade margins (wholesale) 8911 Trade margins (wholesale) 891 Trade margins 89 Trade margins
8912 -00 Trade margins (retail) 8912 Trade margins (retail)
9011 -00 Transportation charges (railway) 9011 Transportation charges
(railway)
901 Transportation charges 90 Transportation charges
9012 -00 Transportation charges (road) 9012 Transportation charges
(road)
9013 -01 Transportation charges (coastal and inland water) 9013
9013 -02 Transportation charges (harbor)
9014 -00 Transportation charges (air) 9014 Transportation charges (air)
9015 -00 Transportation charges (forwarding) 9015 Transportation charges
(forwarding)
9016 -00 Transportation charges (storage facility) 9016 Transportation charges
(storage facility)
9700 -00 Domestic production (gross outputs) 9700 Domestic production (gross
outputs)
970 Domestic production (gross
outputs)
97 Domestic production (gross
outputs)
Consumption expenditure
of general government
(CFC of social fixed
capital)
Consumption expenditure
of general government
(CFC of social fixed
capital)
Consumption expenditure
(private)
Consumption expenditure
(private)
Consumption expenditure
of general government
Consumption expenditure
of general government
Consumption expenditure
of general government
Transportation charges
(coastal and inland water)
1 Basic Sector Classification2 Aggregated Sector Classification
Code Sector NameClassification Code
Sector Name Code Sector NameColumn Code Row Code
Code
187 Sector Classification 107 Sector Classification 37 Sector Classification
Sector Name
- 124 -
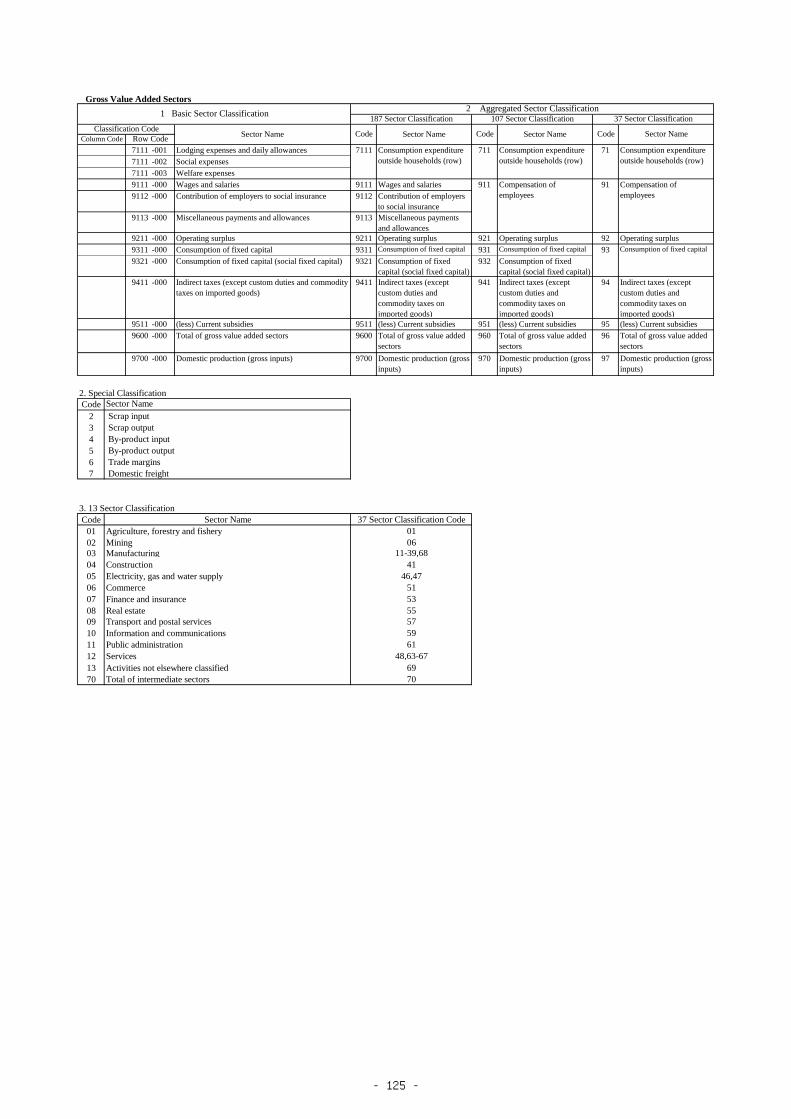
Gross Value Added Sectors
7111 -001 Lodging expenses and daily allowances 7111 711 71
7111 -002 Social expenses
7111 -003 Welfare expenses
9111 -000 Wages and salaries 9111 Wages and salaries 911 91
9112 -000 Contribution of employers to social insurance 9112 Contribution of employers
to social insurance
9113 -000 Miscellaneous payments and allowances 9113 Miscellaneous payments
and allowances
9211 -000 Operating surplus 9211 Operating surplus 921 Operating surplus 92 Operating surplus
9311 -000 Consumption of fixed capital 9311 Consumption of fixed capital 931 Consumption of fixed capital 93 Consumption of fixed capital
9321 -000 Consumption of fixed capital (social fixed capital) 9321 Consumption of fixed
capital (social fixed capital)
932 Consumption of fixed
capital (social fixed capital)
9411 -000 Indirect taxes (except custom duties and commodity
taxes on imported goods)
9411 Indirect taxes (except
custom duties and
commodity taxes on
imported goods)
941 Indirect taxes (except
custom duties and
commodity taxes on
imported goods)
94 Indirect taxes (except
custom duties and
commodity taxes on
imported goods)
9511 -000 (less) Current subsidies 9511 (less) Current subsidies 951 (less) Current subsidies 95 (less) Current subsidies
9600 -000 Total of gross value added sectors 9600 Total of gross value added
sectors
960 Total of gross value added
sectors
96 Total of gross value added
sectors
9700 -000 Domestic production (gross inputs) 9700 Domestic production (gross
inputs)
970 Domestic production (gross
inputs)
97 Domestic production (gross
inputs)
Code
2
3
4
5
6
7
3. 13 Sector Classification
Code
01 Agriculture, forestry and fishery
02 Mining
03 Manufacturing
04 Construction
05 Electricity, gas and water supply
06 Commerce
07 Finance and insurance
08 Real estate
09 Transport and postal services
10 Information and communications
11 Public administration
12 Services
13 Activities not elsewhere classified
70
69
Total of intermediate sectors 70
53
55
57
59
61
48,63-67
Sector Name
Scrap input
51
By-product input
By-product output
Trade margins
Domestic freight
Sector Name 37 Sector Classification Code
01
06
11-39,68
41
46,47
Scrap output
Code Sector NameColumn Code Row Code
2. Special Classification
Compensation of
employees
Compensation of
employees
Consumption expenditure
outside households (row)
Consumption expenditure
outside households (row)
Consumption expenditure
outside households (row)
Classification CodeSector Name Code Sector Name Code Sector Name
1 Basic Sector Classification2 Aggregated Sector Classification
187 Sector Classification 107 Sector Classification 37 Sector Classification
- 125 -

〔Reference 4〕
Code Sector name Code Name
0111 Grains 0111 Growing of cereals (except rice), leguminous crops and oil seeds ( 1/3 )
0112 Growing of rice
0112 Potatoes, beans 0111 Growing of cereals (except rice), leguminous crops and oil seeds ( 2/3 )
0113 Growing of vegetables and melons, roots and tubers ( 1/4 )
0113 Vegetables 0113 Growing of vegetables and melons, roots and tubers ( 2/4 )
0114 Fruits 0121 Growing of grapes
0122 Growing of tropical and subtropical fruits
0123 Growing of citrus fruits
0124 Growing of pome fruits and stone fruits
0125 Growing of other tree and bush fruits and nuts
0115 Miscellaneous edible crops 0111 Growing of cereals (except rice), leguminous crops and oil seeds ( 3/3 )
0113 Growing of vegetables and melons, roots and tubers ( 3/4 )
0114 Growing of sugar cane
0126 Growing of oleaginous fruits
0127 Growing of beverage crops
0128 Growing of spices, aromatic, drug and pharmaceutical crops ( 1/2 )
0116 Inedible crops 0115 Growing of tobacco
0116 Growing of fibre crops
0119 Growing of other non-perennial crops
0128 Growing of spices, aromatic, drug and pharmaceutical crops ( 2/2 )
0129 Growing of other perennial crops
0130 Plant propagation
0164 Seed processing for propagation
0121 Livestock 0141 Raising of cattle and buffaloes
0142 Raising of horses and other equines
0143 Raising of camels and camelids
0144 Raising of sheep and goats
0145 Raising of swine/pigs
0146 Raising of poultry
0149 Raising of other animals
0131 Agricultural services 0161 Support activities for crop production
0162 Support activities for animal production
0163 Post-harvest crop activities
7500 Veterinary activities
0151 Silviculture 0210 Silviculture and other forestry activities
0240 Support services to forestry ( 1/3 )
0152 Logs 0220 Logging ( 1/2 )
0240 Support services to forestry ( 2/3 )
0153 Special forest products 0113 Growing of vegetables and melons, roots and tubers ( 4/4 )
0170 Hunting, trapping and related service activities
0220 Logging ( 2/2 )
0230 Gathering of non-wood forest products
0240 Support services to forestry ( 3/3 )
0171 Marine fishery 0311 Marine fishing
0321 Marine aquaculture
0172 Inland water fishery 0312 Freshwater fishing
0322 Freshwater aquaculture
0611 Coal mining, crude petroleum and natural gas 0510 Mining of hard coal0520 Mining of lignite0610 Extraction of crude petroleum0620 Extraction of natural gas0892 Extraction of peat0910 Support activities for petroleum and natural gas extraction
0621 Gravel and quarrying 0810 Quarrying of stone, sand and clay ( 1/2 )
0990 Support activities for other mining and quarrying ( 1/2 )
2396 Cutting, shaping and finishing of stone ( 1/3 )
0629 Miscellaneous ores 0710 Mining of iron ores
0721 Mining of uranium and thorium ores
0729 Mining of other non-ferrous metal ores
0810 Quarrying of stone, sand and clay ( 2/2 )
0891 Mining of chemical and fertilizer minerals
0899 Other mining and quarrying n.e.c.
0990 Support activities for other mining and quarrying ( 2/2 )
1111 Dairy products 1010 Processing and preserving of meat ( 1/2 )
1050 Manufacture of dairy products
1112 Processed seafood 1020 Processing and preserving of fish, crustaceans and molluscs ( 1/2 )
1113 Grain milling 1061 Manufacture of grain mill products
1114 Noodles, bread, confectionery 1071 Manufacture of bakery products ( 1/2 )
1073 Manufacture of cocoa, chocolate and sugar confectionery
1074 Manufacture of macaroni, noodles, couscous and similar farinaceous products
1079 Manufacture of other food products n.e.c. ( 1/4 )
1115 Preserved agricultural food stuffs 1030 Processing and preserving of fruit and vegetables ( 1/3 )
Coressponding Table of Minor Aggregated Classification in 2015 Input-Output Tables and International Standard Industrial classification
Minor Aggregated Classification in 2015 Input-Output Tables ISIC(Rev.4)
- 126 -

Code Sector name Code Name
Minor Aggregated Classification in 2015 Input-Output Tables ISIC(Rev.4)
1116 Sugar, oils, condiments and seasoning 1010 Processing and preserving of meat ( 2/2 )
1040 Manufacture of vegetable and animal oils and fats ( 1/2 )
1062 Manufacture of starches and starch products
1072 Manufacture of sugar
1079 Manufacture of other food products n.e.c. ( 2/4 )
1119 Miscellaneous foods 1030 Processing and preserving of fruit and vegetables ( 2/3 )
1075 Manufacture of prepared meals and dishes
1079 Manufacture of other food products n.e.c. ( 3/4 )
1121 Liquors 1101 Distilling, rectifying and blending of spirits
1102 Manufacture of wines
1103 Manufacture of malt liquors and malt
1129 Miscellaneous drinks 1030 Processing and preserving of fruit and vegetables ( 3/3 )
1079 Manufacture of other food products n.e.c. ( 4/4 )
1104 Manufacture of soft drinks; production of mineral waters and other bottled
waters
3530 Steam and air conditioning supply ( 1/2 )
1131 Feeds and organic fertilizers, n.e.c. 1020 Processing and preserving of fish, crustaceans and molluscs ( 2/2 )
1040 Manufacture of vegetable and animal oils and fats ( 2/2 )
1080 Manufacture of prepared animal feeds
3821 Treatment and disposal of non-hazardous waste ( 1/2 )
1141 Tobacco 1200 Manufacture of tobacco products
1511 Fiber yarns 1311 Preparation and spinning of textile fibres ( 1/2 )
1512 Fiber fabrics 1312 Weaving of textiles ( 1/2 )
1399 Manufacture of other textiles n.e.c. ( 1/4 )
2219 Manufacture of other rubber products ( 1/3 )
1513 Knitting fabrics 1391 Manufacture of knitted and crocheted fabrics
1514 Yarn and fabric dyeing and finishing 1313 Finishing of textiles ( 1/2 )
1430 Manufacture of knitted and crocheted apparel ( 1/3 )
1519 Miscellaneous fabricated textile products 1311 Preparation and spinning of textile fibres ( 2/2 )
1394 Manufacture of cordage, rope, twine and netting
1399 Manufacture of other textiles n.e.c. ( 2/4 )
1521 Woven fabric and knitted Apparel 1410 Manufacture of wearing apparel, except fur apparel ( 1/4 )
1430 Manufacture of knitted and crocheted apparel ( 2/3 )
1522 1410 Manufacture of wearing apparel, except fur apparel ( 2/4 )
1420 Manufacture of articles of fur
1430 Manufacture of knitted and crocheted apparel ( 3/3 )
1529 Miscellaneous ready-made textile products 1312 Weaving of textiles ( 2/2 )
1392 Manufacture of made-up textile articles, except apparel ( 1/2 )
1393 Manufacture of carpets and rugs
1399 Manufacture of other textiles n.e.c. ( 3/4 )
1709 Manufacture of other articles of paper and paperboard ( 1/4 )
3250 Manufacture of medical and dental instruments and supplies ( 1/6 )
1611 Lumber 1610 Sawmilling and planing of wood ( 1/2 )
1621 Manufacture of veneer sheets and wood-based panels ( 1/2 )
1622 Manufacture of builders' carpentry and joinery ( 1/4 )
1619 Miscellaneous wooden products 1610 Sawmilling and planing of wood ( 2/2 )
1621 Manufacture of veneer sheets and wood-based panels ( 2/2 )
1622 Manufacture of builders' carpentry and joinery ( 2/4 )
1623 Manufacture of wooden containers ( 1/2 )
1629 Manufacture of other products of wood; manufacture of articles of cork, straw
and plaiting materials
( 1/3 )
3290 Other manufacturing n.e.c. ( 1/5 )
1621 Furniture and fixtures 1622 Manufacture of builders' carpentry and joinery ( 3/4 )
1629 Manufacture of other products of wood; manufacture of articles of cork, straw
and plaiting materials
( 2/3 )
2220 Manufacture of plastics products ( 1/4 )
2393 Manufacture of other porcelain and ceramic products ( 1/2 )
2395 Manufacture of articles of concrete, cement and plaster ( 1/3 )
2396 Cutting, shaping and finishing of stone ( 2/3 )
2817 Manufacture of office machinery and equipment (except computers and
peripheral equipment)
( 1/3 )
3100 Manufacture of furniture ( 1/2 )
3212 Manufacture of imitation jewellery and related articles ( 1/2 )
3220 Manufacture of musical instruments ( 1/2 )
1631 Pulp 1701 Manufacture of pulp, paper and paperboard ( 1/3 )
1632 Paper, paperboard 1701 Manufacture of pulp, paper and paperboard ( 2/3 )
1633 Building paper 1701 Manufacture of pulp, paper and paperboard ( 3/3 )
1702 Manufacture of corrugated paper and paperboard and of containers of paper
and paperboard
( 1/3 )
1709 Manufacture of other articles of paper and paperboard ( 2/4 )
1641 Paper containers 1702 Manufacture of corrugated paper and paperboard and of containers of paper
and paperboard
( 2/3 )
1709 Manufacture of other articles of paper and paperboard ( 3/4 )
1649 Miscellaneous processed paper products 1702 Manufacture of corrugated paper and paperboard and of containers of paper
and paperboard
( 3/3 )
1709 Manufacture of other articles of paper and paperboard ( 4/4 )
2220 Manufacture of plastics products ( 2/4 )
Miscellaneous wearing apparel and clothing
accessories
- 127 -

Code Sector name Code Name
Minor Aggregated Classification in 2015 Input-Output Tables ISIC(Rev.4)
1911 Printing, plate making and book binding 1313 Finishing of textiles ( 2/2 )
1811 Printing
1812 Service activities related to printing
2011 Chemical fertilizer 2012 Manufacture of fertilizers and nitrogen compounds ( 1/2 )
2021 Industrial soda chemicals 2011 Manufacture of basic chemicals ( 1/6 )
2029 Miscellaneous industrial inorganic chemicals 0893 Extraction of salt
2011 Manufacture of basic chemicals ( 2/6 )
2012 Manufacture of fertilizers and nitrogen compounds
2031 Petrochemical basic products 2011 Manufacture of basic chemicals ( 3/6 )
2013 Manufacture of plastics and synthetic rubber in primary forms ( 1/4 )
2041 2011 Manufacture of basic chemicals ( 4/6 )
2013 Manufacture of plastics and synthetic rubber in primary forms ( 2/4 )
2042 Synthetic rubber 2013 Manufacture of plastics and synthetic rubber in primary forms ( 3/4 )
2049 2011 Manufacture of basic chemicals ( 5/6 )
2029 Manufacture of other chemical products n.e.c. ( 1/4 )
2051 Synthetic resins 2013 Manufacture of plastics and synthetic rubber in primary forms ( 4/4 )
2061 Synthetic fibers 2030 Manufacture of man-made fibres
2071 Medicaments 2021 Manufacture of pesticides and other agrochemical products ( 1/2 )
2100 Manufacture of pharmaceuticals, medicinal chemical and botanical products
2081 Oil and fat products and surface-active agents 2023 Manufacture of soap and detergents, cleaning and polishing preparations,
perfumes and toilet preparations
( 1/3 )
2082 Cosmetics, toilet preparations and dentifrices 2023 Manufacture of soap and detergents, cleaning and polishing preparations,
perfumes and toilet preparations
( 2/3 )
2083 Paint and varnishes, printing ink 2022 Manufacture of paints, varnishes and similar coatings, printing ink and mastics ( 1/2 )
2084 Agricultural chemicals 2021 Manufacture of pesticides and other agrochemical products ( 2/2 )
2089 Miscellaneous final chemical products 2011 Manufacture of basic chemicals ( 6/6 )
2023 Manufacture of soap and detergents, cleaning and polishing preparations,
perfumes and toilet preparations
( 3/3 )
2029 Manufacture of other chemical products n.e.c. ( 2/4 )
3290 Other manufacturing n.e.c. ( 2/5 )
2111 Petroleum refinery products 1910 Manufacture of coke oven products ( 1/2 )
1920 Manufacture of refined petroleum products ( 1/2 )
2121 Coal products 1910 Manufacture of coke oven products ( 2/2 )
1920 Manufacture of refined petroleum products ( 2/2 )
2211 Plastic products 1399 Manufacture of other textiles n.e.c. ( 4/4 )
2219 Manufacture of other rubber products ( 2/3 )
2220 Manufacture of plastics products ( 3/4 )
2930 Manufacture of parts and accessories for motor vehicles ( 1/4 )
3290 Other manufacturing n.e.c. ( 3/5 )
2221 Tires and inner tubes 2211 Manufacture of rubber tyres and tubes; retreading and rebuilding of rubber
tyres
( 1/2 )
2229 Miscellaneous rubber products 1410 Manufacture of wearing apparel, except fur apparel ( 3/4 )
1520 Manufacture of footwear ( 1/2 )
2029 Manufacture of other chemical products n.e.c. ( 3/4 )
2211 Manufacture of rubber tyres and tubes; retreading and rebuilding of rubber
tyres
( 2/2 )
2219 Manufacture of other rubber products ( 3/3 )
2220 Manufacture of plastics products ( 4/4 )
3830 Materials recovery ( 1/4 )
2311 Leather footwear 1520 Manufacture of footwear ( 2/2 )
2312 1410 Manufacture of wearing apparel, except fur apparel ( 4/4 )
1511 Tanning and dressing of leather; dressing and dyeing of fur
1512 Manufacture of luggage, handbags and the like, saddlery and harness
3092 Manufacture of bicycles and invalid carriages ( 1/3 )
2511 Glass and glass products 2310 Manufacture of glass and glass products
2521 Cement and cement products 2394 Manufacture of cement, lime and plaster ( 1/2 )
2395 Manufacture of articles of concrete, cement and plaster ( 2/3 )
2531 Pottery, china and earthenware 2392 Manufacture of clay building materials ( 1/2 )
2393 Manufacture of other porcelain and ceramic products ( 2/2 )
2399 Manufacture of other non-metallic mineral products n.e.c. ( 1/2 )
2591 Structural clay products 2391 Manufacture of refractory products
2392 Manufacture of clay building materials ( 2/2 )
2395 Manufacture of articles of concrete, cement and plaster ( 3/3 )
2599 2394 Manufacture of cement, lime and plaster ( 2/2 )
2396 Cutting, shaping and finishing of stone ( 3/3 )
2399 Manufacture of other non-metallic mineral products n.e.c. ( 2/2 )
2599 Manufacture of other fabricated metal products n.e.c. ( 1/5 )
2790 Manufacture of other electrical equipment ( 1/6 )
3830 Materials recovery ( 2/4 )
2611 Pig iron and crude steel 2410 Manufacture of basic iron and steel ( 1/6 )
2612 Scrap iron 2410 Manufacture of basic iron and steel ( 2/6 )
2621 Hot rolled steel 2410 Manufacture of basic iron and steel ( 3/6 )
2599 Manufacture of other fabricated metal products n.e.c. ( 2/5 )
Aliphatic intermediates, cyclic intermediates,
synthetic dyes and organic pigments
Tanned leather, leather products and fur skins
(except leather footwear)
Miscellaneous basic organic chemical
products
Miscellaneous ceramic, stone and clay
products
- 128 -

Code Sector name Code Name
Minor Aggregated Classification in 2015 Input-Output Tables ISIC(Rev.4)
2622 Steel pipes and tubes 2410 Manufacture of basic iron and steel ( 4/6 )
2592 Treatment and coating of metals; machining ( 1/5 )
2623 Cold-finished steel, coated steel 2410 Manufacture of basic iron and steel ( 5/6 )
2592 Treatment and coating of metals; machining ( 2/5 )
2599 Manufacture of other fabricated metal products n.e.c. ( 3/5 )
2631 Cast and forged steel products (iron) 2431 Casting of iron and steel ( 1/2 )
2591 Forging, pressing, stamping and roll-forming of metal; powder metallurgy ( 1/3 )
2599 Manufacture of other fabricated metal products n.e.c. ( 4/5 )
2699 Miscellaneous iron or steel products 2410 Manufacture of basic iron and steel ( 6/6 )
2592 Treatment and coating of metals; machining ( 3/5 )
2711 Non-ferrous metals 2420 Manufacture of basic precious and other non-ferrous metals ( 1/3 )
2712 Non-ferrous metal scrap 2420 Manufacture of basic precious and other non-ferrous metals ( 2/3 )
2721 Electric wires and cables 2731 Manufacture of fibre optic cables
2732 Manufacture of other electronic and electric wires and cables
2729 Miscellaneous non-ferrous metal products 2420 Manufacture of basic precious and other non-ferrous metals ( 3/3 )
2432 Casting of non-ferrous metals
2591 Forging, pressing, stamping and roll-forming of metal; powder metallurgy ( 2/3 )
2811 Metal products for construction 2511 Manufacture of structural metal products ( 1/2 )
2812 Fabricated architectural metal products 2511 Manufacture of structural metal products ( 2/2 )
2891 2512 Manufacture of tanks, reservoirs and containers of metal ( 1/2 )
2750 Manufacture of domestic appliances ( 1/3 )
2815 Manufacture of ovens, furnaces and furnace burners ( 1/3 )
2899 Miscellaneous metal products 2431 Casting of iron and steel ( 2/2 )
2512 Manufacture of tanks, reservoirs and containers of metal ( 2/2 )
2591 Forging, pressing, stamping and roll-forming of metal; powder metallurgy ( 3/3 )
2592 Treatment and coating of metals; machining ( 4/5 )
2593 Manufacture of cutlery, hand tools and general hardware ( 1/2 )
2599 Manufacture of other fabricated metal products n.e.c. ( 5/5 )
2750 Manufacture of domestic appliances ( 2/3 )
2818 Manufacture of power-driven hand tools ( 1/2 )
2819 Manufacture of other general-purpose machinery ( 1/7 )
2822 Manufacture of metal-forming machinery and machine tools ( 1/3 )
2829 Manufacture of other special-purpose machinery ( 1/6 )
2930 Manufacture of parts and accessories for motor vehicles ( 2/4 )
3091 Manufacture of motorcycles ( 1/3 )
3092 Manufacture of bicycles and invalid carriages ( 2/3 )
3099 Manufacture of other transport equipment n.e.c. ( 1/2 )
3250 Manufacture of medical and dental instruments and supplies ( 2/6 )
3290 Other manufacturing n.e.c. ( 4/5 )
2911 Boilers and engines 2513 Manufacture of steam generators, except central heating hot water boilers
2811 Manufacture of engines and turbines, except aircraft, vehicle and cycle engines ( 1/3 )
2912 Pumps and compressors 2812 Manufacture of fluid power equipment
2813 Manufacture of other pumps, compressors, taps and valves ( 1/2 )
2913 Conveyors 2816 Manufacture of lifting and handling equipment ( 1/2 )
2914 Refrigerators and air conditioning apparatus 2819 Manufacture of other general-purpose machinery ( 2/7 )
2919 Miscellaneous general-purpose machinery 2592 Treatment and coating of metals; machining ( 5/5 )
2811 Manufacture of engines and turbines, except aircraft, vehicle and cycle engines ( 2/3 )
2813 Manufacture of other pumps, compressors, taps and valves ( 2/2 )
2814 Manufacture of bearings, gears, gearing and driving elements
2815 Manufacture of ovens, furnaces and furnace burners ( 2/3 )
2819 Manufacture of other general-purpose machinery ( 3/7 )
3311 Repair of fabricated metal products ( 1/2 )
3312 Repair of machinery ( 1/3 )
3011 Machinery for agricultural use 2821 Manufacture of agricultural and forestry machinery
3012 Machinery and equipment for construction
and mining
2824 Manufacture of machinery for mining, quarrying and construction
3013 Textile machinery 2826 Manufacture of machinery for textile, apparel and leather production ( 1/3 )
3014 Daily lives industry machinary 2819 Manufacture of other general-purpose machinery ( 4/7 )
2822 Manufacture of metal-forming machinery and machine tools ( 2/3 )
2825 Manufacture of machinery for food, beverage and tobacco processing
2829 Manufacture of other special-purpose machinery ( 2/6 )
3015 Basic material industry machinery 2819 Manufacture of other general-purpose machinery ( 5/7 )
2823 Manufacture of machinery for metallurgy ( 1/2 )
2829 Manufacture of other special-purpose machinery ( 3/6 )
3016 Metal processing machinery 2818 Manufacture of power-driven hand tools ( 2/2 )
2822 Manufacture of metal-forming machinery and machine tools ( 3/3 )
2823 Manufacture of machinery for metallurgy ( 2/2 )
3017 Semiconductor making equipment 2829 Manufacture of other special-purpose machinery ( 4/6 )
3019 Miscellaneous production machinery 2593 Manufacture of cutlery, hand tools and general hardware ( 2/2 )
2826 Manufacture of machinery for textile, apparel and leather production ( 2/3 )
2829 Manufacture of other special-purpose machinery ( 5/6 )
3111 Office machines 2817 Manufacture of office machinery and equipment (except computers and
peripheral equipment)
( 2/3 )
Gas and oil appliances and heating and
cooking apparatus
- 129 -

Code Sector name Code Name
Minor Aggregated Classification in 2015 Input-Output Tables ISIC(Rev.4)
3112 Service industry and amusement machines 2790 Manufacture of other electrical equipment ( 2/6 )
2819 Manufacture of other general-purpose machinery ( 6/7 )
2826 Manufacture of machinery for textile, apparel and leather production ( 3/3 )
2829 Manufacture of other special-purpose machinery ( 6/6 )
3113 Measuring instruments 2651 Manufacture of measuring, testing, navigating and control equipment ( 1/2 )
2819 Manufacture of other general-purpose machinery ( 7/7 )
3250 Manufacture of medical and dental instruments and supplies ( 3/6 )
3114 Medical instruments 2660 Manufacture of irradiation, electromedical and electrotherapeutic equipment ( 1/4 )
3250 Manufacture of medical and dental instruments and supplies ( 4/6 )
3115 Optical instruments and lenses 2670 Manufacture of optical instruments and photographic equipment ( 1/2 )
3116 Ordnance 2520 Manufacture of weapons and ammunition
3040 Manufacture of military fighting vehicles
3211 Electronic devices 2610 Manufacture of electronic components and boards ( 1/2 )
2660 Manufacture of irradiation, electromedical and electrotherapeutic equipment ( 2/4 )
3299 Miscellaneous electronic components 2610 Manufacture of electronic components and boards ( 2/2 )2680 Manufacture of magnetic and optical media
3311 Electrical devices and parts 2710 Manufacture of electric motors, generators, transformers and electricity
distribution and control apparatus
2733 Manufacture of wiring devices
2790 Manufacture of other electrical equipment ( 3/6 )
2815 Manufacture of ovens, furnaces and furnace burners ( 3/3 )
2930 Manufacture of parts and accessories for motor vehicles ( 3/4 )
3321 Household electric appliances 2750 Manufacture of domestic appliances ( 3/3 )
3331 Applied electronic equipment 2660 Manufacture of irradiation, electromedical and electrotherapeutic equipment ( 3/4 )
3332 Electric measuring instruments 2651 Manufacture of measuring, testing, navigating and control equipment ( 2/2 )
2660 Manufacture of irradiation, electromedical and electrotherapeutic equipment ( 4/4 )
3399 Miscellaneous electrical machinery 2720 Manufacture of batteries and accumulators2740 Manufacture of electric lighting equipment2790 Manufacture of other electrical equipment ( 4/6 )
3411 Communication equipment 2630 Manufacture of communication equipment ( 1/2 )
2640 Manufacture of consumer electronics ( 1/3 )
2790 Manufacture of other electrical equipment ( 5/6 )
3412 Image and audio equipment 2630 Manufacture of communication equipment ( 2/2 )
2640 Manufacture of consumer electronics ( 2/3 )
2670 Manufacture of optical instruments and photographic equipment ( 2/2 )
3421 Electronic computing equipment and
accessory equipment of electronic computing
equipment
2620 Manufacture of computers and peripheral equipment
3511 Passenger motor cars 2910 Manufacture of motor vehicles ( 1/2 )
3521 Trucks, buses and miscellaneous cars 2910 Manufacture of motor vehicles ( 2/2 )
2920 Manufacture of bodies (coachwork) for motor vehicles; manufacture of trailers
and semi-trailers
3522 Two-wheel motor vehicles 3091 Manufacture of motorcycles ( 2/3 )
3531 Motor vehicle parts and accessories 2930 Manufacture of parts and accessories for motor vehicles ( 4/4 )
3091 Manufacture of motorcycles ( 3/3 )
3541 Ships and repair of ships 2811 Manufacture of engines and turbines, except aircraft, vehicle and cycle engines ( 3/3 )
3011 Building of ships and floating structures
3012 Building of pleasure and sporting boats
3315 Repair of transport equipment, except motor vehicles ( 1/3 )
3591 Rolling stock and repair of rolling stock 3020 Manufacture of railway locomotives and rolling stock
3315 Repair of transport equipment, except motor vehicles ( 2/3 )
3592 Aircrafts and repair of air crafts 1392 Manufacture of made-up textile articles, except apparel ( 2/2 )
3030 Manufacture of air and spacecraft and related machinery ( 1/2 )
3312 Repair of machinery ( 2/3 )
3315 Repair of transport equipment, except motor vehicles ( 3/3 )
3599 Rolling stock and repair of rolling stock 2816 Manufacture of lifting and handling equipment ( 2/2 )
3030 Manufacture of air and spacecraft and related machinery ( 2/2 )
3092 Manufacture of bicycles and invalid carriages ( 3/3 )
3099 Manufacture of other transport equipment n.e.c. ( 2/2 )
3911 Miscellaneous transport equipment 2640 Manufacture of consumer electronics ( 3/3 )
3230 Manufacture of sports goods
3240 Manufacture of games and toys
3919 Miscellaneous manufacturing products 1622 Manufacture of builders' carpentry and joinery ( 4/4 )
1623 Manufacture of wooden containers ( 2/2 )
1629 Manufacture of other products of wood; manufacture of articles of cork, straw
and plaiting materials
( 3/3 )
1820 Reproduction of recorded media
2022 Manufacture of paints, varnishes and similar coatings, printing ink and mastics ( 2/2 )
2029 Manufacture of other chemical products n.e.c. ( 4/4 )
2652 Manufacture of watches and clocks
2790 Manufacture of other electrical equipment ( 6/6 )
2817 Manufacture of office machinery and equipment (except computers and
peripheral equipment)
( 3/3 )
3100 Manufacture of furniture ( 2/2 )
3211 Manufacture of jewellery and related articles
3212 Manufacture of imitation jewellery and related articles ( 2/2 )
3220 Manufacture of musical instruments ( 2/2 )
3250 Manufacture of medical and dental instruments and supplies ( 5/6 )
3290 Other manufacturing n.e.c. ( 5/5 )
- 130 -

Code Sector name Code Name
Minor Aggregated Classification in 2015 Input-Output Tables ISIC(Rev.4)
3921 Reuse and recycling 3830 Materials recovery ( 3/4 )
4669 Wholesale of waste and scrap and other products n.e.c. ( 1/2 )
4111 Residential construction 3320 Installation of industrial machinery and equipment
4112 Non-residential construction 4100 Construction of buildings
4121 Repair of construction 4210 Construction of roads and railways
4131 Public construction 4220 Construction of utility projects
4191 4290 Construction of other civil engineering projects
4311 Demolition
4312 Site preparation
4321 Electrical installation
4322 Plumbing, heat and air-conditioning installation
4329 Other construction installation
4330 Building completion and finishing
4390 Other specialized construction activities
8130 Landscape care and maintenance service activities ( 1/2 )
4611 Electricity 3510 Electric power generation, transmission and distribution
4621 Gas supply 3520 Manufacture of gas; distribution of gaseous fuels through mains
4622 Steam and hot water supply 3530 Steam and air conditioning supply ( 2/2 )
4711 Water supply 3600 Water collection, treatment and supply ( 1/2 )
3700 Sewerage ( 1/2 )
4811 Waste management service 3700 Sewerage ( 2/2 )
3811 Collection of non-hazardous waste
3812 Collection of hazardous waste
3821 Treatment and disposal of non-hazardous waste ( 2/2 )
3822 Treatment and disposal of hazardous waste
8412 Regulation of the activities of providing health care, education, cultural
services and other social services, excluding social security
( 1/5 )
5111 Wholesale trade 4510 Sale of motor vehicles ( 1/2 )
4520 Maintenance and repair of motor vehicles ( 1/3 )
4530 Sale of motor vehicle parts and accessories ( 1/2 )
4540 Sale, maintenance and repair of motorcycles and related parts and accessories ( 1/3 )
4610 Wholesale on a fee or contract basis
4620 Wholesale of agricultural raw materials and live animals
4630 Wholesale of food, beverages and tobacco
4641 Wholesale of textiles, clothing and footwear
4649 Wholesale of other household goods
4651 Wholesale of computers, computer peripheral equipment and software
4652 Wholesale of electronic and telecommunications equipment and parts
4653 Wholesale of agricultural machinery, equipment and supplies ( 1/2 )
4659 Wholesale of other machinery and equipment
4661 Wholesale of solid, liquid and gaseous fuels and related products
4662 Wholesale of metals and metal ores
4663 Wholesale of construction materials, hardware, plumbing and heating
equipment and supplies
4669 Wholesale of waste and scrap and other products n.e.c. ( 2/2 )
4690 Non-specialized wholesale trade
5112 Retail trade 1071 Manufacture of bakery products ( 2/2 )
4510 Sale of motor vehicles ( 2/2 )
4520 Maintenance and repair of motor vehicles ( 2/3 )
4530 Sale of motor vehicle parts and accessories ( 2/2 )
4540 Sale, maintenance and repair of motorcycles and related parts and accessories ( 2/3 )
4653 Wholesale of agricultural machinery, equipment and supplies ( 2/2 )
4711 Retail sale in non-specialized stores with food, beverages or tobacco
predominating
4719 Other retail sale in non-specialized stores
4721 Retail sale of food in specialized stores
4722 Retail sale of beverages in specialized stores
4723 Retail sale of tobacco products in specialized stores
4730 Retail sale of automotive fuel in specialized stores
4741 Retail sale of computers, peripheral units, software and telecommunications
equipment in specialized stores
4742 Retail sale of audio and video equipment in specialized stores
4751 Retail sale of textiles in specialized stores
4752 Retail sale of hardware, paints and glass in specialized stores
4753 Retail sale of carpets, rugs, wall and floor coverings in specialized stores
4759 Retail sale of electrical household appliances, furniture, lighting equipment and
other household articles in specialized stores
4761 Retail sale of books, newspapers and stationary in specialized stores
4762 Retail sale of music and video recordings in specialized stores
4763 Retail sale of sporting equipment in specialized stores
4764 Retail sale of games and toys in specialized stores
4771 Retail sale of clothing, footwear and leather articles in specialized stores
4772 Retail sale of pharmaceutical and medical goods, cosmetic and toilet articles in
specialized stores
4773 Other retail sale of new goods in specialized stores ( 1/2 )
4774 Retail sale of second-hand goods
4781 Retail sale via stalls and markets of food, beverages and tobacco products
4782 Retail sale via stalls and markets of textiles, clothing and footwear
4789 Retail sale via stalls and markets of other goods
Miscellaneous civil engineering and
construction
- 131 -

Code Sector name Code Name
Minor Aggregated Classification in 2015 Input-Output Tables ISIC(Rev.4)
5112 Retail trade 4791 Retail sale via mail order houses or via Internet
4799 Other retail sale not in stores, stalls or markets
6492 Other credit granting ( 1/2 )
5311 Financial service 6411 Central banking
6419 Other monetary intermediation
6430 Trusts, funds and similar financial entities
6492 Other credit granting ( 2/2 )
6499 Other financial service activities, except insurance and pension funding activities, n.e.c.
6512 Non-life insurance ( 1/2 )
6520 Reinsurance ( 1/2 )
6611 Administration of financial markets
6612 Security and commodity contracts brokerage
6619 Other activities auxiliary to financial service activities
6630 Fund management activities
8291 Activities of collection agencies and credit bureaus ( 1/2 )
5312 Insurance 6530 Pension funding ( 1/2 )
6511 Life insurance
6512 Non-life insurance ( 2/2 )
6520 Reinsurance ( 2/2 )
6621 Risk and damage evaluation
6622 Activities of insurance agents and brokers
6629 Other activities auxiliary to insurance and pension funding
5511 Real estate agencies and rental services 6810 Real estate activities with own or leased property ( 1/3 )
6820 Real estate activities on a fee or contract basis ( 1/3 )
5521 House rent 6810 Real estate activities with own or leased property ( 2/3 )
5531 House rent (imputed house rent) N/A
5711 Railway transport (passengers) 4911 Passenger rail transport, interurban
4921 Urban and suburban passenger land transport ( 1/2 )
4922 Other passenger land transport ( 1/2 )
5221 Service activities incidental to land transportation ( 1/2 )
5712 Railway transport (freight) 4912 Freight rail transport
5721 Road transport service 4921 Urban and suburban passenger land transport ( 2/2 )
4922 Other passenger land transport ( 2/2 )
5722 Road freight transport (except self-transport) 4923 Freight transport by road
5731 Self-transport (passengers) N/A
5732 Self-transport (freight) N/A
5741 International shipping 5011 Sea and coastal passenger water transport ( 1/3 )
5012 Sea and coastal freight water transport ( 1/2 )
7730 Renting and leasing of other machinery, equipment and tangible goods ( 1/4 )
5742 Coastal and inland water transport 5011 Sea and coastal passenger water transport ( 2/3 )
5012 Sea and coastal freight water transport ( 2/2 )
5021 Inland passenger water transport ( 1/2 )
5022 Inland freight water transport
7730 Renting and leasing of other machinery, equipment and tangible goods ( 2/4 )
5743 Harbor transport service 5224 Cargo handling ( 1/2 )
5751 Air transport 5110 Passenger air transport
5120 Freight air transport
7310 Advertising ( 1/3 )
7420 Photographic activities ( 1/2 )
5761 Freight forwarding 5229 Other transportation support activities ( 1/4 )
5320 Courier activities ( 1/2 )
5771 Storage facility service 5210 Warehousing and storage
5781 Packing service 5229 Other transportation support activities ( 2/4 )
5789 Miscellaneous services relating to transport 3600 Water collection, treatment and supply ( 2/2 )
5221 Service activities incidental to land transportation ( 2/2 )
5222 Service activities incidental to water transportation
5223 Service activities incidental to air transportation
5224 Cargo handling ( 2/2 )
5229 Other transportation support activities ( 3/4 )
6810 Real estate activities with own or leased property ( 3/3 )
6820 Real estate activities on a fee or contract basis ( 2/3 )
7911 Travel agency activities
7912 Tour operator activities
5791 Postal services and mail delivery 4773 Other retail sale of new goods in specialized stores ( 2/2 )
5310 Postal activities
5320 Courier activities ( 2/2 )
5911 Communications 6110 Wired telecommunications activities ( 1/2 )6120 Wireless telecommunications activities
6130 Satellite telecommunications activities ( 1/2 )
6190 Other telecommunications activities
5921 Broadcasting 6010 Radio broadcasting
6020 Television programming and broadcasting activities
6110 Wired telecommunications activities ( 2/2 )
6130 Satellite telecommunications activities ( 2/2 )
- 132 -
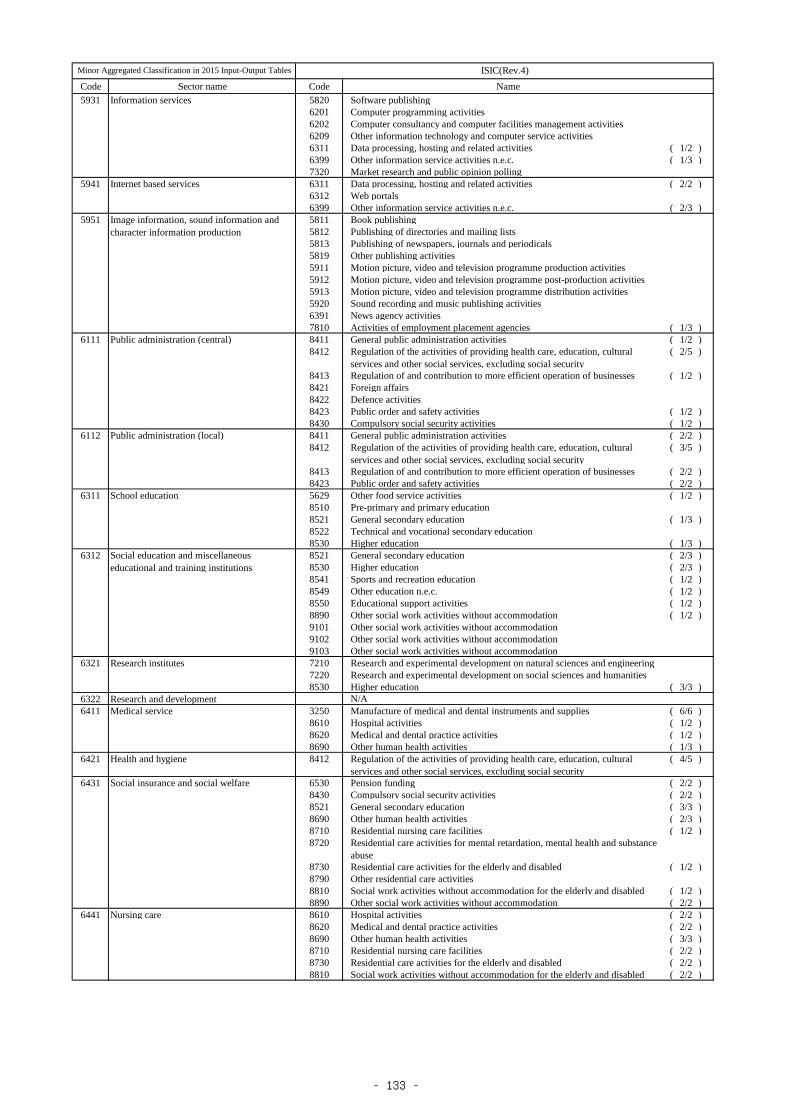
Code Sector name Code Name
Minor Aggregated Classification in 2015 Input-Output Tables ISIC(Rev.4)
5931 Information services 5820 Software publishing
6201 Computer programming activities
6202 Computer consultancy and computer facilities management activities
6209 Other information technology and computer service activities
6311 Data processing, hosting and related activities ( 1/2 )
6399 Other information service activities n.e.c. ( 1/3 )
7320 Market research and public opinion polling
5941 Internet based services 6311 Data processing, hosting and related activities ( 2/2 )
6312 Web portals
6399 Other information service activities n.e.c. ( 2/3 )
5951 5811 Book publishing
5812 Publishing of directories and mailing lists
5813 Publishing of newspapers, journals and periodicals
5819 Other publishing activities
5911 Motion picture, video and television programme production activities
5912 Motion picture, video and television programme post-production activities
5913 Motion picture, video and television programme distribution activities
5920 Sound recording and music publishing activities
6391 News agency activities
7810 Activities of employment placement agencies ( 1/3 )
6111 Public administration (central) 8411 General public administration activities ( 1/2 )
8412 Regulation of the activities of providing health care, education, cultural
services and other social services, excluding social security
( 2/5 )
8413 Regulation of and contribution to more efficient operation of businesses ( 1/2 )
8421 Foreign affairs
8422 Defence activities
8423 Public order and safety activities ( 1/2 )
8430 Compulsory social security activities ( 1/2 )
6112 Public administration (local) 8411 General public administration activities ( 2/2 )
8412 Regulation of the activities of providing health care, education, cultural
services and other social services, excluding social security
( 3/5 )
8413 Regulation of and contribution to more efficient operation of businesses ( 2/2 )
8423 Public order and safety activities ( 2/2 )
6311 School education 5629 Other food service activities ( 1/2 )
8510 Pre-primary and primary education
8521 General secondary education ( 1/3 )
8522 Technical and vocational secondary education
8530 Higher education ( 1/3 )
6312 8521 General secondary education ( 2/3 )
8530 Higher education ( 2/3 )
8541 Sports and recreation education ( 1/2 )
8549 Other education n.e.c. ( 1/2 )
8550 Educational support activities ( 1/2 )
8890 Other social work activities without accommodation ( 1/2 )
9101 Other social work activities without accommodation
9102 Other social work activities without accommodation
9103 Other social work activities without accommodation
6321 Research institutes 7210 Research and experimental development on natural sciences and engineering
7220 Research and experimental development on social sciences and humanities
8530 Higher education ( 3/3 )
6322 Research and development N/A
6411 Medical service 3250 Manufacture of medical and dental instruments and supplies ( 6/6 )
8610 Hospital activities ( 1/2 )
8620 Medical and dental practice activities ( 1/2 )
8690 Other human health activities ( 1/3 )
6421 Health and hygiene 8412 Regulation of the activities of providing health care, education, cultural
services and other social services, excluding social security
( 4/5 )
6431 Social insurance and social welfare 6530 Pension funding ( 2/2 )
8430 Compulsory social security activities ( 2/2 )
8521 General secondary education ( 3/3 )
8690 Other human health activities ( 2/3 )
8710 Residential nursing care facilities ( 1/2 )
8720 Residential care activities for mental retardation, mental health and substance
abuse
8730 Residential care activities for the elderly and disabled ( 1/2 )
8790 Other residential care activities
8810 Social work activities without accommodation for the elderly and disabled ( 1/2 )
8890 Other social work activities without accommodation ( 2/2 )
6441 Nursing care 8610 Hospital activities ( 2/2 )
8620 Medical and dental practice activities ( 2/2 )
8690 Other human health activities ( 3/3 )
8710 Residential nursing care facilities ( 2/2 )
8730 Residential care activities for the elderly and disabled ( 2/2 )
8810 Social work activities without accommodation for the elderly and disabled ( 2/2 )
Image information, sound information and
character information production
Social education and miscellaneous
educational and training institutions
- 133 -

Code Sector name Code Name
Minor Aggregated Classification in 2015 Input-Output Tables ISIC(Rev.4)
6599 Membership-based associations, n.e.c. 8412 Regulation of the activities of providing health care, education, cultural
services and other social services, excluding social security
( 5/5 )
9411 Activities of business and employers membership organizations
9412 Activities of professional membership organizations
9420 Activities of trade unions
9491 Activities of religious organizations ( 1/2 )
9492 Activities of political organizations
9499 Activities of other membership organizations n.e.c.
6611 Goods rental and leasing (except car rental) 6491 Financial leasing ( 1/2 )
7721 Renting and leasing of recreational and sports goods
7722 Renting of video tapes and disks
7729 Renting and leasing of other personal and household goods
7730 Renting and leasing of other machinery, equipment and tangible goods ( 3/4 )
6612 Car rental and leasing 6491 Financial leasing ( 2/2 )
7710 Renting and leasing of motor vehicles
7730 Renting and leasing of other machinery, equipment and tangible goods ( 4/4 )
6621 Advertising services 7310 Advertising ( 2/3 )
6631 Motor vehicle maintenance services 4520 Maintenance and repair of motor vehicles ( 3/3 )
4540 Sale, maintenance and repair of motorcycles and related parts and accessories ( 3/3 )
6632 Repair of machine 3311 Repair of fabricated metal products ( 2/2 )
3312 Repair of machinery ( 3/3 )
3313 Repair of electronic and optical equipment
3314 Repair of electrical equipment
3319 Repair of other equipment
9511 Repair of computers and peripheral equipment
9512 Repair of communication equipment
9521 Repair of consumer electronics
9522 Repair of household appliances and home and garden equipment
6699 Miscellaneous business services 3830 Materials recovery ( 4/4 )
5229 Other transportation support activities ( 4/4 )
6399 Other information service activities n.e.c. ( 3/3 )
6820 Real estate activities on a fee or contract basis ( 3/3 )
6910 Legal activities
6920 Accounting, bookkeeping and auditing activities; tax consultancy
7020 Management consultancy activities
7110 Architectural and engineering activities and related technical consultancy
7120 Technical testing and analysis
7310 Advertising ( 3/3 )
7410 Specialized design activities
7490 Other professional, scientific and technical activities n.e.c.
7740 Leasing of intellectual property and similar products, except copyrighted works
7810 Activities of employment placement agencies ( 2/3 )
7820 Temporary employment agency activities
7830 Other human resources provision
8010 Private security activities
8020 Security systems service activities
8030 Investigation activities
8110 Combined facilities support activities
8121 General cleaning of buildings
8129 Other building and industrial cleaning activities
8211 Combined office administrative service activities
8219 Photocopying, document preparation and other specialized office support
activities
8220 Activities of call centres
8230 Organization of conventions and trade shows
8291 Activities of collection agencies and credit bureaus ( 2/2 )
8292 Packaging activities
8299 Other business support service activities n.e.c.
8550 Educational support activities ( 2/2 )
6711 Hotels 5510 Courier activities
5520 Courier activities
5590 Other accommodation
6721 Eating and drinking services 5610 Restaurants and mobile food service activities
5621 Event catering
5629 Other food service activities ( 2/2 )
5630 Beverage serving activities
6731 9601 Washing and (dry-) cleaning of textile and fur products
9602 Hairdressing and other beauty treatment
9609 Other personal service activities n.e.c. ( 1/2 )
Cleaning, barber shops, beauty shops and
public baths
- 134 -

Code Sector name Code Name
Minor Aggregated Classification in 2015 Input-Output Tables ISIC(Rev.4)
6741 Amusement and recreational services 5011 Sea and coastal passenger water transport ( 3/3 )
5021 Inland passenger water transport ( 2/2 )
5914 Motion picture projection activities
7810 Activities of employment placement agencies ( 3/3 )
7990 Other reservation service and related activities ( 1/2 )
9000 Other social work activities without accommodation
9200 Other social work activities without accommodation ( 1/2 )
9311 Operation of sports facilities
9312 Activities of sports clubs
9319 Other sports activities
9321 Activities of amusement parks and theme parks
9329 Other amusement and recreation activities n.e.c.
6799 Miscellaneous personal services 7420 Photographic activities ( 2/2 )
7990 Other reservation service and related activities ( 2/2 )
8130 Landscape care and maintenance service activities ( 2/2 )
8541 Sports and recreation education ( 2/2 )
8542 Cultural education
8549 Other education n.e.c. ( 2/2 )
9200 Other social work activities without accommodation ( 2/2 )
9491 Activities of religious organizations ( 2/2 )
9523 Repair of footwear and leather goods
9524 Repair of furniture and home furnishings
9529 Repair of other personal and household goods
9603 Funeral and related activities
9609 Other personal service activities n.e.c. ( 2/2 )
9700 Activities of households as employers of domestic personnel
6811 Office supplies N/A
6911 Activities not elsewhere classified N/A
- 135 -

- 136 -

CHAPTER Ⅶ CONCEPT, DEFINITION AND SCOPE BY SECTOR
This chapter stipulates the concept, definition, and scope of
individual sectors that are shown in the basic sector classification
table of the 2015 I-O Tables.
The concept, definition, and scope of the sectors are generally
described in following ways.
(Column・Row Code、Sector Name)
Organized according to the coding number order. However,
for sectors related to the major aggregated classification “Mis-
cellaneous manufacturing products,” there are some sectors that
do not follow the coding number order, as there are some sectors
that cover multiple categories.
(Ministry or agency in charge)
The responsible Ministry or Agency in charge of the sector is
shown.
(Definition, Scope)
The definition and the scope of the sectors are summarized.
(Given examples)
Examples of major goods or services that are generated by the
sector’s activities are shown.
However, in cases where the major goods or services that are gen-
erated are clear from the row sector name, there are instances where
given examples are omitted.
(Changes from the 2011 I-O Tables)
Major changes in concept, definition, and scope in the 2015
Input-Output Tables are shown if they differ from those of 2011
I-O Tables.
(Notes)
Points to remember with regard to concept, definition, or
scope and changes made in the I-O Tables between 2005 and
2011 are listed.
Notes 1 A star mark in the column of the sector name signifies
that sector’s major acting body.
**・・・・・・・Non-market producer (General govern-
ment)
*・・・・・・・・Non-market producer (Private non-
profit institutions serving households)
(nothing)・・Market producer
2 P represents a dummy sector.
3 Based on the 12th revision of the Japan Standard In-
dustrial Classification implemented in November
2007, “Establishments engaged in administrative or
ancillary economic activities” was established as a mi-
nor classification for each medium industrial classifi-
cation. However, in the 2015 I-O Tables, these activi-
ties are not established as an independent sector as in
the 2011 I-O Tables and are conceptually handled as
being included in each sector. This is not listed for
each instance.
The Industry Number 7282 “Pure holding companies”
of the Japan Standard Industrial Classification is han-
dled in the same manner, as it does not have a core busi-
ness, and is considered as having the same activities as
“Establishments engaged in administrative or ancillary
economic activities” since it is dedicated to manage-
ment strategy, human resources strategy, decision-mak-
ing, etc. of other companies.
- 137 -

§1 Endogenous Sectors
01 Agriculture, forestry and fishery
Column Code Row Code Sector Name
0111-01 Rice
0111-011 Rice
0111-012 Rice straw
(Ministry or agency in charge)
Ministry of Agriculture, Forestry and Fisheries
(Definition, Scope)
The production activities of “Rice farming” as specified in In-
dustry Number 0111 of the Japan Standard Industrial Classifica-
tion.
(Given examples)
Rice, rice straw
Column Code Row Code Sector Name
0111-02 Wheat, barley and the like
0111-021 Wheat
0111-022 Barley
(Ministry or agency in charge)
Ministry of Agriculture, Forestry and Fisheries
(Definition, Scope)
The production activities for wheat, barley and the like among
those listed as “Grain and soybean farming, except rice farming”
as specified in Industry Number 0112 of the Japan Standard In-
dustrial Classification.
(Given examples)
Wheat, barley (nijo, rokujo), hadaka-mugi
(Changes from the 2011 I-O Tables)
“0111-021 Wheat (domestic)” and “0111-022 Wheat (im-
ported)” in the 2011 I-O Tables are integrated into “0111-021
Wheat”; “0111-023 Barley (domestic)” and “0111-024 Barley
(imported)” are integrated into “0111-022 Barley.”
Column Code Row Code Sector Name
0112-01 Potatoes and sweet potatoes
0112-011 Sweet potatoes
0112-012 Potatoes
(Ministry or agency in charge)
Ministry of Agriculture, Forestry and Fisheries
(Definition, Scope)
The production activities of “Potato and sweet potato farming”
as specified in Industry Number 0117 of the Japan Standard In-
dustrial Classification.
(Given examples)
Sweet potatoes, potatoes
(Notes)
Taro and yams are classified in the “0113-01 Vegetables (out-
door)” and “0113-001 Vegetables” sectors.
Column Code Row Code Sector Name
0112-02 Pulses
0112-021 Soybeans
0112-029 Miscellaneous pulses
(Ministry or agency in charge)
Ministry of Agriculture, Forestry and Fisheries
(Definition, Scope)
The production activities for pulses among those listed as
“Grain and soybean farming, except rice farming” as specified
in Industry Number 0112 of the Japan Standard Industrial Clas-
sification.
(Given examples)
Soybeans (domestic), soybeans (imported), other pulses (peas,
broad beans, kidney beans, adzuki beans, Sasage, peanuts, other
pulses)
(Changes from the 2011 I-O Tables)
“0112-021 Soybeans (domestic)” and “0112-022 Soybeans
(imported)” in the 2011 I-O Tables are integrated into “0112-021
Soybeans.”
(Notes)
Immature soybeans, peas, broad beans, and kidney beans are
classified in the “0113-01 Vegetables (outdoor)” and “0113-001
Vegetables” sectors.
Column Code Row Code Sector Name
0113-001 Vegetables
0113-01 Vegetables (outdoor)
0113-02 Vegetables (under facilities)
(Ministry or agency in charge)
Ministry of Agriculture, Forestry and Fisheries
(Definition, Scope)
The production activities for Vegetables for among those
listed as “Vegetable farming, including mushrooms” as specified
in Industry Number 0113 of the Japan Standard Industrial Clas-
sification.
- 138 -

Furthermore, the scope of Vegetables (under facilities) corre-
sponds to the vegetable production activities of glasshouses (a
facility covered by glass and in which one is able to conduct
work in a normal posture) or houses (a facility covered by mate-
rial other than glass, and in which one is able to conduct work in
a normal posture); the scope of Vegetables (outdoor) corresponds
to vegetable production activities based on other methods.
(Given examples)
Fruit vegetables (outdoor): Pumpkins, green peppers, cucum-
bers, melons (outdoor), watermelons, eggplants, tomatoes,
young peas (immature peas), immature corn, green soy-
beans (immature soybeans), kidney beans (immature kid-
ney beans)
Leafy vegetables (outdoor): Cabbages, Chinese cabbages, non-
fruit Chinese cabbages, spinach, long leeks, onions, leeks,
hornworts, crown daisies, garlic, lettuces, celery, cauliflower,
broccoli, asparagus, bamboo shoots
Root vegetables: Japanese radish, Japanese turnip, carrots,
burdock root, taros, yams, lotus root, ginger
Fruit vegetables (under facilities): pumpkins, green peppers,
cucumbers, greenhouse melon, watermelons, eggplants, to-
matoes, strawberries
Leafy vegetables (under facilities)): Lettuces, bean sprouts
(Notes)
The production in plastic tunnels was classified under “Vege-
tables (under facilities)” in the 2005 I-O Tables but changed to
“Vegetables (outdoor)” in the 2011 I-O Tables.
Column Code Row Code Sector Name
0114-01 0114-011 Fruits
(Ministry or agency in charge)
Ministry of Agriculture, Forestry and Fisheries
(Definition, Scope)
The production activities of “Fruit and nut farming” as speci-
fied in Industry Number 0114 of the Japan Standard Industrial
Classification.
(Given examples)
Oranges, summer oranges, navel oranges, hassaku oranges,
iyo oranges, grapefruits (imported), apples, grapes, Japanese
pears, pears, peaches, Japanese plums, otoh, Japanese apricots,
loquats, persimmons, Japanese chestnuts, kiwi fruits, pineapples,
bananas (imported), and the growing of fruits
(Changes from the 2011 I-O Tables)
“0114-011 Citrus fruits,” “0114-012 Apples” and “0114-019
Miscellaneous fruits” in the 2011 I-O Tables are integrated into
“0114-011 Fruits.”
Column Code Row Code Sector Name
0115-01 0115-011 Sugar crops
(Ministry or agency in charge)
Ministry of Agriculture, Forestry and Fisheries
(Definition, Scope)
The production activities for sugar crops among those listed
as “Crop farming for industrial products” as specified in Industry
Number 0116 of the Japan Standard Industrial Classification
(Given examples)
Sugar canes, sugar beets
Column Code Row Code Sector Name
0115-02 Crops for beverages
0115-021 Green coffee and cocoa beans
(imported)
0115-029 Miscellaneous crops for bev-
erages
(Ministry or agency in charge)
Ministry of Agriculture, Forestry and Fisheries
(Definition, Scope)
The production activities for crops for beverages that are
among those listed as “Crop farming for industrial products” as
specified in Industry Number 0116 of the Japan Standard Indus-
trial Classification
(Given examples)
Coffee beans, cocoa beans (imported), materials for beverages,
tea leaves, hops, and the growing of tea leaves
Column Code Row Code Sector Name
0115-09 Miscellaneous edible crops
0115-091 Miscellaneous cereals
0115-099 Edible crops, n.e.c.
(Ministry or agency in charge)
Ministry of Agriculture, Forestry and Fisheries
(Definition, Scope)
The production activities for edible crops, n.e.c that are not
elsewhere classified among those listed as “Grain and soybean
farming, except rice farming” as specified in Industry Number
0112 or “Crop farming for industrial products” as specified in
Industry Number 0116 of the Japan Standard Industrial Classifi-
cation.
- 139 -

(Given examples)
Miscellaneous cereals (edible crops): Buckwheat, enbaku, corn,
foxtail millet, millet, hie, grain sorghum (imported)
Edible crops, n.e.c.: Rape seeds (seeds), sesame, olives,
konnyaku potatoes, spice crops (imported), cassava taro for
feed (imported)
(Changes from the 2011 I-O Tables)
“0115-092 Oil seeds” in the 2011 I-O Tables is integrated into
“0115-099 Edible crops, n.e.c.”
(Notes)
The code and name “0115-093 Edible industrial crops, n.e.c.”
in the 2005 I-O Tables was changed to “0115-099 Edible crops,
n.e.c.” in the 2011 I-O Tables.
Column Code Row Code Sector Name
0116-01 0116-011 Feed and forage crops
(Ministry or agency in charge)
Ministry of Agriculture, Forestry and Fisheries
(Definition, Scope)
The production activities of “Miscellaneous crop farming” as
specified in Industry Number 0119 of the Japan Standard Indus-
trial Classification.
(Given examples)
Pasture grass, young corns, feed turnips
Column Code Row Code Sector Name
0116-02 0116-021 Seeds and seedlings
(Ministry or agency in charge)
Ministry of Agriculture, Forestry and Fisheries
(Definition, Scope)
The production activities for bulbs among those listed as “Flo-
riculture” as specified in Industry Number 0115 of the Japan
Standard Industrial Classification and production activities for
seeds and seedlings among those listed as production activities
of bulbs as specified in “Miscellaneous crop farming” as speci-
fied in Industry Number 0119 of the Japan Standard Industrial
Classification; production activities relating to products inputted
directly to their own sectors are excluded.
(Given examples)
Farm products seeds (excluding stock farm products and co-
coons), bulbs, seedlings (excluding seedlings for mountain
planting), plant growth of seedlings
(Notes)
Flowering tree saplings are included in “0116-03, -031 Flow-
ers and plants”
Column Code Row Code Sector Name
0116-03 0116-031 Flowers and plants
(Ministry or agency in charge)
Ministry of Agriculture, Forestry and Fisheries
(Definition, Scope)
The production activities of “Floriculture” as specified in In-
dustry Number 0115 of the Japan Standard Industrial Classifica-
tion.
(Given examples)
Cut flowers, potted plants, flowering trees (bearing trees), sap-
lings for flower gardens, grasses, ground cover plants, plant
growth of flowering trees (bearing trees)
Column Code Row Code Sector Name
0116-09 Miscellaneous inedible crops
0116-091 Leaf tobacco
0116-092 Raw rubber (imported)
0116-093 Raw cotton (imported)
0116-099 Inedible crops, n.e.c.
(Ministry or agency in charge)
Ministry of Agriculture, Forestry and Fisheries
(Definition, Scope)
The production activities for other inedible crops that are not
elsewhere classified among those listed as “Crop farming for in-
dustrial products” as specified in Industry Number 0116 of the
Japan Standard Industrial Classification; scraps and by-products
(waste cotton) produced by other sectors are competing with
“0116-093 Raw cotton (imported).”
(Given examples)
Leaf tobacco, raw rubber (imported), raw cotton (imported),
medicinal crops (medicinal carrots, ama-cha-tsuru), crops for pa-
per (paper mulberry, mitsumata plants, and so forth), crops for
mattresses (rushes and so forth)
(Notes)
The name of the “0116-099” sector was changed from “Crops
for inedible agricultural products, n.e.c.” in the 2005 I-O Tables
to “Inedible crops, n.e.c.” in the 2011 I-O Tables.
- 140 -

Column Code Row Code Sector Name
0121-01 Dairy cattle farming
0121-011 Raw milk
0121-019 Miscellaneous dairy farming
products
(Ministry or agency in charge)
Ministry of Agriculture, Forestry and Fisheries
(Definition, Scope)
The production activities of “Dairy cattle farming” as speci-
fied in Industry Number 0121 of the Japan Standard Industrial
Classification.
(Given examples)
Raw milk, young milk cows (for slaughter or breeding), in-
crease in growth of young milk cows, culled dairy cattle, manure
Column Code Row Code Sector Name
0121-02 0121-021 Beef cattle
(Ministry or agency in charge)
Ministry of Agriculture, Forestry and Fisheries
(Definition, Scope)
The production activities of “Beef cattle farming” as specified
in Industry Number 0122 of the Japan Standard Industrial Clas-
sification.
(Given examples)
Cattle for slaughter (including the increase of the number of
breeding in relation to the number of cattle), cattle for breeding,
manure
Column Code Row Code Sector Name
0121-03 0121-031 Hogs
(Ministry or agency in charge)
Ministry of Agriculture, Forestry and Fisheries
(Definition, Scope)
The production activities of “Pig and hog farming” as speci-
fied in Industry Number 0123 of the Japan Standard Industrial
Classification.
(Given examples)
Hogs (including the increase of the number of young hogs in
relation to the number of hogs), manure
Column Code Row Code Sector Name
0121-04 0121-041 Hen eggs
(Ministry or agency in charge)
Ministry of Agriculture, Forestry and Fisheries
(Definition, Scope)
The production activities for hen eggs among those listed as
“Layers and broilers farming” as specified in Industry Number
0124 of the Japan Standard Industrial Classification.
(Given examples)
Hen eggs, hens (including the increase of the number of chick-
ens in relation to the number of hens), abnormal eggs, chicken
manure
Column Code Row Code Sector Name
0121-05 0121-051 Chickens
(Ministry or agency in charge)
Ministry of Agriculture, Forestry and Fisheries
(Definition, Scope)
The production activities for fowls and broilers among those
listed as “Layers and broilers farming” as specified in Industry
Number 0124 of the Japan Standard Industrial Classification.
(Given examples)
Broilers, chicken manure
Column Code Row Code Sector Name
0121-09 0121-099 Miscellaneous livestock
(Ministry or agency in charge)
Ministry of Agriculture, Forestry and Fisheries
(Definition, Scope)
The production activities for livestock that are classified as
“Livestock animals specialties” specified in Industry Number
0125, “Sericulture farming” as specified in Industry Number
0126, and “Miscellaneous livestock farming” as specified in In-
dustry Number 0129 of the Japan Standard Industrial Classifica-
tion; scraps and by-products (wool waste) are competing with
this sector.
(Given examples)
Wool, horses (including stallions), goats, sheep, fur animals
(the breeding of minks and rabbits, their furs, and other furs),
edible fowl (excluding hens), other edible livestock (goat’s milk,
bee honey, quail eggs), pet animals (including insects), experi-
mental animals (mice, guinea pigs), manure, sericulture
(Changes from the 2011 I-O Tables)
“0121-091 Sheep and lamb wool” and “0121-099 Livestock,
n.e.c.” in the 2011 I-O Tables are integrated into “0121-099 Mis-
cellaneous livestock.”
- 141 -

Column Code Row Code Sector Name
0131-01 0131-011 Veterinary service
(Ministry or agency in charge)
Ministry of Agriculture, Forestry and Fisheries
(Definition, Scope)
The production activities of “Veterinary services” as specified
in Industry Number 7411 of the Japan Standard Industrial Clas-
sification.
Column Code Row Code Sector Name
0131-02 0131-021 Agricultural services (except
veterinary service)
(Ministry or agency in charge)
Ministry of Agriculture, Forestry and Fisheries
(Definition, Scope)
The production activities of “AGRICULTURAL SERVICES,
EXCEPT GARDENING SERVICES” as specified in Group
Number 013 of the Japan Standard Industrial Classification.
(Given examples)
Grain elevators, rice centers, community facilities for rice
seedbeds, land reformation areas, community sorting facilities
for fruits and vegetables, crop spraying, community breeding
beds for silkworms, stud services, incubator services
Column Code Row Code Sector Name
0151-01 0151-011 Silviculture
(Ministry or agency in charge)
Ministry of Agriculture, Forestry and Fisheries
(Definition, Scope)
The production activities of “Silviculture” under Industry
Number 0211, “Silviculture services” under Industry Number
0241 and “Forest tree saplings nursery services” under Industry
Number 0243 of the Japan Standard Industrial Classification.
(Given examples)
Seedlings, the planting of trees
(Notes)
(1) Although seedlings for forestry use are intermediate prod-
ucts, they are included in this sector.
(2) This sector covers “Silviculture services” under Industry
Number 0241 and “Forest tree saplings nursery services”
under Industry Number 0243 of the Japan Standard Indus-
trial Classification, but does not record its production value
because of transaction within its own sector.
Column Code Row Code Sector Name
0152-01 0152-011 Logs
(Ministry or agency in charge)
Ministry of Agriculture, Forestry and Fisheries
(Definition, Scope)
The production activities of “Logging” under Industry Num-
ber 0221 and “Logging services” under Industry Number 0242
of the Japan Standard Industrial Classification.
(Given examples)
Logs (hewn lumber, large-cut parts)
(Notes)
This sector covers “Logging services” under Industry Number
0242 of the Japan Standard Industrial Classification, but does not
record its production value because of transaction within its own
sector.
Column Code Row Code Sector Name
0153-01 0153-011 Special forest products (including
hunting)
(Ministry or agency in charge)
Ministry of Agriculture, Forestry and Fisheries
(Definition, Scope)
The production and harvesting activities of forest products,
excluding logs, for general use among those listed as “Vegetable
farming, including mushrooms” as specified in Industry Number
0113, and production activities for “Cutting of fuelwood and
charcoal-making” as specified in Industry Number 0231, “Mis-
cellaneous special forest product production, except mushrooms”
as specified in Industry Number 0239, “Miscellaneous forestry
services” as specified in Industry Number 0249, and “Miscella-
neous forestry” as specified in Industry Number 0299.
(Given examples)
Mushrooms (matsutake, shiitake, velvet shank, and so forth),
nuts (chestnuts, walnuts, and so forth), root bend bamboo, raw
lacquer from lacquer trees, japan wax, bamboo, fire wood, char-
coal, animal skins from hunting
(Notes)
(1) Cultivated nuts are classified under “0114-01, -011 Fruits.”
(2) This sector covers “Miscellaneous forestry services” under
Industry Number 0249 of the Japan Standard Industrial
Classification, but does not record its production value be-
cause of transaction within its own sector.
- 142 -

Column Code Row Code Sector Name
0171-01 0171-011 Marine fishery
(Ministry or agency in charge)
Ministry of Agriculture, Forestry and Fisheries
(Definition, Scope)
The production activities of “MARINE FISHERIES” under
Group Number 031 of the Japan Standard Industrial Classifica-
tion.
(Given examples)
Fish, shrimp, crabs, squid, octopus, sea urchins, sea cucum-
bers, shellfish, seaweed, whales
(Changes from the 2011 I-O Tables)
“0171-011 Marine fishery (domestic)” and “0171-012 Marine
fishery (imported)” in the 2011 I-O Tables are integrated into
“0171-011 Marine fishery.”
Column Code Row Code Sector Name
0171-02 0171-021 Marine aquaculture
(Ministry or agency in charge)
Ministry of Agriculture, Forestry and Fisheries
(Definition, Scope)
The production activities of “MARINE AQUACULTURE” as
specified in Group Number 041 of the Japan Standard Industrial
Classification.
(Given examples)
Horse mackerel, yellowtail, sea breams, prawns, sea squirts,
scallops, oysters, konbu seaweed, wakame seaweed, seaweed,
pearls
Column Code Row Code Sector Name
0172-001 Inland water fishery and in-
land water aquaculture
0172-01 Inland water fishery
0172-02 Inland water aquaculture
(Ministry or agency in charge)
Ministry of Agriculture, Forestry and Fisheries
(Definition, Scope)
The production activities of “INLAND WATER FISHERIES”
as specified under Group Number 032 and “INLAND WATER
AQUACULTURE” under Group Number 042 of the Japan
Standard Industrial Classification.
(Given examples)
Inland water fishery: Salmons and trouts, smelts, sweetfish,
whitebait, carp, crucians, eels, corbiculas, shrimp
Inland water aquaculture: Trout, sweetfish, carp, crucians,
eels,water pearls, ornamental fish
(Notes)
Domestic production from fish caught by recreational fishers,
which was classified under inland water fishery up to the 2005
I-O Tables, is not included.
- 143 -

06 Mining
Column Code Row Code Sector Name
0611-01 Coal mining, crude petroleum
and natural gas
0611-011 Coal mining
0611-012 Crude petroleum
0611-013 Natural gas
(Ministry or agency in charge)
Ministry of Economy, Trade and Industry
(Definition, Scope)
The extraction and sorting activities of “COAL AND LIG-
NITE MINING” as specified in Group Number 052 and
“CRUDE PETROLEUM AND NATURAL GAS PRODUC-
TION” as specified in Group Number 053 of the Japan Standard
Industrial Classification.
(Given examples)
Coal mining: Crude coal, fuel coal, anthracite, lignite, low-grade
coal
Natural gas: Natural gas, liquefied natural gas, compressed gas
Column Code Row Code Sector Name
0621-01 0621-011 Gravel and quarrying
(Ministry or agency in charge)
Ministry of Economy, Trade and Industry
(Definition, Scope)
The mining, quarrying, and ore sorting activities of “STONE
QUARRYING, SAND, GRAVEL AND COBBLE-STONE
PITS” under Group Number 054 of the Japan Standard Indus-
trial Classification.
(Given examples)
Gravel, sand, peridotite (concentrate), olivine sand
Column Code Row Code Sector Name
0621-02 0621-021 Crushed stones
(Ministry or agency in charge)
Ministry of Economy, Trade and Industry
(Definition, Scope)
The production activities for “Crushed stones” as specified in
Industry Number 2181 of the Japan Standard Industrial Classifi-
cation; scrap and by-products (tailing) that appear in other sec-
tors are competing with this sector.
(Given examples)
Crushed stone, stone materials
Column Code Row Code Sector Name
0629-09 Miscellaneous ores
0629-091 Iron ores
0629-092 Non-ferrous metallic ores
0629-093 Limestone
0629-094 Materials for ceramics (ex-
cept limestone)
0629-099 Ores, n.e.c.
(Ministry or agency in charge)
Ministry of Economy, Trade and Industry
(Definition, Scope)
The extraction and sorting activities of “METAL MINING”
as specified in Group Number 051, “CERAMIC MINERAL
MINING (MINERALS ONLY FOR REFRACTORY, POTTERY
AND PORCELAIN, GLASS AND CEMENT MATERIALS)” as
specified in Group Number 055 and “MISCELLANEOUS MIN-
ERAL MINING” as specified in Group Number 059 of the Japan
Standard Industrial Classification.
Gypsum, chemical gypsum, water granulated slag, blast fur-
nace slag, fly ash, glass scrap, and glass bottles generated as
scrap or by-products in other sectors are competing with the
“0629-094 Materials for ceramics (except limestone)” sector.
Sulfur generated as by-products in other sectors is competing
with the “0629-099 Ores, n.e.c.” sector.
(Given examples)
Non-ferrous metallic ores: Copper, lead, zinc, gold, silver, tin,
tungsten, iron sulfide
Materials for ceramics (except limestone): Silica, silica sand,
dolomite, soapstone, clay, silicate, porcelain, kaolin
Ores, n.e.c.: Barite, bentonite, clay such as diatomite
(Changes from the 2011 I-O Tables)
“0611-01 Metallic ores” and “0639-09 Miscellaneous ores” in
the 2011 I-O Tables are integrated into “0629-09 Miscellaneous
ores.”
- 144 -

11 Beverages and Foods
Column Code Row Code Sector Name
1111-01 Meat
1111-011 Beef
1111-012 Pork
1111-013 Chicken meat
1111-014 Miscellaneous meat
1111-015 Byproducts of slaughtering
and meat processing
(Ministry or agency in charge)
Ministry of Agriculture, Forestry and Fisheries
(Definition, Scope)
The production activities for “Frozen meat and subprimal
products” listed under Industry Number 0911, “Miscellaneous
livestock products” listed under Industry Number 0919 and the
production of edible fowl and their processing as specified in
“Slaughterhouses” listed under Industry Number 9521of the Ja-
pan Standard Industrial Classification.
(Given examples)
Beef, pork, poultry, other meats (horse, ram, or kid meat), by-
products of slaughtering (unprocessed skins, internal organs, and
by-products of meat processing)
(Notes)
(1) Livestock products except for meat products are classified
under “1119-09, -099 Miscellaneous foods.”
(2) Frozen meat (including chicken) classified under “1119-
09, -099 Miscellaneous foods” in the 2005 I-O Tables was
integrated into this sector in the 2011 I-O Tables.
Column Code Row Code Sector Name
1111-02 Dairy farm products
1111-021 Drinking milk
1111-022 Dairy products
(Ministry or agency in charge)
Ministry of Agriculture, Forestry and Fisheries
(Definition, Scope)
The production activities for “Processed milk and milk bever-
age products” as specified in Industry Number 0913 and “Dairy
products, except processed milk and milk beverage products” as
specified in Industry Number 0914 of the Japan Standard Indus-
trial Classification
(Given examples)
Drinking milk: Milk, processed milk
Dairy products: Milk drinks, milk powder, condensed milk, but-
ter, cheese, ice-cream, powder mix, cream, fermented milk,
lactic acid beverage
Column Code Row Code Sector Name
1111-09 1111-099 Miscellaneous livestock prod-
ucts
(Ministry or agency in charge)
Ministry of Agriculture, Forestry and Fisheries
(Definition, Scope)
The production of “Meat products” and “Miscellaneous live-
stock products” listed under Industry Numbers 0912 and 0919 of
the Japan Standard Industrial Classification respectively
(Given examples)
Ham, bacon, sausages, ground beef (chilled), roast pork, bot-
tled and canned meat products (canned corned beef, canned
boiled quail eggs), and other livestock products (refined honey,
dried eggs, etc.)
(Changes from the 2011 I-O Tables)
(1) Bottled or canned meat products (canned corned beef,
canned boiled quail eggs, etc.) classified under “1112-02, -
021 Bottled or canned meat products” in the 2011 I-O Ta-
bles are integrated into this sector.
(2) Miscellaneous livestock products (refined honey, dried
eggs, etc.) classified under “1119-09, -099 Miscellaneous
foods” in the 2011 I-O Tables are integrated into this sector.
Column Code Row Code Sector Name
1112-01 1112-011 Frozen fish and shellfish
(Ministry or agency in charge)
Ministry of Agriculture, Forestry and Fisheries
(Definition, Scope)
The production activities for “Frozen seafood products (un-
processed)” as specified in Industry Number 0925, and “Frozen
seafood products (processed and packaged)” as specified in In-
dustry Number 0926 of the Japan Standard Industrial Classifica-
tion.
(Given examples)
Frozen fish and shellfish, frozen processed fish and shellfish
(whole or cut into three pieces and processed as frozen “sashimi”),
frozen minced fish, by-products of “fish bone with little flesh”
- 145 -
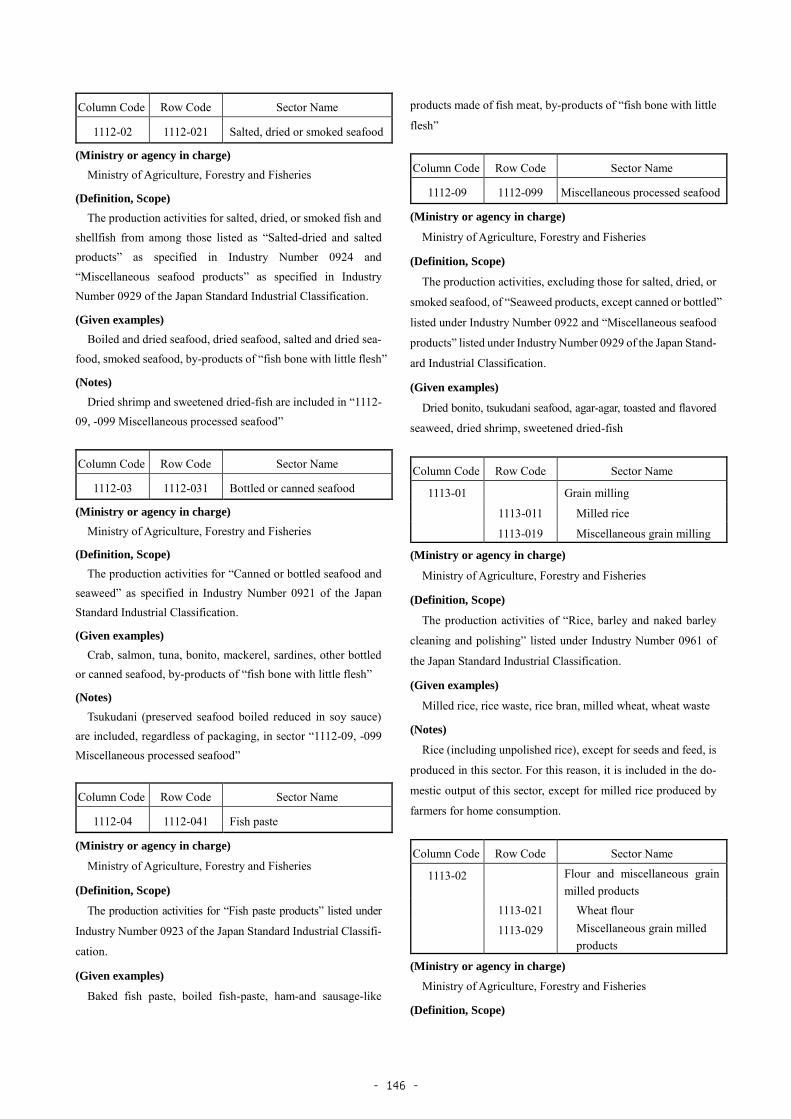
Column Code Row Code Sector Name
1112-02 1112-021 Salted, dried or smoked seafood
(Ministry or agency in charge)
Ministry of Agriculture, Forestry and Fisheries
(Definition, Scope)
The production activities for salted, dried, or smoked fish and
shellfish from among those listed as “Salted-dried and salted
products” as specified in Industry Number 0924 and
“Miscellaneous seafood products” as specified in Industry
Number 0929 of the Japan Standard Industrial Classification.
(Given examples)
Boiled and dried seafood, dried seafood, salted and dried sea-
food, smoked seafood, by-products of “fish bone with little flesh”
(Notes)
Dried shrimp and sweetened dried-fish are included in “1112-
09, -099 Miscellaneous processed seafood”
Column Code Row Code Sector Name
1112-03 1112-031 Bottled or canned seafood
(Ministry or agency in charge)
Ministry of Agriculture, Forestry and Fisheries
(Definition, Scope)
The production activities for “Canned or bottled seafood and
seaweed” as specified in Industry Number 0921 of the Japan
Standard Industrial Classification.
(Given examples)
Crab, salmon, tuna, bonito, mackerel, sardines, other bottled
or canned seafood, by-products of “fish bone with little flesh”
(Notes)
Tsukudani (preserved seafood boiled reduced in soy sauce)
are included, regardless of packaging, in sector “1112-09, -099
Miscellaneous processed seafood”
Column Code Row Code Sector Name
1112-04 1112-041 Fish paste
(Ministry or agency in charge)
Ministry of Agriculture, Forestry and Fisheries
(Definition, Scope)
The production activities for “Fish paste products” listed under
Industry Number 0923 of the Japan Standard Industrial Classifi-
cation.
(Given examples)
Baked fish paste, boiled fish-paste, ham-and sausage-like
products made of fish meat, by-products of “fish bone with little
flesh”
Column Code Row Code Sector Name
1112-09 1112-099 Miscellaneous processed seafood
(Ministry or agency in charge)
Ministry of Agriculture, Forestry and Fisheries
(Definition, Scope)
The production activities, excluding those for salted, dried, or
smoked seafood, of “Seaweed products, except canned or bottled”
listed under Industry Number 0922 and “Miscellaneous seafood
products” listed under Industry Number 0929 of the Japan Stand-
ard Industrial Classification.
(Given examples)
Dried bonito, tsukudani seafood, agar-agar, toasted and flavored
seaweed, dried shrimp, sweetened dried-fish
Column Code Row Code Sector Name
1113-01 Grain milling
1113-011 Milled rice
1113-019 Miscellaneous grain milling
(Ministry or agency in charge)
Ministry of Agriculture, Forestry and Fisheries
(Definition, Scope)
The production activities of “Rice, barley and naked barley
cleaning and polishing” listed under Industry Number 0961 of
the Japan Standard Industrial Classification.
(Given examples)
Milled rice, rice waste, rice bran, milled wheat, wheat waste
(Notes)
Rice (including unpolished rice), except for seeds and feed, is
produced in this sector. For this reason, it is included in the do-
mestic output of this sector, except for milled rice produced by
farmers for home consumption.
Column Code Row Code Sector Name
1113-02 Flour and miscellaneous grain
milled products
1113-021 Wheat flour
1113-029 Miscellaneous grain milled
products
(Ministry or agency in charge)
Ministry of Agriculture, Forestry and Fisheries
(Definition, Scope)
- 146 -

The production activities of “Wheat flour milling” listed un-
der Industry Number 0962 and “Miscellaneous flour and grain
mill products” listed under Industry Number 0969 of the Japan
Standard Industrial Classification.
(Given examples)
Wheat, “fusuma” powder, “soba” powder, “konnyaku” pow-
der, rice powder
Column Code Row Code Sector Name
1114-01 1114-011 Noodles
(Ministry or agency in charge)
Ministry of Agriculture, Forestry and Fisheries
(Definition, Scope)
The production activities for “Noodles” listed under Industry
Number 0992 of the Japan Standard Industrial Classification.
(Given examples)
Dried noodles, instant noodles, macaroni and spaghetti, noodles
Column Code Row Code Sector Name
1114-02 1114-021 Bread
(Ministry or agency in charge)
Ministry of Agriculture, Forestry and Fisheries
(Definition, Scope)
The production activities of “Bread” listed under Industry
Number 0971, processed bread and sandwiches in “Sushi, box
lunch and bread with ingredients” listed under Industry Number
0997, and manufacturing as part of “Retail bakeries (manufac-
turer-sellers)” listed under Industry Number 5863 of the Japan
Standard Industrial Classification.
(Given examples)
Breads, cookie bread, processed bread, sandwiches
(Notes)
Includes production activities of manufacturing of goods that
are manufactured and sold within retail stores.
Column Code Row Code Sector Name
1114-03 1114-031 Confectionery
(Ministry or agency in charge)
Ministry of Agriculture, Forestry and Fisheries
(Definition, Scope)
The production activities of “Pastries and cakes” listed under
Industry Number 0972, “Biscuits, crackers and other dry bakery
products” listed under Industry Number 0973, “Rice confection-
ery” listed under Industry Number 0974, “Miscellaneous bakery
and confectionery products” listed under Industry Number 0979,
instant cocoa as specified in “Food and related products, n.e.c”
listed under Industry Number 0999, and activities of manufac-
turing of “Retail confectioneries (manufacturer-sellers)” listed
under Industry Number 5861 of the Japan Standard Industrial
Classification.
(Given examples)
Caramel, sweet drops, candies, chocolate, chewing gums,
baked cookies, biscuits, rice cakes, Japanese cakes, cakes, snack
cookies, fatty cakes, cocoa
(Notes)
Includes production activities of manufacturing of goods that
are manufactured and sold within retail stores.
Column Code Row Code Sector Name
1115-01 1115-011 Preserved agricultural foodstuffs
(Ministry or agency in charge)
Ministry of Agriculture, Forestry and Fisheries
(Definition, Scope)
The production activities for “CANNED AND PRESERVED
FRUIT AND VEGETABLE PRODUCTS” listed under Group
Number 093 of the Japan Standard Industrial Classification.
(Given examples)
Dried vegetables, frozen vegetables, pickles, cup-jam, dried
squash, dried cut radishes, mashed potatoes, dried persimmons,
bottled or canned vegetables, bottled or canned fruits, condensed
undiluted fruit juice
(Changes from the 2011 I-O Tables)
Bottled or canned jams, bottled or canned vegetables, bottled
or canned fruits, and condensed undiluted fruit juice classified
under “1116-01, -011 Bottled or canned vegetables and fruits” in
the 2011 I-O Tables are integrated into this sector.
(Notes)
(1) Fruit and vegetable juices other than undiluted condensed
fruit juices are classified in “1129-02, -021 Soft drinks,”
and canned cakes are classified in “1114-03, -031 Confec-
tionery.”
(2) Bottled or canned gravy sauce, soup, and tomato-based
products (ketchup, puree) excluding juice, are classified in
“1116-05, -051 Condiments and seasonings”
- 147 -

Column Code Row Code Sector Name
1116-01 Sugar
1116-011 Refined sugar
1116-019 Miscellaneous sugar and by-
products of sugar manufac-
turing
(Ministry or agency in charge)
Ministry of Agriculture, Forestry and Fisheries
(Definition, Scope)
The production activities for “Sugar, except refined sugar”
listed under Industry Number 0951 and “Refined sugar products”
listed under Industry Number 0952 of the Japan Standard Indus-
trial Classification.
(Given examples)
Refined sugar (beet sugar, sugarcane), unrefined sugar, by-
products (molasses, beet pulp)
(Notes)
This sector covers the production activities of non-refined
sugar from cane (domestic) and of refined sugar from non-re-
fined sources, but does not record their production value that
carry out these processes because of input within their own sec-
tor.
Column Code Row Code Sector Name
1116-02 1116-021 Starch
(Ministry or agency in charge)
Ministry of Agriculture, Forestry and Fisheries
(Definition, Scope)
The production activities for “Starch” listed under Industry
Number 0991 of the Japan Standard Industrial Classification.
(Given examples)
Sweet potato starch, potato starch, wheat starch, corn starch,
starch lees
Column Code Row Code Sector Name
1116-03 1116-031 Dextrose, syrup and isomerized
sugar
(Ministry or agency in charge)
Ministry of Agriculture, Forestry and Fisheries
(Definition, Scope)
The production activities for “Glucose, starch syrup and high-
fructose corn syrup” listed under Industry Number 0953 of the
Japan Standard Industrial Classification.
(Given examples)
Dextrose (dextrose (glucose) anhydrous, dextrose (glucose)
monohydrate, dextrose (glucose) total sugar type), syrup (syrup,
dried syrup), isomerized sugar
Column Code Row Code Sector Name
1116-04 Animal oil and fats, vegetable
oil and meal
1116-041 Vegetable oil
1116-042 Animal oils and fats
1116-043 Cooking oil
1116-044 Vegetable meal
(Ministry or agency in charge)
Ministry of Agriculture, Forestry and Fisheries
(Definition, Scope)
The production activities for hardened oils (edible oils) listed
among those specified in “ANIMAL AND VEGETABLE OILS
AND FATS” under Group Number 098, and “Fatty acids, hydro-
genated oils and glycerin” under Industry Group Number 1641
of the Japan Standard Industrial Classification.
The competing sector of the other sector’s scrap and by-prod-
ucts (fruit juice strained lees, vegetable scrap) is “Vegetable
meal.”
(Given examples)
Vegetable oils and fats: Edible rape seed oil, edible bean oil,
non-edible vegetable oils (linseed oil, castor oil)
Animal oils and fats: Animal oils and fats, refined lard, fish
oils
Cooking oil: Margarine, shortening, purification lard
Vegetable meal: Rapeseed meal, soy meal, rice bran meal
Column Code Row Code Sector Name
1116-05 1116-051 Condiments and seasonings
(Ministry or agency in charge)
Ministry of Agriculture, Forestry and Fisheries
(Definition, Scope)
The production activities for “SEASONINGS” listed under
Group Number 094 of the Japan Standard Industrial Classifica-
tion.
(Given examples)
Soybean paste, soy sauce, edible amino-acids, sauce, mayon-
naise, tomato ketchup, tomato puree, edible acids, instant curry,
glutamic acid soda, spices, soup, fermented seasonings, flavorings,
gravy sauce, soba soup, rice and tea, toppings, instant soy bean
- 148 -

soup, clear soup, mayonnaise by-products (albumen)
Column Code Row Code Sector Name
1119-01 1119-011 Prepared frozen foods
(Ministry or agency in charge)
Ministry of Agriculture, Forestry and Fisheries
(Definition, Scope)
The production activities for “Precooked frozen packed foods”
listed under Industry Number 0995 of the Japan Standard Indus-
trial Classification.
(Given examples)
Prepared frozen fried foods (croquettes, pork steak, fried fish),
prepared frozen rice and grain, prepared frozen hamburgers, pre-
pared frozen meat balls with rice powder covering
Column Code Row Code Sector Name
1119-02 1119-021 Retort foods
(Ministry or agency in charge)
Ministry of Agriculture, Forestry and Fisheries
(Definition, Scope)
The production activities for “Retort pouch” listed under In-
dustry Number 0998 of the Japan Standard Industrial Classifica-
tion.
(Given examples)
Retort foods (Curry, bean curd flavor, meat sauce, soup)
Column Code Row Code Sector Name
1119-03 1119-031 Dishes, sushi and lunch boxes
(Ministry or agency in charge)
Ministry of Agriculture, Forestry and Fisheries
(Definition, Scope)
The production activities for “‘Sozai’ (side-dish foods)” listed
under Industry Number 0996, sushi and lunch boxes as specified
in “Sushi, box lunch and bread with ingredients” listed under In-
dustry Number 0997, and manufacturing as part of “Delicatessen
stores” listed under Industry Number 5895 of the Japan Standard
Industrial Classification.
(Given examples)
Side-dishes, sushi, lunch boxes
(Notes)
(1) Includes production activities for manufacturing food
manufactured and sold inside retail stores.
(2) Processed breads and sandwiches are classified under
“1114-02, -021 Bread.”
Column Code Row Code Sector Name
1119-09 1119-099 Miscellaneous foods
(Ministry or agency in charge)
Ministry of Agriculture, Forestry and Fisheries
(Definition, Scope)
The production activities for “ “ Tofu” (bean curd)and
“Aburage”(fried bean curd) ” listed under Industry Number 0993,
“Anko (sweet bean paste) and other related products” listed un-
der Industry Number 0994, and production activities other than
for instant cocoa as specified in “Food and related products, n.e.c”
listed under Industry Number 0999 of the Japan Standard Indus-
trial Classification.
(Given examples)
Tofu, aburage (fried bean curd), nama-age, ganmodoki, nama-
an (sweet bean paste), konnyaku, natto (fermented soybeans),
mugicha (barley tea), ripe bananas, juice powder, rice cakes,
canned processed food (canned curry, canned meat sauce,
canned soup, etc.)
(Changes from the 2011 I-O Tables)
(1) Canned processed food (canned curry, canned meat sauce,
canned soup, etc.) classified under “1112-02, -021 Bottled
or canned meat products” in the 2011 I-O Tables is inte-
grated into this sector.
(2) Miscellaneous livestock products (refined honey, dried
eggs, etc.) classified under this sector in the 2011 I-O Tables
are integrated into “1111-09, -099 Miscellaneous livestock
products.”
(Notes)
Frozen meat (including chicken) classified under this sector in
the 2005 I-O Tables was integrated into “1111-01 Meat” in the
2011 I-O Tables.
Column Code Row Code Sector Name
1121-01 1121-011 Refined sake
(Ministry or agency in charge)
Ministry of Finance
(Definition, Scope)
The production activities for “Sake” (Japanese rice wine)”
listed under Industry Number 1023 and the production activities
for mirin as specified in “Distilled, rectified and blended liquors”
listed under Industry Number 1024 of the Japan Standard Indus-
trial Classification.
- 149 -

(Given examples)
Refined sake, mirin, sake lees, mirin lees
Column Code Row Code Sector Name
1121-02 1121-021 Malt liquors
(Ministry or agency in charge)
Ministry of Finance
(Definition, Scope)
The production activities for “Malt liquors” listed under In-
dustry Number 1022 of the Japan Standard Industrial Classifica-
tion.
(Given examples)
Beer, hops, beer lees, dry yeast, fresh yeast, low-malt beer
Column Code Row Code Sector Name
1121-03 1121-031 Whiskey and brandy
(Ministry or agency in charge)
Ministry of Finance
(Definition, Scope)
The production activities for whiskey and brandy listed
among those of “Distilled, rectified and blended liquors” speci-
fied under Industry Number 1024 of the Japan Standard Indus-
trial Classification.
Column Code Row Code Sector Name
1121-09 1121-099 Miscellaneous liquors
(Ministry or agency in charge)
Ministry of Finance
(Definition, Scope)
The production activities for “Wine, except “sake” (Japanese
rice wine)” listed under Industry Number 1021 and “Distilled,
rectified and blended liquors” excluding the production of whis-
key, brandy, and mirin listed under Industry Number 1024 of the
Japan Standard Industrial Classification.
(Given examples)
Fruit liquors, synthetic sake, shochu, spirits, liquors, miscel-
laneous brewage, miscellaneous liquors, additive alcohol
Column Code Row Code Sector Name
1129-01 1129-011 Tea and roasted coffee
(Ministry or agency in charge)
Ministry of Agriculture, Forestry and Fisheries
(Definition, Scope)
The production activities for “TEA AND COFFEE, EXCEPT
SOFT DRINKS AND CARBONATED WATER” listed under
Group Number 103 of the Japan Standard Industrial Classifica-
tion.
(Given examples)
Green tea, tea, chinese tea, coffee
(Notes)
Coffee drinks, tea drinks and Chinese tea drinks are classified
under “1129-02, -021 Soft drinks.” Barley tea is classified under
“1119-09, -099 Miscellaneous foods.” Cocoa is classified under
“1114-03, -031 Confectionery”
Column Code Row Code Sector Name
1129-02 1129-021 Soft drinks
(Ministry or agency in charge)
Ministry of Agriculture, Forestry and Fisheries
(Definition, Scope)
The production activities for “SOFT DRINKS AND CAR-
BONATED WATER” listed under Group Number 101 of the Ja-
pan Standard Industrial Classification
(Given examples)
Carbonated drinks, fruit beverages, green tea beverages, tea
drinks, oolong tea beverages, coffee drinks, barley tea beverages,
soy milk beverages, mineral water, sports drinks, vegetable
juices
(Changes from the 2011 I-O Tables)
Vegetable juice classified under “1116-01, -011 Bottled or
canned vegetables and fruits” in the 2011 I-O Tables is integrated
into this sector.
(Notes)
Fermented milk and lactic acid beverages are classified in
“1111-02 Dairy farm products” and “1111-022 Dairy products”;
undiluted condensed fruit juices and natural fruit juices are clas-
sified in “1115-01, -011 Preserved agricultural foodstuffs.”
Column Code Row Code Sector Name
1129-03 1129-031 Manufactured ice
(Ministry or agency in charge)
Ministry of Agriculture, Forestry and Fisheries
(Definition, Scope)
The production activities for “MANUFACTURED ICE”
listed under Group Number 104 of the Japan Standard Industrial
Classification.
- 150 -

(Given examples)
Salable ice
Column Code Row Code Sector Name
1131-01 1131-011 Feeds
(Ministry or agency in charge)
Ministry of Agriculture, Forestry and Fisheries
(Definition, Scope)
The production activities for “Balanced compound feeds”
listed under Industry Group Number 1061 and “Elemental feeds”
listed under Industry Group Number 1062 of the Japan Standard
Industrial Classification.
This sector is the competing sector of the other sector’s scrap
and by-products (meat scrap, cocoon scrap and by-products).
(Given examples)
Feed for livestock and poultry, feed for fish farming, pet foods,
fish meal
Column Code Row Code Sector Name
1131-02 1131-021 Organic fertilizers, n.e.c.
(Ministry or agency in charge)
Ministry of Agriculture, Forestry and Fisheries
(Definition, Scope)
The production activities for “Organic fertilizers” listed under
Industry Number 1063 of the Japan Standard Industrial Classifi-
cation.
(Given examples)
Animal-based organic fertilizers (fish meal, meat and bone
meal, processed poultry manure), plant-based organic fertilizers
(rape seed oil lees, rice bran oil lees, cotton oil lees), others (ma-
nure)
(Notes)
N.e.c. refers to the column sector “0121-01 Dairy cattle farm-
ing” and row columns “0121-019 Miscellaneous dairy farming
products,” “0121-02, -021 Beef cattle,” “0121-03, -031 Pork,”
“0121-04, -041 Hen eggs,” and “0121-05, -051 Chickens,” as
well as manure and chicken manure classified under the column
sector “0121-09, -099 Miscellaneous livestock.”
Column Code Row Code Sector Name
1141-01 1141-011 Tobacco
(Ministry or agency in charge)
Ministry of Finance
(Definition, Scope)
The production activities of “TOBACCO MANUFACTURES”
listed under Group Number 105 of the Japan Standard Industrial
Classification.
(Given examples)
Rolled cigarettes, cigars, loose tobacco, pipe tobacco
- 151 -

15 Textile products
Column Code Row Code Sector Name
1511-01 1511-011 Fiber yarns
(Ministry or agency in charge)
Ministry of Economy, Trade and Industry
(Definition, Scope)
The production activities exclusive of “Chemical fibers” listed
under Industry Number 1112 and “Carbon fibers” listed under
Industry Number 1113, as specified in “SILK REELING, SPIN-
NING, CHEMICAL FIBERS AND TWISTING AND BULKY
YARNS” listed under Group Number 111 of the Japan Standard
Industrial Classification.
(Given examples)
Natural fibers (silk, by-product silk), cotton yarns (cotton fi-
ber, mixed cotton fiber), chemical fibers (viscose staple, cupra sta-
ple, acetate, vinylon, nylon, acrylic, polyester, polypropylene),
wool yarns (raw wool fiber, spun wool yarns), twisted yarn, bulk
processed fibers, other fibers (silk, saku, noil silk yarn, hemp,
wa-fiber, etc.)
Column Code Row Code Sector Name
1512-01 1512-011 Cotton and staple fiber fabrics
(including fabrics of synthetic
spun fibers)
(Ministry or agency in charge)
Ministry of Economy, Trade and Industry
(Definition, Scope)
The production activities of “Woven cotton and staple fiber
fabrics” listed under Industry Number 1121 of the Japan Stand-
ard Industrial Classification.
(Given examples)
Cotton fabrics, viscose staple fiber fabrics, chemical fiber fab-
rics, cotton, staple fiber, and synthetic fiber textile
(Notes)
(1) Fabrics of 13.0 cm or less width shall be classified as nar-
row width fabrics in the sector “1519-09, -009 Miscellane-
ous fabrics.” (This criteria applies throughout the textile
products sector.)
(2) The production value includes those products commissioned
from non-manufacturing businesses. (This applies through-
out the textile products sector.)
Column Code Row Code Sector Name
1512-02 1512-021 Silk and artificial silk fabrics
(including fabrics of synthetic
filament fibers)
(Ministry or agency in charge)
Ministry of Economy, Trade and Industry
(Definition, Scope)
The production activities of “Woven silk and rayon fabrics”
listed under Industry Number 1122 of the Japan Standard Indus-
trial Classification.
(Given examples)
Silk textiles, silk fabrics, artificial silk fabrics, synthetic long
filament fiber fabrics, chemical fiber tire cord
(Notes)
(1) Fabrics of 13.0 cm or less width shall be classified as nar-
row width fabrics in the sector “1519-09, -009 Miscellane-
ous fabrics.” (This criteria applies throughout the textile
products sector.)
(2) The production value includes those products commis-
sioned from non-manufacturing businesses. (This applies
throughout the textile products sector.)
Column Code Row Code Sector Name
1512-09 1512-099 Miscellaneous fabrics
(Ministry or agency in charge)
Ministry of Economy, Trade and Industry
(Definition, Scope)
The production activities of “Woven woolen and worsted fab-
rics” listed under Industry Number 1123, “Woven hard and bast
fiber fabrics” listed under Industry Number 1124, “Narrow wo-
ven fabrics” listed under Industry Number 1125, and “Miscella-
neous woven fabrics” listed under Industry Number 1129 of the
Japan Standard Industrial Classification.
(Given examples)
Woven woolen and worsted fabric (worsted wool cloth, other
worsted wool fiber fabrics, spun woolen cloth, other spun
woolen fiber fabrics, other wool fiber fabrics), woven hard and
best fiber fabrics (flax, ramie, jute, fiber hoses, woven synthetic
fiber fabrics,) narrow-width fabrics, miscellaneous fabrics (mo-
quette, etc.)
(Notes)
(1) Fabrics less than 13.0 cm in width are classified as narrow-
width fabrics in this sector, regardless of what type of yarn
they are made.
(2) The production value includes those products commis-
sioned from non-manufacturing businesses.
- 152 -

(3) Narrow woven fabrics, which were classified under
“1519-09, -009 Miscellaneous fabrics” in the 2005 I-O ta-
bles, are integrated into this sector
Column Code Row Code Sector Name
1513-01 1513-011 Knitting fabrics
(Ministry or agency in charge)
Ministry of Economy, Trade and Industry
(Definition, Scope)
The production activities of “KNIT FABRICS” listed under
Group Number 113 of the Japan Standard Industrial Classifica-
tion.
(Given examples)
Circular knitted textiles, knitted textiles (horizontal), knitted
textiles (vertical)
Column Code Row Code Sector Name
1514-01 1514-011 Yarn and fabric dyeing and fin-
ishing (processing on commis-
sion only)
(Ministry or agency in charge)
Ministry of Economy, Trade and Industry
(Definition, Scope)
The production activities for “DYED AND FINISHED TEX-
TILES” listed under Group Number 114 of the Japan Standard
Industrial Classification.
(Notes)
The production value is split into the market value (raw mate-
rials purchase value) and the trade commission (supplied mate-
rials value). However, this sector is defined to cover only the
production activities for dyeing and finishing that does not pur-
chase the raw materials, and the raw materials purchase value is
deducted from the market value.
Column Code Row Code Sector Name
1519-09 Miscellaneous fabricated textile
products
1519-091 Ropes and nets
1519-099 Fabricated textiles products,
n.e.c.
(Ministry or agency in charge)
Ministry of Economy, Trade and Industry
(Definition, Scope)
The production activities for “ROPE, NETTING, LACE AND
CRUDE TEXTILE PRODUCTS” listed under Group Number
115 of the Japan Standard Industrial Classification.
(Given examples)
Ropes and nets: Ropes, cordage, twine, fishing net, net cloth
other than fishing net
Fabricated textiles products, n.e.c.: Lace fabrics, miscellane-
ous textile goods, braids, scoured and combined wool
(scoured wool fabrics, tops, reclaimed wool fabrics), felt,
non-woven fabrics, dry laid non-woven fabrics, coated fab-
rics, water-proof fabrics, miscellaneous crude textile goods
(futon cotton, lily yarns, laces, tassels, etc.)
Column Code Row Code Sector Name
1521-01 1521-011 Woven fabric apparel
(Ministry or agency in charge)
Ministry of Economy, Trade and Industry
(Definition, Scope)
The production activities for “Men’s and boys’ textile outer
garments, including bonded fabrics and lace products” listed un-
der Industry Number 1161, “Ladies’ and girls’ textile outer gar-
ments, including bonded fabrics and lace products” listed under
Industry Number 1162, “Infants' textile outer garments, includ-
ing bonded fabrics and lace products” listed under Industry
Number 1163, “Textile shirts, including bonded fabrics and lace
products, except underwear” listed under Industry Number 1164,
“Textile business, work, sanitary, sport clothing and school uni-
forms, including bonded fabrics and lace products” listed under
Industry Number 1165, “Textile underwear” listed under Indus-
try Number 1171, textile products as specified in “Textile and
knitted nightclothes” listed under Industry Number 1173, and
“Japanese style apparel, including Japanese ‘tabi’-socks” listed
under Industry Number 1181 of the Japan Standard Industrial
Classification. Also includes activities related to manufacturing
within clothing manufacture and retail.
(Given examples)
Men’s and boys’ clothing, women’s and girls’ clothing, infants’
clothing, shirts, business, work and sanitary clothing, sports
clothing, school uniforms, underwear, nightwear, kimono prod-
ucts (readymade Japanese kimono, obi, shawls, tabi, etc.)
(Notes)
(1) The production value includes those products outsourced
production commissioned from non-manufacturers.
(2) Tabi socks, which were classified under “1522-09, -099
Miscellaneous wearing apparel and clothing accessories” in
the 2005 I-O Tables, were integrated into this sector in the
2011 I-O Tables.
- 153 -

Column Code Row Code Sector Name
1521-02 1521-021 Knitted apparel
(Ministry or agency in charge)
Ministry of Economy, Trade and Industry
(Definition, Scope)
The production activities for “Knitted garments, except outer
shirts and sweater” listed under Industry Number 1166, “Knitted
outer shirts” listed under Industry Number 1167, “Sweaters” listed
under Industry Number 1168, “Miscellaneous garments and
shirts” listed under Industry Number 1169, “Knitted underwear”
listed under Industry Number 1172, knitted goods specified in
“Textile and knitted nightclothes” listed under Industry Number
1173, and “Foundation garments” listed under Industry Number
1174 of the Japan Standard Industrial Classification.
(Given examples)
Outer shirts, sweaters, other garments and shirts (men’s and
boys’ clothing, women’s and girls’ clothing, infants’ clothing,
sport clothing, swimming wear, etc.), underwear, nightwear,
foundation garments
(Notes)
The production value includes outsourced production com-
missioned from non-manufacturers
Column Code Row Code Sector Name
1522-09 1522-099 Miscellaneous wearing apparel
and clothing accessories
(Ministry or agency in charge)
Ministry of Economy, Trade and Industry
(Definition, Scope)
The production activities of “Ties” listed under Industry Num-
ber 1182, “Scarfs, mufflers and handkerchiefs” listed under In-
dustry Number 1183, “Hosiery” listed under Industry Number
1184, “Gloves” listed under Industry Number 1185, “Hats, in-
cluding hat bodies” listed under Industry Number 1186, and
“Textile apparel and accessories, n.e.c.” listed under Industry
Number 1189 of the Japan Standard Industrial Classification.
(Given examples)
Neck-ties, scarves, mufflers, handkerchiefs, socks, gloves,
hats, fur apparel, apparel accessories and notions, leather apparel,
fabric footwear
Column Code Row Code Sector Name
1529-01 1529-011 Bedding
(Ministry or agency in charge)
Ministry of Economy, Trade and Industry
(Definition, Scope)
The production activities for “Bedding” listed under Industry
Number 1191 and “Blankets” listed under Industry Number 1192
of the Japan Standard Industrial Classification.
(Given examples)
Futons, down futons, other bedding (futon covers, sheets, cot-
ton blankets, pillows, cushions, sleeping bags, etc.), blankets
Column Code Row Code Sector Name
1529-02 1529-021 Carpets and floor mats
(Ministry or agency in charge)
Ministry of Economy, Trade and Industry
(Definition, Scope)
The production activities for “Carpets and other textile mats”
listed under Industry Number 1193 of the Japan Standard Indus-
trial Classification.
(Given examples)
Carpets, rugs, turf carpet, palm-leaf flooring, floor padding
and fabricated flooring textile
Column Code Row Code Sector Name
1529-09 Miscellaneous ready-made
textile products
1529-091 Fabricated textiles for
medical use
1529-099
Readymade textile products,
n.e.c.
(Ministry or agency in charge)
Ministry of Economy, Trade and Industry
(Definition, Scope)
The production activities for “Canvas products” listed under In-
dustry Number 1194, “Textile bags” listed under Industry Number
1195, “Embroidery” listed under Industry Number 1196, “Towels”
listed under Industry Number 1197, “Textile sanitary materials”
listed under Industry Number 1198, and “Textile products, n.e.c.”
listed under Industry Number 1199 of the Japan Standard Indus-
trial Classification.
(Given examples)
Fabricated textiles for medical use: Gauze, bandages, absor-
bent cotton, sticking plasters/adhesive bandages (fabric),
sanitary masks, triangular bandages, eye bandages, cotton
swabs
Readymade textile products, n.e.c.: Canvas products (sheets,
- 154 -

tents, and awnings), fabricated bags (hemp sack, cotton
sack, and synthetic fiber sack), embroidery products, towels,
curtains, tablecloths
16 Pulp, paper and wooden products
Column Code Row Code Sector Name
1611-01 1611-011 Timber
(Ministry or agency in charge)
Ministry of Agriculture, Forestry and Fisheries
(Definition, Scope)
The production activities of “General sawing and planing
wood” listed under Industry Number 1211 of the Japan Standard
Industrial Classification.
Scrap and by-products (wood chips), which appeared in other
sectors, consider this sector as a competitor.
(Given examples)
Boards, small square , sawn square woods , scrap
Column Code Row Code Sector Name
1611-02 1611-021 Plywood, glued laminated timber
(Ministry or agency in charge)
Ministry of Agriculture, Forestry and Fisheries
(Definition, Scope)
The production activities for “Veneer wood” listed under In-
dustry Number 1212; “Plywood” listed under Industry Number
1222; and “Glued laminated timber” listed under Industry Num-
ber 1223 of the Japan Standard Industrial Classification.
(Given examples)
Single board, general plywood, special plywood, laminboards
(Changes from the 2011 I-O Tables)
Floorings classified under this sector in the 2011 I-O Tables
are integrated into column sector “1619-09 Miscellaneous
wooden products” and row sector “1619-091 Wooden products
for construction.”
Column Code Row Code Sector Name
1611-03 1611-031 Wooden chips
(Ministry or agency in charge)
Ministry of Agriculture, Forestry and Fisheries
(Definition, Scope)
The production activities of “Wood chip” listed under Indus-
try Number 1213 of the Japan Standard Industrial Classification.
- 155 -
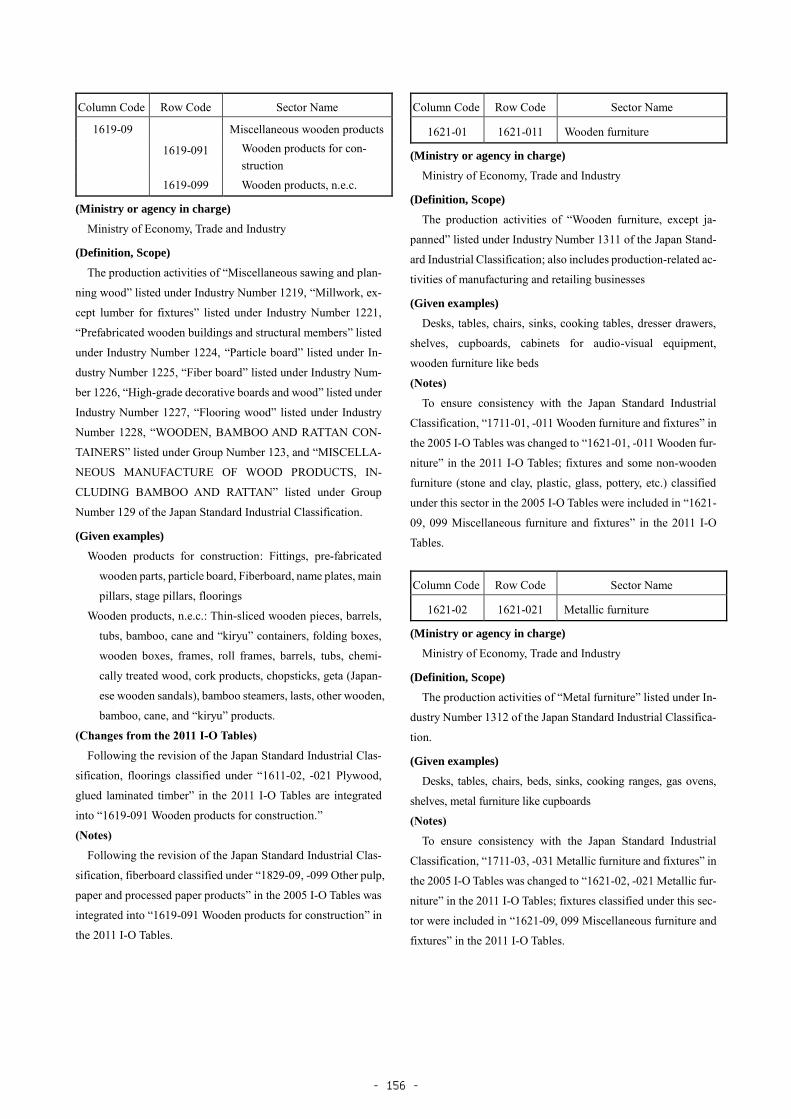
Column Code Row Code Sector Name
1619-09 Miscellaneous wooden products
1619-091 Wooden products for con-
struction
1619-099 Wooden products, n.e.c.
(Ministry or agency in charge)
Ministry of Economy, Trade and Industry
(Definition, Scope)
The production activities of “Miscellaneous sawing and plan-
ning wood” listed under Industry Number 1219, “Millwork, ex-
cept lumber for fixtures” listed under Industry Number 1221,
“Prefabricated wooden buildings and structural members” listed
under Industry Number 1224, “Particle board” listed under In-
dustry Number 1225, “Fiber board” listed under Industry Num-
ber 1226, “High-grade decorative boards and wood” listed under
Industry Number 1227, “Flooring wood” listed under Industry
Number 1228, “WOODEN, BAMBOO AND RATTAN CON-
TAINERS” listed under Group Number 123, and “MISCELLA-
NEOUS MANUFACTURE OF WOOD PRODUCTS, IN-
CLUDING BAMBOO AND RATTAN” listed under Group
Number 129 of the Japan Standard Industrial Classification.
(Given examples)
Wooden products for construction: Fittings, pre-fabricated
wooden parts, particle board, Fiberboard, name plates, main
pillars, stage pillars, floorings
Wooden products, n.e.c.: Thin-sliced wooden pieces, barrels,
tubs, bamboo, cane and “kiryu” containers, folding boxes,
wooden boxes, frames, roll frames, barrels, tubs, chemi-
cally treated wood, cork products, chopsticks, geta (Japan-
ese wooden sandals), bamboo steamers, lasts, other wooden,
bamboo, cane, and “kiryu” products.
(Changes from the 2011 I-O Tables)
Following the revision of the Japan Standard Industrial Clas-
sification, floorings classified under “1611-02, -021 Plywood,
glued laminated timber” in the 2011 I-O Tables are integrated
into “1619-091 Wooden products for construction.”
(Notes)
Following the revision of the Japan Standard Industrial Clas-
sification, fiberboard classified under “1829-09, -099 Other pulp,
paper and processed paper products” in the 2005 I-O Tables was
integrated into “1619-091 Wooden products for construction” in
the 2011 I-O Tables.
Column Code Row Code Sector Name
1621-01 1621-011 Wooden furniture
(Ministry or agency in charge)
Ministry of Economy, Trade and Industry
(Definition, Scope)
The production activities of “Wooden furniture, except ja-
panned” listed under Industry Number 1311 of the Japan Stand-
ard Industrial Classification; also includes production-related ac-
tivities of manufacturing and retailing businesses
(Given examples)
Desks, tables, chairs, sinks, cooking tables, dresser drawers,
shelves, cupboards, cabinets for audio-visual equipment,
wooden furniture like beds
(Notes)
To ensure consistency with the Japan Standard Industrial
Classification, “1711-01, -011 Wooden furniture and fixtures” in
the 2005 I-O Tables was changed to “1621-01, -011 Wooden fur-
niture” in the 2011 I-O Tables; fixtures and some non-wooden
furniture (stone and clay, plastic, glass, pottery, etc.) classified
under this sector in the 2005 I-O Tables were included in “1621-
09, 099 Miscellaneous furniture and fixtures” in the 2011 I-O
Tables.
Column Code Row Code Sector Name
1621-02 1621-021 Metallic furniture
(Ministry or agency in charge)
Ministry of Economy, Trade and Industry
(Definition, Scope)
The production activities of “Metal furniture” listed under In-
dustry Number 1312 of the Japan Standard Industrial Classifica-
tion.
(Given examples)
Desks, tables, chairs, beds, sinks, cooking ranges, gas ovens,
shelves, metal furniture like cupboards
(Notes)
To ensure consistency with the Japan Standard Industrial
Classification, “1711-03, -031 Metallic furniture and fixtures” in
the 2005 I-O Tables was changed to “1621-02, -021 Metallic fur-
niture” in the 2011 I-O Tables; fixtures classified under this sec-
tor were included in “1621-09, 099 Miscellaneous furniture and
fixtures” in the 2011 I-O Tables.
- 156 -

Column Code Row Code Sector Name
1621-03 1621-031 Wooden fixtures
(Ministry or agency in charge)
Ministry of Economy, Trade and Industry
(Definition, Scope)
The production activities for “FIXTURES” as listed under
Group Number 133 of the Japan Standard Industrial Classifica-
tion; also includes production-related activities of manufacturing
and retailing businesses
(Given examples)
Window screens (wooden sliding doors and windows), paper
sliding doors, paper screens
Column Code Row Code Sector Name
1621-09 1621-099 Miscellaneous furniture and fix-
tures
(Ministry or agency in charge)
Ministry of Economy, Trade and Industry
(Definition, Scope)
The production activities of “Mattresses and box springs”
listed under Industry Number 1313, “FURNITURE FOR RELI-
GIOUS PURPOSES” listed under Group Number 132, and
“MISCELLANEOUS FURNITURE AND FIXTURES” listed
under Group Number 139 of the Japan Standard Industrial Clas-
sification; also includes production-related activities of manu-
facturing and retailing businesses
(Given examples)
Bed mattresses, box springs, religious articles, office and store
fixtures (showcases, accordion style curtains), windows and
door screens (blinds, etc.), Japanese folding screens, clothes
racks, bamboo screens, screens, frames for mirrors and pictures,
blackboards, plastic furniture, pottery furniture, stone and clay
furniture
(Notes)
To ensure consistency with the Japan Standard Industrial
Classification, this sector was established for the 2011 I-O Ta-
bles to hold “Mattresses and box springs” listed under Industry
Number 1313, “FURNITURE FOR RELIGIOUS PURPOSES”
listed under Group Number 132, and “MISCELLANEOUS
FURNITURE AND FIXTURES” listed under Group Number
139 of the Japan Standard Industrial Classification, which had
been classified under “1711-01, -011 Wooden furniture and fix-
tures” and “1711-03, -031 Metallic furniture and fixture” in the
2005 I-O Tables.
Column Code Row Code Sector Name
1631-01 1631-011 Pulp
(Ministry or agency in charge)
Ministry of Economy, Trade and Industry
(Definition, Scope)
The production activities for “PULP” listed under Group
Number 141 of the Japan Standard Industrial Classification.
(Given examples)
Dissolved pulp, processing pulp
Column Code Row Code Sector Name
1631-021P Used paper
(Ministry or agency in charge)
Ministry of Economy, Trade and Industry
(Definition, Scope)
This sector is a competing sector for waste paper generated by
the production activities of various sectors, as well as in the final
demand sector.
(Notes)
There is no competing sector that yields waste paper as its ma-
jor product; therefore, a dummy sector showing the row number
is created.
Column Code Row Code Sector Name
1632-01 1632-011 Paper
(Ministry or agency in charge)
Ministry of Economy, Trade and Industry
(Definition, Scope)
Production of “Paper” listed under Industry Number 1421,
“Machine-made Japanese style paper” listed under Industry
Number 1423, and “Hand-made Japanese style paper” listed un-
der Industry Number 1424 of the Japan Standard Industrial Clas-
sification, and production of washi (Japanese paper) used in cur-
rency printed by the National Printing Bureau.
(Given examples)
Paper for newspaper, printing paper, information paper, pack-
aging paper, sanitary paper, other paper, hand-made Japanese pa-
per, Japanese washi for bill on banknote
(Notes)
The sanitary paper included in this sector refers to crude pa-
per; products such as tissue paper and toilet paper are included
in “1649-01, -011 Paper textile for medical use”
- 157 -

Column Code Row Code Sector Name
1632-02 1632-021 Paperboard
(Ministry or agency in charge)
Ministry of Economy, Trade and Industry
(Definition, Scope)
The production activities for “Paperboard” listed under Indus-
try Number 1422 of the Japan Standard Industrial Classification.
(Given examples)
Corrugated paper, white paper, colored paper, paper for con-
struction use, other flat paper
Column Code Row Code Sector Name
1633-01 1633-011 Corrugated cardboard
(Ministry or agency in charge)
Ministry of Economy, Trade and Industry
(Definition, Scope)
The production activities for “Corrugated board” listed under
Industry Number 1432 of the Japan Standard Industrial Classifi-
cation.
(Given examples)
Corrugated cardboard (sheet)
Column Code Row Code Sector Name
1633-02 1633-021 Coated paper and building (con-
struction) paper
(Ministry or agency in charge)
Ministry of Economy, Trade and Industry
(Definition, Scope)
The production activities for “Coated paper, except printing
paper” listed under Industry Number 1431, and “Wall paper and
sliding door (“fusuma”) paper” listed under Industry Number
1433 of the Japan Standard Industrial Classification.
(Given examples)
Insulating paper, insulating tape, asphalt-based coated paper,
book binding cloth, other coated paper, processed paper, wall pa-
per, fusuma (paper wall) paper
Column Code Row Code Sector Name
1641-01 1641-011 Corrugated card board boxes
(Ministry or agency in charge)
Ministry of Economy, Trade and Industry
(Definition, Scope)
The production activities for “Corrugated board boxes” listed
under Industry Number 1453 of the Japan Standard Industrial
Classification.
Column Code Row Code Sector Name
1641-09 1641-099 Miscellaneous paper containers
(Ministry or agency in charge)
Ministry of Economy, Trade and Industry
(Definition, Scope)
The production activities for “Sacks for heavy weight ship-
ping” listed under Industry Number 1451, “Square bottom paper
bags” listed under Industry Number 1452, and “Paperboard
boxes, cups and plates” listed under Industry Number 1454 of
the Japan Standard Industrial Classification.
(Given examples)
Packaging sacks for use with heavy items (cement sacks, rice
and wheat sacks, etc.), paper sacks with rectangular bottoms
(shopping bags, paper carrying bags, etc.), paper boxes (folded
paper boxes, wire-stitched boxes, boxes made of paper and glue,
etc.), and other paper containers (tubes, cups, plates, etc.)
Column Code Row Code Sector Name
1649-01 1649-011 Paper textile for medical use
(Ministry or agency in charge)
Ministry of Economy, Trade and Industry
(Definition, Scope)
The production activities for paper textile materials and prod-
ucts for medical use as specified in “MISCELLANEOUS PULP,
PAPER AND PAPER PRODUCTS” listed under Group Number
149 of the Japan Standard Industrial Classification.
(Given examples)
Paper sanitary materials (sanitary paper and cotton, sanitary
cotton pulp, etc.), paper sanitary products (diapers, towels, nap-
kins, sanitary supplies, tissue paper, toilet paper, etc.)
(Notes)
Base paper for tissue and toilet paper production is included
in “1632-01, -011 Paper.”
Column Code Row Code Sector Name
1649-09 1649-099 Miscellaneous pulp, paper and
processed paper products
(Ministry or agency in charge)
Ministry of Economy, Trade and Industry
(Definition, Scope)
The production activities for “PAPER PRODUCTS” listed
- 158 -

under Group Number 144, and “MISCELLANEOUS PULP, PA-
PER AND PAPER PRODUCTS” excluding production activi-
ties for sanitary paper materials and products listed under Group
Number 149 of the Japan Standard Industrial Classification.
(Given examples)
Paper and fabric book-binding cloth, office paper supplies, pa-
per supplies for schools, paper supplies for home use, cellophane,
paper tubes, paper string, paper tape, solid fiber products and
vulcanized fiber products
(Notes)
Fiberboard, which was classified under this sector in the 2005
I-O Tables, was integrated into column sector “1619-09 Miscel-
laneous wooden products” and the row sector “1619-091
Wooden products for construction.”
20 Chemical products
Column Code Row Code Sector Name
2011-01 2011-011 Chemical fertilizer
(Ministry or agency in charge)
Ministry of Economy, Trade and Industry
(Definition, Scope)
The production activities for “Nitrogenous and phosphatic fer-
tilizers” excluding nitric acid, sodium nitrate, and sodium nitrite
listed under Industry Number 1611, “Compound fertilizers”
listed under Industry Number 1612, “Miscellaneous chemical
fertilizers” listed under Industry Number 1619, and production
activities for ammonium chloride as specified in “Soda” listed
under Industry Number 1621 of the Japan Standard Industrial
Classification; scrap and by-products (ammonium sulfate and
calcium silicate), which appeared in other sectors, consider this
sector as a competitor.
(Given examples)
Nitrogenous and phosphatic fertilizers (Ammonia, ammonia
water, urea, ammonium nitrate, lime nitrogen, calcium over-
phosphate, fused phosphate, polycalcium phosphate, heavy
phosphorous ), Compound fertilizer (ammonium phosphate (fer-
tilizer use), high-grade chemical fertilizer, standard-grade chem-
ical fertilizer, blended fertilizer)
Column Code Row Code Sector Name
2021-01 Industrial soda chemicals
2021-011 Soda ash
2021-012 Caustic soda
2021-013 Liquid chlorine
2021-019 Miscellaneous industrial soda
chemicals
(Ministry or agency in charge)
Ministry of Economy, Trade and Industry
(Definition, Scope)
The production activities for “Soda” excluding those of am-
monium chloride listed under Industry Number 1621 of the Ja-
pan Standard Industrial Classification.
(Given examples)
Miscellaneous industrial soda chemicals: Chlorine gas, gase-
ous hydrochloric acid, oxygen chloride bleaching powder, chlo-
rinated lime solvent, sodium chlorate
- 159 -

Column Code Row Code Sector Name
2029-01 Inorganic pigment
2029-011 Titanium oxide
2029-012 Carbon black
2029-019 Miscellaneous inorganic pig-
ments
(Ministry or agency in charge)
Ministry of Economy, Trade and Industry
(Definition, Scope)
The production activities for “Inorganic pigments” listed under
Industry Number 1622 of the Japan Standard Industrial Classifi-
cation.
(Given examples)
Miscellaneous inorganic pigments: Zinc oxide, ferric oxide,
chrome yellow, minium, lead oxide, cadminium pigment, ginshu
lacquer
Column Code Row Code Sector Name
2029-02 2029-021 Compressed gas and liquefied gas
(Ministry or agency in charge)
Ministry of Economy, Trade and Industry
(Definition, Scope)
The production activities for “Compressed and liquefied gases”
listed under Industry Number 1623 of the Japan Standard Indus-
trial Classification.
(Given examples)
Oxygen, nitrogen, argon, hydrogen, acetylene, carbon dioxide
Column Code Row Code Sector Name
2029-03 Salt
2029-031 Crude salt
2029-032 Salt
(Ministry or agency in charge)
Ministry of Finance
(Definition, Scope)
The production activities for “Salt” listed under Industry
Number 1624 of the Japan Standard Industrial Classification.
(Given examples)
Salt, table salt, sea water, bittern
(Notes)
Rock salt is classified under column sector “0629-09 Miscel-
laneous ores” and row sector “0629-099 Ores, n.e.c.”
Column Code Row Code Sector Name
2029-09 2029-099 Miscellaneous industrial inor-
ganic chemicals
(Ministry or agency in charge)
Ministry of Economy, Trade and Industry
(Definition, Scope)
The production activities for “Nitrogenous and phosphatic fer-
tilizers” listed under Industry Number 1611, excluding nitric
acid, sodium nitrate, and sodium nitrite, and also the activities of
“Miscellaneous industrial inorganic chemical products” listed
under Industry Number 1629, excluding catalysts, of the Japan
Standard Industrial Classification.
(Given examples)
Sulphuric acid salt, sulfide, fluoride, phosphorite, potassium,
barium, activated charcoal
Column Code Row Code Sector Name
2031-01 Petrochemical basic products
2031-011 Ethylene
2031-012 Propylene
2031-019 Miscellaneous petrochemical
basic products
(Ministry or agency in charge)
Ministry of Economy, Trade and Industry
(Definition, Scope)
The production activities for primary products created by the
dissolution of naphtha such as ethylene, propylene, butane, bu-
tylene, butadiene, paraffin, dissolved gasoline, and top gas as
specified in “Basic petrochemicals, including derivatives pro-
duced from an integrated process” listed under Industry Number
1631 of the Japan Standard Industrial Classification.
Column Code Row Code Sector Name
2031-02 Petrochemical aromatic prod-
ucts (except synthetic resin)
2031-021 Pure benzene
2031-022 Pure toluene
2031-023 Xylene
2031-029 Miscellaneous petrochemical
aromatic products
(Ministry or agency in charge)
Ministry of Economy, Trade and Industry
(Definition, Scope)
The production activities for aromatic solvent, and products
- 160 -

created by reformate and dissolved gasoline, such as pure ben-
zene, pure toluene, and xylene (refined o-xylene, m-xylene, and
refined p-xylene) specified in “Basic petrochemicals, including
derivatives produced from a process production” listed under In-
dustry Number 1631 of the Japan Standard Industrial Classifica-
tion.
Column Code Row Code Sector Name
2041-01 Aliphatic intermediates
2041-011 Synthetic octanol and syn-
thetic butanol
2041-012 Acetic acid
2041-013 Ethylene dichloride
2041-014 Acrylonitrile
2041-015 Ethylene glycol
2041-016 Acetic acid vinyl monomer
2041-019 Miscellaneous aliphatic inter-
mediates
(Ministry or agency in charge)
Ministry of Economy, Trade and Industry
(Definition, Scope)
The production activities for “Aliphatic intermediates, including
aliphatic solvent” listed under Industry Number 1632 of the Ja-
pan Standard Industrial Classification; products in this sector are
derivatives of olefin such as ethylene, propylene, and butylene
(Given examples)
Other aliphatic intermediates: Isopropyl alcohol, ethylene ox-
ide, vinyl chloride (monomer)
(Changes from the 2011 I-O Tables)
Ethyl alcohol (petroleum), high-grade synthetic alcohol (C9
or higher), and isopropyl alcohol classified under “2041-011
Synthetic alcohol” in the 2011 I-O Tables are integrated into
“2041-019 Miscellaneous aliphatic intermediates” .
Column Code Row Code Sector Name
2041-02 Cyclic intermediates, synthetic
dyes and organic pigments
2041-021 Synthetic dyes and organic
pigments
2041-022 Styrene monomer
2041-023 Synthetic phenol
2041-024 Terephthalic acid and dimethyl
terephthalate
2041-025
2041-029
Caprolactam
Miscellaneous cyclic interme-
diates
(Ministry or agency in charge)
Ministry of Economy, Trade and Industry
(Definition, Scope)
The production activities for “Cyclic intermediates, synthetic
dyes and organic pigments” listed under Industry Number 1634
of the Japan Standard Industrial Classification
(Given examples)
Miscellaneous cyclic intermediates: Phthalic anhydride, tolu-
ylenediisocyanate, diphenyl methane diisocyanate, cyclohexane,
aniline, nitrobenzene/chlorobenzene
(Changes from the 2011 I-O Tables)
“2041-02 Cyclic intermediates” and “2041-03 Synthetic dyes
and organic pigments” in the 2011 I-O Tables are integrated into
“2041-02 Cyclic intermediates, synthetic dyes and organic pig-
ments.”
(Notes)
(1) Azo pigment, which was classified under “2039-09, -099
Other industrial organic chemicals” in the 2005 I-O Tables,
was integrated into this sector in the 2011 I-O Tables.
(2) The codes “2032-02, -021, -022, -023, -024 and -029” in
the 2005 I-O Tables were changed to “2041-02, -021, -022,-
023, -024 and -029” in the 2011 I-O Tables.
Column Code Row Code Sector Name
2042-01 2042-011 Synthetic rubber
(Ministry or agency in charge)
Ministry of Economy, Trade and Industry
(Definition, Scope)
The production activities for “Synthetic rubber” listed under
Industry Number 1636 of the Japan Standard Industrial Classifi-
cation.
Column Code Row Code Sector Name
2049-01 2049-011 Methane derivatives
(Ministry or agency in charge)
Ministry of Economy, Trade and Industry
(Definition, Scope)
The production activities for methane derivatives as specified
in “Miscellaneous industrial organic chemical products” listed
under Industry Number 1639 of the Japan Standard Industrial
Classification.
(Given examples)
Refined methanol, formalin, methyl chloride, CFC gases
- 161 -

Column Code Row Code Sector Name
2049-02 2049-021 Plasticizers
(Ministry or agency in charge)
Ministry of Economy, Trade and Industry
(Definition, Scope)
The production activities for plasticizers specified in “Miscel-
laneous industrial organic chemical products” listed under In-
dustry Number 1639 of the Japan Standard Industrial Classifica-
tion
(Given examples)
Phthalate plasticizers, fatty acid plasticizers, phosphate plas-
ticizers, adipate plasticizers, polyester plasticizers, epoxy plasti-
cizers
Column Code Row Code Sector Name
2049-09 2049-099 Miscellaneous industrial organic
chemicals
(Ministry or agency in charge)
Ministry of Economy, Trade and Industry
(Definition, Scope)
Production of “Fermentation chemical products” listed under
Industry Number 1633 and “Miscellaneous industrial organic
chemical products,” excluding plasticizers and methane deriva-
tives, listed under Industry Number 1639 of the Japan Standard
Industrial Classification, including production activities of the
Japan Alcohol Corporation.
(Given examples)
Pure benzene (non-petroleum), creosote oil, pitch, naphtha-
lene, ethyl alcohol, lake, rubber accelerator, rubber antioxidant,
high-grade alcohol (fatty products)
(Changes from the 2011 I-O Tables)
Azo pigment, which is classified under this sector in the 2005
I-O Tables, are integrated into “2041-03, -031 Synthetic dyes
and organic pigments.”
Column Code Row Code Sector Name
2051-01 2051-011 Thermosetting resins
(Ministry or agency in charge)
Ministry of Economy, Trade and Industry
(Definition, Scope)
The production activities for phenol resin, urea resin, mela-
mine resin, unsaturated polyester resin, alkyd resin, epoxy resin,
and silica resin as specified in “Plastics” listed under Industry
Number 1635 of the Japan Standard Industrial Classification.
Column Code Row Code Sector Name
2051-02 Thermoplastics resins
2051-021 Polyethylene (low density)
2051-022 Polyethylene (high density)
2051-023 Polystyrene
2051-024 Polypropylene
2051-025 Vinyl chloride resins
(Ministry or agency in charge)
Ministry of Economy, Trade and Industry
(Definition, Scope)
The production activities for polyethylene, polystyrene, poly-
propylene, and vinyl chloride resin as specified in “Plastics”
listed under Industry Number 1635 of the Japan Standard Indus-
trial Classification.
(Notes)
EVA (Ethylene-vinyl acetate copolymers) is included in
“2051-021 Polyethylene (low density).”
Column Code Row Code Sector Name
2051-03 2051-031 High function resins
(Ministry or agency in charge)
Ministry of Economy, Trade and Industry
(Definition, Scope)
The production activities for polyamide resin, polycarbonate,
polyacetal, polyethylene terephthalate (excl. fiber use), poly-
butylene terephthalate, and polyphenylene sulfide specified in
“Plastics” listed under Industry Number 1635 of the Japan
Standard Industrial Classification.
(Given examples)
Polyamide resin, polycarbonate, polyacetal, polyethylene ter-
ephthalate (excluding fiber use), polybutylene terephthalate, pol-
yphenylene sulfide
(Changes from the 2011 I-O Tables)
(1) Polyphenylene sulfide classified under “2051-09, -099
Miscellaneous synthetic resins” in the 2011 I-O Tables is
integrated into this sector.
(2) Modified polyphenylene ether classified under this sector
in the 2011 I-O Tables is integrated into “2051-09, -099
Miscellaneous synthetic resins.”
(Notes)
Polyethylene terephthalate (for fiber use) is included in
“2051-09, -099 Miscellaneous synthetic resins”
- 162 -

Column Code Row Code Sector Name
2051-09 2051-099 Miscellaneous synthetic resins
(Ministry or agency in charge)
Ministry of Economy, Trade and Industry
(Definition, Scope)
The production activities of synthetic resins that are not else-
where classified such as petroleum resin, methacrylic resin, pol-
yvinyl alcohol, vinylidene chloride resin, fluorine resin, acetyl
cellulose, and polyethylene terephthalate (fiber use) specified in
“Plastics” listed under Industry Number 1635 of the Japan
Standard Industrial Classification.
(Given examples)
Petroleum resin (polybutene, petroleum resin), methacrylic
resin (formed materials, plate materials), polyvinyl alcohol, vi-
nylidene chloride resin, fluorocarbon resin, polyethylene tereph-
thalate (fiber use), miscellaneous resins
(Changes from the 2011 I-O Tables)
(1) Modified polyphenylene ether classified under “2051-03,
-031 High function resins” in the 2011 I-O Tables is inte-
grated into this sector.
(2) Polyphenylene sulfide classified under this sector in the
2011 I-O Tables is integrated into “2051-03, -031 High
function resins.”
Column Code Row Code Sector Name
2061-01 Chemical fibers
2061-011 Rayon and acetate
2061-012 Synthetic fibers
(Ministry or agency in charge)
Ministry of Economy, Trade and Industry
(Definition, Scope)
The production activities for synthetic fibers specified in
“Chemical fibers” listed under Industry Number 1112 of the Ja-
pan Standard Industrial Classification.
(Given examples)
Rayon and acetate: Viscose fiber, cupra fiber, and acetate fiber
Synthetic fibers: Nylon fiber, polyester fiber, acrylic fiber, vinyl-
nylon fiber, and polypropylene fiber
(Changes from the 2011 I-O Tables)
“2061-01 Rayon and acetate” and “2061-02 Synthetic fibers”
in the 2011 I-O Tables are integrated into “2061-01 Chemical
fibers.”
Column Code Row Code Sector Name
2071-01 2071-011 Medicaments
(Ministry or agency in charge)
Ministry of Health, Labour and Welfare
(Definition, Scope)
The production activities for “MEDICINES” listed under
Group Number 165 of the Japan Standard Industrial Classifica-
tion.
(Given examples)
Ethical pharmaceuticals (cardiovascular use, antibiotic use),
consumer products (cold remedies, analgesic agents, deodorants,
repellents, pesticides, disinfectants, ointments, vitamin tablets,
calcium tablets), veterinary medicines, consumer medicine
(Notes)
Cosmetics, toilet preparations and dentifrices are classified
under “2081-01, -011 Cosmetics, toilet preparations and denti-
frice” and agricultural chemicals are classified under “2084-01,
-011 Agricultural chemicals.”
Column Code Row Code Sector Name
2081-01 Oil and fat products and sur-
face-active agents
2081-011 Oil and fat products
2081-012 Soap and synthetic detergents
2081-013 Surface-active agents (except
soap or synthetic detergents)
(Ministry or agency in charge)
Ministry of Economy, Trade and Industry
(Definition, Scope)
The production activities exclusive of hardened oils (edible
oils) specified under “Fatty acids, hydrogenated oils and glycerin”
listed under Industry Number 1641, and production activities for
“Soaps and synthetic detergents” listed under Industry Number
1642 and “Surface-active agents, except soaps and synthetic de-
tergent” listed under Industry Number 1643 of the Japan Stand-
ard Industrial Classification.
(Given examples)
Oil and fat industrial chemicals: Pure benzene (non-petro-
leum), creosote oil, pitch, naphthalene, ethyl alcohol, lake, rub-
ber accelerator, rubber antioxidant, high-grade alcohol (fatty
products)
Surface-active agents (except soap and synthetic detergents):
Anionic surfactants, cation surfactants, ionic surfactants, non-
ionic surfactants, softener agents
- 163 -
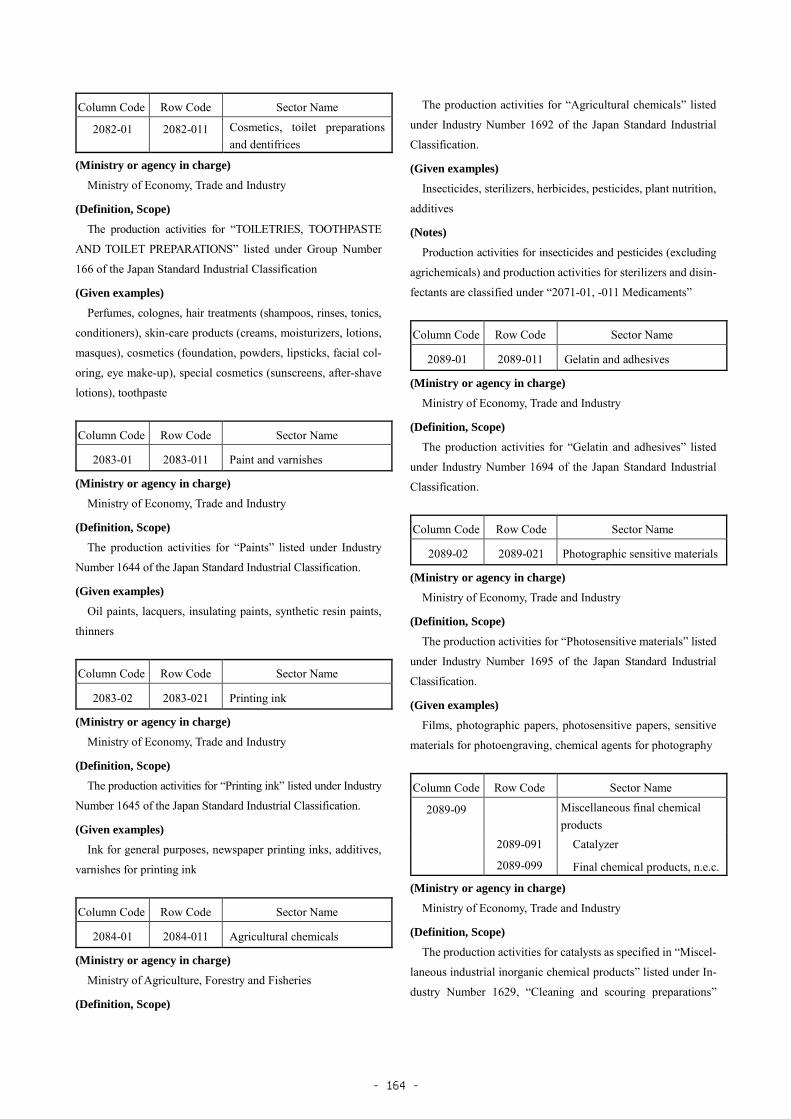
Column Code Row Code Sector Name
2082-01 2082-011 Cosmetics, toilet preparations
and dentifrices
(Ministry or agency in charge)
Ministry of Economy, Trade and Industry
(Definition, Scope)
The production activities for “TOILETRIES, TOOTHPASTE
AND TOILET PREPARATIONS” listed under Group Number
166 of the Japan Standard Industrial Classification
(Given examples)
Perfumes, colognes, hair treatments (shampoos, rinses, tonics,
conditioners), skin-care products (creams, moisturizers, lotions,
masques), cosmetics (foundation, powders, lipsticks, facial col-
oring, eye make-up), special cosmetics (sunscreens, after-shave
lotions), toothpaste
Column Code Row Code Sector Name
2083-01 2083-011 Paint and varnishes
(Ministry or agency in charge)
Ministry of Economy, Trade and Industry
(Definition, Scope)
The production activities for “Paints” listed under Industry
Number 1644 of the Japan Standard Industrial Classification.
(Given examples)
Oil paints, lacquers, insulating paints, synthetic resin paints,
thinners
Column Code Row Code Sector Name
2083-02 2083-021 Printing ink
(Ministry or agency in charge)
Ministry of Economy, Trade and Industry
(Definition, Scope)
The production activities for “Printing ink” listed under Industry
Number 1645 of the Japan Standard Industrial Classification.
(Given examples)
Ink for general purposes, newspaper printing inks, additives,
varnishes for printing ink
Column Code Row Code Sector Name
2084-01 2084-011 Agricultural chemicals
(Ministry or agency in charge)
Ministry of Agriculture, Forestry and Fisheries
(Definition, Scope)
The production activities for “Agricultural chemicals” listed
under Industry Number 1692 of the Japan Standard Industrial
Classification.
(Given examples)
Insecticides, sterilizers, herbicides, pesticides, plant nutrition,
additives
(Notes)
Production activities for insecticides and pesticides (excluding
agrichemicals) and production activities for sterilizers and disin-
fectants are classified under “2071-01, -011 Medicaments”
Column Code Row Code Sector Name
2089-01 2089-011 Gelatin and adhesives
(Ministry or agency in charge)
Ministry of Economy, Trade and Industry
(Definition, Scope)
The production activities for “Gelatin and adhesives” listed
under Industry Number 1694 of the Japan Standard Industrial
Classification.
Column Code Row Code Sector Name
2089-02 2089-021 Photographic sensitive materials
(Ministry or agency in charge)
Ministry of Economy, Trade and Industry
(Definition, Scope)
The production activities for “Photosensitive materials” listed
under Industry Number 1695 of the Japan Standard Industrial
Classification.
(Given examples)
Films, photographic papers, photosensitive papers, sensitive
materials for photoengraving, chemical agents for photography
Column Code Row Code Sector Name
2089-09 Miscellaneous final chemical
products
2089-091 Catalyzer
2089-099 Final chemical products, n.e.c.
(Ministry or agency in charge)
Ministry of Economy, Trade and Industry
(Definition, Scope)
The production activities for catalysts as specified in “Miscel-
laneous industrial inorganic chemical products” listed under In-
dustry Number 1629, “Cleaning and scouring preparations”
- 164 -

listed under Industry Number 1646, “Candles” listed under In-
dustry Number 1647, “Explosives” listed under Industry Num-
ber 1691, “Perfumes and fragrances” listed under Industry Num-
ber 1693, “Natural resin and wood chemical products” listed un-
der Industry Number 1696, “Reagents” listed under Industry
Number 1697, and “Chemicals and allied products, n.e.c.” listed
under Industry Number 1699 of the Japan Standard Industrial
Classification.
(Given examples)
Final chemical products, n.e.c.: Cleaning and scouring prepa-
rations (cleansers, waxes, shoe creams, etc.), candles, explosives
(smokeless powder, electric blasting caps, etc.), fragrances, nat-
ural resin products, wood chemical products, reagents, industrial
chemical products, n.e.c. (dextrin including soluble starch, eras-
ing fluids, bleaching agents, etc.)
21 Petroleum and coal products
Column Code Row Code Sector Name
2111-01 Petroleum refinery products (in-
cluding greases)
2111-011 Gasoline
2111-012 Jet fuel oils
2111-013 Kerosene
2111-014 Light oils
2111-015 Heavy oil A
2111-016 Heavy oil B and C
2111-017 Naphtha
2111-018 LPG (liquefied petroleum gas)
2111-019 Miscellaneous petroleum re-
finery products
(Ministry or agency in charge)
Ministry of Economy, Trade and Industry
(Definition, Scope)
The production activities exclusive of briquettes and briquette
balls as specified in “PETROLEUM REFINING” listed under
Group Number 171, “LUBRICATING OILS AND GREASES
(NOT MADE IN PETROLEUM REFINERIES)” listed under
Group Number 172, and “Miscellaneous petroleum and coal
products” listed under Group Number 1799 of the Japan Stand-
ard Industrial Classification.
A part of plastic scrap generated in the other sectors is consid-
ered to be a competitor of the sector “2111-017 Naphtha.”
Liquefied petroleum gas generated as a by-product in the sec-
tor “2031-01 Petrochemical basic products” is considered to be
a competing section “2111-018 LPG (liquefied petroleum gas).”
(Given examples)
Miscellaneous petroleum refinery products:Grease, lube-oil,
paraffin, asphalt, crude oil for refining and blending, petroleum
gas, oil cokes
Column Code Row Code Sector Name
2121-01 Coal products
2121-011 Coke
2121-019 Miscellaneous coal products
(Ministry or agency in charge)
Ministry of Economy, Trade and Industry
(Definition, Scope)
The production activities for “COKE” listed under Group
Number 173 and “Miscellaneous petroleum and coal products”
listed under Group Number 1799 of the Japan Standard Indus-
trial Classification; the sector also includes coal tar generated in
- 165 -

the cooling process of coal gas, and crude benzol extracted di-
rectly from coal tar and coal gas.
A part of plastic scrap generated in the other sectors is consid-
ered to be a competitor of the sector “2121-011 Coke” and the
sector “2121-019 Miscellaneous coal products”.
Blast furnace gas, basic oxygen furnace gas and electric fur-
nace gas generated as a by-product in the other sectors are con-
sidered to be competing section “2121-019 Miscellaneous coal
products”.
(Given examples)
Miscellaneous coal products: riquettes, briquette balls, crude
benzol, coal tar, coke oven gas
Column Code Row Code Sector Name
2121-02 2121-021 Paving materials
(Ministry or agency in charge)
Ministry of Economy, Trade and Industry
(Definition, Scope)
The production activities for “PAVING MATERIALS” listed
under Group Number 174 of the Japan Standard Industrial Clas-
sification.
(Given examples)
Mixed materials for asphalt paving, mixed materials for tar
paving
22 Plastic products and rubber products
Column Code Row Code Sector Name
2211-01 Plastic products
2211-011 Plastic films and sheets
2211-012 Plastic plates, pipes and bars
2211-013 Foamed plastic products
2211-014 Industrial plastic products
2211-015 Reinforced plastic products
2211-016 Plastic containers
2211-017 Plastic table ware, kitchen ware
and miscellaneous household
articles
2211-019 Miscellaneous plastic products
(Ministry or agency in charge)
Ministry of Economy, Trade and Industry
(Definition, Scope)
The production activities for “PLASTIC PLATES, BARS
AND RODS, PIPES AND TUBES, PIPE FITTINGS AND
PROFILE EXTRUSIONS” listed under Group Number 181,
“PLASTIC FILMS, SHEETS, FLOOR COVERINGS AND
SYNTHETIC LEATHER” listed under Group Number 182,
“INDUSTRIAL PLASTIC PRODUCTS” listed under Group
Number 183, “FOAMED AND REINFORCED PLASTIC
PRODUCTS” listed under Group Number 184, “COMPOUND-
ING PLASTIC MATERIALS, INCLUDING RECLAIMED
PLASTICS” listed under Group Number 185, and “MISCEL-
LANEOUS PLASTIC PRODUCTS” listed under Group Num-
ber 189 of the Japan Standard Industrial Classification.
A part of plastic scrap generated in the other sectors is consid-
ered to be a competitor of the sector “2211-019 Miscellaneous
plastic products”.
(Given examples)
Plastic films and sheets: Plastic film, plastic sheeting, plastic
flooring, synthetic leather extrusion products
Plastic plates, pipes and bars: Plastic plates (flat , waveform,
layered, laminated), bars, plastic pipes (hard tubes, hoses),
plastic joints, plastic extrusion products (troughs, etc.), pro-
cessed articles for plastic plates, bars, pipes, joints and plas-
tic extrusion products
Foamed plastic products: Polyurethane foam, polyethylene
foam, vinyl chloride foam, polystyrene foam, polystyrene
paper, foam plate products, processed foam plastic products
Industrial plastic products: Plastic products for transportation
equipment (bumpers, dashboards, hubcaps), plastic prod-
ucts for electrical appliances (television cabinets, cleaner
- 166 -

bodies, interior parts of refrigerators), other plastic products
for industrial use, processed plastic products for industrial
use
Reinforced plastic products: Reinforced plastic plates, bars,
and joints, reinforced plastic containers, bathtubs and septic
tanks, reinforced plastic industrial products, miscellaneous
reinforced plastic products (reinforced hard hats (hat bod-
ies), insulators, bridge piers, and containers, etc.), pro-
cessed reinforced plastic products
Plastic containers: Plastic beverage bottles, plastic kerosene
containers, containers for industrial chemicals, containers
for detergents and shampoos, containers for beer bottles,
containers for agricultural and fishery use, trash cans
Plastic table ware, kitchen ware and miscellaneous household
articles: Plastic kitchenware and tableware (cutting boards,
bowls, tableware, trays, etc.), plastic toiletries, miscellane-
ous plastic sundries
Miscellaneous plastic products: Plastic parts, waste plastic
products (piles, shelves, fishing banks), plastic medical and
sanitary products, miscellaneous plastic products (binding
tapes, insulating tapes, watch covers, waterproofing, artifi-
cial turf, etc.), processed plastic articles, n.e.c.
(Notes)
Foamed plastic products classified as “foamed and reinforced
plastic products” in “2211-015 Reinforced plastic products” in
the 2005 I-O Tables was removed from this sector and integrated
into “2211-013 Foamed plastic products” in the 2011 I-O Tables.
Column Code Row Code Sector Name
2221-01 2221-011 Tires and inner tubes
(Ministry or agency in charge)
Ministry of Economy, Trade and Industry
(Definition, Scope)
The production activities for “TIRES AND INNER TUBES”
listed under Group Number 191 and “Retreaded tires” listed un-
der Industry Number 1994 of the Japan Standard Industrial Clas-
sification.
(Given examples)
Automobile tires and tubes, aircraft tires and tubes, bicycle
tires and tubes, tractors tires and tubes, solid tires, re-treaded
tires
Column Code Row Code Sector Name
2229-09
2229-091
2229-099
Miscellaneous rubber products
Rubber and plastic footwear
Rubber products, n.e.c.
(Ministry or agency in charge)
Ministry of Economy, Trade and Industry
(Definition, Scope)
Production of “RUBBER AND PLASTIC FOOTWEAR
AND ITS FINDINGS” listed under Group Number 192; “RUB-
BER BELTS AND HOSES, MECHANICAL AND INDUS-
TRIAL RUBBER PRODUCTS” listed under Group Number
193; “Rubber coated fabric and its products” listed under Indus-
try Number 1991; “Medical and sanitary rubber products” listed
under Industry Number 1992; “Rubber sheet (repairsheet)” listed
under Industry Number 1993; “Reclaimed rubber” listed under
Industry Number 1995; and “Rubber products, n.e.c.” listed un-
der Industry Number 1999 of the Japan Standard Industrial Clas-
sification.
(Given examples)
Rubber and plastic footwear: Rubber footwear and its findings
(Rubber-soled canvas boots, rubber-soled shoes, rubber
boots, rubber zori slippers, slippers (including sponge-
soled), related rubber supplies (rubber soles, rubber heels,
zori slipper soles, uppers)), plastic footwear and its findings
(Plastic shoes (synthetic leather shoes, plastic formed
shoes), plastic sandals, slippers and zori slippers, plastic
athletic shoes, plastic shoe accessories)
Rubber products, n.e.c.: Conveyor belts, flat belts, v-shape
belts (including fan belts), rubber hoses, industrial rubber
products (vibration proof rubber, rubber packing), rubber
coated sheets, rubber coated sheet products (air mattress),
medical and sanitary rubber products, (nursing-bottle heads,
water pillows, ice bags, surgical gloves, rubber), rubber for
retreading, recycled rubber other rubber products (foam
rubber and rubber gloves but excluding those for surgical
use, rubber abrasives, rubber bands)
(Changes from the 2011 I-O Tables)
“2229-01 Rubber and plastic footwear” and “2229-09 Miscel-
laneous rubber products” in the 2011 I-O Tables are integrated
into “2229-09 Miscellaneous rubber products.”
(Notes)
“2319-01, -011 Rubber footwear” and “2319-02, -021 Plastic
footwear” in the 2005 I-O Tables were integrated into “2229-01,
-011 Rubber and plastic footwear” in the 2011 I-O Tables.
- 167 -

25 Ceramic, stone and clay products
Column Code Row Code Sector Name
2511-01 Sheet glass and safety glass
2511-011 Sheet glass
2511-012 Safety glass and multilayered
glass
(Ministry or agency in charge)
Ministry of Economy, Trade and Industry
(Definition, Scope)
The production activities for “Flat glass” listed under Industry
Number 2111, and “Processed flat glass” listed under Industry
Number 2112 of the Japan Standard Industrial Classification.
(Given examples)
Sheet glass: Regular flat glass, laminated flat glass, polished flat
glass
Safety glass and multilayered glass: Laminated glass, rein-
forced glass, multilayered glass, ground glass, bent glass, mirrors
Column Code Row Code Sector Name
2511-02 2511-021 Glass fiber and glass fiber prod-
ucts, n.e.c.
(Ministry or agency in charge)
Ministry of Economy, Trade and Industry
(Definition, Scope)
The production activities for “Glass fiber and its products”
listed under Industry Number 2117 of the Japan Standard Indus-
trial Classification.
(Given examples)
Short glass fiber products (felt, board, tube, etc.), long glass fi-
ber products (roving, chopped strand, thread, cloth, matting, etc.),
optical fiber (strand)
Column Code Row Code Sector Name
2511-09 Miscellaneous glass products
2511-091 Glass processing materials
2511-099 Glass products, n.e.c.
(Ministry or agency in charge)
Ministry of Economy, Trade and Industry
(Definition, Scope)
The production activities for “Glass processing materials” listed
under Industry Number 2113, “Glass containers” listed under In-
dustry Number 2114, “Scientific and medical glass instruments”
listed under Industry Number 2115, “Table and kitchen glassware”
listed under Industry Number 2116, and “Miscellaneous glass and
its products” listed under Industry Number 2119 of the Japan
Standard Industrial Classification; scrap and by-products (glass
bottles) generated in other sectors are considered to be in compe-
tition to “2511-099 Glass products, n.e.c.”
(Given examples)
Glass processing materials: Glass base for optical use (includ-
ing eyeglasses), glass for electric bulbs, glass for electronic
tubes, glass for miscellaneous tubes, rods, and bulbs (glass
tubes for ampules, etc.)
Glass products, n.e.c.: Glass containers (glass containers for
drinks, foods and seasonings, cosmetics, and ink bottles),
glassware for scientific and medical use (flasks, beakers,
test tubes, ampoules, and medicine bottles), table glassware,
kitchen and dining table glassware, other glassware (inner
glass containers for thermoses, glass products for lighting
and signaling, glass blocks, and glass tiles)
Column Code Row Code Sector Name
2521-01 2521-011 Cement
(Ministry or agency in charge)
Ministry of Economy, Trade and Industry
(Definition, Scope)
The production activities for “Cement” listed under Industry
Number 2121 of the Japan Standard Industrial Classification; ce-
ment clinkers are classified as intermediate products.
(Given examples)
Portland cement, fly ash cement, blast furnace cement, silica
cement
Column Code Row Code Sector Name
2521-02 2521-021 Ready mixed concrete
(Ministry or agency in charge)
Ministry of Economy, Trade and Industry
(Definition, Scope)
The production activities for “Fresh concrete” listed under In-
dustry Number 2122 of the Japan Standard Industrial Classifica-
tion.
Column Code Row Code Sector Name
2521-03 2521-031 Cement products
(Ministry or agency in charge)
Ministry of Economy, Trade and Industry
(Definition, Scope)
The production activities for “Concrete products” listed under
- 168 -

Industry Number 2123 and “Miscellaneous cement products”
listed under Industry Number 2129 of the Japan Standard Indus-
trial Classification.
(Given examples)
Concrete panels, centrifugal reinforced concrete products
(pipes, pillars, and piles), regular concrete pipes, and hollow
concrete blocks, concrete blocks for earth works, concrete prod-
ucts for pavement, pre-stressed concrete products, terrazzo prod-
ucts, prefabricated concrete housing, other cement products (ce-
ment roof tiles, thick type slate, wood cement products, and aer-
ated concrete products)
Column Code Row Code Sector Name
2531-01 Pottery, china and earthenware
2531-011 Pottery, china and earthen-
ware for construction
2531-012 Pottery, china and earthen-
ware for industry
2531-013 Pottery, china and earthen-
ware for home use
(Ministry or agency in charge)
Ministry of Economy, Trade and Industry
(Definition, Scope)
The production activities for “POTTERY AND RELATED
PRODUCTS” listed under Group Number 214 of the Japan
Standard Industrial Classification.
(Given examples)
Pottery, china and earthenware for construction: Plumbing
fixtures (bathtubs, hand basins, toilet bowls, and water cis-
terns), tiles (mosaic tiles, interior tiles)
Pottery, china and earthenware for industry: Porcelain for
electrical applications (insulators, insulating tubes, special
porcelain parts for electrical use, fine ceramic IC-boards,
and packaged board (annealed)), porcelain products for sci-
entific and industrial use, and fine ceramics (annealed) for
scientific and industrial use
Pottery, china and earthenware for home use: Ceramic table-
ware, pottery kitchen and cooking ware, pottery ornaments,
painted pottery, pottery clay
Column Code Row Code Sector Name
2591-01 2591-011 Clay refractories
(Ministry or agency in charge)
Ministry of Economy, Trade and Industry
(Definition, Scope)
The production activities of “CLAY REFRACTORIES” listed
under Group Number 215 of the Japan Standard Industrial Clas-
sification.
(Given examples)
Refractory bricks, unshaped refractory materials (refractory
mortar, castable refractory materials), artificial refractory mate-
rials (magnesia-clinker, synthetic mullite), and other refractory
materials (including clay melting pot and blocks for blast fur-
naces)
Column Code Row Code Sector Name
2591-09 2591-099 Miscellaneous structural clay
products
(Ministry or agency in charge)
Ministry of Economy, Trade and Industry
(Definition, Scope)
The production activities for “CLAY PRODUCTS FOR
CONSTRUCTION, EXCEPT THOSE OF POTTERY” listed
under Group Number 213 and “Gypsum products” listed under
Industry Number 2192 of the Japan Standard Industrial Classifi-
cation.
(Given examples)
Plaster board and its products (decorative boards, LAS plaster
board, waterproof plaster board, reinforced plaster board, etc.),
gypsum plaster products, baked plaster, clay roof tiles (ibushi
roof tiles, glazed roof tiles, and salt-baked roof tiles), regular
bricks, other structural clay products (porcelain pipes, etc.)
Column Code Row Code Sector Name
2599-01 2599-011 Carbon and graphite products
(Ministry or agency in charge)
Ministry of Economy, Trade and Industry
(Definition, Scope)
The production activities for “Carbon fibers” listed under In-
dustry Number 1113 and “CARBON AND GRAPHITE PROD-
UCTS” listed under Group Number 216 of the Japan Standard
Industrial Classification.
(Given examples)
Electrodes (graphite electrodes, electrolytic plate, carbon
electrodes, and continuous self-burning electrode paste), carbon
fibers, carbon bars (for gauging and batteries), brushes (artificial
graphite, metallic graphite), graphite melting pots, refined
graphite, carbon bricks, graphite bricks, special carbon products
- 169 -

Column Code Row Code Sector Name
2599-02 2599-021 Abrasive and its products
(Ministry or agency in charge)
Ministry of Economy, Trade and Industry
(Definition, Scope)
The production activities for “ABRASIVE AND ITS PROD-
UCTS” listed under Group Number 217 of the Japan Standard
Industrial Classification.
(Given examples)
Natural abrasives, processed abrasives, abrasive grinders,
abrasive cloth paper, reclaimed abrasives, natural abrasive grind-
ers
Column Code Row Code Sector Name
2599-09 2599-099 Miscellaneous ceramic, stone
and clay products
(Ministry or agency in charge)
Ministry of Economy, Trade and Industry
(Definition, Scope)
The production activities for “Reclaimed aggregate” listed un-
der Industry Number 2182, “Artificial aggregate” listed under
Industry Number 2183, “Cut-stones and stone ware products”
listed under Industry Number 2184, “Diatomaceous earth and its
products” listed under Industry Number 2185, “Minerals and
stones crushed or otherwise treated” listed under Industry Num-
ber 2186, “Rock wool, slag wool and its products” listed under
2191, “Lime products” listed under Industry Number 2193,
“Molds, including cores” listed under Industry Number 2194,
and “Ceramic, stone and clay products, n.e.c.” listed under In-
dustry Number 2199 of the Japan Standard Industrial Classifica-
tion.
(Given examples)
Enameled containers (enameled kitchen and table ware,
enameled sanitary articles), lime ash (raw lime, slaked lime, light
calcium carbonate), other stone and clay products (Reclaimed
aggregate, artificial bones, stone-made parts, diatomite and its
products, crushed minerals, crushed stone and clay, and other
treated items), jewelry products (cloisonne products, artificial
jewels), rock wool and its products, molds, other ceramic, stone,
and clay products (enamel, mica)
26 Iron and steel
Column Code Row Code Sector Name
2611-01 2611-011 Pig iron
(Ministry or agency in charge)
Ministry of Economy, Trade and Industry
(Definition, Scope)
The production activities of pig iron not dependent on blast fur-
nace iron and blast furnaces specified in “MANUFACTURE OF
IRON AND STEEL” listed under Major Group Number 22 (ex-
clusive of “ESTABLISHMENTS ENGAGED IN ADMINIS-
TRATIVE OR ANCILLARY ECONOMIC ACTIVITIES (MAN-
UFACTURE OF IRON AND STEEL)” listed under Group Num-
ber 220) of the Japan Standard Industrial Classification; includes
raw iron, pure iron, and base metals
(Given examples)
Blast furnace iron, electric furnace iron
Column Code Row Code Sector Name
2611-02 2611-021 Ferro-alloys
(Ministry or agency in charge)
Ministry of Economy, Trade and Industry
(Definition, Scope)
The production activities for “Ferro-alloys” listed under In-
dustry Number 2213 of the Japan Standard Industrial Classifica-
tion.
(Given examples)
Ferro-nickel, ferro-chrome, ferro-manganese, ferro-molyb-
denum, ferro-vanadium
Column Code Row Code Sector Name
2611-03 2611-031 Crude steel (converters)
(Ministry or agency in charge)
Ministry of Economy, Trade and Industry
(Definition, Scope)
The production activities of steel ingots based on converters,
specified in “MANUFACTURE OF IRON AND STEEL” listed
under Major Group Number 22 (exclusive of “ESTABLISH-
MENTS ENGAGED IN ADMINISTRATIVE OR ANCIL-
LARY ECONOMIC ACTIVITIES (MANUFACTURE OF
IRON AND STEEL)” listed under Group Number 220) of the
Japan Standard Industrial Classification.
(Given examples)
Ordinary crude steel, special crude steel
- 170 -

Column Code Row Code Sector Name
2611-04 2611-041 Crude steel (electric furnaces)
(Ministry or agency in charge)
Ministry of Economy, Trade and Industry
(Definition, Scope)
The production activities of steel ingots based on electric fur-
naces, specified in “MANUFACTURE OF IRON AND STEEL”
listed under Major Group Number 22 (exclusive of “ESTAB-
LISHMENTS ENGAGED IN ADMINISTRATIVE OR ANCIL-
LARY ECONOMIC ACTIVITIES (MANUFACTURE OF
IRON AND STEEL)” listed under Group Number 220) of the
Japan Standard Industrial Classification.
(Given examples)
Ordinary crude steel, special crude steel
Column Code Row Code Sector Name
2612-011P Scrap Iron
(Ministry or agency in charge)
Ministry of Economy, Trade and Industry
(Definition, Scope)
This sector competes with iron scrap generating in the produc-
tion activities of each sector and in the final demand sectors
(Notes)
No sector generating iron scrap as a major product competes
with this sector, and therefore the row code is set as a dummy
sector.
Column Code Row Code Sector Name
2621-01 Hot rolled steel
2621-011 Section steel (ordinary steel)
2621-012 Steep plate (ordinary steel)
2621-013 Steel strip (ordinary steel)
2621-014 Steel bar (ordinary steel)
2621-015 Miscellaneous hot rolled
steel (ordinary steel)
2621-016 Hot rolled steel (special steel)
(Ministry or agency in charge)
Ministry of Economy, Trade and Industry
(Definition, Scope)
The production activities of rails, section steel, steel bars and
rods, wire materials, step plates, steel pipes and tubes, steel strips,
paddle wheels, tool steel, structural steel, steel for special use,
and semi-finished steel specified under “MANUFACTURE OF
IRON AND STEEL” listed under Major Group Number 22 (ex-
clusive of “ESTABLISHMENTS ENGAGED IN ADMINIS-
TRATIVE OR ANCILLARY ECONOMIC ACTIVITIES
(MANUFACTURE OF IRON AND STEEL)” listed under
Group Number 220) of the Japan Standard Industrial Classifica-
tion.
Semi-finished steel is handled as an intermediate product.
(Given examples)
Section steel (ordinary steel): Structural steel plate, H-shape
steel, large, medium, and small tool steel
Steep plate (ordinary steel): Thick plate, medium thickness
plate, thin plate
Steel strip (ordinary steel): Cold-rolled steel band, steel band
for other uses
Steel bar (ordinary steel): Round bar for small structural use,
deformed bar for small structural, other small steel bar and
rod products
Miscellaneous hot rolled steel (ordinary steel): Rails, large
and medium steel bars and rods, steel pipes and tubes, bar
in coil form, wire materials, paddle wheel
Hot rolled steel (special steel): Tool steel, structural steel,
spring steel, bearing steel, stainless steel, refractory steel,
free-cutting steel, piano string materials, high-tensile steel,
manganese steel, alloy steel materials
Column Code Row Code Sector Name
2622-01 Steel pipes and tubes
2622-011 Steel pipes and tubes (ordi-
nary steel)
2622-012 Steel pipes and tubes (special
steel)
(Ministry or agency in charge)
Ministry of Economy, Trade and Industry
(Definition, Scope)
The production activities of hot steel pipes and tubes, cold
steel pipes and tubes, and plated steel pipes and tubes specified
under “MANUFACTURE OF IRON AND STEEL” listed under
Major Group Number 22 (exclusive of “ESTABLISHMENTS
ENGAGED IN ADMINISTRATIVE OR ANCILLARY ECO-
NOMIC ACTIVITIES (MANUFACTURE OF IRON AND
STEEL)” listed under Group Number 220) of the Japan Standard
Industrial Classification.
(Given examples)
Steel pipes and tubes (ordinary steel): Ordinary hot-worked
steel pipes and tubes (seamless steel pipes and tubes, high-
- 171 -

frequency welded steel tubes, and arc-welded steel tubes),
ordinary steel pipes and tubes for cold drawing, ordinary
coated steel pipes and tubes
Steel pipes and tubes (special steel): Hot-worked special steel
pipes and tubes (seamless steel pipes and tubes, high fre-
quency welded steel tubes, and arc-welded steel tubes), spe-
cial steel pipes and tubes for cold drawing
Column Code Row Code Sector Name
2623-01 Cold-finished steel
2623-011 Cold-finished steel (ordinary
steel)
2623-012 Cold-finished steel (special
steel)
(Ministry or agency in charge)
Ministry of Economy, Trade and Industry
(Definition, Scope)
The production activities of cold-rolled tool steel, strip steel,
bar and rod steel, cold-rolled steel plate, cold-rolled wide steel
band, cold-rolled electric furnace strip steel, steel wire, carbon
steel for cold rolling, hard steel wire, solder rod core wire, P.C.
steel wire, piano strings, stainless steel wire, other special steel
wire specified under “MANUFACTURE OF IRON AND
STEEL” listed under Major Group Number 22 (exclusive of
“ESTABLISHMENTS ENGAGED IN ADMINISTRATIVE OR
ANCILLARY ECONOMIC ACTIVITIES (MANUFACTURE
OF IRON AND STEEL)” listed under Group Number 220) of
the Japan Standard Industrial Classification.
(Given examples)
Coldfinished steel (ordinary steel): Strip steel, cold-rolled
wide steel band, old-rolled steel plate, cold-rolled electric
furnace strip steel, bar and rod steel, steel wire, carbon steel
for cold rolling, hard steel wire, solder rod core wire, light-
gauge structural steel plate, light-gauge section steel
Coldfinished steel (special steel): Strip steel, cold-rolled wide
steel band, cold-rolled steel plate, bar and rod steel, P.C.
steel wire, piano strings, stainless steel wire, carbon steel
for cold rolling, other special steel wire
Column Code Row Code Sector Name
2623-02 2623-021 Coated steel
(Ministry or agency in charge)
Ministry of Economy, Trade and Industry
(Definition, Scope)
The production activities except for coated steel tubes for
“COATED STEEL” listed under Group Number 224 of the Ja-
pan Standard Industrial Classification.
(Given examples)
Tin plate, zinc-coated steel, steel wire, zinc-coated hard steel
wire, aluminum-coated steel plates, tin-free steel
Column Code Row Code Sector Name
2631-01 Cast and forged steel
2631-011 Forged steel
2631-012 Cast steel
(Ministry or agency in charge)
Ministry of Economy, Trade and Industry
(Definition, Scope)
The production activities for “Steel castings” listed under In-
dustry Number 2253 and “Steel forgings” listed under Industry
Number 2255 of the Japan Standard Industrial Classification.
(Given examples)
Forged steel: Ordinary forged steel materials and special
forged steel materials (before gas-cutting)
Cast steel: Ordinary cast steel materials and special cast steel
materials (before riser cutting)
Column Code Row Code Sector Name
2631-02 2631-021 Cast iron pipes and tubes
(Ministry or agency in charge)
Ministry of Economy, Trade and Industry
(Definition, Scope)
The production activities for “Cast iron pipe” listed under In-
dustry Number 2293 of the Japan Standard Industrial Classifica-
tion.
(Given examples)
Straight pipes (regular type, hard cast iron), deformed pipes
(regular type, hard cast iron)
Column Code Row Code Sector Name
2631-03
2631-031
2631-032
Cast and forged materials (iron)
Cast materials (iron)
Forged materials (iron)
(Ministry or agency in charge)
Ministry of Economy, Trade and Industry
(Definition, Scope)
The production activities for “Iron castings, except cast iron
pipes and malleable iron castings” listed under Industry Number
2251, “Malleable iron castings” listed under Industry Number
- 172 -

2252, and “Steel product forgings” listed under Industry Number
2254 of the Japan Standard Industrial Classification.
(Given examples)
Cast materials (iron): Iron castings, spheroidal graphite cast
iron, alloy cast iron, malleable cast iron, precision cast parts,
malleable cast iron joints
Forged materials (iron): Forged parts (for automobiles, for in-
dustrial machines)
Column Code Row Code Sector Name
2699-01 2699-011 Iron and steel shearing and slitting
(Ministry or agency in charge)
Ministry of Economy, Trade and Industry
(Definition, Scope)
The production activities for “Iron and steel shearing and
slitting” listed under Industry Number 2291 of the Japan
Standard Industrial Classification.
Column Code Row Code Sector Name
2699-09 2699-099 Miscellaneous iron or steel
products
(Ministry or agency in charge)
Ministry of Economy, Trade and Industry
(Definition, Scope)
The production activities for “Iron and steel, n.e.c.” listed
under Industry Number 2299 of the Japan Standard Industrial
Classification.
(Given examples)
Iron powder, rolled pure iron, pellets
27 Non-ferrous metals
Column Code Row Code Sector Name
2711-01 2711-011 Copper
(Ministry or agency in charge)
Ministry of Economy, Trade and Industry
(Definition, Scope)
The production activities for the “Primary smelting and refin-
ing of copper” listed under Industry Number 2311 of the Japan
Standard Industrial Classification.
Crude copper is classified as intermediate product.
Column Code Row Code Sector Name
2711-02 2711-021 Lead and zinc (including regen-
erated lead)
(Ministry or agency in charge)
Ministry of Economy, Trade and Industry
(Definition, Scope)
The production activities of “Primary smelting and refining of
zinc” listed under Industry Number 2312, primary smelting and
refining of lead specified in “Miscellaneous primary smelting
and refining of non-ferrous metals” listed under Industry
Number 2319, “Secondary smelting and refining of lead,
including lead alloys” listed under Industry Number 2321, and
the production activities of zinc regeneration and zinc alloy
manufacturing specified in “Miscellaneous secondary smelting
and refining of non-ferrous metals, including non-ferrous alloys”
listed under Industry Number 2329 of the Japan Standard
Industrial Classification.
Crude lead, including crude lead generated as a by-product, is
classified as intermediate product.
(Given examples)
Lead, regenerated lead, anti-friction metal alloy, solder, zinc,
regenerated zinc, zinc alloy
Column Code Row Code Sector Name
2711-03 2711-031 Aluminum (including regener-
ated aluminum)
(Ministry or agency in charge)
Ministry of Economy, Trade and Industry
(Definition, Scope)
The production activities of aluminum smelting and refining
and alumina refining specified in “Miscellaneous primary
smelting and refining of non-ferrous metals” listed under
Industry Number 2319 and “Secondary smelting and refining of
- 173 -

aluminum including aluminum alloys” listed under Industry
Number 2322 of the Japan Standard Industrial Classification.
(Given examples)
Raw aluminum, alumina, hydro-oxide aluminum, regenerated
aluminum, aluminum alloy
Column Code Row Code Sector Name
2711-09 2711-099 Miscellaneous non-ferrous met-
als
(Ministry or agency in charge)
Ministry of Economy, Trade and Industry
(Definition, Scope)
The production activities exclusive of aluminum smelting and
refining, alumina refining, and primary smelting and refining of
lead specified in “Miscellaneous primary smelting and refining of
non-ferrous metals” listed under Industry Number 2319 and pro-
duction activities exclusive of zinc regeneration and zinc alloy
manufacturing specified in “Miscellaneous secondary smelting
and refining of non-ferrous metals, including non-ferrous alloys”
listed under Industry Number 2329 of the Japan Standard Indus-
trial Classification.
(Given examples)
Gold, silver, titanium, tungsten, tin, antimony, regenerated
gold, gold alloy, regenerated silver, silver alloy, regenerated cop-
per, copper alloy
Column Code Row Code Sector Name
2712-011P Non-ferrous metal scrap
(Ministry or agency in charge)
Ministry of Economy, Trade and Industry
(Definition, Scope)
A competitive sector for non-ferrous metal scrap generated in
the production activities of manufacturers and in the final de-
mand sectors
(Notes)
No sector generating non-ferrous metal scrap as a major prod-
uct competes with this sector, and therefore the row code is set
as a dummy sector.
Column Code Row Code Sector Name
2721-01 2721-011 Electric wires and cables
(Ministry or agency in charge)
Ministry of Economy, Trade and Industry
(Definition, Scope)
The production activities for “Electric wire and cable, except
optical fiber cable” listed under Industry Number 2341 of the
Japan Standard Industrial Classification.
Bare wire and rough drawing wire are classified as intermedi-
ate products.
(Given examples)
Communication wires and cables, power wires and cables
Column Code Row Code Sector Name
2721-02 2721-021 Optical fiber cables
(Ministry or agency in charge)
Ministry of Economy, Trade and Industry
(Definition, Scope)
The production activities for “Optical fiber cables, including
telecommunication composite cables” listed under Industry
Number 2342 of the Japan Standard Industrial Classification.
Column Code Row Code Sector Name
2729-01 2729-011 Rolled and drawn copper and
copper alloys
(Ministry or agency in charge)
Ministry of Economy, Trade and Industry
(Definition, Scope)
The production activities for the “Rolling and drawing of cop-
per and copper alloys” listed under Industry Number 2331 of the
Japan Standard Industrial Classification.
(Given examples)
Rolled and drawn articles of copper, yellow copper, and
bronze
Column Code Row Code Sector Name
2729-02 2729-021 Rolled and drawn aluminum
(Ministry or agency in charge)
Ministry of Economy, Trade and Industry
(Definition, Scope)
The production activities for the “Rolling of aluminum and
aluminum alloys, including drawing and extruding” listed under
Industry Number 2332 of the Japan Standard Industrial Classifi-
cation.
(Given examples)
Rolled and drawn aluminum (plates, discs, thread, tubes,
bars, wires, formed materials, foil)
- 174 -
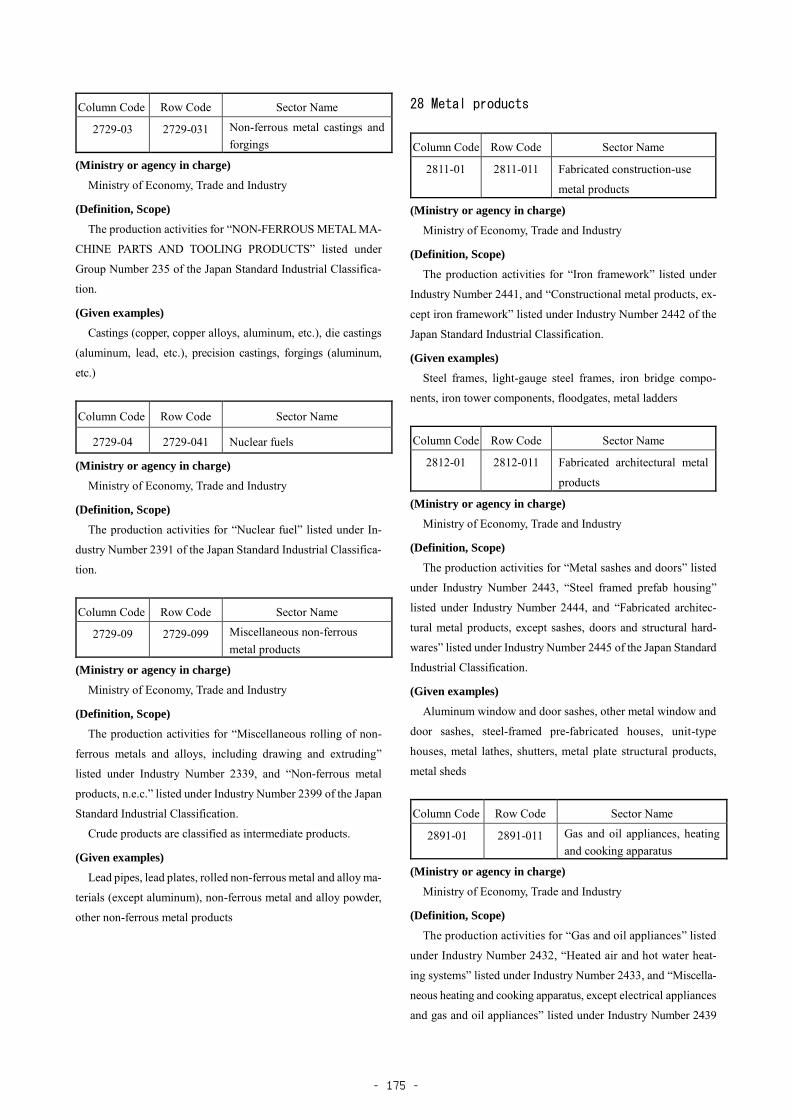
Column Code Row Code Sector Name
2729-03 2729-031 Non-ferrous metal castings and
forgings
(Ministry or agency in charge)
Ministry of Economy, Trade and Industry
(Definition, Scope)
The production activities for “NON-FERROUS METAL MA-
CHINE PARTS AND TOOLING PRODUCTS” listed under
Group Number 235 of the Japan Standard Industrial Classifica-
tion.
(Given examples)
Castings (copper, copper alloys, aluminum, etc.), die castings
(aluminum, lead, etc.), precision castings, forgings (aluminum,
etc.)
Column Code Row Code Sector Name
2729-04 2729-041 Nuclear fuels
(Ministry or agency in charge)
Ministry of Economy, Trade and Industry
(Definition, Scope)
The production activities for “Nuclear fuel” listed under In-
dustry Number 2391 of the Japan Standard Industrial Classifica-
tion.
Column Code Row Code Sector Name
2729-09 2729-099 Miscellaneous non-ferrous
metal products
(Ministry or agency in charge)
Ministry of Economy, Trade and Industry
(Definition, Scope)
The production activities for “Miscellaneous rolling of non-
ferrous metals and alloys, including drawing and extruding”
listed under Industry Number 2339, and “Non-ferrous metal
products, n.e.c.” listed under Industry Number 2399 of the Japan
Standard Industrial Classification.
Crude products are classified as intermediate products.
(Given examples)
Lead pipes, lead plates, rolled non-ferrous metal and alloy ma-
terials (except aluminum), non-ferrous metal and alloy powder,
other non-ferrous metal products
28 Metal products
Column Code Row Code Sector Name
2811-01 2811-011 Fabricated construction-use
metal products
(Ministry or agency in charge)
Ministry of Economy, Trade and Industry
(Definition, Scope)
The production activities for “Iron framework” listed under
Industry Number 2441, and “Constructional metal products, ex-
cept iron framework” listed under Industry Number 2442 of the
Japan Standard Industrial Classification.
(Given examples)
Steel frames, light-gauge steel frames, iron bridge compo-
nents, iron tower components, floodgates, metal ladders
Column Code Row Code Sector Name
2812-01 2812-011 Fabricated architectural metal
products
(Ministry or agency in charge)
Ministry of Economy, Trade and Industry
(Definition, Scope)
The production activities for “Metal sashes and doors” listed
under Industry Number 2443, “Steel framed prefab housing”
listed under Industry Number 2444, and “Fabricated architec-
tural metal products, except sashes, doors and structural hard-
wares” listed under Industry Number 2445 of the Japan Standard
Industrial Classification.
(Given examples)
Aluminum window and door sashes, other metal window and
door sashes, steel-framed pre-fabricated houses, unit-type
houses, metal lathes, shutters, metal plate structural products,
metal sheds
Column Code Row Code Sector Name
2891-01 2891-011 Gas and oil appliances, heating
and cooking apparatus
(Ministry or agency in charge)
Ministry of Economy, Trade and Industry
(Definition, Scope)
The production activities for “Gas and oil appliances” listed
under Industry Number 2432, “Heated air and hot water heat-
ing systems” listed under Industry Number 2433, and “Miscella-
neous heating and cooking apparatus, except electrical appliances
and gas and oil appliances” listed under Industry Number 2439
- 175 -

of the Japan Standard Industrial Classification.
(Given examples)
Gas appliances such as gas ovens, bath heaters and flash water
heaters, oil appliances such as kerosene stoves, heated air sys-
tems, heated water systems such as heated water boilers, heating
and cooking apparatus, solar heating appliances
Column Code Row Code Sector Name
2899-01 2899-011 Bolts, nuts, rivets and springs
(Ministry or agency in charge)
Ministry of Economy, Trade and Industry
(Definition, Scope)
The production activities for “BOLTS, NUTS, RIVETS, MA-
CHINE SCREWS AND WOOD SCREWS” listed under Group
Number 248, and “Metallic springs” listed under Industry Num-
ber 2492 of the Japan Standard Industrial Classification.
Column Code Row Code Sector Name
2899-02 2899-021 Metal containers, fabricated
plate and sheet metal
(Ministry or agency in charge)
Ministry of Economy, Trade and Industry
(Definition, Scope)
The production activities for “TIN CANS AND OTHER
PLATED SHEET PRODUCTS” listed under Group Number 241
and “Fabricated plate work and sheet metal work” listed under
Industry Number 2446 of the Japan Standard Industrial Classifi-
cation.
(Given examples)
Oil drums, 18 liter cans, metal cans (for canned foods), gen-
eral purpose cans, containers, tanks made of metal sheet, high
pressure vessels tanks
Column Code Row Code Sector Name
2899-03 Plumbing accessories, powder
metallurgy products and tools
2899-031 Plumbing accessories
2899-032 Powder metallurgy products
2899-033 Cutlery and tools
(Ministry or agency in charge)
Ministry of Economy, Trade and Industry
(Definition, Scope)
The production activities for “Edge tools for machinery” listed
under Industry Number 2422, “Edge tools, artisans' tools and
hand tools, except files, saws and knives for kitchen use” listed
under Industry Number 2423, “Working tools” listed under In-
dustry Number 2424, “Hand saws and saw blades” listed under
Industry Number 2425, “Agricultural tools, except agricultural
machinery” listed under Industry Number 2426, “Plumbing sup-
plies, except valves and cocks” listed under Industry Number
2431, and “Powder metallurgy products” listed under Industry
Number 2453 of the Japan Standard Industrial Classification.
(Given examples)
Plumber’s supplies: Pipe joint (metal), metal sanitary ware,
atomizing nozzles, sprinkler heads, drain-pipe shut-off
plugs
Powder metallurgy products: Machine parts (powder metal-
lurgy), carbide tips, carbide tools (powder- or metallurgy-
based)
Cutlery and tools: Machine edge, artisan’s tools and hand
tools (cooking knives, knives, scissors, and barber’s tools,
picks, hammers, shovels, and scoops), files, work tools
(wrenches, cutting pliers, and screwdrivers), hand saws,
saw blades, farm tools (rakes, hoes, and scythes), farm tool
parts
Column Code Row Code Sector Name
2899-09 Miscellaneous metal products
2899-091 Stamped and pressed metal
products
2899-092 Fabricated wire products
2899-099 Metal products, n.e.c.
(Ministry or agency in charge)
Ministry of Economy, Trade and Industry
(Definition, Scope)
The production activities of “Tableware (occidental type)”
listed under Industry Number 2421, “Miscellaneous hardware”
listed under Industry Number 2429, “Stamped and pressed alu-
minum products and aluminum alloys” listed under Industry
Number 2451, “Stamped and pressed metal products, except alu-
minum and aluminum alloys” listed under Industry Number
2452, “METAL COATING, ENGRAVING AND HEAT
TREATING, EXCEPT ENAMELED IRONWARE” listed under
Group Number 246, “FABRICATED WIRE PRODUCTS, EX-
CEPT SCREWS” listed under Group Number 247, “Safes”
listed under Industry Number 2491, “Fabricated metal products,
n.e.c.” listed under Industry Number 2499 of the Japan Standard
Industrial Classification, including the production of coins by the
Japan Mint.
- 176 -

(Given examples)
Stamped and pressed metal products: Aluminum machine
parts, aluminum kitchen and tableware, aluminum cans for
drinks, other metal products (stamped and pressed machine
parts, bottle crowns)
Fabricated wire products: Nails, Metal nets, PC steel twisted
wire, wire rope, welding rods
Metal products, n.e.c.: Tableware (occidental-type), other
metal wares (keys, locks, structural metal ware, and cable
metal ware), surface-treated metal products (engraved
metal products, heat-treated metal products, etc.), safes and
their parts, fixtures and accessories, other metal products
(coins, metal packing and gaskets, metal name tags, metal
tube clamps, metal foils, stepladders, etc.)
29 General-purpose machinery
Column Code Row Code Sector Name
2911-01 2911-011 Boilers
(Ministry or agency in charge)
Ministry of Economy, Trade and Industry
(Definition, Scope)
The production activities for “Boilers” listed under Industry
Number 2511 of the Japan Standard Industrial Classification.
(Given examples)
Steam boilers, water heaters, and boiler parts, fixtures and ac-
cessories
Column Code Row Code Sector Name
2911-02 2911-021 Turbines
(Ministry or agency in charge)
Ministry of Economy, Trade and Industry
(Definition, Scope)
The production activities for “Steam engines, turbines and wa-
ter turbines, except marine engines” listed under Industry Num-
ber 2512 of the Japan Standard Industrial Classification.
(Given examples)
Steam turbines, water-powered turbines, gas-fired turbines,
parts, fixtures and accessories for steam engines, turbines, and
water-powered turbines
(Notes)
Turbines for aircrafts are classified under “3592-01, -011 Air-
crafts.”
Column Code Row Code Sector Name
2911-03 2911-031 Engines
(Ministry or agency in charge)
Ministry of Economy, Trade and Industry
(Definition, Scope)
The production activities for “General-purpose internal
combustion engines” listed under Industry Number 2513 and
“Miscellaneous engines and turbines” listed under Industry
Number 2519 of the Japan Standard Industrial Classification.
(Given examples)
General-purpose gasoline engines, general-purpose kerosene
engines, general-purpose diesel engines, general-purpose gas en-
gines, atomic power reactors, water wheels (excluding water
power turbines), windmill engines, compressed-air engines,
- 177 -

parts, fixtures and accessories for general-purpose internal com-
bustion engines, atomic power reactors, and other engines
(Notes)
(1) Internal combustion engines for vessels, aircrafts, automo-
biles, and motorcycles are not classified in this sector.
(2) Electrical equipment for internal combustion engines is
classified under “3311-05, -051 Electrical equipment for in-
ternal combustion engines.”
Column Code Row Code Sector Name
2912-01 2912-011 Pumps and compressors
(Ministry or agency in charge)
Ministry of Economy, Trade and Industry
(Definition, Scope)
Production of “PUMPS AND COMPRESSORS” listed under
Group Number 252 of the Japan Standard Industrial Classifica-
tion.
(Given examples)
Pumps and pumping equipment: (single-step rotary pumps,
multi-step rotary pumps, pumps (anti-corrosive type), electric
pumps (for household), hand-operated pumps, etc.), air compres-
sors, gas compressors, blowers (cylindrical compressors, rotary
compressors, centrifugal compressors, axial compressors, etc.),
hydraulic and pneumatic equipment (hydraulic pumps, hydraulic
motors, hydraulic cylinders, hydraulic valves, pneumatic equip-
ment, etc.), and parts, fixtures, and accessories for pumps and
compressors
(Notes)
(1) This sector includes fire pumps and vessel pumps.
(2) Vacuum pumps are classified under “3019-02, -021 Vac-
uum equipment and vacuum component.” Automotive fuel
pumps are classified under “3531-01, -011 Internal combus-
tion engines for motor vehicles,” motor pumps for aircrafts
are classified under “3592-01, -011 Aircrafts,” and metering
pumps are classified under “3113-01, -011 Measuring in-
struments.”
Column Code Row Code Sector Name
2913-01 2913-011 Conveyors
(Ministry or agency in charge)
Ministry of Economy, Trade and Industry
(Definition, Scope)
The production activities for “Elevators and escalators” listed
under Industry Number 2532 and “Logistics and conveying
equipment” listed under Industry Number 2533 of the Japan
Standard Industrial Classification.
(Given examples)
Elevators including for home use, escalators including mov-
ing walkways, cranes, hoists, conveyors, and parts, fixtures and
accessories for conveying machines
(Notes)
Elevators for automobiles are classified under “2919-09 Mis-
cellaneous general-purpose machinery” and “2919-099 General-
purpose machinery, n.e.c.”
Column Code Row Code Sector Name
2914-01 2914-011 Refrigerators and air condi-
tioning apparatus
(Ministry or agency in charge)
Ministry of Economy, Trade and Industry
(Definition, Scope)
The production activities for “Refrigerating machines and air
conditioning apparatus” listed under Industry Number 2535 of
the Japan Standard Industrial Classification.
(Given examples)
Refrigerators, refrigerated and cooled display cases (incl.
shelves for frozen foods), packaged air-conditioners, water cool-
ers, cooling towers, cooling apparatus, freezing apparatus, ice-
making apparatus, dehumidifiers (excluding for consumer use),
parts, fixtures and accessories for refrigerators, and heat and hu-
midity conditioners
Column Code Row Code Sector Name
2919-01 2919-011 Bearings
(Ministry or agency in charge)
Ministry of Economy, Trade and Industry
(Definition, Scope)
The production activities for “Ball and roller bearings” listed
under Industry Number 2594 of the Japan Standard Industrial
Classification.
(Given examples)
Bearing shaft receptacles, roller shaft receptacles, shaft units,
and parts of bearing shaft receptacles and roller shaft receptacles
- 178 -

Column Code Row Code Sector Name
2919-09 Miscellaneous general-purpose
machinery
2919-091 Mechanical power transmis-
sion equipment
2919-099 General-purpose machinery,
n.e.c.
(Ministry or agency in charge)
Ministry of Economy, Trade and Industry
(Definition, Scope)
The production activities for “Mechanical power
transmission equipment, except ball and roller bearings” listed
under Industry Number 2531, “Industrial furnaces and ovens”
listed under Industry Number 2534, “Fire extinguishing
equipment and its apparatus” listed under Industry Number
2591, “Valves and fittings” listed under Industry Number
2592, “Fabricated pipe and fittings” listed under Industry
Number 2593, “Piston rings” listed under Industry Number
2595, “General-purpose machinery and apparatus, n.e.c.” listed
under Industry Number 2596, and “Machine shops (jobbing
and repair)” listed under Industry Number 2599 of the Japan
Standard Industrial Classification.
(Given examples)
Mechanical power transmission equipment: Transmissions,
gears (including those of plastics), roller chains
General-purpose machinery, n.e.c.: Industrial ovens, fire ex-
tinguishing gear, fire engine equipment, high-temperature
high pressure valves, automatic adjustable valves, supply
and drain valves, cocks, general purpose valves and cocks,
cut, bent, and threaded pipe articles, piston rings, heavy oil
and gas burners, parking devices, elevators for automobiles,
parts, fixtures, and accessories for general-purpose machin-
ery, n.e.c.
(Notes)
(1) “3019-09 Other general industrial machinery and equip
ment” (except wrapping and packaging machines) and
“3031- 09 Other general machines and parts” in the 2005 I-
O Tables were integrated into “2919-09 Miscellaneous gen-
eral-purpose machinery” in the 2011 I-O Tables; “3019-099
Other general industrial machinery and equipment” (except
wrapping and packaging machines)” and “3031-099 Other
general machines and parts” in the 2005 I-O Tables were
integrated and regrouped into “2919-091 Mechanical
power transmission equipment”; and “2919-099 General-
purpose machinery, n.e.c.” in the 2011 I-O Tables.
(2) Wrapping and packaging machines included in “3019-09,
-099 Miscellaneous general-purpose industrial machinery
and equipment” in the 2005 I-O Tables were divided and re-
grouped into “3014-01 Daily lives industry machinery” and
“3014-015 Packing machinery” in the 2011 I-O Tables.
- 179 -

30 Production machinery
Column Code Row Code Sector Name
3011-01 3011-011 Machinery for agricultural use
(Ministry or agency in charge)
Ministry of Economy, Trade and Industry
(Definition, Scope)
The production activities for “AGRICULTURAL MACHIN-
ERY AND EQUIPMENT, EXCEPT AGRICULTURAL TOOLS”
listed under Group Number 261 of the Japan Standard Industrial
Classification.
(Given examples)
Cultivators, push tractors, sprays, dust sprays, rice seeding
machines, rice chaffing machines, agricultural drying machines,
combines, cropping machines, feed machines, and parts, fixtures,
and accessories for agricultural machinery
(Notes)
Hand tools for farming are classified under the column sector
“2899-03 Plumber’s supplies, powder metallurgy products and
tools” and row column “2899-033 Cutlery and tools.”
Column Code Row Code Sector Name
3012-01 3012-011 Machinery and equipment for
construction and mining
(Ministry or agency in charge)
Ministry of Economy, Trade and Industry
(Definition, Scope)
The production activities for “MACHINERY AND EQUIP-
MENT FOR CONSTRUCTION AND MINING” listed under
Group Number 262 of the Japan Standard Industrial Classifica-
tion.
(Given examples)
Excavators, construction cranes, grounding machines, asphalt
paving machines, concrete machines, foundation work machines,
drilling machines, rock drilling machines, iron piles, crushing
machines, triturator, sorters, wheel tractors, caterpillar tractors,
and parts, fixtures, and accessories of construction and mining
machines
Column Code Row Code Sector Name
3013-01 3013-011 Textile machinery
(Ministry or agency in charge)
Ministry of Economy, Trade and Industry
(Definition, Scope)
The production activities for “TEXTILE MACHINERY”
listed under Group Number 263 of the Japan Standard Industrial
Classification.
(Given examples)
Chemical fiber fabrication machines, fiber spinning machines,
textile fabrication machines, knitting machines, dyeing and fin-
ishing machines, sawing machines (household sawing machines,
industrial sawing machines), and parts, fixtures, and accessories
of textile machinery
Column Code Row Code Sector Name
3014-01 Daily lives industry machinery
3014-011 Food processing machinery
and equipment
3014-012 Wood working machinery
3014-013 Pulp equipment and paper
machinery
3014-014 Printing, bookbinding and pa-
per-converting machinery
3014-015 Packing machinery
(Ministry or agency in charge)
Ministry of Economy, Trade and Industry
(Definition, Scope)
Production of “DAILY LIVES INDUSTRY MACHINERY”
listed under Group Number 264 of the Japan Standard Industrial
Classification.
(Given examples)
Food processing machinery and equipment: Grain processing
machines and systems, bakery and confectionary machines
and systems, brewing machines, milk-processing and diary
products processing machines and systems, meat and ma-
rine products processing machines, and parts, fixtures, and
accessories for food processing machinery
Wood working machinery: Timber sawing machinery (band
saws, circular saws), woodwork machinery (planers, saws,
and nailers), plywood machinery (veneer lathes, presses,
and cutters), and parts, fixtures, and accessories for machin-
ery for timber, woodwork, and plywood
Pulp and paper machines: Pulp machines and machinery
(chip-makers, chip-crushers, and refiners), paper machines
(long net, round net, short net, combined net), other paper
machinery (cutters, winders, coating machines), and parts,
fixtures, and accessories of pulp and paper machines
Printing, bookbinding and paperconverting machinery: Print-
ing machines (relief printing machines, lithographic print-
ing machines, (for sizes greater than B3 paper), special
- 180 -

printing machines, intaglio printing machines), bookbind-
ing machines (cutters, binders, and folders), paper pro-
cessing machines (for paper boxes, corrugate boxes, paper
sacks and envelop, and paper cups), plate-making machines
(type-casting machines, photographic typesetting ma-
chines), and parts, fixtures, and accessories of printing,
bookbinding, and paper processing machines
Packing machinery: Wrapping and packaging machines,
packing machines, and parts, fixture, and accessories for
Packing machines
(Notes)
(1) Wrapping and packaging machines, which had been clas-
sified under “3019-099 Other general industrial machinery
and equipment” in the 2005 I-O Tables were removed from
this sector and included in a new sector, “3014-015 Packing
machinery” in the 2011 I-O Tables.
(2) Wrapping and packaging machines, which were classified
under “3019-09 Other general industrial machinery and
equipment,” “3029-03 Food processing machinery and
equipment,” and wood working machinery, pulp equipment
and paper machinery, printing, bookbinding and paper con-
verting machinery, which had been classified under “3029-
09 Other special machinery for industrial use” in the 2005
I-O Tables were regrouped and included in “3014-01 Daily
lives industry machinery” in the 2011 I-O Tables.
Column Code Row Code Sector Name
3015-01 3015-011 Chemical machinery
(Ministry or agency in charge)
Ministry of Economy, Trade and Industry
(Definition, Scope)
The production activities for “Chemical machinery and its
equipment” listed under Industry Number 2652 of the Japan
Standard Industrial Classification.
(Given examples)
Filters, separators, heat exchangers (including partial conden-
sers), mixers, agitators, kneading machines, dissolvers, granula-
tor, emulsifiers, crushers, reactors, production furnaces, pyroly-
sis furnaces, electrolytic bathes, evaporators, distillers, machines
for crystallizations, dryers, dust controllers, chemical tanks (fixed
types, floating-roof types, spheres, and others), chemically treated
environment protecting equipment, other chemical machinery
and its equipment (presses, roasting machines, sintering ma-
chines, calciners, etc.) and parts, fixtures, and accessories of
chemical machines
Column Code Row Code Sector Name
3015-02 Casting equipment and plastic
processing machinery
3015-021 Casting equipment
3015-022 Plastic processing machinery
(Ministry or agency in charge)
Ministry of Economy, Trade and Industry
(Definition, Scope)
The production activities for “Casting equipment” listed un-
der Industry Number 2651 and “Machinery for fabrication of
plastic and its equipment” listed under Industry Number 2653 of
the Japan Standard Industrial Classification.
(Given examples)
Casting equipment: Die-casting machines, other casting ma-
chines (die-molding, die-inserting, inner arrangement, and
specialty die molding), dies and die-fitting (limited to iron
and steel), and parts, fixtures, and accessories for casting
machines
Plastic processing machinery: Injectors, Extruders, other plas-
tic processing machines (compressed molding, blow mold-
ing, vacuum molding), and parts, fixtures, and accessories
for plastic processing machines
Column Code Row Code Sector Name
3016-01 3016-011 Metal machine tools
(Ministry or agency in charge)
Ministry of Economy, Trade and Industry
(Definition, Scope)
The production activities for “Metal cutting machine tools”
listed under Industry Number 2661 and parts and accessories for
metal working machines specified in “Parts and accessories for
metalworking machines and metal cutting machine tools, except
machinists' tools, molds and dies” listed under Industry Number
2663 of the Japan Standard Industrial Classification.
(Given examples)
Turning machines, drilling machines, boring machines, mill-
ing machines, grinding machines, gear-cutting machines, gear
finishing machines, special purpose machines, machining cen-
ters, other metal machining tools (flat grinding machines, trans-
verse shaping machines, broaching machines, horning machines,
lapping machines, metal sawing machines, etc.), and parts, fix-
tures, and accessories for machine-tools
- 181 -

Column Code Row Code Sector Name
3016-02 3016-021 Metal processing machinery
(Ministry or agency in charge)
Ministry of Economy, Trade and Industry
(Definition, Scope)
The production activities for “Metalworking machinery and
its equipment, except metal cutting machine tools” listed under
Industry Number 2662 and parts and accessories for metal-work-
ing machines specified in “Parts and accessories for metalwork-
ing machines and metal cutting machine tools, except machin-
ists' tools, molds and dies” listed under Industry Number 2663
of the Japan Standard Industrial Classification.
(Given examples)
Metal rolling machines and auxiliary equipment, refiner,
bending machines, hydraulic pressing machines, mechanical
pressing machines, shearing machines, forging machines, wire-
forming machines, gas welding machines, fusing machines,
other metal machining tools (tube mills, pneumatic presses, etc.),
rolls for metal rolling, and parts, fixtures, and accessories for
metal machine tools
Column Code Row Code Sector Name
3016-03 3016-031 Machinists’ precision tools
(Ministry or agency in charge)
Ministry of Economy, Trade and Industry
(Definition, Scope)
The production activities for “Machinists' tools, except powder
metallurgy products” listed under Industry Number 2664 of the
Japan Standard Industrial Classification.
(Given examples)
Special steel cutting tools, carbide tipped tools (excluding
powder metallurgy), air tools, electric tools, diamond bladed
tools, and jigs and accessories for metal processing
(Notes)
Carbide tipped tools (powder metallurgy) are classified under
the column sector “2899-03 Plumber’s supplies, powder metal-
lurgy products and tools” and row sector “2899-032 Powder
metallurgy products.”
Column Code Row Code Sector Name
3017-01 3017-011 Semiconductor making equip-
ment
(Ministry or agency in charge)
Ministry of Economy, Trade and Industry
(Definition, Scope)
The production activities for “SEMICONDUCTOR AND
FLAT-PANEL DISPLAY MANUFACTURING EQUIPMENT”
listed under Group Number 267 of the Japan Standard Industrial
Classification.
(Given examples)
Handling devices for wafer processes (electronic circuitry for-
mation), semiconductor assembly devices, flat panel display
manufacturing devices, and parts, fixtures, and accessories for
semiconductor and flat panel display manufacturing devices
Column Code Row Code Sector Name
3019-01 3019-011 Metal molds
(Ministry or agency in charge)
Ministry of Economy, Trade and Industry
(Definition, Scope)
The production activities for “Molds and dies, parts and ac-
cessories for metal products” listed under Industry Number 2691,
and “Molds and dies, parts and accessories for nonmetal prod-
ucts” listed under Industry Number 2692 of the Japan Standard
Industrial Classification.
(Given examples)
Metal molds for press machines, metal molds for forging,
metal molds for casting (including die-casting), metal molds for
plastics, molds for rubber, and parts and accessories for molds
and dies
Column Code Row Code Sector Name
3019-02 3019-021 Vacuum equipment and vacuum
component
(Ministry or agency in charge)
Ministry of Economy, Trade and Industry
(Definition, Scope)
The production activities for “Vacuum equipment and vacuum
component” listed under Industry Number 2693 of the Japan
Standard Industrial Classification.
(Given examples)
Vacuum equipment and vacuum components except semicon-
ductor manufacturing devices (vacuum pumps, vacuum metal-
lurgy equipment, vacuum chemical equipment, vacuum deposi-
tion equipment, vacuum coating equipment, sputtering apparat-
uses, dry etching equipment, CVD equipment, ion implantation
equipment, etc.), and parts, fixtures, and accessories for vacuum
equipment and vacuum components
- 182 -

Column Code Row Code Sector Name
3019-03 3019-031 Robots
(Ministry or agency in charge)
Ministry of Economy, Trade and Industry
(Definition, Scope)
The production activities for “Robots” listed under Industry
Number 2694 of the Japan Standard Industrial Classification.
(Given examples)
Manual manipulators, fixed-sequence robots, variable-se-
quence robots, playback robots, computer-controlled robots, and
parts, fixtures, and accessories for robots
Column Code Row Code Sector Name
3019-09 3019-099 Miscellaneous production ma-
chinery
(Ministry or agency in charge)
Ministry of Economy, Trade and Industry
(Definition, Scope)
The production activities for “Production machinery and ma-
chine parts, n.e.c.” listed under Industry Number 2699 of the Ja-
pan Standard Industrial Classification.
(Given examples)
Machines and tools for the rubber industry, specialty ma-
chines for the glass industry, other specialty industrial machines
(tobacco machines, specialty machines for the chemical and drug,
hat-making, leather-processing, and shoe-making industries),
and parts, fixtures, and accessories for miscellaneous production
machinery
(Notes)
Other production machinery which had been classified under
“3029-09 Other special machinery for industrial use” in the 2005
I-O Tables was removed from this sector and included in “3019-
09 Miscellaneous production machinery” in the 2011 I-O Tables.
31 Business oriented machinery
Column Code Row Code Sector Name
3111-01 3111-011 Copy machine
(Ministry or agency in charge)
Ministry of Economy, Trade and Industry
(Definition, Scope)
The production activities for copying machines specified in
“Copying machines” listed under Industry Number 2711 of the
Japan Standard Industrial Classification.
(Given examples)
Electrostatic indirect copying machines, digital copying ma-
chines, full-color copying machines, and parts, fixtures, and ac-
cessories for copying machines
Column Code Row Code Sector Name
3111-09 3111-099 Miscellaneous office machines
(Ministry or agency in charge)
Ministry of Economy, Trade and Industry
(Definition, Scope)
The production activities for “Miscellaneous office machines”
listed under Industry Number 2719 of the Japan Standard Indus-
trial Classification.
(Given examples)
Accounting registers (cash registers), electronic accounting
machines except stored-program machines, word processors,
typewriters, time recorders, duplicators, address printers, micro-
film machines, offset printing machines (for sizes smaller than
B3 paper), coin calculators, shredders for office use, drawing
machines, and parts, fixtures, and accessories for other office
machines
(Notes)
Electronic computing equipment is included in “3421-01, -
011 Personal Computers” or “3421-02, -021 Electronic compu-
ting equipment (except personal computers).” Office supplies
such as slide rules, Japanese abacuses, mimeographs, and design
and drawing instruments are included in “3919-04, -041 Station-
ery.”
- 183 -
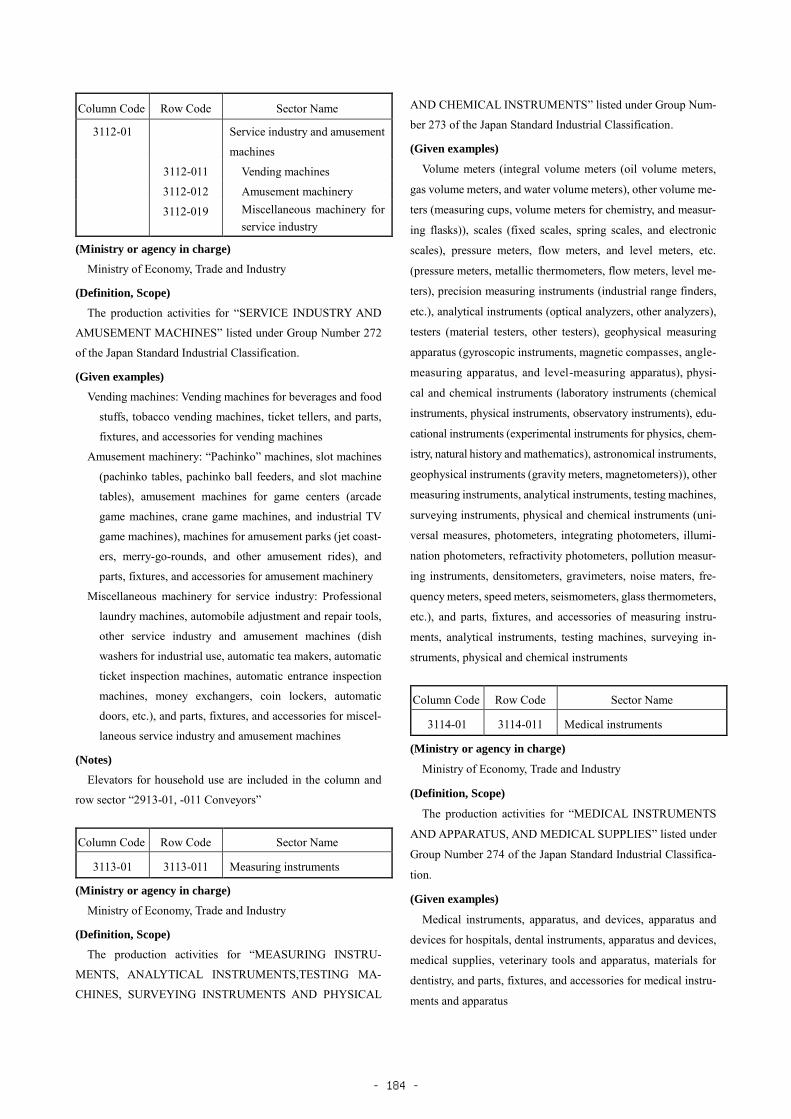
Column Code Row Code Sector Name
3112-01 Service industry and amusement
machines
3112-011 Vending machines
3112-012 Amusement machinery
3112-019 Miscellaneous machinery for
service industry
(Ministry or agency in charge)
Ministry of Economy, Trade and Industry
(Definition, Scope)
The production activities for “SERVICE INDUSTRY AND
AMUSEMENT MACHINES” listed under Group Number 272
of the Japan Standard Industrial Classification.
(Given examples)
Vending machines: Vending machines for beverages and food
stuffs, tobacco vending machines, ticket tellers, and parts,
fixtures, and accessories for vending machines
Amusement machinery: “Pachinko” machines, slot machines
(pachinko tables, pachinko ball feeders, and slot machine
tables), amusement machines for game centers (arcade
game machines, crane game machines, and industrial TV
game machines), machines for amusement parks (jet coast-
ers, merry-go-rounds, and other amusement rides), and
parts, fixtures, and accessories for amusement machinery
Miscellaneous machinery for service industry: Professional
laundry machines, automobile adjustment and repair tools,
other service industry and amusement machines (dish
washers for industrial use, automatic tea makers, automatic
ticket inspection machines, automatic entrance inspection
machines, money exchangers, coin lockers, automatic
doors, etc.), and parts, fixtures, and accessories for miscel-
laneous service industry and amusement machines
(Notes)
Elevators for household use are included in the column and
row sector “2913-01, -011 Conveyors”
Column Code Row Code Sector Name
3113-01 3113-011 Measuring instruments
(Ministry or agency in charge)
Ministry of Economy, Trade and Industry
(Definition, Scope)
The production activities for “MEASURING INSTRU-
MENTS, ANALYTICAL INSTRUMENTS,TESTING MA-
CHINES, SURVEYING INSTRUMENTS AND PHYSICAL
AND CHEMICAL INSTRUMENTS” listed under Group Num-
ber 273 of the Japan Standard Industrial Classification.
(Given examples)
Volume meters (integral volume meters (oil volume meters,
gas volume meters, and water volume meters), other volume me-
ters (measuring cups, volume meters for chemistry, and measur-
ing flasks)), scales (fixed scales, spring scales, and electronic
scales), pressure meters, flow meters, and level meters, etc.
(pressure meters, metallic thermometers, flow meters, level me-
ters), precision measuring instruments (industrial range finders,
etc.), analytical instruments (optical analyzers, other analyzers),
testers (material testers, other testers), geophysical measuring
apparatus (gyroscopic instruments, magnetic compasses, angle-
measuring apparatus, and level-measuring apparatus), physi-
cal and chemical instruments (laboratory instruments (chemical
instruments, physical instruments, observatory instruments), edu-
cational instruments (experimental instruments for physics, chem-
istry, natural history and mathematics), astronomical instruments,
geophysical instruments (gravity meters, magnetometers)), other
measuring instruments, analytical instruments, testing machines,
surveying instruments, physical and chemical instruments (uni-
versal measures, photometers, integrating photometers, illumi-
nation photometers, refractivity photometers, pollution measur-
ing instruments, densitometers, gravimeters, noise maters, fre-
quency meters, speed meters, seismometers, glass thermometers,
etc.), and parts, fixtures, and accessories of measuring instru-
ments, analytical instruments, testing machines, surveying in-
struments, physical and chemical instruments
Column Code Row Code Sector Name
3114-01 3114-011 Medical instruments
(Ministry or agency in charge)
Ministry of Economy, Trade and Industry
(Definition, Scope)
The production activities for “MEDICAL INSTRUMENTS
AND APPARATUS, AND MEDICAL SUPPLIES” listed under
Group Number 274 of the Japan Standard Industrial Classifica-
tion.
(Given examples)
Medical instruments, apparatus, and devices, apparatus and
devices for hospitals, dental instruments, apparatus and devices,
medical supplies, veterinary tools and apparatus, materials for
dentistry, and parts, fixtures, and accessories for medical instru-
ments and apparatus
- 184 -

(Notes)
X-ray equipment, electronic equipment, and laser equipment
are classified under the sector “3331-01, -011 Applied electronic
equipment”
Column Code Row Code Sector Name
3115-01 3115-011 Optical instruments and lenses
(Ministry or agency in charge)
Ministry of Economy, Trade and Industry
(Definition, Scope)
The production activities for “OPTICAL INSTRUMENTS
AND APPARATUS, AND LENSES” listed under Group Number
275 of the Japan Standard Industrial Classification.
(Given examples)
Microscopes, telescopes (telescopes, binoculars, microscopes,
magnifiers), cameras and motion picture equipment (cameras
excluding digital cameras [focal-plane shutter type, lens shutter
type, compact cameras, twin-lens cameras, miniature cameras,
professional cameras], photographic and related devices [enlarg-
ing devices, developing, printing, and finishing devices, photo
dryers, readers, and viewers, etc.], motion picture equipment
[film cameras, film projectors, slide projectors, film developing
devices, film printing devices, film screens, etc.]), lenses and
prisms for optical instruments (camera lenses, interchangeable
camera lenses, optical lenses, prisms), parts, fixtures and acces-
sories for microscopes and telescopes, etc., parts, fixtures and
accessories for cameras and motion picture equipment (filters,
hoods, tripods, geared heads with mounting plates, self-timers,
range finders, exposure meters, shutters, bodies, foldable camera
bodies, camera attachments for close-up photography and tele-
scopic photography, and electronic flash)
Column Code Row Code Sector Name
3116-01 3116-011 Ordnance
(Ministry or agency in charge)
Ministry of Economy, Trade and Industry
(Definition, Scope)
The production activities of “ORDNANCE AND ACCESSO-
RIES” listed under Group Number 276 of the Japan Standard
Industrial Classification.
(Given examples)
Weapons, heavy weapons, grenade launchers, cartridges, shells,
explosives, other weapons (flame throwers, combat vehicles, fire
control systems, etc.), weapons parts and accessories
32 Electronic components
Column Code Row Code Sector Name
3211-01 3211-011 Semiconductor devices
(Ministry or agency in charge)
Ministry of Economy, Trade and Industry
(Definition, Scope)
The production activities for “Photoelectric conversion ele-
ment” listed under Industry Number 2812, and “Semiconduc-
tor devices, except photoelectric conversion element” listed un-
der Industry Number 2813 of the Japan Standard Industrial
Classification.
(Given examples)
Photoelectric conversion elements (light-emitting diodes, la-
ser diodes, couplers and interrupters, solar cells, etc.), other semi-
conductor devices (diodes, rectifiers, transistors (silicon transis-
tors, field effect transistors, insulated-gate bipolar transistors, etc.),
thermistors, varistors, thyristors, photodetectors, etc.)
(Notes)
Components of semiconductor devices are classified under the
sector “3299-09, -099 Miscellaneous electronic components”
Column Code Row Code Sector Name
3211-02 3211-021 Integrated circuits
(Ministry or agency in charge)
Ministry of Economy, Trade and Industry
(Definition, Scope)
The production activities for “Integrated circuits” listed under
Industry Number 2814 of the Japan Standard Industrial Classifi-
cation.
Unmounted integrated circuits are classified as intermediate
products.
(Given examples)
Linear integrated circuits, bipolar integrated circuits, MOS in-
tegrated circuits, hybrid integrated circuits, integrated circuits
not mounted (for export)
(Notes)
Components of integrated circuits are classified under the
sector “3299-09, -099 Miscellaneous electronic components”
Column Code Row Code Sector Name
3211-03 3211-031 Liquid crystal panel
(Ministry or agency in charge)
- 185 -

Ministry of Economy, Trade and Industry
(Definition, Scope)
The production activities for liquid crystal panel and liquid
crystal devices among those listed as “Liquid crystal panel and
flat-panel” as specified in Industry Number 2815 of the Japan
Standard Industrial Classification
(Given examples)
Liquid crystal panel: Active types (TFT types), passive types,
liquid crystal modules (those conducted in an integrated manner
from panel production), liquid crystal devices
Column Code Row Code Sector Name
3211-04 3211-041 Flat-panel and electron tubes
(Ministry or agency in charge)
Ministry of Economy, Trade and Industry
(Definition, Scope)
Production of “Electron tubes” listed under Industry Number
2811 and “Liquid crystal panel and flat-panel” listed under In-
dustry Number 2815 of the Japan Standard Industrial Classifica-
tion, except liquid crystal panels and liquid crystal devices
(Given examples)
Electron tubes (microwave tubes, cathode‐ray tubes [Braun
tubes], indicator tubes, x-ray tubes, etc.), plasma display panels,
plasma display modules produced in the process of panel pro-
duction, other flat-panels (organic EL panels, SED panels, FED
panels, etc.)
(Changes from the 2011 I-O Tables)
Other flat-panels classified under “3299-09, -099 Miscellane-
ous electronic components” in the 2011 I-O Tables are integrated
into this sector.
(Notes)
Parts of electron tubes are included in “3299-09, -099 Miscel-
laneous electronic components.”
Column Code Row Code Sector Name
3299-01 3299-011 Storage media
(Ministry or agency in charge)
Ministry of Economy, Trade and Industry
(Definition, Scope)
Production of “STORAGE MEDIA” listed under Group
Number 283 of the Japan Standard Industrial Classification
(Given examples)
Semiconductor memory media (SD memory cards, memory
sticks, CompactFlash, etc.), raw optical discs (magneto-optical
discs (MO, etc.), CD-R/RWs, DVD-R/RWs, BD-R/RWs, etc.),
raw magnetic discs (rigid discs, etc.), raw magnetic tapes (for
audio recording, video recording, and electronic computing
equipment)
(Changes from the 2011 I-O Tables)
Semiconductor memory media classified under “3299-09, -
099 Miscellaneous electronic components” in the 2011 I-O Ta-
bles are integrated into this sector.
Column Code Row Code Sector Name
3299-02 3299-021 Electric circuit
(Ministry or agency in charge)
Ministry of Economy, Trade and Industry
(Definition, Scope)
The production activities of “ELECTRONIC CIRCUIT”
listed under Group Number 284 of the Japan Standard Industrial
Classification.
(Given examples)
Rigid printed wiring board, flexible printed wiring board,
module substrates, printing wiring mounting board, module
mounting board
Column Code Row Code Sector Name
3299-09 3299-099 Miscellaneous electronic com-
ponents
(Ministry or agency in charge)
Ministry of Economy, Trade and Industry
(Definition, Scope)
Production of “ELECTRONIC PARTS” listed under Group
Number 282 and “UNIT PARTS” listed under Group Number
285 and “MISCELLANEOUS ELECTRONIC PARTS, DE-
VICES AND ELECTRONIC CIRCUITS” listed under Group
Number 289 of the Japan Standard Industrial Classification
(Given examples)
Resistors, capacitors, transformers, composite parts, audio
parts, magnetic heads, micromotors (less than 3W), connectors,
switches, relays, unit parts (switching power supplies, TV tuners,
control units, etc.), other electronic parts (magnetic compo-
nents (including powder and gold), silicon wafers (surface
grounded), touch panel sensors, LED lamps, etc.)
(Changes from the 2011 I-O Tables)
Other flat-panel and semiconductor memory media classified
under this sector in the 2011 I-O Tables are integrated into
“3211-04, -041 Flat-panel and electron tubes” and “3299-01, -
011 Storage media, respectively.”
- 186 -

(Notes)
(1) Micromotors (less than 3W) are included in this sector.
(2) LED (light-emitting diode) lamps are included in this sec-
tor.
(3) Parts of semiconductor devices, integrated circuits, and
electron tubes are included in this sector.
(4) Parts and accessories of wired communication equipment,
radio communication equipment (except cellular telephone
sets), radio and television receivers, and other communica-
tion equipment (except railway signal and safety appli-
ances) are included in this sector.
(5) Electronic circuits classified under this sector in the 2005
I-O Tables were classified under a new sector, “3299-02, -
021 Electronic circuits” in the 2011 I-O Tables.
(6) Silicon wafers (surface grounded) classified under
“3241-09, -099 Other electrical devices and parts” in the
2005 I-O Tables were integrated into this sector in the 2011
I-O Tables.
33 Electrical machinery
Column Code Row Code Sector Name
3311-01 Rotating electrical equipment
3311-011 Generators
3311-012 Electric motors
(Ministry or agency in charge)
Ministry of Economy, Trade and Industry
(Definition, Scope)
The production activities for “Generators, motors and other
rotating electrical machinery” listed under Industry Number
2911of the Japan Standard Industrial Classification.
(Given examples)
Generators: Turbine generators (AC), engine generators (AC),
other generators (DC generators, hydro-generators, motor-
driven generators), and parts, fixtures, and accessories for other
rotary electrical machines and generators
Motors: DC motors, single-phase induction motors, tri-phase
induction motors, other AC motors (synchronous motors, brush
motors), DC and AC mini-motors, other mini-motors (synchro-
nous motors, stepping motors), and parts, fixtures, and accesso-
ries for motors
(Notes)
(1) Generators and electric motors for internal combustion en
gines for motor vehicles and airplanes are included in
“3311-05, -051 Electrical equipment for internal combus-
tion engines.”
(2) Super mini-motors (less than 3W) are included in “3299-
09, -099 Miscellaneous electronic components”
Column Code Row Code Sector Name
3311-02 3311-021 Transformers and reactors
(Ministry or agency in charge)
Ministry of Economy, Trade and Industry
(Definition, Scope)
The production activities for “Power and distribution trans-
formers, except electronic appliances transformers” listed under
Industry Number 2912 of the Japan Standard Industrial Classifi-
cation.
(Given examples)
Standard transformers, non-standard transformers, transform-
ers for special applications, instrument transformers, reactors,
inductive voltage controllers, and parts, fixtures, and accessories
for transformers
- 187 -

Column Code Row Code Sector Name
3311-03 3311-031 Relay switches and switch-
boards
(Ministry or agency in charge)
Ministry of Economy, Trade and Industry
(Definition, Scope)
The production activities for “Electrical relay switches” listed
under Industry Number 2913, and “Switchboards and electrical
control equipment” listed under Industry Number 2914 of the
Japan Standard Industrial Classification.
(Given examples)
Electrical relay switches (relays, circuit breakers, switchgear,
programmable controllers), switchboards and electrical control
equipment (power distribution boards, monitoring control panels,
distribution panels, etc.) and parts, fixtures, and accessories for
switchgear, distribution panels, and electrical control equipment
Column Code Row Code Sector Name
3311-04 3311-041 Wiring devices and supplies
(Ministry or agency in charge)
Ministry of Economy, Trade and Industry
(Definition, Scope)
The production activities for “Wiring devices and supplies”
listed under Industry Number 2915 of the Japan Standard Indus-
trial Classification.
(Given examples)
Small switchgear, flasher unit, cord connectors, other wiring
devices and supplies (lamp holders, panel boards, small wiring
boxes, fuses, terminals, etc.)
Column Code Row Code Sector Name
3311-05 3311-051 Electrical equipment for inter-
nal combustion engines
(Ministry or agency in charge)
Ministry of Economy, Trade and Industry
(Definition, Scope)
The production activities for “Auxiliary equipment for inter-
nal combustion engines” listed under Industry Number 2922 of
the Japan Standard Industrial Classification.
(Given examples)
Battery generators, ignition motors, magnetic generators, ig-
nition coils, distributors, spark plugs, and parts, fixtures, and ac-
cessories for internal combustion engines
(Notes)
Electrical equipment for internal combustion engines for au-
tomobiles, aircrafts, etc. are included in this sector.
Column Code Row Code Sector Name
3311-09 3311-099 Miscellaneous electrical devices
and parts
(Ministry or agency in charge)
Ministry of Economy, Trade and Industry
(Definition, Scope)
The production activities for “Electrical welding equipment”
listed under Industry Number 2921, and “Miscellaneous indus-
trial electrical apparatus, including those for vehicles and vessels”
listed under Industry Number 2929 of the Japan Standard Indus-
trial Classification.
(Given examples)
Electrical welding equipment (arc-welding machines, re-
sistance welding machines, condensers, electric furnaces, indus-
trial heating devices, power converters, silicon and selenium rec-
tifiers, and parts, fixtures, and accessories for other industrial
heavy electrical equipment
Column Code Row Code Sector Name
3321-01 3321-011 Household air-conditioners
(Ministry or agency in charge)
Ministry of Economy, Trade and Industry
(Definition, Scope)
The production activities for “Air-conditioning and home
comfort” excluding household air-conditioners, listed under In-
dustry Number 2932 of the Japan Standard Industrial Classifica-
tion.
(Given examples)
Household air-conditioners (window type, separate type, etc.),
and parts, fixtures, and accessories for household air-condition-
ers
Column Code Row Code Sector Name
3321-02 3321-021 Household electric appliances
(except air-conditioners)
(Ministry or agency in charge)
Ministry of Economy, Trade and Industry
(Definition, Scope)
The production activities for household air-conditioners spec-
ified in “HOUSEHOLD ELECTRIC APPLIANCES” listed un-
der Group Number 293 of the Japan Standard Industrial Classi-
fication.
- 188 -

(Given examples)
Kitchen appliances (electric rice cookers, microwaves (in-
cluding oven ranges and steam ranges), refrigerators, electro-
magnetic cookers (IH cookers, IH cooking heaters, etc.), other
kitchen appliances (electric pots, dishwashers, dish dryers, etc.),
ventilation and housing-related appliances (electric fans, electric
ventilation fans, electric water heaters, humidifiers, dehumidifi-
ers, air cleaners, etc.), apparel and sanitation-related appliances
(electric irons, electric washers, electric vacuum cleaners,
clothes dryers, etc.), other household electric appliances (electric
foot warmers, barber and hairdressing tools (electric razors, hair
dryers, etc.), electrically-heated bidet toilet seats, electric stoves,
electric carpets, household therapeutic instruments), and parts,
fixtures, and accessories for household electric appliances (ex-
cluding household air conditioners)
Column Code Row Code Sector Name
3331-01 3331-011 Applied electronic equipment
(Ministry or agency in charge)
Ministry of Economy, Trade and Industry
(Definition, Scope)
The production activities of “ELECTRONIC EQUIPMENT”
listed under Group Number 296 of the Japan Standard Industrial
Classification.
(Given examples)
X-ray devices (for medical use and industrial use), electronic
devices for medical use, other applied electronic equipment (ap-
plied ultrasound devices, applied high frequency power devices,
electronic microscopes, numerical control devices, Geiger coun-
ters, laser devices, applied magnetic probing devices, etc.) and
parts, fixtures, and accessories for applied electronic equipment
(Notes)
Following the revision of the Japan Standard Industrial Clas-
sification, industrial recording and playback devices and video
cameras (excluding for broadcasting), and their parts, fixtures
and accessories classified under this sector in the 2005 I-O Ta-
bles were integrated into “3411-01, -011 Video equipment and
digital camera” in the 2011 I-O Tables.
Column Code Row Code Sector Name
3332-01 3332-011 Electric measuring instruments
(Ministry or agency in charge)
Ministry of Economy, Trade and Industry
(Definition, Scope)
The production activities of “ELECTRIC MEASURING IN-
STRUMENTS” listed under Group Number 297 of the Japan
Standard Industrial Classification.
(Given examples)
Electric meters (watt-hour meters, ammeters, and voltmeters),
electric measuring instruments (voltage standards, ammeter stand-
ards, and circuit testers), semiconductor and IC testers, industrial
process control instruments, medical instruments, and parts, fix-
tures, and accessories for electric measuring instruments
Column Code Row Code Sector Name
3399-01 3399-011 Electric bulbs
(Ministry or agency in charge)
Ministry of Economy, Trade and Industry
(Definition, Scope)
The production activities for “Electric bulbs” listed under In-
dustry Number 2941 of the Japan Standard Industrial Classifica-
tion.
(Given examples)
General purpose light bulbs, miniature lamps, Xmas tree light
bulbs, automobile lamps, infra-red lamps, flash bulbs for pho-
tography, pilot lamps, halogen lamps, fluorescent lamps, mer-
cury lamps, UV lamps, sterilizer lamps, neon tubes, arc lamps,
and HID lamps
(Notes)
(1) LED (light-emitting diode) lamps are included in “3299-
09, -099 Miscellaneous electronic components.”
(2) Parts for Electric bulbs are classified under the sector
“3399-09, -099 Miscellaneous electrical devices and parts.
Column Code Row Code Sector Name
3399-02 3399-021 Electric lighting fixtures and ap-
paratus
(Ministry or agency in charge)
Ministry of Economy, Trade and Industry
(Definition, Scope)
The production activities for “Electric lighting fixtures” listed
under Industry Number 2942 of the Japan Standard Industrial
Classification.
(Given examples)
Incandescent lamps and fixtures, fluorescent lamps, mercury
lamps, lamps with generators, portable searchlights, flashlights,
UV sterilizers, sodium lamps, car blinkers, and parts, fixtures,
and accessories for electric lighting fixtures and apparatus
- 189 -

Column Code Row Code Sector Name
3399-03 3399-031 Batteries
(Ministry or agency in charge)
Ministry of Economy, Trade and Industry
(Definition, Scope)
The production activities of “PRIMARY BATTERIES (DRY
AND WET)” listed under Group Number 295 of the Japan
Standard Industrial Classification.
(Given examples)
Storage batteries (lead, alkali, lithium-ion), primary batteries
(manganese dry cells, alkali-manganese dry cells, silver oxide
cells, lithium-ion cells), parts, fixtures, and accessories for bat-
tery cells
Column Code Row Code Sector Name
3399-09 3399-099 Miscellaneous electrical devices
and parts
(Ministry or agency in charge)
Ministry of Economy, Trade and Industry
(Definition, Scope)
The production activities for “MISCELLANEOUS ELEC-
TRICAL MACHINERY EQUIPMENT AND SUPPLIES” listed
under Group Number 299 of the Japan Standard Industrial Clas-
sification.
(Given examples)
Lead wires, solar cell module, electrical devices and parts,
n.e.c. (lamp sockets, tungsten wire for electrical lamps and elec-
tronics, molybdenum, permanent magnets, electrical contacts,
lead frames, etc.)
(Notes)
(1) Parts for electric bulbs are included in this sector.
(2) Silicon wafers (surface grounded), which were classified
in this sector in the 2005 I-O tables, were integrated into
“3299-09, -099 Miscellaneous electronic components.”
34 Information and communication electronics
equipment
Column Code Row Code Sector Name
3411-01 3411-011 Wired communication equip-
ment
(Ministry or agency in charge)
Ministry of Economy, Trade and Industry
(Definition, Scope)
The production activities for “Communication equipment
wired” listed under Industry Number 3011 of the Japan Stand-
ard Industrial Classification.
(Given examples)
Telephone (wired) devices (telephone machines, switching
equipment, intercom systems, telephone applied devices, etc.),
telecommunication and image (wired) devices (facsimile ma-
chines, telephone systems for teleconferences, etc.), carrier de-
vices (digital transmission equipment, modulator-demodulators
(modem), etc.)
(Notes)
(1) Parts and accessories of wired communication equipment
are classified under the sector “3299-09, -099 Miscellane-
ous electronic components”
(2) Cellular phones and portable handy phones (PHS) are clas-
sified under the sector “3411-02, -021 Cellular phones.”
However, cordless handset of a telephone machine or a
facsimile machine that are available for independent use
as portable handy phones (PHS) shall also be classified in
this sector, while a PHS unit that is available as a slave unit
of a telephone machine shall be classified under the sector
“3411-02, -021 Cellular phones”
Column Code Row Code Sector Name
3411-02 3411-021 Mobile phones
(Ministry or agency in charge)
Ministry of Economy, Trade and Industry
(Definition, Scope)
The production activities for “Mobile phone and PHS”
listed under Industry Number 3012 of the Japan Standard In-
dustrial Classification.
(Given examples)
Cellular phones, portable handy phones (PHS)
- 190 -

Column Code Row Code Sector Name
3411-03 3411-031 Radio communication equip-
ment (except Mobile phone)
(Ministry or agency in charge)
Ministry of Economy, Trade and Industry
(Definition, Scope)
The production activities for “Radio communication equip-
ment” listed under Industry Number 3013 of the Japan Stand-
ard Industrial Classification.
(Given examples)
Radio and television broadcasting equipment, fixed radio
communication equipment, other mobile radio communication
equipment, radio communication equipment for cellular phones
(excluding cellular phones and portable handy phones (PHS)),
applied radio equipment (GPS systems, car navigation systems,
ETC systems, etc.), and other radio communication equipment
(personal radio communication equipment, etc.)
(Notes)
Parts and accessories of radio communication equipment (ex-
cept cellular telephone sets) are included in “3299-09, -099 Mis-
cellaneous electronic components.”
Column Code Row Code Sector Name
3411-04 3411-041 Radio and television sets
(Ministry or agency in charge)
Ministry of Economy, Trade and Industry
(Definition, Scope)
The production activities for “Radio and television set receiv-
ers” listed under Industry Number 3014 of the Japan Standard
Industrial Classification.
(Given examples)
Radio receivers, television receivers (including record-
ing/playback integrated type, liquid crystal panel type, plasma
display panel type, Braun tube type, projection type [integrated
with a receiver], etc.)
(Notes)
Parts and accessories for radio and television sets are classi-
fied in “3299-09, -099 Miscellaneous electronic components.”
Column Code Row Code Sector Name
3411-09 3411-099 Miscellaneous communication
equipment
(Ministry or agency in charge)
Ministry of Economy, Trade and Industry
(Definition, Scope)
The production activities for “Traffic signals, railway sig-
nals and safety appliances” listed under Industry Number
3015, and “Miscellaneous communication equipment and re-
lated products” listed under Industry Number 3019 of the Ja-
pan Standard Industrial Classification.
(Given examples)
Traffic signal safety devices and their parts, fixtures, and
accessories (traffic signals, mechanical signals, electric rail
switchers, mechanical rail switchers, etc.), fire alarms, secu-
rity alarms, lighting signals, communication signals, and gas
alarms
(Notes)
Parts and accessories for other communication equipment (ex-
cept railway signal and safety appliances) are included in “3299-
09, -099 Miscellaneous electronic components.”
Column Code Row Code Sector Name
3412-01 3412-011 Video equipment and digital
camera
(Ministry or agency in charge)
Ministry of Economy, Trade and Industry
(Definition, Scope)
The production activities for “Video equipment” listed un-
der Industry Number 3021, and “Digital camera” listed under
Industry Number 3022 of the Japan Standard Industrial Clas-
sification.
(Given examples)
Recording and playback devices (DVD recorders, etc.),
video cameras (excluding for broadcasting), digital cameras,
and parts, fixtures, and accessories for video equipment and
digital camera
(Notes)
Following the revision of the Japan Standard Industrial
Classification, industrial recording and playback devices and
video cameras (excluding for broadcasting), and their parts,
fixtures, and accessories classified under “3221-01, -011
Applied electronic equipment” in the 2005 I-O Tables were
integrated into this sector in the 2011 I-O Tables.
Column Code Row Code Sector Name
3412-02 3412-021 Electric audio equipment
(Ministry or agency in charge)
Ministry of Economy, Trade and Industry
(Definition, Scope)
The production activities for “Electric audio equipment”
- 191 -

listed under Industry Number 3023 of the Japan Standard In-
dustrial Classification.
(Given examples)
Stereo systems, car stereo systems, digital audio disc players,
amps for high fidelity, speaker systems for high fidelity and cars,
hearing aids, other electrical acoustic equipment (tape recorders,
IC recorders, etc.), speaker systems, microphones, earphones,
acoustic pickups, etc. (finished products), parts, fixtures, and ac-
cessories for electrical acoustic equipment
Column Code Row Code Sector Name
3421-01 3421-011 Personal Computers
(Ministry or agency in charge)
Ministry of Economy, Trade and Industry
(Definition, Scope)
The production activities for “Personal computer” listed un-
der Industry Number 3032 of the Japan Standard Industrial
Classification.
(Given examples)
Personal computers (desktops, notebooks, tablets, etc.) and
parts, fixtures and accessories for personal computers
Column Code Row Code Sector Name
3421-02 3421-021 Electronic computing
equipment (except personal
computers)
(Ministry or agency in charge)
Ministry of Economy, Trade and Industry
(Definition, Scope)
The production activities for “Computer, except personal
computer” listed under Industry Number 3031 of the Japan
Standard Industrial Classification.
(Given examples)
General purpose computers, mid-range computers (office
computers, workstations, etc.), and parts, fixtures, and accesso-
ries for electronic computing equipment (excluding personal
computers)
Column Code Row Code Sector Name
3421-03 3421-031 Electronic computing equipment
(accessory equipment)
(Ministry or agency in charge)
Ministry of Economy, Trade and Industry
(Definition, Scope)
The production activities for “External storages” listed un-
der Industry Number 3033, “Printer” listed under Industry
Number 3034, “Display unit” listed under Industry Number
3035, and “Miscellaneous peripheral equipment” listed under
Industry Number 3039 of the Japan Standard Industrial Clas-
sification.
(Given examples)
External storage equipment (magnetic disc devices, optical
disc devices, disc allay devices, etc.), printer devices (serial
printers, line printers, drafting machine (plotter), etc.), display
devices (displays (for electronic computing equipment), etc.),
other accessory equipment (banking terminals, other terminals, and
other input-output devices, etc.) and parts, fixtures, and accessories
of electronic computer’s accessory equipment
- 192 -

35 Transportation equipment
Column Code Row Code Sector Name
3511-01 3511-011 Passenger motor cars
(Ministry or agency in charge)
Ministry of Economy, Trade and Industry
(Definition, Scope)
The production activities for passenger motor cars speci-
fied in “Motor vehicles, including motorcycles” listed under In-
dustry Number 3111 of the Japan Standard Industrial Classi-
fication.
(Given examples)
Compact cars, small cars, sedans
(Notes)
Vehicle chassis or CKD (Completely Knocked Down) ve-
hicles (to be exported unassembled, where the shipping value
per vehicle is over 60% of the total composite parts of an as-
sembled vehicle [on FOB price basis]), are classified under
this sector.
Column Code Row Code Sector Name
3521-01 3521-011 Trucks, buses and miscellaneous
cars
(Ministry or agency in charge)
Ministry of Economy, Trade and Industry
(Definition, Scope)
The production activities for “Motor vehicles, including
motorcycles” but excluding passenger cars and motorcycles
listed under Industry Number 3111, and the production activ-
ities for “Motor vehicles bodies and trailers” listed under In-
dustry Number 3112 of the Japan Standard Industrial Classi-
fication.
(Given examples)
Small buses, large buses, light trucks, small trucks (gaso-
line or diesel), trucks (gasoline or diesel), trailers, special
purpose vehicles, trailers, small truck bodies, truck bodies,
special purpose vehicle bodies
(Notes)
Vehicle chassis or CKD (Completely Knocked Down) ve-
hicles (to be exported unassembled, where the shipping value
per vehicle is over 60% of the total composite parts of an as-
sembled vehicle [on FOB price basis]), are classified under
this sector.
Column Code Row Code Sector Name
3522-01 3522-011 Two-wheel motor vehicles
(Ministry or agency in charge)
Ministry of Economy, Trade and Industry
(Definition, Scope)
The production activities for two-wheel motor vehicles
specified in “Motor vehicles, including motorcycles” listed un-
der Industry Number 3111 of the Japan Standard Industrial
Classification.
(Notes)
Bicycles with engines, motor scooters, vehicles with side-cars,
or CKD vehicles (to be exported unassembled, where the ship-
ping value per vehicle is over 60% of the total composite parts
of an assembled vehicle [on FOB price basis]), are classified un-
der this sector.
Column Code Row Code Sector Name
3531-01 3531-011 Internal combustion engines for
motor vehicles
(Ministry or agency in charge)
Ministry of Economy, Trade and Industry
(Definition, Scope)
The production activities for internal combustion engines
for motor vehicles and related parts specified in “Motor vehi-
cles parts and accessories” listed under Industry Number 3113
of the Japan Standard Industrial Classification.
(Given examples)
Gasoline engines for motor vehicles, diesel engines for
motor vehicles, internal combustion engines for motorcycles
and motor scooters, and parts, fixtures, and accessories for
internal combustion engines for motor vehicles (radiators, oil
strainers, oil filters, pistons, inlet valves, exhaust valves, car-
buretors, air cleaners, and fuel injection devices)
Column Code Row Code Sector Name
3531-02 3531-021 Motor vehicle parts and
accessories
(Ministry or agency in charge)
Ministry of Economy, Trade and Industry
(Definition, Scope)
The production activities for internal combustion engines
and related parts specified in “Motor vehicles parts and acces-
sories” but excluding internal combustion engines for motor
vehicles and related parts, listed under Industry Number 3113
of the Japan Standard Industrial Classification.
- 193 -

(Given examples)
Parts for driving, transmitting, and steering devices, parts for
suspension and braking devices, parts for chassis and bodies,
car air-conditioners, car heaters, car seats, knocked-down parts
(for passenger cars, busses, trucks, and motorcycles)
(Notes)
Sets of knocked-down parts (to be exported unassembled,
where the shipping value per vehicle is under 60% of the total
composite parts of an assembled vehicle [on FOB price ba-
sis]), are classified under this sector.
Column Code Row Code Sector Name
3541-01 3541-011 Steel ships
(Ministry or agency in charge)
Ministry of Land, Infrastructure, Transport and Tourism
(Definition, Scope)
The production activities of steel shipbuilding specified in
“Shipbuilding and repairing” listed under Industry Number
3131 and “Hull blocks” listed under Industry Number 3132
of the Japan Standard Industrial Classification.
(Given examples)
Cargo vessels, cargo and passenger vessels, passenger ves-
sels, automobile carrier vessels, oil tankers, fishing vessels
(Notes)
(1) Hull manufacturing is the production activities for own
sector. Therefore, its production value will, in principle,
not be counted in but is treated as one of ship building
process.
(2) The refurbishing of steel vessels is included in this sec-
tor.
Column Code Row Code Sector Name
3541-02 3541-021 Miscellaneous Ships (except
steel ships)
(Ministry or agency in charge)
Ministry of Land, Infrastructure, Transport and Tourism
(Definition, Scope)
The production activities related to manufacturing of
wooden ships specified in “Shipbuilding and repairing” listed
under Industry Number 3131 and production activities re-
lated to shipbuilding specified in “Small watercraft building
and repairing” listed under Industry Number 3133 of the Ja-
pan Standard Industrial Classification.
(Given examples)
Wooden vessels, wooden boats, plastic boats, metal fabri-
cated boats
(Notes)
(1) Vessels made primarily from reinforced plastic or alu-
minum (less than a gross weight of 20 tons) are classi-
fied under this sector.
(2) All related refurbishing and repairing are classified un-
der this sector.
Column Code Row Code Sector Name
3541-03 3541-031 Internal combustion engines for
vessels
(Ministry or agency in charge)
Ministry of Economy, Trade and Industry
(Definition, Scope)
The production activities for “Marine engines” listed under
Industry Number 3134 of the Japan Standard Industrial Clas-
sification.
(Given examples)
Diesel engines for vessels, hot-bulb engines for vessels,
steam engines for vessels, electrical ignition engines for ves-
sels, gas turbines for vessels, steam turbines for vessels, and
parts, fixtures, and accessories for vessel engines
Column Code Row Code Sector Name
3541-10 3541-101 Repair of ships
(Ministry or agency in charge)
Ministry of Land, Infrastructure, Transport and Tourism
(Definition, Scope)
The repair activities specified in “Shipbuilding and repair-
ing” listed under Industry Number 3131 and “Small watercraft
building and repairing” listed under Industry Number 3133 of
the Japan Standard Industrial Classification.
(Notes)
(1) Repair work undertaken by the users of the vessels is
classified under this sector.
(2) Refurbishing is not included in this sector but is in-
cluded in either “3541-01, -011 Steel ships” or “3541-02,
-021 Miscellaneous Ships (except steel ships).
Column Code Row Code Sector Name
3591-01 3591-011 Rolling stock
(Ministry or agency in charge)
- 194 -

Ministry of Land, Infrastructure, Transport and Tourism
(Definition, Scope)
The production and repair activities for “RAILROAD
EQUIPMENT AND PARTS” listed under Group Number 312
of the Japan Standard Industrial Classification.
(Given examples)
Locomotives for railways and tramcars, passenger car-
riages, cargo trains, special purpose trains, related parts
(Notes)
(1) Production and repair activities carried out by railways
are classified under this sector
(2) Signal safety devices are not included in this sector but
classified under “3412-09, -099 Miscellaneous communi-
cation equipment”
Column Code Row Code Sector Name
3591-10 3591-101 Repair of rolling stock
(Ministry or agency in charge)
Ministry of Land, Infrastructure, Transport and Tourism
(Definition, Scope)
The repair activities for “Train’s coach-cars” listed under
Industry Number 3121 of the Japan Standard Industrial Clas-
sification.
(Notes)
(1) Repair work for rolling stock is not classified under this
sector but included in “3591-01, -011 Rolling stock”
(2) Repair work carried out by railways is included in this
sector.
Column Code Row Code Sector Name
3592-01 3592-011 Aircrafts
(Ministry or agency in charge)
Ministry of Economy, Trade and Industry
(Definition, Scope)
The production activities of “AIRCRAFT AND PARTS”
listed under Group Number 314 of the Japan Standard Indus-
trial Classification.
(Given examples)
Aircraft (airplanes including turbojets, turboprops, etc.),
helicopters, other aircraft (gliders, airships, etc.), engines for
aircrafts (turbojet engines, turbo shaft engines, etc.), and
other aircraft related parts and accessory devices (propellers,
rotor blades, main wings, bodies, landing gear, aircraft steer-
ing training facilities, etc.)
Column Code Row Code Sector Name
3592-10 3592-101 Repair of aircrafts
(Ministry or agency in charge)
Ministry of Economy, Trade and Industry
(Definition, Scope)
The repair activities for “AIRCRAFT AND PARTS” listed
under Group Number 314 and aircraft maintenance per-
formed at airports, etc. specified in “MACHINE REPAIR
SHOPS, EXCEPT ELECTRICAL MACHINERY, APPARATUS,
APPLIANCES AND SUPPLIES” listed under Group Number
901 of the Japan Standard Industrial Classification.
Column Code Row Code Sector Name
3599-01 3599-011 Bicycles
(Ministry or agency in charge)
Ministry of Economy, Trade and Industry
(Definition, Scope)
The production activities for “Bicycles and parts” listed un-
der Industry Number 3191 of the Japan Standard Industrial
Classification.
(Given examples)
Finished bicycles (racing bicycles, children’s bicycles,
infant bicycles, mini bicycles, mountain bicycles, motor-
assisted bicycles, and special purpose bicycles), wheelchairs,
bicycle frames, and parts, fixtures, and accessories for
bicycles
(Notes)
Wheelchairs (electric) are included in the column sector
“3599-09 Miscellaneous transport equipment” and row sector
“3599-099 Transport equipment, n.e.c.”
Column Code Row Code Sector Name
3599-09 Miscellaneous transport equip-
ment
3599-091 Transport equipment for in-
dustrial use
3599-099 Transport equipment, n.e.c.
(Ministry or agency in charge)
Ministry of Economy, Trade and Industry
(Definition, Scope)
The production activities for “INDUSTRIAL TRUCKS
AND PARTS AND ACCESSORIES” listed under Group Num-
ber 315 and for “Transportation equipment, n.e.c.” listed un-
der Industry Number 3199 of the Japan Standard Industrial
- 195 -

Classification.
(Given examples)
Transport vehicles for industry: Forklift trucks, fixed plat-
form truck (powered by batteries or internal combustion
engines, and motor-driven transport vehicles, etc.), in-
dustrial locomotives, industrial carriages, straddle carri-
ers, industrial trailers, pallet trucks, shovel loaders (ex-
cept for construction use) and parts, fixtures, and acces-
sories for industrial transport vehicles
Transport equipment, n.e.c.: Aircraft and spacecraft (rock-
ets, satellites, and spaceship, etc), and parts, fixtures, and
accessories for aircraft and spacecraft, other transport
vehicles not elsewhere classified (transport carts, carts,
shopping carts, golf cars, and golf carts, wheelchairs
(electric), etc), and parts, fixtures, and accessories for
other transport vehicles not elsewhere classified
(Notes)
Wheelchairs (manual) are included in “3599-01, -011 Bicy-
cles”
39 Miscellaneous manufacturing products
Column Code Row Code Sector Name
1911-01 1911-011 Printing, plate making and book
binding
(Ministry or agency in charge)
Ministry of Economy, Trade and Industry
(Definition, Scope)
The production activities of “PRINTING” listed under Group
Number 151, “PLATE MAKING FOR PRINTING” listed under
Group Number 152, “BOOKBINDING AND FINISHING”
listed under Group Number 153, and “SERVICES RELATED
TO PRINTING” listed under Group Number 159 of the Japan
Standard Industrial Classification, as well as the activities con-
ducted by the National Printing Bureau for printing, plate-mak-
ing, and book-binding.
(Given examples)
Printing (offset printing [planography printing, digital print-
ing, etc.], relief [anastatic] printing, intaglio printing [screen
printing, photogravure, etc.], gazette printing, currency printing,
special printing on non-paper), plate-making (photoengraving,
photomask, printing types, stereotypes, copper intaglio printing,
wood engraving printing, etc.), bookbinding, printed matter,
other services related to printing trade, advertising revenue of the
National Printing Bureau.
(Notes)
Revenue of trade margins from general printing is not in-
cluded in the production value because most of the activities are
commissioned from similar businesses.
Column Code Row Code Sector Name
2311-01 2311-011 Leather footwear
(Ministry or agency in charge)
Ministry of Economy, Trade and Industry
(Definition, Scope)
The production activities for “CUT STOCK AND FINDINGS
FOR LEATHER FOOTWEAR” listed under Group Number 203
and “LEATHER FOOTWEAR” listed under Group Number 204
of the Japan Standard Industrial Classification.
(Given examples)
Leather shoes (men’s over 23 cm, women’s and children’s
leather shoes, athletic leather shoes [mountaineering shoes, skat-
ing shoes, spike shoes, golfing shoes, etc.], work shoes [safety
shoes, anti-static shoes, acid-proof shoes, etc.], other leather
shoes [partly leather shoes, etc.], other leather footwear [zori
- 196 -

slippers, slippers, sandals, etc.]) and materials and accessories
for leather footwear (uppers, soles, heels, etc.)
Column Code Row Code Sector Name
2312-01
2312-011
2312-012
Leather tanning, leather prod-
ucts, and fur skins (except
leather footwear)
Leather and fur skins
Baggage, handbags, small
leather cases, and miscellane-
ous leather products
(Ministry or agency in charge)
Ministry of Economy, Trade and Industry
(Definition, Scope)
The production activities for “LEATHER TANNING AND
FINISHING” listed under Group Number 201; “MECHANI-
CAL AND INDUSTRIAL LEATHER PRODUCTS, EXCEPT
GLOVES AND MITTENS” listed under Group Number 202;
“LEATHER GLOVES AND MITTENS” listed under Group
Number 205; “BAGGAGE” listed under Group Number 206;
“HANDBAGS AND SMALL CASES” listed under Group
Number 207; “FUR SKINS” listed under Group Number 208;
and “MISCELLANEOUS TANNING LEATHER PRODUCTS”
listed under Group Number 209 of the Japan Standard Industrial
Classification.
(Given examples)
Leathers and fur skins: Leathers (Cowhide uppers, ox hide up-
pers, cowhide soles, coated cattle leather, other cattle leather,
horsehide, pigskin, goat and sheep skin, other coated leather
(crocodile, lizard, and snake skin), fur (processed but not fin-
ished)
Luggage, handbags, small cases, and miscellaneous leather prod-
ucts: Industrial leather products (industrial leather belts,
leather packing, gaskets, etc.), leather gloves (for dress,
work, and sport, and including those of synthetic leather),
luggage (regardless of materials; leather travel bags, leather
brief cases, school bags, and school satchels, plastic luggage,
and synthetic leather cases, etc.), bags (wallet, purses, shop-
ping bags, etc.), handbags (regardless of materials), miscella-
neous leather products (dress leather belts, saddles, spurs,
wristwatch bands, etc.)
(Changes from the 2011 I-O Tables)
“2312-01 Leather and fur skins” and “2312-02 Luggage,
handbags, small leather cases and miscellaneous leather prod-
ucts” in the 2011 I-O Tables are integrated into “2312-01,
Leather, leather products, and fur skins (except leather foot-
wear).”
(Notes)
Fur clothing, coated leather clothing, and fur apparel accesso-
ries (coats, mufflers, and fur accessories) are classified under
“1522-09, -099 Miscellaneous wearing apparel and clothing ac-
cessories” and leather athletic goods (like gloves) are classified
under “3911-02, -021 Sporting and athletic goods”
Column Code Row Code Sector Name
3911-01 3911-011 Toys and games
(Ministry or agency in charge)
Ministry of Economy, Trade and Industry
(Definition, Scope)
The production activities for “Games and toys, except dolls”
listed under Industry Number 3251, and “Dolls” listed under In-
dustry Number 3252 of the Japan Standard Industrial Classifica-
tion.
(Given examples)
Entertainment items and toys (cards, hanafuda cards, igo
game items, shogi game items, mahjong game items, game
boards, electronic toys [television games for home use, portable
electronic games, etc.], metallic toys, plastic toys [model kits,
air-filled vinyl toys, children’s carriage vehicles {i.e. walkers for
infants, baby carriages, and tricycles}, etc.], stuffed animal toys,
wooden toys, etc.), dolls (Japanese, western-style, stuffed, sekku,
hina, etc.), and parts and accessories for toys
(Notes)
Game software recording media (CDs, DVDs, cassettes, etc.)
are included in “3919-06, -061 Audio and video records, other
information recording media”
Column Code Row Code Sector Name
3911-02 3911-021 Sporting and athletic goods
(Ministry or agency in charge)
Ministry of Economy, Trade and Industry
(Definition, Scope)
The production activities for “Sporting and athletic goods”
listed under Industry Number 3253 of the Japan Standard Indus-
trial Classification.
(Given examples)
Baseball gear, softball gear, basketball gear, volleyball gear,
rugby gear, soccer gear, tennis gear, ping-pong gear, badminton
gear, golf gear, hockey gear, ski gear, water-ski gear, skating gear,
- 197 -

track and field gear, gymnastics gear, fishing gear and accesso-
ries, swings, slides, air-guns, hunting guns, Japanese fencing
gear, hang-gliding gear, and parts and accessories for sporting
goods
(Notes)
Hats, uniforms, shoes, belts, helmets, and so forth are not clas-
sified under this sector but are included in their respective sec-
tors.
Column Code Row Code Sector Name
3919-01 3919-011 Jewelry and adornments
(Ministry or agency in charge)
Ministry of Economy, Trade and Industry
(Definition, Scope)
The production activities for “PRECIOUS METAL
PRODUCTS, INCLUDING JEWELS” listed under Group
Number 321 and “COSTUME JEWELRY, COSTUME
ACCESSORIES, BUTTONS AND RELATED PRODUCTS,
EXCEPT PRECIOUS METALS AND JEWELRY” listed under
Group Number 322 of the Japan Standard Industrial
Classification; production of the metallic art objects by the Japan
Mint is included in this sector
(Given examples)
Costume jewelry, costume accessories (precious metals [gold,
silver, platinum, etc.] and jewelry [natural jewelry, pearls, etc.]
products, tin and antimony products, etc.), (necklaces, bracelets,
rings, earrings, broaches, lockets, cuff links, etc.), other jewelry,
accessories, and precious metal products (powder compacts,
badges, buckles, medals, combs, handy mirrors, jewel boxes, ac-
cessory cases, religious tools, trophies, decorative medals, pre-
cious metal cigar cases, western tableware such as precious
metal knives, forks, spoons and dishes), artificial flowers, deco-
rative feathers, buttons, needles, pins, hooks, snaps, and related
products (sewing needles, machine needles, zips, snaps, hooks,
clips, pushpins, hook and loop fasteners, safety pins, etc.), wigs,
kamoji, and parts and accessories for jewelry and accessories
(Notes)
Japanese fans, Japanese performance fans, paper lanterns,
umbrellas, Japanese umbrellas, and cigars, pipes (except for pre-
cious metals and jewelry products) are classified under “3919-
09, -099 Miscellaneous manufacturing products.”
Column Code Row Code Sector Name
3919-02 3919-021 Watches and clocks
(Ministry or agency in charge)
Ministry of Economy, Trade and Industry
(Definition, Scope)
The production activities for “WATCHES, CLOCKS,
CLOCKWORK-OPERATED DEVICES AND PARTS” listed
under Group Number 323 of the Japan Standard Industrial Clas-
sification.
(Given examples)
Watches (including movements; mechanical watches, battery-
operated watches), clocks (including movements; mechanical
clocks, clocks, alarm clocks, wall clocks, and instrument panel
clocks), other watches and clocks (stop watches, timer watches,
metronomes), watch and clock parts (dial plates, springs, gears,
and screws)
Column Code Row Code Sector Name
3919-03 3919-031 Musical instruments
(Ministry or agency in charge)
Ministry of Economy, Trade and Industry
(Definition, Scope)
The production activities for “MUSICAL INSTRUMENTS”
listed under Group Number 324 of the Japan Standard Industrial
Classification.
(Given examples)
Pianos, guitars, electronic guitars, electronic musical instru-
ments (“Electone”, synthesizers, electronic keyboards, elec-
tronic pianos, etc.), harmonicas, accordions, pipe instruments,
stringed instruments, drums, shamisen, koto, shakuhachi, music
box movements, and parts, fixtures, and accessories for musical
instruments
Column Code Row Code Sector Name
3919-04 3919-041 Stationery
(Ministry or agency in charge)
Ministry of Economy, Trade and Industry
(Definition, Scope)
The production activities for “PENS, LEAD PENCILS,
PAINTING MATERIALS AND STATIONERY” listed under
Group Number 326 of the Japan Standard Industrial Classifica-
tion.
(Given examples)
- 198 -

Fountain pens, pens and lead pencils (fountain pens, refillable
lead pencils, ball-point pens, marking pens, pencils, lead for re-
fillable lead pencils, etc.), brushes and painting materials (water
color tubes, crayons, pastels, brushes, paint brushes, oil paint
tubes, sketchbooks, canvas, drawing plates, drawing clothes,
poster colors, etc.), other stationery (seals, seal pads, stamps,
stamp pads, rulers, compasses, drafting boards, glue for offices
and industries, abacuses, staplers, pencil boxes, hole punchers,
pencil sharpeners, etc.) and parts and accessories for writing in-
struments and stationery
Column Code Row Code Sector Name
3919-05 3919-051 “Tatami” (straw matting) and
straw products”
(Ministry or agency in charge)
Ministry of Agriculture, Forestry and Fisheries
(Definition, Scope)
The production activities for “Straw, panama hats and straw
goods” listed under Industry Number 3281 and “Tatami” mats
(straw-mats)” listed under Industry Number 3282 of the Japan
Standard Industrial Classification.
(Given examples)
Tatami mats, tatami flooring, tatami floor coverings, goza
(thin woven-straw floorings), mushiro (woven-straw wall hang-
ings), hana-mushiro (woven-straw flower patterned wall hang-
ings), kamasu, straw, rope, straw hats, woven-rope hats
Column Code Row Code Sector Name
3919-06 3919-061 Audio and video records, other
information recording media
(Ministry or agency in charge)
Ministry of Economy, Trade and Industry
(Definition, Scope)
The production activities for “Information recording materials,
except newspapers, books, other printed products, etc.” listed
under Industry Number 3296 of the Japan Standard Industrial
Classification.
(Given examples)
Audio information recording media (audio discs, audiotapes,
etc.), video information recording media (videodiscs, videotapes,
etc.), game software recording media (CDs, DVDs, cassettes,
etc.), computer software recording media (CDs, DVDs, etc.),
prepaid cards
(Notes)
Video software, prepaid cards, recording media for television
games (CDs, DVDs, cassettes, etc.) are included in this sector,
and unrecorded media (semiconductor memories, optical disks,
magnetic tapes, etc.) are included in “3299-01, -011 Storage me-
dia.”
Game software, video software, and music software are pro-
duction activities of the column sector “5931-01 Information ser-
vices” and row sectors “5931-011 Computer programming and
miscellaneous software services” and “5951-01, -011 Video pic-
ture, sound information, character information production,” re-
spectively. Only production activities of media are included in
this sector, and not the value of information.
Column Code Row Code Sector Name
3919-09 3919-099 Miscellaneous manufacturing
products
(Ministry or agency in charge)
Ministry of Economy, Trade and Industry
(Definition, Scope)
The production activities of “LACQUER WARE” listed un-
der 327, “Fans and lanterns (Japanese style)” listed under Indus-
try Number 3283,“Brooms and brushes” listed under Industry
Number 3284, “Smoking accessories and supplies, except pre-
cious metals and jewelry” listed under Industry Number 3285,
“Miscellaneous sundry goods” listed under Industry Number
3289, “Fireworks” listed under Industry Number 3291, “Sign-
boards and signs” listed under Industry Number 3292, “Pallets”
listed under Industry Number 3293, “Models and patterns” listed
under Industry Number 3294, “Pattern manufactured of indus-
trial use” listed under Industry Number 3295, “Spectacles, in-
cluding frames” listed under Industry Number 3297, and “Mis-
cellaneous manufacturing industries, n.e.c.” listed under Indus-
try Number 3299 of the Japan Standard Industrial Classification.
(Given examples)
Japanese lacquer ware (furniture, kitchen utensils, and table-
ware, etc.), Japanese fans, Japanese performance fans, paper lan-
terns, brooms, brushes (toothbrushes, cosmetic brushes, scrub-
bers, brooms, dusters, mops, etc.), smoking accessories and sup-
plies (cigarette lighters, cigarette filters, etc.), miscellaneous
sundry goods (umbrellas, matches, thermos bottles, etc.), fire-
works (incl. toy models), signboards, signboard equipment,
(signboards, signboard equipment, displays, etc.), pallets (for
cargo handling and transportation), models (mannequins, body
stands, globes, food stuffs, etc.), industrial models (incl. wooden
models), eyeglasses incl. frames (eyeglasses, glasses frames,
- 199 -

glasses lenses incl. contact lenses, parts of eyeglasses, etc.), mis-
cellaneous products, n.e.c. (textile wall components, scents,
safety and protection gear, life-saving equipment, prefabricated
houses, room units, lamp shades, funeral accessories, ogalite,
shoe inserts excluding leather, canes, etc.)
(Notes)
(1) “Prepaid cards” are included in “3919-06, -061 Audio and
video records, other information recording media,” artifi-
cial flowers, decoration feathers, needles, pins, hooks, fas-
teners are included in “3919-01, -011 Jewelry and adorn-
ments” and straw hats, straw knitted hats are included in
“3919-05, -051 "Tatami" (straw matting) and straw prod-
ucts.”
(2) Following the revision of the Japan Standard Industrial
Classification, eyeglasses and eyeglass frames classified
under “3711-09 Other photographic and optical instruments”
in the 2005 I-O Tables were integrated into this sector in the
2011 I-O Tables.
Column Code Row Code Sector Name
3921-01 3921-011 Reuse and recycling
(Ministry or agency in charge)
Ministry of Economy, Trade and Industry
(Definition, Scope)
The recovery and processing activities for recyclable materials
such as iron scrap. “RECYCLED MATERIAL” listed under
Group Number 536 of the Japan Standard Industrial Classifica-
tion is classified under this sector as its activities falls under re-
cycling activities. This sector becomes a bridging sector for by-
products in addition to scrap. This sector includes iron scrap, non-
ferrous metal scrap, plastic scrap, glass scrap, and waste paper.
(Given examples)
Iron scrap, non-ferrous metal scrap, plastic scrap, glass scrap,
waste paper, cotton fiber waste, wool waste, animal hair waste,
plaster, blast furnace slag, fly ash, mineral waste, sulfur, by-pro-
duced silkworm chrysalis, fruit juice pulp, scrap meat, vegetable
waste, soy sauce lees, coffee lees, wood chips, ammonium sul-
fate, ammonium chloride, silicic acid calcium, LPG, coke, coal-
bed gas, blast furnace gas, converter gas, electric furnace gas, etc.
(Notes)
In the 2000 I-O Tables, scraps and by-products were input into
this sector and the output value of this sector was included in the
production value, but since the 2005 I-O Tables, scraps and by-
products are directly output to the input sector without bypassing
this sector, and only expenditures are recorded in this sector.
The recyclable materials wholesale activities in “5111-01, -
011 Wholesale trade” are the recovery activities, and are classi-
fied under this sector.
Scraps and by-products for which the “lump method” or
“transfer method” are applied are not handled in this sector.
- 200 -

41 Construction
Column Code Row Code Sector Name
4111-01 4111-011 Residential construction
(wooden)
(Ministry or agency in charge)
Ministry of Land, Infrastructure, Transport and Tourism
(Definition, Scope)
The activities related to the building of new wooden houses,
expanding existing houses, and refurbishing houses; houses are
stipulated as being buildings that are used exclusively for resi-
dential use or as (living quarters of) “combined buildings for liv-
ing and commercial use.” The key component, referred to as the
“key building component,” stipulated in Article 2 of the Building
Standards Law (the same definition applies hereafter), of the
aforementioned buildings (as defined in Article 2 of the same
Law and also applied hereafter) shall be wood.
(Given examples)
Housing building (wooden), living quarters of combined
housing for both living and commercial use (wooden)
(Notes)
(1) The drawing of plans for buildings may be carried out by
the house owners themselves, by professional design engi-
neers, or by sub-contractors of building contractors. The ac-
tivities conducted by professional design engineers are
classified as inputs from the sector “6699-02, -021 Civil en-
gineering and construction services” on a lump sum basis.
The same shall apply to all sectors in “41 Construction”
of the aggregated sector classification, except for the sector
“4111-01, -011 Residential construction (wooden)”
(2) “Building new houses” refers to the construction of build-
ings on new sites where no buildings exist.
“Expansion” refers to construction related to existing build-
ings, thereby increasing the floor space.
“Refurbishment” refers to the construction of new build-
ings including the elimination, wholly or partially, of ex-
isting buildings, with usage, size, and structure remain-
ing generally similar to that of the pre-existing construc-
tion.
(3) Activities related to regular repairs for buildings (housing
and non-housing) are classified under the sector “4121-01,
-011 Repair of construction”
Column Code Row Code Sector Name
4111-02 4111-021 Residential construction (non-
wooden)
(Ministry or agency in charge)
Ministry of Land, Infrastructure, Transport and Tourism
(Definition, Scope)
The activities related to constructing new buildings, expand-
ing existing buildings, and refurbishing buildings; the buildings
referred herein are those buildings that are used exclusively for
living or as (living quarters of) “combined buildings for living
and industry use.” The key building component of the aforemen-
tioned buildings shall be non-wooden materials.
(Given examples)
Housing buildings (non-wooden), living quarters of combined
housing buildings for both residential and industry use (non-
wooden)
(Notes)
The structural classification of non-wooden buildings is as
following:
Steel framed and reinforced concrete structure (SRC struc-
ture): This refers to buildings with an integral steel frame
and reinforced concrete structure. Key building compo-
nents are defined in Point 5, Article 2 of the Building Stand-
ards Law. (The same applies hereafter.)
Reinforced concrete structure (RC structure): This refers to
buildings with an integral structure of reinforced concrete.
Iron structure (S structure): This refers to buildings with
frames of iron or other metals (including reinforced iron
bars with “ri-pu-ra-su” treatment and light steel frame
structures).
“Concrete block structure (CB structure): This refers to build-
ings built with concrete blocks reinforced by iron bars (in-
cluding those with exterior walls of concrete block).
Others: This refers to buildings built with other structures,
such as stone, bricks, concrete without reinforcing bars,
concrete blocks without reinforcing bars, and other struc-
tures that are not elsewhere classified
Column Code Row Code Sector Name
4112-01 4112-011 Nonresidential construction
(wooden)
(Ministry or agency in charge)
Ministry of Land, Infrastructure, Transport and Tourism
(Definition, Scope)
The activities of constructing new buildings, expanding
- 201 -

existing buildings, and refurbishing buildings of wood, except
those specified in “4111-01, -011 Residential construction
(wooden)”
(Given examples)
Factory and warehouse buildings, office buildings
Column Code Row Code Sector Name
4112-02 4112-021 Nonresidential construction
(non-wooden)
(Ministry or agency in charge)
Ministry of Land, Infrastructure, Transport and Tourism
(Definition, Scope)
The activities of constructing new buildings, expanding exist-
ing buildings, and refurbishing buildings of non-wooden materi-
als, except those specified in “4111-02, -021 Residential con-
struction (nonwooden)”
(Given examples)
Factory and warehouse buildings, office buildings, school
buildings, and hospital and store buildings
(Notes)
The structural classification of “non-wooden” buildings is the
same as that of “4111-02, -021 Residential construction
(nonwooden)”
Column Code Row Code Sector Name
4121-01 4121-011 Repair of construction
(Ministry or agency in charge)
Ministry of Land, Infrastructure, Transport and Tourism
(Definition, Scope)
(1) The regular repair work of buildings (housing and non-
housings buildings) and civil construction (railways,
electric power, telecommunication, water supply, and
drainage facilities, gas tanks, parking lots, and golf links).
Output is considered to be building repairs and civil
construction repairs.
(2) However, the following are not considered to be activities
of this sector, but those of corresponding sectors.
1 Large-scale modernization causing a significant increase
in the life expectancy of the construction
2 Maintenance and repair work relating to public works,
and restoration work following natural disaster
3 Replacement and repair work relating to rails, power, and
signal facilities, power transmission and distribution facil-
ities, and transmission and telecommunication cables
(Notes)
Renovation of buildings, both residential and nonresidential,
involving the enhancement of the functionality and/or life expec-
tancy is recorded as output in the “Gross domestic fixed capital
formation” sector, and regular repair and maintenance work is
recorded as intermediate consumption.
Column Code Row Code Sector Name
4131-01 4131-011 Public construction of roads
(Ministry or agency in charge)
Ministry of Land, Infrastructure, Transport and Tourism
(Definition, Scope)
The following public works, including new construction as
well as maintenance and repair work
(1) Construction of roads and streets implemented by the gov-
ernment and by local governments
(2) Toll road businesses conducted by the Japan Highway Public
Corporation, Metropolitan Expressway Public Corporation,
Hanshin Expressway Public Corporation, Honshu-Shikoku
Bridge Authority, and local governments
(Given examples)
Roads, streets, toll roads, land re-adjustment projects
(Notes)
(1) Small-scale maintenance and repair work on roads and streets
may be considered as classified in the sector “4121-01, -011
Repair of construction.” However, those are treated, as before,
as public works from a chronological perspective.
(2) The activities of the sectors “4131-01, -011 Public construc-
tion of roads” “4131-02, -021 Public construction of rivers,
drainages and miscellaneous public construction,” and “4131-
03, -031 Agricultural public construction” may be considered
more or less as established items rather than as activities. For
example, the activities of road construction are not included
in this sector in their entirety but divided between the govern-
ment, local governments, East Nippon Expressway Company
Limited, Metropolitan Expressway Public Corp., Central Nip-
pon Expressway Company Limited, West Nippon Express-
way Company Limited, Hanshin Expressway Public Corp.,
and Honshu-Shikoku Bridge Authority. Construction activi-
ties by other entities are classified in a separate sector, “4191-
09, -099 Miscellaneous civil engineering and construction”
- 202 -

Column Code Row Code Sector Name
4131-02 4131-021 Public construction of rivers,
drainages and miscellaneous
public construction
(Ministry or agency in charge)
Ministry of Land, Infrastructure, Transport and Tourism
(Definition, Scope)
The following public works, including maintenance and
repair work, in addition to new construction
(1) Rivers: Activities implemented by the government and local
governments relating to rivers, soil erosion prevention and
sediment control, and the sea shore, as well as activities
implemented by the Water Resources Development Public
Corporation
(2) Urban planning: Activities implemented by the government
and local governments relating to drainage, parks, waste
treatment facilities, etc.
(3) Ports and harbors: Activities implemented by the government
and local governments relating to ports and fishing harbors
(4) Airports: Activities implemented by the government and
local governments as well as by Narita Airport Authority,
New Kansai International Airport Co., Ltd., and the Central
Japan International Airport Co., Ltd. relating to airports
(5) Reconstruction after natural disaster: Reconstruction
activities related to natural disasters, mine pollution, and
urban disasters, all implemented by the government and local
governments for the aforementioned, and for “4131-01 Public
construction of roads.”
(6) Offshore fishing-bed preparation: Activities implemented by
the government and local governments relating to offshore
fishing-bed preparation
(Given examples)
River restoration, the overall development of rivers, soil
erosion prevention and sediment control, seashore, drainage,
waste treatment facilities, park, port, fishing harbor, airport,
reconstruction after disaster
(Notes)
Small-scale maintenance and repair work may be considered
as classified in the sector “4121-01, -011 Repair of construction.”
However, those are treated, as before, as public works from a
chronological perspective.
Column Code Row Code Sector Name
4131-03 4131-031 Agricultural public construction
(Ministry or agency in charge)
Ministry of Agriculture, Forestry and Fisheries
(Definition, Scope)
The activities of the following public works, including
maintenance and repair works, in addition to new construction
(1) Agricultural public works: Agricultural infrastructure im-
provement activities implemented by the government, local
governments, land improvement sectors, and other entities
(2) Forest paths: Activities implemented by the government and
local governments relating to forest paths
(3) Mountain forest preservation: Activities implemented by the
government and local governments relating to mountain forest
preservation
(4) Reconstruction following natural disaster: Reconstruction
activities, relating to the aforementioned points 1 through 3,
implemented by the government and local governments
(Given examples)
Land improvement, forest paths, mountain forest preservation,
reconstruction after disaster
Column Code Row Code Sector Name
4191-01 4191-011 Railway construction
(Ministry or agency in charge)
Ministry of Land, Infrastructure, Transport and Tourism
(Definition, Scope)
The construction activities relating to railways implemented
by Japan Railway, Japan Railway Construction Corporation,
public railways, private railways, Teito Rapid Transit Authority,
and Honshu-Shikoku Bridge Authority, as well as the
replacement and repair activities of rails and power and signal
facilities
(Given examples)
Construction relating to railways
(Notes)
Activities of the sectors “4191-01, -011 Railway construction”
“4191-02, -021 Electric power facilities construction” “4191-03,
-031 Telecommunication facilities construction” and “4191-09,
-099 Miscellaneous civil engineering and construction” may be
considered more or less as established items rather than as activ-
ities similar to the sector of “Public works.” In short, the classi-
fication of the sectors in the “Construction” sector is defined on
- 203 -

a production (construction) basis, while in the “Civil engineering”
sector it is based on investment.
Civil engineering construction activities implemented by
other establishments than those that are defined according to in-
vestment will be classified in the sector “4191-09, -099 Miscel-
laneous civil engineering and construction”
Column Code Row Code Sector Name
4191-02 4191-021 Electric power facilities con-
struction
(Ministry or agency in charge)
Ministry of Land, Infrastructure, Transport and Tourism
(Definition, Scope)
Electricity business activities conducted by nine power com-
panies, Okinawa Power Company, Electric Power Development
Company, and local public enterprises as well as facility con-
struction work activities conducted by other electricity business
entities and Japan Atomic Power Company relating to power
generation, transmission and distribution.
Facilities replacement and repair work is included in this sec-
tor, and entities that obtain the licensed permission for installing
in-house power generation of more than 1000kW are also in-
cluded in this sector.
(Given examples)
Facilities relating to power generation, transmission, and dis-
tribution
Column Code Row Code Sector Name
4191-03 4191-031 Telecommunication facilities
construction
(Ministry or agency in charge)
Ministry of Land, Infrastructure, Transport and Tourism
(Definition, Scope)
Telecommunication facilities construction activities conducted
by Type 1 telecommunication carriers, and facilities replacement
and repair works, are included in this sector.
(Given examples)
Construction of telecommunication related facilities
Column Code Row Code Sector Name
4191-09 4191-099 Miscellaneous civil engineering
and construction
(Ministry or agency in charge)
Ministry of Land, Infrastructure, Transport and Tourism
(Definition, Scope)
The following civil construction works by private sectors and
that are not classified elsewhere, and civil construction works
other than government public works.
(1) Water supplies and water supplies for industry:
Facilities construction conducted by local public entities
relating to water supplies, small-scale water-supply systems,
and water supplies for industry
(2) Site preparation:
Site preparation work conducted by the Urban Development
Corporation, the Japan Regional Development Corporation,
local public entities, and the private sector
(3) Other civil engineering:
Restoration work, in relation to mining pollution, carried out
by the government and local public entities, gas related works
carried out by local public entities and the private sector,
investment-oriented construction work by unemployed people
placement programs conducted by local public entities, parking
maintenance work conducted by the government, and other
private sector civil engineering construction not previously
mentioned
(Given examples)
Facilities relating to water supplies and water supplies for in-
dustry, reclamation and site preparation work, construction work
for gas tanks, parking lots, golf links, ball parks, recreation parks
and pipelines, district streets in housing complexes conducted by
private sectors, piers and bank roads, and river construction work
- 204 -

46 Electricity, gas and heat supply
Column Code Row Code Sector Name
4611-001 Electricity
4611-01 Electricity (thermal power)
4611-02 Electricity (except thermal
power)
(Ministry or agency in charge)
Ministry of Economy, Trade and Industry
(Definition, Scope)
The production activities for the “PRODUCTION,
TRANSMISSION AND DISTRIBUTION OF ELECTRICITY”
excluding private power generation listed under Group
Number 331 of the Japan Standard Industrial Classification.
(Given examples)
Thermal power generation (including biomass), hydraulic
power generation, nuclear power generation, power generation
from new energy sources (wind, geothermal, solar power gener-
ation)
(Notes)
Joint power generation classified under “5111-02 Electricity
(thermal power),” “5111-03 Electricity (water power, etc.)” and
this sector in the 2005 I-O Tables were included in “4611-04, -
041 Private power generation” in the 2011 I-O Tables.
Column Code Row Code Sector Name
4611-03 4611-031 Private power generation
(Ministry or agency in charge)
Ministry of Economy, Trade and Industry
(Definition, Scope)
The private power generation activities specified in “PRO-
DUCTION, TRANSMISSION AND DISTRIBUTION OF
ELECTRICITY” listed under Group Number 331 of the Japan
Standard Industrial Classification. However, only activities
of the mining industry with continuous power generation fa-
cilities of a maximum output of more than 1,000 kW are ap-
plicable to this scope.
(Notes)
(1) This sector is defined as an independent activity sector,
not as a self-activity sector, despite the sector name “pri-
vate power generation.”
(2) Joint power generation classified under “5111-02 Electric-
ity (thermal power),” “5111-03 Electricity (water power,
etc.)” and “5111-001 Electricity” in the 2005 I-O Tables
were integrated into this sector in the 2011 I-O Tables.
Column Code Row Code Sector Name
4621-01 4621-011 Gas supply
(Ministry or agency in charge)
Ministry of Economy, Trade and Industry
(Definition, Scope)
The production activities of “PRODUCTION AND DIS-
TRIBUTION OF GAS” listed under Group Number 341 of the
Japan Standard Industrial Classification.
Column Code Row Code Sector Name
4622-01 4622-011 Steam and hot water supply
(Ministry or agency in charge)
Ministry of Economy, Trade and Industry
(Definition, Scope)
The production activities of “HEAT SUPPLY” listed under
Group Number 351 of the Japan Standard Industrial Classifi-
cation.
- 205 -

47 Water supply
Column Code Row Code Sector Name
4711-01 4711-011 Water supply
(Ministry or agency in charge)
Ministry of Health, Labour and Welfare
(Definition, Scope)
The production activities of “WATER FOR END USERS,
EXCEPT INDUSTRIAL USERS” excluding water supply for
shipping listed under Group Number 361 of the Japan Standard
Industrial Classification.
(Given examples)
Activities of water bureaus (departments), water supply
offices, water purification pools, drainage facilities, water
pumping stations
(Notes)
(1) This sector applies to activities related to drinking water
supplies, regardless of usage (mains water, general water
supplies, and small-scale water-supply systems, as
specified in the Water Law).
(2) Activities related to water supplies for shipping are
included in “5789-02, -021 Port and water traffic control
(public corporation) **” and “5789-03, -031 Port and water
traffic control.”
Column Code Row Code Sector Name
4711-02 4711-021 Industrial water supply
(Ministry or agency in charge)
Ministry of Economy, Trade and Industry
(Definition, Scope)
The production activities of “WATER FOR INDUSTRIAL
USERS” listed under Group Number 362 of the Japan Standard
Industrial Classification.
(Notes)
(1) This sector corresponds to activities (industrial water
business based on “Industrial Water Road Business Act”)
for supplying water for industrial use (exclusive of water
supplied for hydroelectric power generation and for
drinking)
(2) Water supplies and small-scale water supply activities con-
ducted by local public entities according to the “Water Law”
are classified in the sector “4711-01, -011 Water supply”
Column Code Row Code Sector Name
4711-03 4711-031 Sewage disposal **
(Ministry or agency in charge)
Cabinet Office
(Definition, Scope)
The associated treatment activities for “SEWERAGE” listed
under Group Number 363 of the Japan Standard Industrial Clas-
sification; namely, the activities of sewage bureau (departments),
sewerage facilities, sewerage offices, and sewerage pumping sta-
tions
(Notes)
This sector covers the business activities of facilities that drain
sewerage and rain water within the scope of public sewerage ac-
tivities conducted by local public entities. Therefore, the activi-
ties of this sector are aimed at sanitation by way of drains, drain-
age canals and other ancillary facilities (such as filtration facili-
ties). Activities by local public entities in treating waste and ex-
cretion are classified in the sector “4811-01, -011 Waste man-
agement services (public) **”
- 206 -

48 Waste management service
Column Code Row Code Sector Name
4811-01 4811-011 Waste management services
(public corporation) **
(Ministry or agency in charge)
Ministry of the Environment
(Definition, Scope)
The activities of local public entities among those speci-
fied in “DOMESTIC WASTE DISPOSAL BUSINESS” listed
under Group Number 881, “INDUSTRIAL WASTE DIS-
POSAL BUSINESS” listed under Group Number 882, and
“MISCELLANEOUS WASTE DISPOSAL BUSINESS” listed
under Group Number 889 of the Japan Standard Industrial
Classification.
(Given examples)
Activities related to the collection and treatment of human
waste, waste, and industrial waste
(Notes)
Taking into account handling in terms of industrial classifica-
tions and laws, it may be more desirable to reorganize this sector
into “Domestic waste disposal (including night soil disposal)” and
“Industrial waste disposal.” However, as both domestic waste dis-
posal and industrial waste disposal are intermixed with both indus-
try and publicly-managed, and strict categorization is not possible
when recording, the current sectors are kept.
Column Code Row Code Sector Name
4811-02 4811-021 Waste management services
(Ministry or agency in charge)
Ministry of the Environment
(Definition, Scope)
The activities of private entities among those specified in
“DOMESTIC WASTE DISPOSAL BUSINESS” listed under
Group Number 881, “INDUSTRIAL WASTE DISPOSAL
BUSINESS” listed under Group Number 882, and
“MISCELLANEOUS WASTE DISPOSAL BUSINESS” listed
under Group Number 889 of the Japan Standard Industrial
Classification; activities commissioned by local public entities are
included, while in-house disposal is not included.
(Given examples)
Activities related to the collection and treatment of human
waste, waste, and industrial waste
(Notes)
Same as “4811-01, -011 Waste management services (public)
**.”
51 Commerce
Column Code Row Code Sector Name
5111-01 5111-011 Wholesale trade
(Ministry or agency in charge)
Ministry of Economy, Trade and Industry
(Definition, Scope)
The wholesale trade activities related to Group Numbers
501, 511through 513, 521 through 522, 531 through 535, 541
through 549, 551 through 559 of the Japan Standard Industrial
Classification; the production values are wholesale trade mar-
gins.
The sector includes sales activities of Agriculture Cooperative
Unions, Fishery Cooperative Unions, Processed Marine Prod-
ucts Cooperative Unions, and Forestry Cooperative Unions,
sales and procurement activities of the Japan Agriculture Coop-
erative Association, Japan Fishery Cooperative Association, Ja-
pan Processed Marine Products Cooperative Association, and Ja-
pan Forestry Cooperative Association, central wholesale market,
and local wholesale markets.
(Notes)
The activities of “RECYCLED MATERIAL” listed under
Group Number 536 of the Japan Standard Industrial Classifica-
tion are included in “3921-01, -011 Reuse and recycling.” Activ-
ities exclusive of the resource storage business of the Japan Oil,
Gas and Metals National Corporation are included in “6699-09,
-099 Miscellaneous business services.”
Column Code Row Code Sector Name
5112-01 5112-011 Retail trade
(Ministry or agency in charge)
Ministry of Economy, Trade and Industry
(Definition, Scope)
The activities of “retail business” of Group Numbers 561 –
569, 571 – 579, 581 – 589, 591 – 593, 601-609, and 611-619, as
well as “PAWNBROKERS” listed under Group Number 642 of
the Japan Standard Industrial Classification. The domestic pro-
duction amount is the retail margin amount.
The sector includes the procurement activities of Agriculture
Cooperative Unions, Fishery Cooperative Unions, Processed
Marine Products Cooperative Unions, and Forestry Cooperative
Unions, and activities of retail stores and Co-ops. The production
activities of manufacturing and retailing are not classified in this
- 207 -

sector, but classified in the corresponding sector of manufactur-
ing.
(Given examples)
Examples of manufacturing and retailing: Retail of mens-
wear, confectionery, bread, processed food such as tofu,
kamaboko, and so forth, the retail of cooked dishes, furniture,
housing fixtures, tatami, religious ceremonial articles
(Notes)
(1) Among the activities of dispensing pharmacies, dispens-
ing by pharmacies as based on prescriptions from physi-
cians or dentists are excluded.
(2) Following the revision of the Japan Standard Industrial
Classification, food takeout and delivery services classi-
fied under “Delicatessen stores” in the 2005 I-O Tables
were integrated into “6721-01, -011 Eating and drinking
services” in the 2011 I-O Tables.
(3) Trade margins in “pharmacy dispensing services not cov-
ered by health insurance” in the 2005 I-O Tables were in-
tegrated into “6411-04, -041 Medical service (pharmacy
dispensing)” in the 2011 I-O Tables.
53 Finance and insurance
Column Code Row Code Sector Name
5311-01 Financial service
5311-011 Financial service (FISIM),
public
5311-012 Financial service (FISIM),
private
5311-013 Financial service (commis-
sion), public
5311-014 Financial service (commis-
sion), private
(Ministry or agency in charge)
Financial Services Agency
(Definition, Scope)
The scope corresponds to the activities of “CENTRAL BANK”
listed under Group Number 621, “BANKS,EXCEPT CENTRAL
BANK” listed under Group Number 622, “FINANCIAL INSTI-
TUTIONS FOR SMALL-BUSINESS” listed under Group
Number 631, “FINANCIAL INSTITUTIONS FOR AGRICUL-
TURE, FORESTRY AND FISHERIES FINANCES” listed un-
der Group Number 632, “MONEY LENDING BUSINESS”
listed under Group Number 641, “CREDIT CARD AND IN-
STALLMENT FINANCE BUSINESSES” listed under Group
Number 643, “MISCELLANEOUS NON-DEPOSIT MONEY
CORPORATIONS” listed under Group Number 649, “FINAN-
CIAL PRODUCTS TRANSACTION DEALERS” listed under
Group Number 651, “FUTURES COMMODITY TRANSAC-
TION DEALERS AND COMMODITY INVESTMENT ADVI-
SORS” listed under Group Number 652, “FINANCIAL AUX-
ILIARIES listed under Group Number 661, “TRUST BUSI-
NESSES” listed under Group Number 662, and “FINANCIAL
BROKERS AND INTERMEDIARIES” listed under Group
Number 663 of the Japan Standard Industrial Classification.
(Given examples)
City banks, regional banks (including second-tier regional
banks), trust banks, long-term credit banks, foreign banks in Ja-
pan, Norinchukin Bank, JA Bank Shin-ren, JF Bank Shin-gyoren,
JA Co-op unions (credit facility), JF Co-op unions (credit facil-
ity), Agriculture, Credit finance services, Shin-kin Federation
Bank, credit co-op unions, Shin-kin Central Bank, Shoko Chukin
Bank, Rokin banks, Rokin Federation Bank, short-term financ-
ing companies, investment management companies, securities
financing companies, securities companies, securities invest-
ment trust companies, securities investment advisory companies,
financial instruments exchanges, Japan Post Co., Ltd. (bank
- 208 -

agency business) and those classified under “financial service”
in “public activities” in System of Transactor-Based Production
Activity Classification.
(Notes)
(1) Public financial institutions refer to those classified under
“financial service” in “public activities” in System of
Transactor-Based Production Activity Classification and
the Japan Post Co., Ltd. (bank agency business). All other
financial institutions are private financial institutions.
(2) Financing activities conducted by life insurance businesses
and insurance businesses are not classified in this sector but
in the sectors of “5312-01, -011 Life insurance” and “5312-
02, -021 Non-life insurance”
(3) The row sectors are divided into “public” and “private” in
order to make them consistent with institutional sector di-
vision of the SNA’s income expenditure and capital finance
accounts, as well as to clarify the differences between the
output structures.
Column Code Row Code Sector Name
5312-01 5312-011 Life insurance
(Ministry or agency in charge)
Financial Services Agency
(Definition, Scope)
Life insurance services classified under the activities of “LIFE
INSURANCE INSTITUTIONS” listed under Group Number
671, “Life insurance agents and brokers” listed under Industry
Number 6741, “MUTUAL AID ORGANIZATIONS AND
SMALL-AMOUNT SHORT-TERM INSURANCE PROVID-
ERS” listed under Group Number 673, and “Miscellaneous in-
surance service institutions” listed under Industry Number 6759
of the Japan Standard Industrial Classification; and services that
do not fall under “social security funds” classified under the ac-
tivities of “SOCIAL INSURANCE ORGANIZATIONS” listed
under Group Number 851 of the Japan Standard Industrial Clas-
sification
(Given examples)
Life insurance, pension insurance, re-insurance of life in-
surance, life insurance agents, re-insurance of JA mutual aid
insurance (such as life insurance mutual aid), social insurance
business (national pension funds and associations, welfare
pension funds, corporate pension funds and associations,
etc.)
(Changes from the 2011 I-O Tables)
Services that do not fall under “social security funds” classi-
fied under “6431-01, -011 Social insurance **” in the 2011 I-O
Tables (national pension funds, the National Pension Fund As-
sociation, welfare pension funds, corporate pension funds, the
Pension Fund Association, the Farmers Pension Fund (except
old pensions), the Organization for Small & Medium Enterprises
and Regional Innovation (mutual aid account for small enter-
prises), and the Organization for Workers Retirement Allowance
Mutual Aid, etc.) are integrated into this sector.
(Notes)
(1) This sector includes the group life insurance services of
the Japan Housing Finance Agency and life insurance ser-
vices practiced in Japan by foreign life insurance compa-
nies licensed as specified in the Insurance Business Act.
(2) A study was conducted in the 1985 I-O Tables to estab-
lish a row code for imputed interest because activities of
life insurance companies would produce pure insurance
services and, simultaneously, they would produce im-
puted services for finance as a combined product. How-
ever, this idea was withdrawn in consideration of the 68
SNA (the interpretation of the 93 SNA remains the same
as that of the 68 SNA).
Column Code Row Code Sector Name
5312-02 5312-021 Non-life insurance
(Ministry or agency in charge)
Financial Services Agency
(Definition, Scope)
The activities of “NON-LIFE INSURANCE INSTITU-
TIONS” listed under Group Number 672, “Non-life insurance
agents and brokers” listed under Industry Number 6742,
“Agents and brokers for mutual aid and Small-amount Short-
term Insurance” listed under Industry Number 6743, “Rate-
making services” listed under Industry Number 6751, “Ap-
praisers” listed under Industry Number 6752, “MUTUAL AID
ORGANIZATIONS AND SMALL-AMOUNT SHORT-TERM
INSURANCE PROVIDERS” listed under Group Number 673,
and “Miscellaneous insurance service institutions” listed under
Industry Number 6759 of the Japan Standard Industrial Clas-
sification.
(Given examples)
Fire insurance, earthquake insurance, marine insurance,
automobile insurance (compulsory, arbitrary), theft insurance,
transportation insurance, re-insurance of non-life insurance,
trade insurance, non-life insurance agents, JA mutual aid (fire,
- 209 -

car), re-insurance of JA mutual aid (fire, car), and retroces-
sion of re-insurance
(Notes)
This sector includes government insurance and reinsurance
special accounts, Japan Housing Finance Agency (housing loan
insurance), Japan Finance Corporation (credit insurance busi-
ness), insurance business conducted by the Agriculture, Forestry
and Fisheries Credit Foundations, and disaster provident benefits
conducted by the Japan Sport Council, forestry insurance ac-
count of the Forestry and Forest Products Research Institute and
the Nippon Export and Investment Insurance, as well as nonlife
insurance businesses operated in Japan by foreign insurance
companies that have received a license as specified in the “In-
surance Business Act.”
55 Real estate
Column Code Row Code Sector Name
5511-01 5511-011 Real estate agencies and man-
agers
(Ministry or agency in charge)
Ministry of Land, Infrastructure, Transport and Tourism
(Definition, Scope)
The activities of “SALES AGENTS OF BUILDINGS AND
HOUSES AND LAND SUBDIVIDERS AND DEVELOPERS”
listed under Group Number 681, “REAL ESTATE AGENTS
AND BROKERS” listed under Group Number 682, parking lots
that are managed and operated with the purpose of storing
automobiles upon being commissioned by the owner as specified
in “AUTOMOBILE PARKING” listed under Group Number
693, and “REAL ESTATE MANAGERS” listed under Group
Number 694 of the Japan Standard Industrial Classification.
(Given examples)
Commission fees for selling, leasing, swapping, and broker-
ing real estate, real estate management fees
(Changes from the 2011 I-O Tables)
In housing sales, only commission fees for brokering services
were recorded in the 2011 I-O Tables, but in the 2015 I-O Tables,
trade margins are recorded.
(Notes)
(1) The construction activities by sales agents of buildings
and houses are not included in this sector, but in the
construction sector.
(2) Regarding the activities of property sales, only
commission fees for trade agencies and brokerages are
included in production values. Costs needed for site
preparation are included in the construction sector.
Column Code Row Code Sector Name
5511-02 5511-021 Real estate rental service
(Ministry or agency in charge)
Ministry of Land, Infrastructure, Transport and Tourism
(Definition, Scope)
The activities exclusive of “Land lessors” listed under
Industry Number 6912 from among “REAL ESTATE LESSORS,
EXCEPT HOUSE AND ROOM LESSORS” listed under Group
Number 691, and activities of parking businesses with the
objective of storing automobiles specified in “AUTOMOBILE
PARKING” listed under Group Number 693 (exclusive of
activities of management and operation of parking lots
- 210 -

conducted upon being commissioned by the owner) of the Japan
Standard Industrial Classification.
(Given examples)
Leasing fees for real estate leasing (commercial property rent-
als (or partial property rental in the case of combined housing),
building rental, warehouse rental)
(Notes)
The leasing fee for the housing portion in the case of com-
bined housing shall be classified in the sector “5521-01, -011
House rent.”
Column Code Row Code Sector Name
5521-01 5521-011 House rent
(Ministry or agency in charge)
Ministry of Land, Infrastructure, Transport and Tourism
(Definition, Scope)
The activities of “HOUSE AND ROOM LESSORS” listed
under Group Number 692 of the Japan Standard Industrial Clas-
sification.
Column Code Row Code Sector Name
5531-01 5531-011 House rent (imputed house rent)
(Ministry or agency in charge)
Ministry of Land, Infrastructure, Transport and Tourism
(Definition, Scope)
In activities where a person living in a house that he/she owns
is operating a house rental business in relation to himself/herself,
services that arise due to use of one’s own home, not associated
with receipt and payment of rent.
Even with regard to housing and dormitories for employees
that are owned by a company, the difference between the market
price and the rent that is actually paid is included in this sector.
57 Transport and postal services
Column Code Row Code Sector Name
5711-01 5711-011 Railway transport (passengers)
(Ministry or agency in charge)
Ministry of Land, Infrastructure, Transport and Tourism
(Definition, Scope)
The activities related to passenger transport specified in
“RAILWAY TRANSPORT” listed under Group Number 421 and
activities specified in “Railway facilities services” listed under
Industry Number 4851 of the Japan Standard Industrial
Classification; other activities of the railway business, including
carriage repair activities, shall be classified in separate sectors
according to their nature.
(Given examples)
Passenger transportation activities undertaken by JR, public
and private railways, and tramways (regular railways, tramways,
underground railways, monorail railways, guided rail type
tramways, cable tramways, ropeways, and non-rail tramways)
(Notes)
(1) Revenues relating to advertisements in carriage and on sta-
tion premises, and the sales of goods, public telephone ser-
vices, and coin locker use shall not be included in this sector.
(2) Revenues derived from other forms of transport such as
“Bus transport services” shall be treated in the same way.
Column Code Row Code Sector Name
5712-01 5712-011 Railway transport (freight)
(Ministry or agency in charge)
Ministry of Land, Infrastructure, Transport and Tourism
(Definition, Scope)
The activities of cargo transportation specified in “RAILWAY
TRANSPORT” listed under Major Group Number 421 of the
Japan Standard Industrial Classification.
(Given examples)
Cargo transport by JR, private railways
(Notes)
Activities carried out by freight forwarders and freight for-
warding agents are not included in this sector, but are included
in “5761-01, -011 Consigned freight forwarding”
- 211 -
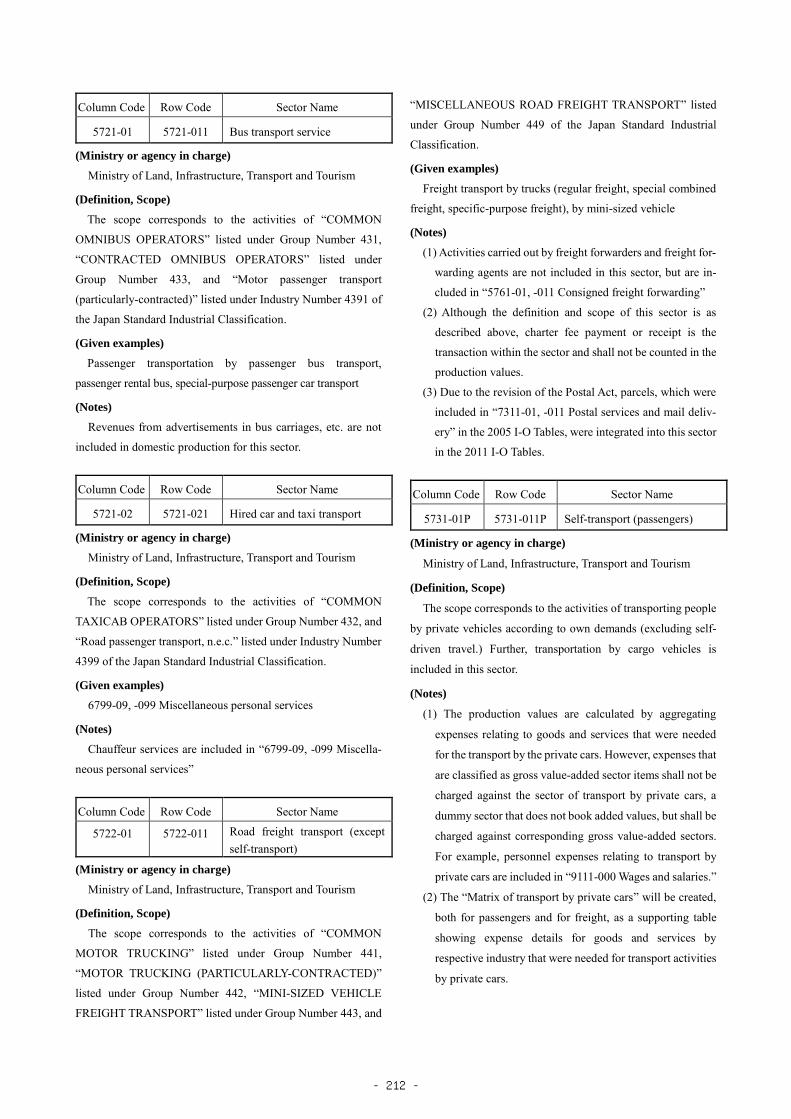
Column Code Row Code Sector Name
5721-01 5721-011 Bus transport service
(Ministry or agency in charge)
Ministry of Land, Infrastructure, Transport and Tourism
(Definition, Scope)
The scope corresponds to the activities of “COMMON
OMNIBUS OPERATORS” listed under Group Number 431,
“CONTRACTED OMNIBUS OPERATORS” listed under
Group Number 433, and “Motor passenger transport
(particularly-contracted)” listed under Industry Number 4391 of
the Japan Standard Industrial Classification.
(Given examples)
Passenger transportation by passenger bus transport,
passenger rental bus, special-purpose passenger car transport
(Notes)
Revenues from advertisements in bus carriages, etc. are not
included in domestic production for this sector.
Column Code Row Code Sector Name
5721-02 5721-021 Hired car and taxi transport
(Ministry or agency in charge)
Ministry of Land, Infrastructure, Transport and Tourism
(Definition, Scope)
The scope corresponds to the activities of “COMMON
TAXICAB OPERATORS” listed under Group Number 432, and
“Road passenger transport, n.e.c.” listed under Industry Number
4399 of the Japan Standard Industrial Classification.
(Given examples)
6799-09, -099 Miscellaneous personal services
(Notes)
Chauffeur services are included in “6799-09, -099 Miscella-
neous personal services”
Column Code Row Code Sector Name
5722-01 5722-011 Road freight transport (except
self-transport)
(Ministry or agency in charge)
Ministry of Land, Infrastructure, Transport and Tourism
(Definition, Scope)
The scope corresponds to the activities of “COMMON
MOTOR TRUCKING” listed under Group Number 441,
“MOTOR TRUCKING (PARTICULARLY-CONTRACTED)”
listed under Group Number 442, “MINI-SIZED VEHICLE
FREIGHT TRANSPORT” listed under Group Number 443, and
“MISCELLANEOUS ROAD FREIGHT TRANSPORT” listed
under Group Number 449 of the Japan Standard Industrial
Classification.
(Given examples)
Freight transport by trucks (regular freight, special combined
freight, specific-purpose freight), by mini-sized vehicle
(Notes)
(1) Activities carried out by freight forwarders and freight for-
warding agents are not included in this sector, but are in-
cluded in “5761-01, -011 Consigned freight forwarding”
(2) Although the definition and scope of this sector is as
described above, charter fee payment or receipt is the
transaction within the sector and shall not be counted in the
production values.
(3) Due to the revision of the Postal Act, parcels, which were
included in “7311-01, -011 Postal services and mail deliv-
ery” in the 2005 I-O Tables, were integrated into this sector
in the 2011 I-O Tables.
Column Code Row Code Sector Name
5731-01P 5731-011P Self-transport (passengers)
(Ministry or agency in charge)
Ministry of Land, Infrastructure, Transport and Tourism
(Definition, Scope)
The scope corresponds to the activities of transporting people
by private vehicles according to own demands (excluding self-
driven travel.) Further, transportation by cargo vehicles is
included in this sector.
(Notes)
(1) The production values are calculated by aggregating
expenses relating to goods and services that were needed
for the transport by the private cars. However, expenses that
are classified as gross value-added sector items shall not be
charged against the sector of transport by private cars, a
dummy sector that does not book added values, but shall be
charged against corresponding gross value-added sectors.
For example, personnel expenses relating to transport by
private cars are included in “9111-000 Wages and salaries.”
(2) The “Matrix of transport by private cars” will be created,
both for passengers and for freight, as a supporting table
showing expense details for goods and services by
respective industry that were needed for transport activities
by private cars.
- 212 -

Column Code Row Code Sector Name
5732-01P 5732-011P Self-transport (freight)
(Ministry or agency in charge)
Ministry of Land, Infrastructure, Transport and Tourism
(Definition, Scope)
The scope corresponds to the activities of transporting cargo
by private vehicles according to own demands (excluding self-
driven travel.)
(Notes)
Same as those of aforementioned sector “5731-01P, -011P
Self-transport (passengers)”.
Column Code Row Code Sector Name
5741-01 5741-011 International shipping
(Ministry or agency in charge)
Ministry of Land, Infrastructure, Transport and Tourism
(Definition, Scope)
The activities specified in “OCEANGOING TRANSPORT”
listed under Group Number 451, and “Vessel rental, except
coastwise ship leasing” listed under Industry Number 4541of the
Japan Standard Industrial Classification.
(Given examples)
Passenger and freight transportation by ocean transport
(Notes)
(1) Activities of “Vessel rental, except coastwise ship leasing”
under 4541 of the Industry Number of the Japan Standard
Industrial Classification are included in this sector.
However, charter fee payment or receipt is the transaction
within the sector and shall not be counted in the production
values. A charter agreement with foreign “ocean transport”
or “vessel leasing” shall, however, be counted in view of
the international balance of payment. The import side of
this (payment side of charter fee) shall be counted in at the
point of intersection of own sector.
(2) Activities carried out by freight forwarders and freight for-
warding agents are not included in this sector, but are in-
cluded in “5761-01, -011 Consigned freight forwarding”
Column Code Row Code Sector Name
5742-01 Coastal and inland water
transport
5742-011 Coastal and inland water
transport (passengers)
5742-012 Coastal and inland water
transport (freight)
(Ministry or agency in charge)
Ministry of Land, Infrastructure, Transport and Tourism
(Definition, Scope)
The activities specified in “COASTWISE TRANSPORT”
listed under Group Number 452, “INLAND WATER
TRANSPORT” listed under Group Number 453, and “Coastwise
ship leasing” listed under Industry Number 4542 of the Japan
Standard Industrial Classification.
(Given examples)
Passenger transport by coastal water transport (including
transport of passengers below twelve people), freight transport
by coastal water transport, passenger transport by port transport,
passenger and freight transport by river water transport and
inland water transport
(Notes)
(1) Activities of “Coastwise ship leasing” under Industry
Number 4542 of the Japan Standard Industrial
Classification are included in this sector. However, the
related charter fee, payment and receipt, shall not be
counted in this sector because of transactions within the
sector.
(2) Activities carried out by freight forwarders and freight
forwarding agents are not included in this sector, but are
included in “5761-01, -011 Consigned freight forwarding”
Column Code Row Code Sector Name
5743-01 5743-011 Harbor transport service
(Ministry or agency in charge)
Ministry of Land, Infrastructure, Transport and Tourism
(Definition, Scope)
The activities specified in “PORT TRANSPORT” listed under
Group Number 481 of the Japan Standard Industrial
Classification.
(Given examples)
Regular port transport, port-cargo handling, lighter transport
(including towing lighters and rafts), coastal cargo handling and
raft cargo handling
- 213 -

Column Code Row Code Sector Name
5751-01 Air transport
5751-011 International air transport
5751-012 Domestic air transport (pas-
sengers)
5751-013 Domestic air transport (freight)
5751-014 Aircraft service except air
transport
(Ministry or agency in charge)
Ministry of Land, Infrastructure, Transport and Tourism
(Definition, Scope)
The activities specified in “AIR TRANSPORT” listed under
Group Number 461, and “AIRCRAFT SERVICE, EXCEPT AIR
TRANSPORT” listed under Group Number 462 of the Japan
Standard Industrial Classification.
(Given examples)
Passenger and freight transportation internationally or domes-
tically, and aircraft services (chemical spray by aircrafts, aerial
photography) by air transport
(Notes)
(1) Although “AIR TRANSPORT” listed under Group
Number 461 of the Japan Standard Industrial Classification
is within the scope of this sector, charter fee payment or
receipt for international air transport is a transaction within
the sector and shall not be counted in the production values.
A charter agreement (passenger charger + freight charter)
with foreign “air transport” shall, however, be counted in
view of the international balance of payment. The import
side of this (payment side of charter fee) shall be counted
in at the point of intersection of own sector.
(2) Activities carried out by freight forwarders and freight
forwarding agents are not included in this sector, but are
included in “5761-01, -011 Consigned freight forwarding.”
Column Code Row Code Sector Name
5761-01 5761-011 Consigned freight forwarding
(Ministry or agency in charge)
Ministry of Land, Infrastructure, Transport and Tourism
(Definition, Scope)
The activities specified in “COLLECT-AND-DELIVER
FREIGHT TRANSPORT” listed under Group Number 444 and
“FREIGHT FORWARDING, EXCEPT COLLECT-AND-
DELIVER FREIGHT TRANSPORT” listed under Group
Number 482 of the Japan Standard Industrial Classification.
(Given examples)
Freight forwarders (1st group freight forwarders), collect-and-
deliver freight transporters (2nd group freight forwarders), freight
forwarding agents
(Notes)
The production value of this sector corresponds to the amount
of transport fare and trade commission deducted by transport
fare payable to actual transportation entities and trade commis-
sion, in order to avoid double counting of freight transport fare.
Column Code Row Code Sector Name
5771-01 5771-011 Storage facility service
(Ministry or agency in charge)
Ministry of Land, Infrastructure, Transport and Tourism
(Definition, Scope)
The activities specified in “ORDINARY WAREHOUSING”
listed under Group Number 471, “REFRIGERATED WARE-
HOUSING” listed under Group Number 472 of the Japan Stand-
ard Industrial Classification, and co-op warehousing activities
(Given examples)
Regular warehousing (outdoor warehousing, storage silo,
storage tank, trunk room), storage and cargo handling at chilled
warehouse, water surface timber warehouse, JA warehouse, ma-
rine products union warehouse, forestry union warehouse, union
warehouse for small businesses
(Notes)
Activities at a private warehouse shall be included in the ac-
tivities of the corresponding industry. However, activities at un-
ion warehouses shall be included in this sector because union
warehouses charge similar as commercial warehouses do.
Column Code Row Code Sector Name
5781-01 5781-011 Packing service
(Ministry or agency in charge)
Ministry of Land, Infrastructure, Transport and Tourism
(Definition, Scope)
The activities specified in “PACKING AND CRATING”
listed under Group Number 484 of the Japan Standard Industrial
Classification.
(Given examples)
Packing, cargo packing, crating, industrial products crating,
export packing
(Notes)
Private packing activities shall be treated as inputs of packing
materials of corresponding sector, and shall not be included in
- 214 -

this sector.
Column Code Row Code Sector Name
5789-01 5789-011 Facility service for road transport
(Ministry or agency in charge)
Ministry of Land, Infrastructure, Transport and Tourism
(Definition, Scope)
The activities of “Fixed facilities for road transport” listed
under Industry Number 4852, “Terminal facilities for motor
vehicles” listed under Industry Number 4853, activities related
to road transport in specified in “Terminal facilities for handling
freight” listed under Industry Number 4854, and activities
exclusive of surface parking lots and parking lots with the
purpose of storing automobiles specified in “AUTOMOBILE
PARKING” listed under Group Number 693 of the Japan
Standard Industrial Classification.
(Given examples)
Motorways, toll roads, toll bridges, toll tunnels, car terminals,
facilities relating to road transport among “Terminal facilities for
handling freight”, toll parking lot
(Notes)
(1) Rent-a-car and leasing cars are included in “6612-01, -011
Car rental and leasing”
(2) Parking lots on roads are not included in this sector, but
included in “6112-01, -011 Public administration (local) **”
for the following reasons; parking lots on roads are the
tentative measure for car parking until such time that
sufficient volume of regular parking space becomes
available; and parking lots on roads provided with parking
meters and tickets that are prepared by the National Public
Safety Commission are aiming at parking hours control for
better road utilization.
Column Code Row Code Sector Name
5789-02 5789-021 Port and water traffic control
(public corporation) **
(Ministry or agency in charge)
Ministry of Land, Infrastructure, Transport and Tourism
(Definition, Scope)
The activities specified in “Piers and docks” listed under In-
dustry Number 4855, port-related activities such as cargo han-
dling pier facilities specified in “Terminal facilities for handling
freight” listed under Industry Number 4854, water supply activ-
ities for vessels specified in “WATER FOR END USERS, EX-
CEPT INDUSTRIAL USERS” listed under Group Number 361,
and activities of providing waterways information by waterway
signaling office (lighthouse), and by the water traffic center
specified “Services incidental to transport, n.e.c.” listed under
Industry Number 4899 of the Japan Standard Industrial Classifi-
cation
(Given examples)
Management of port and fishing harbor, provision of water-
ways information
(Changes from the 2011 I-O Tables)
Port-related activities to which local public business account-
ing is applied, and management of some facilities conducted
within port premises by port operation companies, etc., which
were included in this sector in the 2011 I-O Tables, are removed
from this sector and classified under a new sector, “5789-03, -
031 Port and water traffic control.”
(Notes)
Regarding vessel tonnage tax and special tonnage tax, those
taxes are primarily paid to customs directly by captains of
inbound vessels or by operators. However, those taxes are the
cost of using port facilities by inbound vessels and, therefore,
shall be input to this sector as expenses booked as indirect taxes
to consist the production value. In the similar manner, canal
passage tax and lighthouse tax are booked in this sector, but
limited to those for import.
Column Code Row Code Sector Name
5789-03 5789-031 Port and water traffic control
(Ministry or agency in charge)
Ministry of Land, Infrastructure, Transport and Tourism
(Definition, Scope)
The port-related activities such as cargo handling pier facili-
ties specified in “Freight handling facilities” listed under Indus-
try Number 4854, activities specified in “Piers and docks” listed
under Industry Number 4855, water supply activities for vessels
specified in “WATER FOR END USERS, EXCEPT INDUS-
TRIAL USERS” listed under Group Number 361 of the Japan
Standard Industrial Classification
(Given examples)
Management of ports
(Changes from the 2011 I-O Tables)
Port-related activities to which local public business account-
ing is applied, and management of some facilities conducted
- 215 -

within port premises by port operation companies, etc., which
were included in “5789-02. -021 Port and water traffic control
**” in the 2011 I-O Tables, are split and specified in this sector.
Column Code Row Code Sector Name
5789-04 5789-041 Services relating to water
transport
(Ministry or agency in charge)
Ministry of Land, Infrastructure, Transport and Tourism
(Definition, Scope)
The activities of measuring quantities, volume, transport
appraisal, ship pilot, salvage, marine rescue, rope handling on
anchoring, and vessel towing specified in “Services incidental to
transport, n.e.c.” listed under Industry Number 4899 of the Japan
Standard Industrial Classification.
(Given examples)
Ship pilot, quantity inspection, volume inspection, appraisal
Column Code Row Code Sector Name
5789-05 5789-051 Airport and air traffic control
(public corporation) **
(Ministry or agency in charge)
Ministry of Land, Infrastructure, Transport and Tourism
(Definition, Scope)
The management activities of airports and public heliports by
the local public entities specified in “Airports and air fields, hel-
iports” listed under Industry Number 4856 of the Japan Standard
Industrial Classification.
(Given examples)
Airport management
(Changes from the 2011 I-O Tables)
Airport management and air traffic control activities con-
ducted by the national government, which were classified under
this sector in the 2011 I-O Tables are integrated into “5789-06, -
061 Airport and air traffic control.”
(Notes)
Import (payment relating to foreign airport facilities) shall be
counted in the sector “5789-06, -061 Airport and air traffic con-
trol.”
Column Code Row Code Sector Name
5789-06 5789-061 Airport and air traffic control
(Ministry or agency in charge)
Ministry of Land, Infrastructure, Transport and Tourism
(Definition, Scope)
Activities related to “Airports and air fields, heliports” listed
under Industry Number 4856 of the Japan Standard Industrial
Classification, which are conducted by entities other than local
public bodies.
(Given examples)
Airport control, air traffic control
(Changes from the 2011 I-O Tables)
Airport management and air traffic control activities con-
ducted by the national government, which were classified under
“5789-04, -041 Airport and air traffic control (public) **” in the
2011 I-O Tables, are integrated into this sector.
(Notes)
Import (payment relating to foreign airport facilities) shall be
counted in this sector.
Column Code Row Code Sector Name
5789-07 5789-071 Services relating to air transport
(Ministry or agency in charge)
Ministry of Land, Infrastructure, Transport and Tourism
(Definition, Scope)
The supporting activities relating to air transport (on-board
food services, operation service, passenger boarding, luggage
loading, aircraft fuel control and fuel supply charge, and other
related services) among those specified in “Services incidental
to transport, n.e.c.” excluding air traffic control activities under
Industry Number 4899 of the Japan Standard Industrial Classifi-
cation.
(Given examples)
Provision of facilities for fueling aircrafts, provision of con-
venience facilities, provision of supply facilities
(Notes)
Airport terminal buildings are included in “5511-02, -021
Real estate rental service”, passenger transportation limousine
buses are in “5721-01, -011 Bus transport service”, fuel supply
(sale of fuel) is in “Trade”, and aircraft maintenance and repair are
in “3592-10, -101 Repair of aircrafts” respectively
Column Code Row Code Sector Name
5789-09 5789-099 Travel agency and miscellaneous
services relating to transport
(Ministry or agency in charge)
Ministry of Land, Infrastructure, Transport and Tourism
(Definition, Scope)
- 216 -

The activities conducted by tourism associations among those
specified in “TRAVEL AGENCY” listed under Group Number
791, “TRANSPORT AGENCIES” listed under Group Number
483, “Shipping brokers” listed under Industry Number 4891,
“Services incidental to transport, n.e.c.” listed under Industry
Number 4899 of the Japan Standard Industrial Classification.
(Given examples)
Travel agencies, transport agencies, transport intermediates
(Notes)
This sector covers other transport businesses not elsewhere
classified.
Column Code Row Code Sector Name
5791-01 5791-011 Postal services and mail delivery
(Ministry or agency in charge)
Ministry of Internal affairs and Communications
(Definition, Scope)
The post-related activities among those specified in “POSTAL
ACTIVITIES, INCLUDING MAIL DELIVERY” listed under
Group Number 491 ,“POSTAL SERVICES” listed under Group
Number 861, and “CONTRACTED POSTAL SERVICES”
listed under Group Number 862 of the Japan Standard Industrial
Classification.
(Given examples)
Regular post, parcel delivery, postal services undertaken by
contracted post offices, postal stamp selling stands (trade com-
missions), etc.
(Changes from the 2011 I-O Tables)
Postal services undertaken by contracted post offices, and
postal stamp selling stands (trade commissions), which were
classified under “5919-09, -099 Miscellaneous service relating to
communication” in the 2011 I-O Tables are integrated into this
sector.
(Notes)
Commissioning of transport of postal matter shall be counted
in at the point of intersection of “5712-011 Railway transport
(freight),” “5742-012 Coastal and inland water transport
(freight),” “5751-011 International air transport” and “5751-013
Domestic air transport (freight).”
59 Information and communications
Column Code Row Code Sector Name
5911-01 5911-011 Fixed telecommunications
(Ministry or agency in charge)
Ministry of Internal affairs and Communications
(Definition, Scope)
Services related to “FIXED TELECOMMUNICATIONS”
listed under Group Number 371 of the Japan Standard Industrial
Classification, except server housing services and server hosting
services.
(Given examples)
Telephone, telegraph, telegram, personal, ISP (internet service
provider), IX (internet exchange) service, Internet connection
service via fixed telecommunication lines, voice messaging ser-
vice, fax service, wire broadcast telephones, etc.
(Changes from the 2011 I-O Tables)
(1) Wire broadcast telephones classified under “5911-09, -
099 Miscellaneous telecommunications” and “5919-09, -
099 Miscellaneous services relating to communication” in
the 2011 I-O Tables is integrated into this sector.
(2) Server housing services and server hosting services clas-
sified under “5911-09, -099 Miscellaneous telecommuni-
cations” in the 2011 I-O Tables are integrated into “5941-
01, -011 Internet based services.”
(Notes)
Self-operated telecommunication network systems and tele-
phone systems such as public offices, electricity, railways, air-
crafts, and ships are not included in this sector.
Column Code Row Code Sector Name
5911-02 5911-021 Mobile telecommunications
(Ministry or agency in charge)
Ministry of Internal affairs and Communications
(Definition, Scope)
The activities specified in “MOBILE TELECOMMUNICA-
TIONS” listed under Group Number 372 of the Japan Stand-
ard Industrial Classification.
(Given examples)
Mobile phones, PHSs, on-demand radio communications,
internet connection services by mobile telecommunications, etc.
- 217 -

Column Code Row Code Sector Name
5911-03 5911-031 Services incidental to telecom-
munications
(Ministry or agency in charge)
Ministry of Internal affairs and Communications
(Definition, Scope)
The activities specified in “SERVICES INCIDENTAL TO
TELECOMMUNICATIONS” listed under Group Number 373
of the Japan Standard Industrial Classification.
(Given examples)
Contracted telecommunications services, cellular phone
shops (commission fees for cellular phone contracts), contracted
airport radio telephone services, mobile radio center services, etc.
(Changes from the 2011 I-O Tables)
“Wire broadcast telephones” and “postal services undertaken
by contracted post offices and postal stamp selling stands (trade
commission)” classified under “5919-09, -099 Miscellaneous
services relating to communication” in the 2011 I-O Tables are
integrated into “5911-01, -011 Fixed telecommunications” and
“5791-01, -011 Postal services and mail delivery”, respectively.
Column Code Row Code Sector Name
5921-01 5921-011 Public broadcasting
(Ministry or agency in charge)
Ministry of Internal affairs and Communications
(Definition, Scope)
The activities specified in “PUBLIC BROADCASTING, EX-
CEPT CABLECASTING” listed under Group Number 381, and
the activities related to public broadcasting specified in “Satellite
broadcasting s” listed under Industry Number 3823 of the Japan
Standard Industrial Classification.
(Given examples)
Television, radio, satellite broadcasting by Japan Broadcast-
ing Corporation
(Notes)
NHK Science & Technology Research Laboratories, and
NHK Broadcasting Culture Research Institute, both of which be-
long to Japan Broadcasting Corporation, are included in this sec-
tor.
Column Code Row Code Sector Name
5921-02 5921-021 Private broadcasting
(Ministry or agency in charge)
Ministry of Internal affairs and Communications
(Definition, Scope)
The activities specified in “PRIVATE-SECTOR BROAD-
CASTING, EXCEPT CABLECASTING” listed under Group
Number 382 (exclusive of public broadcasting activities speci-
fied in “Satellite broadcasting” listed under Industry Number
3823) of the Japan Standard Industrial Classification.
Revenues from advertisement is included in the production
value.
(Given examples)
Television, radio, satellite broadcasting supported primarily by
advertisement commission revenue or fee from broadcasting on
contract
Column Code Row Code Sector Name
5921-03 5921-031 Cable broadcasting
(Ministry or agency in charge)
Ministry of Internal affairs and Communications
(Definition, Scope)
The activities of specified in “CABLECASTING” listed
under Group Number 383 of the Japan Standard Industrial
Classification.
Revenue from advertisement is included in the production
value.
(Given examples)
Cable television broadcasting, cable radio broadcasting
Column Code Row Code Sector Name
5931-01 Information services
5931-011 Computer programming and
miscellaneous software services
5931-012 Data processing, research and
information services
(Ministry or agency in charge)
Ministry of Economy, Trade and Industry
(Definition, Scope)
The activities specified in “COMPUTER PROGRAMMING
AND OTHER SOFTWARE SERVICES” listed under Group
Number 391 and “DATA PROCESSING AND INFORMATION
SERVICES” listed under Group Number 392 of the Japan Stand-
ard Industrial Classification. Also included are the document in-
formation provision account of the Japan Science and Technol-
ogy Agency and activities of the Nippon Automated Cargo and
Port Consolidated System, Inc.
- 218 -

(Given examples)
Computer programming and miscellaneous software services:
software development, information system development
Data processing and research and information services: com-
putation services, computer center, machine time service,
punching services, economic information provider service,
real estate information provider service, weather infor-
mation provider service, traffic information provider ser-
vice, market research, polling service, social research
Column Code Row Code Sector Name
5941-01 5941-011 Internet based services
(Ministry or agency in charge)
Ministry of Internal affairs and Communications
(Definition, Scope)
The activities specified in “SERVICES INCIDENTAL TO
INTERNET” listed under Group Number 401 and activities re-
lated to server housing services and server hosting services that
fall under activities related to “FIXED TELECOMMUNICA-
TIONS” listed under Group Number 371 of the Japan Standard
Industrial Classification.
Revenue from advertisement is included in the production
value.
(Given examples)
ASP (application service provider), electronic authentication,
information network security service, portal site management,
IDC (Internet data center) services, etc.
(Changes from the 2011 I-O Tables)
Server housing services and server hosting services, which
were included in “5911-09, -099 Miscellaneous telecommunica-
tions” in the 2011 I-O Tables, are integrated into this sector.
Column Code Row Code Sector Name
5951-01 5951-011 Video picture, sound information,
character information production
(except newspaper or publication)
(Ministry or agency in charge)
Ministry of Internal affairs and Communications
(Definition, Scope)
The activities specified in “VIDEO PICTURE INFOR-
MATION PRODUCTION AND DISTRIBUTION” listed under
Group Number 411, “SOUND INFORMATION PRODUC-
TION” listed under Group Number 412, “COMMERCIAL ART
AND GRAPHIC DESIGN” listed under Group Number 415,
and “SERVICES INCIDENTAL TO VIDEO PICTURE INFOR-
MATION, SOUND INFORMATION, CHARACTER INFOR-
MATION PRODUCTION AND DISTRIBUTION” listed under
Group Number 416 of the Japan Standard Industrial Classifica-
tion.
(Given examples)
Movie production and distribution, video production and sales,
television program production, television commercial produc-
tion, record production, music publishing, radio program pro-
duction, advertising production (related to printed matter),
Kyodo News Service, Jiji Press, news agency branches (those
that do not print and publish), rental studios, pre-production,
post-production
(Notes)
(1) Production activities of DVDs, etc. are included in “3919-
06, -061 Audio and video records, other information re-
cording media.”
(2) “Theatrical goods rental” listed under Industry Number
7091 of the Japan Standard Industrial Classification is in-
cluded in the column sector “6611-01 Goods rental and
leasing (except car rental)” and row sector “6611-015
Sports goods, recreation goods and miscellaneous goods
rental and leasing.”
(3)Activities related to sound information production, and
sound information and character information production
and distribution from among services incidental to video
picture, sound information, character information produc-
tion and distribution, which were included in “8519-09, -
099 Other business services,” as well as news syndicates
included in “7351-04, -041 News syndicates and private
detective agencies” in the 2005 I-O Tables are integrated
into this sector.
Column Code Row Code Sector Name
5951-02 5951-021 Newspaper
(Ministry or agency in charge)
Ministry of Economy, Trade and Industry
(Definition, Scope)
The activities of “NEWSPAPER PUBLISHERS” listed under
Group Number 413 of the Japan Standard Industrial Classifica-
tion; revenue from advertisements is also included in the produc-
tion value
(Notes)
Electronic media is also included in this sector.
- 219 -

Column Code Row Code Sector Name
5951-03 5951-031 Publication
(Ministry or agency in charge)
Ministry of Economy, Trade and Industry
(Definition, Scope)
The production activities of “PUBLISHERS, EXCEPT
NEWSPAPERS” listed under Group Number 414 of the Japan
Standard Industrial Classification; the production value includes
revenue from advertisements.
(Given examples)
Books, magazines, journals, other publications
(Notes)
Electronic media is also included in this sector.
61 Public administration
Column Code Row Code Sector Name
6111-01 6111-011 Public administration (central
government) **
(Ministry or agency in charge)
Cabinet Office
(Definition, Scope)
“NATIONAL GOVERNMENT SERVICES” listed under
Major Group Number 97 of the Japan Standard Industrial
Classification in general, covering the central government
general accounts and special accounts as well as the government
services undertaken by government-associated entities, except
services undertaken by “non-market producers (general
government) **” associated with the central government which
are included in the sectors classified under “semi-public
administration” and “social security funds.”
(Given examples)
Refer to the “Government services” in System of Transactor-
Based Production Activity Classification.
(Changes from the 2011 I-O Tables)
Commission fees paid to the central government by market
producers (spectrum license user fees, permit fees, etc.) which
were classified under “9411-000 Indirect taxes (except custom
duties and commodity taxes on imported goods)” in the 2011 I-
O Tables are included in “sales of goods and services” in this
sector.
(Notes)
Activities by Self Defense Force are included in this sector.
Column Code Row Code Sector Name
6112-01 6112-011 Public administration (local
government) **
(Ministry or agency in charge)
Cabinet Office
(Definition, Scope)
The scope corresponds to the activities of “LOCAL
GOVERNMENT SERVICES” in general under Major Group
Number 98 of the Japan Standard Industrial Classification. To be
precise, the scope covers the government services by local
government-related entities classified as non-market producer
(General government) ** among regular local public entities and
special local public entities excluding those of sectors that are
classified in “semi-public administration” and “social security
funds” sector.
- 220 -

(Given examples)
Refer to the “Government services” in System of Transactor-
Based Production Activity Classification.
(Changes from the 2011 I-O Tables)
Commission fees paid to the local government by market pro-
ducers which were classified under “9411-000 Indirect taxes (ex-
cept customs duties and commodity taxes on imported goods)”
in the 2011 I-O Tables are included in “sales of goods and ser-
vices” in this sector.
63 Education and research
Column Code Row Code Sector Name
6311-01 6311-011 School education (public institu-
tion) **
(Ministry or agency in charge)
Ministry of Education, Culture, Sports, Science and Technol-
ogy
(Definition, Scope)
The scope corresponds to the activities of “KINDERGAR-
TENS” listed under Group Number 811, “ELEMENTARY
SCHOOLS” listed under Group Number 812, “LOWER SEC-
ONDARY SCHOOLS” listed under Group Number 813, “UP-
PER SECONDARY SCHOOLS, SECONDARY SCHOOLS”
listed under Group Number 814, “SCHOOLS FOR SPECIAL
NEEDS EDUCATION” listed under Group Number 815, “IN-
STITUTION OF HIGHER EDUCATION” listed under Group
Number 816, “SPECIALIZED TRAINING COLLEGES AND
MISCELLANEOUS SCHOOLS” listed under Group Number
817, and “INTEGRATED CENTERS FOR EARLY CHILD-
HOOD EDUCATION AND CARE” listed under Group Number
819 of the Japan Standard Industrial Classification established
by the National University Corporation, the Institute of National
Colleges of Technology, local governments, and public univer-
sity corporations (excluding research activities conducted by in-
stitutions of higher education).
(Given examples)
Kindergartens, integrated centers for early childhood
education and care, elementary schools, lower secondary schools,
upper secondary schools, secondary education school, special
needs school, specialized high schools, junior colleges,
universities, special training schools, other types of school
(Changes from the 2011 I-O Tables)
(1) “INTEGRATED CENTERS FOR EARLY CHILDHOOD
EDUCATION AND CARE” listed under Group Number
819 of the Japan Standard Industrial Classification are
included in this sector.
(2) Research activities conducted by institutions of higher
education are removed from this sector and included in
relevant sectors listed under “Scientific and development
research institutes.”
(3) Educational activities of research institutes attached to
schools are included in this sector.
(Notes)
(1) Libraries attached to schools are classified in this sector.
- 221 -

However, hospitals and research institutes attached to
schools are classified in “Medical” and “Research
institutions (except educational activities)” respectively.
(2) A new category, “Integrated centers for early childhood
education and care” (legally authorized integrated school
and child welfare facilities), was established in April 2015,
and the relevant schools are included in this sector from
the 2015 I-O Tables. This sector is growing due to the fact
that day nurseries, etc. are shifting to this new category.
Column Code Row Code Sector Name
6311-02 6311-021 School education (NPI) *
(Ministry or agency in charge)
Ministry of Education, Culture, Sports, Science and Technology
(Definition, Scope)
The scope corresponds to the activities of “KINDERGAR-
TENS” listed under Group Number 811, “ELEMENTARY
SCHOOLS” listed under Group Number 812, “LOWER SEC-
ONDARY SCHOOLS” listed under Group Number 813, “UPPER
SECONDARY SCHOOLS, SECONDARY SCHOOLS” listed
under Group Number 814, “SCHOOLS FOR SPECIAL NEEDS
EDUCATION” listed under Group Number 815, “INSTITU-
TION OF HIGHER EDUCATION” listed under Group Number
816, “SPECIALIZED TRAINING COLLEGES AND MISCEL-
LANEOUS SCHOOLS” listed under Group Number 817, and
“INTEGRATED CENTERS FOR EARLY CHILDHOOD ED-
UCATION AND CARE” listed under Group Number 819 of the
Japan Standard Industrial Classification established by enti-
ties other than National University Corporation, the Institute
of National Colleges of Technology, local governments, and
public university corporations (excluding research activities
conducted by institutions of higher education).
(Given examples)
Kindergartens, integrated centers for early childhood educa-
tion and care, elementary schools, lower secondary schools, up-
per secondary schools, secondary education school, special
needs school, specialized high schools, junior colleges, univer-
sities, special training schools, other types of school
(Changes from the 2011 I-O Tables)
(1) “INTEGRATED CENTERS FOR EARLY CHILDHOOD
EDUCATION AND CARE” listed under Group Number
819 of the Japan Standard Industrial Classification are
included in this sector.
(2) Research activities conducted by institutions of higher
education are removed from this sector and included in
relevant sectors listed under “Scientific and development
research institutes.”
(3) Educational activities of research institutes attached to
schools are included in this sector.
(Notes)
(1) Libraries attached to schools are classified in this sector.
However, hospitals and research institutes attached to
schools are classified in “Medical” and “Research institutions”
(except educational activities)” respectively.
(2) A new category, “Integrated centers for early childhood
education and care” (legally authorized integrated school
and child welfare facilities), was established in April 2015,
and the relevant schools are included in this sector from the
2015 I-O Tables. This sector is growing due to the fact that
day nurseries, etc. are shifting to this new category.
Column Code Row Code Sector Name
6311-03 6311-031 School lunch (public institution)
**
(Ministry or agency in charge)
Ministry of Education, Culture, Sports, Science and Technol-
ogy
(Definition, Scope)
The production activities for school meals provided for school
children at compulsory public schools, in accordance with the
“School Lunch Law” (No. 160 of 1954).
(Changes from the 2011 I-O Tables)
This category is moved from “Manufacturing” to “Services”
in the 13-sector classification table, and from “1119 Miscellane-
ous foods” to “6311 School education” in the sector classifica-
tion.
(Notes)
School lunch programs shall basically be implemented by the
schools themselves. However, in reality there are cases in which
school meals are provided by school organizations or by external
organizations such as school meals centers and so forth that have
been contracted. Confusion may arise if the classification is
made according to meal service providers, and therefore it is
made according to the educational entity that is supposed to pro-
vide the school meals service: either the “public institution” or
“NPI.”
Column Code Row Code Sector Name
6311-04 6311-041 School lunch (NPI) *
- 222 -

(Ministry or agency in charge)
Ministry of Education, Culture, Sports, Science and Technol-
ogy
(Definition, Scope)
The production activities for school meals provided for school
children at compulsory private schools, in accordance with the
“School Meals Law” (No. 160 of 1954).
(Changes from the 2011 I-O Tables)
This category is moved from “Manufacturing” to “Services”
in the 13-sector classification table, and from “1119 Miscellane-
ous foods” to “6311 School education” in the sector classifica-
tion.
(Notes)
Same as “6311-03, -031 School lunch (public institution) **”
Column Code Row Code Sector Name
6312-01 6312-011 Social education (public institu-
tion) **
(Ministry or agency in charge)
Ministry of Education, Culture, Sports, Science and Technology
(Definition, Scope)
The scope corresponds to the activities of social educational
facilities opened by the national government, local governments,
and independent administrative agencies, from among “SO-
CIAL EDUCATION” listed under Group Number 821 of the Ja-
pan Standard Industrial Classification. To be specific, the activ-
ities refer to organizational and educational activities outside of
those that are conducted according to school education curricu-
lums.
(Given examples)
Citizens’ Public hall, library, museum, art museum, zoo, bo-
tanical garden, aquarium, educational facilities for children and
youths (youth’s house, nature house for boys), social education
by correspondence, education hall for women
Column Code Row Code Sector Name
6312-02 6312-021 Social education (NPI) *
(Ministry or agency in charge)
Ministry of Education, Culture, Sports, Science and Technology
(Definition, Scope)
The scope corresponds to the activities of social educational
facilities opened by entities other than the national government,
local governments, and independent administrative agencies,
from among “SOCIAL EDUCATION” listed under Group
Number 821 of the Japan Standard Industrial Classification. To
be specific, the activities refer to organizational and educational
activities outside of those that are conducted according to school
education curriculums.
(Given examples)
Citizens’ Public hall, library, museum, art museum, zoo, bo-
tanical garden, aquarium, educational facilities for children and
youths (youth’s house, nature house for boys), social education
by correspondence, education hall for women
Column Code Row Code Sector Name
6312-03 6312-031 Miscellaneous educational and
training institutions (public in-
stitution) **
(Ministry or agency in charge)
Ministry of Education, Culture, Sports, Science and Technology
(Definition, Scope)
The scope corresponds to the activities of employees training
facilities opened by the government, local governments and in-
dependent administrative agencies, from among “Employee
training facilities and supporting facilities” listed under Industry
Number 8221, and the activities of “Vocational guidance centers”
listed under Industry Number 8222 of the Japan Standard Indus-
trial Classification.
(Given examples)
National Defense Academy, National Police Academy, Local
Autonomy College, Meteorological College, Fire Academy, Vo-
cational Ability Development School, National Institute for Sea
Training
Column Code Row Code Sector Name
6312-04 6312-041 Miscellaneous educational and
training institutions
(Ministry or agency in charge)
Ministry of Education, Culture, Sports, Science and Technology
(Definition, Scope)
The scope corresponds to the activities of employees training
facilities opened by entities other than the government, local
governments and independent administrative agencies, “Em-
ployee training facilities and supporting facilities” listed under
Industry Number 8221, as well as the activities of “Educational
and learning support services, n.e.c.” listed under Industry Num-
ber 8299 of the Japan Standard Industrial Classification.
(Given examples)
Contract work for employee training, training school for den-
tal hygiene specialist (other than specialized schools nor other
- 223 -

types of school), cooking schools (other than specialized schools
nor other types of school), dressmaking schools (other than spe-
cialized schools nor other types of school), driving training
school (other than specialized schools nor other types of school)
Column Code Row Code Sector Name
6321-01 6321-011 Research institutes for natural
science (pubic institution) **
(Ministry or agency in charge)
Ministry of Education, Culture, Sports, Science and Technology
(Definition, Scope)
Research activities in the field of natural sciences conducted
by the research institutes of the government, local governments
and independent administrative agencies, from among
“RESEARCH INSTITUTES FOR NATURAL SCIENCES”
listed under Group Number 711 and schools established by
national university corporations, the National Institute of
Technology, local public bodies, and public university
corporations that fall under “INSTITUTIONS OF HIGHER
EDUCATION” listed under Group Number 816 of the Japan
Standard Industrial Classification.
(Given examples)
Public universities (limited to research activities), National
Institute for Materials Science, National Institute of Advanced
Industrial Science and Technology, National Institute of
Biomedical Innovation, Health and Nutrition, theoretical
research institutes, engineering research institutes, agricultural
research institutes, medical and medicine research institutes
(Changes from the 2011 I-O Tables)
(1) Research activities in the field of natural sciences
conducted by national and public institutions of higher
education are included in this sector.
(2) Educational activities conducted by research institutes
attached to national and public schools are removed from
this sector and included in “School education (public
instituion) **.”
(Notes)
Activities of research institutes attached to public schools (ex-
cluding educational activities) are included in this sector.
Column Code Row Code Sector Name
6321-02 6321-021 Research institutes for cultural
and social sciences (public insti-
tution) **
(Ministry or agency in charge)
Ministry of Education, Culture, Sports, Science and Technology
(Definition, Scope)
Research activities in the field of humanities and social
sciences conducted by the research institutes of the government,
local governments and independent administrative agencies, from
among “RESEARCH INSTITUTES FOR HUMANITIES AND
SOCIAL SCIENCES” listed under Group Number 712 and
schools established by national university corporations, the
National Institute of Technology, local public bodies, and public
university corporations that fall under “INSTITUTIONS OF
HIGHER EDUCATION” listed under Group Number 816 of the
Japan Standard Industrial Classification.
(Given examples)
Public universities (limited to research activities), National
Education Policies Research Institute, National Institutes for
the Humanities, National Institute of Social Security Research,
National Institute of Population Research, Research Institute of
Economy, Trade and Industry
(Changes from the 2011 I-O Tables)
(1) Research activities in the field of humanities and social
sciences conducted by national and public institutions of
higher education are included in this sector.
(2) Educational activities conducted by research institutes at-
tached to national and public schools are removed from
this sector and included in “School education (public insti-
tution) **.”
(Notes)
Activities of research institutes attached to public schools (ex-
cluding educational activities) are included in this sector.
Column Code Row Code Sector Name
6321-03 6321-031 Research institutes for natural
sciences (NPI) *
(Ministry or agency in charge)
Ministry of Education, Culture, Sports, Science and Technology
(Definition, Scope)
Research activities in the field of natural sciences conducted
by the research institutes of the non-profit private corporations
from among “RESEARCH INSTITUTES FOR NATURAL SCI-
ENCES” listed under Group Number 711 and schools estab-
lished by entities other than national university corporations, the
National Institute of Technology, local public bodies, and public
university corporations that fall under “INSTITUTIONS OF
HIGHER EDUCATION” listed under Group Number 816 of the
Japan Standard Industrial Classification.
- 224 -

(Given examples)
Private universities (limited to research activities), theoretical
research institutes, engineering research institutes, agricultural
research institutes, medical and medicine research institutes
(Changes from the 2011 I-O Tables)
(1) Research activities in the field of natural sciences
conducted by private institutions of higher education are
included in this sector.
(2) Educational activities conducted by research institutes
attached to private schools are removed from this sector and
included in “School education (NPI) *.”
(Notes)
Activities of research institutes attached to private schools
(excluding educational activities) are included in this sector.
Column Code Row Code Sector Name
6321-04 6321-041 Research institutes for cultural
and social sciences (NPI) *
(Ministry or agency in charge)
Ministry of Education, Culture, Sports, Science and Technology
(Definition, Scope)
Research activities in the field of humanities and social sci-
ences conducted by the research institutes of the non-profit pri-
vate corporations from among “RESEARCH INSTITUTES FOR
HUMANITIES AND SOCIAL SCIENCES” listed under Group
Number 712 and schools established by entities other than na-
tional university corporations, the National Institute of Technol-
ogy, local public bodies, and public university corporations that
fall under “INSTITUTIONS OF HIGHER EDUCATION” listed
under Group Number 816 of the Japan Standard Industrial Clas-
sification.
(Given examples)
Private universities (limited to research activities), Institute of
Oriental Culture, social science research institutes
(Changes from the 2011 I-O Tables)
(1) Research activities in the field of humanities and social
sciences conducted by private institutions of higher
education are included in this sector.
(2) Educational activities conducted by research institutes
attached to private schools are removed from this sector and
included in “School education (NPI) *.”
(Notes)
Activities of research institutes attached to private schools
(excluding educational activities) are included in this sector.
Column Code Row Code Sector Name
6321-05 6321-051 Research institutes for natural
sciences
(Ministry or agency in charge)
Ministry of Education, Culture, Sports, Science and Technology
(Definition, Scope)
The scope corresponds to the experimental, testing and re-
searching activities relating to natural science conducted by re-
search institutes except for the following entities, from among
those of “RESEARCH INSTITUTES FOR NATURAL SCI-
ENCES” listed under Group Number 711 of the Japan Standard
Industrial Classification.
(1) Research institutes of the government and local govern-
ments, and research institutes established by independent
administrative agencies (including research institutes at-
tached to public schools)
(2) Research institutes opened by non-profit private corpora-
tions such as research institutes attached to private schools
(Given examples)
Theoretical research institutes, engineering research institutes,
agricultural research institutes, medical and medicine research
institutes
Column Code Row Code Sector Name
6321-06 6321-061 Research institutes for cultural
and social sciences
(Ministry or agency in charge)
Ministry of Education, Culture, Sports, Science and Technology
(Definition, Scope)
The scope corresponds to the experimental, testing and re-
searching activities relating to humanities and social sciences
conducted by research institutes except for the following entities,
from among those of “RESEARCH INSTITUTES FOR HU-
MANITIES AND SOCIAL SCIENCES” listed under Group
Number 712 of the Japan Standard Industrial Classification.
(1) Research institutes of the government and local govern-
ments, and research institutes established by independent
administrative agencies (including research institutes at-
tached to public schools)
(2) Research institutes opened by non-profit private corpora-
tions such as research institutes attached to private schools
(Given examples)
Cultural and social research institutes, social science research
institutes
- 225 -

Column Code Row Code Sector Name
6322-01 6322-011 Research and development (in-
tra-enterprise)
(Ministry or agency in charge)
Ministry of Education, Culture, Sports, Science and Technology
(Definition, Scope)
The scope corresponds to creative efforts and research activi-
ties by enterprises to get new knowledge on materials, functions
or phenomena, or to have existing knowledge utilized for new
directions. Further, research and development activities by en-
terprises relating to production and manufacturing processes of
products (commodities), or technical improvement thereof are
included in this sector.
(Given examples)
(1) Examples refer to thoughts, ideas, gathering of infor-
mation and data, proto-type production, experiment, exam-
ination, analysis and reports that are needed for activities
and research. Therefore, activities of making machines,
tools or devices for the researches, growing animals and
plants and surveying documents are included in this sector.
(2) Examples also refer to the activities described in the afore-
mentioned paragraph as well as engineering and manufac-
turing of a pilot plan and prototype with testing at other site
than the entity’s research laboratory or research and devel-
opment division, for example at manufacturing plant.
64 Medical, health care and welfare
Column Code Row Code Sector Name
6411-01 6411-011 Medical service (hospitalization)
(Ministry or agency in charge)
Ministry of Health, Labour and Welfare
(Definition, Scope)
The hospitalization activities, from among general practice as
specified in “HOSPITALS” listed under Group Number 831 and
“Clinics with beds” listed under Industry Number 8321 of the
Japan Standard Industrial Classification.
Dentistry in hospitals and clinics of medical practitioners is
included in “Medical service (dentistry).” Services with Long-
Term Care Insurance are classified under “Nursing care (facility
services)” or “Nursing care (except facility services).”
(Given examples)
General practice (hospitalization (excluding dentistry))
(Notes)
“8311-01, -011 Medical service (public),” “8311-02, -021
Medical service (non-profit foundations, etc.),” and “8311-03, -
031 Medical service (medical corporations, etc.)” in the 2005 I-
O Tables are reorganized in the 2011 I-O Tables.
Column Code Row Code Sector Name
6411-02 6411-021 Medical service (except hospi-
talization)
(Ministry or agency in charge)
Ministry of Health, Labour and Welfare
(Definition, Scope)
Activities such as medical service except hospitalization, pre-
ventive care activities, and medical consultations, etc. from
among general practice specified in “HOSPITALS” listed under
Group Number 831 and “CLINICS OF MEDICAL PRACTI-
TIONERS” listed under Group Number 832 of the Japan Stand-
ard Industrial Classification.
Dentistry in hospitals and clinics of medical practitioners is
included in “Medical service (dentistry).” Services with Long-
Term Care Insurance are classified under “Nursing care (facility
services)” or “Nursing care (except facility services).”
(Given examples)
General practice (medical service except hospitalization (ex-
cluding dentistry))
(Notes)
Same as “6411-01, -001 Medical service (hospitalization)”
- 226 -

Column Code Row Code Sector Name
6411-03 6411-031 Medical service (dentistry)
(Ministry or agency in charge)
Ministry of Health, Labour and Welfare
(Definition, Scope)
The activities of dentistry and various dental exams as
specified in “HOSPITALS” listed under Group Number 831 and
“DENTAL CLINICS” listed under Group Number 833 of the
Japan Standard Industrial Classification.
Services with Long-Term Care Insurance are classified under
“Nursing care (facility services)” or “Nursing care (except facil-
ity services).”
(Given examples)
Dentistry
(Notes)
Same as “6411-01, -001 Medical service (hospitalization)”
Column Code Row Code Sector Name
6411-04 6411-041 Medical service (pharmacy dis-
pensing)
(Ministry or agency in charge)
Ministry of Health, Labour and Welfare
(Definition, Scope)
Pharmacy dispensing activities as specified in “Pharmacies”
listed under Industry Number 6033 of the Japan Standard Indus-
trial Classification.
Services with Long-Term Care Insurance are classified under
“Nursing care (facility services)” or “Nursing care (except facil-
ity services).”
(Given examples)
Pharmacy dispensing at pharmacies and dispensing pharmacies
(Notes)
Same as “6411-01, -001 Medical service (hospitalization)”
Column Code Row Code Sector Name
6411-05 6411-051 Medical service (miscellaneous
medical service)
(Ministry or agency in charge)
Ministry of Health, Labour and Welfare
(Definition, Scope)
The activities of “MATERNITY CLINICS AND NURSING”
listed under Group Number 834, “OTHER HEALTH PRACTI-
TIONERS” listed under Group Number 835, and “SERVICES
INCIDENTAL TO MEDICAL” listed under Group Number 836
of the Japan Standard Industrial Classification. Home nursing
services carried out by hospitals and clinics of medical practi-
tioners are included in this sector.
Services with Long-Term Care Insurance are classified under
“Nursing care (facility services)” or “Nursing cBare (except fa-
cility services).”
(Given examples)
Birth centers, home nursing stations, treatment places, eye
banks, bone marrow banks, sanitation inspection stations,
sterilization (of medical devices), clinical examinations, etc.
(Notes)
Same as “6411-01, -001 Medical service (hospitalization)”
Column Code Row Code Sector Name
6421-01 6421-011 Health and hygiene (public insti-
tution) **
(Ministry or agency in charge)
Ministry of Health, Labour and Welfare
(Definition, Scope)
The scope corresponds to the activities by the government and
local governments among those of “PUBLIC HEALTH
CENTERS” listed under Group Number 841, “HEALTH
CONSULTATION OFFICES” listed under Group Number 842,
and “OTHER PUBLIC HEALTH AND HYGIENE” listed under
Group Number 849 of the of the Japan Standard Industrial
Classification.
(Given examples)
Public health centers, health consultation offices, quarantine
(excluding animal and plants), medical-related examiners (para-
sites, water quality), meat inspection stations, dog control centers,
dog control offices
Column Code Row Code Sector Name
6421-02 6421-021 Health and hygiene
(Ministry or agency in charge)
Ministry of Health, Labour and Welfare
(Definition, Scope)
The scope corresponds to the activities by entities other than
the government and local governments among those of
“HEALTH CONSULTATION OFFICES” listed under Group
Number 842, and “OTHER PUPLIC HEALTH AND HYGIENE”
- 227 -

listed under Group Number 849 of the of the Japan Standard In-
dustrial Classification.
(Given examples)
Health consultation offices, medical-related examiners (para-
sites, water quality), meat inspection stations, sterilizer business
(articles, phones), dog control centers, dog control offices
Column Code Row Code Sector Name
6431-01 6431-011 Social insurance **
(Ministry or agency in charge)
Ministry of Health, Labour and Welfare
(Definition, Scope)
Activities related to social security funds conducted by “SO-
CIAL INSURANCE ORGANIZATIONS” listed under Group
Number 851 of the Japan Standard Industrial Classification
(Given examples)
Social insurance work, such as national pensions, employees'
pensions, mutual aid pensions, health insurance, long-term care
insurance, labor insurance, etc.
(Changes from the 2011 I-O Tables)
Services that do not fall under “social security funds” included
in this sector in the 2011 I-O Tables (national pension funds, Na-
tional Pension Fund Association, employees' pension funds, cor-
porate pension funds, Pension Fund Association, Farmers Pen-
sion Fund (except old pensions), Organization for Small & Me-
dium Enterprises and Regional Innovation (Small Enterprise
Mutual Relief account), Organization for Workers Retirement
Allowance Mutual Aid, etc.) are removed from this sector and
integrated into “5312-01, -011 Life insurance.”
(Notes)
(1) Activities for hygiene facilities (recreation centers, lodging
facilities) for the insured and their families by social insur-
ance business groups are included in “6711-01, -011 Hotels”
(2) “8313-01, -011 Social Insurance (public) **” and “8313-02,
-021 Social Insurance (private, non-profit) *” in the 2005 I-
O Tables were integrated into this sector in the 2011 I-O Ta-
bles.
Column Code Row Code Sector Name
6431-02 6431-021 Social welfare (public institu-
tion) **
(Ministry or agency in charge)
Ministry of Health, Labour and Welfare
(Definition, Scope)
Self-support facilities for children among “Miscellaneous
vocational and educational supporting facilities” listed under
Industry Number 8229, “WELFARE OFFICES” listed under
Group Number 852, “Miscellaneous child welfare services”
listed under Industry Number 8539, “WELFARE SERVICES
FOR THE AGED AND CARE SERVICES” listed under Group
Number 854, “WELFARE SERVICES FOR DISABLED
PERSONS” listed under Group Number 855, and social welfare
facility service activities and social welfare local service activities
by the national government and local public agencies specified in
“MISCELLANEOUS SOCIAL INSURANCE, SOCIAL
WELFARE AND CARE SERVICES” listed under Group Number
859 of the Japan Standard Industrial Classification.
The services with Long-Term Care Insurance are classified
under “Nursing care (facility services)” or “Nursing care (except
facility services).”
(Given examples)
Social welfare offices, child consultation centers, children’s
welfare facilities (children’s houses), children’s nursing care
facilities, self-support facilities for children, senior’s nursing
care home, senior’s inexpensive nursing home, senior’s welfare
centers, support facilities for the disabled, self-training offices
(Changes from the 2011 I-O Tables)
Day nurseries classified under this sector in the 2011 I-O-
Tables are removed from this sector and integrated in a new
sector “6431-05, 051 Nurseries.”
Column Code Row Code Sector Name
6431-03 6431-031 Social welfare (NPI) *
(Ministry or agency in charge)
Ministry of Health, Labour and Welfare
(Definition, Scope)
Self-support facilities for children among “Miscellaneous vo-
cational and educational support facilities” listed under Industry
Number 8229, “Miscellaneous child welfare services” listed un-
der Industrial Number 8539, “WELFARE SERVICES FOR THE
AGED AND CARE SERVICES” listed under Group Number
854, “WELFARE SERVICES FOR DISABLED PERSONS”
listed under Group Number 855, and social welfare facility ser-
vice activities and social welfare local service activities by social
welfare corporations specified in “MISCELLANEOUS SO-
CIAL INSURANCE, SOCIAL WELFARE AND CARE SER-
VICES” listed under Group Number 859 of the Japan Standard
Industrial Classification.
The services with Long-Term Care Insurance are classified
under “Nursing care (facility services)” or “Nursing care (except
- 228 -

facility services).”
(Given examples)
Children’s welfare facilities (children’s houses), children’s
nursing care facilities, self-support facilities for children, private
nursing homes, senior’s nursing care home, senior’s inexpensive
nursing home, senior’s welfare centers, support facilities for the
disabled, self-training offices, rehabilitation facilities
(Changes from the 2011 I-O Tables)
Day nurseries classified under this sector in the 2011 I-O- Ta-
bles are removed from this sector and integrated in a new sector
“6431-05, 051 Nurseries.”
Column Code Row Code Sector Name
6431-04 6431-041 Social welfare
(Ministry or agency in charge)
Ministry of Health, Labour and Welfare
(Definition, Scope)
The scope corresponds to social welfare facility service activ-
ities and social welfare regional service activities by corpora-
tions and individuals, from among those of “Miscellaneous child
welfare services” listed under Industrial Number 8539, “WEL-
FARE SERVICES FOR THE AGED AND CARE SERVICES”
listed under Group Number 854, “WELFARE SERVICES FOR
DISABLED PERSONS” listed under Group Number 855, and
“MISCELLANEOUS SOCIAL INSURANCE, SOCIAL WEL-
FARE AND CARE SERVICES” listed under Group Number
859 of the Japan Standard Industrial Classification.
The services with Long-Term Care Insurance are classified
under “Nursing care (facility services)” or “Nursing care (except
facility services).”
(Given examples)
Private nursing homes, care house, support facilities for the
disabled
(Changes from the 2011 I-O Tables)
Day nurseries classified under this sector in the 2011 I-O- Ta-
bles are removed from this sector and integrated in a new sector
“6431-05, 051 Nurseries.”
Column Code Row Code Sector Name
6431-05 6431-051 Nursery
(Ministry or agency in charge)
Ministry of Health, Labour and Welfare
(Definition, Scope)
Activities of “Day nursery” listed under Industry Number
8531
(Given examples)
Day nurseries, daycare centers for children, day-nursery-type
centers for early childhood education and care, and locally certi-
fied centers for early childhood education and care
(Changes from the 2011 I-O Tables)
Day nurseries classified under “6431-02, -021 Social welfare
(public) **,” “6431-03, -031 Social welfare (private, non-profit)
*” and “6431-04, -041 Social welfare (profit-making)” in the
2011 I-O Tables were removed from these sectors and included
in this new sector.
Column Code Row Code Sector Name
6441-01 6441-011 Nursing care (facility services)
(Ministry or agency in charge)
Ministry of Health, Labour and Welfare
(Definition, Scope)
The activities of facility services based on Long-Term Care
Insurance, from among “HOSPITALS” listed under Group
Number 831, “CLINICS OF MEDICAL PRACTITIONERS”
listed under Group Number 832, “DENTAL CLINICS” listed
under Group Number 833, “Nursing” listed under Industry Num-
ber 8342, “OTHER HEALTH PRACTITIONERS” listed under
Group Number 835, and “WELFARE SERVICES FOR THE
AGED AND CARE SERVICES” listed under Group Number
854 of the Japan Standard Industrial Classification.
(Given examples)
Welfare facilities for the elderly requiring long-term care
(special nursing home for the elderly), Health care facilities for
the elderly requiring long-term care, Sanatorium type medical
care facilities for the elderly requiring care
Column Code Row Code Sector Name
6441-02 6441-021 Nursing care (except facility ser-
vices)
(Ministry or agency in charge)
Ministry of Health, Labour and Welfare
(Definition, Scope)
The activities exclusive of facility services based on Long-
Term Care Insurance, from among “HOSPITALS” listed under
Group Number 831, “CLINICS OF MEDICAL PRACTITION-
ERS” listed under Group Number 832, “DENTAL CLINICS”
listed under Group Number 833, “Nursing” listed under Industry
Number 8342, “OTHER HEALTH PRACTITIONERS” listed
under Group Number 835, and “WELFARE SERVICES FOR
- 229 -

THE AGED AND CARE SERVICES” listed under Group Num-
ber 854 of the Japan Standard Industrial Classification.
(Given examples)
In-home services, community-based services, preventive care
services, community-based preventive care services
(Notes)
“In-home services” include home-visit care, home nursing,
outpatient care, short-stay services, etc.; “community-based ser-
vices” include small multi-care facilities, home-visit at night for
long-term care, outpatient long-term care for a dementia patient,
etc.; “preventative care services” include outpatient preventative
long-term care, outpatient rehabilitation for preventative long-
term care, home-visit service for preventative long-term care,
etc.; “community-based preventive care services” include multi-
functional preventive long-term care in a small group home, pre-
ventive long-term care for a dementia patient in communal living,
etc.
65 Membership-based associations n.e.c.
Column Code Row Code Sector Name
6599-01 6599-011 Membership-based business as-
sociations
(Ministry or agency in charge)
Cabinet Office
(Definition, Scope)
Not-for-profit activities conducted by “AGRICULTURE,
FORESTRY AND FISHERIES COOPERATIVE
ASSOCIATIONS, N.E.C.” listed under Group Number 871,
“BUSINESS COOPERATIVE ASSOCIATIONS, N.E.C.” listed
under Group Number 872, and “BUSINESS AND
PROFESSIONAL ORGANIZATIONS” listed under Group
Number 931 of the Japan Standard Industrial Classification.
Among the activities specified in “AGRICULTURE, FOR-
ESTRY AND FISHERIES COOPERATIVE ASSOCIATIONS,
N.E.C.” listed under Group Number 871 and “BUSINESS CO-
OPERATIVE ASSOCIATIONS, N.E.C.” listed under Group
Number 872 of the Japan Standard Industrial Classification, ac-
tivities for the purpose of commercial gain, such as buying and
selling, are included in the activities sector for wholesale and re-
tail trade, and are not included in this sector.
(Given examples)
Cooperative association of fabrics, Chamber of commerce and
industry, Japan Business Federation, Life Insurance Association,
Japanese Bankers Association, Japan Federation of Certified
Public Tax Accountants' Associations, National Federation of
Small Business Associations, National Chamber of Agriculture
Column Code Row Code Sector Name
6599-02 6599-021 Private non-profit institutions
serving households, n.e.c. *
(Ministry or agency in charge)
Cabinet Office
(Definition, Scope)
The scope corresponds to the activities of “RELIGION” listed
under Major Group Number 94, “LABOR ORGANIZATIONS”
listed under Group Number 932, “NON-PROFIT CULTURAL,
SCIENCE AND ART ORGANIZATIONS” under Group Num-
ber 933, “POLITICAL ORGANIZATIONS” listed under Group
Number 934, “NON-PROFIT ORGANIZATIONS, N.E.C.”
listed under Group Number 939, and “MEETING HALLS”
listed under Group Number 951 of the Japan Standard Industrial
Classification. The sector includes the activities of non-profit
- 230 -
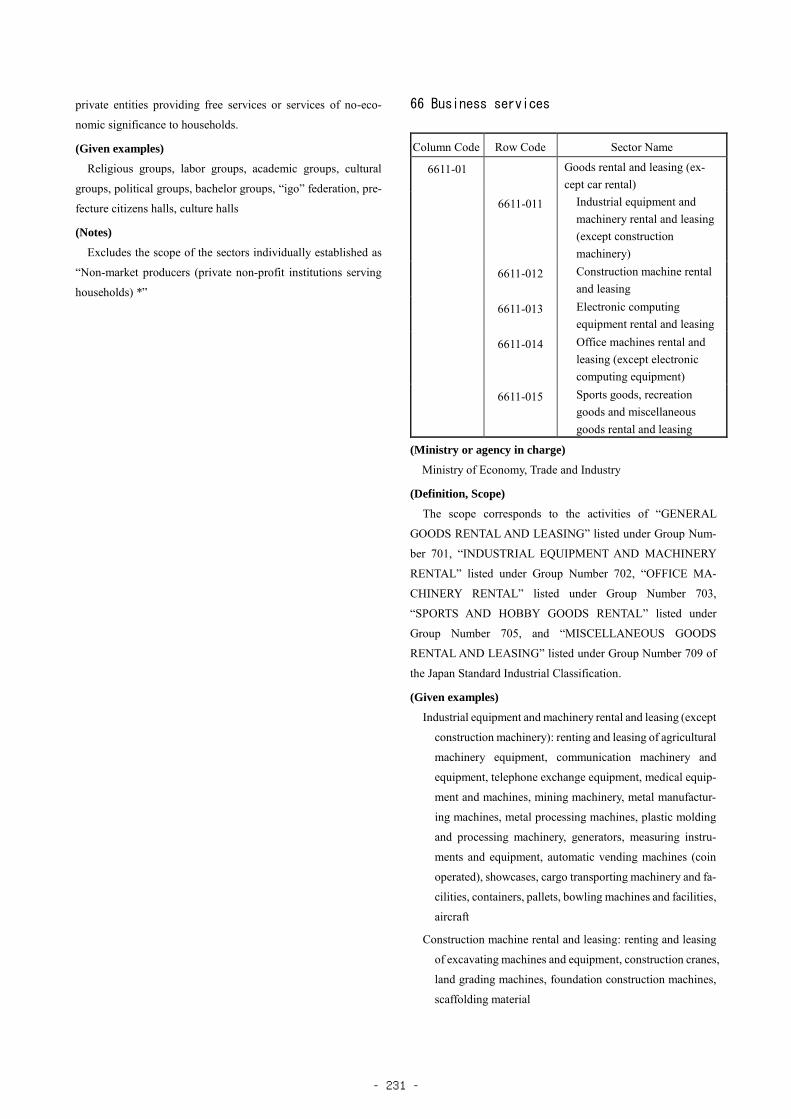
private entities providing free services or services of no-eco-
nomic significance to households.
(Given examples)
Religious groups, labor groups, academic groups, cultural
groups, political groups, bachelor groups, “igo” federation, pre-
fecture citizens halls, culture halls
(Notes)
Excludes the scope of the sectors individually established as
“Non-market producers (private non-profit institutions serving
households) *”
66 Business services
Column Code Row Code Sector Name
6611-01 Goods rental and leasing (ex-
cept car rental)
6611-011 Industrial equipment and
machinery rental and leasing
(except construction
machinery)
6611-012 Construction machine rental
and leasing
6611-013 Electronic computing
equipment rental and leasing
6611-014 Office machines rental and
leasing (except electronic
computing equipment)
6611-015 Sports goods, recreation
goods and miscellaneous
goods rental and leasing
(Ministry or agency in charge)
Ministry of Economy, Trade and Industry
(Definition, Scope)
The scope corresponds to the activities of “GENERAL
GOODS RENTAL AND LEASING” listed under Group Num-
ber 701, “INDUSTRIAL EQUIPMENT AND MACHINERY
RENTAL” listed under Group Number 702, “OFFICE MA-
CHINERY RENTAL” listed under Group Number 703,
“SPORTS AND HOBBY GOODS RENTAL” listed under
Group Number 705, and “MISCELLANEOUS GOODS
RENTAL AND LEASING” listed under Group Number 709 of
the Japan Standard Industrial Classification.
(Given examples)
Industrial equipment and machinery rental and leasing (except
construction machinery): renting and leasing of agricultural
machinery equipment, communication machinery and
equipment, telephone exchange equipment, medical equip-
ment and machines, mining machinery, metal manufactur-
ing machines, metal processing machines, plastic molding
and processing machinery, generators, measuring instru-
ments and equipment, automatic vending machines (coin
operated), showcases, cargo transporting machinery and fa-
cilities, containers, pallets, bowling machines and facilities,
aircraft
Construction machine rental and leasing: renting and leasing
of excavating machines and equipment, construction cranes,
land grading machines, foundation construction machines,
scaffolding material
- 231 -

Electronic computing equipment rental and leasing: renting
and leasing of electronic computers, computer-related
equipment, personal computers
Office machines rental and leasing (except electronic compu-
ting equipment): renting and leasing of office machines and
equipment, copying machines, cash registers, filing sys-
tem-related equipment, time recorders
Sports goods, recreation goods and miscellaneous goods
rental and leasing: renting and leasing of sporting goods,
skiing goods, skating goods, bicycles, athletic meeting gear,
tents, yachts, motor boats, horses, cine-film and theater
play related tools and devices, cine-film projectors, cine-
films, music and video recording media (CDs, DVDs, BDs,
etc.), costumes and apparels, boutiques, TVs, books, musi-
cal instruments, art goods, bed clothing, live plant, flower
wreaths, pianos, medical welfare equipment
(Notes)
Activities of “GENERAL GOODS RENTAL AND LEAS-
ING” listed under Group Number 701 of the Japan Standard In-
dustrial Classification are separately included in the activities of
corresponding renting and leasing business by goods.
The renting of welfare equipment in nurse insurance are out-
putted from this sector via “6441-02 Nursing care (except facil-
ity services)”
Column Code Row Code Sector Name
6612-01 6612-011 Car rental and leasing
(Ministry or agency in charge)
Ministry of Land, Infrastructure, Transport and Tourism
(Definition, Scope)
The scope corresponds to the activities of “AUTOMOBILE
RENTAL” listed under Group Number 704 of the Japan Stand-
ard Industrial Classification.
(Given examples)
Rent-a-car business, automobile leasing business
Column Code Row Code Sector Name
6621-01 Advertising services
6621-011 Television and radio
advertising services
6621-012 Newspaper, magazine and
miscellaneous advertising
services
(Ministry or agency in charge)
Ministry of Economy, Trade and Industry
(Definition, Scope)
The scope corresponds to the activities of “ADVERTISING”
listed under Group Number 731 of the Japan Standard Industrial
Classification.
Further, advertising activities conducted by other industrial
sectors (private broadcasting, newspapers and magazines)
providing advertising media are included in this sector.
(Given examples)
Newspaper, magazine and miscellaneous advertising ser-
vices: newspaper advertisement, magazine advertisement, direct
mailing advertisement, outdoor advertisement, traffic advertise-
ment, insertion advertisement
Column Code Row Code Sector Name
6631-10 6631-101 Motor vehicle maintenance ser-
vices
(Ministry or agency in charge)
Ministry of Land, Infrastructure, Transport and Tourism
(Definition, Scope)
The scope corresponds to maintenance, repair and recycling
activities of “AUTOMOBILE MAINTENANCE SERVICES”
listed under Major Group Number 891 of the Japan Standard In-
dustrial Classification.
(Given examples)
Maintenance, repair, inspection, and registration of automo-
biles
(Changes from the 2011 I-O Tables)
Activities for the “accounts for motor vehicle inspection and
registration” in “special account for safety of motor vehicles” are
included in this sector.
(Notes)
(1) Maintenance activities of motor bicycles and motor tricy-
cles are included in this sector.
(2) Recycling business of automobile tires shall be included
in “2221-01, -011 Tires and inner tubes”
(3) Automobile inspection activities conducted by the Na-
tional Agency of Vehicle Inspection shall be included in this
sector.
Column Code Row Code Sector Name
6632-10 6632-101 Machine repair services
(Ministry or agency in charge)
Ministry of Economy, Trade and Industry
(Definition, Scope)
- 232 -

The activities specified in “MACHINE REPAIR SHOPS,
EXCEPT ELECTRICAL MACHINERY, APPARATUS,
APPLIANCES AND SUPPLIES” listed under Group Number
901 exclusive of aircraft maintenance conducted at airports, etc.
and the activities specified in “ELECTRICAL MACHINERY,
APPARATUS, APPLIANCES AND SUPPLIES REPAIR SHOP”
listed under Group Number 902 of the Japan Standard Industrial
Classification.
(Given examples)
General machine repairs, construction machinery and mining
machine repairs, electric machine repairs, industrial transporta-
tion vehicle repairs, optical equipment repairs
(Notes)
The activities of aircraft maintenance conducted at airports,
etc. are included in “3592-10, -101 Repair of aircrafts.”
Column Code Row Code Sector Name
6699-01 6699-011 Judicial, financial and account-
ing services
(Ministry or agency in charge)
Ministry of Finance
(Definition, Scope)
The scope corresponds to the activities of “LAWYERS’ AND
PATENT ATTORNEYS’ OFFICES” listed under Group Number
721, “Notaries public’s and judicial scriveners’ offices’ offices
listed under Industry Number 7221, and “CERTIFIED PUBLIC
ACCOUNTANTS’ AND AUDITORS’ OFFICES” listed under
Group Number 724 of the Group Number of the Japan Standard
Industrial Classification.
(Given examples)
Legal offices, patent attorney offices, notary public, judicial
scrivener office, public certified accountant office, tax consult-
ant office
Column Code Row Code Sector Name
6699-02 6699-021 Civil engineering and construc-
tion services
(Ministry or agency in charge)
Ministry of Land, Infrastructure, Transport and Tourism
(Definition, Scope)
The scope corresponds to the activities of “ENGINEERING
AND ARCHITECTURAL SERVICES” listed under Group
Number 742 of the Japan Standard Industrial Classification.
(Given examples)
Engineering supervisory services, architectural design and en-
gineering services, architectural consultant, land measurement
services, geological survey services
Column Code Row Code Sector Name
6699-03 6699-031 Worker dispatching services
(Ministry or agency in charge)
Ministry of Health, Labour and Welfare
(Definition, Scope)
The scope corresponds to the activities of “WORKER DIS-
PATCHING SERVICES” listed under Group Number 912 of the
Japan Standard Industrial Classification.
(Notes)
No provision of worker dispatch is possible for the following
services.
(1) Port transport services
(2) Construction works
(3) Security services
(4) Medical related services at hospitals (partially excepted)
Since administrative and ancillary economic activities at
headquarters, etc. are included in each sector and counted in In-
put-Output Tables, even in sectors that are closely related to (1)
to (4) above, worker dispatching services may be input in work
such as clerical work, etc.
Column Code Row Code Sector Name
6699-04 6699-041 Building maintenance services
(Ministry or agency in charge)
Ministry of Health, Labour and Welfare
(Definition, Scope)
The scope corresponds to the activities of “BUILDING
MAINTENANCE SERVICES” listed under Group Number 922
of the Japan Standard Industrial Classification.
(Given examples)
Building service business, building maintenance service, floor
polishing service, window glass cleaning service, chimney
cleaning service, sterilizer service, housing disinfect service,
building cleaning service, building drinking water management
services, building cleaning services, building drain cleaning ser-
vices
(Notes)
Sterilizer services for railways and vessels are included in this
sector
- 233 -

Column Code Row Code Sector Name
6699-05 6699-051 Guard services
(Ministry or agency in charge)
Ministry of Economy, Trade and Industry
(Definition, Scope)
The scope corresponds to the activities of “GUARD SER-
VICES” listed under Group Number 923 of the Japan Standard
Industrial Classification.
(Given examples)
Guarding of facilities: Guard services for facilities, patrol
guard services, security guard services, guard services for
airport security, machine guard services
Guarding of crowds: Guard services for traffic guidance,
guard services for crowds
Guarding of transport: Guard services for transport of valua-
bles, guard services for transport of hazardous materials
such as nuclear fuel
Personal guard services
Column Code Row Code Sector Name
6699-09 6699-099 Miscellaneous business services
(Ministry or agency in charge)
Ministry of Economy, Trade and Industry
(Definition, Scope)
The activities of “Land and house surveyors’ offices” listed
under Industry Number 7222, “ADMINISTRATIVE
SCRIVENERS’ OFFICES” listed under Group Number 723,
“CERTIFIED SOCIAL INSURANCE AND LABOR
CONSULTANTS’ OFFICES” listed under Group Number 725,
“DESIGN SERVICES” listed under Group Number 726,
“Business consultants” listed under Industry Number 7281,
“MISCELLANEOUS PROFESSIONAL SERVICES” listed
under Group Number 729, “MECHANICAL DESIGN
SERVICES” listed under Group Number 743, “COMMODITY
INSPECTION AND NON-DESTRUCTIVE TESTING
SERVICES” listed under Group Number 744, “SURVEYOR
CERTIFICATION” listed under Group Number 745,
“MISCELLANEOUS TECHNICAL SERVICES” listed under
Group Number 749, “EMPLOYMENT SERVICES” listed
under Group Number 911, “STENOGRAPHIC, ENTRÉE
DOCUMENT AND DUPLICATING SERVICES” listed under
Group Number 921, and “BUSINESS SERVICES, N.E.C.”
listed under Group Number 929 of the Japan Standard Industrial
Classification. The activities of National Center for University
Entrance Examinations, and activities exclusive of the resource
storage business conducted by the Japan Oil, Gas and Metals
National Corporation are included.
(Given examples)
Stenographer, address writer, copying service, micro-filming
service, commodity inspection service, silk inspection office,
mass measurement certifying services, environmental
measurement services, metal and mineral analysis services,
private job introduction services, display related services,
industrial facility cleaning services, call centers, non-destructive
inspection services, plant engineering services, party
entertaining services, tow truck services, LPG filling services,
hot spring water supply services, designing services,
management consultancy services, machine engineering
services, administrative scriveners, real estate assessment
services, land and building surveyors, presides, interpreters,
detective agencies, credit survey agencies
(Notes)
The resource storage business conducted by the Japan Oil,
Gas and Metals National Corporation is included in “6111-01, -
011 Public administration (central) **.”
- 234 -

67 Personal services
Column Code Row Code Sector Name
6711-01 6711-011 Hotels
(Ministry or agency in charge)
Ministry of Health, Labour and Welfare
(Definition, Scope)
The scope corresponds to the lodging activities except for
company dormitories and student dormitories among those of
“HOTELS” listed under Group Number 751, “COMMON
LODGING HOUSES” listed under Group Number 752,
“BOARDING HOUSES” listed under Group Number 753, and
“MISCELLANEOUS LODGING PLACES” listed under Group
Number 759 of the Japan Standard Industrial Classification.
(Given examples)
Hotels, inns, national lodging facilities, motels, common lodg-
ing facilities, bed houses, mountain cottages, boarding houses,
membership lodging facilities, mutual aid operated lodging fa-
cilities, recreational lodging houses, youth-hostels, resort club,
common lodging houses
(Notes)
(1) Souvenir shops located in inns and hotels are not included
in this sector, but included in “5112-01, -011 Retail trade”
(2) Company dormitories, bachelor’s housings and student
dormitories among the sector of “Lodging places, n.e.c.”
under 7599 of the Industry Number of the Japan Standard
Industrial Classification shall be included in “5531-01, -011
House rent (imputed house rent)”
(3) Eating and drinking services that are included in accom-
modations services and provided are included in this sector.
(4) “Resort clubs” specified in Industry Number 7592 of the
Japan Standard Industrial Classification are included in this
sector.
Column Code Row Code Sector Name
6721-01 6721-011 Eating and drinking places
(Ministry or agency in charge)
Ministry of Agriculture, Forestry and Fisheries
(Definition, Scope)
The scope corresponds to the activities of “EATING AND
DRINKING PLACES” listed under Major Group Number 76 of
the Japan Standard Industrial Classification
(Given examples)
Cafeterias, restaurant, specialty restaurants, Japanese noodle
(“Soba” and “Udon”) restaurants, Sushi bars, drinking bars, beer
halls, bars, cabaret, night clubs, Coffee shops, hamburger shop
(Changes from the 2011 Tables)
“Eating and drinking places” classified under “6721-01, -011
Eating and drinking services” in the 2011 I-O Tables are inte-
grated into this sector.
(Notes)
Food takeout and delivery services classified under “8612-01,
-011 General eating and drinking places (except coffee shops),”
“8612-02, -021 Coffee shops,” “8612-03, -031 Eating and drink-
ing places for pleasure” and “6112-01, -011 Retail trade” in the
2005 I-O Tables were integrated into “6721-01, -011 Eating and
drinking services” in the 2011 I-O Tables.
Column Code Row Code Sector Name
6721-02 6721-021 Food takeout and delivery ser-
vices
(Ministry or agency in charge)
Ministry of Agriculture, Forestry and Fisheries
(Definition, Scope)
“FOOD TAKE OUT AND DELIVERY SERVICES” listed
under Major Group Number 77 of the Japan Standard Industrial
Classification
(Given examples)
Food takeout and delivery services
(Changes from the 2011 Tables)
“Food takeout and delivery services” classified under “6721-
01, -011 Eating and drinking services” in the 2011 I-O Tables are
integrated into this sector.
(Notes)
Food takeout and delivery services classified under “8612-01,
-011 General eating and drinking places (except coffee shops),”
“8612-02, -021 Coffee shops,” “8612-03, -031 Eating and drink-
ing places for pleasure” and “6112-01, -011 Retail trade” in the
2005 I-O Tables were integrated into “6721-01, -011 Eating and
drinking services” in the 2011 I-O Tables.
Column Code Row Code Sector Name
6731-01 6731-011 Cleaning
(Ministry or agency in charge)
Ministry of Health, Labour and Welfare
(Definition, Scope)
The scope corresponds to the activities of “LAUNDRIES”
listed under Group Number 781of the Japan Standard Industrial
Classification.
- 235 -

(Given examples)
Laundries, Cleaning services, laundry services, cleaning
factories, intermediate for laundry services, intermediate for
cleaning services, linen-supply services, rental diaper services,
rental towel services, rental floorcloth services, rental mop
services
Column Code Row Code Sector Name
6731-02 6731-021 Barber shops
(Ministry or agency in charge)
Ministry of Health, Labour and Welfare
(Definition, Scope)
The scope corresponds to the activities of “BARBERSHOPS”
listed under Group Number 782 of the Japan Standard Industrial
Classification.
(Given examples)
Barber shops
Column Code Row Code Sector Name
6731-03 6731-031 Beauty shops
(Ministry or agency in charge)
Ministry of Health, Labour and Welfare
(Definition, Scope)
The scope corresponds to the activities of “HAIR-DRESSING
AND BEAUTY SALON” listed under Group Number 783 of the
Japan Standard Industrial Classification.
(Given examples)
Beauty parlors, beauty salon
Column Code Row Code Sector Name
6731-04 6731-041 Public baths
(Ministry or agency in charge)
Ministry of Health, Labour and Welfare
(Definition, Scope)
The scope corresponds to the activities of “PUBLIC BATH-
HOUSES” listed under Group Number 784 and “MISCELLANE-
OUS PUBLIC BATHHOUSES” listed under Group Number 785
of the Japan Standard Industrial Classification.
(Given examples)
Public baths, hot-spring baths, steam baths, sand baths, saunas,
spas, mineral spring baths, health spas, deluxe public baths
(Notes)
Health centers shall be included in “6741-09, -099 Miscella-
neous amusement and recreation services”
Column Code Row Code Sector Name
6731-09 6731-099 Miscellaneous cleaning, barber
shops, beauty shops and public
baths
(Ministry or agency in charge)
Ministry of Health, Labour and Welfare
(Definition, Scope)
The scope corresponds to the activities of “MISCELLANE-
OUS LAUNDRY, BEAUTY AND BATH SERVICES” listed un-
der Group Number 789 of the Japan Standard Industrial Classifi-
cation.
(Given examples)
Fulling plants, dyeing plants, aesthetic salons, coin-operated
showers, laundromats, nail salons, massage brothel
(Notes)
Massage brothels, which were included in “8614-04, -041
Public baths” in the 2005 I-O Tables, were integrated into this
sector in the 2011 I-O Tables.
Column Code Row Code Sector Name
6741-01 6741-011 Movie theaters
(Ministry or agency in charge)
Ministry of Health, Labour and Welfare
(Definition, Scope)
The scope corresponds to the activities of “CINEMAS” listed
under Group Number 801 of the Japan Standard Industrial Clas-
sification.
(Given examples)
Movie halls, movie theaters, outdoor movie theaters, movie
theater rental and leasing services, mini theater, video theater
Column Code Row Code Sector Name
6741-02 6741-021 Performances (except movie
theaters), theatrical comranies
(Ministry or agency in charge)
Cabinet Office
(Definition, Scope)
The scope corresponds to the activities of “PERFOMANCES
(EXCEPT OTHERWISE CLAASIFIED), THEATRICAL
COMRANIES” listed under Group Number 802 of the Japan
Standard Industrial Classification. Such activities as following
- 236 -

are included in the scope: entertainment providers of plays, ar-
tistic shows, music, public shows, and entertaining sports per-
formed by themselves or on contract.
(Given examples)
Theaters, orchestra attached to theaters, musical performer
groups, musical dancing team groups, comical theaters, “sumo”
rings, boxing rings, ballparks (for professional baseball games),
theater play performer group, arts production business, music
performer group, professional baseball players group, profes-
sional wrestling performer group
Column Code Row Code Sector Name
6741-03 6741-031 Stadiums and companies of bi-
cycle, horse, motorcar and mo-
torboat races
(Ministry or agency in charge)
Cabinet Office
(Definition, Scope)
The scope corresponds to the activities of “BYCYCLE,
HORSE, MOTORCAR AND MOTORBOAT RACE TRACK
OPERATIONS AND COMPANIES” listed under Group Num-
ber 803 of the Japan Standard Industrial Classification.
(Given examples)
Bicycle race track operations, horse race track operations, mo-
torboat race track operations, motorcar race track operations, bi-
cycle race companies, horse race companies.
Column Code Row Code Sector Name
6741-04 6741-041 Sport facility service, public gar-
dens and amusement parks
(Ministry or agency in charge)
Cabinet Office
(Definition, Scope)
The scope corresponds to the activities of “SPORTS FACILI-
TIES” listed under Group Number 804, and “PUBLIC GAR-
DENS AND AMUSEMENT PARKS” listed under Group Num-
ber 805 of the Japan Standard Industrial Classification.
(Given examples)
Gymnasium, golf courses, golf driving ranges, bowling alleys,
tennis clubs, baseball and tennis batting ranges, fitness centers,
swimming pools, ice-skating arena, public gardens, amusement
parks, theme parks
(Notes)
Fitness centers, which were included in “8619-04, -041 Sup-
plementary tutorial schools, instruction services for arts, culture
and technical skills” in the 2005 I-O Tables, are integrated into
this sector in the 2011 I-O Tables.
Column Code Row Code Sector Name
6741-05 6741-051 Amusement and recreation fa-
cilities
(Ministry or agency in charge)
Cabinet Office
(Definition, Scope)
The scope corresponds to the activities of “AMUSEMENT
AND RECREATION FACILITIES” listed under Group Number
806 of the Japan Standard Industrial Classification. This sector
includes activities that offer amusement to the public.
(Given examples)
Billiard rooms, “go” and Japanese chess parlors, “mah-jong”
parlors, “pachinko” parlors, game centers, slot machine game
parlors, bingo-game parlors, toy-gun shooting halls
Column Code Row Code Sector Name
6741-09 6741-099 Miscellaneous amusement and
recreation services
(Ministry or agency in charge)
Cabinet Office
(Definition, Scope)
The scope corresponds to the activities of “MISCELLANE-
OUS AMUSEMENT AND RECREATION SERVICES” listed
under Group Number 809, and “AUTHORS AND ARTISTS”
listed under Group Number 727 of the Japan Standard Industrial
Classification. Activities of associated amusement-related ser-
vices that are not elsewhere classified such as theater ticket
agency, and of creation of artistic literature are included in this
sector.
(Given examples)
Dance halls, marinas, recreational fishing guide business, gei-
sha houses, “karaoke” boxes, theater ticket agency, off-track bet-
ting horse race ticket offices, off-track betting bicycle race ticket
office, fishing pond services, writers, artists
Column Code Row Code Sector Name
6799-01 6799-011 Photographic studios
(Ministry or agency in charge)
Cabinet Office
(Definition, Scope)
The scope corresponds to the activities of “PHOTOGRAPHIC
- 237 -

STUDIOS” listed under Group Number 746 of the Japan Stand-
ard Industrial Classification.
This sector covers the photographic activities with the other
industry sectors activities such as Advertising services and Pub-
lication.
(Given examples)
Photographic services, photographic studios, commercial
photographic services
Column Code Row Code Sector Name
6799-02 6799-021 Ceremonial occasions
(Ministry or agency in charge)
Ministry of Health, Labour and Welfare
(Definition, Scope)
The scope corresponds to the activities of “CREMATORIES
AND GRAVEYARD CUSTODIANS” listed under Group Num-
ber 795 and “CEREMONIAL OCCASIONS” listed under
Group Number 796 of the Japan Standard Industrial Classifica-
tion.
(Given examples)
Funeral service providers, funeral ceremonial halls, graveyard
custodians, mutual aid ceremonial cervices, wedding halls
(Notes)
The activities to carry the dead by hearse is included in “5722-
01, -011 Road freight transport (except self-transport)”
Column Code Row Code Sector Name
6799-03 6799-031 Supplementary tutorial schools,
instruction services for arts, cul-
ture and technical skills
(Ministry or agency in charge)
Cabinet Office
(Definition, Scope)
The scope corresponds to the activities of “SUPPLEMEN-
TARY TUTORIAL SCHOOLS” listed under Group Number 823
and “INSTRUCTION SERVICES FOR ARTS, CULTURE
AND TECHNICALS” listed under Group Number 824 of the
Japan Standard Industrial Classification.
(Given examples)
Preparatory learning classes (not classified as schools), music
instructions, calligraphy instructions, flower arrangement and
tea ceremony instructions, abacus instructions, foreign language
instructions, sports and health instructions, other instructional
services for arts, culture and technical skills
(Notes)
Following the revision of the Japan Standard Industrial Clas-
sification, fitness clubs, which were included in this sector in the
2005 I-O Tables, were integrated into “6741-04, -041 Sport fa-
cility service, public gardens and amusement parks” in the 2011
I-O Tables.
Column Code Row Code Sector Name
6799-04 6799-041 Miscellaneous repairs, n.e.c.
(Ministry or agency in charge)
Cabinet Office
(Definition, Scope)
The scope corresponds to the activities of “PAPER HANG-
ERS” listed under Group Number 903 and “MISCELLANEOUS
REPAIR SERVICES” listed under Group Number 909 of the Ja-
pan Standard Industrial Classification.
The activities are primarily intended for final demands, and
furniture repairing and blacksmith services are included.
(Given examples)
Paper hangers, furniture repair shops, watch and clock repair
shops, shoe repair shops, blacksmith shops, musical instruments
repair shops, bicycle repair shops
(Notes)
(1) Industrial repairs such as machinery repairs, ship repairs,
railway cart repairs, and aircraft repairs shall be included in
the corresponding industry sector.
(2) The item of “bicycle tire repairs” shall be included in
“6631-10, -101 Motor vehicle maintenance services”
(3) Clothes repairs shall be included in “6799-09, -099 Mis-
cellaneous personal services”
Column Code Row Code Sector Name
6799-09 6799-099 Miscellaneous personal services
(Ministry or agency in charge)
Cabinet Office
(Definition, Scope)
The scope corresponds to the activities of “GARDENING
SERVICES” listed under Group Number 014, “DOMESTIC
SERVICES” listed under Group Number 792, “GARMENT
SEWING SERVICES AND REPAIRS” listed under Group
Number 793, “CHECKROOMS, SAFETY DEPOSIT SER-
VICES” listed under Group Number 794, and “LIVING-RE-
LATED AND PERSONAL SERVICES, N.E.C.” listed under
- 238 -

Group Number 799 of the Japan Standard Industrial Classifica-
tion.
(Given examples)
Professional landscaping services, garden plants mainte-
nance services, domestic services, garments repair services, lug-
gage deposit services, bicycle deposit services, food processing
services, used cotton recycling services, matrimonial agency,
photographic development and printing services, tourist guide
services (guides), lottery ticket sales
68 Office supplies
Column Code Row Code Sector Name
6811-00P 6811-000P Office supplies
(Ministry or agency in charge)
Ministry of Economy, Trade and Industry
(Definition, Scope)
The number of articles are so many that fall in the category of
office supplies. Their composition will not necessarily change
drastically according to production activities, and therefore,
these items are collectively included in this sector as a dummy
sector from analysis viewpoints.
The scope of office supplies sector corresponds to those sup-
plies that individual industry will input as office supplies gener-
ally and commonly, and that are included in “Stationery, paper
products, stationery and photographic supplies” under 93 of the
Major Group Number of the Standard Commodity Classification
for Japan excluding parts and components.
Further, electronic desktop calculators (except programmable
type), printing papers and scissors are not included in Commod-
ity Classification Number 93, but shall be included in this sector.
(Given examples)
Paper filing threads, copying papers, sequential slip note-
books, hardboard papers, carbon copy papers, accounting note-
books, accounting slips, envelops, spread sheets, filing supplies,
photo films, photo printing papers, office starch, tapes, strings,
erasers, chalks, scissors, electronic desktop calculators, writing
tools, stamp pads, seal stamp pad, staplers, hole punchers, paper
clips, semiconductor memory media
- 239 -

69 Activities not elsewhere classified
Column Code Row Code Sector Name
6911-00 6911-000 Activities not elsewhere classi-
fied
(Ministry or agency in charge)
Ministry of Internal affairs and Communications
(Definition, Scope)
The scope corresponds to the production activities of goods
and services that are not elsewhere classified.
Further, this sector serves the purpose of booking accumulated
errors in estimation of columns and rows sectors.
(Notes)
For residual errors in counting the row and column sectors,
both the residual error of endogenous sectors and residual error
of exogenous sectors are included. In Input-Output Tables of Ja-
pan, this sector is oriented as an endogenous sector, and disa-
greement between the row total and column total of this sector,
or in other words, the final overall error is balanced at the point
of intersection of “9211-000 Operating surplus” and “6911-00
Activities not elsewhere classified,” and also plays the role of
adjusting dual equivalence of national income.
§2 Final Demand Sectors
Column Code Row Code Sector Name
7111-00 Consumption expenditure out-
side households (column)
(Ministry or agency in charge)
Cabinet Office
(Definition, Scope)
The scope corresponds to so-called “enterprise expenditures”
that are similar to consumption expenditures of household in-
cluding expense account and entertainment expenses that are
paid by companies or other entities.
For details, refer to the explanation given in row sectors 7110-
001 through 7110-003 of Gross Value Added Sector.
(Changes from the 2011 I-O Tables)
Recreational and sports-related expenses included in this
sector in the 2011 I-O Tables are integrated into “7211-00
Consumption expenditures of households.”
(Notes)
This sector indicates the contents of goods and services relat-
ing to expenditures of the sectors “7111-001 Lodging expenses
and daily allowances”, “7111-002 Social expenses” and “7111-
003 Welfare expenses”.
Column Code Row Code Sector Name
7211-00 Consumption expenditure of
households
(Ministry or agency in charge)
Cabinet Office
(Definition, Scope)
(1) The expenditure represents the amount of expenditure for
households (consumers except private enterprises)
goods and services, deducted by the amount of sales of sim-
ilar kinds (used articles and scrap), then added by net in-
crease of gifts-in-kind received from overseas, and further
added by residents’ expenditure in overseas. The consump-
tion expenditures referred to herein represent all expendi-
tures except for those spent on land, house building and
construction buildings. The whole of purchase amount of
goods including the amount of unused goods be recorded
consumption expenditures.
(2) There are two concepts about consumption expenditures
for household in national accounts calculation; one is “res-
idents’ household and non-residents’ household consump-
tion in domestic market” (DOMESTIC concept); and the
- 240 -

other is “consumption of residents’ household both in do-
mestic market and in overseas” (NATION concept.) In the
I-O Tables, this sector is expressed in “NATION concept”.
And residents’ household consumption in overseas and
non-residents’ household consumption in domestic market
are shown in a separate column of “9412-00 (less) Imports
(direct purchase)” and “9212-00 Exports (direct purchase)”
respectively. This way of presentation has the following
benefits.
1 Both concepts regarding household consumption make
available in the national accounting.
2 The I-O Tables as a whole can be convertible to “DOM-
STIC concept” basis. Further, refer to “8412-00 (less) Im-
ports (direct purchase)”and “8012-00 Exports (direct pur-
chase)” for the conversion.
(3) Overseas gifts-in-kind (gifts that an individual receives
from overseas) and overseas consumption expenditure
(residents’ consumption of goods and services in overseas)
shall once be recorded in import columns, and then trans-
ferred to demand side column, consumption expenditure of
household.
(4) Transactions of used goods are divided in a transaction
within the household sector, and a transaction between sec-
tors such as capital formation or non-market producer (gen-
eral government).
In former case, trade amount of used goods is cancelled
out, and only related trade margin and freight cost are rec-
orded. In latter case, however, trade amount from a house-
hold is recorded as negative consumption expenditure of
household. On the contrary, purchase amount of used goods
that a household purchases from other sector shall be recog-
nized as consumption expenditure of the household sector,
and the same shall be recognized of its sales amount as neg-
ative expenditure of the selling sector.
(5) For medical services and care services, the amount shared
by a household shall be recorded.
(6) Benefit-in-kind (commuting allowance) shall be included
in consumption expenditure of households. Therefore,
served meals arranged by enterprises and the Self Defense
Force shall be treated as consumption directly by house-
hold. Further, served meals by jails shall be treated as gov-
ernment consumption of materials for food and beverage,
and are not included in consumption expenditure of house-
hold.
(7) Cost of materials used in foods and beverages that are
provided to households by restaurants, hotels, amuse-
ment centers and hospitals is first recorded as interme-
diate input in the respective sectors and then as output
from these sectors to the “Consumption expenditure of
households” sector.
(Changes from the 2011 I-O Tables)
Recreational and sports-related expenses included in
“7111-00 Consumption expenditure outside households (col-
umn)” in the 2011 I-O Tables are integrated into this sector.
(Notes)
As FISIM (Financial Intermediation Services Indirectly
Measured) was introduced in the “Financial service” sector in
the 2011 I-O Tables, FISIM purchased by households is counted.
Column Code Row Code Sector Name
7212-00 Consumption expenditure of
private non-profit institutions
serving households
(Ministry or agency in charge)
Cabinet Office
(Definition, Scope)
The expenditure represents costs that were borne by private
non-profit institutions serving households among those that
relate to goods and services supplied at price of no-economic
significance. Namely, it is equal to the difference between: the
production value (appraised by cost required for production) of
services supplied by non-market producers (private non-profit
institutions serving households) *; and the sales of goods and
services at prices of no economic significance and gross fixed
capital (research and development) formed at their own expense.
Therefore, it is the production value of non-market producers
(private non-profit institutions serving households) * less output
to other sectors.
(Changes from the 2011 I-O Tables)
(1) Research and development expenditures of non-market
producers (non-profit institutions serving households) * is
moved to “7511-00 Gross domestic fixed capital formation
(private).”
(2) Consumption of fixed capital of research and development,
etc. by non-market producers (non-profit institutions
serving households) is newly included in this sector.
Column Code Row Code Sector Name
7311-01 Collective consumption expendi-
ture of central government
(Ministry or agency in charge)
- 241 -

Cabinet Office
(Definition, Scope)
The expenditure represents costs that were borne by the cen-
tral government themselves that relate to collective services pro-
vided (diplomatic and national defense services) at price of no-
economic significance. Namely, it is equal to the difference be-
tween: the production value (appraised by cost required for pro-
duction) of collective services supplied by non-market producers
(general government) ** classified as the central government;
and the sales of goods and services at prices of no economic sig-
nificance and gross fixed capital (research and development)
formed at their own expense. Therefore, it is equal to the value
of collective services consumed by the central government.
(Changes from the 2011 I-O Tables)
(1) Research and development expenditures of non-market
producers (general government) ** classified as central gov-
ernment is moved to “7411-00 Gross domestic fixed capital
formation (public).”
(2) Non-market output of the Central Bank in the “Financial
service (FISIM), public” sector is removed from the finan-
cial service sector and recorded as intermediate input in the
“Public administration (central) **” sector. Accordingly, the
increase in domestic production in the “Public administra-
tion (central) **” sector calculated based on total production
is included in this sector.
Column Code Row Code Sector Name
7311-02 Collective consumption expendi-
ture of local government
(Ministry or agency in charge)
Cabinet Office
(Definition, Scope)
The expenditure represents costs that were borne by local
governments themselves that relate to collective services pro-
vided (services provided for overall society such as diet, and
police) at price of no-economic significance. Namely, it is
equal to the difference between: the production value (ap-
praised by cost required for production) of collective services
supplied by non-market producers (general government) **
classified as the local government; and the sales of goods and
services at prices of no economic significance and gross fixed
capital (research and development) formed at their own ex-
pense. Therefore, it is equal to the value of collective services
consumed by the local government.
(Changes from the 2011 I-O Tables)
Research and development expenditures of non-market pro-
ducers (general government) ** classified as local government
are moved to “7411-00 Gross domestic fixed capital formation
(public).”
Column Code Row Code Sector Name
7311-03 Individual consumption expendi-
ture of central government
(Ministry or agency in charge)
Cabinet Office
(Definition, Scope)
The expenditure represents costs that were borne by the cen-
tral government themselves that relate to individual goods and
services provided (goods and services provided for an individual
such as education, health and hygiene) at price of no-economic
significance. Namely, it is equal to the difference between: the
production value (appraised by cost required for production) of
individual services provided by non-market producers (general
government) ** classified as the central government; and the
sales of goods and services at prices of no economic significance
(in other words, the self-consumed value of individual services
by the central government), plus benefits-in-kind of school text-
books for households and insurance benefits for medical and
nursing care services for households.
(Notes)
Expenditures for long-term care insurance benefits (except mu-
nicipal special benefits) is included in this sector.
Column Code Row Code Sector Name
7311-04 Individual consumption expendi-
ture of local government
(Ministry or agency in charge)
Cabinet Office
(Definition, Scope)
The expenditure represents costs that were borne by local
governments themselves that relate to individual goods and
services provided (goods and services provided for an
individual such as education, health and hygiene) at price of
no-economic significance. Namely, it is equal to the difference
between: the production value (appraised by cost required for
production) of individual services provided by non-market
producers ‘general government) ** classified as local
government service producers that are classified as the local
government; and the sales of goods and services at prices of no
economic significance. Therefore, it is equal to the value of
- 242 -

individual services consumed by the local government.
(Notes)
Special municipal benefits of nursing care insurance shall be
recorded in this sector
Column Code Row Code Sector Name
7321-01 Collective consumption expendi-
ture of central government (CFC
of social fixed capital)
(Ministry or agency in charge)
Cabinet Office
(Definition, Scope)
The scope corresponds to depreciated fixed capital relating
to collective services provided by the central government at no-
economic significance (the scope of “7311-01 Collective
consumption expenditure of central government”).
(Changes from the 2011 I-O Tables)
Consumption of fixed capital of research and development,
etc. by non-market producers (general government) ** classified
as central government is newly included in this sector.
(Notes)
Market valuation was introduced in the 2011 I-O Tables.
Column Code Row Code Sector Name
7321-02 Collective consumption expendi-
ture of local government (CFC
of social fixed capital)
(Ministry or agency in charge)
Cabinet Office
(Definition, Scope)
The scope corresponds to depreciated fixed capital relating to
collective services provided by the local government at no-
economic significance (the scope of “7311-02 Collective
consumption expenditure of local government”).
(Changes from the 2011 I-O Tables)
Consumption of fixed capital of research and development,
etc. by non-market producers (general government) ** classified
as local government is newly included in this sector.
(Notes)
Market valuation was introduced in the 2011 I-O Tables.
Column Code Row Code Sector Name
7321-03 Individual consumption expendi-
ture of central government
(CFC of social fixed capital)
(Ministry or agency in charge)
Cabinet Office
(Definition, Scope)
The scope corresponds to depreciated fixed capital relating to
individual goods and services provided by the central
government at no-economic significance (the scope of “7311-03
Individual consumption expenditure of central government”).
(Notes)
Market valuation was introduced in the 2011 I-O Tables.
Column Code Row Code Sector Name
7321-04 Individual consumption expendi-
ture of local government (CFC
of social fixed capital)
(Ministry or agency in charge)
Cabinet Office
(Definition, Scope)
The scope corresponds to depreciated fixed capital relating to
individual goods and services provided by the local government
at no-economic significance (the scope of “7311-04 Individual
consumption expenditure of local government”.
(Notes)
Market valuation was introduced in the 2011 I-O Tables.
Column Code Row Code Sector Name
7411-00 Gross domestic fixed capital
formation (public sector)
(Ministry or agency in charge)
Cabinet Office
(Definition, Scope)
(1) Acquisition (by means of purchase, transfer of ownership,
etc.) by non-market producers (general government) ** or
public enterprises of domestic fixed assets, such as
buildings, machines, devices, defense equipment,
intellectual property products (including research and
development, software), etc., including expenses required
for acquisition, installation cost, freight margins, trade
margins for acquisition of used assets, commission fees for
brokering service, and other direct expenses.
The scope is limited to assets that are produced through
manufacturing process. Therefore, non-material assets such
as goodwill are not included in the scope. Land is non-
produced asset and is, therefore, not included in fixed asset
formation. However, land preparation and improvement
work costs excluding land purchase price are recorded in
- 243 -
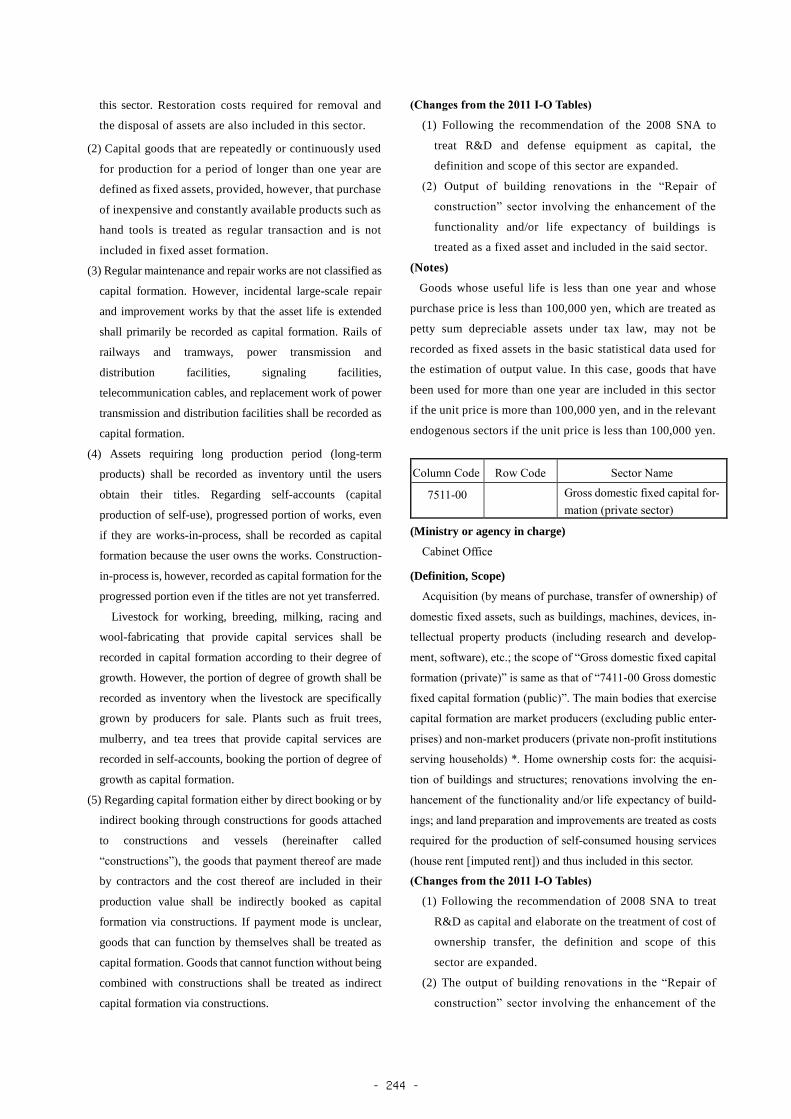
this sector. Restoration costs required for removal and
the disposal of assets are also included in this sector.
(2) Capital goods that are repeatedly or continuously used
for production for a period of longer than one year are
defined as fixed assets, provided, however, that purchase
of inexpensive and constantly available products such as
hand tools is treated as regular transaction and is not
included in fixed asset formation.
(3) Regular maintenance and repair works are not classified as
capital formation. However, incidental large-scale repair
and improvement works by that the asset life is extended
shall primarily be recorded as capital formation. Rails of
railways and tramways, power transmission and
distribution facilities, signaling facilities,
telecommunication cables, and replacement work of power
transmission and distribution facilities shall be recorded as
capital formation.
(4) Assets requiring long production period (long-term
products) shall be recorded as inventory until the users
obtain their titles. Regarding self-accounts (capital
production of self-use), progressed portion of works, even
if they are works-in-process, shall be recorded as capital
formation because the user owns the works. Construction-
in-process is, however, recorded as capital formation for the
progressed portion even if the titles are not yet transferred.
Livestock for working, breeding, milking, racing and
wool-fabricating that provide capital services shall be
recorded in capital formation according to their degree of
growth. However, the portion of degree of growth shall be
recorded as inventory when the livestock are specifically
grown by producers for sale. Plants such as fruit trees,
mulberry, and tea trees that provide capital services are
recorded in self-accounts, booking the portion of degree of
growth as capital formation.
(5) Regarding capital formation either by direct booking or by
indirect booking through constructions for goods attached
to constructions and vessels (hereinafter called
“constructions”), the goods that payment thereof are made
by contractors and the cost thereof are included in their
production value shall be indirectly booked as capital
formation via constructions. If payment mode is unclear,
goods that can function by themselves shall be treated as
capital formation. Goods that cannot function without being
combined with constructions shall be treated as indirect
capital formation via constructions.
(Changes from the 2011 I-O Tables)
(1) Following the recommendation of the 2008 SNA to
treat R&D and defense equipment as capital, the
definition and scope of this sector are expanded.
(2) Output of building renovations in the “Repair of
construction” sector involving the enhancement of the
functionality and/or life expectancy of buildings is
treated as a fixed asset and included in the said sector.
(Notes)
Goods whose useful life is less than one year and whose
purchase price is less than 100,000 yen, which are treated as
petty sum depreciable assets under tax law, may not be
recorded as fixed assets in the basic statistical data used for
the estimation of output value. In this case, goods that have
been used for more than one year are included in this sector
if the unit price is more than 100,000 yen, and in the relevant
endogenous sectors if the unit price is less than 100,000 yen.
Column Code Row Code Sector Name
7511-00 Gross domestic fixed capital for-
mation (private sector)
(Ministry or agency in charge)
Cabinet Office
(Definition, Scope)
Acquisition (by means of purchase, transfer of ownership) of
domestic fixed assets, such as buildings, machines, devices, in-
tellectual property products (including research and develop-
ment, software), etc.; the scope of “Gross domestic fixed capital
formation (private)” is same as that of “7411-00 Gross domestic
fixed capital formation (public)”. The main bodies that exercise
capital formation are market producers (excluding public enter-
prises) and non-market producers (private non-profit institutions
serving households) *. Home ownership costs for: the acquisi-
tion of buildings and structures; renovations involving the en-
hancement of the functionality and/or life expectancy of build-
ings; and land preparation and improvements are treated as costs
required for the production of self-consumed housing services
(house rent [imputed rent]) and thus included in this sector.
(Changes from the 2011 I-O Tables)
(1) Following the recommendation of 2008 SNA to treat
R&D as capital and elaborate on the treatment of cost of
ownership transfer, the definition and scope of this
sector are expanded.
(2) The output of building renovations in the “Repair of
construction” sector involving the enhancement of the
- 244 -

functionality and/or life expectancy of buildings is
treated as a fixed asset and included in the said sector.
Column Code Row Code Sector Name
7611-01 Increase in producer's stocks of
finished goods
(Ministry or agency in charge)
Cabinet Office
(Definition, Scope)
The sector shows volume increases or decreases of product
inventory by producers defined as products before sold or
shipped (excluding construction buildings) that are appraised by
annually averaged market prices.
(Notes)
One-time productions of plants and animals with over one
year production period such as livestock grown for butchery and
growing trees for timbers are included in “7611-02 Increase in
semi-finished goods and work-in-progress” for the portion of de-
gree of growth.
Column Code Row Code Sector Name
7611-02 Increase in semi-finished goods
and work in progress
(Ministry or agency in charge)
Cabinet Office
(Definition, Scope)
The sector shows volume increases or decreases of semi-fin-
ished products or products of work-in-progress that are ap-
praised by assumed annual averaged market prices.
Such products are defined as products that are partially pro-
cessed, assembled, or on growing by goods production industries,
and that are unable to be sold, shipped or delivered to other busi-
nesses without additional processing (excluding self-accounts
and construction work-in-progress.)
(Notes)
The grown portion of one-time productions of plants and ani-
mals with over one year production period such as livestock
grown for butchery and growing trees for timbers shall be in-
cluded in this sector. Also increase of the goods that are owned
by professional producers that grow and deliver goods not for
their own use even if classified as fixed capital formation shall
be included in this sector.
Column Code Row Code Sector Name
7611-03 Increase in dealer’s stocks of
goods
(Ministry or agency in charge)
Cabinet Office
(Definition, Scope)
This represents goods acquired by producers that are classi-
fied as wholesalers or retailers and their volume increases or de-
creases appraised by annual average market price.
(Notes)
Other business sectors than those classified as wholesalers or
retailers are not outputting to this sector. However, the national
petroleum reserve by Japan Oil, Gas and Metals National Cor-
poration shall be exceptionally treated as dealer inventories.
Column Code Row Code Sector Name
7611-04 Increase in stocks of raw materi-
als and supplies
(Ministry or agency in charge)
Cabinet Office
(Definition, Scope)
This represents volume increases or decreases of raw materi-
als appraised by annual average market prices. Row materials
are referred to one of the followings.
(1) All of raw materials, resources, parts and components and/or
stocks that are acquired for processing, manufacturing, assem-
bling or repairing of commodity goods, or for construction
works
(2) Coals, petroleum and other fuels that are purchased for con-
sumption
(3) Fertilizers, agricultural chemicals, seeds, feeds and similar
kinds for agricultural producers
(4) Non-endurable containers, packing materials at packaging
plants, stationery and other stocks that are purchased
(5) Ammunition owned by the Ministry of Defense
(6) Others
(Changes from the 2011 I-O Tables)
Following the recommendations of the 2008 SNA to treat
defense equipment as capital, the definition and scope of this
sector are expanded.
(Notes)
(1) Production volume of non-market producers (general gov-
ernment) ** shall be estimated by aggregating expenses
needed for these activities. Intermediate input expenditures,
however, are recorded in such that new purchases of goods
- 245 -

and services in current accounts deducting net sales amount
of used goods and scrap of same kinds as intermediate con-
sumption for production volume estimation. The output
goes to consumption expenditures either by the central gov-
ernment or local governments after deducting sales amount
to other sectors (tuition fees of public schools, for exam-
ple.) Therefore, the calculated amount that are considered
as materials inventory of non-market producers (general
government) ** in contrast to market producers are actually
recorded in the consumption expenditure of central govern-
ment and in the consumption expenditure of local govern-
ments. They are not included in the increase in stocks of
raw materials and supplies. However, ammunition owned
by the Ministry of Defense is included in this sector as
stated in the “definition and scope.”
(2) Non-market producers (Private nonprofit institutions serv-
ing households) * are also treated in a similar manner as
non-market producers (general government) **.
Column Code Row Code Sector Name
8011-01 Exports (ordinary trade)
(Ministry or agency in charge)
Ministry of Internal affairs and Communications
(Definition, Scope)
The sector is stipulated and defined as “transactions of goods
between residents and non-residents” and the scope corresponds
to the goods recorded in the trade statistics compiled by the Min-
istry of Finance.
However, from the perspective of counting net exports (exports
of goods produced in Japan in the corresponding year), re-ex-
ported goods (goods that are exported after being imported, with-
out being demanded domestically; in other words, goods that are
not domestic products) and exports that are presumed to be re-im-
ported (actual state does not differ from a domestic product being
demanded domestically) are deducted. With regard to calligraphic
works, antiques, used tires, used automobiles, etc., only the margin
equivalent is counted.
Further, the followings are outside of export statistics and not
able to be captured as data. Therefore, the followings are ex-
cluded from the scope.
(1) Small cargo (less than ¥200,000 in value per cargo)
(2) Samples and gifts
(3) Cargoes relating to military forces stationed in Japan.
(4) Exhibition goods for expositions and trade fairs
(5) Cargoes treated as special trade or direct purchase items
Appraisal of “export (ordinary trade)” is made on FOB (Free-
on-board) price basis.
(Given examples)
Articles handled in trade statistics (partially excepted)
(Changes from the 2011 I-O Tables)
Consumption tax levied in the process of the domestic distri-
bution of exported goods, which was classified separately under
“7711-00 Balancing sector” in the 2011 and earlier I-O Tables,
is included in this sector in the 2015 I-O Tables. As the consump-
tion tax classified under the balancing sector is refunded, it is
recorded as negative values at the intersection of “5111-011
Wholesale trade” to prevent the overstatement of exports.
(Notes)
In trade statistics, exports are valuated using a FOB price basis,
and this basis is also used for this sector. However, FOB prices
include the trade margins and domestic freights that were used
in the span from the production factory to actual vessel within
the monetary amount of a good, and are considered as being
equivalent to purchasers’ price.
As a result, when recording in producers’ price valuation ta-
bles, the values from which trade margins and domestic freights
were subtracted are counted for each good, in the same manner
as in the said valuation tables. The trade margins and domestic
freights for each good are collectively counted in the commerce
and transport sectors.
Column Code Row Code Sector Name
8011-02 Exports (special trade)
(Ministry or agency in charge)
Ministry of Internal affairs and Communications
(Definition, Scope)
The scope is “transactions of services and goods not counted
in ordinary trade between residents and non-residents,” and the
main scope consists of, from among the Balance of Payments
Statistics compiled by the Bank of Japan, the balance on services
for which receipt and payment of compensation for services that
are provided between residents and non-residents is recorded,
less (1) the estimated scope of “exports (direct purchase)” and
(2) building maintenance services, etc.
Cargo freights and freight insurance are considered as being
“transport (insurance) services that are provided (exported) in a
condition of trade by a Japanese business operator,” regardless of
whether the revenue from cargo freights (net insurance premium)
received by a Japanese transport (insurance) business operator in
relation to cargo freights and freight insurance is from imported
- 246 -

goods or exported goods, or whether the paying party is a resident
or non-resident. All are considered as export of cargo freights and
freight insurance, and counted in this sector.
Correspondence (outline) between Balance of Payments Sta-
tistics and input-output tables is as shown in the table in “8411-
02 (less) Imports (special trade).”
(Given examples)
Cargo freight, passenger freight, port expenses, consumption
of goods and services on business trip, international phone calls,
cargo insurance, agent commissions, advertising expenses, and
other service-related transactions by private sector
(Notes)
Consumption of goods and services on sightseeing trips shall
be included in “8012-00 Exports (direct purchase)”
Column Code Row Code Sector Name
8012-00 Exports (direct purchase)
(Ministry or agency in charge)
Ministry of Internal affairs and Communications
(Definition, Scope)
The scope corresponds to “direct transactions of goods and
services in domestic market by non-resident households.”
Other final demand sectors than “7211-00 Consumption ex-
penditure of households” are described on domestic concept.
However, consumption expenditures of households are defined
based on national concept. Therefore, a sector that adjusts two
different concepts is needed converting it to domestic concept
that I-O Tables stand on.
Should a sector be established that converts from nation con-
sumption expenditure by households to domestic consumption
expenditure by households, the total sum of final demands be-
comes equal to total sum of domestic expenditure. Thus, domes-
tic concept can be maintained with I-O Tables.
The sector “Export (direct purchase)” plays such roles.
(Given examples)
Consumption by foreign persons traveling to Japan (with a
purpose other than business, such as sightseeing) in Japan, indi-
vidual spending by diplomatic mission members, individual
spending by military personnel stationed in Japan
(Notes)
Conversion equation to convert “7211-00 Consumption ex-
penditure of households” to domestic concept
Consumption expenditure of households(DOMSTIC concept)
=Consumption expenditure of households(NATION concept)
+Exports (direct purchase)-Imports (direct purchase)
Column Code Row Code Sector Name
8411-01 (less) Imports (ordinary trade)
(Ministry or agency in charge)
Ministry of Internal affairs and Communications
(Definition, Scope)
The sector is stipulated and defined as “transactions of goods
between residents and non-residents” and the scope corresponds
to the goods recorded on trade statistics that are compiled by the
Ministry of Finance.
However, from the perspective of counting net imports (ex-
ports of goods produced in foreign countries and demanded in
Japan in the corresponding year), re-imported goods (goods that
are imported after being exported, without being demanded
abroad; in other words, goods that are produced in Japan) and
imports that are presumed to be re-exported (import of goods
that are exported without being demanded in Japan) are deducted.
Calligraphic works, antiques, used tires, used automobiles, etc.,
are deducted.
Further, the followings are outside of ordinary trade statistics
and not able to be captured as data. Therefore, the followings are
excluded from the scope.
(1) Small cargo (less than ¥200,000 in value per cargo)
(2) Samples and gifts
(3) Cargoes relating to military forces stationed in Japan.
(4) Exhibition goods for expositions and trade fairs
(5) Cargoes treated as special trade or direct purchase
Appraisal of “(less) import (ordinary trade)” is made on CIF
price basis.
(Given examples)
Articles handled in trade statistics (partially exempted)
Column Code Row Code Sector Name
8411-02 (less) Imports (special trade)
(Ministry or agency in charge)
Ministry of Internal affairs and Communications
(Definition, Scope)
The scope is “transactions of services and goods not counted
in ordinary trade between residents and non-residents,” and the
main scope consists of, from among the Balance of Payments
Statistics compiled by the Bank of Japan, the balance on services
- 247 -

for which receipt and payment of compensation for services that
are provided between residents and non-residents is recorded,
less (1) the estimated scope of “imports (direct purchase)” and
(2) building maintenance services, etc.
Cargo freights and freight insurance are considered as being
“transport (insurance) services that are provided (exported) in a
condition of trade by a Japanese business operator,” regardless
of whether the revenue from cargo freights (net insurance pre-
mium) received by a Japanese transport (insurance) business op-
erator in relation to cargo freights and freight insurance is from
imported goods or exported goods, or whether the paying party
is a resident or non-resident. All are counted in “8011-02 Exports
(special trade)” as export of cargo freights and freight insurance,
and counted in this sector. For example, with regard to transport
of imports by a Japanese transport business operator, revenue is
not counted in this sector even if it is earned (if it is counted in
this sector, domestic production decreases, despite there being
revenue).
Payment of charter vessel fees and charter aircraft fees to for-
eign transport business operators is counted in this sector, how-
ever, such payments are inputted directly to their own sectors for
international shipping and international air transport, and are
thus cancelled out in terms of row sectors.
Correspondence (outline) between Balance of Payments Sta-
tistics and input-output tables is as shown below.
Balance of Payments Statistics I-O Tables
Cargo freight Cargo
insurance
Freight and
insurance
Export Import Export Import Export Import
Activities by Japa-
nese transport (in-
surance) companies
Relating to exports
Paid by exporters
(residents)
Paid by importers
(non-residents)
Relating to imports
Paid by exporters
(residents)
Paid by importers
(non-residents)
Multinational
transport between
three countries
Activities by for-
eign transport (in-
surance) companies
Relating to exports
Paid by exporters
(residents)
Paid by importers
(non-residents)
Relating to imports
Paid by exporters
(residents)
Paid by importers
(non-residents)
(Given examples)
Cargo freight, passenger freight, port expenses, consumption
of goods and services on business trip, international phone calls,
cargo insurance, agent commission, advertisement expenses,
films and tapes rental fees, other service-related transactions by
private sector
(Notes)
(1) Import articles in the ordinary trade in I-O Tables are ap-
praised on CIF prices. Therefore, booking import of cargo
freight and cargo insurance in special trade causes duplicated
booking. As a result, cargo freights and insurance are not
counted in imports (special trade) in I-O Tables, with the ex-
ception of some exceptions such as charter vessel fees and
charger aircraft fees.
(2) Consumption of goods and services on sightseeing trips
shall be included in “8412-00 (less) Imports (direct pur-
chase)”
Column Code Row Code Sector Name
8412-00 (less) Imports (direct purchase)
(Ministry or agency in charge)
Ministry of Internal affairs and Communications
(Definition, Scope)
The scope corresponds to “direct transactions of goods and
services in overseas market by resident households.”
Other final demand sectors than “7211-00 Consumption ex-
penditure of households” are described on domestic concept.
However, consumption expenditures of households are defined
based on national concept. Therefore, a sector that adjusts two
different concepts is needed converting it to domestic concept
that I-O Tables stand on. Should a sector be established that con-
verts from nation consumption expenditure by households to do-
mestic consumption expenditure by households, the total sum of
- 248 -

final demands becomes equal to total sum of domestic expendi-
ture. Thus, domestic concept can be maintained with I-O Tables.
The sector “Import (direct purchase)” plays such roles.
(Given examples)
Local consumption by Japanese visitors to foreign countries
(with a purpose other than business, such as sightseeing), indi-
vidual spending by diplomatic mission members
(Notes)
Conversion equation to convert “7211-00 Consumption ex-
penditure of households” to domestic concept
Consumption expenditure of households(DOMSTIC
concept)= Consumption expenditure of households
(NATION concept)+Exports (direct purchase)-Im-
ports (direct purchase)
Column Code Row Code Sector Name
8511-00 (less) Custom duties
(Ministry or agency in charge)
Ministry of Internal affairs and Communications
(Definition, Scope)
Import articles are levied of customs duties from trade policy
considerations based on Customs Tariff Table. This works for
squeezing price gaps between inexpensive import products and
expensive domestic products by appraising import products at
the same price level of domestic products. Thus, a “Custom du-
ties” sector was established separate from “Imports” sector, clar-
ifying the amount related to imported goods.
Refunds that are provided in cases corresponding to certain
conditions after paying taxes are included in total custom duties,
due to restrictions with the basic data. Regarding vessels that
are re-imported, the transactions are recorded as can-
cellation of imports and therefore no customs duties are
recorded.
(Notes)
For the transaction values of imported goods, the total of or-
dinary trade, custom duties, and commodity taxes on the im-
ported goods are recorded in the respective sectors of the I-O
Tables.
Column Code Row Code Sector Name
8611-00 (less) Commodity taxes on im-
ported goods
(Ministry or agency in charge)
Ministry of Internal affairs and Communications
(Definition, Scope)
Imported goods are levied of consumption tax as inland tax
same as the case of domestic goods, alcohol tax, tobacco tax,
gasoline tax, local road tax, petroleum gas tax and petroleum gas
on customs clearance in addition to customs duty.
As a part of clarifying the amount of imported goods, this sec-
tor was established as a column sector in the same manner as
“8511-00 (less) Custom duties,” with these taxes as the scope.
(Given examples)
Alcohol tax, tobacco tax, gasoline tax, local gasoline tax, local
road tax, petroleum gas tax, petroleum tax and consumption tax
on imported goods
- 249 -

§3 Gross Value Added Sectors
Column Code Row Code Sector Name
7111-001 Lodging expenses and daily
allowances
7111-002 Social expenses
7111-003 Welfare expenses
(Ministry or agency in charge)
Cabinet Office
(Definition, Scope)
Consumption expenditure outside households is so-called
“corporate consumption” and the scope corresponds to expendi-
tures paid by corporations and other entities such as expense ac-
counts and entertainment expenses similar to those paid by
households, including welfare expenses (excluding the ones that
are recorded in other gross value added sectors), expense ac-
counts and entertainment expenses as well as trip expenses paid
but excluding transport fares (primarily staying and daily allow-
ances.)
(1) Staying and daily allowance
This corresponds to daily allowance payable to directors or
employees of expenses needed for trips of business manage-
ment and of sales and for trips of transfer, staying charges and
preparation allowance for transfer, transfer allowance and
nursing allowance.
(2) Expense accounts
The expenses refer to such expenses of entertaining, inviting,
soliciting, giving fits to customers, suppliers and other busi-
ness related persons or similar actions. This does not include
expenses for employees.
However, expenses for year-end and year-beginning parties
for directors or managers, expenses entertaining finance per-
sonnel, and party expenses after department meetings are in-
cluded in expense accounts as exceptions.
(3) Welfare expenses
They consist of health, hygiene, and medical service ex-
penses (expenses needed for medical services for employees
such as those for goods and services to maintain operations of
related facilities), etc.
Further, personnel cost for employees that corporations di-
rectly hire to operate welfare facilities, depreciation cost
thereof and indirect taxes are not included in this sector, but are
included in “9111-000 through 9113-000 Compensation of em-
ployees”, “9311-000 Consumption of fixed capital” and “9411-
000 Indirect taxes (except custom duties and commodity taxes
on imported goods)” respectively.
(Changes from the 2011 I-O Tables)
Recreational and sports-related expenses included in this sec-
tor in the 2011 I-O Tables are integrated into “9113-000 Miscel-
laneous payments and allowances.”
(Notes)
(1) Activities relating to lodging and recreational facilities that
corporations provide for their employees are included in
“6711-01 Hotels”, and similarly activities relating to stay-
ing lodges, company housings for bachelors, and for stu-
dents are included in “5531-01 House rent (imputed house
rent)”.
Further, costs of food materials or corporate spending
that supplements expenses for outsourcing among employ-
ees’ canteen expenses shall be included in compensation of
employees (“9113-000 Miscellaneous payments and allow-
ances”) as a sort of “salaries-in-kind”. Therefore, em-
ployee’s share as well as corporate share shall be treated in
the way that “7211-00 Consumption expenditure of house-
holds” shall input individual foods materials or “Eating and
drinking places.”
(2) “7111-00 Consumption expenditure outside house-
holds (column)” (domestic production of column sec-
tor) matches the total of “7111-001 Lodging expenses
and daily allowances,” “7111-002 Social expenses,”
and “7111-003 Welfare expenses” (total of domestic
production for row sectors).
Column Code Row Code Sector Name
9111-000 Wages and salaries
9112-000 Contribution of employers to
social insurance
9113-000 Miscellaneous payments and
allowances
(Ministry or agency in charge)
Ministry of Health, Labour and Welfare
(Definition, Scope)
(1) Scope of compensation of employees
Compensation of employees refers to all income of cash
and in kind that are paid as compensation to work to the em-
ployed by private sectors and governments domestically.
The incomes referred herein are recorded on employer’s
payment basis, and not on employee’s receipt basis. Further,
salaries shall be recorded as compensation of employees in
the specified payment period of relevant entities regardless
- 250 -

whether the said wages and salaries are paid on time or de-
layed in order to capture and recognize correctly due income
for due period (accrual basis.) Furthermore, compensation of
employees are recognized on domestic concept, and there-
fore, compensation of employees incurred domestically is
the compensation of employees regardless whether an em-
ployee is resident or non-resident.
The scope of compensation of employees covers incomes
(wages and salaries, social insurance premium (employer’s
share), and other compensation and allowances) of directors
on payroll, regular workers, temporary and day-workers. In-
comes of self-support owners are included in business sur-
plus.
(2) Contents of items included in compensation of employees
Compensation of employees includes every and all items
that can be considered as rewards to works done by employees.
In addition, a system of national accounts is taken into consid-
eration, driving at the following items that consist of Compen-
sation of employees.
1 Wages and salaries
A) Wages for regular workers, Wages for temporary and
day-workers
This refers to pay amount of an employer before de-
ducting taxes and social insurance premium (employer
share). This also includes marriage and condolence
money that are obligatorily specified in employees pol-
icy manuals, or labor agreements, and tips that are re-
divided by an employer after collection.
When marriage and condolence money are specified
in employees manuals or labor agreement, it is included
in wages and salaries. Items under “Marriage and con-
dolence money” are following:
a) Happy money for marriage
b) Happy money for childbirth
c) Happy money for school initiation
d) Condolence money for death
e) Sadness money for injury
f) Sadness money for casualties
There are two kinds of “tips”; the one that a guest
gives directly to an employee; the other that a tip from a
guest is divided by an employer to an employee. A tip
due to an employee is basically cash given by a guest
other than a specified amount of charges and is a contin-
ued revenue source. Therefore, aforementioned two
kinds of tips can both be considered as wages and sala-
ries. However, the latter was only included in the income,
and the former has been considered as a cash transfer
from a guest to an employee.
The compensation for national diet representatives and
for local diet representatives (Annual allowance for diet
representatives) is treated as the wages for regular work-
ers.
B) Compensation of directors
This refers to the amount payable to corporate direc-
tors as corporate expense cost.
2 Social insurance premium (employer share)
a) Health insurance managed by the Japan Health Insur-
ance Association (including day-worker insured under
special provision)
b) Health insurance managed by unions
c) Employees' pension insurance
d) Seamen’s insurance
e) Mutual aid for private school personnel
f) Employment insurance
g) Workers’ casualties compensation insurance
h) Child allowance
i) National public service personnel mutual aid association
j) Pension fund association for local government officials
k) Government employees’ accident compensation
l) Casualties compensation fund for local government offi-
cials
Insurance premiums for health insurance include insur-
ance premiums for medical care and nursing care.
Furthermore, the payment amount of accident compen-
sation based on the “Labor Standards Act” and casualties
compensation for government officials of the national and
local governments as in k) and l) shall be the social insur-
ance premium (paid for by employer)
3 Miscellaneous payments and allowances
a) Installments and allowances for retirement pensions, al-
lowances for lump-sum retirement
Installments and allowances for retirement pensions refer
to: service costs for the defined-benefit corporate pension
plan (retirement benefits recognized as having accrued as
compensation for labor during a fixed period); expenses
for the operation of the relevant pension plan; installments
to the Smaller Enterprise Retirement Allowance Mutual
Aid System, etc.; and installments to defined contribution
pension plan (corporate type).
- 251 -

Allowances for lump-sum retirement consist of the em-
ployer’s reserved amount for the funded pension plan based
on mutual aid contracts for retirement allowance, and the
retirement allowance actually paid by the employer other
than based on the funded pension plan.
b) Wage-in-kind
This refers to the cost borne by employers when served
meals, commuting pass and corporate products are pro-
vided.
c) Housing rent difference
When an employee lives in a corporate supported hous-
ing, the difference between the market rent charge and the
rent that the employee pays is deemed as wage-in-kind.
d) Added benefits of social insurance
Employers’ costs that are paid on top of legal payments
from the employer to employee, regarding payment of so-
cial insurance. Examples consist of compensation other
than legal compensation for workmen’s compensation in-
surance and added benefits for health insurance managed
by unions.
e) Expenses for assets building
This refers to an employer’s cost for the benefit of an
employee.
f) Recreational and sports-related expenses
The expenses of recreational activities of employees and
their families and recreational facilities
g) Employee stock option plan
This is an employee benefit plan under which the com-
pany offers employees the right to buy a certain number of
shares of the company’s stock at a set price (exercise price)
on the specified date (vesting date) or within a specified pe-
riod following the vesting date (vesting period).
(Changes made from the 2011 I-O Tables)
(1) Service costs for the defined-benefit corporate pension
plan (retirement benefits recognized as having accrued as
compensation for labor during a fixed period) and expenses
for operation of the relevant pension plan are included in
“9113-000 Miscellaneous payments and allowances” to re-
place: Employees' Pension Fund classified under “9112-
000 Contribution of employers to social insurance;” and in-
stallments to additional benefits for the Employees' Pension
Fund and installments to the defined-benefit corporate pen-
sion plan classified under “9113-000 Miscellaneous pay-
ments and allowances” in the 2011 I-O Tables.
(2) Recreational and sports-related expenses classified under
“7111-003 Welfare expenses” in the 2011 I-O Tables are in-
cluded in “9113-000 Miscellaneous payments and allow-
ances.”
(3) The employee stock option plan is included in “9113-000
Miscellaneous payments and allowances.”
(Notes)
Directors’ bonuses were integrated into the “Wages and sala-
ries” sector in the 2011 I-O Tables.
Column Code Row Code Sector Name
9211-000 Operating surplus
(Ministry or agency in charge)
Cabinet Office
(Definition, Scope)
(1) The scope corresponds to the value of gross value added
deducted by consumption expenditure outside households,
compensation of employees, capital depreciation reserve,
and pure indirect taxes (indirect taxes minus subsidies.)
(2) Income of an individual business or a family employee
without pay shall be recorded as business surplus, not as
compensation of employees
(3) Since it is defined in such that production values of non-
market producers (general government) ** and non-market
producers (private non-profit institutions serving house-
holds) * are equal to production costs (total sum of expend-
itures), no business surplus is created, but it is only created
in market producers.
(Changes made from the 2011 I-O Tables)
Special local corporation taxes classified under “9411-000 In-
direct taxes (except customs duties and commodity taxes on im-
ported goods)” in the 2011 I-O Tables is integrated into this sec-
tor.
Column Code Row Code Sector Name
9311-000 Consumption of fixed capital
(Ministry or agency in charge)
Cabinet Office
(Definition, Scope)
Values of fixed assets will be consumed during production
processes. This is the cost in reserve to supplement the depreci-
ated portion of the values, and it covers depreciation and inci-
dental capital loss. Depreciation reserve is to prepare for normal
wear and tear as well as for damages of fixed assets. Incidental
capital loss reserve is for incidental losses like accidents. How-
ever, losses from rare and major disasters such as the Great East
- 252 -

Japan Earthquake are not targeted in Input-Output Tables.
The scope of fixed capital subject to capital depreciation re-
serve is the same range of that of “Gross domestic fixed capital
formation.”
(Changes made from the 2011 I-O Tables)
(1) Following the recommendation of 2008 SNA to treat
R&D as capital and elaborate on the treatment of cost of
ownership transfer, the definition and scope of this
sector are expanded.
(2) Output of building renovations in the “Repair of
construction” sector involving the enhancement of the
functionality and/or life expectancy of buildings is
treated as fixed assets and included in the said sector.
(Notes)
Market valuation was introduced in the 2011 I-O Tables.
Column Code Row Code Sector Name
9321-000 Consumption of fixed capital
(Social fixed capital)
(Ministry or agency in charge)
Cabinet Office
(Definition, Scope)
This represents reserved costs to supplement depreciated por-
tion of fixed assets owned by general government. The scope co-
vers depreciation and incidental capital loss same as “9311-000
Consumption of fixed capital.” The scope of fixed capital is the
same range of that of “Gross domestic fixed capital formation
(public).”
(Changes from the 2011 I-O Tables)
(1) Following the recommendation of 2008 SNA to treat
R&D and defense equipment as capital, the definition
and scope of this sector are expanded.
(2) Output of building renovations in the “Repair of
construction” sector involving the enhancement of the
functionality and/or life expectancy of buildings is
treated as fixed assets and included in the said sector.
(Notes)
Market valuation was introduced in the 2011 I-O Tables.
Column Code Row Code Sector Name
9411-000 Indirect taxes (except custom
duties and commodity taxes
on imported goods)
(Ministry or agency in charge)
Cabinet Office
(Definition, Scope)
(1) Indirect taxes are duties and outside duty burden to be lev-
ied on production, sales, purchase and/or usage of goods
and services. These are not income but recognized as ex-
penses by the Taxation Law and are to burden by final pur-
chasers. Further, outside tax revenues that are not classified
as operating income of the government but levied for finan-
cial purposes are also included in indirect taxes. However,
“customs duties” and “imported goods commodity tax” are
not included in direct taxes but recorded as exemption items
for the final demands.
(2) Consumption tax, alcohol tax, tobacco tax, gasoline tax,
and car weight tax fall in the government tax category. To-
bacco tax (local) and fixed asset tax fall in the local govern-
ment tax category. Fees collected with revenue stamps fall
in outside taxation item category and the total amount is
treated as indirect taxes.
(3) Fixed asset taxes are not only levied on factory lands and
depreciative assets but also on housing and housing lands.
Total amount of fixed asset taxes are treated as indirect
taxes.
Namely, housings are all supplied by market producers
in terms of system of national accounts and I-O Tables, and
housings, even though they are owned by individuals for
living, are nominally rented from the sector “5531-01
House rent (imputed house rent)” and their rents are rec-
orded as imputed rent. Therefore, fixed asset taxes levied
on self-owned housings shall be treated as indirect taxes
same as taxation on corporations. Real estate acquisition
tax and urban planning tax are treated as indirect taxes with
the same reason.
(4) Some portion of car tax (50% of tax amount for conven-
ience) are borne by households, and another 50% goes to
indirect taxes as a portion borne by producers.
(Changes from the 2011 I-O Tables)
Commission fees paid to the central government by market
producers (spectrum license user fees, permit fees, etc.) which
were classified under this sector in the 2011 I-O Tables are in-
cluded in “sales of goods and services” in “6111-01, -011 Public
administration (central government) **” and “6112-01, -011
Public administration (local government) **” and a special local
corporation tax is integrated into “9211-000 Operating surplus.”
(Notes)
(1) Special local consumption tax was abolished as of March
31, 2000, but deferred payment of such tax exists after-
wards. With regard to this issue, as with the 2005 and 2011
- 253 -

I-O Tables, costs for amusement, eating and drinking, lodg-
ing, etc. are included in final consumption expenditure in-
clusive of tax, and at hotels and eating and drinking estab-
lishments, etc., sales that include tax are counted, and spe-
cial local consumption tax is considered as being an indirect
tax where the column sectors bear the amount.
Column Code Row Code Sector Name
9511-000 (less) Current subsidies
(Ministry or agency in charge)
Cabinet Office
(Definition, Scope)
Current subsidies refer to the grants that meet the following
three conditions: (1) those paid by non-market producers (gen-
eral government) ** to market producers; (2) those offered to
cover the ordinary expenditures of market producers; and (3)
those considered to lower the market prices of goods and ser-
vices. Grants paid to market producers to support their invest-
ments or cover the loss of working assets are not classified as
“subsidies” for the purpose of this sector. Grants paid by non-
market producers (general government) ** to other non-market
producers (general government) ** or to non-market producers
(private non-profit institutions serving households) * do not
meet condition (1) above and therefore are not categorized as
“subsidies.”
(Notes)
The definition and scope of this sector were adjusted to com-
ply with the System of National Accounts in the 2011 I-O Tables.
- 254 -