Embed Size (px)
Citation preview

2015: HOW FAR IS THE RECOVERY?
CHINA: CARROT AND STICK
> Rocky TUNG Economist, Asia Pacific, Coface
COFACE COUNTRY RISK CONFERENCE 2014 / 11 November 2014 13
/
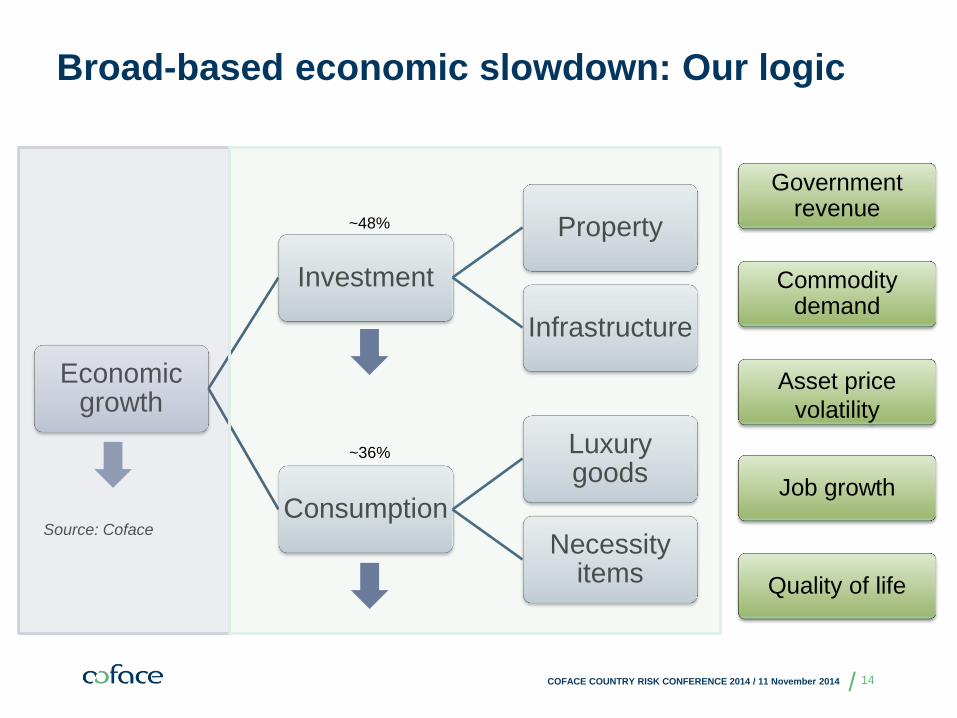
Broad-based economic slowdown: Our logic
Economic growth
Investment
Property
Infrastructure
Consumption
Luxury goods
Necessity items
Government revenue
Commodity demand
Asset price
volatility
Job growth
Quality of life
Source: Coface
~48%
~36%
COFACE COUNTRY RISK CONFERENCE 2014 / 11 November 2014 14
/
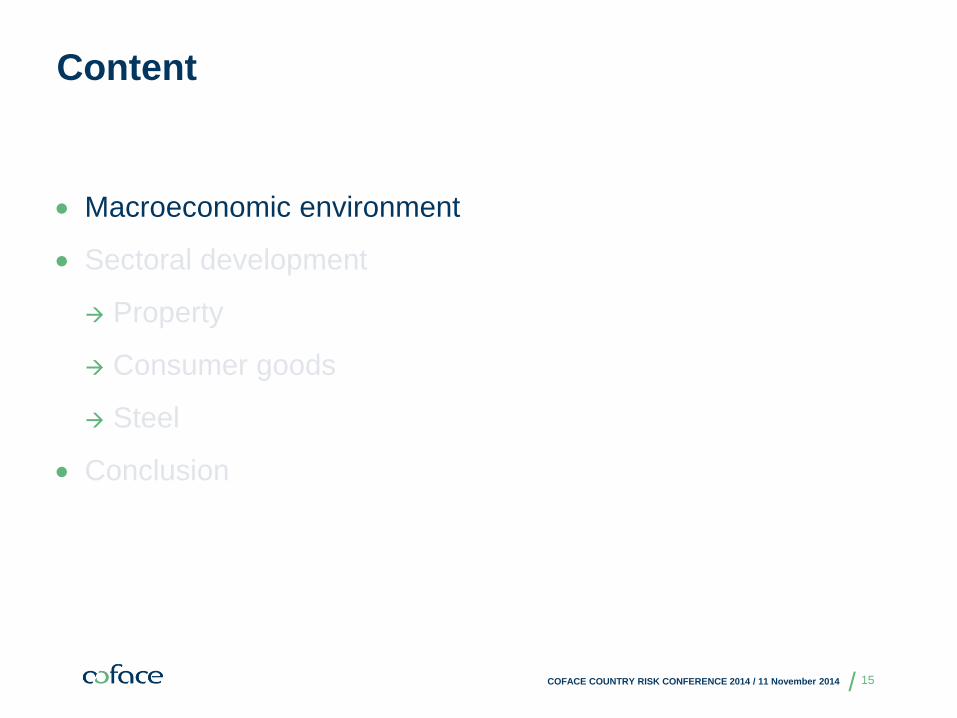
Content
Macroeconomic environment
Sectoral development
Property
Consumer goods
Steel
Conclusion
COFACE COUNTRY RISK CONFERENCE 2014 / 11 November 2014 15
/
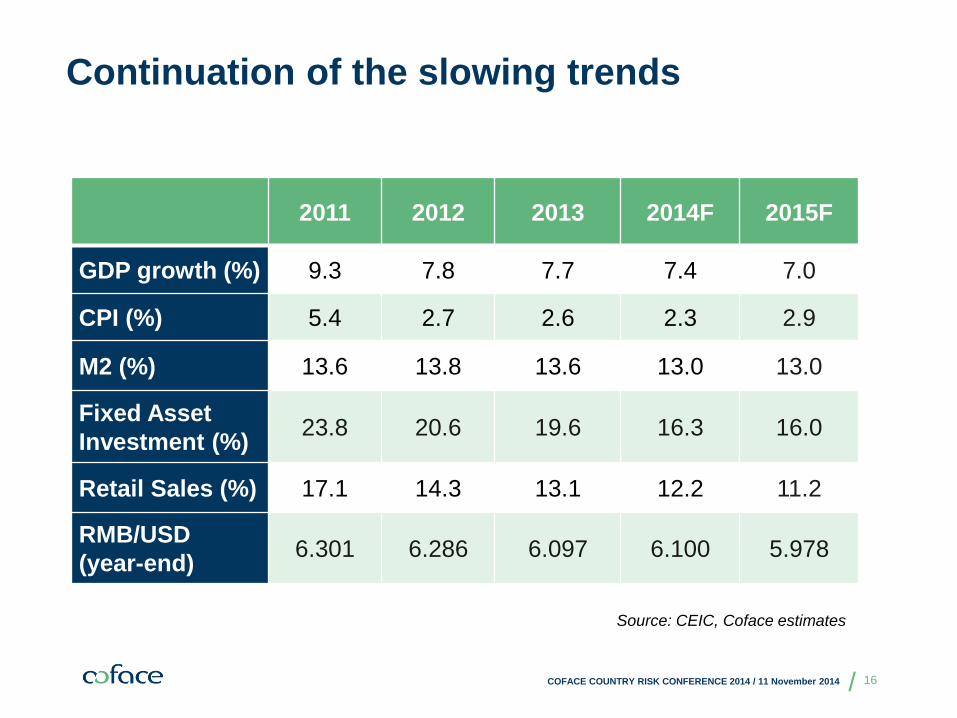
Continuation of the slowing trends
2011 2012 2013 2014F 2015F
GDP growth (%) 9.3 7.8 7.7 7.4 7.0
CPI (%) 5.4 2.7 2.6 2.3 2.9
M2 (%) 13.6 13.8 13.6 13.0 13.0
Fixed Asset
Investment (%) 23.8 20.6 19.6 16.3 16.0
Retail Sales (%) 17.1 14.3 13.1 12.2 11.2
RMB/USD
(year-end) 6.301 6.286 6.097 6.100 5.978
Source: CEIC, Coface estimates
COFACE COUNTRY RISK CONFERENCE 2014 / 11 November 2014 16

/
Policy direction
Job creation
Inflation
Growth
Policy stance to revolve around 3 key factors
Source: Coface
COFACE COUNTRY RISK CONFERENCE 2014 / 11 November 2014 17

/
GDP Target @ ~7.5%: Falling short
Source: CEIC, Coface estimates
A steady structural shift toward the 7% range
Expectation management matters
COFACE COUNTRY RISK CONFERENCE 2014 / 11 November 2014 18
0%
2%
4%
6%
8%
10%
12%
14%
16%
2004 2005 2006 2007 2008 2009 2010 2011 2012 2013 2014F 2015F
GDP target Actual GDP growth
6%
7%
8%
9%
10%
11%
12%
13%
14%
15%
Slowing GDP growth in China
GDP Growth
YoY
13.4%
10.2%
7.8%
Avg for 2014/15 7.2%
/
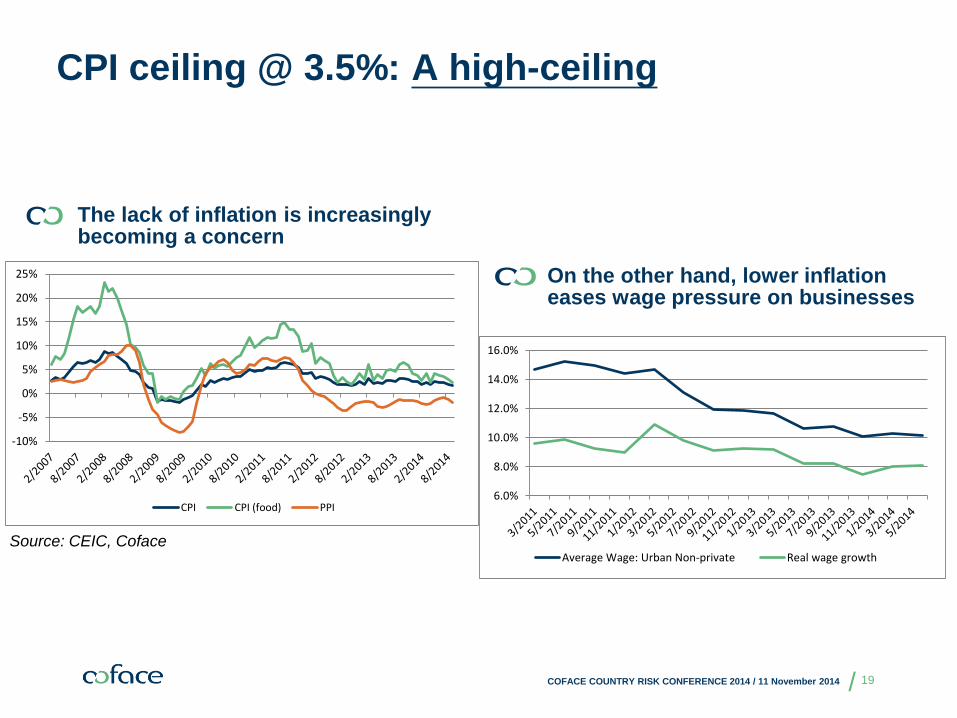
CPI ceiling @ 3.5%: A high-ceiling
Source: CEIC, Coface
On the other hand, lower inflation eases wage pressure on businesses
The lack of inflation is increasingly becoming a concern
COFACE COUNTRY RISK CONFERENCE 2014 / 11 November 2014 19
-10%
-5%
0%
5%
10%
15%
20%
25%
CPI CPI (food) PPI6.0%
8.0%
10.0%
12.0%
14.0%
16.0%
Average Wage: Urban Non-private Real wage growth

/
New job creation @ 10 million/year:
Good for now, but…
You can’t have your cake and eat it too
Source: CEIC, Coface
Income growth continues its downward trend
Will the halt of new job creation growth be coming soon?
COFACE COUNTRY RISK CONFERENCE 2014 / 11 November 2014 20
-1.0%
6.0%4.5% 3.7% 3.5%
1.7%
-10%
-5%
0%
5%
10%
15%
Urban new employment growth (YoY)
11.7m
11m
12.2m
11m
13.1m12.7m11.3%
14.1%
12.6%
9.7%
9.3%
0%
2%
4%
6%
8%
10%
12%
14%
16%
0
5,000
10,000
15,000
20,000
25,000
30,000
3/2010 9/2010 3/2011 9/2011 3/2012 9/2012 3/2013 9/2013 3/2014 9/2014
YTD disposable income per capita (LHS) YTD consumption expenditure (LHS)
Disposable income per capita growth Consumption expenditure growth
RMB/ Yr YoYRMB/ Yr YoY

/
Expected steps going forward
Growth stabilization
Managing expectation
Strengthening economic structure
Targeted stimuli
Lower growth target
Continuation of
structural reform
COFACE COUNTRY RISK CONFERENCE 2014 / 11 November 2014 21
/
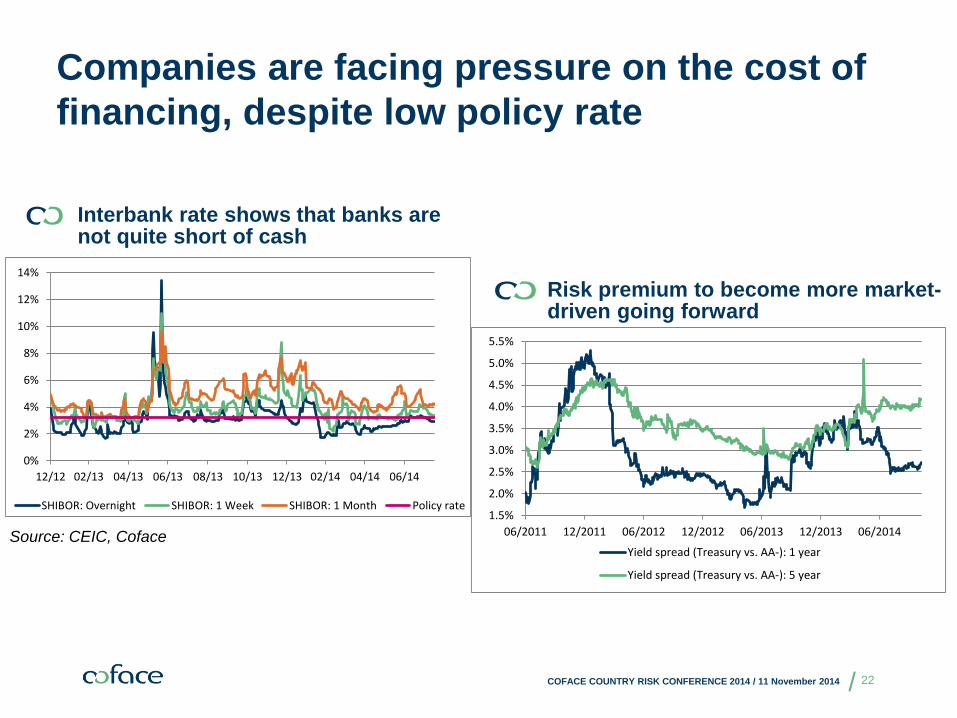
Companies are facing pressure on the cost of
financing, despite low policy rate
Source: CEIC, Coface
Risk premium to become more market-driven going forward
Interbank rate shows that banks are not quite short of cash
COFACE COUNTRY RISK CONFERENCE 2014 / 11 November 2014 22
0%
2%
4%
6%
8%
10%
12%
14%
12/12 02/13 04/13 06/13 08/13 10/13 12/13 02/14 04/14 06/14
SHIBOR: Overnight SHIBOR: 1 Week SHIBOR: 1 Month Policy rate1.5%
2.0%
2.5%
3.0%
3.5%
4.0%
4.5%
5.0%
5.5%
06/2011 12/2011 06/2012 12/2012 06/2013 12/2013 06/2014
Yield spread (Treasury vs. AA-): 1 year
Yield spread (Treasury vs. AA-): 5 year

/
But expansion of monetary base is becoming
less effective as a tool
Source: CEIC, Coface estimates
Money supply growth is becoming less-efficient in boosting growth
Slowing non-bank financing activities dragged aggregate financing growth
Nominal GDP M0 M1 M2
1Yr lead 0.1109 0.3961 0.5847 0.3406
3Q-lead 0.3552 0.4965 0.6556 0.2301
2Q-lead 0.6068 0.5783 0.6074 0.0844
1Q-lead 0.8353 0.4529 0.4233 -0.1410
Simultaneous 1.0000 0.4811 0.1991 -0.2671
Nominal GDP/ Money Supply
COFACE COUNTRY RISK CONFERENCE 2014 / 11 November 2014 23
-20%
-10%
0%
10%
20%
30%
40%
0
500
1,000
1,500
2,000
2,500
3,000
10/2012 1/2013 4/2013 7/2013 10/2013 1/2014 4/2014 7/2014
Aggregate financing New loan
YTD aggregate financing growth (RHS) YTD new loan growth (RHS)
RMB b YoY
95%
0%
50%
100%
150%
200%
250%
Nominal GDP growth / M1 growth (9M-lead)
Correlation (10-year) @ 0.6610-year average @ 105%
/
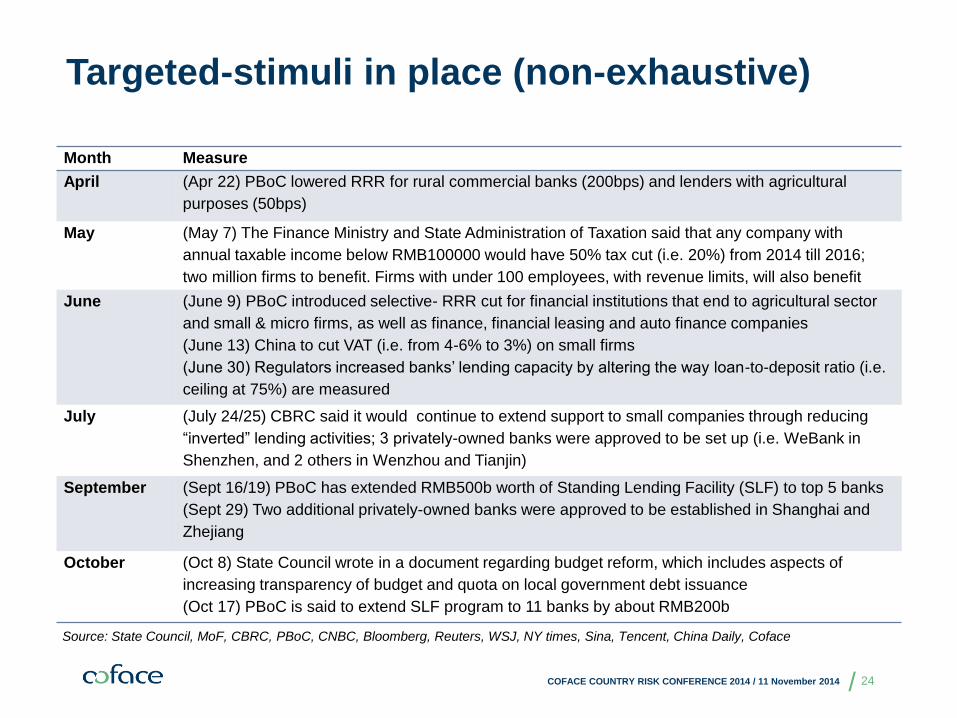
Month Measure
April (Apr 22) PBoC lowered RRR for rural commercial banks (200bps) and lenders with agricultural
purposes (50bps)
May (May 7) The Finance Ministry and State Administration of Taxation said that any company with
annual taxable income below RMB100000 would have 50% tax cut (i.e. 20%) from 2014 till 2016;
two million firms to benefit. Firms with under 100 employees, with revenue limits, will also benefit
June (June 9) PBoC introduced selective- RRR cut for financial institutions that end to agricultural sector
and small & micro firms, as well as finance, financial leasing and auto finance companies
(June 13) China to cut VAT (i.e. from 4-6% to 3%) on small firms
(June 30) Regulators increased banks’ lending capacity by altering the way loan-to-deposit ratio (i.e.
ceiling at 75%) are measured
July (July 24/25) CBRC said it would continue to extend support to small companies through reducing
“inverted” lending activities; 3 privately-owned banks were approved to be set up (i.e. WeBank in
Shenzhen, and 2 others in Wenzhou and Tianjin)
September (Sept 16/19) PBoC has extended RMB500b worth of Standing Lending Facility (SLF) to top 5 banks
(Sept 29) Two additional privately-owned banks were approved to be established in Shanghai and
Zhejiang
October (Oct 8) State Council wrote in a document regarding budget reform, which includes aspects of
increasing transparency of budget and quota on local government debt issuance
(Oct 17) PBoC is said to extend SLF program to 11 banks by about RMB200b
Targeted-stimuli in place (non-exhaustive)
Source: State Council, MoF, CBRC, PBoC, CNBC, Bloomberg, Reuters, WSJ, NY times, Sina, Tencent, China Daily, Coface
COFACE COUNTRY RISK CONFERENCE 2014 / 11 November 2014 24

/
Content
Macroeconomic environment
Sectoral development
Property
Consumer goods
Steel
Conclusion
COFACE COUNTRY RISK CONFERENCE 2014 / 11 November 2014 25

/
Sectoral Risk Assessment (non-exhaustive)
Source: Datastream data, Coface (September 2014)
COFACE COUNTRY RISK CONFERENCE 2014 / 11 November 2014 26
/
Property
A key part of the Chinese government’s urbanization plan
An important source of government revenue
A huge downstream market for other sectors like steel and cement, and thus iron ore, coal and other commodities
Source: Coface
Why do we talk about it?
COFACE COUNTRY RISK CONFERENCE 2014 / 11 November 2014 27

/
-15%
-10%
-5%
0%
5%
10%
15%
88
90
92
94
96
98
100
102
104
106
108
Real estate climate index RECI YoY change
0
2,000,000
4,000,000
6,000,000
8,000,000
10,000,000
12,000,000
14,000,000
0%
10%
20%
30%
40%
50%
Other sources (RHS) Self-raised (RHS)
Foreign investment (RHS) Domestic loan (RHS)
Real estate investment source of fund
YoY RMB m
-9.1%
+11.5%
+11.8%
Lack of alternate source of financing hurts
business climate of property sector…
Source: CEIC, Coface
Deteriorated environment for the property market in 2014
*Source of fund, area of land development, area of
building construction, sale price, floor space for sale, etc
Property developers faced difficulty in obtaining financing-facilities from “other sources”
GDP slowed for 6
consecutive quarters;
withdrawal syndrome;
curbing property
sales
GFC Worries of
overdevelopment;
lack of “other”
financing sources
COFACE COUNTRY RISK CONFERENCE 2014 / 11 November 2014 28
/
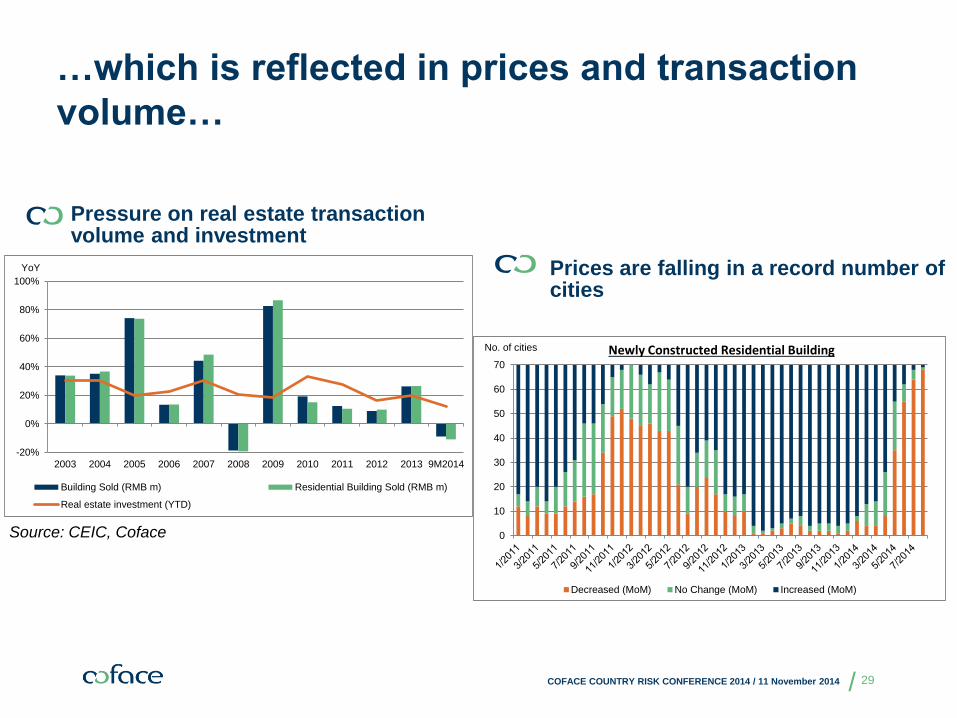
…which is reflected in prices and transaction
volume…
Pressure on real estate transaction volume and investment
Source: CEIC, Coface
Prices are falling in a record number of cities
COFACE COUNTRY RISK CONFERENCE 2014 / 11 November 2014 29
0
10
20
30
40
50
60
70
Decreased (MoM) No Change (MoM) Increased (MoM)
No. of cities Newly Constructed Residential Building
-20%
0%
20%
40%
60%
80%
100%
2003 2004 2005 2006 2007 2008 2009 2010 2011 2012 2013 9M2014
Building Sold (RMB m) Residential Building Sold (RMB m)
Real estate investment (YTD)
YoY

/
…but the property market is too important to
see no support…
And land sales represent a key role in government financing
Property market takes a key position in banks’ portfolio
Source: CEIC, Coface
COFACE COUNTRY RISK CONFERENCE 2014 / 11 November 2014 30
18.9%
19.4%
19.9%
20.4%
20.9%
21.4%
0%
20%
40%
60%
80%
100%
3Q10 1Q11 3Q11 1Q12 3Q12 1Q13 3Q13 1Q14
Individual Housing Mortgage/Real Estate Loan
Real Estate Development Loan/Real Estate Loan
Real Estate Loan/Total RMB Loan (RHS)6,000,000
8,000,000
10,000,000
12,000,000
14,000,000
16,000,000
0%
5%
10%
15%
20%
25%
30%
35%
2009 2010 2011 2012 2013
Government revenue (RHS)
Debt issuance / Govt revenue
Income from land usage right transfer/ Govt revenue
RMB m
/
Consumer goods
Designed to be the new growth driver for the economy
Benefited from rising income and new sales channels
Hurt by anti-corruption scheme
Source: Coface
Why do we talk about it?
COFACE COUNTRY RISK CONFERENCE 2014 / 11 November 2014 31
/
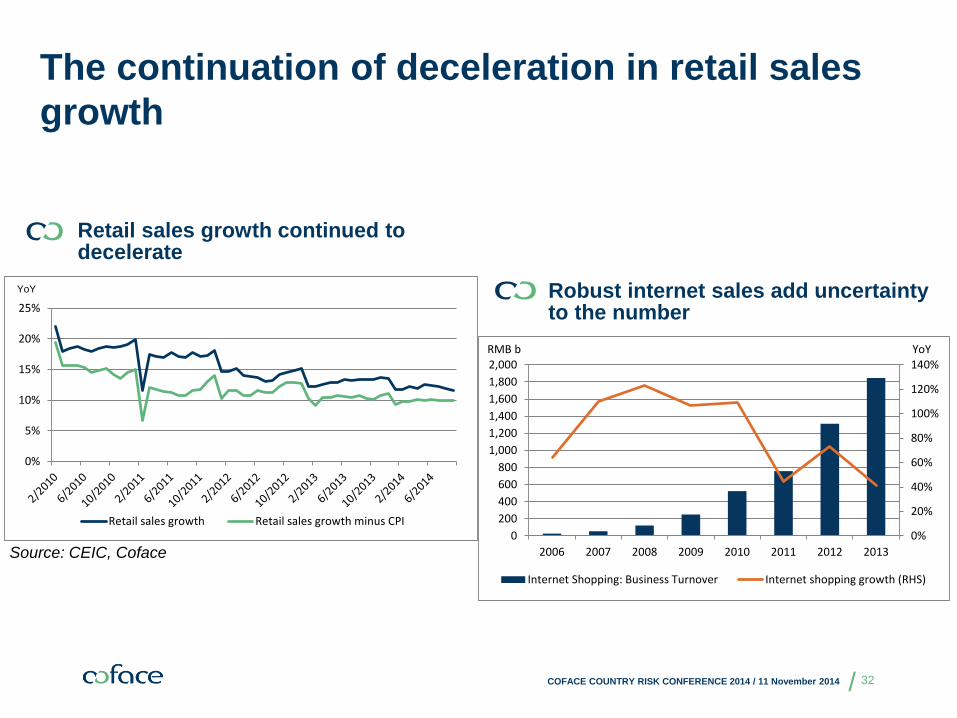
The continuation of deceleration in retail sales
growth
Source: CEIC, Coface
Retail sales growth continued to decelerate
Robust internet sales add uncertainty to the number
COFACE COUNTRY RISK CONFERENCE 2014 / 11 November 2014 32
0%
20%
40%
60%
80%
100%
120%
140%
0
200
400
600
800
1,000
1,200
1,400
1,600
1,800
2,000
2006 2007 2008 2009 2010 2011 2012 2013
Internet Shopping: Business Turnover Internet shopping growth (RHS)
RMB b YoY
0%
5%
10%
15%
20%
25%
Retail sales growth Retail sales growth minus CPI
YoY

/
Consumptions hurt via anti-corruption regime
But liquor and other luxury goods are hurt extensively by the anti-corruption scheme
Demand for necessity items continue to benefit from income growth
Source: CEIC, Coface
-40%
-30%
-20%
-10%
0%
10%
20%
30%
40%
社會消費品零售總額(200家最大零售企業):食品
社會消費品零售總額(200家最大零售企業):飲料
社會消費品零售總額(200家最大零售企業):生活用品
同比增長
-60.0%
-40.0%
-20.0%
0.0%
20.0%
40.0%
60.0%
80.0%
100.0%
社會消費品零售總額(200家最大的零售企業):白酒
COFACE COUNTRY RISK CONFERENCE 2014 / 11 November 2014 33
-40%
-30%
-20%
-10%
0%
10%
20%
30%
40%
Retail sales of 200 largest retail enterprise: food
Retail sales of 200 largest retail enterprise: beverage
Retail sales of 200 largest retail enterprise: articles for daily use
YoY
-60.0%
-40.0%
-20.0%
0.0%
20.0%
40.0%
60.0%
80.0%
100.0%
Retail sales of 200 largest retail enterprise: liquor

/
Other barriers of a breakthrough in retail
sales
Widening gap between urban and rural households may be a barrier
Consumers are less-eager to spend with positive interest rate
Source: CEIC, Coface estimates
COFACE COUNTRY RISK CONFERENCE 2014 / 11 November 2014 34
0
5,000
10,000
15,000
20,000
0%
5%
10%
15%
20%
25%
Difference between urban and rural per capita income (RHS)
Cash income per capita for rural household
Disposable income per capita for urban households
YoY RMB
-7%
-6%
-5%
-4%
-3%
-2%
-1%
0%
1%
2%
Saving deposit rate minus CPI 1-year time-deposit rate minus CPI

/
Steel
A barometer for the other sectors in China (property, construction, shipping, automobile, electronics, etc.)
A traditionally important industry that is facing tremendous pressure – provides indication of government policy direction
Arguably a price-setter for the regional market
Source: Coface
Why do we talk about it?
COFACE COUNTRY RISK CONFERENCE 2014 / 11 November 2014 35
/
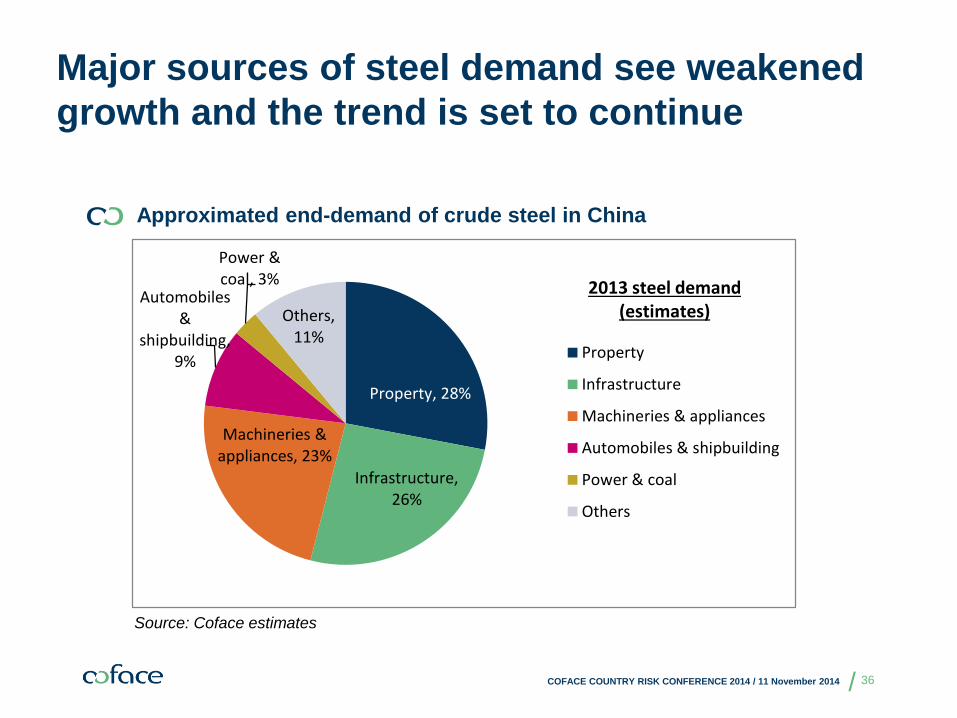
Major sources of steel demand see weakened
growth and the trend is set to continue
Approximated end-demand of crude steel in China
Source: Coface estimates
COFACE COUNTRY RISK CONFERENCE 2014 / 11 November 2014 36
Property, 28%
Infrastructure, 26%
Machineries & appliances, 23%
Automobiles &
shipbuilding, 9%
Power & coal, 3%
Others, 11%
Property
Infrastructure
Machineries & appliances
Automobiles & shipbuilding
Power & coal
Others
2013 steel demand (estimates)
/
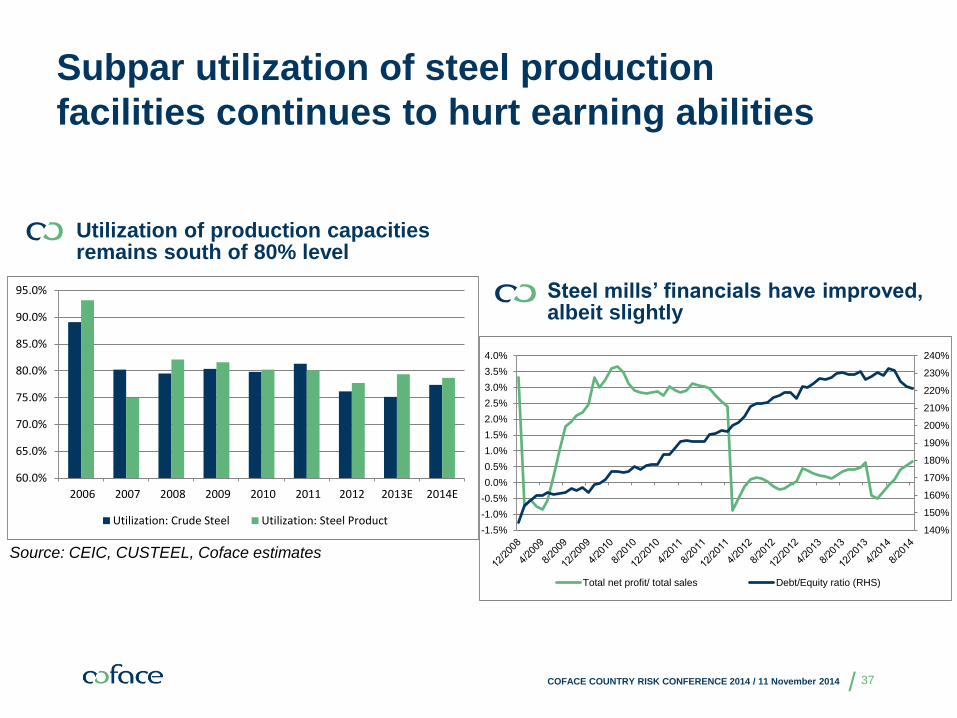
Subpar utilization of steel production
facilities continues to hurt earning abilities
Steel mills’ financials have improved, albeit slightly
Utilization of production capacities remains south of 80% level
Source: CEIC, CUSTEEL, Coface estimates
COFACE COUNTRY RISK CONFERENCE 2014 / 11 November 2014 37
140%
150%
160%
170%
180%
190%
200%
210%
220%
230%
240%
-1.5%
-1.0%
-0.5%
0.0%
0.5%
1.0%
1.5%
2.0%
2.5%
3.0%
3.5%
4.0%
Total net profit/ total sales Debt/Equity ratio (RHS)
60.0%
65.0%
70.0%
75.0%
80.0%
85.0%
90.0%
95.0%
2006 2007 2008 2009 2010 2011 2012 2013E 2014E
Utilization: Crude Steel Utilization: Steel Product

/
Crude steel = Coke (from coking coal) + iron ore
+ scrap steel
Already depressed coal prices have limited downside unless we will see a collapse of the industry
High iron ore inventory is depressing prices
Source: CEIC, Coface
COFACE COUNTRY RISK CONFERENCE 2014 / 11 November 2014 38
0
20,000
40,000
60,000
80,000
100,000
120,000
Iron ore inventory at Ports
'000 tons
3,500
4,000
4,500
5,000
5,500
6,000
6,500
7,000
7,500
8,000
8,500
360
410
460
510
560
610
660
710
01/13 03/13 05/13 07/13 09/13 11/13 01/14 03/14 05/14 07/14 09/14
Coal Inventory: Port: Qinhuangdao 5800 Calorie: Datong High-quality
5500 Calorie: Shanxi High-quality 5000 Calorie: Shanxi Common
4500 Calorie: Common
RMB/t k tons
/
Content
Macroeconomic environment
Sectoral development
Property
Consumer goods
Steel
Conclusion
COFACE COUNTRY RISK CONFERENCE 2014 / 11 November 2014 39

/
Companies concern most on Chinese economic slowdown and tightening monetary policy and
access to credit.
Coface’s Payment Survey :
Most Concerning Factors in 2014
61.2%
16.3%
25.6%
50.0%
8.8% 3.3%
0%
20%
40%
60%
80%
Chinese economicslowdown
global economicslowdown
rising labour costs tightening monetarypolicy and access to
credit
RMB appreciation others
Most concerning factors in 2014
Multiple answers
Source: Coface (February)
COFACE COUNTRY RISK CONFERENCE 2014 / 11 November 2014 40

/
Expectation of near-term development
Policy stance
• Reform to continue at a managed pace
• Continuation of targeted-stimulus approach as a stabilizer for growth
• Growth target to moderate in 2015
Liquidity
• More active open market operations to manage liquidity
• Stricter regulations on shadow-banking facilitators
• Further assistance extended to SMEs and micro firms
Property market
• Demand to stay at low level
• Price pressure remains as inventory awaits to be digested
• Less-strict policy stance expected to be used as a “stimulus” for the market, but effectiveness is unclear
Retail sales
• Slower demand growth for necessity items with moderated income growth
• Anti-corruption scheme to have lesser effect on consumption as a result of base-effect
• Rising competition for sales outlets with bricks and mortar
Steel
• Accelerated dismantling of outdated production capacity
• Medium-sized steel mills to face liquidity pressure
• Profitability to remain at depressed level
• Low value-added traders to be out of business
Source: Coface
COFACE COUNTRY RISK CONFERENCE 2014 / 11 November 2014 41
/
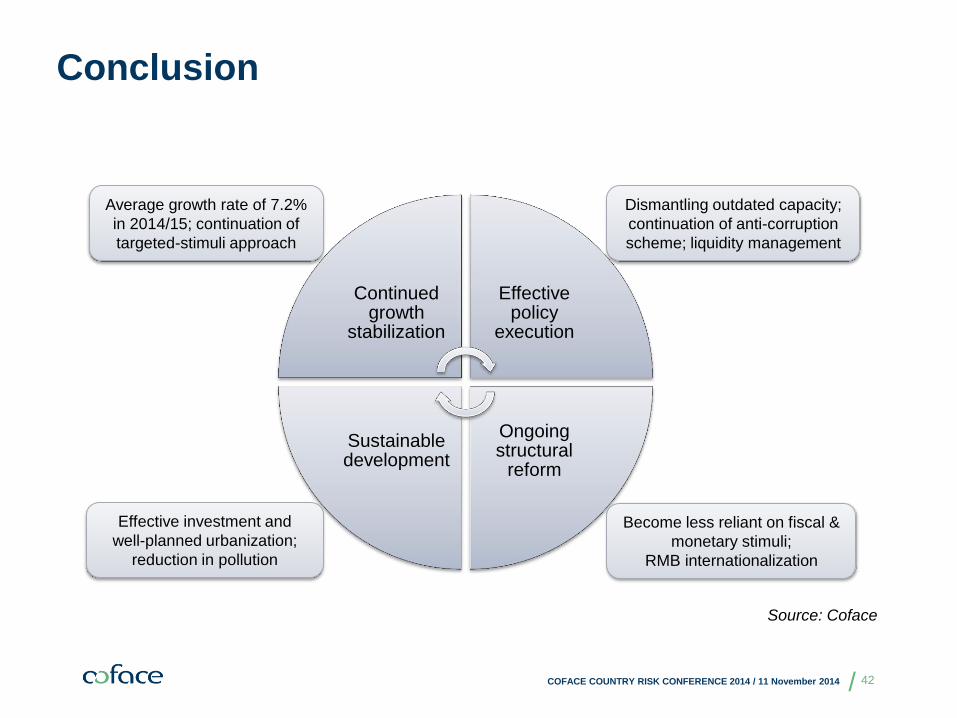
Conclusion
Continued growth
stabilization
Effective policy
execution
Ongoing structural
reform
Sustainable development
Source: Coface
Average growth rate of 7.2%
in 2014/15; continuation of
targeted-stimuli approach
Effective investment and
well-planned urbanization;
reduction in pollution
Dismantling outdated capacity;
continuation of anti-corruption
scheme; liquidity management
Become less reliant on fiscal &
monetary stimuli;
RMB internationalization
COFACE COUNTRY RISK CONFERENCE 2014 / 11 November 2014 42