Embed Size (px)
Citation preview

2015 CFA Institute Research Challenge-Kansas CityUniversity of Missouri – Kansas CitySponsored by the CFA Society Kansas City
Paul FrauenAdam McCluskySam Snider
2
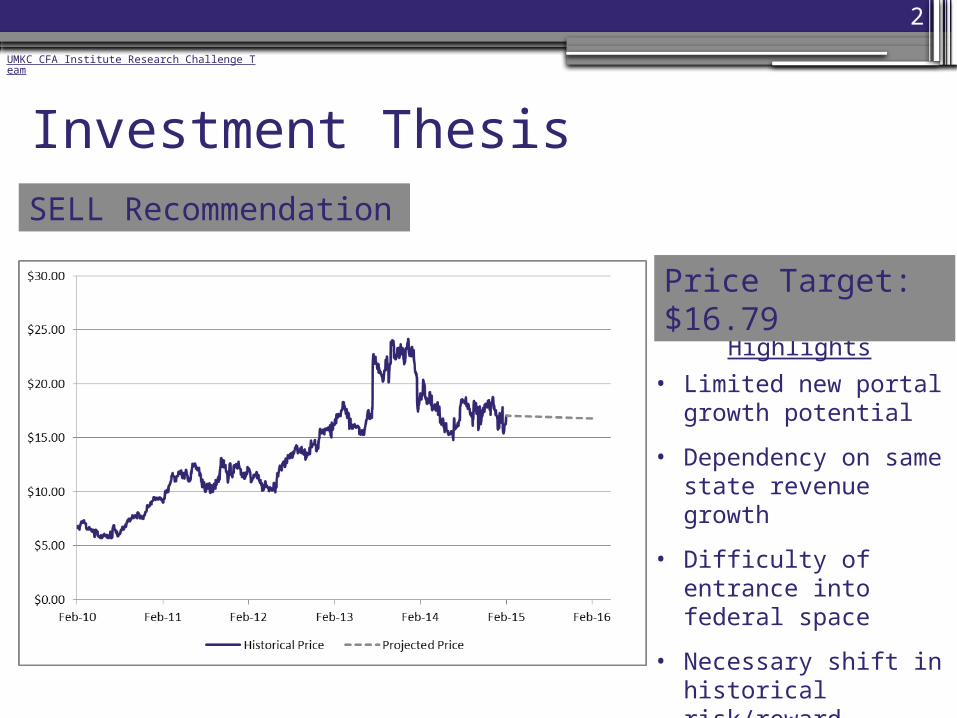
Investment ThesisSELL Recommendation
Highlights
• Limited new portal growth potential
• Dependency on same state revenue growth
• Difficulty of entrance into federal space
• Necessary shift in historical risk/reward profile
Price Target: $16.79
UMKC CFA Institute Research Challenge Team

3
Investment Thesis: Coming to a Crossroads
Risk/Reward Profile
Valuation ConclusionInvestment
Thesis
Current EGOV Positioning
UMKC CFA Institute Research Challenge Team
4
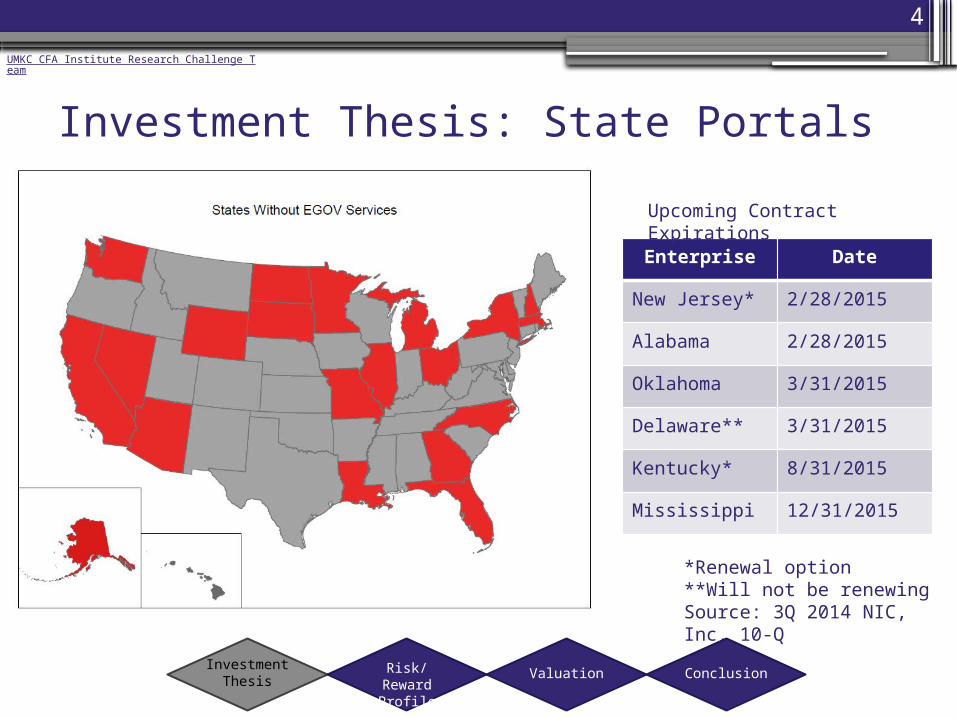
Investment Thesis: State Portals
Enterprise Date
New Jersey* 2/28/2015
Alabama 2/28/2015
Oklahoma 3/31/2015
Delaware** 3/31/2015
Kentucky* 8/31/2015
Mississippi 12/31/2015
Upcoming Contract Expirations
*Renewal option**Will not be renewingSource: 3Q 2014 NIC, Inc. 10-Q
Risk/Reward Profile
Valuation ConclusionInvestment
Thesis
UMKC CFA Institute Research Challenge Team

5
Risk/Reward Profile: HistoricalLow Risk:▫Minimal upfront investment ($0.5-1M)
▫No debt servicing obligations
▫Lack of third party competition at the enterprise level
Risk/Reward Profile
Valuation ConclusionInvestment
Thesis
UMKC CFA Institute Research Challenge Team
6
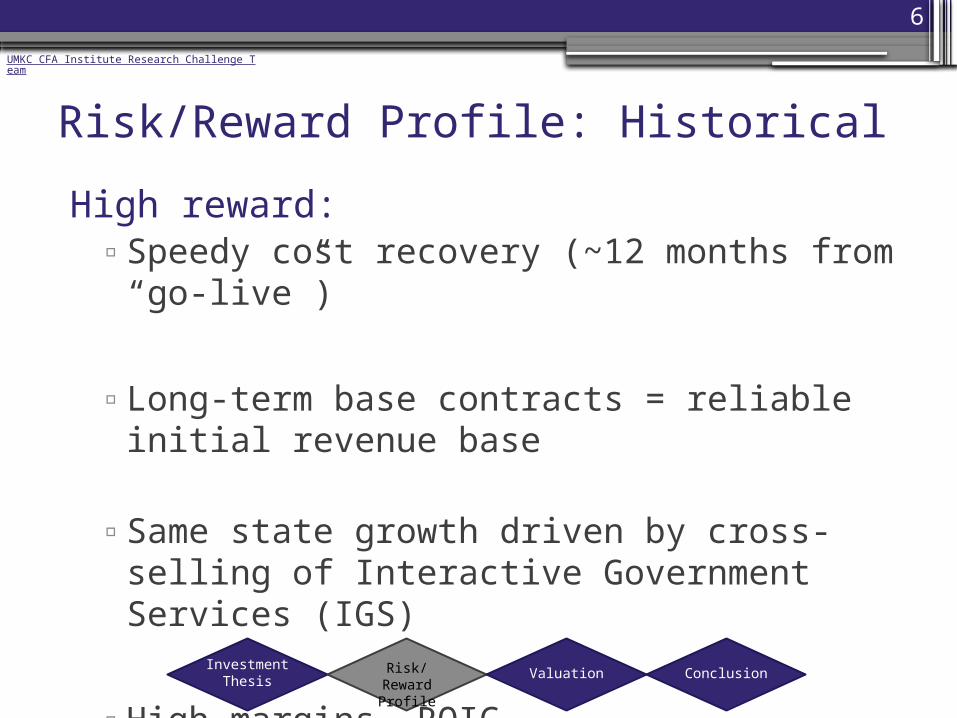
Risk/Reward Profile: HistoricalHigh reward:▫Speedy cost recovery (~12 months from
“go-live”)
▫Long-term base contracts = reliable initial revenue base
▫Same state growth driven by cross-selling of Interactive Government Services (IGS)
▫High margins, ROICRisk/Reward
ProfileValuation Conclusion
Investment Thesis
UMKC CFA Institute Research Challenge Team

7
Risk/Reward Profile: Forward Looking
Risk/Reward Profile
Valuation ConclusionInvestment
Thesis
Risk Implications
Diminishing opportunities for new state contracts
• Retention of existing contracts and same state growth critically important
• Forced to compete at the agency level
Maturation of existing contracts • Cross-selling opportunities diminish
States’ desire for flexibility (short-term renewals, alternative funding arrangements)
• Revenue stream becomes less predictable
Bureaucratic hurdles and capacity/scalability concerns at the federal level
• Requires significantly more investment with uncertain payback period
UMKC CFA Institute Research Challenge Team
8
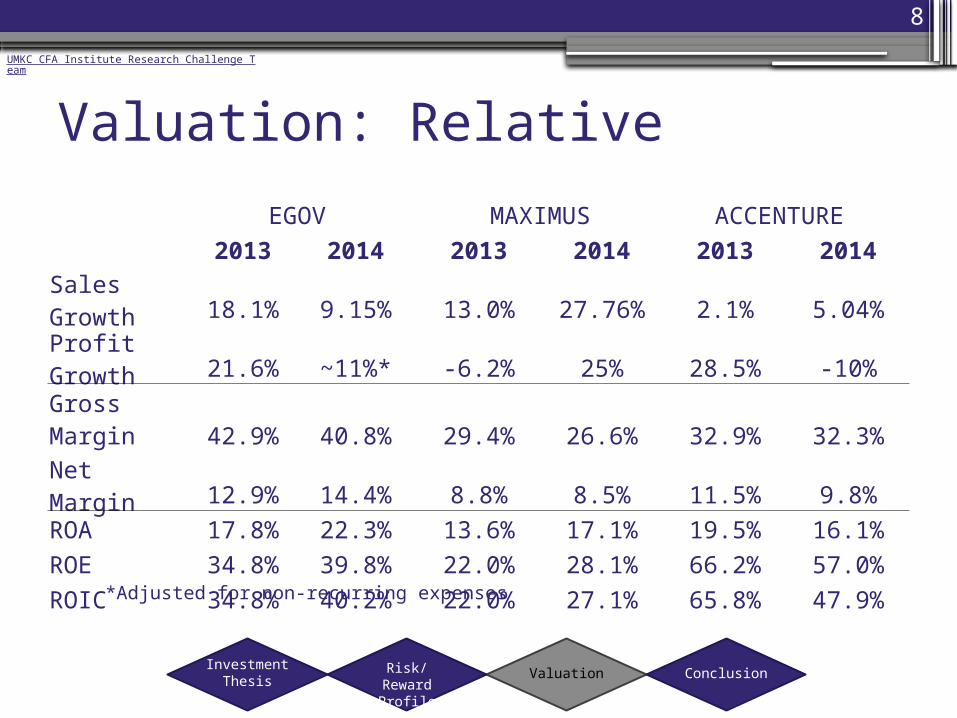
Valuation: Relative
Valuation ConclusionRisk/Reward Profile
EGOV MAXIMUS ACCENTURE 2013 2014 2013 2014 2013 2014
Sales Growth 18.1% 9.15% 13.0% 27.76% 2.1% 5.04%Profit Growth 21.6% ~11%* -6.2% 25% 28.5% -10%
Gross Margin 42.9% 40.8% 29.4% 26.6% 32.9% 32.3%Net Margin 12.9% 14.4% 8.8% 8.5% 11.5% 9.8%ROA 17.8% 22.3% 13.6% 17.1% 19.5% 16.1%ROE 34.8% 39.8% 22.0% 28.1% 66.2% 57.0%ROIC 34.8% 40.2% 22.0% 27.1% 65.8% 47.9%
*Adjusted for non-recurring expenses
Investment Thesis
UMKC CFA Institute Research Challenge Team
9
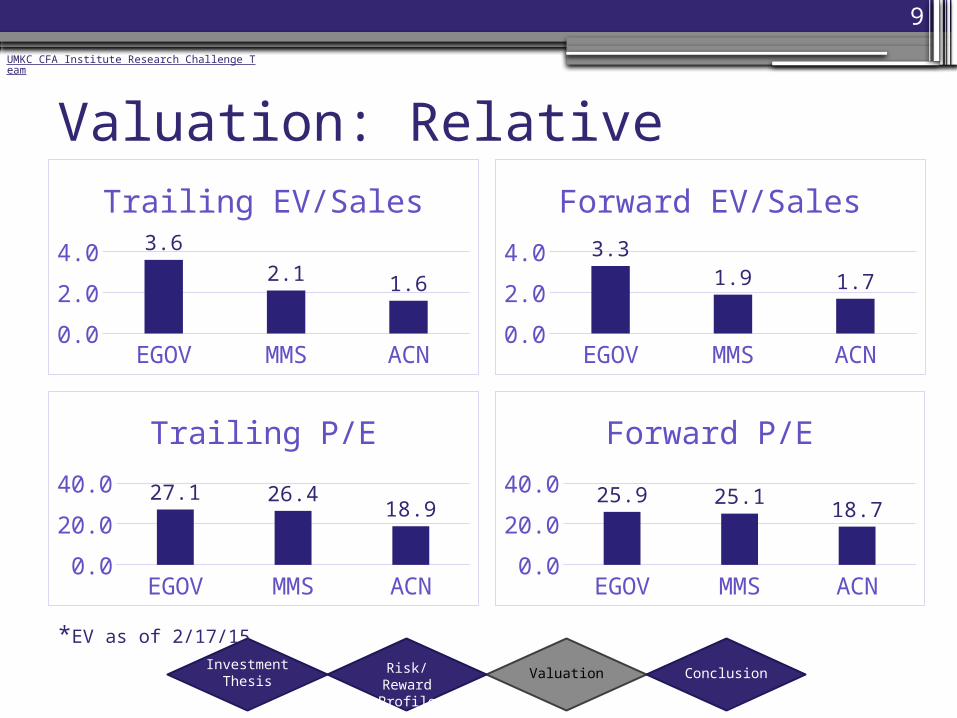
Valuation: Relative
EGOV MMS ACN0.0
2.0
4.0 3.6
2.1 1.6
Trailing EV/Sales
EGOV MMS ACN0.0
2.0
4.0 3.3
1.9 1.7
Forward EV/Sales
Valuation ConclusionRisk/Reward Profile
Investment Thesis
EGOV MMS ACN0.0
10.020.030.0 27.1 26.4
18.9
Trailing P/E
EGOV MMS ACN0.0
10.020.030.0 25.9 25.1
18.7
Forward P/E
*EV as of 2/17/15
UMKC CFA Institute Research Challenge Team

10
Valuation: RelativeRelative:$15.77
Valuation ConclusionRisk/Reward Profile
Investment Thesis
*EV as of 1/21/15
UMKC CFA Institute Research Challenge Team
11
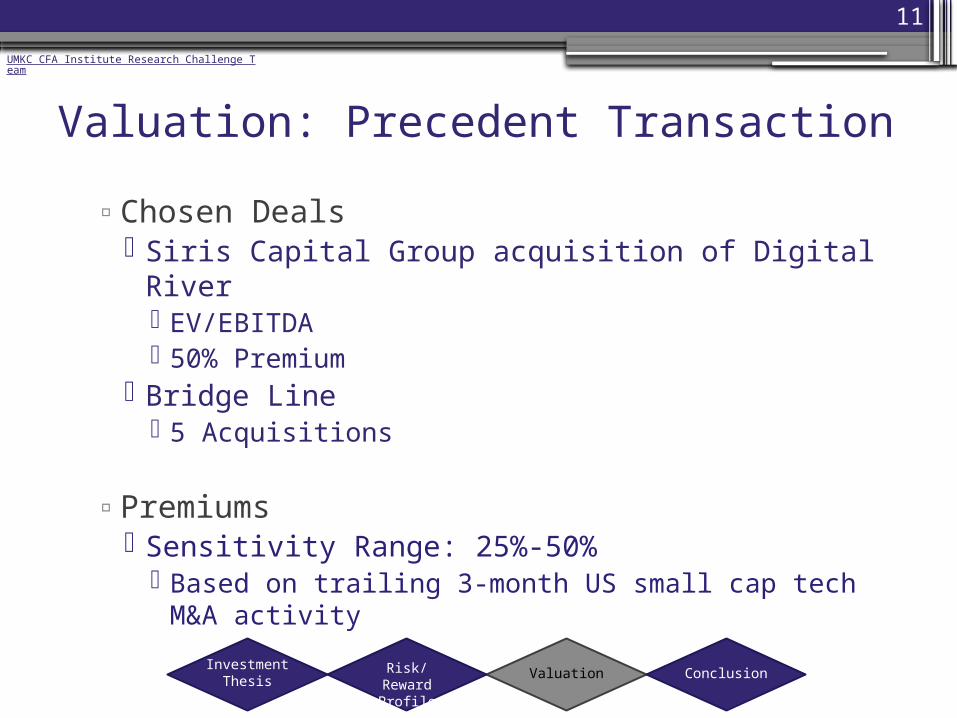
Valuation: Precedent Transaction
▫Chosen Deals Siris Capital Group acquisition of Digital River
EV/EBITDA 50% Premium
Bridge Line 5 Acquisitions
▫Premiums Sensitivity Range: 25%-50%
Based on trailing 3-month US small cap tech M&A activity
Valuation ConclusionRisk/Reward Profile
Investment Thesis
UMKC CFA Institute Research Challenge Team
12
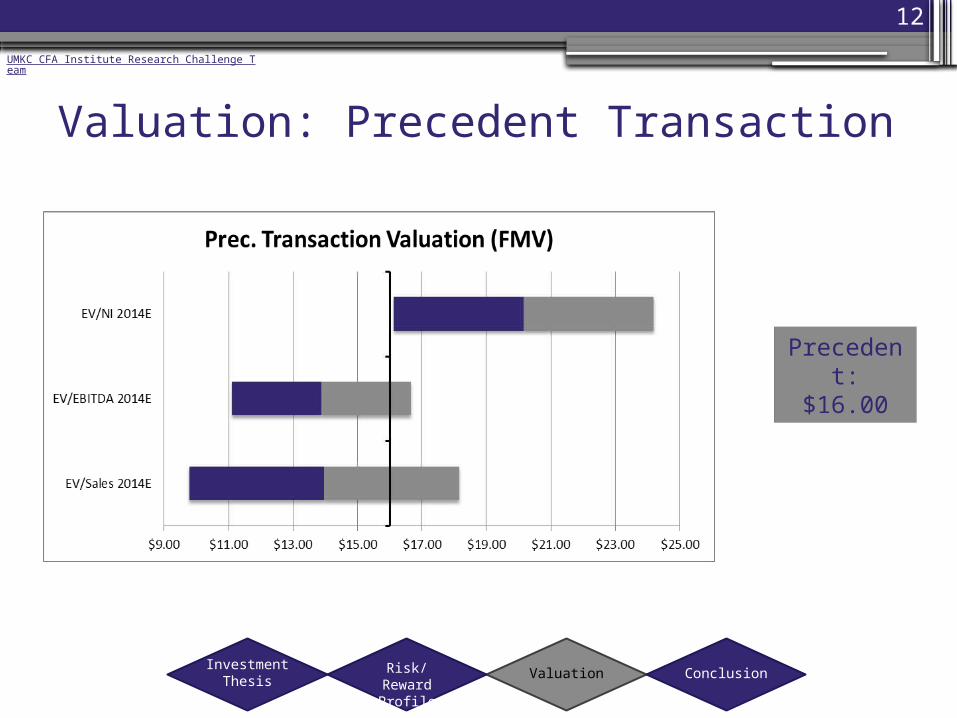
Valuation: Precedent Transaction
Precedent:
$16.00
Valuation ConclusionRisk/Reward Profile
Investment Thesis
UMKC CFA Institute Research Challenge Team
13
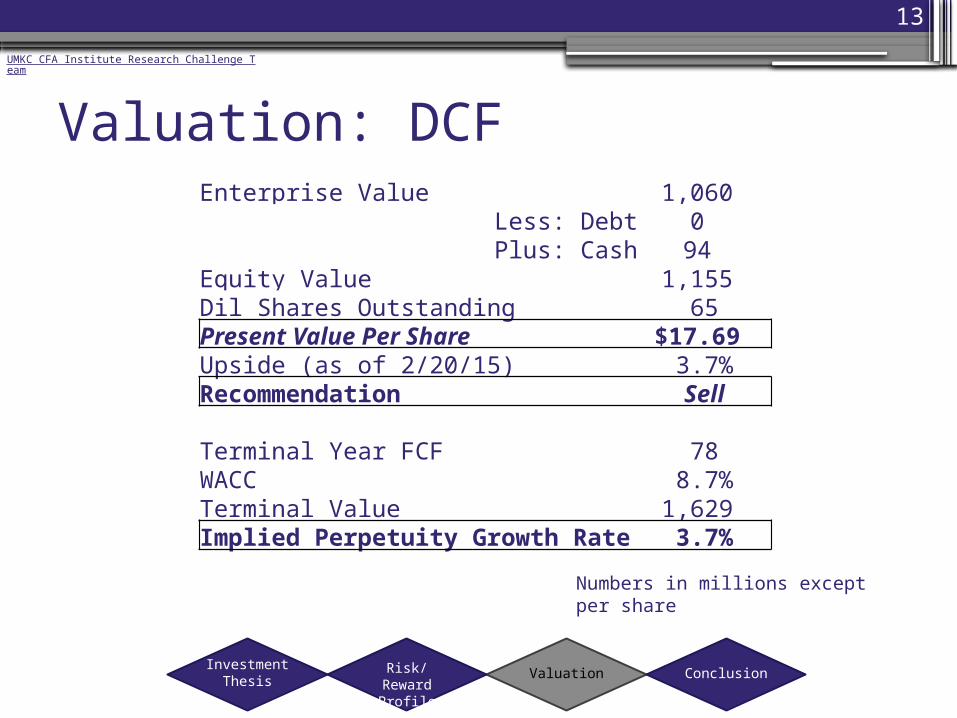
Valuation: DCF
Valuation ConclusionRisk/Reward Profile
Enterprise Value 1,060 Less: Debt 0 Plus: Cash 94
Equity Value 1,155 Dil Shares Outstanding 65Present Value Per Share $17.69 Upside (as of 2/20/15) 3.7%Recommendation Sell
Terminal Year FCF 78WACC 8.7%Terminal Value 1,629 Implied Perpetuity Growth Rate 3.7%
Investment Thesis
UMKC CFA Institute Research Challenge Team
Numbers in millions except per share

14
Valuation: DCFInput Assumptions/Methodology
Revenue* Simulated using 5 scenarios ranging from worst case to best case
Margins Small but steady increase as benefits of operating leverage are partially offset by additional federal spending
Effective Tax Rate Held constant at 39% (consistent with company guidance and historical average)
CAPEX Growth parallels revenue growth
WACC* Cost of equity: CAPMCost of debt: N/A (assume constant capital structure)
Exit Multiple* 11.0x EBITDA (based on relative valuation)* Indicates highly sensitive inputs
Valuation ConclusionRisk/Reward Profile
Investment Thesis
UMKC CFA Institute Research Challenge Team

15
Conclusions and Recommendations
Valuation ConclusionRisk/Reward Profile
SELL Recommendation
Price Target: $16.79
Relative:$15.77
Precedent:
$16.00
DCF:$17.69
25%
25%
50%
Investment Thesis
UMKC CFA Institute Research Challenge Team
16
Company
Overview
ValuationCompetitive Landscape
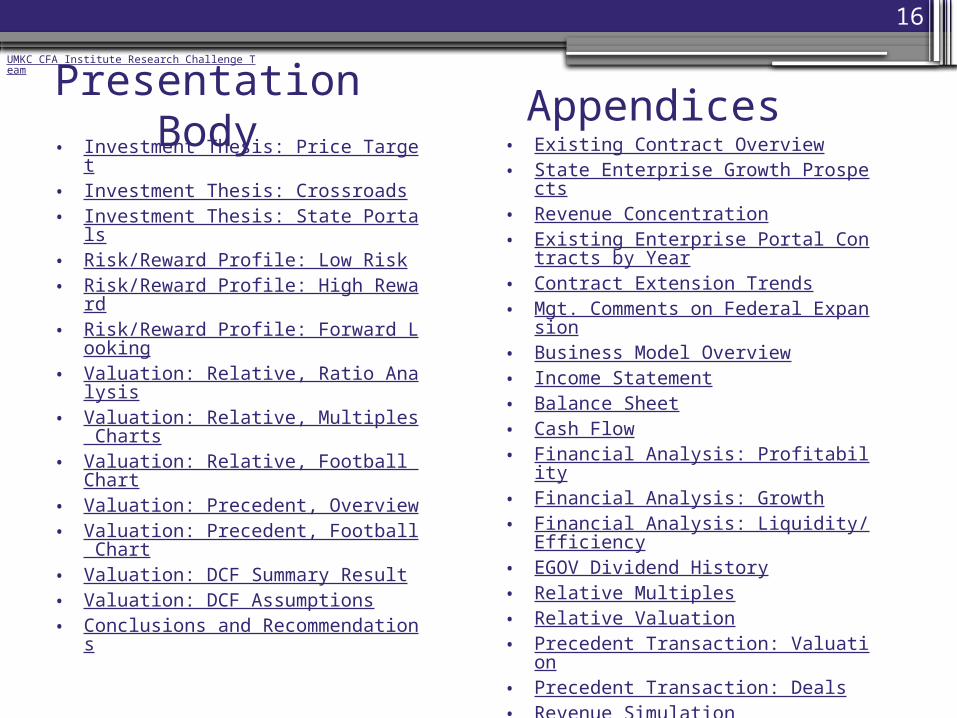
Presentation Body Appendices• Investment Thesis: Price Target• Investment Thesis: Crossroads• Investment Thesis: State Portals• Risk/Reward Profile: Low Risk• Risk/Reward Profile: High Reward• Risk/Reward Profile: Forward Lookin
g• Valuation: Relative, Ratio Analysis• Valuation: Relative, Multiples Charts• Valuation: Relative, Football Chart• Valuation: Precedent, Overview• Valuation: Precedent, Football Chart• Valuation: DCF Summary Result• Valuation: DCF Assumptions• Conclusions and Recommendations
• Existing Contract Overview• State Enterprise Growth Prospects• Revenue Concentration• Existing Enterprise Portal Contracts
by Year• Contract Extension Trends• Mgt. Comments on Federal Expansi
on• Business Model Overview• Income Statement• Balance Sheet• Cash Flow• Financial Analysis: Profitability• Financial Analysis: Growth• Financial Analysis: Liquidity/Efficienc
y• EGOV Dividend History• Relative Multiples• Relative Valuation• Precedent Transaction: Valuation• Precedent Transaction: Deals• Revenue Simulation• State Contract Value Estimation• DCF Model Spreadsheet• DCF Model Results• WACC Estimation• Sensitivity Analysis: Price Sensitivity• Sensitivity Analysis: Terminal Sensiti
vity
UMKC CFA Institute Research Challenge Team

17
Existing Contract Overview▫ 28 Enterprise Contracts
Includes DE (expires March 2015)
▫ 3 Additional States with Agency-Level Contracts New Mexico Virginia Louisiana (currently in pilot phase – no revenue)
▫ 1 Federal Contract Department of Transportation
Federal Motor Carrier Safety Administration
UMKC CFA Institute Research Challenge Team
18
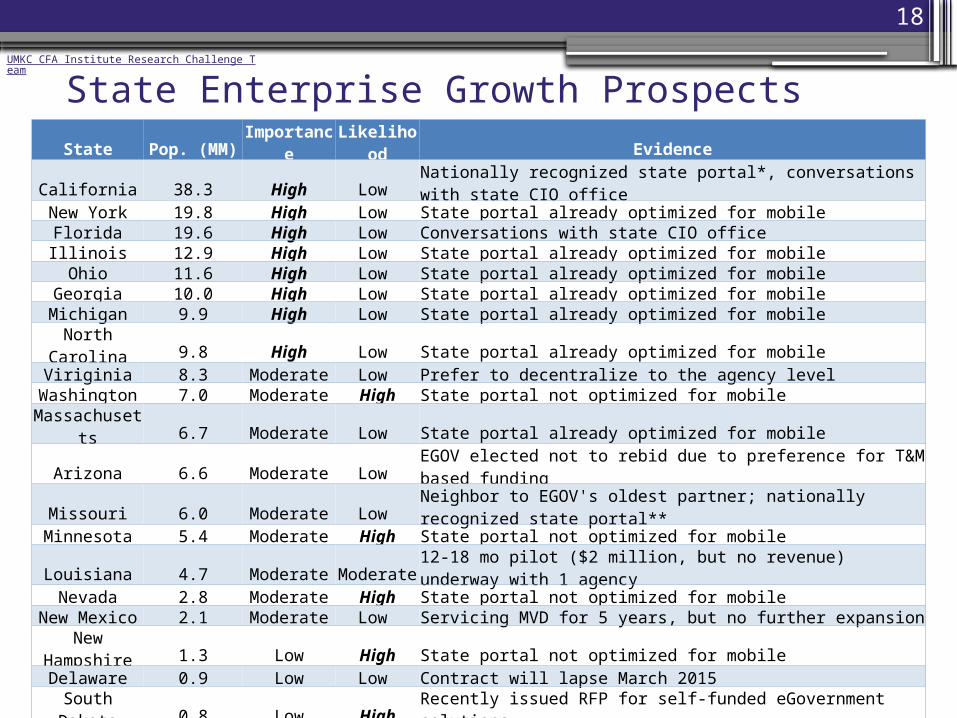
State Enterprise Growth Prospects
Company
Overview
ValuationCompetitive Landscape
State Pop. (MM) Importance Likelihood EvidenceCalifornia 38.3 High Low Nationally recognized state portal*, conversations with state CIO officeNew York 19.8 High Low State portal already optimized for mobile
Florida 19.6 High Low Conversations with state CIO officeIllinois 12.9 High Low State portal already optimized for mobileOhio 11.6 High Low State portal already optimized for mobile
Georgia 10.0 High Low State portal already optimized for mobileMichigan 9.9 High Low State portal already optimized for mobile
North Carolina 9.8 High Low State portal already optimized for mobileViriginia 8.3 Moderate Low Prefer to decentralize to the agency level
Washington 7.0 Moderate High State portal not optimized for mobileMassachusetts 6.7 Moderate Low State portal already optimized for mobile
Arizona 6.6 Moderate Low EGOV elected not to rebid due to preference for T&M based fundingMissouri 6.0 Moderate Low Neighbor to EGOV's oldest partner; nationally recognized state portal**
Minnesota 5.4 Moderate High State portal not optimized for mobileLouisiana 4.7 Moderate Moderate 12-18 mo pilot ($2 million, but no revenue) underway with 1 agencyNevada 2.8 Moderate High State portal not optimized for mobile
New Mexico 2.1 Moderate Low Servicing MVD for 5 years, but no further expansionNew Hampshire 1.3 Low High State portal not optimized for mobile
Delaware 0.9 Low Low Contract will lapse March 2015South Dakota 0.8 Low High Recently issued RFP for self-funded eGovernment solutions
Alaska 0.7 Low High State portal not optimized for mobileNorth Dakota 0.7 Low High State portal not optimized for mobile
Wyoming 0.6 Low High State portal not optimized for mobile*2013 Finalist for Best in the Web: State Portal Category (Center for Digital Government)**2014 Finalist for Best in the Web: State Portal Category (Center for Digital Government)
Estimated number of new state portal contracts: 8 Estimated total number of state portal contracts: 36
UMKC CFA Institute Research Challenge Team
19
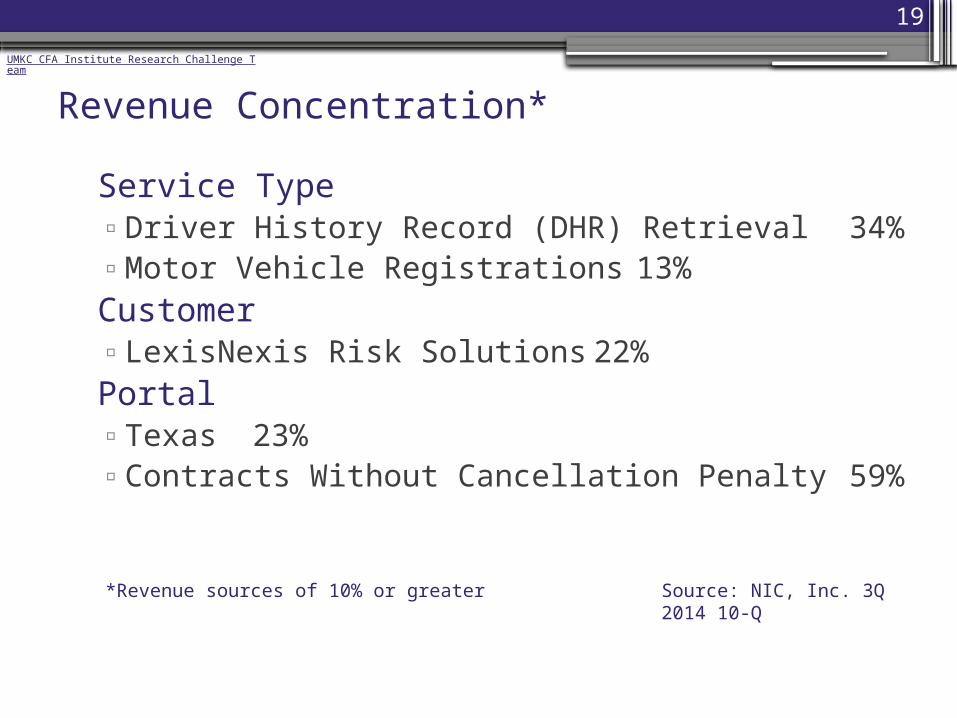
Revenue Concentration*
•Service Type▫Driver History Record (DHR) Retrieval 34%▫Motor Vehicle Registrations 13%
•Customer▫LexisNexis Risk Solutions 22%
•Portal▫Texas 23%▫Contracts Without Cancellation Penalty 59%
*Revenue sources of 10% or greater
Valuation Conclusion
Source: NIC, Inc. 3Q 2014 10-Q
Investment Thesis
UMKC CFA Institute Research Challenge Team
20
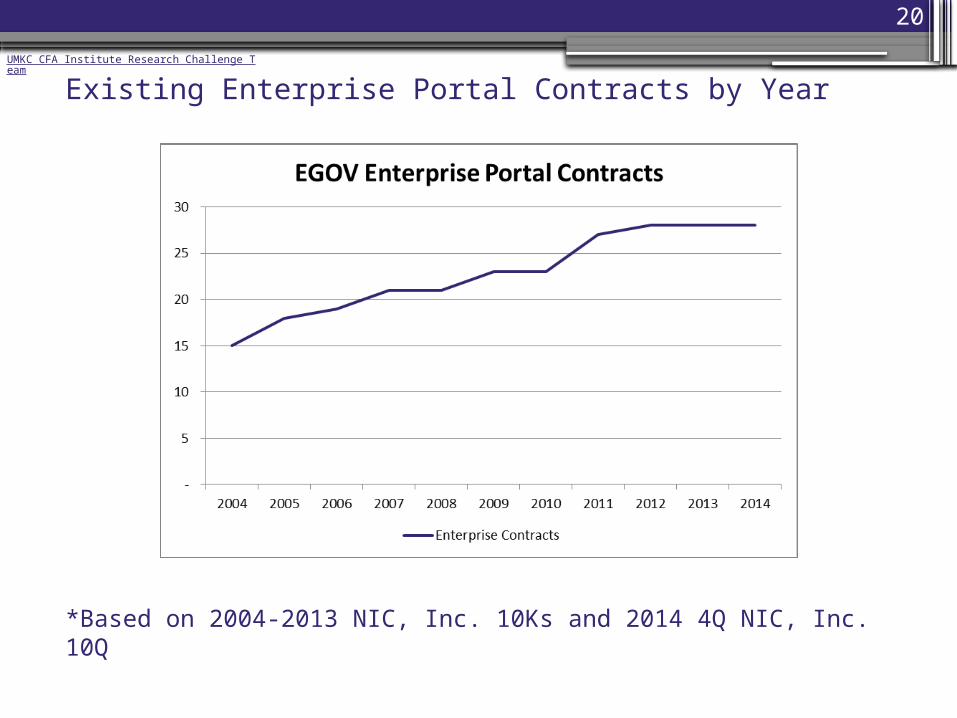
Existing Enterprise Portal Contracts by Year
Company
Overview
ValuationCompetitive Landscape
*Based on 2004-2013 NIC, Inc. 10Ks and 2014 4Q NIC, Inc. 10Q
UMKC CFA Institute Research Challenge Team

21
Contract Renewal Trends
Company
Overview
ValuationCompetitive Landscape
*Based on 2009-2013 NIC, Inc. 10Ks
UMKC CFA Institute Research Challenge Team
22
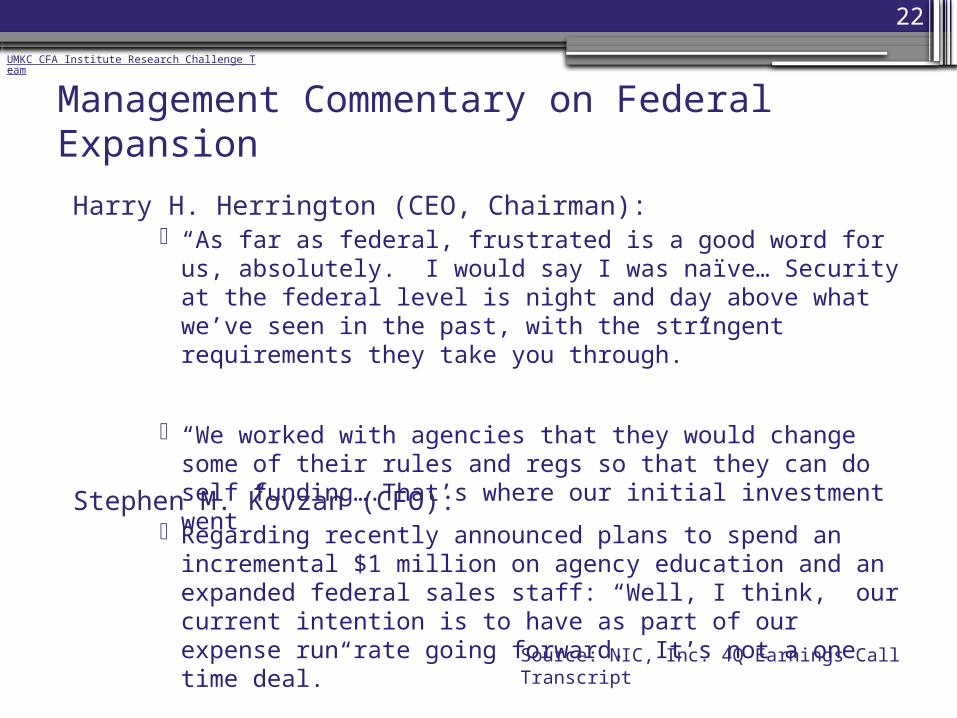
Harry H. Herrington (CEO, Chairman): “As far as federal, frustrated is a good word for us,
absolutely. I would say I was naïve… Security at the federal level is night and day above what we’ve seen in the past, with the stringent requirements they take you through.”
“We worked with agencies that they would change some of their rules and regs so that they can do self funding….That’s where our initial investment went”
Stephen M. Kovzan (CFO): Regarding recently announced plans to spend an
incremental $1 million on agency education and an expanded federal sales staff: “Well, I think, our current intention is to have as part of our expense run rate going forward. It’s not a one time deal.”
Management Commentary on Federal Expansion
Source: NIC, Inc. 4Q Earnings Call Transcript
UMKC CFA Institute Research Challenge Team
23
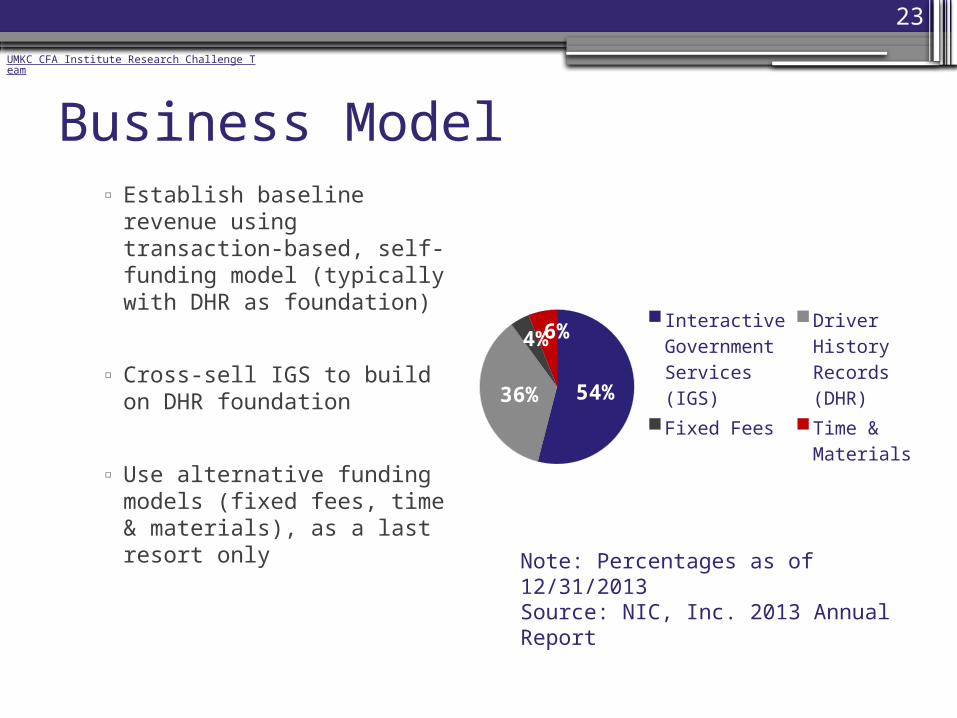
Business Model▫ Establish baseline
revenue using transaction-based, self-funding model (typically with DHR as foundation)
▫ Cross-sell IGS to build on DHR foundation
▫ Use alternative funding models (fixed fees, time & materials), as a last resort only
54%36%
4%6%
Interactive Government Services (IGS)Driver History Records (DHR)Fixed Fees Time & Ma-terials
Note: Percentages as of 12/31/2013Source: NIC, Inc. 2013 Annual Report
UMKC CFA Institute Research Challenge Team

24
NIC Inc (EGOV US) - Income Statement
In Millions of USD except Per Share FY 2007 FY 2008 FY 2009 FY 2010 FY 2011 FY 2012 FY 2013Revenue 85.8 100.6 132.9 161.5 180.9 210.2 249.3 - Cost of Revenue 45.5 55.8 79.2 99.5 108.8 127.6 147.4Gross Profit 40.2 44.8 53.7 62.0 72.1 82.6 101.9 + Other Operating Revenue -- -- 0.0 0.0 0.0 0.0 0.0 - Operating Expenses 24.1 26.2 31.6 32.6 33.6 39.4 49.3Operating Income 16.1 18.6 22.0 29.4 38.5 43.2 52.6 - Interest Expense 0.0 0.0 -- -- -- -- -- - Net Non-Operating Losses (Gains) -2.2 -0.6 -0.1 0.0 0.0 0.0 0.1Pretax Income 18.4 19.3 22.1 29.4 38.5 43.2 52.6 - Income Tax Expense 6.4 7.3 8.1 11.0 15.5 16.8 20.5Annual Tax Rate 35% 38% 37% 38% 40% 39% 39%
Income Before XO Items 12.0 11.9 13.9 18.4 22.9 26.3 32.0Net Income 12.0 11.9 13.9 18.4 22.9 26.3 32.0Net Inc Avail to Common Shareholders 12.0 11.9 13.9 18.4 22.9 26.3 32.0 Abnormal Losses (Gains) -0.3 -- -0.5 2.4 -0.3 0.5 9.1 Tax Effect on Abnormal Items 0.1 -- -0.6 -0.8 0.1 -0.2 -3.3Normalized Income 11.7 11.9 12.9 19.9 22.7 26.7 37.9 Basic EPS Before Abnormal Items 0.18 0.19 0.20 0.31 0.36 0.41 0.58Basic EPS Before XO Items 0.19 0.19 0.22 0.28 0.35 0.40 0.49Basic EPS 0.19 0.19 0.22 0.28 0.35 0.40 0.49 Basic Weighted Avg Shares 61.8 62.5 63.0 63.5 64.0 64.5 64.9Diluted EPS Before Abnormal Items 0.18 0.19 0.20 0.30 0.35 0.41 0.58Diluted EPS Before XO Items 0.19 0.19 0.22 0.28 0.35 0.40 0.49Diluted EPS 0.19 0.19 0.22 0.28 0.35 0.40 0.49 Diluted Weighted Avg Shares 62.5 62.8 63.1 63.6 64.2 64.6 65.0Source: Bloomberg
UMKC CFA Institute Research Challenge Team
25
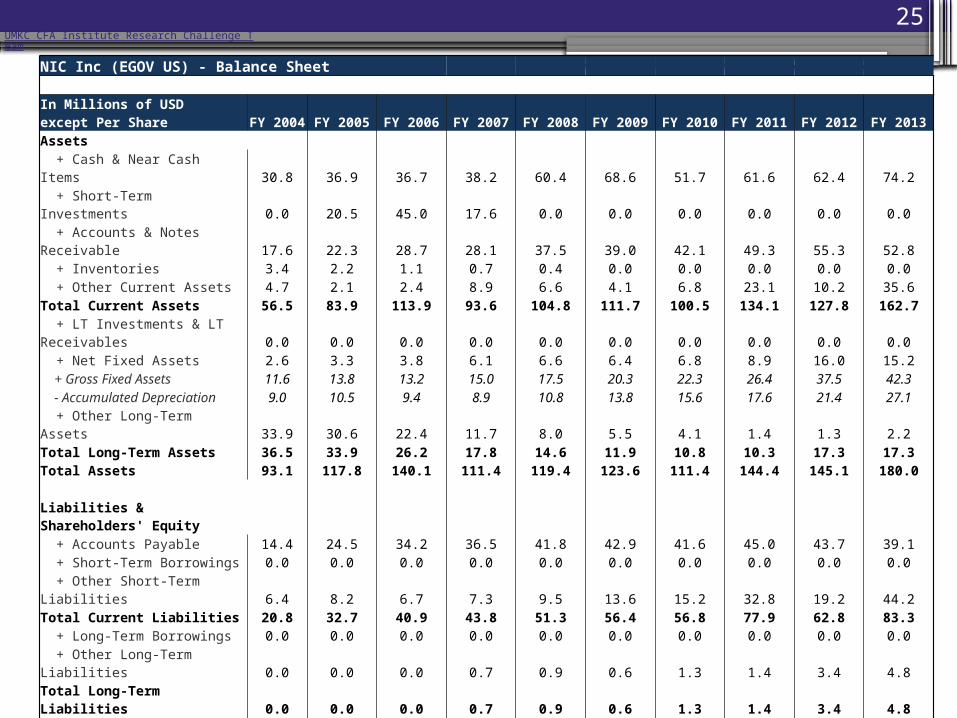
NIC Inc (EGOV US) - Balance Sheet
In Millions of USD except Per Share FY 2004 FY 2005 FY 2006 FY 2007 FY 2008 FY 2009 FY 2010 FY 2011 FY 2012 FY 2013Assets + Cash & Near Cash Items 30.8 36.9 36.7 38.2 60.4 68.6 51.7 61.6 62.4 74.2 + Short-Term Investments 0.0 20.5 45.0 17.6 0.0 0.0 0.0 0.0 0.0 0.0 + Accounts & Notes Receivable 17.6 22.3 28.7 28.1 37.5 39.0 42.1 49.3 55.3 52.8 + Inventories 3.4 2.2 1.1 0.7 0.4 0.0 0.0 0.0 0.0 0.0 + Other Current Assets 4.7 2.1 2.4 8.9 6.6 4.1 6.8 23.1 10.2 35.6Total Current Assets 56.5 83.9 113.9 93.6 104.8 111.7 100.5 134.1 127.8 162.7 + LT Investments & LT Receivables 0.0 0.0 0.0 0.0 0.0 0.0 0.0 0.0 0.0 0.0 + Net Fixed Assets 2.6 3.3 3.8 6.1 6.6 6.4 6.8 8.9 16.0 15.2 + Gross Fixed Assets 11.6 13.8 13.2 15.0 17.5 20.3 22.3 26.4 37.5 42.3 - Accumulated Depreciation 9.0 10.5 9.4 8.9 10.8 13.8 15.6 17.6 21.4 27.1 + Other Long-Term Assets 33.9 30.6 22.4 11.7 8.0 5.5 4.1 1.4 1.3 2.2Total Long-Term Assets 36.5 33.9 26.2 17.8 14.6 11.9 10.8 10.3 17.3 17.3Total Assets 93.1 117.8 140.1 111.4 119.4 123.6 111.4 144.4 145.1 180.0 Liabilities & Shareholders' Equity + Accounts Payable 14.4 24.5 34.2 36.5 41.8 42.9 41.6 45.0 43.7 39.1 + Short-Term Borrowings 0.0 0.0 0.0 0.0 0.0 0.0 0.0 0.0 0.0 0.0 + Other Short-Term Liabilities 6.4 8.2 6.7 7.3 9.5 13.6 15.2 32.8 19.2 44.2Total Current Liabilities 20.8 32.7 40.9 43.8 51.3 56.4 56.8 77.9 62.8 83.3 + Long-Term Borrowings 0.0 0.0 0.0 0.0 0.0 0.0 0.0 0.0 0.0 0.0 + Other Long-Term Liabilities 0.0 0.0 0.0 0.7 0.9 0.6 1.3 1.4 3.4 4.8Total Long-Term Liabilities 0.0 0.0 0.0 0.7 0.9 0.6 1.3 1.4 3.4 4.8Total Liabilities 20.8 32.7 40.9 44.5 52.2 57.0 58.1 79.3 66.2 88.0 + Total Preferred Equity 0.0 0.0 0.0 0.0 0.0 0.0 0.0 0.0 0.0 0.0 + Minority Interest 0.0 0.0 0.0 0.0 0.0 0.0 0.0 0.0 0.0 0.0 + Share Capital & APIC 200.9 207.4 210.2 165.9 154.2 139.6 107.9 96.8 84.3 88.4 + Retained Earnings & Other Equity -128.7 -122.3 -111.0 -99.1 -87.0 -73.0 -54.7 -31.7 -5.4 3.5Total Equity 72.3 85.2 99.3 66.9 67.2 66.6 53.3 65.1 78.9 91.9Total Liabilities & Equity 93.1 117.8 140.1 111.4 119.4 123.6 111.4 144.4 145.1 180.0Source: Bloomberg
UMKC CFA Institute Research Challenge Team
26
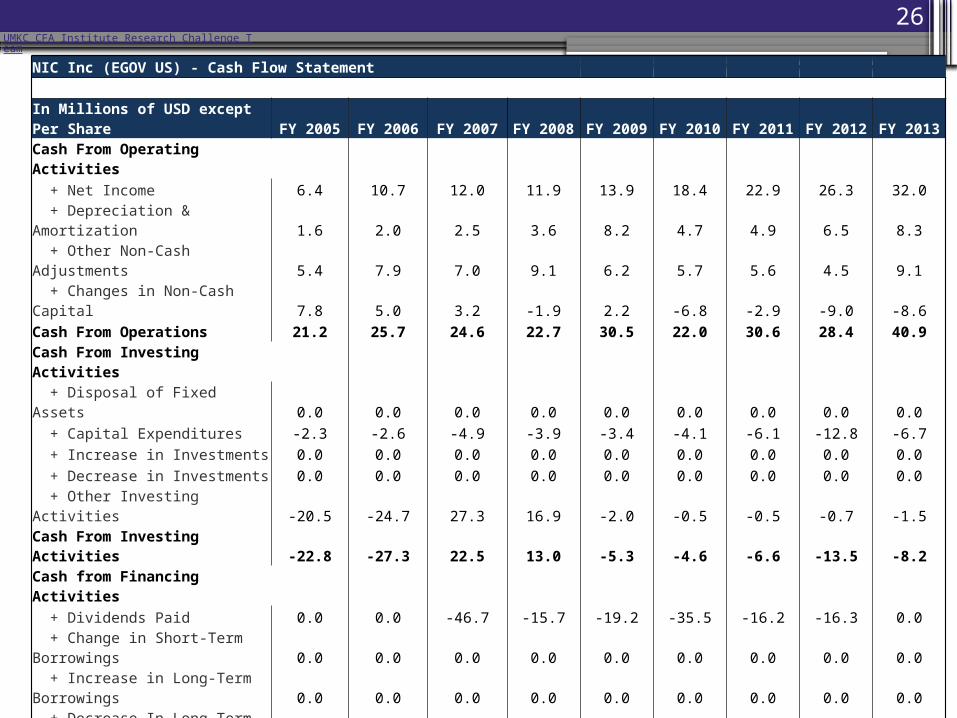
NIC Inc (EGOV US) - Cash Flow Statement
In Millions of USD except Per Share FY 2005 FY 2006 FY 2007 FY 2008 FY 2009 FY 2010 FY 2011 FY 2012 FY 2013
Cash From Operating Activities
+ Net Income 6.4 10.7 12.0 11.9 13.9 18.4 22.9 26.3 32.0
+ Depreciation & Amortization 1.6 2.0 2.5 3.6 8.2 4.7 4.9 6.5 8.3
+ Other Non-Cash Adjustments 5.4 7.9 7.0 9.1 6.2 5.7 5.6 4.5 9.1
+ Changes in Non-Cash Capital 7.8 5.0 3.2 -1.9 2.2 -6.8 -2.9 -9.0 -8.6
Cash From Operations 21.2 25.7 24.6 22.7 30.5 22.0 30.6 28.4 40.9
Cash From Investing Activities
+ Disposal of Fixed Assets 0.0 0.0 0.0 0.0 0.0 0.0 0.0 0.0 0.0
+ Capital Expenditures -2.3 -2.6 -4.9 -3.9 -3.4 -4.1 -6.1 -12.8 -6.7
+ Increase in Investments 0.0 0.0 0.0 0.0 0.0 0.0 0.0 0.0 0.0
+ Decrease in Investments 0.0 0.0 0.0 0.0 0.0 0.0 0.0 0.0 0.0
+ Other Investing Activities -20.5 -24.7 27.3 16.9 -2.0 -0.5 -0.5 -0.7 -1.5
Cash From Investing Activities -22.8 -27.3 22.5 13.0 -5.3 -4.6 -6.6 -13.5 -8.2
Cash from Financing Activities
+ Dividends Paid 0.0 0.0 -46.7 -15.7 -19.2 -35.5 -16.2 -16.3 0.0 + Change in Short-Term Borrowings 0.0 0.0 0.0 0.0 0.0 0.0 0.0 0.0 0.0 + Increase in Long-Term Borrowings 0.0 0.0 0.0 0.0 0.0 0.0 0.0 0.0 0.0 + Decrease In Long-Term Borrowings 0.0 0.0 0.0 0.0 0.0 0.0 0.0 0.0 0.0
+ Increase in Capital Stocks 4.8 1.4 1.1 2.1 2.2 1.1 2.2 2.2 2.2
+ Decrease in Capital Stocks 0.0 0.0 0.0 0.0 0.0 0.0 0.0 0.0 0.0
+ Other Financing Activities 3.0 0.0 0.0 0.0 0.0 0.0 0.0 0.0 -23.0
Cash from Financing Activities 7.8 1.4 -45.6 -13.6 -16.9 -34.4 -14.1 -14.2 -20.8
Net Changes in Cash 6.1 -0.2 1.5 22.1 8.3 -16.9 10.0 0.7 11.9
Direct Method Cashflow Source: Bloomberg
UMKC CFA Institute Research Challenge Team

27
Financial Analysis: Historical Trends
Profitability
2009 2010 2011 2012 20130%
4%
8%
12% 10.5% 11.4%12.7% 12.5% 12.9%
Net Margin
2009 2010 2011 2012 201337%
38%
39%
40%
41%
42%
40.4%
38.4%
39.9%39.3%
40.9%
Gross Margin
2009 2010 2011 2012 20130%
10%
20%
30%
40%
50%
20.8%
30.6%38.8% 36.6% 37.5%
Return on Equity
2009 2010 2011 2012 201326%
30%
34%
30.0%
34.5% 35.3%33.4%
34.8%
Return on Invested Cap-ital
Source: Bloomberg
UMKC CFA Institute Research Challenge Team
28
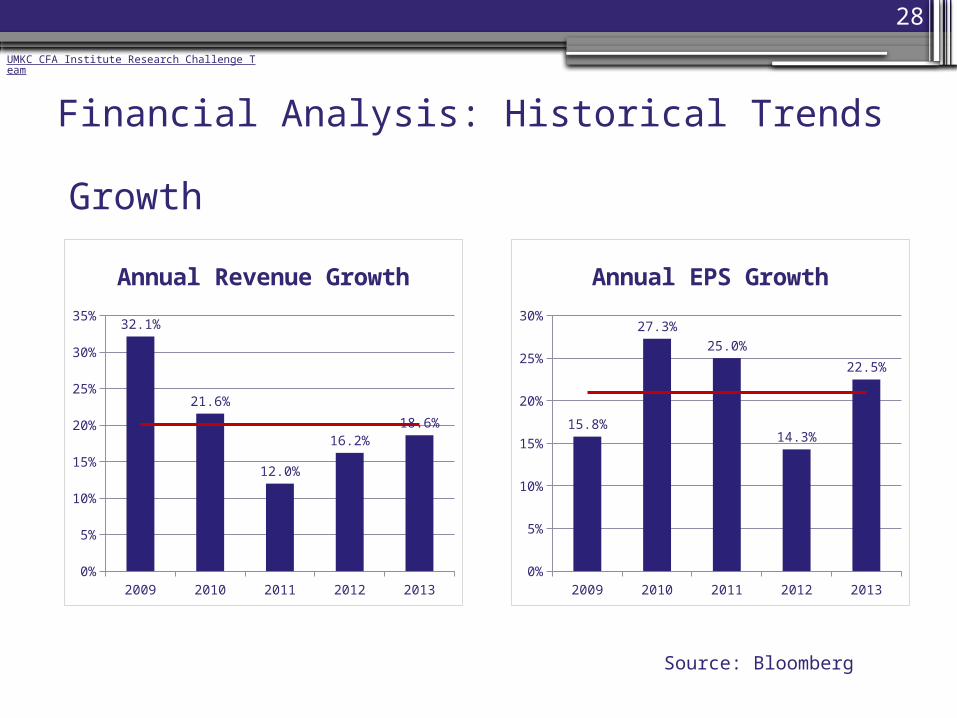
Financial Analysis: Historical Trends
Growth
2009 2010 2011 2012 20130%
5%
10%
15%
20%
25%
30%
35%32.1%
21.6%
12.0%
16.2%18.6%
Annual Revenue Growth
2009 2010 2011 2012 20130%
5%
10%
15%
20%
25%
30%
15.8%
27.3%
25.0%
14.3%
22.5%
Annual EPS Growth
Source: Bloomberg
UMKC CFA Institute Research Challenge Team
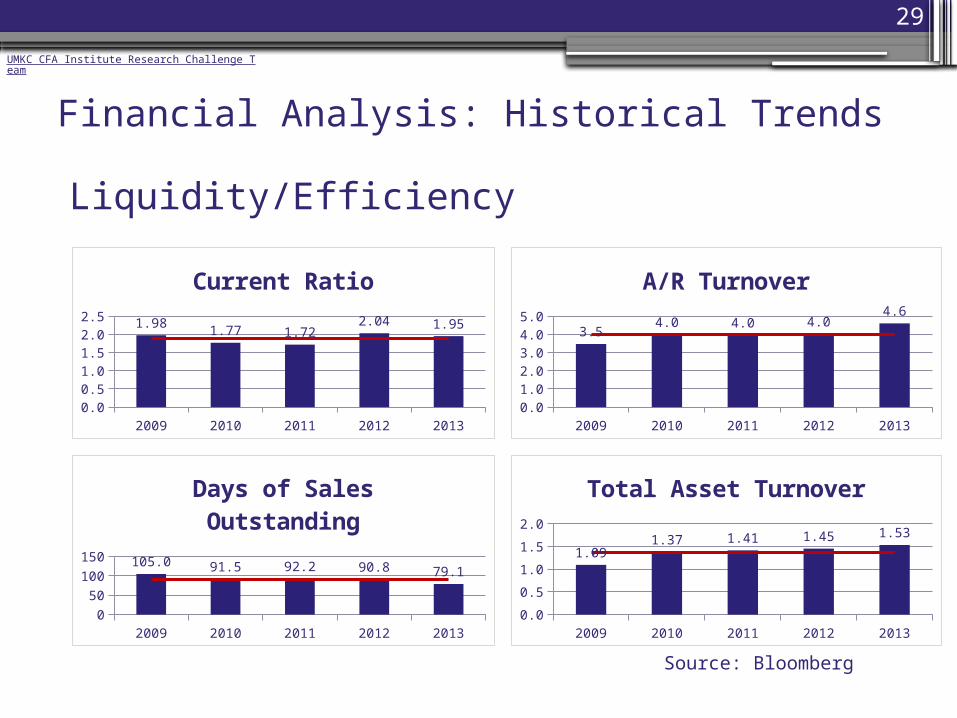
29
Financial Analysis: Historical Trends
Liquidity/Efficiency
Source: Bloomberg
2009 2010 2011 2012 20130.0
0.5
1.0
1.5
2.0
2.51.98
1.77 1.722.04 1.95
Current Ratio
2009 2010 2011 2012 20130.0
1.0
2.0
3.0
4.0
5.0
3.54.0 4.0 4.0
4.6
A/R Turnover
2009 2010 2011 2012 20130
50
100
150105.0 91.5 92.2 90.8 79.1
Days of Sales Outstand-ing
2009 2010 2011 2012 20130.0
0.5
1.0
1.5
2.0
1.091.37 1.41 1.45 1.53
Total Asset Turnover
UMKC CFA Institute Research Challenge Team

30
EGOV Dividend History
39114 39479 39845 40210 40513 40878 41214 41579 41944 $-
$0.10
$0.20
$0.30
$0.40
$0.50
$0.60
$0.70
$0.80 $0.75
$0.25
$0.30 $0.30
$0.25 $0.25 $0.25
$0.35
$0.50
EGOV Special Dividends
Source: Bloomberg
UMKC CFA Institute Research Challenge Team
31
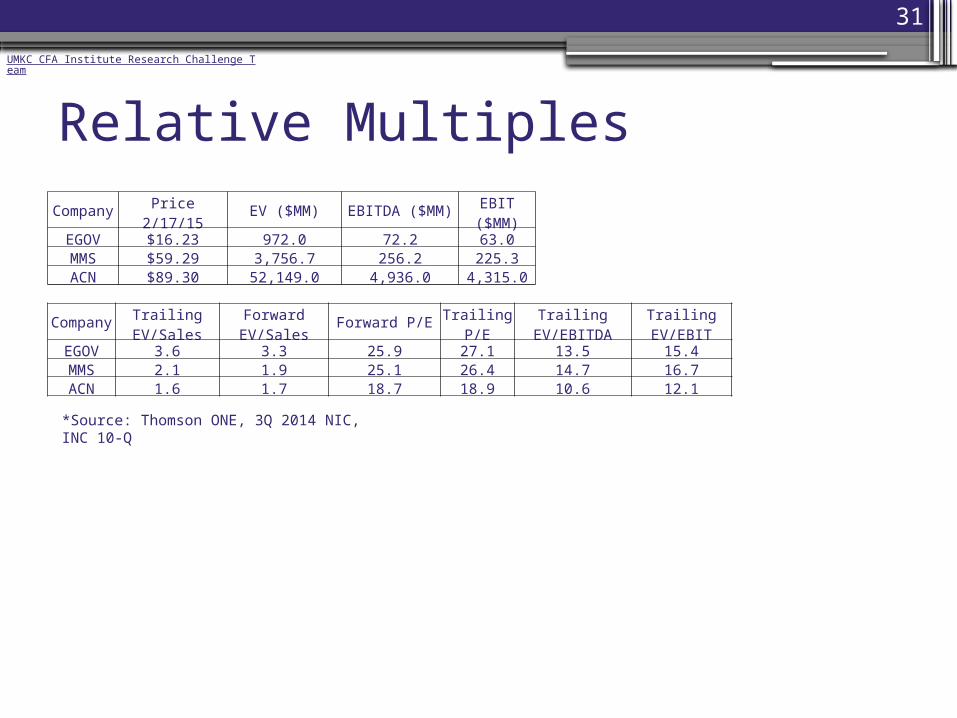
Relative Multiples
Company
Overview
ValuationCompetitive Landscape
Company Price 2/17/15 EV ($MM) EBITDA ($MM) EBIT ($MM)EGOV $16.23 972.0 72.2 63.0MMS $59.29 3,756.7 256.2 225.3ACN $89.30 52,149.0 4,936.0 4,315.0
Company Trailing EV/Sales Forward EV/Sales Forward P/E Trailing P/E Trailing EV/EBITDA Trailing EV/EBITEGOV 3.6 3.3 25.9 27.1 13.5 15.4MMS 2.1 1.9 25.1 26.4 14.7 16.7ACN 1.6 1.7 18.7 18.9 10.6 12.1
*Source: Thomson ONE, 3Q 2014 NIC, INC 10-Q
UMKC CFA Institute Research Challenge Team
32
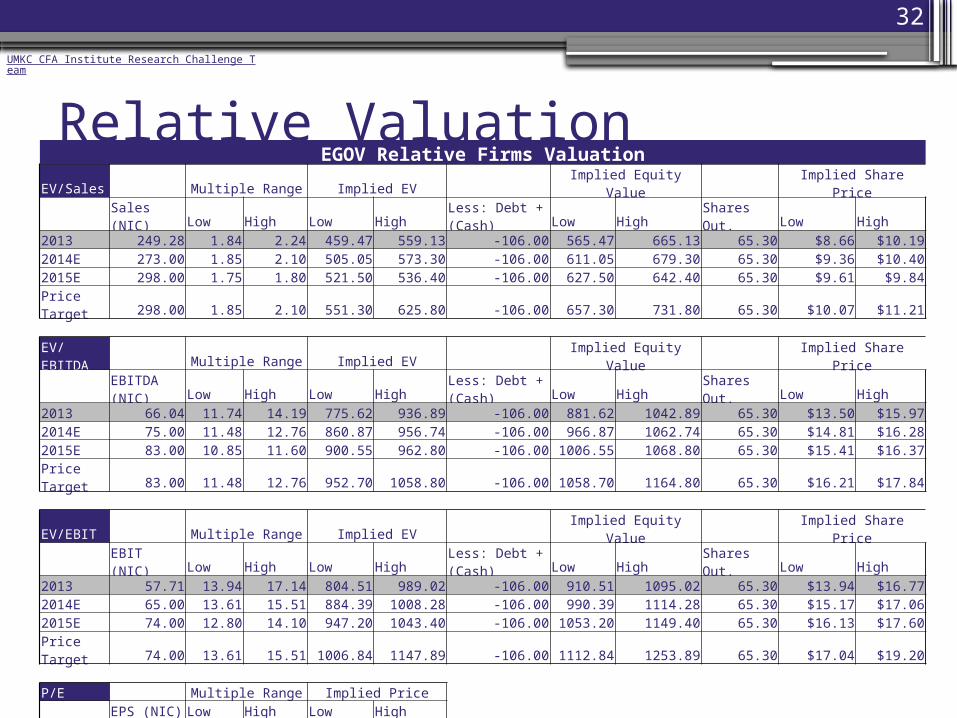
Relative Valuation
Company
Overview
ValuationCompetitive Landscape
EGOV Relative Firms ValuationEV/Sales Multiple Range Implied EV Implied Equity Value Implied Share Price
Sales (NIC) Low High Low High Less: Debt + (Cash) Low High Shares Out. Low High2013 249.28 1.84 2.24 459.47 559.13 -106.00 565.47 665.13 65.30 $8.66 $10.192014E 273.00 1.85 2.10 505.05 573.30 -106.00 611.05 679.30 65.30 $9.36 $10.402015E 298.00 1.75 1.80 521.50 536.40 -106.00 627.50 642.40 65.30 $9.61 $9.84Price Target 298.00 1.85 2.10 551.30 625.80 -106.00 657.30 731.80 65.30 $10.07 $11.21 EV/EBITDA Multiple Range Implied EV Implied Equity Value Implied Share Price
EBITDA (NIC) Low High Low High Less: Debt + (Cash) Low High Shares Out. Low High2013 66.04 11.74 14.19 775.62 936.89 -106.00 881.62 1042.89 65.30 $13.50 $15.972014E 75.00 11.48 12.76 860.87 956.74 -106.00 966.87 1062.74 65.30 $14.81 $16.282015E 83.00 10.85 11.60 900.55 962.80 -106.00 1006.55 1068.80 65.30 $15.41 $16.37Price Target 83.00 11.48 12.76 952.70 1058.80 -106.00 1058.70 1164.80 65.30 $16.21 $17.84 EV/EBIT Multiple Range Implied EV Implied Equity Value Implied Share Price
EBIT (NIC) Low High Low High Less: Debt + (Cash) Low High Shares Out. Low High2013 57.71 13.94 17.14 804.51 989.02 -106.00 910.51 1095.02 65.30 $13.94 $16.772014E 65.00 13.61 15.51 884.39 1008.28 -106.00 990.39 1114.28 65.30 $15.17 $17.062015E 74.00 12.80 14.10 947.20 1043.40 -106.00 1053.20 1149.40 65.30 $16.13 $17.60Price Target 74.00 13.61 15.51 1006.84 1147.89 -106.00 1112.84 1253.89 65.30 $17.04 $19.20 P/E Multiple Range Implied Price EPS (NIC) Low High Low High2013 0.49 21.20 23.90 10.39 11.712014E 0.61 22.50 26.30 13.73 16.042015E 0.68 21.20 23.90 14.42 16.25Price Target 0.68 22.50 26.30 15.30 17.88
UMKC CFA Institute Research Challenge Team

33
Precedent Transaction Valuation
ValuationCompetitive Landscape
Precedent Transaction Analysis
Multiple Range Implied Deal Offer Implied Equity Value (Offer)
Minus Premium (25%) Minus Premium (50%) Implied Share
Price
EV/Sales
Sales 2014 E Low High Low High Less: Net Debt Low High Low High Low High Dil. Shares Low High
FMV 273.00 2.63 5.40 717.21 1474.2 -106 823.21 1580.2 617.4075 1185.15 411.605 790.1 65.299 $6.30 $18.15
EV/EBITDA EBITDA 2014 E Low High Low High Less: Net
Debt Low High Low High Low High Dil. Shares Low High
FMV 75.00 17.92 17.92 1344 1344 -106 1450 1450 1087.5 1087.5 725 725 65.299 $11.10 $16.65
EV/NI Net Income 2014 E Low High Low High Less: Net
Debt Low High Low High Low High Dil. Shares Low High
FMV 39.1 51.15 51.15 1999.97 1999.97 -106 2105.97 2105.97 1579.47 1579.47 1052.98 1052.98 65.299 $16.13 $24.19
Premiums Paid # Deals Volume >100% 93 8.79B
75.01-100% 90 22.65B 50.01-75% 211 56.23B 25.01-50% 411 129.51B 10.01-25% 257 81.18B
*Source: Bloomberg (Last 3 Months)
UMKC CFA Institute Research Challenge Team

34
Precedent Transaction: Deals
Company
Overview
ValuationCompetitive Landscape
Company Deal EV/LTM Revenue EV/LTM EBITDA EV/LTM NIAccenture Acquires Acquity Group 2.24 Bridgeline Acquires ElementsLocal Inc. 2.1 Acquires MarketNet Inc. 2.7 Acquires Magnetic Corp 2 Acquires e.magination network 5.4 Acquires TMX Interactive 2.4 Digital River Investor Group Acquires DRIV 1.55 17.92 Acquires 30% of Softonic Int. SL 51.15Mean 2.63 17.92 51.15Max 5.4 17.92 51.15
UMKC CFA Institute Research Challenge Team

35
Revenue Simulation
Company
Overview
ValuationCompetitive Landscape
Scenario Prob.5-yr
CAGREst. Price
Worst Case 10% -4.8%$6.87
(-59.7%)
Bad Case 20% 2.2%$11.61
(-31.9%)
Base Case 40% 6.8%$16.41
(-3.7%)
Good Case 20% 13.7%$24.02
(+40.9%)
Best Case 10% 18.8%$31.67
(+85.7%)
Simulation
(10K
Trials)
N/A 8.7%$17.69
(+3.8%)
Texas Case N/A 2.3%$13.97
(-18.1%)
• Worst Case: Significant loss of business and less than anticipated growth.
• Bad Case: Midpoint between base and worst case (i.e., growth lags, but not to such an extreme)
• Base Case: EGOV’s revenue base stays relatively stable, with the bulk of growth coming from existing states.
• Good Case: Midpoint between base and best case (i.e., EGOV gains more new business than lost business, but not to such an extreme)
• Best Case: EGOV consistently adds states at a faster than anticipated rate of 2-3 per year, or realizes a comparable amount of revenue from alternative sources, (e.g., federal, international, acquisitions).
• Texas Case: Base Case assumptions with Texas expiring in August of 2017
UMKC CFA Institute Research Challenge Team
36
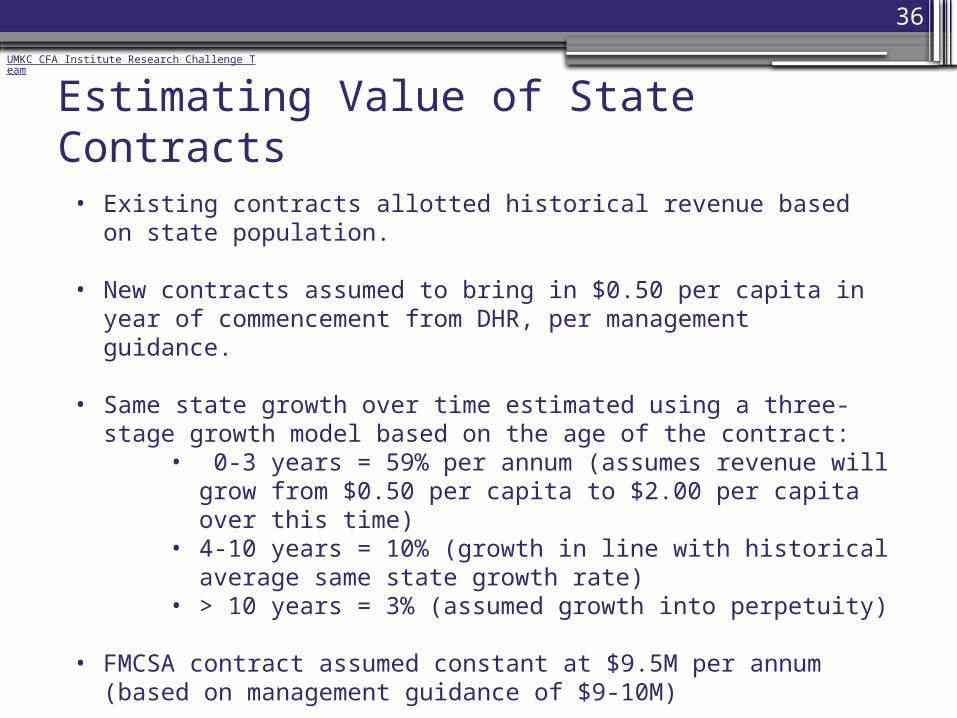
Estimating Value of State Contracts
Company
Overview
ValuationCompetitive Landscape
• Existing contracts allotted historical revenue based on state population.
• New contracts assumed to bring in $0.50 per capita in year of commencement from DHR, per management guidance.
• Same state growth over time estimated using a three-stage growth model based on the age of the contract:
• 0-3 years = 59% per annum (assumes revenue will grow from $0.50 per capita to $2.00 per capita over this time)
• 4-10 years = 10% (growth in line with historical average same state growth rate)
• > 10 years = 3% (assumed growth into perpetuity)
• FMCSA contract assumed constant at $9.5M per annum (based on management guidance of $9-10M)
UMKC CFA Institute Research Challenge Team
37
Company
Overview
ValuationHistorical Performanc
e
Competitive Landscape
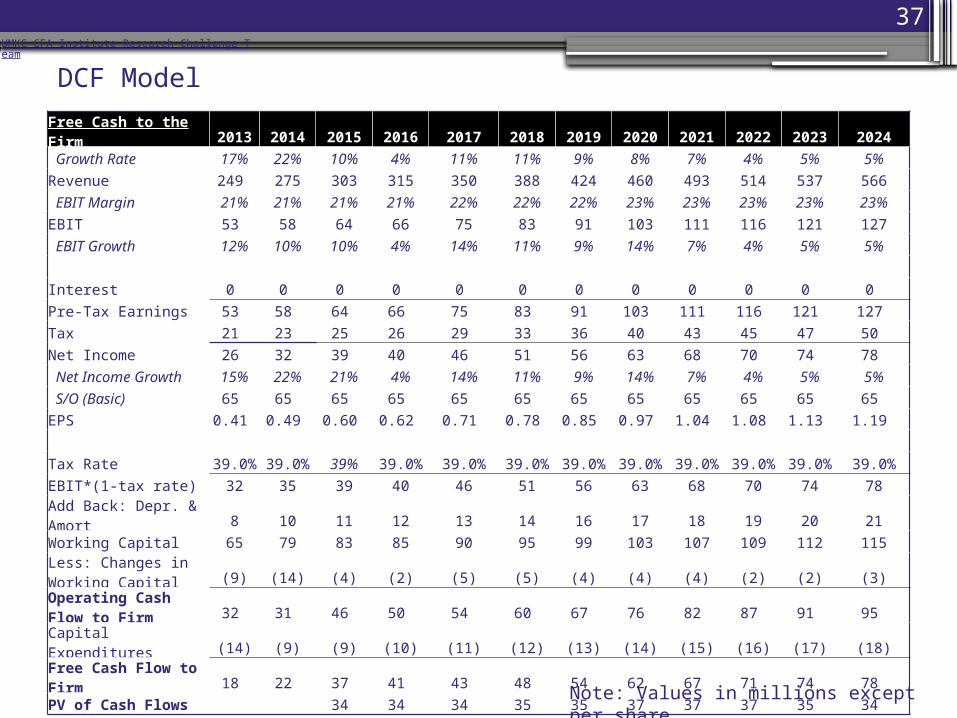
Free Cash to the Firm 2013 2014 2015 2016 2017 2018 2019 2020 2021 2022 2023 2024
Growth Rate 17% 22% 10% 4% 11% 11% 9% 8% 7% 4% 5% 5%
Revenue 249 275 303 315 350 388 424 460 493 514 537 566
EBIT Margin 21% 21% 21% 21% 22% 22% 22% 23% 23% 23% 23% 23%
EBIT 53 58 64 66 75 83 91 103 111 116 121 127
EBIT Growth 12% 10% 10% 4% 14% 11% 9% 14% 7% 4% 5% 5%
Interest 0 0 0 0 0 0 0 0 0 0 0 0
Pre-Tax Earnings 53 58 64 66 75 83 91 103 111 116 121 127
Tax 21 23 25 26 29 33 36 40 43 45 47 50
Net Income 26 32 39 40 46 51 56 63 68 70 74 78
Net Income Growth 15% 22% 21% 4% 14% 11% 9% 14% 7% 4% 5% 5%
S/O (Basic) 65 65 65 65 65 65 65 65 65 65 65 65
EPS 0.41 0.49 0.60 0.62 0.71 0.78 0.85 0.97 1.04 1.08 1.13 1.19
Tax Rate 39.0% 39.0% 39% 39.0% 39.0% 39.0% 39.0% 39.0% 39.0% 39.0% 39.0% 39.0%
EBIT*(1-tax rate) 32 35 39 40 46 51 56 63 68 70 74 78
Add Back: Depr. & Amort 8 10 11 12 13 14 16 17 18 19 20 21
Working Capital 65 79 83 85 90 95 99 103 107 109 112 115Less: Changes in Working Capital (9) (14) (4) (2) (5) (5) (4) (4) (4) (2) (2) (3)Operating Cash Flow to Firm 32 31 46 50 54 60 67 76 82 87 91 95
Capital Expenditures (14) (9) (9) (10) (11) (12) (13) (14) (15) (16) (17) (18)
Free Cash Flow to Firm 18 22 37 41 43 48 54 62 67 71 74 78
PV of Cash Flows 34 34 34 35 35 37 37 37 35 34
DCF Model
Note: Values in millions except per share
UMKC CFA Institute Research Challenge Team
38
Company
Overview
ValuationHistorical Performanc
e
Competitive Landscape
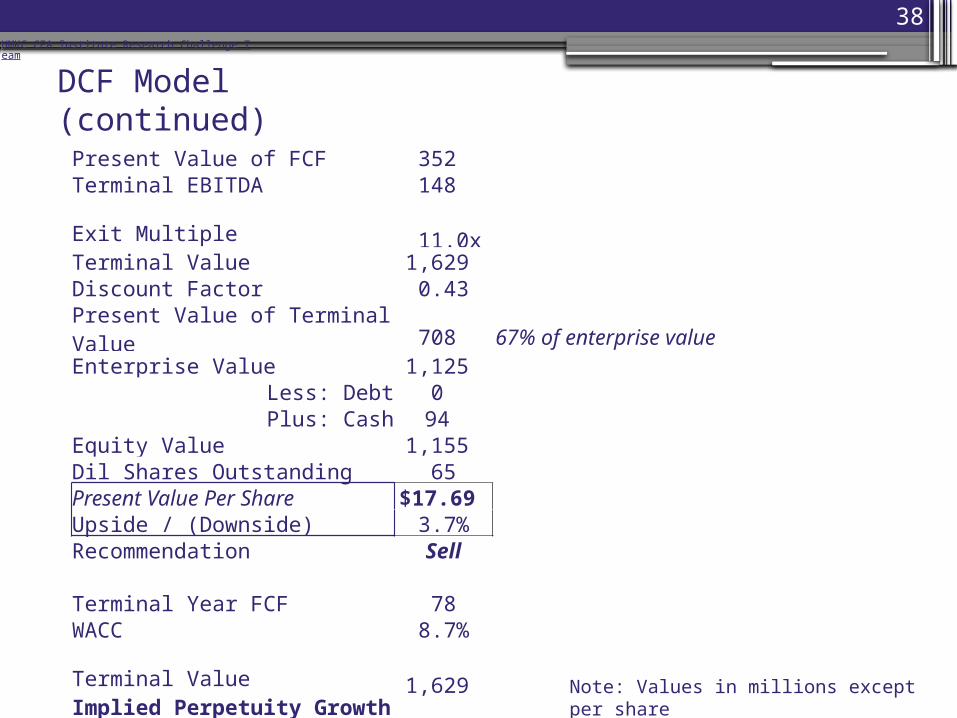
DCF Model (continued)
Present Value of FCF 352
Terminal EBITDA 148
Exit Multiple 11.0x
Terminal Value 1,629
Discount Factor 0.43
Present Value of Terminal Value 708 67% of enterprise valueEnterprise Value 1,125
Less: Debt 0
Plus: Cash 94
Equity Value 1,155
Dil Shares Outstanding 65
Present Value Per Share $17.69
Upside / (Downside) 3.7%
Recommendation Sell
Terminal Year FCF 78
WACC 8.7%
Terminal Value 1,629
Implied Perpetuity Growth Rate 3.7%
Note: Values in millions except per share
UMKC CFA Institute Research Challenge Team
39
Company
Overview
ValuationHistorical Performanc
e
Competitive Landscape
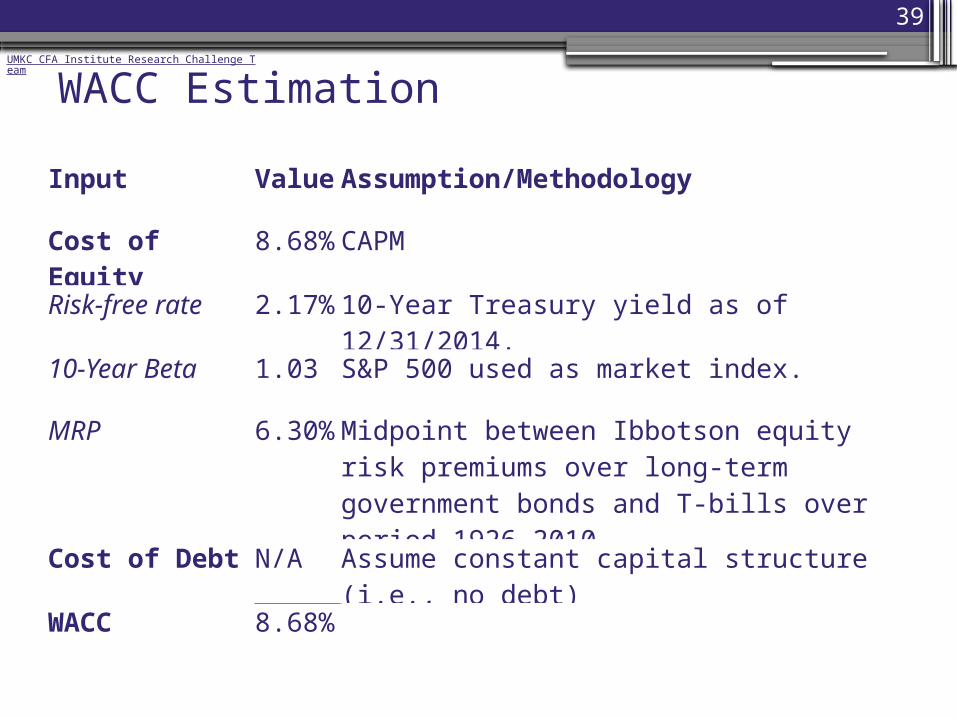
WACC Estimation
Input Value Assumption/Methodology
Cost of Equity 8.68% CAPM
Risk-free rate 2.17% 10-Year Treasury yield as of 12/31/2014.
10-Year Beta 1.03 S&P 500 used as market index.
MRP
6.30%
Midpoint between Ibbotson equity risk premiums over long-term government bonds and T-bills over period 1926-2010
Cost of Debt N/A Assume constant capital structure (i.e., no debt)
WACC 8.68%
UMKC CFA Institute Research Challenge Team
40
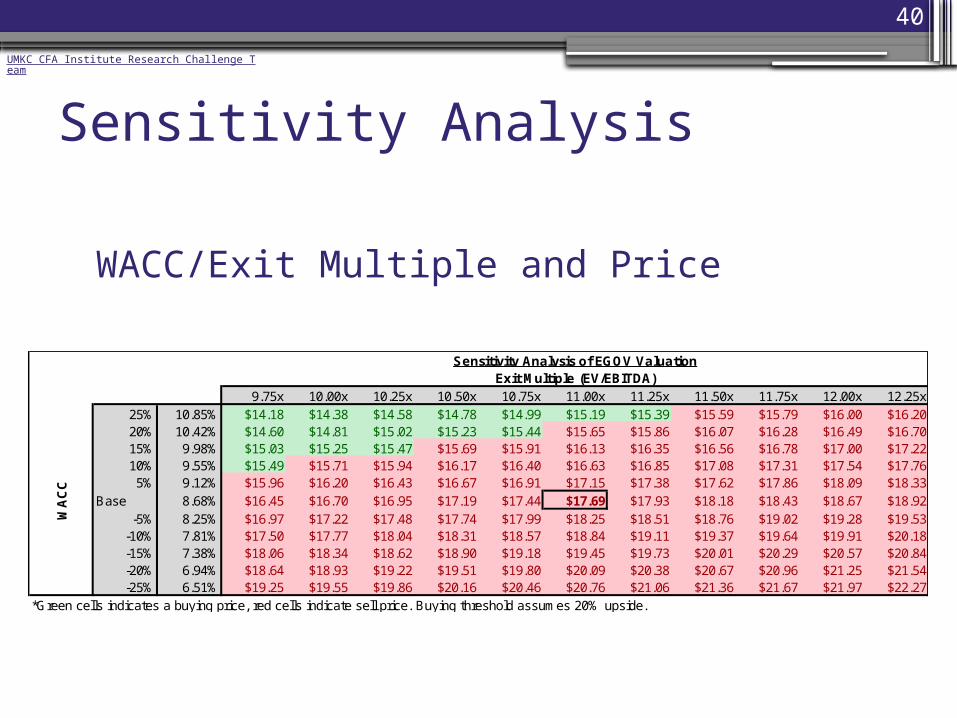
Sensitivity Analysis
•WACC/Exit Multiple and Price
9.75x 10.00x 10.25x 10.50x 10.75x 11.00x 11.25x 11.50x 11.75x 12.00x 12.25x 25% 10.85% $14.18 $14.38 $14.58 $14.78 $14.99 $15.19 $15.39 $15.59 $15.79 $16.00 $16.2020% 10.42% $14.60 $14.81 $15.02 $15.23 $15.44 $15.65 $15.86 $16.07 $16.28 $16.49 $16.7015% 9.98% $15.03 $15.25 $15.47 $15.69 $15.91 $16.13 $16.35 $16.56 $16.78 $17.00 $17.2210% 9.55% $15.49 $15.71 $15.94 $16.17 $16.40 $16.63 $16.85 $17.08 $17.31 $17.54 $17.765% 9.12% $15.96 $16.20 $16.43 $16.67 $16.91 $17.15 $17.38 $17.62 $17.86 $18.09 $18.33
Base 8.68% $16.45 $16.70 $16.95 $17.19 $17.44 $17.69 $17.93 $18.18 $18.43 $18.67 $18.92-5% 8.25% $16.97 $17.22 $17.48 $17.74 $17.99 $18.25 $18.51 $18.76 $19.02 $19.28 $19.53
-10% 7.81% $17.50 $17.77 $18.04 $18.31 $18.57 $18.84 $19.11 $19.37 $19.64 $19.91 $20.18-15% 7.38% $18.06 $18.34 $18.62 $18.90 $19.18 $19.45 $19.73 $20.01 $20.29 $20.57 $20.84-20% 6.94% $18.64 $18.93 $19.22 $19.51 $19.80 $20.09 $20.38 $20.67 $20.96 $21.25 $21.54-25% 6.51% $19.25 $19.55 $19.86 $20.16 $20.46 $20.76 $21.06 $21.36 $21.67 $21.97 $22.27
*Green cells indicates a buying price, red cells indicate sell price. Buying threshold assumes 20% upside.
WA
CC
Exit Multiple (EV/EBITDA)Sensitivity Analysis of EGOV Valuation
UMKC CFA Institute Research Challenge Team

41
• WACC/Exit Multiple and Perpetuity Growth Rate
Sensitivity Analysis
9.75x 10.00x 10.25x 10.50x 10.75x 11.00x 11.25x 11.50x 11.75x 12.00x 12.25x 25% 10.85% 5.17% 5.31% 5.44% 5.56% 5.68% 5.79% 5.90% 6.00% 6.10% 6.19% 6.28%20% 10.42% 4.76% 4.90% 5.02% 5.15% 5.26% 5.38% 5.48% 5.58% 5.68% 5.78% 5.87%15% 9.98% 4.35% 4.48% 4.61% 4.73% 4.85% 4.96% 5.07% 5.17% 5.27% 5.36% 5.45%10% 9.55% 3.94% 4.07% 4.20% 4.32% 4.44% 4.55% 4.65% 4.75% 4.85% 4.95% 5.04%5% 9.12% 3.53% 3.66% 3.79% 3.91% 4.02% 4.13% 4.24% 4.34% 4.44% 4.53% 4.62%
Base 8.68% 3.11% 3.25% 3.37% 3.49% 3.61% 3.72% 3.82% 3.92% 4.02% 4.11% 4.20%-5% 8.25% 2.70% 2.83% 2.96% 3.08% 3.19% 3.30% 3.41% 3.51% 3.61% 3.70% 3.79%
-10% 7.81% 2.29% 2.42% 2.55% 2.67% 2.78% 2.89% 2.99% 3.09% 3.19% 3.28% 3.37%-15% 7.38% 1.88% 2.01% 2.13% 2.25% 2.37% 2.48% 2.58% 2.68% 2.78% 2.87% 2.96%-20% 6.94% 1.47% 1.60% 1.72% 1.84% 1.95% 2.06% 2.17% 2.26% 2.36% 2.45% 2.54%-25% 6.51% 1.06% 1.19% 1.31% 1.43% 1.54% 1.65% 1.75% 1.85% 1.94% 2.04% 2.12%
*Green cells indicates a buying price, red cells indicate sell price. Buying threshold assumes 20% upside.
WA
CC
Exit Multiple (EV/EBITDA)Implied Perpetuity Growth Rate Associated with Valuation Sensitivity
UMKC CFA Institute Research Challenge Team