Embed Size (px)
Citation preview

2015ANNUAL REPORT
A SPECIALIST REAL ESTATE INVESTMENT MANAGER
For
per
sona
l use
onl
y

APN Property Group Limited and its Controlled Entities ABN 30 109 846 068
Contents2015 Financial year highlights 2Executive Chairman's letter 3Directors’ report 4Auditor’s independence declaration 35Independent auditor’s report 36Directors’ declaration 38Consolidated statement of profit or loss and other comprehensive income 40Consolidated statement of financial position 41Consolidated statement of changes in equity 42Consolidated statement of cashflows 43Notes to the financial statements 44Summary of shareholders 86
2015
For
per
sona
l use
onl
y
APN PROPERTY GROUP 2015 ANNUAL REPORT | 1 |
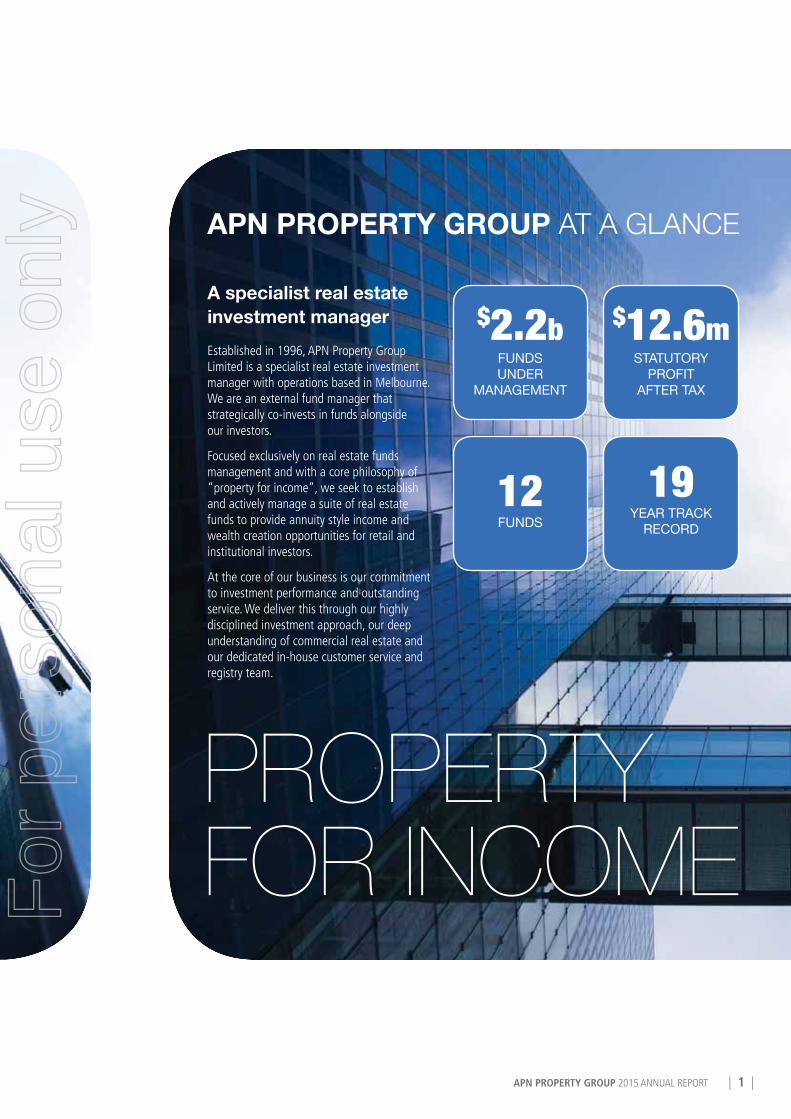
$2.2b $12.6mFUNDS UNDER
MANAGEMENT
STATUTORY PROFIT
AFTER TAX
12FUNDS
19YEAR TRACK
RECORD
A specialist real estate investment managerEstablished in 1996, APN Property Group Limited is a specialist real estate investment manager with operations based in Melbourne. We are an external fund manager that strategically co-invests in funds alongside our investors.
Focused exclusively on real estate funds management and with a core philosophy of “property for income”, we seek to establish and actively manage a suite of real estate funds to provide annuity style income and wealth creation opportunities for retail and institutional investors.
At the core of our business is our commitment to investment performance and outstanding service. We deliver this through our highly disciplined investment approach, our deep understanding of commercial real estate and our dedicated in-house customer service and registry team.
APN PROPERTY GROUP AT A GLANCE
PROPERTY FOR INCOMEFor
per
sona
l use
onl
y
| 2 | 2015 ANNUAL REPORT | 2 | 2015 ANNUAL REPORT
2015 FINANCIAL YEAR HIGHLIGHTS
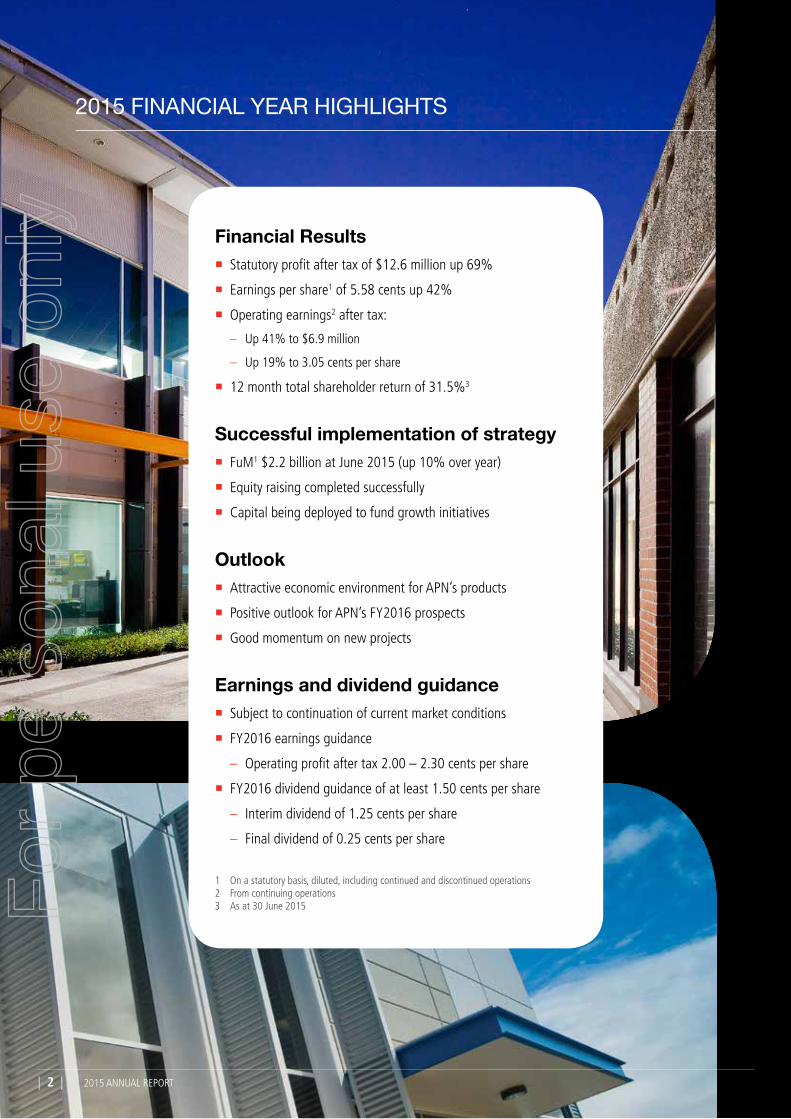
Financial Results � Statutory profit after tax of $12.6 million up 69%
� Earnings per share1 of 5.58 cents up 42%
� Operating earnings2 after tax:
– Up 41% to $6.9 million
– Up 19% to 3.05 cents per share
� 12 month total shareholder return of 31.5%3
Successful implementation of strategy � FuM1 $2.2 billion at June 2015 (up 10% over year)
� Equity raising completed successfully
� Capital being deployed to fund growth initiatives
Outlook � Attractive economic environment for APN’s products
� Positive outlook for APN’s FY2016 prospects
� Good momentum on new projects
Earnings and dividend guidance � Subject to continuation of current market conditions
� FY2016 earnings guidance
– Operating profit after tax 2.00 – 2.30 cents per share
� FY2016 dividend guidance of at least 1.50 cents per share
– Interim dividend of 1.25 cents per share
– Final dividend of 0.25 cents per share
1 On a statutory basis, diluted, including continued and discontinued operations2 From continuing operations3 As at 30 June 2015For
per
sona
l use
onl
y

APN PROPERTY GROUP 2015 ANNUAL REPORT | 3 | APN PROPERTY GROUP 2015 ANNUAL REPORT | 3 |
Dear Shareholder
On behalf of the board I am pleased to present APN Property Group Limited’s FY2015 Annual Report.
This year our company increased its operating profit after tax by 41% to $6.9 million or 3.05 cents per share (up 19% over FY2014). Including non-operating items including unrealised profits from our co-investments in Industria REIT and Generation Healthcare REIT our statutory earnings per share was 5.58 cents or $12.6 million (FY2014: 3.93 cents and $7.5 million). Net income from recurring sources represented 75% of the total, including co-investment income of $3.4 million.
Following the company’s successful fully underwritten $30 million equity raising in April 2015 to fund new growth initiatives and increase our co-investments in our listed funds the company has no debt at 30 June 2015. APN’s net tangible assets position (principally cash and co-investments) was $86.5 million or 28.6 cents per share.
The company delivered a total shareholder return (capital growth and dividends) for the year of 31.5% including an increase of the dividend for the year to 1.50 cents per share (fully franked). In the previous year APN’s total shareholder return was 45%.
We are pleased with these results, which reflect ongoing strong investment performance delivered to APN’s clients and a growth in our funds under management, which increased 10.1% to $2.2 billion at June 2015.
However, we believe the company has significant further potential to grow its sustainable earnings and deliver value for you, our shareholders.
First, using our 30 June 2015 closing share price, the implied value of our funds management business (splitting out the net assets of the company) was approximately $25.4 million or 8 cents per share, or slightly more than 1.00% of our Funds Under Management.
Second, with an ongoing commitment to investment performance and outstanding client service, we have four divisions which each offer real prospects for growth. APN has a well-resourced and largely fixed cost base, coupled with a clear focus on building the scale and profitability of the business we are well placed to grow underlying sustainable earnings.
We continue to believe APN’s ‘property for income’ philosophy offers investors, particularly those nearing or in retirement, a highly relevant risk-reward opportunity featuring regular cash income returns. While competition in the industry remains fierce, the size of our market is growing through mandated superannuation savings and our competitive advantages (expertise, track record, governance and co-investment capacity) mean we are well placed to meet this competition.
At the time of writing we are witnessing increasing volatility across a number of financial markets. This provides a timely reminder of our role as a trusted investor by our customers and the importance of patience and disciplined decision making in fluid capital environments. We believe this volatility is likely to provide buying opportunities for the company and our clients, and should highlight the value of quality commercial property investments.
The results reflect the efforts and dedication of our team. Our new leaders in Tim Slattery and Michael Groth have worked tirelessly through the year to lead the continued improvement of the company and successfully execute our strategy. With this opportunity, I would like to thank all of our employees and our joint venture partners for contributing to APN’s successful 2015 results.
Finally, to our fellow shareholders, thank you for your ongoing investment in the company. I believe APN remains very well positioned to offer you excellent future returns on your shareholding.
Yours sincerely
Chris Aylward Executive Chairman
EXECUTIVE CHAIRMAN'S LETTER
Christopher AylwardExecutive Chairman
For
per
sona
l use
onl
y

| 4 | 2015 ANNUAL REPORT
Christopher AylwardExecutive Chairman and Chief Executive Officer
A Director since 1996.
Chris has more than 30 years’ experience in the Australian property and construction industry.
Prior to jointly establishing APN in 1996, Chris was the founding Director of Grocon Pty Limited and had overall responsibility for the construction of commercial and retail properties in Sydney and Melbourne with a total value of over $2 billion.
Chris has led the construction and development of the following high profile properties:
� Governor Phillip Tower in Sydney � Governor Macquarie Tower in Sydney � 120 Collins Street in Melbourne � World Congress Centre in Melbourne
Clive AppletonBEc, MBA, AMP (Harvard), GradDip (Mktg), FAICDNon-Executive Director
A Director since 2004.
Clive joined APN as Managing Director in April 2004 following a successful career in property and funds management, having worked for Australia’s leading retail property investment, management and development groups. Clive was instrumental in floating APN Property Group in 2005 and was responsible for managing APN’s Private Funds division for 5 years. In 2013 he became a non-executive Director.
Prior to joining the Group, Clive was the Managing Director of the Gandel Group (1997-2004), which included the iconic Chadstone Shopping Centre, where he was involved in the development of $1 billion worth of property as well as the acquisition and redevelopment of the Myer Brisbane Centre. Clive has also held the positions of Managing Director and Non-executive director of Federation Centres (formerly Centro Properties Limited) for the periods 1990–1997 and 2011–2015 respectively.
Clive is a Non-executive Director of the Gandel Group (since 1997), Aspen Group (since 2012), Arrow International (since 2012) and Perth Airports Pty Ltd and Perth Airport Development Group Pty Ltd (since 2014). He is also a Council Member of Cairnmillar Institute.
DIRECTORS’ REPORT
The directors of APN Property Group Limited (APN or the Company) are pleased to present their report of the APN Property Group (APN Group or the Group) for the financial year ended 30 June 2015.
Information about the Directors Directors of APN Property Group Limited at the date of this Report:
| 4 | 2015 ANNUAL REPORT
For
per
sona
l use
onl
y

APN PROPERTY GROUP 2015 ANNUAL REPORT | 5 |
Howard BrenchleyBEcNon-Executive Director
A Director since 1998.
Howard has a long history in the Australian property investment industry with almost 30 years’ experience analysing and investing in the sector.
Howard joined APN in 1998 and was responsible for establishing the APN Funds Management business. In this capacity he developed a suite of new property securities and direct property funds, including the flagship APN Property for Income Fund, one of the largest property securities funds in Australia. In 2014 Howard transitioned to a non-executive Director.
Prior to joining APN, Howard was co-founder and research director of Property Investment Research Pty Limited, one of Australia’s leading independent research companies, specialising in the property trust sector.
Howard is also a director of APN Funds Management Limited (since 1998) and National Storage Holdings Limited, part of the listed National Storage REIT (since 2014).
Timothy Slattery BSc, LLB, MBA (London Business School) Executive Director
A Director since 12 September 2014.
Tim has over 12 years’ of experience across real estate, funds management, investment banking and law.
Over Tim’s career, he has practised law at Herbert Smith Freehills as a qualified corporate lawyer and worked in corporate finance advisory within Goldman Sachs’ investment banking division.
Tim has worked on mergers, acquisitions and financing transactions worth several billion dollars within Australia and internationally including a number of significant commercial real estate transactions.
He has led both private and public capital raising projects for real estate investments and successfully completed asset acquisitions, sales and asset management projects across a range of different real estate asset classes.
John Freemantle B. Bus (Acctg), CPA Company Secretary
Company Secretary since 2007. John has been involved in the property industry since 1977. Before joining APN in 2006, he worked with Dillingham Constructions, Jennings Property Group and Centro Property Group, where he held the roles of Chief Financial Officer and Company Secretary for 17 years.
dIRECToRS’ REPoRT
APN PROPERTY GROUP 2015 ANNUAL REPORT | 5 |
For
per
sona
l use
onl
y
| 6 | 2015 ANNUAL REPORT
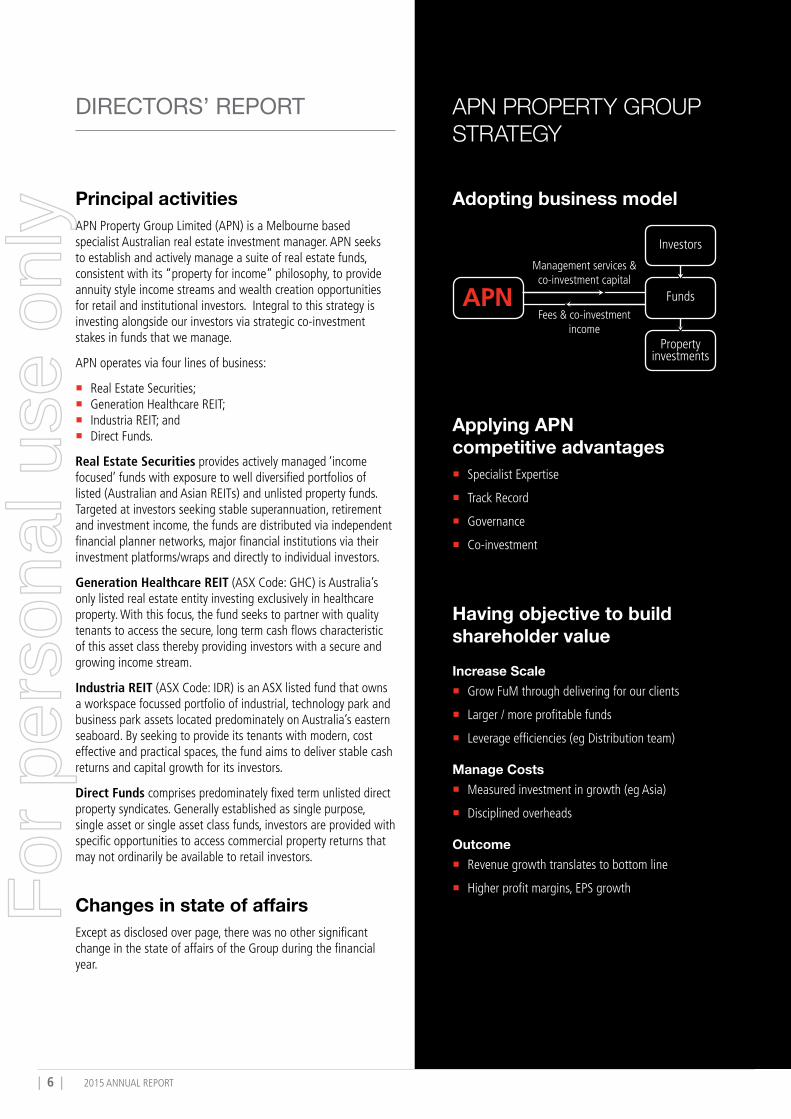
Principal activitiesAPN Property Group Limited (APN) is a Melbourne based specialist Australian real estate investment manager. APN seeks to establish and actively manage a suite of real estate funds, consistent with its “property for income” philosophy, to provide annuity style income streams and wealth creation opportunities for retail and institutional investors. Integral to this strategy is investing alongside our investors via strategic co-investment stakes in funds that we manage.
APN operates via four lines of business:
� Real Estate Securities; � Generation Healthcare REIT; � Industria REIT; and � Direct Funds.
Real Estate Securities provides actively managed ‘income focused’ funds with exposure to well diversified portfolios of listed (Australian and Asian REITs) and unlisted property funds. Targeted at investors seeking stable superannuation, retirement and investment income, the funds are distributed via independent financial planner networks, major financial institutions via their investment platforms/wraps and directly to individual investors.
Generation Healthcare REIT (ASX Code: GHC) is Australia’s only listed real estate entity investing exclusively in healthcare property. With this focus, the fund seeks to partner with quality tenants to access the secure, long term cash flows characteristic of this asset class thereby providing investors with a secure and growing income stream.
Industria REIT (ASX Code: IDR) is an ASX listed fund that owns a workspace focussed portfolio of industrial, technology park and business park assets located predominately on Australia’s eastern seaboard. By seeking to provide its tenants with modern, cost effective and practical spaces, the fund aims to deliver stable cash returns and capital growth for its investors.
Direct Funds comprises predominately fixed term unlisted direct property syndicates. Generally established as single purpose, single asset or single asset class funds, investors are provided with specific opportunities to access commercial property returns that may not ordinarily be available to retail investors.
Changes in state of affairsExcept as disclosed over page, there was no other significant change in the state of affairs of the Group during the financial year.
DIRECTORS’ REPORT
Applying APN competitive advantages
� Specialist Expertise
� Track Record
� Governance
� Co-investment
Having objective to build shareholder valueIncrease Scale
� Grow FuM through delivering for our clients
� Larger / more profitable funds
� Leverage efficiencies (eg Distribution team)
Manage Costs � Measured investment in growth (eg Asia)
� Disciplined overheads
Outcome � Revenue growth translates to bottom line
� Higher profit margins, EPS growth
APN ProPErTy GrouP STrATEGy
Management services & co-investment capital
Fees & co-investment income
Adopting business model
Funds
Property investments
Investors
For
per
sona
l use
onl
y
APN PROPERTY GROUP 2015 ANNUAL REPORT | 7 |
dIRECToRS’ REPoRT
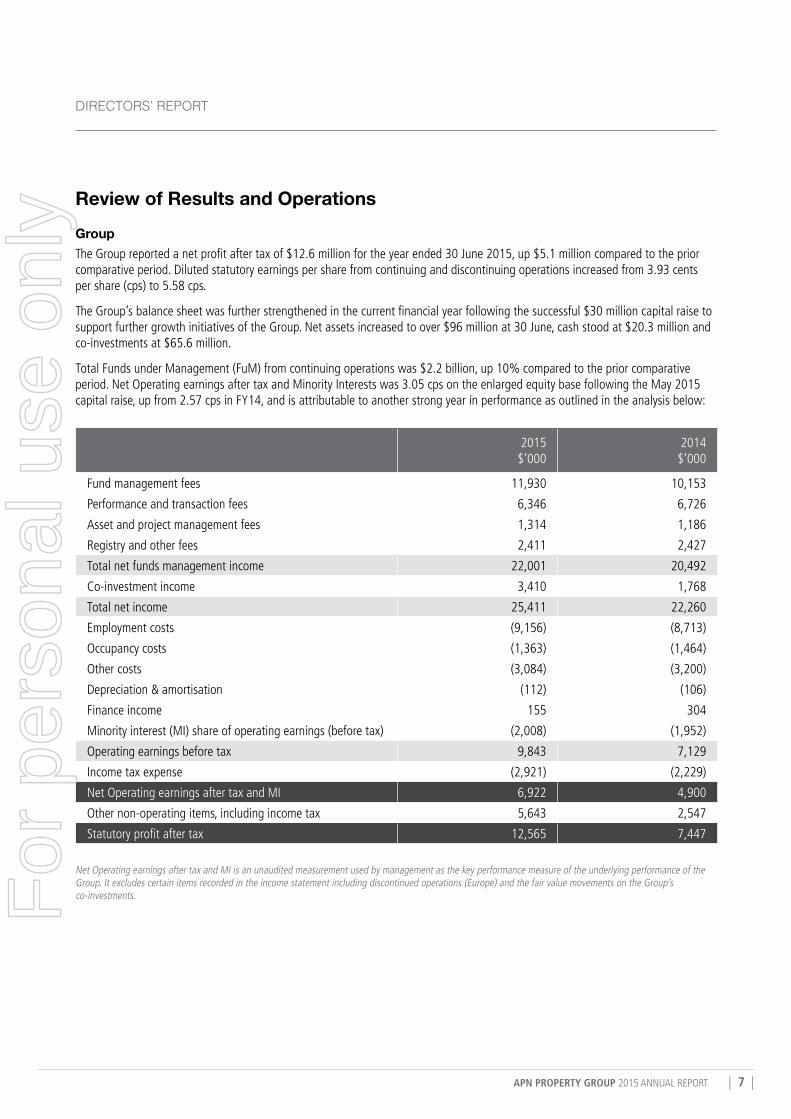
Review of Results and OperationsGroupThe Group reported a net profit after tax of $12.6 million for the year ended 30 June 2015, up $5.1 million compared to the prior comparative period. Diluted statutory earnings per share from continuing and discontinuing operations increased from 3.93 cents per share (cps) to 5.58 cps.
The Group’s balance sheet was further strengthened in the current financial year following the successful $30 million capital raise to support further growth initiatives of the Group. Net assets increased to over $96 million at 30 June, cash stood at $20.3 million and co-investments at $65.6 million.
Total Funds under Management (FuM) from continuing operations was $2.2 billion, up 10% compared to the prior comparative period. Net Operating earnings after tax and Minority Interests was 3.05 cps on the enlarged equity base following the May 2015 capital raise, up from 2.57 cps in FY14, and is attributable to another strong year in performance as outlined in the analysis below:
2015 $’000
2014 $’000
Fund management fees 11,930 10,153
Performance and transaction fees 6,346 6,726
Asset and project management fees 1,314 1,186
Registry and other fees 2,411 2,427
Total net funds management income 22,001 20,492
Co-investment income 3,410 1,768
Total net income 25,411 22,260
Employment costs (9,156) (8,713)
Occupancy costs (1,363) (1,464)
Other costs (3,084) (3,200)
Depreciation & amortisation (112) (106)
Finance income 155 304
Minority interest (MI) share of operating earnings (before tax) (2,008) (1,952)
Operating earnings before tax 9,843 7,129
Income tax expense (2,921) (2,229)
Net Operating earnings after tax and MI 6,922 4,900
Other non-operating items, including income tax 5,643 2,547
Statutory profit after tax 12,565 7,447
Net Operating earnings after tax and MI is an unaudited measurement used by management as the key performance measure of the underlying performance of the Group. It excludes certain items recorded in the income statement including discontinued operations (Europe) and the fair value movements on the Group’s co-investments.F
or p
erso
nal u
se o
nly
| 8 | 2015 ANNUAL REPORT
DIRECTORS’ REPORT
Total net income was $25.4 million for the year ended 30 June 2015, versus $22.3 million in 2014. Fund management fee and co-investment income increased 18% and 93% respectively, reflecting substantial growth in FuM from our Real Estate Securities division, a full year’s contribution from Industria REIT and increased co-investment stakes in those funds managed by APN.
Net performance and transaction fees for the period include project initiation fees of $0.8 million from the Newmark APN Auburn Property Fund, performance and transaction fees from the successful conclusion of the APN 541 St Kilda Road Fund ($0.8 million), acquisition fees from the launch of the APN Coburg North Retail Fund ($0.2 million) and performance and acquisition fees following the continued strong outperformance of Generation Healthcare REIT and its recent acquisition of the RSL Care portfolio ($4.3 million).
Operating costs increased marginally from $13.4 million to $13.6 million, primarily due to performance and transaction fee linked employee incentive arrangements established in the current year. Cost control on all other areas of the business remained a focus of the Group, with non-employment related operating costs falling $0.2 million to $4.4 million. Importantly, the funds management platform remains well resourced and positioned to manage future FuM growth.
Included in other non-operating items were mark-to-market gains (after tax) totalling $5.7 million on APN’s co-investments stakes. This includes the tax benefit from the recognition of previously unrecognised capital losses totalling $2.7 million.
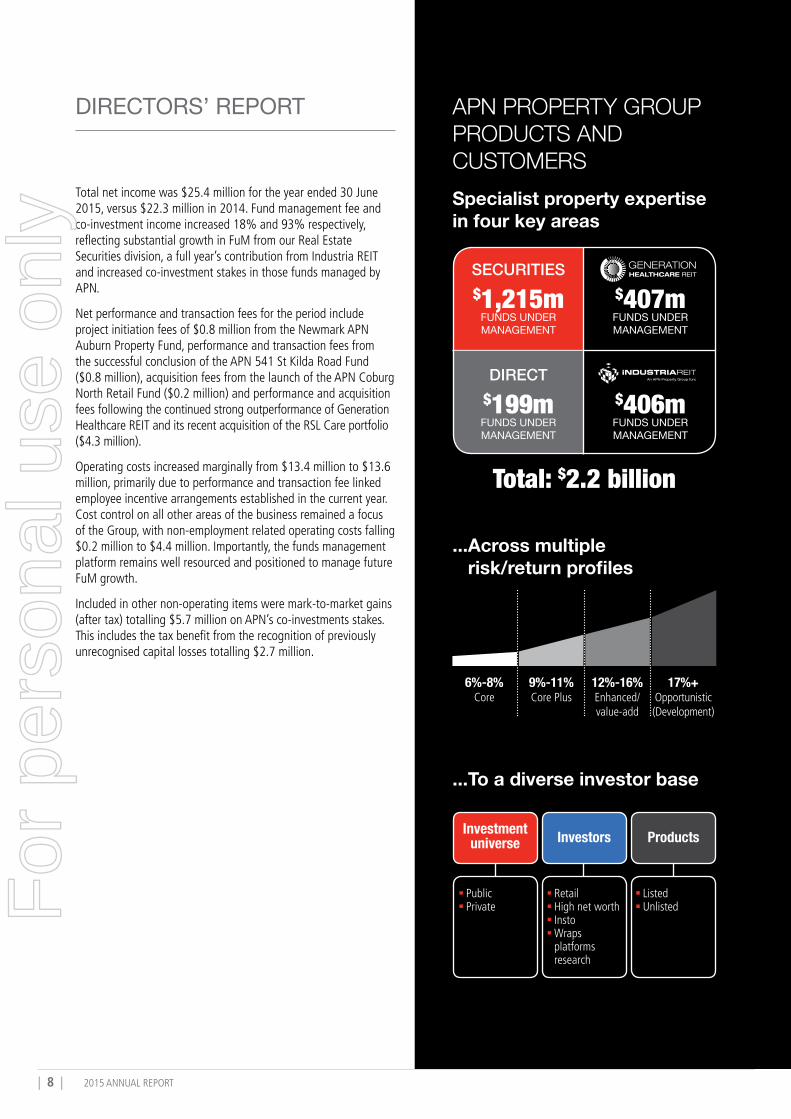
APN ProPErTy GrouP ProDuCTS AND CuSToMErSSpecialist property expertise in four key areas
...Across multiple risk/return profiles
...To a diverse investor base
$1,215m
$199m
FUNDS UNDER MANAGEMENT
FUNDS UNDER MANAGEMENT
SECURITIES
DIRECT
$407m
$406m
FUNDS UNDER MANAGEMENT
FUNDS UNDER MANAGEMENT
Total: $2.2 billion
6%-8%Core
9%-11%Core Plus
12%-16%Enhanced/ value-add
17%+Opportunistic (Development)
Investment universe Investors Products
§ Retail§ High net worth§ Insto§ Wraps platforms research
§ Listed§ Unlisted
§ Public§ PrivateF
or p
erso
nal u
se o
nly
APN PROPERTY GROUP 2015 ANNUAL REPORT | 9 |
dIRECToRS’ REPoRT
Real Estate SecuritiesAPN’s Real Estate Securities (RES) offers retail and institutional investors exposure to listed (AREIT’s and Asian REIT’s) and unlisted property securities across five different investment products. Targeted at independent financial planner networks, major financial institution investment platforms and wraps, broker networks (through the ASX’s new mFund settlement service) and self-directed investors, RES products are actively marketed to Australian and New Zealand investors.
RES Funds under Management increased 17% to $1.2 billion at 30 June 2015, following continued strong APN AREIT Fund average monthly net inflows of over $17 million and the strong market performance of the AREIT market in general. Net outflows of $109 million for the year were experienced in the Property for Income Funds’ following full liquidity being re-established from 1 July 2014, with these outflows reducing progressively over time. Product rationalisation continued as two small funds were closed and monies returned to investors.
Importantly performance of our funds remained strong, with both the APN AREIT Fund and the APN Asian REIT Fund reporting ‘true to label’ performance of consistent and relatively high levels of income, some capital growth and lower than market volatility over 1, 3 and 5 year time frames. Both the APN Asian REIT Fund and APN AREIT Fund remain rated by research houses, with the APN AREIT Fund winning Money magazine's 2015 Best of the Best award for Best Property Securities Fund.
RES’s priorities for 2016 remain focused on continuing to deliver strong investment performance and service for its investors. The expansion of APN’s distribution network and channels will be an important driver of growth in FuM over the coming 12 months. This is expected to be supported by the continuation of the low interest rate environment for some time and investors need for regular stable income streams. New product opportunities to meet investor appetite will be explored.
Highlights � Funds under Management up 17% to $1.2 billion
� APN AREIT Fund average monthly net inflows of over $17 million
� Continued strong ‘true to label’ performance from the APN AREIT and APN Asian REIT Funds
� Money magazine's 2015 Best of the Best award for Best Property Securities Fund won by APN AREIT Fund
Priorities � Maintenance of strong investment performance
and investor service
� Expand distribution network, channels and relationships with investors
� Investigate new product opportunities to meet investor demand
For
per
sona
l use
onl
y
| 10 | 2015 ANNUAL REPORT
DIRECTORS’ REPORT
Highlights � 7.25% increase in distributions paid/declared,
total return to investors of 32.6%
� Funds under Management up 25% to $407 million
� Entry into aged care subsector with $46 million RSL Care transaction and collaboration agreement to explore further real estate transactions
� Significant progress on GHC’s ~$116 million organic growth pipeline
Priorities � Grow operational earnings and distributions
� Commence construction on Frankston Private expansion & Casey Stage 2
� Consider other value adding transactions
Generation Healthcare REITGeneration Healthcare REIT (GHC) is Australia’s only ASX listed healthcare real estate investment entity. Investing exclusively in healthcare property, with a focus on partnering with quality tenants, GHC delivers investors access to secure, long term diversified income yields. GHC is managed by Generation Healthcare Management Pty Ltd a joint venture between entities associated with Miles Wentworth and Chris Adams, and APN Property Group Limited.
The strong performance of GHC has continued throughout the 2015 financial year. Distributions paid to investors increased 7.25% compared to the pcp, and the total return to investors was 32.6%, outperforming the S&P/ASX 300 Property Accumulation Index return by 12.3%. Funds under Management increased by 25% to $407 million at 30 June 2015 following like-for-like property revaluation increases of $22 million and the acquisition of the $46 million RSL Care portfolio that was announced in conjunction with the $52 million equity raise completed in May 2015.
Substantial progress has been made on GHC’s pipeline of organic growth opportunities which now total approximately $238 million (GHC’s share represents approximately $116 million). Both the Frankston Private expansion project (Healthscope Limited pre-committed) and Stage 2 of the Casey Private Hospital (in joint venture with St John of God Health Care) have advanced significantly, with construction now forecast to commence before the end of the 2015 calendar year.
Management remains focused on growing the operational earnings / distributions of GHC, advancing the organic growth projects and seeking opportunities that add value to investors.
For
per
sona
l use
onl
y
APN PROPERTY GROUP 2015 ANNUAL REPORT | 11 |
dIRECToRS’ REPoRT
Industria REITIndustria REIT (IDR) is an ASX listed real estate investment trust that owns a portfolio of 17 established workspace focused industrial, technology and business park assets. With properties located across Sydney, Melbourne, Brisbane and Adelaide, IDR aims to provide investors with stable cash returns and capital growth based on APN’s ‘property for income’ philosophy with a ‘property for industry’ focus.
IDR paid distributions totalling 16.20 cents per security for the year, below Product Disclosure Statement and Prospectus forecasts and reflective of a very challenging leasing market for office assets. Brisbane in particular has been difficult, with tenants reluctant to commit and/or requiring elevated incentives to sign leases. Pleasingly, property valuations have remained relatively strong, with IDR reporting an increase in NTA per security to $2.02 at 30 June 2015. Funds under Management remained steady at $406 million.
Asset management initiatives and leasing transactions will be managements primary focus for FY2016. Opportunities to recycle capital through acquisition and divestment opportunities will be pursued if value can be maximised for IDR investors.
Highlights � Funds under Management steady at $406 million
� NTA per security increased to $2.02
� Security buyback implemented
� WALE (by area) at 4.8 years in challenging leasing market
Priorities � Intense active property management and leasing
focus to enhance income security
� Value adding capital recycling initiatives
For
per
sona
l use
onl
y

| 12 | 2015 ANNUAL REPORT
DIRECTORS’ REPORT
Direct FundsAPN’s Direct Funds division comprises predominately fixed term unlisted direct property funds that provide specific opportunities to access property returns not generally available to the pooled investment market. APN’s existing product suite includes retail, sophisticated / high net worth and institutional investors.
Funds under Management totalled $199 million at 30 June 2015, down from $252 million in the pcp, reflecting the successful conclusion of the APN 541 St Kilda Road Fund (29% return for investors), the acceptance of an unsolicited offer for the asset owned by the Newmark APN Auburn Property Fund, partially offset by the establishment of the $19 million APN Coburg North Retail Fund. The Coburg North Fund capitalised on investors continuing appetite for high quality, stable income yields back by long term leases and this area remains a focus for the Group with the APN Convenience Retail Property Fund to be launched in the near future.
Subsequent to year end the APN Steller Development Fund was launched seeking to raise up to $20.0 million from sophisticated investors. Targeting an internal rate of return of 18%, this fund is expected to undertake six identified inner Melbourne medium density apartment projects.
Key priorities for FY2016 are to continue to actively manage the existing property portfolio and Funds in line with our investment mandates, to successfully establish the APN Steller Development Fund and APN Convenience Retail Property Fund and to source new real estate opportunities that meet the needs of our growing investor base.
Highlights � Funds under Management of $199 million
� 29% return delivered for APN St Kilda Road Fund investors
� APN Property Portfolio Plus term extended for up to 3 years to renew expiring leases
� $5.5 million liquidity delivered for APN Regional Property Fund investors
Priorities � Continue active property management to enhance
income security and returns for investors
� Establish the APN Steller Development Fund and APN Convenience Retail Property Fund
� Source new real estate opportunities
� Continue to broaden our growing investor base
For
per
sona
l use
onl
y
APN PROPERTY GROUP 2015 ANNUAL REPORT | 13 |
DividendsIn respect of the financial year ended 30 June 2015, a fully franked interim dividend of 1.25 cents per share was paid to the shareholders on 14 April 2015.
The directors have declared a final dividend of 0.25 cents. The dividend will be fully franked and paid on 16 October 2015 to investors registered on 30 September 2015.
Outlook and earnings guidanceThe Australian economy has slowed since last financial year, notwithstanding the stimulus provided by further macroeconomic adjustments. Interest rates have continued to fall throughout the year and now sit at 2.00%. The latest unemployment numbers and the persistence of economic slack see market commentators concerned about further economic downside risk. It is difficult to see the catalyst for a change to the low interest rate, low inflation and low growth environment that Australia is now experiencing.
For commercial real estate, investment demand has remained robust reflecting continued strong demand from domestic and international buyers given the current low interest rate environment – this is expected to continue. Investors are still actively chasing investment grade real estate across all asset classes, translating through to asset value appreciation opportunities for existing owners. Particular focus is being applied to those assets with long weighted average lease terms, leased to quality tenants that will provide resilience in uncertain economic times. The occupier market remains under pressure with subdued demand across most major markets and elevated incentives a feature of leasing transactions. These conditions are expected to continue well into FY2016.
With a focus on ‘property-for-income’, combined with the ever growing pool of Australian superannuation assets, APN remains well positioned to capitalise on the demand for income products in this economic environment. Net Operating Earnings after tax and MI are forecast to be in the range of 2.00 – 2.30 cents per share for FY2016. This includes only previously announced transaction and performance fees. Future market based performance fees from APN’s existing funds are excluded. The operating environment, and in particular the regulatory landscape and equity and interest rate markets, have been assumed to remain broadly consistent to that currently being experienced.
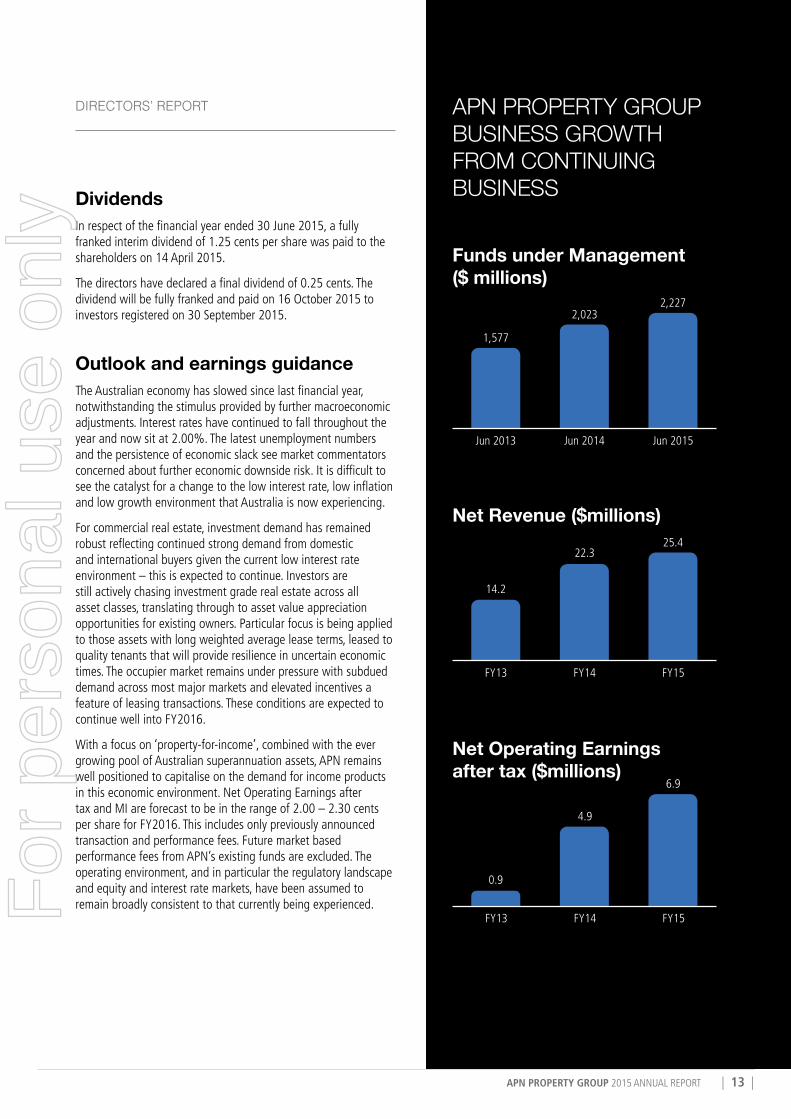
dIRECToRS’ REPoRT APN ProPErTy GrouP BuSINESS GroWTH FroM CoNTINuING BuSINESS
Funds under Management ($ millions)
Net Revenue ($millions)
Net Operating Earnings after tax ($millions)
1,577
2,0232,227
Jun 2013 Jun 2014 Jun 2015
14.2
22.325.4
FY13 FY14 FY15
0.9
4.9
6.9
FY13 FY14 FY15For
per
sona
l use
onl
y
| 14 | 2015 ANNUAL REPORT
DIRECTORS’ REPORT
Key risksThe following are key risk areas that could impact on our ability to achieve our strategic objectives and prospects for future years.
Regulatory riskAPN operates in a highly regulated environment and our success can be impacted by breaches to our regulatory licence conditions, changes to the regulatory environment and the structure of the markets that we operate in. Regulatory breaches may affect APN through penalties, liabilities, restrictions on activities and compliance and other costs. We have established a regulatory compliance framework to monitor compliance with our regulatory licence requirements at all times.
In addition, the Australian funds management industry is in a period of significant regulatory change with respect to superannuation and to the provision of financial advice. The interpretation, practical implementation and reputational consequences of changes could adversely impact APN’s business model or result in its business and or strategic objectives not being achieved. APN closely monitors and actively engages with industry bodies on changes that could impact our business.
Operational riskAs a fund manager, APN depends on its skills and expertise to deliver investment performance and outstanding service to meet and exceed the expectations of our investors and other stakeholders. Significant or prolonged underperformance of funds managed by APN may affect the ability of APN to retain existing and attract new FuM. In addition, the economic environment, particularly interest rates, and market volatility have the potential to influence the investment preferences and products considered desirable by our existing and potential investors. APN continuously monitors investment performance, service levels, market conditions and its product suite to ensure that these continue to meet investor requirements and expectations.
Subsequent events On 16 July 2015, APN announced the exchange of contracts to acquire the Masters Home Improvement Store and Service Centre, South Nowra, its second convenience retail property. This asset and the previously announced acquisition of 7-Eleven, Eagleby have been acquired by APN on a guaranteed delivery contract basis, financed from available cash reserves and new limited recourse debt warehousing facilities being established. Both assets will form the basis of the shortly to be launched unlisted APN Convenience Retail Property Fund that is designed to provide retail investors with a regular and sustainable cash income yield, with the potential for income and capital growth over time.
On 28 July 2015, APN announced the launch of the APN Steller Development Fund. Established in conjunction with Steller Pty Limited, a local Melbourne metropolitan developer, the APN Steller Development Fund is seeking to raise up to $20.0 million from sophisticated investors to undertake up to six inner Melbourne medium density apartment projects. APN has committed to a $2.0 million co-investment stake in this fund which is targeting an 18.0% p.a. equity internal rate of return (IRR), pre taxation, post all fees.
Other than the above, there has been no other matter or circumstances occurring subsequent to the end of the financial year that has significantly affected, or may significantly affect, the operations of the Group, the results of those operations, or the state of affairs of the Group in future financial years.
For
per
sona
l use
onl
y
APN PROPERTY GROUP 2015 ANNUAL REPORT | 15 |
dIRECToRS’ REPoRT
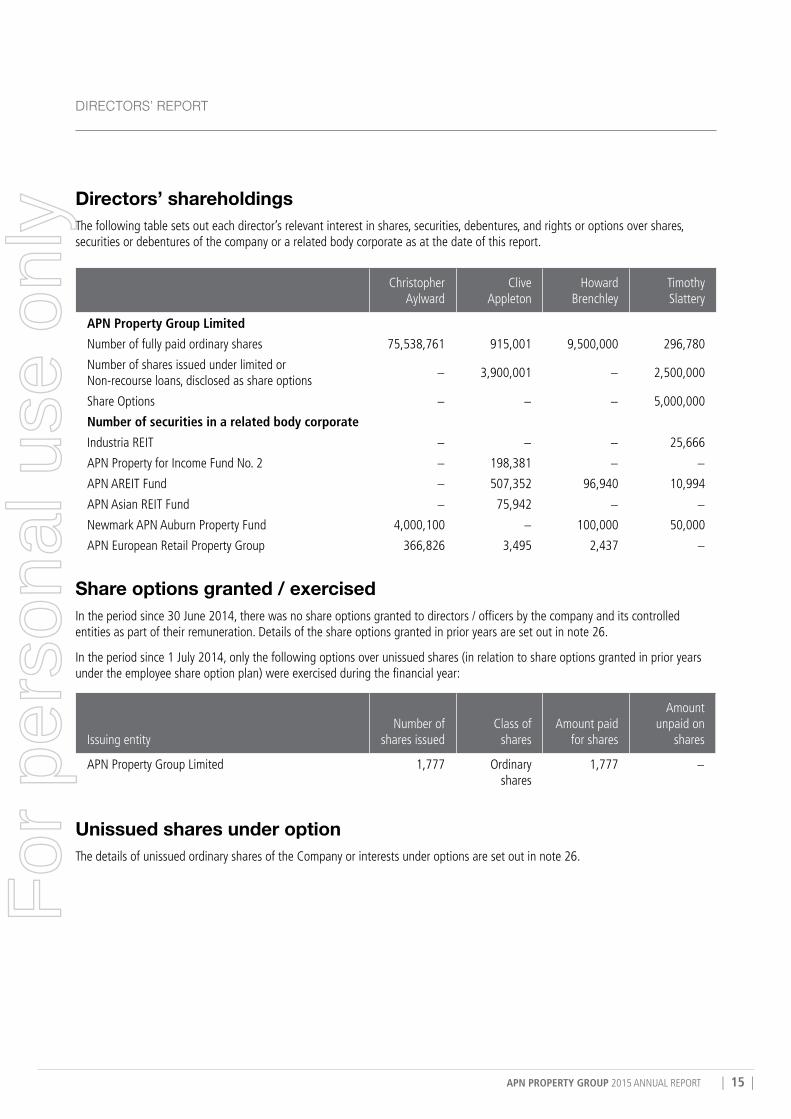
Directors’ shareholdingsThe following table sets out each director’s relevant interest in shares, securities, debentures, and rights or options over shares, securities or debentures of the company or a related body corporate as at the date of this report.
Christopher Aylward
Clive Appleton
Howard Brenchley
Timothy Slattery
APN Property Group Limited
Number of fully paid ordinary shares 75,538,761 915,001 9,500,000 296,780
Number of shares issued under limited or Non-recourse loans, disclosed as share options
− 3,900,001 − 2,500,000
Share Options − − − 5,000,000
Number of securities in a related body corporate
Industria REIT − − − 25,666
APN Property for Income Fund No. 2 − 198,381 − −
APN AREIT Fund − 507,352 96,940 10,994
APN Asian REIT Fund − 75,942 − −
Newmark APN Auburn Property Fund 4,000,100 − 100,000 50,000
APN European Retail Property Group 366,826 3,495 2,437 −
Share options granted / exercisedIn the period since 30 June 2014, there was no share options granted to directors / officers by the company and its controlled entities as part of their remuneration. Details of the share options granted in prior years are set out in note 26.
In the period since 1 July 2014, only the following options over unissued shares (in relation to share options granted in prior years under the employee share option plan) were exercised during the financial year:
Issuing entityNumber of
shares issuedClass of
sharesAmount paid
for shares
Amount unpaid on
shares
APN Property Group Limited 1,777 Ordinary shares
1,777 −
Unissued shares under optionThe details of unissued ordinary shares of the Company or interests under options are set out in note 26.
For
per
sona
l use
onl
y
| 16 | 2015 ANNUAL REPORT
DIRECTORS’ REPORT
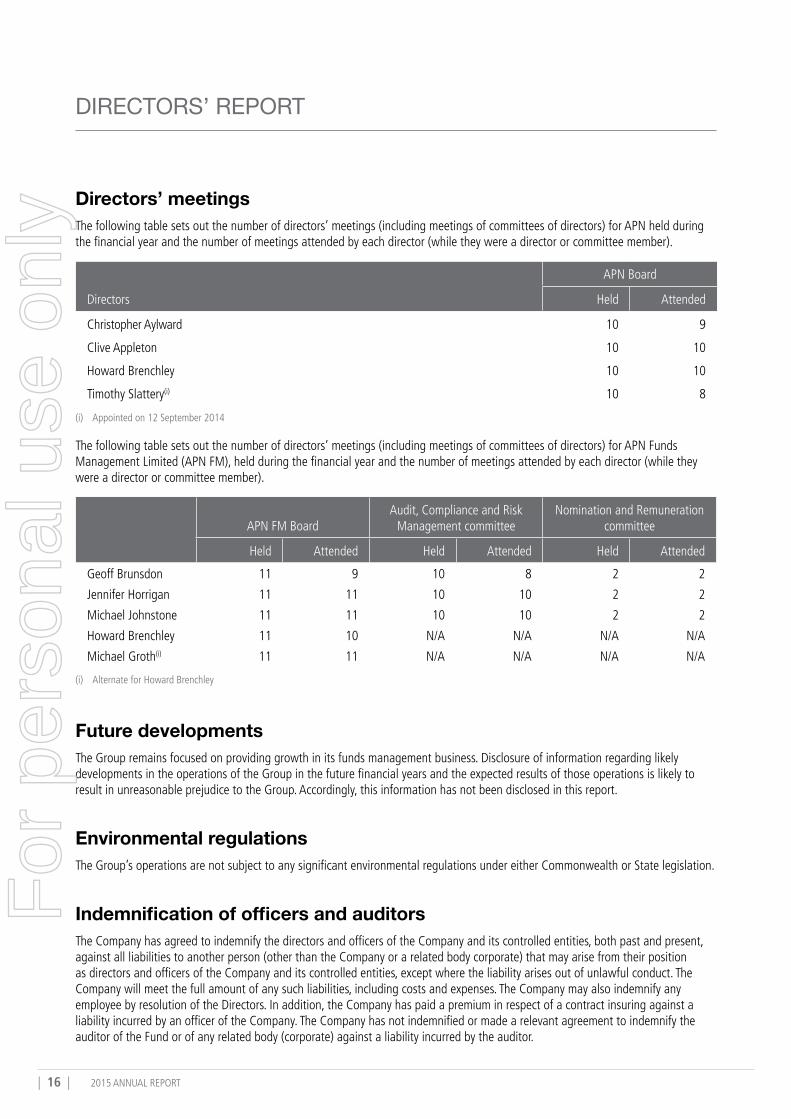
Directors’ meetingsThe following table sets out the number of directors’ meetings (including meetings of committees of directors) for APN held during the financial year and the number of meetings attended by each director (while they were a director or committee member).
Directors
APN Board
Held Attended
Christopher Aylward 10 9
Clive Appleton 10 10
Howard Brenchley 10 10
Timothy Slattery(i) 10 8
(i) Appointed on 12 September 2014
The following table sets out the number of directors’ meetings (including meetings of committees of directors) for APN Funds Management Limited (APN FM), held during the financial year and the number of meetings attended by each director (while they were a director or committee member).
APN FM Board Audit, Compliance and Risk
Management committeeNomination and Remuneration
committee
Held Attended Held Attended Held Attended
Geoff Brunsdon 11 9 10 8 2 2
Jennifer Horrigan 11 11 10 10 2 2
Michael Johnstone 11 11 10 10 2 2
Howard Brenchley 11 10 N/A N/A N/A N/A
Michael Groth(i) 11 11 N/A N/A N/A N/A
(i) Alternate for Howard Brenchley
Future developmentsThe Group remains focused on providing growth in its funds management business. Disclosure of information regarding likely developments in the operations of the Group in the future financial years and the expected results of those operations is likely to result in unreasonable prejudice to the Group. Accordingly, this information has not been disclosed in this report.
Environmental regulationsThe Group’s operations are not subject to any significant environmental regulations under either Commonwealth or State legislation.
Indemnification of officers and auditorsThe Company has agreed to indemnify the directors and officers of the Company and its controlled entities, both past and present, against all liabilities to another person (other than the Company or a related body corporate) that may arise from their position as directors and officers of the Company and its controlled entities, except where the liability arises out of unlawful conduct. The Company will meet the full amount of any such liabilities, including costs and expenses. The Company may also indemnify any employee by resolution of the Directors. In addition, the Company has paid a premium in respect of a contract insuring against a liability incurred by an officer of the Company. The Company has not indemnified or made a relevant agreement to indemnify the auditor of the Fund or of any related body (corporate) against a liability incurred by the auditor.
For
per
sona
l use
onl
y

APN PROPERTY GROUP 2015 ANNUAL REPORT | 17 |
dIRECToRS’ REPoRT
Auditor’s independence declarationThe auditor’s independence declaration is included on page 35 of the annual report. No officer of the Company was a partner or director of the auditor at any time when the auditor undertook an audit of the Company.
Non-audit services Details of amounts paid or payable to the auditor for non-audit services provided during the year by the auditor are outlined in note 30 to the financial statements.
The directors are satisfied that the provision of non-audit services, during the year, by the auditor (or by another person or firm on the auditor’s behalf) is compatible with the general standard of independence for auditors imposed by the Corporations Act 2001.
The directors are of the opinion that the services as disclosed in note 30 do not compromise the external auditor’s independence, for the following reasons:
� all non-audit services have been reviewed and approved to ensure that they do not impact the integrity and objectivity of the auditor, and
� none of the services undermine the general principles relating to auditor independence as set out in Code of Conduct APES 110 Code of Ethics for Professional Accountants issued by the Accounting Professional & Ethical Standards Board, including reviewing or auditing the auditor’s own work, acting in a management or decision-making capacity for the company, acting as advocate for the company or jointly sharing economic risks and rewards.
Rounding off of amountsThe company is a company of the kind referred to in ASIC Class Order 98/100, dated 10 July 1998, and in accordance with that Class Order amounts in the directors’ report and the financial report are rounded off to the nearest thousand dollars, unless otherwise indicated.
rEMuNErATIoN rEPorTDirector and key management personnel detailsThe names of directors of the Company and the Group, who held office during all of the financial year and until the date of this report, except where otherwise noted, are:
Directors of APN
� Christopher Aylward (Executive Chairman, Chief Executive Officer)
� Clive Appleton (Non-Executive Director)
� Howard Brenchley (transitioned from Executive Director to Non-Executive Director on 1 July 2014)
� Timothy Slattery (Executive Director, Appointed 12 September 2014)
Directors of APN FM
� Geoff Brunsdon (Independent Director, Chairman)
� Michael Johnstone (Independent Director)
� Jennifer Horrigan (Independent Director)
� Howard Brenchley (Non-Executive Director)
� Michael Groth (Alternate Director for Howard Brenchley)
The key management personnel of the Group and the Company who were not directors for the financial year were:
� John Freemantle (Company Secretary)
� Michael Groth (Chief Financial Officer)
Remuneration policy for directors and key management personnelPrinciples of compensationRemuneration is referred to as compensation throughout this report. The information provided in the remuneration report has been audited.
This remuneration report relates to the key management personnel (including executive and non-executive directors) and the Company Secretary, being those people who have the authority and responsibility for planning, directing and controlling the activities of the Company and the Group.
For
per
sona
l use
onl
y
| 18 | 2015 ANNUAL REPORT
DIRECTORS’ REPORT
Compensation packages for directors and key management personnel of the Company and the Group are competitively set to attract and retain committed, capable and highly motivated people and reward them for delivering the Group’s strategic objectives and value creation for shareholders. The compensation packages take into account:
� the capability, qualifications and experience of the directors and key management personnel;
� the directors’ and key management personnel’s ability to control the Group’s performance;
� the Group’s performance including:
– the Group’s earnings;
– the growth in the Company’s share price and delivering constant returns on shareholder wealth; and
� the amount of performance based incentives included within each director and key management personnel compensation packages.
Compensation of non-executive directors Fees and payments to non-executive directors reflect the demands and responsibilities of those directors and are reviewed by the Board annually. Non-executive directors’ fees including standing Board committee fees and subsidiary Board fees are determined within an aggregate annual fee pool limit, which is periodically recommended for approval by shareholders. At present that sum is fixed at a maximum of $750,000. Non-executive directors are not entitled to any retirement benefits.
Remuneration for all non-executive directors is in the form of fixed compensation and not by way of a commission on, or a percentage of, profits or operating revenue, with the exception of Clive Appleton who is presently entitled to the benefits of shares in APN issued when he was managing director, pursuant to the incentive arrangements as detailed below.
Subject to the Corporations Act, fees paid for extra services and reimbursement of necessary expenses do not form part of the annual fee pool limit approved by shareholders.
Compensation of executive directors and key management personnel APN’s remuneration policy framework has the following key components:
� Fixed compensation – Salary, including superannuation and employee fringe benefits;
� Short term incentives (STI) – Performance-linked entitlement to cash bonuses; and
� Long term incentives (LTI) – Performance-linked entitlement to shares.
Compensation packages for executive directors and key management personnel may include a mix of fixed (including non-cash benefits) and variable compensation (short and long term incentives) components. In accordance with the Company’s Securities Trading Policy, LTI recipients are prohibited from entering into any kind of transaction which limits the economic risk of participating in that scheme. Compensation packages and key performance indicators (“KPI’s”) are reviewed annually and on promotion by the Board through a process that considers individual, segment and overall performance of the Group and the role and responsibilities of the individual. External remuneration consultants are utilised by the Board where considered necessary to ensure remuneration is appropriately structured and commensurate with comparable roles in the market. No external remuneration consultants were engaged in the current year.
Fixed compensationFixed compensation consists of base salary which is calculated on a total cost basis, inclusive of employer contributions to superannuation funds, and any employee fringe benefits.
Short term incentives (STI)Short term incentives are discretionary and non-discretionary cash bonuses that may be payable annually. They are structured to reward outstanding performance assessed against agreed financial and non-financial KPI’s. All permanent employees (excluding non-executive directors) with more than 6 months service at the end of each financial year are eligible to receive a STI award.
A limited number of employees have the opportunity to earn bonuses in accordance with pre-determined performance criteria. These arrangements are approved in advance by the Board. It is a condition of the incentive, that bonuses earned are payable in three equal instalments over two years, conditional upon continued employment at the time each payment is due.
All other eligible employees will be considered for bonuses each year depending upon performance against criteria established for each individual. Bonuses will be determined by the Board in its absolute discretion, having regard to the financial performance of the APN Group for the financial year. F
or p
erso
nal u
se o
nly
APN PROPERTY GROUP 2015 ANNUAL REPORT | 19 |
dIRECToRS’ REPoRT
Long term incentives (LTI)Long term incentives are equity based incentives designed to attract, retain and motivate selected employees’ who can contribute to the strategic objectives and success of the Group. Participation in the ownership of the APN Group through LTI’s is subject vesting criteria aligned to the creation of long term shareholder value.
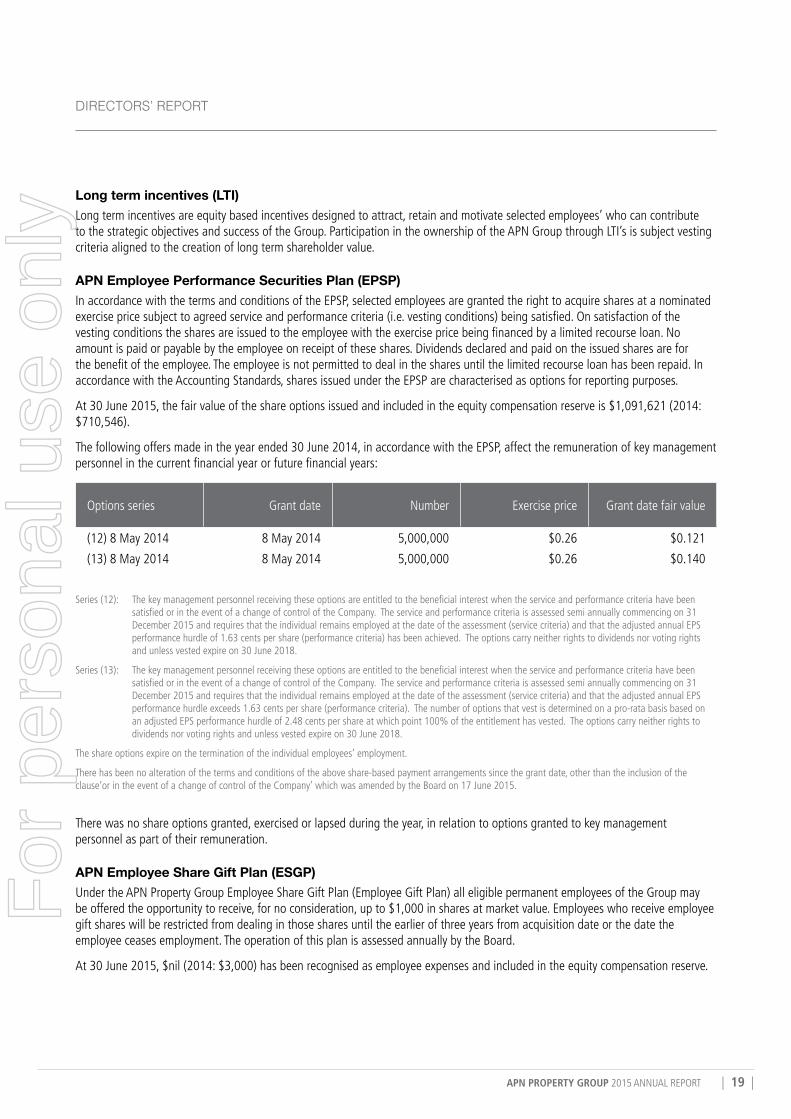
APN Employee Performance Securities Plan (EPSP)In accordance with the terms and conditions of the EPSP, selected employees are granted the right to acquire shares at a nominated exercise price subject to agreed service and performance criteria (i.e. vesting conditions) being satisfied. On satisfaction of the vesting conditions the shares are issued to the employee with the exercise price being financed by a limited recourse loan. No amount is paid or payable by the employee on receipt of these shares. Dividends declared and paid on the issued shares are for the benefit of the employee. The employee is not permitted to deal in the shares until the limited recourse loan has been repaid. In accordance with the Accounting Standards, shares issued under the EPSP are characterised as options for reporting purposes.
At 30 June 2015, the fair value of the share options issued and included in the equity compensation reserve is $1,091,621 (2014: $710,546).
The following offers made in the year ended 30 June 2014, in accordance with the EPSP, affect the remuneration of key management personnel in the current financial year or future financial years:
Options series Grant date Number Exercise price Grant date fair value
(12) 8 May 2014 8 May 2014 5,000,000 $0.26 $0.121
(13) 8 May 2014 8 May 2014 5,000,000 $0.26 $0.140
Series (12): The key management personnel receiving these options are entitled to the beneficial interest when the service and performance criteria have been satisfied or in the event of a change of control of the Company. The service and performance criteria is assessed semi annually commencing on 31 December 2015 and requires that the individual remains employed at the date of the assessment (service criteria) and that the adjusted annual EPS performance hurdle of 1.63 cents per share (performance criteria) has been achieved. The options carry neither rights to dividends nor voting rights and unless vested expire on 30 June 2018.
Series (13): The key management personnel receiving these options are entitled to the beneficial interest when the service and performance criteria have been satisfied or in the event of a change of control of the Company. The service and performance criteria is assessed semi annually commencing on 31 December 2015 and requires that the individual remains employed at the date of the assessment (service criteria) and that the adjusted annual EPS performance hurdle exceeds 1.63 cents per share (performance criteria). The number of options that vest is determined on a pro-rata basis based on an adjusted EPS performance hurdle of 2.48 cents per share at which point 100% of the entitlement has vested. The options carry neither rights to dividends nor voting rights and unless vested expire on 30 June 2018.
The share options expire on the termination of the individual employees’ employment.
There has been no alteration of the terms and conditions of the above share-based payment arrangements since the grant date, other than the inclusion of the clause‘or in the event of a change of control of the Company’ which was amended by the Board on 17 June 2015.
There was no share options granted, exercised or lapsed during the year, in relation to options granted to key management personnel as part of their remuneration.
APN Employee Share Gift Plan (ESGP)Under the APN Property Group Employee Share Gift Plan (Employee Gift Plan) all eligible permanent employees of the Group may be offered the opportunity to receive, for no consideration, up to $1,000 in shares at market value. Employees who receive employee gift shares will be restricted from dealing in those shares until the earlier of three years from acquisition date or the date the employee ceases employment. The operation of this plan is assessed annually by the Board.
At 30 June 2015, $nil (2014: $3,000) has been recognised as employee expenses and included in the equity compensation reserve.
For
per
sona
l use
onl
y
| 20 | 2015 ANNUAL REPORT
DIRECTORS’ REPORT
Other Incentive Plans (no longer in operation)Some employees retain entitlements under former plans but no new benefits will accrue from them. These are:
APN Employee Share Plan (ESS)The APN Employee Share Plan is no longer in operation however shares / options previously issued under this plan remain outstanding. Under the terms and conditions of the ESS, shares were issued at market price and financed by a limited recourse loan. No amounts were paid or payable by the recipients on receipt of the shares / options. In accordance with the Accounting Standards, shares issued under the ESS are characterised as options for reporting purposes.
Clive Appleton Share Trust (CAST)Shares were issued to former managing director, Clive Appleton in September 2004 pursuant to the APN Property Group Clive Appleton Share Plan. The terms and conditions are the same in all material respects with the ESS outlined above.
At 30 June 2015, 3,900,001 (2014: 3,900,001) share options were outstanding and the fair value of share options under this arrangement included in the equity compensation reserve is $104,000 (2014: $104,000). The shares are fully vested and can be exercised at any time.
Miles Wentworth and Chris Adams (MWCA)The last issue under the MWCA plan was in August 2011. The shares were issued as a sign-on incentive as part of the Groups’ acquisition of 67.5% of the Generation Healthcare REIT management business. The issue price of the shares was fully financed by limited recourse loans provided by the Group. Dividends are for the benefit of the individuals. The individuals are not permitted to deal in the shares until the limited recourse loan has been repaid. Shares issued under the MWCA plan are characterised as share options.
At 30 June 2015, the fair value of the share options issued and included in equity compensation reserve is $nil (2014: $nil).
Project Specific Incentives � There are a limited number of commitments made to
provide incentives to staff directly involved with the success of development projects undertaken by development funds managed by APN FM. These have been structured to comply with the expectations of the investors in these funds that key staff rewards be aligned to the project outcomes.
� Incentives will be paid in accordance with the successful delivery of certain prescribed milestones established for project success. The milestones are matched to the parameters under which APN can earn management fees from these projects. No bonuses will be paid unless APN first earns a fee from achieving these milestones.
Executive Directors and Key Management Personnel service agreementsRemuneration and other terms of employment for executive directors and key management personnel are formalised in service agreements or letters of employment.
Letters of employment for key management personnel provide for various conditions in line with market practice including:
� an annual remuneration package and benefits including superannuation which is reviewed at least on an annual basis with reviews currently effective on 1st July each year;
� the basis of termination or retirement and the benefits and conditions as a consequence;
� agreed provisions in relation to annual leave and long service leave, confidential information, intellectual property; and
� a restrictive covenant preventing the employees from engaging in specified activities after their employment with the Group ceases.
Service agreement entered into with Executive Director, Christopher Aylward, is as set out below.
� Christopher Aylward has entered into an open ended agreement which is terminable by either party with six months notice. The agreement provides for a total remuneration package of $30,000 per annum (excluding share-based payments, long service leave benefits and other non-monetary benefits, if applicable).
There are no other termination payments provided for, in these contracts or in the employment contracts of any other key management personnel. All key management personnel service agreements or letters of employment provide for a notice period between 3 to 6 months, except as otherwise stated above.F
or p
erso
nal u
se o
nly
APN PROPERTY GROUP 2015 ANNUAL REPORT | 21 |
dIRECToRS’ REPoRT
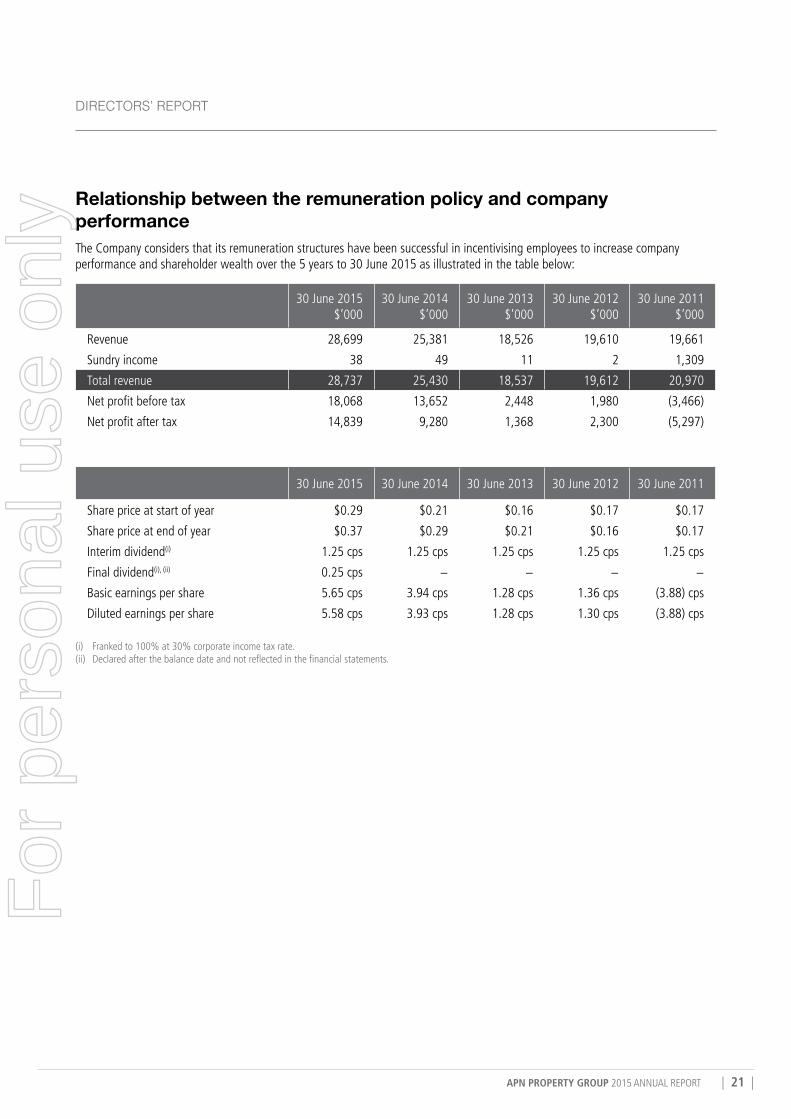
Relationship between the remuneration policy and company performanceThe Company considers that its remuneration structures have been successful in incentivising employees to increase company performance and shareholder wealth over the 5 years to 30 June 2015 as illustrated in the table below:
30 June 2015 $’000
30 June 2014 $’000
30 June 2013 $’000
30 June 2012 $’000
30 June 2011 $’000
Revenue 28,699 25,381 18,526 19,610 19,661
Sundry income 38 49 11 2 1,309
Total revenue 28,737 25,430 18,537 19,612 20,970
Net profit before tax 18,068 13,652 2,448 1,980 (3,466)
Net profit after tax 14,839 9,280 1,368 2,300 (5,297)
30 June 2015 30 June 2014 30 June 2013 30 June 2012 30 June 2011
Share price at start of year $0.29 $0.21 $0.16 $0.17 $0.17
Share price at end of year $0.37 $0.29 $0.21 $0.16 $0.17
Interim dividend(i) 1.25 cps 1.25 cps 1.25 cps 1.25 cps 1.25 cps
Final dividend(i), (ii) 0.25 cps − − − −
Basic earnings per share 5.65 cps 3.94 cps 1.28 cps 1.36 cps (3.88) cps
Diluted earnings per share 5.58 cps 3.93 cps 1.28 cps 1.30 cps (3.88) cps
(i) Franked to 100% at 30% corporate income tax rate.(ii) Declared after the balance date and not reflected in the financial statements.
For
per
sona
l use
onl
y
| 22 | 2015 ANNUAL REPORT
DIRECTORS’ REPORT
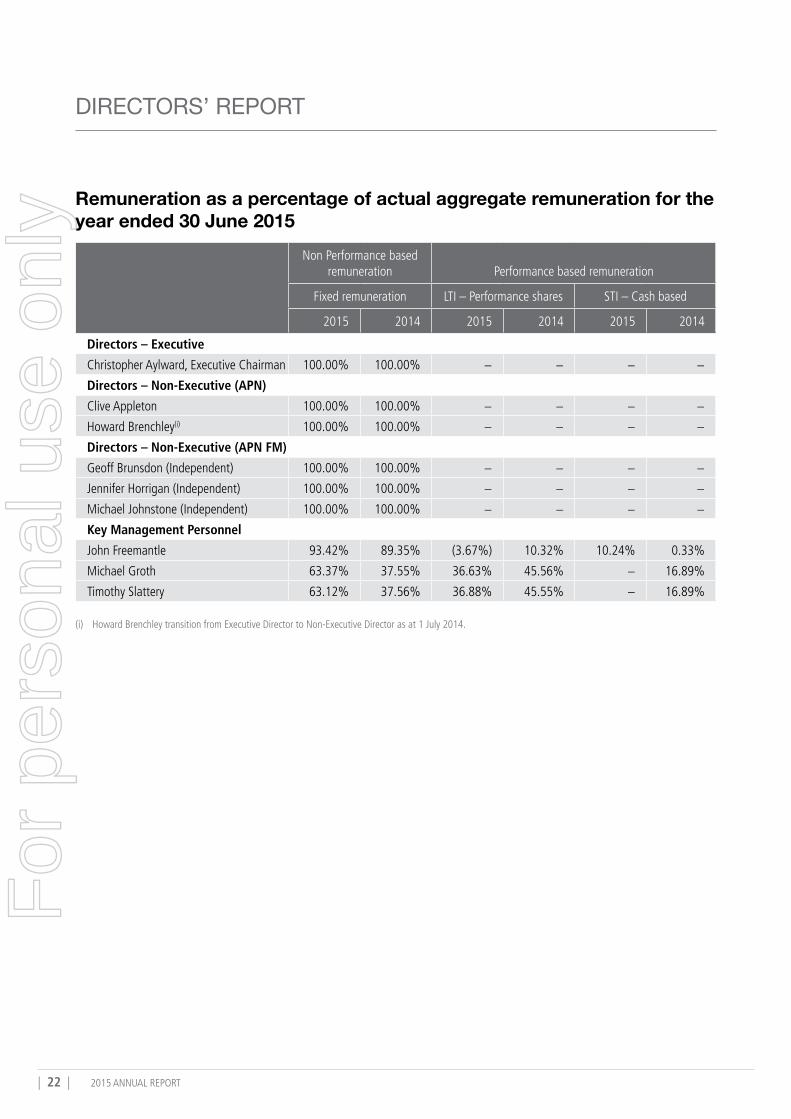
Remuneration as a percentage of actual aggregate remuneration for the year ended 30 June 2015
Non Performance based remuneration Performance based remuneration
Fixed remuneration LTI – Performance shares STI – Cash based
2015 2014 2015 2014 2015 2014
Directors – Executive
Christopher Aylward, Executive Chairman 100.00% 100.00% − − − −
Directors – Non-Executive (APN)
Clive Appleton 100.00% 100.00% − − − −
Howard Brenchley(i) 100.00% 100.00% − − − −
Directors – Non-Executive (APN FM)
Geoff Brunsdon (Independent) 100.00% 100.00% − − − −
Jennifer Horrigan (Independent) 100.00% 100.00% − − − −
Michael Johnstone (Independent) 100.00% 100.00% − − − −
Key Management Personnel
John Freemantle 93.42% 89.35% (3.67%) 10.32% 10.24% 0.33%
Michael Groth 63.37% 37.55% 36.63% 45.56% − 16.89%
Timothy Slattery 63.12% 37.56% 36.88% 45.55% − 16.89%
(i) Howard Brenchley transition from Executive Director to Non-Executive Director as at 1 July 2014.
For
per
sona
l use
onl
y
APN PROPERTY GROUP 2015 ANNUAL REPORT | 23 |
dIRECToRS’ REPoRT
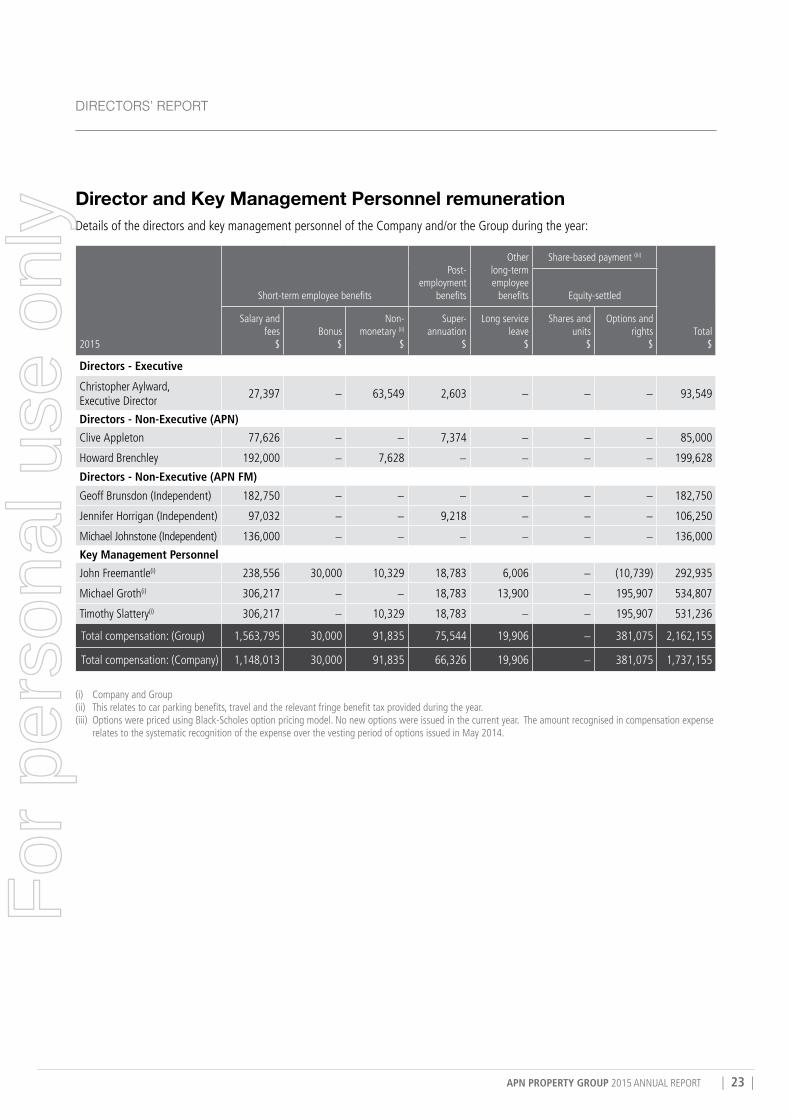
Director and Key Management Personnel remuneration Details of the directors and key management personnel of the Company and/or the Group during the year:
2015
Short-term employee benefits
Post-employment
benefits
Other long-term employee
benefits
Share-based payment (iii)
Total $
Equity-settled
Salary and fees
$Bonus
$
Non-monetary (ii)
$
Super-annuation
$
Long service leave
$
Shares and units
$
Options and rights
$
Directors - Executive
Christopher Aylward, Executive Director
27,397 − 63,549 2,603 − − − 93,549
Directors - Non-Executive (APN)
Clive Appleton 77,626 − − 7,374 − − − 85,000
Howard Brenchley 192,000 − 7,628 − − − − 199,628
Directors - Non-Executive (APN FM)
Geoff Brunsdon (Independent) 182,750 − − − − − − 182,750
Jennifer Horrigan (Independent) 97,032 − − 9,218 − − − 106,250
Michael Johnstone (Independent) 136,000 − − − − − − 136,000
Key Management Personnel
John Freemantle(i) 238,556 30,000 10,329 18,783 6,006 − (10,739) 292,935
Michael Groth(i) 306,217 − − 18,783 13,900 − 195,907 534,807
Timothy Slattery(i) 306,217 − 10,329 18,783 − − 195,907 531,236
Total compensation: (Group) 1,563,795 30,000 91,835 75,544 19,906 − 381,075 2,162,155
Total compensation: (Company) 1,148,013 30,000 91,835 66,326 19,906 − 381,075 1,737,155
(i) Company and Group(ii) This relates to car parking benefits, travel and the relevant fringe benefit tax provided during the year. (iii) Options were priced using Black-Scholes option pricing model. No new options were issued in the current year. The amount recognised in compensation expense
relates to the systematic recognition of the expense over the vesting period of options issued in May 2014.
For
per
sona
l use
onl
y
| 24 | 2015 ANNUAL REPORT
DIRECTORS’ REPORT
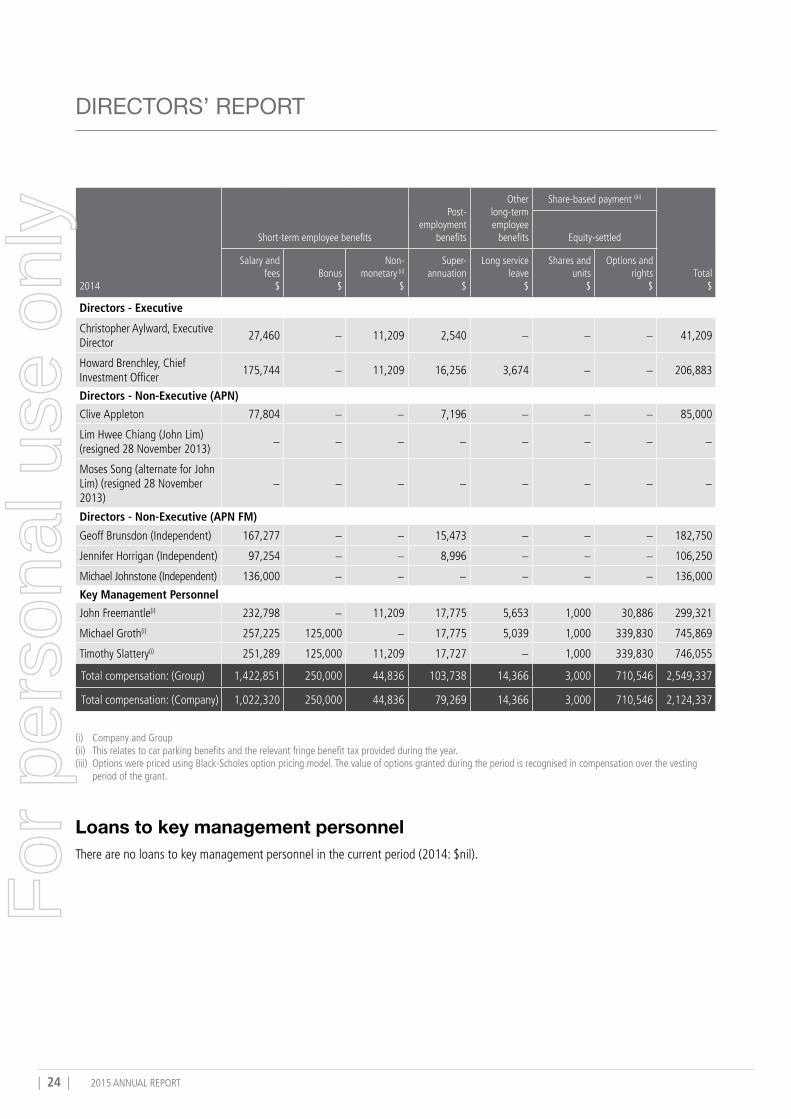
2014
Short-term employee benefits
Post-employment
benefits
Other long-term employee
benefits
Share-based payment (iii)
Total $
Equity-settled
Salary and fees
$Bonus
$
Non-monetary (ii)
$
Super-annuation
$
Long service leave
$
Shares and units
$
Options and rights
$
Directors - Executive
Christopher Aylward, Executive Director
27,460 − 11,209 2,540 − − − 41,209
Howard Brenchley, Chief Investment Officer
175,744 − 11,209 16,256 3,674 − − 206,883
Directors - Non-Executive (APN)
Clive Appleton 77,804 − − 7,196 − − − 85,000
Lim Hwee Chiang (John Lim) (resigned 28 November 2013)
− − − − − − − −
Moses Song (alternate for John Lim) (resigned 28 November 2013)
− − − − − − − −
Directors - Non-Executive (APN FM)
Geoff Brunsdon (Independent) 167,277 − − 15,473 − − − 182,750
Jennifer Horrigan (Independent) 97,254 − − 8,996 − − − 106,250
Michael Johnstone (Independent) 136,000 − − − − − − 136,000
Key Management Personnel
John Freemantle(i) 232,798 − 11,209 17,775 5,653 1,000 30,886 299,321
Michael Groth(i) 257,225 125,000 − 17,775 5,039 1,000 339,830 745,869
Timothy Slattery(i) 251,289 125,000 11,209 17,727 − 1,000 339,830 746,055
Total compensation: (Group) 1,422,851 250,000 44,836 103,738 14,366 3,000 710,546 2,549,337
Total compensation: (Company) 1,022,320 250,000 44,836 79,269 14,366 3,000 710,546 2,124,337
(i) Company and Group(ii) This relates to car parking benefits and the relevant fringe benefit tax provided during the year. (iii) Options were priced using Black-Scholes option pricing model. The value of options granted during the period is recognised in compensation over the vesting
period of the grant.
Loans to key management personnelThere are no loans to key management personnel in the current period (2014: $nil).
For
per
sona
l use
onl
y
APN PROPERTY GROUP 2015 ANNUAL REPORT | 25 |
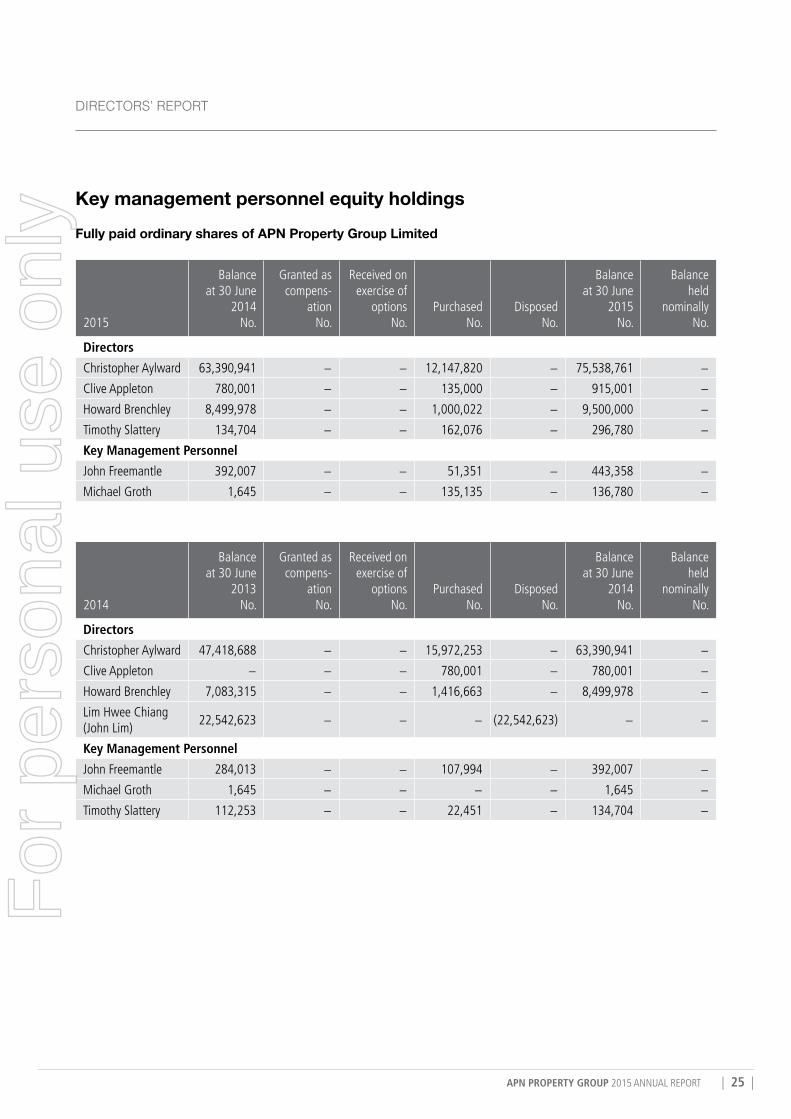
dIRECToRS’ REPoRT
Key management personnel equity holdings Fully paid ordinary shares of APN Property Group Limited
2015
Balance at 30 June
2014 No.
Granted as compens-
ation No.
Received on exercise of
options No.
Purchased No.
Disposed No.
Balance at 30 June
2015 No.
Balance held
nominally No.
Directors
Christopher Aylward 63,390,941 − − 12,147,820 − 75,538,761 −
Clive Appleton 780,001 − − 135,000 − 915,001 −
Howard Brenchley 8,499,978 − − 1,000,022 − 9,500,000 −
Timothy Slattery 134,704 − − 162,076 − 296,780 −
Key Management Personnel
John Freemantle 392,007 − − 51,351 − 443,358 −
Michael Groth 1,645 − − 135,135 − 136,780 −
2014
Balance at 30 June
2013 No.
Granted as compens-
ation No.
Received on exercise of
options No.
Purchased No.
Disposed No.
Balance at 30 June
2014 No.
Balance held
nominally No.
Directors
Christopher Aylward 47,418,688 − − 15,972,253 − 63,390,941 −
Clive Appleton − − − 780,001 − 780,001 −
Howard Brenchley 7,083,315 − − 1,416,663 − 8,499,978 −
Lim Hwee Chiang (John Lim)
22,542,623 − − − (22,542,623) − −
Key Management Personnel
John Freemantle 284,013 − − 107,994 − 392,007 −
Michael Groth 1,645 − − − − 1,645 −
Timothy Slattery 112,253 − − 22,451 − 134,704 −
For
per
sona
l use
onl
y
| 26 | 2015 ANNUAL REPORT
DIRECTORS’ REPORT
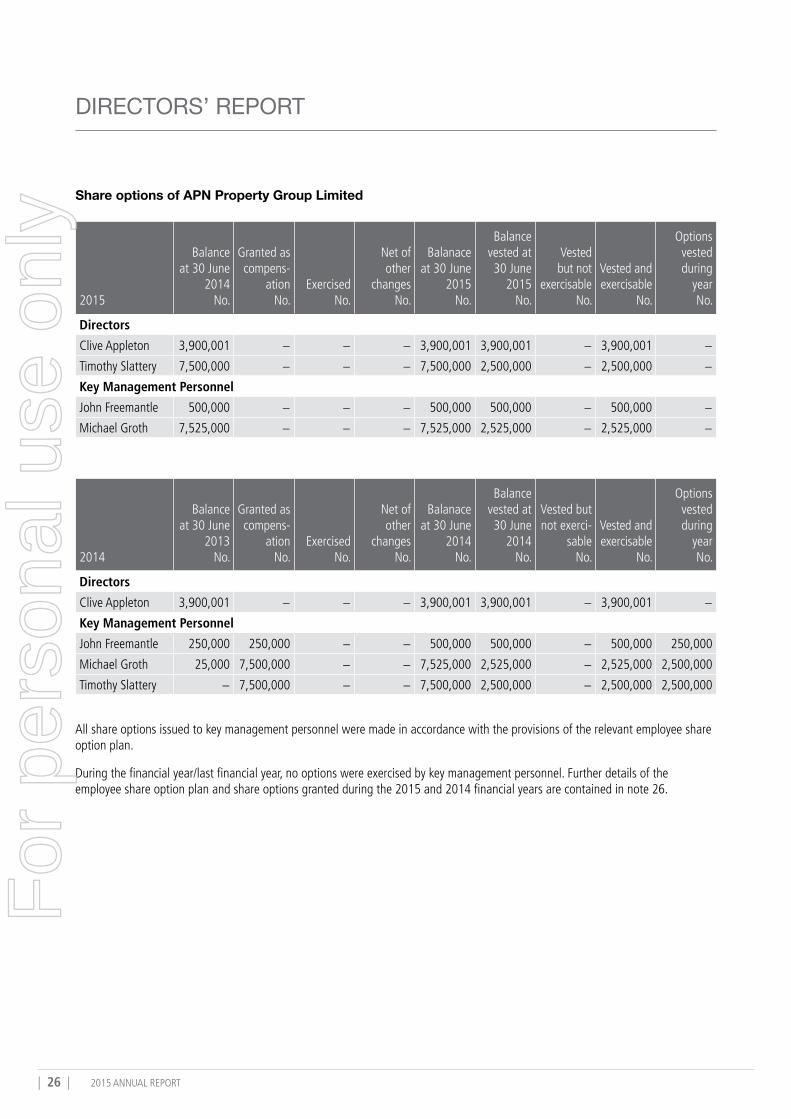
Share options of APN Property Group Limited
2015
Balance at 30 June
2014 No.
Granted as compens-
ation No.
Exercised No.
Net of other
changes No.
Balanace at 30 June
2015 No.
Balance vested at 30 June
2015 No.
Vested but not
exercisable No.
Vested and exercisable
No.
Options vested during
year No.
Directors
Clive Appleton 3,900,001 − − − 3,900,001 3,900,001 − 3,900,001 −
Timothy Slattery 7,500,000 − − − 7,500,000 2,500,000 − 2,500,000 −
Key Management Personnel
John Freemantle 500,000 − − − 500,000 500,000 − 500,000 −
Michael Groth 7,525,000 − − − 7,525,000 2,525,000 − 2,525,000 −
2014
Balance at 30 June
2013 No.
Granted as compens-
ation No.
Exercised No.
Net of other
changes No.
Balanace at 30 June
2014 No.
Balance vested at 30 June
2014 No.
Vested but not exerci-
sable No.
Vested and exercisable
No.
Options vested during
year No.
Directors
Clive Appleton 3,900,001 − − − 3,900,001 3,900,001 − 3,900,001 −
Key Management Personnel
John Freemantle 250,000 250,000 − − 500,000 500,000 − 500,000 250,000
Michael Groth 25,000 7,500,000 − − 7,525,000 2,525,000 − 2,525,000 2,500,000
Timothy Slattery − 7,500,000 − − 7,500,000 2,500,000 − 2,500,000 2,500,000
All share options issued to key management personnel were made in accordance with the provisions of the relevant employee share option plan.
During the financial year/last financial year, no options were exercised by key management personnel. Further details of the employee share option plan and share options granted during the 2015 and 2014 financial years are contained in note 26.
For
per
sona
l use
onl
y

APN PROPERTY GROUP 2015 ANNUAL REPORT | 27 |
dIRECToRS’ REPoRT
Signed in accordance with a resolution of directors made pursuant to s.298(2) of the Corporations Act 2001.
On behalf of the Directors
Christopher Aylward Executive Chairman
24 August 2015
For
per
sona
l use
onl
y
| 28 | 2015 ANNUAL REPORT
DIRECTORS’ REPORT
APN CorPorATE GOVERNANCE STATEMENTThis 2015 statement, approved by the Board of APN Property Group Limited on 24 August 2015, outlines the main corporate governance practices in place throughout the financial year, which comply with the ASX Corporate Governance Council’s Corporate Governance Principles and Recommendations (ASX Guidelines), unless otherwise stated.
The APN Property Group comprises a number of companies including parent entity, APN Property Group Limited and wholly owned subsidiary, APN Funds Management Limited (APN FM). APN FM is the Responsible Entity for the managed investment schemes currently operated by APN.
The boards of APN and APN FM operate independently of each other.
� The board of APN (Board) comprises four directors, who collectively have a relevant interest in over 30% of the issued capital of the company. Two directors are also executives of the company. The Board is responsible for the overall management of the Company and of the APN Group and is strongly focussed on serving the interests of all shareholders.
� The board of APN FM comprises four Directors, three of whom are independent of the business and of the board of APN. All directors of APN FM have a legal obligation to put the interests of investors in the respective managed funds, ahead of their own, and those of APN.
The Board considers that separation of the boards ensures that the responsibility for managing the interests of shareholders in APN is completely independent of managing the interests of the APN funds and their respective investors. The separation also assists in enhancing the identification and management of conflicts of interest and related party transactions within the APN Group.
The Board of APN has adopted the following Corporate Governance policies and procedures:Role and responsibility of the BoardThe Board is responsible for the overall management of the Company and of the APN Group including the determination of the APN Group’s strategic direction.
Without limitation to the duties and responsibilities of directors under the Corporations Act, the Constitution and all applicable laws, the Board is responsible for:
� Oversight of the APN Group, including its control and accountability systems;
� Setting the aims, strategies and policies of the APN Group, in particular in respect of:
– the direction of the APN Group’s property funds management business (including the establishment of new funds from time to time); and
– the decisions to co-invest in APN managed funds;
� Appointing and removing the managing director of APN (or equivalent); and where appropriate, ratifying the appointment and the removal of senior executives of APN including, but not limited to, the chief financial officer (or equivalent) and company secretary;
� Providing input into and final approval of management’s development of corporate strategy and performance objectives for the APN Group;
� Reviewing, ratifying and monitoring systems of risk management and internal compliance and control, codes of conduct and legal compliance for the APN Group;
� Monitoring senior management’s performance and implementation of strategy and ensuring appropriate resources are available;
� Approving and monitoring the progress of major capital expenditure, financial reporting, capital management and acquisitions and divestitures within the APN Group; and
� Approving and monitoring financial and other reporting obligations of entities within the APN Group.F
or p
erso
nal u
se o
nly

APN PROPERTY GROUP 2015 ANNUAL REPORT | 29 |
dIRECToRS’ REPoRT
Audit and risk managementThe Board has not appointed an audit and risk management committee and accordingly is responsible for the audit and risk management functions in respect of the Company. The audit and risk management functions of the Board are:
External audit � to determine the appointment and removal of external
auditors;
� to monitor compliance with the Corporations Act in relation to auditor rotation;
� to undertake periodic reviews in order to monitor the effectiveness, objectivity and independence of the external auditor;
� to review and consider the adequacy of the audit plan proposed by the external auditors;
� to review all of the external auditor’s reports;
� to commission such enquiry by the external auditors as the Board deems appropriate;
� to consider management’s responses to matters that arise from external audits;
� to conduct regular reviews of management’s activity pertaining to audit findings to ensure any issues are being dealt with in a timely manner; and
� to perform annual assessments of the external auditor’s compliance with any applicable laws, regulations and any other relevant requirements.
Financial statements � to review APN’s financial statements and related notes, and
ensure they are consistent with information known to Board members and that they reflect appropriate accounting principles, standards and regulations;
� to review the external auditor’s reviews or audits of APN’s financial statements and corresponding reports;
� to consider any significant changes required in the external auditor’s audit plans;
� to review accounting and reporting issues as they arise; and
� to review any disputes or issues that may arise during the course of an audit.
Risk management � to monitor the management of risks relevant to the APN
Group;
� to review the APN Group’s current risk management program (including all internal policies developed and implemented to manage and identify all of the identified risks (Governance Policies)) and whether it identifies all areas of potential risk and also ensures the APN Group has in place:
– a procedure for identifying risks and controlling financial or other impacts on the APN Group;
– an adequate system of internal control, management of business risks and safeguarding of assets;
– a system for reporting and investigating breaches of the APN Group’s compliance and risk management procedures and Governance Policies; and
– a review of internal control systems and the operational effectiveness of the Governance Policies and procedures related to risk and control; and
� to ensure that regular audits of the Governance Policies are conducted to monitor compliance;
� to monitor compliance with the APN Group Conflicts of Interest and Related Party Transactions Policy and comply with its obligations under the policy;
� to oversee investigations of allegations of fraud or malfeasance.
The Board will immediately delegate the audit and risk management functions to a board committee if so required by the Listing Rules, Corporations Act or any other applicable laws.
A review of the risk management program took place during the year.
For
per
sona
l use
onl
y
| 30 | 2015 ANNUAL REPORT
DIRECTORS’ REPORT
Nomination and remunerationThe Board has not appointed a nomination and remuneration committee and accordingly is responsible for the nomination and remuneration functions in respect of the entities within the APN Group. The nomination and remuneration functions of the Board are:
� determining the appropriate size and composition of the Board, together with the board of APN FM;
� the appointment, re-appointment and removal of directors;
� developing formal and transparent procedures and criteria for the selection of candidates for, and appointments to, the Board and the board of APN FM in the context of each board’s existing composition and structure;
� developing a succession plan for the Board and the board of APN FM and regularly reviewing the succession plan;
� implementing induction procedures designed to allow new directors to participate fully and actively in Board decision-making at the earliest opportunity;
� implementing induction programs that enable directors to gain an understanding of:
– the APN Group’s financial, strategic, operational and risk management position;
– their rights, duties and responsibilities which, in the case of directors of APN FM, includes their specific duties and responsibilities as directors of a corporate trustee and responsible entity; and
– the role of the Board and Board committees;
� providing directors and key executives with access to continuing education to update their skills and knowledge and provide them access to internal and external sources of information which enhance their effectiveness in their roles;
� developing a process for performance and remuneration evaluation of the Board, its committees and individual directors and key executives, which can be made available to the public;
� developing remuneration and incentive policies which motivate directors and management to pursue the long-term growth and success of the APN Group within an appropriate control framework;
� developing policies which demonstrate a clear relationship between key executive performance and remuneration;
� the remuneration and incentive policies for senior executives within the APN Group; and
� the remuneration packages of senior executives and directors.
A copy of the APN Board Charter is available on the Company’s website (www.apngroup.com.au).
The Board of APN FM has adopted Corporate Governance policies and procedures as follows:Roles and responsibility of the Board of APN FMThe Board is responsible for the overall management of the Company and in particular the proper governance as Responsible Entity for the managed investment schemes currently operated by APN.
A copy of the APN FM Board Charter is available on the Company’s website (www.apngroup.com.au).
Audit, Compliance and Risk Management Committee for Managed Investment Schemes – APN FMThe board of APN FM has established an Audit, Compliance and Risk Management Committee. Responsibility for overseeing APN FM’s responsibilities for audit, compliance and risk management for itself and each APN fund is managed by this committee.
A copy of the Charter for the APN FM Audit, Compliance and Risk Management Committee is available on the Company’s website (www.apngroup.com.au).
Nomination and Remuneration Committee for Managed Investment Schemes – APN FMThe board of APN FM has established a Nomination and Remuneration Committee for overseeing APN FM’s responsibilities for ensuring adequacy of the size and composition of the board of APN FM for itself and each APN fund.
A copy of the Charter for the APN FM Nomination and Remuneration Committee is available on the Company’s website (www.apngroup.com.au).
Composition, Structure and Processes The Board currently comprises four directors (two of whom are also executives of the company). Each has a significant relevant interest in the Company. The names and biographical details of the directors are set out on pages 4 to 5 of the directors’ report.
For
per
sona
l use
onl
y

APN PROPERTY GROUP 2015 ANNUAL REPORT | 31 |
dIRECToRS’ REPoRT
Terms of appointmentThe Board has adopted a letter of appointment that contains the terms on which non-executive directors are to be appointed, including the basis upon which they will be indemnified by the Company. Non-executive directors are entitled to take independent advice at the cost of the Company in relation to their role as members of the Board.
Review of Board performanceThe performance of the Board is reviewed at least annually by the Board. The evaluation includes a review of:
� the Board’s membership and the charters of the Board and its committees (if any);
� Board processes and its committees’ (if any) effectiveness in supporting the Board; and
� the performance of the Board and its committees (if any).
A review of each Director’s performance is undertaken by the Chairman, after consultation with the other directors, prior to a director standing for re-election.
Ethical Standards, Market Communication and Conflict of InterestCode of ConductThe Board of the Company has adopted a Code of Conduct that applies to all directors and employees of the Company and its subsidiaries. The purpose of the Code of Conduct is to clarify the standards of ethical behaviour required of the Company directors and all employees and encourage the observance of those standards, and to ensure high standards of corporate and individual behaviour are observed by all of the Company’s employees in the context of their employment with the Company. By adoption of the Code of Conduct, the Company wants to ensure that all persons dealing with the Company, whether it be employees, shareholders, investors, customers or competitors, can be guided by the stated values and policies of the Company.
The Code of Conduct also sets out the Board’s view on conflicts of interest and related party transactions involving directors and employees and other legal and compliance obligations of the Company including corporate opportunities, confidentiality, fair dealing, protection of and proper use of Company information and assets, compliance with laws and regulations and encouraging the reporting of unlawful or unethical conduct.
A copy of the Code of Conduct is available at the Company’s website (www.apngroup.com.au).
Securities Trading PolicyThe Company has adopted a Securities Trading Policy that summarises the law relating to insider trading and other relevant provisions and sets out the procedures of the Company and its subsidiaries for permission and disclosure of trading by directors and employees in APN Group securities.
The Securities Trading Policy applies to all directors, executives, senior management and other employees of the Company and its subsidiaries and is designed to prevent breaches of the insider trading provisions by directors and employees of the Company and its subsidiaries. The Securities Trading Policy confirms that it is the responsibility of all directors and employees to comply with the insider trading provisions of the Corporations Act and to bring information in relation to any actual or potential insider trading to the attention of the relevant officer of the Company or its subsidiaries, as appropriate.
A copy of the Securities Trading Policy is available at the Company’s website (www.apngroup.com.au).
Continuous DisclosureThe Company has adopted a Continuous Disclosure Policy to ensure that shareholders and the market have equal and timely access to material information regarding developments in relation to the Company in accordance with applicable disclosure requirements in both the Corporations Act and the ASX Listing Rules. Such information will relate to matters including the financial position, performance, ownership and governance in relation to the Company.
A copy of the Continuous Disclosure Policy is available at the Company’s website (www.apngroup.com.au).
Communication with shareholdersThe Company has adopted a Communications Policy in order to ensure that there is effective communication between the Company and its shareholders, and also to encourage shareholders to participate at general meetings.
In accordance with the Company’s Communications Policy, the APN Group website (www.apngroup.com.au) is a significant component of the communications strategy. The Company ensures that its website is continually updated and contains recent announcements, webcasts, presentations, disclosure documents, market information and answers to frequently asked questions.
A copy of the Communications Policy is available at the Company’s website (www.apngroup.com.au).
For
per
sona
l use
onl
y

| 32 | 2015 ANNUAL REPORT
Diversity APN Property Group, including APN Funds Management Limited embraces a practice of Workplace Diversity as follows:
What is Workplace Diversity?Workplace diversity recognises and leverages the different skills and perspectives people bring to our organisation through their gender, culture, physical and mental ability, sexual orientation, age, socio economic background, language, religion, education, and family / marital status. It also refers to diverse ways of thinking and ways of working.
Statement of Commitment As an organisation we recognise the benefits to be gained from a diverse workforce where the differing skills, perspectives and experiences of individuals from different backgrounds can lead to more innovative and efficient business practices.
We are committed to creating an environment in which the principles of diversity are embedded in the culture and systems of the organisation and where every individual has the opportunity to excel.
Diversity PolicyAPN Property Group has adopted a Diversity Policy (a copy of which is available at the Company’s website (www.apngroup.com.au)). The aims of the Diversity Policy are:
� to articulate APN Property Group’s commitment to diversity within its organisation at all levels (including employee level, senior executive level and Board level); and
� to establish objectives and procedures which are designed to foster and promote diversity within APN Property Group. This includes placing obligations on APN Property Group and its Board to set objectives, measure against those objectives and disclose progress at appropriate intervals.
Gender Diversity ObjectivesIn accordance with its Diversity Policy, APN Property Group has set measureable objectives to achieve gender and other diversity, and has appointed the Compliance Officer to monitor compliance with those objectives and to report to the Board of APN Property Group at least annually.
For the financial year 2015/2016, APN Property Group has set the following measureable objectives for gender and other diversity:
� the selection process for Board appointments, having regard for the need to maintain an appropriate mix of skills, experience, expertise and diversity will consider at least one female candidate wherever reasonably possible;
� the selection process for senior management appointments, having regard for the need to maintain an appropriate mix of skills, experience, expertise and diversity will consider at least one female candidate wherever reasonably possible;
� the process for recruitment of new employees, having regard for the skills and expertise required for the role, will consider at least one female candidate wherever reasonably possible;
� flexible work arrangements to balance family and other commitments with the role will continue to be considered for all employees, where the requirements of the role permit;
� the Diversity Policy is available to all employees at all times; and
� all employees responsible for employment and promotion of employees will be reminded of the Diversity Policy and these objectives at least annually.
APN Property Group will report on the outcome of these measurable objectives each year.
For the financial year 2014/2015, APN Property Group set similar measureable objectives for gender and other diversity. These objectives and a report on the outcome are set out below:
� the selection process for Board appointments, having regard for the need to maintain an appropriate mix of skills, experience, expertise and diversity will consider at least one female candidate wherever reasonably possible.
– The Board made one new appointment during the year. Mr Tim Slattery was appointed in September 2014 to fill the vacancy arising from the resignation of Mr John Lim the previous year. Mr Slattery is an executive director and has been with APN for a number of years. There were no changes to the Board of APN FM during the year.
� the selection process for senior management appointments, having regard for the need to maintain an appropriate mix of skills, experience, expertise and diversity will consider at least one female candidate wherever reasonably possible.
– There were no senior management appointments in this financial year.
� the process for recruitment of new employees, having regard for the skills and expertise required for the role, will consider at least one female candidate wherever reasonably possible.
– Thirteen new appointments were made during the year of which six (46%) were female;
DIRECTORS’ REPORT
For
per
sona
l use
onl
y
APN PROPERTY GROUP 2015 ANNUAL REPORT | 33 |
� flexible work arrangements to balance family and other commitments with the role will continue to be considered for all employees, where the requirements of the role permit.
– Flexible work arrangements have been agreed with a number of employees in relation to family balance, maternity needs and illness;
� the Diversity Policy is available to all employees at all times.
– The policy was available on the company intranet which is available to all staff at all times;
� all employees responsible for employment and promotion of employees will be reminded of the Diversity Policy and these objectives at least annually.
– Employees were reminded on each occasion of a new appointment.
Gender Diversity in APN Property GroupAt the date of this report, the proportion of women in APN Property Group was:
� Board of APN Property Group Limited: nil � Board of APN Funds Management Limited: 25% � Senior Management of the APN Property Group: 17% � All employees of APN Property Group: 33%
SustainabilityAPN Property Group, including APN Funds Management Limited believes that the sustainability of the business is intrinsically linked to the successful management of its financial, social and environmental risks, obligations and opportunities. We believe those companies that adopt sustainable practices are more likely to generate better long term returns for investors.
This philosophy is embedded in the culture of the business and monitored to ensure critical business risks are carefully managed. This is evidenced in the following key objectives:
Our Investors � Prioritise the interests of investors;
� Separate Boards operating independently of each other to manage conflicts between the interests of investors in APN PG and investors in the funds we manage;
� Strong focus on investment performance;
� Regular and meaningful communications to investors.
Our Community � Significant value attributed to ‘sustainability conscious’
companies in the investment decision process of the APN managed ‘real estate securities’ funds;
� Bias to ‘green’ rated direct property investments and development opportunities;
� Corporate values ethos required of all staff - integrity, passion, respect, accountability and professionalism.
Our Staff � Demanding recruitment standards;
� Attractive remuneration incentives for strong performance;
� Focus on diversity;
� Employee engagement in overall business performance, including regular staff briefings.
Our Governance � Independent Board to manage the Responsible Entity of
APN’s managed funds;
� Strict compliance regime to ensure compliance with legislative framework overseen by independent Board Compliance Sub-Committee;
� Documented compliance programme and Company Policies to regulate compliance requirements;
� Annual compliance audits.
dIRECToRS’ REPoRT
For
per
sona
l use
onl
y
| 34 | 2015 ANNUAL REPORT
Compliance with ASX GuidelinesThe Company meets all of the ASX Guidelines, except in relation to the following:
� Recommendation 2.1.(a).1-2, 2.3, 2.4, 2.5 – the Board should establish a nomination committee comprising at least 3 members, a majority of independent directors and chaired by an independent director, and should not be the same person as the CEO of the entity
� Recommendations 4.1.(a).1-2 – the Board should establish an audit committee comprising at least 3 members, only non-executive directors, a majority of independent directors and chaired by an independent director, who is not a chair of the board
� Recommendation 7.1.(a).1-2 – a majority of the Board should be independent directors and chaired by an independent director.
� Recommendation 8.1.(a).1-2 – the Board should establish a remuneration committee comprising at least 3 members, a majority of independent directors and chaired by an independent director
The Board has carefully considered its size and composition, together with the specialist knowledge of the property and property securities sector of its directors, and formed the view that based on its current composition, it has the necessary skills and motivation to ensure that the Company performs strongly, and there is sufficient accountability in the structure of the Board, to ensure the outcomes and objectives sought by the ASX Guidelines are achieved. The Board considers that this has been enhanced through the separation of the boards of APN and the Responsible Entity of the APN funds, APN FM.
Having regard for the size of the APN Group and separation of responsibilities between the Board of the Company and the independent board of APN FM, the Board considered that incorporating the audit and risk management and nomination and remuneration procedures into the function of the Board is an appropriate way of addressing the accountability and efficiencies sought to be achieved by the ASX Guidelines. This position is regularly reviewed to ensure the outcomes and objectives under the ASX Guidelines continue to be achieved.
DIRECTORS’ REPORT
For
per
sona
l use
onl
y
APN PROPERTY GROUP 2015 ANNUAL REPORT | 35 |
AUDITOR’S INDEPENDENCE DECLARATION
For
per
sona
l use
onl
y
| 36 | 2015 ANNUAL REPORT
INDEPENDENT AUDITOR’S REPORT
For
per
sona
l use
onl
y
APN PROPERTY GROUP 2015 ANNUAL REPORT | 37 |
INDEPENDENT AUDITOR’S REPORT
For
per
sona
l use
onl
y

| 38 | 2015 ANNUAL REPORT
The Directors declare that:
(a) in the Directors’ opinion, there are reasonable grounds to believe that the company will be able to pay its debts as and when they become due and payable;
(b) in the Directors’ opinion, the attached financial statements are in compliance with International Financial Reporting Standards, as stated in note 2 to the financial statements;
(c) in the Directors’ opinion, the attached financial statements and notes thereto are in accordance with the Corporations Act 2001, including compliance with accounting standards and giving a true and fair view of the financial position and performance of the Company and the Group; and
(d) the Directors have been given the declarations required by s.295A of the Corporations Act 2001.
Signed in accordance with a resolution of the directors made pursuant to s.295(5) of the Corporations Act 2001.
On behalf of the Directors
Christopher Aylward Executive Chairman
24 August 2015
DIRECTORS’ DECLARATION
For
per
sona
l use
onl
y

APN PROPERTY GROUP 2015 ANNUAL REPORT | 39 |
For
per
sona
l use
onl
y
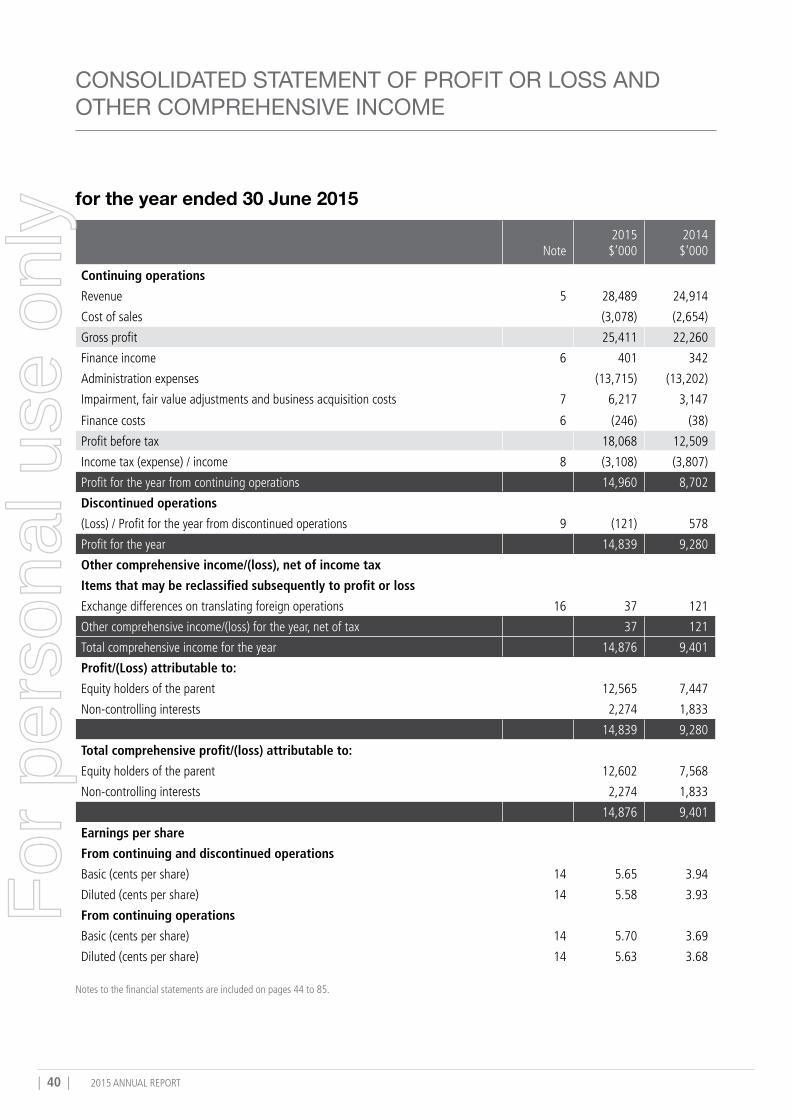
| 40 | 2015 ANNUAL REPORT
for the year ended 30 June 2015
Note2015 $’000
2014 $’000
Continuing operations
Revenue 5 28,489 24,914
Cost of sales (3,078) (2,654)
Gross profit 25,411 22,260
Finance income 6 401 342
Administration expenses (13,715) (13,202)
Impairment, fair value adjustments and business acquisition costs 7 6,217 3,147
Finance costs 6 (246) (38)
Profit before tax 18,068 12,509
Income tax (expense) / income 8 (3,108) (3,807)
Profit for the year from continuing operations 14,960 8,702
Discontinued operations
(Loss) / Profit for the year from discontinued operations 9 (121) 578
Profit for the year 14,839 9,280
Other comprehensive income/(loss), net of income tax
Items that may be reclassified subsequently to profit or loss
Exchange differences on translating foreign operations 16 37 121
Other comprehensive income/(loss) for the year, net of tax 37 121
Total comprehensive income for the year 14,876 9,401
Profit/(Loss) attributable to:
Equity holders of the parent 12,565 7,447
Non-controlling interests 2,274 1,833
14,839 9,280
Total comprehensive profit/(loss) attributable to:
Equity holders of the parent 12,602 7,568
Non-controlling interests 2,274 1,833
14,876 9,401
Earnings per share
From continuing and discontinued operations
Basic (cents per share) 14 5.65 3.94
Diluted (cents per share) 14 5.58 3.93
From continuing operations
Basic (cents per share) 14 5.70 3.69
Diluted (cents per share) 14 5.63 3.68
Notes to the financial statements are included on pages 44 to 85.
CONSOLIDATED STATEMENT OF PROFIT OR LOSS AND OTHER COMPREHENSIVE INCOME
For
per
sona
l use
onl
y
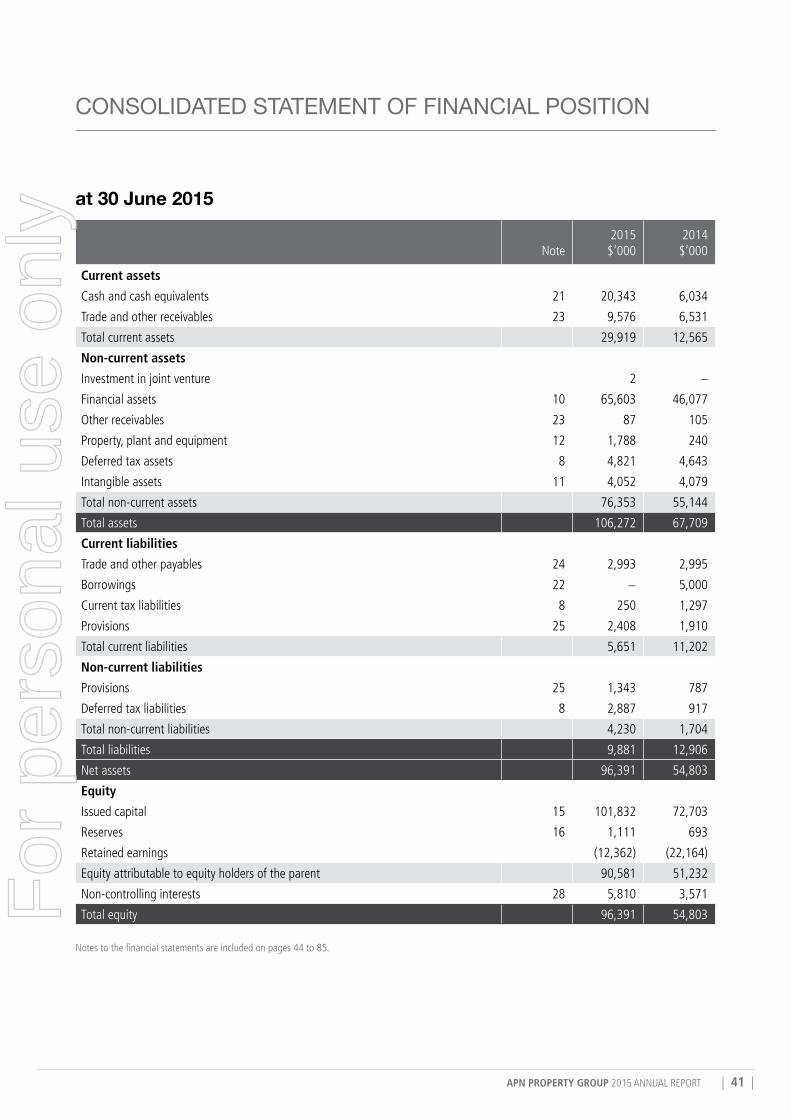
APN PROPERTY GROUP 2015 ANNUAL REPORT | 41 |
at 30 June 2015
Note2015 $’000
2014 $’000
Current assets
Cash and cash equivalents 21 20,343 6,034
Trade and other receivables 23 9,576 6,531
Total current assets 29,919 12,565
Non-current assets
Investment in joint venture 2 –
Financial assets 10 65,603 46,077
Other receivables 23 87 105
Property, plant and equipment 12 1,788 240
Deferred tax assets 8 4,821 4,643
Intangible assets 11 4,052 4,079
Total non-current assets 76,353 55,144
Total assets 106,272 67,709
Current liabilities
Trade and other payables 24 2,993 2,995
Borrowings 22 − 5,000
Current tax liabilities 8 250 1,297
Provisions 25 2,408 1,910
Total current liabilities 5,651 11,202
Non-current liabilities
Provisions 25 1,343 787
Deferred tax liabilities 8 2,887 917
Total non-current liabilities 4,230 1,704
Total liabilities 9,881 12,906
Net assets 96,391 54,803
Equity
Issued capital 15 101,832 72,703
Reserves 16 1,111 693
Retained earnings (12,362) (22,164)
Equity attributable to equity holders of the parent 90,581 51,232
Non-controlling interests 28 5,810 3,571
Total equity 96,391 54,803 Notes to the financial statements are included on pages 44 to 85.
CONSOLIDATED STATEMENT OF FINANCIAL POSITION
For
per
sona
l use
onl
y
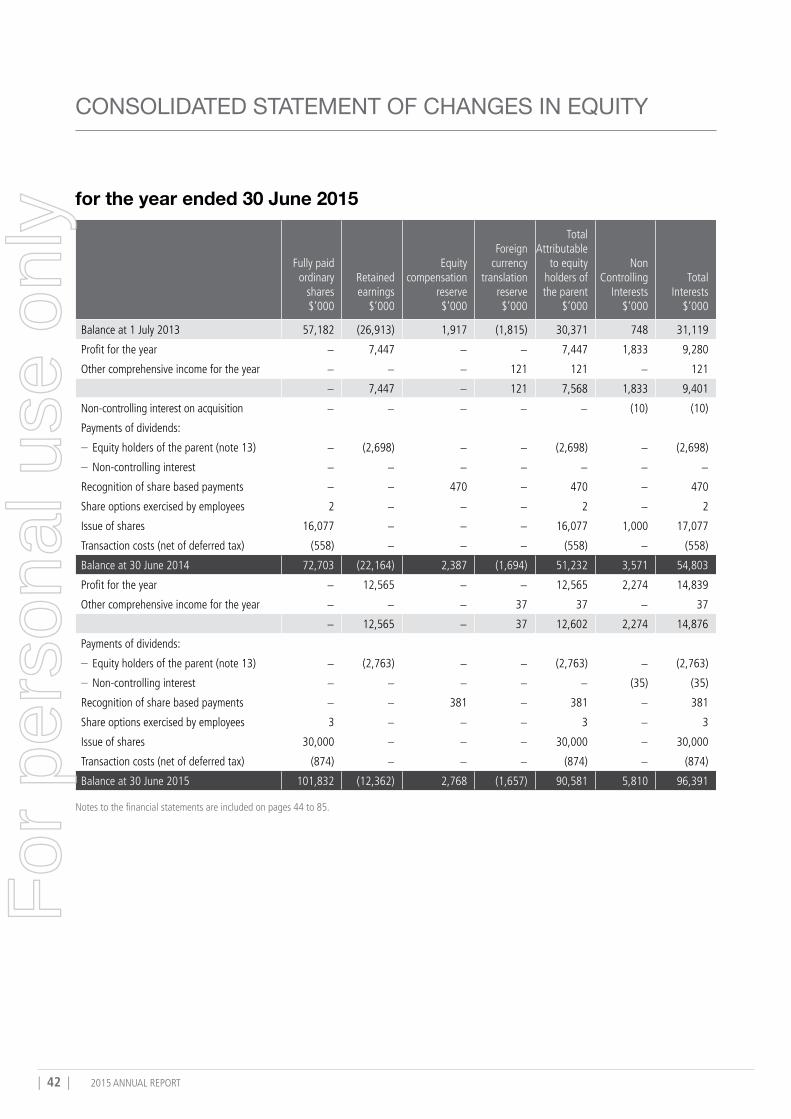
| 42 | 2015 ANNUAL REPORT
for the year ended 30 June 2015
Fully paid ordinary
shares $’000
Retained earnings
$’000
Equity compensation
reserve $’000
Foreign currency
translation reserve $’000
Total Attributable
to equity holders of the parent
$’000
Non Controlling
Interests $’000
Total Interests
$’000
Balance at 1 July 2013 57,182 (26,913) 1,917 (1,815) 30,371 748 31,119
Profit for the year − 7,447 − − 7,447 1,833 9,280
Other comprehensive income for the year − − − 121 121 − 121
− 7,447 − 121 7,568 1,833 9,401
Non-controlling interest on acquisition − − − − − (10) (10)
Payments of dividends:
– Equity holders of the parent (note 13) − (2,698) − − (2,698) − (2,698)
– Non-controlling interest − − − − − − −
Recognition of share based payments − − 470 − 470 − 470
Share options exercised by employees 2 − − − 2 − 2
Issue of shares 16,077 − − − 16,077 1,000 17,077
Transaction costs (net of deferred tax) (558) − − − (558) − (558)
Balance at 30 June 2014 72,703 (22,164) 2,387 (1,694) 51,232 3,571 54,803
Profit for the year − 12,565 − − 12,565 2,274 14,839
Other comprehensive income for the year − − − 37 37 − 37
− 12,565 − 37 12,602 2,274 14,876
Payments of dividends:
– Equity holders of the parent (note 13) − (2,763) − − (2,763) − (2,763)
– Non-controlling interest − − − − − (35) (35)
Recognition of share based payments − − 381 − 381 − 381
Share options exercised by employees 3 − − − 3 − 3
Issue of shares 30,000 − − − 30,000 − 30,000
Transaction costs (net of deferred tax) (874) − − − (874) − (874)
Balance at 30 June 2015 101,832 (12,362) 2,768 (1,657) 90,581 5,810 96,391
Notes to the financial statements are included on pages 44 to 85.
CONSOLIDATED STATEMENT OF CHANGES IN EqUITY
For
per
sona
l use
onl
y
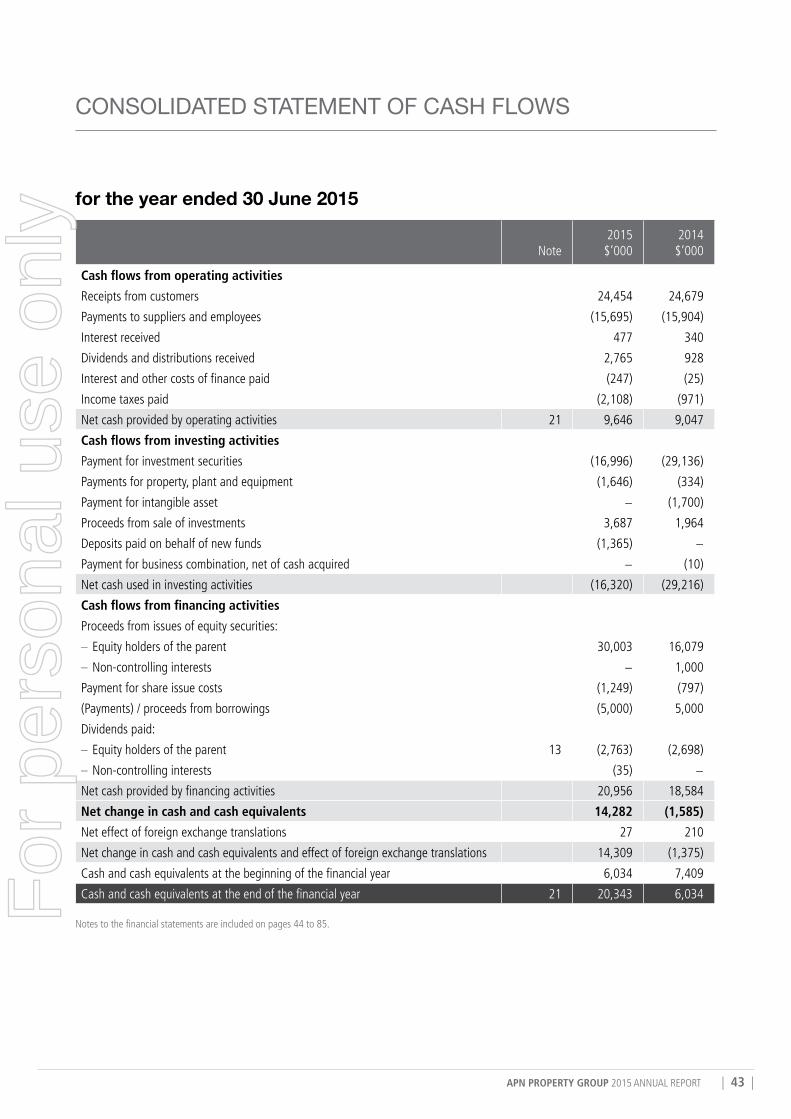
APN PROPERTY GROUP 2015 ANNUAL REPORT | 43 |
CONSOLIDATED STATEMENT OF CASH FLOwS
for the year ended 30 June 2015
Note2015 $’000
2014 $’000
Cash flows from operating activities
Receipts from customers 24,454 24,679
Payments to suppliers and employees (15,695) (15,904)
Interest received 477 340
Dividends and distributions received 2,765 928
Interest and other costs of finance paid (247) (25)
Income taxes paid (2,108) (971)
Net cash provided by operating activities 21 9,646 9,047
Cash flows from investing activities
Payment for investment securities (16,996) (29,136)
Payments for property, plant and equipment (1,646) (334)
Payment for intangible asset − (1,700)
Proceeds from sale of investments 3,687 1,964
Deposits paid on behalf of new funds (1,365) −
Payment for business combination, net of cash acquired − (10)
Net cash used in investing activities (16,320) (29,216)
Cash flows from financing activities
Proceeds from issues of equity securities:
– Equity holders of the parent 30,003 16,079
– Non-controlling interests − 1,000
Payment for share issue costs (1,249) (797)
(Payments) / proceeds from borrowings (5,000) 5,000
Dividends paid:
– Equity holders of the parent 13 (2,763) (2,698)
– Non-controlling interests (35) −
Net cash provided by financing activities 20,956 18,584
Net change in cash and cash equivalents 14,282 (1,585)
Net effect of foreign exchange translations 27 210
Net change in cash and cash equivalents and effect of foreign exchange translations 14,309 (1,375)
Cash and cash equivalents at the beginning of the financial year 6,034 7,409
Cash and cash equivalents at the end of the financial year 21 20,343 6,034 Notes to the financial statements are included on pages 44 to 85.F
or p
erso
nal u
se o
nly

| 44 | 2015 ANNUAL REPORT
1. GENErAL INForMATIoNAPN Property Group Limited (APN or the Company) is a public company listed on the Australian Stock Exchange (trading under the ASX ticker ‘APD’), incorporated and operating in Australia.
APN Property Group Limited’s registered office and its principal place of business is Level 30, 101 Collins Street, Melbourne Victoria 3000.
The principal activity of the Company and the Group during the course of the financial year was the provision of funds management services.
2. STATEMENT oF CoMPLIANCE The financial report is a general purpose financial report which has been prepared in accordance with the Corporations Act 2001, Accounting Standards and Interpretations, and complies with other requirements of the law.
The financial report comprises the consolidated financial statements of the Group. For the purposes of preparing the consolidated financial statements, the Group is a for-profit entity.
Accounting Standards include Australian Accounting Standards. Compliance with Australian Accounting Standards ensures that the financial statements and notes of the Company and the Group comply with International Financial Reporting Standards (‘IFRS’).
The financial statements were authorised for issue by the directors on 24 August 2015.
2.1 Basis of preparationThe financial report has been prepared on the basis of historical cost, except for certain non-current assets and financial instruments that are measured at fair value. Cost is based on the fair value of the consideration given in exchange for assets. Fair value is the price that would be received to sell an asset or paid to transfer a liability in an orderly transaction between market participants at the measurement date, regardless of whether that price is directly observable or estimated using another valuation technique. All amounts are presented in Australian dollars, unless otherwise noted.
The Company is a company of the kind referred to in ASIC Class Order 98/100, dated 10 July 1998, and in accordance with that Class Order, amounts in the financial statements are rounded to the nearest thousand dollars, unless otherwise indicated.
2.2 Basis of consolidationThe consolidated financial statements incorporate the financial statements of the Company and entities controlled by the Company (its subsidiaries) (referred to as ‘the Group’ in these financial statements) – refer note 28 for a list of controlled entities (subsidiaries) as at year end. Control is achieved where the Company:
� has power over the investee;
� is exposed, or has rights, to variable returns from its involvement with the investee; and
� has the ability to use its power to affect its returns.
The Company reassesses whether or not it controls an investee if the facts and circumstances indicate that there are changes to one or more of the three elements of control listed above.
Consolidation of a subsidiary begins when the Company obtains control over the subsidiary and ceases when the Company loses control of the subsidiary. Income and expenses of an entity are included the financial statements of the Group for the period it is consolidated. All intragroup assets and liabilities, equity, income, expenses and cash flows relating to transactions between members of the Group are eliminated in full on consolidation.
When necessary, adjustments are made to the financial statements of subsidiaries to bring their accounting policies into line with the Group's accounting policies.
2.3 Foreign currenciesThe functional currency of foreign subsidiaries is listed in note 28. For the purpose of presenting consolidated financial statements, the assets and liabilities of the Group’s foreign subsidiaries are expressed in Australian dollars (the functional currency of the Company and the Group), using the exchange rates prevailing at the end of the reporting period. Income and expense items are translated at the average exchange rates for the period. Exchange differences arising, if any, are classified as other comprehensive income and are accumulated in equity.
Transactions in currencies other than an entities functional currency (i.e. a foreign currency transaction) are recorded at the rates of exchange prevailing on the dates of the transactions. At the end of each reporting period, monetary items denominated in foreign currencies are retranslated at the rates prevailing at the balance sheet date. Non-monetary items carried at fair value that are denominated in foreign currencies are retranslated at the rates prevailing on the date when the fair value was determined. Non-monetary items that are measured in terms of historical cost in a foreign currency are not retranslated.
NOTES TO THE FINANCIAL STATEMENTS
For
per
sona
l use
onl
y
APN PROPERTY GROUP 2015 ANNUAL REPORT | 45 |
Exchange differences arising from the above are recognised in the profit or loss in the period in which they arise except for exchange differences on monetary items receivable from or payable to a foreign operation for which settlement is neither planned or likely to occur (therefore forming part of the net investment in a foreign subsidiary), which are recognised initially in other comprehensive income and reclassified from equity to profit or loss on repayment of the monetary items.
2.4 Other accounting policiesSignificant accounting policies that summarise the measurement basis used and are relevant to an understanding of the financial statements are provided throughout the notes to the financial statements.
2.5 The notes to the financial statementsThe notes to these financial statements include information required to understand the financial statements that is relevant and material to the operations, financial position and performance of the Group. The notes have been collated into sections to help users find and understand inter-related information. Information is considered material and relevant if, for example:
� the amount in question is significant by virtue of its size or nature;
� it is important to understand the results of the Group;
� it helps explain the impact of significant changes in the Groups business; or
� it relates to an aspect of the Group’s operations that is important to its future performance.
3. CrITICAL ACCouNTING juDGEMENTS AND kEy SourCES oF ESTIMATIoN uNCErTAINTyIn the application of the Group’s accounting policies, the directors have made judgments, estimates and assumptions about carrying values of assets and liabilities that are not readily apparent from other sources. The judgements, estimates and assumptions are based on historical experience and various other factors that are believed to be reasonable under the circumstance, however actual results may differ from these estimates. The judgements, estimates and assumptions made in the current period are contained in the following notes:
NoTES To THE FINANCIAL STATEMENTS
Note Description
Note 8 – Income taxes Deferred Tax Assets
Note 11 – Intangible assets Impairment of management rights
Note 18 – Financial risk management
Valuation of Level 3 financial instruments
For
per
sona
l use
onl
y
| 46 | 2015 ANNUAL REPORT
NOTES TO THE FINANCIAL STATEMENTS
4. SEGMENT INForMATIoN4.1 Operating Segments The Group revised its reportable segments in the current year following a review of its lines of business and reporting structure. As a result the composition of APN’s reportable segments has changed to reclassify the APN Asian Asset Income Fund and the APN Development Fund No.2 within the Real Estate Securities funds and Direct Real Estate funds segments respectively. In addition, Registry is no longer reported as a separate segment and is now incorporated into each of the Group’s reportable segments to which its services are provided. The reporting segment disclosure is consistent with information reported to the Group’s chief operating decision maker for the purposes of resource allocation and assessment of performance, which is more specifically focused on the categories of product being provided to the different market segments. Where applicable, the corresponding segment information in the prior period has been restated to reflect the newly reportable and amended segments in accordance with the Accounting Standards.
The Group’s reportable segments are aligned to the categories of product managed by the Group and are as follows:
Reportable segments Product type Fund
Continuing operationsReal Estate Securities funds Open ended properties securities funds
Open ended offshore fund
� APN AREIT Fund � APN Property for Income Fund � APN Property for Income Fund No. 2 � APN Unlisted Property Fund � APN Asian REIT Fund � APN Asian Pacific REIT Fund (terminated) � APN Asian Asset Income Fund (terminated)
Healthcare Real Estate fund Listed property trust � Generation Healthcare REIT (GHC)
Industrial Real Estate fund Listed property trust � Industria REIT (IDR)
Direct Real Estate funds Fixed term Australian funds Wholesale fund
� APN Property Plus Portfolio � APN Regional Property Fund � Newmark APN Auburn Property Fund � APN 541 St Kilda Road Fund � APN Coburg North Retail Fund � APN Development Fund No.2
Investment revenue Investment income received or receivable from co-investments
Discontinued operationsEuropean Real Estate funds Property trust fund and fixed term
European funds � APN Poland Retail Fund � APN Champion Retail Fund � APN Euro Property Fund � APN Vienna Retail Fund (terminated) � APN European Retail Property Group
Information regarding these reportable segments is presented below. The accounting policies of the reportable segments are the same as the Group’s accounting policies.F
or p
erso
nal u
se o
nly
APN PROPERTY GROUP 2015 ANNUAL REPORT | 47 |
NoTES To THE FINANCIAL STATEMENTS
4.2 Segments revenues and resultsThe following is an analysis of the Group’s revenue and results by reportable operating segments for the year under review:
Segment revenue Year ended
Segment net revenue Year ended
Segment profit Year ended
30 June 2015 $’000
30 June 2014 $’000
30 June 2015 $’000
30 June 2014 $’000
30 June 2015 $’000
30 June 2014 $’000
Continuing operations
Real estate securities funds 10,819 9,981 8,219 7,528 2,982 1,856
Healthcare real estate fund 7,798 7,148 7,638 7,148 5,318 5,397
Industrial real estate fund 2,250 1,236 2,250 1,236 906 447
Direct real estate funds 4,212 4,732 3,894 4,531 2,657 3,218
Investment revenue 3,410 1,768 3,410 1,768 3,410 1,768
28,489 24,865 25,411 22,211 15,273 12,686
Sundry income − 49 − 49 − 49
Finance income 401 342
Central administration (3,463) (3,571)
Depreciation and amortisation (112) (106)
Finance costs (246) (38)
Share of joint venture (2) −
28,489 24,914 25,411 22,260 11,851 9,362
Income tax expense (3,523) (2,813)
Minority interest (1,406) (1,367)
Net operating earnings after tax & MI 6,922 5,182
Gain from impairment and fair value adjustments before tax 6,217 3,147
Income tax expense 415 (993)
Minority interest (880) (362)
5,752 1,792
Total revenue, net revenue and profit after tax and minority interest from continuing operations
28,489 24,914 25,411 22,260 12,674 6,974
Discontinued operations
European real estate funds(i) 248 516 248 511 − 1,144
Income tax expense (121) (566)
Minority interest 12 (105)
(109) 473
Total revenue, net revenue and profit after tax and minority interest for the year
28,737 25,430 25,659 22,771 12,565 7,447
(i) European operations revenue and result includes writeback of doubtful debts.
The revenue reported above includes revenue generated from related parties of $28,631,000 (2014: $25,289,000) and revenue from external parties of $106,000 (2014: $141,000). This represents the analysis of the Group’s revenue from its major products. Related parties transactions are disclosed in note 29. There were no intersegment sales during the period.
For
per
sona
l use
onl
y
| 48 | 2015 ANNUAL REPORT
NOTES TO THE FINANCIAL STATEMENTS
Segment profit represents the profit earned by each reportable segment without allocation of corporate costs, finance income and costs, impairment and fair value adjustments, depreciation and amortisation and income tax expense. This is the measure reported to the chief operating decision maker for the purposes of resource allocation and assessment of segment performance.
For the period ended 30 June 2015, Continuing operations included a charge for impairment of management rights of $nil (2014: $174,000 – Real Estate Securities Funds) and Discontinued operations included doubtful debts recovered of $85,000 (2014: $1,092,000).
4.3 Segments assets and liabilitiesInformation on assets and liabilities for each reportable segment is not required to be disclosed as such information is not regularly provided to the chief operating decision maker for the purposes of resource allocation and assessment of segment performance.
4.4 Geographical informationThe Group operations are based in Australia (country of domicile) following the termination of the APN Asian Asset Income Fund, closure of its Singapore Office and the continued wind down of the European real estate funds segment.
4.5 Information about major customersThe analysis of the Group’s revenue from its major customers and the segments reporting the revenues are detailed as below:
Revenue from major customers2015 $’000
2014 $’000
Customer A included in revenue from Real estate securities funds 7,323 5,189
Customer B included in revenue from Healthcare real estate funds 9,677 8,202
Customer C included in revenue from Industrial real estate fund 3,630 −
Customer D included in revenue from Direct real estate fund − 2,444
For
per
sona
l use
onl
y
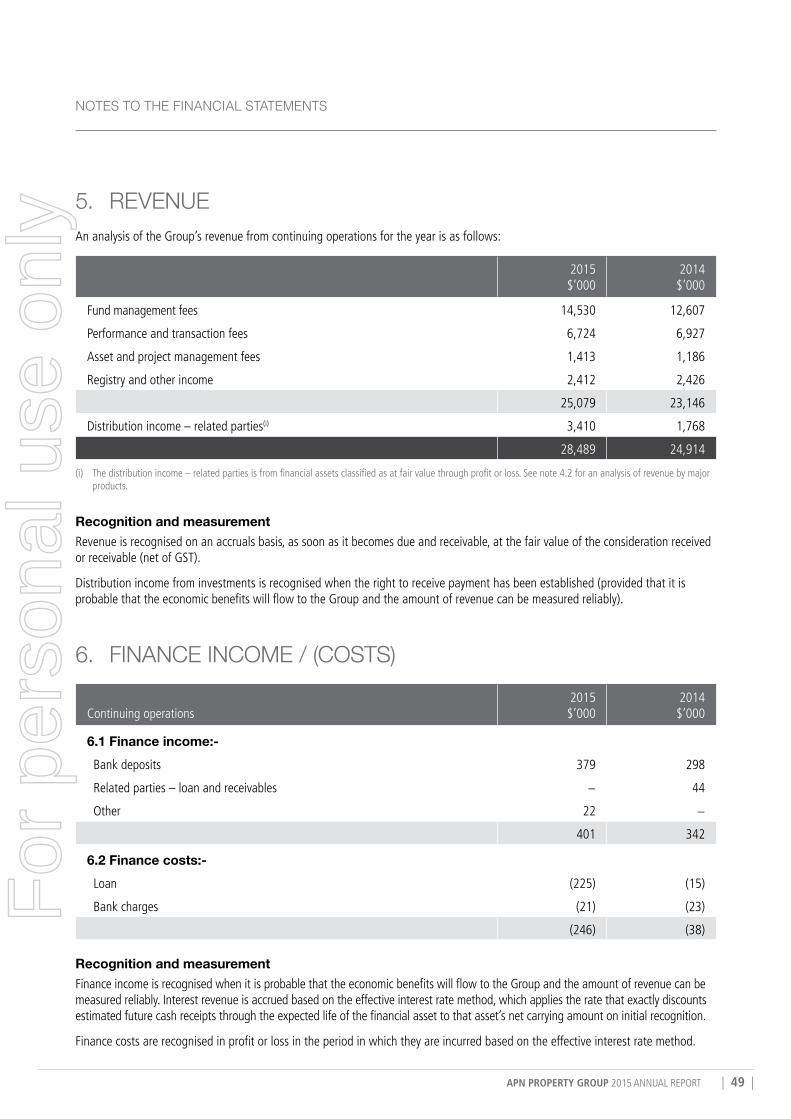
APN PROPERTY GROUP 2015 ANNUAL REPORT | 49 |
NoTES To THE FINANCIAL STATEMENTS
5. rEvENuEAn analysis of the Group’s revenue from continuing operations for the year is as follows:
2015 $’000
2014 $’000
Fund management fees 14,530 12,607
Performance and transaction fees 6,724 6,927
Asset and project management fees 1,413 1,186
Registry and other income 2,412 2,426
25,079 23,146
Distribution income – related parties(i) 3,410 1,768
28,489 24,914
(i) The distribution income – related parties is from financial assets classified as at fair value through profit or loss. See note 4.2 for an analysis of revenue by major products.
Recognition and measurement Revenue is recognised on an accruals basis, as soon as it becomes due and receivable, at the fair value of the consideration received or receivable (net of GST).
Distribution income from investments is recognised when the right to receive payment has been established (provided that it is probable that the economic benefits will flow to the Group and the amount of revenue can be measured reliably).
6. FINANCE INCoME / (CoSTS)
Continuing operations2015 $’000
2014 $’000
6.1 Finance income:- Bank deposits 379 298
Related parties – loan and receivables − 44
Other 22 −
401 342
6.2 Finance costs:- Loan (225) (15)
Bank charges (21) (23)
(246) (38)
Recognition and measurementFinance income is recognised when it is probable that the economic benefits will flow to the Group and the amount of revenue can be measured reliably. Interest revenue is accrued based on the effective interest rate method, which applies the rate that exactly discounts estimated future cash receipts through the expected life of the financial asset to that asset’s net carrying amount on initial recognition.
Finance costs are recognised in profit or loss in the period in which they are incurred based on the effective interest rate method.
For
per
sona
l use
onl
y
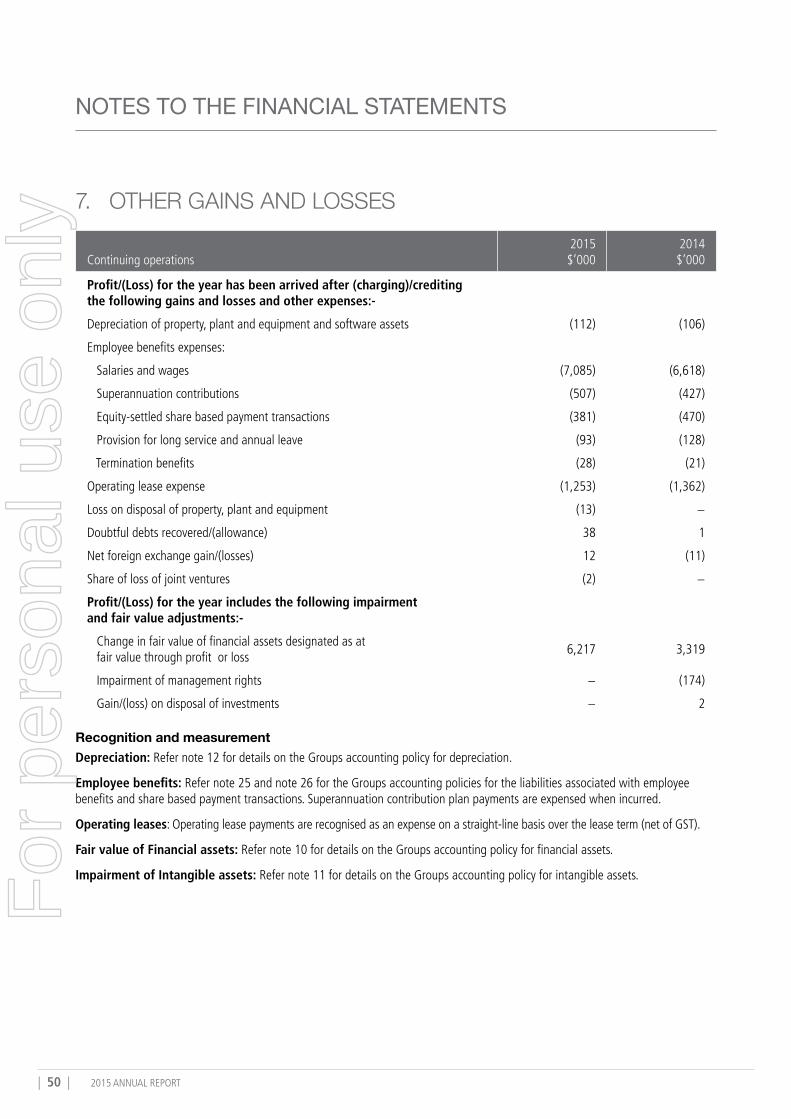
| 50 | 2015 ANNUAL REPORT
NOTES TO THE FINANCIAL STATEMENTS
7. oTHEr GAINS AND LoSSES
Continuing operations2015 $’000
2014 $’000
Profit/(Loss) for the year has been arrived after (charging)/crediting the following gains and losses and other expenses:-
Depreciation of property, plant and equipment and software assets (112) (106)
Employee benefits expenses:
Salaries and wages (7,085) (6,618)
Superannuation contributions (507) (427)
Equity-settled share based payment transactions (381) (470)
Provision for long service and annual leave (93) (128)
Termination benefits (28) (21)
Operating lease expense (1,253) (1,362)
Loss on disposal of property, plant and equipment (13) −
Doubtful debts recovered/(allowance) 38 1
Net foreign exchange gain/(losses) 12 (11)
Share of loss of joint ventures (2) −
Profit/(Loss) for the year includes the following impairment and fair value adjustments:-
Change in fair value of financial assets designated as at fair value through profit or loss
6,217 3,319
Impairment of management rights − (174)
Gain/(loss) on disposal of investments − 2
Recognition and measurementDepreciation: Refer note 12 for details on the Groups accounting policy for depreciation.
Employee benefits: Refer note 25 and note 26 for the Groups accounting policies for the liabilities associated with employee benefits and share based payment transactions. Superannuation contribution plan payments are expensed when incurred.
Operating leases: Operating lease payments are recognised as an expense on a straight-line basis over the lease term (net of GST).
Fair value of Financial assets: Refer note 10 for details on the Groups accounting policy for financial assets.
Impairment of Intangible assets: Refer note 11 for details on the Groups accounting policy for intangible assets.For
per
sona
l use
onl
y
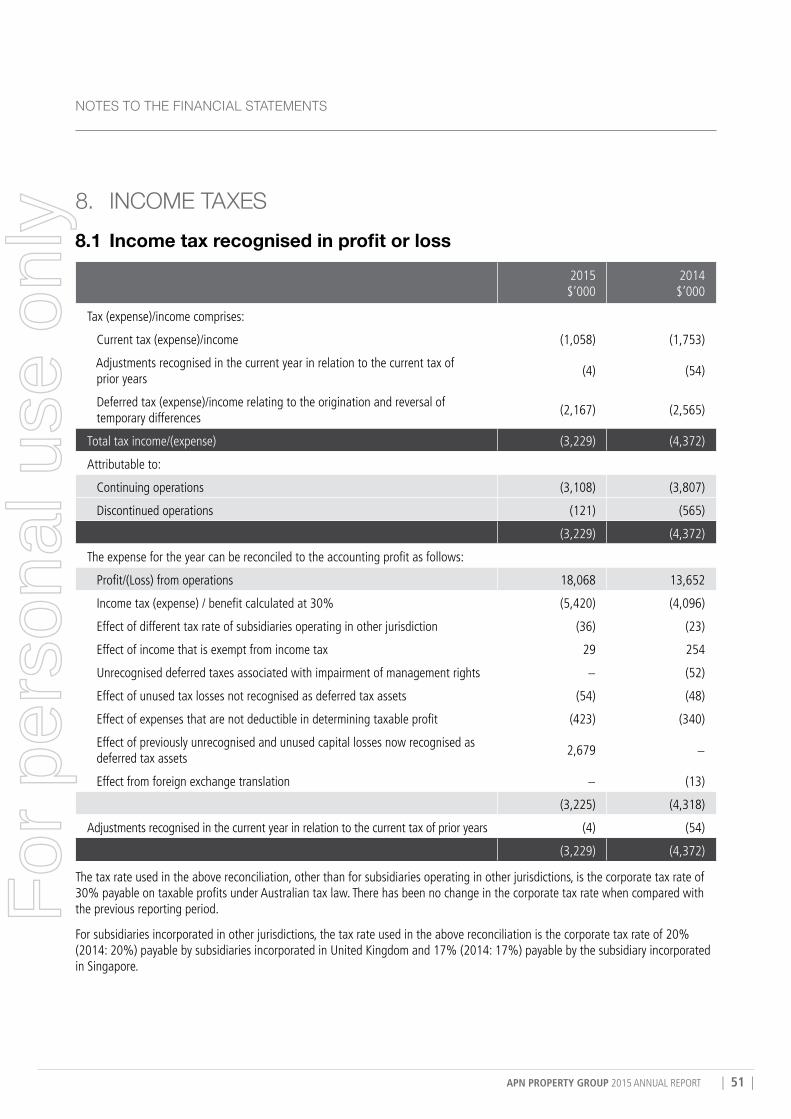
APN PROPERTY GROUP 2015 ANNUAL REPORT | 51 |
NoTES To THE FINANCIAL STATEMENTS
8. INCoME TAxES8.1 Income tax recognised in profit or loss
2015 $’000
2014 $’000
Tax (expense)/income comprises:
Current tax (expense)/income (1,058) (1,753)
Adjustments recognised in the current year in relation to the current tax of prior years
(4) (54)
Deferred tax (expense)/income relating to the origination and reversal of temporary differences
(2,167) (2,565)
Total tax income/(expense) (3,229) (4,372)
Attributable to:
Continuing operations (3,108) (3,807)
Discontinued operations (121) (565)
(3,229) (4,372)
The expense for the year can be reconciled to the accounting profit as follows:
Profit/(Loss) from operations 18,068 13,652
Income tax (expense) / benefit calculated at 30% (5,420) (4,096)
Effect of different tax rate of subsidiaries operating in other jurisdiction (36) (23)
Effect of income that is exempt from income tax 29 254
Unrecognised deferred taxes associated with impairment of management rights − (52)
Effect of unused tax losses not recognised as deferred tax assets (54) (48)
Effect of expenses that are not deductible in determining taxable profit (423) (340)
Effect of previously unrecognised and unused capital losses now recognised as deferred tax assets
2,679 −
Effect from foreign exchange translation − (13)
(3,225) (4,318)
Adjustments recognised in the current year in relation to the current tax of prior years (4) (54)
(3,229) (4,372)
The tax rate used in the above reconciliation, other than for subsidiaries operating in other jurisdictions, is the corporate tax rate of 30% payable on taxable profits under Australian tax law. There has been no change in the corporate tax rate when compared with the previous reporting period.
For subsidiaries incorporated in other jurisdictions, the tax rate used in the above reconciliation is the corporate tax rate of 20% (2014: 20%) payable by subsidiaries incorporated in United Kingdom and 17% (2014: 17%) payable by the subsidiary incorporated in Singapore.
For
per
sona
l use
onl
y
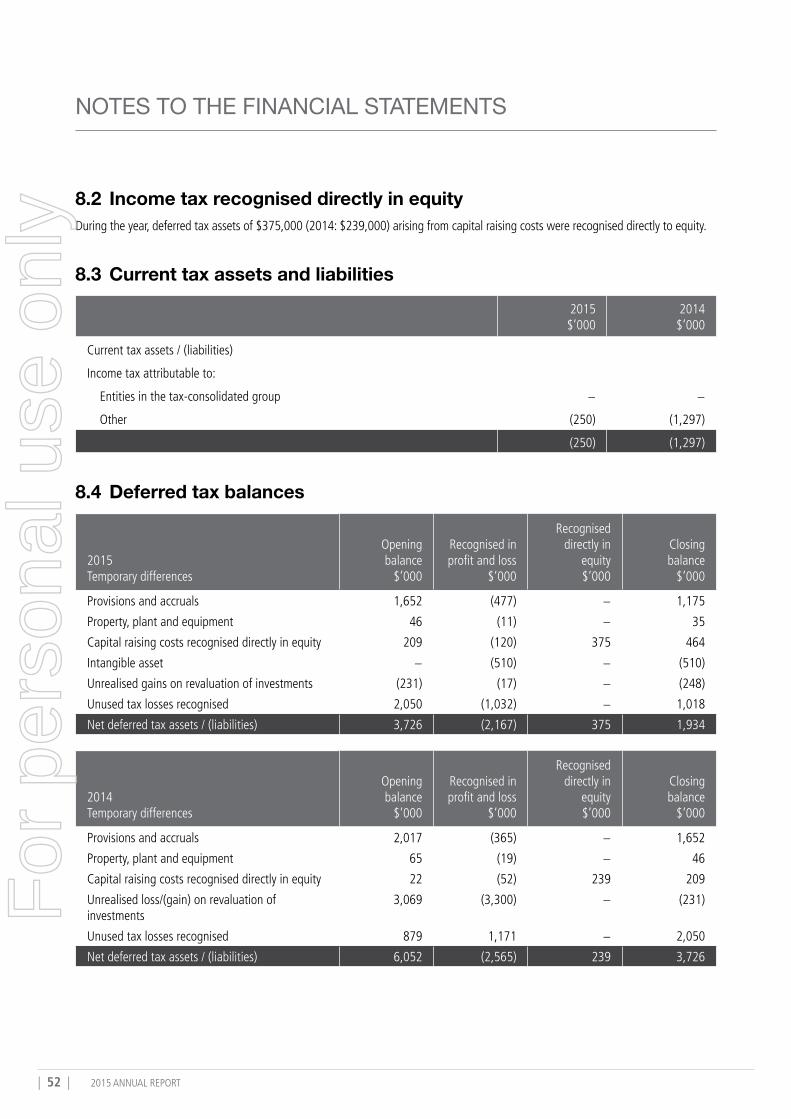
| 52 | 2015 ANNUAL REPORT
8.2 Income tax recognised directly in equityDuring the year, deferred tax assets of $375,000 (2014: $239,000) arising from capital raising costs were recognised directly to equity.
8.3 Current tax assets and liabilities2015 $’000
2014 $’000
Current tax assets / (liabilities)
Income tax attributable to:
Entities in the tax-consolidated group − −
Other (250) (1,297)
(250) (1,297)
8.4 Deferred tax balances
2015 Temporary differences
Opening balance
$’000
Recognised in profit and loss
$’000
Recognised directly in
equity $’000
Closing balance
$’000
Provisions and accruals 1,652 (477) − 1,175
Property, plant and equipment 46 (11) − 35
Capital raising costs recognised directly in equity 209 (120) 375 464
Intangible asset − (510) − (510)
Unrealised gains on revaluation of investments (231) (17) − (248)
Unused tax losses recognised 2,050 (1,032) − 1,018
Net deferred tax assets / (liabilities) 3,726 (2,167) 375 1,934
2014 Temporary differences
Opening balance
$’000
Recognised in profit and loss
$’000
Recognised directly in
equity $’000
Closing balance
$’000
Provisions and accruals 2,017 (365) − 1,652
Property, plant and equipment 65 (19) − 46
Capital raising costs recognised directly in equity 22 (52) 239 209
Unrealised loss/(gain) on revaluation of investments
3,069 (3,300) − (231)
Unused tax losses recognised 879 1,171 − 2,050
Net deferred tax assets / (liabilities) 6,052 (2,565) 239 3,726
NOTES TO THE FINANCIAL STATEMENTS
For
per
sona
l use
onl
y
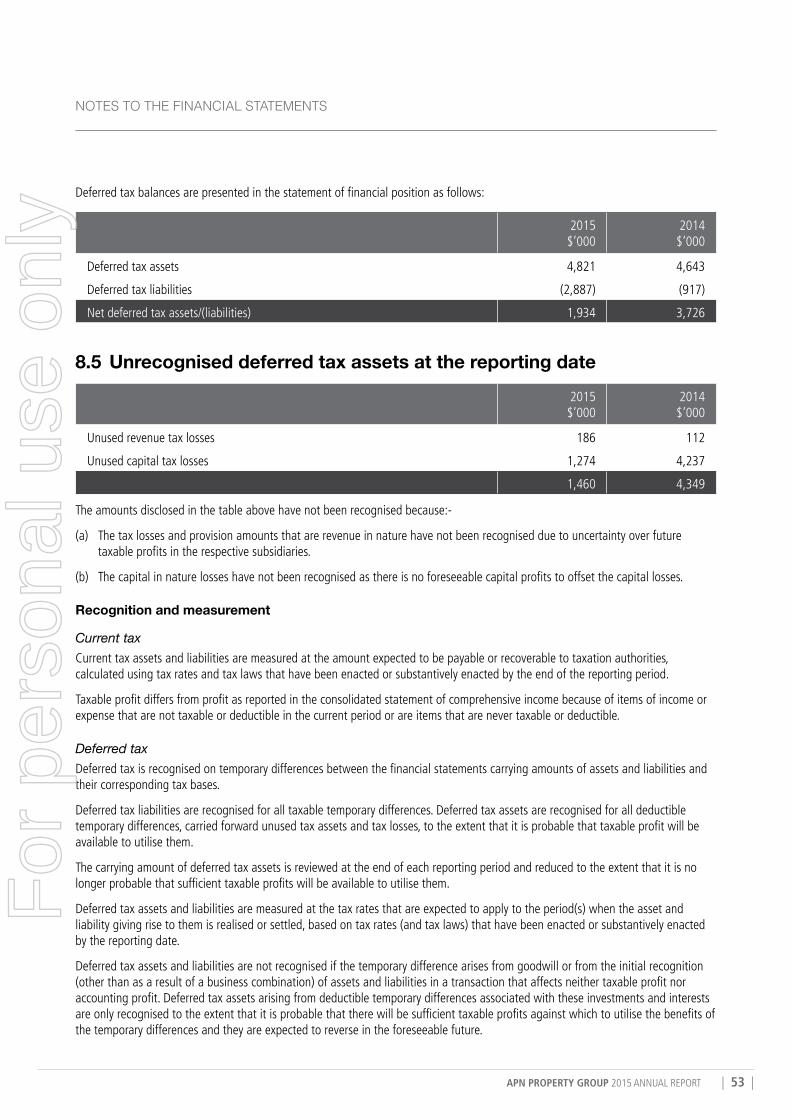
APN PROPERTY GROUP 2015 ANNUAL REPORT | 53 |
Deferred tax balances are presented in the statement of financial position as follows:
2015 $’000
2014 $’000
Deferred tax assets 4,821 4,643
Deferred tax liabilities (2,887) (917)
Net deferred tax assets/(liabilities) 1,934 3,726
8.5 Unrecognised deferred tax assets at the reporting date2015 $’000
2014 $’000
Unused revenue tax losses 186 112
Unused capital tax losses 1,274 4,237
1,460 4,349
The amounts disclosed in the table above have not been recognised because:-
(a) The tax losses and provision amounts that are revenue in nature have not been recognised due to uncertainty over future taxable profits in the respective subsidiaries.
(b) The capital in nature losses have not been recognised as there is no foreseeable capital profits to offset the capital losses.
Recognition and measurement
Current taxCurrent tax assets and liabilities are measured at the amount expected to be payable or recoverable to taxation authorities, calculated using tax rates and tax laws that have been enacted or substantively enacted by the end of the reporting period.
Taxable profit differs from profit as reported in the consolidated statement of comprehensive income because of items of income or expense that are not taxable or deductible in the current period or are items that are never taxable or deductible.
Deferred taxDeferred tax is recognised on temporary differences between the financial statements carrying amounts of assets and liabilities and their corresponding tax bases.
Deferred tax liabilities are recognised for all taxable temporary differences. Deferred tax assets are recognised for all deductible temporary differences, carried forward unused tax assets and tax losses, to the extent that it is probable that taxable profit will be available to utilise them.
The carrying amount of deferred tax assets is reviewed at the end of each reporting period and reduced to the extent that it is no longer probable that sufficient taxable profits will be available to utilise them.
Deferred tax assets and liabilities are measured at the tax rates that are expected to apply to the period(s) when the asset and liability giving rise to them is realised or settled, based on tax rates (and tax laws) that have been enacted or substantively enacted by the reporting date.
Deferred tax assets and liabilities are not recognised if the temporary difference arises from goodwill or from the initial recognition (other than as a result of a business combination) of assets and liabilities in a transaction that affects neither taxable profit nor accounting profit. Deferred tax assets arising from deductible temporary differences associated with these investments and interests are only recognised to the extent that it is probable that there will be sufficient taxable profits against which to utilise the benefits of the temporary differences and they are expected to reverse in the foreseeable future.
NoTES To THE FINANCIAL STATEMENTS
For
per
sona
l use
onl
y
| 54 | 2015 ANNUAL REPORT
Deferred tax assets and liabilities are offset when there is a legally enforceable right to set off current tax assets against current tax liabilities, they relate to the same taxation authority and the Group intends to settle its obligations on a net basis.
Income taxes relating to items recognised directly in other comprehensive income or equity are recognised in other comprehensive income or equity and not in the statement of profit and loss.
Key estimate – Recognition of Deferred Tax Assets The Group has carried forward revenue and capital tax losses, the on-going recognition of which requires an estimation of the future taxable profits at each reporting date. The Group has estimated its future taxable profits against which these losses can be utilised, to determine the revenue and capital losses to be recognised as at the reporting date. Note 8.4 and 8.5 present the recognised and unrecognised revenue / capital tax losses respectively.
8.6 Tax consolidationThe Company and its wholly-owned Australian resident entities have formed a tax-consolidated group with effect from 1 July 2003 and are therefore taxed as a single entity from that date. The head entity within the tax-consolidated group is APN Property Group Limited. The members of the tax-consolidated group are identified at note 28.
Entities within the tax-consolidated group have entered into a tax funding arrangement and a tax-sharing agreement with the head entity. Under the terms of the tax funding arrangement, APN Property Group Limited and each of the entities in the tax-consolidated group has agreed to pay a tax equivalent payment to or from the head entity, based on the current tax liability or current tax asset of the entity. Such amounts are reflected in amounts receivable from or payable to other entities in the tax-consolidated group.
The tax sharing agreement entered into between members of the tax-consolidated group provides for the determination of the allocation of income tax liabilities between the entities should the head entity default on its tax payment obligations or if an entity should leave the tax-consolidated group. The effect of the tax sharing agreement is that each member’s liability for tax payable by the tax-consolidated group is limited to the amount payable to the head entity under the tax funding arrangement.
NOTES TO THE FINANCIAL STATEMENTS
For
per
sona
l use
onl
y
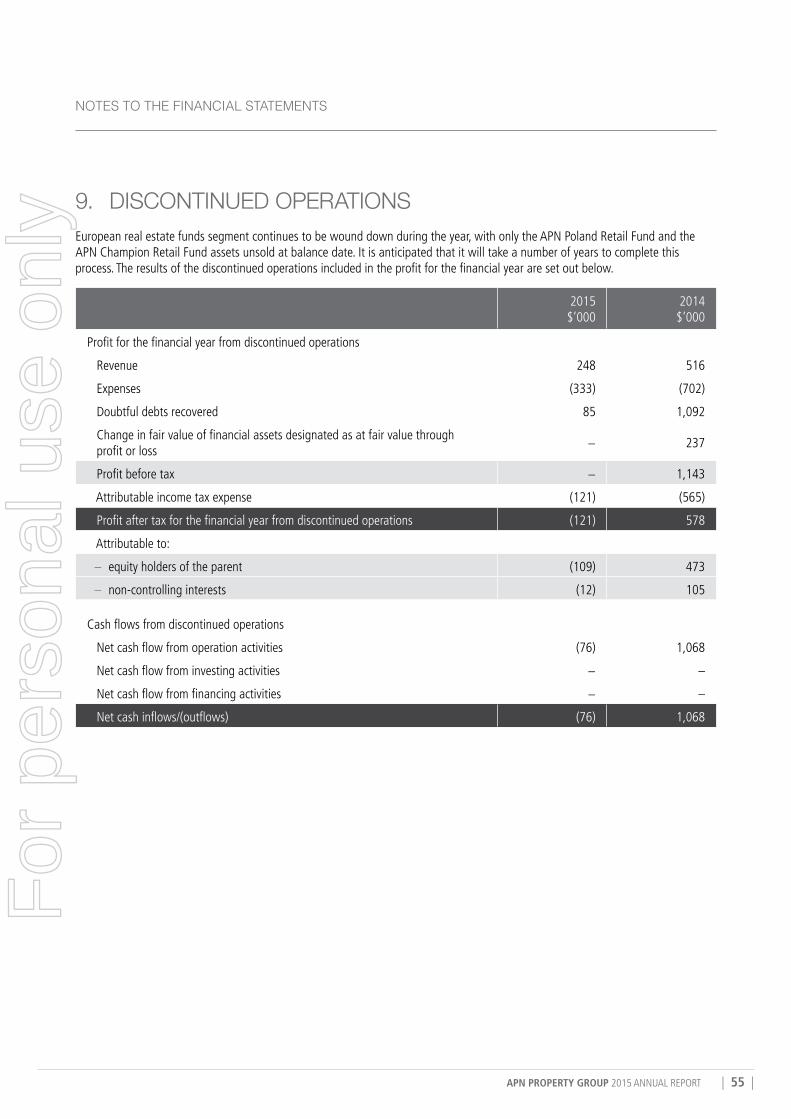
APN PROPERTY GROUP 2015 ANNUAL REPORT | 55 |
9. DISCoNTINuED oPErATIoNSEuropean real estate funds segment continues to be wound down during the year, with only the APN Poland Retail Fund and the APN Champion Retail Fund assets unsold at balance date. It is anticipated that it will take a number of years to complete this process. The results of the discontinued operations included in the profit for the financial year are set out below.
2015 $’000
2014 $’000
Profit for the financial year from discontinued operations
Revenue 248 516
Expenses (333) (702)
Doubtful debts recovered 85 1,092
Change in fair value of financial assets designated as at fair value through profit or loss
− 237
Profit before tax − 1,143
Attributable income tax expense (121) (565)
Profit after tax for the financial year from discontinued operations (121) 578
Attributable to:
– equity holders of the parent (109) 473
– non-controlling interests (12) 105
Cash flows from discontinued operations
Net cash flow from operation activities (76) 1,068
Net cash flow from investing activities − –
Net cash flow from financing activities − –
Net cash inflows/(outflows) (76) 1,068
NoTES To THE FINANCIAL STATEMENTS
For
per
sona
l use
onl
y
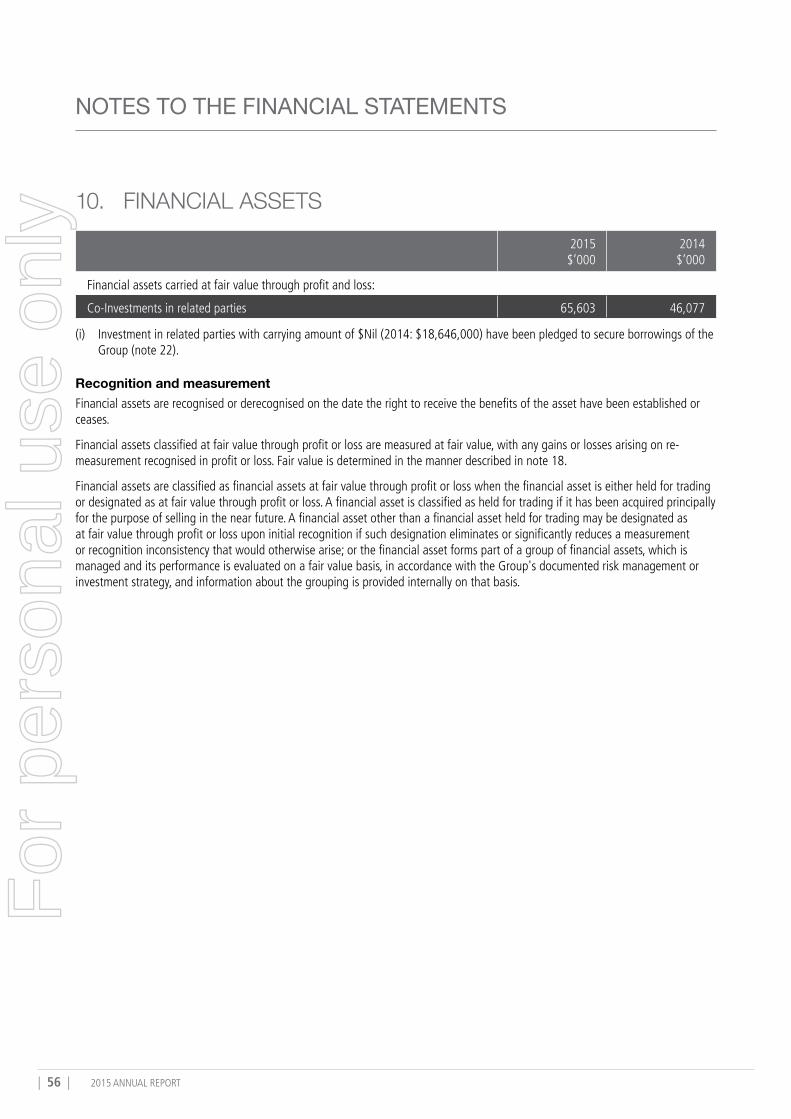
| 56 | 2015 ANNUAL REPORT
NOTES TO THE FINANCIAL STATEMENTS
10. FINANCIAL ASSETS2015 $’000
2014 $’000
Financial assets carried at fair value through profit and loss:
Co-Investments in related parties 65,603 46,077
(i) Investment in related parties with carrying amount of $Nil (2014: $18,646,000) have been pledged to secure borrowings of the Group (note 22).
Recognition and measurementFinancial assets are recognised or derecognised on the date the right to receive the benefits of the asset have been established or ceases.
Financial assets classified at fair value through profit or loss are measured at fair value, with any gains or losses arising on re-measurement recognised in profit or loss. Fair value is determined in the manner described in note 18.
Financial assets are classified as financial assets at fair value through profit or loss when the financial asset is either held for trading or designated as at fair value through profit or loss. A financial asset is classified as held for trading if it has been acquired principally for the purpose of selling in the near future. A financial asset other than a financial asset held for trading may be designated as at fair value through profit or loss upon initial recognition if such designation eliminates or significantly reduces a measurement or recognition inconsistency that would otherwise arise; or the financial asset forms part of a group of financial assets, which is managed and its performance is evaluated on a fair value basis, in accordance with the Group's documented risk management or investment strategy, and information about the grouping is provided internally on that basis.
For
per
sona
l use
onl
y
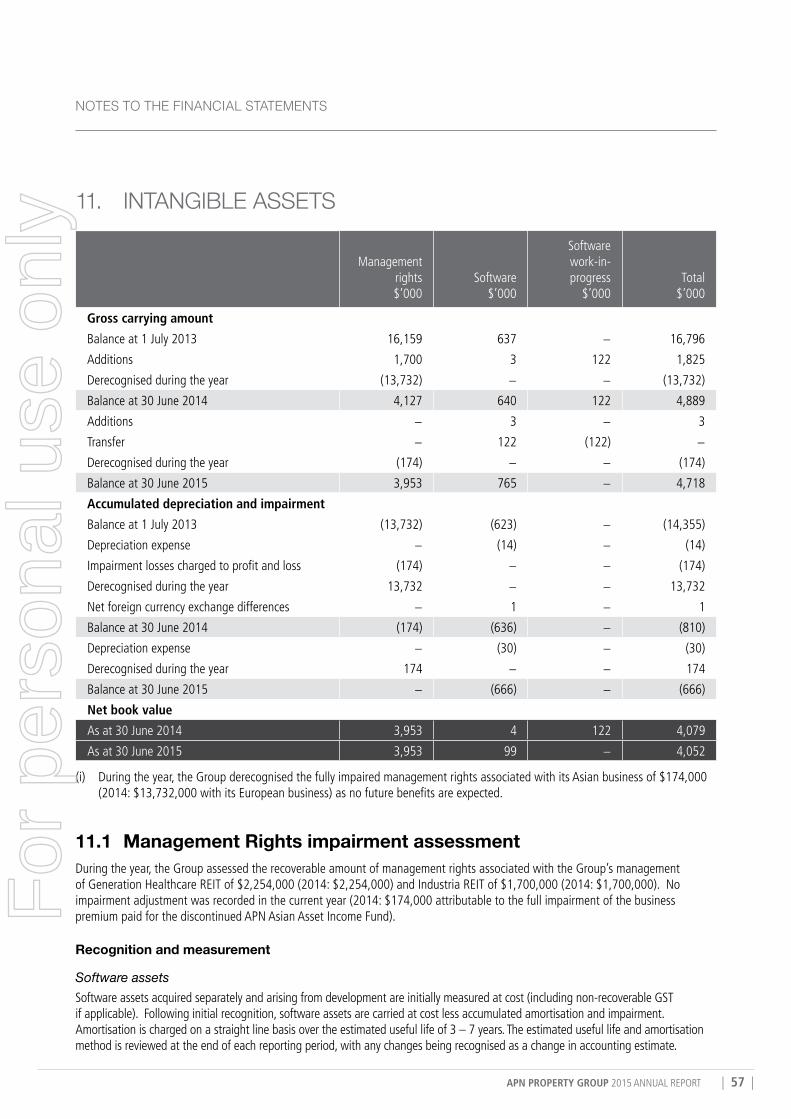
APN PROPERTY GROUP 2015 ANNUAL REPORT | 57 |
NoTES To THE FINANCIAL STATEMENTS
11. INTANGIBLE ASSETS
Management rights $’000
Software $’000
Software work-in-progress
$’000Total
$’000
Gross carrying amount
Balance at 1 July 2013 16,159 637 − 16,796
Additions 1,700 3 122 1,825
Derecognised during the year (13,732) − − (13,732)
Balance at 30 June 2014 4,127 640 122 4,889
Additions − 3 − 3
Transfer − 122 (122) −
Derecognised during the year (174) − − (174)
Balance at 30 June 2015 3,953 765 − 4,718
Accumulated depreciation and impairment
Balance at 1 July 2013 (13,732) (623) − (14,355)
Depreciation expense − (14) − (14)
Impairment losses charged to profit and loss (174) − − (174)
Derecognised during the year 13,732 − − 13,732
Net foreign currency exchange differences − 1 − 1
Balance at 30 June 2014 (174) (636) − (810)
Depreciation expense − (30) − (30)
Derecognised during the year 174 − − 174
Balance at 30 June 2015 − (666) − (666)
Net book value
As at 30 June 2014 3,953 4 122 4,079
As at 30 June 2015 3,953 99 − 4,052
(i) During the year, the Group derecognised the fully impaired management rights associated with its Asian business of $174,000 (2014: $13,732,000 with its European business) as no future benefits are expected.
11.1 Management Rights impairment assessmentDuring the year, the Group assessed the recoverable amount of management rights associated with the Group’s management of Generation Healthcare REIT of $2,254,000 (2014: $2,254,000) and Industria REIT of $1,700,000 (2014: $1,700,000). No impairment adjustment was recorded in the current year (2014: $174,000 attributable to the full impairment of the business premium paid for the discontinued APN Asian Asset Income Fund).
Recognition and measurement
Software assetsSoftware assets acquired separately and arising from development are initially measured at cost (including non-recoverable GST if applicable). Following initial recognition, software assets are carried at cost less accumulated amortisation and impairment. Amortisation is charged on a straight line basis over the estimated useful life of 3 – 7 years. The estimated useful life and amortisation method is reviewed at the end of each reporting period, with any changes being recognised as a change in accounting estimate.
For
per
sona
l use
onl
y
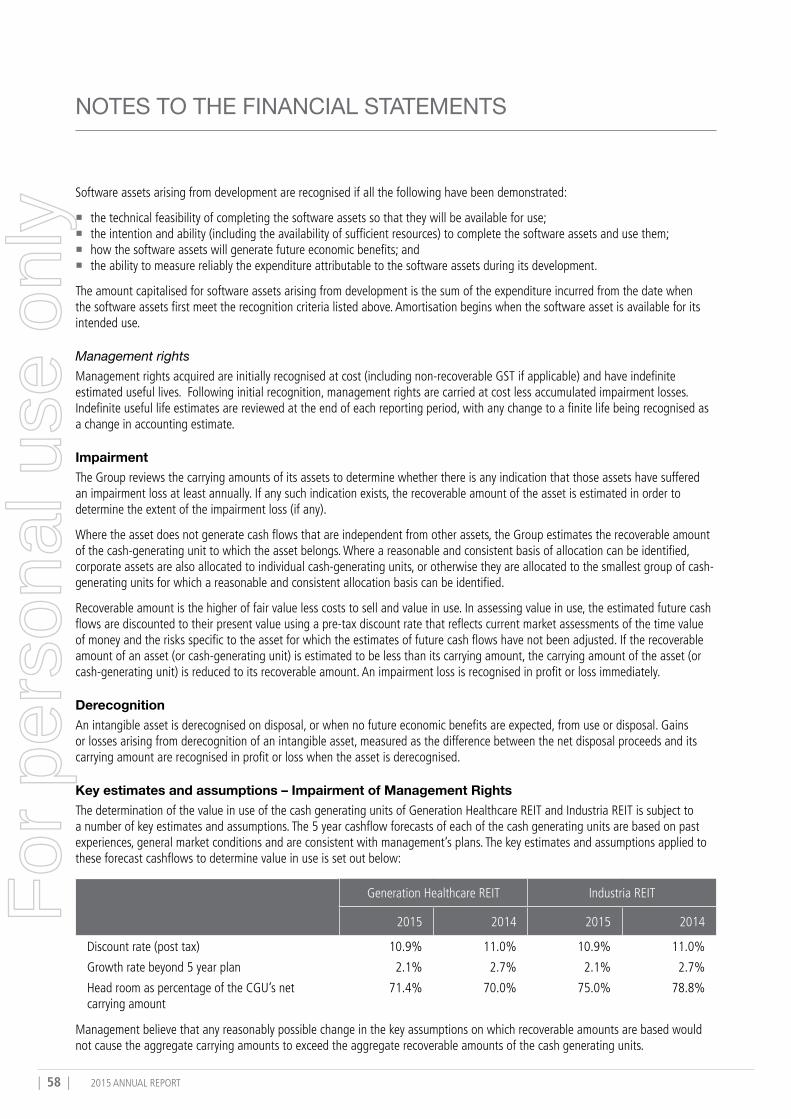
| 58 | 2015 ANNUAL REPORT
NOTES TO THE FINANCIAL STATEMENTS
Software assets arising from development are recognised if all the following have been demonstrated:
� the technical feasibility of completing the software assets so that they will be available for use; � the intention and ability (including the availability of sufficient resources) to complete the software assets and use them; � how the software assets will generate future economic benefits; and � the ability to measure reliably the expenditure attributable to the software assets during its development.
The amount capitalised for software assets arising from development is the sum of the expenditure incurred from the date when the software assets first meet the recognition criteria listed above. Amortisation begins when the software asset is available for its intended use.
Management rightsManagement rights acquired are initially recognised at cost (including non-recoverable GST if applicable) and have indefinite estimated useful lives. Following initial recognition, management rights are carried at cost less accumulated impairment losses. Indefinite useful life estimates are reviewed at the end of each reporting period, with any change to a finite life being recognised as a change in accounting estimate.
ImpairmentThe Group reviews the carrying amounts of its assets to determine whether there is any indication that those assets have suffered an impairment loss at least annually. If any such indication exists, the recoverable amount of the asset is estimated in order to determine the extent of the impairment loss (if any).
Where the asset does not generate cash flows that are independent from other assets, the Group estimates the recoverable amount of the cash-generating unit to which the asset belongs. Where a reasonable and consistent basis of allocation can be identified, corporate assets are also allocated to individual cash-generating units, or otherwise they are allocated to the smallest group of cash-generating units for which a reasonable and consistent allocation basis can be identified.
Recoverable amount is the higher of fair value less costs to sell and value in use. In assessing value in use, the estimated future cash flows are discounted to their present value using a pre-tax discount rate that reflects current market assessments of the time value of money and the risks specific to the asset for which the estimates of future cash flows have not been adjusted. If the recoverable amount of an asset (or cash-generating unit) is estimated to be less than its carrying amount, the carrying amount of the asset (or cash-generating unit) is reduced to its recoverable amount. An impairment loss is recognised in profit or loss immediately.
DerecognitionAn intangible asset is derecognised on disposal, or when no future economic benefits are expected, from use or disposal. Gains or losses arising from derecognition of an intangible asset, measured as the difference between the net disposal proceeds and its carrying amount are recognised in profit or loss when the asset is derecognised.
Key estimates and assumptions – Impairment of Management Rights The determination of the value in use of the cash generating units of Generation Healthcare REIT and Industria REIT is subject to a number of key estimates and assumptions. The 5 year cashflow forecasts of each of the cash generating units are based on past experiences, general market conditions and are consistent with management’s plans. The key estimates and assumptions applied to these forecast cashflows to determine value in use is set out below:
Generation Healthcare REIT Industria REIT
2015 2014 2015 2014
Discount rate (post tax) 10.9% 11.0% 10.9% 11.0%
Growth rate beyond 5 year plan 2.1% 2.7% 2.1% 2.7%
Head room as percentage of the CGU’s net carrying amount
71.4% 70.0% 75.0% 78.8%
Management believe that any reasonably possible change in the key assumptions on which recoverable amounts are based would not cause the aggregate carrying amounts to exceed the aggregate recoverable amounts of the cash generating units.
For
per
sona
l use
onl
y
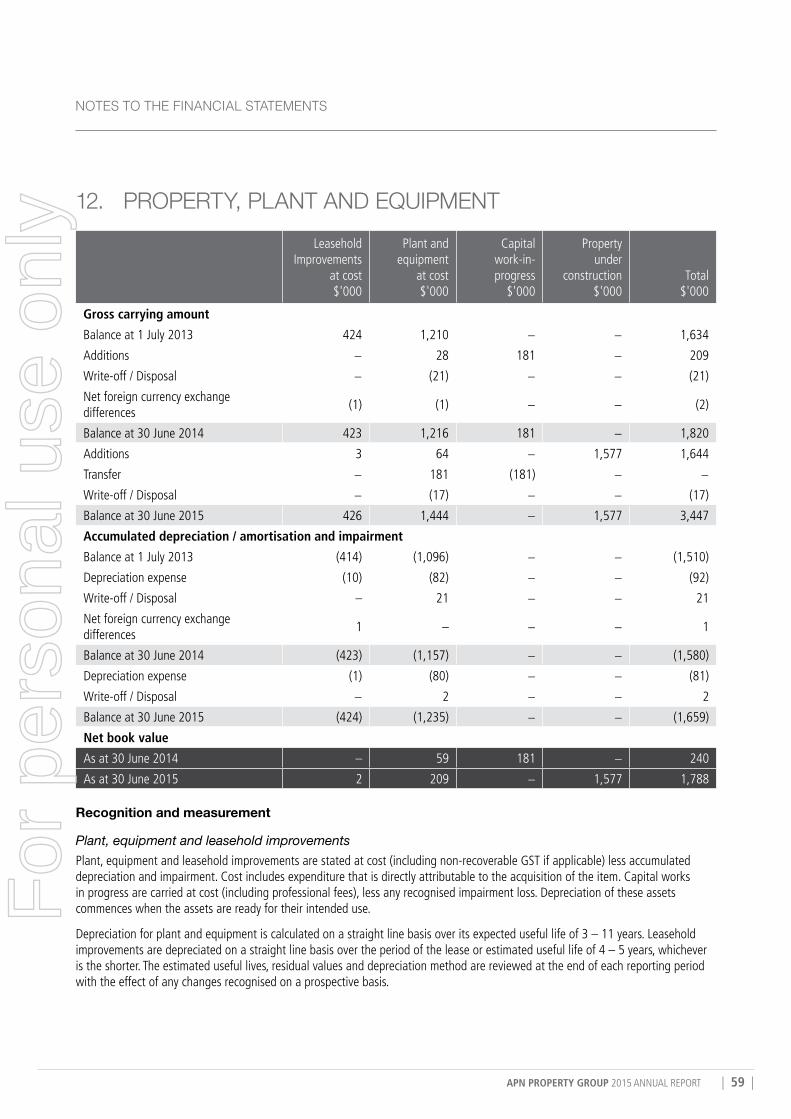
APN PROPERTY GROUP 2015 ANNUAL REPORT | 59 |
NoTES To THE FINANCIAL STATEMENTS
12. ProPErTy, PLANT AND EquIPMENTLeasehold
Improvements at cost $'000
Plant and equipment
at cost $'000
Capital work-in-progress
$'000
Property under
construction $'000
Total $'000
Gross carrying amount
Balance at 1 July 2013 424 1,210 − − 1,634
Additions − 28 181 − 209
Write-off / Disposal − (21) − − (21)
Net foreign currency exchange differences
(1) (1) − − (2)
Balance at 30 June 2014 423 1,216 181 − 1,820
Additions 3 64 − 1,577 1,644
Transfer − 181 (181) − −
Write-off / Disposal − (17) − − (17)
Balance at 30 June 2015 426 1,444 − 1,577 3,447
Accumulated depreciation / amortisation and impairment
Balance at 1 July 2013 (414) (1,096) − − (1,510)
Depreciation expense (10) (82) − − (92)
Write-off / Disposal – 21 − − 21
Net foreign currency exchange differences
1 – − − 1
Balance at 30 June 2014 (423) (1,157) − − (1,580)
Depreciation expense (1) (80) − − (81)
Write-off / Disposal − 2 − − 2
Balance at 30 June 2015 (424) (1,235) − − (1,659)
Net book value
As at 30 June 2014 – 59 181 − 240
As at 30 June 2015 2 209 − 1,577 1,788
Recognition and measurement
Plant, equipment and leasehold improvementsPlant, equipment and leasehold improvements are stated at cost (including non-recoverable GST if applicable) less accumulated depreciation and impairment. Cost includes expenditure that is directly attributable to the acquisition of the item. Capital works in progress are carried at cost (including professional fees), less any recognised impairment loss. Depreciation of these assets commences when the assets are ready for their intended use.
Depreciation for plant and equipment is calculated on a straight line basis over its expected useful life of 3 – 11 years. Leasehold improvements are depreciated on a straight line basis over the period of the lease or estimated useful life of 4 – 5 years, whichever is the shorter. The estimated useful lives, residual values and depreciation method are reviewed at the end of each reporting period with the effect of any changes recognised on a prospective basis.
For
per
sona
l use
onl
y
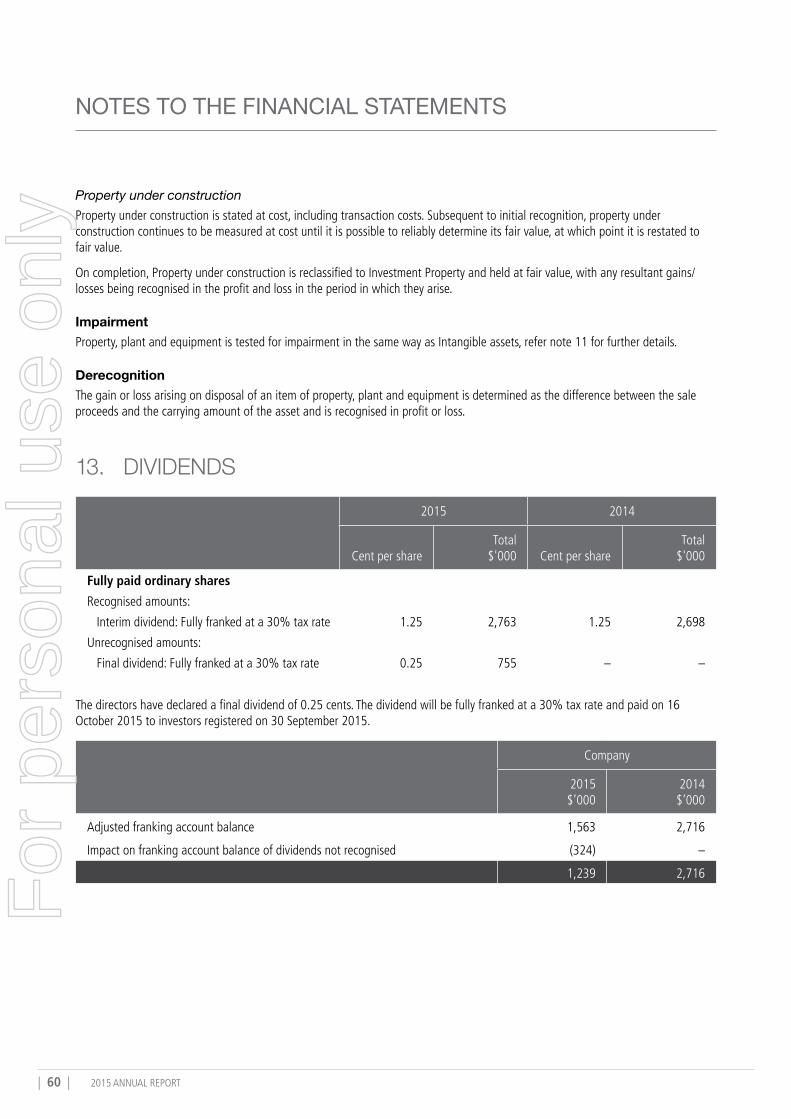
| 60 | 2015 ANNUAL REPORT
NOTES TO THE FINANCIAL STATEMENTS
Property under constructionProperty under construction is stated at cost, including transaction costs. Subsequent to initial recognition, property under construction continues to be measured at cost until it is possible to reliably determine its fair value, at which point it is restated to fair value.
On completion, Property under construction is reclassified to Investment Property and held at fair value, with any resultant gains/losses being recognised in the profit and loss in the period in which they arise.
ImpairmentProperty, plant and equipment is tested for impairment in the same way as Intangible assets, refer note 11 for further details.
DerecognitionThe gain or loss arising on disposal of an item of property, plant and equipment is determined as the difference between the sale proceeds and the carrying amount of the asset and is recognised in profit or loss.
13. DIvIDENDS
2015 2014
Cent per shareTotal
$'000 Cent per shareTotal
$'000
Fully paid ordinary shares
Recognised amounts:
Interim dividend: Fully franked at a 30% tax rate 1.25 2,763 1.25 2,698
Unrecognised amounts:
Final dividend: Fully franked at a 30% tax rate 0.25 755 – –
The directors have declared a final dividend of 0.25 cents. The dividend will be fully franked at a 30% tax rate and paid on 16 October 2015 to investors registered on 30 September 2015.
Company
2015 $’000
2014 $’000
Adjusted franking account balance 1,563 2,716
Impact on franking account balance of dividends not recognised (324) –
1,239 2,716
For
per
sona
l use
onl
y
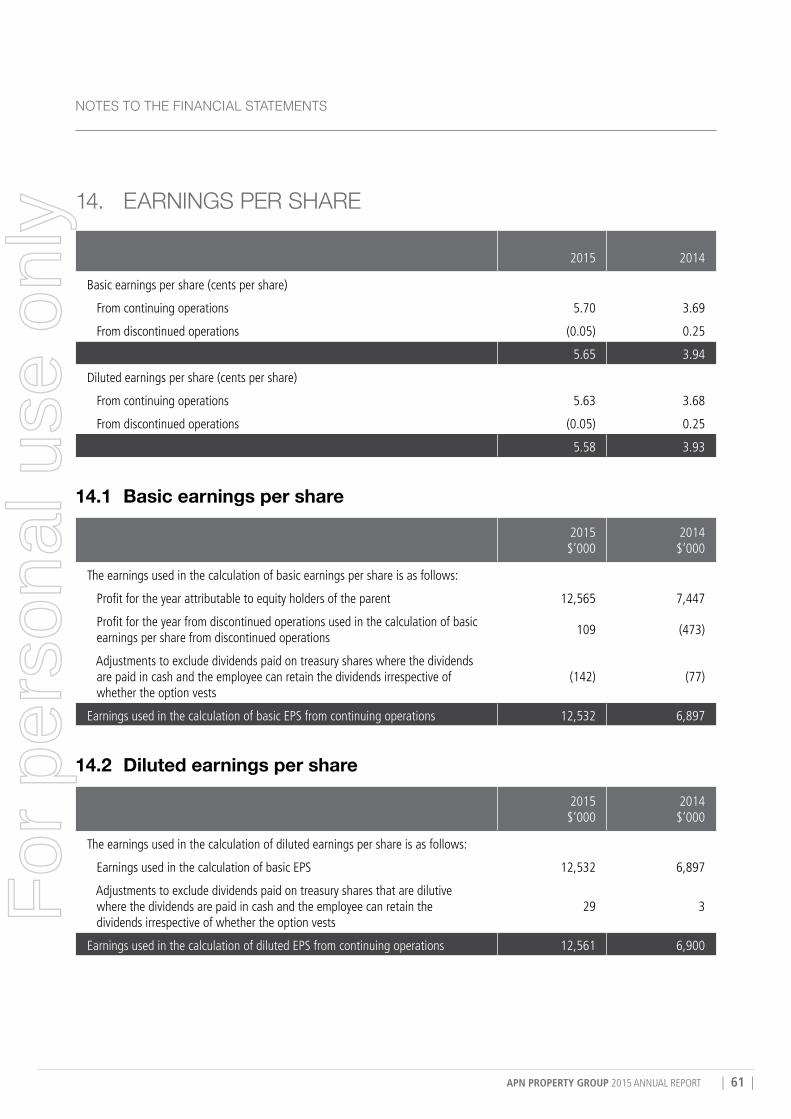
APN PROPERTY GROUP 2015 ANNUAL REPORT | 61 |
NoTES To THE FINANCIAL STATEMENTS
14. EArNINGS PEr SHArE
2015 2014
Basic earnings per share (cents per share)
From continuing operations 5.70 3.69
From discontinued operations (0.05) 0.25
5.65 3.94
Diluted earnings per share (cents per share)
From continuing operations 5.63 3.68
From discontinued operations (0.05) 0.25
5.58 3.93
14.1 Basic earnings per share
2015 $’000
2014 $’000
The earnings used in the calculation of basic earnings per share is as follows:
Profit for the year attributable to equity holders of the parent 12,565 7,447
Profit for the year from discontinued operations used in the calculation of basic earnings per share from discontinued operations
109 (473)
Adjustments to exclude dividends paid on treasury shares where the dividends are paid in cash and the employee can retain the dividends irrespective of whether the option vests
(142) (77)
Earnings used in the calculation of basic EPS from continuing operations 12,532 6,897
14.2 Diluted earnings per share
2015 $’000
2014 $’000
The earnings used in the calculation of diluted earnings per share is as follows:
Earnings used in the calculation of basic EPS 12,532 6,897
Adjustments to exclude dividends paid on treasury shares that are dilutive where the dividends are paid in cash and the employee can retain the dividends irrespective of whether the option vests
29 3
Earnings used in the calculation of diluted EPS from continuing operations 12,561 6,900
For
per
sona
l use
onl
y
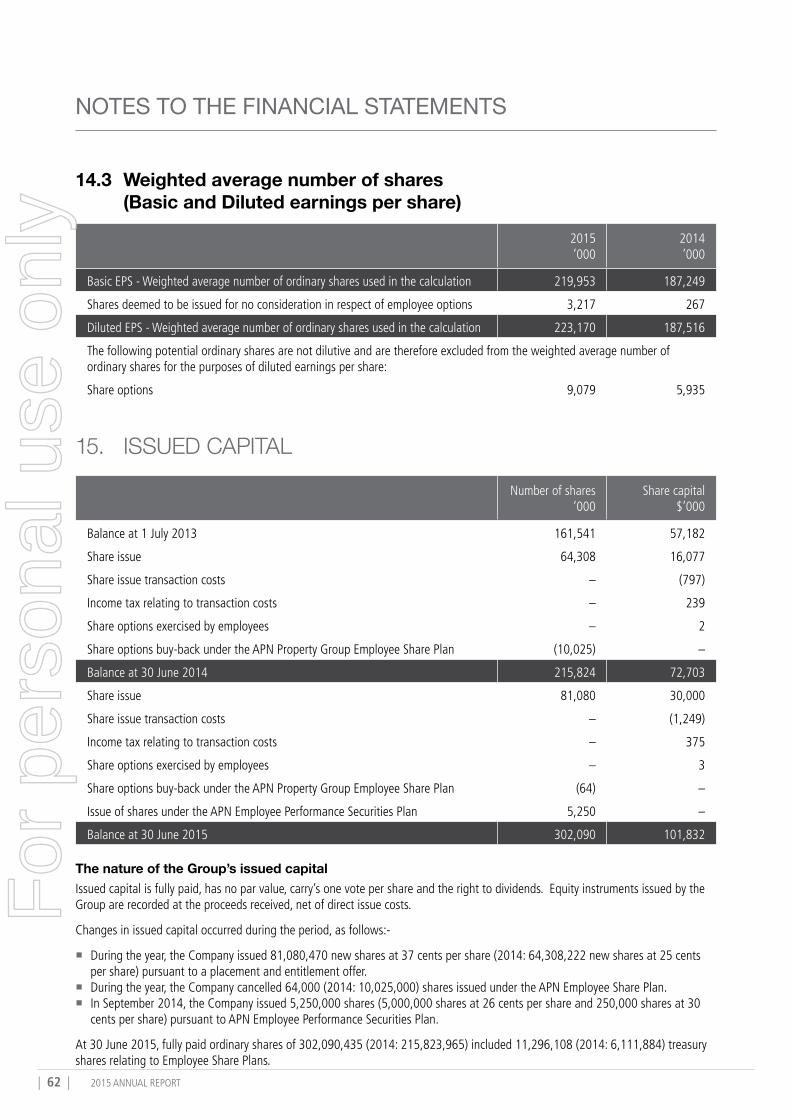
| 62 | 2015 ANNUAL REPORT
NOTES TO THE FINANCIAL STATEMENTS
14.3 Weighted average number of shares (Basic and Diluted earnings per share)
2015 ’000
2014 ’000
Basic EPS - Weighted average number of ordinary shares used in the calculation 219,953 187,249
Shares deemed to be issued for no consideration in respect of employee options 3,217 267
Diluted EPS - Weighted average number of ordinary shares used in the calculation 223,170 187,516
The following potential ordinary shares are not dilutive and are therefore excluded from the weighted average number of ordinary shares for the purposes of diluted earnings per share:
Share options 9,079 5,935
15. ISSuED CAPITAL
Number of shares ’000
Share capital $’000
Balance at 1 July 2013 161,541 57,182
Share issue 64,308 16,077
Share issue transaction costs – (797)
Income tax relating to transaction costs – 239
Share options exercised by employees – 2
Share options buy-back under the APN Property Group Employee Share Plan (10,025) –
Balance at 30 June 2014 215,824 72,703
Share issue 81,080 30,000
Share issue transaction costs – (1,249)
Income tax relating to transaction costs – 375
Share options exercised by employees – 3
Share options buy-back under the APN Property Group Employee Share Plan (64) –
Issue of shares under the APN Employee Performance Securities Plan 5,250 –
Balance at 30 June 2015 302,090 101,832
The nature of the Group’s issued capital Issued capital is fully paid, has no par value, carry’s one vote per share and the right to dividends. Equity instruments issued by the Group are recorded at the proceeds received, net of direct issue costs.
Changes in issued capital occurred during the period, as follows:-
� During the year, the Company issued 81,080,470 new shares at 37 cents per share (2014: 64,308,222 new shares at 25 cents per share) pursuant to a placement and entitlement offer.
� During the year, the Company cancelled 64,000 (2014: 10,025,000) shares issued under the APN Employee Share Plan. � In September 2014, the Company issued 5,250,000 shares (5,000,000 shares at 26 cents per share and 250,000 shares at 30
cents per share) pursuant to APN Employee Performance Securities Plan.
At 30 June 2015, fully paid ordinary shares of 302,090,435 (2014: 215,823,965) included 11,296,108 (2014: 6,111,884) treasury shares relating to Employee Share Plans.
For
per
sona
l use
onl
y
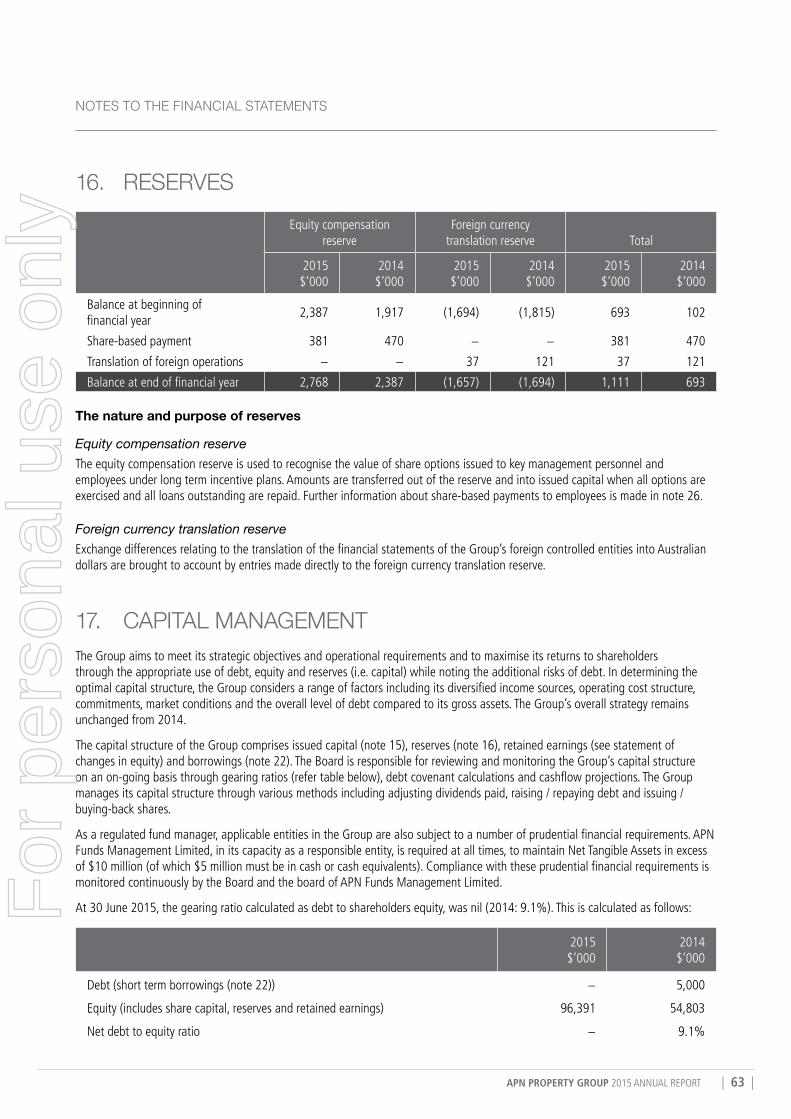
APN PROPERTY GROUP 2015 ANNUAL REPORT | 63 |
NoTES To THE FINANCIAL STATEMENTS
16. rESErvESEquity compensation
reserveForeign currency
translation reserve Total
2015 $’000
2014 $’000
2015 $’000
2014 $’000
2015 $’000
2014 $’000
Balance at beginning of financial year
2,387 1,917 (1,694) (1,815) 693 102
Share-based payment 381 470 − − 381 470
Translation of foreign operations − − 37 121 37 121
Balance at end of financial year 2,768 2,387 (1,657) (1,694) 1,111 693
The nature and purpose of reserves
Equity compensation reserveThe equity compensation reserve is used to recognise the value of share options issued to key management personnel and employees under long term incentive plans. Amounts are transferred out of the reserve and into issued capital when all options are exercised and all loans outstanding are repaid. Further information about share-based payments to employees is made in note 26.
Foreign currency translation reserveExchange differences relating to the translation of the financial statements of the Group’s foreign controlled entities into Australian dollars are brought to account by entries made directly to the foreign currency translation reserve.
17. CAPITAL MANAGEMENTThe Group aims to meet its strategic objectives and operational requirements and to maximise its returns to shareholders through the appropriate use of debt, equity and reserves (i.e. capital) while noting the additional risks of debt. In determining the optimal capital structure, the Group considers a range of factors including its diversified income sources, operating cost structure, commitments, market conditions and the overall level of debt compared to its gross assets. The Group’s overall strategy remains unchanged from 2014.
The capital structure of the Group comprises issued capital (note 15), reserves (note 16), retained earnings (see statement of changes in equity) and borrowings (note 22). The Board is responsible for reviewing and monitoring the Group’s capital structure on an on-going basis through gearing ratios (refer table below), debt covenant calculations and cashflow projections. The Group manages its capital structure through various methods including adjusting dividends paid, raising / repaying debt and issuing / buying-back shares.
As a regulated fund manager, applicable entities in the Group are also subject to a number of prudential financial requirements. APN Funds Management Limited, in its capacity as a responsible entity, is required at all times, to maintain Net Tangible Assets in excess of $10 million (of which $5 million must be in cash or cash equivalents). Compliance with these prudential financial requirements is monitored continuously by the Board and the board of APN Funds Management Limited.
At 30 June 2015, the gearing ratio calculated as debt to shareholders equity, was nil (2014: 9.1%). This is calculated as follows:
2015 $’000
2014 $’000
Debt (short term borrowings (note 22)) − 5,000
Equity (includes share capital, reserves and retained earnings) 96,391 54,803
Net debt to equity ratio − 9.1%
For
per
sona
l use
onl
y

| 64 | 2015 ANNUAL REPORT
NOTES TO THE FINANCIAL STATEMENTS
18. FINANCIAL rISk MANAGEMENT18.1 Financial risk management objectivesThe Group holds financial instruments for financing, operational and risk management purposes. Exposure to credit, interest rate, liquidity, currency and equity price risks is managed in accordance with the Group’s financial risk management policy. The objective of this policy is to support the delivery of the Group’s financial targets whilst protecting its future financial security. The Board has the primary responsibility for establishing a sound framework of risk management and audit oversight.
18.2 Market riskThe main risks arising from the Group’s financial instruments are credit, liquidity, and equity price risk. The Group uses different strategies and financial instruments to measure and manage these risks including monitoring ageing analyses and concentration of counterparties (credit risk), cash flow forecasting, including sensitivity analysis, and interest rate hedging instruments (liquidity risk), and monitoring investments, equity and property markets (equity price risk).
There has been no change to the Group’s exposure to the market risks identified above or the manner in which it manages and measures these risks.
18.3 Equity price riskThe Group is exposed to equity price risk. This arises from investments held by the Group and classified as at fair value through profit or loss.
The exposure to equity price risk at the end of the reporting period, assuming equity prices had been 10% higher or lower while all other variables were held constant, would increase/decrease net profit by $6,560,000 (2014: $4,608,000).
18.4 Liquidity risk managementThe Board has approved a liquidity risk management framework for the management of the Group’s short, medium and long-term funding and liquidity management requirements. The Group manages liquidity risk by maintaining adequate liquid asset reserves, continuously monitoring forecast and actual cash flows and by matching the maturity profiles of financial assets and liabilities.
At 30 June 2015, the Group’s banking facilities are disclosed in note 22.
For
per
sona
l use
onl
y
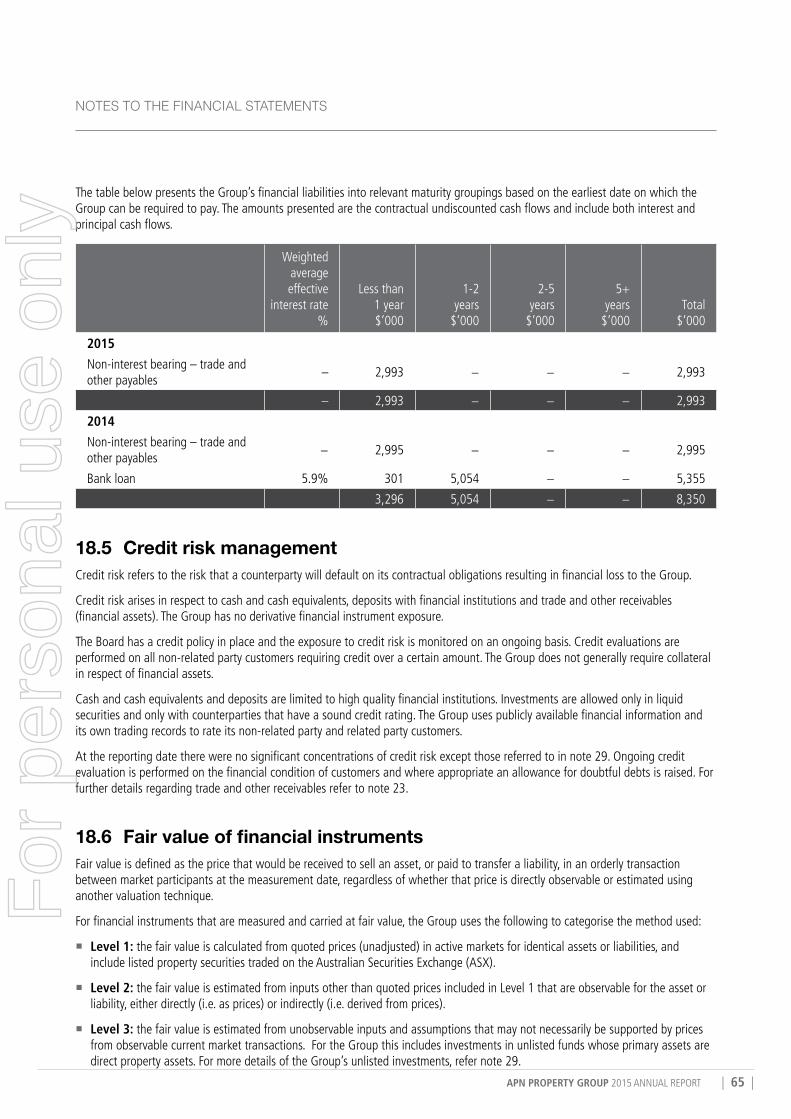
APN PROPERTY GROUP 2015 ANNUAL REPORT | 65 |
NoTES To THE FINANCIAL STATEMENTS
The table below presents the Group’s financial liabilities into relevant maturity groupings based on the earliest date on which the Group can be required to pay. The amounts presented are the contractual undiscounted cash flows and include both interest and principal cash flows.
Weighted average effective
interest rate %
Less than 1 year $’000
1-2 years $’000
2-5 years
$’000
5+ years
$’000Total
$’000
2015
Non-interest bearing – trade and other payables
– 2,993 − − − 2,993
– 2,993 − − − 2,993
2014
Non-interest bearing – trade and other payables
− 2,995 − − − 2,995
Bank loan 5.9% 301 5,054 − − 5,355
3,296 5,054 − − 8,350
18.5 Credit risk managementCredit risk refers to the risk that a counterparty will default on its contractual obligations resulting in financial loss to the Group.
Credit risk arises in respect to cash and cash equivalents, deposits with financial institutions and trade and other receivables (financial assets). The Group has no derivative financial instrument exposure.
The Board has a credit policy in place and the exposure to credit risk is monitored on an ongoing basis. Credit evaluations are performed on all non-related party customers requiring credit over a certain amount. The Group does not generally require collateral in respect of financial assets.
Cash and cash equivalents and deposits are limited to high quality financial institutions. Investments are allowed only in liquid securities and only with counterparties that have a sound credit rating. The Group uses publicly available financial information and its own trading records to rate its non-related party and related party customers.
At the reporting date there were no significant concentrations of credit risk except those referred to in note 29. Ongoing credit evaluation is performed on the financial condition of customers and where appropriate an allowance for doubtful debts is raised. For further details regarding trade and other receivables refer to note 23.
18.6 Fair value of financial instrumentsFair value is defined as the price that would be received to sell an asset, or paid to transfer a liability, in an orderly transaction between market participants at the measurement date, regardless of whether that price is directly observable or estimated using another valuation technique.
For financial instruments that are measured and carried at fair value, the Group uses the following to categorise the method used:
� Level 1: the fair value is calculated from quoted prices (unadjusted) in active markets for identical assets or liabilities, and include listed property securities traded on the Australian Securities Exchange (ASX).
� Level 2: the fair value is estimated from inputs other than quoted prices included in Level 1 that are observable for the asset or liability, either directly (i.e. as prices) or indirectly (i.e. derived from prices).
� Level 3: the fair value is estimated from unobservable inputs and assumptions that may not necessarily be supported by prices from observable current market transactions. For the Group this includes investments in unlisted funds whose primary assets are direct property assets. For more details of the Group’s unlisted investments, refer note 29.
For
per
sona
l use
onl
y
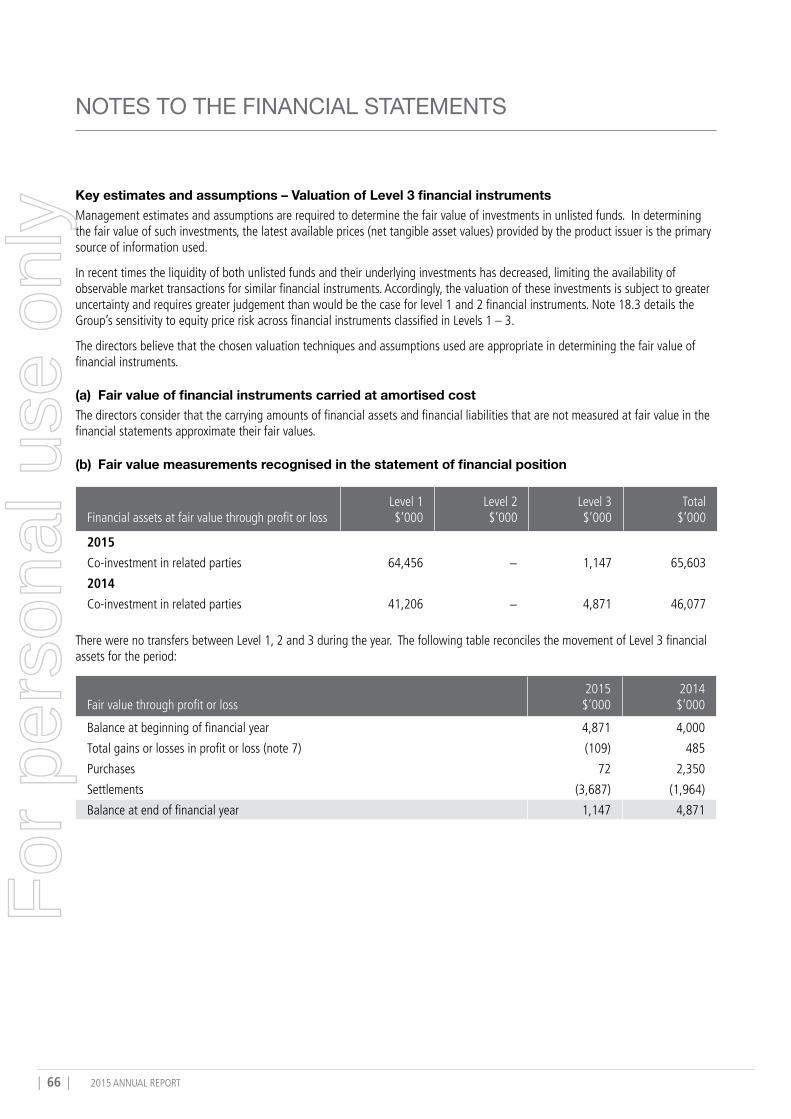
| 66 | 2015 ANNUAL REPORT
NOTES TO THE FINANCIAL STATEMENTS
Key estimates and assumptions – Valuation of Level 3 financial instruments Management estimates and assumptions are required to determine the fair value of investments in unlisted funds. In determining the fair value of such investments, the latest available prices (net tangible asset values) provided by the product issuer is the primary source of information used.
In recent times the liquidity of both unlisted funds and their underlying investments has decreased, limiting the availability of observable market transactions for similar financial instruments. Accordingly, the valuation of these investments is subject to greater uncertainty and requires greater judgement than would be the case for level 1 and 2 financial instruments. Note 18.3 details the Group’s sensitivity to equity price risk across financial instruments classified in Levels 1 – 3.
The directors believe that the chosen valuation techniques and assumptions used are appropriate in determining the fair value of financial instruments.
(a) Fair value of financial instruments carried at amortised costThe directors consider that the carrying amounts of financial assets and financial liabilities that are not measured at fair value in the financial statements approximate their fair values.
(b) Fair value measurements recognised in the statement of financial position
Financial assets at fair value through profit or loss Level 1 $’000
Level 2 $’000
Level 3 $’000
Total $’000
2015
Co-investment in related parties 64,456 − 1,147 65,603
2014
Co-investment in related parties 41,206 − 4,871 46,077
There were no transfers between Level 1, 2 and 3 during the year. The following table reconciles the movement of Level 3 financial assets for the period:
Fair value through profit or loss2015 $’000
2014 $’000
Balance at beginning of financial year 4,871 4,000
Total gains or losses in profit or loss (note 7) (109) 485
Purchases 72 2,350
Settlements (3,687) (1,964)
Balance at end of financial year 1,147 4,871
For
per
sona
l use
onl
y
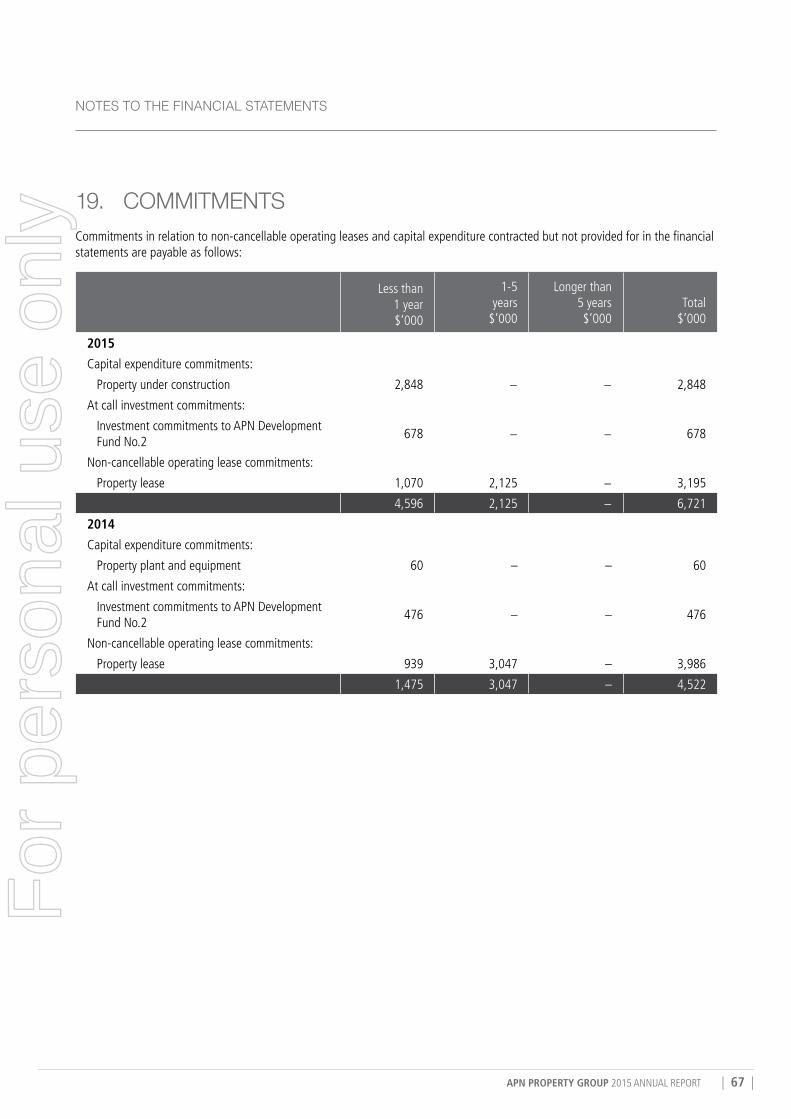
APN PROPERTY GROUP 2015 ANNUAL REPORT | 67 |
NoTES To THE FINANCIAL STATEMENTS
19. CoMMITMENTS Commitments in relation to non-cancellable operating leases and capital expenditure contracted but not provided for in the financial statements are payable as follows:
Less than 1 year $’000
1-5 years
$’000
Longer than 5 years $’000
Total $’000
2015
Capital expenditure commitments:
Property under construction 2,848 − − 2,848
At call investment commitments:
Investment commitments to APN Development Fund No.2
678 − − 678
Non-cancellable operating lease commitments:
Property lease 1,070 2,125 − 3,195
4,596 2,125 − 6,721
2014
Capital expenditure commitments:
Property plant and equipment 60 – – 60
At call investment commitments:
Investment commitments to APN Development Fund No.2
476 – – 476
Non-cancellable operating lease commitments:
Property lease 939 3,047 – 3,986
1,475 3,047 – 4,522
For
per
sona
l use
onl
y
| 68 | 2015 ANNUAL REPORT
NOTES TO THE FINANCIAL STATEMENTS
20. CoNTINGENTS ASSETS AND LIABILITIES20.1 Contingent assetsPerformance entitlements from APN Development Fund No.2
APN Funds Management Limited, a wholly owned subsidiary of the Company and fund manager of APN Development Fund No.2, has been issued ‘B’ class units, which carry conditional performance entitlements. These performance entitlements will not be crystalised until the earlier of the conclusion of the APN Development Fund No.2 or ‘A’ class unit holders receiving an Internal Rate of Return (IRR) greater than 14% on total committed capital.
At 30 June 2015, the ability to earn a performance entitlement is possible, but not probable as ‘A’ class unit holders have not received an IRR greater than 14% on total committed capital. Accordingly no asset has been recognised in the financial statements.
20.2 Contingent liabilities APN Funds Management Limited, a wholly owned subsidiary of the Company, enters into many contracts in its capacity as responsible entity of a number of managed investment schemes (“Schemes”). APN FM’s liability in respect of these contracts is generally limited to its right to recover any payments made out of the assets of the applicable Scheme. These rights are asserted in a Limitation of Liability clause that is included in contracts relating to a Scheme.
In circumstances where a Limitation of Liability clause is not included in a Scheme contract and the scheme has insufficient assets to reimburse APN FM, then APN FM may incur a financial loss. The Directors are not aware of any circumstances where a loss resulting from these circumstances is likely to occur.
For
per
sona
l use
onl
y
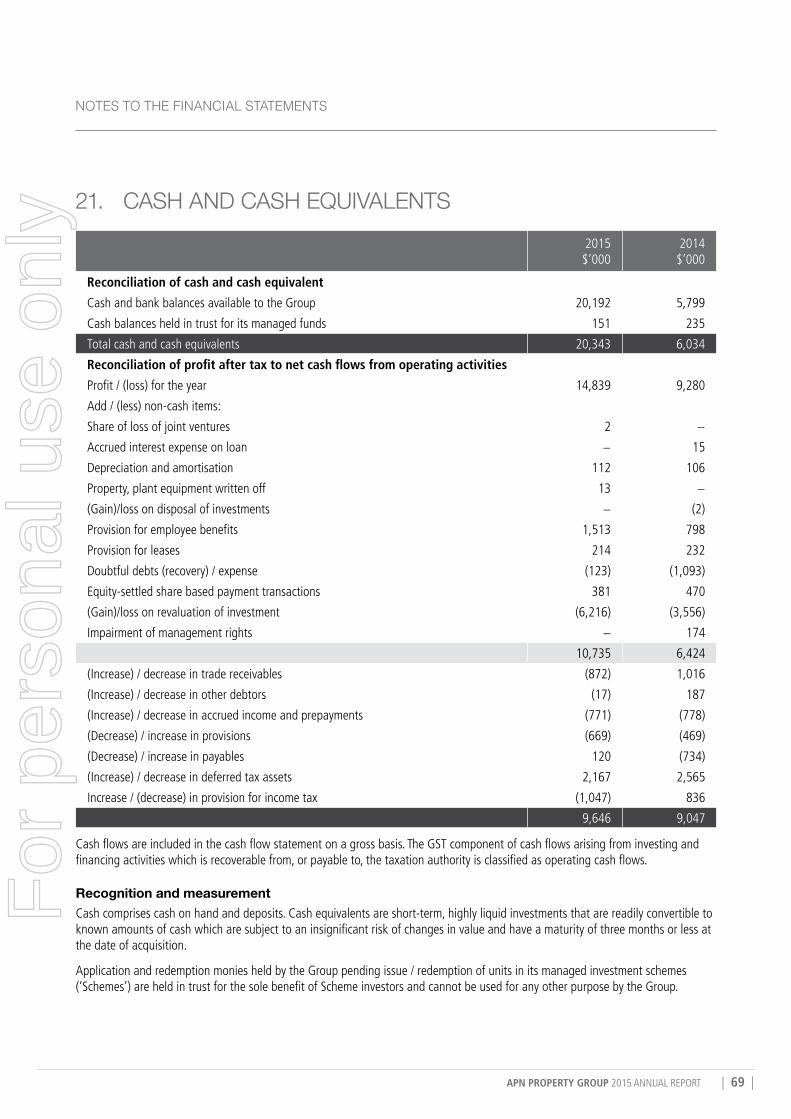
APN PROPERTY GROUP 2015 ANNUAL REPORT | 69 |
NoTES To THE FINANCIAL STATEMENTS
21. CASH AND CASH EquIvALENTS2015 $’000
2014 $’000
Reconciliation of cash and cash equivalent
Cash and bank balances available to the Group 20,192 5,799
Cash balances held in trust for its managed funds 151 235
Total cash and cash equivalents 20,343 6,034
Reconciliation of profit after tax to net cash flows from operating activities
Profit / (loss) for the year 14,839 9,280
Add / (less) non-cash items:
Share of loss of joint ventures 2 −
Accrued interest expense on loan − 15
Depreciation and amortisation 112 106
Property, plant equipment written off 13 −
(Gain)/loss on disposal of investments − (2)
Provision for employee benefits 1,513 798
Provision for leases 214 232
Doubtful debts (recovery) / expense (123) (1,093)
Equity-settled share based payment transactions 381 470
(Gain)/loss on revaluation of investment (6,216) (3,556)
Impairment of management rights − 174
10,735 6,424
(Increase) / decrease in trade receivables (872) 1,016
(Increase) / decrease in other debtors (17) 187
(Increase) / decrease in accrued income and prepayments (771) (778)
(Decrease) / increase in provisions (669) (469)
(Decrease) / increase in payables 120 (734)
(Increase) / decrease in deferred tax assets 2,167 2,565
Increase / (decrease) in provision for income tax (1,047) 836
9,646 9,047
Cash flows are included in the cash flow statement on a gross basis. The GST component of cash flows arising from investing and financing activities which is recoverable from, or payable to, the taxation authority is classified as operating cash flows.
Recognition and measurementCash comprises cash on hand and deposits. Cash equivalents are short-term, highly liquid investments that are readily convertible to known amounts of cash which are subject to an insignificant risk of changes in value and have a maturity of three months or less at the date of acquisition.
Application and redemption monies held by the Group pending issue / redemption of units in its managed investment schemes (‘Schemes’) are held in trust for the sole benefit of Scheme investors and cannot be used for any other purpose by the Group.
For
per
sona
l use
onl
y
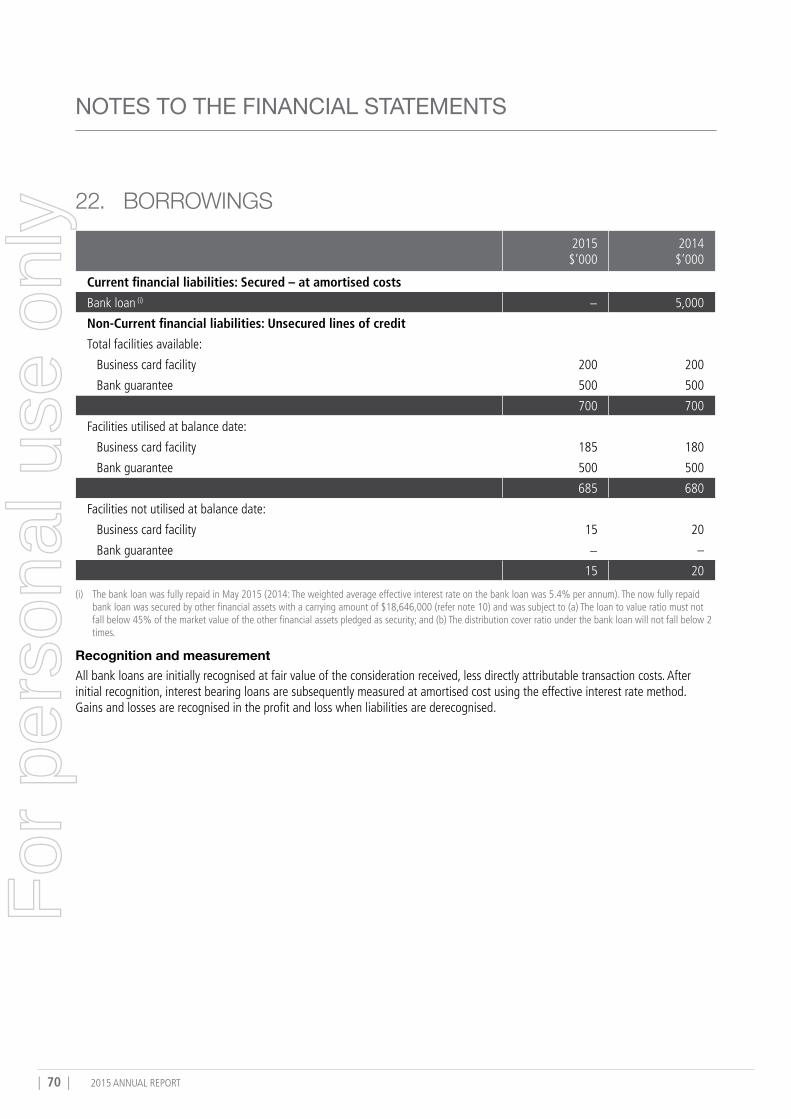
| 70 | 2015 ANNUAL REPORT
NOTES TO THE FINANCIAL STATEMENTS
22. BorroWINGS2015 $’000
2014 $’000
Current financial liabilities: Secured – at amortised costs
Bank loan (i) − 5,000
Non-Current financial liabilities: Unsecured lines of credit
Total facilities available:
Business card facility 200 200
Bank guarantee 500 500
700 700
Facilities utilised at balance date:
Business card facility 185 180
Bank guarantee 500 500
685 680
Facilities not utilised at balance date:
Business card facility 15 20
Bank guarantee − –
15 20
(i) The bank loan was fully repaid in May 2015 (2014: The weighted average effective interest rate on the bank loan was 5.4% per annum). The now fully repaid bank loan was secured by other financial assets with a carrying amount of $18,646,000 (refer note 10) and was subject to (a) The loan to value ratio must not fall below 45% of the market value of the other financial assets pledged as security; and (b) The distribution cover ratio under the bank loan will not fall below 2 times.
Recognition and measurementAll bank loans are initially recognised at fair value of the consideration received, less directly attributable transaction costs. After initial recognition, interest bearing loans are subsequently measured at amortised cost using the effective interest rate method. Gains and losses are recognised in the profit and loss when liabilities are derecognised.
For
per
sona
l use
onl
y
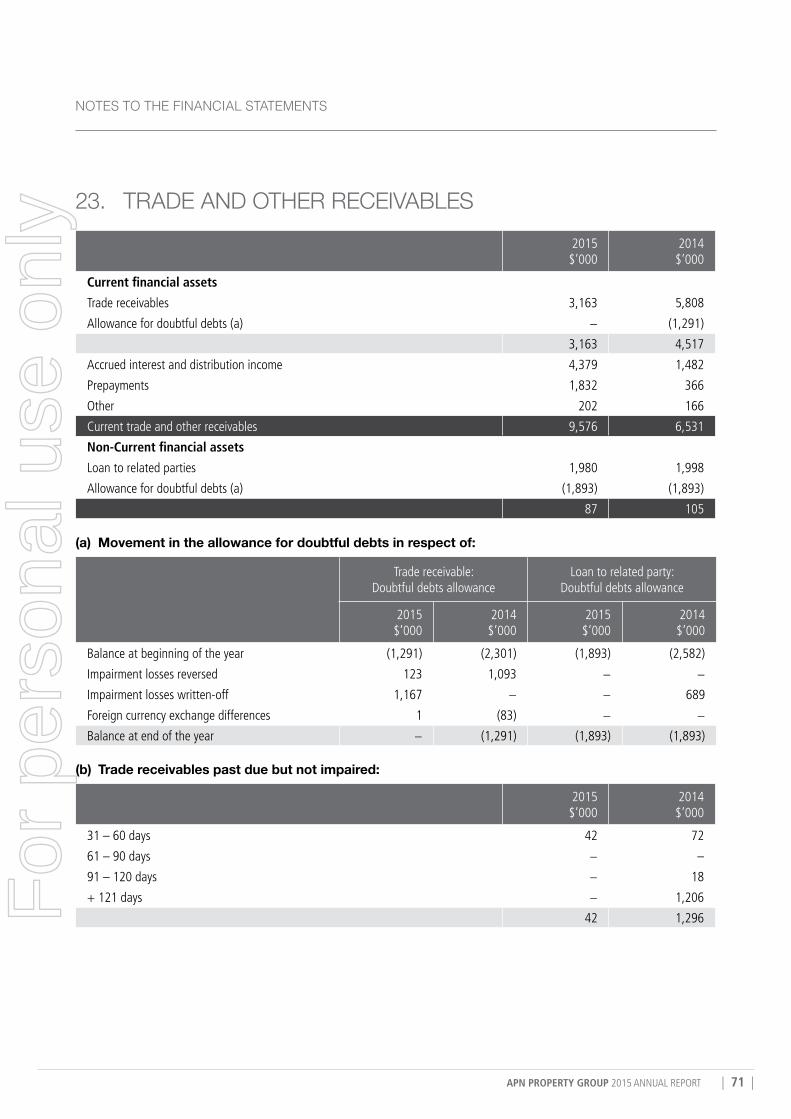
APN PROPERTY GROUP 2015 ANNUAL REPORT | 71 |
NoTES To THE FINANCIAL STATEMENTS
23. TrADE AND oTHEr rECEIvABLES2015 $’000
2014 $’000
Current financial assets
Trade receivables 3,163 5,808
Allowance for doubtful debts (a) − (1,291)
3,163 4,517
Accrued interest and distribution income 4,379 1,482
Prepayments 1,832 366
Other 202 166
Current trade and other receivables 9,576 6,531
Non-Current financial assets
Loan to related parties 1,980 1,998
Allowance for doubtful debts (a) (1,893) (1,893)
87 105
(a) Movement in the allowance for doubtful debts in respect of:
Trade receivable: Doubtful debts allowance
Loan to related party: Doubtful debts allowance
2015 $’000
2014 $’000
2015 $’000
2014 $’000
Balance at beginning of the year (1,291) (2,301) (1,893) (2,582)
Impairment losses reversed 123 1,093 − −
Impairment losses written-off 1,167 − − 689
Foreign currency exchange differences 1 (83) − −
Balance at end of the year − (1,291) (1,893) (1,893)
(b) Trade receivables past due but not impaired:
2015 $’000
2014 $’000
31 – 60 days 42 72
61 – 90 days − –
91 – 120 days − 18
+ 121 days − 1,206
42 1,296For
per
sona
l use
onl
y
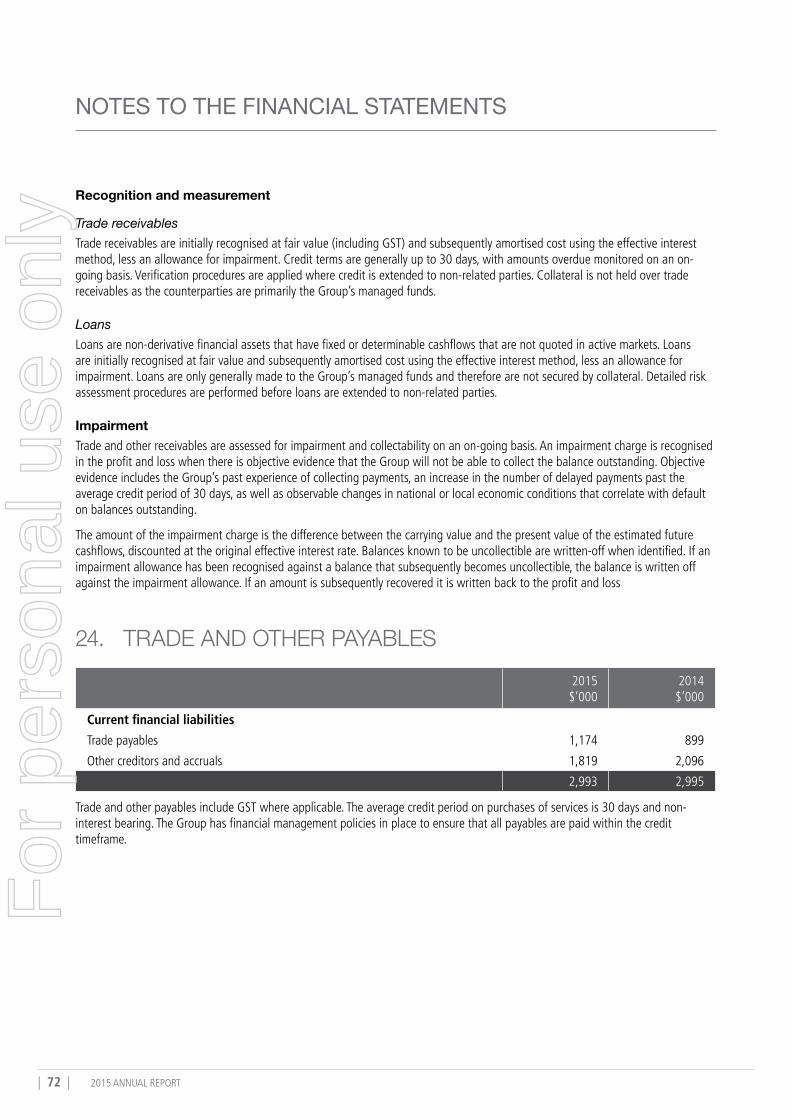
| 72 | 2015 ANNUAL REPORT
NOTES TO THE FINANCIAL STATEMENTS
Recognition and measurement
Trade receivablesTrade receivables are initially recognised at fair value (including GST) and subsequently amortised cost using the effective interest method, less an allowance for impairment. Credit terms are generally up to 30 days, with amounts overdue monitored on an on-going basis. Verification procedures are applied where credit is extended to non-related parties. Collateral is not held over trade receivables as the counterparties are primarily the Group’s managed funds.
LoansLoans are non-derivative financial assets that have fixed or determinable cashflows that are not quoted in active markets. Loans are initially recognised at fair value and subsequently amortised cost using the effective interest method, less an allowance for impairment. Loans are only generally made to the Group’s managed funds and therefore are not secured by collateral. Detailed risk assessment procedures are performed before loans are extended to non-related parties.
ImpairmentTrade and other receivables are assessed for impairment and collectability on an on-going basis. An impairment charge is recognised in the profit and loss when there is objective evidence that the Group will not be able to collect the balance outstanding. Objective evidence includes the Group’s past experience of collecting payments, an increase in the number of delayed payments past the average credit period of 30 days, as well as observable changes in national or local economic conditions that correlate with default on balances outstanding.
The amount of the impairment charge is the difference between the carrying value and the present value of the estimated future cashflows, discounted at the original effective interest rate. Balances known to be uncollectible are written-off when identified. If an impairment allowance has been recognised against a balance that subsequently becomes uncollectible, the balance is written off against the impairment allowance. If an amount is subsequently recovered it is written back to the profit and loss
24. TrADE AND oTHEr PAyABLES2015 $’000
2014 $’000
Current financial liabilities
Trade payables 1,174 899
Other creditors and accruals 1,819 2,096
2,993 2,995
Trade and other payables include GST where applicable. The average credit period on purchases of services is 30 days and non-interest bearing. The Group has financial management policies in place to ensure that all payables are paid within the credit timeframe.
For
per
sona
l use
onl
y
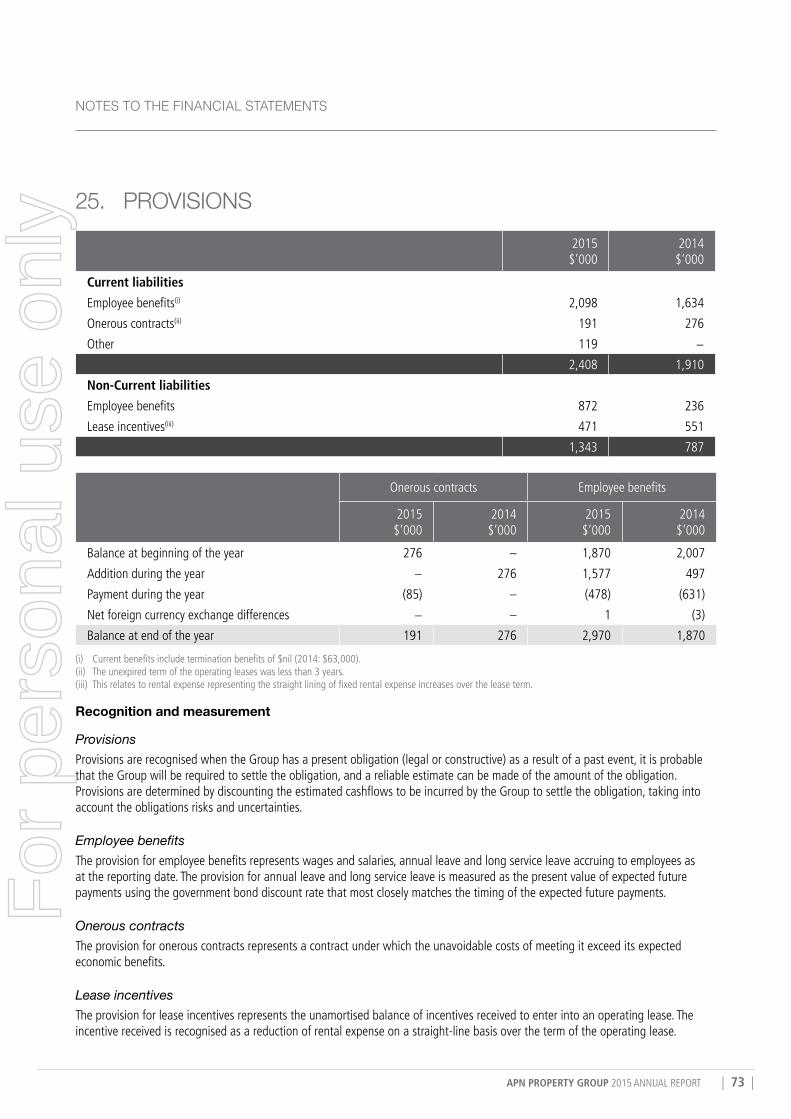
APN PROPERTY GROUP 2015 ANNUAL REPORT | 73 |
NoTES To THE FINANCIAL STATEMENTS
25. ProvISIoNS2015 $’000
2014 $’000
Current liabilities
Employee benefits(i) 2,098 1,634
Onerous contracts(ii) 191 276
Other 119 −
2,408 1,910
Non-Current liabilities
Employee benefits 872 236
Lease incentives(iii) 471 551
1,343 787
Onerous contracts Employee benefits
2015 $’000
2014 $’000
2015 $’000
2014 $’000
Balance at beginning of the year 276 – 1,870 2,007
Addition during the year − 276 1,577 497
Payment during the year (85) – (478) (631)
Net foreign currency exchange differences − – 1 (3)
Balance at end of the year 191 276 2,970 1,870
(i) Current benefits include termination benefits of $nil (2014: $63,000).(ii) The unexpired term of the operating leases was less than 3 years.(iii) This relates to rental expense representing the straight lining of fixed rental expense increases over the lease term. Recognition and measurement
ProvisionsProvisions are recognised when the Group has a present obligation (legal or constructive) as a result of a past event, it is probable that the Group will be required to settle the obligation, and a reliable estimate can be made of the amount of the obligation. Provisions are determined by discounting the estimated cashflows to be incurred by the Group to settle the obligation, taking into account the obligations risks and uncertainties.
Employee benefitsThe provision for employee benefits represents wages and salaries, annual leave and long service leave accruing to employees as at the reporting date. The provision for annual leave and long service leave is measured as the present value of expected future payments using the government bond discount rate that most closely matches the timing of the expected future payments.
Onerous contractsThe provision for onerous contracts represents a contract under which the unavoidable costs of meeting it exceed its expected economic benefits.
Lease incentivesThe provision for lease incentives represents the unamortised balance of incentives received to enter into an operating lease. The incentive received is recognised as a reduction of rental expense on a straight-line basis over the term of the operating lease.
For
per
sona
l use
onl
y

| 74 | 2015 ANNUAL REPORT
NOTES TO THE FINANCIAL STATEMENTS
26. SHArE-BASED PAyMENTSThe Group provides equity settled benefits to employees, including key management personnel, through share based incentives. Employees are paid for their services or incentivised for their performance in part through granting shares or rights over shares in the Group. As the Group does not require reimbursement for the cost of the grant, this is deemed a contribution by the Group in its capacity as owner. The expense arising from these grants is shown in note 7.
Recognition and measurement The cost of share based payments is measured at their fair value at the grant date. Fair value is determined using the Black-Scholes option pricing model, based on the director’s best estimates of the term of the grant (vesting period), the effects of any market and service conditions (but not performance conditions) and other behavioural considerations. The fair value determined is expensed to the profit and loss and recognised in the equity compensation reserve, on a straight line basis over the vesting period, based on the estimated number of shares that will eventually vest. This estimate is reassessed at each reporting date, with any resultant change recognised on a straight line basis in the profit and loss and equity compensation reserve over the remaining vesting period.
26.1 Additional information on share based incentive plansAPN Employee Performance Securities Plan (EPSP)The EPSP is offered to selected employees who are granted the right to acquire shares at a nominated exercise price, subject to agreed service and performance conditions (i.e. vesting conditions). Employees are issued the shares once vesting conditions are met, with the issue price fully financed by a limited recourse loan provided by the Group. Dividends are for the benefit of the employee. Employees are not permitted to deal in the shares until the limited recourse loan has been repaid. Shares issued under the EPSP are characterised as share options.
No EPSP share options were issued in the current year (2014: 15,250,000). At 30 June 2015, the fair value of the share options issued and included in the equity compensation reserve is $1,091,621 (2014: $710,546).
APN Employee Share Plan (ESS)The last issue under the ESS plan was in November 2007. Under the plan employees were invited to acquire shares issued at market price, fully financed by a limited recourse loan provided by the Group. Depending on the terms of the invitation, dividends were either for the benefit of the employee or applied to the repayment of the limited recourse loan. Shares issued under the ESS are characterised as share options.
During the year 64,000 (2014: 25,000) shares were cancelled. At 30 June 2015, the fair value of all existing share options issued and included in equity compensation reserve was $1,188,378 (2014: $1,188,378).
Clive Appleton Share Trust (CAST)The last issue under the CAST plan was in September 2004. Shares were issued to former managing director, Clive Appleton on terms and conditions that are the same in all material respects with the ESS outlined above.
At 30 June 2015, the fair value of share options issued and included in the equity compensation reserve was $104,000 (2014: $104,000). The shares are fully vested and can be exercised at any time.
Miles Wentworth and Chris Adams (MWCA)The last issue under the MWCA plan was in August 2011. The shares were issued as a sign-on incentive as part of the Groups’ acquisition of 67.5% of the Generation Healthcare REIT management business. The issue price of the shares was fully financed by limited recourse loans provided by the Group. Dividends are for the benefit of the individuals. The individuals are not permitted to deal in the shares until the limited recourse loan has been repaid. Shares issued under the MWCA plan are characterised as share options.
At 30 June 2015, the fair value of the share options issued and included in equity compensation reserve is $nil (2014: $nil).
APN Employee Share Gift Plan (ESGP)Under the ESGP the Group periodically offers all eligible permanent employees of the Group the opportunity to receive, for no consideration, up to $1,000 in shares at market value. Dealing in shares issued under this plan is restricted until the earlier of three years from issue date or the date the employee ceases employment.
At 30 June 2015, $nil (2014: $40,000) has been recognised as employee expenses and included in the equity compensation reserve.
For
per
sona
l use
onl
y
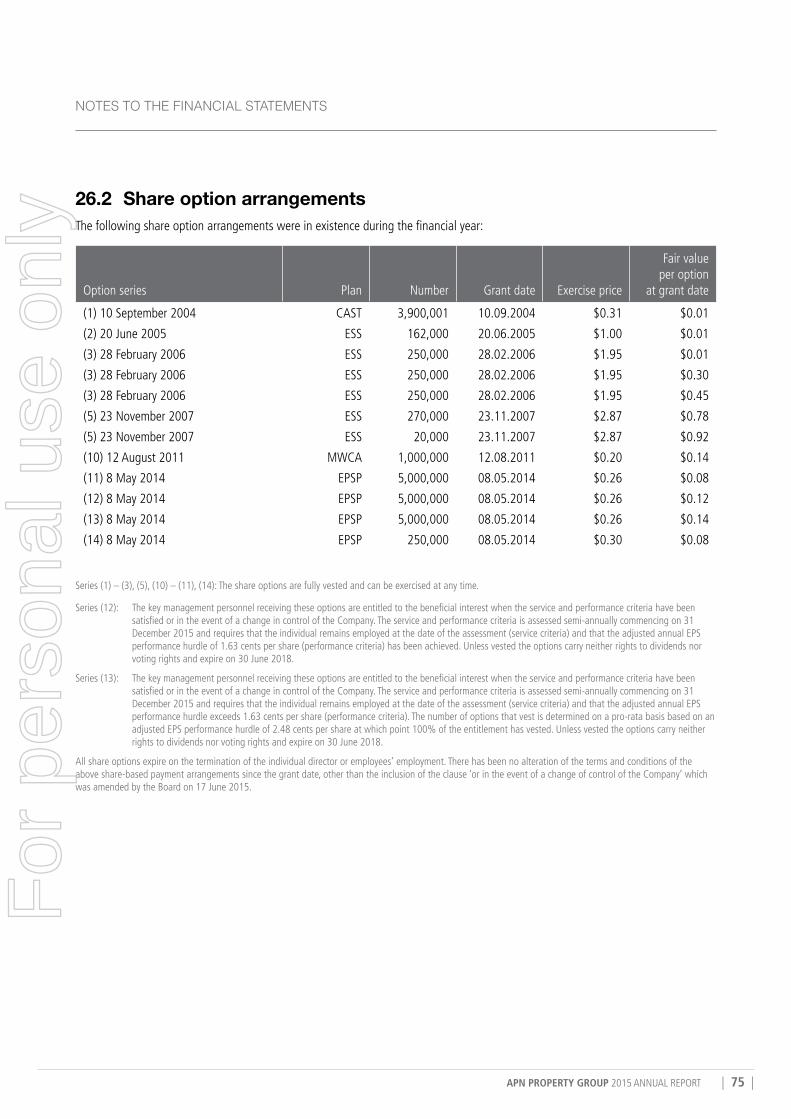
APN PROPERTY GROUP 2015 ANNUAL REPORT | 75 |
NoTES To THE FINANCIAL STATEMENTS
26.2 Share option arrangements The following share option arrangements were in existence during the financial year:
Option series Plan Number Grant date Exercise price
Fair value per option
at grant date
(1) 10 September 2004 CAST 3,900,001 10.09.2004 $0.31 $0.01
(2) 20 June 2005 ESS 162,000 20.06.2005 $1.00 $0.01
(3) 28 February 2006 ESS 250,000 28.02.2006 $1.95 $0.01
(3) 28 February 2006 ESS 250,000 28.02.2006 $1.95 $0.30
(3) 28 February 2006 ESS 250,000 28.02.2006 $1.95 $0.45
(5) 23 November 2007 ESS 270,000 23.11.2007 $2.87 $0.78
(5) 23 November 2007 ESS 20,000 23.11.2007 $2.87 $0.92
(10) 12 August 2011 MWCA 1,000,000 12.08.2011 $0.20 $0.14
(11) 8 May 2014 EPSP 5,000,000 08.05.2014 $0.26 $0.08
(12) 8 May 2014 EPSP 5,000,000 08.05.2014 $0.26 $0.12
(13) 8 May 2014 EPSP 5,000,000 08.05.2014 $0.26 $0.14
(14) 8 May 2014 EPSP 250,000 08.05.2014 $0.30 $0.08
Series (1) – (3), (5), (10) – (11), (14): The share options are fully vested and can be exercised at any time.
Series (12): The key management personnel receiving these options are entitled to the beneficial interest when the service and performance criteria have been satisfied or in the event of a change in control of the Company. The service and performance criteria is assessed semi-annually commencing on 31 December 2015 and requires that the individual remains employed at the date of the assessment (service criteria) and that the adjusted annual EPS performance hurdle of 1.63 cents per share (performance criteria) has been achieved. Unless vested the options carry neither rights to dividends nor voting rights and expire on 30 June 2018.
Series (13): The key management personnel receiving these options are entitled to the beneficial interest when the service and performance criteria have been satisfied or in the event of a change in control of the Company. The service and performance criteria is assessed semi-annually commencing on 31 December 2015 and requires that the individual remains employed at the date of the assessment (service criteria) and that the adjusted annual EPS performance hurdle exceeds 1.63 cents per share (performance criteria). The number of options that vest is determined on a pro-rata basis based on an adjusted EPS performance hurdle of 2.48 cents per share at which point 100% of the entitlement has vested. Unless vested the options carry neither rights to dividends nor voting rights and expire on 30 June 2018.
All share options expire on the termination of the individual director or employees’ employment. There has been no alteration of the terms and conditions of the above share-based payment arrangements since the grant date, other than the inclusion of the clause ‘or in the event of a change of control of the Company’ which was amended by the Board on 17 June 2015.
For
per
sona
l use
onl
y
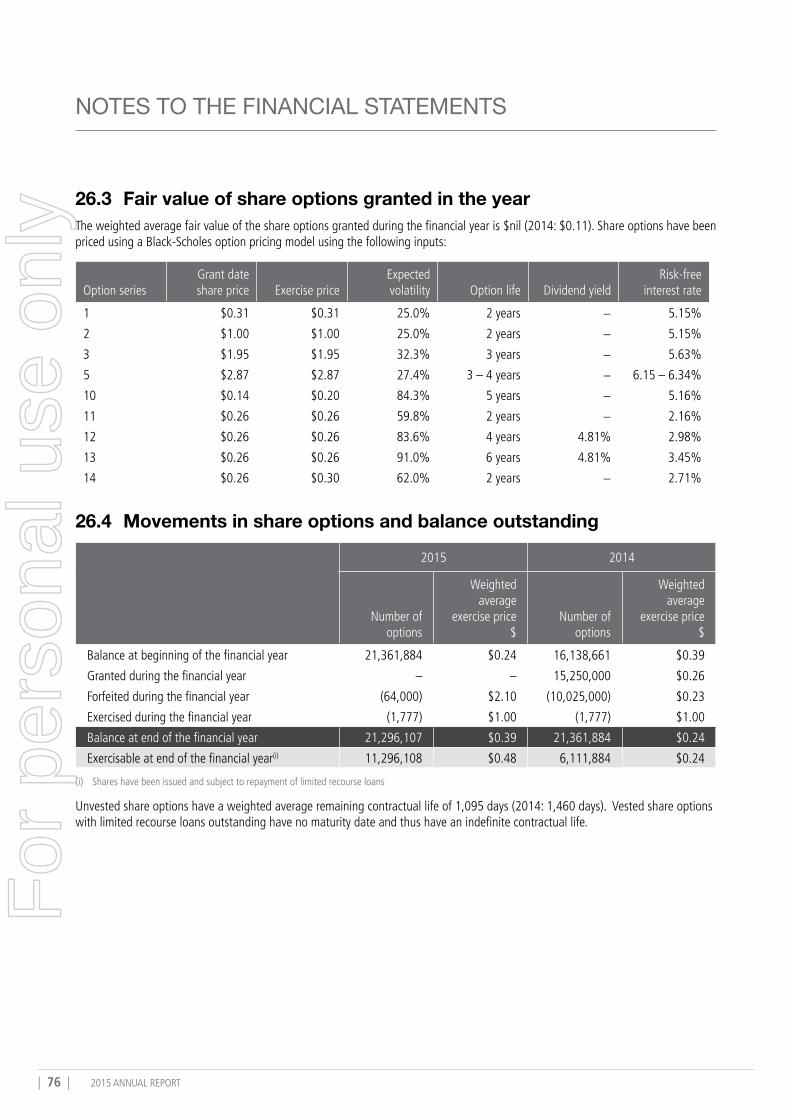
| 76 | 2015 ANNUAL REPORT
NOTES TO THE FINANCIAL STATEMENTS
26.3 Fair value of share options granted in the yearThe weighted average fair value of the share options granted during the financial year is $nil (2014: $0.11). Share options have been priced using a Black-Scholes option pricing model using the following inputs:
Option seriesGrant date share price Exercise price
Expected volatility Option life Dividend yield
Risk-free interest rate
1 $0.31 $0.31 25.0% 2 years − 5.15%
2 $1.00 $1.00 25.0% 2 years − 5.15%
3 $1.95 $1.95 32.3% 3 years − 5.63%
5 $2.87 $2.87 27.4% 3 – 4 years − 6.15 – 6.34%
10 $0.14 $0.20 84.3% 5 years − 5.16%
11 $0.26 $0.26 59.8% 2 years − 2.16%
12 $0.26 $0.26 83.6% 4 years 4.81% 2.98%
13 $0.26 $0.26 91.0% 6 years 4.81% 3.45%
14 $0.26 $0.30 62.0% 2 years − 2.71%
26.4 Movements in share options and balance outstanding
2015 2014
Number of options
Weighted average
exercise price $
Number of options
Weighted average
exercise price $
Balance at beginning of the financial year 21,361,884 $0.24 16,138,661 $0.39
Granted during the financial year – – 15,250,000 $0.26
Forfeited during the financial year (64,000) $2.10 (10,025,000) $0.23
Exercised during the financial year (1,777) $1.00 (1,777) $1.00
Balance at end of the financial year 21,296,107 $0.39 21,361,884 $0.24
Exercisable at end of the financial year(i) 11,296,108 $0.48 6,111,884 $0.24
(i) Shares have been issued and subject to repayment of limited recourse loans Unvested share options have a weighted average remaining contractual life of 1,095 days (2014: 1,460 days). Vested share options with limited recourse loans outstanding have no maturity date and thus have an indefinite contractual life.
For
per
sona
l use
onl
y
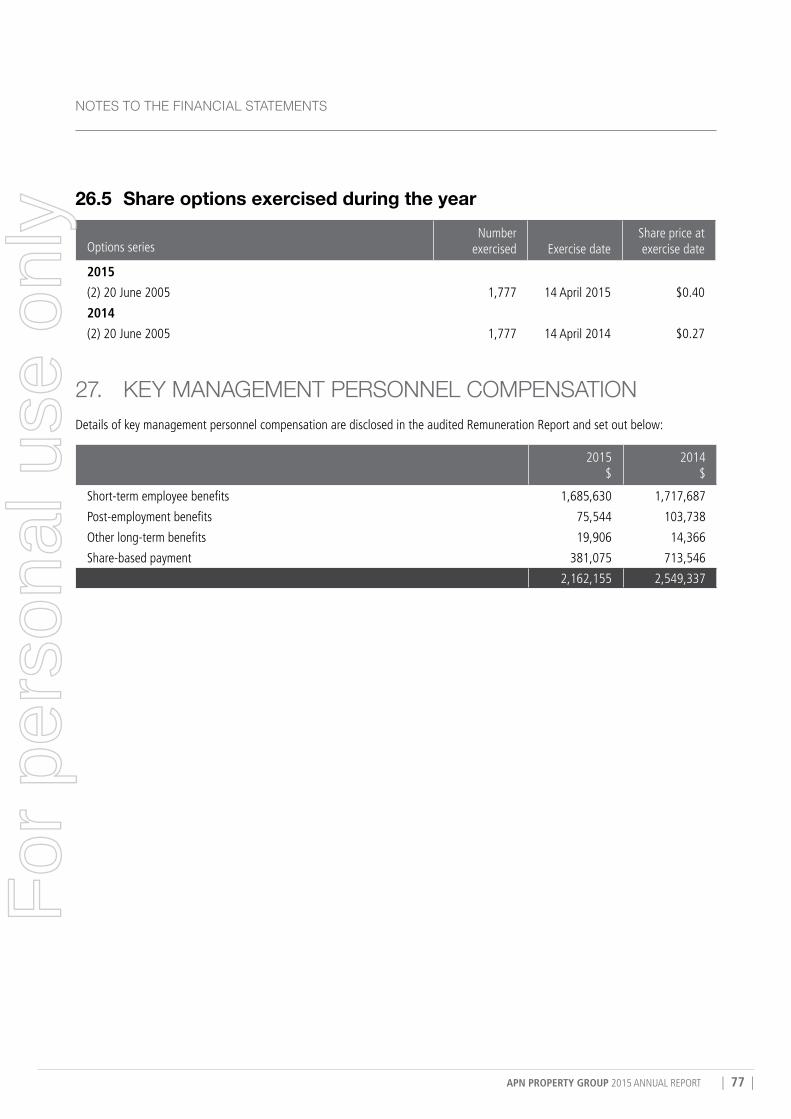
APN PROPERTY GROUP 2015 ANNUAL REPORT | 77 |
NoTES To THE FINANCIAL STATEMENTS
26.5 Share options exercised during the year
Options seriesNumber
exercised Exercise dateShare price at exercise date
2015
(2) 20 June 2005 1,777 14 April 2015 $0.40
2014
(2) 20 June 2005 1,777 14 April 2014 $0.27
27. kEy MANAGEMENT PErSoNNEL CoMPENSATIoNDetails of key management personnel compensation are disclosed in the audited Remuneration Report and set out below:
2015 $
2014 $
Short-term employee benefits 1,685,630 1,717,687
Post-employment benefits 75,544 103,738
Other long-term benefits 19,906 14,366
Share-based payment 381,075 713,546
2,162,155 2,549,337
For
per
sona
l use
onl
y
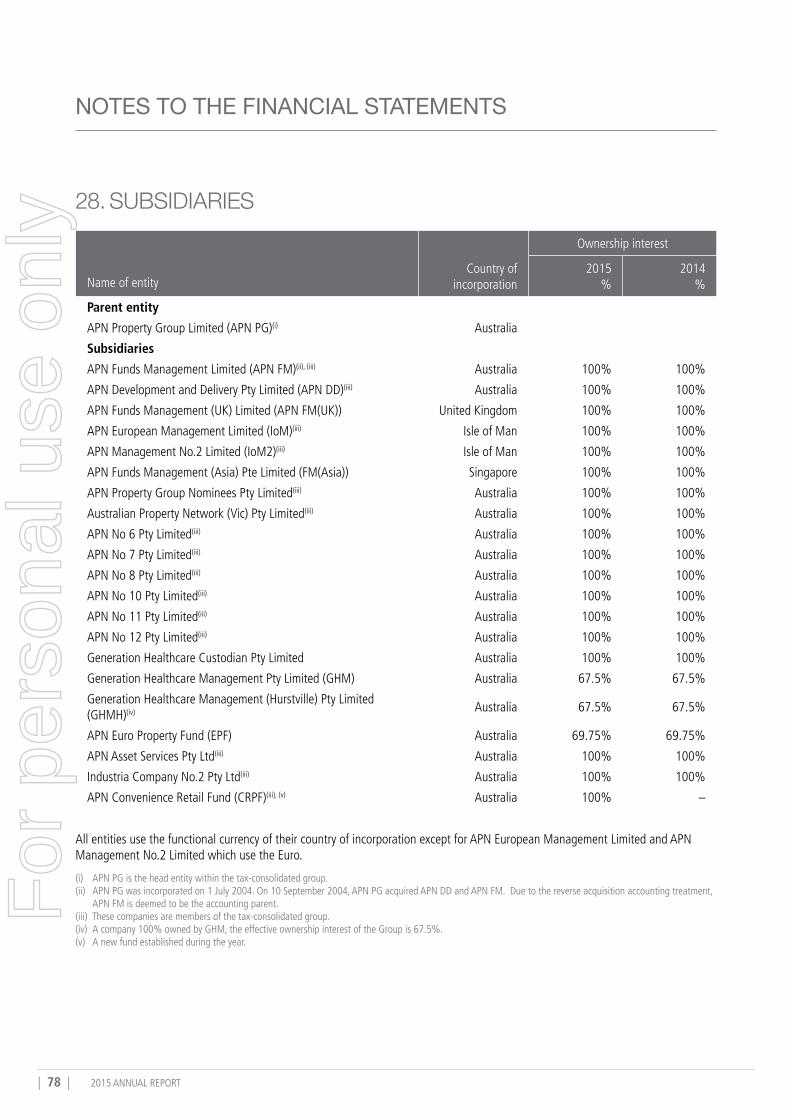
| 78 | 2015 ANNUAL REPORT
NOTES TO THE FINANCIAL STATEMENTS
28. SuBSIDIArIES
Name of entityCountry of
incorporation
Ownership interest
2015 %
2014 %
Parent entity
APN Property Group Limited (APN PG)(i) Australia
Subsidiaries
APN Funds Management Limited (APN FM)(ii), (iii) Australia 100% 100%
APN Development and Delivery Pty Limited (APN DD)(iii) Australia 100% 100%
APN Funds Management (UK) Limited (APN FM(UK)) United Kingdom 100% 100%
APN European Management Limited (IoM)(iii) Isle of Man 100% 100%
APN Management No.2 Limited (IoM2)(iii) Isle of Man 100% 100%
APN Funds Management (Asia) Pte Limited (FM(Asia)) Singapore 100% 100%
APN Property Group Nominees Pty Limited(iii) Australia 100% 100%
Australian Property Network (Vic) Pty Limited(iii) Australia 100% 100%
APN No 6 Pty Limited(iii) Australia 100% 100%
APN No 7 Pty Limited(iii) Australia 100% 100%
APN No 8 Pty Limited(iii) Australia 100% 100%
APN No 10 Pty Limited(iii) Australia 100% 100%
APN No 11 Pty Limited(iii) Australia 100% 100%
APN No 12 Pty Limited(iii) Australia 100% 100%
Generation Healthcare Custodian Pty Limited Australia 100% 100%
Generation Healthcare Management Pty Limited (GHM) Australia 67.5% 67.5%
Generation Healthcare Management (Hurstville) Pty Limited (GHMH)(iv) Australia 67.5% 67.5%
APN Euro Property Fund (EPF) Australia 69.75% 69.75%
APN Asset Services Pty Ltd(iii) Australia 100% 100%
Industria Company No.2 Pty Ltd(iii) Australia 100% 100%
APN Convenience Retail Fund (CRPF)(iii), (v) Australia 100% –
All entities use the functional currency of their country of incorporation except for APN European Management Limited and APN Management No.2 Limited which use the Euro.
(i) APN PG is the head entity within the tax-consolidated group.(ii) APN PG was incorporated on 1 July 2004. On 10 September 2004, APN PG acquired APN DD and APN FM. Due to the reverse acquisition accounting treatment,
APN FM is deemed to be the accounting parent.(iii) These companies are members of the tax-consolidated group.(iv) A company 100% owned by GHM, the effective ownership interest of the Group is 67.5%.(v) A new fund established during the year.
For
per
sona
l use
onl
y
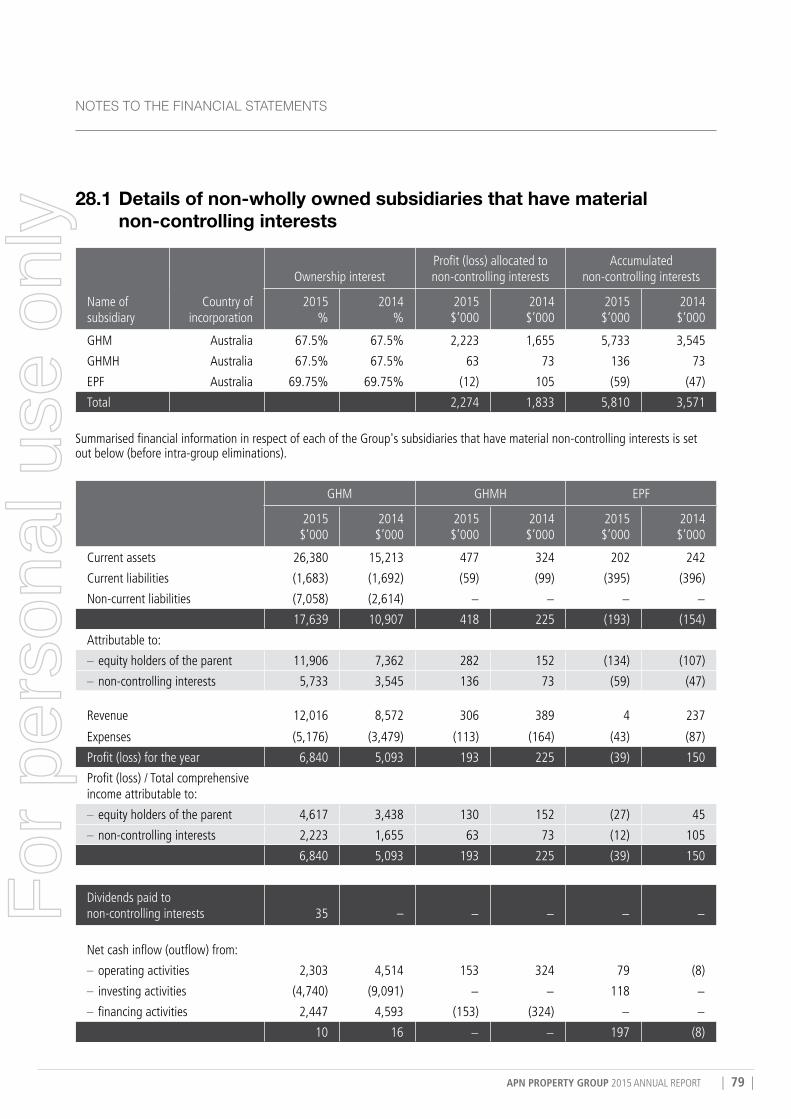
APN PROPERTY GROUP 2015 ANNUAL REPORT | 79 |
NoTES To THE FINANCIAL STATEMENTS
28.1 Details of non-wholly owned subsidiaries that have material non-controlling interests
Name of subsidiary
Country of incorporation
Ownership interestProfit (loss) allocated to non-controlling interests
Accumulated non-controlling interests
2015 %
2014 %
2015 $’000
2014 $’000
2015 $’000
2014 $’000
GHM Australia 67.5% 67.5% 2,223 1,655 5,733 3,545
GHMH Australia 67.5% 67.5% 63 73 136 73
EPF Australia 69.75% 69.75% (12) 105 (59) (47)
Total 2,274 1,833 5,810 3,571
Summarised financial information in respect of each of the Group's subsidiaries that have material non-controlling interests is set out below (before intra-group eliminations).
GHM GHMH EPF
2015 $’000
2014 $’000
2015 $’000
2014 $’000
2015 $’000
2014 $’000
Current assets 26,380 15,213 477 324 202 242
Current liabilities (1,683) (1,692) (59) (99) (395) (396)
Non-current liabilities (7,058) (2,614) − − − −
17,639 10,907 418 225 (193) (154)
Attributable to:
– equity holders of the parent 11,906 7,362 282 152 (134) (107)
– non-controlling interests 5,733 3,545 136 73 (59) (47)
Revenue 12,016 8,572 306 389 4 237
Expenses (5,176) (3,479) (113) (164) (43) (87)
Profit (loss) for the year 6,840 5,093 193 225 (39) 150
Profit (loss) / Total comprehensive income attributable to:
– equity holders of the parent 4,617 3,438 130 152 (27) 45
– non-controlling interests 2,223 1,655 63 73 (12) 105
6,840 5,093 193 225 (39) 150
Dividends paid to non-controlling interests 35 – − − − −
Net cash inflow (outflow) from:
– operating activities 2,303 4,514 153 324 79 (8)
– investing activities (4,740) (9,091) − − 118 −
– financing activities 2,447 4,593 (153) (324) − −
10 16 − − 197 (8)
For
per
sona
l use
onl
y
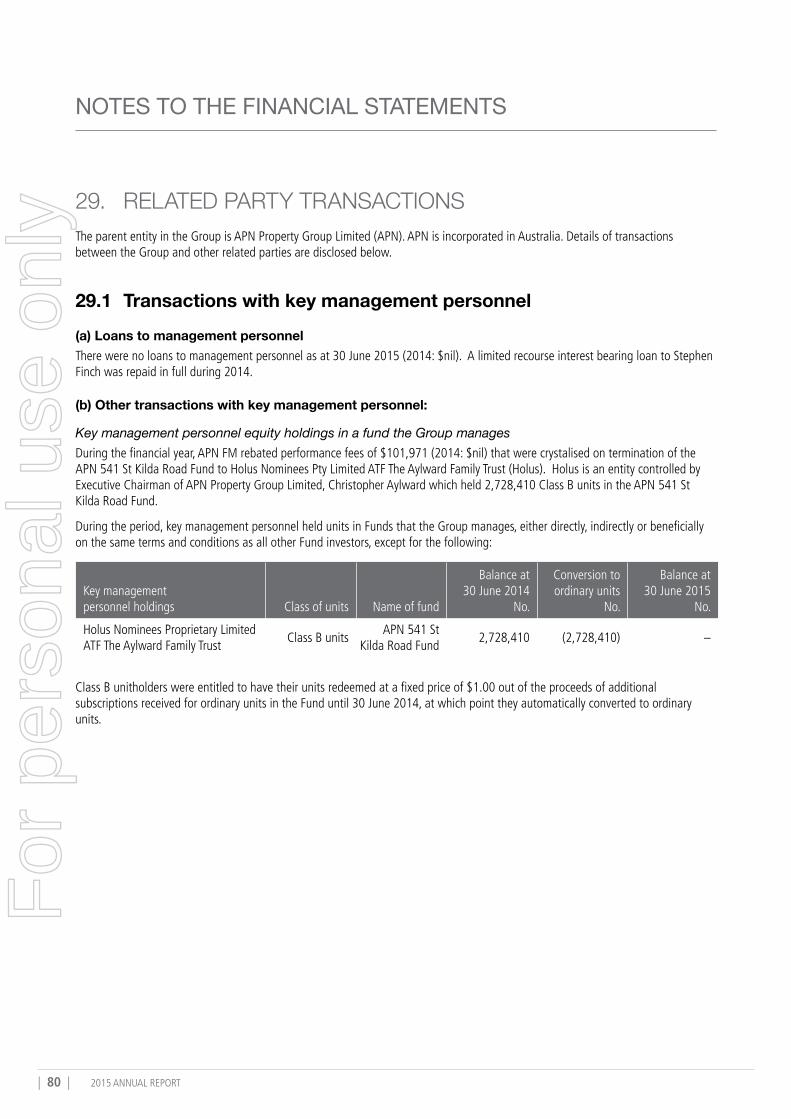
| 80 | 2015 ANNUAL REPORT
NOTES TO THE FINANCIAL STATEMENTS
29. rELATED PArTy TrANSACTIoNSThe parent entity in the Group is APN Property Group Limited (APN). APN is incorporated in Australia. Details of transactions between the Group and other related parties are disclosed below.
29.1 Transactions with key management personnel(a) Loans to management personnel There were no loans to management personnel as at 30 June 2015 (2014: $nil). A limited recourse interest bearing loan to Stephen Finch was repaid in full during 2014.
(b) Other transactions with key management personnel:
Key management personnel equity holdings in a fund the Group managesDuring the financial year, APN FM rebated performance fees of $101,971 (2014: $nil) that were crystalised on termination of the APN 541 St Kilda Road Fund to Holus Nominees Pty Limited ATF The Aylward Family Trust (Holus). Holus is an entity controlled by Executive Chairman of APN Property Group Limited, Christopher Aylward which held 2,728,410 Class B units in the APN 541 St Kilda Road Fund.
During the period, key management personnel held units in Funds that the Group manages, either directly, indirectly or beneficially on the same terms and conditions as all other Fund investors, except for the following:
Key management personnel holdings Class of units Name of fund
Balance at 30 June 2014
No.
Conversion to ordinary units
No.
Balance at 30 June 2015
No.
Holus Nominees Proprietary Limited ATF The Aylward Family Trust
Class B unitsAPN 541 St
Kilda Road Fund2,728,410 (2,728,410) –
Class B unitholders were entitled to have their units redeemed at a fixed price of $1.00 out of the proceeds of additional subscriptions received for ordinary units in the Fund until 30 June 2014, at which point they automatically converted to ordinary units.
For
per
sona
l use
onl
y
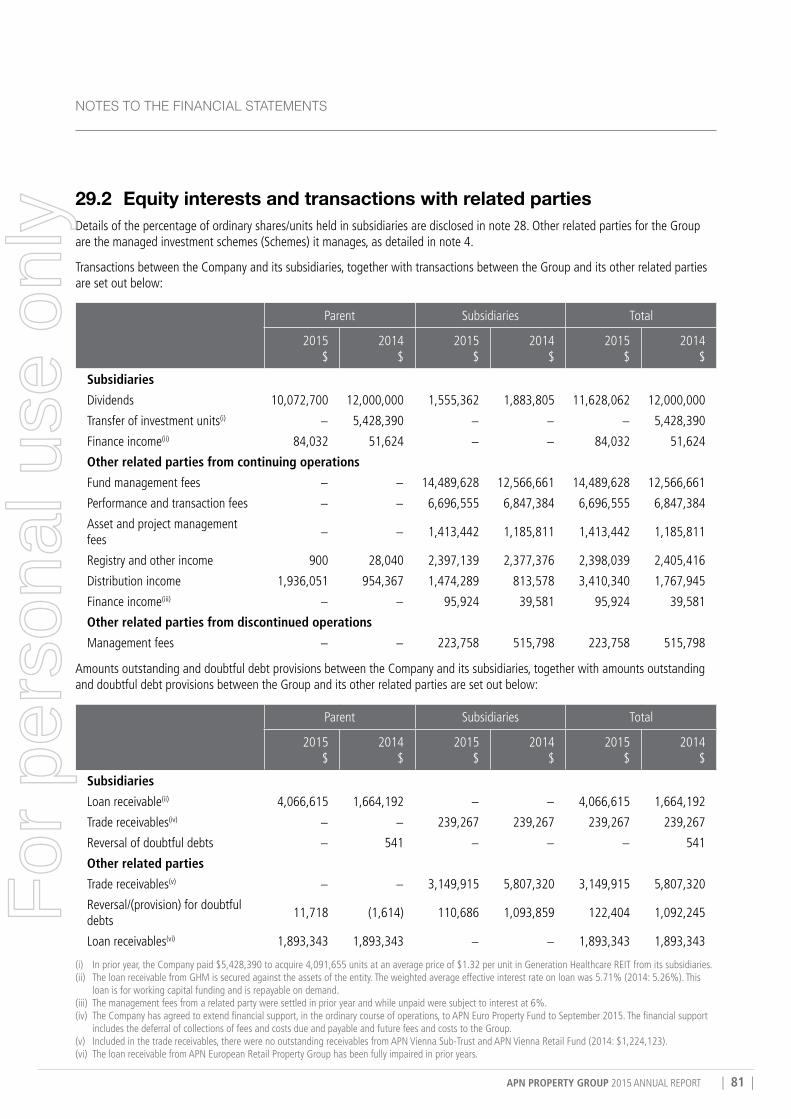
APN PROPERTY GROUP 2015 ANNUAL REPORT | 81 |
NoTES To THE FINANCIAL STATEMENTS
29.2 Equity interests and transactions with related partiesDetails of the percentage of ordinary shares/units held in subsidiaries are disclosed in note 28. Other related parties for the Group are the managed investment schemes (Schemes) it manages, as detailed in note 4.
Transactions between the Company and its subsidiaries, together with transactions between the Group and its other related parties are set out below:
Parent Subsidiaries Total
2015 $
2014 $
2015 $
2014 $
2015 $
2014 $
Subsidiaries
Dividends 10,072,700 12,000,000 1,555,362 1,883,805 11,628,062 12,000,000
Transfer of investment units(i) − 5,428,390 − − − 5,428,390
Finance income(ii) 84,032 51,624 − − 84,032 51,624
Other related parties from continuing operations
Fund management fees − − 14,489,628 12,566,661 14,489,628 12,566,661
Performance and transaction fees − − 6,696,555 6,847,384 6,696,555 6,847,384
Asset and project management fees
− − 1,413,442 1,185,811 1,413,442 1,185,811
Registry and other income 900 28,040 2,397,139 2,377,376 2,398,039 2,405,416
Distribution income 1,936,051 954,367 1,474,289 813,578 3,410,340 1,767,945
Finance income(iii) − − 95,924 39,581 95,924 39,581
Other related parties from discontinued operations
Management fees − − 223,758 515,798 223,758 515,798
Amounts outstanding and doubtful debt provisions between the Company and its subsidiaries, together with amounts outstanding and doubtful debt provisions between the Group and its other related parties are set out below:
Parent Subsidiaries Total
2015 $
2014 $
2015 $
2014 $
2015 $
2014 $
Subsidiaries
Loan receivable(ii) 4,066,615 1,664,192 − − 4,066,615 1,664,192
Trade receivables(iv) − − 239,267 239,267 239,267 239,267
Reversal of doubtful debts − 541 − − − 541
Other related parties
Trade receivables(v) − − 3,149,915 5,807,320 3,149,915 5,807,320
Reversal/(provision) for doubtful debts
11,718 (1,614) 110,686 1,093,859 122,404 1,092,245
Loan receivables(vi) 1,893,343 1,893,343 − − 1,893,343 1,893,343
(i) In prior year, the Company paid $5,428,390 to acquire 4,091,655 units at an average price of $1.32 per unit in Generation Healthcare REIT from its subsidiaries. (ii) The loan receivable from GHM is secured against the assets of the entity. The weighted average effective interest rate on loan was 5.71% (2014: 5.26%). This
loan is for working capital funding and is repayable on demand. (iii) The management fees from a related party were settled in prior year and while unpaid were subject to interest at 6%.(iv) The Company has agreed to extend financial support, in the ordinary course of operations, to APN Euro Property Fund to September 2015. The financial support
includes the deferral of collections of fees and costs due and payable and future fees and costs to the Group. (v) Included in the trade receivables, there were no outstanding receivables from APN Vienna Sub-Trust and APN Vienna Retail Fund (2014: $1,224,123). (vi) The loan receivable from APN European Retail Property Group has been fully impaired in prior years.
For
per
sona
l use
onl
y
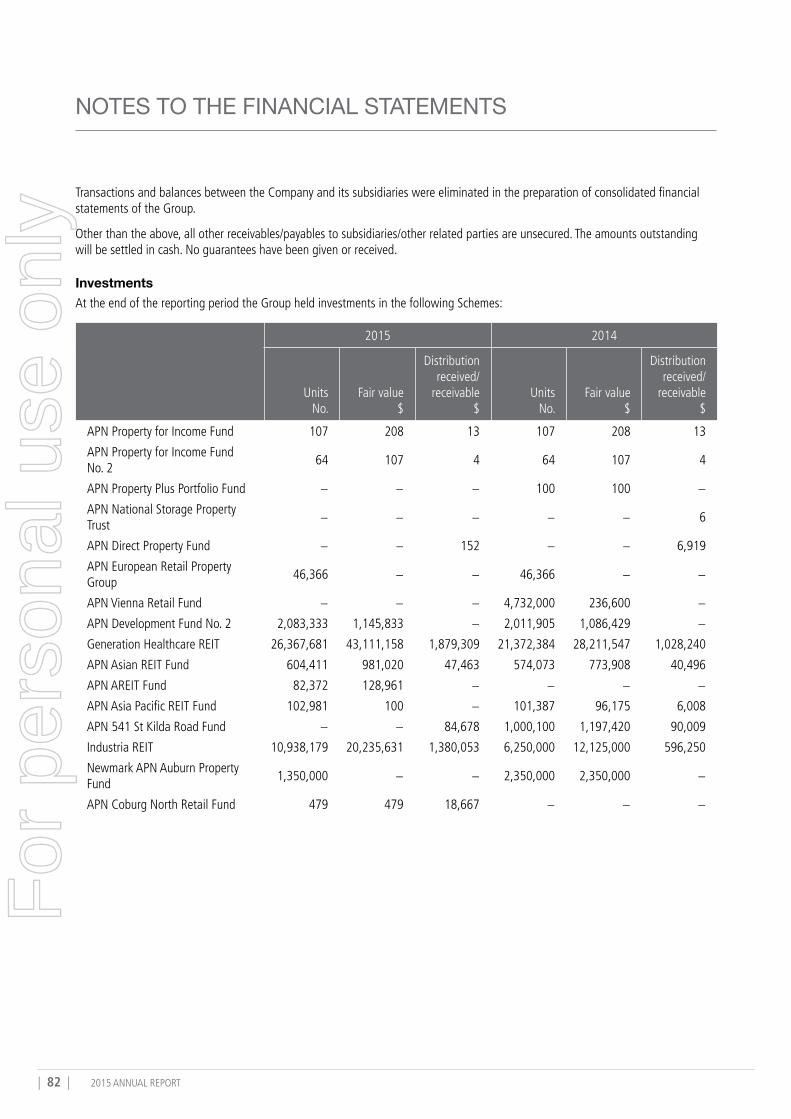
| 82 | 2015 ANNUAL REPORT
NOTES TO THE FINANCIAL STATEMENTS
Transactions and balances between the Company and its subsidiaries were eliminated in the preparation of consolidated financial statements of the Group.
Other than the above, all other receivables/payables to subsidiaries/other related parties are unsecured. The amounts outstanding will be settled in cash. No guarantees have been given or received.
InvestmentsAt the end of the reporting period the Group held investments in the following Schemes:
2015 2014
Units No.
Fair value $
Distribution received/
receivable $
Units No.
Fair value $
Distribution received/
receivable $
APN Property for Income Fund 107 208 13 107 208 13
APN Property for Income Fund No. 2
64 107 4 64 107 4
APN Property Plus Portfolio Fund − − − 100 100 −
APN National Storage Property Trust
− − − − − 6
APN Direct Property Fund − − 152 − − 6,919
APN European Retail Property Group
46,366 − − 46,366 − −
APN Vienna Retail Fund − − − 4,732,000 236,600 −
APN Development Fund No. 2 2,083,333 1,145,833 − 2,011,905 1,086,429 −
Generation Healthcare REIT 26,367,681 43,111,158 1,879,309 21,372,384 28,211,547 1,028,240
APN Asian REIT Fund 604,411 981,020 47,463 574,073 773,908 40,496
APN AREIT Fund 82,372 128,961 − − − −
APN Asia Pacific REIT Fund 102,981 100 − 101,387 96,175 6,008
APN 541 St Kilda Road Fund − − 84,678 1,000,100 1,197,420 90,009
Industria REIT 10,938,179 20,235,631 1,380,053 6,250,000 12,125,000 596,250
Newmark APN Auburn Property Fund
1,350,000 − − 2,350,000 2,350,000 −
APN Coburg North Retail Fund 479 479 18,667 − − −
For
per
sona
l use
onl
y
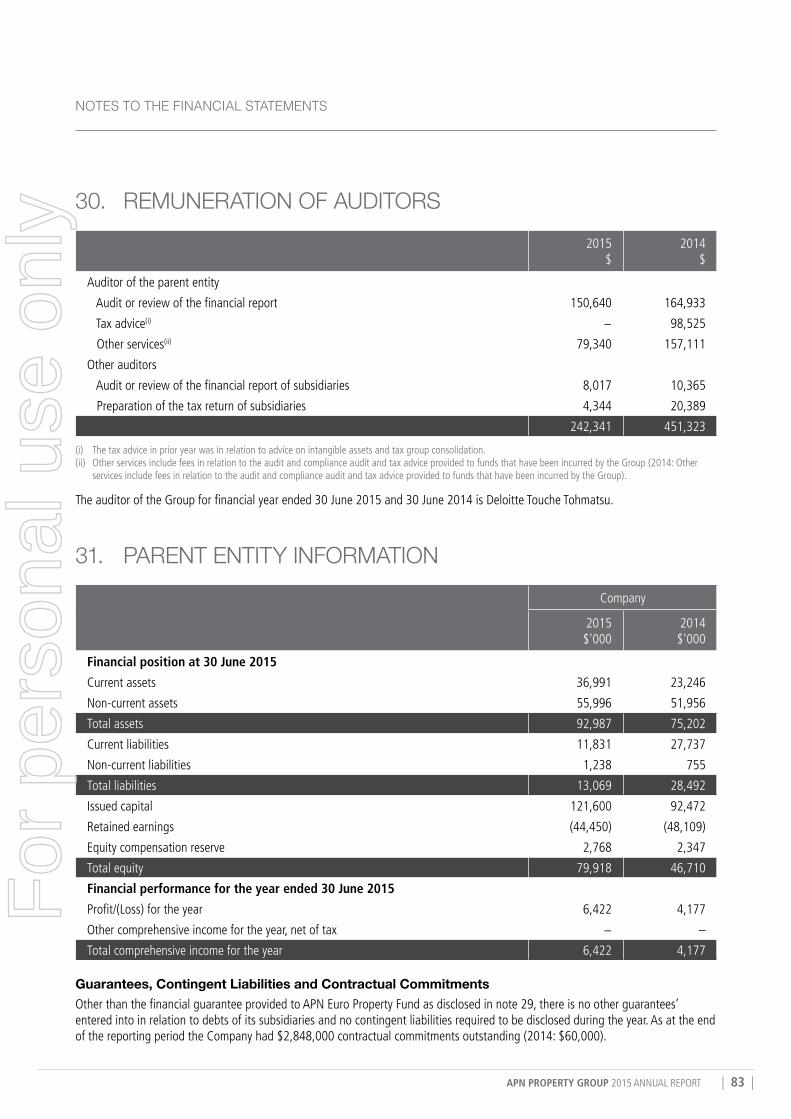
APN PROPERTY GROUP 2015 ANNUAL REPORT | 83 |
NoTES To THE FINANCIAL STATEMENTS
30. rEMuNErATIoN oF AuDITorS2015
$2014
$
Auditor of the parent entity
Audit or review of the financial report 150,640 164,933
Tax advice(i) − 98,525
Other services(ii) 79,340 157,111
Other auditors
Audit or review of the financial report of subsidiaries 8,017 10,365
Preparation of the tax return of subsidiaries 4,344 20,389
242,341 451,323
(i) The tax advice in prior year was in relation to advice on intangible assets and tax group consolidation.(ii) Other services include fees in relation to the audit and compliance audit and tax advice provided to funds that have been incurred by the Group (2014: Other
services include fees in relation to the audit and compliance audit and tax advice provided to funds that have been incurred by the Group). The auditor of the Group for financial year ended 30 June 2015 and 30 June 2014 is Deloitte Touche Tohmatsu.
31. PArENT ENTITy INForMATIoNCompany
2015 $'000
2014 $'000
Financial position at 30 June 2015
Current assets 36,991 23,246
Non-current assets 55,996 51,956
Total assets 92,987 75,202
Current liabilities 11,831 27,737
Non-current liabilities 1,238 755
Total liabilities 13,069 28,492
Issued capital 121,600 92,472
Retained earnings (44,450) (48,109)
Equity compensation reserve 2,768 2,347
Total equity 79,918 46,710
Financial performance for the year ended 30 June 2015
Profit/(Loss) for the year 6,422 4,177
Other comprehensive income for the year, net of tax − –
Total comprehensive income for the year 6,422 4,177
Guarantees, Contingent Liabilities and Contractual CommitmentsOther than the financial guarantee provided to APN Euro Property Fund as disclosed in note 29, there is no other guarantees’ entered into in relation to debts of its subsidiaries and no contingent liabilities required to be disclosed during the year. As at the end of the reporting period the Company had $2,848,000 contractual commitments outstanding (2014: $60,000).
For
per
sona
l use
onl
y
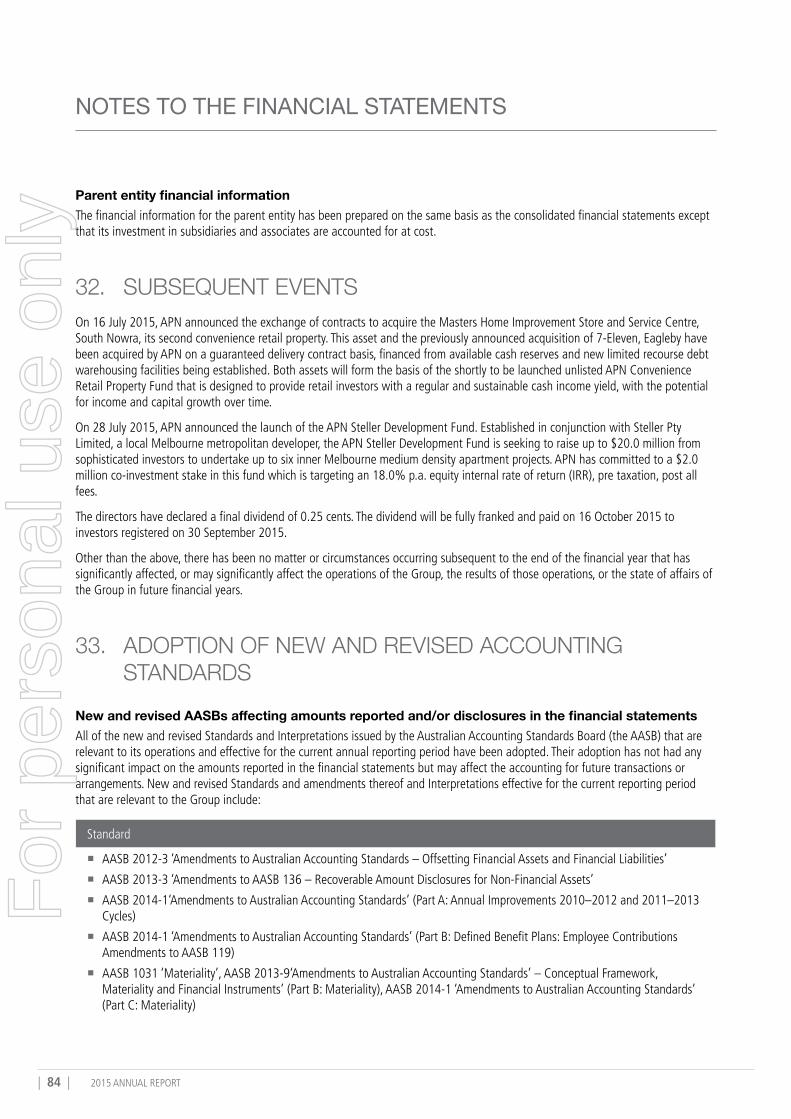
| 84 | 2015 ANNUAL REPORT
NOTES TO THE FINANCIAL STATEMENTS
Parent entity financial informationThe financial information for the parent entity has been prepared on the same basis as the consolidated financial statements except that its investment in subsidiaries and associates are accounted for at cost.
32. SuBSEquENT EvENTSOn 16 July 2015, APN announced the exchange of contracts to acquire the Masters Home Improvement Store and Service Centre, South Nowra, its second convenience retail property. This asset and the previously announced acquisition of 7-Eleven, Eagleby have been acquired by APN on a guaranteed delivery contract basis, financed from available cash reserves and new limited recourse debt warehousing facilities being established. Both assets will form the basis of the shortly to be launched unlisted APN Convenience Retail Property Fund that is designed to provide retail investors with a regular and sustainable cash income yield, with the potential for income and capital growth over time.
On 28 July 2015, APN announced the launch of the APN Steller Development Fund. Established in conjunction with Steller Pty Limited, a local Melbourne metropolitan developer, the APN Steller Development Fund is seeking to raise up to $20.0 million from sophisticated investors to undertake up to six inner Melbourne medium density apartment projects. APN has committed to a $2.0 million co-investment stake in this fund which is targeting an 18.0% p.a. equity internal rate of return (IRR), pre taxation, post all fees.
The directors have declared a final dividend of 0.25 cents. The dividend will be fully franked and paid on 16 October 2015 to investors registered on 30 September 2015.
Other than the above, there has been no matter or circumstances occurring subsequent to the end of the financial year that has significantly affected, or may significantly affect the operations of the Group, the results of those operations, or the state of affairs of the Group in future financial years.
33. ADoPTIoN oF NEW AND rEvISED ACCouNTING STANDArDSNew and revised AASBs affecting amounts reported and/or disclosures in the financial statementsAll of the new and revised Standards and Interpretations issued by the Australian Accounting Standards Board (the AASB) that are relevant to its operations and effective for the current annual reporting period have been adopted. Their adoption has not had any significant impact on the amounts reported in the financial statements but may affect the accounting for future transactions or arrangements. New and revised Standards and amendments thereof and Interpretations effective for the current reporting period that are relevant to the Group include:
Standard
� AASB 2012-3 ‘Amendments to Australian Accounting Standards – Offsetting Financial Assets and Financial Liabilities’
� AASB 2013-3 ‘Amendments to AASB 136 – Recoverable Amount Disclosures for Non-Financial Assets’
� AASB 2014-1‘Amendments to Australian Accounting Standards’ (Part A: Annual Improvements 2010–2012 and 2011–2013 Cycles)
� AASB 2014-1 ‘Amendments to Australian Accounting Standards’ (Part B: Defined Benefit Plans: Employee Contributions Amendments to AASB 119)
� AASB 1031 ‘Materiality’, AASB 2013-9‘Amendments to Australian Accounting Standards’ – Conceptual Framework, Materiality and Financial Instruments’ (Part B: Materiality), AASB 2014-1 ‘Amendments to Australian Accounting Standards’ (Part C: Materiality)
For
per
sona
l use
onl
y
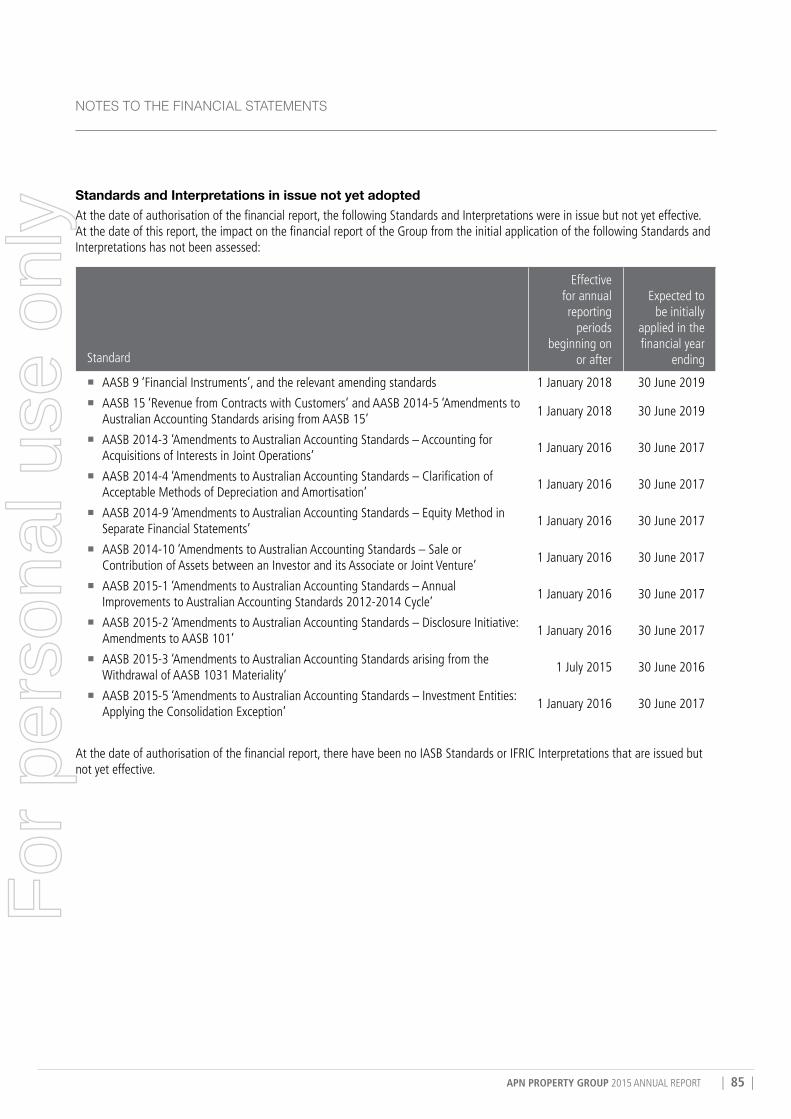
APN PROPERTY GROUP 2015 ANNUAL REPORT | 85 |
NoTES To THE FINANCIAL STATEMENTS
Standards and Interpretations in issue not yet adoptedAt the date of authorisation of the financial report, the following Standards and Interpretations were in issue but not yet effective. At the date of this report, the impact on the financial report of the Group from the initial application of the following Standards and Interpretations has not been assessed:
Standard
Effective for annual reporting
periods beginning on
or after
Expected to be initially
applied in the financial year
ending
� AASB 9 ‘Financial Instruments’, and the relevant amending standards 1 January 2018 30 June 2019
� AASB 15 ‘Revenue from Contracts with Customers’ and AASB 2014-5 ‘Amendments to Australian Accounting Standards arising from AASB 15’
1 January 2018 30 June 2019
� AASB 2014-3 ‘Amendments to Australian Accounting Standards – Accounting for Acquisitions of Interests in Joint Operations’
1 January 2016 30 June 2017
� AASB 2014-4 ‘Amendments to Australian Accounting Standards – Clarification of Acceptable Methods of Depreciation and Amortisation’
1 January 2016 30 June 2017
� AASB 2014-9 ‘Amendments to Australian Accounting Standards – Equity Method in Separate Financial Statements’
1 January 2016 30 June 2017
� AASB 2014-10 ‘Amendments to Australian Accounting Standards – Sale or Contribution of Assets between an Investor and its Associate or Joint Venture’
1 January 2016 30 June 2017
� AASB 2015-1 ‘Amendments to Australian Accounting Standards – Annual Improvements to Australian Accounting Standards 2012-2014 Cycle’
1 January 2016 30 June 2017
� AASB 2015-2 ‘Amendments to Australian Accounting Standards – Disclosure Initiative: Amendments to AASB 101’
1 January 2016 30 June 2017
� AASB 2015-3 ‘Amendments to Australian Accounting Standards arising from the Withdrawal of AASB 1031 Materiality’
1 July 2015 30 June 2016
� AASB 2015-5 ‘Amendments to Australian Accounting Standards – Investment Entities: Applying the Consolidation Exception’
1 January 2016 30 June 2017
At the date of authorisation of the financial report, there have been no IASB Standards or IFRIC Interpretations that are issued but not yet effective.
For
per
sona
l use
onl
y
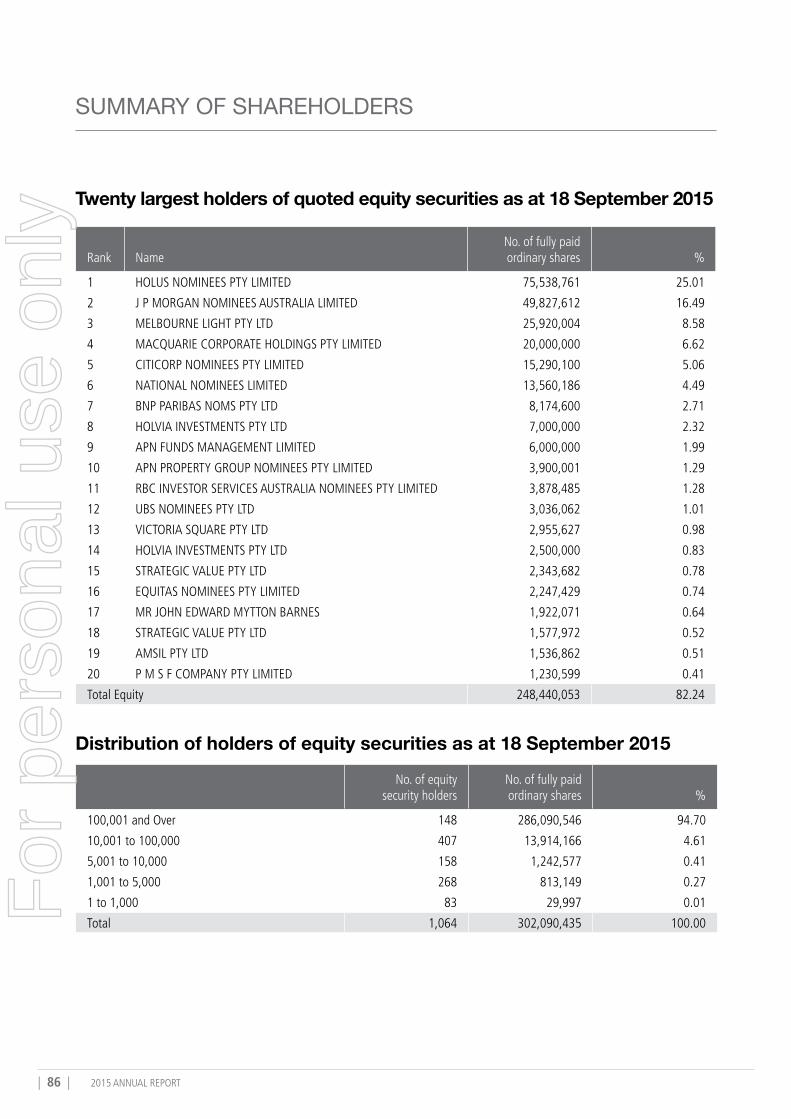
| 86 | 2015 ANNUAL REPORT
Twenty largest holders of quoted equity securities as at 18 September 2015
Rank NameNo. of fully paid ordinary shares %
1 HOLUS NOMINEES PTY LIMITED 75,538,761 25.01
2 J P MORGAN NOMINEES AUSTRALIA LIMITED 49,827,612 16.49
3 MELBOURNE LIGHT PTY LTD 25,920,004 8.58
4 MACQUARIE CORPORATE HOLDINGS PTY LIMITED 20,000,000 6.62
5 CITICORP NOMINEES PTY LIMITED 15,290,100 5.06
6 NATIONAL NOMINEES LIMITED 13,560,186 4.49
7 BNP PARIBAS NOMS PTY LTD 8,174,600 2.71
8 HOLVIA INVESTMENTS PTY LTD 7,000,000 2.32
9 APN FUNDS MANAGEMENT LIMITED 6,000,000 1.99
10 APN PROPERTY GROUP NOMINEES PTY LIMITED 3,900,001 1.29
11 RBC INVESTOR SERVICES AUSTRALIA NOMINEES PTY LIMITED 3,878,485 1.28
12 UBS NOMINEES PTY LTD 3,036,062 1.01
13 VICTORIA SQUARE PTY LTD 2,955,627 0.98
14 HOLVIA INVESTMENTS PTY LTD 2,500,000 0.83
15 STRATEGIC VALUE PTY LTD 2,343,682 0.78
16 EQUITAS NOMINEES PTY LIMITED 2,247,429 0.74
17 MR JOHN EDWARD MYTTON BARNES 1,922,071 0.64
18 STRATEGIC VALUE PTY LTD 1,577,972 0.52
19 AMSIL PTY LTD 1,536,862 0.51
20 P M S F COMPANY PTY LIMITED 1,230,599 0.41
Total Equity 248,440,053 82.24
Distribution of holders of equity securities as at 18 September 2015
No. of equity security holders
No. of fully paid ordinary shares %
100,001 and Over 148 286,090,546 94.70
10,001 to 100,000 407 13,914,166 4.61
5,001 to 10,000 158 1,242,577 0.41
1,001 to 5,000 268 813,149 0.27
1 to 1,000 83 29,997 0.01
Total 1,064 302,090,435 100.00
SUMMARY OF SHAREHOLDERS
For
per
sona
l use
onl
y
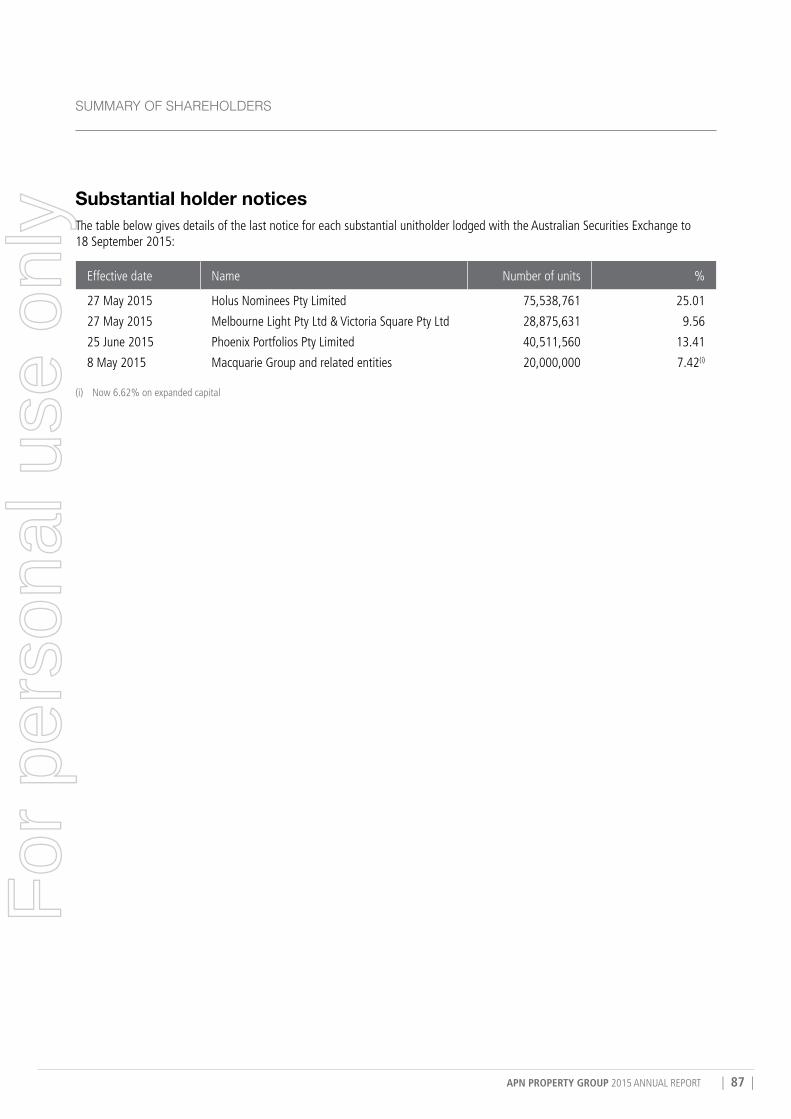
APN PROPERTY GROUP 2015 ANNUAL REPORT | 87 |
Substantial holder notices The table below gives details of the last notice for each substantial unitholder lodged with the Australian Securities Exchange to 18 September 2015:
Effective date Name Number of units %
27 May 2015 Holus Nominees Pty Limited 75,538,761 25.01
27 May 2015 Melbourne Light Pty Ltd & Victoria Square Pty Ltd 28,875,631 9.56
25 June 2015 Phoenix Portfolios Pty Limited 40,511,560 13.41
8 May 2015 Macquarie Group and related entities 20,000,000 7.42(i)
(i) Now 6.62% on expanded capital
SUMMARY oF SHAREHoLdERS
For
per
sona
l use
onl
y

| 88 | 2015 ANNUAL REPORT
On-market buy-backThere is no current on-market buy-back.
Company secretaryJohn Freemantle
Registered officeAPN Property Group LimitedLevel 30101 Collins StreetMelbourne VIC 3000Telephone: (03) 8656 1000Email: [email protected]: apngroup.com.au
Principal administration officeAPN Property Group LimitedLevel 30101 Collins StreetMelbourne VIC 3000Telephone: (03) 8656 1000Website: apngroup.com.au
Share registryLink Market Services LimitedLevel 12, 680 George StreetSydney NSW 2000Telephone: 1300 554 474 (toll free within Australia)Telephone: (02) 8280 7100Facsimile: (02) 9287 0303 www.linkmarketservices.com.au
Postal Address:Locked Bag A14Sydney South NSW 1235
Auditor
Deloitte Touche Tohmatsu550 Bourke Street Melbourne VIC 3000
For
per
sona
l use
onl
y

APN PROPERTY GROUP 2015 ANNUAL REPORT | 89 |
2015For
per
sona
l use
onl
y

APN Property Group LimitedLevel 30, 101 Collins Street,Melbourne, Victoria 3000
Telephone (03) 8656 1000Email [email protected] apngroup.com.au
ABN 30 109 846 068
2015
For
per
sona
l use
onl
y