Embed Size (px)
Citation preview
2015 Annual Report
MARYLANDHEALTHBENEFIT E CHANGE
2015 Maryland Health Benefit Exchange Annual Report
The Maryland Health Benefit Exchange (MHBE) is
responsible for Maryland Health Connection, the
state’s health insurance marketplace under the Patient
Protection and Affordable Care Act of 2010 (ACA). The
agency works with the Maryland Department of Health
and Mental Hygiene (DHMH), the Maryland Insurance
Administration (MIA), the Department of Human
Resources (DHR), and stakeholders statewide on the
goal of making health coverage affordable and more
accessible for Marylanders.
The Maryland Health Benefit Exchange Act of 2011
requires MHBE to forward to the Secretary of the U.S.
Department of Health and Human Services (HHS), the
Governor, and the Maryland General Assembly an annual
report on the activities, expenditures, and receipts of
the agency in a standardized format required by the
Secretary.1 Specifically, under state statute, MHBE is to
report on health plan participation, consumer choice and
participation, financial integrity, and the agency’s fraud,
waste, and abuse detection and prevention program.2
All data in this report is from the Maryland Health Benefit
Exchange unless otherwise noted.
1 Md. Code Ann., Ins. § 31-119(d).2 Md. Code Ann., Ins. § 31-119(d)(2)(ii).
Gov. Larry Hogan
Lt. Gov. Boyd K. Rutherford
MARYLAND HEALTH BENEFIT EXCHANGE BOARD OF TRUSTEES
Van T. Mitchell CHAIRMAN AND SECRETARY, MARYLAND DEPT. OF HEALTH AND MENTAL HYGIENE
Kenneth Apfel
Linda S. (Susie) Comer
Michelle A. Gourdine, M.D.
S. Anthony (Tony) McCannVICE CHAIRMAN
Alfred W. Redmer Jr.COMMISSIONER, MARYLAND INSURANCE ADMINISTRATION
Thomas Saquella
Ben Steffen EXECUTIVE DIRECTOR, MARYLAND HEALTH CARE COMMISSION
Sam Malhotra SECRETARY, MARYLAND DEPT. OF HUMAN RESOURCES (NON-VOTING)
Carolyn A. Quattrocki EXECUTIVE DIRECTOR, MARYLAND HEALTH BENEFIT EXCHANGE
Jonathan Kromm DEPUTY EXECUTIVE DIRECTOR, MARYLAND HEALTH BENEFIT EXCHANGE
Maryland Health Benefit Exchange 1
Table of Contents
1. Executive Summary 2
2. Plan and Partner Management 4
A. Plan Participation 4
B. Quality Ratings 4
C. Premiums 4
D. Plans and Benefits 5
E. Stand-Alone Dental Plans (SADPs) 5
F. Small Business Health Options Program (SHOP) 5
G. Advanced Premium Tax Credits (APTCs) 5
H. Tax Penalty 7
3. Consumer Assistance 8
A. Connector Entities 8
B. Application Counselor Sponsoring Entities (ACSEs) 10
C. Producer Operations 10
D. Appeals and Grievances 10
E. Call Center 11
4. Finance 13
A. Fee Assessments and Funding 13
B. MHBE Fund Status 13
5. Compliance 14
A. Fraud, Waste, and Abuse Detection 14
6. Marketing and Outreach 16
A. Marketing 16
B. Outreach 18
C. Research 18
7. Additional Data 20
A. CMS Enrollment Data 20
B. QHP Enrollment by Jurisdiction 33
C. QHP Enrollment by Jurisdiction and Metal Level 34
D. Demographic Enrollment Data 35
E. 2015 Open Enrollment by Day 38
2 2015 Annual Report
1. Executive SummaryMHBE continued to make strides in its second year in advancing health reform and health coverage for all in Maryland. Through its consumer-facing website MarylandHealthConnection.gov, enrollments in private Qualified Health Plans (QHP) increased by 83 percent in 2015 to roughly 120,000 enrollees. The two-year-old state-based marketplace for health coverage also processed more than 600,000 Medicaid enrollees as the state transferred from a two-decade-old legacy system to a more modern, web-based platform.
The rate of uninsured in Maryland, which hovered around 15 percent of the state’s population for most of the 2000s3, dropped to 7.9 percent4 in 2014 following the first full year of the state marketplace. Some outlets report a further reduction after the second year, estimating it as low as 4.9 percent.5
In 2015, about nine in 10 Marylanders who enrolled through Maryland Health Connection qualified for financial help to help lower or waive the cost of health coverage. Under the Affordable Care Act, Marylanders who are not eligible for qualifying health coverage, such as affordable employer-sponsored coverage or a government program such as Medicaid, may apply for an Advanced Premium Tax Credit, or APTC, to offset the cost of monthly insurance premiums. About 66,000 Maryland households that qualified in 2015 averaged $3,000 in total tax credits — more than $190 million statewide.6
For 2016, MarylandHealthConnection.gov improved with a more mobile-friendly site, a more streamlined application, and a star system to rate the quality of plans. The rating system, produced by the Maryland Health Benefit Exchange with the Maryland Health Care Commission, applies only to Maryland plans. In 2016, Marylanders can also enroll online in a dental-only plan or enroll in dental at the same time they enroll in a health plan. Maryland Health Connection offers family and child-only dental plans for 2016 — 18 plans in all from six participating dental insurers. For both the 2015 and 2016 open enrollments, Maryland was among the first states in the nation to roll out “anonymous browsing,” a popular feature that allows consumers to shop plans prior to creating an account.
“When I was 26,
I got kicked off
of my mom’s
health coverage
plan. I was able
to get no-cost
coverage that
fits my lifestyle
and has doctors
close by.”
— Nkosi, Bladensburg
3 Health Insurance Coverage in Maryland Through 2009, Maryland Health Care Commission, Jan. 2011.4 Press Release, U.S. Census Bureau, Sep. 16, 2015.5 How Obamacare Increased Insurance Coverage in Every State, 24/7 Wall Street, Jul. 31, 2015.6 66,000 Maryland households have received $140 million in tax credits to help them afford health coverage in
2015, Press Release, Maryland Health Benefit Exchange, Sep. 15, 2015.
Maryland Health Benefit Exchange 3
On July 21, 2015, Maryland Attorney General Brian E. Frosh announced7 that the prime contractor hired to build Maryland’s flawed health exchange website in 2013 will pay $45 million to avoid legal action over its performance. Noridian Healthcare Solutions LLC agreed to pay $20 million upfront, and an additional $25 million in annual installments of $5 million over five years. The payments represent a recovery of 61 percent of the total paid to the company for the failed web site development and launch in 2013. Noridian Healthcare Solutions’ parent company has agreed to guarantee at least $40 million of the settlement payment. Investigation of claims against other companies involved in the development and implementation of the Maryland marketplace is continuing.
The recovery and turnaround in the second year from the earlier technical problems were widely recognized by the media and industry organizations:
“The second year of Maryland’s health insurance marketplace was much more successful than its first.”
– The Washington Post8
“The turnaround in Maryland since the last time may be even more striking than the improvements to HealthCare.gov.”
— The Huffington Post9
“Maryland redeemed itself … the ‘Comeback Kid.’”
– FierceHealthPayer10
“If there was a most-improved public HIX award, Maryland Health Connection certainly would be in the running for such an honor.”
– Employee Benefit Adviser11
The extensive work in rebuilding the system for the 2015 open enrollment included reviewing, updating,
validating, and testing more than 2,500 business rules and 675,000 lines of code from the Connecticut system that Maryland adopted. The transition also required configuring the 8001 Medicaid enrollment transaction file and coordinating testing efforts between MHBE and DHMH to validate user enrollment and eligibility information. In recognition of its IT work, MHBE received the Recognition Award for Collaboration Across Boundaries at the IT Solutions Management for Human Services conference in Philadelphia in August 2015. The award was given by the American Public Human Services Association, a bipartisan, non-profit national organization representing chief executives in state and local human service agencies, public child welfare administrators and human service program leaders, and by IT Solutions Management for Human Services, an association of Health and Human Services information technology professionals representing federal, state, and local governments and the private sector.
The marketing campaign that first introduced the marketplace to the public and then worked to regain confidence in the rebuilt system also received regional and national recognition. The “Relaunch of Maryland Health Connection” won a Platinum 2015 MarCom Award, an international creative competition that recognizes outstanding achievement by marketing and communication professionals. Maryland Health Connection and Weber Shandwick, MHBE’s marketing firm in 2013-2015, also were named as a finalist for the 2015 SABRE Awards North America (for Superior Achievement in Branding, Reputation & Engagement), one of the public relations industry’s largest competitions. The “Launch (and Relaunch) of Maryland Health Connection” was also, at press time for this report, a finalist in the Public Relations Society of America 2015 Best in Maryland Awards program.
7 Prime Contractor for Maryland Health Benefit Exchange Web Site to Repay State $45 Million, Press Release, Maryland Attorney General, Jul. 21, 2015.8 Maryland health exchange’s second year much more successful than first, The Washington Post, Feb. 18, 2015.9 Rush Of Obamacare Enrollees Expected Before Sunday Deadline, The Huffington Post, Feb. 12, 2015.10 State exchange winners and losers from open enrollment round two, Fierce Health Payer, Apr. 1, 2015.11 Maryland HIX enrollment nearly doubles in half the time, Employee Benefit Adviser, Mar. 25, 2015.
4 2015 Annual Report
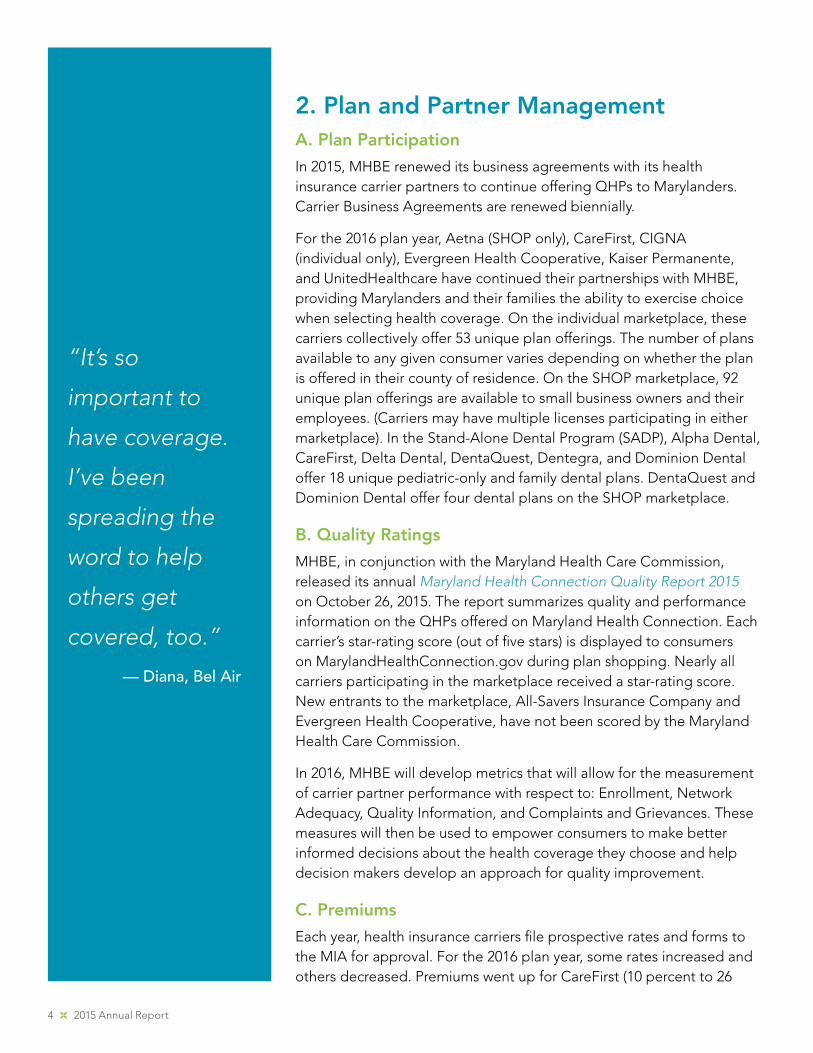
“It’s so
important to
have coverage.
I’ve been
spreading the
word to help
others get
covered, too.”
— Diana, Bel Air
2. Plan and Partner ManagementA. Plan Participation
In 2015, MHBE renewed its business agreements with its health insurance carrier partners to continue offering QHPs to Marylanders. Carrier Business Agreements are renewed biennially.
For the 2016 plan year, Aetna (SHOP only), CareFirst, CIGNA (individual only), Evergreen Health Cooperative, Kaiser Permanente, and UnitedHealthcare have continued their partnerships with MHBE, providing Marylanders and their families the ability to exercise choice when selecting health coverage. On the individual marketplace, these carriers collectively offer 53 unique plan offerings. The number of plans available to any given consumer varies depending on whether the plan is offered in their county of residence. On the SHOP marketplace, 92 unique plan offerings are available to small business owners and their employees. (Carriers may have multiple licenses participating in either marketplace). In the Stand-Alone Dental Program (SADP), Alpha Dental, CareFirst, Delta Dental, DentaQuest, Dentegra, and Dominion Dental offer 18 unique pediatric-only and family dental plans. DentaQuest and Dominion Dental offer four dental plans on the SHOP marketplace.
B. Quality Ratings
MHBE, in conjunction with the Maryland Health Care Commission, released its annual Maryland Health Connection Quality Report 2015 on October 26, 2015. The report summarizes quality and performance information on the QHPs offered on Maryland Health Connection. Each carrier’s star-rating score (out of five stars) is displayed to consumers on MarylandHealthConnection.gov during plan shopping. Nearly all carriers participating in the marketplace received a star-rating score. New entrants to the marketplace, All-Savers Insurance Company and Evergreen Health Cooperative, have not been scored by the Maryland Health Care Commission.
In 2016, MHBE will develop metrics that will allow for the measurement of carrier partner performance with respect to: Enrollment, Network Adequacy, Quality Information, and Complaints and Grievances. These measures will then be used to empower consumers to make better informed decisions about the health coverage they choose and help decision makers develop an approach for quality improvement.
C. Premiums
Each year, health insurance carriers file prospective rates and forms to the MIA for approval. For the 2016 plan year, some rates increased and others decreased. Premiums went up for CareFirst (10 percent to 26
Maryland Health Benefit Exchange 5
percent), Evergreen (10 percent, for some plans), and Kaiser Permanente (10 percent, for some plans). Premiums decreased for All Savers (-3 percent to -7 percent), Evergreen (-10 percent, for some plans), Kaiser Permanente (-14 percent, for some plans), Cigna (-3 percent), and UnitedHealthcare of the Mid-Atlantic (-1 percent).
Plan pricing has changed from when Maryland Health Connection began offering QHPs in 2014. Carriers that used to offer the most inexpensive plans may now be more expensive, while carriers that offered more cost-prohibitive plans may now be more competitive. For example, the carrier with four of the six least expensive Silver plans in 2014 (Rating Region 1) had none of the six least expensive Silver plans in 2016. Each year, Maryland Health Connection encourages consumers to shop for the plan that best suits their needs and maximizes their financial assistance.
D. Plans and Benefits
Among several notable trends, Health Savings Account (HSA)-eligible plans now account for more than 30 percent of all plans offered on the state-based marketplace, up from 22 percent in 2015. Such plans typically have higher deductibles (a minimum of $1,250 for an individual and $2,500 for a family) and lower premiums. Consumers’ tax-free funds in their HSAs may be used to pay the deductible and other qualified expenses. An indicator has been added to plan shopping on the website to assist consumers in determining which plans are HSA-eligible.
Also, Evergreen and UnitedHealthcare now offer narrow-network HMO plans. For 2016, 17 percent of plans offered on Maryland Health Connection are narrow network HMO plans, up from 10 percent in 2015. Such plans offer reduced choice among providers in-network as a tradeoff for reduced premium costs or increase benefits.
E. Stand-Alone Dental Plans (SADPs)
The state marketplace added Stand-Alone Dental Plans (SADPs) for 2016. Consumers may enroll in health and dental coverage at the same time. Five
dental carriers offer 18 unique pediatric-only and family SADPs. Also, Marylanders seeking dental coverage only may apply with a slimmed-down eligibility application. The only requirement to enroll in a dental plan on Maryland Health Connection is Maryland residency. All QHPs on Maryland Health Connection are required to offer embedded pediatric dental coverage.
F. Small Business Health Options Program (SHOP)
SHOP is entering its second year open to businesses with 50 or fewer full-time-equivalent employees. The program allows qualifying businesses to access a two-year tax credit from the Internal Revenue Service to help offset costs and provides more coverage options for employees. Three Third-Party Administrators (TPAs) were selected by MHBE in a competitive process to be the conduits for employers seeking to use the program.
Successes include the implementation of the Third-Party Administrators and the Employee Choice Model; a 250-percent increase in participating groups and covered lives and outreach that included presentations at the Maryland Hispanic Business Conference and the Maryland Chamber of Commerce Business Policy Conference in fall 2015.
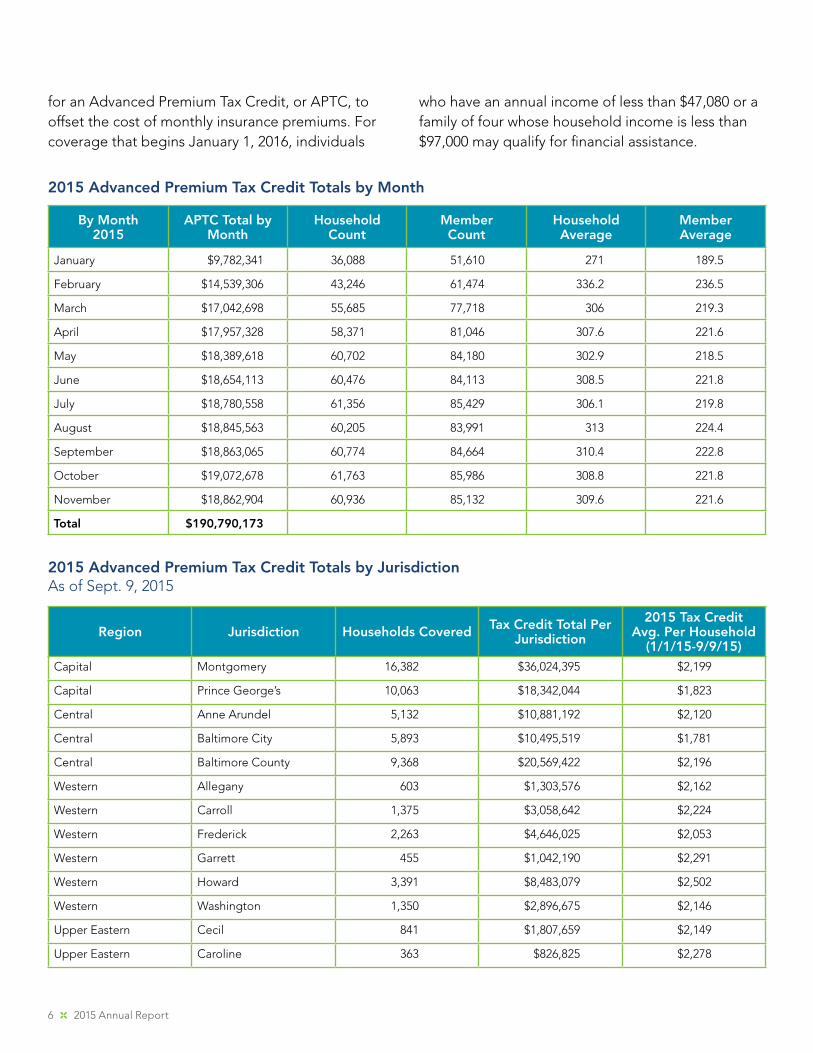
G. Advanced Premium Tax Credits (APTCs)
About 66,000 Maryland households received more than $190 million in federal tax credits to help them purchase quality health coverage in 2015 through MarylandHealthConnection.gov. Under the Affordable Care Act, Marylanders who are not eligible for qualifying health coverage, such as affordable employer-sponsored coverage or a government program such as Medicaid, may apply
Number of participating SHOP groups 110
Number of participating employees 631
Number of combined employee/dependent lives
925
6 2015 Annual Report
for an Advanced Premium Tax Credit, or APTC, to offset the cost of monthly insurance premiums. For coverage that begins January 1, 2016, individuals
who have an annual income of less than $47,080 or a family of four whose household income is less than $97,000 may qualify for financial assistance.
By Month 2015
APTC Total by Month
Household Count
Member Count
Household Average
Member Average
January $9,782,341 36,088 51,610 271 189.5
February $14,539,306 43,246 61,474 336.2 236.5
March $17,042,698 55,685 77,718 306 219.3
April $17,957,328 58,371 81,046 307.6 221.6
May $18,389,618 60,702 84,180 302.9 218.5
June $18,654,113 60,476 84,113 308.5 221.8
July $18,780,558 61,356 85,429 306.1 219.8
August $18,845,563 60,205 83,991 313 224.4
September $18,863,065 60,774 84,664 310.4 222.8
October $19,072,678 61,763 85,986 308.8 221.8
November $18,862,904 60,936 85,132 309.6 221.6
Total $190,790,173
2015 Advanced Premium Tax Credit Totals by Month
Region Jurisdiction Households Covered Tax Credit Total Per Jurisdiction
2015 Tax Credit Avg. Per Household
(1/1/15-9/9/15)Capital Montgomery 16,382 $36,024,395 $2,199
Capital Prince George’s 10,063 $18,342,044 $1,823
Central Anne Arundel 5,132 $10,881,192 $2,120
Central Baltimore City 5,893 $10,495,519 $1,781
Central Baltimore County 9,368 $20,569,422 $2,196
Western Allegany 603 $1,303,576 $2,162
Western Carroll 1,375 $3,058,642 $2,224
Western Frederick 2,263 $4,646,025 $2,053
Western Garrett 455 $1,042,190 $2,291
Western Howard 3,391 $8,483,079 $2,502
Western Washington 1,350 $2,896,675 $2,146
Upper Eastern Cecil 841 $1,807,659 $2,149
Upper Eastern Caroline 363 $826,825 $2,278
2015 Advanced Premium Tax Credit Totals by JurisdictionAs of Sept. 9, 2015
Maryland Health Benefit Exchange 7
Upper Eastern Dorchester 333 $753,611 $2,263
Upper Eastern Harford 2255 $4,793,934 $2,126
Upper Eastern Kent 224 $549,691 $2,454
Upper Eastern Queen Anne’s 509 $1,149,607 $2,259
Upper Eastern Talbot 525 $1,259,863 $2,400
Lower Shore Somerset 224 $606,289 $2,707
Lower Shore Wicomico 1,110 $2,520,224 $2,270
Lower Shore Worcester 1,017 $2,278,950 $2,241
Southern Calvert 670 $1,330,961 $1,987
Southern Charles 1,143 $2,340,531 $2,048
Southern Saint Mary’s 606 $1,244,123 $2,053
Total 66,095 $139,205,027 $2,106
H. Tax Penalty
In 2016, the federal tax penalty for lacking coverage is 2.5 percent of gross household income over the federal income tax filing threshold, or $695 per individual — whichever is greater. That is up from the 2015 penalty of 2 percent of gross household income over the tax filing threshold or $325 per individual. Messaging about the penalty will increase during the 2016 enrollment season to aid public awareness. The penalty is designed to prompt healthier people to get coverage to keep premium levels sustainable as insurers are now forbidden from turning away applicants due to existing health problems. More people covered also reduce the shared cost of uncompensated care. The Affordable Care Act provides certain exemptions, including for people below a certain income and those who are without coverage for fewer than three months.
8 2015 Annual Report
“When I left my
full-time teaching
job and went back
to school to study
early childhood
education, I was
able to continue
my health plan
using COBRA. But
the payments were
high, especially
with a mortgage
to pay. My mom
told me about
Maryland Health
Connection. The
enrollment process
was much easier
than I thought it
would be.”
— Grace, Brooklyn Park
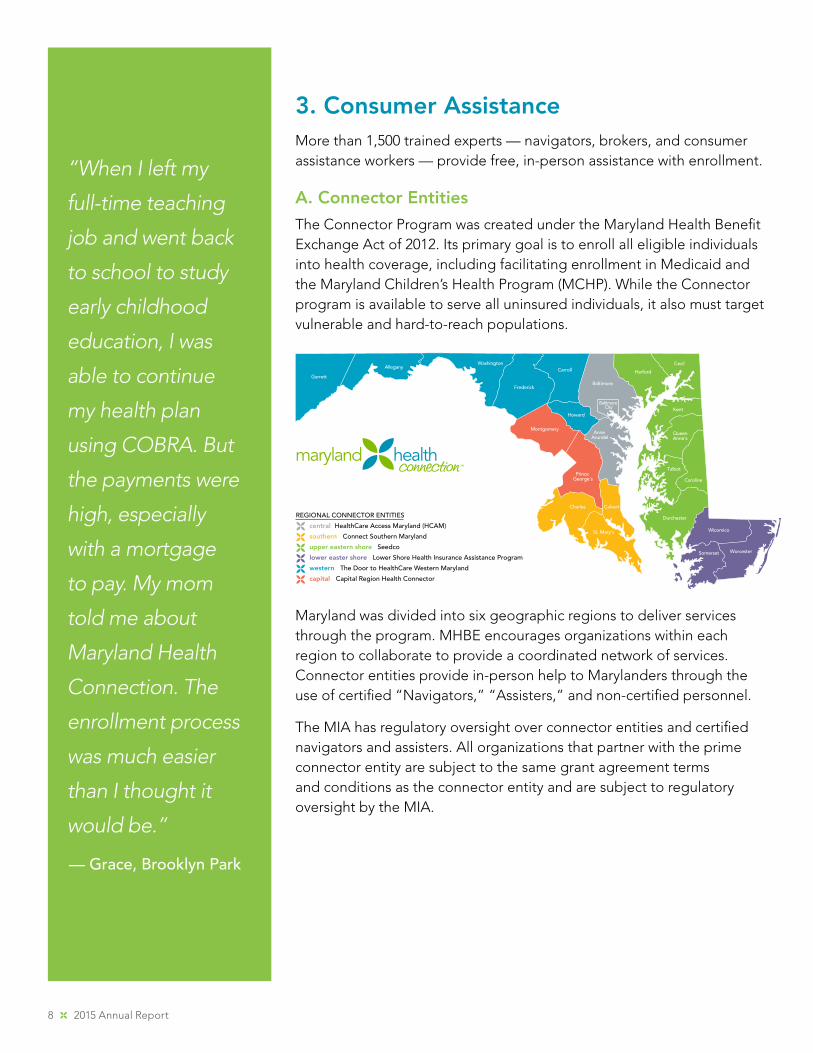
3. Consumer AssistanceMore than 1,500 trained experts — navigators, brokers, and consumer assistance workers — provide free, in-person assistance with enrollment.
A. Connector Entities
The Connector Program was created under the Maryland Health Benefit Exchange Act of 2012. Its primary goal is to enroll all eligible individuals into health coverage, including facilitating enrollment in Medicaid and the Maryland Children’s Health Program (MCHP). While the Connector program is available to serve all uninsured individuals, it also must target vulnerable and hard-to-reach populations.
Maryland was divided into six geographic regions to deliver services through the program. MHBE encourages organizations within each region to collaborate to provide a coordinated network of services. Connector entities provide in-person help to Marylanders through the use of certified “Navigators,” “Assisters,” and non-certified personnel.
The MIA has regulatory oversight over connector entities and certified navigators and assisters. All organizations that partner with the prime connector entity are subject to the same grant agreement terms and conditions as the connector entity and are subject to regulatory oversight by the MIA.
Allegany
Anne Arundel
Baltimore
Calvert
Caroline
CarrollCecil
Charles
Dorchester
Frederick
GarrettHarford
HowardKent
Montgomery
Prince George's
QueenAnne's
St. Mary's
Somerset
Talbot
Washington
Wicomico
Worcester
Baltimore City
REGIONAL CONNECTOR ENTITIES
central HealthCare Access Maryland (HCAM)
southern Connect Southern Maryland
upper eastern shore Seedco
lower easter shore Lower Shore Health Insurance Assistance Program
western The Door to HealthCare Western Maryland
capital Capital Region Health Connector
Maryland Health Benefit Exchange 9
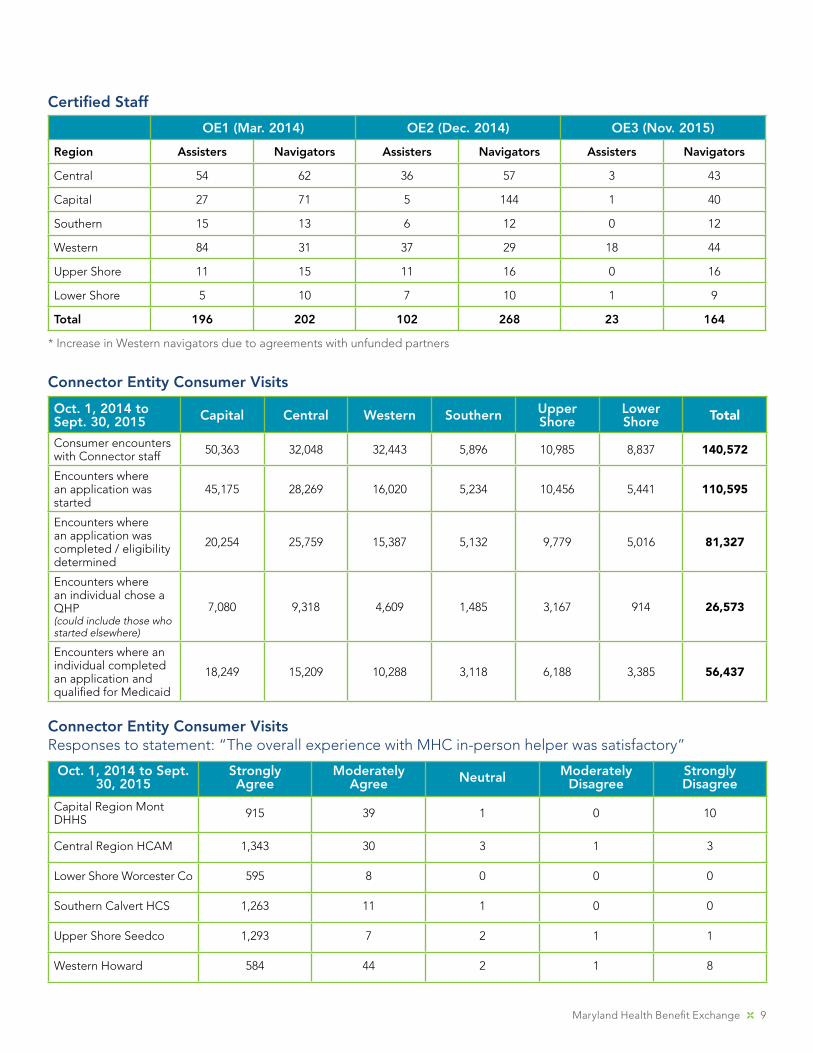
Certified Staff
OE1 (Mar. 2014) OE2 (Dec. 2014) OE3 (Nov. 2015)
Region Assisters Navigators Assisters Navigators Assisters Navigators
Central 54 62 36 57 3 43
Capital 27 71 5 144 1 40
Southern 15 13 6 12 0 12
Western 84 31 37 29 18 44
Upper Shore 11 15 11 16 0 16
Lower Shore 5 10 7 10 1 9
Total 196 202 102 268 23 164
* Increase in Western navigators due to agreements with unfunded partners
Connector Entity Consumer Visits
Oct. 1, 2014 to Sept. 30, 2015 Capital Central Western Southern Upper
ShoreLower Shore Total
Consumer encounters with Connector staff 50,363 32,048 32,443 5,896 10,985 8,837 140,572
Encounters where an application was started
45,175 28,269 16,020 5,234 10,456 5,441 110,595
Encounters where an application was completed / eligibility determined
20,254 25,759 15,387 5,132 9,779 5,016 81,327
Encounters where an individual chose a QHP(could include those who started elsewhere)
7,080 9,318 4,609 1,485 3,167 914 26,573
Encounters where an individual completed an application and qualified for Medicaid
18,249 15,209 10,288 3,118 6,188 3,385 56,437
Connector Entity Consumer VisitsResponses to statement: “The overall experience with MHC in-person helper was satisfactory”
Oct. 1, 2014 to Sept. 30, 2015
Strongly Agree
Moderately Agree Neutral Moderately
DisagreeStrongly Disagree
Capital Region Mont DHHS 915 39 1 0 10
Central Region HCAM 1,343 30 3 1 3
Lower Shore Worcester Co 595 8 0 0 0
Southern Calvert HCS 1,263 11 1 0 0
Upper Shore Seedco 1,293 7 2 1 1
Western Howard 584 44 2 1 8
10 2015 Annual Report
B. Application Counselor Sponsoring Entities (ACSEs)
The Application Counselor Sponsoring Entity (ACSE) program assists consumers with trained counselors who are certified by MHBE and sponsored by community-based organizations, health care providers, units of state or local government, and other entities authorized by MHBE. The program designates ACSEs who agree to employ, retain, and monitor Certified Application Counselors (CAC) to help Marylanders get coverage through Maryland Health Connection. The designations cover a two-year term and may be renewed for an additional two years. The designation of an entity as an ACSE does not entitle it or its counselors to funding from MHBE. The program is vital to helping increase consumer support throughout Maryland.
As of October 31, 2015, 53 ACSEs sponsored 253 CACs throughout Maryland, with 40 in process. That nearly doubled the program from a year earlier when 29 ACSEs sponsored 140 CACs.
C. Producer Operations
As of September 30, 2015, the MHBE had 1,123 Authorized Producers, or insurance brokers. Of those, 137 were SHOP-only, 236 were individual-only, with the balance of 750 working in both markets. In the individual market, 27,555 people were enrolled in QHPs by a total of 645 producers from January 1, 2015 to September 30, 2015. In other words, nearly 60 percent of Authorized Producers enrolled someone in 2015.
For most Authorized Producers, the ACA and individual health coverage is a minor part of their work. For a relatively small number of producers, individual health coverage is a major focus or even the core of their business. Half of all producer-assisted enrollments were performed by 59 producers and one-quarter of all producer-assisted enrollments were performed by 20 producers.
Producer Operations, coordinating with Training, successfully converted all training offerings for Authorized Producers into self-directed online formats, which provided greater flexibility for training. Producer Operations, coordinating with the Call Center, also successfully reduced hold times and dropped calls on the Producer Support Hotline by dedicating consumer service reps to that line. Producer Operations also collaborated on several changes to the system to aid productivity for Authorized Producers such as adding the option for consumers to designate a producer when they create an account.
For 2016, in a unique program believed to be a first-in-the-nation pilot, select brokers are linked directly to consumers through the Maryland Health Connection call center. The Broker Assistance Transfer (BAT) pilot program is known as the “BATPhone.” Brokers are the only consumer assistance workers who can recommend a specific plan to consumers based on individual needs.
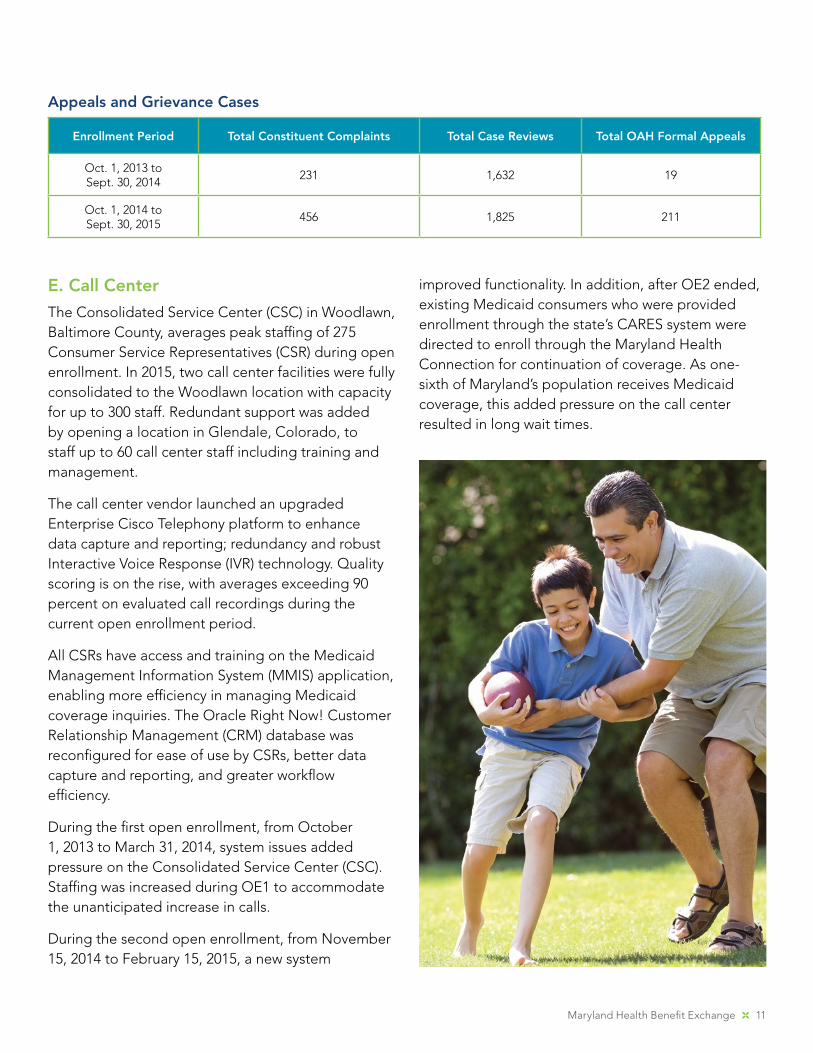
D. Appeals and Grievances
The Appeals and Grievance Unit handles case reviews, formal appeals, and constituent complaints for QHP and Medicaid members. Four appeals and grievance coordinators, one lead, one manager, and an assistant review and investigate thousands of cases each year. Below is a breakdown of cases reviewed between the first and second open enrollments. Of the many cases investigated and handled through an informal resolution process or a formal Office of Administrative Hearing (OAH) appeal, all were successfully resolved with no liability to the agency. Information gathered from the complaints and appeals has been used to improve system functionality and operational processes to eliminate the need for an appeal or complaint in the future as appropriate.
Maryland Health Benefit Exchange 11
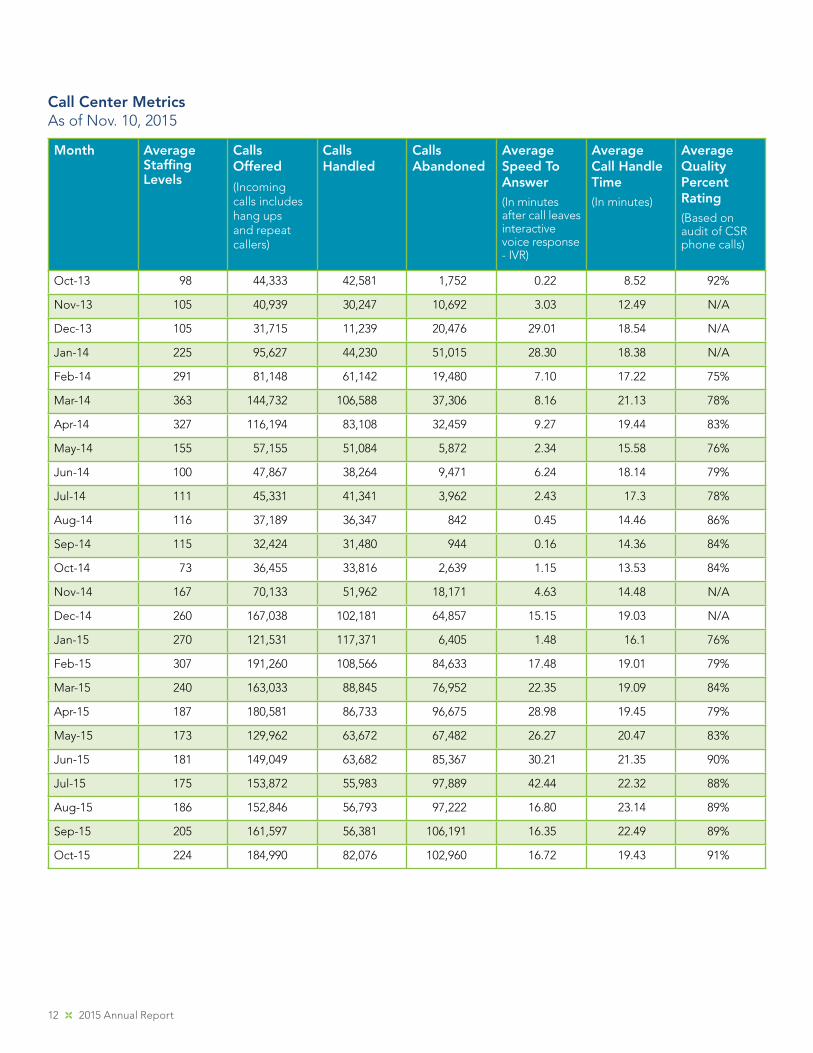
E. Call Center
The Consolidated Service Center (CSC) in Woodlawn, Baltimore County, averages peak staffing of 275 Consumer Service Representatives (CSR) during open enrollment. In 2015, two call center facilities were fully consolidated to the Woodlawn location with capacity for up to 300 staff. Redundant support was added by opening a location in Glendale, Colorado, to staff up to 60 call center staff including training and management.
The call center vendor launched an upgraded Enterprise Cisco Telephony platform to enhance data capture and reporting; redundancy and robust Interactive Voice Response (IVR) technology. Quality scoring is on the rise, with averages exceeding 90 percent on evaluated call recordings during the current open enrollment period.
All CSRs have access and training on the Medicaid Management Information System (MMIS) application, enabling more efficiency in managing Medicaid coverage inquiries. The Oracle Right Now! Customer Relationship Management (CRM) database was reconfigured for ease of use by CSRs, better data capture and reporting, and greater workflow efficiency.
During the first open enrollment, from October 1, 2013 to March 31, 2014, system issues added pressure on the Consolidated Service Center (CSC). Staffing was increased during OE1 to accommodate the unanticipated increase in calls.
During the second open enrollment, from November 15, 2014 to February 15, 2015, a new system
improved functionality. In addition, after OE2 ended, existing Medicaid consumers who were provided enrollment through the state’s CARES system were directed to enroll through the Maryland Health Connection for continuation of coverage. As one-sixth of Maryland’s population receives Medicaid coverage, this added pressure on the call center resulted in long wait times.
Enrollment Period Total Constituent Complaints Total Case Reviews Total OAH Formal Appeals
Oct. 1, 2013 toSept. 30, 2014
231 1,632 19
Oct. 1, 2014 toSept. 30, 2015
456 1,825 211
Appeals and Grievance Cases
12 2015 Annual Report
Month Average Staffing Levels
Calls Offered
(Incoming calls includes hang ups and repeat callers)
Calls Handled
Calls Abandoned
Average Speed To Answer(In minutes after call leaves interactive voice response - IVR)
Average Call Handle Time(In minutes)
Average Quality Percent Rating(Based on audit of CSR phone calls)
Oct-13 98 44,333 42,581 1,752 0.22 8.52 92%
Nov-13 105 40,939 30,247 10,692 3.03 12.49 N/A
Dec-13 105 31,715 11,239 20,476 29.01 18.54 N/A
Jan-14 225 95,627 44,230 51,015 28.30 18.38 N/A
Feb-14 291 81,148 61,142 19,480 7.10 17.22 75%
Mar-14 363 144,732 106,588 37,306 8.16 21.13 78%
Apr-14 327 116,194 83,108 32,459 9.27 19.44 83%
May-14 155 57,155 51,084 5,872 2.34 15.58 76%
Jun-14 100 47,867 38,264 9,471 6.24 18.14 79%
Jul-14 111 45,331 41,341 3,962 2.43 17.3 78%
Aug-14 116 37,189 36,347 842 0.45 14.46 86%
Sep-14 115 32,424 31,480 944 0.16 14.36 84%
Oct-14 73 36,455 33,816 2,639 1.15 13.53 84%
Nov-14 167 70,133 51,962 18,171 4.63 14.48 N/A
Dec-14 260 167,038 102,181 64,857 15.15 19.03 N/A
Jan-15 270 121,531 117,371 6,405 1.48 16.1 76%
Feb-15 307 191,260 108,566 84,633 17.48 19.01 79%
Mar-15 240 163,033 88,845 76,952 22.35 19.09 84%
Apr-15 187 180,581 86,733 96,675 28.98 19.45 79%
May-15 173 129,962 63,672 67,482 26.27 20.47 83%
Jun-15 181 149,049 63,682 85,367 30.21 21.35 90%
Jul-15 175 153,872 55,983 97,889 42.44 22.32 88%
Aug-15 186 152,846 56,793 97,222 16.80 23.14 89%
Sep-15 205 161,597 56,381 106,191 16.35 22.49 89%
Oct-15 224 184,990 82,076 102,960 16.72 19.43 91%
Call Center MetricsAs of Nov. 10, 2015
Maryland Health Benefit Exchange 13
“I lost my
coverage
recently. I went
to an event,
asked questions
and got the
best coverage
for me.”
— Adam, Edgewood
4. FinanceMHBE has and will continue to use the financial guidelines prescribed by the Maryland Comptroller to ensure its financial integrity. In areas where MHBE has been exempted from various state procedures that affect the finances and/or procurement of the agency, MHBE adheres to policies approved by its MHBE Board of Trustees. MHBE has addressed or is in the process of addressing all recommendations in audits conducted by the Maryland Department of Legislative Services’ Office of Legislative Audits (OLA), as well as the Center for Consumer Information and Insurance Oversight, the regulatory arm of the Center for Medicare and Medicaid Services (CMS) that oversees state-based exchanges, and will continue to do so.
A. Fee Assessments and Funding
The Maryland State Comptroller is responsible for collecting the assessment generated by “the 2-percent premium tax on each authorized insurance company, surplus lines broker, or unauthorized insurance company that sells, or an individual who independently procures, any type of insurance coverage upon a risk that is located in the State.”12 Most revenues from this long-standing assessment go to the state’s General Fund, from which MHBE receives an annual appropriation of not less than $35 million.
B. MHBE Fund Status
The enabling legislation that created MHBE defined a special non-lapsing fund that would consist of user fees or other assessments collected by the exchange, all revenue deposited into the fund derived from the 2-percent tax on premiums, all revenue deposited into the fund from the Maryland Health Insurance Plan Fund, income from investments made on behalf of the fund, interest on deposits or investment of money in the fund, money collected by the Board as a result of a legal or other actions, money donated to the fund, money awarded to the fund through grants, and any other source accepted on behalf of the fund. However, the Maryland Health Progress Act of 2013 reversed prior legislation and required that any funds in the exchange operations account from the premium tax that remain unspent at the end of the state fiscal year shall revert to the state General Fund. In effect, MHBE no longer has a special non-lapsing fund. As such, the special fund has a zero balance at the end of every fiscal year. MHBE was appropriated and spent $12,967,846 in special funds in Fiscal Year 2015. The current special fund appropriation for Fiscal Year 2016 is $34,793,436.
12 See Maryland Department of Legislative Services Fiscal and Policy Note – HB228, Maryland Health Progress Act of 2013
14 2015 Annual Report
“As someone
with chronic
asthma, having
health care is
very important.
I cannot say
thank you
enough.”
— Alisa
5. Compliance
A. Fraud, Waste, and Abuse Detection
In compliance with the Maryland Health Benefit Exchange Act of 2012, MHBE established a Fraud, Waste, and Abuse Detection and Prevention Program to ensure its compliance with federal and state laws for the detection and prevention of fraud, waste, and abuse. The Chief Compliance Officer, in collaboration with DHMH’s Office of Investigator General, as appropriate, investigates reported or suspected cases, mitigates further risk through the development of corrective action plans and/or disciplinary action, and oversees ongoing implementation of corrective actions to ensure their desired effect.
Of four reported cases in Fiscal Year 2015, investigations found no instance of fraud, waste, or abuse. Three reports were not founded and the fourth was a service-related complaint. The allegations were reported through confidential hotlines, investigations were initiated within the required 10-day timeframe, and no further action was required.
MHBE’s Governing Board approved the Compliance and Ethics Plan, which serves as the basis for the agency’s oversight and monitoring program. The program includes a Code of Conduct; procedures for identifying, investigating, and resolving potential misconduct; a non-retaliation, non-intimidation policy; management controls to prevent fraud, waste, and abuse; risk management practices; and financial integrity policies and quality controls.
MHBE underwent several retrospective audits by state and federal agencies related to the implementation of the exchange, effectiveness of its functioning, and status of its financial, programmatic, IT and compliance programs dating from the period of inception through the summer of 2014. While corrective actions were recommended as a result of the audits, the agency had already implemented many of the improvements. Examples include development of a new marketplace application, restructure of procurement procedures, compliance with Maryland Open Meeting Act, implementation of an inventory management program, continuous improvement of IT Security functioning, and more comprehensive management and oversight of contractors to promote transparency, consistency, and expected outcomes.
MHBE revised its Non-Exchange Entity Agreement (similar to HIPAA Business Associate Agreement), which includes protections for the personally identifiable information (PII) that consumers provide to the exchange in order to determine their eligibility for assistance

Maryland Health Benefit Exchange 15
and to enroll in insurance programs through the marketplace. The Non-Exchange Entity Agreements describe IT Security requirements that reduce probability of a privacy incident and include breach notification requirements in the event that one would occur. Additionally, training programs related to prevention of fraud, waste and abuse, privacy, and IT Security were revised to incorporate new regulations and lessons learned to promote understanding of requirements and mitigate risk. MHBE continues to develop and reinforce internal control mechanisms
to improve services rendered, ensure consistent application of best practices and promote effective use of its resources.
16 2015 Annual Report
“For a long time,
I worked a job
just to maintain
health coverage.
I was able to
quit that job so
I could do what
I was passionate
about. Because of
Maryland Health
Connection, my
husband and I,
who are both self-
employed, now
have the coverage
we need to take
care of our family.
I know there are
other families out
there who could
benefit from this
just like we did.”
— Amanda, Salisbury
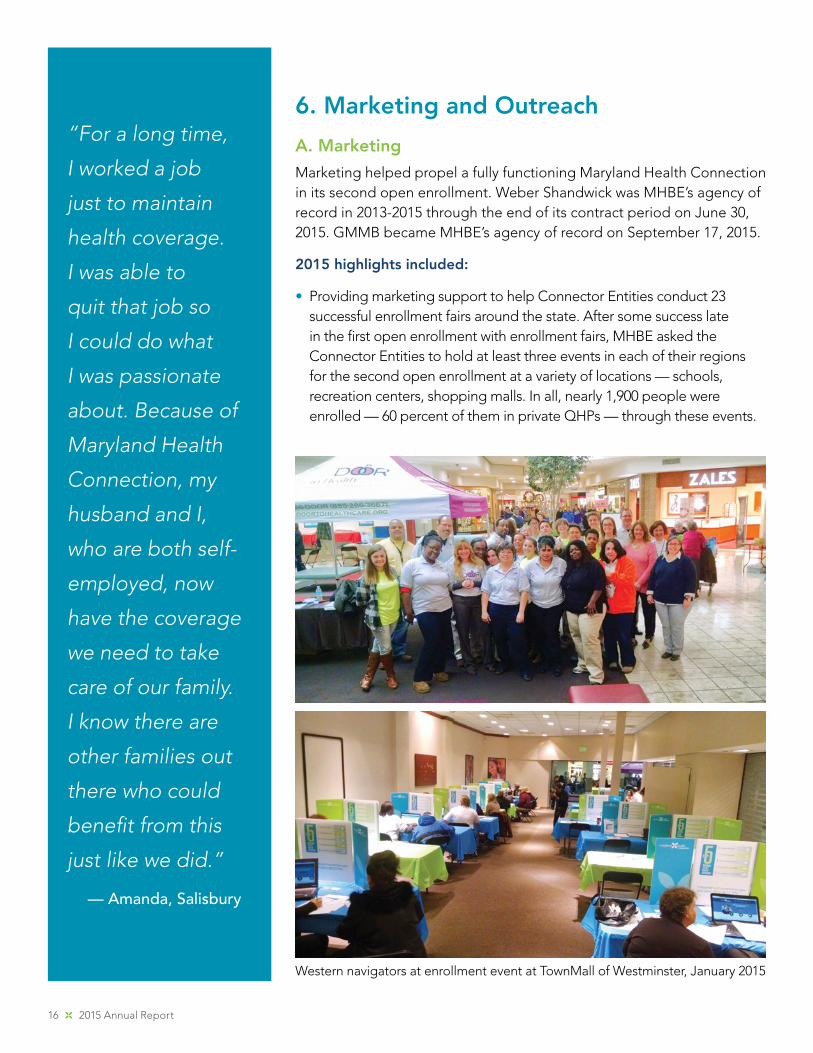
6. Marketing and Outreach
A. Marketing
Marketing helped propel a fully functioning Maryland Health Connection in its second open enrollment. Weber Shandwick was MHBE’s agency of record in 2013-2015 through the end of its contract period on June 30, 2015. GMMB became MHBE’s agency of record on September 17, 2015.
2015 highlights included:
• Providing marketing support to help Connector Entities conduct 23 successful enrollment fairs around the state. After some success late in the first open enrollment with enrollment fairs, MHBE asked the Connector Entities to hold at least three events in each of their regions for the second open enrollment at a variety of locations — schools, recreation centers, shopping malls. In all, nearly 1,900 people were enrolled — 60 percent of them in private QHPs — through these events.
Western navigators at enrollment event at TownMall of Westminster, January 2015
Maryland Health Benefit Exchange 17
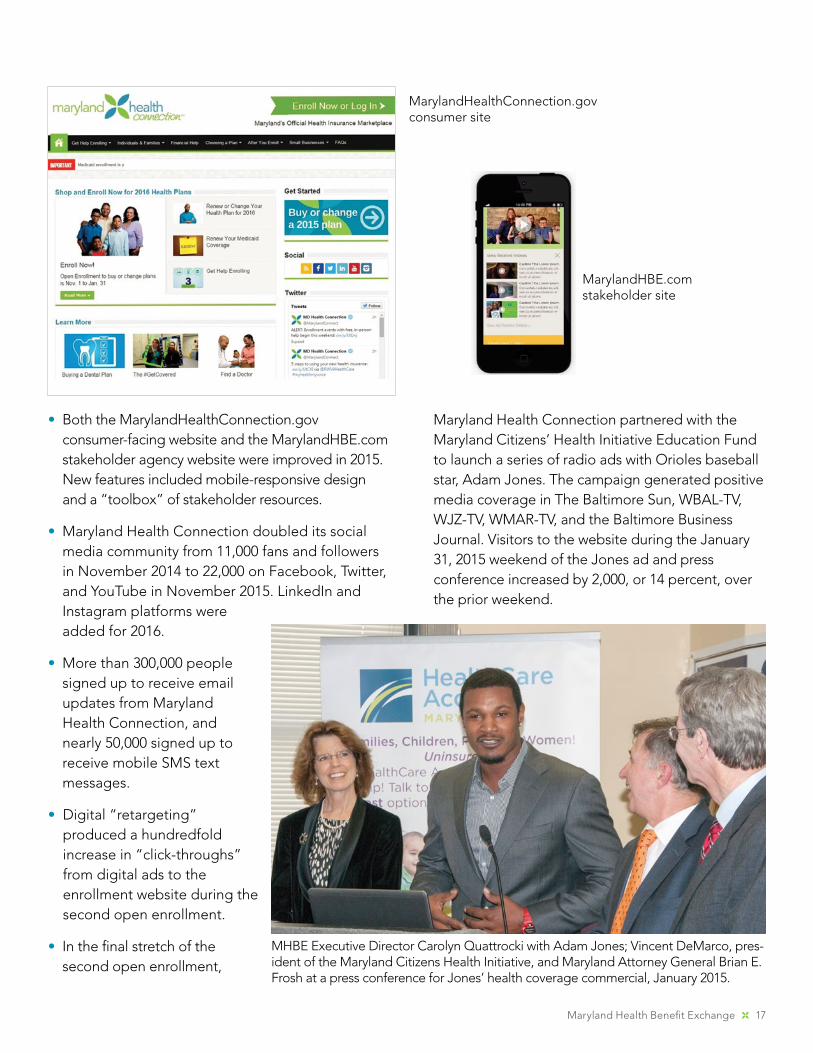
• Both the MarylandHealthConnection.gov consumer-facing website and the MarylandHBE.com stakeholder agency website were improved in 2015. New features included mobile-responsive design and a “toolbox” of stakeholder resources.
• Maryland Health Connection doubled its social media community from 11,000 fans and followers in November 2014 to 22,000 on Facebook, Twitter, and YouTube in November 2015. LinkedIn and Instagram platforms were added for 2016.
• More than 300,000 people signed up to receive email updates from Maryland Health Connection, and nearly 50,000 signed up to receive mobile SMS text messages.
• Digital “retargeting” produced a hundredfold increase in “click-throughs” from digital ads to the enrollment website during the second open enrollment.
• In the final stretch of the second open enrollment,
Maryland Health Connection partnered with the Maryland Citizens’ Health Initiative Education Fund to launch a series of radio ads with Orioles baseball star, Adam Jones. The campaign generated positive media coverage in The Baltimore Sun, WBAL-TV, WJZ-TV, WMAR-TV, and the Baltimore Business Journal. Visitors to the website during the January 31, 2015 weekend of the Jones ad and press conference increased by 2,000, or 14 percent, over the prior weekend.
MarylandHealthConnection.gov consumer site
MarylandHBE.com stakeholder site
MHBE Executive Director Carolyn Quattrocki with Adam Jones; Vincent DeMarco, pres-ident of the Maryland Citizens Health Initiative, and Maryland Attorney General Brian E. Frosh at a press conference for Jones’ health coverage commercial, January 2015.
18 2015 Annual Report
• MHBE formed partnerships with sister state agencies, including Maryland Department of Labor, Licensing and Regulation (DLLR), and the Maryland Department of Veterans Affairs, which added a logo and link to the health insurance enrollment website on their websites. Also, the Maryland Department of Commerce (DOC), Maryland Insurance Administration (MIA), the Governor’s Office of Minority Affairs (GOMA), and the Health Education and Advocacy Unit (HEAU) of the Maryland Office of the Attorney General (OAG) agreed to circulate Maryland Health Connection brochures at their outreach events.
B. Outreach
Reaching African-American, Hispanic, and Young Invincible (18-34) populations, groups under-insured for health coverage, were a primary focus of the enrollment outreach. MHBE entered into a partnership with the AFRO American Newspaper, which circulated information to African-American-serving churches, Historically Black Colleges and Universities (HBCUs), NAACP, Baltimore Urban League, and Associated Black Charities. Enrollees who identified as Black or African-American made up 26 percent of total enrollments during the second open enrollment and 18 percent of QHP enrollment.
Paid advertising reaching the Latino audience to encourage enrollment and promote events was increased for the second open enrollment, achieving a reach of 87 percent of Spanish-speaking TV households with ads on Entravision and Telemundo. In addition, Spanish-language online advertising and Latino radio stations in the DC metropolitan and Lower Shore regions were employed, as well as Spanish-language newspapers in Baltimore and Washington metro markets. Community outreach efforts included electronic and in-person distribution of Spanish-language enrollment materials to mercados, retailers, and community organizations. Enrollees who identified themselves as Hispanic on an optional question on the application made up
4.9 percent of total enrollments during OE2 and 4.5 percent of QHP enrollment. At the end of OE2, the marketing team added a bilingual Outreach Coordinator and took additional steps to increase marketing to Hispanic consumers and businesses.
C. Research
Marketing for the second open enrollment was informed by surveys by KRC Research through MHBE’s contract with Weber Shandwick in fall 2014, including a telephone survey of 800 Maryland residents and six focus groups. Additional focus groups sponsored by the Maryland Citizens’ Health Initiative Education Fund were conducted in fall 2014.
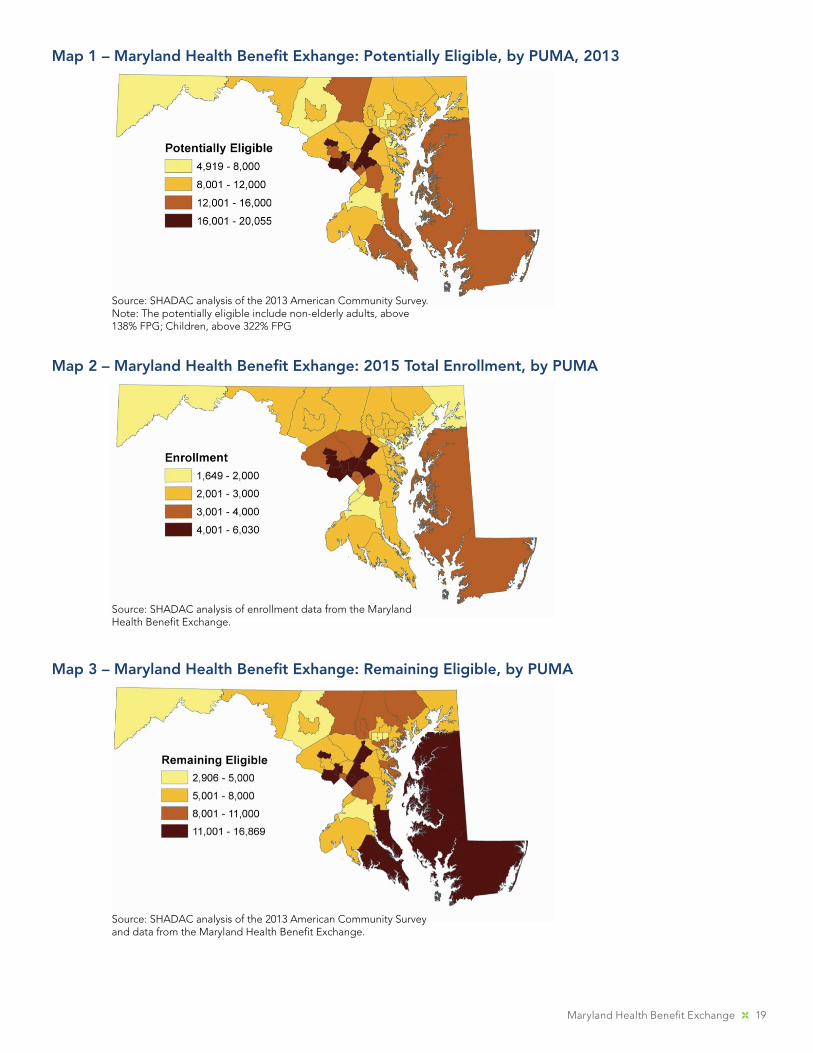
In July 2015, the State Health Access Data Assistance Center (SHADAC) at the University of Minnesota assisted MHBE in analyzing where most remaining uninsured Marylanders live who would be eligible under the Affordable Care Act for enrollment in a private QHP. The primary goal was to assess the geographic concentration of individuals who are likely eligible for coverage through the marketplace, but who had not enrolled. SHADAC combined 2015 enrollment data by ZIP code provided by MHBE with the most recent data available from the U.S. Census Bureau’s American Community Survey (ACS). The potentially eligible, or target population, was defined as non-elderly adults between 139 percent and 400 percent of the Federal Poverty Level (FPL), and children above 322 percent of the FPL who are uninsured or have coverage in the non-group market. The analysis was used for strategic and resource planning for outreach and marketing in the open enrollment for 2016 coverage.
Maryland Health Benefit Exchange 19
Map 1 – Maryland Health Benefit Exhange: Potentially Eligible, by PUMA, 2013
Source: SHADAC analysis of the 2013 American Community Survey. Note: The potentially eligible include non-elderly adults, above 138% FPG; Children, above 322% FPG
Map 2 – Maryland Health Benefit Exhange: 2015 Total Enrollment, by PUMA
Source: SHADAC analysis of enrollment data from the Maryland Health Benefit Exchange.
Map 3 – Maryland Health Benefit Exhange: Remaining Eligible, by PUMA
Source: SHADAC analysis of the 2013 American Community Survey and data from the Maryland Health Benefit Exchange.
20 2015 Annual Report
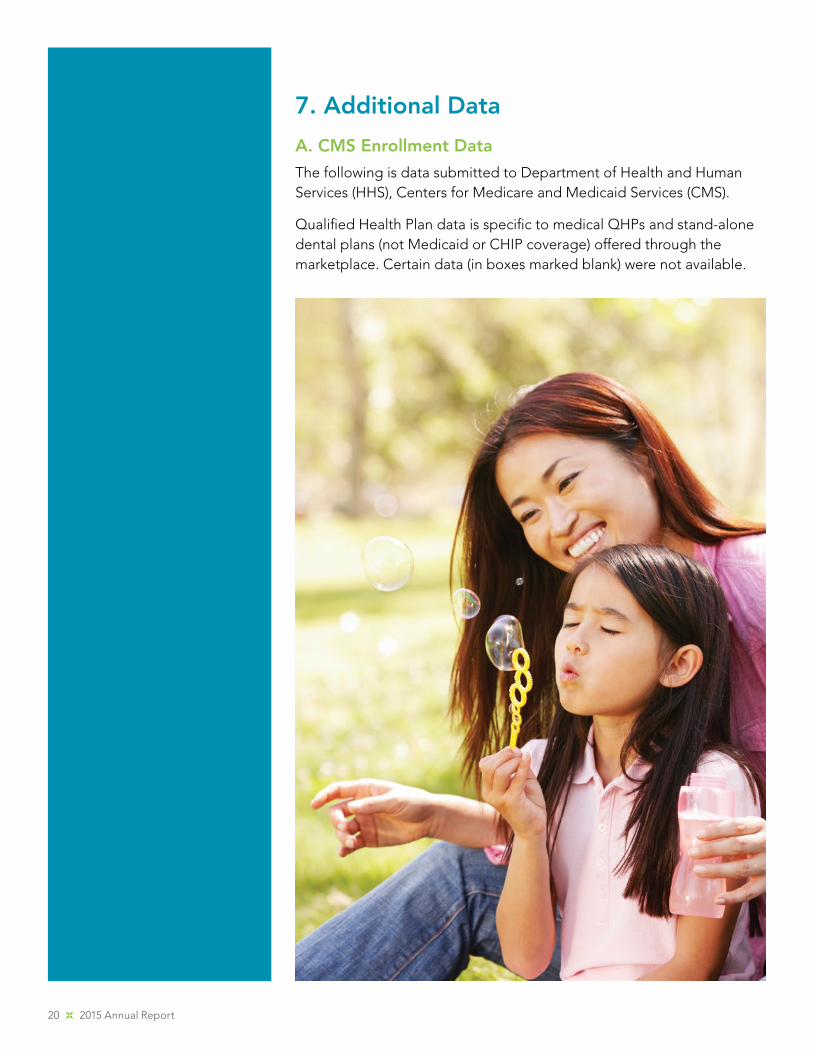
7. Additional Data
A. CMS Enrollment Data
The following is data submitted to Department of Health and Human Services (HHS), Centers for Medicare and Medicaid Services (CMS).
Qualified Health Plan data is specific to medical QHPs and stand-alone dental plans (not Medicaid or CHIP coverage) offered through the marketplace. Certain data (in boxes marked blank) were not available.
Maryland Health Benefit Exchange 21
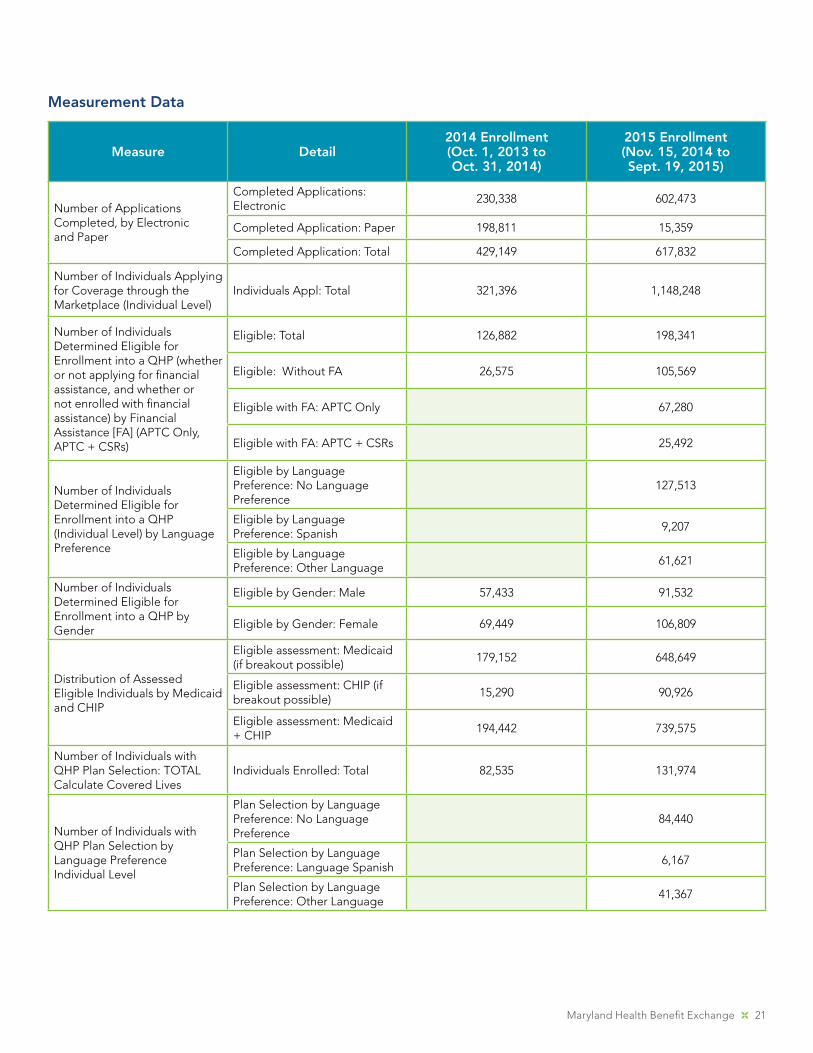
Measurement Data
Measure Detail2014 Enrollment(Oct. 1, 2013 to Oct. 31, 2014)
2015 Enrollment(Nov. 15, 2014 to Sept. 19, 2015)
Number of Applications Completed, by Electronic and Paper
Completed Applications: Electronic
230,338 602,473
Completed Application: Paper 198,811 15,359
Completed Application: Total 429,149 617,832
Number of Individuals Applying for Coverage through the Marketplace (Individual Level)
Individuals Appl: Total 321,396 1,148,248
Number of Individuals Determined Eligible for Enrollment into a QHP (whether or not applying for financial assistance, and whether or not enrolled with financial assistance) by Financial Assistance [FA] (APTC Only, APTC + CSRs)
Eligible: Total 126,882 198,341
Eligible: Without FA 26,575 105,569
Eligible with FA: APTC Only 67,280
Eligible with FA: APTC + CSRs 25,492
Number of Individuals Determined Eligible for Enrollment into a QHP (Individual Level) by Language Preference
Eligible by Language Preference: No Language Preference
127,513
Eligible by Language Preference: Spanish
9,207
Eligible by Language Preference: Other Language
61,621
Number of Individuals Determined Eligible for Enrollment into a QHP by Gender
Eligible by Gender: Male 57,433 91,532
Eligible by Gender: Female 69,449 106,809
Distribution of Assessed Eligible Individuals by Medicaid and CHIP
Eligible assessment: Medicaid (if breakout possible)
179,152 648,649
Eligible assessment: CHIP (if breakout possible)
15,290 90,926
Eligible assessment: Medicaid + CHIP
194,442 739,575
Number of Individuals with QHP Plan Selection: TOTALCalculate Covered Lives
Individuals Enrolled: Total 82,535 131,974
Number of Individuals with QHP Plan Selection by Language PreferenceIndividual Level
Plan Selection by Language Preference: No Language Preference
84,440
Plan Selection by Language Preference: Language Spanish
6,167
Plan Selection by Language Preference: Other Language
41,367
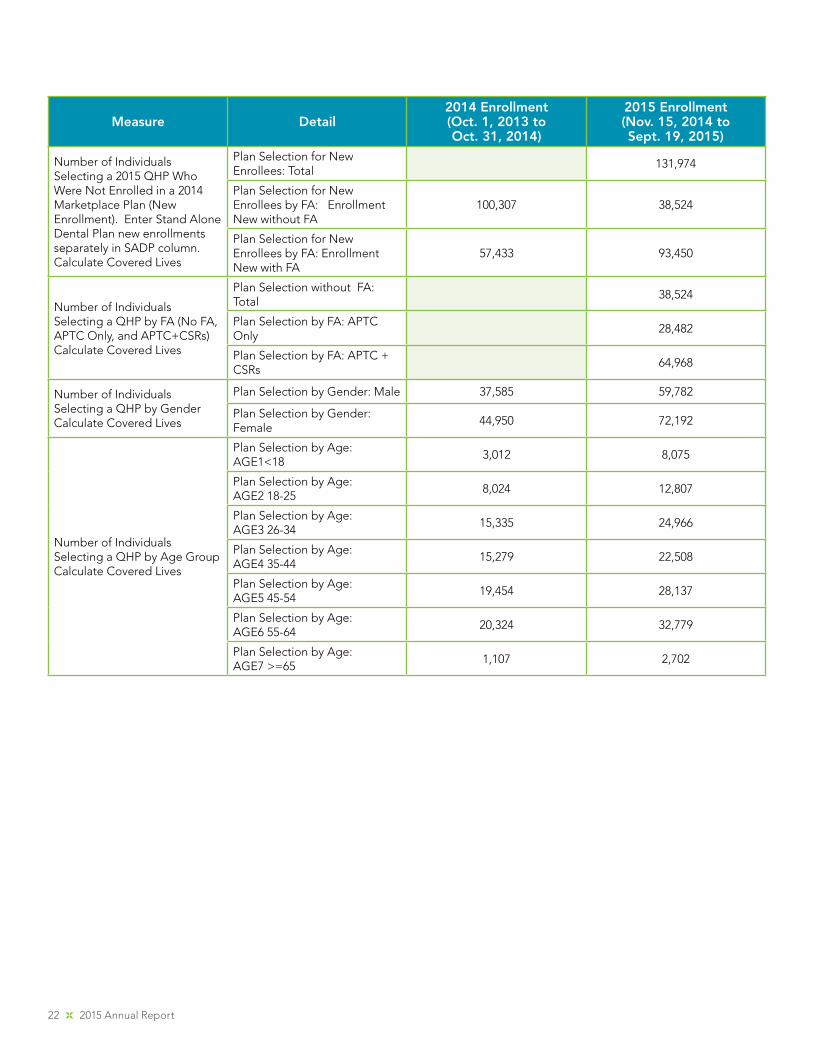
22 2015 Annual Report
Measure Detail2014 Enrollment(Oct. 1, 2013 to Oct. 31, 2014)
2015 Enrollment(Nov. 15, 2014 to Sept. 19, 2015)
Number of Individuals Selecting a 2015 QHP Who Were Not Enrolled in a 2014 Marketplace Plan (New Enrollment). Enter Stand Alone Dental Plan new enrollments separately in SADP column. Calculate Covered Lives
Plan Selection for New Enrollees: Total
131,974
Plan Selection for New Enrollees by FA: Enrollment New without FA
100,307 38,524
Plan Selection for New Enrollees by FA: Enrollment New with FA
57,433 93,450
Number of Individuals Selecting a QHP by FA (No FA, APTC Only, and APTC+CSRs)Calculate Covered Lives
Plan Selection without FA: Total
38,524
Plan Selection by FA: APTC Only
28,482
Plan Selection by FA: APTC + CSRs
64,968
Number of Individuals Selecting a QHP by GenderCalculate Covered Lives
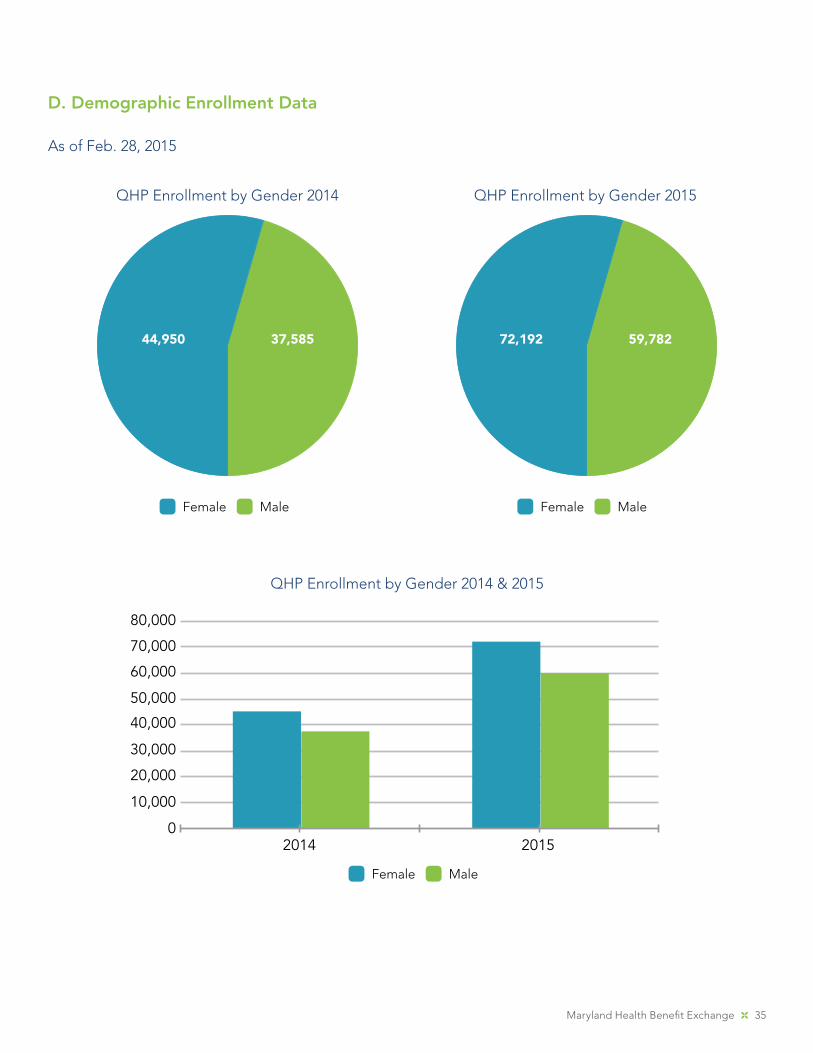
Plan Selection by Gender: Male 37,585 59,782
Plan Selection by Gender: Female
44,950 72,192
Number of Individuals Selecting a QHP by Age GroupCalculate Covered Lives
Plan Selection by Age: AGE1<18
3,012 8,075
Plan Selection by Age: AGE2 18-25
8,024 12,807
Plan Selection by Age: AGE3 26-34
15,335 24,966
Plan Selection by Age: AGE4 35-44
15,279 22,508
Plan Selection by Age: AGE5 45-54
19,454 28,137
Plan Selection by Age: AGE6 55-64
20,324 32,779
Plan Selection by Age: AGE7 >=65
1,107 2,702
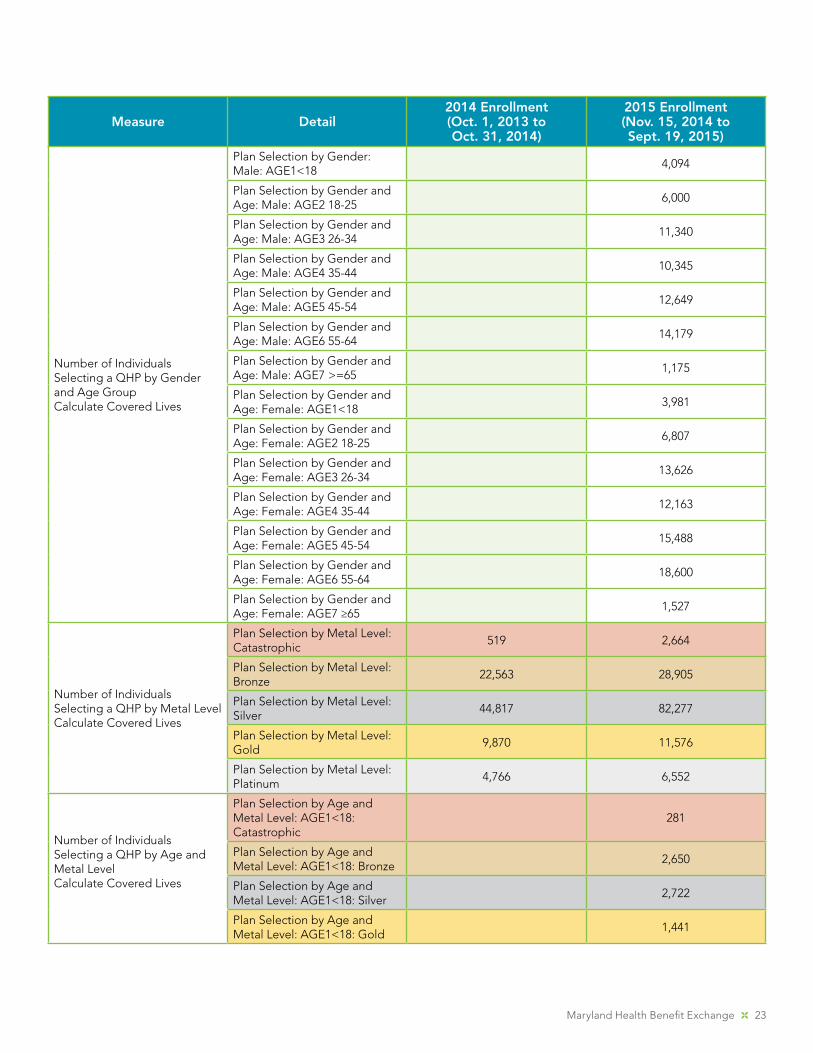
Maryland Health Benefit Exchange 23
Measure Detail2014 Enrollment(Oct. 1, 2013 to Oct. 31, 2014)
2015 Enrollment(Nov. 15, 2014 to Sept. 19, 2015)
Number of Individuals Selecting a QHP by Gender and Age GroupCalculate Covered Lives
Plan Selection by Gender: Male: AGE1<18
4,094
Plan Selection by Gender and Age: Male: AGE2 18-25
6,000
Plan Selection by Gender and Age: Male: AGE3 26-34
11,340
Plan Selection by Gender and Age: Male: AGE4 35-44
10,345
Plan Selection by Gender and Age: Male: AGE5 45-54
12,649
Plan Selection by Gender and Age: Male: AGE6 55-64
14,179
Plan Selection by Gender and Age: Male: AGE7 >=65
1,175
Plan Selection by Gender and Age: Female: AGE1<18
3,981
Plan Selection by Gender and Age: Female: AGE2 18-25
6,807
Plan Selection by Gender and Age: Female: AGE3 26-34
13,626
Plan Selection by Gender and Age: Female: AGE4 35-44
12,163
Plan Selection by Gender and Age: Female: AGE5 45-54
15,488
Plan Selection by Gender and Age: Female: AGE6 55-64
18,600
Plan Selection by Gender and Age: Female: AGE7 ≥65
1,527
Number of Individuals Selecting a QHP by Metal LevelCalculate Covered Lives
Plan Selection by Metal Level: Catastrophic
519 2,664
Plan Selection by Metal Level: Bronze
22,563 28,905
Plan Selection by Metal Level: Silver
44,817 82,277
Plan Selection by Metal Level: Gold
9,870 11,576
Plan Selection by Metal Level: Platinum
4,766 6,552
Number of Individuals Selecting a QHP by Age and Metal LevelCalculate Covered Lives
Plan Selection by Age and Metal Level: AGE1<18: Catastrophic
281
Plan Selection by Age and Metal Level: AGE1<18: Bronze
2,650
Plan Selection by Age and Metal Level: AGE1<18: Silver
2,722
Plan Selection by Age and Metal Level: AGE1<18: Gold
1,441
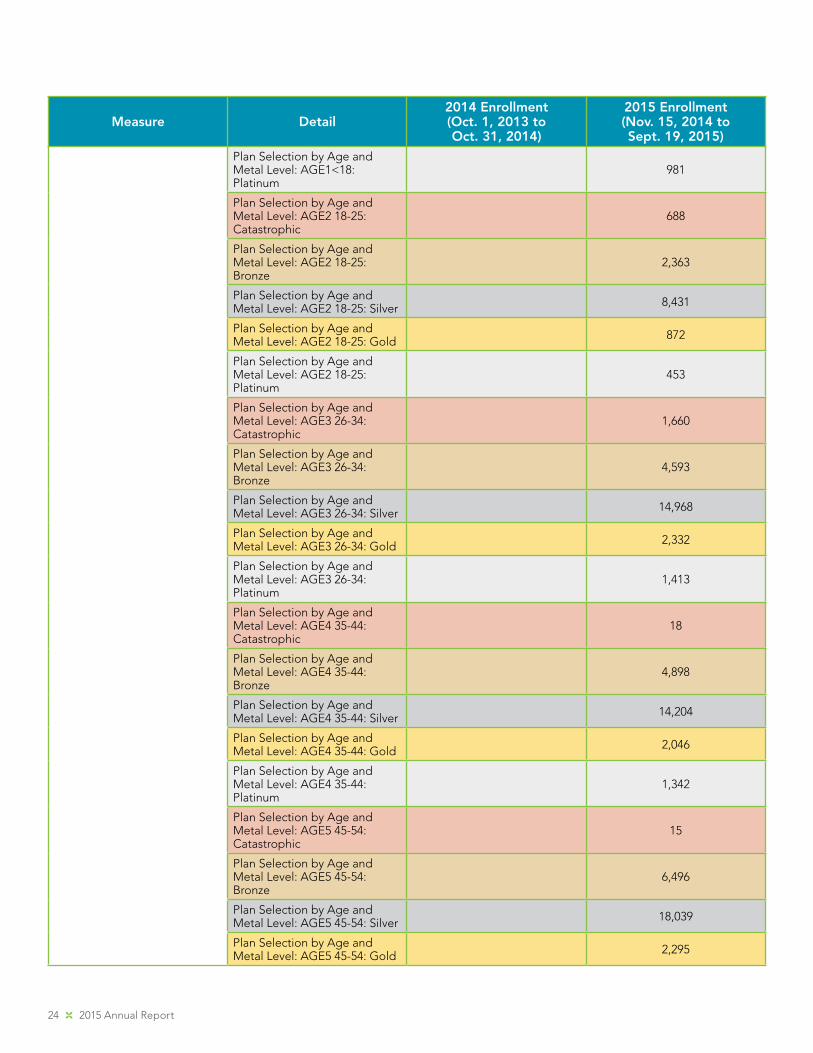
24 2015 Annual Report
Measure Detail2014 Enrollment(Oct. 1, 2013 to Oct. 31, 2014)
2015 Enrollment(Nov. 15, 2014 to Sept. 19, 2015)
Plan Selection by Age and Metal Level: AGE1<18: Platinum
981
Plan Selection by Age and Metal Level: AGE2 18-25: Catastrophic
688
Plan Selection by Age and Metal Level: AGE2 18-25: Bronze
2,363
Plan Selection by Age and Metal Level: AGE2 18-25: Silver 8,431
Plan Selection by Age and Metal Level: AGE2 18-25: Gold 872
Plan Selection by Age and Metal Level: AGE2 18-25: Platinum
453
Plan Selection by Age and Metal Level: AGE3 26-34: Catastrophic
1,660
Plan Selection by Age and Metal Level: AGE3 26-34: Bronze
4,593
Plan Selection by Age and Metal Level: AGE3 26-34: Silver 14,968
Plan Selection by Age and Metal Level: AGE3 26-34: Gold 2,332
Plan Selection by Age and Metal Level: AGE3 26-34: Platinum
1,413
Plan Selection by Age and Metal Level: AGE4 35-44: Catastrophic
18
Plan Selection by Age and Metal Level: AGE4 35-44: Bronze
4,898
Plan Selection by Age and Metal Level: AGE4 35-44: Silver 14,204
Plan Selection by Age and Metal Level: AGE4 35-44: Gold 2,046
Plan Selection by Age and Metal Level: AGE4 35-44: Platinum
1,342
Plan Selection by Age and Metal Level: AGE5 45-54: Catastrophic
15
Plan Selection by Age and Metal Level: AGE5 45-54: Bronze
6,496
Plan Selection by Age and Metal Level: AGE5 45-54: Silver 18,039
Plan Selection by Age and Metal Level: AGE5 45-54: Gold 2,295
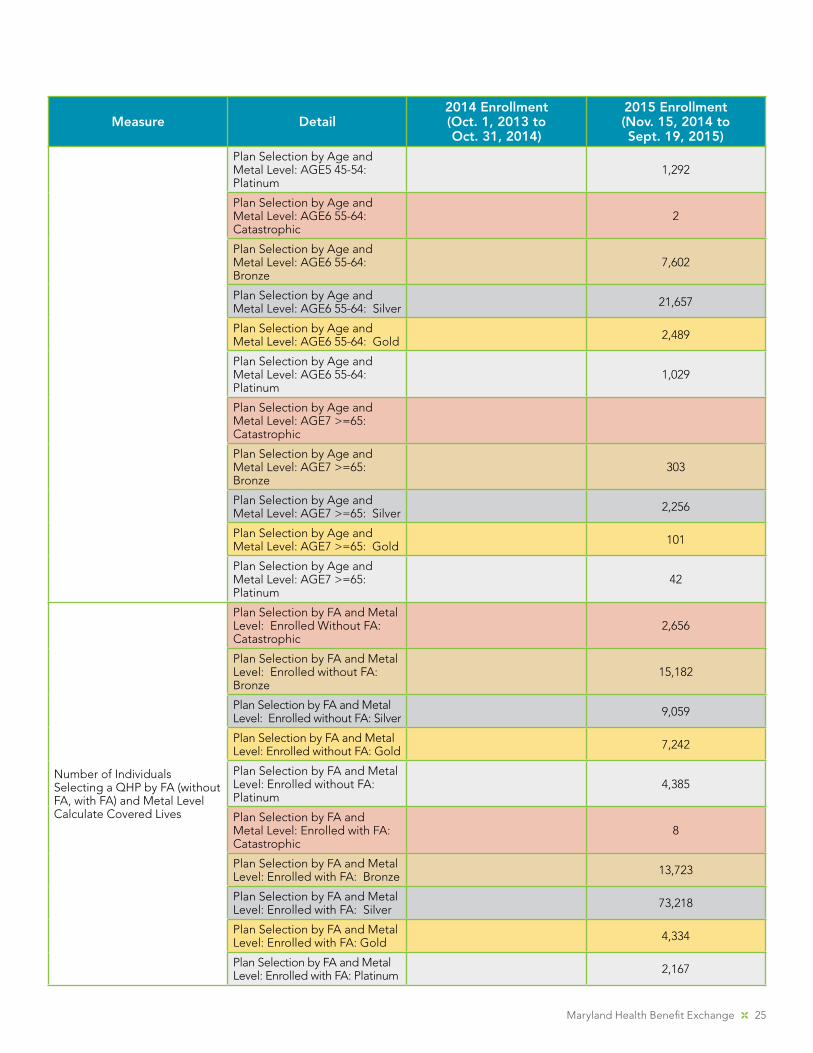
Maryland Health Benefit Exchange 25
Measure Detail2014 Enrollment(Oct. 1, 2013 to Oct. 31, 2014)
2015 Enrollment(Nov. 15, 2014 to Sept. 19, 2015)
Plan Selection by Age and Metal Level: AGE5 45-54: Platinum
1,292
Plan Selection by Age and Metal Level: AGE6 55-64: Catastrophic
2
Plan Selection by Age and Metal Level: AGE6 55-64: Bronze
7,602
Plan Selection by Age and Metal Level: AGE6 55-64: Silver 21,657
Plan Selection by Age and Metal Level: AGE6 55-64: Gold 2,489
Plan Selection by Age and Metal Level: AGE6 55-64: Platinum
1,029
Plan Selection by Age and Metal Level: AGE7 >=65: Catastrophic
Plan Selection by Age and Metal Level: AGE7 >=65: Bronze
303
Plan Selection by Age and Metal Level: AGE7 >=65: Silver 2,256
Plan Selection by Age and Metal Level: AGE7 >=65: Gold 101
Plan Selection by Age and Metal Level: AGE7 >=65: Platinum
42
Number of Individuals Selecting a QHP by FA (without FA, with FA) and Metal LevelCalculate Covered Lives
Plan Selection by FA and Metal Level: Enrolled Without FA: Catastrophic
2,656
Plan Selection by FA and Metal Level: Enrolled without FA: Bronze
15,182
Plan Selection by FA and Metal Level: Enrolled without FA: Silver 9,059
Plan Selection by FA and Metal Level: Enrolled without FA: Gold 7,242
Plan Selection by FA and Metal Level: Enrolled without FA: Platinum
4,385
Plan Selection by FA and Metal Level: Enrolled with FA: Catastrophic
8
Plan Selection by FA and Metal Level: Enrolled with FA: Bronze 13,723
Plan Selection by FA and Metal Level: Enrolled with FA: Silver 73,218
Plan Selection by FA and Metal Level: Enrolled with FA: Gold 4,334
Plan Selection by FA and Metal Level: Enrolled with FA: Platinum 2,167
26 2015 Annual Report
Measure Detail2014 Enrollment(Oct. 1, 2013 to Oct. 31, 2014)
2015 Enrollment(Nov. 15, 2014 to Sept. 19, 2015)
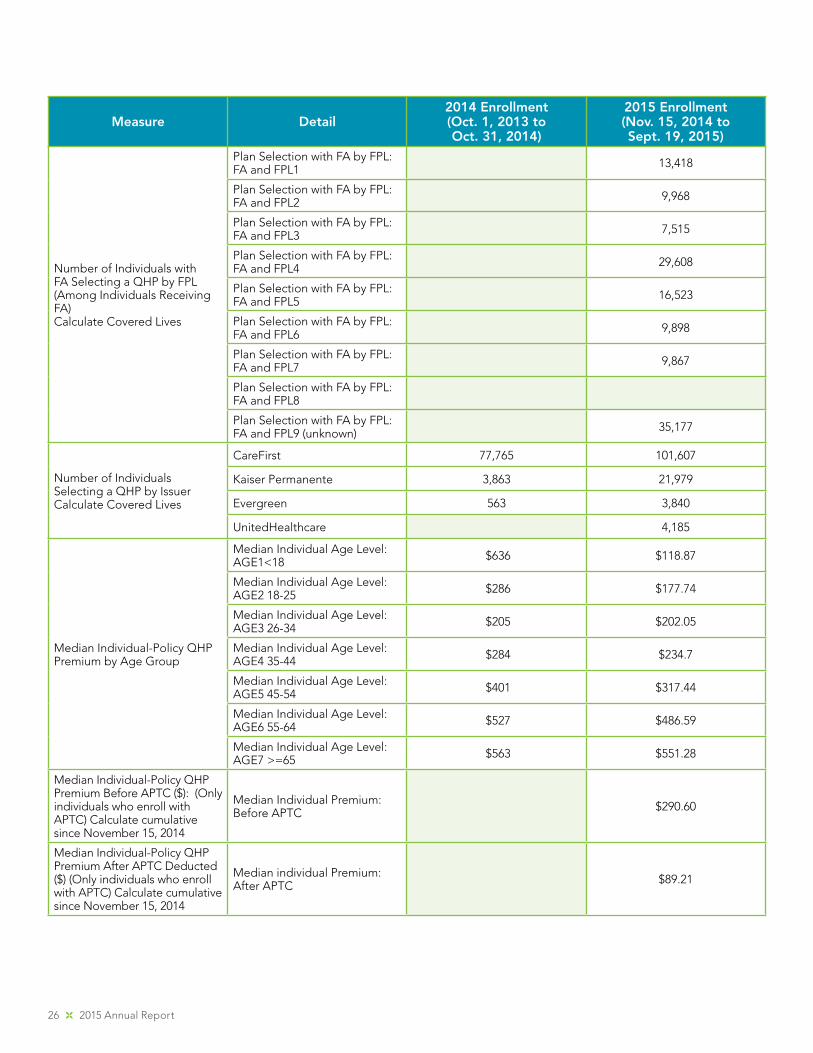
Number of Individuals with FA Selecting a QHP by FPL (Among Individuals Receiving FA)Calculate Covered Lives
Plan Selection with FA by FPL: FA and FPL1 13,418
Plan Selection with FA by FPL: FA and FPL2 9,968
Plan Selection with FA by FPL: FA and FPL3 7,515
Plan Selection with FA by FPL: FA and FPL4 29,608
Plan Selection with FA by FPL: FA and FPL5 16,523
Plan Selection with FA by FPL: FA and FPL6 9,898
Plan Selection with FA by FPL: FA and FPL7 9,867
Plan Selection with FA by FPL: FA and FPL8
Plan Selection with FA by FPL: FA and FPL9 (unknown) 35,177
Number of Individuals Selecting a QHP by IssuerCalculate Covered Lives
CareFirst 77,765 101,607
Kaiser Permanente 3,863 21,979
Evergreen 563 3,840
UnitedHealthcare 4,185
Median Individual-Policy QHP Premium by Age Group
Median Individual Age Level: AGE1<18 $636 $118.87
Median Individual Age Level: AGE2 18-25 $286 $177.74
Median Individual Age Level: AGE3 26-34 $205 $202.05
Median Individual Age Level: AGE4 35-44 $284 $234.7
Median Individual Age Level: AGE5 45-54 $401 $317.44
Median Individual Age Level: AGE6 55-64 $527 $486.59
Median Individual Age Level: AGE7 >=65 $563 $551.28
Median Individual-Policy QHP Premium Before APTC ($): (Only individuals who enroll with APTC) Calculate cumulative since November 15, 2014
Median Individual Premium: Before APTC $290.60
Median Individual-Policy QHP Premium After APTC Deducted ($) (Only individuals who enroll with APTC) Calculate cumulative since November 15, 2014
Median individual Premium: After APTC $89.21
Maryland Health Benefit Exchange 27
Measure Detail2014 Enrollment(Oct. 1, 2013 to Oct. 31, 2014)
2015 Enrollment(Nov. 15, 2014 to Sept. 19, 2015)
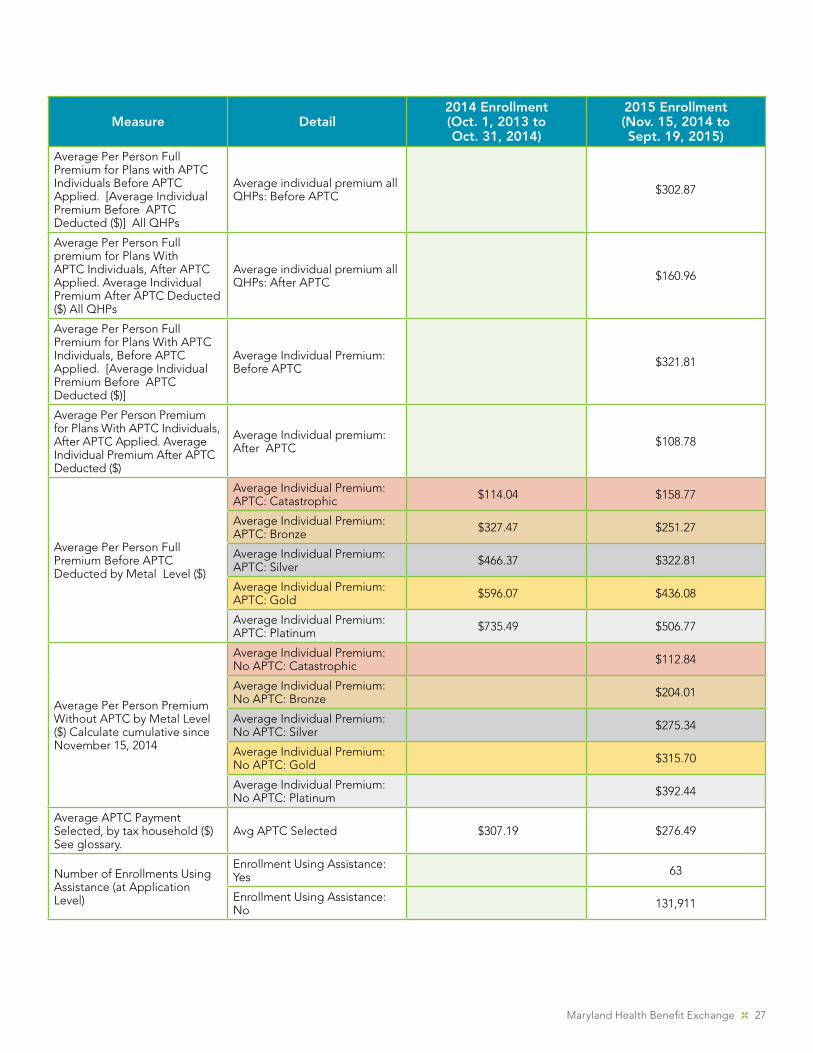
Average Per Person Full Premium for Plans with APTC Individuals Before APTC Applied. [Average Individual Premium Before APTC Deducted ($)] All QHPs
Average individual premium all QHPs: Before APTC $302.87
Average Per Person Full premium for Plans With APTC Individuals, After APTC Applied. Average Individual Premium After APTC Deducted ($) All QHPs
Average individual premium all QHPs: After APTC $160.96
Average Per Person Full Premium for Plans With APTC Individuals, Before APTC Applied. [Average Individual Premium Before APTC Deducted ($)]
Average Individual Premium: Before APTC $321.81
Average Per Person Premium for Plans With APTC Individuals, After APTC Applied. Average Individual Premium After APTC Deducted ($)
Average Individual premium: After APTC $108.78
Average Per Person Full Premium Before APTC Deducted by Metal Level ($)
Average Individual Premium: APTC: Catastrophic $114.04 $158.77
Average Individual Premium: APTC: Bronze $327.47 $251.27
Average Individual Premium: APTC: Silver $466.37 $322.81
Average Individual Premium: APTC: Gold $596.07 $436.08
Average Individual Premium: APTC: Platinum $735.49 $506.77
Average Per Person Premium Without APTC by Metal Level ($) Calculate cumulative since November 15, 2014
Average Individual Premium: No APTC: Catastrophic $112.84
Average Individual Premium: No APTC: Bronze $204.01
Average Individual Premium: No APTC: Silver $275.34
Average Individual Premium: No APTC: Gold $315.70
Average Individual Premium: No APTC: Platinum $392.44
Average APTC Payment Selected, by tax household ($) See glossary.
Avg APTC Selected $307.19 $276.49
Number of Enrollments Using Assistance (at Application Level)
Enrollment Using Assistance: Yes 63
Enrollment Using Assistance: No 131,911
28 2015 Annual Report
Measure Detail2014 Enrollment(Oct. 1, 2013 to Oct. 31, 2014)
2015 Enrollment(Nov. 15, 2014 to Sept. 19, 2015)
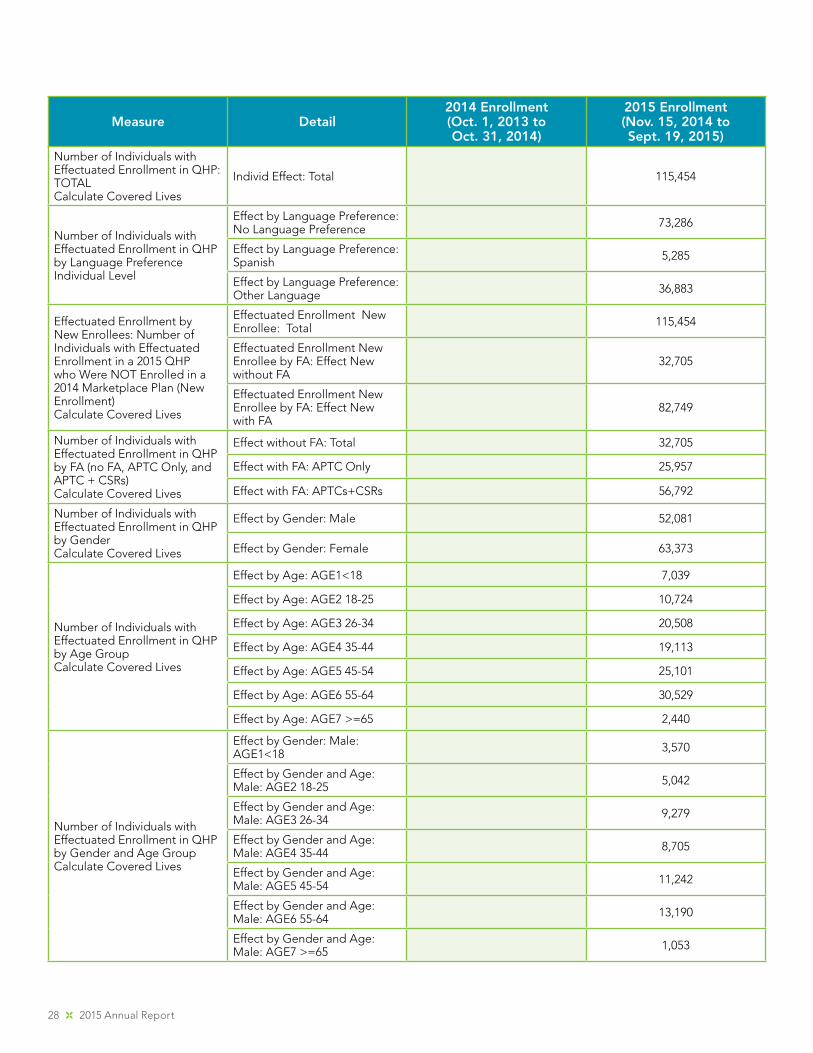
Number of Individuals with Effectuated Enrollment in QHP: TOTALCalculate Covered Lives
Individ Effect: Total 115,454
Number of Individuals with Effectuated Enrollment in QHP by Language PreferenceIndividual Level
Effect by Language Preference: No Language Preference 73,286
Effect by Language Preference: Spanish 5,285
Effect by Language Preference: Other Language 36,883
Effectuated Enrollment by New Enrollees: Number of Individuals with Effectuated Enrollment in a 2015 QHP who Were NOT Enrolled in a 2014 Marketplace Plan (New Enrollment)Calculate Covered Lives
Effectuated Enrollment New Enrollee: Total 115,454
Effectuated Enrollment New Enrollee by FA: Effect New without FA
32,705
Effectuated Enrollment New Enrollee by FA: Effect New with FA
82,749
Number of Individuals with Effectuated Enrollment in QHP by FA (no FA, APTC Only, and APTC + CSRs)Calculate Covered Lives
Effect without FA: Total 32,705
Effect with FA: APTC Only 25,957
Effect with FA: APTCs+CSRs 56,792
Number of Individuals with Effectuated Enrollment in QHP by GenderCalculate Covered Lives
Effect by Gender: Male 52,081
Effect by Gender: Female 63,373
Number of Individuals with Effectuated Enrollment in QHP by Age GroupCalculate Covered Lives
Effect by Age: AGE1<18 7,039
Effect by Age: AGE2 18-25 10,724
Effect by Age: AGE3 26-34 20,508
Effect by Age: AGE4 35-44 19,113
Effect by Age: AGE5 45-54 25,101
Effect by Age: AGE6 55-64 30,529
Effect by Age: AGE7 >=65 2,440
Number of Individuals with Effectuated Enrollment in QHP by Gender and Age GroupCalculate Covered Lives
Effect by Gender: Male: AGE1<18 3,570
Effect by Gender and Age: Male: AGE2 18-25 5,042
Effect by Gender and Age: Male: AGE3 26-34 9,279
Effect by Gender and Age: Male: AGE4 35-44 8,705
Effect by Gender and Age: Male: AGE5 45-54 11,242
Effect by Gender and Age: Male: AGE6 55-64 13,190
Effect by Gender and Age: Male: AGE7 >=65 1,053
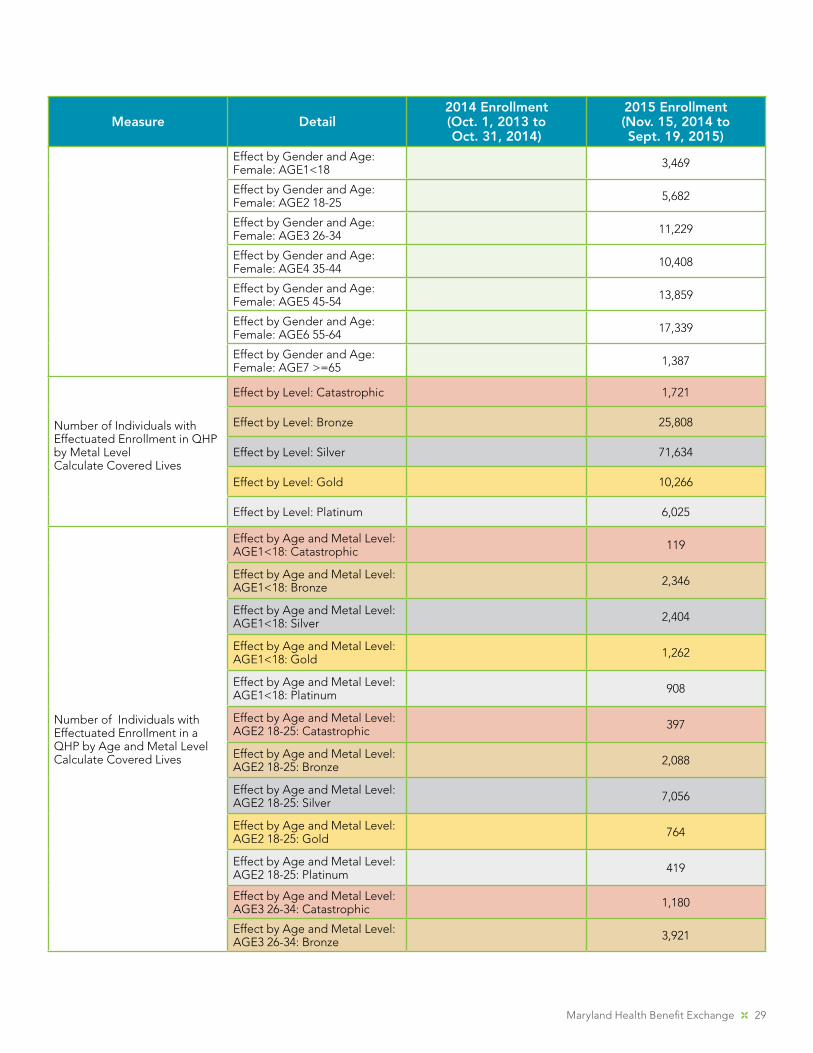
Maryland Health Benefit Exchange 29
Measure Detail2014 Enrollment(Oct. 1, 2013 to Oct. 31, 2014)
2015 Enrollment(Nov. 15, 2014 to Sept. 19, 2015)
Effect by Gender and Age: Female: AGE1<18 3,469
Effect by Gender and Age: Female: AGE2 18-25 5,682
Effect by Gender and Age: Female: AGE3 26-34 11,229
Effect by Gender and Age: Female: AGE4 35-44 10,408
Effect by Gender and Age: Female: AGE5 45-54 13,859
Effect by Gender and Age: Female: AGE6 55-64 17,339
Effect by Gender and Age: Female: AGE7 >=65 1,387
Number of Individuals with Effectuated Enrollment in QHP by Metal LevelCalculate Covered Lives
Effect by Level: Catastrophic 1,721
Effect by Level: Bronze 25,808
Effect by Level: Silver 71,634
Effect by Level: Gold 10,266
Effect by Level: Platinum 6,025
Number of Individuals with Effectuated Enrollment in a QHP by Age and Metal LevelCalculate Covered Lives
Effect by Age and Metal Level: AGE1<18: Catastrophic 119
Effect by Age and Metal Level: AGE1<18: Bronze 2,346
Effect by Age and Metal Level: AGE1<18: Silver 2,404
Effect by Age and Metal Level: AGE1<18: Gold 1,262
Effect by Age and Metal Level: AGE1<18: Platinum 908
Effect by Age and Metal Level: AGE2 18-25: Catastrophic 397
Effect by Age and Metal Level: AGE2 18-25: Bronze 2,088
Effect by Age and Metal Level: AGE2 18-25: Silver 7,056
Effect by Age and Metal Level: AGE2 18-25: Gold 764
Effect by Age and Metal Level: AGE2 18-25: Platinum 419
Effect by Age and Metal Level: AGE3 26-34: Catastrophic 1,180
Effect by Age and Metal Level: AGE3 26-34: Bronze 3,921
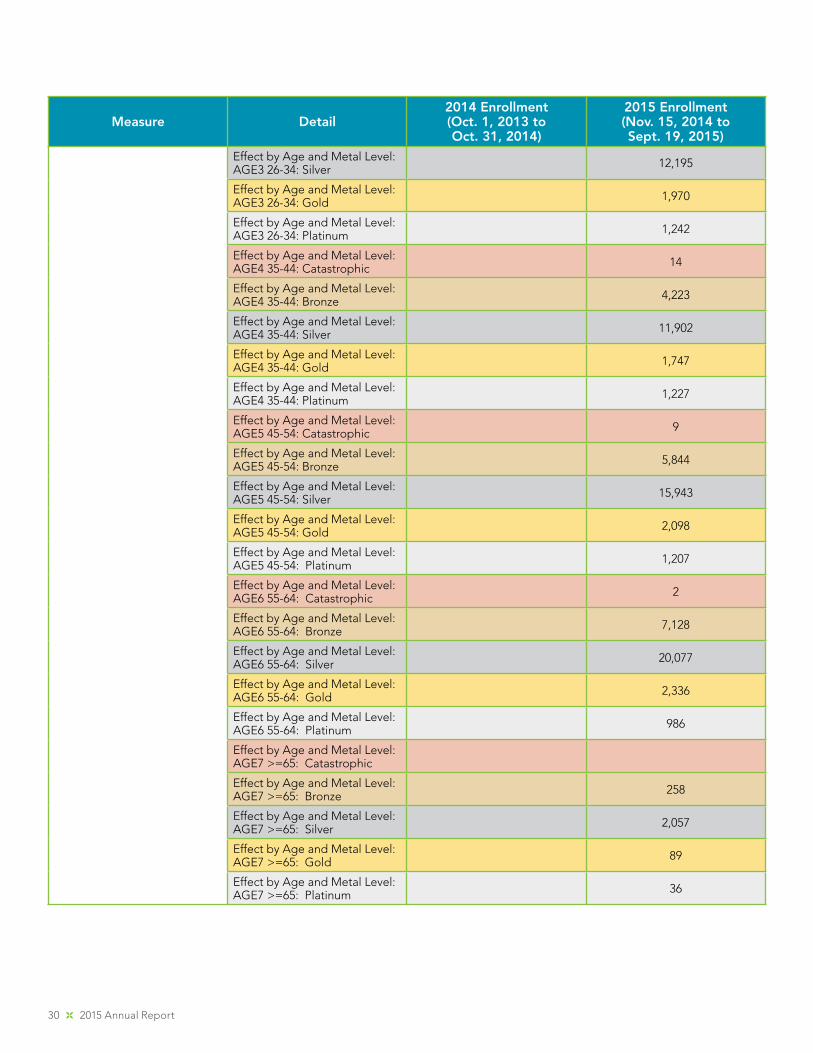
30 2015 Annual Report
Measure Detail2014 Enrollment(Oct. 1, 2013 to Oct. 31, 2014)
2015 Enrollment(Nov. 15, 2014 to Sept. 19, 2015)
Effect by Age and Metal Level: AGE3 26-34: Silver 12,195
Effect by Age and Metal Level: AGE3 26-34: Gold 1,970
Effect by Age and Metal Level: AGE3 26-34: Platinum 1,242
Effect by Age and Metal Level: AGE4 35-44: Catastrophic 14
Effect by Age and Metal Level: AGE4 35-44: Bronze 4,223
Effect by Age and Metal Level: AGE4 35-44: Silver 11,902
Effect by Age and Metal Level: AGE4 35-44: Gold 1,747
Effect by Age and Metal Level: AGE4 35-44: Platinum 1,227
Effect by Age and Metal Level: AGE5 45-54: Catastrophic 9
Effect by Age and Metal Level: AGE5 45-54: Bronze 5,844
Effect by Age and Metal Level: AGE5 45-54: Silver 15,943
Effect by Age and Metal Level: AGE5 45-54: Gold 2,098
Effect by Age and Metal Level: AGE5 45-54: Platinum 1,207
Effect by Age and Metal Level: AGE6 55-64: Catastrophic 2
Effect by Age and Metal Level: AGE6 55-64: Bronze 7,128
Effect by Age and Metal Level: AGE6 55-64: Silver 20,077
Effect by Age and Metal Level: AGE6 55-64: Gold 2,336
Effect by Age and Metal Level: AGE6 55-64: Platinum 986
Effect by Age and Metal Level: AGE7 >=65: Catastrophic
Effect by Age and Metal Level: AGE7 >=65: Bronze 258
Effect by Age and Metal Level: AGE7 >=65: Silver 2,057
Effect by Age and Metal Level: AGE7 >=65: Gold 89
Effect by Age and Metal Level: AGE7 >=65: Platinum 36
Maryland Health Benefit Exchange 31
Measure Detail2014 Enrollment(Oct. 1, 2013 to Oct. 31, 2014)
2015 Enrollment(Nov. 15, 2014 to Sept. 19, 2015)
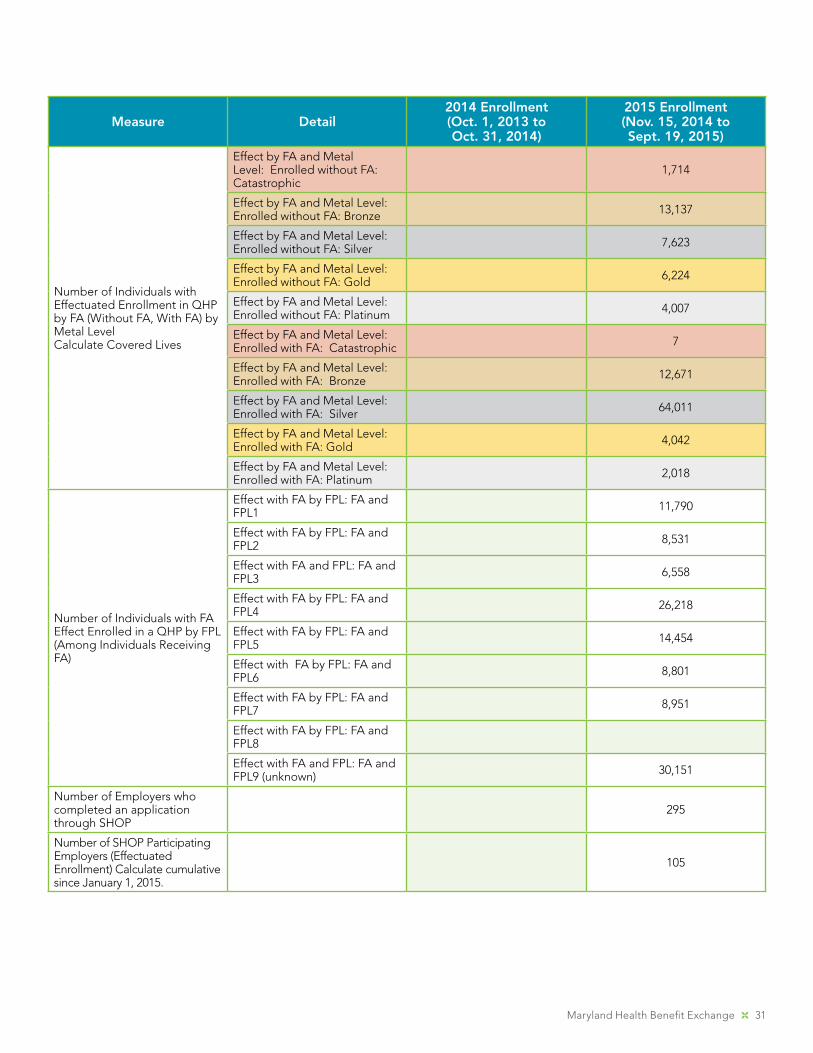
Number of Individuals with Effectuated Enrollment in QHP by FA (Without FA, With FA) by Metal LevelCalculate Covered Lives
Effect by FA and Metal Level: Enrolled without FA: Catastrophic
1,714
Effect by FA and Metal Level: Enrolled without FA: Bronze 13,137
Effect by FA and Metal Level: Enrolled without FA: Silver 7,623
Effect by FA and Metal Level: Enrolled without FA: Gold 6,224
Effect by FA and Metal Level: Enrolled without FA: Platinum 4,007
Effect by FA and Metal Level: Enrolled with FA: Catastrophic 7
Effect by FA and Metal Level: Enrolled with FA: Bronze 12,671
Effect by FA and Metal Level: Enrolled with FA: Silver 64,011
Effect by FA and Metal Level: Enrolled with FA: Gold 4,042
Effect by FA and Metal Level: Enrolled with FA: Platinum 2,018
Number of Individuals with FA Effect Enrolled in a QHP by FPL (Among Individuals Receiving FA)
Effect with FA by FPL: FA and FPL1 11,790
Effect with FA by FPL: FA and FPL2 8,531
Effect with FA and FPL: FA and FPL3 6,558
Effect with FA by FPL: FA and FPL4 26,218
Effect with FA by FPL: FA and FPL5 14,454
Effect with FA by FPL: FA and FPL6 8,801
Effect with FA by FPL: FA and FPL7 8,951
Effect with FA by FPL: FA and FPL8
Effect with FA and FPL: FA and FPL9 (unknown) 30,151
Number of Employers who completed an application through SHOP
295
Number of SHOP Participating Employers (Effectuated Enrollment) Calculate cumulative since January 1, 2015.
105
32 2015 Annual Report
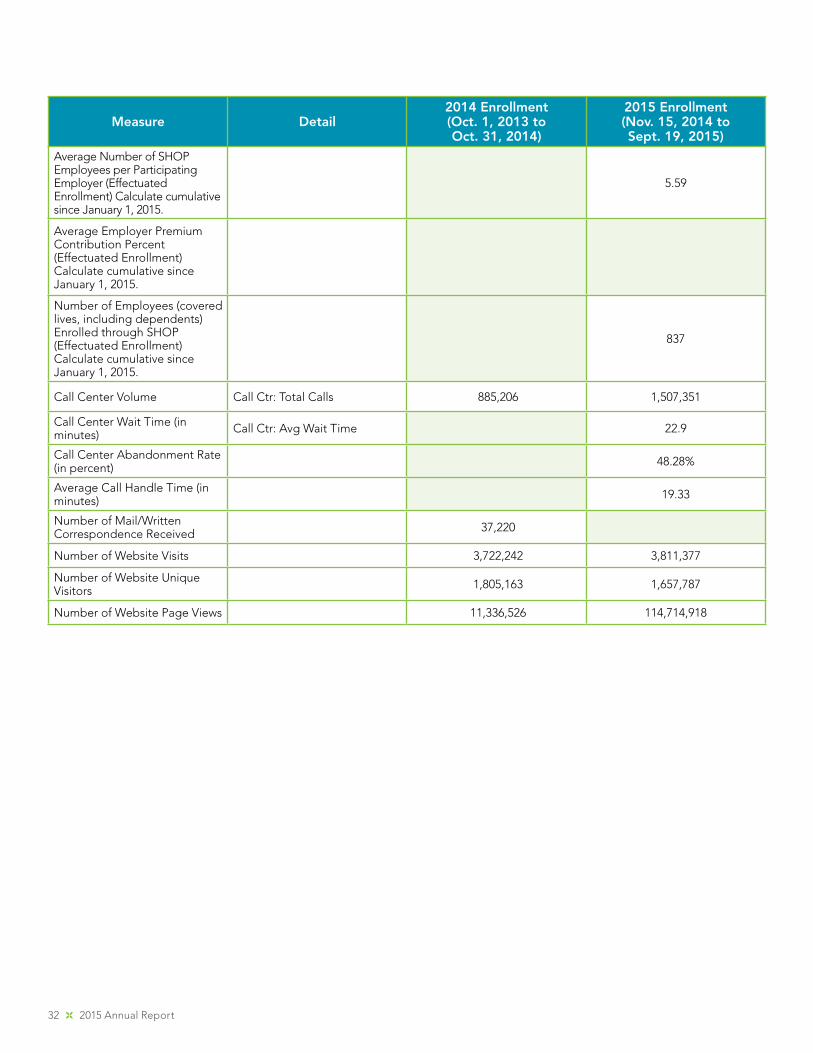
Measure Detail2014 Enrollment(Oct. 1, 2013 to Oct. 31, 2014)
2015 Enrollment(Nov. 15, 2014 to Sept. 19, 2015)
Average Number of SHOP Employees per Participating Employer (Effectuated Enrollment) Calculate cumulative since January 1, 2015.
5.59
Average Employer Premium Contribution Percent (Effectuated Enrollment) Calculate cumulative since January 1, 2015.
Number of Employees (covered lives, including dependents) Enrolled through SHOP (Effectuated Enrollment) Calculate cumulative since January 1, 2015.
837
Call Center Volume Call Ctr: Total Calls 885,206 1,507,351
Call Center Wait Time (in minutes) Call Ctr: Avg Wait Time 22.9
Call Center Abandonment Rate (in percent) 48.28%
Average Call Handle Time (in minutes) 19.33
Number of Mail/Written Correspondence Received 37,220
Number of Website Visits 3,722,242 3,811,377
Number of Website Unique Visitors 1,805,163 1,657,787
Number of Website Page Views 11,336,526 114,714,918
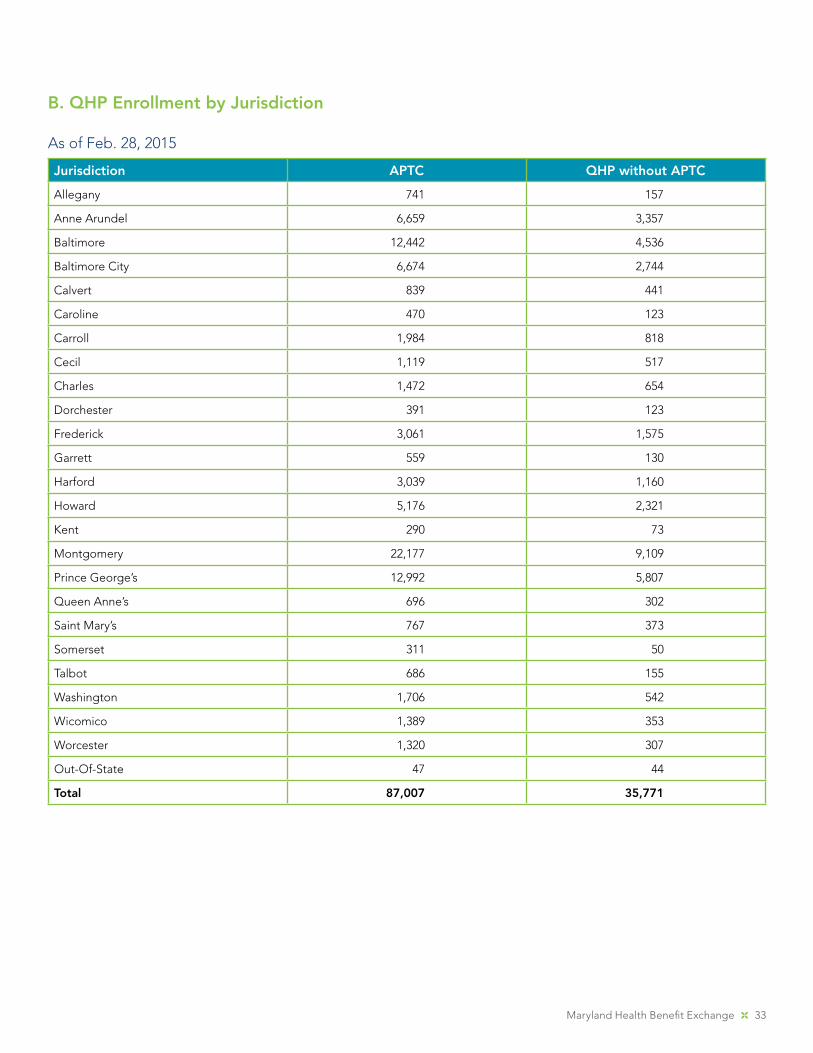
Maryland Health Benefit Exchange 33
As of Feb. 28, 2015
Jurisdiction APTC QHP without APTC
Allegany 741 157
Anne Arundel 6,659 3,357
Baltimore 12,442 4,536
Baltimore City 6,674 2,744
Calvert 839 441
Caroline 470 123
Carroll 1,984 818
Cecil 1,119 517
Charles 1,472 654
Dorchester 391 123
Frederick 3,061 1,575
Garrett 559 130
Harford 3,039 1,160
Howard 5,176 2,321
Kent 290 73
Montgomery 22,177 9,109
Prince George’s 12,992 5,807
Queen Anne’s 696 302
Saint Mary’s 767 373
Somerset 311 50
Talbot 686 155
Washington 1,706 542
Wicomico 1,389 353
Worcester 1,320 307
Out-Of-State 47 44
Total 87,007 35,771
B. QHP Enrollment by Jurisdiction
34 2015 Annual Report
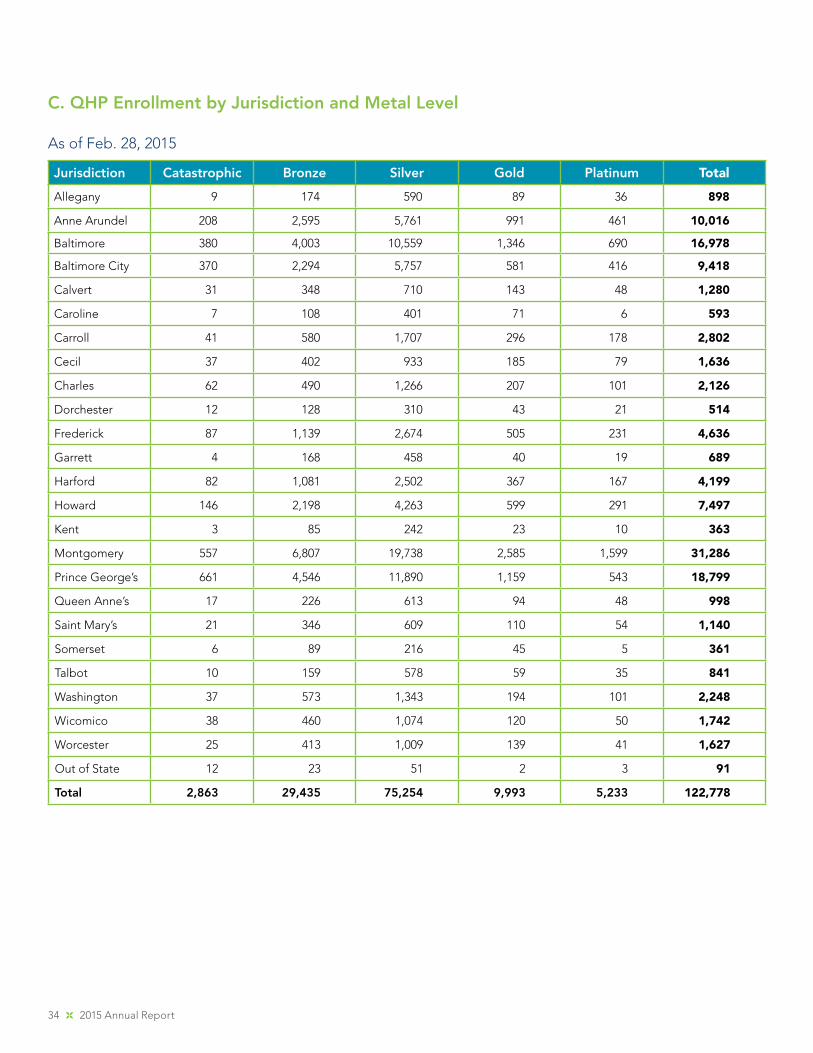
C. QHP Enrollment by Jurisdiction and Metal Level
As of Feb. 28, 2015
Jurisdiction Catastrophic Bronze Silver Gold Platinum Total
Allegany 9 174 590 89 36 898
Anne Arundel 208 2,595 5,761 991 461 10,016
Baltimore 380 4,003 10,559 1,346 690 16,978
Baltimore City 370 2,294 5,757 581 416 9,418
Calvert 31 348 710 143 48 1,280
Caroline 7 108 401 71 6 593
Carroll 41 580 1,707 296 178 2,802
Cecil 37 402 933 185 79 1,636
Charles 62 490 1,266 207 101 2,126
Dorchester 12 128 310 43 21 514
Frederick 87 1,139 2,674 505 231 4,636
Garrett 4 168 458 40 19 689
Harford 82 1,081 2,502 367 167 4,199
Howard 146 2,198 4,263 599 291 7,497
Kent 3 85 242 23 10 363
Montgomery 557 6,807 19,738 2,585 1,599 31,286
Prince George’s 661 4,546 11,890 1,159 543 18,799
Queen Anne’s 17 226 613 94 48 998
Saint Mary’s 21 346 609 110 54 1,140
Somerset 6 89 216 45 5 361
Talbot 10 159 578 59 35 841
Washington 37 573 1,343 194 101 2,248
Wicomico 38 460 1,074 120 50 1,742
Worcester 25 413 1,009 139 41 1,627
Out of State 12 23 51 2 3 91
Total 2,863 29,435 75,254 9,993 5,233 122,778
Maryland Health Benefit Exchange 35
D. Demographic Enrollment Data
As of Feb. 28, 2015
QHP Enrollment by Gender 2014 QHP Enrollment by Gender 2015
44,950 37,585 72,192 59,782
Female Male Female Male
QHP Enrollment by Gender 2014 & 2015
80,000
70,000
60,000
50,000
40,000
30,000
20,000
10,000
02014 2015
Female Male

36 2015 Annual Report
2014 QHP Enrollment by Age Groups 2015 QHP Enrollment by Age Groups
20,324
15,335
<18 18-25 26-34 35-44
45-54
15,27919,454
8,024
3,0121,107
32,779
24,966
22,50828,137
12,807
8,0752,702
QHP Enrollment by Age Group in 2014 & 2015
0
5,000
10,000
15,000
20,000
25,000
30,000
35,000
<18 18-25 26-34 35-44 45-54 55-64 >65
2014 2015
55-64 >65
<18 18-25 26-34 35-44
45-54 55-64 >65
Maryland Health Benefit Exchange 37
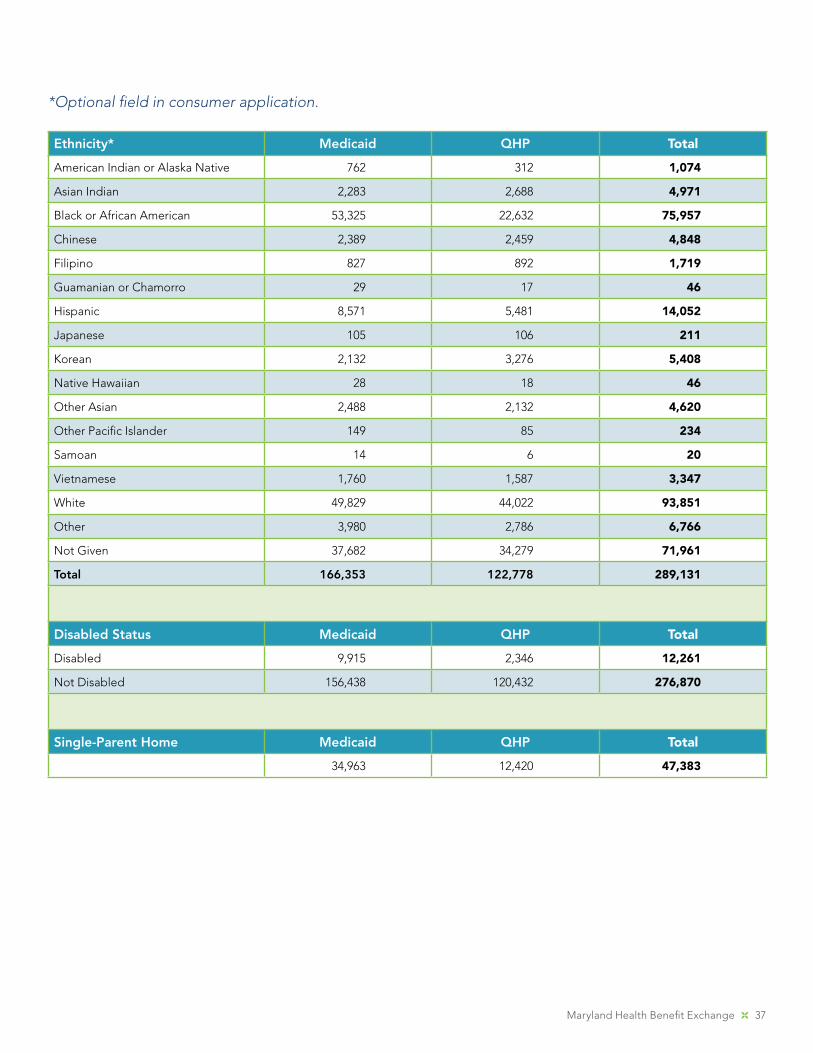
Ethnicity* Medicaid QHP Total
American Indian or Alaska Native 762 312 1,074
Asian Indian 2,283 2,688 4,971
Black or African American 53,325 22,632 75,957
Chinese 2,389 2,459 4,848
Filipino 827 892 1,719
Guamanian or Chamorro 29 17 46
Hispanic 8,571 5,481 14,052
Japanese 105 106 211
Korean 2,132 3,276 5,408
Native Hawaiian 28 18 46
Other Asian 2,488 2,132 4,620
Other Pacific Islander 149 85 234
Samoan 14 6 20
Vietnamese 1,760 1,587 3,347
White 49,829 44,022 93,851
Other 3,980 2,786 6,766
Not Given 37,682 34,279 71,961
Total 166,353 122,778 289,131
Disabled Status Medicaid QHP Total
Disabled 9,915 2,346 12,261
Not Disabled 156,438 120,432 276,870
Single-Parent Home Medicaid QHP Total
34,963 12,420 47,383
*Optional field in consumer application.
38 2015 Annual Report
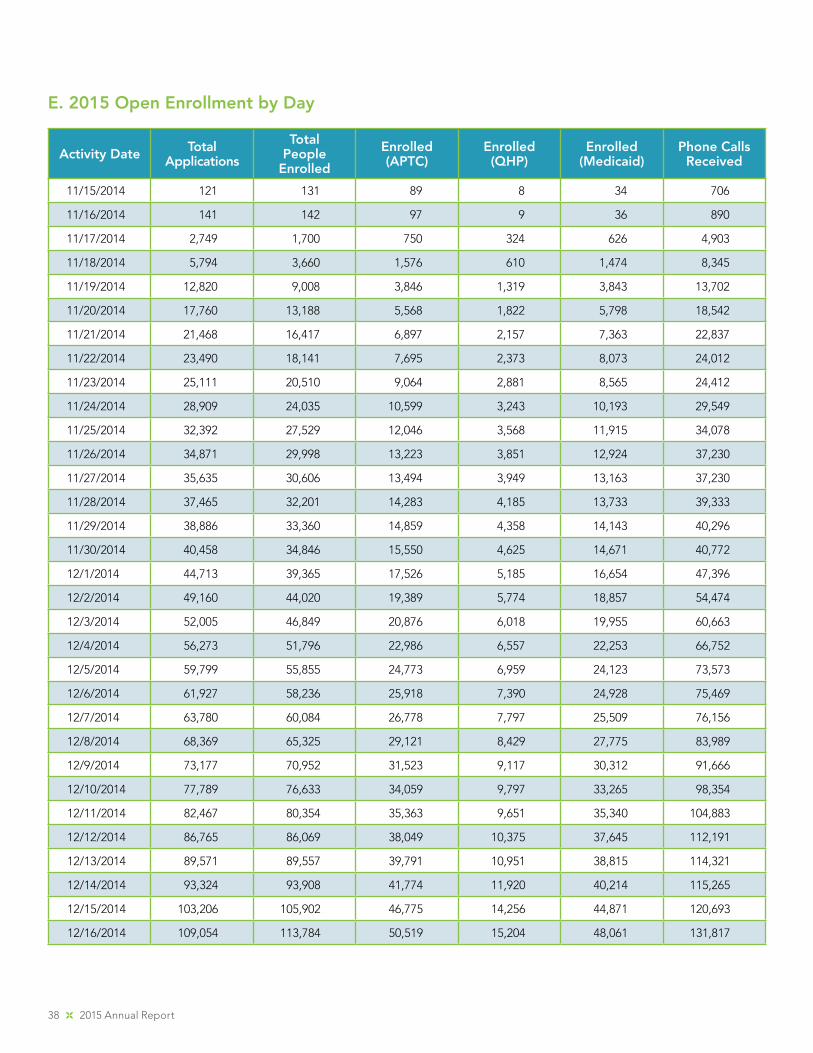
E. 2015 Open Enrollment by Day
Activity Date Total Applications
Total People
Enrolled
Enrolled (APTC)
Enrolled (QHP)
Enrolled (Medicaid)
Phone Calls Received
11/15/2014 121 131 89 8 34 706
11/16/2014 141 142 97 9 36 890
11/17/2014 2,749 1,700 750 324 626 4,903
11/18/2014 5,794 3,660 1,576 610 1,474 8,345
11/19/2014 12,820 9,008 3,846 1,319 3,843 13,702
11/20/2014 17,760 13,188 5,568 1,822 5,798 18,542
11/21/2014 21,468 16,417 6,897 2,157 7,363 22,837
11/22/2014 23,490 18,141 7,695 2,373 8,073 24,012
11/23/2014 25,111 20,510 9,064 2,881 8,565 24,412
11/24/2014 28,909 24,035 10,599 3,243 10,193 29,549
11/25/2014 32,392 27,529 12,046 3,568 11,915 34,078
11/26/2014 34,871 29,998 13,223 3,851 12,924 37,230
11/27/2014 35,635 30,606 13,494 3,949 13,163 37,230
11/28/2014 37,465 32,201 14,283 4,185 13,733 39,333
11/29/2014 38,886 33,360 14,859 4,358 14,143 40,296
11/30/2014 40,458 34,846 15,550 4,625 14,671 40,772
12/1/2014 44,713 39,365 17,526 5,185 16,654 47,396
12/2/2014 49,160 44,020 19,389 5,774 18,857 54,474
12/3/2014 52,005 46,849 20,876 6,018 19,955 60,663
12/4/2014 56,273 51,796 22,986 6,557 22,253 66,752
12/5/2014 59,799 55,855 24,773 6,959 24,123 73,573
12/6/2014 61,927 58,236 25,918 7,390 24,928 75,469
12/7/2014 63,780 60,084 26,778 7,797 25,509 76,156
12/8/2014 68,369 65,325 29,121 8,429 27,775 83,989
12/9/2014 73,177 70,952 31,523 9,117 30,312 91,666
12/10/2014 77,789 76,633 34,059 9,797 33,265 98,354
12/11/2014 82,467 80,354 35,363 9,651 35,340 104,883
12/12/2014 86,765 86,069 38,049 10,375 37,645 112,191
12/13/2014 89,571 89,557 39,791 10,951 38,815 114,321
12/14/2014 93,324 93,908 41,774 11,920 40,214 115,265
12/15/2014 103,206 105,902 46,775 14,256 44,871 120,693
12/16/2014 109,054 113,784 50,519 15,204 48,061 131,817
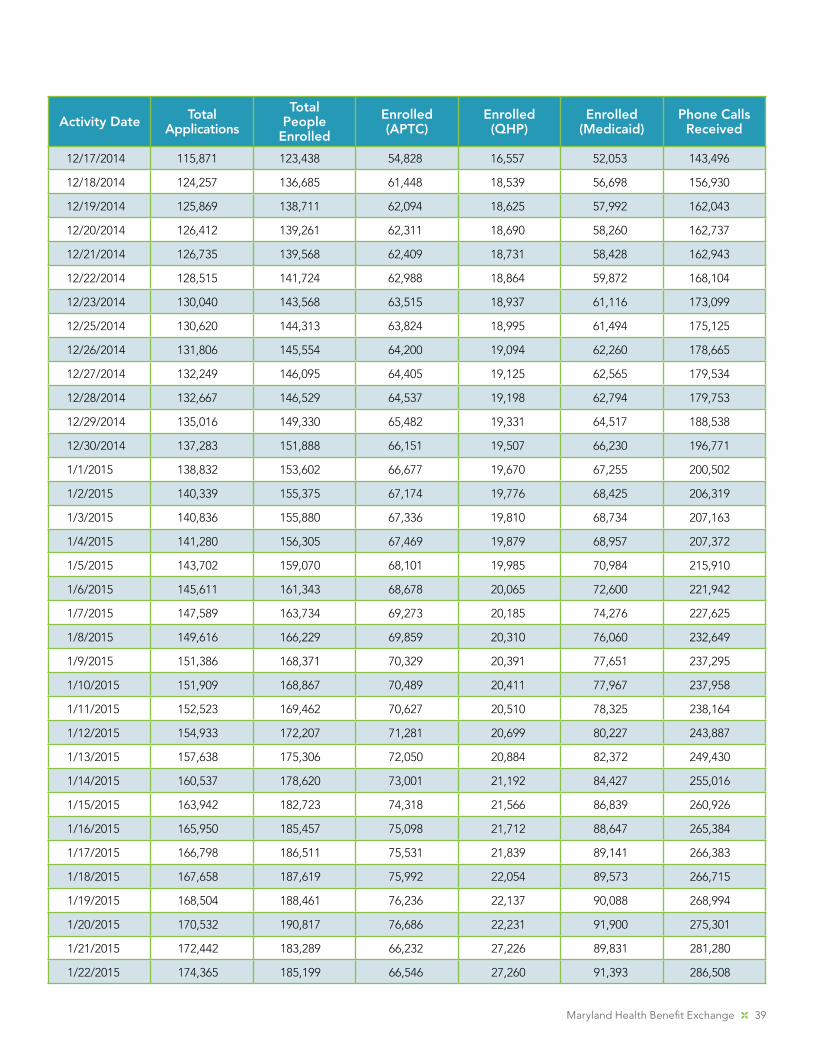
Maryland Health Benefit Exchange 39
Activity Date Total Applications
Total People
Enrolled
Enrolled (APTC)
Enrolled (QHP)
Enrolled (Medicaid)
Phone Calls Received
12/17/2014 115,871 123,438 54,828 16,557 52,053 143,496
12/18/2014 124,257 136,685 61,448 18,539 56,698 156,930
12/19/2014 125,869 138,711 62,094 18,625 57,992 162,043
12/20/2014 126,412 139,261 62,311 18,690 58,260 162,737
12/21/2014 126,735 139,568 62,409 18,731 58,428 162,943
12/22/2014 128,515 141,724 62,988 18,864 59,872 168,104
12/23/2014 130,040 143,568 63,515 18,937 61,116 173,099
12/25/2014 130,620 144,313 63,824 18,995 61,494 175,125
12/26/2014 131,806 145,554 64,200 19,094 62,260 178,665
12/27/2014 132,249 146,095 64,405 19,125 62,565 179,534
12/28/2014 132,667 146,529 64,537 19,198 62,794 179,753
12/29/2014 135,016 149,330 65,482 19,331 64,517 188,538
12/30/2014 137,283 151,888 66,151 19,507 66,230 196,771
1/1/2015 138,832 153,602 66,677 19,670 67,255 200,502
1/2/2015 140,339 155,375 67,174 19,776 68,425 206,319
1/3/2015 140,836 155,880 67,336 19,810 68,734 207,163
1/4/2015 141,280 156,305 67,469 19,879 68,957 207,372
1/5/2015 143,702 159,070 68,101 19,985 70,984 215,910
1/6/2015 145,611 161,343 68,678 20,065 72,600 221,942
1/7/2015 147,589 163,734 69,273 20,185 74,276 227,625
1/8/2015 149,616 166,229 69,859 20,310 76,060 232,649
1/9/2015 151,386 168,371 70,329 20,391 77,651 237,295
1/10/2015 151,909 168,867 70,489 20,411 77,967 237,958
1/11/2015 152,523 169,462 70,627 20,510 78,325 238,164
1/12/2015 154,933 172,207 71,281 20,699 80,227 243,887
1/13/2015 157,638 175,306 72,050 20,884 82,372 249,430
1/14/2015 160,537 178,620 73,001 21,192 84,427 255,016
1/15/2015 163,942 182,723 74,318 21,566 86,839 260,926
1/16/2015 165,950 185,457 75,098 21,712 88,647 265,384
1/17/2015 166,798 186,511 75,531 21,839 89,141 266,383
1/18/2015 167,658 187,619 75,992 22,054 89,573 266,715
1/19/2015 168,504 188,461 76,236 22,137 90,088 268,994
1/20/2015 170,532 190,817 76,686 22,231 91,900 275,301
1/21/2015 172,442 183,289 66,232 27,226 89,831 281,280
1/22/2015 174,365 185,199 66,546 27,260 91,393 286,508
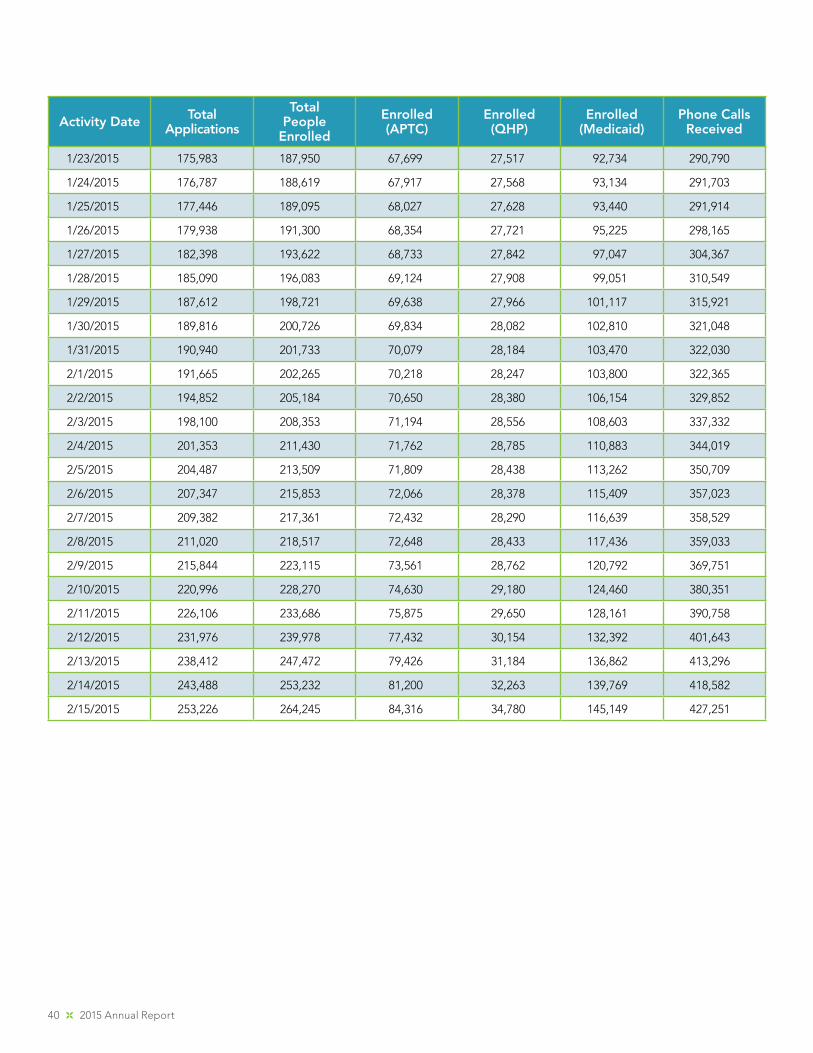
40 2015 Annual Report
Activity Date Total Applications
Total People
Enrolled
Enrolled (APTC)
Enrolled (QHP)
Enrolled (Medicaid)
Phone Calls Received
1/23/2015 175,983 187,950 67,699 27,517 92,734 290,790
1/24/2015 176,787 188,619 67,917 27,568 93,134 291,703
1/25/2015 177,446 189,095 68,027 27,628 93,440 291,914
1/26/2015 179,938 191,300 68,354 27,721 95,225 298,165
1/27/2015 182,398 193,622 68,733 27,842 97,047 304,367
1/28/2015 185,090 196,083 69,124 27,908 99,051 310,549
1/29/2015 187,612 198,721 69,638 27,966 101,117 315,921
1/30/2015 189,816 200,726 69,834 28,082 102,810 321,048
1/31/2015 190,940 201,733 70,079 28,184 103,470 322,030
2/1/2015 191,665 202,265 70,218 28,247 103,800 322,365
2/2/2015 194,852 205,184 70,650 28,380 106,154 329,852
2/3/2015 198,100 208,353 71,194 28,556 108,603 337,332
2/4/2015 201,353 211,430 71,762 28,785 110,883 344,019
2/5/2015 204,487 213,509 71,809 28,438 113,262 350,709
2/6/2015 207,347 215,853 72,066 28,378 115,409 357,023
2/7/2015 209,382 217,361 72,432 28,290 116,639 358,529
2/8/2015 211,020 218,517 72,648 28,433 117,436 359,033
2/9/2015 215,844 223,115 73,561 28,762 120,792 369,751
2/10/2015 220,996 228,270 74,630 29,180 124,460 380,351
2/11/2015 226,106 233,686 75,875 29,650 128,161 390,758
2/12/2015 231,976 239,978 77,432 30,154 132,392 401,643
2/13/2015 238,412 247,472 79,426 31,184 136,862 413,296
2/14/2015 243,488 253,232 81,200 32,263 139,769 418,582
2/15/2015 253,226 264,245 84,316 34,780 145,149 427,251