Embed Size (px)
Citation preview
Entropy 2014, 16, 4801-4817; doi:10.3390/e16094801
entropy ISSN 1099-4300
www.mdpi.com/journal/entropy
Article
Pneumatic Performance Study of a High Pressure Ejection Device Based on Real Specific Energy and Specific Enthalpy
Jie Ren *, Fengbo Yang, Dawei Ma, Guigao Le and Jianlin Zhong
School of Mechanical Engineering, Nanjing University of Science and Technology, Nanjing 210094,
Jiangsu, China; E-Mails: [email protected] (F.Y.); [email protected] (D.M.);
[email protected] (G.L.); [email protected] (J.Z.)
* Author to whom correspondence should be addressed; E-Mail: [email protected]; Tel.: +86-25-8431-5125.
Received: 8 May 2014; in revised form: 10 August 2014 / Accepted: 29 August 2014 /
Published: 3 September 2014
Abstract: In high-pressure dynamic thermodynamic processes, the pressure is much higher
than the air critical pressure, and the temperature can deviate significantly from the Boyle
temperature. In such situations, the thermo-physical properties and pneumatic performance
can’t be described accurately by the ideal gas law. This paper proposes an approach to
evaluate the pneumatic performance of a high-pressure air catapult launch system, in which
esidual functions are used to compensate the thermal physical property uncertainties of
caused by real gas effects. Compared with the Nelson-Obert generalized compressibility
charts, the precision of the improved virial equation of state is better than
Soave-Redlich-Kwong (S-R-K) and Peng-Robinson (P-R) equations for high pressure air. In
this paper, the improved virial equation of state is further used to establish a compressibility
factor database which is applied to evaluate real gas effects. The specific residual
thermodynamic energy and specific residual enthalpy of the high-pressure air are also
derived using the modified corresponding state equation and improved virial equation of state
which are truncated to the third virial coefficient. The pneumatic equations are established
on the basis of the derived residual functions. The comparison of the numerical results shows
that the real gas effects are strong, and the pneumatic performance analysis indicates that the
real dynamic thermodynamic process is obviously different from the ideal one.
Keywords: thermodynamics; residual function; specific thermodynamic energy; specific
enthalpy; high pressure air; compressibility factor
OPEN ACCESS
Entropy 2014, 16 4802
1. Introduction
Compared to petroleum or electric systems, high pressure air has the advantages of no pollution, high
power density, cheapness, reliable performance, recycling use, and being easy to maintain [1,2]. It has
been applied to industrial automation, robot driving, compressed air powered vehicles, and even some
special industries such as aeronautics, astronautics, and weapons design [3]. Typically, the charging and
discharging performance and exergy analysis [4] are based on the equations of state. However, in
high-pressure pneumatic dynamic thermodynamic processes, the pressure is much higher than the air
critical pressure and the temperature can deviate significantly from the Boyle temperature. Since the
thermodynamic properties based on the ideal gas are not authentic [5], the deviations in the mass and
energy balances in thermodynamic process may not be acceptable. In this paper, the specific residual
thermodynamic energy and specific residual enthalpy will be derived to compensate for the real gas effect.
Extensive studies have been conducted on high pressure pneumatic systems [6,7]. In these works,
most of the thermodynamic property calculations are still based on the ideal gas assumption, although
the specific thermodynamic energy and specific enthalpy of an ideal gas and a real gas can differ
considerably under high pressure and low temperature conditions. In this study, we will also examine the
deviation between the state variables computed by the real gas equation and ideal gas assumption.
Many semi-empirical formulas have been proposed to describe the properties of real gases, including
the van der Waals equation [5], Redlich-Kwong (R-K) equation [8], Soave-Redlich-Kwong (S-R-K)
equation [9], Benedict-Webb-Rubin (B-W-R) equation [10], and Peng-Robinson (P-R) equation [11,12].
With the development of the corresponding states principles, these equations are applicable to all kinds
of gases within a certain pressure and temperature range. However, the precision of some of these
equations is not satisfactory, or when calculating the thermodynamic variables by using high order
nonlinear equations, like the S-R-K and P-R equations, it will lead to the extra problem of solving
transcendental equations, which appearance is not desirable. The SAFT-type equation of state [13] is
accurate enough to calculate thermodynamic variables of air, while the mathematical expression of the
derived functions are complex.
2. Derivation and Determination of Real Gas Equation of State for High Pressure Air
According to the corresponding state law, the compressibility factor which indicates the deviation of
real gas from ideal gas can be obtained from the table of corresponding states [14]:
,m c mc r mrc r r
c r
PV PV PVZ Z P T
RT RT T
(1)
The compressibility factor is a function of the corresponding pressure and temperature. The
compressibility factor value of an ideal gas is 1. For most gases, the P-Z curves can be approximately
considered to be linear when the pressure P < 0.5Pc or the temperature T > 5Tc, and the compressibility
factor Z is nearly 1. However, under high pressure conditions over 0.5Pc, or low temperature conditions
below 5Tc, a reliable and simple real gas equation of state should be derived to fit the data.
The virial coefficients which are basic thermodynamic properties represent the non-ideal behavior of
real gases. The importance of the virial coefficients lies in the fact that they are related directly to the
interactions between molecules. The second virial coefficient represents the deviation behavior from
Entropy 2014, 16 4803
ideality due to interactions between pairs of molecules, the third virial coefficient gives the effects of
interactions of molecular triplets, and so on. The fourth and higher virial coefficients usually contribute
little to the densities of gases and have relatively large uncertainties. Therefore, the accurate knowledge
of the virial coefficients is of great significance. In order to improve the accuracy of calculation, most
effort has been focused on obtaining the second [15,16] and third virial coefficients [17,18].
The volume serial form of the virial equation which is truncated to the third virial coefficient can be
written as:
21m
m m
PV B C
RT V V (2)
After the introduction of the critical pressure Pc, the critical temperature Tc, acentric factor ω, and the
extended corresponding states variable θ [19], the second and third virial coefficients of the
corresponding state can be expressed as:
0 1 2( ) ( ) ( )cr r r r r r r
c
BPB B T B T B T
RT (3)
20 1 2
2( ) ( ) ( )
( )c
r r r r r r rc
CPC C T C T C T
RT (4)
where Br0(Tr), Cr
0(Tr) are obtained by fitting data for small spherical molecules (ω = 0); Br1(Tr), Cr
1(Tr)
are obtained from data for larger, non-spherical, non-polar molecules (ω ≠ 0); Br2(Tr), Cr
2(Tr) are
obtained from data for non-hydrogen bonding polar molecules; and Tr = T/Tc.
In this paper, the real gas is assumed to be air in chemical equilibrium [20]. The National Institute of
Standards and Technology (NIST) provides a basic model of air [21], which consists of nitrogen,
oxygen, and argon. These are non polar molecules, the Br2(Tr), and Cr
2(Tr) of dry air are 0, and the critical
parameters of air are: Tc = 132.45K, Pc = 3.77MPa. The improved formulas of Br0(Tr), Br
1(Tr), Cr0(Tr),
and Cr1(Tr) given by references [22–24] are:
02 3 8
0.30252 0.15668 0.00724 0.00022( ) 0.13356r r
r r r r
B TT T T T
(5)
12 3 8
0.15581 0.38183 0.44044 0.00541( ) 0.17404r r
r r r r
B TT T T T
(6)
02.8 10.5
0.02432 0.00313( ) 0.01407r r
r r
C TT T
(7)
12.8 3 6 10.5
0.0177 0.04 0.003 0.00228( ) 0.02676r r
r r r r
C TT T T T
(8)
The Peng-Robinson (P-R) equation, Equation (9), is an improvement on the van der Waals equation.
It was proposed in 1976 [12,13]:
( )
( ) ( )
RT a Tp
v b v v b b v b
(9)
Entropy 2014, 16 4804
where 2 2
20.5( ) 0.42748 1 1c
r
c
a TR T
r Tp
, 20.48 1.574 0.176r w w , and
0.08664c
c
RTb
p .
In the general high pressure pneumatic system, the pressure can reach 30 MPa, and the temperature
range is about 250 K< T <400 K. Compared with the Nelson-Obert’s generalized compressibility
chart [1], the P-R equation is more precise than the S-R-K equation in the compressibility factor
calculation of air [1]. In this paper we calculate the compressibility factor, using improved virial and
P-R equations. The results of some feature points are shown in Table 1. The data for air fitted in this
paper are provided by the real properties database of National Institute of Standards and Technology
(NIST) [25], as shown in Table 2.
Table 1. Compressibility factors of air using improved virial equation and P-R equation.
Compressibility Factors Z Pressure [MPa]
0.101 1 6 12 19.43 25 30
Temperature [K]
400 virial 1.0002 1.0019 1.0146 1.0358 1.0695 1.0986 1.1268
P-R 1.0001 1.0007 1.0077 1.0231 1.0504 1.0755 1.1005
298 virial 0.9997 0.9969 0.9880 0.9922 1.0173 1.0470 1.0788
P-R 0.9994 0.9947 0.9772 0.9773 1 1.0275 1.0620
250 virial 0.9990 0.9907 0.9540 0.9351 0.9505 0.9832 1.0209
P-R 0.9987 0.9875 0.9392 0.9190 0.9382 0.9725 1.0170
200 virial 0.9976 0.9765 0.8687 0.7942 0.8133 0.8685 0.9278
P-R 0.9970 0.9710 0.8476 0.7831 0.8157 0.8775 0.9465
Table 2. Specific volume within different temperature and pressure.
Specific volume [m3/kg]
Pressure [MPa]
0.1 0.5 1 6 10 15 20 25 30
Temperature [K]
100 0.281 0.0509 0.00130 0.00126 0.00125 0.00122 0.00120 0.00119 0.00117 140 0.399 0.0773 0.0370 0.00222 0.00174 0.00158 0.00150 0.00144 0.00139200 0.537 0.114 0.0561 0.00833 0.00467 0.00309 0.00245 0.00214 0.00195260 0.746 0.149 0.0741 0.0120 0.00713 0.00478 0.00368 0.00307 0.00269300 0.861 0.172 0.0859 0.0142 0.00855 0.00578 0.00446 0.00368 0.00318400 0.148 0.230 0.115 0.0194 0.0118 0.00806 0.00620 0.00509 0.00437
The error results when calculating the compressibility factor within the pressure range of
0.101325 MPa < P < 30 MPa at the temperatures of 400 K, 300 K and 260 K, respectively, are shown as
Table 3. From Table 3, it is found that the precision of improved virial equation is better than P-R
equation compared to the NIST database.
Compared with the P-R equation, the precision of the improved virial equation is better. The
precision can meet the requirements of general engineering computation. Therefore, the improved virial
equation is adopted to calculate compressibility factor, and in this paper the thermodynamic variables
will be derived based on the improved virial equation of state.
Entropy 2014, 16 4805
Table 3. Error of compressibility factors for air using improved virial equation and P-R
equation respectively.
Temperature [K]
Pressure range [MPa]
P-R equation Improved virial equation Maximum absolute
error
Maximum relative error
Maximum absolute
error
Maximum relative error
400 0.101325~30 0.0415 3.63% 0.0152 1.33% 300 0.101325~30 0.0467 4.21% 0.0274 2.47% 260 0.101325~30 0.0555 5.13% 0.0457 4.23%
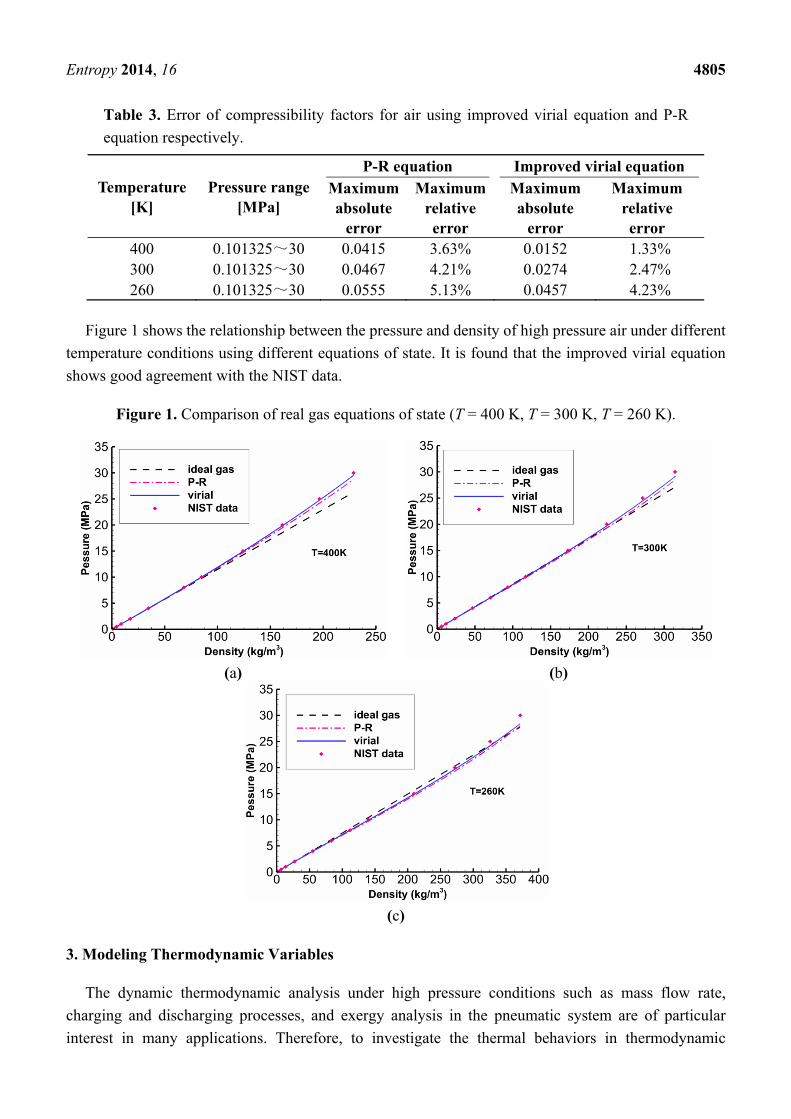
Figure 1 shows the relationship between the pressure and density of high pressure air under different
temperature conditions using different equations of state. It is found that the improved virial equation
shows good agreement with the NIST data.
Figure 1. Comparison of real gas equations of state (T = 400 K, T = 300 K, T = 260 K).
(a) (b)
(c)
3. Modeling Thermodynamic Variables
The dynamic thermodynamic analysis under high pressure conditions such as mass flow rate,
charging and discharging processes, and exergy analysis in the pneumatic system are of particular
interest in many applications. Therefore, to investigate the thermal behaviors in thermodynamic
Entropy 2014, 16 4806
processes, which can be used to predict the gas pressure, temperature and flow rate, it is essential to
derive the thermodynamic variables on the basis of real gas equation states. In this section, the real
analytical expressions of specific thermodynamic energy and specific enthalpy will be derived for high
pressure air.
3.1. Residual Functions
In the calculation of real thermodynamic property variables, the ideal value can be calculated first,
then the residual function will subtracted from the ideal value. The definition of residual function can be
expressed as:
reF F F (10)
where Fre denotes the residual of a arbitrary extensive properties or specific properties, that is, the
difference between the properties of ideal gas and real gas, F* denotes the properties of ideal gas, and F
denotes the properties of real gas.
The differential form of specific thermodynamic energy for real gas is:
[ ( ) ]P
du c dT p T dvv vT
(11)
We have:
u pT p
v TT v
(12)
The residual specific thermodynamic energy for a real gas is obtained by integrating the equation
above from v* = ∞ (ideal gas state) to v (real gas state) along the isotherm:
2 ( / )( )
v v
rv
p p Tu p T dv T dv
T T
(13)
The specific enthalpy for a real gas is defined as:
h u pv (14)
and the specific enthalpy for an ideal gas can be expressed by: * *
gh u R T (15)
Combination of the above three equations will lead to:
2 ( / )v
r gv
p Th T dv pv R T
T
(16)
3.2 Thermodynamic Variables of Ideal Gas
The specific thermodynamic energy and specific enthalpy of ideal gas can be written as:
0
* *0( )
T
VTu T c dT u (17)
Entropy 2014, 16 4807
0
* *0( ) ( )
T
V gTh T c R dT h (18)
For ideal gas, isochoric heat capacity can be expressed by:
* 2 3 4( 1)V gc R T T T T (19)
where 3.653 , 31.337 10 , 63.294 10 , 91.913 10 , and 120.2763 10 .
3.3 Thermodynamic Variables of Real Gas
Based on the improved virial equation and substituting Equations (13), (16), (17) and (18) into
Equation (10), respectively, the analytical expressions of specific thermodynamic energy and specific
enthalpy for real gas are obtained as follows:
0
2 3 40
2 3 8
2 7
2 3 8
2 7
2 2 2.8
2 2 1.8
( 1)
0.31336 0.02172 0.001760.30252
0.763662 1.32132 0.043280.15581
0.068096 0.032865
2
T
gT
g c c c cc
c m
c c cc
g c c
c m
u R T T T T dT u
RR T T T TT
p V T T T
T T Tw T
T T T
R R T T T
p V T
+
+
10.5 2.8 3 6 10.5
9.5 1.8 2 5 9.5
0.04956 0.12 0.018 0.02394c c c c cT T T Tw
T T T T T
(20)
0
2 3 40
2 3 8
2 7
2 3 8
2 7
2 2 2.8
2 2 1.8
0.31336 0.02172 0.001760.30252
0.763662 1.32132 0.04328 0.15581
0.068096 0
2
T
gT
g c c c cc
c m
c c cc
g c c
c m
h R T T T T dT h
RR T T T TT
p V T T T
T T Tw T
T T T
R R T T
p V T
+
+
10.5 2.8 3 6 10.5
9.5 1.8 2 5 9.5
0 1 2 2 0 1 2
2 2 2
.032865 0.04956 0.12 0.018 0.02394
( ) ( ) ( ) ( ) ( ) ( ) ( )
c c c c c
c r r r r r r c r r r r r r
gc c
T T T T Tw
T T T T T
RT B T B T B T RT C T C T C TR T
vMP v M P
(21)
4. Modeling of Pneumatic Catapult
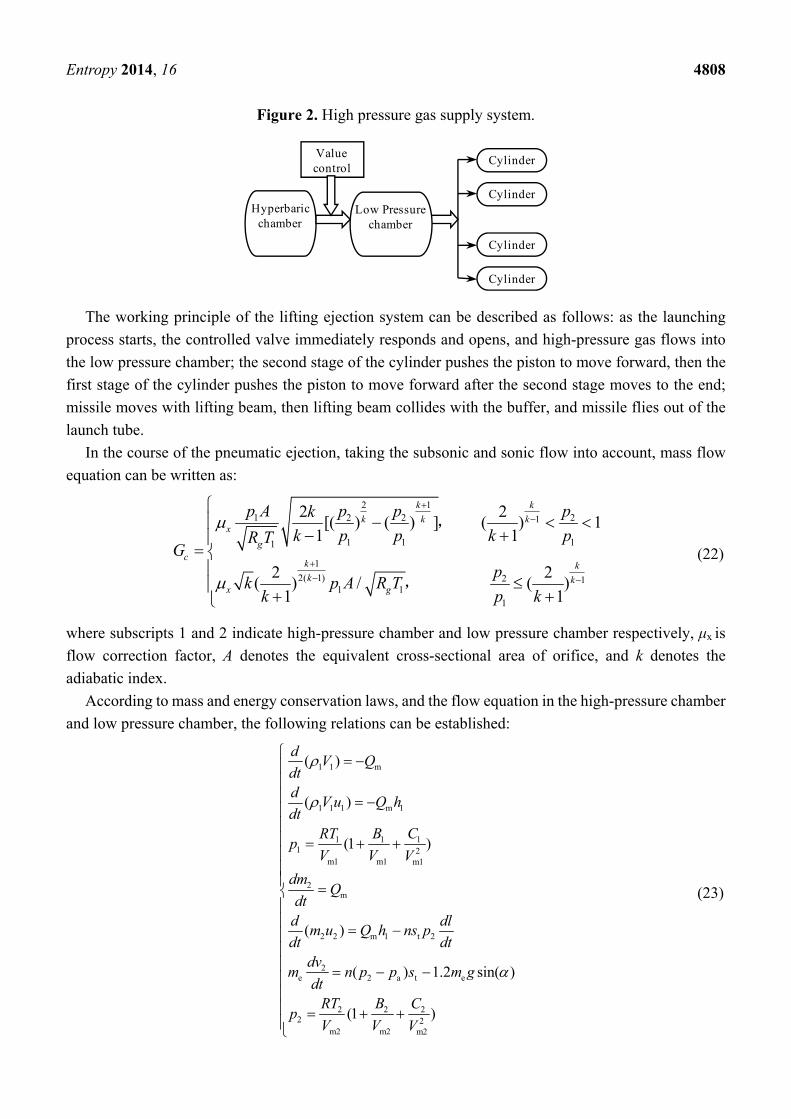
Figure 2 shows the working principle of a high pressure pneumatic catapult, and Figure 3 is the
schematic diagram of the lifting ejection mechanism which is a schematic structural diagram of the
three-step piston cylinder in Figure 1 and component 6 in Figure 4. There da is the diameter of the piston
rod, dc is the diameter of piston, Sa is an effective thrust area of the third stage cylinder, Lb represents the
second cylinder, and Lc represents the third stage cylinder.
Entropy 2014, 16 4808
Figure 2. High pressure gas supply system.
The working principle of the lifting ejection system can be described as follows: as the launching
process starts, the controlled valve immediately responds and opens, and high-pressure gas flows into
the low pressure chamber; the second stage of the cylinder pushes the piston to move forward, then the
first stage of the cylinder pushes the piston to move forward after the second stage moves to the end;
missile moves with lifting beam, then lifting beam collides with the buffer, and missile flies out of the
launch tube.
In the course of the pneumatic ejection, taking the subsonic and sonic flow into account, mass flow
equation can be written as:
2 11 2 2 21
1 1 11
1
2( 1) 2 11 1
1
2 2[( ) ( ) ] ( ) 1
1 1
2 2( ) / ( )
1 1
k k
k k kx
gc
k kk k
x g
p A p p pk
k p p k pR TG
pk p A R T
k p k
,
,
(22)
where subscripts 1 and 2 indicate high-pressure chamber and low pressure chamber respectively, μx is
flow correction factor, A denotes the equivalent cross-sectional area of orifice, and k denotes the
adiabatic index.
According to mass and energy conservation laws, and the flow equation in the high-pressure chamber
and low pressure chamber, the following relations can be established:
1 1 m
1 1 1 m 1
1 1 11 2
m1 m1 m1
2m
2 2 m 1 t 2
2e 2 a t e
2 2 22 2
m2 m2 m2
( )
( )
(1 )
( )
( ) 1.2 sin( )
(1 )
dV Q
dtd
V u Q hdt
RT B Cp
V V V
dmQ
dtd dl
m u Q h ns pdt dt
dvm n p p s m g
dtRT B C
pV V V
(23)
Hyperbaric chamber
Cylinder
Cylinder
Cylinder
Cylinder
Value control
Low Pressure chamber
Entropy 2014, 16 4809
where me is the quality of missile, Pa denotes the atmospheric pressure, g is the acceleration of gravity,
v2 is the speed of missile, and st denotes effective thrust area.
Let X1=ρ1, X2=T1, X3=m2, X4=T2, X5=l, X6=v2, the closed pneumatic equations can be established as:
2
1 1
2 2* *0 0
111 121 0 1 12 2 298.151 1 1 1 1 11
2 2 2*
1 211 2212 21 1
3
*4 298.1
1
/
11 /
2
2
c
Xg c g ccV c
c m m mc m
g c g cV
c m c m
c
V
r
X G V
R RT R R TG M MD D c dT u G h h V
V p V X V X Vp VX
R RT R R TX c D D
p V p V
X G
X c dT
4
2 20 0 0 5 *
112 122 12 2 252 22 2 3
20 0 6 3 3*
0 2 6 3 21222 22
112
1
X g c g c g c cc
c m c mc m c m
g c g c gcV
c m c mc m
rR RT R R T R RT M V ns X RT
e D D h h Gp V p Vp V p V X
R RT M ns X X R RT X R RRTns p X X c D
p V p Vp V
+2
2222 22
5 6
2 0 0 0 02 0
0 06
02 0
0
2 3 8 2 3 8
211 2 3 8 2 32 2 2 2 2 2
2
( ) 1.2 sin( ) sin( ), 1.2
sin( )0 , 1.2
0.31336 0.04344 0.01232 0.763662 2.64264 0.30296
c
c m
c c c c c c
TD
p V
X X
n p p s M g M gp p
M nsX
M gp p
ns
T T T T T TD
X X X X X X
8
2.8 10.5 2.8 3 6 10.5
221 2.8 10.5 2.8 3 6 10.52 2 2 2 2 2
2 3 8
112 2 74 4 4
0.1225728 0.3122175 0.089208 0.24 0.09 0.22743
0.31336 0.02172 0.00176D 0.30252
0. 0.15581
c c c c c c
c c cc
c
T T T T T TD
X X X X X X
T T TT
X X X
T
2 3 8
2 74 4 4
2.8 10.5 2.8 3 6 10.5
122 1.8 9.5 1.8 2 5 9.54 4 4 4 4 4
2 3
212 2 34 4
763662 1.32132 0.04328
0.068096 0.032865 0.04956 0.12 0.018 0.02394D
0.31336 0.04344 0.01232
c c c
c c c c c c
c c c
T T T
X X X
T T T T T T
X X X X X X
T T TD
X X
8 2 3 8
8 2 3 84 4 4 4
2.8 10.5 2.8 3 6 10.5
222 2.8 10.5 2.8 3 6 10.54 4 4 4 4 4
0.763662 2.64264 0.30296
0.1225728 0.3122175 0.089208 0.24 0.09 0.22743
c c c
c c c c c c
T T T
X X X X
T T T T T TD
X X X X X X
(24)
Entropy 2014, 16 4810
Figure 3. Three-step piston cylinder simplified diagram.
Figure 4. Lifting ejection mechanism sketch.
5. Simulation Analysis of the Pneumatic Ejection
The system parameters of above mathematical model and thermo-physical parameters are as shown
in Table 4. The five-step four-order Runge-Kutta method is used to calculate the pneumatic ejection
process based on ideal gas equation and real gas equation respectively. The basic idea of five-step
four-order Runge-Kutta method is expressed as:
1 1 6
0 0 11 0 612 1 6
0 0 12 0 623 1 6
4 0 1 0 13 6 0 63
1 2 3 4, 1 , 0
( , ,..., )
, ,...,2 2 2
( , ,..., ), 1, 2,..., 62 2 2
( , ,..., )
6 3 3 6
i i j j j
i i j j j
i i j j j
i i j j j
i i i ii j i j
k f t X X
t t k t kk f t X X
t t k t kk f t X X i
k f t t X t k X t k
k k k kX X t
(25)
where 0t indicates time step, and j represents the current time step.
Air intake
Sa
dc
da
Buffer
Load
Lc
Lb
La
1 3 4 5
1-folding wing, 2-lifting beam, 3-lifting pole, 4-missile,
5-gas inlet, 6-three-step piston cylinder, 7-exhaust orifice,
8-launch tube.
2 6 7 8
Entropy 2014, 16 4811
Table 4. System parameters and thermal physical parameters of dry air.
Parameters Values Universal gas constant R [J/mol·K] 8.3145 Critical temperature Tc [K] 132.45 Critical pressure Pc [MPa] 3.77 Acentric Factor 0.031 Gas constant of air Rg [J/kg·K] 287.0 Molar mass M [g/mol] 28.97 Flow correction factor μx 0.95 Cross-sectional area valve control A [m2] 0.0123 Adiabatic index k 1.4 Initial gas density of “1” ρ1 [kg/m3] 360 Initial gas temperature of “1” T1 [K] 300 Volume of “1” V1 [m
3] 1.8 Initial gas mass of “2” m2 [kg] 26 Initial gas temperature of “2” T2 [K] 300 The number three piston cylinder n 4 Effective thrust area of cylinder S0 [m
2] 0.0235 Mass of missile M0 [kg] 24,000 Launch angle [deg] 90 Initial volume of “2” V0 [m
3] 0.7
5.1. Comparative Analysis of Dynamic Thermodynamic Processes
Figures 5–9 show the dynamic variation comparison of the main thermodynamic variables in the
ejection process. When air flows from high pressure chamber to low pressure chamber in the throttling
process, the temperature will change with the pressure drop. The throttling process is assumed to be an
isenthalpic process. From Figure 5, we can see that the high pressure air flows into the low pressure
chamber, the temperature in the high pressure chamber decreases all the time. In the initial stage, the
temperature of the low-pressure chamber increases immediately, and then decreases gradually when the
missile moves upward. Also, from Figure 5, we can see that the real temperature in the high chamber
decreases faster than the ideal temperature before 0.2 s. This can be explained from the following two
aspects: firstly, Figure 9 shows that the gas mass based on real gas and ideal gas flowing into the low
pressure chamber are nearly equal; secondly, Figure 7 shows that the residual enthalpy in high pressure
chamber is positive, the real enthalpy of high pressure air is obviously less than ideal one. As a result, the
real temperature in the high chamber decreases faster before 0.2 s.
From Figure 5, we know the temperature in the low pressure chamber increases immediately, and
then decreases slowly when the missile moves upward. It shows that the real temperature of gas in the
low pressure is always lower than ideal one, which indicates that the real gas effects decelerates the temperature increasing rates in the low pressure chamber in the early stage, and accelerates the rate of
decrease of the temperature with the missile moving upward.
Figure 6 shows the pressure variations in the high pressure chamber and low pressure chamber. We
can see that the hyperbaric always deflates, and the pressure continues to decay. High pressure air flows
into low pressure chamber that the pressure in the low pressure chamber increases before the missile
Entropy 2014, 16 4812
starts to move, and decreases as the missile moves upward. The real pressure decay rate is greater than
the ideal decay rate. This is due to the following facts: firstly, from the analysis above, we know that the
real temperature in the high chamber decreases faster than the ideal one; secondly, the real gas mass
flowing out of high pressure chamber is nearly the same as the ideal mass. The first factor is the
dominant factor which makes the phenomenon happened. The ideal value of temperature in the hyperbaric
pressure chamber is much greater than the actual value which is similar to low pressure chamber.
Figure 5. Temperature contrast curve.
Figure 6. Pressure contrast curve.
From Figure 7, we can see that the specific enthalpy in the hyperbaric chamber increases first and then
decreases slightly, while the specific enthalpy in the low pressure chamber rises rapidly, and then increases
slowly. When the pressure getting higher, the distance between molecules becomes smaller and the
intermolecular interaction becomes stronger, as a result, the specific enthalpy gets larger and it deviates more
from the ideal gas state. While the temperature increases, the situation is totally different: longer distance
between molecules makes the intermolecular forces smaller, so the specific enthalpy gets smaller and it is
more close to the ideal gas state. For the high pressure chamber, with gas flowing into low pressure chamber,
pressure decays, and temperature decreases rapidly. Figure 7 shows the specific enthalpy in the high pressure
chamber drops slightly, which indicates that the pressure drop is the main factor. For the low pressure
chamber, the pressure and temperature increase first, and decrease with the gas pushing the missile upwards.
Figure 7 shows the specific enthalpy in the low pressure chamber increases rapidly first and then increases
slightly, which indicates that the pressure increase is the main factor in the early stage, and the temperature
decrease is the main factor in the later round.
Entropy 2014, 16 4813
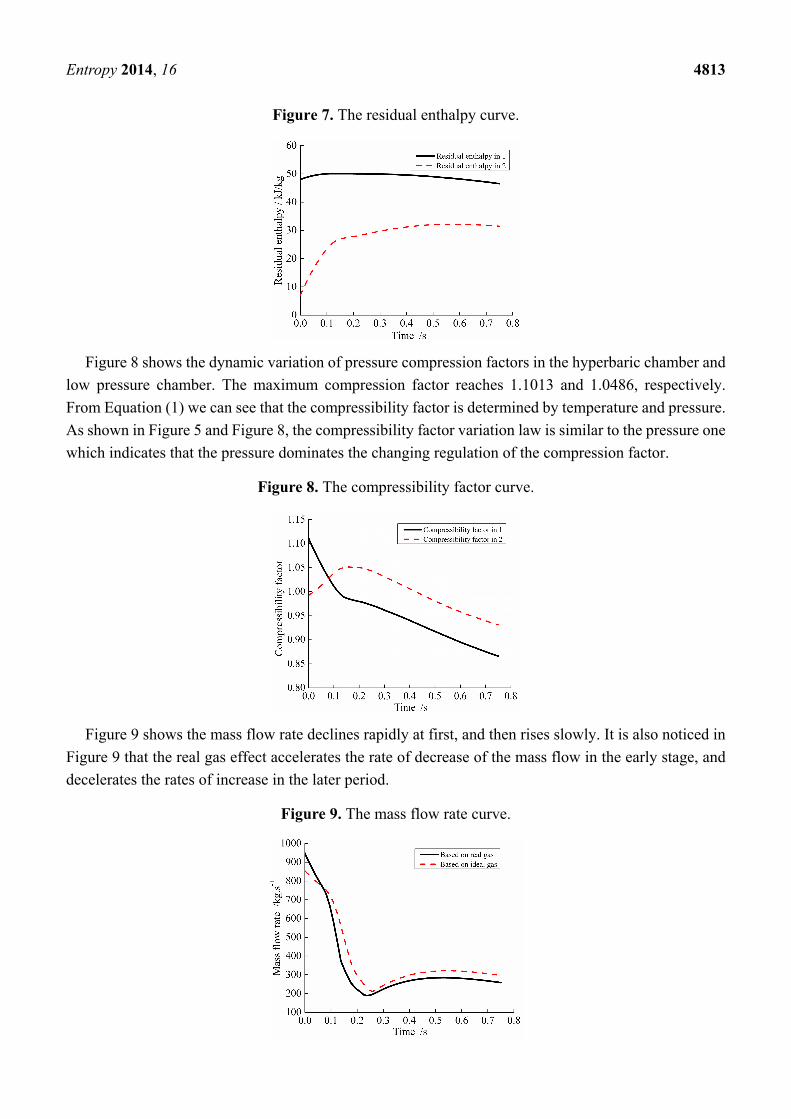
Figure 7. The residual enthalpy curve.
Figure 8 shows the dynamic variation of pressure compression factors in the hyperbaric chamber and
low pressure chamber. The maximum compression factor reaches 1.1013 and 1.0486, respectively.
From Equation (1) we can see that the compressibility factor is determined by temperature and pressure.
As shown in Figure 5 and Figure 8, the compressibility factor variation law is similar to the pressure one
which indicates that the pressure dominates the changing regulation of the compression factor.
Figure 8. The compressibility factor curve.
Figure 9 shows the mass flow rate declines rapidly at first, and then rises slowly. It is also noticed in
Figure 9 that the real gas effect accelerates the rate of decrease of the mass flow in the early stage, and
decelerates the rates of increase in the later period.
Figure 9. The mass flow rate curve.
Entropy 2014, 16 4814
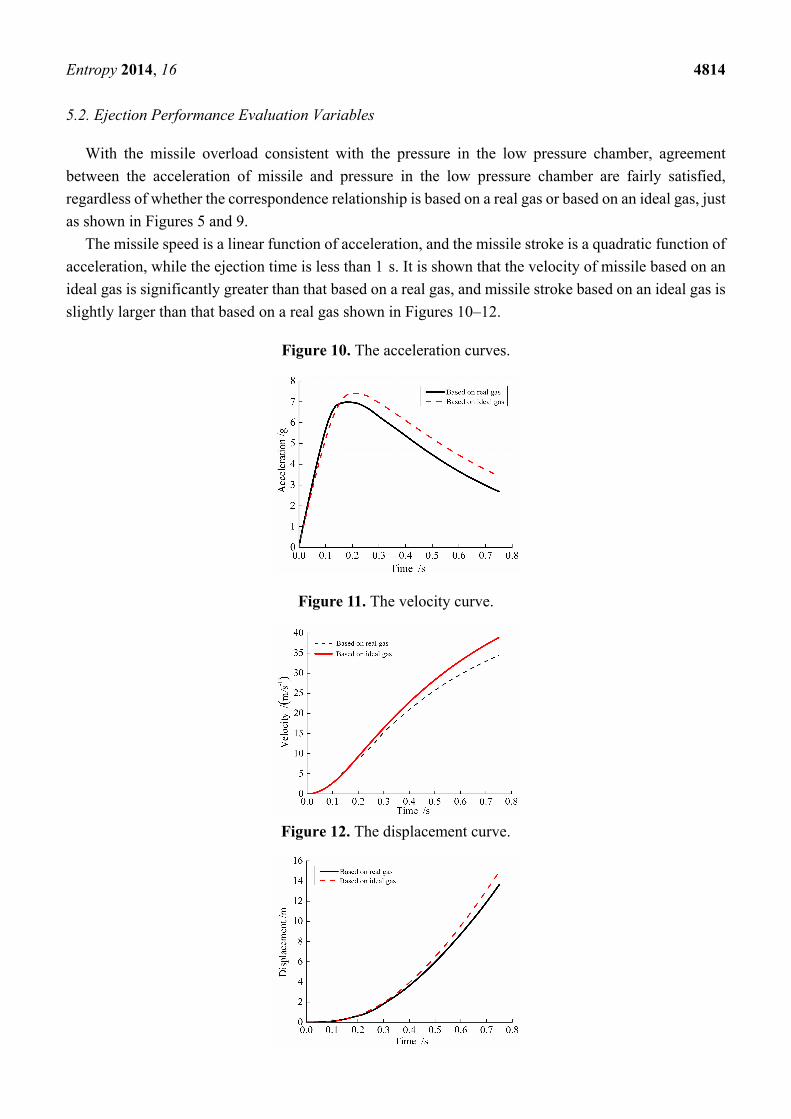
5.2. Ejection Performance Evaluation Variables
With the missile overload consistent with the pressure in the low pressure chamber, agreement
between the acceleration of missile and pressure in the low pressure chamber are fairly satisfied,
regardless of whether the correspondence relationship is based on a real gas or based on an ideal gas, just
as shown in Figures 5 and 9.
The missile speed is a linear function of acceleration, and the missile stroke is a quadratic function of
acceleration, while the ejection time is less than 1 s. It is shown that the velocity of missile based on an
ideal gas is significantly greater than that based on a real gas, and missile stroke based on an ideal gas is
slightly larger than that based on a real gas shown in Figures 10–12.
Figure 10. The acceleration curves.
Figure 11. The velocity curve.
Figure 12. The displacement curve.
Entropy 2014, 16 4815
6. Conclusions
In this paper, the improved virial equation of state is used to describe the thermodynamic properties
of high pressure air by fitting the NIST data. The compressibility factor is utilized to evaluate the
precision of the equation of state. Compared with the NIST data, the compressibility factor value
obtained from the improved virial equation has a maximum error of 1.33%, 2.47% and 4.23% within the
pressure ranges of 0.101325 MPa < P < 30 MPa at the temperatures of 400 K, 300 K and 260 K,
respectively, and the precision of the improved virial equation of state is better than that of the existing
P-R and S-R-K equations.
Also, the analytical expression for thermodynamic variables, such as the specific residual
thermodynamic energy and specific residual enthalpy are presented to compensate the real gas effects,
based on the improved virial equation of state. The study on dynamic thermodynamic analyses, mass
flow rate, charging and discharging processes, and exergy analysis are of particular importance in high
pressure air applications. In addition, based on the real thermodynamic variables, the internal ballistics
mathematical model for a pneumatic ejection system is established, with the real gas effects considered.
Numerical simulations are also performed.
The detailed dynamic thermodynamic processes for discharging processes in the hyperbaric chamber
and charging processes in the low pressure chamber are analyzed. The comparison of the numerical
results indicate that the value of residual enthalpy is high, the state of the working fluid deviates from the
ideal gas, and the compressibility of working fluid is strong, as the compression factor reaches 1.107.
The real gas effects accelerate the pressure and temperature rates of decrease in the hyperbaric pressure
chamber, and decelerate the rates of increase in the low pressure chamber.
Acknowledgments
The authors acknowledge the support from the National Natural Science Foundation of China (Grant
No. 51303081) and the Natural Science Foundation of Jiangsu Province, China (Grant No.
BK20130761).
Authors Contributions
Dawei Ma conceived of the ideal that we can apply high pressure ejection device to weapon scope in
line with the development direction for new concept weapons. His main contribution is the problem
motivation. Jie Ren established the structure scheme of the high pressure pneumatic catapult, and
developed the method to evaluate the real gas effects, by establishing compression factor library. Jie Ren
also deduced the closed pneumatic equations to analyse the real dynamic thermodynamic process, by
presenting the analytical expressions of specific residual thermodynamic energy and specific residual
enthalpy of the high-pressure air based on real gas state equation. Fengbo Yang developed the research
program to study the real gas effects, by using five-step four-order Runge-Kutta method to solve the
closed pneumatic equations and calculated the compression factor based on P-R equation and improved
virial equation. The contribution of Jianlin Zhong was to deduce the closed pneumatic equations based
on ideal gas, including the mass and energy conservation laws. Guigao Le was responsible for the
comparative analysis of the pneumatic catapult performance based on real gas state equation and ideal
Entropy 2014, 16 4816
gas state equation, including the analysis of dynamic thermodynamic processes and article polish. All
authors have read and approved the final manuscript.
Nomenclature
Z compressibility factor, dimensionless h specific enthalpy, J/kg
P pressure, MPa Rg gas constant, J/(kg·K)
T temperature, K s specific entropy, J/(kg·K)
Vm molar volume, m3/mol α, β, γ, δ, ε constants
R universal gas constant, J/(mol·K) ρ density, (kg/m3)
B the second virial cofficient, dimensionless n polytropic exponent, dimensionless
C the third virial cofficient, dimensionless Subscripts
acentric factor, dimensionless r corresponding value
Θ extended corresponding states variables, dimensionless c critical value
u specific thermodynamic energy, J/kg re residual value
Cv isochoric heat capacity, J/(kg·K) * ideal gas
v specific volume, m3/kg 0 reference state
Conflict of Interest
The authors declare no conflict of interest.
References
1. Luo, Y.; Wang, X. Exergy analysis on throttle reduction efficiency based on real gas equations.
Energy 2010, 35, 181–187.
2. Zhu, J.; Lei, J.; Huang, Z.; Fu, T. Pneumatic position servo control system based on grey relational
compensation control. Chin. J. Mech. Eng. 2012, 48, 159–167. (In Chinese)
3. Wang, X.; Luo, Y.; Xu, Z. Study of polytropic exponent based on high pressure switching
expansion reduction. J. Therm. Sci. 2011, 5, 435–441.
4. Yang, J.L.; Ma, Y.T.; Li, M.X.; Guan, H.Q. Exergy analysis of transcritical carbon diodide
refrigeration cycle with an expander. Energy 2005, 30, 1162–1175.
5. Chen, Z. Advanced Engineering Thermodynamics; Higher Education Press: Beijing, China, 2008.
6. Jia, G.; Wang, X.; Liu, H.; Wu, G. Study on pressure reduction and power property of high
pressure pneumatic system on the compressed air powered vehicle. China Mech. Eng. 2004, 15,
1294–1297. (In Chinese)
7. Yang, G.; Guo, J.; Li, B. Dynamic simulation investigation of a novel high-pressure pneumatic
proportional control valve. China Mech. Eng. 2007, 18, 1418–1420. (In Chinese)
8. Privat, R.; Privat, Y.; Jaubert, J.-N. Can cubic equations of state be recast in the virial form? Fluid
Phase Equilibr. 2009, 282, 38–50.
9. Jaubert, J.-N.; Privat, R. Relationship between the binary interaction parameters (kij) of the
Peng–Robinson and those of the Soave–Redlich–Kwong equations of state: Application to the
definition of the PR2SRK model. Fluid Phase Equilibr. 2010, 295, 26–37.
10. Scalise, O.H. On the phase equilibrium stockmayer fluids. Fluid Phase Equilibr. 2007, 253,
171–175.
Entropy 2014, 16 4817
11. Brown, J.S. Predicting performance of refrigerants using the Peng-Robinson equation of state.
Int. J. Refrig. 2007, 30, 1319–1328.
12. Avaullee, L.; Trassy, L.; Neau, E.; Jaubert, J. Thermodynamic modeling for petroleum fluids. I.
Equation of state and group contribution for the estimation of thermodynamic parameters of
heavy hydrocarbons. Fluid Phase Equilibr. 1997, 139, 155–170.
13. Privat, R.; Gani, R.; Jaubert, J.N. Are safe results obtained when the PC-SAFT equation of state is
applied to ordinary pure chemicals? Fluid Phase Equilibr. 2010, 295, 76–92.
14. Bi, M.; Feng, D.; Ma, L. Engineering Thermodynamics; Chemical Industry Press: Beijing, China,
2008. (In Chinese)
15. Scott, D.J.; Patel, T.R.; Winzor, D.J. A Potential for overestimating the absolute magnitudes of
second virial coefficients by small-angle X-ray scattering. Anal. Biochem. 2013, 435, 158–165.
16. Winzor, D.J.; Scott, D.J.; Wills, P.R. A simpler analysis for the measurement of second virial coefficients by self-interaction chromatography. Anal. Biochem. 2007, 371, 21–25.
17. Ramos-Estrada, M.; Iglesias-Silva, G.A.; Hall, K.R.; Kohler, F. Estimation of third virial
coefficients at low reduced temperatures. Fluid Phase Equilibria. 2006, 240, 179–185.
18. Chen, H.; Zheng, J.; Xu, P.; Li, L.; Liu, Y.; Bie, H. Study on real-gas equations of high pressure
hydrogen. Int. J. Hydrog. Energy 2010, 35, 3100–3104.
19. Xiang, H. Thermal Physical and Chemical Properties of the Fluid: The Corresponding State
Principle and Application; Science Press: Beijing, China, 2003. (In Chinese)
20. Kameyama, H.; Yoshida, K.; Yamauchi, S.; Fueki, K. Evaluation of reference exergies for the
elements. Appl. Energy 1982, 11, 69–83.
21. Lemmon, E.W.; Jacobsen, R.T.; Penoncello, S.G.; Friend, D.G. Thermodynamic properties of air
and mixtures of nitrogen argon and oxygen from 60 to 2000 K at pressure to 2000 MPa. J. Phys.
Chem. Ref. Data 2000, 29, 331–385.
22. Chueh, P.L.; Prausnitz, J.M. Third virial coefficients of nonpolar gases and their mixtures. AIChE
J. 1967, 13, 896–902.
23. Meng, L.; Duan, Y.-Y.; Wang, X.-D. Binary interaction parameter kij for calculating the second
cross-virial coefficients of mixtures. Fluid Phase Equilibr. 2007, 260, 354–358.
24. Meng, L.; Duan, Y.-Y.; Li, L. Correlations for second and third virial coefficients of pure fluids.
Fluid Phase Equilibr. 2004, 226, 109–120.
25. Green, D.W.; Perry, R.H. Perry’s Chemical Engineers’ Handbook, 8th ed.; McGraw-Hill
Professional: New York, NY, USA, 2007.
© 2014 by the authors; licensee MDPI, Basel, Switzerland. This article is an open access article
distributed under the terms and conditions of the Creative Commons Attribution license
(http://creativecommons.org/licenses/by/3.0/).


![PRACTICAL HYDROCARBON DEW POINT … · REVIEW OF EQUATIONS OF STATE TO CALCULATE ... popular generic equations of state (EOS) are the Peng-Robinson or “PR EOS” [6] and Soave-Redlich-Kwong](https://img.pdfslide.us/doc/110x75/5af8d4db7f8b9aff288c59cc/practical-hydrocarbon-dew-point-of-equations-of-state-to-calculate-popular.jpg)