Embed Size (px)
Citation preview
VOL. 6, NO. 9, SEPTEMBER 2011 ISSN 1819-6608
ARPN Journal of Engineering and Applied Sciences
©2006-2011 Asian Research Publishing Network (ARPN). All rights reserved.
www.arpnjournals.com
VAPOR-LIQUID EQUILIBRIUM PREDICTION BY PE AND ANN FOR
THE EXTRACTION OF UNSATURATED FATTY ACID ESTERS BY SUPERCRITICAL CO2
Abdul Mun'em Abbas Karim1, Ali Khudhair Mutlag1 and Mohammed Salah Hameed2
1College of Engineering, University of Diyala, Baquba, Diyala, Iraq 2Chemical Engineering Higher Colleges of Technology, Abu Dhabi Men’s College, Abu Dhabi, United Arab Emirates
E-Mail: [email protected], [email protected] ABSTRACT
The prediction of vapor-liquid equilibrium (VLE) may serve as a cheap alternative method to the experimental measurements of VLE. This is especially true for high pressure where it requires expensive equipment to measure VLE as compared with the low pressure experiments. Program phase equilibria (PE) with Peng-Robinson equation of state (PR-EOS) and artificial neural networks (ANN) technique are applied at high-pressure VLE. Related literature data were used to develop and validate a model capable of predicting VLE for four CO2-fatty acid ester systems. The systems used including oleic acid methyl ester, linoleic acid methyl ester, eicosapentaenoic acid ethyl ester (EPAEE), and docosahexenoic acid ethyl ester (DHAEE) at two different temperatures of 313k and 333k and pressure range (28.6 - 235.4) bar. The percentage average root square relative deviation (%ARSRD) is used to compare the predicted results by PE program and artificial neural networks (ANN) favored the ANN model as it gives more representative results to the experimental data. Keywords: vapor-liquid equilibrium, high pressure, PE program, Peng-Robinson equation of state, ANN, carbon dioxide, esters.
Nomenclature a, b parameters in the equation of state A, B dimensionless parameters f fugacity, bar
ijk ,
ijl adjustable parameters
n number of components ni number of moles of component i, mole N number of data points P pressure, bar R universal gas constant, lit. bar/mole K T temperature, K x,y liquid and vapor mole fractions, respectively Z compressibility factor V total system volume, lit ν total system molar volume , lit./mole Greek Symbols
φ fugacity coefficient in mixture ω acentric factor Subscripts and Superscripts c critical condition exp experimental value calc calculated value ν vapor phase l liquid phase i,j Component
m mixture r reduced property
1. INTRODUCTION
A gas when compressed isothermally to pressures more than its critical pressure, exhibits enhanced solvent power in the vicinity of its critical temperature. Such fluids are called supercritical fluids (SCF), which possess specific characteristics that make them attractive as solvents. In particular, solvent density, and hence solvent effectiveness, can be controlled by pressure and temperature. Liquid-like densities and gas like viscosity, coupled with diffusion coefficients that are at least an order of magnitude higher than those of liquids, contribute to enhancement of mass transfer.
Gas extraction is a chemical engineering separation process and it is particularly effective for the isolation of components of medium molecular weight and relatively low polarity at moderate temperatures, and it can be used to recovery low volatility heat-labile component. The method finds its special application in food and petroleum industries [1].
The extraction of edible oils and the fractionation and purification of oil constituents with help of supercritical fluids (SCF's) have gained considerable industrial interest. In a typical purification step, undesired components presented with the edible oils, such as free fatty acids, are removed without any change in their constituents.
Vacuum distillation is the conventional technique for the separation of oil compounds. Some of the oil components, such as polyunsaturated fatty acids, and their esters, are sensitive to heat and will be degraded in this process. The use of SCF provides means to avoid their
122
VOL. 6, NO. 9, SEPTEMBER 2011 ISSN 1819-6608
ARPN Journal of Engineering and Applied Sciences
©2006-2011 Asian Research Publishing Network (ARPN). All rights reserved.
www.arpnjournals.com
degradation. Carbon dioxide is the most commonly used supercritical fluid for extraction, and material processing owing to its availability, inertness, non-flammability, non-toxicity, low cost and low critical temperature and pressure.
King et al., [2] used entrainer to increase the vapor loading in the extraction of oleic acid and mono-olein by carbon dioxide above its critical temperature and pressure using the vapor recirculation equipment [3].
Eisenbach [4] used supercritical fractionation method with carbon dioxide to separate eicosapentaenoic acid ethyl ester from a mixture of fatty acid ethyl esters obtained from codfish oil. His results suggest that a mixture of different carbon number could be separated using supercritical carbon dioxide. For the design of such supercritical fractionation process, it requires the vapor-liquid equilibria for the mixture of fatty acid esters and carbon dioxide.
Inomata et al., [5] had developed new experimental equipment and measured vapor-liquid equilibrium data involving low volatility fatty acid esters (methyl stearate, methyl palmitate, methyl myristate, and methyl oleate) and carbon dioxide at temperature range (313.15-343.15K). They obtained fairly good correlation of the experimental data except in the critical region by using the PR-EOS and the modified van der Waals mixing rules that required two adjustable binary parameters.
Cheng et al., [6] used an analytic method to produce PVT-x-y measurements for the systems ethane-methyl oleate and carbon dioxide-methyl oleate along isotherms at 313.15K and 343.15K up to pressures substantially greater than the critical pressures of the pure solvents. PR-EOS with a non-quadratic mixing rule was successful in modeling the experimental data [7].
Bharath et al., [8] measured the vapor-liquid equilibria for two binary systems of the two oleic acid-carbon dioxide and triolein-carbon dioxide and a ternary system oleic acid-triolein-carbon dioxide with the aim of separating the fatty acids and triglycerides. Their results showed that oleic acid can be selectively extracted using supercritical carbon dioxide as a solvent. They also measured at high pressure vapor-liquid equilibria for the systems palm kernel oil-carbon dioxide and sesame oil-carbon dioxide and showed that the supercritical carbon dioxide was found to fractionate these triglyceride mixtures on the basis of the total carbon number of the constituent fatty acids of the triglyceride.
Lockemann et al., [9] showed that the separation processes involving the use of SCF's at elevated pressures are powerful tools for the mild fractionation of polyunsaturated fatty acid compounds and the removal of short-chained components, such as methyl laurate, from edible oil constituents. The phase equilibria data are required to form the basis for the design of these separation processes.
Karim et al., [10] measured the mole fraction solubility of oleic acid in supercritical pure CO2 at temperature range (308.15-333.15 K) and pressures up to 200 bars. The effects of temperature and pressure in the
extraction process are represented by Redlich-Kwong equation of state (RK-EOS). The results showed that the mole fraction solubility of oleic acid depends strongly upon the pressure (density) of the supercritical carbon dioxide and it becomes appreciable when the critical density is exceeded. The experimental phase equilibrium data were compared with the results predicted by the RK-EOS and showed a good representation.
Yang and Li [11] proposed neural networks method for modeling the supercritical fluid extraction. They suggested first the use of a three-layer neural network with fast learning algorithm and then compare the results with the conventional model of the PR-EOS. A novel hybrid model was proposed combining both the neural network and the PR-EOS. The proposed models perform better than the conventional model that needs to select its parameters by trial and error. The effectiveness of the proposed approaches is demonstrated by simulation and comparison studies.
Chang et al., [12] determined experimental P-T-x-y equilibrium data for four binary mixtures (CO2+four fatty acid ester systems, including oleic acid methyl ester, linoleic acid methyl ester, eicosapentaenoic acid ethyl ester, and docosahexenoic acid ethyl ester) over a wide range of pressure ( 104.4-235.4 bar) at 313K and 333K temperatures. They found that experimental equilibrium constants of oleic acid methyl ester and linoleic acid methyl ester larger than those of eicosapentaenoic acid ethyl ester and docosahexenoic acid ethyl ester. Their finding indicates that the two methylated fatty acids would be extracted easier than the other compounds in a separation process using supercritical CO2 extraction. The equilibrium data were, then, successfully correlated using PR and modified soave-redlich-kwong (SRK) equations of state with different mixing rules.
Mohanty [13] has used multilayer perception ANN with one hidden layer to predict VLE. The method was used in terms of liquid and vapor phase compositions using the equilibrium temperature and pressure for each of the three binary systems (CO2- ethylcaprate, CO2-ethylcaproate and CO2- ethylcaprylate). Mohanty [14] has also reported the use of ANN to estimate the bubble pressure and the vapor phase composition of the CO2–difluoromethane system. He regarded the phase equilibrium ANN is applied to a single binary system at various conditions of equilibrium pressure and temperature. Si-Moussa et al., [15] applied ANN to high-pressure vapor liquid equilibrium (VLE) using data from literature to develop and validate a model capable of predicting VLE for six CO2-ester binaries (CO2-ethylcaprate, CO2-ethyl caproate, CO2-ethyl caprylate, CO2-diethyl carbonate, CO2-ethyl butyrate and CO2-isopropyl acetate). Their statistical analyses of the predictability of the optimized neural network model showed a good agreement with the experimental data. Furthermore, the comparison in terms of average absolute relative deviation was performed between the results predicted using various methods for each binary system at
123
VOL. 6, NO. 9, SEPTEMBER 2011 ISSN 1819-6608
ARPN Journal of Engineering and Applied Sciences
©2006-2011 Asian Research Publishing Network (ARPN). All rights reserved.
www.arpnjournals.com
the given temperature range. The data predicted by some cubic equation of state with various mixing rules and the excess Gibbs energy models showed that the artificial neural network model gives far better results.
Moghadassi et al., [16] proposed a new method based on ANN for prediction of thermodynamic properties for superheated and saturated region of ammonia. The ANN's results were compared with the results of some equations of state (PR-EOS included). Comparisons showed an ANN capability for prediction of thermodynamic properties of ammonia.
Moghadassi et al., [17] proposed a new method based on ANN for the prediction of vapor-liquid equilibrium data of nitrogen- n-pentane system. Experimental data were collected from work done based on static analytical method and after pre-treating were used for training the network. Among this training the back-propagation learning algorithm with various training such as Scaled Conjugate Gradient (SCG), Levenberg-Marquardt (LM), and Resilient Back propagation (RP) methods were used. The most successfully algorithm with suitable number of seven neurons in the hidden layer, the LM algorithm was found to give the minimum Mean Square Error (MSE).
Karim and Mutlag [18] modeled the experimental data were taken from literature for the separation of phenanthrene by pure supercritical CO2 and supercritical CO2 entrained with n-pentane as a liquid solvent by using two techniques, PR-EOS and ANN. They found that the ANN technique gives a good agreement with the experimental data of the systems under consideration.
In present work an attempt is tried to estimate the high pressure VLE of four CO2-esters binaries using program PE with PR-EOS and ANN technique. Three pure component properties (Tc, Pc, ω) and two intensive state variables (T and P) were selected as Neural Network (NN) inputs in order to describe the VLE of the four binaries in one system. The experimental data used for program PE and training and validation of the NN are those reported by Chang et al., [12] for the binary systems of carbon dioxide (1) with each of the one of the fatty acid esters (2) (oleic acid methyl ester (methyl oleate), linoleic acid methyl ester (methyl linoleate), eicosapentaenoic acid ethyl ester (EPAEE) and docosahexenoic acid ethyl ester (DHAEE). 2. MODELING SUPERCRITICAL FLUID EXTRACTION (SFE)
The experiments carried out to obtain high-pressure phase-equilibrium data are very difficult to perform and costly to conduct. Hence, it would by extremely useful to develop a proper model or correlation scheme to extend and complement the experimentally obtained data for SCF-solute system at high pressure. The correlation scheme can also be used to optimize the parameters to control the extraction process and get the satisfy yield rate of extract. A reliable and simple mass transfer model is necessary to design an extraction plant
and determine the optimum operating conditions to control the yield rate [19].
The theoretical calculation of phase equilibria may serve as a cheap alternative method to the experimental measurement of phase equilibria. This is especially true for high pressure operation where it is necessary to build expensive equipment to measure the phase equilibria. The theoretical prediction method may serve as a fast alternative method compared to the experimental measurements. 2.1 Program PE (Phase Equilibrium) (PE V1.0)
The calculation of phase equilibria requires suitable EOS for the system under investigation. Unfortunately, the successful use of all EOS is limited to certain groups of compounds and certain process conditions, making necessary the use of different EOS for different systems. These methods are referred to as predictive methods that can be used if hardly any information is known about the system under investigation. On the other hand such predictive models are inferior to other models with individual adjustable parameters if sufficient information is known about the system under investigation. In such case the adjustment of these parameters can be used to make the EOS accurately represent what is already known to use the EOS with these parameters. Afterwards the unknown parameters can be calculated based on the experimental knowledge. A PE program has been developed for modeling phase equilibria with non-predictive EOS. The program excludes the necessity to build, handle and maintain large data bases - but enabling best possible correlations, for well known system.
The use of the EOS to fit the users' needs is the most important step for achieving good results. The choice of the most suitable EOS for a given system is related to background experience. The choice of the most elaborated complicated and physically sound EOS does not necessarily guarantee best results. One further key to success is the input in order to determine the adjustable EOS parameters.
The program package PE (= Phase Equilibria) has been developed at the Technical University Hamburg-Harburg within the last 12 years. The program has been designed for the calculation of fluid-phase equilibrium using equations of state (EOS).
PE offers more than 40 different EOS, allowing the user to choose the one best fits his needs. PE also offers powerful routines to determine the above mentioned adjustable parameters for pure components and mixtures by correlating experimental data and subroutines to use these parameters for theoretical predictions of equilibria.
PE V1.0 had already been designed for Microsoft Windows 95/98/NT in such a way that all Windows features like mouse control, menus, dialog boxes, combo boxes, and graphical output routines have been supported [19,20].
In the present work the experimental data [12] were described using PR-EOS [21]. It is known to give
124
VOL. 6, NO. 9, SEPTEMBER 2011 ISSN 1819-6608
ARPN Journal of Engineering and Applied Sciences
©2006-2011 Asian Research Publishing Network (ARPN). All rights reserved.
www.arpnjournals.com
slightly better predications of liquid densities than the SRK-EOS by Soave [22]. The PR-EOS requires three inputs per compound, Tc, Pc and the acentric factor (ω) and the general form is,
( )( )
( ) ([ ])bbbTa
bRTP
−++−
−=
υυυυ …(1)
( ) ),()( ωα rc TTaTa = …(2)
25.0 )]1(1[),( rr TT −+= κωα …(3)
226992.054226.137464.0 ωωκ −+= ..(4)
c
cc P
TRTa
22
45724.0)( = …(5)
c
c
PRT
b 0778.0= …(6)
In general an equation of state is developed first for pure component, and then extended to mixtures through the use of mixing rules for combining the pure component parameters. Most of the mixing rules for the EOS calculates the mixture parameters am and bm for the
EOS according to the one-fluid mixing rules (Eqs. 7 and 8) and the only difference between them is the combining rule that determines how the cross coefficients aij and bij are calculated.
ijj
n
i
n
jim axxa ∑∑
= =
=1 1
… (7)
ijj
n
i
n
jim bxxb ∑∑
= =
=1 1
… (8)
The quadratic mixing rule is the mixing rule offers a maximum of two binary interaction parameters per binary system, whereof only one is used to adjust the parameter a and it is sufficient for the correlation of equilibria in systems that do not contain specific interactions.
( )ijjiij kaaa −= 1 with …(9) ijji kk =
( )ijji
ij
bbb l−
+= 1
2 with …(10) ijji ll =
The physical properties of the pure components used in the present work are summarized in Table-1.
Table-1. Physical properties of pure components used [12].
Component MW Tc (K) Pc (bar) ω CO2 44.01 304.20 73.80 0.2250 Methyl Oleate 296.50 866.94 11.22 0.9835 Methyl Linoleate 294.50 875.31 11.62 0.9869 EPAEE 302.46 792.66 12.06 1.0102 DHAEE 256.50 803.10 11.28 1.0797
For the vapor-liquid equilibrium calculations, at
equilibrium state the fugacity for all species i must be the same in all phases, namely,
lii ff ˆˆ =υ or iiii xy lφφν ˆˆ = ... (11)
where and are the fugacity coefficients of component i in the liquid and vapor phases respectively. Since pressure-explicit equations of state are more common types and the useful relation for finding fugacity coefficients [23]
liφ
νφi
is,
iφln = ZVdVRT
nP
RT v njvTi
ln1
,,
−⎥⎥⎦
⎤
⎢⎢⎣
⎡−⎟⎟
⎠
⎞⎜⎜⎝
⎛∂∂
∫∞
… (12)
where V is the total system volume, ni and nj are the mole numbers of component i and j respectively.To calculate the fugacity coefficients, equations of state which are valid for both vapor phase mixture and liquid phase mixture where used. Cubic equations of state such as the PR-EOS have become important tool in the area of phase equilibrium modeling, especially, for systems at pressures close to or above the critical pressure of one or more of these system components.
When the PR-EOS is introduced into the Eq. (12), the following closed-form expression for fugacity coefficient is obtained in the liquid phase,
( ) ( ) ⎟⎠⎞
⎜⎝⎛
−+
⎥⎥⎥
⎦
⎤
⎢⎢⎢
⎣
⎡−+−−−=∑
BZBZ
a
ax
bb
BABZZ
bb
m
jjii
m
i
m
ii 414.0
414.2ln2
22ln1ˆln lφ … (13)
125
VOL. 6, NO. 9, SEPTEMBER 2011 ISSN 1819-6608
ARPN Journal of Engineering and Applied Sciences
©2006-2011 Asian Research Publishing Network (ARPN). All rights reserved.
www.arpnjournals.com
and when replacing υ in Eq.(1) in term of PZRT , gives the cubic equation of PR-EOS as:
( ) ( ) ( ) 0321 32223 =−−−−−+−− BBABZBBAZBZ …(14) where Z is compressibility factor and, A and B are defined as,
2)(RTPa
A m= … (14a)
RTPb
B m= … (14b)
The fugacity coefficients of the components in the vapor phase are also calculated with Eq.(13) with, yi and all the (PR) a and b values for the vapor replacing their corresponding terms. 2.2 Artificial Neural Networks (ANN) modeling
The main advantage of the ANN approach over traditional methods of modeling is that it does not require the complex nature of the underlying process under consideration to be explicitly described in mathematical terms. It learns the relationship between the input and the output by being exposed to the examples presented to them in training [24].
In order to describe the phase behavior of the four CO2-fatty acid ester systems by ANN model a total of seven variables have been selected in this work: four intensive state variables (temperature, pressure, and CO2 mole fractions in the liquid and vapor phases) and three pure component properties of the fatty acid ester (critical
temperature, critical pressure and acentric factor). The choice of the input and output variables was based on the need to describe the four binaries by only one ANN model. Therefore, the temperature, pressure, and the pure component properties of the esters have been selected as input variables and the remaining as output variables.
The input / output data allows the neural network to be trained in a way that minimizes the error between the real output and the estimated (neural net) output. The model is then used for different purposes among which are estimation and prediction.
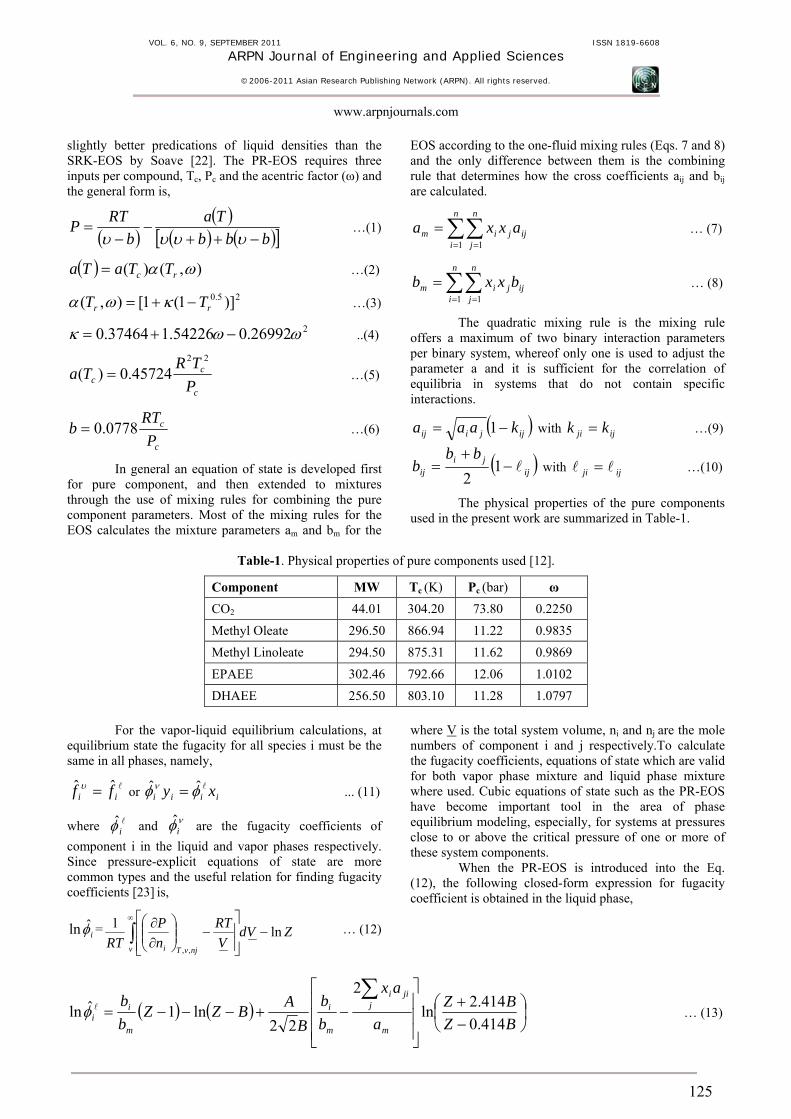
The basic element of a NN is an artificial neuron as shown in Figure-1, which consists of three main components; weight, bias and an activation function. Each neuron receives inputs xi (i= 1, 2, …, n) attached with a weight wij (j ≥1) which shows the connection strength for a particular input for each connection. Every input is then multiplied by the corresponding weight of the neuron connection and summed as:
∑=
=n
jiiji xwQ
1 … (15)
A bias bi, a type of correction weight with a constant non-zero value, is added to the summation in Eq. (15) as:
iii bQU += … (16)
Figure-1. Basic elements of an artificial neuron.
In other words, Qi in Eq. (16) is the weighted sum of the ith neuron for the input received from the preceding layer with n neurons, wij is the weight between the ith neuron in the hidden layer and the jth neuron in the preceding (input) layer, and xj is the output of the jth neuron in the input layer. After being corrected by a bias as in Eq. (16), the summation is transferred using a scalar-to-scalar function called an activation or transfer function, f (Ui), to yield a value called the unit’s activation, given as:
)( ii Ufy = … (17)
Activation functions serve to introduce nonlinearity into NNs which makes it more powerful than linear transformation.
2.2.1 Neural Network (NN) Architecture
In this study, the usual feed-forward multilayer NN with single hidden layer was considered. One of the most important tasks in NN studies is to determine the optimal network architecture which is related to the number of neurons in the hidden layer [24]. Generally, the trial and error approach is used. In this study, the best architecture of the network was obtained by trying different numbers of neurons. The trial started from two, and the performance of each network was checked by employing Mean Absolute Percentage Error (MAPE) defined as:
126
VOL. 6, NO. 9, SEPTEMBER 2011 ISSN 1819-6608
ARPN Journal of Engineering and Applied Sciences
©2006-2011 Asian Research Publishing Network (ARPN). All rights reserved.
www.arpnjournals.com
1001 ×
−
=∑=
Nd
yd
MAPE
N
i i
ii
… (18)
where N is the number of exemplars in the training set, di is the desired output, yi is the computed output. The goal is to minimize MAPE to obtain a network with the best generalization.
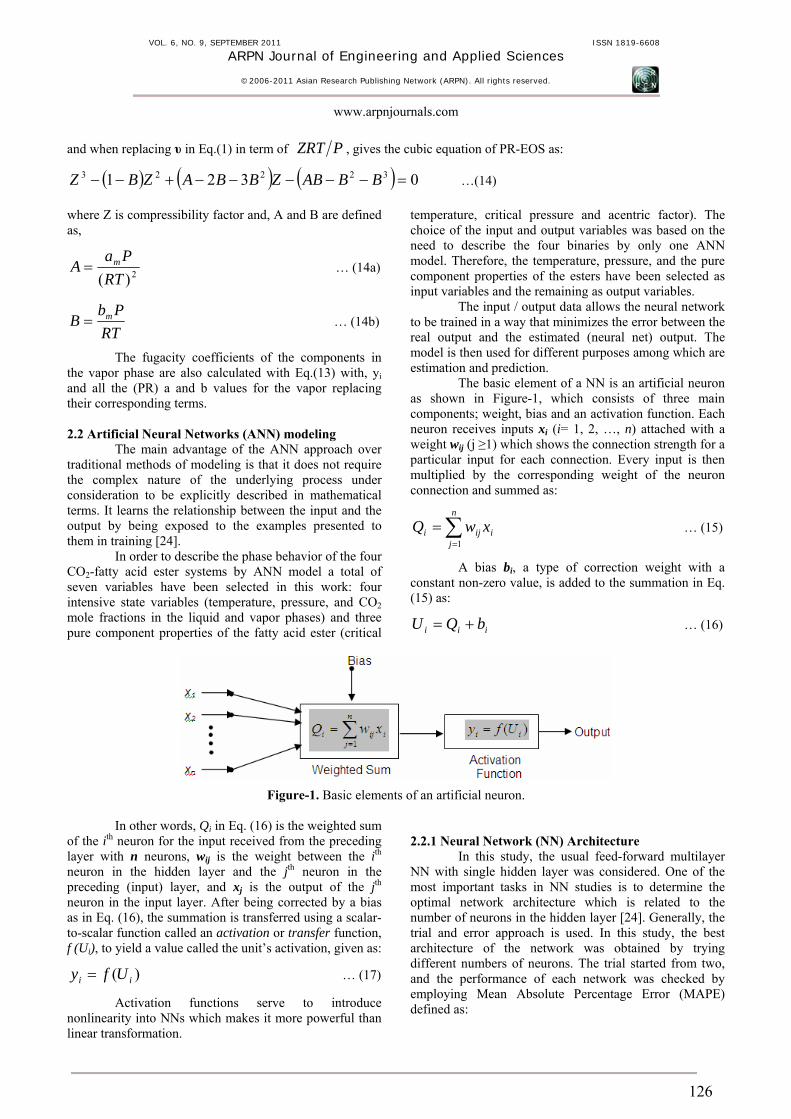
The relationship between the number of neurons ranging from 2 to 10 and the corresponding MAPE values obtained is presented in Figure-2. It is seen in Figure-2a that MAPE values decrease with an increasing number of
neurons in the training stage. Therefore, the architecture of the network improves in the learning process with the increasing number of neurons. In the testing process, however, MAPE values reduce with the increasing number of neurons until the number of neurons reaches seven and then the MAPE values start to increase, which implies that the network becomes more generalized with the increasing number of neurons until an optimum value is obtained. Beyond this optimum point the network turns out to be specialized only on the training set and it deviates from producing reasonable results in the testing stage. This procedure is a common experience in NN studies.
1 2 3 4 5 6 7 8 9 10 11 121
2
3
4
5
6
7
8
9
10
11
No. of Hidden Neurons
MA
PE %
TrainingTesting
1 2 3 4 5 6 7 8 9 10 110.9
0.92
0.94
0.96
0.98
1
No. of Hidden Neurons
R
TrainingTesting
(a) (b)
Figure-2. Selecting an optimal network architecture.
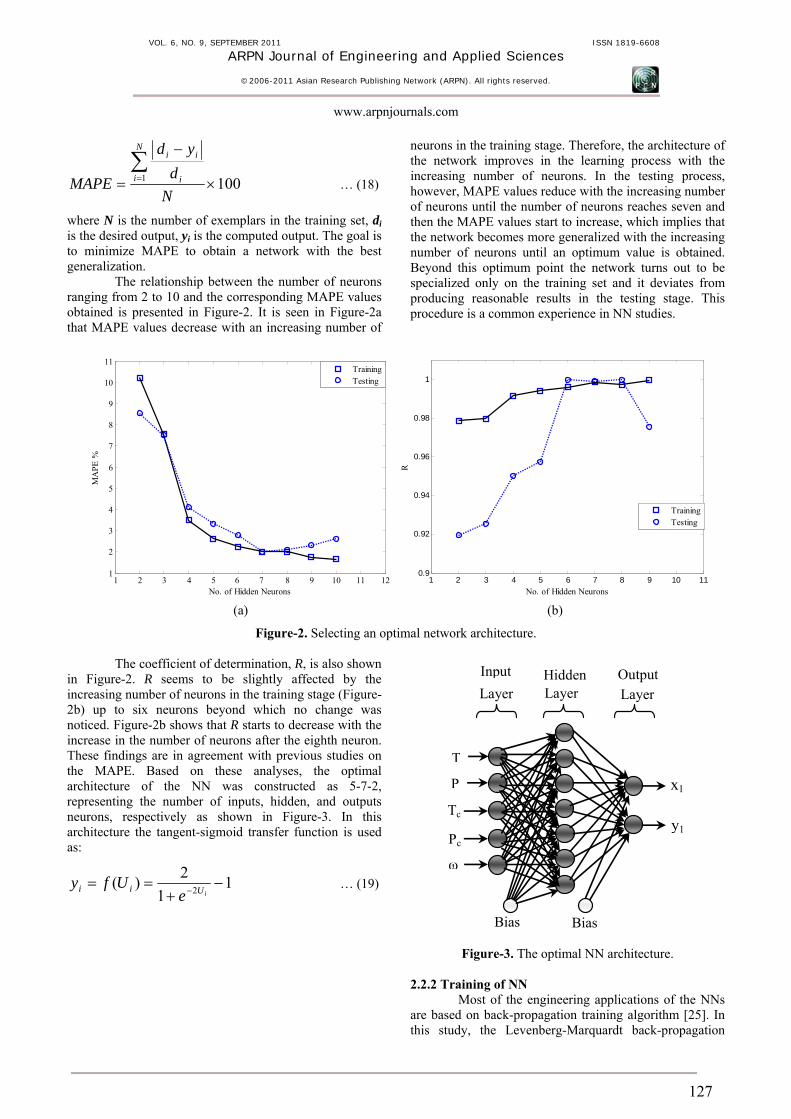
The coefficient of determination, R, is also shown in Figure-2. R seems to be slightly affected by the increasing number of neurons in the training stage (Figure-2b) up to six neurons beyond which no change was noticed. Figure-2b shows that R starts to decrease with the increase in the number of neurons after the eighth neuron. These findings are in agreement with previous studies on the MAPE. Based on these analyses, the optimal architecture of the NN was constructed as 5-7-2, representing the number of inputs, hidden, and outputs neurons, respectively as shown in Figure-3. In this architecture the tangent-sigmoid transfer function is used as:
11
2)( 2 −+
== − iUii eUfy … (19)
Layer Layer Input OutputHidden Layer
y1
x1
Pc
Tc
Bias Bias
T
P
ω
Figure-3. The optimal NN architecture. 2.2.2 Training of NN
Most of the engineering applications of the NNs are based on back-propagation training algorithm [25]. In this study, the Levenberg-Marquardt back-propagation
127
VOL. 6, NO. 9, SEPTEMBER 2011 ISSN 1819-6608
ARPN Journal of Engineering and Applied Sciences
©2006-2011 Asian Research Publishing Network (ARPN). All rights reserved.
www.arpnjournals.com
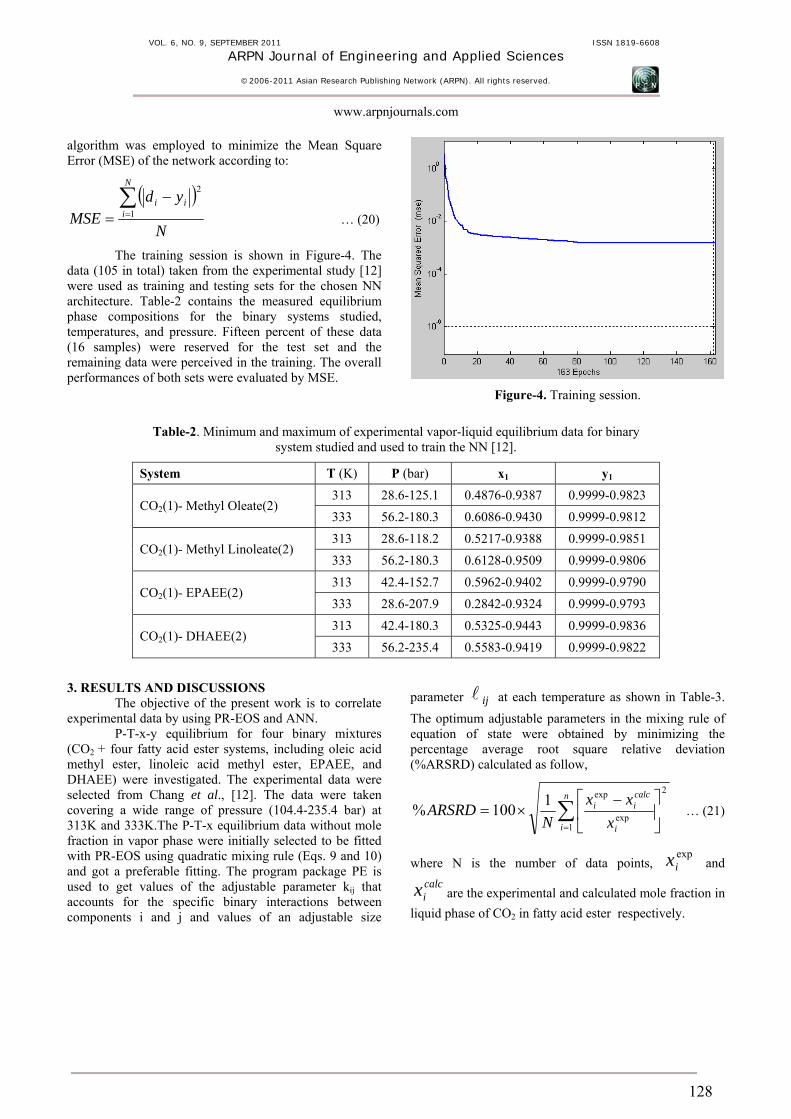
algorithm was employed to minimize the Mean Square Error (MSE) of the network according to:
( )N
ydMSE
N
iii∑
=
−= 1
2
… (20)
The training session is shown in Figure-4. The data (105 in total) taken from the experimental study [12] were used as training and testing sets for the chosen NN architecture. Table-2 contains the measured equilibrium phase compositions for the binary systems studied, temperatures, and pressure. Fifteen percent of these data (16 samples) were reserved for the test set and the remaining data were perceived in the training. The overall performances of both sets were evaluated by MSE.
Figure-4. Training session.
Table-2. Minimum and maximum of experimental vapor-liquid equilibrium data for binary system studied and used to train the NN [12].
System T (K) P (bar) x1 y1
313 28.6-125.1 0.4876-0.9387 0.9999-0.9823 CO2(1)- Methyl Oleate(2)
333 56.2-180.3 0.6086-0.9430 0.9999-0.9812 313 28.6-118.2 0.5217-0.9388 0.9999-0.9851
CO2(1)- Methyl Linoleate(2) 333 56.2-180.3 0.6128-0.9509 0.9999-0.9806 313 42.4-152.7 0.5962-0.9402 0.9999-0.9790
CO2(1)- EPAEE(2) 333 28.6-207.9 0.2842-0.9324 0.9999-0.9793 313 42.4-180.3 0.5325-0.9443 0.9999-0.9836
CO2(1)- DHAEE(2) 333 56.2-235.4 0.5583-0.9419 0.9999-0.9822
3. RESULTS AND DISCUSSIONS
The objective of the present work is to correlate experimental data by using PR-EOS and ANN.
P-T-x-y equilibrium for four binary mixtures (CO2 + four fatty acid ester systems, including oleic acid methyl ester, linoleic acid methyl ester, EPAEE, and DHAEE) were investigated. The experimental data were selected from Chang et al., [12]. The data were taken covering a wide range of pressure (104.4-235.4 bar) at 313K and 333K.The P-T-x equilibrium data without mole fraction in vapor phase were initially selected to be fitted with PR-EOS using quadratic mixing rule (Eqs. 9 and 10) and got a preferable fitting. The program package PE is used to get values of the adjustable parameter kij that accounts for the specific binary interactions between components i and j and values of an adjustable size
parameter at each temperature as shown in Table-3. The optimum adjustable parameters in the mixing rule of equation of state were obtained by minimizing the percentage average root square relative deviation (%ARSRD) calculated as follow,
ijl
∑=
⎥⎦
⎤⎢⎣
⎡ −×=
n
i i
calcii
xxx
NARSRD
1
2
exp
exp1100% … (21)
where N is the number of data points, and
are the experimental and calculated mole fraction in liquid phase of CO
expix
calcix
2 in fatty acid ester respectively.
128
VOL. 6, NO. 9, SEPTEMBER 2011 ISSN 1819-6608
ARPN Journal of Engineering and Applied Sciences
©2006-2011 Asian Research Publishing Network (ARPN). All rights reserved.
www.arpnjournals.com
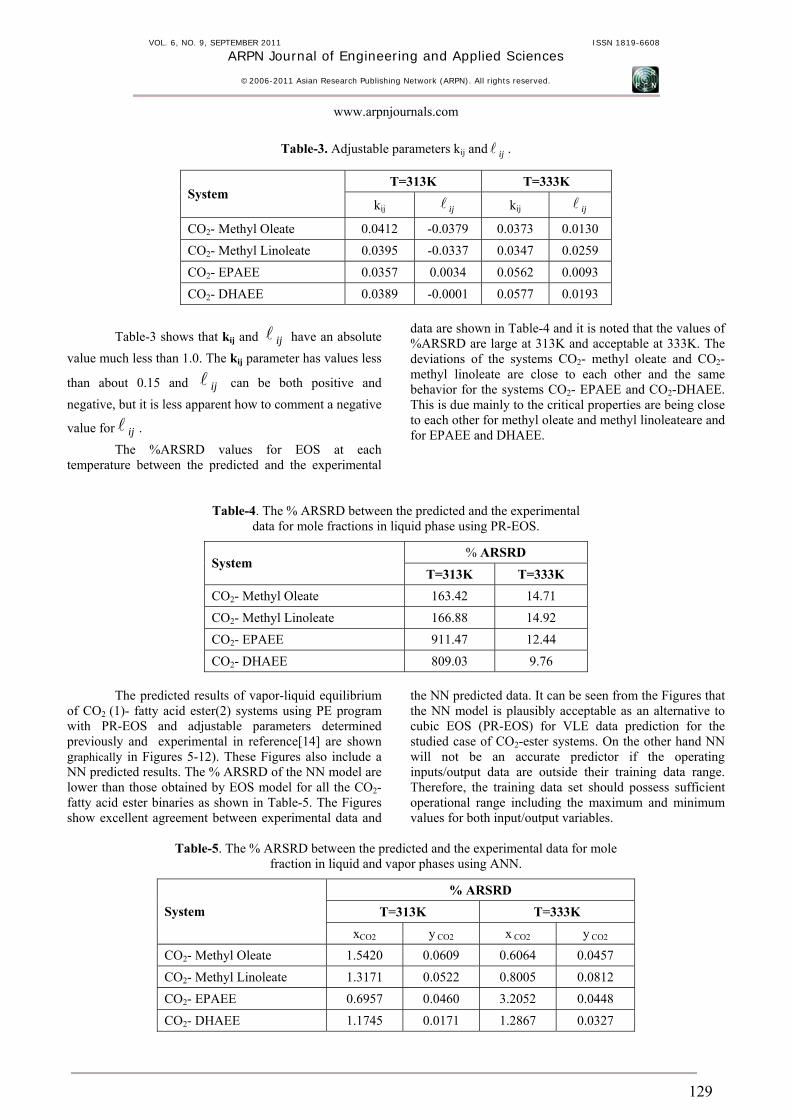
Table-3. Adjustable parameters kij and . ijl
T=313K T=333K System
kij ijl kij ijl
CO2- Methyl Oleate 0.0412 -0.0379 0.0373 0.0130 CO2- Methyl Linoleate 0.0395 -0.0337 0.0347 0.0259 CO2- EPAEE 0.0357 0.0034 0.0562 0.0093 CO2- DHAEE 0.0389 -0.0001 0.0577 0.0193
Table-3 shows that kij and have an absolute value much less than 1.0. The k
ijl
ij parameter has values less
than about 0.15 and can be both positive and negative, but it is less apparent how to comment a negative
value for .
ijl
ijlThe %ARSRD values for EOS at each
temperature between the predicted and the experimental
data are shown in Table-4 and it is noted that the values of %ARSRD are large at 313K and acceptable at 333K. The deviations of the systems CO2- methyl oleate and CO2- methyl linoleate are close to each other and the same behavior for the systems CO2- EPAEE and CO2-DHAEE. This is due mainly to the critical properties are being close to each other for methyl oleate and methyl linoleateare and for EPAEE and DHAEE.
Table-4. The % ARSRD between the predicted and the experimental data for mole fractions in liquid phase using PR-EOS.
% ARSRD System
T=313K T=333K CO2- Methyl Oleate 163.42 14.71 CO2- Methyl Linoleate 166.88 14.92 CO2- EPAEE 911.47 12.44 CO2- DHAEE 809.03 9.76
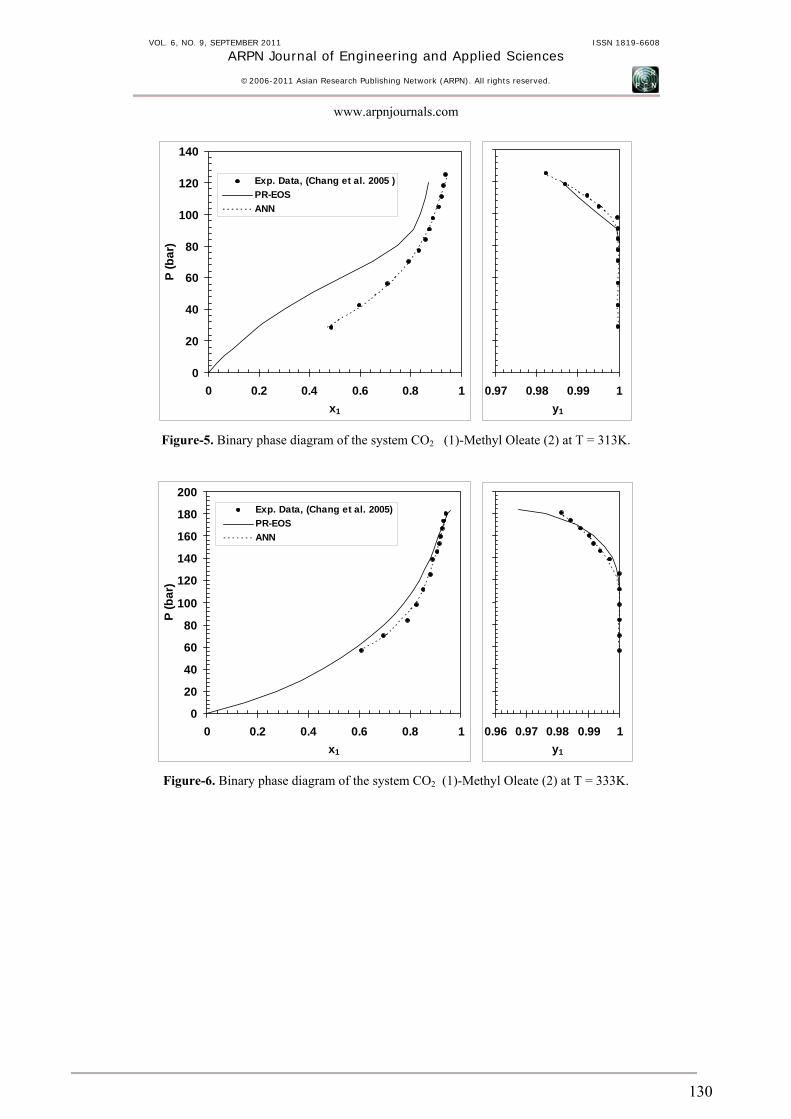
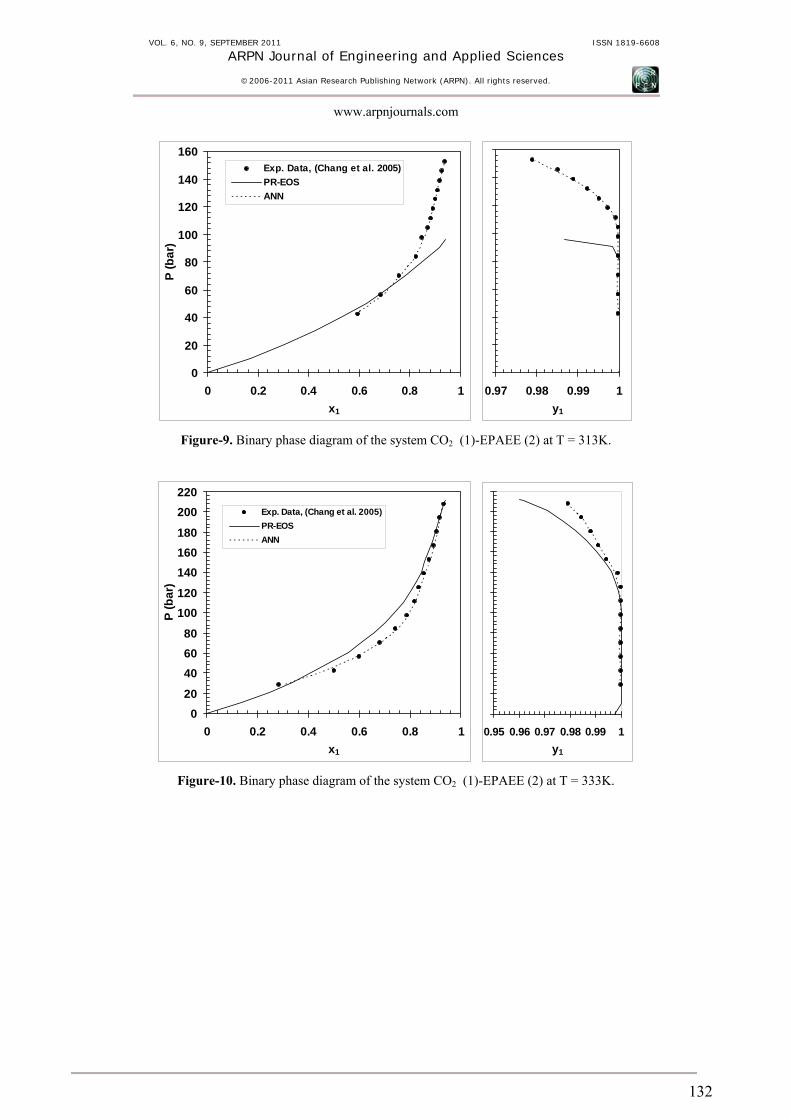
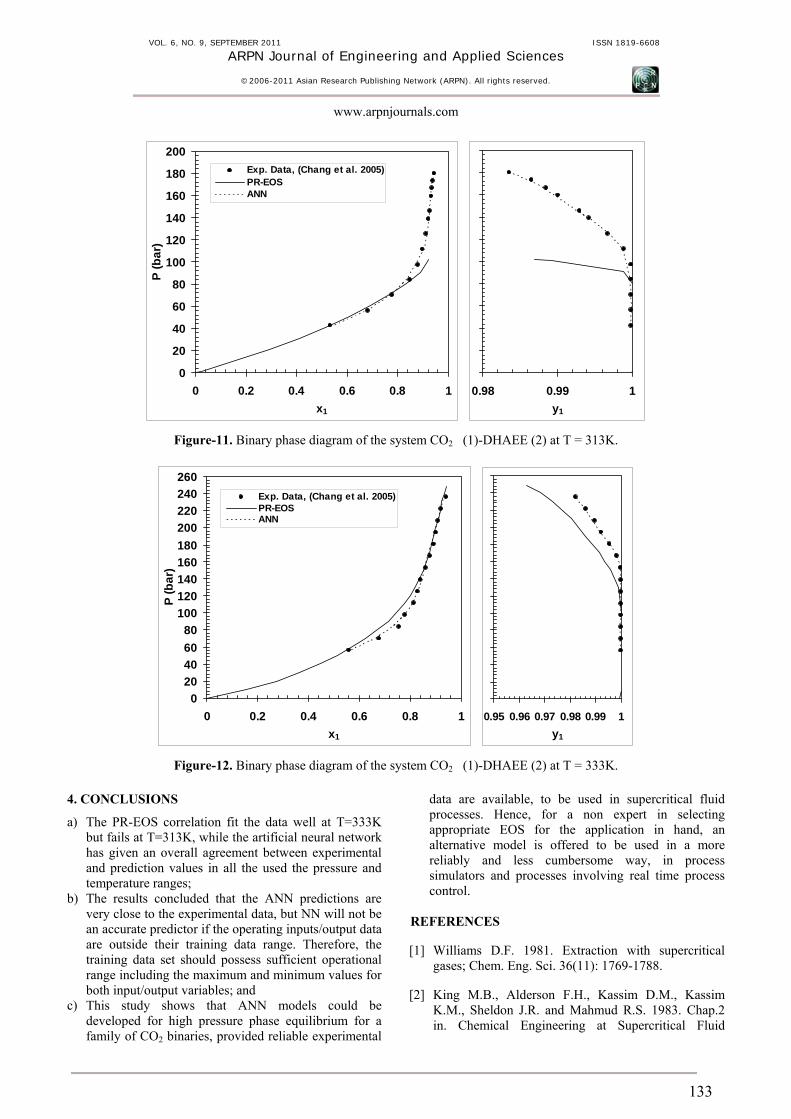
The predicted results of vapor-liquid equilibrium
of CO2 (1)- fatty acid ester(2) systems using PE program with PR-EOS and adjustable parameters determined previously and experimental in reference[14] are shown graphically in Figures 5-12). These Figures also include a NN predicted results. The % ARSRD of the NN model are lower than those obtained by EOS model for all the CO2- fatty acid ester binaries as shown in Table-5. The Figures show excellent agreement between experimental data and
the NN predicted data. It can be seen from the Figures that the NN model is plausibly acceptable as an alternative to cubic EOS (PR-EOS) for VLE data prediction for the studied case of CO2-ester systems. On the other hand NN will not be an accurate predictor if the operating inputs/output data are outside their training data range. Therefore, the training data set should possess sufficient operational range including the maximum and minimum values for both input/output variables.
Table-5. The % ARSRD between the predicted and the experimental data for mole
fraction in liquid and vapor phases using ANN.
% ARSRD T=313K T=333K System
xCO2 y CO2 x CO2 y CO2
CO2- Methyl Oleate 1.5420 0.0609 0.6064 0.0457 CO2- Methyl Linoleate 1.3171 0.0522 0.8005 0.0812 CO2- EPAEE 0.6957 0.0460 3.2052 0.0448 CO2- DHAEE 1.1745 0.0171 1.2867 0.0327
129
VOL. 6, NO. 9, SEPTEMBER 2011 ISSN 1819-6608
ARPN Journal of Engineering and Applied Sciences
©2006-2011 Asian Research Publishing Network (ARPN). All rights reserved.
www.arpnjournals.com
0
20
40
60
80
100
120
140
0 0.2 0.4 0.6 0.8 1x1
P (b
ar)
Exp. Data, (Chang et al. 2005 )PR-EOSANN
0.97 0.98 0.99 1y1
Figure-5. Binary phase diagram of the system CO2 (1)-Methyl Oleate (2) at T = 313K.
0
20
40
60
80
100
120
140
160
180
200
0 0.2 0.4 0.6 0.8 1x1
P (b
ar)
Exp. Data, (Chang et al. 2005)PR-EOSANN
0.96 0.97 0.98 0.99 1y1
Figure-6. Binary phase diagram of the system CO2 (1)-Methyl Oleate (2) at T = 333K.
130

VOL. 6, NO. 9, SEPTEMBER 2011 ISSN 1819-6608
ARPN Journal of Engineering and Applied Sciences
©2006-2011 Asian Research Publishing Network (ARPN). All rights reserved.
www.arpnjournals.com
0
20
40
60
80
100
120
140
0 0.2 0.4 0.6 0.8 1x1
P (b
ar)
Exp. Data, (Chang et al. 2005 )PR-EOSANN
0.97 0.98 0.99 1y1
Figure-7. Binary phase diagram of the system CO2 (1)- Methyl Linoleate (2) at T = 313K.
0
20
40
60
80
100
120
140
160
180
200
0 0.2 0.4 0.6 0.8 1x1
P (b
ar)
Exp. Data, (Chang et al. 2005)PR-EOSANN
0.96 0.97 0.98 0.99 1y1
Figure-8. Binary phase diagram of the system CO2 (1)- Methyl Linoleate (2) at T = 333K.
131
VOL. 6, NO. 9, SEPTEMBER 2011 ISSN 1819-6608
ARPN Journal of Engineering and Applied Sciences
©2006-2011 Asian Research Publishing Network (ARPN). All rights reserved.
www.arpnjournals.com
0
20
40
60
80
100
120
140
160
0 0.2 0.4 0.6 0.8 1x1
P (b
ar)
Exp. Data, (Chang et al. 2005)PR-EOSANN
0.97 0.98 0.99 1y1
Figure-9. Binary phase diagram of the system CO2 (1)-EPAEE (2) at T = 313K.
020
406080
100120
140160180
200220
0 0.2 0.4 0.6 0.8 1x1
P (b
ar)
Exp. Data, (Chang et al. 2005)PR-EOSANN
0.95 0.96 0.97 0.98 0.99 1y1
Figure-10. Binary phase diagram of the system CO2 (1)-EPAEE (2) at T = 333K.
132
VOL. 6, NO. 9, SEPTEMBER 2011 ISSN 1819-6608
ARPN Journal of Engineering and Applied Sciences
©2006-2011 Asian Research Publishing Network (ARPN). All rights reserved.
www.arpnjournals.com
0
20
40
60
80
100
120
140
160
180
200
0 0.2 0.4 0.6 0.8 1x1
P (b
ar)
Exp. Data, (Chang et al. 2005)PR-EOSANN
0.98 0.99 1y1
Figure-11. Binary phase diagram of the system CO2 (1)-DHAEE (2) at T = 313K.
020406080
100120140160180200220240260
0 0.2 0.4 0.6 0.8 1x1
P (b
ar)
Exp. Data, (Chang et al. 2005)PR-EOSANN
0.95 0.96 0.97 0.98 0.99 1y1
Figure-12. Binary phase diagram of the system CO2 (1)-DHAEE (2) at T = 333K. 4. CONCLUSIONS
a) The PR-EOS correlation fit the data well at T=333K but fails at T=313K, while the artificial neural network has given an overall agreement between experimental and prediction values in all the used the pressure and temperature ranges;
b) The results concluded that the ANN predictions are very close to the experimental data, but NN will not be an accurate predictor if the operating inputs/output data are outside their training data range. Therefore, the training data set should possess sufficient operational range including the maximum and minimum values for both input/output variables; and
c) This study shows that ANN models could be developed for high pressure phase equilibrium for a family of CO2 binaries, provided reliable experimental
data are available, to be used in supercritical fluid processes. Hence, for a non expert in selecting appropriate EOS for the application in hand, an alternative model is offered to be used in a more reliably and less cumbersome way, in process simulators and processes involving real time process control.
REFERENCES [1] Williams D.F. 1981. Extraction with supercritical
gases; Chem. Eng. Sci. 36(11): 1769-1788. [2] King M.B., Alderson F.H., Kassim D.M., Kassim
K.M., Sheldon J.R. and Mahmud R.S. 1983. Chap.2 in. Chemical Engineering at Supercritical Fluid
133
VOL. 6, NO. 9, SEPTEMBER 2011 ISSN 1819-6608
ARPN Journal of Engineering and Applied Sciences
©2006-2011 Asian Research Publishing Network (ARPN). All rights reserved.
www.arpnjournals.com
Conditions. Paulaitis, M.E. et al. (Eds.), Ann Arbor Science, 31.
[3] Peter S. and Brunner G. 1978. Angew. Chem. Int. Ed.
Engl. 17: 746. [4] Eisenbach W. 1984. Supercritical fluid extraction,
Ber. Bunsenges, Phys. Chem. 88: 882-887. [5] Inomata H., Kondo T., Hirohama S., Arai K., Suzuki
Y. and Konno M. 1989. Vapor-liquid equilibria for binary mixtures of carbon dioxide and fatty acid methyl esters. Fluid Phase Equilibria. 46: 41-52.
[6] Cheng H., Zollweg J.A. and Streett W.B. 1989.
Experimental measurements of supercritical fluid-liquid phase equilibrium, Chap.7 in "Supercritical Fluid Science and Technology. Johnston, K.P. et al. (Eds.), ACS. (406): 86.
[7] Zou M., Lim S. B., Rizvi S. S. H. and Zollweg J. A.
1989. Vapor-liquid equilibria of fatty acid esters in supercritical fluids, Chap.8 in "Supercritical Fluid Science and Technology. Johnston, K.P. et al. (Eds.), ACS. (406): 98.
[8] Bharath R., Inomata H., Adschiri T. and Arai K. 1992.
Phase equilibrium study for the separation and fractionation of fatty oil components using supercritical carbon dioxide. Fluid Phase Equilibria. 81: 307-320.
[9] Lockemann C.A., de Soto-Soliz S.M. and Schlünder
E.-U. 1995. High-pressure phase equilibria and densities of the binary system carbon dioxide-methyl laurate. Chem. Eng. Process. 34: 561-564.
[10] Karim A. M. A., Kassim D. M. and Zablouk M. A.
2001. Phase Equilibrium Study for the Separation of Liquid Components Using Supercritical Carbon Dioxide. Scientific Journal, Tikrit Univ. Eng. Science, College of Eng., Tikrit Univ., Iraq. 8(2): 87-104.
[11] Yang S. X., Li H. and Shi J. 2003. Modeling of
Supercritical Fluid Extraction by Neural Networks. Intelligent Automation and Soft Computing. 9(1): 3-12.
[12] Chang C-m. J., Lee M-s., Li B-c. and Chen P-y. 2005.
Vapor-Liquid Equilibria and Densities of CO2 with Four Unsaturated Fatty Acid Esters at Elevated Pressures. Fluid Phase Equilibria. 233: 56-65.
[13] Mohanty S. 2005. Estimation of vapour liquid
equilibria of binary systems, carbon dioxide-ethyl caproate, ethylcaprylate and ethyl caprate using artificial neural networks. Fluid Phase Equilib. 235, 92.
[14] Mohanty S. 2006. Estimation of vapour liquid equilibria for the system, carbon dioxide-difluormethane using artificial neural networks. Int. J. Refrigeration. 29, 243.
[15] Si-Moussa C., Hanini S., Derriche R., Bouhedda M.
and Bouzidi A. 2008. Prediction of High-Pressure Vapor-Liquid Equilibrium of Six Binary Systems, Carbon Dioxide with Six Esters, Using an Artificial Neural Network Model. Brazilian J. of Chem. Eng. 25(01): January-March, 183-19.
[16] Moghadassi A., Parvizian F., Hosseini S. M. and
Sharifi A. 2008. Prediction of PVT Properties of Ammonia by Using Artificial Neural Network and Equations of state. ARPN J. of Eng. And Applied Sciences. 3(6): 18-27.
[17] Moghadassi A., Parvizian F. and Hosseini S. M. 2009.
A New Approach Based on Artificial Neural Networks for Prediction of High Pressure Vapor-Liquid Equilibrium. Australian J. of Basic and Applied Sciences. 3(3): 1851-1862.
[18] Karim A. M. A., Mutlag A. K. 2009. Artificial Neural
Networks Modeling of Phase Equilibrium for the Separation of Phenanthrene Using supercritical CO2. 1st Information Technology Conference / Computer Engineering and Information Technology Dept./ University of Technology / Baghdad - Iraq / 21-23 April.
[19] Pfohl O., Petkov S., Brunner G. 2009. "PE" quickly
makes available the newest equations of state via the internet. Industrial and Engineering Chemistry Research. 39(11): 4439-4440.
[20] Petkov S., Pfohl O. and Brunner G. 1999. Modelling
High-Pressure Fluid-Phase Equilibria. 17th ESAT. [21] Peng D.-Y., Robinson D.B. 1976. A New Two-
Constant Equation of State. I and EC Fundam. 15(1): 59.
[22] Soave G. 1972. Equilibrium Constants from a
Modified Redlich-Kwong Equation of State. Chem. Eng. Sci. 27: 1197.
[23] Walas S. M. 1985. Phase Equilibria in Chemical
Engineering. Butterworth Publishers, USA. [24] Stich T. J., Spoerre J., K. and Velasco T. 2000. The
Application of Artificial Neural Networks to Monitoring and Control of an Induction Hardening Process. Journal of Industrial Technology. 16(1), Jan.
[25] Demuth H. B. and Beala M. 1998. Neural Network
Toolboxa: User’s Guide. Ver, 3, The Mathworks, Inc., Natik, MA.
134