Embed Size (px)
Citation preview

1
2014 Investor Presentation Final version 3.2
read disclaimers on the final page

2Key HighlightsKey Highlights
� Langham Place
- strong sales growth at mall
� Citibank Plaza
- bottoming out in 2015
� Expense Ratio Slightly Up
- higher rental commissions
� DPU Lower
- normalizing tax rate
- higher interest expense
� Stable Valuation
� Resilient Financial Profile
2014 Change
Rental Income $2080m + 4.6%
Net Property
Income$1800m + 3.0%
Expense Ratio 13.5% + 1.4pp
Distribution
per Unit$0.2037 - 3.0%
Property
Valuation$62,438m + 1.5%
Gearing 23.1% - 0.3pp

3Total Rental IncomeTotal Rental Income
Rental Income increased 4.6% yoy to $2,080 mil, but was down 1.6% HoH
By contribution: Citibank Plaza 51%
Langham Place Mall 35%
Langham Place Office 14%
At the Trust Level1
Langham Place OfficeB
Langham Place MallC
Revenue -3.7% to $1,064 mil
Lower Passing Rent
Decrease in occupancy in 4Q
after BoAML moved out
Citibank PlazaA
Revenue +11.2% to $281 mil
Higher Passing Rents
A bit of down time in 2H after
Ageas Insurance vacated
Revenue +16.4% to $735 mil
Higher Base Rents
Seasonality concentrates growth
in 2H of each year
Minimal impact on income from
Oct/Nov Occupy demonstrations
No longer discussing Gross Revenue to avoid the distortion of bldg mgt fee income growth
553 564 552 553 559 505
113 119 120 133 140142
259278 291
340 350 385
$0
$200
$400
$600
$800
$1,000
$1,200
$1,400
1H 12 2H 12 1H 13 2H 13 1H 14 2H 14
in H
K$
(m
illi
on
s)
Rental Income (by Property) LP Retail LP Office Citibank Plaza

4Net Property IncomeNet Property Income
Net Property Income +3.0% to $1,800 mil
Net Operating Expenses +16.0% to $280 mil
Net Expenses Ratio +1.4pp to 13.5%
Net Building Mgt Expenses increased by $13.6 mil,
driven by higher maintenance costs at LP Mall
Leasing Commissions increased by $17.6 mil, because of
large amount of space rolled over at office properties
At the Trust Level1 At the Property Level2
Net Property
Income
Net Operating
Expenses
Citibank Plaza -6% to $932m +15% to $132m
Langham Office +9% to $253m +34% to $28m
Langham Mall +17% to $615m +14% to $120m
830 836 858 889 921880
95 126 105136 128 151
$0
$200
$400
$600
$800
$1,000
$1,200
$1,400
1H 12 2H 12 1H 13 2H 13 1H 14 2H 14
in H
K$
(m
illi
on
s)
Rental Income (with expenses)
Operating Expenses Net Property Income
10.2%
13.1%
10.9%
13.3%
12.2%
14.7%
0%
2%
4%
6%
8%
10%
12%
14%
16%
18%
1H12 2H12 1H13 2H13 1H14 2H14
Expense Ratio (as a % of Rental Income)

5
Cash Interest Expenses increased $37 mil, from $251
mil to $288 mil
$7.5bn refinancing in May 2014 at higher rates
No refinancing and therefore no further increase in
interest spreads for 2015.
Interest1
Taxes paid increased $48 mil to $161 mil
Effective tax rate was low at 12.8% because of
leftover deductions from retired CB used in 1H
The effective tax rate in 1H was 9.1% but returned
to ‘normal’ in 2H
Taxes 2
Non Property ExpensesNon Property Expenses
79
65
117
134139
150
$0
$30
$60
$90
$120
$150
$180
1H 12 2H 12 1H 13 2H 13 1H 14 2H 14
in H
K$
(mill
ions
)
Cash Interest Expenses
16.7%
9.5%
12.8%
0%
4%
8%
12%
16%
20%
2012 2013 2014
Effective Tax Rate

6DistributionsDistributions
Distributable Income decreased 2.9% to $1,234 mil.
There was a $37 mil drop broken down as follows:
Although NPI increased $53m
Interest Income decreased by $5m
Cash Finance Costs increased $37m
Taxes increased by $48m
Distributable Income1
Distribution Per Unit for 2014 decreased
3.0% to HK$0.2037
Based on unit price of $3.80, the yield is
5.36%
-$90m
The dip in 2012 DPU was due to the conversion of CBs
Distribution Per Unit2
1,2
54
1,2
71
1,2
34
-68 -70 -64
1,1
86
1,2
01
1,1
71
-$400
$0
$400
$800
$1,200
$1,600
$2,000
2012 2013 2014
in H
K$
(m
illi
on
s)
Distribution Amount Distributable Income
Retention
Distribution Amount
0.2089 0.2099 0.2037
$0.00
$0.05
$0.10
$0.15
$0.20
$0.25
$0.30
2012 2013 2014
Distribution per Unit

7
Citibank Plaza,
$36,332m
Langham
Office,
$7,869m
Langham
Retail,
$18,237m
Valuation by Property Valuation by Property
58%
29%
13%
Value fell 4.1% to $22,000 per sq. ft.
Implied rent decreased
from $82.67 to $78.72 per sq. ft
Cap Rate 3.3%
Citibank Plaza
Langham Place Mall
Langham Place Office
Comparisons are made with respect to Dec 2013 Valuation by Savills Valuation and Professional Services per sq. ft. valuations are based on Gross Floor Area
Value rose 6.6% to $11,200 per sq. ft
Implied rent increased
from $35.00 to $37.32 per sq. ft
Cap Rate 4.0%
Value rose 12.4% to $30,000 per sq. ft.
Implied rent increased
from $164.32 to $185.00 per sq. ft
Cap Rate 4.0%
Appraised Value of Properties at $62.44bn
Property Valuation1

8
Properties appreciated by $929mil in 2014
Capitalization Rates unchanged over 2014, all
adjustments to value are based on changes in rental
assumptions
Property Value Over Time1 Net Asset Value2
Net Assets stand at HK$46.28bn
NAV per unit increased 1.5% to HK$8.06 per
unit from Dec 2013
Based on unit price of $3.80, the discount to
NAV is 53%
Net Asset ValueNet Asset Value
$7.80 $7.94 $8.06
$0.00
$2.00
$4.00
$6.00
$8.00
$10.00
12/12 12/13 12/14
Net Asset Value per Unit
36.5 37.9 36.3
21.823.6 26.1
$0
$10
$20
$30
$40
$50
$60
$70
$80
12/12 12/13 12/14
in H
K$
(b
illi
on
s)
Value of Property Portfolio
Citibank Plaza Langham Place

9
22
00 3
70
0
19
00
38
00
31
04
$0
$1,000
$2,000
$3,000
$4,000
$5,000
$6,000
2015 2016 2017 2018 2019 2020 2021 2022 2023
HK
$ m
illi
on
s
Debt MaturityBank Loans MTN
HK$11.6bn in secured bank loans and
HK$3.1bn in unsecured notes
Blended interest: 2.03% (1M Hibor = 0.24%)
Average maturity: 4.1 years (as of Dec 2014)
Interest Expense2
floating interest rate of Hibor + 1.33%. fixed coupon of 3.75%
79% 21%
Debt As Of Dec 2014 Debt As Of Dec 2014
Basic Information1
At 1M Hibor = 0.24%, 2015 interest expenses
should be $298m
(compared to $289m for 2014 )

10
Total borrowings have remained steady at $14.7bn
Gross Assets at $63.6bn
Langham Place Mall is presently unpledged
Total Borrowings1
Interest cover remains comfortable at 6.2x
Debt to Assets (Gearing) ratio is low at 23.1%, well
within REIT Code maximum of 45%
Debt to Equity ratio at a robust level of 31.8%
Ratios 2
Debt HistoryDebt History
Interest cover is calculated using NPI as the numerator.
12,219
14,704 14,704
0x
4x
8x
12x
16x
0
5,000
10,000
15,000
20,000
2012 2013 2014
HK
$ (m
illi
on
s)
Debt Levels
Total Borrowings (L) Interest Coverage (R)
31.8%
23.1%
0%
20%
40%
60%
80%
100%
2012 2013 2014
Leverage RatiosDebt / Equity Debt / Assets

11
OFFICE MARKET UPDATEOFFICE MARKET UPDATE

12
$0
$20
$40
$60
$80
$100
$120
$140
$H
K p
er
sq.
ft.
Index rebased from original data series to the approximate equivalent rental levels
Collier's Rental Indices(Dec 2011 - Dec 2014)
Wanchai
Central
Tsim Sha Tsui
HK HK Grade ‘A’ Office Rents Grade ‘A’ Office Rents
vacancy 5%
vacancy 3%
vacancy 2%

13
0.0
0.2
0.4
0.6
0.8
1.0
1.2
1.4
1.6
1987
1988
1989
1990
1991
1992
1993
1994
1995
1996
1997
1998
1999
2000
2001
2002
2003
2004
2005
2006
2007
2008
2009
2010
2011
2012
2013
2014
2015
2016
2017
NE
T F
LOO
R A
RE
A (
mill
ion
sq
ft)
HONG KONG CENTRAL GRADE A OFFICE SUPPLY (1986 - 2016)
Grade Grade ‘A’ Office ‘A’ Office Supply Supply -- Central Central
No new land from reclamation
3 possible future sites:
Murray Road Carpark (350,000 sq. ft.)
GPO (300,000 sq. ft.)
site opp new Government HQ (180,000 sq. ft.)
Longer Term Supply2
Virtually 0 Grade A supply in Central
Shanghai Commercial Bank Redevelopment (95,000 sq. ft.)
Only Grade-B buildings, but in good locations
33 Des Voeux Rd Central (74,000 sq. ft.)
Imminent Supply1
20 year Average Supply
490,000 sq. ft. per year

14
0.0
1.0
2.0
3.0
4.0
5.0
6.0
7.0
8.0
198
7
198
8
198
9
199
0
199
1
199
2
199
3
199
4
199
5
199
6
199
7
199
8
199
9
200
0
200
1
200
2
200
3
200
4
200
5
200
6
200
7
200
8
200
9
201
0
2011
201
2
201
3
201
4
201
5
201
6
201
7
NE
T FL
OO
R A
REA
(mill
ion
sq
ft)
HONG KONG SAR GRADE A OFFICE SUPPLY (1986 - 2016)
Central Rest of HKSAR
Grade Grade ‘A’ Office ‘A’ Office Supply Supply -- HKSARHKSAR
20 year Average Supply
2,470,000 sq. ft. per year
2016 Supply2
550k sq. ft. - 2 projects in Shatin
710k sq. ft. - 2 projects in Kwln E
240k sq. ft. - project in Island E
600k sq. ft. - Somerset Hse in Island E
180k sq. ft. - Sunning Plaza in CWB
240k sq. ft. - Asia House in CWB
Recent Demolitions3 2015 Supply1
2.3m sq. ft. - 5 projects in Kwln E
250k sq. ft - Octagon in Tsuen Wan
120k sq. ft. - Observatory Rd in TST

15Capitalization RatesCapitalization Rates

16
CITIBANK PLAZACITIBANK PLAZA
17
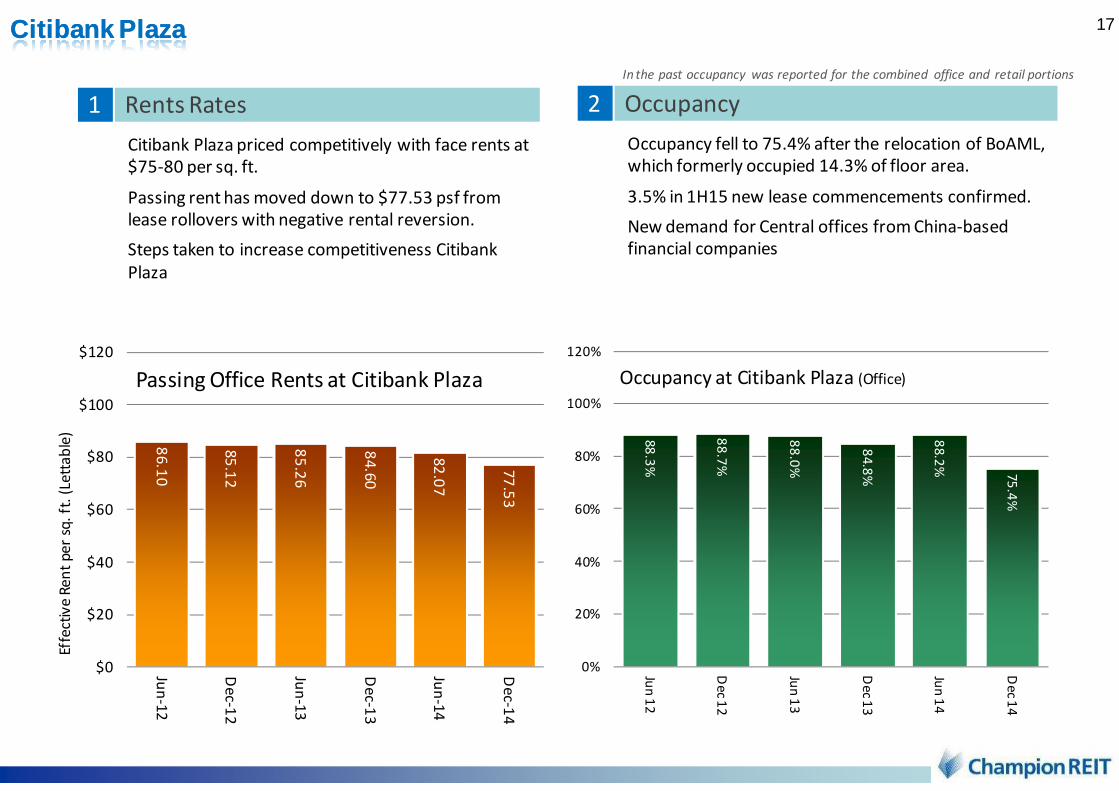
Citibank Plaza priced competitively with face rents at
$75-80 per sq. ft.
Passing rent has moved down to $77.53 psf from
lease rollovers with negative rental reversion.
Steps taken to increase competitiveness Citibank
Plaza
Rents Rates1
Citibank Plaza Citibank Plaza
Occupancy fell to 75.4% after the relocation of BoAML,
which formerly occupied 14.3% of floor area.
3.5% in 1H15 new lease commencements confirmed.
New demand for Central offices from China-based
financial companies
Occupancy 2
86
.10
85
.12
85
.26
84
.60
82
.07
77
.53
$0
$20
$40
$60
$80
$100
$120
Jun
-12
De
c-12
Jun
-13
De
c-13
Jun
-14
De
c-14
Effe
ctiv
e R
en
t p
er
sq.
ft.
(Le
tta
ble
)
Passing Office Rents at Citibank Plaza
88
.3%
88
.7%
88
.0%
84
.8%
88
.2%
75
.4%
0%
20%
40%
60%
80%
100%
120%
Jun
12
De
c 12
Jun
13
De
c 13
Jun
14
De
c 14
Occupancy at Citibank Plaza (Office)
In the past occupancy was reported for the combined office and retail portions

18Citibank Plaza Citibank Plaza
Expiry risk is lower in 2015 with less than 10% of
the floor area up for renewal.
Passing rents have further to fall as the average
expiring rents in 2015 are $98 psf.
Leases commission charged up front at
commencement of new leases – operating
expenses will go up in re-letting phase
Lease Maturities 2 Tenant Mix 1
Banking has been reduced to a third of the floor area
with the exit of BoAML
The growing segments are:
Asset Management which increased from 8% to 14%
Hedge Funds which increased from 4% to 7%.
Banking33%
Asset Management
14%Hedge Funds
7%Securities
2%
Legal5%
Consultancy2%
Others11%
Vacant25%
Tenant
ProfileCitibank Plaza - Office
(Dec 2014)
Citibank
18%
ICBC
12%
24.6%
9.9%
27.4%
18.4%
1.9%
6.9%
1.8%
12.6%
1.4%
0%
10%
20%
30%
40%
50%
Vacant 2015 2016 2017 2018
Perc
en
tage
of F
loo
r A
rea
Citibank Plaza Expiries (Dec 2014)Vacant Leases Expiring Rent Review

19Asset EnhancementAsset Enhancement
Planned2 In Progress1
Car park is currently undergoing renovation.
Completion expected in 3Q 15.
A facelift to the main office lobby, including the lift cars,
is being launched.
Work is scheduled to begin in early 2016.

20
SUPPLIMENTARY MATERIALSSUPPLIMENTARY MATERIALS
LANGHAM PLACE LANGHAM PLACE

21
Face rents steady at $38-45 per sq. ft.
Passing rent improved further to $35.87 per sq. ft.
but growth will begin to taper as rental reversion gap
narrows.
Rent Rates 1
LanghamLangham Place Office TowerPlace Office Tower
Several tenants vacated upon expiry in 2014 but
were replaced.
There was a bit of downtime for a few floors in 2H
but occupancy returned to 100% by year end.
Occupancy2
28
.09
28
.36
30
.42
32
.86
34
.78
35
.87
$0
$5
$10
$15
$20
$25
$30
$35
$40
Jun
-12
De
c-12
Jun
-13
De
c-13
Jun
-14
De
c-14
Eff
ect
ive
Re
nt
pe
r sq
. ft
. (G
FA)
Passing Office Rents
at Langham Place 98
.0%
99
.2%
98
.8%
99
.0%
98
.8%
10
0.0
%
0%
20%
40%
60%
80%
100%
120%
Jun
12
De
c 12
Jun
13
De
c 13
Jun
14
De
c 14
Office Occupancy at Langham Place

22
Insurance, formerly 10% of floor area, is no longer a
category with the relocation of Ageas.
Merchandizing & Trading decreased by a further 3%.
Most of this 13% has been taken up by tenants from
the Health & Beauty sector.
Tenant Mix 1
LanghamLangham Place Office TowerPlace Office Tower
Lease Maturities2
15% of floor area to expire in 2015.
The renewal of the majority of these have
already been negotiated.
Merchandizing& Trading
38%
Professional & Sales Services
18%
Health & Beauty
31%
Lifestyle10%
Others3%
Tenant
ProfileLangham Place Office
(Dec 2014)
0.0%
14.8%
53.1%
12.3%5.1%
2.5%
1.0%
0%
10%
20%
30%
40%
50%
60%
70%
Vacant 2015 2016 2017 2018
Pe
rce
nta
ge
of
Flo
or
Are
a
Langham Place Office Expiries (Dec 2014) Vacant
Leases Expiring
Rent Review
Sears
17%
Neo
Derm
12%

23Some 2014 LP Mall EventsSome 2014 LP Mall Events

24
Fashion & Accessories
44%
Health &Beauty10%
Entertainment16%
Food & Beverage
20%
Others10%
Tenant
ProfileLangham Place Mall
(Dec 2014)
LanghamLangham Place MallPlace Mall
9.8% growth in Tenant Sales per sq. ft. in 2014.
Focus on cosmetics and mid-priced fashion and
accessories isolates mall from slowdown in the HK luxury
retail segment.
Tenant Sales2
Trade mix unchanged - focus is on selecting the
individual tenants.
Cinema City with its 4DX cinemas is a major
new tenant. Other recent new shops include
Uniqlo, Holly Brown, TeaWood, Clarks Originals.
Tenant Mix 1
$9
56
$1
,05
3
$1
,14
3
$8
51
$9
39
$1
,04
1
$0
$200
$400
$600
$800
$1,000
$1,200
$1,400
2012 2013 2014
Mo
nth
ly A
vera
ge
(pe
r sq
. ft
.)
Tenant Salesex Cinema
with Cinema

25
10
2.6
5
11
4.8
9
11
8.7
1
14
4.2
6
14
6.0
1
16
5.4
4
$0
$40
$80
$120
$160
$200
Jun
-12
De
c-12
Jun
-13
De
c-13
Jun
-14
De
c-14
Effe
ctiv
e R
en
t p
er s
q.
ft.
(Let
tab
le)
Passing Retail Rents at Langham Place
(exclusive of turnover rent)
LanghamLangham Place MallPlace Mall
The passing base rent increased to $165.44 per sq. ft.
following the rollover of 36% of floor area in 2014.
Including turnover rent, the comprehensive rent is
$180 per sq. ft. compared to $152 per sq. ft. in 2013.
Rent as a percent of sales is 17.5%.
Passing Rent1
In spite of the hefty jump in passing rent,
turnover rent only decreased marginally from
$25.87 to $25.21 per sq. ft. (there was a 2
month impact from the Occupy protests)
Turnover rent as a percent of the total is 14%
Turnover Rent2
$2
0.6
4
$2
6.6
4
$2
3.2
0
$2
8.5
4
$2
4.1
2
$2
6.3
0
$0
$20
$40
$60
$80
$100
$120
$140
$1601
H 1
2
2H
12
1H
13
2H
13
1H
14
2H
14
Mo
nth
ly A
ve
rag
e (
pe
r sq
. ft
)
Turnover Rent

26
0.0%
25.8%24.1%
17.4%14.1%
4.7%
2.2%
0%
10%
20%
30%
40%
50%
Vacant 2015 2016 2017 2018
Pe
rce
nta
ge
of
Flo
or
Are
a
Langham Place Mall Expiries (Dec 2014)Vacant Leases Expiring Rent Review
LanghamLangham Place MallPlace Mall
Full occupancy easily maintained
With proven track record, there are ample
retailers competing for limited spaces at the Mall
Occupancy2
26% of the space in the Mall will be rolling over
in 2015.
Tenant undergoing Rent Review in 2015 is H&M
Lease Maturities1
10
0.0
%
10
0.0
%
10
0.0
%
10
0.0
%
10
0.0
%
10
0.0
%
0%
20%
40%
60%
80%
100%
120%
Jun
12
De
c 12
Jun
13
De
c 13
Jun
14
De
c 14
Occupancy at Langham Place Mall

27ConclusionConclusion
At the operational level the strong performance of Langham Place will not be able to offset the
expected fall in Citibank Plaza income as it did in 2014.
Distributions, which will also be affected by a slightly higher effective tax rate, are expected to be
lower in 2015
the REIT3
Lower average occupancy and lower passing rent in 2015. Rental rates will continue to be under
pressure this year as we focus on rebuilding occupancy.
While there has been some progress in reducing vacancy in 1Q15, income from Citibank Plaza is
expected to decline this year.
Citibank Plaza1
Office Rents are firm, there should continue to be positive rental reversion but only 15% of the
building is expiring in 2015.
Retail Rental Income should continue to increase in 2015 but the increase will depend on the pace of
tenant sales growth in 1H 15.
Langham Place2
28
the END the END

29
This presentation may contain information which is proprietary, confidential and/or legally privileged and has been prepared by Eagle AssetManagement (CP) Limited, in its capacity as the manager (the “REIT Manager”) of Champion Real Estate Investment Trust (the “Trust”). Thispresentation is being communicated for information purposes only and its intended recipients are professional investors in Hong Kong (asdefined by Part 1 of Schedule 1 to the Securities and Futures Ordinance(Cap.571)) and professional investors outside of Hong Kong to whomit is lawful to communicate the presentation. Any other persons should not rely or act upon this presentation or any of its contents.
The information contained in this document, including any obtained from external data sources, has not been verified. The information andopinions in this presentation are subject to change without notice and the REIT Manager is under no obligation to update or keep current theinformation contained in this presentation. No representation or warranty, express or implied is made as to, and no reliance should be placedon, the fairness, accuracy, completeness or correctness of the information or opinions contained herein. It is not the intention to provide, andyou may not rely on this document as providing, a complete or comprehensive analysis of the Trust’s financial or operational position.Furthermore, this presentation should not be construed as legal, tax, investment, or other advice. None of the REIT Manager, the Trust, norany of their respective affiliates, advisors or representatives shall be held liable for any damages, losses or expenses of any kind, whetherdirect, indirect, special, consequential or incidental, arising out of or in connection with the presentation. In this regard, all warranties orrepresentations of any kind, whether expressed or implied by law, equity or statutes, are excluded to the extent permissible under theapplicable law. All liabilities whatsoever arising from or incidental to the document are hereby expressly disclaimed.
Certain information and statements made in this presentation contain forward-looking statements. All forward-looking statements are based oncurrent expectation of future events and are subject to a number of factors that could cause actual results to differ materially from thosedescribed in the forward-looking statements. Caution should be taken with respect to such statements and you should not place unduereliance on any such forward-looking statements.
This document does not constitute a prospectus, notice, circular, brochure or advertisement offering to sell or inviting offers to acquire,purchase or subscription for any units (“Units”) or other securities of the Trust. The value of Units and the income from them, if any, may fall aswell as rise from time to time. Units are not obligations of, deposits in, or guaranteed by the REIT Manager, the Trust, nor any of theirrespective affiliates, advisors or representatives. An investment in Units or other securities of the Trust is subject to investment risks, includingthe possible loss of the principal amount invested. It is intended that holders of Units may only deal in their Units through trading on the StockExchange of Hong Kong and investors have no right to request the REIT Manager to redeem their Units. Listing status does not guarantee aliquid market for the Units.
All copyright, patent, intellectual and other property rights in information contained herein is owned by the REIT Manager or other third parties.No rights of any kind are licensed or assigned or shall otherwise pass to persons accessing such information. Without the expressed writtenpermission of the REIT Manager under no circumstances should information contained herein or any part of it be quoted, reproduced,redistributed or transmitted in any form, by any means, electronic or otherwise.
Important Notice