Embed Size (px)
Citation preview

For more information on gold, and how specific gold, silver, palladium and platinum investments may be used to
protect yourself or profit from the events we foresee, please contact:
2 0 1 4 G O L D M A R K E T O U T L O O K

Copyright CPM Group LLC 2014. These reports are produced by CPM Group for distribution by Monex Deposit Company. The rights to distribution, reproduction, and redistribution rights are ceded to Monex Deposit Company by CPM Group for these reports. These reports are not for reproduction or retransmission without written consent of Monex Deposit Company. The intellectual content and property of these reports remain the property of CPM Group, and they are not for reproduction or retrans-mission without written consent of CPM Group. The views expressed within are solely those of CPM Group. Such infor-mation has not been verified, nor does CPM make any representation as to its accuracy or completeness. Any statements non-factual in nature constitute only current opinions, which are subject to change. While every effort has been made to ensure that the accuracy of the material contained in the reports is correct, CPM Group cannot be held liable for errors or omissions. CPM Group is not soliciting any action based on it. Information contained here should not be relied on as specific investment or market timing advice. At times the principals and associates of CPM Group may have long or short positions in some of the markets mentioned here.

Page 1 2014 Gold Market Outlook
A Golden Buying Opportunity Gold prices fell sharply in 2013, from an average price of $1,670.15 in 2012 to $1,409.43 on average in 2013. Even as prices declined they remained far above historical gold price levels, remaining higher than they ever had been prior to the middle of 2010. The seeming, but not real, disparity between those two statements – prices fell sharply and remained at historical highs – beautifully reflects the discordant trends in the gold investment market last year. Short-term investors and trend followers either were selling gold or stopped buying additional amounts of gold, reflected in the de-cline in prices. Longer term investors, who seem to repre-sent three-quarters or more of the gold investing public, continued to buy historically high volumes of gold. While short-term investors were selling, in part in reaction to nothing more than the declining gold price, longer term investors continued to buy extraordinarily large amounts of gold as protection against all of the major economic, political, and financial risks and uncertainties that still plague the world. In between these two groups of inves-tors, other investors and central banks pulled back from buying as much gold as they had been buying in 2010 – 2012. They still were buying, but reduced the volumes of their purchases while waiting to see how low gold prices would go before resuming higher volume acquisitions. In total, investors and government banks still bought his-torically high and significant amounts of gold, but the marginal decline was enough to move prices lower. These trends are expected to continue into the first half of 2014, but most of the selling appears to be behind the market. The coming year is likely to see gold prices
stabilize around current levels and then probably rise. The increase may not become apparent until the final four months of the year, but by September or October expectations are that gold prices will be rising once more, as investors step up their gold buying. CPM Group’s main expectation is that gold prices may well hold above the June 2013 low of $1,180 on a daily price basis, although a spike below that cannot be ruled out. We do not expect prices to fall sharply below that level on a sustained basis. We expect gold prices to re-main under pressure for much of 2014, perhaps into Sep-tember or October, before they start rising more force-fully on a longer term basis. The price of gold may aver-age around $1,250 this year, down from $1,409.43 in 2013. Clearly one of the factors that will be necessary for investors to start buying greater volumes of gold again will be higher gold prices. There are any number of in-vestors, including central banks, that are waiting to see gold prices stabilize and start to show signs of rising be-fore they increase their volumes. Longer term economic problems will continue to stimulate historically high amounts of interest in gold from longer term investors. By September and October on-going political fighting in Washington should be expected to encourage other inves-tors with shorter term horizons to start buying once more, exacerbated by the mid-term elections in early Novem-ber. More important, going forward longer term investors and the central bankers that have been buying remain inter-ested in gold. They still are buying a great deal of gold
200
400
600
800
1,000
1,200
1,400
1,600
1,800
2,000
200
400
600
800
1,000
1,200
1,400
1,600
1,800
2,000
00 01 02 03 04 05 06 07 08 09 10 11 12 13 14
Gold Prices: Down From 2011 But Still Historically High
$ / Oz $ / Oz
Comex Gold Prices, Daily, From 1 January 2000 to 7 January 2014

Page 2 2014 Gold Market Outlook
and they should be expected to step up as buyers again, once they feel the price has stopped falling, or they look over the horizon at the gathering economic and political gloom, and decide it’s time to stock up on more gold. Economic and financial environment The split in investor behavior in 2013 reflects the divide between shorter term opportunities investors and longer term investors driven by long-term economic concerns. The first group has watched gold prices rise from 2001 into 2011. Many of these investors did not start buying gold until 2006, 2007, or later, after the price already had more than doubled off of its base at the turn of the cen-tury. They watched prices peak in September 2011, watched the world not collapse despite all that was going wrong in Washington, on Wall Street, and in Europe at the time, and decided to take some profits. In reality, many of them stayed with gold through most of 2012, only dumping their metal as 2013 progressed. Longer term investors continued to buy gold. In fact, they probably stepped up their purchases as prices fell during 2013, picking up lower priced gold from shorter term investors who had bought high in 2011 and 2012 and now were selling. The longer term investors are focusing on the reality that the problems that caused the series of financial crises from 2001 through 2011 are still in place and have yet to be dealt with effectively. (The series of crises really started in 1997 with the Asian currency crisis, but since that incident, the Russian bond default in 1998, and the collapse of Long Term Capital Management in that same
year did not directly damage most U.S. investors, and since the internet stock bubble was still running through-out that period, U.S. investors ignored those early warn-ing signs.) It is not that things have not changed since the 2008 financial crisis and Great Recession; economic and financial conditions have changed wildly in the past six years, and not all for the better. However, the core issues – of structural deficit spending in the industrialized na-tions, rising government debt, and a wide range of finan-cial, economic and political imbalances between the ma-jor countries internationally – remain or have gotten worse. Those investors who continue to buy and hold gold are focusing on one of the single most critical observations about the state of the U.S. and global economies: The chance of another round of financial, economic, and po-litical problems on the scale of what we saw in 2007 - 2009 is 100%. It is not a question of whether it will hap-pen, but when. Does it happen in the next four years, or the next 30 years? Some investors have lost a lot of money by investing based on their fears and expectations of an imminent col-lapse of the modern global financial system since 1981. It has not happened yet. We have come close, but it has not happened. It may not ever happen. Big problems will happen, but maybe not that total failure they lick their chops over. In the meantime, while we are waiting, there are profits to be made in a full range of markets. The fol-lowers of the doomsayers have missed out on the two largest bond rallies and two largest stock market rallies in history. Smarter investors have done well by having a portion of their wealth in gold and silver as insurance against a catastrophic failure of the global financial system, but by also keeping the bulk of their gold and silver in a more mobile investment portfolio to which they add and sub-tract metal based on prices and market conditions. There are times to take short term, tactical positions, as well as to maintain the longer term strategic holdings. They man-age this portion of their precious metals, and other, in-vestments predicated on the probability that the big col-lapse will not come, and that fortunes can be made by investing wisely on the more likely probability that good and bad times will continue to come in broadly cyclical fashion, as has been the case largely since the 14th cen-tury.
Coming back to the immediate economic outlook for 2014 and beyond, relatively painless financial solutions exist for many of these problems, but they are not being
Continuing Sub-Par Global Economic Growth
-6
-4
-2
0
2
4
6
8
10
-6
-4
-2
0
2
4
6
8
10
80 82 84 86 88 90 92 94 96 98 00 02 04 06 08 10 12 14
World
Emerging and Developing Economies
Advanced Economies
Real Gross Domestic ProductAnnual, Projected Through 2014Percent Change Percent Change

U.S. Manufactures More With Fewer Workers
Page 3 2014 Gold Market Outlook
pursued by the U.S. and other governments for political reasons. This suggests that the outlook is even worse, since the lack of political will to tackle the underlying imbalances means that addressing let alone actually fix-ing the U.S. and global economic problems is that much less likely to happen in a reasonable, well structured, long-term rebalancing. With no incentives for political leaders to fix these issues, they are likely to grow even worse over the next many years before reaching truly intractable extremes. It gets worse Before addressing the consequences of all of this for gold, we need to discuss other problems. There’s more. One of the most frightening factors facing the U.S. and every other country in the world is the fact that there is massive structural unemployment, and that the employ-ment situation is only going to get much, much worse going forward. Pundits like to inaccurately proclaim that America does not make anything anymore. If fact, the United States actually produces more than 50% more manufactured goods today than it did a quarter century ago, in the late 1980s, and only in the past two years was supplanted by China as the largest manufacturing nation. It uses 34% fewer factory workers to make things, however. We have lost more jobs to computers since the 1980s than we have to off-shore manufacturing. The United States still is one of the two largest manufac-turing nations in the world, by a wide margin. We only gave up the top manufacturing slot to China around 2012, and even now the U.S. manufactures almost as much as
does China. The third and fourth largest manufacturing nations are far behind these two powerhouses. The prob-lem facing the United States, and the rest of the world, is not that we do not produce things anymore, but that we use far less labor in doing so than we used to. The job losses have not been limited to the United States. Em-ployment has suffered in virtually every nation, and today the amount of surplus labor is one of the major brakes to real economic recovery around the world. This will worsen, both for the United States and the world. The job losses over the past several decades re-flected improved productivity due to computer-assisted manufacturing, better manufacturing equipment, and other factors. The next wave of innovation, already un-derway, is computerized manufacturing. Instead of guid-ing or assisting manufacturing processes, computers will replace the actual workers, from the poor people making clothes in southeast Asia to workers making more com-plex things ranging from automatic rifles to personal electronic devices. As a result of this, unemployment rates around the world are not likely to improve in the long-run, but instead to grow even more problematically worse. Adding insult to injury, computers also are in-creasingly displacing service workers, even at fast food restaurants. Golden consequences The consequences of all of this for gold and gold inves-tors are clear. While the current muddle through eco-nomic environment of low growth, low inflation, and high unemployment is becoming an acceptable norm for many investors, consumers, and companies, and could remain so for a couple of years. However, the inexorable march toward points where all of these problems demand resolution in a pressing fashion will continue. At some point the multi-generational binge borrowing and spend-ing will have to be dealt with, and there is a great likeli-hood that strong, willful political leadership will not be there to guide the transition. In this environment gold continues to make tremendous sense as a form of savings, a safe haven against all sorts of political, economic, and financial chaos, an alternative currency, a hedge against inflation and deflation, and as a commodity. In short, investors are likely to keep buying historically large volumes of gold for all the good reasons that have existed throughout history for holding some portion of your wealth in gold. Shorter term investors may see gold buying opportunities in 2014 as gold prices stop falling and stabilize, while
10
12
14
16
18
20
50
70
90
110
130
150
87 89 91 93 95 97 99 01 03 05 07 09 11 13
U.S. Manufacturing Output and EmploymentQuarterly, Through July 2013
Source: Bureau of Labor Statistics
Index (2009 = 100) Million Persons
Mfg. Employment
Mfg. Output (LHS)

Page 4 2014 Gold Market Outlook
broader financial markets struggle to maintain balance. Longer term investors will continue to see gold as a must-have asset in their portfolio and as insurance against fi-nancial calamity. Both sets of investors may see the lower prices in early 2014 as a blessing given to them by investors who liquidated their holdings in 2013 based on short-term price trends. Prices: A cyclical peak in a secular bull market Around 2010 CPM Group began warning that gold prices could reach a cyclical peak in a secular or longer term bull market. We warned at that time that such a short-term peak could occur around 2011, and it appears to have happened. We said at that time, and all of our re-search since then has re-affirmed that this appears to be the case, that after such a cyclical peak prices could fall and consolidate for a couple of years, but that in the longer run gold prices should be expected to resume their ascent around 2015 – 2016, and probably move to record highs within a decade. Specifically, our view had been that gold prices could drop to around $1,300 – $1,400 on an annual average basis in 2013 – 2015, before rising. Gold prices averaged $1,424 in 2013. Our expectation was that the intraday low would be made sometime in 2013 or the first three quarters of 2014. We would not be surprised to see the intraday low of $1,179.40 reached on 28 June 2013 as the low, although it is possible that prices could drop below that level briefly in early 2014. Longer term, the secular bull market seems likely to us to continue for the reasons we just discussed: All of the eco-nomic problems that brought about the economic calami-
ties from 2001 through 2009 are still in place and have yet to be addressed by government leaders. Some of the regulatory reforms put in place since 2009 actually exac-erbate the situation, and have put financial markets in even worse shape than was the case in 2008 to weather future crisis. The world may be more vulnerable to future financial and economic shocks than it was in 2008. While many investors are aware of this and continue to buy gold, some have been lured away, at least temporarily, by the sirens’ songs of higher stock prices. That will change, and may change quite abruptly. If we had to put a date on it, we would expect a major downward correction in U.S. equity markets in September and October 2014. We want to note that some market commentators now are writing about the potential of much lower gold prices, perhaps to $1,000 or lower. We only would say that many of these projections are coming from banks and others that were talking about $2,000, $2,400, and higher gold prices in early 2012, four months after the peak in gold prices and at the same time CPM Group was pro-jecting the start of a multi-year decline to around $1,400. When prices are rising, these banks are bullish; when prices are falling, they turn bearish. They seem to come up with their price projections by extending a line over recent price trends, as opposed to basing their future price expectations on a detailed analysis of gold’s fundamental trends and the economic factors that determine the all-important gold fundamental: investment demand. Investment demand Investors always have been the key factor behind rising and falling gold prices, at least in modern times. If eco-
-10
0
10
20
30
40
50
60
-30
-10
10
30
50
70
90
110
66 69 72 75 78 81 84 87 90 93 96 99 02 05 08 11 14p
Percent Million Ounces
Investment Demand's Effect on Gold Prices Price Change Through 6 January 2014
NetInvestment Demand (Left Scale)
Percent Change in Price
0
2
4
6
8
10
12
0
2
4
6
8
10
12
73 76 79 82 85 88 91 94 97 00 03 06 09 12
Million Ounces
Gold Coin Demand
Million OuncesAnnual , Through 2014
Investment Demand: Remains At Historically High Levels
Page 5 2014 Gold Market Outlook
nomic and political developments are uncertain or hos-tile, investors buy more gold. If things look rosy, they buy less gold. Some investors buy gold based on its mar-ket fundamentals, but the vast majority of investment demand is determined by developments in the broader society, economy, and polity. Investment demand thus influences gold prices. Mine production, secondary recovery from scrap, and demand from jewelers and other fabricators in turn are influenced by prices. Certainly there is some reverse flow involved; those other fundamentals have some influence on gold prices, and prices in turn influence investment demand, but the major economic dynamics here are that investors set the direction and pace for gold prices, and the other market fundamentals follow. Another important characteristic to be aware of is that it is investor attitudes and perceptions that matter the most, as opposed to the actual economic realities. The economy could be humming along, but if investors are focusing on the likelihood that the music will end soon, they will buy gold. Similarly, the economy could be treading water, but if investors believe that economic conditions are good and improving, they may neglect gold and buy stocks. This is exactly what has been happening in 2013: Inves-tors have become desensitized to low growth, low re-turns, low interest rates and high unemployment. They are accepting the current stagnant economic environment, with major problems still looming over the world econ-omy, as a recovery. Based on these perceptions, they have been pouring money into the stock market. The stock market has been rising partly because corporations
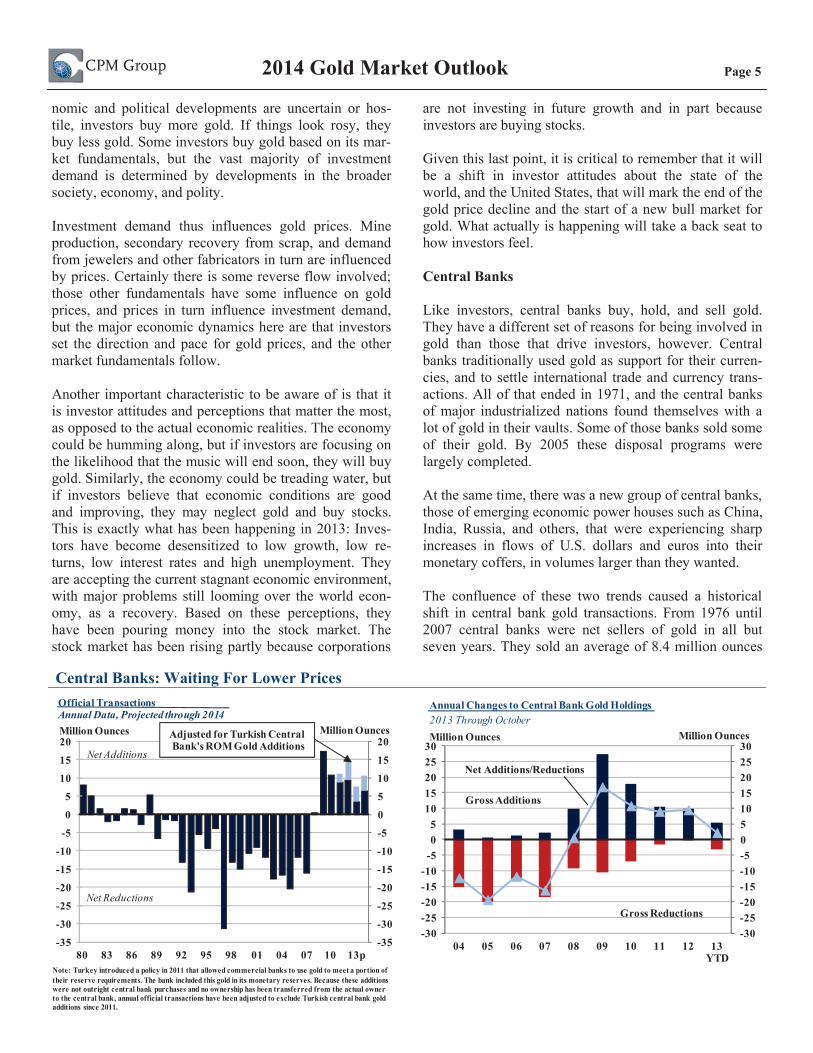
are not investing in future growth and in part because investors are buying stocks. Given this last point, it is critical to remember that it will be a shift in investor attitudes about the state of the world, and the United States, that will mark the end of the gold price decline and the start of a new bull market for gold. What actually is happening will take a back seat to how investors feel. Central Banks Like investors, central banks buy, hold, and sell gold. They have a different set of reasons for being involved in gold than those that drive investors, however. Central banks traditionally used gold as support for their curren-cies, and to settle international trade and currency trans-actions. All of that ended in 1971, and the central banks of major industrialized nations found themselves with a lot of gold in their vaults. Some of those banks sold some of their gold. By 2005 these disposal programs were largely completed. At the same time, there was a new group of central banks, those of emerging economic power houses such as China, India, Russia, and others, that were experiencing sharp increases in flows of U.S. dollars and euros into their monetary coffers, in volumes larger than they wanted. The confluence of these two trends caused a historical shift in central bank gold transactions. From 1976 until 2007 central banks were net sellers of gold in all but seven years. They sold an average of 8.4 million ounces
-35
-30
-25
-20
-15
-10
-5
0
5
10
15
20
-35
-30
-25
-20
-15
-10
-5
0
5
10
15
20
80 83 86 89 92 95 98 01 04 07 10 13p
Million Ounces Million Ounces
Net Additions
Net Reductions
Official TransactionsAnnual Data, Projected through 2014
Adjusted for Turkish Central Bank's ROM Gold Additions
-30-25-20-15-10-5051015202530
-30-25-20-15-10
-505
1015202530
04 05 06 07 08 09 10 11 12 13 YTD
Million Ounces Million Ounces
Gross Additions
Gross Reductions
Net Additions/Reductions
Annual Changes to Central Bank Gold Holdings2013 Through October
Central Banks: Waiting For Lower Prices
Note: Turkey introduced a policy in 2011 that allowed commercial banks to use gold to meet a portion of their reserve requirements. The bank included this gold in its monetary reserves. Because these additions were not outright central bank purchases and no ownership has been transferred from the actual owner to the central bank, annual official transactions have been adjusted to exclude Turkish central bank gold additions since 2011.

Total Gold Supply Near Record High Levels
0
20
40
60
80
100
120
140
0
20
40
60
80
100
120
140
73 76 79 82 85 88 91 94 97 00 03 06 09 12
Secondary Supply
Transitional Economies Exports to Market EconomiesMarket Economy Mine Production
Total Gold Supply
Mln Oz Mln OzAnnual, Projected Through 2014
-
200
400
600
800
1,000
1,200
1,400
1,600
1,800
0
200
400
600
800
1,000
1,200
1,400
1,600
1,800
02 03 04 05 06 07 08 09 10 11 12 13
The Price of Gold and Cash Operating Costs of ProductionQuarterly, Through Second Quarter 2013
$/Ounce
Cash Cost
Production Cost
Gold Price
$/Ounce
Gold Mining Remains Profitable
Page 6 2014 Gold Market Outlook
per year during this time. From 1989 through 2007 they sold an average of 12.5 million ounces per year, selling as much as 31.2 million ounces in 1997 and as much as 20.4 million ounces as recently as 2005. In 2008 central banks emerged as net buyers of gold once more, and have been consistent net buyers ever since. Several factors figured into the shift. First, those industri-alized nation central banks that had wanted to sell some of their gold had sold almost all of what they had wanted to sell by 2006. Second, emerging market central banks were increasingly concerned about the preponderance of dollars and euros in their holdings. These two currencies, issued by the central banks causing the most financial distress, constituted 85% - 90% of central banks’ total monetary reserves. They began diversifying their cur-rency holdings, and some began buying gold. Central banks added between 9.2 and 16.8 million ounces per year to their net gold holdings between 2009 and 2012. This constituted a very small shift in total central bank monetary reserves, but an enormous amount of gold compared to annual supply and demand for the metal. Central banks continued to add around a million ounces per month to their gold holdings into April 2013. In line with private investors, when prices fell in late April and May central banks increased their gold purchases, seeing the initial drop as a buying opportunity. As prices contin-ued to decline in June, both private investors and central banks pulled back from buying, waiting to see how low gold prices would drop before resuming any significant sales. Some sold in July and August. By September and October central banks were slightly positive buyers once more.
It appears to CPM Group that those central banks that have been significant buyers of gold over the past five years continue to be interested in buying gold, but they are being more price sensitive. We expect them to only have bought around 3.5 million ounces in 2013, when the final figures are calculated. We Project central banks to buy around 6.5 million or more in 2014, as they come to expect gold prices to rise once more, stepping up their purchases back to 9 – 10 million ounces per year. These central banks remain interested in adding gold to their monetary reserves; they are just being value investors. Supply: Mine Production and Secondary Supply Mine production actually is rising globally right now, in a surprise to many gold market observers. The simple view has been that lower gold prices must be causing produc-ers to reduce their output. That is true for a few mining companies, but most producers are responding to lower prices by focusing their mining activities on higher grade ores. As a result, they can produce more ounces of gold per metric tonne of ore mined, and lower their average per-ounce cost of production. Gold mine output rose about 2.2 million ounces last year, or 2.8%, and is likely to rise around 4.8% in 2014, or another 4.0 million ounces. There is a lot more to the rise in gold production than merely high grading, however. Several new mines have come into production last year and will come into pro-duction this year with radically lower costs, boosting pro-duction while making the mining companies more profit-able. Mine production continues to expand in China, the

0
20
40
60
80
100
120
0
20
40
60
80
100
120
77 80 83 86 89 92 95 98 01 04 07 10 13p
Other Uses
Dental/ Medical
Electronics
Developed Country-JewelryDeveloping Country-Jewelry
Gold Fabrication Demand
Million Ounces Million OuncesAnnual, Projected Through 2014
Gold Fabrication Demand Bounces Back
Page 7 2014 Gold Market Outlook largest gold mining country now. As a result, mine pro-duction may continue to rise for the next few years. Even as production continues to grow, the lower price of gold and difficulties mining companies are experiencing in securing development financing are reducing projected future increases in production. As one measure of this, in January 2013 there were around 22.8 million ounces of new gold mining capacity slated to come onstream be-tween 2013 and 2016. By September that projection had been cut nearly in half, to around 12 million ounces, as many projects were deferred, slowed down, or cancelled out right. While mine production has continued to grow, the recov-ery of gold from old jewelry and other scrap has plunged. Secondary recovery of gold from scrap had more than doubled from 20.0 million ounces in 2000 to 47.2 million ounces in 2012. The rise in gold prices brought a lot of old jewelry to scrap refiners. Economic stringencies had caused consumers to sell old gold jewelry, and environ-ment regulations increased the amount of gold being re-covered from old electronic gadgets. The drop in gold prices took its toll immediately on this business last year. Gold scrap recovery dropped from 47.2 million ounces in 2012 to around 39.3 million ounces last year. As a result, the total amount of newly refined gold enter-ing the market last year dropped around 5.4% to 123.6 million ounces, with the 2.2 million ounces in increased mine production more than offset by the 7.9 million ounce drop in secondary recovery. Scrap is projected to contract another 3.6 million ounces in 2014, while mine production may rise 4.0 million
ounces, so total supply may be slightly higher at 124.1 million ounces this year. Fabrication Demand The use of gold in jewelry, electronics, dental implants, medical devices, and other manufactured products totaled around 90.5 million ounces last year. That was up 10.5% from 82.1 million ounces in 2012, and the highest level since 2008. Gold use in jewelry and other fabricated products is highly price elastic. As prices rose, jewelers used less gold per piece of jewelry they made, in order to try to keep their products affordable to consumers. Con-sumers meanwhile pulled back on gold jewelry purchases as economic times were hard and they had less discre-tionary income to spend on luxury items. As prices fell last year, jewelers started using more gold per piece and consumers started buying more gold jew-elry. These trends are expected to continue in 2014. Gold fabrication demand is projected to rise 6.5% to around 96.3 million ounces as a result. Conclusion The course of gold prices depends on investor demand levels, and investors will decide whether to buy, hold, or sell gold based primarily on their perceptions of eco-nomic and political concerns. Our expectation is that in-vestors will enter 2014 somewhat optimistic about the economic outlook for the United States and the world, but exit the year less optimistic and more concerned about the state of the world. Investors may start the year by continuing to focus on the stock market, where easy money has been made. They may be optimistic about rising housing sales and prices and lower unemployment. As the year progresses, they may start to worry that the stock market’s strength is a sugar high, and when the sugar wears off stock prices may fall sharply. They also may start to realize that much of the strength in housing represents foreign buyers and hedge funds, and that the real U.S. economy is not nearly as healthy as they had thought at the start of 2014. In this environment, they may start increasing the volumes and pace of their gold purchases. Gold may remain weak for much of 2014, but may not fall far from the levels already seen since April 2013. Prices could trade between $1,180 and $1,340 in the first part of 2014, rising toward the high end of that range and possibly punching through to around $1,400 - $1,420 by the end of the year.

Page 8 2014 Gold Market Outlook
Million Ounces
Gold Statistical Position
*Million Ounces; Source: CPM Group; Notes: There may be discrepancies in totals and percent changes due to rounding; Net official sales are indicated by negative numbers; The price is the Comex nearby active settlement. Longer term projections are available in CPM Group's Gold Supply, Demand, and Price: 10-Year Projections report; e -- estimates; p -- projections; NM -- Not meaningful; January 6, 2014
Supply 2007 2008 2009 2010 2011 2012 2013e 2014p
Mine Production 70.9 69.3 74.8 77.7 79.0 79.9 82.1 86.1Secondary Supply 38.8 45.2 47.1 46.3 46.8 47.2 39.3 35.7Transitional Economy Sales 3.7 3.8 3.9 4.3 4.8 3.5 2.2 2.2Total Supply 113.3 118.3 125.8 128.3 130.7 130.6 123.6 124.1 % Change Year Ago 6.6% 4.4% 6.3% 2.0% 1.8% 0.0% -5.4% 0.4%
Fabrication Demand
Industrial Demand 14.1 14.1 12.4 13.0 12.9 13.0 13.2 13.5Jewelry Demand Developed Countries 14.9 12.4 9.4 8.7 8.3 7.9 7.8 7.9 Developing Countries 68.9 68.7 57.7 60.7 59.4 61.2 69.4 74.9Total Jewelry Demand 83.8 81.1 67.1 69.4 67.6 69.1 77.2 82.8Total Fabrication Demand 97.9 95.2 79.4 82.4 80.5 82.1 90.5 96.3 % Change Year Ago 3.1% -2.8% -16.6% 3.8% -2.3% 2.1% 10.1% 6.5%
Stock DemandTotal Official Transactions -16.2 0.6 16.8 10.8 9.2 9.5 3.5 6.5 % Change Year Ago 37.4% NM NM -36.1% -14.2% 3.1% -63.2% 85.7%
Net Private Investment Official Coins 4.4 5.6 6.8 6.3 7.0 5.3 4.6 4.1 Bullion 24.4 12.5 18.3 23.9 31.0 31.0 22.6 15.0 Medallions 2.8 4.5 4.5 5.0 3.0 2.7 2.4 2.2 Total 31.6 22.6 29.6 35.2 41.0 39.0 29.7 21.2 % Change Year Ago 36.8% -28.6% 31.1% 19.0% 16.3% -4.8% -23.9% -28.4%Total Stock Demand 15.4 23.1 46.4 46.0 50.2 48.5 33.2 27.7 % Change Year Ago 36.1% 50.3% 100.5% -0.9% 9.2% -3.4% -31.6% -16.3%Total Demand(Fabrication Plus Stock Change) 113.3 118.3 125.8 128.3 130.7 130.6 123.6 124.1Price Per Ounce High $842.70 $1,004.30 $1,218.30 $1,421.40 $1,889.70 $1,796.50 $1,693.20 Low 606.90 705.00 807.30 1,052.80 1,318.40 1,536.60 1,193.60 Average 700.11 872.82 974.70 1,228.63 1,572.00 1,670.15 1,409.43 % Change Year Ago 15.4% 24.7% 11.7% 26.1% 27.9% 6.2% -15.6%

CPM Group LLC
CPM Group is a fundamentally based commodities research shop. We develop our own proprietary estimates of gold, silver, platinum, and palladium supply and demand on a global basis, drawing on every resource we can find, including our own extensive list of contacts involved in precious metals around the world. We have been doing this sort of research and analysis since the 1970s, far longer than anyone else in the business. We also undertake research in specialty metals, base metals, energy and agricultural commodities. We are known for our basic fundamental research, a wide range of financially oriented consulting services, and our expertise in using financial derivatives to structure financing for produc-ers, refiners, industrial users, and investors interested in either hedging or investing in commodities.
Our investment philosophy is simple: We are value investors who base our decisions on what to buy, sell, hold, or avoid on the fundamentals of each asset, and the macro-economic, financial and political environmental factors that we expect will affect that asset’s value. We have concerns, expressed in this report and elsewhere, about long-term imbalances in government deficit spending, public and private debt, and a wide range of other economic and political factors. We don’t expect the world’s financial system to collapse, however. That is not the way the world tends to work. More likely eco-nomic outcomes in the real world lie between the extremes of cataclysmic collapses and nirvana. We advise our clients – and practice what we preach – to have some of their wealth in gold and silver as an insurance policy against a catastrophic failure, but we also advise them to invest other portions of their money in precious metals and other assets based on the assumption that that sort of failure does not occur. We focus on investing based on likely scenarios, but with an eye always open to outlying events that take the world’s markets by surprise. We have watched investors who were so worried about a collapse that they missed some of the largest stock and bond market rallies of all times over the past 30 years, while watching their safe haven assets fluctuate eight-fold in value up and down, and then up and down again. We prefer our clients to buy and sell precious metals and other assets based on cyclical and other developments, while also maintaining that long-term insurance policy in case the levee breaks.
CPM Group LLC30 Broad St.37th FloorNew York, NY 10004 USA

For more information on gold, and how specific gold, silver, palladium and platinum investments may be used to
protect yourself or profit from the events we foresee, please contact:
MONEX DEPOSIT COMPANY 4910 BIRCH STREET
NEWPORT BEACH, CA 92660(800) 949-4653(949) 752-1400