Embed Size (px)
Citation preview
i
COVERIS HOLDINGS S.A.TABLE OF CONTENTS
ANNUAL REPORT
PageSECTION I
Cautionary Note Regarding Forward-Looking StatementsRisk FactorsOur Business
SECTION IIManagement’s Discussion and Analysis of Financial Condition and Results of Operations
SECTION IIIIndex to Combined Consolidated Financial StatementsIndependent Auditor's ReportCombined Consolidated Balance SheetsCombined Consolidated Statements of OperationsCombined Consolidated Statements of Comprehensive Income (Loss)Combined Consolidated Statements of Shareholders' Equity (Deficiency)Combined Consolidated Statements of Cash FlowsNotes to the Combined Consolidated Financial Statements
11
15
38
F - 1F - 2F - 3F - 4F - 5F - 6F - 7F - 9
Table Of Contents
1
SECTION I(in thousands of U.S. dollars)
CAUTIONARY NOTE REGARDING FORWARD LOOKING STATEMENTS This annual report of Coveris Holdings S.A., (the "Company") for the fiscal year ended December 31, 2014 including “Management’s Discussion and Analysis of Financial Condition and Results of Operations,” contains forward-looking statements. These statements include, but are not limited to, any statement that may predict, forecast, indicate or imply future results, performance, achievements or events. These forward-looking statements address matters that involve risks and uncertainties as described in Section I of this report. You can often identify these and other forward-looking statements by the use of the words such as “may,” “will,” “could,” “would,” “should,” “expects,” “plans,” “anticipates,” “estimates,” “intends,” “potential,” “projected,” “continue,” or the negative of such terms, or other comparable terminology. Forward-looking statements also include the assumptions underlying or relating to any of the foregoing statements. These statements are based on current expectations and assumptions regarding future events and business performance and involve known and unknown risks, uncertainties and other factors that may cause industry trends or our actual results, level of activity, performance or achievements to be materially different from any future results, levels of activity, performance or achievements expressed or implied by these statements.
Although we believe that expectations reflected in the forward-looking statements are reasonable, we cannot guarantee future results, levels of activity, performance or achievements. We will assume no obligation to update any of the forward-looking statements after the date of this report to conform these statements to actual results or changes in our expectations, except as required by law. You should not place undue reliance on these forward-looking statements, which apply only as of the date of this report.
Except as otherwise indicated, references to "we," "our," "us," "the Group," and "the Company" refer to Coveris Holdings S.A. and our subsidiaries.
You should carefully consider the risks described below as well as the other information contained in this annual report before making an investment decision. Any of the following risks may have a material adverse effect on our business, results of operations, financial condition and cash flows, and as a result you may lose all or part of your original investment. The risks described below are not the only risks we face. Additional risks and uncertainties not currently known to us or that we currently deem to be immaterial may also have a material adverse effect on our business, results of operations, financial condition and cash flows.
RISK FACTORS
Our business operations and the implementation of our business strategy are subject to significant risks inherent in our business, including, without limitation, the risks and uncertainties described below. The occurrence of any one or more of the risks or uncertainties described below could have a material adverse effect on our combined consolidated balance sheet, statement of operations and cash flows and could cause actual results to differ materially from our historical results. While we believe we have identified and discussed below the key risk factors affecting our business, there may be additional risks and uncertainties that are not presently known or that are not currently believed to be significant that may adversely affect our business, operations, industry, financial position and financial performance in the future. Because of the following risks and uncertainties, as well as other variables affecting our operating results, past financial performance should not be considered a reliable indicator of future performance and historical trends may not be consistent with results or trends in future periods. Our combined consolidated financial statements and the notes thereto and the other information contained in this annual report should be read in connection with the risk factors discussed below.
We are exposed to changes in market conditions for our products and such conditions are dependent upon factors beyond our control.
Macroeconomic factors in the geographies in which we operate affect our results of operations. The market for plastic-based film and packaging products is generally mature in most of the geographies in which we operate, and consequently there is a close correlation between consumer consumption levels and demand for our products. The revenues we generate each period are affected by factors such as unemployment levels, consumer spending, credit availability and business and consumer confidence. Certain of our products are considered discretionary, and as a result consumers generally purchase less of these products during economic downturns. In addition, for both discretionary and non-discretionary products, as economic conditions slow, retailers often seek to manage inventory levels and slow their rate of product purchases as they try to sell product already in stock. Our customers also seek to reduce working capital during a slowdown, and consequently they seek to manage inventory levels, revise trade credit
Table Of Contents
2
terms and aggressively negotiate prices. As a result, an economic slowdown may adversely affect our financial position, results of operations and our ability to fund our operations.
Deterioration in economic conditions or disruptions in credit markets also pose a risk to our commercial relationships with our customers, suppliers and creditors. If economic conditions deteriorate significantly, or if our customers or raw material suppliers are not able to refinance their existing credit lines or otherwise are forced to cease doing business, our business would be materially adversely affected. The financial condition of some of our customers may expose us to credit risk. If our customers suffer financial difficulty, they may not be able to pay us, which could have a material adverse effect on our results of operations. In addition, if we are not able to secure sufficient funding required for our working capital and capital investment requirements in excess of borrowings available under our current financing arrangements due to a lack of availability of credit, we may not be able to pay our suppliers who may cease doing business with us, which could have a material adverse effect on our business, results of operations, financial condition and cash flows.
Furthermore, the economic outlook in Europe is adversely affected by continued weakness in various European economies in which we sell our products, the possibility of continued or increased weakness and the risk that one or more euro zone countries could come under increasing pressure to leave the European Monetary Union. Any of these developments, or the perception that any of these developments are likely to occur, could have a material adverse effect on the economic development of the affected countries and could lead to severe economic recession or depression, and a general anticipation that such risks will materialize in the future could jeopardize the stability of financial markets or the overall financial and monetary system. This, in turn, would have a material adverse effect on our business, results of operations, financial condition and cash flows.
Our operations may also be adversely affected by political events that are beyond our control. Trade restrictions, such as sanctions or embargos, in countries where we conduct business may limit or block our access to certain markets. Several rounds of international sanctions imposed on Russia have led Russia to respond by banning the importation of certain products from, among others, the United States and European Union based business. Since that policy has been in place, we have experienced a reduction in our shipments into Russia. We do not know if or when the Russian embargo will be lifted, nor do we know if we will see an increase in our business in Russia when it is lifted.
Our business may be negatively affected by increases in raw materials or energy prices that we are unable to pass on to our customers, our inability to retain or replace our key suppliers and supply chain disruptions.
Our margins are largely driven by the prices we charge for our products and the costs of the raw materials we require to make our products. Raw materials costs represent the single largest component of our operating costs. The raw materials we depend on in our production are primarily polymers, paper, films, inks, adhesives, additives and transit packaging materials. Many of the raw materials we use in our manufacturing processes are commodities, which are subject to significant price volatility. The price of polymers and the other raw materials that we use is a function of supply and demand, suppliers’ capacity utilization, industry and consumer sentiment and prices for crude oil, natural gas and other raw materials. The price for polymers fluctuates substantially as a result of changes in petroleum and natural gas prices, industry demand and the capacities of the companies that produce polymers to meet market needs. Prices for paper depend on the industry’s capacity utilization and the costs of raw materials. Polymer prices continued to be volatile during from 2012 into 2015. Price fluctuations, in particular with respect to polymers, may have a material adverse effect on our business, results of operations, financial condition and cash flows.
Our ability to pass on increases in the cost of raw materials to our customers is dependent on the pricing methodology agreed to with our customers. We seek to include price escalation clauses in our framework sales agreements that allow us to increase prices for our products if our raw material prices increase. A significant portion of our total net sales are made pursuant to framework contractual agreements and a significant portion of these framework sales agreements contained a price escalation clause. These price escalation clauses typically pass through our raw material price changes in our plastic and paper production in 30 to 90 days and 90 to 120 days, respectively. However, these clauses may not in all cases be effective to offset our increased costs. We also sell a substantial portion of our products under purchase orders, in which pricing is based on pricing sheets that we have previously sent to our customers. We may not be able to increase prices for these purchases if customers do not agree to a price escalation, in particular in our markets where competition is intense. If we chose to increase prices in such circumstances, we would risk volume loss. As a result, if our cost of raw materials increases, our margins may be negatively impacted. Increases in energy prices, particularly in the price of electricity, also increase our cost of sales, and energy costs.
As a result of operating large manufacturing facilities, the fuels necessary to power our facilities and operations constitute a significant portion of our cost of sales. We use large amounts of electricity, natural gas and oil in our production. Prices for these fuels have been volatile in recent years and have generally risen since 2005. However, during 2014 and 2015, oil prices decreased by more than 50% compared to 2013. While this decrease in oil prices might lead to a temporary reduction in fuel costs, any future
Table Of Contents
3
increase in energy prices may adversely affect our business to the extent that we are unable to pass these increased costs on to our customers.
The raw materials and energy that we use have historically been available in adequate supply from multiple sources. However, volatility in global economic conditions, fluctuations in oil prices and plastic resin demand, production constraints, temporary severe weather conditions and other factors could result in temporary shortages of raw materials. If any of our suppliers is subject to a major production disruption or is unable to meet its obligations under present supply agreements, we may be forced to pay higher prices to obtain the necessary raw materials and may not be able to increase the prices of our finished products. Therefore, interruptions in supply could increase pressure on our margins and reduce our cash flows or could harm our ability to deliver our products to our customers on a timely basis, which could adversely affect our business, financial condition and results of operations. In addition, consolidation could occur among our suppliers, and such consolidation could hinder our ability to obtain adequate supplies of raw materials, which could lead to higher prices for the type of plastic resins we use. Failure to obtain adequate supplies of raw materials or future price increases could have a material adverse effect on our business, results of operations, financial condition and cash flows.
Significant competition in our markets may adversely affect our competitive position, sales and overall operations.
The packaging industry is highly competitive. The markets for our products are mature in Europe and the Americas, and there are many competing manufacturers that produce similar and other types of packaging. Additionally, we compete, to a certain extent, with our customers if they have in-house packaging-making capabilities.
Some of our competitors have extensive production facilities, well developed sales and marketing staffs and greater geographic reach or financial resources than we have. For example, some of our key competitors include Amcor, Mondi Group, Bemis Company, Inc., Berry Plastics Corporation, Sealed Air, Inc. and Sonoco Products Co., each of which has substantial financial, marketing and other resources and established brand names. Our competitors could use their significant resources to increase their marketing, develop new products or reduce their prices in a manner that adversely impacts our ability to sell our products at prices that generate the same margins we have earned in the past, or at all. Certain products are also available from a number of local manufacturers specializing in the production of a limited group of products. These local manufacturers may have existing relationships with local customers and may be more familiar with local preferences than we are. It may be possible for our current or future competitors to develop new product manufacturing technology or processes that may allow them to offer packaging products at a cost or quality that has a significant advantage over our products, and we may not have sufficient resources or capital to match such innovation. If competition in our high margin businesses increases, our overall margins could be substantially reduced. We cannot assure you that we will continue to be able to compete successfully against existing or future competitors.
While the principal drivers for competition for our products include quality, product performance and characteristics and service, price is also an important aspect of our ability to compete. We currently manufacture our products in 17 countries, including the United Kingdom, the United States, France, Germany, Hungary, Canada, Finland, Netherlands, Poland, Austria, Bulgaria, Egypt, Romania, Serbia, Turkey, China and Ukraine. We may face competition from producers who manufacture a higher percentage of their products in countries with significantly lower labor costs than we do. If one or more of our competitors with manufacturing facilities in such lower cost countries offers products of sufficient quality in our markets at lower prices, we may be forced to lower our prices to maintain our competitiveness, or we may be unable to continue to sell our products. In either case, our sales and our gross profit could decline and such decline could have a material adverse effect on our business, results of operations, financial condition and cash flows.
The profitability of plastic packaging companies is heavily influenced by the supply of, and demand for, plastic packaging. The plastic packaging market has historically been characterized by steady growth of manufacturing capacity and demand. If plastic packaging capacity increases and there is no corresponding increase in demand, the prices we receive for our products could materially decline, which could have a material adverse effect on our business, results of operations, financial condition and cash flows.
We may be unable to continue to integrate the various Group businesses effectively and realize the expected synergies and cost savings from the Combination.
On May 31, 2013, Sun Capital Partners V, LLC, an affiliate of Sun Capital Partners Inc. ("Sun Capital") completed a combination (the "Combination") of five of their flexible and rigid packaging portfolio businesses in North America and Europe, including Exopack Holding Corp ("Exopack"), Eifel Management S.a.r.l. & Partners S.C.A. ("Kobusch"), Copper Management S.a.r.l. & Partners S.C.A. ("Britton"), Portugal Management S.a.r.l. ("Paragon") and Island Lux S.a.r.l. & Partners S.C.A. ("Paccor"), collectively, Coveris Holdings, S.A., a Luxembourg company (société anonyme). Since the Combination, we have added five
Table Of Contents
4
acquisitions, InteliCoat, Closures, KubeTech, St. Neots and Learoyd. The Group has only operated and been managed as a single business since the Combination, and we cannot assure you that we will be able to continue to integrate the various Group businesses effectively or that our senior management will be able to continue to effectively implement our integration and growth strategies. While we have been able to realize significant synergies and cost savings in procurement, manufacturing, technology and sales since the date of the Combination, we will continue to seek to realize the synergies in procurement and manufacturing through the cost savings programs discussed in "Management's Discussion and Analysis." Should we be unable to continue to integrate the Group in accordance with our business plan, we may not be able to realize further benefits from the Combination, which could adversely affect our business. Additionally, in order to realize these additional cost synergies and cost savings, we expect to make significant amounts of cash outlays, which may be higher than our estimated amount.
Furthermore, our anticipated synergies are based on a number of assumptions, such as our ability to leverage our increased volume into improved pricing for raw materials; our ability to successfully implement capital projects in a timely and cost-efficient manner; our ability to share best manufacturing practices across our network; and our ability to manufacture some of our manufacturing inputs in a cost effective manner that were previously purchased from outside suppliers. If one or more of our underlying assumptions regarding our anticipated synergies prove to have been incorrect, we may not be able to realize fully, or realize in the anticipated timeframe, the expected synergies. Furthermore, pricing pressure from our customers or competitors or other variables may deprive us of some of the benefits from the cost measures that, in the calculation of Pro Forma Adjusted EBITDA (earnings before interest, tax, depreciation and amortization expense), we have assumed that we will be able to retain. Also, cost efficiencies from improved production processes may not be able to be sustained due to changes in customer needs, environmental law, availability of raw materials, energy costs or other cost variables. Our new business initiatives could result in unintended consequences, such as the loss of key customers and suppliers.
Our inability to realize the anticipated cost savings, synergies and revenue enhancements from the Combination could have a material adverse effect on our business, results of operations, financial condition and cash flows.
The prior year financial information included in this annual report may not be representative of our operations as a combined company or otherwise comparable to our current operating results.
Prior to May 31, 2013, the Group did not operate as a single business and had not been previously managed on a combined basis. As a result, the historical financial statements for each of the businesses in the Group may not reflect what our results of operations, financial position and cash flows would have been had all the businesses operated on a combined basis during such periods, and may not be indicative of what our results of operations, financial position and cash flows will be in the future. Furthermore, we have included certain pro forma financial information for the years ended December 31, 2014 and 2013, in this annual report that gives effect to the Combination. This pro forma financial information may not be indicative of actual results that would have been achieved had the transactions described herein been consummated on the date or for the periods indicated and will not reflect our combined consolidated results or result of operations as of any future date or any future period.
The pro forma financial information included in this annual report has not been audited. This pro forma data should therefore not be relied on to reflect what our results of operations and financial condition would have looked like had the Combination already occurred.
We are exposed to the risk of product substitution.
We derive the majority of our total net sales from sales of flexible and rigid plastic packaging products. Plastic packaging products compete with other forms of packaging, principally paper and metal packaging. Customer preference for a particular type of packaging can be driven by cost, appearance, functional considerations or other factors. In addition, consumer preference can be affected by environmental considerations, including whether packaging can be recycled or re-used. Although consumer demand has led to increasing substitution of plastic packaging for other forms of packaging over the last several years, there can be no assurance that demand for plastic packaging will continue to increase.
Our sales may also be impacted by variations in customer preference driven by the cost of associated packaging products. Difficult economic conditions may result in consumers’ preference for less expensive and less elaborate forms of packaging. We cannot assure you that our products will continue to be preferred by our customers or our customers’ end-consumers and that consumer preference will not shift from plastic-based packaging to non-plastic packaging. A material shift in consumer preference from our packaging types could result in a decline in sales volume or pricing pressure that would have a material adverse effect on our business, results of operations, financial condition and cash flows.
Table Of Contents
5
We may be adversely affected by the loss of key customers for our products, and our customer concentration could increase due to industry consolidation.
Our commercial relations with most of our customers are conducted through short term framework agreements or purchase orders. These arrangements generally provide for guaranteed minimum orders and there can be no assurance that we would continue to be able to sell our products to our customers or sell on terms as favorable as in the past, or at all. We cannot assure you that we will be able to maintain our existing relationships with our customers.
There is also the risk that our customers may shift their production operations to locations in which we do not currently have a presence. The loss of one or more of these customers, a significant reduction in sales to these customers or a significant change in the commercial terms of our relationship with these customers could have a material adverse effect on our business, results of operations, financial condition and cash flows.
Additionally our customers may decide to in-source the production of their packaging which we currently supply, or otherwise elect not to do business with us. Loss of key contracts could have a material impact on our business, results of operations, financial condition and cash flows.
Customer consolidation has increased the concentration of our revenues with our largest customers. In many cases, such consolidation may be accompanied by increased customer bargaining power and pressure from customers for price reduction. In addition, this consolidation may lead manufacturers to rely on a reduced number of suppliers. If, following the consolidation of one of our customers with another company, a competitor was to be the main supplier to the combined consolidated companies, this could have a material adverse effect on our business, financial condition or results of operations. Increased pricing pressures from our customers that may result from such a consolidation may also have a material adverse effect on our business, results of operations, financial condition and cash flows.
We may fail to keep up with product innovation.
Our business is subject to frequent and sometimes significant changes in technology and if we do not keep up with these changes, our sales and profits may decline. Product development and engineering requires significant investment. Some of our competitors may have greater access to financial resources than we do and may increase their competitiveness by investing more in research and development activities and making strategic capital expenditures with respect to key products. Additionally, some of our competitors may be more capable of accessing synergies in product and technology development and market activities.
We cannot assure you that our product development and engineering efforts and capital expenditures will continue to deliver competitive products that will translate into sales to customers or that we will consistently be able to renew our production lines as our customers stop using those products. We may not be able to replace outdated technologies, replace them as quickly as our competitors or develop and market new and better products in the future. We may enter new markets, which may not have the economics or customer acceptance of new technology that we had anticipated. If we fail to keep pace with the evolving technological innovations in our markets or we fail to maintain our key competencies, we may experience a material adverse effect on our business, results of operations, financial condition and cash flows.
We may not be able to meet the demands of our customers.
Some of our customers’ products can experience higher demand as part of their launch or as a result of promotions and advertising campaigns. Although our production capacity is usually not constrained, in some cases it can be constrained by line capacity, particularly for bespoke products or products that incorporate new technologies. We may be unable to deliver production at the level required by our customers during periods of strong sales to end-customers, which may lead us to lose potential revenues or face claims from customers. To service supply shortfall, our customers may turn to our competitors, which could lead to our relationship with such customers being jeopardized and a reduction in or termination of our business with such customers.
Any interruption in the operations of our manufacturing facilities may adversely affect our business.
Due to the operating conditions inherent in some of our manufacturing processes, we cannot assure that we will not incur unplanned business interruptions or that such interruptions will not have an adverse impact on our business, financial condition and results of operations. There can be no assurance that alternative production capacity will be available in the future in the event of a major disruption or, if it is available, that it could be obtained on favorable terms. To the extent that we experience any breakdown of key manufacturing equipment or similar manufacturing problems, we will be required to make capital expenditures that may make it difficult for us to meet customer demand, which would result in a loss of revenues, and could impair our liquidity. In addition,
Table Of Contents
6
the rationalization of our manufacturing base in an effort to realize cost synergies exacerbates this risk because our manufacturing activities become more concentrated and plant disruptions impact larger production operations.
Our manufacturing operations are subject to risks relating to plastics conversion and printing operations and the related use, storage, transportation and disposal of polymers, inks and lacquers, products and wastes, including but not limited to:
• pipeline leaks and ruptures;• fires and explosions;• accidents;• severe weather and natural disasters (such as hurricanes);• mechanical failures;• unscheduled downtimes;• labor disputes;• transportation interruptions;• other environmental risks; and• sabotage or terrorist attacks.
These risks can cause personal injury and loss of life, catastrophic damage to, or destruction of, property and equipment and environmental damage, and may result in a suspension of operations, litigation exposures, loss of market share and the imposition of civil or criminal penalties. Unplanned outages can impact our operating results, even if such outages are covered by insurance.
We mainly use electrical power and natural gas to manufacture our products. These energy sources are essential to our operations and we rely on their continuous supply to conduct our business. Frequent or prolonged power interruptions may have a material adverse effect on our operations.
Because we rely on external transportation and warehousing providers to deliver our products, any disruption in their services could adversely affect our business.
The success of our business depends, in large part, upon the maintenance of a strong distribution network. We rely on independent transportation and warehousing companies to store and deliver our products to our customers. Strikes, slowdowns, transportation disruptions, such as severe weather, and other conditions in the transportation industry, such as increases in fuel prices, could increase our costs and disrupt our operations. If any subcontractor fails to properly store or timely deliver our products to our customers, the results of our operations could be adversely affected. There can be no guarantee that we will maintain relationships with our current independent transportation and warehousing providers. A delay in distribution could, among other things, have an adverse impact on our reputation, result in return of an amount of our products that could not be shipped in a timely manner or require us to contract with alternative, and possibly more expensive, distributors. In addition, our current distributors have storage facilities located near our manufacturing plants, which provide us with convenient facilities in which to store our products and which reduce our costs of transportation. If we were required to change distributors, it would be disruptive to our business, which could have a material adverse effect on our business, results of operations, financial condition and cash flows.
Our business requires high levels of capital investments.
Our business requires high levels of capital investments, including maintenance and growth expenditures. We invested $116,497 and $124,061 toward capital expenditures during the years ended December 31, 2014 and December 31, 2013, respectively. We will continue to require capital expenditures to improve efficiencies in our manufacturing base by potentially consolidating and relocating facilities, investing in programs and technology to consolidate our procurement, sales and marketing and back office functions. We may not be able to make such capital expenditures if we do not generate sufficient cash flow from operations, have funds available for future borrowings under our existing credit facilities, are restricted from incurring additional debt or as a result of a combination of these factors. In particular, due to global economic conditions, the availability of funds from debt capital markets may diminish significantly. If we are unable to meet our capital expenditure plans, we may not be able to maintain our manufacturing capacity, which may negatively impact our competitive position and ultimately, our revenues and profitability. In addition, we are required to make injection molds or new toolings when we make new products for our customers. We use these molds and toolings throughout the life span of these products and generally make new molds as these products cease to be produced and new products take their place. This involves a significant amount of capital expenditures on our part. Any failure to meet our capital expenditure plans may have a material adverse effect on our business, results of operations, financial condition and cash flows.
We are subject to risks from legal and arbitration proceedings, which could adversely affect our financial results and condition.
Table Of Contents
7
From time to time we are involved in labor, tax, commercial and other legal and arbitration proceedings, the outcomes of which are difficult to predict. We could become involved in legal and arbitration disputes in the future which may involve substantial claims for damages or other payments. Although individually these proceedings do not typically involve substantial amounts, in the aggregate such proceedings or any increase in the number of such proceedings may have a material adverse effect on our business, results of operations and financial condition.
In the event of a negative outcome of any material legal or arbitration proceeding, whether based on a judgment or a settlement agreement, we could be obligated to make substantial payments, which could have a material adverse effect on our business, financial condition and results of operations. In addition, the costs related to litigation and arbitration proceedings may be significant. Even if there is a positive outcome in such proceedings, we may still have to bear part or all of our advisory and other costs to the extent they are not reimbursable by other litigants, insurance or otherwise, which could have a material adverse effect on our business, results of operations and financial condition.
Failure to maintain good employee relations may affect our operations and the success of our business.
As of December 31, 2014, we had 9,825 employees located in 17 countries. As we are continuously restructuring our workforce to achieve productivity gains, maintaining good relationships with our employees, unions and other employee representatives is crucial to our ability to successfully implement such restructurings. As a result, any deterioration of the relationships with our employees, unions and other employee representatives could have an adverse effect on our business, results of operations and financial condition.
The majority of our employees are covered by national collective bargaining agreements and company-level agreements specific to our Company. These agreements typically complement applicable statutory provisions in respect of, among other things, the general working conditions of our employees such as working time, holidays, termination, retirement, welfare and incentives. National collective bargaining agreements and Company-specific agreements also contain provisions that could affect our ability to restructure our operations and facilities, terminate employees or outsource certain services.
We may not be able to extend existing Company-specific agreements, renew them on their current terms, or, upon the expiration of such agreements, negotiate such agreements in a favorable and timely manner or without work stoppages, strikes or similar industrial actions. We may also become subject to additional Company-specific agreements or amendments to the existing national collective bargaining agreements. Such additional Company-specific agreements or amendments may increase our operating costs and have an adverse effect on our business, results of operations and financial condition.
In addition, we are required to consult and seek the advice of our employee works councils with respect to a broad range of matters, which could prevent or delay the completion of certain corporate transactions.
Consultations with works councils, strikes, similar industrial actions or other disturbances by our workforce, particularly where there are union delegates, could disrupt our operations, result in a loss of reputation, increased wages and benefits or otherwise have a material adverse effect on our business, results of operations and financial condition.
We are exposed to risks related to conducting operations in several different countries.
We currently have manufacturing facilities located in 17 countries, including the United Kingdom, the United States, France, Germany, Hungary, Canada, Finland, Netherlands, Poland, Austria, Bulgaria, Egypt, Romania, Serbia, Turkey, China and Ukraine. As a result, our business is subject to risks related to the differing legal, political, social and regulatory requirements and economic conditions of many jurisdictions. Risks inherent in international operations include the following:
• general economic, social or political conditions in the countries in which we operate could have an adverse effect on our earnings from operations in those countries;
• compliance with a variety of laws and regulations in various jurisdictions may be burdensome;• unexpected or adverse changes in laws or regulatory requirements in various jurisdictions may occur, including in
particular the introduction of more stringent regulations relating to packaging that comes into contact with food;• the imposition of withholding taxes or other taxes or royalties on our income, or the adoption of other restrictions on
foreign trade or investment, including currency exchange controls;• adverse changes in export duties, quotas and tariffs and difficulties in obtaining export licenses;• intellectual property rights may be more difficult to enforce;• transportation and other shipping costs may increase;
Table Of Contents
8
• staffing difficulties, national or regional labor strikes or other labor disputes;• the imposition of any price controls or nationalization programs; and• difficulty enforcing agreements and collecting receivables.
Our international sales are also subject to various sanction, export control and anti-corruption laws and regulations and we may be subject to significant penalties for violating such laws. We can also be in violation of such laws for the actions of our affiliates, employees and agents. In recent years there has been an increase in both the frequency and severity of enforcement under such laws. While we have adopted policies and controls since the Combination to help mitigate such risks, and we are currently reviewing and updating these policies and controls and are in the process of implementing a compliance program with our subsidiaries, employees and agents to further mitigate the risk of non-compliance, there can be no assurance that such controls have been or will be effective in ensuring that we, our employees and our agents have complied or will comply with such laws. The size and extent of our operations, and the size of our group structure, increase the risks that violations, such as sales to customers in sanctioned jurisdictions, would not adequately identified with our controls. If an enforcement action were to be brought against us for a violation of these laws, we could be exposed to civil and criminal prosecution or penalties, the imposition of export or economic sanctions against us and reputational damage.
Any of these factors could require us to change our current operational structure and could have a material adverse effect on our business, results of operations, financial condition and cash flows.
We are exposed to currency fluctuation risks in several different countries that could adversely affect our profitability.
We currently operate our facilities in 17 different countries. As a result, our business is subject to currency fluctuation risks. Our results of operations may be affected by both the transaction effects and the translation effects of foreign currency exchange rate fluctuations. When we are required to pay our debt, purchase raw materials, meet our fixed costs or pay for services, in currencies outside of our respective operations' jurisdictions, we are exposed to unrealized and realized gains and losses due to foreign exchange, depending on fluctuations in exchange rates. A high percentage of our production facilities are currently located in the euro zone and the United Kingdom. As a result, a large proportion of our manufacturing costs and our selling, general and administrative expenses are incurred in currencies other than the U.S. dollar, reflecting the location of our production sites. Where we are unable to match sales received in foreign currencies with costs paid in the same currency, our results of operations are consequently impacted by currency exchange rate fluctuations. In addition, our business may be negatively affected if foreign currency movements provide non-local suppliers with competitive pricing advantages.
We are also exposed to foreign exchange risk through the translation of the financial statements from our functional currencies to the U.S. dollar. Our income and expenses are reported in the relevant local currency and translated into U.S. dollars at the applicable currency exchange rate for inclusion in our combined consolidated financial statements. Therefore, our financial results in any given period are materially affected by fluctuations in the value of the U.S. dollar relative to the other currencies in which we have costs and expenses. These translations could significantly affect the comparability of our results between financial periods and/or result in significant changes to the carrying value of our assets, liabilities and stockholders’ equity.
During the latter half of 2014, the U.S. dollar strengthened considerably against several other currencies of countries where we conduct business. The U.S. dollar's relative strength against the currencies in other countries in which we conduct business means that, among other things, our foreign sales and EBITDA, which are reported to our investors in U.S. dollars, will be lower than if the U.S. dollar were weaker relative to those currencies. The Group employs various hedging strategies to offset the impact of foreign currency fluctuations on our cash and flows and/or earnings. Hedging involves speculation and significant judgment. Hedging activities, if not applied appropriately, can have a material adverse effect on our business, results of operations, financial condition and cash flows.
Current and future environmental and other workplace, health and safety requirements could adversely affect our financial condition and our ability to conduct our business.
Our operations, properties and products are subject to international, EU, U.S. federal and state national and local environmental laws and regulations that impose limitations on the discharge of pollutants into the air, soil and water, establish standards for the treatment, storage and disposal of solid and hazardous wastes, and require investigation and clean-up of contaminated sites, and establish environmental standards for our products and raw materials inputs to our product processes, as well as determine the guidelines for workplace health and safety. Certain environmental laws in the jurisdictions in which we operate, including the Comprehensive Environmental Response, Compensation, and Liability Act, or CERCLA, in the United States, impose joint and several liability for cleanup costs, without regard to fault, on current and former owners and operators of property that has been
Table Of Contents
9
impacted by a release of hazardous substance or on persons who have disposed of, arranged for the disposal of or released hazardous substances into the environment.
We cannot predict with any certainty our future capital expenditure requirements necessary to comply with applicable environmental laws and regulations due to changing environmental technologies and continually changing compliance standards which have tended to become increasingly strict. From time to time, we could be subject to requests for information, notices of violation or investigations initiated by environmental regulatory agencies relating to our operations and properties. Furthermore, violations or contaminated sites we do not know about (including contamination caused by prior owners and operators of such sites or newly discovered information) could result in additional compliance or remediation costs or other liabilities, which could be material. We may also assume significant environmental liabilities in future acquisitions. In addition, EU, U.S. federal and state, national and local governments could enact laws or regulations concerning environmental matters that increase the cost of production, or otherwise adversely affect the demand, for plastic products.
Legislation that would prohibit, tax or restrict the sale or use of certain types of plastic and other containers, and would require diversion of solid wastes such as packaging materials from disposal in landfills, has been or may be introduced in the U.S. Congress, U.S. state legislatures, the European Union or certain member states thereof, and other legislative bodies. Container legislation has been adopted in a few jurisdictions and similar legislation has been defeated in public referenda in several states, local elections and many state and local legislative sessions. There can be no assurance that future legislation or regulation would not have a material adverse effect on our business, results of operations, financial condition and cash flows.
We are also subject to regulation that establishes specific requirements for the manufacture and marketing of plastic materials that are intended to or may come into contact with food. These regulations typically set out a list of authorized substances (some of which, due to specific restrictions, must be of specific purity and quality) that may be used in the manufacture of plastic materials.
Regulations also typically establish a limit on the transfer constituent elements from the plastic to food. We may be required to incur additional costs or change raw materials or production process to comply with future food packaging legislation or regulation.
Additionally, our products and the raw materials we use in our production processes are subject to numerous environmental laws and regulations, including the European Union’s Regulation on Registration, Evaluation, Authorization and Restriction of Chemical substances (“REACH”) (EC 1907/2006), which requires a costly and time-consuming registration, safety analysis, and in some cases, authorization process for chemicals made or imported into the European Union. REACH may also require the phase-out or substitution of certain chemicals deemed to be dangerous with suitable alternatives. The European Union is continuously adopting additional requirements related to product safety. Although REACH compliance is primarily the responsibility of our suppliers or the producers of chemical raw materials, we are also affected by REACH as a “downstream” user of REACH-regulated substances. It is possible that the authorization process or the marketing and use restrictions imposed by REACH could increase the cost of or affect the supplies of some chemicals that we use as raw materials or that are manufactured and/or imported into the European Union by us or our suppliers, or require us to substitute current raw materials with alternative substances, and the failure to comply with these requirements could result in fines and penalties. Although we have systems in place to track and monitor the REACH status of our raw materials and believe that our suppliers have made the required registrations and are in material compliance with REACH, there can be no assurance that current or future REACH or similar regulations would not have a material adverse effect on our business, results of operations, financial condition and cash flows.
The presence of hazardous materials at our facilities or in our products may expose us to potential liabilities associated with the cleanup of contaminated soil and groundwater or other types of damages, which could adversely affect our financial condition and our ability to conduct our business.
The presence of hazardous materials at our facilities may expose us to potential liabilities associated with the cleanup of contaminated soil and groundwater, and we could be liable for the costs of responding to and remediating releases of hazardous materials and the restoration of natural resources damaged by such releases, among other things. In order to address such hazardous material releases, we may need to spend substantial amounts of money and other resources from time to time to undertake investigative or remedial actions, construct and maintain remedial equipment, and clean up and/or decommission waste management facilities. If we do not comply with such environmental requirements, regulatory agencies could seek to impose civil, administrative and/or criminal liabilities. Under some circumstances, private parties could also seek to impose civil fines or penalties for violations of environmental law or recover monetary damages, including those relating to property damage or personal injury or illnesses or injuries allegedly related to exposure to hazardous substances at our facilities or in our products.
Changes in product requirements and their enforcement may have a material impact on our operations.
Table Of Contents
10
Changes in laws and regulations relating to the materials allowed for use in packaging and to the recycling of plastic packaging could adversely affect our business if implemented on a large scale in the major markets in which we operate. Changes in laws and regulations laying down restrictions on, and conditions for use of, food, beverage, pharmaceutical, agricultural or other products and the materials in contact with them, or on the use of materials and agents in the production of our products could also adversely affect our business. A number of governmental authorities, both in the United States and abroad, have considered or are expected to consider legislation aimed at reducing the amount of plastic wastes. Programs have included, mandating certain rates of recycling and/or the use of recycled materials, imposing deposits or taxes on plastic packaging material and requiring retailers or manufacturers to take back packaging used for their products. Legislation, as well as voluntary initiatives similarly aimed at reducing the level of plastic wastes, could reduce the demand for certain plastic packaging, result in greater costs for plastic packaging manufacturers or otherwise impact our business. Some consumer products companies, including some of our customers, have responded to these governmental initiatives and to perceived environmental concerns of consumers by using containers made in whole or in part of recycled plastic. Future legislation and initiatives could adversely affect us in a manner that could be material.
The failure of our patents, trademarks, models and confidentiality agreements to protect our intellectual property could adversely affect our business.
Proprietary protection of our processes, apparatuses and other technology is important to our business. Our actions to protect our proprietary rights may be insufficient to prevent others from developing similar products to ours. In addition, the laws and their enforcement in many countries do not protect our intellectual property rights to the same extent as the laws of the European Union and the United States. Furthermore, any pending patent application filed by us may not result in an issued patent, or if patents are issued to us, such patents may not provide meaningful protection against competitors and customers or against competitive technologies. In addition, our competitors and any other third parties may obtain patents that restrict or preclude our ability to lawfully manufacture and market our products in a competitive manner, which could have a material adverse effect on our business, results of operations, financial condition and cash flows.
We also rely upon unpatented proprietary know-how and continuing technological innovation and other trade secrets to develop and maintain our competitive position. There can be no assurance that our confidentiality agreements will not be breached or will provide meaningful protection for our trade secrets or proprietary know-how and adequate remedies in the event of an unauthorized use or disclosure of these trade secrets and know-how. In addition, there can be no assurance that others will not obtain knowledge of these trade secrets through independent development or other access by legal means.
If we are unable to maintain the proprietary nature of our technologies, our profit margin could be reduced as competitors imitating our products could compete aggressively against us in the pricing of certain products and our business, results of operations, financial condition and cash flows may be materially adversely affected.
Any material pending litigation against us regarding any intellectual property claims, with or without merit, could subject us to costly litigation and divert our technical and management personnel from their regular responsibilities. Furthermore, if such claims are adversely determined against us, we could be forced to suspend the manufacture of products using the contested invention or negotiate royalty payments for the usage of such invention and our business, financial condition, results of operations and cash flows could be adversely affected if any such products are material to our business.
Fluctuations in the financial markets will likely adversely affect our pension plan assets and our future cash flows.
We operate certain defined benefit pension plans at our U.S., Canadian and European operations. Continued disruption in global credit and financial markets could adversely affect the market value of our pension plan assets, which would likely increase our pension costs and cause a corresponding decrease in our cash flow. Our pension costs are dependent upon numerous factors resulting from actual plan experience and assumptions of future experience. Pension plan assets are primarily made up of equity and fixed income investments. Accordingly, fluctuations in actual equity market returns as well as changes in general interest rates may result in increased or decreased pension costs in future periods. In addition, changes in assumptions regarding current discount rates and expected rates of return on plan assets could also increase or decrease pension costs. A decline in our pension plan assets as a result of volatile equity market returns would significantly increase future minimum required pension contributions in 2015 and future years which would have an adverse impact on our cash flows.
Failure of control measures and systems resulting in faulty or contaminated products could have a material adverse effect on our business.
Although we have not been subject to any material litigation regarding damages for defective products or substantial product recalls or other material corrective actions in the recent past, these events may occur in the future. Failure to meet control measures
Table Of Contents
11
and quality and safety standards, due to, among other things, accidental or malicious raw material contamination or due to supply chain contamination carried by human error or equipment failure may result in adverse effects on consumer health, litigation exposure, loss of market share, reputational damage, financial costs and loss of revenue.
In addition, if our products fail to meet our standards, we may be required to incur substantial costs in taking appropriate corrective action (including recalling products from consumers) and to reimburse customers and/or end consumers for losses that they suffer as a result of this failure. Customers and end consumers may seek to recover these losses through litigation and, under applicable legal rules, may succeed in any such claim even if there is no negligence or other fault on our part. Placing an unsafe product on the market, failing to notify the regulatory authorities of a safety issue, failing to take appropriate corrective action and failing to meet other regulatory requirements relating to product safety could lead to regulatory investigation, enforcement action and/or prosecution. Any product quality or safety issue may also result in adverse publicity, which may damage our reputation. Any liability resulting from a product defect, if it were to be established in relation to a sufficient volume of claims or to claims for sufficiently large amounts, could have a material adverse effect on our business, results of operations, financial condition and cash flows.
Interruption in the operation of our information and communication technology may affect us adversely.
The operation of our manufacturing facilities as well as our sales and service activities depend on the efficient and uninterrupted operation of complex and sophisticated computer, telecommunication and data processing systems. Information and communication technology-related risks are particularly relevant since our information technology landscape is fragmented and mainly locally driven, due in part to our history of acquisitions of businesses which operated proprietary information technology systems. Some of the software used by us is end user-developed by local personnel. As a consequence, the different platforms in use for key processes may lead to inefficiencies, such as problems with interoperability, malfunctions and higher cost. Our computer and data processing systems and related infrastructure (data center, hardware and wide and local area networks) are generally exposed to the risk of disturbances, damage, electricity failures, computer viruses, fire, other disasters, hacker attacks and similar events. Disruptions to operations or interruptions in operations involving the systems have occurred in individual cases in the past and may occur in the future. Although administration and production networks are separated, an interruption in the operations of computer or data processing could adversely affect our ability to efficiently maintain our production processes and to ensure adequate controls. Disruptions to or interruptions in operations could lead to production downtime which, in turn, could result in lost net sales. Any one or more of these risks, if they were to materialize, could materially adversely affect our business, financial condition and results of operations.
Our insurance coverage may not be sufficient to cover the risks inherent in our business and future coverage may be difficult to obtain replacement insurance on acceptable terms or at all.
Our insurance policies may not provide adequate coverage for the risks inherent in our business, as these insurance policies typically exclude certain risks and are subject to certain thresholds and limits. We cannot assure you that our property, plant and equipment and inventories will not suffer damages due to unforeseen events or that our products may not be defective. Further, the proceeds available from our insurance policies may not be sufficient to protect us from all possible loss or damage resulting from such events. As a result, our insurance coverage may prove to be inadequate for events that may cause significant disruption to our operations, which may have a material adverse effect on our business, results of operations, financial condition and cash flows.
We may suffer indirect losses, such as the disruption of our business or third-party claims of damages, as a result of an insured risk event. Our business interruption insurance and general liability insurance policies, including our product liability insurance, are subject to limitations, thresholds and limits, and may not fully cover all of our indirect losses.
Among other factors, adverse political developments, security concerns and natural disasters in any country in which we operate may materially adversely affect available insurance coverage and result in increased premiums for available coverage and additional exclusions from coverage.
Higher employment costs may have a material adverse effect on our business, financial condition and results of operations.
Labor costs represent a significant portion of our cost of goods sold. Labor costs have been increasing steadily in all of our locations over the past several years, with higher growth in “low-cost countries” where we manufacture products for export to U.S. and European customers. Our labor costs may rise faster than expected in the future as a result of increased workforce activism, government decrees and changes in social and pension contribution rules. We face resistance from customers to price increases motivated by increased labor costs. The continued and sustained increase in labor costs may make some of our plants less competitive against manufacturers operating from countries with lower salary levels, particularly if we do not manage to offset the increase in
Table Of Contents
12
labor costs through productivity gains. If employment costs increase further, and we cannot recover these costs from our customers through increased selling prices or offset them through productivity gains, our operating costs will increase, which could have a material adverse effect on our business, results of operations, financial condition and cash flows.
We may pursue and execute acquisitions, which could adversely affect our business.
We continually evaluate potential acquisition opportunities in the ordinary course of business, including those that could be material in size and to our operations. Acquisitions involve a number of special risks, including:
• the diversion of management’s attention and resources to the assimilation of the acquired companies and their employees and to the management of expanding operations;
• the incorporation of acquired products into our product line;• problems associated with maintaining relationships with employees, suppliers and customers of acquired businesses;• the increasing demands on our operational systems;• possible adverse effects on our reported operating results, particularly during the first several reporting periods after
such acquisitions are completed; and• the loss of key employees and the difficulty of presenting a unified corporate image.
We may become responsible for unexpected liabilities that we failed or were unable to discover in the course of performing due diligence in connection with historical acquisitions and any future acquisitions. We have typically required selling stockholders to indemnify us against certain undisclosed liabilities. However, we cannot assure you that indemnification rights we have obtained, or will in the future obtain, will be enforceable, collectible or sufficient in amount, scope or duration to fully offset the possible liabilities associated with the business or property acquired. Any of these liabilities, individually or in the aggregate, could have a material adverse effect on our business, financial condition and results of operations.
In addition, we may not be able to successfully integrate future acquisitions without substantial costs, delays or other problems. The costs of such integration could have a material adverse effect on our operating results and financial condition. Although we conduct what we believe to be a prudent level of investigation regarding the businesses we purchase, in light of the circumstances of each transaction, an unavoidable level of risk remains regarding the actual condition of these businesses. Until we actually assume operating control of such businesses and their assets and operations, we may not be able to ascertain the actual value or understand the potential liabilities of the acquired entities and their operations. Furthermore, we may not realize all of the cost savings and synergies we expect to achieve from our current strategic initiatives due to a variety of risks, including, but not limited to, difficulties in integrating shared services with our business, higher than expected employee severance or retention costs, higher than expected overhead expenses, delays in the anticipated timing of activities related to our cost-saving plans and other unexpected costs associated with operating our business. If we are unable to achieve the cost savings or synergies that we expect to achieve from our strategic initiatives, it could adversely affect our business, financial condition and results of operations.
An affiliate of Sun Capital controls us and may have conflicts of interest with us.
An affiliate of Sun Capital indirectly controls us. Such affiliate of Sun Capital, therefore, has the power to take actions that affect us, including appointing management and approving mergers, a sale of substantially all of our assets and other extraordinary transactions. For example, such affiliate of Sun Capital could cause us to make acquisitions that increase the amount of our indebtedness or to sell revenue-generating assets, impairing our ability to make payments under our debt agreements. Such affiliate of Sun Capital could also receive certain fees in connection with such acquisitions and other corporate events under a management services agreement with us. Additionally, such affiliate of Sun Capital is in the business of making investments in companies and may, from time to time, acquire and hold interests in businesses that compete directly or indirectly with us. Such affiliate of Sun Capital may also pursue acquisition opportunities that may be complementary to our business, and as a result, those acquisition opportunities may not be available to us.
Taxing authorities could challenge our historical and future tax positions or our allocation of taxable income among our subsidiaries, and the tax laws to which we are subject could change in a manner adverse to us.
The amount of income taxes we pay is subject to our interpretation of applicable tax laws in the jurisdictions in which we file. We have taken and will continue to take tax positions based on our interpretation of such tax laws. There can be no assurance that a taxing authority will not have a different interpretation of applicable law and assess us with additional taxes. Similarly, the tax laws to which we are subject could change in a manner unfavorable to us. Additionally, in certain circumstances, we use estimates when calculating our tax liabilities. For example, because we conduct operations, including intercompany transactions, through subsidiaries in numerous tax jurisdictions around the world, we must establish a transfer pricing methodology to account for
Table Of Contents
13
intercompany transactions. While the transfer pricing methodology we utilize is based on economic studies, it could be challenged by various tax authorities resulting in additional tax liability, interest and penalties. We are regularly under audit by tax authorities, and although we believe our interpretation of applicable tax laws is correct and our tax estimates are reasonable, the final determinations of such audits could be materially different than those which are reflected in our historical financial statements provided elsewhere in this offering memorandum. Any imposition of additional tax liability for historical periods or any change in interpretations, law or our use of estimates in current and future tax periods could have a material adverse effect on our business, results of operations, financial condition and cash flows.
We are subject to anti-trust and similar legislation in the jurisdictions in which we operate.
We are subject to a variety of anti-trust and similar legislation in the jurisdictions in which we operate. Future acquisitions may be subject to merger control approval. In addition, we are subject to legislation in many of the jurisdictions in which we operate relating to unfair competitive practices and similar behavior. There can be no assurance that we will not be subject to allegations of, or regulatory investigations or proceedings into, such practices. In the event that such allegations are made or investigations or proceedings initiated (irrespective of merit), we may be required to devote significant management resources to defending such allegations. In the event that such allegations are proved, we may be subject to significant fines, damages awards and other expenses.
For example, two of our subsidiaries Paccor France SAS (formerly known as Huhtamaki France S.A.S.) and Island Lux S.a r.l. & Partners S.C.A. ("Island Lux SCA"), received a Statement of Objections from the European Commission on September 28, 2012, alleging that Paccor France S.A.S. participated in a cartel involving foam trays used for retail food packaging between September 3, 2004 and June 19, 2006. In the Statement of Objections, which constitutes an intermediate step in the proceedings, the European Commission indicated that it intends to levy a fine against the addressees of the Statement of Objections, including Coveris Rigid Auneau. Proceedings regarding this matter are currently pending and no decision has been taken so far by the EU Commission authority. We have been advised that the Competition authority expects to issue a decision in the first half of 2015. Coveris believes that any fine levied upon Coveris Rigid Auneau would be indemnified by Huhtamaki Oyj, the previous owner of the company, under the Sale and Purchase Agreement dated September 22, 2010. The claim has been accepted by Huhtamaki Oyi by fax dated October 9, 2012 and the defense is being handled by Huhtamaki and their legal advisors Dechert LLP. Should Huhtamaki fail to fulfill its obligations under the indemnity granted to us, or should the indemnity be unenforceable, our business, results of operations, financial condition or cash flow could be materially adversely affected.
Furthermore, in December 2013, Paccor Packaging Spain, S.A. (subsequently renamed Coveris Rigid Spain S.A., "Paccor Spain") received a demand letter from the counsel for SUCA, S.C.A. y de Asociacion de Organizaciones de Productores de Frutas y Hortalizas de Almeria—Coexphal (“SUCA”) alleging that a Paccor Spain predecessor business, Autobar Packaging Spain S.A. (“Autobar”) participated in price fixing activities with respect to packaging products sold in Spain between 1999 and 2007. The Autobar business was sold to Group Guillin in 2006. The demand letter claims damages “preliminary estimated” at €13,500,000 (made against all cartel participants and not just Paccor Spain), together with interest and costs. The demand letter also references a second legal action pending before an Italian court in Bologna, Italy, and notifies Paccor Spain that SUCA has named Paccor Spain as a co-defendant in the Italian action, for which formal notice was received in January 2014. A hearing on this matter was held in November 2014, in which an indemnity claim against Groupe Guillin and Veripack was raised and, alternatively, an action in recourse against all Cartelists. The next hearing is scheduled for May 13, 2015. Coveris Rigid Spain S.A. (fka Paccor Packaging Spain S.A.) was sold to a third party on July 22, 2014. An indemnification/guarantee has been granted to the Purchaser of Coveris Rigid Spain S.A. by both Coveris Holdings SA and Coveris Rigid Polska (formerly, Paccor Polska) for any losses and costs arising from the SUCA claim, and the Coveris Group remains responsible for handling the defense in this case. Any imposition of fines or damage awards and expenses which would invoke the indemnity granted by the Group, could have a material adverse effect on our business, results of operations, financial condition or cash flow.
We may not be able to retain key members of our senior management team.
Our success depends upon the continued service of our directors and senior management. In addition, our future growth and success also depends on our ability to attract, train, retain and motivate skilled managerial, sales, administration, operating and technical personnel. The number of people with the necessary skills to serve in these positions is limited.
Any loss in the continued service of certain key personnel may have a material adverse effect on our business. In connection with the Combination, we have also hired new management personnel in order to effectively manage the Company. Failure to successfully retain our key management team, integrate new management personnel and attract the talent necessary to manage the Company could have a material adverse effect on our business.
Table Of Contents
14
Our high leverage and debt service obligations could adversely affect our business and prevent us from fulfilling our obligations with respect to our indebtedness.
Our high leverage and debt service obligations could adversely affect our business and prevent us from fulfilling our obligations with respect to our indebtedness. We anticipate that our high leverage will continue for the foreseeable future. Our high leverage could have material adverse consequences, including, but not limited to:
• making it more difficult for us to satisfy our debt obligations; • increasing our vulnerability to a continuing downturn in our business or economic and industry conditions; • limiting our ability to obtain additional financing and increasing the cost of any such financing to fund future working
capital requirements, capital expenditures, business opportunities and other corporate requirements; • requiring the dedication of a substantial portion of our cash flow from operations to the payment of principal of, and
interest on, our indebtedness, which means that this cash flow would not be available to fund our operations and for other corporate purposes;
• limiting our flexibility in planning for, or reacting to, changes in our business, the competitive environment and our industry; and
• placing us at a competitive disadvantage relative to a competitor with less leverage.
Any of these or other consequences or events could have a material adverse effect on our ability to satisfy our debt obligations.
Moreover, we may incur substantial additional indebtedness in the future. If we incur additional indebtedness, the related risks that we now face, as described above and elsewhere in these “Risk Factors,” could intensify.
We are subject to restrictive debt covenants, which may limit our operating flexibility.
Our indebtedness contains covenants which impose significant restrictions on the way we can operate, including restrictions on the ability to:
• borrow or guarantee additional indebtedness and issue certain preferred shares; • layer debt; • pay dividends, repurchase shares, and make distributions and certain other payments and investments; • redeem or repurchase indebtedness junior to the Notes; • create liens; • merge or consolidate with other entities; • create encumbrances or restrictions on the payment of dividends or other amounts to each Issuer from any of its restricted
subsidiaries; • enter into certain transactions with affiliates; • sell, lease or transfer certain assets, including shares of any restricted subsidiary of the Company; and • provide guarantees of other debt.
These covenants could limit our ability to finance our future operations and capital needs and our ability to pursue acquisitions and other business activities that may be in our interest. A breach of any of our covenants or restrictions could result in an event of default under such agreements. Upon the occurrence of any event of default under these facilities, subject to applicable cure periods and other limitations on acceleration or enforcement, the relevant creditors could cancel the availability of the facility and/or elect to declare all amounts outstanding under these facilities, together with accrued interest, immediately due and payable. In addition, any default under these facilities could lead to an event of default and acceleration under other debt instruments that contain cross default or cross acceleration provisions.
We may not have enough cash available to service our debt and to sustain our operations.
Our ability to make scheduled payments to meet our debt service obligations when due and to fund our ongoing operations or to refinance our debt, depends on our future operating and financial performance and our ability to generate cash, which will be affected by our ability to successfully implement our business strategy as well as general economic, financial, competitive, regulatory, legal, technical and other factors, including those discussed in these “Risk Factors”, beyond our control. If we cannot generate sufficient cash to meet our debt service requirements, we may, among other things, need to refinance all or a portion of our debt, including the Notes, obtain additional financing, delay planned capital expenditures or sell assets. If we are not able to refinance any of our debt, obtain additional financing or sell assets on commercially reasonable terms or at all, we may not be able to satisfy our obligations with respect to our debt. In that event, borrowings under other debt agreements or instruments that contain
Table Of Contents
15
cross-default or cross-acceleration provisions may become payable on demand, and we may not have sufficient funds to repay all of our debts.
Our failure to comply with the agreements relating to our outstanding indebtedness, including as a result of events beyond our control, could result in an event of default that could materially and adversely affect our results of operations and our financial condition.
If there were an event of default under any of the agreements relating to our outstanding indebtedness, the holders of the defaulted debt could cause all amounts outstanding with respect to that debt to be due and payable immediately. We cannot assure you that our assets or cash flow would be sufficient to fully repay borrowings under our outstanding debt instruments if accelerated upon an event of default. Further, if we are unable to repay, refinance or restructure our indebtedness under our secured debt, the holders of such debt could proceed against the collateral securing that indebtedness. In addition, any event of default or declaration of acceleration under one debt instrument could also result in an event of default under one or more of our other debt instruments.
OUR BUSINESS
We are a leading global manufacturer of plastic and other value-added packaging products, based on net sales. We offer a broad range of flexible and rigid plastic, paper packaging, and coatings products that include primary packaging (such as bags, pouches, cups, lids and trays), films, laminates, sleeves and labels. As of December 31, 2014, we produced our products in 66 strategically located production facilities in North America, Europe, Asia and the Middle East. Our broad product offering and geographic reach allow us to serve as a “one-stop-shop” for our customers who increasingly demand a single source of supply that can be reliably and consistently delivered throughout the world. Our products are used in a diverse range of growing and resilient end markets, including the food, beverage, pet food, household, personal care, medical and industrial end markets. We have benefited from significant plastic packaging growth in our strategic end markets in North America and Europe, which has on average over the last ten years exceeded gross domestic product growth due in part to resilient demand for consumer goods and a shift from metal, paper and glass packaging to plastic packaging. During the past three years, we have taken significant steps towards becoming a global packaging company with broad technological capabilities and a diverse manufacturing, development and sales platform that we can use to leverage customer relationships, product lines, manufacturing technologies and purchasing scale.
We currently have a diversified base of over 3,000 customers, ranging from leading international blue-chip customers to smaller regional businesses who we believe look to us for packaging solutions that have high consumer impact in terms of form, function and branding. Our diverse customer base includes some of the largest consumer products companies in the world such as Procter & Gamble, Coca-Cola, Nestle, Kellogg, Kraft Foods, Lactalis, Certainteed, Mars, Colgate, Danone, Arla and Unilever. We have developed longstanding relationships with our customers spanning, in many cases, over 15 years. For the years ended December 31, 2014 and 2013, no single customer represented more than 6% of net sales, and our top ten customers represented approximately 21% and 21% of net sales, respectively. Effective packaging is key to the success of our customers’ products, and we work closely with these customers to design value-added packaging that complements and enhances the functionality and shelf-appeal of their product line. We have product innovation teams located throughout our markets that enable us to serve our customers locally, and we solidify our relationships with our customers by working with them to develop, commercialize and efficiently produce innovative new product packaging. We believe that the Combination will enable us to expand our business by cross-selling to our large existing customer base and by offering new customers broad distribution of technically advanced products with consistent quality that cover a broad range of our customers’ value chain. We believe that our efforts in this area have begun to gain traction with some of our large customers during the year ended December 31, 2014.
As of December 31, 2014, we operated 66 production facilities worldwide which allow us to supply global customers reliably, quickly and efficiently across multiple regions. As of that date, 18 of our production facilities were located in North America, 46 production facilities were located across Europe and two were strategically located in the Middle East and China. We believe this provides us with a competitive advantage over most of our competitors, which in general are smaller and only offer regional distribution. Our manufacturing platform benefits from several years of facility upgrades, footprint rationalization and modernization. During the year ended December 31, 2013, we made significant capital investments, which have provided us with a modern and efficient portfolio of facilities to produce our products. We have also benefited from sharing and implementing best practices and procedures across our businesses in order to leverage our technological expertise and improve efficiency throughout our group. Furthermore, we have achieved synergies and cost savings at our production facilities, primarily as a result of (i) leveraging economies of scale and improving supplier performance management in our procurement and (ii) the rationalization of our footprint and the improvement of efficiencies through lean manufacturing.
We conduct our business principally through two operating segments: Flexible and Rigid. In our Flexible packaging segment we manufacture a variety of flexible and semi-rigid plastic and paper products, including bags, pouches, roll stocks, films, laminates,
Table Of Contents
16
sleeves and labels. We sell these products primarily in North America and Europe. In our Rigid packaging segment we manufacture thermoformed and decorated rigid plastic and paper packaging solutions, including bowls, cups, lids and trays. We sell these products primarily in Europe.
Our Strengths
We believe our key competitive strengths are:
Leading Positions in Attractive End Markets. We are a leading global manufacturer of flexible and rigid plastic packaging based on net sales and hold strong positions in both North America and Europe with sales into attractive end markets and product types across our global portfolio. For example, we believe that we are the largest provider of paper-based pet food packaging in North America, the second largest provider of pet food and cheese packaging in North America, a leader in the printed beverage shrink market in North America, a leading provider of unit dose laundry detergent packaging in North America, the second largest provider for printed shrink (collation) films in North America and a leading provider of private labels in the United Kingdom, as well as among the largest thin wall rigid packaging producers by volume in Europe. We hold these leading positions in some of the most favorable segments and geographies in terms of market size and expected demand growth in the global packaging market. During the last ten years, according to the industry data to which we subscribe, plastic packaging has been the fastest growing segment of the packaging market, and sales growth in our markets during the last ten years has exceeded gross domestic product growth, due in part to increasing demand for consumer goods, a shift from metal, paper and glass containers to plastics, and increasing wealth levels in emerging economies leading to the establishment of a “middle class.” According to Smithers Pira, the global flexible and rigid plastic packaging industries are expected to grow at a compound annual growth rate of approximately 4.5% and 5.3%, respectively, from 2013 to 2018.
Broad Geographic Reach. Our industry is heavily influenced by large, global customers who require that their suppliers are able to deliver products globally, in a timely manner, and based on defined product specifications. We have an extensive manufacturing base in North America, Europe and strategically located production facilities in Asia and the Middle East, which allow us to supply global customers quickly and efficiently across multiple regions. The flexible packaging market is highly fragmented in North America and Europe, and we believe that large, global customers have historically been underserved by smaller manufacturers that can only provide products on a regional basis. We are able to produce products in various regions of the world that have the same quality and appearance, which helps our customers provide a consistent product and brand throughout their markets. Moreover, customers desire a packaging provider certified and able to meet applicable government food and safety standards, which we believe gives larger market participants, such as us, an advantage over small market participants. Our strategically located production facilities allow us to manufacture products in close proximity to our customers’ facilities, reducing supply chain complexity, minimizing shipping costs and allowing for just-in-time delivery. Our broad geographic reach also exposes us to a wide variety of products and technologies, which we can scale up and introduce quickly throughout all of our markets.
Resilient and Diversified Business Model. We offer a diverse range of flexible and rigid plastic and paper packaging solutions for use in consumer staples such as foods and beverages, other consumer staples, including detergent and pet food, household care and hygiene products, medical devices and other construction and electronics products. We also produce packaging labels and can provide customized printing services for our customers’ products. We believe that we have one of the broadest product portfolios in the plastic packaging industry, which reduces our exposure to changes in consumer preferences for particular packaging solutions. Further, demand for consumer staples, and by extension demand for our products, is generally more resilient across economic cycles than other discretionary consumer or industrial products. For the years ended December 31, 2014 and 2013, we generated a significant portion of our net sales from sales of packaging for food, beverages and pet and household care. Each of these end markets has exhibited resilience during recent adverse economic conditions. We also sell our products in over 95 countries, which reduces our exposure to individual geographic regions. Our customer base is well diversified with no individual customer representing more than 6% of sales and with the top ten customers only representing a combined 21% for the year ended December 31, 2014. We believe that our broad product portfolio and diverse end markets, customer base and geographic markets make us less susceptible to regional economic shocks, changing demand dynamics or shifting customer preferences.
Established Relationships with Blue-Chip Customers. We have a large and expanding customer base of over 3,000 customers that includes some of the largest consumer products companies in the world, including Procter & Gamble, Coca-Cola, Nestle, Kellogg, Kraft Foods, Lactalis, Certainteed, Mars, Colgate, Danone, Arla and Unilever. In addition, many of the world’s largest retailers, including Tesco, Walmart (Asda), Marks & Spencer and J Sainsbury’s, use our packaging and labels for their store-brand products. We have long-standing relationships with many of these customers. Our technology and design teams work closely with our customers, and are in some instances located at our clients’ facilities, to design packaging that complements and enhances the functionality and shelf-appeal of their product line, and our production teams also work closely with our customers, including in many cases at the customers’ production facility, to produce and deliver products according to their specifications and to ensure
Table Of Contents
17
that our products are integrated into their assembly line. We believe that our record for reliably providing high quality products has created customer trust and loyalty. In addition, we believe that we benefit from high switching costs due to our knowledge of our customers’ products and processes, the costs involved with certifying facilities and developing packaging that complies with specific product requirements, in particular with food and healthcare packaging and the significant set-up time required to install production capacity for customized products. As a result, we are a preferred supplier to many of our customers. Furthermore, we believe that the Combination will enable us to expand our business by cross-selling to our large existing customer base and by offering new customers broad distribution of technically advanced products with consistent quality that cover a broad range of our customers’ value chain. We believe that our efforts in this area have begun to gain traction with some of our large customers. Proven Capabilities in Developing and Commercializing New Technologies. We seek to develop innovative, sustainable and value-added products that improve the shelf-appeal of our customers’ products and enhance product functionality by delivering unique performance characteristics. We focus our research efforts on projects with the potential to command a sustainable price premium, develop customer loyalty and support our overall profitability. We believe we have a track record of commercializing new products that generate incremental organic profitability. Recent product innovations include our Maraflex® vacuum shrink films and bags, which provide durable protection and seal integrity for fresh meats, and the Versaflex™ machine, which is designed to work seamlessly with our customers’ existing meat packing systems to cut bags to custom lengths from tubestock, reducing or eliminating the need for large premade bag inventory. In 2013 we were awarded the Flexible Packaging Association’s 2013 Highest Achievement Award for our development of the Kraft YES® Pack, a four corner sealed pouch with a pourable fitment and two handles, which we developed jointly with Kraft to provide customers with an attractive flexible packaging solution that decreases food waste and is functional and environmentally friendly. In 2014, we received awards from, among others, the European Flexographic Industry Association, FlexoTech Magazine, The Café Life, and the Packaging News. As of December 31, 2014, we owned 368 patents and had 87 patent applications pending.
Large Scale Provides Opportunities for Cost Savings. We benefit from economies of scale in raw material procurement, manufacturing and distribution. We are one of the largest purchasers of plastic resins globally, which provides us with considerable purchasing power. We have achieved cost benefits relating to the procurement of raw materials by using our scale to obtain better pricing in key raw materials purchases, including improved pricing of resin, paper, film, ink and masterbatch.
Our large scale provides us with significant free cash flow that has allowed us to make improvements in our production capabilities. For example, we have recently invested in obtaining capacity enhancing presses and/or extrusion lines in our facilities in several of our facilities in North America. We believe that our combined scale provides significant opportunities to realize further savings in procurement, manufacturing and overhead costs. Our large manufacturing base also allows us to enhance capacity utilization, optimize transportation costs and realize distribution efficiencies. We constantly review and optimize our manufacturing footprint. For example, we recently launched the first phase of the modernization of our production facility in Whitby as a result of which we will consolidate Concord Ontario into our Whitby facility. Stable Earnings. Our diversified product portfolio, resilient end markets and focus on cost savings initiatives has allowed us to generate stable adjusted EBITDA margins despite challenging macroeconomic conditions and significant resin price changes in recent years. We have benefited from strong plastic packaging industry growth in North America and Europe, our main geographic markets and continued growth in the end markets for our products such as packaging for foods and beverages, which have been resilient during periods of adverse economic conditions. We seek to stabilize our earnings by managing our exposure to fluctuations in raw material prices through long-term arrangements with preferred suppliers, with various raw material pass-through mechanisms and by managing our mix of contracted and spot sales. A significant portion of our net sales are made pursuant to agreements indexed to raw material prices with escalator and de-escalator mechanisms, which typically adjust plastic packaging raw material prices within 30 to 90 days and paper raw material prices within 90 to 120 days. Our rationalization efforts have contributed to our ability to make significant capital investment in our production facilities and machinery, which we believe will help reduce our future maintenance capital expenditure requirements, allowing us to produce products more efficiently and enhance future free cash flows.
Experienced Management Team with Successful Track Record. Our senior management team has extensive experience in the packaging industry and a track record of successfully integrating acquisitions. Our senior management team is led by our Chief Executive Officer, Gary Masse, who assumed his role as CEO effective April 14, 2014. Mr. Masse has more than 25 years of experience in the manufacturing sector, most recently serving as CEO of Precision Partners Inc., a $500 million engineering and manufacturing company. Prior to Precision, Mr. Masse was Group President for Cooper Industries, where he managed the $800 million Cooper Tools global business which had more than 50% of its sales outside of the United States. During Mr. Masse’s tenure as President, Cooper achieved profitable growth through global expansion and expanded margins by implementing lean manufacturing procedures in the operations and back office. Mr. Masse has also held executive and senior management positions at Danaher Corporation and General Electric. Mike Alger, our Chief Financial Officer, who has over 35 years of experience in
Table Of Contents
18
senior finance and operations roles, previously served as Group Chief Financial Officer of a diverse group of Sun Capital portfolio companies. Mr. Alger has significant acquisition and integration experience from prior business ventures. Mr. Alger and several other members of our current management team led the integration of the Sun Capital portfolio companies that comprised the Exopack Business into the Group and have successfully increased our EBITDA margin since the Combination through integration and cost-savings initiatives.
Our Strategy
In connection with the Combination we have created a number of strategic plans for the future development of our business. We intend to develop our business through continued investment in world-class technologies and employees with the vision to become the global leader for innovative and sustainable packing solutions and are striving for excellence in safety, product quality, customer service and operations. Building upon our core strengths, we pursue the following strategies:
Leverage Our Customer Relationships to Organically Grow Our Business. We enjoy long-standing relationships with many of our customers. We work closely with these customers to design packaging that complements and enhances the functionality, product quality and shelf-appeal of their product lines. We seek to continue to offer enhanced service and support to customers, anticipating their needs and providing value-added solutions to their problems. We intend to continue to focus on delivering high quality customer service and value-added products and seek to leverage the long-standing customer relationships of our businesses to increase sales to our largest customers. We believe that the Combination provides us the opportunity to cross-sell our complete product line to customers in all of our markets, and thus expand our share of the value chain with our existing customers. For example, since the Combination, we have been working to leverage our leading market positions and technological expertise in rigid packaging and labels in Europe to build market share for these products in North America. We believe that the Combination also provides our European Flexibles business with the opportunity to leverage our longstanding North American relationships with major pet food companies to which we provide multiple substrates and product types. We believe that our customers will recognize the advantages of our global scale and the opportunity to use technology exchange and best practices to deliver the highest quality and most consistent packaging. In addition, leveraging relationships across the Group have allowed us to capture new technology and market opportunities. For example, teams in our North American Food business unit and our UK Food & Consumer business unit are currently collaborating to sell Duralite™, a proprietary light weight shrink film, to a key customer, from our United Kingdom plants to the United States, where the customer is located. The related Duralite™ technology is also being shared between the United Kingdom and the United States.
Achieve Further Integration and Cost Savings from the Combination. We intend to continue to integrate all organizational and operational functions across our Company by leveraging our management’s collective experience in business integration and knowledge of each of our legacy businesses. We believe the Combination and our increased scale allows us to secure improved volume pricing from our suppliers and continue to streamline procurement. We plan to continue to develop our company-wide purchasing programs to enhance our pricing capabilities, to allow global purchasing from preferred suppliers. We plan to expand the role of Procurement group in our raw materials procurement in order to continue to expand upon the procurement savings that we realized in 2014 and 2013. We also intend to continue to rationalize our manufacturing footprint where opportunities exist to streamline production and utilize more efficient sites, and to institute company-wide operational and manufacturing best practices. Finally, we are consolidating our management and back office functions where systems and language capabilities allow. Continue to Enhance our Products Through Advanced Technology. We intend to continue developing innovative products for distribution in attractive markets to further enhance the value we provide our customers and drive best practices through harmonization and standardization of equipment, and we are focused on working together with our customers to increase the functionality, product quality and shelf-appeal of our products by developing and applying innovative new technologies. To enhance the convenience of our products, we intend to continue to develop complementary product features such as high definition graphics, fitments, easy open, advanced package re-closure systems and barrier technology. We believe that the integration of the Group improves our development capabilities, and have commenced the harmonization of our global R&D centers to design and expedite the production of innovative products. We produce a wide variety of products and use multiple different technologies across our businesses, and we intend to leverage our scale to introduce new products quickly throughout all of our markets maintaining our focus on safety, product quality, customer service and operations. In 2015, we intend to increase the coordination of our technology teams, in line with the overall commercial strategy we have been developing and refining since the Combination. Increase Share of the Value Chain. We intend to leverage our global manufacturing capabilities, broad product portfolio and advanced packaging technologies to continue to expand our share of the value chain with our existing customers and to increase our market share in select product categories for which we believe we can offer the greatest range of value-added services. We currently provide products and services that cover a wide range of the value chain, ranging from converting raw materials into packaging products to printing and labeling those products. For instance, our plastic quad sealed bags used for the packaging of
Table Of Contents
19
pet food cover the full packaging value chain: we form the basis of the product by extruding cast nylon and film, followed by lamination, printing and the addition of a slider zipper, as well as comprehensive field technical support to the pet food manufacturer. We believe that we are well-positioned following the Combination to increase our overall market share in attractive product categories by leveraging the leadership positions of our businesses at different points in the value chain, and we recently hired two category managers to facilitate our efforts. We intend to continue to focus our research and development and coordinated sales efforts on select products in which we believe we can offer the greatest range of value-added services. For example, our recent investments in additional ClearShield lines (a water quench line for forming webs) and a Mark Andy printing press, demonstrate our focus on critical markets, such as meat products, where we have strong market share and intellectual property.
Selectively Pursue Strategic Acquisition Opportunities. In addition to the growth in net sales, operating income and cash flow that we are targeting through organic sales volume growth and cost savings, we believe that our platform is well positioned for additional strategic acquisition opportunities. We believe that our increased size resulting from the Combination creates an opportunity for us to consider a broader range of potential targets as a result of our greater resources and increased geographic reach. For example, one of our customers has asked us to expand into Africa, and we believe that other customers may make similar requests. In addition, our broad geographic reach allows us to selectively expand into adjacent markets that we believe can be managed from and integrated with our existing operations. We believe that we have demonstrated our ability to successfully integrate acquisitions and achieve operating efficiencies. We intend to pursue a selective and disciplined acquisition strategy to expand into new markets to serve demand from our existing customer base.
Our Segments
Our business is divided into two reportable segments, Flexible and Rigid, based on the type of products manufactured. Our Flexible segment and our Rigid segment generated sales of $1,986,679 and $772,578 in the twelve months ended December 31, 2014, respectively.
As of December 31, 2014, our Flexible segment operates 45 production facilities: 16 in North America, 27 in Europe, one in Egypt and one in China, through which we manufacture and sell value-added flexible, plastic and paper -based packaging and film products used in a wide variety of end markets, including food and beverage, healthcare and hygiene, pet food, agriculture and horticulture, electronics, building materials and chemicals, and banking and security. We offer a wide range of packaging styles, graphics, special features and coatings to suit particular customer needs. In addition to a complete existing product line, we have sophisticated in-house product development departments located throughout our markets, which allow us to integrate ourselves into, and, we believe, add significant value to, our customers’ packaging design processes. We continually develop our product portfolio in response to our customers’ changing needs and we believe that our product development capabilities help solidify our relationships with our customers.
As of December 31, 2014, our Rigid segment operates 21 production facilities: 2 in North America and 19 in Europe, in close proximity to customers and in geographies with favorable underlying growth rates. Our Rigid segment produces thermoformed and decorated rigid plastic and plastic/paper packaging solutions for a variety of end-markets including food and foodservice, healthcare, home and personal care and hygiene. Our Rigid facilities have advanced technological capabilities, enabling us to concentrate on value-added packaging solutions including sophisticated decorating capabilities.
History
On May 31, 2013, Sun Capital Partners V, L.P., an affiliate of Sun Capital completed the Combination of five of their flexible and rigid packaging portfolio businesses in North America and Europe, including the Exopack Business, Britton Business, Paccor Business, Kobusch Business and Paragon Business under Coveris Holdings, S.A., a Luxembourg public limited liability company (société anonyme).
Following the completion of the Combination, the Group has been combined into a single business, added five acquisitions and taken significant steps to integrate the Company’s businesses in order to leverage their complementary product lines, customer bases, procurement requirements, technologies and geographic reach. For example, we have focused on coordinating product development and sales efforts across the businesses to leverage our combined product line and integrate new product technologies throughout our Company. We have also instituted cost savings initiatives across the Company, including company-wide procurement initiatives and manufacturing rationalizations.
Product Overview
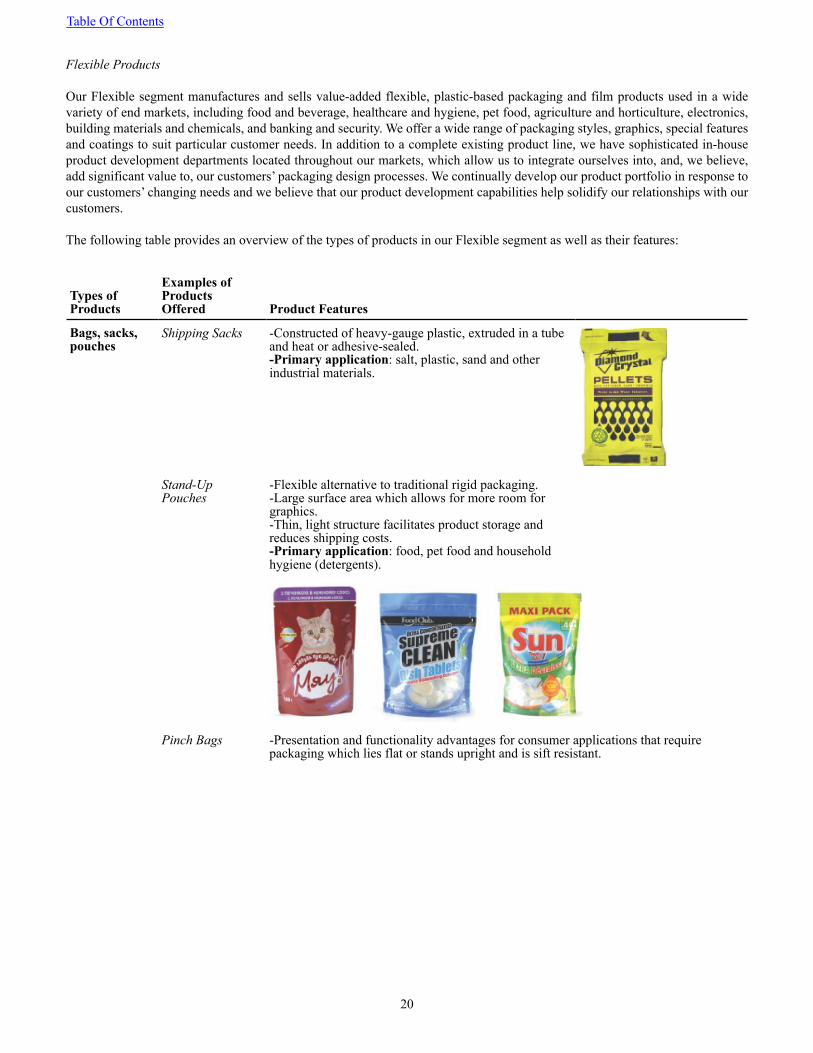
Table Of Contents
20
Flexible Products
Our Flexible segment manufactures and sells value-added flexible, plastic-based packaging and film products used in a wide variety of end markets, including food and beverage, healthcare and hygiene, pet food, agriculture and horticulture, electronics, building materials and chemicals, and banking and security. We offer a wide range of packaging styles, graphics, special features and coatings to suit particular customer needs. In addition to a complete existing product line, we have sophisticated in-house product development departments located throughout our markets, which allow us to integrate ourselves into, and, we believe, add significant value to, our customers’ packaging design processes. We continually develop our product portfolio in response to our customers’ changing needs and we believe that our product development capabilities help solidify our relationships with our customers.
The following table provides an overview of the types of products in our Flexible segment as well as their features:
Types ofProducts
Examples ofProductsOffered Product Features
Bags, sacks,pouches
Shipping Sacks -Constructed of heavy-gauge plastic, extruded in a tube and heat or adhesive-sealed.-Primary application: salt, plastic, sand and other industrial materials.
Stand-UpPouches
-Flexible alternative to traditional rigid packaging.-Large surface area which allows for more room for graphics.-Thin, light structure facilitates product storage and reduces shipping costs.-Primary application: food, pet food and household hygiene (detergents).
Pinch Bags -Presentation and functionality advantages for consumer applications that requirepackaging which lies flat or stands upright and is sift resistant.
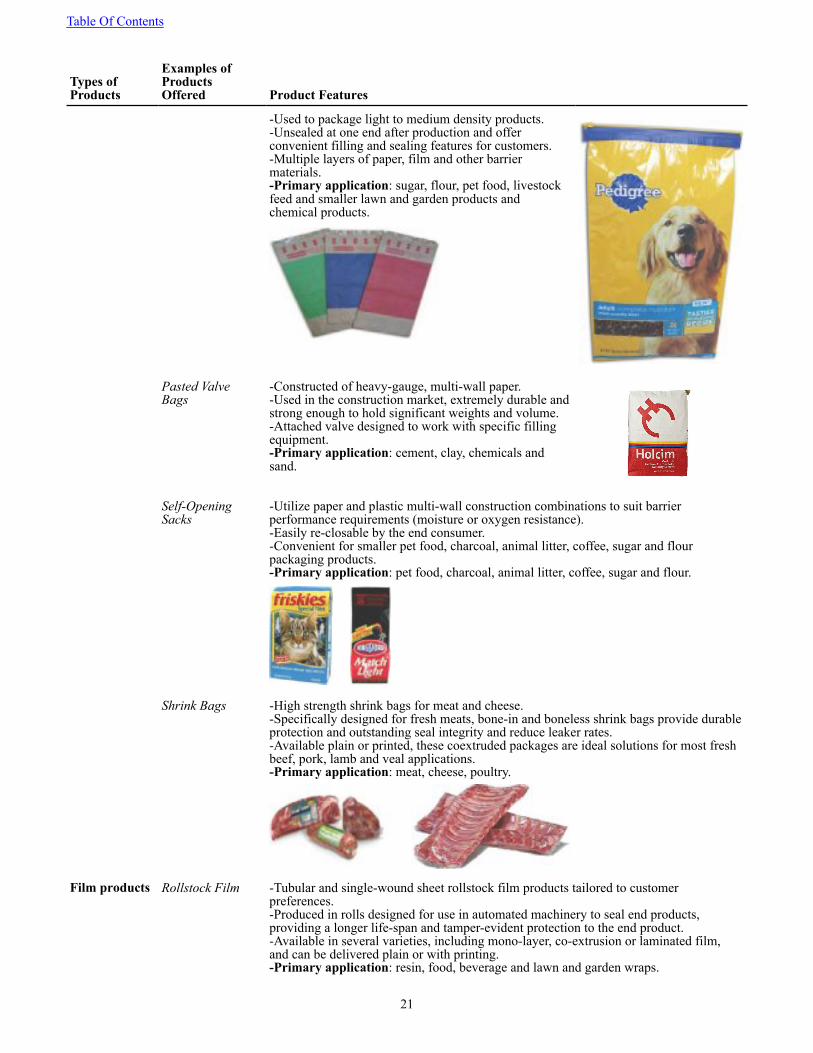
Table Of Contents
21
Types ofProducts
Examples ofProductsOffered Product Features
-Used to package light to medium density products.-Unsealed at one end after production and offer convenient filling and sealing features for customers.-Multiple layers of paper, film and other barrier materials.-Primary application: sugar, flour, pet food, livestock feed and smaller lawn and garden products and chemical products.
Pasted ValveBags
-Constructed of heavy-gauge, multi-wall paper.-Used in the construction market, extremely durable and strong enough to hold significant weights and volume.-Attached valve designed to work with specific filling equipment.-Primary application: cement, clay, chemicals and sand.
Self-OpeningSacks
-Utilize paper and plastic multi-wall construction combinations to suit barrier performance requirements (moisture or oxygen resistance).-Easily re-closable by the end consumer.-Convenient for smaller pet food, charcoal, animal litter, coffee, sugar and flour packaging products.-Primary application: pet food, charcoal, animal litter, coffee, sugar and flour.
Shrink Bags -High strength shrink bags for meat and cheese.-Specifically designed for fresh meats, bone-in and boneless shrink bags provide durable protection and outstanding seal integrity and reduce leaker rates.-Available plain or printed, these coextruded packages are ideal solutions for most fresh beef, pork, lamb and veal applications.-Primary application: meat, cheese, poultry.
Film products Rollstock Film -Tubular and single-wound sheet rollstock film products tailored to customer preferences.-Produced in rolls designed for use in automated machinery to seal end products, providing a longer life-span and tamper-evident protection to the end product.-Available in several varieties, including mono-layer, co-extrusion or laminated film, and can be delivered plain or with printing.-Primary application: resin, food, beverage and lawn and garden wraps.
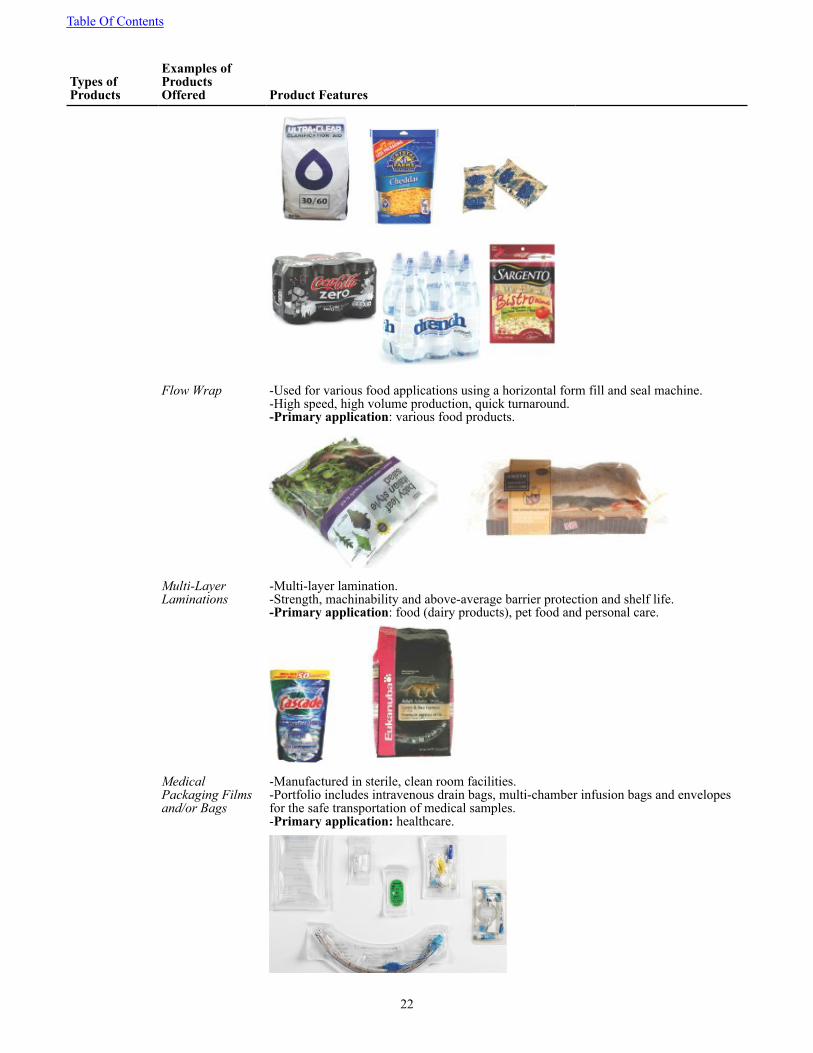
Table Of Contents
22
Types ofProducts
Examples ofProductsOffered Product Features
Flow Wrap -Used for various food applications using a horizontal form fill and seal machine.-High speed, high volume production, quick turnaround. -Primary application: various food products.
Multi-LayerLaminations
-Multi-layer lamination.-Strength, machinability and above-average barrier protection and shelf life.-Primary application: food (dairy products), pet food and personal care.
MedicalPackaging Filmsand/or Bags
-Manufactured in sterile, clean room facilities.-Portfolio includes intravenous drain bags, multi-chamber infusion bags and envelopes for the safe transportation of medical samples.-Primary application: healthcare.
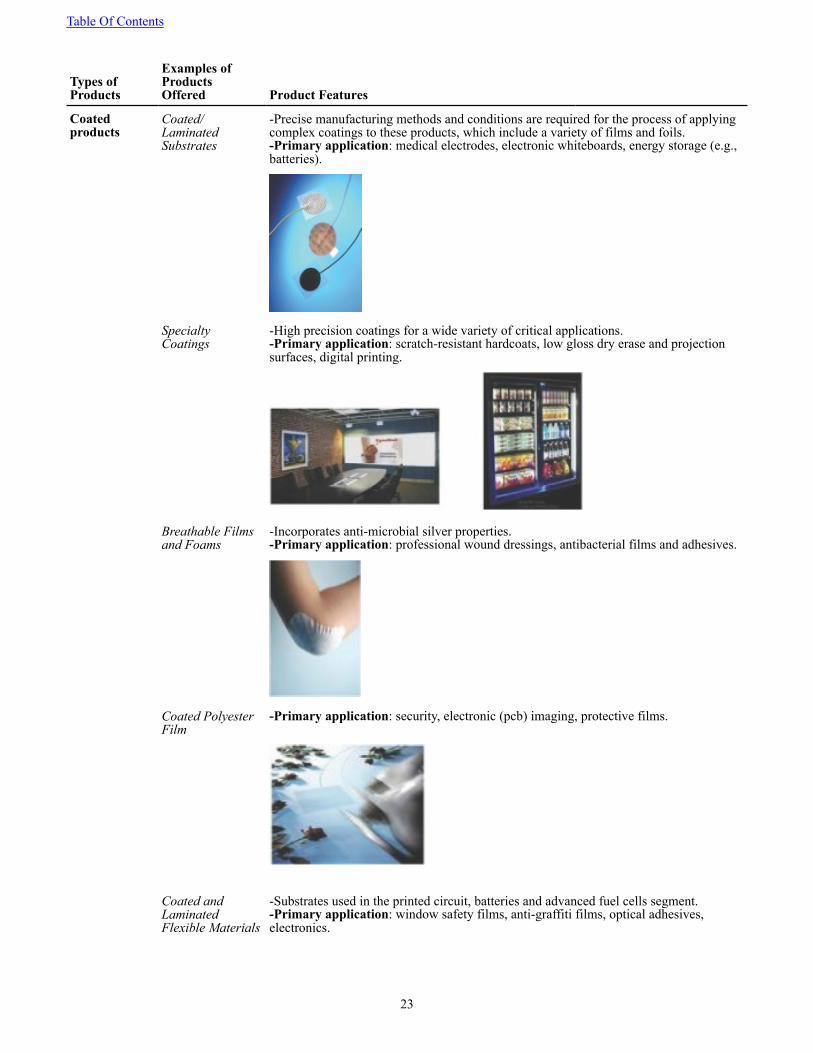
Table Of Contents
23
Types ofProducts
Examples ofProductsOffered Product Features
Coatedproducts
Coated/LaminatedSubstrates
-Precise manufacturing methods and conditions are required for the process of applying complex coatings to these products, which include a variety of films and foils.-Primary application: medical electrodes, electronic whiteboards, energy storage (e.g., batteries).
SpecialtyCoatings
-High precision coatings for a wide variety of critical applications.-Primary application: scratch-resistant hardcoats, low gloss dry erase and projection surfaces, digital printing.
Breathable Filmsand Foams
-Incorporates anti-microbial silver properties.-Primary application: professional wound dressings, antibacterial films and adhesives.
Coated PolyesterFilm
-Primary application: security, electronic (pcb) imaging, protective films.
Coated andLaminatedFlexible Materials
-Substrates used in the printed circuit, batteries and advanced fuel cells segment.-Primary application: window safety films, anti-graffiti films, optical adhesives, electronics.
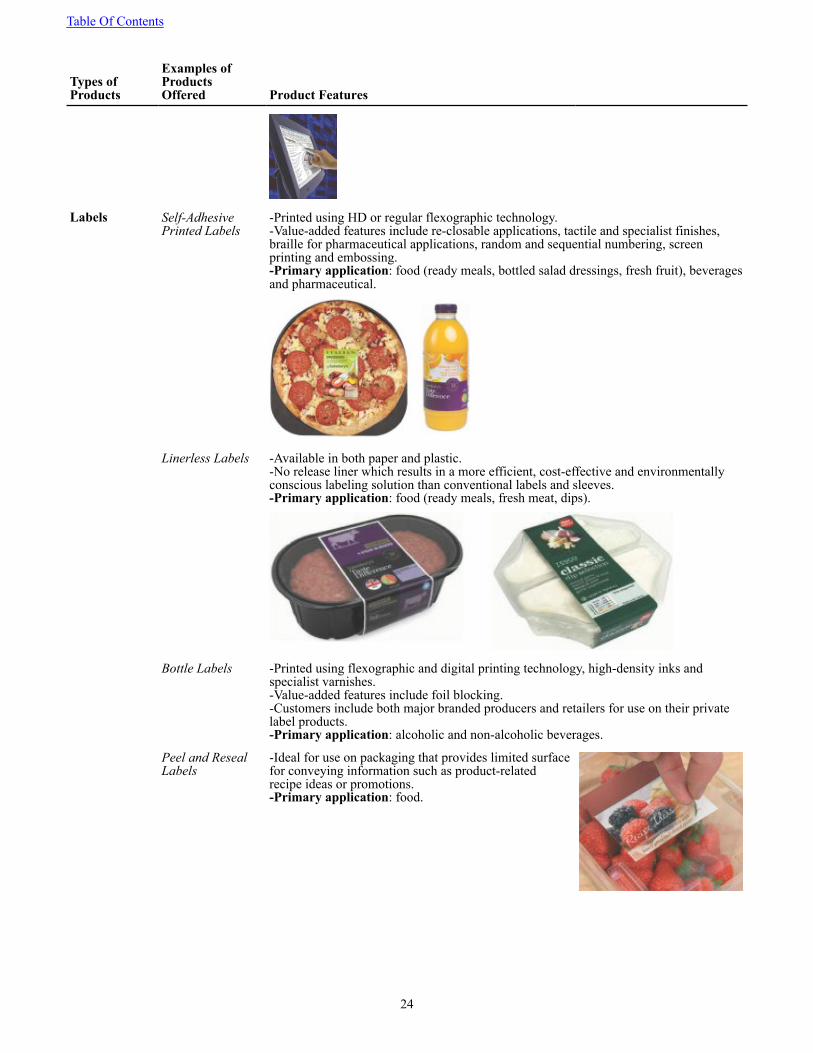
Table Of Contents
24
Types ofProducts
Examples ofProductsOffered Product Features
Labels Self-AdhesivePrinted Labels
-Printed using HD or regular flexographic technology.-Value-added features include re-closable applications, tactile and specialist finishes, braille for pharmaceutical applications, random and sequential numbering, screen printing and embossing.-Primary application: food (ready meals, bottled salad dressings, fresh fruit), beverages and pharmaceutical.
Linerless Labels -Available in both paper and plastic.-No release liner which results in a more efficient, cost-effective and environmentally conscious labeling solution than conventional labels and sleeves.-Primary application: food (ready meals, fresh meat, dips).
Bottle Labels -Printed using flexographic and digital printing technology, high-density inks and specialist varnishes.-Value-added features include foil blocking.-Customers include both major branded producers and retailers for use on their private label products.-Primary application: alcoholic and non-alcoholic beverages.
Peel and ResealLabels
-Ideal for use on packaging that provides limited surface for conveying information such as product-related recipe ideas or promotions.-Primary application: food.
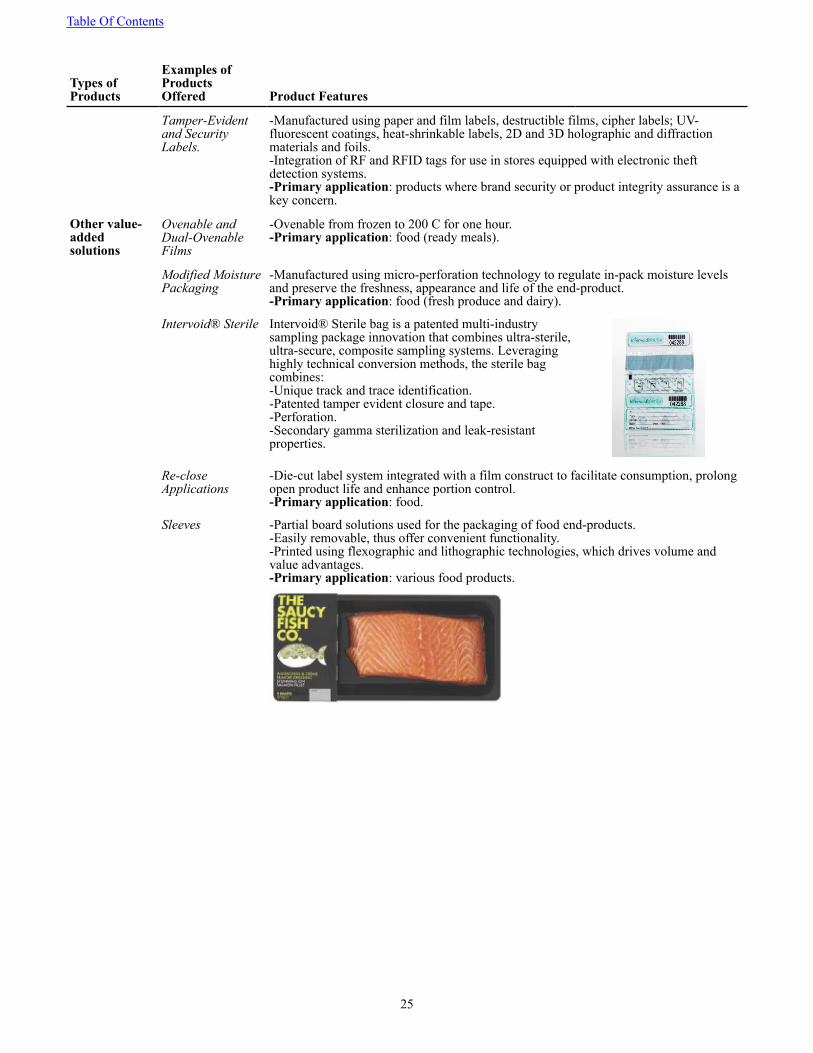
Table Of Contents
25
Types ofProducts
Examples ofProductsOffered Product Features
Tamper-Evidentand SecurityLabels.
-Manufactured using paper and film labels, destructible films, cipher labels; UV-fluorescent coatings, heat-shrinkable labels, 2D and 3D holographic and diffraction materials and foils.-Integration of RF and RFID tags for use in stores equipped with electronic theft detection systems.-Primary application: products where brand security or product integrity assurance is a key concern.
Other value-addedsolutions
Ovenable andDual-OvenableFilms
-Ovenable from frozen to 200 C for one hour.-Primary application: food (ready meals).
Modified MoisturePackaging
-Manufactured using micro-perforation technology to regulate in-pack moisture levels and preserve the freshness, appearance and life of the end-product.-Primary application: food (fresh produce and dairy).
Intervoid® Sterile Intervoid® Sterile bag is a patented multi-industry sampling package innovation that combines ultra-sterile, ultra-secure, composite sampling systems. Leveraging highly technical conversion methods, the sterile bag combines:-Unique track and trace identification.-Patented tamper evident closure and tape.-Perforation.-Secondary gamma sterilization and leak-resistant properties.
Re-closeApplications
-Die-cut label system integrated with a film construct to facilitate consumption, prolong open product life and enhance portion control.-Primary application: food.
Sleeves -Partial board solutions used for the packaging of food end-products.-Easily removable, thus offer convenient functionality.-Printed using flexographic and lithographic technologies, which drives volume and value advantages.-Primary application: various food products.
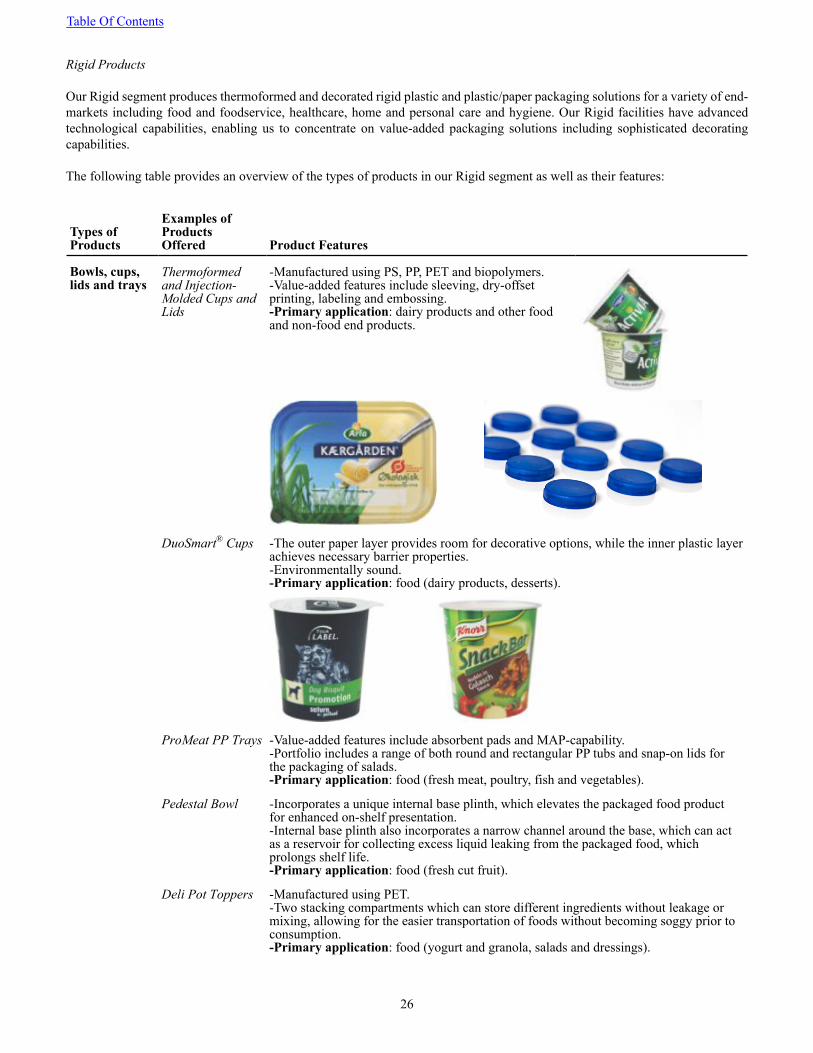
Table Of Contents
26
Rigid Products
Our Rigid segment produces thermoformed and decorated rigid plastic and plastic/paper packaging solutions for a variety of end-markets including food and foodservice, healthcare, home and personal care and hygiene. Our Rigid facilities have advanced technological capabilities, enabling us to concentrate on value-added packaging solutions including sophisticated decorating capabilities.
The following table provides an overview of the types of products in our Rigid segment as well as their features:
Types ofProducts
Examples ofProductsOffered Product Features
Bowls, cups,lids and trays
Thermoformedand Injection-Molded Cups andLids
-Manufactured using PS, PP, PET and biopolymers.-Value-added features include sleeving, dry-offset printing, labeling and embossing.-Primary application: dairy products and other food and non-food end products.
DuoSmart® Cups -The outer paper layer provides room for decorative options, while the inner plastic layer achieves necessary barrier properties.-Environmentally sound.-Primary application: food (dairy products, desserts).
ProMeat PP Trays -Value-added features include absorbent pads and MAP-capability.-Portfolio includes a range of both round and rectangular PP tubs and snap-on lids for the packaging of salads.-Primary application: food (fresh meat, poultry, fish and vegetables).
Pedestal Bowl -Incorporates a unique internal base plinth, which elevates the packaged food product for enhanced on-shelf presentation.-Internal base plinth also incorporates a narrow channel around the base, which can act as a reservoir for collecting excess liquid leaking from the packaged food, which prolongs shelf life.-Primary application: food (fresh cut fruit).
Deli Pot Toppers -Manufactured using PET.-Two stacking compartments which can store different ingredients without leakage or mixing, allowing for the easier transportation of foods without becoming soggy prior to consumption.-Primary application: food (yogurt and granola, salads and dressings).
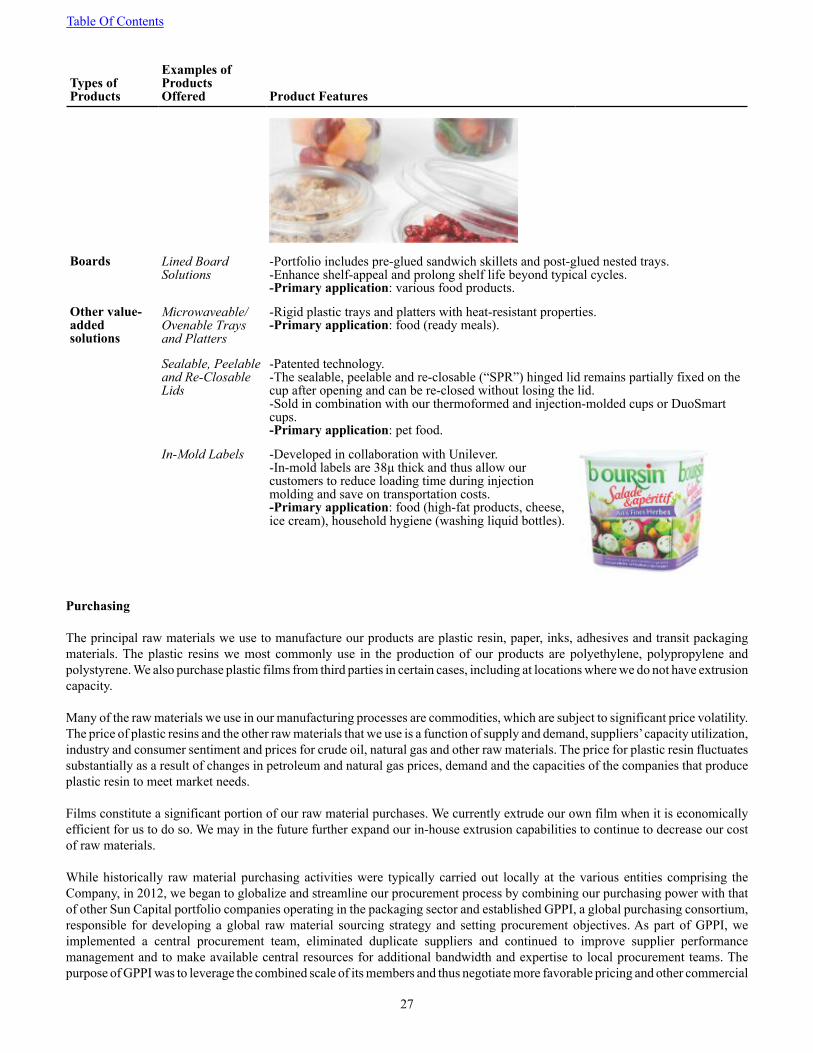
Table Of Contents
27
Types ofProducts
Examples ofProductsOffered Product Features
Boards Lined BoardSolutions
-Portfolio includes pre-glued sandwich skillets and post-glued nested trays.-Enhance shelf-appeal and prolong shelf life beyond typical cycles.-Primary application: various food products.
Other value-addedsolutions
Microwaveable/Ovenable Traysand Platters
-Rigid plastic trays and platters with heat-resistant properties.-Primary application: food (ready meals).
Sealable, Peelableand Re-ClosableLids
-Patented technology.-The sealable, peelable and re-closable (“SPR”) hinged lid remains partially fixed on the cup after opening and can be re-closed without losing the lid.-Sold in combination with our thermoformed and injection-molded cups or DuoSmart cups.-Primary application: pet food.
In-Mold Labels -Developed in collaboration with Unilever.-In-mold labels are 38µ thick and thus allow our customers to reduce loading time during injection molding and save on transportation costs.-Primary application: food (high-fat products, cheese, ice cream), household hygiene (washing liquid bottles).
Purchasing
The principal raw materials we use to manufacture our products are plastic resin, paper, inks, adhesives and transit packaging materials. The plastic resins we most commonly use in the production of our products are polyethylene, polypropylene and polystyrene. We also purchase plastic films from third parties in certain cases, including at locations where we do not have extrusion capacity.
Many of the raw materials we use in our manufacturing processes are commodities, which are subject to significant price volatility. The price of plastic resins and the other raw materials that we use is a function of supply and demand, suppliers’ capacity utilization, industry and consumer sentiment and prices for crude oil, natural gas and other raw materials. The price for plastic resin fluctuates substantially as a result of changes in petroleum and natural gas prices, demand and the capacities of the companies that produce plastic resin to meet market needs.
Films constitute a significant portion of our raw material purchases. We currently extrude our own film when it is economically efficient for us to do so. We may in the future further expand our in-house extrusion capabilities to continue to decrease our cost of raw materials.
While historically raw material purchasing activities were typically carried out locally at the various entities comprising the Company, in 2012, we began to globalize and streamline our procurement process by combining our purchasing power with that of other Sun Capital portfolio companies operating in the packaging sector and established GPPI, a global purchasing consortium, responsible for developing a global raw material sourcing strategy and setting procurement objectives. As part of GPPI, we implemented a central procurement team, eliminated duplicate suppliers and continued to improve supplier performance management and to make available central resources for additional bandwidth and expertise to local procurement teams. The purpose of GPPI was to leverage the combined scale of its members and thus negotiate more favorable pricing and other commercial
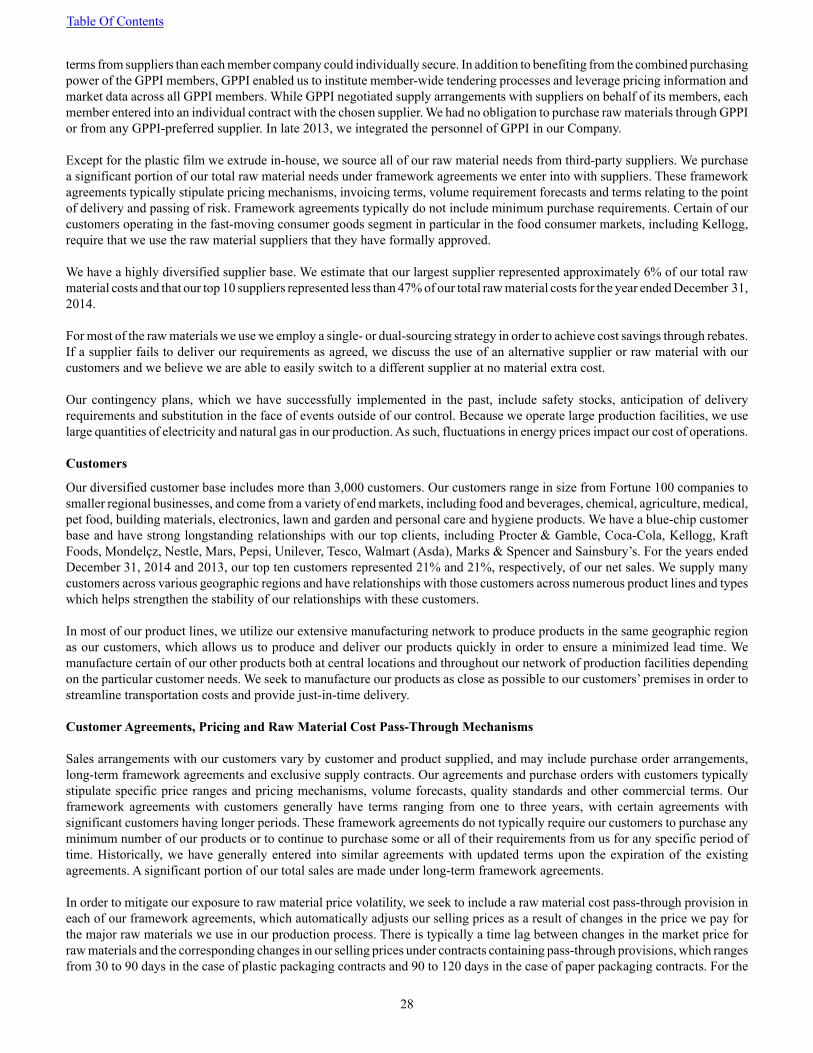
Table Of Contents
28
terms from suppliers than each member company could individually secure. In addition to benefiting from the combined purchasing power of the GPPI members, GPPI enabled us to institute member-wide tendering processes and leverage pricing information and market data across all GPPI members. While GPPI negotiated supply arrangements with suppliers on behalf of its members, each member entered into an individual contract with the chosen supplier. We had no obligation to purchase raw materials through GPPI or from any GPPI-preferred supplier. In late 2013, we integrated the personnel of GPPI in our Company.
Except for the plastic film we extrude in-house, we source all of our raw material needs from third-party suppliers. We purchase a significant portion of our total raw material needs under framework agreements we enter into with suppliers. These framework agreements typically stipulate pricing mechanisms, invoicing terms, volume requirement forecasts and terms relating to the point of delivery and passing of risk. Framework agreements typically do not include minimum purchase requirements. Certain of our customers operating in the fast-moving consumer goods segment in particular in the food consumer markets, including Kellogg, require that we use the raw material suppliers that they have formally approved.
We have a highly diversified supplier base. We estimate that our largest supplier represented approximately 6% of our total raw material costs and that our top 10 suppliers represented less than 47% of our total raw material costs for the year ended December 31, 2014.
For most of the raw materials we use we employ a single- or dual-sourcing strategy in order to achieve cost savings through rebates. If a supplier fails to deliver our requirements as agreed, we discuss the use of an alternative supplier or raw material with our customers and we believe we are able to easily switch to a different supplier at no material extra cost.
Our contingency plans, which we have successfully implemented in the past, include safety stocks, anticipation of delivery requirements and substitution in the face of events outside of our control. Because we operate large production facilities, we use large quantities of electricity and natural gas in our production. As such, fluctuations in energy prices impact our cost of operations.
Customers
Our diversified customer base includes more than 3,000 customers. Our customers range in size from Fortune 100 companies to smaller regional businesses, and come from a variety of end markets, including food and beverages, chemical, agriculture, medical, pet food, building materials, electronics, lawn and garden and personal care and hygiene products. We have a blue-chip customer base and have strong longstanding relationships with our top clients, including Procter & Gamble, Coca-Cola, Kellogg, Kraft Foods, Mondelçz, Nestle, Mars, Pepsi, Unilever, Tesco, Walmart (Asda), Marks & Spencer and Sainsbury’s. For the years ended December 31, 2014 and 2013, our top ten customers represented 21% and 21%, respectively, of our net sales. We supply many customers across various geographic regions and have relationships with those customers across numerous product lines and types which helps strengthen the stability of our relationships with these customers.
In most of our product lines, we utilize our extensive manufacturing network to produce products in the same geographic region as our customers, which allows us to produce and deliver our products quickly in order to ensure a minimized lead time. We manufacture certain of our other products both at central locations and throughout our network of production facilities depending on the particular customer needs. We seek to manufacture our products as close as possible to our customers’ premises in order to streamline transportation costs and provide just-in-time delivery.
Customer Agreements, Pricing and Raw Material Cost Pass-Through Mechanisms
Sales arrangements with our customers vary by customer and product supplied, and may include purchase order arrangements, long-term framework agreements and exclusive supply contracts. Our agreements and purchase orders with customers typically stipulate specific price ranges and pricing mechanisms, volume forecasts, quality standards and other commercial terms. Our framework agreements with customers generally have terms ranging from one to three years, with certain agreements with significant customers having longer periods. These framework agreements do not typically require our customers to purchase any minimum number of our products or to continue to purchase some or all of their requirements from us for any specific period of time. Historically, we have generally entered into similar agreements with updated terms upon the expiration of the existing agreements. A significant portion of our total sales are made under long-term framework agreements.
In order to mitigate our exposure to raw material price volatility, we seek to include a raw material cost pass-through provision in each of our framework agreements, which automatically adjusts our selling prices as a result of changes in the price we pay for the major raw materials we use in our production process. There is typically a time lag between changes in the market price for raw materials and the corresponding changes in our selling prices under contracts containing pass-through provisions, which ranges from 30 to 90 days in the case of plastic packaging contracts and 90 to 120 days in the case of paper packaging contracts. For the
Table Of Contents
29
years ended December 31, 2014 and 2013, a significant portion of our sales were made under framework agreements or purchase orders that contain a raw material cost pass-through provision.
Unless otherwise contractually agreed, our ability to pass through changes in the market price for raw materials is generally subject to competitive market conditions at that time. As raw material prices rise, we seek to immediately update our internal quote management system used in connection with purchase orders to reflect these changes. These updates ensure that changes are quickly fed through to our sales teams in charge of negotiating our purchase order contracts. In addition, our purchasing strategy includes an effort to take advantage of seasonal pricing variations.
Research and Development, Patents, Trademarks and Licenses
Our innovation and research and development capabilities are a key element of our success. As a result, we are required to continuously invest in innovation and research and development as well as capital expenditures to update our facilities with the equipment needed to produce new products. We work with our customers to develop new products in connection with their product launches and we also organically develop products to sell to our existing customers. Periods in which we and our customers have successfully anticipated trends generally have had more favorable results. If a release is successful, this will have a positive impact on our sales until consumer preferences change or until those items are replaced by new items. If the product is not successful, we will not be able to fully load our lines and our operating results will be negatively impacted temporarily. A majority of research and development efforts in the plastic packaging space are currently devoted to innovations that help to differentiate products, such as convenience packaging, improved barrier protection, packaging design initiatives, smart packaging, and environmentally-friendly alternatives. Our ability to accurately predict consumer trends and needs and focus our development efforts accordingly will impact our product sales.
We consider innovation and research and development to be a key factor in the success of our product offerings. Technicians employed by our product development and process engineering organization, together with our operations, marketing and sales teams, work closely with current and potential customers to develop customized products that meet their specific performance requirements and to assist them in processing our products on their machinery. In addition, we work closely with some key suppliers, especially on additives and specialty polymers, to develop products that offer differentiation to our customers’ end products. We believe that continued research and development activities in innovation, rationalization and automation will help to ensure that we maintain a leading position in product and production technology.
Our research and development capabilities are currently located in different centers based on our various businesses. Our most significant innovation centers are located at Stanley, United Kingdom, Zell, Germany, Menasha, Wisconsin, and Halle, Germany, and our graphics design centers are located in Menasha, Wisconsin and Spalding, United Kingdom. As part of the integration of our businesses during the past two years, we have sought to streamline our R&D capabilities in order to provide for company-wide support where possible. For example, we developed our Duralite technology, which allows our customers to heavily down-gauge shrink film, in Europe, and later proceeded to introduce the same technology in our North American operations, which we believe will give us a competitive advantage in the region. Further, we introduced our peel and reseal technology in the processed meat and cheese packaging markets in Europe and leveraged our expertise to bring the same technology to our U.S. customers. We plan to continue the integration of our R&D capabilities, and to share product developments and best practices throughout our group. We believe that this will allow us to create a more efficient R&D structure that can leverage our scale to develop products that meet and anticipate our customers’ needs. As a result of the Combination, we have additional technical capabilities in different regions of the world, which are beneficial to offer a complete suite of packaging solutions to our clients, to help reduce costs and to expedite services and product delivery for our customers.
We are able to use our broad product offerings and state-of-the-art technology to transfer technological innovations from one end market to another. For example, our expertise in producing zippered stand-up pouches for the food consumer market has helped us to develop and commercialize a patented re-closable feature on multi-wall bags for pet food. We have also successfully developed our RAVE™ composite line of premade bags. Through unique substrate combinations these robust bags offer less damage to the retailer and lower overall cost for the packaged goods company.
Our policy is to protect all of our significant technologies by seeking patents and where appropriate, defending and enforcing our intellectual property rights. We believe that this strategy allows us to preserve the advantages of the products we sell and the technologies we use and license, and helps us to maximize the return on our investment in research and development. Our patents are granted in a number of jurisdictions worldwide, including in the United States, the United Kingdom and several other European countries.
Table Of Contents
30
When appropriate, we license a portion of the technology that we use in certain of our products. Our license agreements are typically non-exclusive.
Sales and Marketing
Our overall sales and marketing strategy is to deliver levels of quality, consistency, innovation, reliability and customer service that establishes us as a critical supplier to our customers, in particular in value-added market segments. We seek to provide innovative and customized products to customers. Our key differentiators include strong technical resources, customer service and support capabilities and broad geographic reach with large-scale production capabilities. It is critical in our industry to provide superior service, and therefore we approach sales and marketing with interdisciplinary teams comprised of a sales force with specialized product and market knowledge and research and development engineers who together coordinate sales and production activities to meet specific customer and market demands. Our engineers also provide customers with on-going technical assistance and advice concerning the most efficient method of processing of our packaging products on their machines. We believe that our full service, “one-stop-shop” resources enable us to provide industry-leading services and products to a wide range of customers, including international blue chip companies and smaller, regional accounts. Our scale enables us to dedicate certain sales and marketing efforts to particular products, customers or geographic regions, enabling us to develop expertise that is valued by our customers.
We strive to maintain close relationships with our customers, collaborating on technological advancements and demand planning. Historically, our individual businesses have conducted their own sales and marketing efforts and have managed their own relationships with their customers. As part of the integration of our businesses during the last two years, we have sought to manage our large customer relationships on a group-wide basis, in order to take advantage of cross-selling opportunities, while still maintaining valuable local relationships. Our sales representatives are currently generally divided between regional and national accounts. Regional representatives target smaller accounts, while national representatives focus on customers requiring service from multiple facilities. We have in the past maintained a single sales personnel and customer service contact with each customer except our large, multinational customers who, due to their organizational set-up, require several points of contact in the countries and regions in which they operate. We believe that this model facilitates clear communication and fosters close personal relationships. In connection with the Combination we are able to consolidate duplicative sales relationships so that we can have a single dedicated sales representative or team focused on selling products produced by our group, rather than a specific business unit, to our customers.
Our products consist of those that we develop ourselves, and market to our customers, and those that we develop in coordination with our customers to meet their specific product needs. We actively seek to identify and pursue joint development opportunities with customers, leveraging our market and technical expertise to meet customer needs, regardless of segment or packaging configuration. Certain of our product lines are highly specified to customers’ individual requirements, and as a result we are closely involved with our customers planning for new products. We believe these efforts enhance the integration of our business with our customers’ operations and position us as a critical supplier. As a part of these development opportunities, our manufacturing, engineering and food science personnel work closely with field sales personnel and customer service representatives to satisfy customers’ needs through the production of high-quality, value-added products and on-time deliveries. Certain of our clients operate in extensive regulatory frameworks and are required to subject their suppliers to long approval and qualification processes. We believe that switching suppliers would impose significant extra cost on these customers and that this constitutes a barrier to entry into our markets, strengthening our position as a critical supplier of our customers.
In addition to product development, our marketing teams are also responsible for establishing product pricing processes and metrics and margin management tools and measurements, developing innovation metrics and assessing new markets that offer growth prospects.
Our sales representatives are trained to focus on specific product categories, while maintaining a general familiarity with all of our products in order to take advantage of cross-selling opportunities. As a result, we believe that our sales personnel have developed a deep understanding of our product lines, in addition to the specific operations and needs of the individual customers that each representative services. We believe that this expertise enables us to cultivate new business, develop highly-effective partnering initiatives with key customers, meet or exceed customer needs and expectations as to product quality and innovation, and differentiate our products from those of our competition. For example, our labels business line in our Flexible segment is highly integrated with our customers, including a number of employees located at retailers’ sites where their primary responsibility is to carry out on-site project management. Each implanted employee serves as a single point of contact to the retailer and manages complex work streams such as supply chain arrangements on behalf of the retailer, thereby streamlining the production process. On-site project management carried out by our implanted employees also provides us additional customer access to cross-sell
Table Of Contents
31
other product lines. We believe we are well-positioned to continue to increase our market share as retailers and manufacturers look to consolidate supply chains to ensure reliability, quality and consistency of packaging material.
Manufacturing Operations, Production Facilities and Equipment
Our production facilities are located in 17 countries, including the United Kingdom, the United States, France, Germany, Hungary, Canada, Finland, Netherlands, Poland, Austria, Bulgaria, Egypt, Romania, Serbia, Turkey, China and Ukraine. We have 66 principal production facilities totaling approximately 900,000 square meters. We believe that our facilities are suitable and adequate for our business purposes for the foreseeable future.
We maintain an expansive array of packaging machinery and specialized equipment at our various facilities, which enables us to offer a wide variety of products and maintain a high degree of flexibility in meeting customer demands. Our diverse production capabilities allow us to serve a large portion of the packaging value chain and are a key element of our ability to serve as a “one-stop-shop” for our customers. Product conformance to customer standards is continually monitored and maintained by our supervisors and our key equipment and critical operations are administered by trained, experienced operators. Investments in equipment are driven by industry trends, developing technologies, customer needs and cost containment.
We use state of the art equipment at our production facilities to manufacture plastic products. Our key manufacturing technologies are known as “extrusion,” “lamination” and “coating.” In extrusion, plastic resins with various properties are blended with additives to create a specified performance compound, the nature of which is dependent on end-market use and customer preference. Blended resin compounds are then shaped under heat and pressure to create plastic sheet material or film. The manufacturing inputs and process, including the combination of resin and extrusion methods, may be varied to produce differences in color, clarity, tensile strength, toughness, thickness, shrinkability, surface friction, transparency, sealability and permeability. If a product needs the protection of more than a single plastic film, additional layers consisting of materials, such as oriented polyester or OPP, are bonded to it, in a lamination process. These materials are stiffer, harder to tear and heat sealable. The film layers are brought together by applying an adhesive or by extruding a layer of molten polymer to bind two film layers into one. Extruded plastic film, foil, and paper can be coated using slot die, direct gravure, reverse gravure and proprietary coating methods, using liquid crystal, exotic filled ceramics and polyamides, and some can be used over printed products for gloss, print protection or surface dynamic control. In most of our production facilities, we also have various types of printing capabilities that allows us to print directly on the products we produce, allowing us to provide an additional process in the value chain.
We use thermoforming, injection molding and blow molding techniques in the production of rigid plastic packaging. Thermoforming transforms thermoplastic sheet material into a new geometry using heat to soften the material and forcing it into or onto a mold where it is cooled and “frozen” into the new geometry. Injection molding is the technique of injecting molten plastic into a cold mold and forming a part. Blow molding is the technique of injecting plastic material into a tube and then using pressurized air to conform it to a required hollow shape.
We employ a wide variety of other production processes that allow us to meet a wide range of customer needs.
In recent years as we have acquired the entities that comprise the Company, we have continuously expanded our manufacturing footprint and improved our operational efficiency and streamlined our broader business. We will continue to improve our manufacturing footprint now that we have integrated our businesses in the Combination. Our improvement plan includes evaluating the rationalization of our production facilities, capital investments to reduce production costs, manufacturing technology development, targeted sales growth projects and pricing-point improvements, with a focus on projects we believe would return our investment within three years or less. Also, we have upgraded the operating processes at each of our facilities, reducing our fixed costs and improving our profit margins. We plan to undertake similar upgrades at other facilities now that we have integrated our businesses following the Combination. We develop and maintain our facilities with modern equipment and extensive technical capabilities. Our production lines are developed with industry leading machine suppliers and assemblers, and in many cases, our own specialist engineers carry out extensive customization of the base equipment to create a proprietary manufacturing process. We perform on-going and regularly scheduled maintenance on each of our facilities and since being acquired by Sun Capital, we have not experienced any unplanned plant shut-down or material interruption in our operations due to equipment failures that affected our customers.
Our customers are increasingly expanding their global presence and rely on us to provide regional or local supply solutions, and as a result we believe the Combination allows us to solidify our position as a key supplier to those global customers. Our ability to manufacture products in various regions allows us to serve markets where delivery times and transportation and other costs such as import duties may be prohibitive. We believe that we have a flexible manufacturing base that allows us to effectively respond to changing customer needs, for example by modifying production lines in response to customer specifications.
Table Of Contents
32
Logistics
Our products are generally delivered to our customers using third-party transportation and warehousing providers. We believe this arrangement allows us to limit the capital commitment required to maintain our own distribution capabilities, such as a transportation fleet and distribution warehouses and to minimize the time required for us to deliver our products to our customers.
We manufacture products for some of our customers based on their purchase orders, thereby removing the need to hold any significant inventory. Finished products for these customers are typically shipped immediately following production. For some of our retailer customers, we receive a binding seasonal order plan and we deliver finished products on a weekly or monthly basis based on purchase orders submitted by these customers in fulfillment of the order plan. We produce the products set forth in the seasonal order plan in a manner that is designed to maximize our production efficiency and, accordingly, in most cases the production for our retailer customers is “made for stock.” Our retailer customers are obliged to pay for the stock that has been produced to satisfy their order plan, whether or not they request the products be delivered. We maximize our flexibility and service level offered to our retailer customers by using a mixture of leased warehouses and warehouses operated by third parties and by engaging third party transport companies to transport products from our manufacturing plants to the relevant warehouse, and to then deliver such products to our retailer customers upon receipt of their purchase orders.
Insurance
We maintain comprehensive insurance policies with respect to property damage, business interruption, employers’ liability, public and product liability, recall, workers’ compensation and contract works. All of our policies are underwritten with reputable insurance providers, and we conduct periodic reviews of our insurance coverage, both in terms of coverage limits and deductibles. We believe that we maintain a level of insurance that is appropriate for the risks of our business and is comparable to that maintained by other companies in the packaging industry.
Employees
As of December 31, 2014, we had 9,825 employees worldwide, with 2,390 in North America, 3,923 in Europe, 2,969 in the United Kingdom and 543 in the Middle East and China.
In Europe, our employees in the United Kingdom, France, Germany, Poland, Finland and the Netherlands are represented by trade unions or works councils. In the United States, as of December 31, 2014, 484 of our employees were covered by five separate collective bargaining agreements with various expiration dates up through February 2017. For a description of our pension obligations, see “Management’s Discussion and Analysis of Financial Condition and Results of Operations-Liquidity, Liabilities and Financing Agreements-Pension Plans.”
Historically, we have enjoyed good labor relations and we are committed to maintaining these relationships. There have been no work stoppages or strikes at any of our facilities during the past five years. We take a constructive approach to union relationships where there are unionized facilities, and have been able to secure the cooperation of our unions and our workforce with regard to significant changes at those facilities.
We continuously invest in training our employees on all levels to ensure they increase production efficiency by becoming acquainted with the latest manufacturing technologies. Training is custom-developed and is typically organized on-site at each of our production facilities. When new technology is installed at a facility, our relevant employees undertake training at one of our other facilities where such technology is already installed and operating. We have also established an employee development program in order to identify and foster high-potential employees and to build a talent pool of potential future management.
Legal Proceedings
In the normal course of business, we are party to various lawsuits, legal proceedings and claims arising out of our business. We cannot predict the outcome of these lawsuits, legal proceedings and claims with certainty. However, we believe that the outcome of any existing or known threatened proceedings, even if determined adversely, would not have a material adverse effect on our financial condition. The most significant of these proceedings of which we are aware is listed below.
Huhtamaki France S.A.S. European Commission Investigation
Table Of Contents
33
Two of our subsidiaries Paccor France S.A.S. (formerly known as Huhtamaki France S.A.S. and now Coveris Rigid (Auneau) France S.A.S.) and Island Lux S.a.r.l. & Partners S.C.A. ("Island Lux SCA"), received a Statement of Objections from the European Commission on September 28, 2012, alleging that Paccor France S.A.S. participated in a cartel involving foam trays used for retail food packaging between September 3, 2004 and June 19, 2006. In the Statement of Objections, which constitutes an intermediate step in the proceedings, the European Commission indicated that it intends to levy a fine against the addressees of the Statement of Objections, including Coveris Rigid (Auneau) France S.A.S. Proceedings regarding this matter are currently pending and no decision has been taken so far by the EU Commission authority. We have been advised that the Competition authority expects to issue a decision in the first half of 2015. Coveris believes that any fine levied upon Coveris Rigid (Auneau) France S.A.S. would be indemnified by Huhtamaki Oyj, the previous owner of the company, under the Sale and Purchase Agreement dated September 22, 2010. The claim has been accepted by Huhtamaki Oyj by fax dated October 9, 2012 and the defense is being handled by Huhtamaki. Should Huhtamaki fail to fulfill its obligations under the indemnity granted to us, or should the indemnity be unenforceable, our business, results of operations, financial condition or cash flow could be materially adversely affected.
The Company has not recorded any contingent liability related to this matter as this contingency is not probable and estimable due to the underlying circumstances at this time.
Autobar Packaging Spain S.A. Price Fixing Allegations
In December 2013, Paccor Packaging Spain, S.A. (subsequently renamed Coveris Rigid Spain S.A., "Paccor Spain") received a demand letter from the counsel for SUCA, S.C.A. (“SUCA”) and Asociacion de Organizaciones de Productores de Frutas y Hortalizas de Almeria-Coexphal (“COEXPHAL”). The demand letter alleges that a Paccor Spain predecessor business, Autobar Packaging Spain S.A. (“Autobar”) participated in price fixing activities with respect to packaging products sold in Spain between 1999 and 2007. The Autobar business was sold as a going concern to Group Guillin in 2006 and was contributed into Group Guillin’s subsidiary, Veripack. The demand letter claims damages “preliminarily estimated” at €13,500,000 (made against all cartel participants and not just Paccor Spain), together with interest and costs.
The demand letter also referenced a second legal action pending before an Italian court in Bologna, Italy, and notified Paccor Spain that SUCA has named Paccor Spain as a co-defendant in the Italian action, on the basis of a decision rendered by the Spanish Competition Authority (“CNC”) in 2011 stating that price-fixing activities have been undertaken by some parties, including Veripack, the successor of the relevant business unit of Paccor Spain. Coveris purchased Autobar in May 2013, without the business unit allegedly involved in the Cartel, which had been transferred to Group Guillin/Veripack. Under Spanish law, which Coveris believes should apply since all the companies allegedly damaged by the cartel are Spanish entities, a one-year term of limitation applies to tort claims. The CNC decision was rendered on December 2, 2011 and the first request for damages addressed to Paccor Spain was dated November 28, 2013, after the limitation period had expired. Under Spanish law there is no longer any possibility for the damaged parties to include Paccor Spain in the proceedings or request for damages. However, in the Bologna, Italy proceedings, SUCA and COEXPHAL are alleging that Italian law should apply, under which the term of limitations is 5 years. On January 23, 2014, Paccor Spain received formal notice of the Italian action. A hearing on this matter was held in November 2014, in which we raised (a) procedural objections, (b) objections on the merits, (c) an indemnity claim against Groupe Guillin and Veripack on ground that they should be held exclusively liable for any possible damage since they are the exclusive successors of the Autobar business unit allegedly involved in the Cartel, and (d) alternatively, an action in recourse against all Cartelists. Groupe Guillin and Veripack have denied any liability and made an indemnity claim against Coveris on the grounds that Coveris, being the successor to Autobar, should be held exclusively liable for the whole period investigated by the CNC. The other cartelists have also claimed an action in recourse against Coveris.
Since some of the summoned parties did not appear before the Court, the Judge directed separate proceedings. Accordingly our indemnity claim against Groupe Guillin and Veripack, as well as our action in recourse against the other cartelist which have appeared in the Bologna proceedings remain part of the main proceedings while our action in recourse against those cartelists that have not appeared will be subject to separate proceedings. The Judge set a briefing schedule through March 30, 2015 and a hearing date of May 13, 2015.
Coveris Spain was sold to a third party on July 22, 2014. An indemnification/guarantee has been granted to the Purchaser of Coveris Spain by both Coveris Holdings SA and Coveris Rigid Polska (formerly, Paccor Polska) for any losses and costs arising from the SUCA claim, and the Coveris Group remains responsible for handling the defense in this case. Any imposition of fines or damage awards and expenses which would invoke the indemnity granted by the Group, could have a material adverse effect on our business, results of operations, financial condition or cash flow.
The Company has not recorded any contingent liability related to this matter as this contingency is not probable and estimable due to the underlying circumstances at this time.
Table Of Contents
34
PerfoTec BV
On December 29, 2014, Coveris Flexibles US LLC received notice that PerfoTec BV had filed a suit in The Netherlands (District Court of the Hague) against Coveris Flexibles US LLC (“Coveris US”), Coveris Germany Holding GmbH and Coveris Flexibles Deutschland GmbH (together with Coveris Germany Holding GmbH, “Coveris Germany”). The complaint alleges breach of two license agreements signed by each of Coveris US and Coveris Germany, as well as several purchase order confirmations issued by PerfoTec but not signed by Coveris US or Coveris Germany (collectively, the “License and Purchase Agreements”). Specifically, PerfoTec alleges breach of the obligations of (i) Coveris US to pay EURO 200,000, representing the 50% unpaid balance for four PerfoTec systems, to be increased by statutory commercial interest as of June 1, 2013, (ii) Coveris Germany to pay EURO 70,000 for the purchase of a third PerfoTec laser, to be increased by statutory commercial interest as of June 1, 2013, and (iii) both Coveris US and Coveris Germany to comply with obligations to use commercially reasonable efforts to promote the PerfoTec laser system in conjunction with a packaging machine or converting machine, including promotion as a premium product at two significant trade shows each year for three years. PerfoTec alleges that it suffered damages of EURO 20 million because Coveris US and Coveris Germany failed to comply with their obligations under the license agreements. PerfoTec also seeks an order of specific performance for the defendants to comply with the License and Purchase Agreements (including the promotion obligations), subject to forfeiture of a penalty of EURO 1 million per day or partial day of non-compliance with the order, an unspecified amount to compensate for losses incurred by PerfoTec resulting from non-compliance with the License and Purchase Agreements, and an award of costs.
An initial hearing date has been set for April 1, 2015, at which time PerfoTec will file the full particulars of its claim. Our answer is expected to be due in mid-May 2015. Coveris believes that it has strong defenses to these claims and intends to fully defend against them.
The Company has not recorded any contingent liability related to this matter as this contingency is not probable and estimable due to the underlying circumstances at this time.
Regulatory Matters
Overview
Our businesses are highly regulated in all of the jurisdictions in which we operate. Our production facilities and operations are subject to both national and international regulatory regimes. In the member states of the European Union (the “Member States”), the regulatory environment of our business activities is shaped by EU directives and regulations, which are either implemented in the individual Member States through national legislation or have direct application to the states or individuals. In the United States, our facilities are subject to the local, state and federal laws and regulations of the U.S. federal government. Regulations that affect our operations mostly relate to areas of environmental protection, product safety and quality, occupational health and safety, industrial hygiene and plant safety.
Environmental, health and safety (“EHS”) laws and regulations govern our facilities and our operations, including: (i) the storage, handling and treatment of hazardous substances and wastes; (ii) water discharges; (iii) air emissions; (iv) human health and safety; (v) the clean-up and remediation of contaminated facilities; and (vi) the sale and use of the products we manufacture. Many of our operations require permits and controls to monitor or prevent pollution. We have incurred, and will continue to incur, substantial on-going capital and operating expenditures to ensure compliance with current and future EHS laws and regulations, which tend to become more stringent over time.
Our environmental management systems, are intended to ensure that we both comply with applicable environmental requirements and minimize environmental risk by promoting environmental protection activities and initiatives. We actively address legal and environmental compliance issues in connection with our operations and properties, and we believe that we have systems in place to ensure that environmental costs and liabilities will not have a material adverse impact on us. Nevertheless, estimates of future environmental costs and liabilities are inherently imprecise, and the imposition of new or unanticipated costs or obligations could have a material adverse effect on our business, financial condition or results of operations.
European Regulations
REACH Regulation and the Classification, Labeling and Packaging Regulation
Table Of Contents
35
The European Union requires control of the use of chemical products within the European Union by imposing on all affected industries the responsibility for ensuring and demonstrating the safe manufacture, use and disposal of chemicals. The Regulation on Registration, Evaluation, Authorization and Restriction of Chemical substances (the “REACH regulation”) requires the registration of all chemicals manufactured in or imported into the European Union (either alone, in mixtures or in articles) with the European Chemicals Agency (“ECHA”). The regulation requires formal documentation of the relevant data required for hazard assessments for each substance registered as well as development of risk assessments for their registered uses. Most uses of high hazard substances such as carcinogens will require authorization by ECHA.
In parallel with the REACH regulation, the European Union has adopted the Regulation on Classification, Labeling and Packaging of Substances and Mixtures (the “CLP regulation”) to harmonize the European Union’s system of classifying, labeling and packaging chemical substances with the United Nation’s Globally Harmonized System, an internationally-agreed tool for chemical hazard communication, incorporating harmonized chemical hazard classification criteria and provisions for standardized labels and safety data sheets. The CLP regulation is expected to further this objective by promoting regulatory efficiency. It introduces new classification criteria, hazard symbols and labeling phrases, while taking account of elements that are part of the current EU legislation.
We believe we are in material compliance with these regulations and are participating in a collaborative industry effort to comply with future requirements under these regulations. We are not required to register any raw materials. However, we require confirmation of registration under the REACH regulation from our suppliers. In addition, ECHA, depending on the outcome of its on-going and/or future analyses, may designate a few of the chemicals we use in our production processes as “substances of very high concern” and thereby require authorization and a strict safety evaluation for them under the REACH regulation. Our cost estimates assume that none of the chemicals we use in our production processes will be designated as a “substance of very high concern” under the REACH regulation.
EU Emissions Trading System
Our business is subject to the EU Emissions Trading System (the “EU ETS”), which is an EU-wide system of trading allowances that are issued by Member States to cover industrial greenhouse gas emissions and which has been implemented in Germany by the Greenhouse Gas Emission Trading Act (Treibhausemissionshandelsgesetz) (“TEHG”). Industrial facilities to which the EU ETS applies receive a certain number of allowances to emit greenhouse gases and must surrender one allowance for each ton of greenhouse gases emitted. Facilities that emit fewer tons of greenhouse gases than their allowances cover are able to sell the excess allowances in the open market, whereas those that emit more must buy additional allowances through the EU ETS. Phases I and II of the EU ETS covered emissions in calendar years 2005 to 2007, and 2008 to 2012, respectively, and the current Phase III covers the period from 2013 to 2020. None of our production facilities or operations is presently restricted pursuant to the EU ETS or TEHG.
Environmental Remediation and Closure Liabilities
Some of our facilities have an extended history of industrial chemical processing, storage and related activities. Under the requirements of permits granted under laws implementing the IPPC or IED Directives, we may be required to investigate and remediate contamination at facilities which we use or have used in the past, particularly if we close an operational facility. In connection with contaminated properties, as well as our operations generally, we also could be subject to claims by government authorities, individuals and other third parties seeking damages for alleged personal injury or property damage resulting from hazardous substance contamination or exposure caused by our operations, facilities or products.
Some of our facilities have been the subject of limited investigations for contamination in the past. Based on current knowledge of facility conditions and existing law and practice, we do not believe we currently have any material obligations or costs for investigation or remediation activities at our facilities. Nevertheless, the discovery of previously unknown contamination, or the imposition of new obligations to investigate or remediate contamination at our facilities, could result in substantial unanticipated costs. While we are protected by contractual indemnities from prior owners or operators against some remediation costs related to known contamination, we cannot guarantee that we will be able to recover under such indemnity provisions in all cases. We could be required to establish or substantially increase financial reserves for such obligations or liabilities and, if we fail to accurately predict the amount or timing of such costs, the related impact on our business, financial condition or results of operations in any period in which those costs need to be incurred could be material.
Laws and regulations of many of the jurisdictions in which we operate oblige us to prevent contamination of the soil by taking adequate precautions. The competent authorities may require each of the persons responsible to take remediation measures, or do so themselves, placing the costs for such action on the person responsible.
Table Of Contents
36
Food Packaging Regulation
Our products are subject to the European Commission Regulation on Plastic Materials and Articles Intended to Come into Contact with Food (Regulation (EU) No 10/2011) (the “Food Packaging Regulation”), which is directly applicable to all Member States without transposition into national law. This regulation establishes specific requirements for the manufacture and marketing of plastic materials and articles that are intended to come into contact with food, are already in contact with food or can reasonably be expected to come into contact with food. The Food Packaging Regulation sets out the rules to follow in order to be able to launch food packaging products on the market. Many of these rules originate from rules under pre-existing EU regulations including, among others, the provisions of Regulation (EC) No 1935/2004 on intended and foreseeable use, the labeling requirements set out in Regulation (EC) No 1935/2004, the traceability requirements set out in Regulation (EC) No 1935/2004 and the “good manufacturing practice” requirements as set out in Commission Regulation (EC) No 2023/2006.
The Food Packaging Regulation sets out a list of authorized substances (some of which, due to specific restrictions, must be of a specific purity and quality) which may be used in the manufacture of plastic layers in plastic materials and articles. Additionally, plastic materials and articles must not transfer their constituents to food in quantities exceeding the specific migration limits, as provided by the Food Packaging Regulation.
U.S. Regulations
Toxic Substances
The Toxic Substances Control Act (the “TSCA”), is designed to ensure that chemicals manufactured, imported, processed, or distributed in commerce, or used or disposed of in the United States do not pose unreasonable risks to human health or the environment. The TSCA registry, maintained by the U.S. Environmental Protection Agency (“EPA”), lists over 83,000 covered chemicals; chemicals not listed on the TSCA registry or otherwise exempted cannot be imported into or sold in the United States until registered with the EPA. The TSCA sets forth specific reporting, record-keeping, and testing rules for chemicals (including requirements for the import and export of certain chemicals), as well as other restrictions relevant to our business.
Pursuant to the TSCA, the EPA from time to time issues “Significant New Use Rules” when it identifies new uses of chemicals that could pose risks. Any manufacturer, importer, processor, or distributor of a chemical substance or mixture who has information reasonably suggesting a substantial risk of injury to health or the environment is required to notify the EPA immediately.
There have been proposals in the United States to enhance the requirements under the TSCA to register and analyze the safety of substances and chemicals such as those we use in our production processes. If finalized, these proposals could result in an obligation to demonstrate that the health or environmental risks of the substances we handle and process are adequately controlled.
Contamination
The Comprehensive Environmental Response, Compensation, and Liability Act (“CERCLA”) and similar state laws govern the investigation and remediation of contaminated sites and establish strict, joint and several liability for site owners and individuals and entities responsible for disposing of or releasing hazardous substances at, or operating, such sites. In some cases, a party that sent waste to a contaminated site can be held liable for the entire cost of remediation regardless of fault, the lawfulness of disposal or the actions of other parties. CERCLA also requires certain facilities to maintain a minimum level of financial responsibility for accidents.
Food Packaging Regulation
The Food and Drug Administration (“FDA”) regulates the material content of direct-contact food and drug packages, including certain packages we manufacture pursuant to the Federal Food, Drug and Cosmetics Act. Certain of our products are also regulated by the Consumer Product Safety Commission (“CPSC”) pursuant to various federal laws, including the Consumer Product Safety Act and the Poison Prevention Packaging Act. Both the FDA and the CPSC can require the manufacturer of defective products to repurchase or recall such products and may also impose fines or penalties on the manufacturer. Similar laws exist in some states and cities. In addition, laws exist in certain states restricting the sale of packaging with certain levels of heavy metals, imposing fines and penalties for non-compliance. Although we use FDA approved resins and pigments in our products that directly contact food and drug products and believe our products are in material compliance with all applicable FDA regulations and other requirements, we remain subject to the risk that our products could be found not to be in compliance with such requirements.
Table Of Contents
37
Canadian Regulations
Our Canadian facilities are subject to Canadian federal and provincial legislation and to municipal (local) by-laws covering human health and safety and the protection of the environment. Federal regulations generally address these matters at the international, national or inter-provincial level but also deal with the protection of certain navigable waters and other matters within federal jurisdiction. The provinces take the lead at the operational level and so have the greatest day-to-day impact on environmental matter at our facilities. There is an attempt to harmonize federal and provincial regulations but often the effect is cumulative with the combined outcome often adding an addition level of regulatory oversight. Municipalities have powers granted by the provinces to ratify local nuisance, water and sewage and waste by-laws.
Federally, amongst the laws to which our facilities are subject are the Canadian Environmental Protection Act, under which is found the National Pollutant Reporting Release Inventory (“NPRI”) requirements and the New Substance Notification Regulations; the Fisheries Act, which addresses the protection of fish habitat; and the Transportation of Dangerous Goods Act, which deals with the trans-border or inter-provincial shipment of dangerous goods.
Our Ontario facilities are subject to the Environmental Protect Act (“EPA”), which regulates the discharge of all contaminants into the natural environment through directly prohibiting the release of any contaminant or by limiting or approving the release of a contaminant. For example, the industrial emission of Nitrogen Oxides and Sulphur Oxides are regulated under Ontario Regulation (“O. Reg.”) 194/05 and ozone depleting substances and other halocarbons are regulated under O. Reg. 463/10. The discharge of contaminants to air are generally regulated under O. Reg. 419/05 (Air Pollution - Local Air Quality) and discharges to surface waters are regulated by imposing effluent monitoring and effluent limits through a number of regulations dealing with different industrial sectors such as organic (O. Reg. 63/95) and inorganic (O. Reg. 64/95) chemical manufacturing and the pulp and paper (O.Reg. 760/93) sectors. The effluent monitoring and effluent limits regulations also impact what can be released to municipal sewers although local by-laws often place greater restrictions on what can be released into the municipal sewer system. The classification and any treatment or disposal of wastes are regulated under Regulation 347 (General-Waste Management), while the regulation of the transport and the treatment or disposal of the waste occurs by way of approvals issued under the EPA. Waste reduction and recycling is compelled by Ontario Regulations 101/94 (Recycling and Composting of Municipal Waste), 102/94 (Waste Audits and Waste Reduction Plans), 103/94 (Industrial, Commercial and Institutional Source Separation Program) and 104/94 (Packaging Audits and Packaging Reduction Plans), and is intended to be facilitated through the charging of “eco-fees” to producers to offset the costs of recycling under the proposed Waste Diversion Strategy Act. The Toxics Reduction Act, 2009, requires an annual assessment of the facility’s operations and the development of a plan to reduce the use of the same toxic substances that are reported under the federal NPRI. The Ontario Water Resources Act is intended to conserve, protect and manage Ontario’s waters by prohibiting the discharge of polluting materials where these could impair the quality of the water and prohibits or regulates the discharge of sewage and regulates the taking of groundwater. Ontario’s Dangerous Goods Transportation Act regulates the transportation and shipment of dangerous goods within Ontario and Ontario’s Occupational Health and Safety Act has the object of ensuring a safe and healthy workplace by means of a number regulations which regulate such workplace issues as worker exposure to chemical agents (Regulation 833), the identification and safe handling of designated substances, including asbestos (O. Reg. 278/05) and acrylonitrile, lead, mercury and silca (O.Reg. 490/09), and by implementing the Workplace Hazardous Materials Information System (WHMIS) (Regulation 860).
Table Of Contents
38
SECTION II(in thousands of U.S. dollars)
MANAGEMENT’S DISCUSSION AND ANALYSIS OF FINANCIAL CONDITION AND RESULTS OF OPERATIONS
Overview
This Management’s Discussion and Analysis of Financial Condition and Results of Operations should be read together with our combined consolidated financial statements, including the notes thereto, included elsewhere in this report.
On May 31, 2013, Sun Capital Partners V, LLC, an affiliate of Sun Capital Partners Inc. ("Sun Capital") completed a combination (the "Combination") of five of their flexible and rigid packaging portfolio businesses in North America and Europe, including Exopack Holding Corp ("Exopack"), Eifel Management S.a.r.l. & Partners S.C.A. ("Kobusch"), Copper Management S.a.r.l. & Partners S.C.A. ("Britton"), Portugal Management S.a.r.l. ("Paragon") and Island Lux S.a.r.l. & Partners S.C.A. ("Paccor"), collectively, Coveris Holdings, S.A., a Luxembourg company (the "Group"). Prior to May 31, 2013, the results of operations of Kobusch, Paccor, Paragon and Britton were presented on a combined basis as they were not part of a legal sub-group but were all under the common control of Sun Capital Partners V, LLC. Subsequent to the Combination on May 31, 2013, the combined consolidated financial statements of the Company are presented on a combined consolidated basis. These combined consolidated financial statements include the accounts of all the entities and their subsidiaries. Material intercompany balances and transactions among the combined consolidated entities have been eliminated. Results of operations of companies acquired are included from their respective dates of acquisition. Given the acquisitions that occurred during the years ended December 31, 2014 and 2013, the combined consolidated financial statements are not comparable for the years ended December 31, 2014 and 2013. For more information, see “Unaudited Pro Forma Financial Information” below.
We are one of the largest manufacturers of plastic packaging products in the world. We offer a broad range of value-added flexible and rigid plastic and paper packaging products that include primary packaging (such as bags, pouches, cups, tubs, lids and trays), films, laminates, sleeves and labels. We operate 66 production and warehousing facilities in 17 countries, including the United States, the United Kingdom, France and Germany, which allows us to supply global customers reliably, quickly and efficiently across multiple regions. We operate 18 facilities in North America, 46 facilities across Europe, as well as two strategically located facilities in the Middle East and China.
We currently have a diversified base of over 3,000 customers, ranging from leading international blue-chip customers to smaller regional businesses, who we believe look to us for packaging solutions that have high consumer impact in terms of form, function and branding. Our products are used in a diverse range of growing and resilient end markets, including the food, industrial, beverage, pet and household care and medical end markets. Our diverse customer base includes some of the largest consumer products companies in the world such as Procter & Gamble, Coca-Cola, Kellogg, Kraft Foods, Mondelez, Nestle, Mars, Pepsi and Unilever. We have developed longstanding relationships with our customers spanning, in many cases, over 15 years.
We have invested over $350,000 in capital spending over the last 3 years on maintenance, safety, compliance, growth and cost reduction projects. The growth and cost reduction projects were for new equipment or to upgrade existing equipment to add new capabilities and allow us to enter new markets. These projects which were done in Europe and North America (“NA”) are expected to reduce costs and drive volume gains through access to new markets and higher throughput.
We have invested in restructuring projects, both before and after the combination, to consolidate plants, exit unprofitable product lines, develop social programs, and reduce SG&A headcount. These programs were intended to increase our operating efficiency, realize synergies from redundant operations and to take advantage of our size and scale. We expect to continue to invest in these programs to drive operating income performance.
We conduct our business principally through two operating segments: Flexible and Rigid. In our Flexible packaging segment we manufacture a variety of flexible and semi-rigid plastic and paper products, including bags, pouches, roll stocks, films, laminates, sleeves and labels. We sell these products primarily in North America and Europe. In our Rigid packaging segment we manufacture injection molded or thermoformed and decorated rigid plastic and paper packaging solutions, including bowls, cups, tubs, lids and trays. We sell these products primarily in Europe and North America.
Beginning in 2014, we have implemented the Coveris Business System ("CBS") in order to achieve our strategic goals and priorities. CBS starts with a foundation of our values, mission and culture, which are based around Commercial Excellence, Operational Excellence, Talent and Leadership and Acquisition Integration. Within the foundation and principles of CBS, we are implementing
Table Of Contents
39
lean manufacturing techniques within the framework of the Coveris Performance System ("CPS"). Our results for the year ended December 31, 2014 are already reaping the benefits of the CBS and CPS.
Recent Developments
We appointed Kathleen McJohn as General Counsel effective October 6, 2014. Ms. McJohn most recently served as Senior Vice President, General Counsel and Secretary at WMS Industries. Ms. McJohn will work closely with our current legal representatives as well as business unit and executive team members to build a legal department closely aligned with our corporate strategy and objectives.
On February 10, 2015, the Company issued $85,000 in aggregate principal amount 7 7/8% Senior Notes (the "Additional Notes") maturing on November 1, 2019. The proceeds from the Additional Notes were primarily used to refinance the amount outstanding under the GBP Revolving Credit Facility. Interest on the Additional Notes is paid semi-annually on each November 1 and May 1, commencing on May 1, 2015. The Additional Notes were issued under the same indenture and terms and conditions as the $325,000 Senior Notes discussed in "Liquidity, Liabilities and Financing Agreements."
On February 12, 2015, the Company entered into two cross currency swaps in order to address the Company's exposure to foreign currency risk related to the future principal and interest of the Senior Notes and New Term Loan. The GBP-to-USD cross currency swap has a termination date of May 8, 2019 and a notional amount of $397,487. The EUR-to-USD cross currency swap has a termination date of May 8, 2019 and a notional amount of $225,067. The EUR-to-USD cross currency swap also includes a put option with a strike price of 1.25037 at $123,787 that expires on May 6, 2019, which limits the potential liability should exchange rates revert to historical averages.
Key Factors Affecting Our Business and Operations
General Economic Conditions in our Markets
Macroeconomic factors in the geographies in which we operate affect our results of operations. The market for plastic-based film and packaging products is generally mature in most of the markets in which we operate, and as such there is a close correlation between consumer consumption levels and demand for our products. As a result, the revenues we generate each period are affected by factors such as unemployment levels, consumer spending, credit availability and business and consumer confidence. Certain of our products are considered discretionary and as a result consumers generally purchase less of these products during economic downturns. A large portion of our products are used in fast-moving consumer goods markets. Consumption of these products has shown resilience over time and less volatility compared to gross domestic product indexes. However, as economic conditions slow, retailers often seek to manage inventory levels and slow their rate of product purchases as they try to sell product already in stock. Our customers also seek to reduce working capital during a slowdown and as a result they seek to manage inventory levels, revise trade credit terms and aggressively negotiate prices. Historically, the primary impact on our revenues during economic downturns has been reduced demand due to the destocking efforts by our customers.
Changes in Prices of Raw Materials and Fuels
Raw materials costs represent the single largest component of our operating costs. Given the significance of raw materials costs to our operating expenses and our limited ability to control raw materials costs as compared to other operating costs, volatility in raw materials prices can materially affect our margins and results of operations.
The principal raw materials we use to manufacture our products are resins, polymers, paper, films, inks, adhesives, masterbatches and transit packaging materials. Many of the raw materials we use in our manufacturing processes are commodities, which are subject to significant price volatility. The price of polymers and the other raw materials that we use is a function of supply and demand, suppliers’ capacity utilization, industry and consumer sentiment and prices for crude oil, natural gas and other raw materials. Prices for paper depend on the industry’s capacity utilization and the costs of raw materials. After rapid polyethylene price rises from 2009 to 2011, reaching a peak in 2011, polyethylene prices continued to be volatile from 2012 through 2014, partly driven by supply disruptions due to weather conditions in the Gulf of Mexico. Similarly, polymer prices increased between 2009 and 2011, and remained volatile through early 2014, mainly due to higher oil prices and partly due to supply disruptions caused by unplanned outages at the production facilities of polymer producers. Changes in prices of raw materials may have an impact on our profitability in the future. We believe that the recent strengthening of the U.S. dollar versus the euro and British pound may present opportunities for us, through the import to the U.S. of raw materials and/or finished goods, as well as the purchase of capital equipment manufactured in Europe.
Table Of Contents
40
As a result of operating large manufacturing facilities, the fuels necessary to power our facilities and operations constitute a significant portion of our cost of sales. We use large amounts of electricity, natural gas and oil in our production. Prices for these fuels have been highly volatile in recent years and have generally risen since 2005. However, during 2014 and 2015, oil prices decreased by more than 50% compared to 2013. While this decrease in oil prices might lead to a temporary reduction in fuel costs, any future increase in energy prices may adversely affect our business to the extent that we are unable to pass these increased costs on to our customers.
We take various actions to reduce overall raw materials and energy expense and exposure to price fluctuations. Most of our raw materials are purchased at market prices and so our costs are exposed to changes in price. We generally seek to pass increased materials costs to our customers through a variety of means. In certain of our customer contracts we have price modification mechanisms based on increases in our raw materials prices and in other cases we seek to revise prices based on costs as new customer agreements are negotiated or purchase orders are placed. These mechanisms generally pass through raw material price changes in our plastic and paper production in 30 to 90 days and 90 to 120 days, respectively. For our remaining sales, which are primarily made through purchase orders, we seek to pass through raw material price increases by increasing the price of our products. In addition, a proportion of the materials we purchase are sourced from suppliers that are imposed on us by our fast-moving consumer goods customers, who are responsible for any variance in such suppliers’ costs. Furthermore, we seek to take advantage of decreases in raw material prices by keeping our sales prices at the same levels until price terms of the contract are renegotiated.
In April 2012, Sun Capital established a global procurement team (GPPI) that focused on achieving best in class sourcing across all of Sun Capital’s packaging investments. Prior to the Combination, our legacy businesses benefited from participating in GPPI, which sought to use economies of scale to eliminate duplicate suppliers, reduce prices, centralize resources, and improve supplier performance. Following the Combination, during the fourth quarter of 2013, we integratedGPPI personnel and processes into our procurement group.
Our product mix and ability to create innovative products that use raw materials efficiently also impacts the amount of raw materials we use to produce our products. If we are able to produce products that use less resin, or use a mix of raw materials that are less subject to price fluctuation, we will reduce our raw material price exposure.
Foreign Currency Exchange Rates
Our reported results of operations and financial condition are affected by exchange rate fluctuations, and we are exposed to both transactional and translational risk due to these fluctuations.
Transactional risk arises when our subsidiaries execute transactions in a currency other than their functional currency. We currently operate facilities in 17 different countries, and sell our products into approximately 95 countries. As a result, we generate a significant portion of our sales and incur a significant portion of our expenses in currencies other than the U.S. dollar. The primary currencies in which we generate revenues are the euro, the U.S. dollar and the British pound sterling. Where we are unable to match sales received in foreign currencies with costs paid in the same currency, our results of operations are impacted by currency exchange rate fluctuations. For example, a stronger U.S. dollar will increase the cost of U.S. dollar supplies for our non-U.S. businesses and conversely decrease the cost of non-U.S. dollar supplies for our U.S. dollar businesses. Our subsidiaries generally execute their sales and incur most of their materials costs in the same currency. We have entered into a series of forward contracts and foreign currency options in an effort to reduce the effect of exchange rate fluctuations on our financial statements related to our future debt principal and interest payments in U.S. dollars from cash flows largely generated in British pounds and euros. We have elected to not pursue effective hedge accounting treatment on these forward contracts and will record changes in the fair value of the contracts to the combined consolidated statement of operations. See “Quantitative and Qualitative Information Regarding Market and Operating Risks-Foreign Exchange Risk.”
We present our combined consolidated financial statements in U.S. dollars. As a result, we must translate the assets, liabilities, revenue and expenses of all of our operations with a functional currency other than the U.S. dollars into U.S. dollars at then-applicable exchange rates. Consequently, increases or decreases in the value of these currencies against the U.S. dollar may affect the value of our assets, liabilities, revenue and expenses with respect to our non-U.S. dollar businesses in our combined consolidated financial statements, even if their value has not changed in their original currency, which creates translation risk. These translations could significantly affect the comparability of our results between financial periods and result in significant changes to the carrying value of our assets, liabilities and stockholders’ equity.
Competition and Market Trends
Table Of Contents
41
The packaging industry is highly competitive, and levels of competition, pricing and other activities by our competitors impact our results in each period. The markets for our products are mature in Europe and North America, and there are many competing manufacturers that produce similar and other types of packaging. While the principal drivers for competition for our products include quality, product performance and characteristics and service, price is also an important aspect of our ability to compete. In the flexible packaging segment, the market leaders have a strong presence in high volume product lines over which to spread the fixed costs of capital investments. Larger players gain a competitive advantage in these areas through operational efficiency and investment in processing technology and capabilities. Although the largest players will continue to dominate the high-volume product areas, small and mid-size companies have often found success by carving out unique market niches with customers. Bags and film products used in custom applications that require fast turnaround times are better served by smaller manufacturers, and there are numerous small players that deal only in these markets. In the rigid plastic packaging segment, cost pressures in rigid packaging make it difficult for small players to compete on high-volume products, but small- and medium-sized competitors frequently focus on niche products for household chemicals, personal care products, food, or automotive retail products. Smaller players can differentiate themselves in these areas through value-added services such as shrink-sleeve labeling and custom design.
We currently manufacture most of our products in the United States, Canada, the United Kingdom, Germany and certain other European countries. Our competitors include producers who manufacture a higher percentage of their products in countries with significantly lower labor costs than we do. If one or more of our competitors with manufacturing facilities in such lower cost countries offers products of sufficient quality in our markets at lower prices, we may be forced to lower our prices to maintain our competitiveness, or we may be unable to continue to sell our products. In either case, our sales and our gross profit could decline. Additionally, we compete, to a certain extent, with our customers if they have in-house packaging-making capabilities.
We are also impacted by packaging trends, which change based on product cost, environmental impact and consumer demand. During the last ten years the packaging industry has experienced a general shift toward plastic products. Plastic packaging has been the fastest growing segment of the packaging market, and sales growth in our markets during the last ten years has exceeded gross domestic product growth, due in part to increasing demand for consumer goods and a shift from metal, paper and glass containers to plastics.
Success of New Products
Our innovation and research and development capabilities are a key element of our success. As a result, we are required to continuously invest in innovation and research and development as well as capital expenditures to update our facilities with the equipment needed to produce new products. We work with our customers to develop new products in connection with their product launches and we also organically develop products to sell to our existing customers. Periods in which we and our customers have successfully anticipated trends generally have had more favorable results. If a release is successful, this will have a positive impact on our sales until consumer preferences change or until those items are replaced by new items. If the product is not successful, we will not be able to fully load our lines and our operating results will be negatively impacted temporarily. A majority of research and development efforts in the plastic packaging space are currently devoted to innovations that help to differentiate products, such as convenience packaging, improved barrier protection, packaging design initiatives, smart packaging and environmentally-friendly alternatives. Our ability to accurately predict consumer trends and needs and focus our development efforts accordingly will impact our product sales.
Changes in Product Mix
Our results of operations have in the past been, and will continue to be in the future, impacted by changes in our product mix. We manufacture and sell flexible and rigid plastic products with a focus on the production of technologically advanced packaging solutions and films and on innovation and customization. Our products have different average selling prices and gross margins. In general, our products in technically demanding product areas have higher average selling prices and gross margins as compared to our products used in less demanding applications. The difference in margins is driven by applications and the levels of innovation and customization required for those products. Our exposure to cyclical end markets (including industrial, building products and retail) makes our flexible-packaging business slightly less predictable than our consumer- and food-oriented rigid-packaging operations.
Our strategy is to continue to innovate and improve existing products and technologies, as well as to develop new products to prevent commoditization and replace our existing lower valued-added products with more technically advanced products. Factors that influence our product mix in a particular period include the timing and roll-out of new products, the demand for existing products and demand growth for various types of packaging. For example, rigid plastic packaging sales in our markets have increased in the past ten years at a rate higher than flexible plastic products, as consumer goods sellers have switched from packaging solutions, such as Styrofoam, to rigid plastic.
Table Of Contents
42
Weather
Our results of operations are also affected by weather conditions in the various geographic markets in which we operate, to the extent that weather conditions affect demand for products utilized in our packaging. For example, a significant weather event, such as a hurricane in the United States, may increase demand for our products used in the construction end market, while abnormally wet summer weather in Europe may dampen demand for packaging for fresh foods used in picnics or farm products.
2013 Refinancing
On November 8, 2013, we issued $325,000 in aggregate principal amount of Senior Notes and entered into a New Term Loan with a syndicate of financial institutions, in which the proceeds were segregated into two tranches of varying principal amounts and currency denominations: (1) $435,000 and (2) €175,000. The proceeds from the Senior Notes and New Term Loan were used to pay off much of our existing debt structure in Europe as well as the legacy $350,000 Term Loan Facility from Exopack. We refinanced our legacy debt structure with a new bond issuance and term loan structure in order to establish a sustainable credit structure, strategically position our business for future growth and fund current working capital needs across all of our jurisdictions. Also on November 8, 2013, subsequent to the issuance of the Senior Notes, we amended the NA ABL Facility and entered into receivables and inventory financing arrangements in each of France, Germany and the United Kingdom.
Acquisitions
We have acquired control over various companies through a series of separate transactions completed between August 5, 2010 and August 21, 2014. Except for the acquisition of Rose HPC Holding, LLC and its subsidiaries (collectively referred to as "KubeTech") as described below, we have accounted for each of these acquisitions using the purchase method of accounting prescribed in ASC 805. Under these standards, as of the date of each acquisition, we have conducted a formal valuation analysis of the identifiable assets and liabilities of the applicable acquired entity, made corresponding adjustments to such entity’s pre-acquisition carrying values and allocated any positive or negative difference between the cost of each acquisition and the fair value of the related identifiable net assets to goodwill or other intangible assets or to gains on bargained purchases, as the case may be.
We have accounted for the acquisition of KubeTech under the guidance for common control transactions as both the Company and KubeTech are indirectly majority-owned by Sun Capital Partners V, L.P. According to ASC 805, business combinations between entities under common control are accounted for at the historical carrying values of the assets and liabilities transferred at the date of the transaction and retrospectively presented in the financial statements for the prior periods through the date under which the entities came under common control.
Acquisitions affect our results of operations in several ways. First, our results for the period during which an acquisition takes place are affected by the inclusion of the results of the acquired entity into our consolidated results. Second, the results of the acquired businesses after their acquisition may be positively affected by synergies. Additionally, we may experience an increase in operating expenses, including staff costs, as we integrate the acquired business into our network. Finally, because acquired entities are consolidated from their date of acquisition, unless the acquiree is under common control, the full impact of an acquisition or disposition is only reflected in our financial statements in the subsequent period.
Factors Affecting Comparability
We accounted for the combination of the Fund V Companies and the Exopack Business as a business combination in accordance with ASC 805. Accordingly, we have included the results of operations of the Exopack Business in our combined consolidated financial statements from the date of its acquisition. Therefore, results for the years ended December 31, 2014 and 2013, are not directly comparable. We have included in this annual report unaudited pro forma financial information reflecting the acquisition of the Exopack Business as if it had been acquired on January 1, 2013, based on certain assumptions in "Unaudited Pro Forma Information." In addition to the acquisition of the Exopack Business, we have completed a number of selective acquisitions since the closing date of the Combination to complement the growth in net sales, operating income and cash flow that we are targeting through organic sales volume growth and cost savings. The acquisitions since the date of the Combination are as follows:
• InteliCoat. On August 28, 2013, the Company purchased certain assets and assumed certain liabilities from Sun Capital portfolio companies InteliCoat Technologies Image Products S. Hadley LLC and Image Products Group LLC (collectively
Table Of Contents
43
referred to as “InteliCoat”). The financial results of InteliCoat subsequent to the acquisition date are included within the Company's Flexible reporting segment. We have consolidated InteliCoat in our financial statements from the date of its acquisition.
• Closures. On October 23, 2013, we acquired 100% of the share capital of Daisy UK Bidco Limited, the parent company of Closures Limited in the UK (“Closures”). The financial results of Closures subsequent to the acquisition date are included within the Company's Rigid reporting segment. We have consolidated Closures in our financial statements from the date of its acquisition.
• KubeTech. On May 30, 2014, we acquired 100% of the equity interest of KubeTech. KubeTech was indirectly, wholly owned by Sun Capital Partners V, L.P., the ultimate majority shareholder of the Company. We incorporated KubeTech into our Rigid segment. We have consolidated KubeTech in our financial statements from the date of its acquisition by Sun Capital Partners V, L.P. on December 31, 2012, as KubeTech was accounted for as a business combination under common control.
• St. Neots. On June 12, 2014, we purchased 100% of the share capital of St. Neots Holdings Limited (“St. Neots”). St. Neots consists of two manufacturing facilities located in the UK with a sourcing office in Hong Kong. St. Neots is a leading manufacturer of cartonboard solutions for the food-to-go and convenience markets. We have consolidated St. Neots in our financial statements from the date of its acquisition and include its results in our Flexible reporting segment.
• Learoyd. On August 21, 2014, we acquired the shares of Learoyd Packaging Limited (“Learoyd”), which is one of the UK’s leading flexographic print specialists supplying flexible packaging solutions to major supermarkets, own brands and food manufacturers and retailers. We believe that the acquisition of Learoyd supports and strengthens our UK flexible packaging offering through advanced processes and technologies in addition to providing access to new customer and product markets. We have consolidated Learoyd in our financial statements from the date of its acquisition and include its results in our Flexible reporting segment.
As we included the results of operations of each acquired business in our combined consolidated financial statements from the date of their respective acquisition, results for the years ended December 31, 2014 and 2013 are not comparable.
Description of Key Line Items in Our Income Statements
Net sales
We recognize sales revenue when all of the following conditions are met: persuasive evidence of an agreement exists, delivery has occurred, our price to the buyer is fixed and determinable and collectability is reasonably assured. Sales and related cost of sales are principally recognized upon transfer of title to the customer, which generally occurs upon shipment of products. Our stated shipping terms are generally FOB shipping point unless otherwise noted in the customer contract. Sales to certain customers are on consignment and revenue is recognized when the customer uses the products. Provisions for estimated returns and allowances and customer rebates are recorded when the related products are sold.
Cost of sales
Our cost of sales represent amount paid for direct costs of running the business including amounts due to external third parties for service directly related to revenue. These costs include direct and indirect materials costs, direct and indirect labor costs, including fringe benefits, supplies, utilities, depreciation, amortization, insurance, pension and post-retirement benefits and other manufacturing related costs. The largest component of our costs of sales is the cost of materials, and the most significant component of this is plastic resin.
We also lease various buildings, machinery and equipment from third parties under operating lease agreements. Rent expense under the operating lease agreements is included in cost of sales or selling and administrative expenses depending on the nature of the leased assets.
Selling, general and administrative expenses
Selling, general and administrative expenses primarily include sales and marketing, finance and administration and information technology costs. Our major cost elements include salary and wages, fringe benefits, travel and information technology costs.
Table Of Contents
44
Depreciation and amortization
Depreciation and amortization expenses consist of the depreciation of non-manufacturing related property, plant and equipment as well as the amortization of intangible assets.
Interest expense
Our interest expense relates mainly to interest expenses, exchange rate differences, deferred finance costs and unused facility and letter of credit fees on financial debt and other finance costs.
Other income (expense), net
Our other, net generally consists of gains and losses on the disposal or sale of assets.
Foreign currency exchange gain (loss)
Our foreign currency exchange gain or loss generally consists of realized and unrealized gains on foreign currency transactions. A significant driver in this line item is the unrealized foreign exchange gain or loss on the remeasurement of our U.S. dollar denominated Term Loan and Senior Notes that are maintained by a euro functional currency entity. Additionally, included in this line item are the changes in the fair value of derivative instruments not designated as hedges.
(Provision)/benefit for income taxes
Income tax expense includes current and deferred tax. Taxes are recognized in the income statement except where the underlying transaction is recognized in comprehensive income, in which case the tax effect is recognized in comprehensive income. Current tax is tax paid or received during the current year and includes adjustments of current tax for prior periods.
Results of Operations
Currency
We make references to "constant currency," a non-GAAP performance measure that excludes the foreign exchange rate impact from fluctuations in the weighted average foreign exchange rates between reporting periods. Constant currency is calculated by translating current period results from currencies other than the U.S. dollar using the comparable weighted average foreign exchange rates from the prior year period. This information is provided to view financial results without the impact of fluctuations in foreign currency rates, thereby enhancing comparability between reporting periods.
Basis of Presentation
Prior to May 31, 2013, the results of operations of Kobusch, Paccor, Paragon and Britton were presented on a combined basis as they were not consolidated into any common parent or holding company but were all under the common control of Sun Capital Partners V, L.P. Subsequent to the Combination on May 31, 2013, the combined consolidated financial statements of the Company are presented on a combined consolidated basis. These combined consolidated financial statements include the accounts of all the entities and their subsidiaries. Material intercompany balances and transactions among the combined consolidated entities have been eliminated. Results of operations of companies acquired are included from their respective dates of acquisition. As such, the combined consolidated statements of operations are not comparable for the years ended December 31, 2014 and 2013.
Common Control Acquisition of KubeTech
On May 30, 2014, the Company acquired 100% of the equity interest of KubeTech. KubeTech was indirectly, wholly owned by Sun Capital Partners V, L.P., a majority shareholder of the Company. As such, the Company has accounted for this acquisition under the guidance for a business combination under common control and has recorded the assets and liabilities transferred at the date of the transaction at their historical carrying values. The Company has presented this information retrospectively in the financial statements for the prior periods through the date under which both entities came under common control through the formation of KubeTech by Sun Capital Partners V, L.P. on December 31, 2012. Refer to Note 5. Business Combinations for further disclosures regarding the KubeTech acquisition and Note 17. KubeTech Common Control Reconciliation for a reconciliation of the retrospective

Table Of Contents
45
consolidation of KubeTech into our combined consolidated balance sheets, combined consolidated statements of operations and combined consolidated statements of cash flows.
Discontinued Operations
During the quarter ended September 30, 2014, the Flexibles segment disposed of its resin trade business. The Company's resin trade business consisted of buying and reselling resins from wholesalers to customers. The resin trade business has been discontinued to further focus the Company's operations around the Company's long-term strategy and organizational goals. The Company has reclassified all income and expenses for the resin trade business in the prior year's combined consolidated statement of operations to income (loss) from discontinued operations for the year ended December 31, 2013, to conform to current period presentation in accordance with ASC 205.
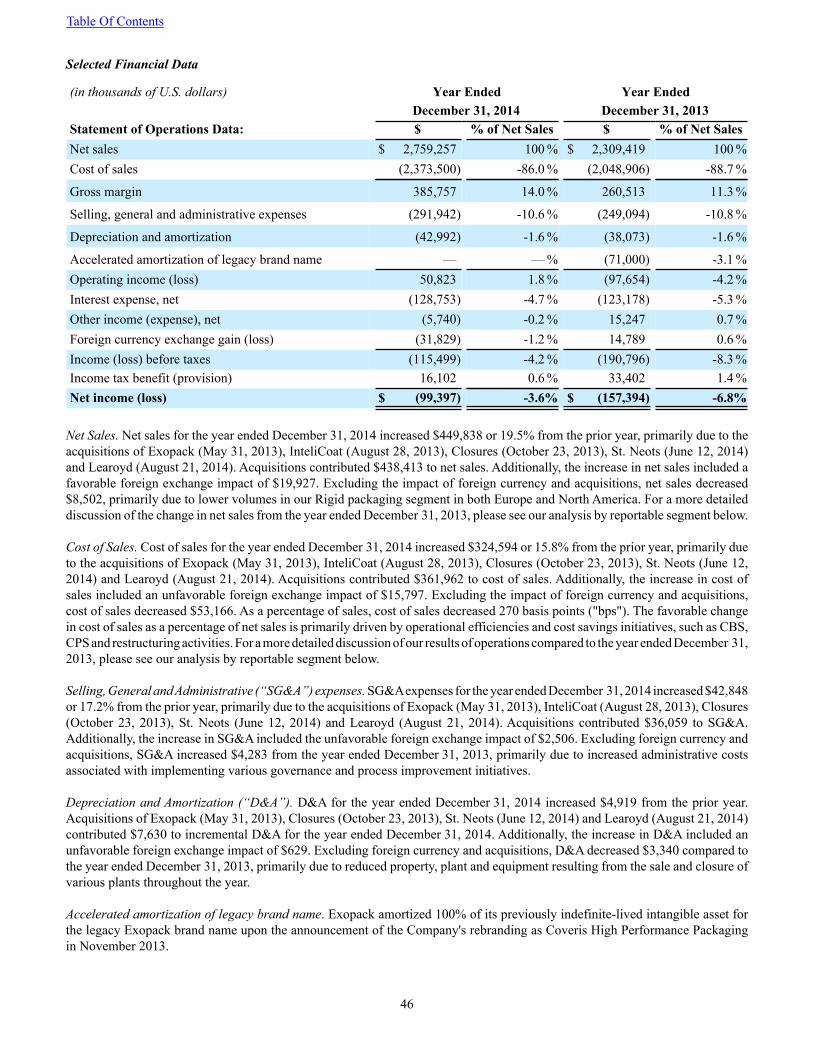
Table Of Contents
46
Selected Financial Data
(in thousands of U.S. dollars) Year Ended Year EndedDecember 31, 2014 December 31, 2013
Statement of Operations Data: $ % of Net Sales $ % of Net SalesNet sales $ 2,759,257 100 % $ 2,309,419 100 %Cost of sales (2,373,500) -86.0 % (2,048,906) -88.7 %
Gross margin 385,757 14.0 % 260,513 11.3 %
Selling, general and administrative expenses (291,942) -10.6 % (249,094) -10.8 %
Depreciation and amortization (42,992) -1.6 % (38,073) -1.6 %
Accelerated amortization of legacy brand name — — % (71,000) -3.1 %Operating income (loss) 50,823 1.8 % (97,654) -4.2 %Interest expense, net (128,753) -4.7 % (123,178) -5.3 %Other income (expense), net (5,740) -0.2 % 15,247 0.7 %Foreign currency exchange gain (loss) (31,829) -1.2 % 14,789 0.6 %Income (loss) before taxes (115,499) -4.2 % (190,796) -8.3 %Income tax benefit (provision) 16,102 0.6 % 33,402 1.4 %Net income (loss) $ (99,397) -3.6% $ (157,394) -6.8%
Net Sales. Net sales for the year ended December 31, 2014 increased $449,838 or 19.5% from the prior year, primarily due to the acquisitions of Exopack (May 31, 2013), InteliCoat (August 28, 2013), Closures (October 23, 2013), St. Neots (June 12, 2014) and Learoyd (August 21, 2014). Acquisitions contributed $438,413 to net sales. Additionally, the increase in net sales included a favorable foreign exchange impact of $19,927. Excluding the impact of foreign currency and acquisitions, net sales decreased $8,502, primarily due to lower volumes in our Rigid packaging segment in both Europe and North America. For a more detailed discussion of the change in net sales from the year ended December 31, 2013, please see our analysis by reportable segment below.
Cost of Sales. Cost of sales for the year ended December 31, 2014 increased $324,594 or 15.8% from the prior year, primarily due to the acquisitions of Exopack (May 31, 2013), InteliCoat (August 28, 2013), Closures (October 23, 2013), St. Neots (June 12, 2014) and Learoyd (August 21, 2014). Acquisitions contributed $361,962 to cost of sales. Additionally, the increase in cost of sales included an unfavorable foreign exchange impact of $15,797. Excluding the impact of foreign currency and acquisitions, cost of sales decreased $53,166. As a percentage of sales, cost of sales decreased 270 basis points ("bps"). The favorable change in cost of sales as a percentage of net sales is primarily driven by operational efficiencies and cost savings initiatives, such as CBS, CPS and restructuring activities. For a more detailed discussion of our results of operations compared to the year ended December 31, 2013, please see our analysis by reportable segment below.
Selling, General and Administrative (“SG&A”) expenses. SG&A expenses for the year ended December 31, 2014 increased $42,848 or 17.2% from the prior year, primarily due to the acquisitions of Exopack (May 31, 2013), InteliCoat (August 28, 2013), Closures (October 23, 2013), St. Neots (June 12, 2014) and Learoyd (August 21, 2014). Acquisitions contributed $36,059 to SG&A. Additionally, the increase in SG&A included the unfavorable foreign exchange impact of $2,506. Excluding foreign currency and acquisitions, SG&A increased $4,283 from the year ended December 31, 2013, primarily due to increased administrative costs associated with implementing various governance and process improvement initiatives.
Depreciation and Amortization (“D&A”). D&A for the year ended December 31, 2014 increased $4,919 from the prior year. Acquisitions of Exopack (May 31, 2013), Closures (October 23, 2013), St. Neots (June 12, 2014) and Learoyd (August 21, 2014) contributed $7,630 to incremental D&A for the year ended December 31, 2014. Additionally, the increase in D&A included an unfavorable foreign exchange impact of $629. Excluding foreign currency and acquisitions, D&A decreased $3,340 compared to the year ended December 31, 2013, primarily due to reduced property, plant and equipment resulting from the sale and closure of various plants throughout the year.
Accelerated amortization of legacy brand name. Exopack amortized 100% of its previously indefinite-lived intangible asset for the legacy Exopack brand name upon the announcement of the Company's rebranding as Coveris High Performance Packaging in November 2013.
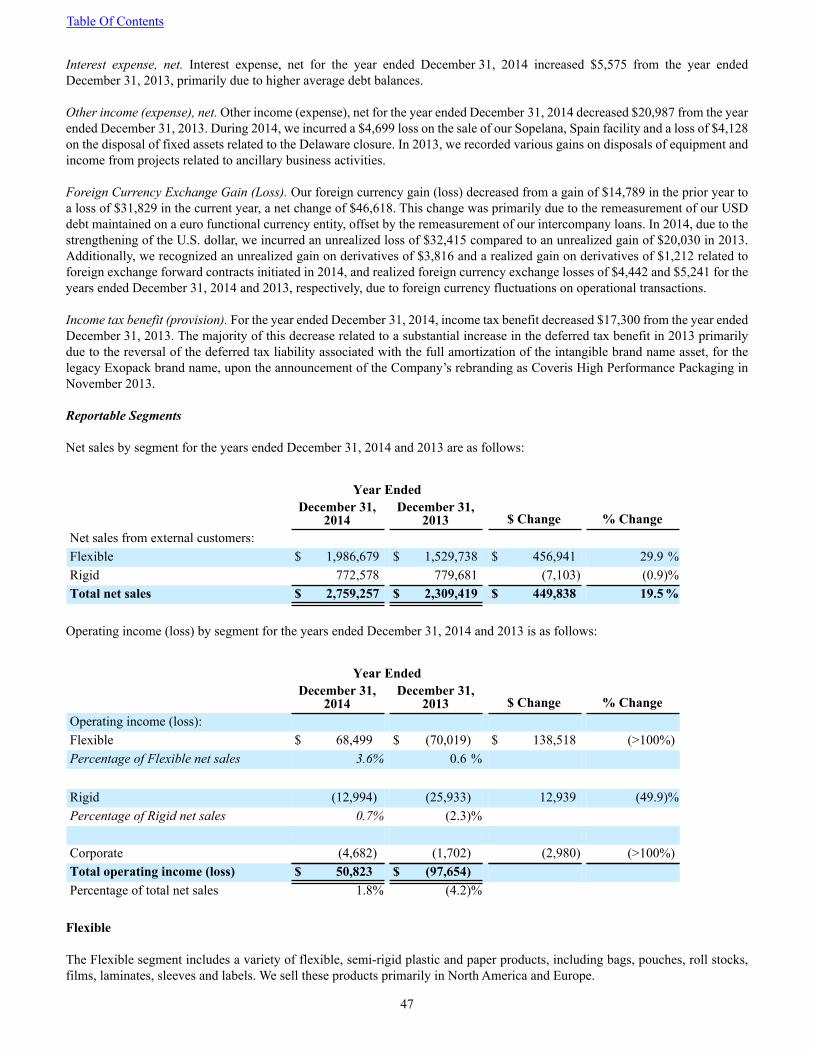
Table Of Contents
47
Interest expense, net. Interest expense, net for the year ended December 31, 2014 increased $5,575 from the year ended December 31, 2013, primarily due to higher average debt balances.
Other income (expense), net. Other income (expense), net for the year ended December 31, 2014 decreased $20,987 from the year ended December 31, 2013. During 2014, we incurred a $4,699 loss on the sale of our Sopelana, Spain facility and a loss of $4,128 on the disposal of fixed assets related to the Delaware closure. In 2013, we recorded various gains on disposals of equipment and income from projects related to ancillary business activities.
Foreign Currency Exchange Gain (Loss). Our foreign currency gain (loss) decreased from a gain of $14,789 in the prior year to a loss of $31,829 in the current year, a net change of $46,618. This change was primarily due to the remeasurement of our USD debt maintained on a euro functional currency entity, offset by the remeasurement of our intercompany loans. In 2014, due to the strengthening of the U.S. dollar, we incurred an unrealized loss of $32,415 compared to an unrealized gain of $20,030 in 2013. Additionally, we recognized an unrealized gain on derivatives of $3,816 and a realized gain on derivatives of $1,212 related to foreign exchange forward contracts initiated in 2014, and realized foreign currency exchange losses of $4,442 and $5,241 for the years ended December 31, 2014 and 2013, respectively, due to foreign currency fluctuations on operational transactions.
Income tax benefit (provision). For the year ended December 31, 2014, income tax benefit decreased $17,300 from the year ended December 31, 2013. The majority of this decrease related to a substantial increase in the deferred tax benefit in 2013 primarily due to the reversal of the deferred tax liability associated with the full amortization of the intangible brand name asset, for the legacy Exopack brand name, upon the announcement of the Company’s rebranding as Coveris High Performance Packaging in November 2013.
Reportable Segments
Net sales by segment for the years ended December 31, 2014 and 2013 are as follows:
Year EndedDecember 31,
2014December 31,
2013 $ Change % ChangeNet sales from external customers:Flexible $ 1,986,679 $ 1,529,738 $ 456,941 29.9 %Rigid 772,578 779,681 (7,103) (0.9)%Total net sales $ 2,759,257 $ 2,309,419 $ 449,838 19.5 %
Operating income (loss) by segment for the years ended December 31, 2014 and 2013 is as follows:
Year EndedDecember 31,
2014December 31,
2013 $ Change % ChangeOperating income (loss):Flexible $ 68,499 $ (70,019) $ 138,518 (>100%)Percentage of Flexible net sales 3.6% 0.6 %
Rigid (12,994) (25,933) 12,939 (49.9)%Percentage of Rigid net sales 0.7% (2.3)%
Corporate (4,682) (1,702) (2,980) (>100%)Total operating income (loss) $ 50,823 $ (97,654)Percentage of total net sales 1.8% (4.2)%
Flexible
The Flexible segment includes a variety of flexible, semi-rigid plastic and paper products, including bags, pouches, roll stocks, films, laminates, sleeves and labels. We sell these products primarily in North America and Europe.
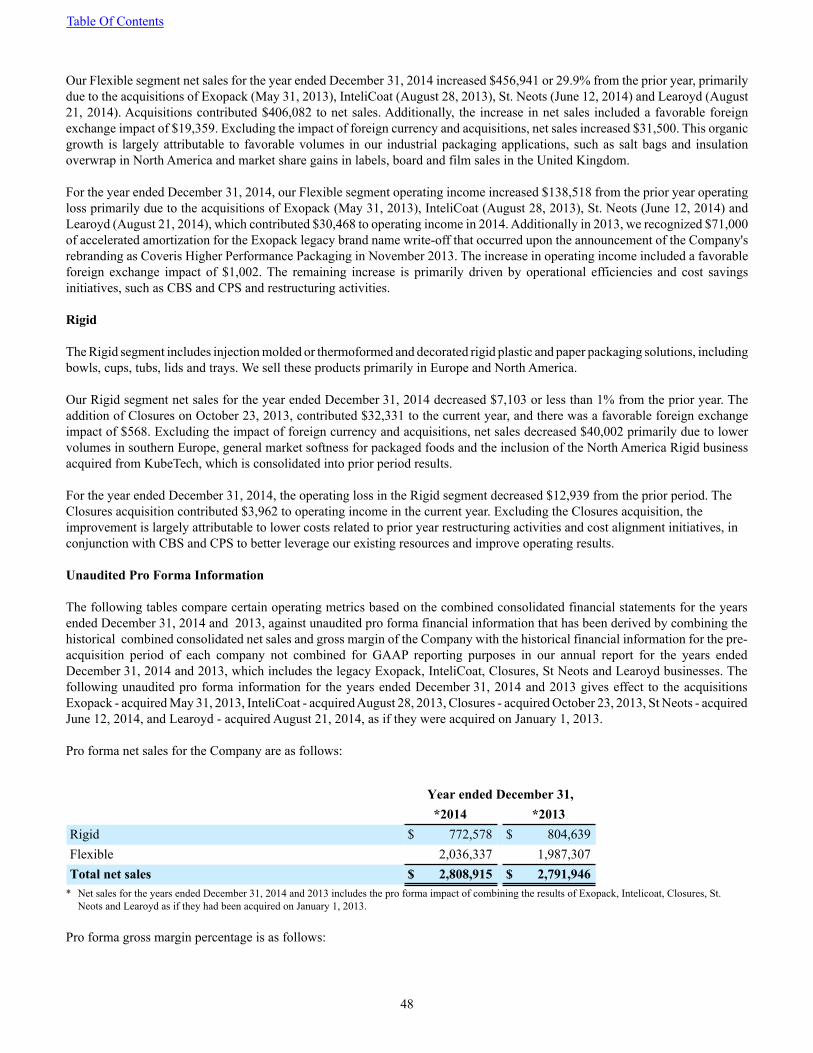
Table Of Contents
48
Our Flexible segment net sales for the year ended December 31, 2014 increased $456,941 or 29.9% from the prior year, primarily due to the acquisitions of Exopack (May 31, 2013), InteliCoat (August 28, 2013), St. Neots (June 12, 2014) and Learoyd (August 21, 2014). Acquisitions contributed $406,082 to net sales. Additionally, the increase in net sales included a favorable foreign exchange impact of $19,359. Excluding the impact of foreign currency and acquisitions, net sales increased $31,500. This organic growth is largely attributable to favorable volumes in our industrial packaging applications, such as salt bags and insulation overwrap in North America and market share gains in labels, board and film sales in the United Kingdom.
For the year ended December 31, 2014, our Flexible segment operating income increased $138,518 from the prior year operating loss primarily due to the acquisitions of Exopack (May 31, 2013), InteliCoat (August 28, 2013), St. Neots (June 12, 2014) and Learoyd (August 21, 2014), which contributed $30,468 to operating income in 2014. Additionally in 2013, we recognized $71,000 of accelerated amortization for the Exopack legacy brand name write-off that occurred upon the announcement of the Company's rebranding as Coveris Higher Performance Packaging in November 2013. The increase in operating income included a favorable foreign exchange impact of $1,002. The remaining increase is primarily driven by operational efficiencies and cost savings initiatives, such as CBS and CPS and restructuring activities.
Rigid
The Rigid segment includes injection molded or thermoformed and decorated rigid plastic and paper packaging solutions, including bowls, cups, tubs, lids and trays. We sell these products primarily in Europe and North America.
Our Rigid segment net sales for the year ended December 31, 2014 decreased $7,103 or less than 1% from the prior year. The addition of Closures on October 23, 2013, contributed $32,331 to the current year, and there was a favorable foreign exchange impact of $568. Excluding the impact of foreign currency and acquisitions, net sales decreased $40,002 primarily due to lower volumes in southern Europe, general market softness for packaged foods and the inclusion of the North America Rigid business acquired from KubeTech, which is consolidated into prior period results.
For the year ended December 31, 2014, the operating loss in the Rigid segment decreased $12,939 from the prior period. The Closures acquisition contributed $3,962 to operating income in the current year. Excluding the Closures acquisition, the improvement is largely attributable to lower costs related to prior year restructuring activities and cost alignment initiatives, in conjunction with CBS and CPS to better leverage our existing resources and improve operating results.
Unaudited Pro Forma Information
The following tables compare certain operating metrics based on the combined consolidated financial statements for the years ended December 31, 2014 and 2013, against unaudited pro forma financial information that has been derived by combining the historical combined consolidated net sales and gross margin of the Company with the historical financial information for the pre-acquisition period of each company not combined for GAAP reporting purposes in our annual report for the years ended December 31, 2014 and 2013, which includes the legacy Exopack, InteliCoat, Closures, St Neots and Learoyd businesses. The following unaudited pro forma information for the years ended December 31, 2014 and 2013 gives effect to the acquisitions Exopack - acquired May 31, 2013, InteliCoat - acquired August 28, 2013, Closures - acquired October 23, 2013, St Neots - acquired June 12, 2014, and Learoyd - acquired August 21, 2014, as if they were acquired on January 1, 2013.
Pro forma net sales for the Company are as follows:
Year ended December 31,*2014 *2013
Rigid $ 772,578 $ 804,639Flexible 2,036,337 1,987,307Total net sales $ 2,808,915 $ 2,791,946
* Net sales for the years ended December 31, 2014 and 2013 includes the pro forma impact of combining the results of Exopack, Intelicoat, Closures, St. Neots and Learoyd as if they had been acquired on January 1, 2013.
Pro forma gross margin percentage is as follows:
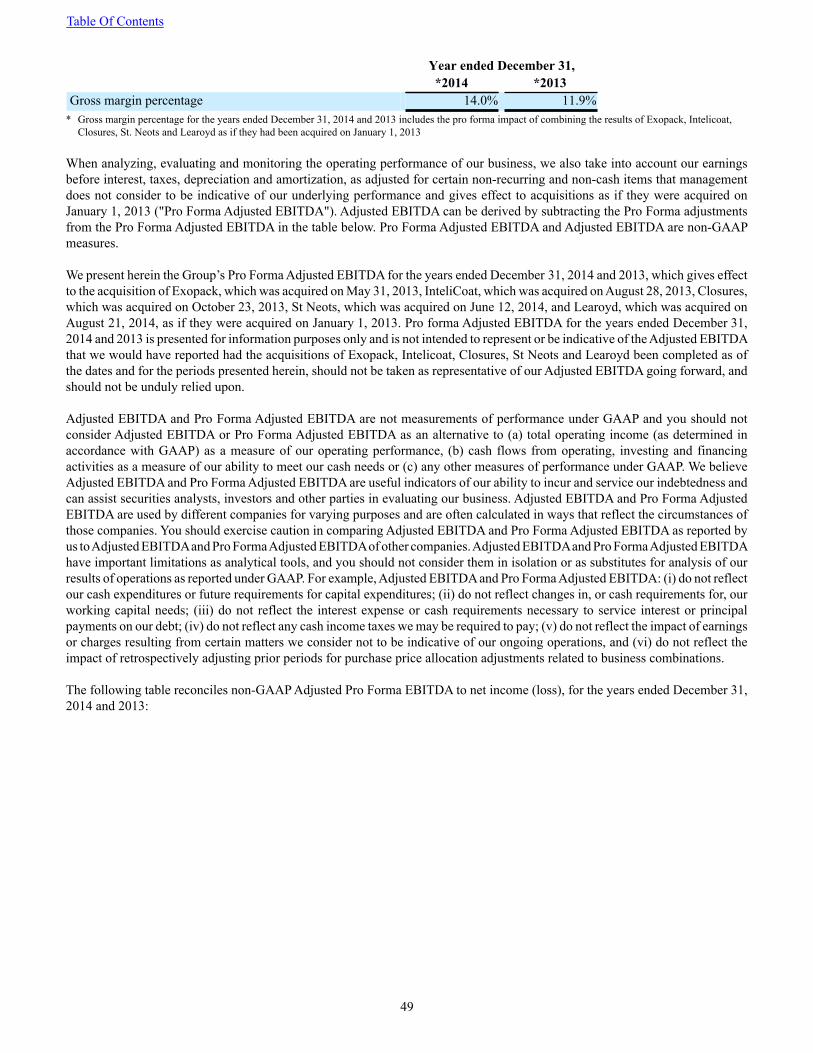
Table Of Contents
49
Year ended December 31,*2014 *2013
Gross margin percentage 14.0% 11.9%* Gross margin percentage for the years ended December 31, 2014 and 2013 includes the pro forma impact of combining the results of Exopack, Intelicoat,
Closures, St. Neots and Learoyd as if they had been acquired on January 1, 2013
When analyzing, evaluating and monitoring the operating performance of our business, we also take into account our earnings before interest, taxes, depreciation and amortization, as adjusted for certain non-recurring and non-cash items that management does not consider to be indicative of our underlying performance and gives effect to acquisitions as if they were acquired on January 1, 2013 ("Pro Forma Adjusted EBITDA"). Adjusted EBITDA can be derived by subtracting the Pro Forma adjustments from the Pro Forma Adjusted EBITDA in the table below. Pro Forma Adjusted EBITDA and Adjusted EBITDA are non-GAAP measures.
We present herein the Group’s Pro Forma Adjusted EBITDA for the years ended December 31, 2014 and 2013, which gives effect to the acquisition of Exopack, which was acquired on May 31, 2013, InteliCoat, which was acquired on August 28, 2013, Closures, which was acquired on October 23, 2013, St Neots, which was acquired on June 12, 2014, and Learoyd, which was acquired on August 21, 2014, as if they were acquired on January 1, 2013. Pro forma Adjusted EBITDA for the years ended December 31, 2014 and 2013 is presented for information purposes only and is not intended to represent or be indicative of the Adjusted EBITDA that we would have reported had the acquisitions of Exopack, Intelicoat, Closures, St Neots and Learoyd been completed as of the dates and for the periods presented herein, should not be taken as representative of our Adjusted EBITDA going forward, and should not be unduly relied upon.
Adjusted EBITDA and Pro Forma Adjusted EBITDA are not measurements of performance under GAAP and you should not consider Adjusted EBITDA or Pro Forma Adjusted EBITDA as an alternative to (a) total operating income (as determined in accordance with GAAP) as a measure of our operating performance, (b) cash flows from operating, investing and financing activities as a measure of our ability to meet our cash needs or (c) any other measures of performance under GAAP. We believe Adjusted EBITDA and Pro Forma Adjusted EBITDA are useful indicators of our ability to incur and service our indebtedness and can assist securities analysts, investors and other parties in evaluating our business. Adjusted EBITDA and Pro Forma Adjusted EBITDA are used by different companies for varying purposes and are often calculated in ways that reflect the circumstances of those companies. You should exercise caution in comparing Adjusted EBITDA and Pro Forma Adjusted EBITDA as reported by us to Adjusted EBITDA and Pro Forma Adjusted EBITDA of other companies. Adjusted EBITDA and Pro Forma Adjusted EBITDA have important limitations as analytical tools, and you should not consider them in isolation or as substitutes for analysis of our results of operations as reported under GAAP. For example, Adjusted EBITDA and Pro Forma Adjusted EBITDA: (i) do not reflect our cash expenditures or future requirements for capital expenditures; (ii) do not reflect changes in, or cash requirements for, our working capital needs; (iii) do not reflect the interest expense or cash requirements necessary to service interest or principal payments on our debt; (iv) do not reflect any cash income taxes we may be required to pay; (v) do not reflect the impact of earnings or charges resulting from certain matters we consider not to be indicative of our ongoing operations, and (vi) do not reflect the impact of retrospectively adjusting prior periods for purchase price allocation adjustments related to business combinations.
The following table reconciles non-GAAP Adjusted Pro Forma EBITDA to net income (loss), for the years ended December 31, 2014 and 2013:
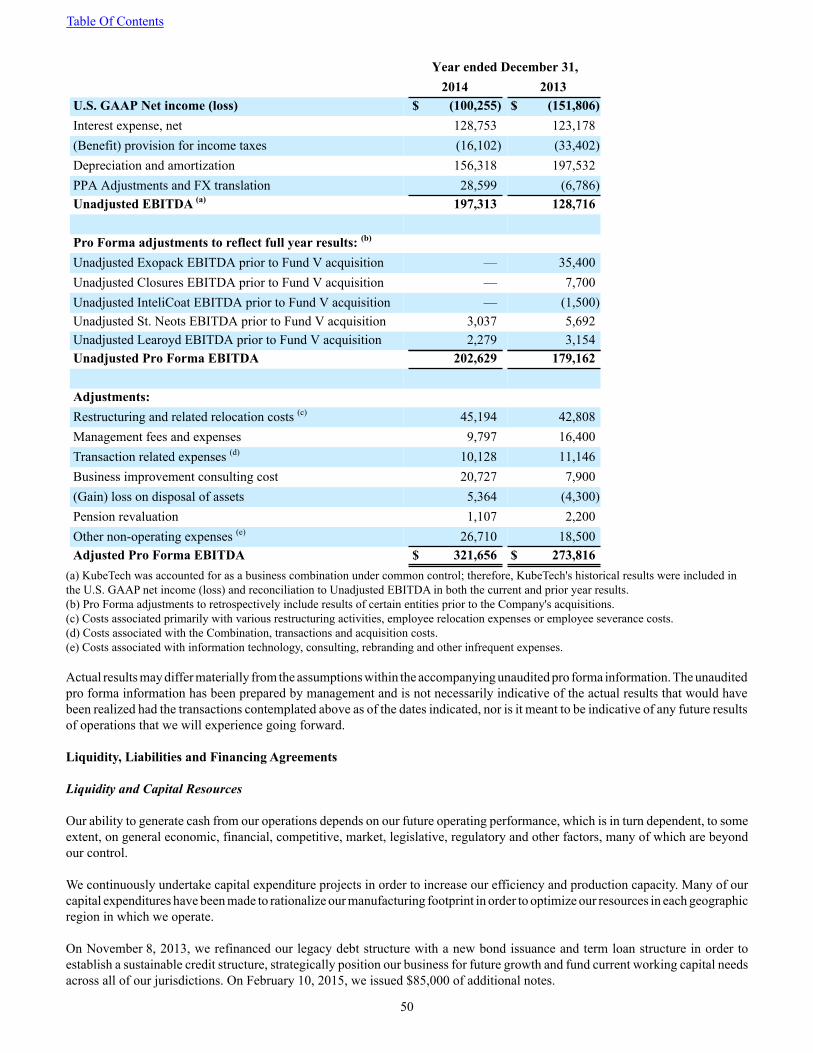
Table Of Contents
50
Year ended December 31,2014 2013
U.S. GAAP Net income (loss) $ (100,255) $ (151,806)Interest expense, net 128,753 123,178(Benefit) provision for income taxes (16,102) (33,402)Depreciation and amortization 156,318 197,532PPA Adjustments and FX translation 28,599 (6,786)Unadjusted EBITDA (a) 197,313 128,716
Pro Forma adjustments to reflect full year results: (b)
Unadjusted Exopack EBITDA prior to Fund V acquisition — 35,400Unadjusted Closures EBITDA prior to Fund V acquisition — 7,700Unadjusted InteliCoat EBITDA prior to Fund V acquisition — (1,500)Unadjusted St. Neots EBITDA prior to Fund V acquisition 3,037 5,692Unadjusted Learoyd EBITDA prior to Fund V acquisition 2,279 3,154Unadjusted Pro Forma EBITDA 202,629 179,162
Adjustments:Restructuring and related relocation costs (c) 45,194 42,808Management fees and expenses 9,797 16,400Transaction related expenses (d) 10,128 11,146Business improvement consulting cost 20,727 7,900(Gain) loss on disposal of assets 5,364 (4,300)Pension revaluation 1,107 2,200Other non-operating expenses (e) 26,710 18,500Adjusted Pro Forma EBITDA $ 321,656 $ 273,816
(a) KubeTech was accounted for as a business combination under common control; therefore, KubeTech's historical results were included in the U.S. GAAP net income (loss) and reconciliation to Unadjusted EBITDA in both the current and prior year results. (b) Pro Forma adjustments to retrospectively include results of certain entities prior to the Company's acquisitions.(c) Costs associated primarily with various restructuring activities, employee relocation expenses or employee severance costs.(d) Costs associated with the Combination, transactions and acquisition costs.(e) Costs associated with information technology, consulting, rebranding and other infrequent expenses.
Actual results may differ materially from the assumptions within the accompanying unaudited pro forma information. The unaudited pro forma information has been prepared by management and is not necessarily indicative of the actual results that would have been realized had the transactions contemplated above as of the dates indicated, nor is it meant to be indicative of any future results of operations that we will experience going forward.
Liquidity, Liabilities and Financing Agreements
Liquidity and Capital Resources
Our ability to generate cash from our operations depends on our future operating performance, which is in turn dependent, to some extent, on general economic, financial, competitive, market, legislative, regulatory and other factors, many of which are beyond our control.
We continuously undertake capital expenditure projects in order to increase our efficiency and production capacity. Many of our capital expenditures have been made to rationalize our manufacturing footprint in order to optimize our resources in each geographic region in which we operate.
On November 8, 2013, we refinanced our legacy debt structure with a new bond issuance and term loan structure in order to establish a sustainable credit structure, strategically position our business for future growth and fund current working capital needs across all of our jurisdictions. On February 10, 2015, we issued $85,000 of additional notes.
Table Of Contents
51
North American ABL Facility
On May 31, 2013, the Company entered into the North American asset-backed lending facility (the "NA ABL Facility") with General Electric Capital Corporation and certain other financial institutions party thereto from time to time in conjunction with the Exopack acquisition. The NA ABL Facility provides a maximum credit facility of $75,000, which includes a Canadian dollar sub-facility available to the Company’s Canadian subsidiaries for up to $15,000 (the Canadian dollar equivalent). The NA ABL Facility also provides the Company’s United States and Canadian subsidiaries with letter of credit sub-facilities. Availability under the NA ABL Facility is subject to borrowing base limitations for both the U.S. and the Canadian subsidiaries, as defined in the loan agreement. In general, in the absence of an event of default, the NA ABL Facility matures on November 8, 2018.
On May 2, 2014, the Company entered into an agreement with the Company's lender to engage the $25,000 accordion feature under the NA ABL Facility. In addition, the Company entered into an agreement on July 18, 2014, to increase the available borrowings under the NA ABL Facility from $100,000 to $110,000 through the collateralization of KubeTech accounts receivable and inventory. The increase in borrowing availability gives the Company flexibility to fund incremental working capital needs as the Company continues to expand.
Availability under the NA ABL Facility is capped at the lesser of the then-applicable commitment and the borrowing base. The borrowing base consists of a percentage of eligible trade receivables and eligible inventory owned by U.S. borrowers, in the case of U.S. borrowings, or Canadian borrowers, in the case of Canadian borrowings. Under the terms of a lock box arrangement, remittances automatically reduce the revolving debt outstanding on a daily basis and therefore the NA ABL Facility is included in the current portion of interest-bearing debt and capital leases on the Company's combined consolidated balance sheets as of December 31, 2014 and 2013.
Interest accrues on amounts outstanding under the U.S. facility at a variable annual rate equal to the US Index Rate plus 1.00% to 1.25%, depending on the utilization of the NA ABL Facility, or at the Company's election, at an annual rate equal to the LIBOR Rate (as defined therein) plus 2.00% to 2.25%, depending on utilization. In general, interest will accrue on amounts outstanding under the Canadian sub-facility subsequent at a variable rate equal to the Canadian Index Rate (as defined therein) plus 1.00% to 1.25%, depending upon utilization, at the Company's election, at an annual rate equal to the BA Rate (as defined therein) plus 2.00% to 2.25%, depending upon utilization. Pricing will increase by an additional 50 basis points above the rates described in the foregoing sentences on any loans made against the last 5.00% of eligible accounts receivable and eligible inventory. The NA ABL Facility also includes unused facility, ticking and letter-of-credit fees which are reflected in interest expense. The weighted average interest rate on borrowings outstanding under the NA ABL Facility was 2.70% as of December 31, 2014.
The NA ABL Facility is secured by the accounts receivable, inventory, proceeds therefrom and related assets of the Exopack Business on a first lien basis (subject to permitted liens) and by substantially all other asset of the legacy Exopack business on a second lien basis (subject to permitted liens). However, the assets of any non-U.S. entities in the legacy Exopack business do not secure the obligations under the U.S. facility.
The NA ABL Facility contains certain customary affirmative and negative covenants restricting the Company’s and its subsidiaries’ ability to, among other things, incur additional indebtedness, grant liens, engage in mergers, acquisitions and asset sales, declare dividends and distributions, redeem or repurchase equity interests, incur contingent obligations, prepay certain subordinated indebtedness, make loans, certain payments and investments and enter into transactions with affiliates. As of December 31, 2014, the Company was in compliance with these covenants.
As of December 31, 2014, $73,853 was outstanding and $17,929 was available for additional borrowings, net of outstanding letters of credit of $4,486 under the NA ABL Facility.
The Company recognized $720 in deferred financing costs related to the amendment of the NA ABL Facility in 2013, which are being amortized on a straight-line basis over the term of the NA ABL Facility.
European ABL Facility
On November 8, 2013, the Company entered receivables and inventory financing arrangements in each of France, Germany and the United Kingdom whereby cash is made available to the Company in consideration for inventory and certain trade receivables generated in these respective countries. The aggregate of any advances or borrowings under the GE French Facilities, the GE Germany Facilities and the GE UK Facility is limited to $175,000 (equivalent) and the GE French Facilities, the GE Germany
Table Of Contents
52
Facilities and the GE UK Facility and the security and guarantees granted in respect thereof are, in the cases of the GE French Facilities and the GE UK Facility, subject to the terms of the Intercreditor Agreement.
As of December 31, 2014, $89,642 was outstanding and approximately $57,523 was available for additional borrowings under the European ABL Facility. The weighted average interest rate on borrowings outstanding under the European ABL Facility was 2.95% as of December 31, 2014.
France
Under the French Facilities with GE Factofrance and Cofacredit (the “Factors”), certain wholly-owned subsidiaries shall sell and assign to the Factors certain debts which, subject to the terms and conditions of the French Facilities, the assignees are obliged to buy and accept. The sale price for the assigned debt is approximately 85%. The facilities are non-recourse facilities. The maximum aggregate funded amount under the French Facilities is limited to €48,000. The French Facilities have an unfixed term with a five year commitment period under which the Factors shall not be entitled to terminate the contracts except upon the occurrence of (i) a breach of any of the covenants listed under the French Facilities, (ii) an event of default under any facility granted by a GE Capital entity or (iii) a revocation of the mandates as defined under the contracts. Apart from the commitment period, any termination of the contracts requires three months’ prior notice, save that (i) the Factors may terminate at any time without prior notice upon the occurrence of certain events described under the French Facilities, (ii) the parties may terminate if Coveris Holdings S.A ceases to directly or indirectly own at least 51% of the equity interests of the Company, (iii) the Factors may terminate the contracts with a ten (10) working days prior notice, and with immediate effect in the event any representation or warranty made by Coveris Holdings S.A. pursuant to the Side Letter is not complied with or proves to have been incorrect or misleading when made or deemed to be made and is not remedied within the above notice period by any means or party. Within the frame of the French Facilities, certain wholly-owned subsidiaries have pledged to the benefit of the Factors, the receivables held over the Factors on the current accounts opened in their books, in order to secure the obligations under the terms of the French Facilities.
Germany
Under the German facilities with GE Capital Bank AG, to be entered into by certain wholly-owned subsidiaries as originators and GE Capital Bank AG as factoring bank (the “GE Germany Facilities”), certain wholly-owned subsidiaries may sell and assign to GE Capital Bank AG certain receivables which, subject to the terms and conditions of the GE Germany Facilities, the assignee is obliged to buy and accept. It is further intended that certain wholly-owned subsidiaries provide certain limited cross guarantees for the benefit of GE Capital Bank AG to guarantee their obligations under the GE Germany Facilities. The factoring fee for the GE Germany Facilities is 0.15% calculated as a multiple of the gross turnover of assigned receivables and bears interest at 3M EURIBOR +2.25%. The facilities are non-recourse facilities. The maximum aggregate funded amount under the GE Germany Facilities is limited to €25,000. The GE Germany Facilities have a five year term and any termination of the contract requires three months’ prior notice to the second anniversary, the third anniversary or the fourth anniversary of the relevant commencement date, save that GE Capital Bank AG may terminate at any time if one of the following termination events, amongst others, occurs: a change of control, a cross-default and breach of the relevant fixed charge coverage.
United Kingdom
Under the GE UK Facility with GE Capital Bank Limited (“GE”), certain wholly-owned subsidiaries (the “Clients”) assign to GE Capital Bank Limited certain debts which, subject to customary conditions, GE is obliged to buy and accept. Certain wholly-owned subsidiaries are guarantors under the GE UK Facility (the “UK Obligors”). The Clients and UK Obligors have granted security in favor of GE over non-vesting debts and a floating charge over all assets subject to the terms of the Intercreditor Agreement. The GE UK Facility is comprised of an invoice finance facility for which the aggregate loan advance limit is £69,000 (the “Invoice Facility”) and a revolving inventory finance facility for which the aggregate current account limit is £20,000 (the “Revolving Inventory Facility”). Under the Invoice Facility, the advance percentage for the assigned debts is 90% of the nominal amount of the debt, subject to reduction in respect of the discount rate, service charges and other liabilities. Under the Revolving Inventory Facility, the loan advance percentage of the eligible inventory is 80% of the net orderly liquidation value of that inventory, subject to reduction in respect of certain customary reserves. The GE UK Facility has recourse terms where the Clients and UK Obligors bear the credit risk of the transactions (including where the underlying debtor fails to pay). The GE UK Facility has a term of five years and any termination of the contract requires either three months’ prior notice where there is a refinancing or one month’s prior notice where there is a sale of the Company. Customary representations and warranties are included in the GE UK Facility and customary restrictions on disposals of assets and granting liens are also included. Events of default include failure to pay, misrepresentation, insolvency, insolvency proceedings, breach of obligations and cross-acceleration and cross-default to other indebtedness of the Clients or the UK Obligors. A mandatory prepayment is required upon the change of control of a Client or UK Obligor subject to minimum thresholds in respect of EBITDA, gross assets or turnover being satisfied. In addition, if the availability
Table Of Contents
53
under the Invoice Facility plus the availability under the Revolving Inventory Facility plus the equivalent concept of availability under the GE Germany Facility and the GE French Facilities is less than $14,583, the Clients shall not permit the ratio of operating cash flow of the Company to the fixed charges of the Company to be less than 1.00:1.00.
$325,000 7 7/8% Senior Notes
On November 8, 2013 the Company issued $325,000 in aggregate principal amount 7 7/8% Senior Notes (the “Senior Notes”) maturing on November 1, 2019. Interest on the Senior Notes is paid semi-annually on each November 1 and May 1, commencing on May 1, 2014. The Senior Notes are senior unsecured obligations of the Company, ranking senior in right of payment to all of the Company's future debt that is expressly subordinated in right of payment to the Senior Notes and rank pari passu in right of payment with the Company's existing and future debt that is not so subordinated, including the Company's obligations under the New Term Loan, the European ABL Facilities, the NA ABL Facility and the Exopack Notes.
The Senior Notes are guaranteed on a senior unsecured basis (the “Guarantees”) by substantially all of the Company's subsidiaries organized in the United States, the United Kingdom, Canada, Austria, Germany, Finland, Luxembourg and Poland (the “Guarantors”). Each of the Guarantees ranks senior in right of payment to the applicable Guarantor’s future debt that is expressly subordinated in right of payment to such Guarantee and ranks pari passu in right of payment with such Guarantor’s existing and future debt that is not so subordinated, including the applicable Guarantor’s obligations under the New Term Loan, the European ABL Facilities, the NA ABL Facility and the Exopack Notes, as applicable. The validity and enforceability of the Guarantees and the liability of each Guarantor is subject to certain limitations described in the offering memorandum relating to the Senior Notes dated October 24, 2013. The Notes and Guarantees are structurally subordinated to all obligations of the Company's subsidiaries that do not guarantee the Notes and effectively subordinated to any existing and future secured debt of the Company and its subsidiaries, to the extent of the value of the property and assets securing such debt.
At any time prior to November 1, 2016, the Company may on any one or more occasions redeem up to 40% of the aggregate principal amount of the Notes issued under the Indenture, upon not less than 30 nor more than 60 days’ notice, at a redemption price equal to 107.875% of the principal amount of the Notes redeemed, plus accrued and unpaid interest and Additional Amounts, if any, to the date of redemption, with the net cash proceeds of an Equity Offering of (i) the Company or (ii) any Parent Holdco of the Company to the extent the proceeds from such Equity Offering are contributed to the Company’s common equity capital or are paid to the Company as consideration for the issuance of ordinary shares; provided that:
(1) at least 60% of the aggregate principal amount of the Notes originally issued under the Indenture (excluding Notes held by the Company and its Subsidiaries) remains outstanding immediately after the occurrence of such redemption; and
(2) the redemption occurs within 120 days of the date of the closing of such Equity Offering.
Further, at any time prior to November 1, 2016, the Company may on any one or more occasions redeem all or a part of the Notes upon not less than 30 nor more than 60 days’ notice, at a redemption price equal to 100% of the principal amount of such Notes redeemed plus the Applicable Premium, as defined in the Indenture governing the Senior Notes, as of, and accrued and unpaid interest and Additional Amounts, as defined in the Indenture, if any, to the date of redemption.
On or after November 1, 2016, the Company may on any one or more occasions redeem all or a part of the Notes upon not less than 30 nor more than 60 days’ notice (subject to such longer period as may be determined by the Company, in the case of a defeasance of the Notes or a satisfaction and discharge of the Indenture), at the redemption prices (expressed as percentages of principal amount) set forth below, plus accrued and unpaid interest and Additional Amounts, if any, on the Notes redeemed, to the applicable date of redemption, if redeemed during the twelve-month period beginning on November 1 of the years indicated below:
Year Redemption Price2016 103.938%2017 101.969%2018 and thereafter 100.000%
Unless the Company defaults in the payment of the redemption price, interest will cease to accrue on the Notes or portions thereof called for redemption on the applicable redemption date.
Any redemption and notice may, in the Company's discretion, be subject to the satisfaction of one or more conditions precedent.
Table Of Contents
54
The Senior Notes require the Company to comply with customary affirmative and negative covenants applicable to the Company and its restricted subsidiaries. Set forth below is a brief description of the affirmative and negative covenants, all of which will be subject to customary exceptions, materiality thresholds and qualifications, including, in the case of certain negative covenants, the ability to grow baskets with retained excess cash flow, the proceeds of qualified equity issuances and certain other amounts:
• The affirmative covenants include the following: (i) delivery of financial statements and other customary financial information; (ii) notices of events of default and other material events; (iii) maintenance of existence, ability to conduct business, properties, insurance and books and records; (iv) payment of certain obligations; (v) inspection rights; (vi) compliance with laws, including employee benefits and environmental laws; (vii) use of proceeds; (viii) further assurances; (ix) additional collateral and guarantor requirements; (x) maintenance of ratings; (xi) designation of unrestricted subsidiaries; (xii) information regarding collateral; and (xiv) post-closing matters.
• The negative covenants include limitations on: (i) indebtedness and the issuance of preferred stock; (ii) restricted payments; (iii) liens; (iv) dividend and other payment restrictions; (v) layered debt; (vi) mergers, consolidation or sale of assets and (vii) transactions with affiliates.
As of December 31, 2014, the Company was in compliance with all of these covenants. On February 10, 2015, we issued $85,000 in additional Senior Notes under the indenture, dated as of November 8, 2013. The additional Senior Notes are fully fungible with the original Senior Notes.
$235,000 10% Exopack Notes
On May 31, 2013, the Company assumed the $235,000 10% Notes (the "Exopack Notes") in conjunction with the Exopack acquisition. The Exopack Notes were issued pursuant to the indenture dated May 31, 2011, between, among others, Exopack and The Bank of New York Mellon Trust Company, N.A., as trustee. Exopack issued $235,000 in aggregate principal amount of unregistered senior notes. Included in the carrying value of the Exopack notes is an unamortized note premium of $402 recorded in conjunction with the purchase price allocation of the Exopack acquisition. This debt premium to record the Exopack Notes at fair value on the acquisition date is amortized on a straight line basis from the acquisition date through the maturity date of June 1, 2018.
The Exopack Notes accrue interest at the rate of 10% per annum and payable semi-annually on each June 1 and December 1.
The Exopack Notes are senior unsecured obligations of the Company and rank equally in right of payment with all existing and future senior indebtedness of Exopack, rank senior in right of payment to any future subordinated indebtedness of Exopack, and are effectively subordinated to any secured indebtedness of Exopack up to the value of the collateral securing such indebtedness. The Exopack Notes are unconditionally guaranteed, jointly and severally, on a senior basis, by the Guarantors that also guarantee the Senior Notes (except for the subsidiaries of Exopack that are organized outside of the United States). The guarantees of the Exopack Notes rank equally in right of payment with all existing and future senior indebtedness of the guarantors, rank senior in right of payment to any future subordinated indebtedness of the guarantors, and are effectively subordinated to any secured indebtedness of the guarantors, including the New Term Loan), up to the value of the collateral securing such indebtedness. The guarantees of the Exopack Notes may be released under certain conditions, including the sale or other disposition of all or substantially all of the guarantor subsidiary’s assets, the sale or other disposition of all the capital stock of the guarantor subsidiary, change in the designation of any restricted subsidiary as an unrestricted subsidiary by Exopack, or upon legal defeasance or satisfaction and discharge of the Exopack Notes.
Exopack is not required to make mandatory redemption or sinking fund payments with respect to the Exopack Notes.
If Exopack experiences a change of control, Exopack must offer to repurchase the Exopack Notes at a price equal to 101% of the aggregate principal amount of the Exopack Notes, plus accrued and unpaid interest and additional amounts, if any, to the date of purchase.
The Exopack Notes Indenture contains customary events of default, including, without limitation, payment defaults, covenant defaults, certain cross-defaults to mortgages, indentures or other instruments, certain events of bankruptcy and insolvency, and judgment defaults. The Exopack Notes Indenture contains covenants for the benefit of the holders of the Exopack Notes substantially similar to the covenants that govern the Senior Notes. As of December 31, 2014, the Company was in compliance with all of these covenants.
New Term Loan
Table Of Contents
55
On November 8, 2013, the Company entered into a credit agreement (the “New Term Loan”) with Goldman Sachs Bank USA, as administrative and collateral agent and the certain financial institutions and other persons party thereto as lenders from time to time. The Company borrowed a single draw dollar denominated term loan of approximately $435,000 (the "New Term Loan - USD Tranche") in principal amount and a single draw euro denominated term loan of approximately €175,000 (the "New Term Loan - EUR Tranche") in principal amount pursuant to the New Term Loan Facility Agreement. As of December 31, 2014 there was $430,650 and $210,585 of principal outstanding on the USD Tranche and EUR Tranche, respectively.
The New Term Loan matures on May 8, 2019. Should the maturity of the Exopack Notes not be extended (and the Exopack Notes remain outstanding at the time), the maturity of the New Term Loan will be automatically shortened to the date that is 91 days prior to the maturity date of the Exopack Notes. The term loan shall be repayable in equal quarterly installments of 1.00% per annum of the original principal amounts.
The Company may also incur an incremental term loan under the New Term Loan from time to time in an amount not to exceed $50,000 plus an unlimited amount subject to meeting a secured net leverage ratio approximately equal to the secured net leverage ratio as of November 8, 2013. The incurrence of an incremental term loan is subject to various customary conditions, including locating a lender or lenders willing to provide it.
The New Term Loan, at the Company’s option, will from time to time bear interest at either (i) with respect to loans denominated in dollars, (a) 3.25% in excess of the alternate base rate (i.e., the greatest of the prime rate, the federal funds effective rate in effect on such day plus 1/2 of 1%, and the London interbank offer rate (after giving effect to any floor) for an interest period of one month) in effect from time to time, or (b) 4.25% in excess of the London interbank offer rate (adjusted for maximum reserves), and (ii) with respect to loans denominated in euros, 4.75% in excess of the euro interbank offer rate (adjusted for maximum reserves). The London interbank offer rate and the euro interbank offer rate will be subject to a floor of 1.00% and the alternate base rate will subject to a floor of 2.00%. Interest will be payable quarterly in arrears and at maturity. The interest rate applicable to amounts outstanding on the New Term Loan - USD Tranche was 5.25% as of December 31, 2014. The applicable interest rate applicable to amounts outstanding on the New Term Loan - EUR Tranche was 5.75% as of December 31, 2014.
All obligations of the Company under the New Term Loan and any secured hedging arrangements and secured cash management agreements provided by lenders or affiliates thereof will be unconditionally guaranteed by the Guarantors.
Subject to customary agreed security principles, certain excluded ABL collateral under the GE Germany Facilities and the French Facilities and the lien priorities, the New Term Loan Facility will be secured by substantially all assets of the Company and the Guarantors.
The New Term Loan Facility Agreement does not include any financial covenants.
The New Term Loan has customary events of default (subject to materiality thresholds and standstill and grace periods), including: (a) non-payment of obligations (subject to a five business day grace period in the case of interest and fees); (b) breach of representations, warranties and covenants (subject to a thirty-day grace period following written notice in the case of certain covenants); (c) bankruptcy (voluntary or involuntary); (d) inability to pay debts as they become due; (e) cross default and cross acceleration to material indebtedness; (f) ERISA events; (g) change in control; (h) invalidity of liens, guarantees, subordination agreements; and (i) judgments.
The New Term Loan requires the Company to comply with customary affirmative and negative covenants applicable to the Company and its restricted subsidiaries. Set forth below is a brief description of the affirmative and negative covenants, all of which will be subject to customary exceptions, materiality thresholds and qualifications, including, in the case of certain negative covenants, the ability to grow baskets with retained excess cash flow, the proceeds of qualified equity issuances and certain other amounts:
• The affirmative covenants include the following: (i) delivery of financial statements and other customary financial information; (ii) notices of events of default and other material events; (iii) maintenance of existence, ability to conduct business, properties, insurance and books and records; (iv) payment of certain obligations; (v) inspection rights; (vi) compliance with laws, including employee benefits and environmental laws; (vii) use of proceeds; (viii) further assurances; (ix) additional collateral and guarantor requirements; (x) maintenance of ratings; (xi) designation of unrestricted subsidiaries; (xii) information regarding collateral; and (xiv) post-closing matters.
• The negative covenants include limitations on: (i) liens; (ii) debt (including guaranties); (iii) fundamental changes; (iv) dispositions (including sale leasebacks); (v) affiliate transactions; (vi) investments (vii) restrictive agreements, and no negative pledges; (viii) restricted payments; (ix) voluntary prepayments of unsecured and subordinated debt;
Table Of Contents
56
(x) amendments to certain debt agreements and organizational documents; (xi) changes of business, center of main interests or fiscal years; and (xii) anti-terrorism and sanctions related matters.
As of December 31, 2014, the Company was in compliance with all of these covenants.
GBP Revolving Credit Facility
On October 18, 2013, the Company entered into a Loan Authorization Agreement (the "GBP Revolving Credit Facility") with Bank of Montreal Ireland P.L.C.
Borrowings on the GBP Revolving Credit Facility are payable on demand; provided that to the extent funds are not immediately available, the Company shall have ten business days to honor any demand for payment requested by Bank of Montreal Ireland P.L.C. Borrowings are guaranteed by a related party parent, Sun Capital Partners V, L.P.
As of December 31, 2014, there was $65,679 (£42,286) outstanding on the GBP Revolving Credit Facility, which accrues interest on all outstanding amounts at an interest rate of 3.50% above Adjusted LIBOR, as set forth in the Loan Authorization Agreement dated October 18, 2013. The applicable interest rate as of December 31, 2014 was 4.20%.
PNC Term Loan and Revolver
On February 8, 2013, KubeTech entered into a revolving credit, term loan and security agreement (the "PNC Credit Agreement") with PNC Bank with total commitments of $32,250. The total commitments consisted of $10,000 in term loans ("PNC Term Loans") and a $22,250 revolving loan advance ("PNC Revolving Loan"). The PNC Credit Agreement was secured by substantially all of the assets of KubeTech and was guaranteed by Rose HPC.
As a part of the acquisition of KubeTech by the Company on May 30, 2014, the outstanding principal and interest on the PNC Term Loans and PNC Revolving Loan were paid in full. The total pay off amount was $16,446, including accrued interest of $373. Unamortized deferred financing costs totaling $190 were written off as a result of the settlement of the facilities.
Related Party Note
As of the formation of KubeTech on December 31, 2012, KubeTech executed a subordinated promissory note with Albea, a related party owned by Sun Capital, for an aggregate amount of $18,000 (the "Related Party Note"). On January 8, 2013, KubeTech sold all of its shares in its Poland facility to Albea for $3,000, the total of which was applied to the principal of the Related Party Note. The Related Party Note is subordinate to the PNC Credit Agreement. Interest accrued at a rate of 10% and was capitalized to principal annually. The Related Party Note was scheduled to mature on December 31, 2017.
Following the acquisition of KubeTech by the Company on May 30, 2014, the Company made a cash payment of $4,600 to settle the Related Party Note, which included both outstanding interest and principal. An additional $9,918 of principal and $1,012 of accrued interest was forgiven and accounted for as a capital contribution along with $651 in equipment transfers to Albea. The remainder of the Related Party Note was satisfied through the settlement of related party trading balances owed to KubeTech by Albea.
Shareholder loans
As of December 31, 2014 and December 31, 2013, the Company had related party shareholder loans which are PECs, ALPECs or YFPECs.
On January 23, 2013 Neuheim Lux Group Holding V exercised its option to convert the £0.6 million yield free convertible PECs to shares. 585,531 shares in Paragon Management S.a.r.l. were issued to Neuheim Lux Group Holding V, increasing the number of shares outstanding in Paragon Management S.a.r.l. to 616,209.
On May 31, 2013, the shareholder loans of Paccor, Britton, Kobusch and Paragon were redeemed by the shareholders in exchange for newly issued YFPECs. As part of the restructuring, YFPECs (including the new instruments issued in connection with the redemption of CPECs) were subsequently transferred to Coveris Holdings S.A. in exchange for shares while PECs and ALPECs were transferred by the shareholders at book value in exchange for new PECs and ALPECs with the same terms. The Company converted the remaining accrued interest related to the previously redeemed shareholder loans into equity during the year ended December 31, 2013.
Table Of Contents
57
Liquidity Discussion
As of December 31, 2014, we had approximately $17,929 of available borrowing capacity under our North American ABL Facility and $57,523 under our European ABL Facilities. On May 2, 2014, we entered into a commitment increase with our lender to engage the $25,000 accordion feature with the NA ABL Facility. This commitment increase gives us the flexibility to fund incremental working capital needs as we continue to expand. We believe our future operating cash flow and available liquidity will be sufficient to support our operations, funds our working capital and capital expenditure needs, as well as provide for scheduled interest and principal payments for the next twelve months.
As of December 31, 2014, we had $1,487,310 of third party, interest-bearing debt (including capital lease obligations). As of December 31, 2014, we had $51,679 in cash and cash equivalents on hand. We expect that our principal sources of liquidity will be borrowings with our North American ABL Facility, European ABL Facility, factoring lines, cash flow from operations and reduced capital spending.
Net working capital (current assets less current liabilities) decreased $93,288 to $59,236 as of December 31, 2014 from $152,524 as of December 31, 2013. The decrease from the prior year end is largely attributable to decreased cash, accounts receivable and inventory balances, timing of borrowings and repayments on our NA ABL Facility and European ABL Facility and the acquisitions of KubeTech and St. Neots.
Cash decreased $17,808 from December 31, 2013, compared to a $36,074 decrease from December 31, 2012 to December 31, 2013.
Cash provided by operating activities were $77,636 for the year ended December 31, 2014 and $53,502 for the year ended December 31, 2013, or an increase of $24,134. The increase in operating cash flows is primarily due to the company’s improved performance and decreased accounts receivable and inventory balances.
Cash used in investing activities for the years ended December 31, 2014 and 2013 was $139,122 and $221,144, respectively. The decrease is primarily due to lower acquisition activity. The prior year includes $103,869 of cash outflows for acquisitions, net of cash acquired, for Intelicoat and Closures and for the original acquisition of KubeTech by Sun Capital. The original KubeTech acquisition is included in our prior year cash flows due to the common control nature of the transaction. In the current year, $33,455 was paid for acquisitions, net of cash acquired, related to the acquisitions of St. Neots and Learoyd. Additionally, capital spending is down from the prior year.
Cash provided by financing activities for the year ended December 31, 2014 was $47,580 compared to $136,740 for the year ended December 31, 2013. This decrease is primarily related to borrowings and repayments on our North American and European ABL Facilities and payments of legacy debt assumed in acquisitions. The increased use of our various credit facilities is due to working capital needs. See Note 7. Financing Arrangements for further discussion of our debt structure.
Contractual Obligations
The following table summarizes the scheduled payments and obligations under our contractual and other commitments as of December 31, 2014:
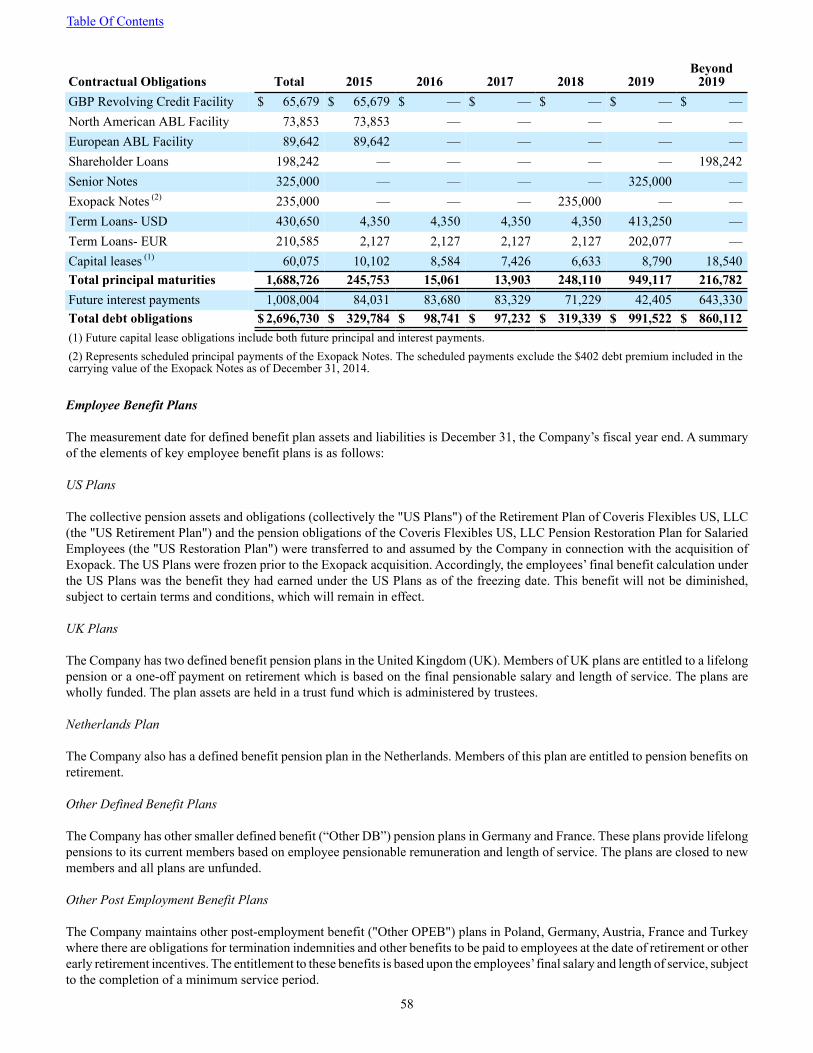
Table Of Contents
58
Contractual Obligations Total 2015 2016 2017 2018 2019Beyond
2019GBP Revolving Credit Facility $ 65,679 $ 65,679 $ — $ — $ — $ — $ —North American ABL Facility 73,853 73,853 — — — — —European ABL Facility 89,642 89,642 — — — — —Shareholder Loans 198,242 — — — — — 198,242Senior Notes 325,000 — — — — 325,000 —Exopack Notes (2) 235,000 — — — 235,000 — —Term Loans- USD 430,650 4,350 4,350 4,350 4,350 413,250 —Term Loans- EUR 210,585 2,127 2,127 2,127 2,127 202,077 —Capital leases (1) 60,075 10,102 8,584 7,426 6,633 8,790 18,540Total principal maturities 1,688,726 245,753 15,061 13,903 248,110 949,117 216,782Future interest payments 1,008,004 84,031 83,680 83,329 71,229 42,405 643,330Total debt obligations $ 2,696,730 $ 329,784 $ 98,741 $ 97,232 $ 319,339 $ 991,522 $ 860,112(1) Future capital lease obligations include both future principal and interest payments.(2) Represents scheduled principal payments of the Exopack Notes. The scheduled payments exclude the $402 debt premium included in thecarrying value of the Exopack Notes as of December 31, 2014.
Employee Benefit Plans
The measurement date for defined benefit plan assets and liabilities is December 31, the Company’s fiscal year end. A summary of the elements of key employee benefit plans is as follows:
US Plans
The collective pension assets and obligations (collectively the "US Plans") of the Retirement Plan of Coveris Flexibles US, LLC (the "US Retirement Plan") and the pension obligations of the Coveris Flexibles US, LLC Pension Restoration Plan for Salaried Employees (the "US Restoration Plan") were transferred to and assumed by the Company in connection with the acquisition of Exopack. The US Plans were frozen prior to the Exopack acquisition. Accordingly, the employees’ final benefit calculation under the US Plans was the benefit they had earned under the US Plans as of the freezing date. This benefit will not be diminished, subject to certain terms and conditions, which will remain in effect.
UK Plans
The Company has two defined benefit pension plans in the United Kingdom (UK). Members of UK plans are entitled to a lifelong pension or a one-off payment on retirement which is based on the final pensionable salary and length of service. The plans are wholly funded. The plan assets are held in a trust fund which is administered by trustees.
Netherlands Plan
The Company also has a defined benefit pension plan in the Netherlands. Members of this plan are entitled to pension benefits on retirement.
Other Defined Benefit Plans
The Company has other smaller defined benefit (“Other DB”) pension plans in Germany and France. These plans provide lifelong pensions to its current members based on employee pensionable remuneration and length of service. The plans are closed to new members and all plans are unfunded.
Other Post Employment Benefit Plans
The Company maintains other post-employment benefit ("Other OPEB") plans in Poland, Germany, Austria, France and Turkey where there are obligations for termination indemnities and other benefits to be paid to employees at the date of retirement or other early retirement incentives. The entitlement to these benefits is based upon the employees’ final salary and length of service, subject to the completion of a minimum service period.
Table Of Contents
59
During the year ended December 31, 2014 we recorded a net periodic pension benefit of $1,319, which included interest cost of $7,627 at assumed rates ranging between of 1.8% and 4.9%, service cost of $1,268, offset by $8,271 of expected returns on plan assets at assumed rates ranging between 3.7% and 7.0%. During the year ended December 31, 2013, we recorded a net periodic pension benefit of $2,844, which included interest cost of $3,864 at assumed rates ranging between of 3.2% and 4.7%, service cost of $3,331, partially offset by $10,039 of expected returns on plan assets at assumed rates ranging between 3.2% and 7.0%.
During the year ended December 31, 2014, we recorded net periodic postretirement cost of $986, which included interest cost of $421 at the assumed rate of 3.5%, service cost of $623 and expected return on plan assets of $4. During the year ended December 31, 2013, we recorded net periodic postretirement cost of $1,163, which included interest expense of $487 at the assumed rate of 0.9%, service cost of $564 and expected return on plan assets of $112.
We expect to make contributions of $1,791 to the various pension plans in 2015.
The projected pension liability of these plans will be affected by assumptions regarding inflation, investment returns, market interest rates, changes in the number of plan participants, changes in the benefit obligations, and laws and regulations pertaining to benefit obligations. We annually reevaluate assumptions used in projecting the pension and postretirement liabilities and associated expense (income). These judgments, assumptions and estimates may affect the carrying value of pension plan assets and pension plan and postretirement plan liabilities and pension and postretirement plan expense (income) in our consolidated financial statements included elsewhere in this report.
As of December 31, 2014, the fair value of the assets of the various pension plans was $174,921, up from $160,857 at December 31, 2013. Our minimum required contributions to our pension plans for fiscal year 2015 and thereafter may increase or decrease depending on volatility with respect to future global stock market valuations.
Critical Accounting Policies and Estimates
For discussion on our critical accounting policies and estimates, please see Section III, Note 1, "Organization and Significant Accounting Policies" to be read in conjunction with Note 2, "Recent Accounting Pronouncements."
Table Of Contents
60
Quantitative and Qualitative Information Regarding Market and Operating Risks
Our operations are exposed to different financial risks, including foreign exchange risk, interest rate risk and counterparty risk. Our risk management is coordinated at our headquarters, in close cooperation with our executive committee, and focuses on securing our short- to medium-term cash flows by minimizing the exposure to financial markets.
Foreign Exchange Risk
Transactional risk arises when our subsidiaries execute transactions in a currency other than their functional currency. We currently operate facilities in 17 different countries, and sell our products into approximately 95 countries. As a result, we generate a significant portion of our sales and incur a significant portion of our expenses in currencies other than the U.S. dollar. The primary currencies in which we generated revenues are the euro, the U.S. dollar and the British pound sterling. Where we are unable to match sales received in foreign currencies with costs paid in the same currency, our results of operations are impacted by currency exchange rate fluctuations. For example, a stronger U.S. dollar will increase the cost of U.S. dollar supplies for our non-U.S. businesses and conversely decrease the cost of non-U.S. dollar supplies for our U.S. dollar businesses. Our subsidiaries generally execute their sales and incur most of their materials costs in the same currency. We have entered into a series of forward contracts and foreign currency options in an effort to reduce the effect of exchange rate fluctuations on our financial statements related to our future debt principal and interest payments in U.S. dollars from cash flows largely generated in British pounds and euros.
We present our consolidated financial statements in U.S. dollars. As a result, we must translate the assets, liabilities, revenue and expenses of all of our operations with a functional currency other than the U.S. dollars into U.S. dollars at then-applicable exchange rates. Consequently, increases or decreases in the value of these currencies against the U.S. dollar may affect the value of our assets, liabilities, revenue and expenses with respect to our non-U.S. dollar businesses in our combined consolidated financial statements, even if their value has not changed in their original currency, which creates translation risk.
Interest Rate Risk
Interest rate risk relates to a negative impact on our profits arising from changes in interest rates. Our income and operating cash flow are also dependent on changes in market interest rates. Some balance sheet items, such as cash and bank balances, interest bearing investments and borrowings, are exposed to interest rate risk. Borrowings under our New Term Loan, NA ABL Facility and European ABL Facilities bear interest at variable rates. Because these rates may increase or decrease at any time, we are subject to the risk that they may increase, thereby increasing the interest rates applicable to our borrowings under these facilities. Increases in the applicable rates would increase our interest expense and reduce our net income or increase our net loss. We do not have any instruments in place, such as interest rate swaps or caps, which would mitigate our exposure to interest rate risk related to these borrowings. Based on the amount of borrowings outstanding as of December 31, 2014, the effect of a hypothetical 0.125% increase in interest rates would increase our annual interest expense on third party variable rate debt by approximately $1,494.
Borrowings under the Senior Notes and Exopack Notes bear interest at a fixed rate. For fixed rate debt, interest rate changes affect the fair market value of such debt, but do not impact earnings or cash flow. We currently do not intend to enter into hedging arrangements with respect to our variable rate borrowings, which will primarily be borrowings under the New Term Loan, the NA ABL Facility and the European ABL Facilities and other local working capital borrowing.
Table Of Contents
F - 1
SECTION III
COVERIS HOLDINGS S.A.INDEX TO THE COMBINED CONSOLIDATED FINANCIAL STATEMENTS
Page
Independent Auditor's Report
Combined Consolidated Balance Sheets as of December 31, 2014 and 2013
Combined Consolidated Statements of Operations for the Years Ended December 31, 2014 and 2013
Combined Consolidated Statements of Comprehensive Income (Loss) for the Years Ended December 31, 2014 and 2013
Combined Consolidated Statements of Shareholders' Equity (Deficiency) for the Years Ended December 31, 2014 and 2013
Combined Consolidated Statements of Cash Flows for the Years Ended December 31, 2014 and 2013
Notes to the Combined Consolidated Financial Statements
F - 2
F - 3
F - 4
F - 5
F - 6
F - 7
F - 9
Table Of Contents
F - 2
Independent Auditor's Report To the Shareholder ofCoveris Holdings S.A.
We have audited the accompanying combined consolidated financial statements of Coveris Holdings S.A. and its subsidiaries (together referred to as the “Group”), which comprise the combined consolidated balance sheets as of 31 December 2014 and 2013, and the related combined consolidated statements of operations, of comprehensive income (loss), of shareholders’ equity (deficiency) and of cash flows for the two years ended 31 December 2014.
Management’s responsibility for the combined consolidated financial statements
Management is responsible for the preparation and fair presentation of the combined consolidated financial statements in accordance with accounting principles generally accepted in the United States of America; this includes the design, implementation, and maintenance of internal control relevant to the preparation and fair presentation of combined consolidated financial statements that are free from material misstatement, whether due to fraud or error.
Auditor’s responsibility
Our responsibility is to express an opinion on the combined consolidated financial statements based on our audit. We conducted our audit in accordance with auditing standards generally accepted in the United States of America. Those standards require that we plan and perform the audit to obtain reasonable assurance about whether the combined consolidated financial statements are free from material misstatement.
An audit involves performing procedures to obtain audit evidence about the amounts and disclosures in the combined consolidated financial statements. The procedures selected depend on our judgment, including the assessment of the risks of material misstatement of the combined consolidated financial statements, whether due to fraud or error. In making those risk assessments, we consider internal control relevant to the Group’s preparation and fair presentation of the combined consolidated financial statements in order to design audit procedures that are appropriate in the circumstances, but not for the purpose of expressing an opinion on the effectiveness of the Group’s internal control. Accordingly, we express no such opinion. An audit also includes evaluating the appropriateness of accounting policies used and the reasonableness of significant accounting estimates made by Management, as well as evaluating the overall presentation of the combined consolidated financial statements.
We believe that the audit evidence we have obtained is sufficient and appropriate to provide a basis for our audit opinion.
Opinion
In our opinion, the combined consolidated financial statements referred to above present fairly, in all material respects, the financial position of Coveris Holdings S.A. at 31 December 2014 and 2013, and the results of its operations and its cash flows for the years then ended December 31, 2014 in accordance with accounting principles generally accepted in the United States of America.
/s/ PricewaterhouseCoopers, Société coopérative Luxembourg, March 26, 2015
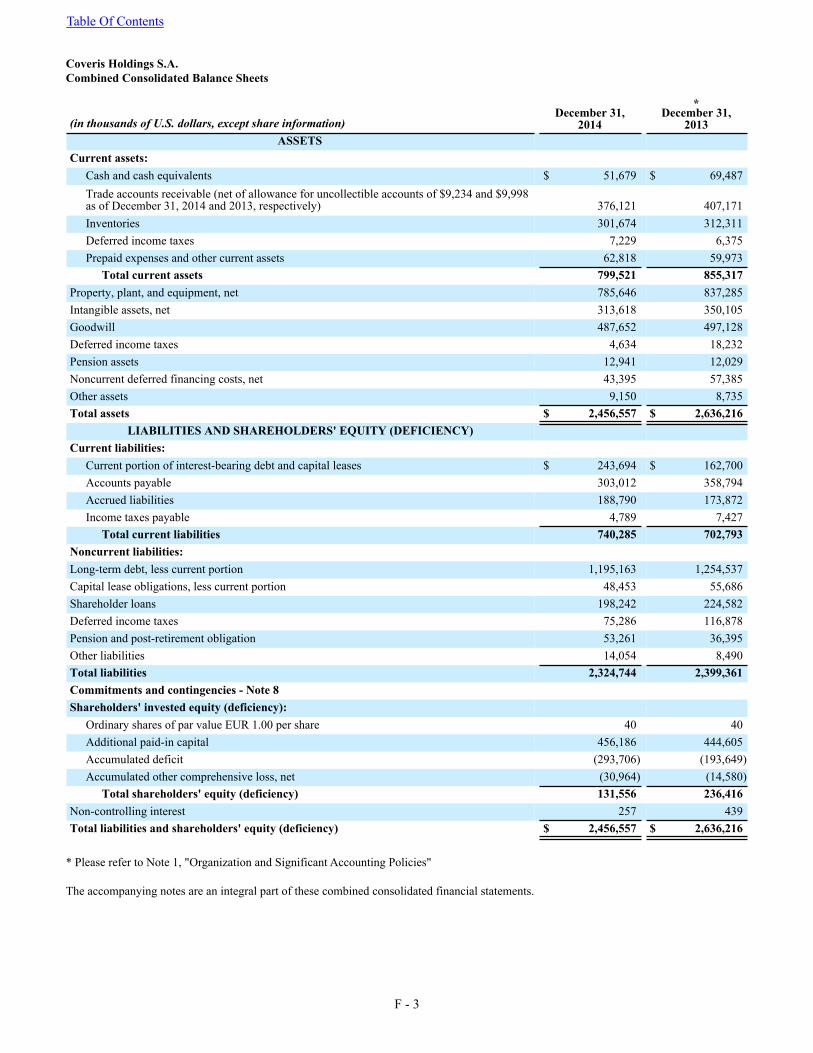
Table Of Contents
F - 3
Coveris Holdings S.A.Combined Consolidated Balance Sheets
*
(in thousands of U.S. dollars, except share information)December 31,
2014December 31,
2013ASSETS
Current assets:Cash and cash equivalents $ 51,679 $ 69,487Trade accounts receivable (net of allowance for uncollectible accounts of $9,234 and $9,998as of December 31, 2014 and 2013, respectively) 376,121 407,171Inventories 301,674 312,311Deferred income taxes 7,229 6,375Prepaid expenses and other current assets 62,818 59,973
Total current assets 799,521 855,317Property, plant, and equipment, net 785,646 837,285Intangible assets, net 313,618 350,105Goodwill 487,652 497,128Deferred income taxes 4,634 18,232Pension assets 12,941 12,029Noncurrent deferred financing costs, net 43,395 57,385Other assets 9,150 8,735Total assets $ 2,456,557 $ 2,636,216
LIABILITIES AND SHAREHOLDERS' EQUITY (DEFICIENCY)Current liabilities:
Current portion of interest-bearing debt and capital leases $ 243,694 $ 162,700Accounts payable 303,012 358,794Accrued liabilities 188,790 173,872Income taxes payable 4,789 7,427
Total current liabilities 740,285 702,793Noncurrent liabilities:Long-term debt, less current portion 1,195,163 1,254,537Capital lease obligations, less current portion 48,453 55,686Shareholder loans 198,242 224,582Deferred income taxes 75,286 116,878Pension and post-retirement obligation 53,261 36,395Other liabilities 14,054 8,490Total liabilities 2,324,744 2,399,361Commitments and contingencies - Note 8Shareholders' invested equity (deficiency):
Ordinary shares of par value EUR 1.00 per share 40 40Additional paid-in capital 456,186 444,605Accumulated deficit (293,706) (193,649)Accumulated other comprehensive loss, net (30,964) (14,580)
Total shareholders' equity (deficiency) 131,556 236,416Non-controlling interest 257 439Total liabilities and shareholders' equity (deficiency) $ 2,456,557 $ 2,636,216
* Please refer to Note 1, "Organization and Significant Accounting Policies"
The accompanying notes are an integral part of these combined consolidated financial statements.
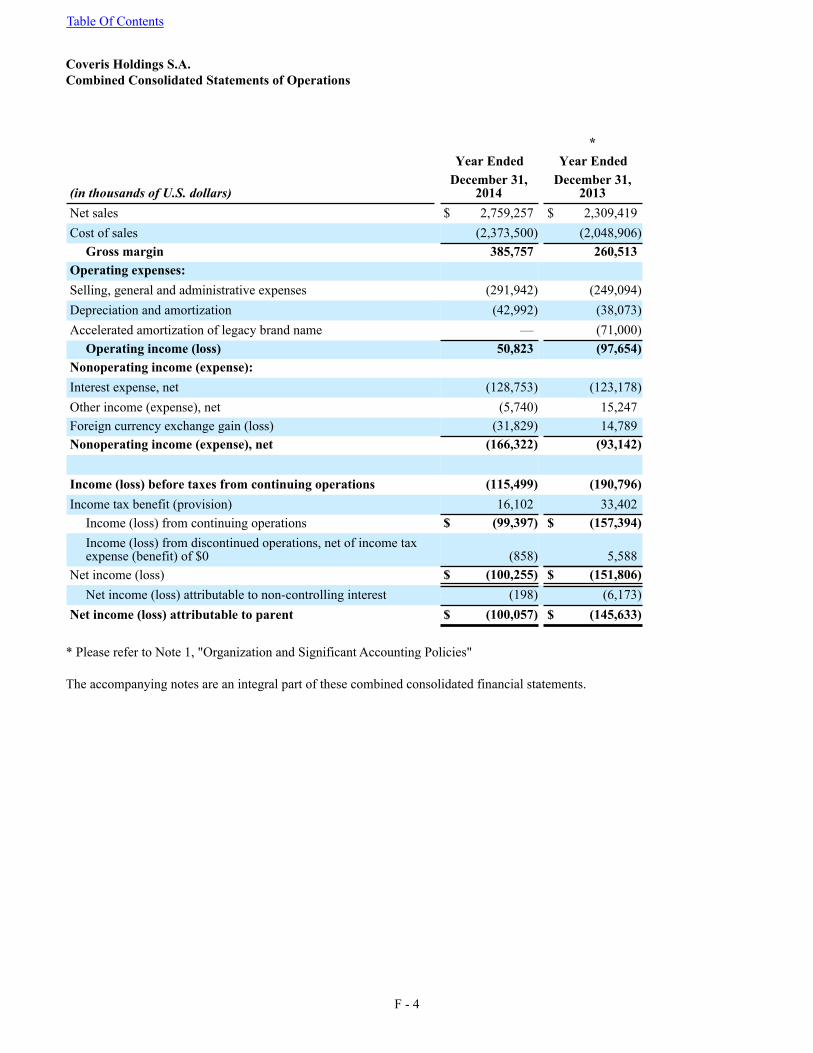
Table Of Contents
F - 4
Coveris Holdings S.A.Combined Consolidated Statements of Operations
*Year Ended Year Ended
(in thousands of U.S. dollars)December 31,
2014December 31,
2013Net sales $ 2,759,257 $ 2,309,419Cost of sales (2,373,500) (2,048,906)
Gross margin 385,757 260,513Operating expenses:Selling, general and administrative expenses (291,942) (249,094)Depreciation and amortization (42,992) (38,073)Accelerated amortization of legacy brand name — (71,000)
Operating income (loss) 50,823 (97,654)Nonoperating income (expense):Interest expense, net (128,753) (123,178)Other income (expense), net (5,740) 15,247Foreign currency exchange gain (loss) (31,829) 14,789Nonoperating income (expense), net (166,322) (93,142)
Income (loss) before taxes from continuing operations (115,499) (190,796)Income tax benefit (provision) 16,102 33,402
Income (loss) from continuing operations $ (99,397) $ (157,394)Income (loss) from discontinued operations, net of income taxexpense (benefit) of $0 (858) 5,588
Net income (loss) $ (100,255) $ (151,806)Net income (loss) attributable to non-controlling interest (198) (6,173)
Net income (loss) attributable to parent $ (100,057) $ (145,633)
* Please refer to Note 1, "Organization and Significant Accounting Policies"
The accompanying notes are an integral part of these combined consolidated financial statements.
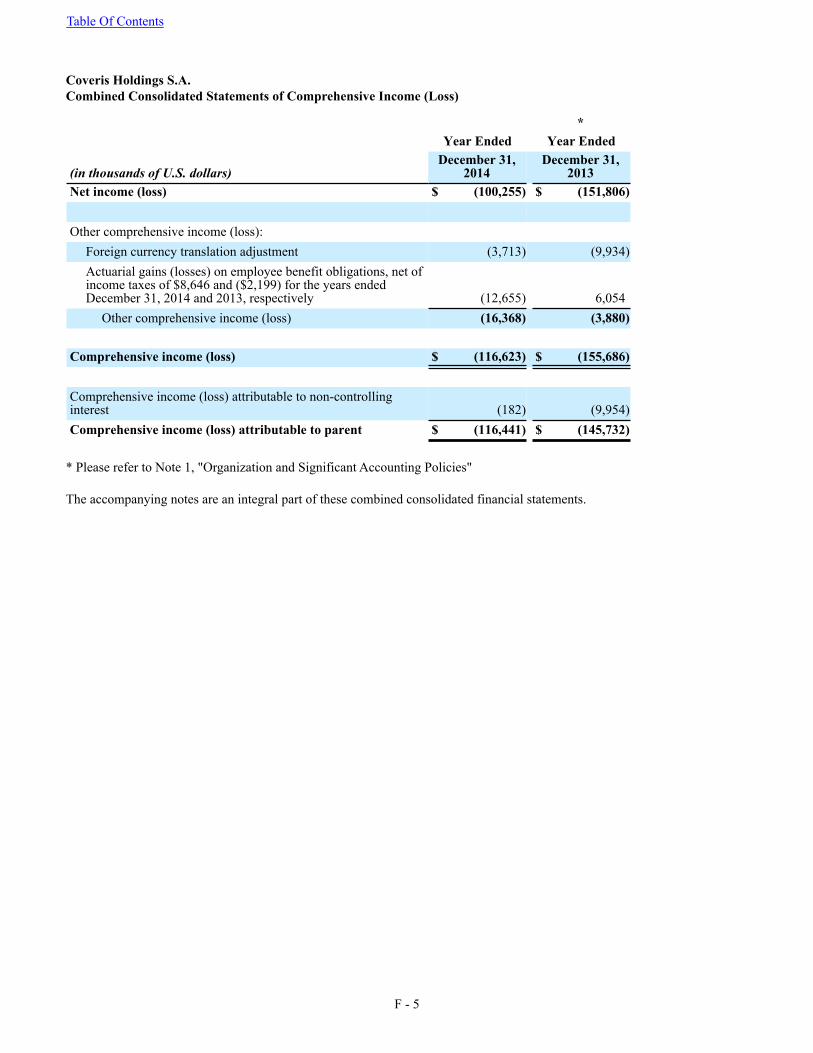
Table Of Contents
F - 5
Coveris Holdings S.A.Combined Consolidated Statements of Comprehensive Income (Loss)
*Year Ended Year Ended
(in thousands of U.S. dollars)December 31,
2014December 31,
2013Net income (loss) $ (100,255) $ (151,806)
Other comprehensive income (loss):Foreign currency translation adjustment (3,713) (9,934)Actuarial gains (losses) on employee benefit obligations, net ofincome taxes of $8,646 and ($2,199) for the years endedDecember 31, 2014 and 2013, respectively (12,655) 6,054
Other comprehensive income (loss) (16,368) (3,880)
Comprehensive income (loss) $ (116,623) $ (155,686)
Comprehensive income (loss) attributable to non-controllinginterest (182) (9,954)Comprehensive income (loss) attributable to parent $ (116,441) $ (145,732)
* Please refer to Note 1, "Organization and Significant Accounting Policies"
The accompanying notes are an integral part of these combined consolidated financial statements.
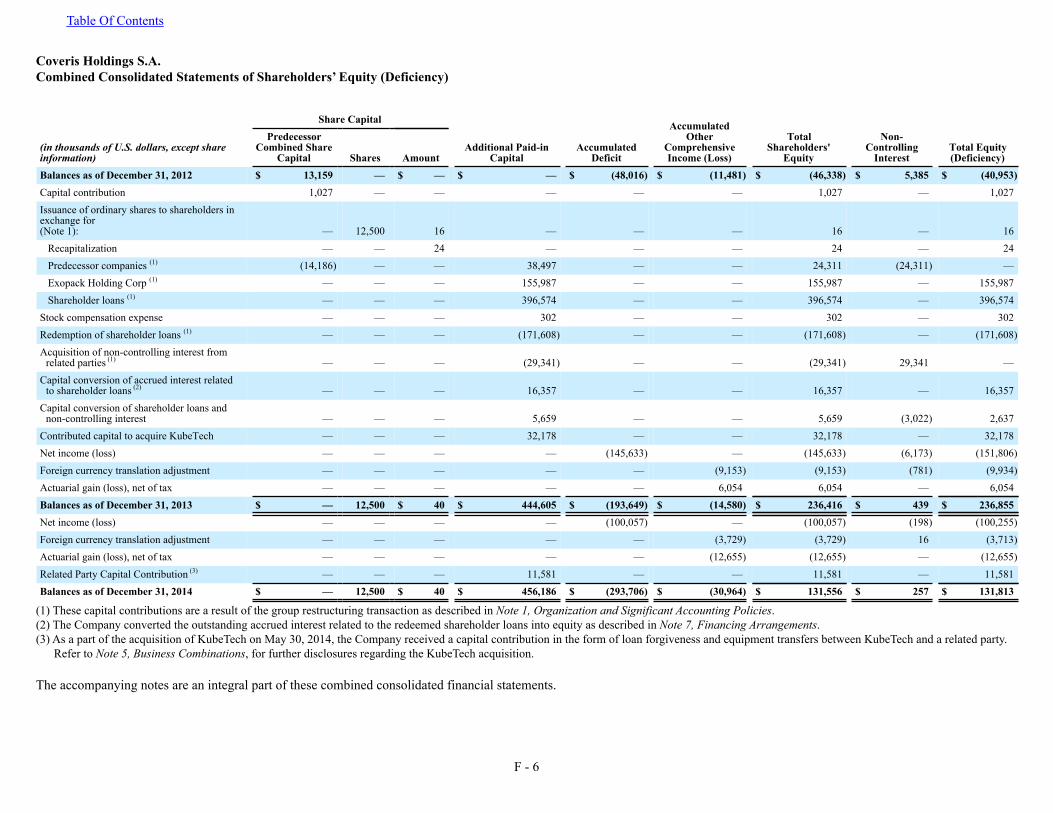
Table Of Contents
F - 6
Coveris Holdings S.A.Combined Consolidated Statements of Shareholders’ Equity (Deficiency)
Share Capital
Additional Paid-inCapital
AccumulatedDeficit
AccumulatedOther
ComprehensiveIncome (Loss)
(in thousands of U.S. dollars, except shareinformation)
PredecessorCombined Share
Capital Shares Amount
TotalShareholders'
Equity
Non-Controlling
InterestTotal Equity(Deficiency)
Balances as of December 31, 2012 $ 13,159 — $ — $ — $ (48,016) $ (11,481) $ (46,338) $ 5,385 $ (40,953)Capital contribution 1,027 — — — — — 1,027 — 1,027Issuance of ordinary shares to shareholders in exchange for (Note 1): — 12,500 16 — — — 16 — 16
Recapitalization — — 24 — — — 24 — 24Predecessor companies (1) (14,186) — — 38,497 — — 24,311 (24,311) —Exopack Holding Corp (1) — — — 155,987 — — 155,987 — 155,987Shareholder loans (1) — — — 396,574 — — 396,574 — 396,574
Stock compensation expense — — — 302 — — 302 — 302Redemption of shareholder loans (1) — — — (171,608) — — (171,608) — (171,608)Acquisition of non-controlling interest from
related parties (1) — — — (29,341) — — (29,341) 29,341 —Capital conversion of accrued interest related
to shareholder loans (2) — — — 16,357 — — 16,357 — 16,357Capital conversion of shareholder loans and
non-controlling interest — — — 5,659 — — 5,659 (3,022) 2,637Contributed capital to acquire KubeTech — — — 32,178 — — 32,178 — 32,178Net income (loss) — — — — (145,633) — (145,633) (6,173) (151,806)Foreign currency translation adjustment — — — — — (9,153) (9,153) (781) (9,934)Actuarial gain (loss), net of tax — — — — — 6,054 6,054 — 6,054Balances as of December 31, 2013 $ — 12,500 $ 40 $ 444,605 $ (193,649) $ (14,580) $ 236,416 $ 439 $ 236,855Net income (loss) — — — — (100,057) — (100,057) (198) (100,255)Foreign currency translation adjustment — — — — — (3,729) (3,729) 16 (3,713)Actuarial gain (loss), net of tax — — — — — (12,655) (12,655) — (12,655)Related Party Capital Contribution (3) — — — 11,581 — — 11,581 — 11,581Balances as of December 31, 2014 $ — 12,500 $ 40 $ 456,186 $ (293,706) $ (30,964) $ 131,556 $ 257 $ 131,813
(1) These capital contributions are a result of the group restructuring transaction as described in Note 1, Organization and Significant Accounting Policies.(2) The Company converted the outstanding accrued interest related to the redeemed shareholder loans into equity as described in Note 7, Financing Arrangements.(3) As a part of the acquisition of KubeTech on May 30, 2014, the Company received a capital contribution in the form of loan forgiveness and equipment transfers between KubeTech and a related party.
Refer to Note 5, Business Combinations, for further disclosures regarding the KubeTech acquisition.
The accompanying notes are an integral part of these combined consolidated financial statements.
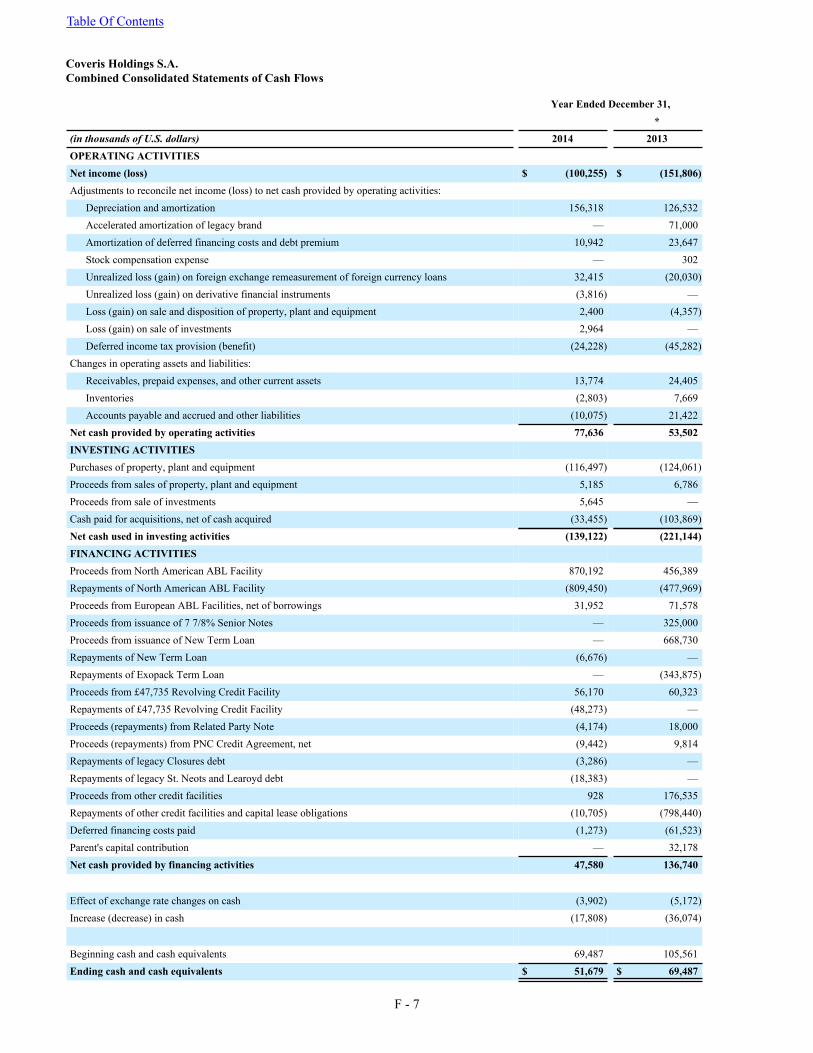
Table Of Contents
F - 7
Coveris Holdings S.A.Combined Consolidated Statements of Cash Flows
Year Ended December 31,*
(in thousands of U.S. dollars) 2014 2013OPERATING ACTIVITIESNet income (loss) $ (100,255) $ (151,806)Adjustments to reconcile net income (loss) to net cash provided by operating activities:
Depreciation and amortization 156,318 126,532Accelerated amortization of legacy brand — 71,000Amortization of deferred financing costs and debt premium 10,942 23,647Stock compensation expense — 302Unrealized loss (gain) on foreign exchange remeasurement of foreign currency loans 32,415 (20,030)Unrealized loss (gain) on derivative financial instruments (3,816) —Loss (gain) on sale and disposition of property, plant and equipment 2,400 (4,357)Loss (gain) on sale of investments 2,964 —Deferred income tax provision (benefit) (24,228) (45,282)
Changes in operating assets and liabilities:Receivables, prepaid expenses, and other current assets 13,774 24,405Inventories (2,803) 7,669Accounts payable and accrued and other liabilities (10,075) 21,422
Net cash provided by operating activities 77,636 53,502INVESTING ACTIVITIES Purchases of property, plant and equipment (116,497) (124,061)Proceeds from sales of property, plant and equipment 5,185 6,786Proceeds from sale of investments 5,645 —Cash paid for acquisitions, net of cash acquired (33,455) (103,869)Net cash used in investing activities (139,122) (221,144)FINANCING ACTIVITIESProceeds from North American ABL Facility 870,192 456,389Repayments of North American ABL Facility (809,450) (477,969)Proceeds from European ABL Facilities, net of borrowings 31,952 71,578Proceeds from issuance of 7 7/8% Senior Notes — 325,000Proceeds from issuance of New Term Loan — 668,730Repayments of New Term Loan (6,676) —Repayments of Exopack Term Loan — (343,875)Proceeds from £47,735 Revolving Credit Facility 56,170 60,323Repayments of £47,735 Revolving Credit Facility (48,273) —Proceeds (repayments) from Related Party Note (4,174) 18,000Proceeds (repayments) from PNC Credit Agreement, net (9,442) 9,814Repayments of legacy Closures debt (3,286) —Repayments of legacy St. Neots and Learoyd debt (18,383) —Proceeds from other credit facilities 928 176,535Repayments of other credit facilities and capital lease obligations (10,705) (798,440)Deferred financing costs paid (1,273) (61,523)Parent's capital contribution — 32,178Net cash provided by financing activities 47,580 136,740
Effect of exchange rate changes on cash (3,902) (5,172)Increase (decrease) in cash (17,808) (36,074)
Beginning cash and cash equivalents 69,487 105,561Ending cash and cash equivalents $ 51,679 $ 69,487
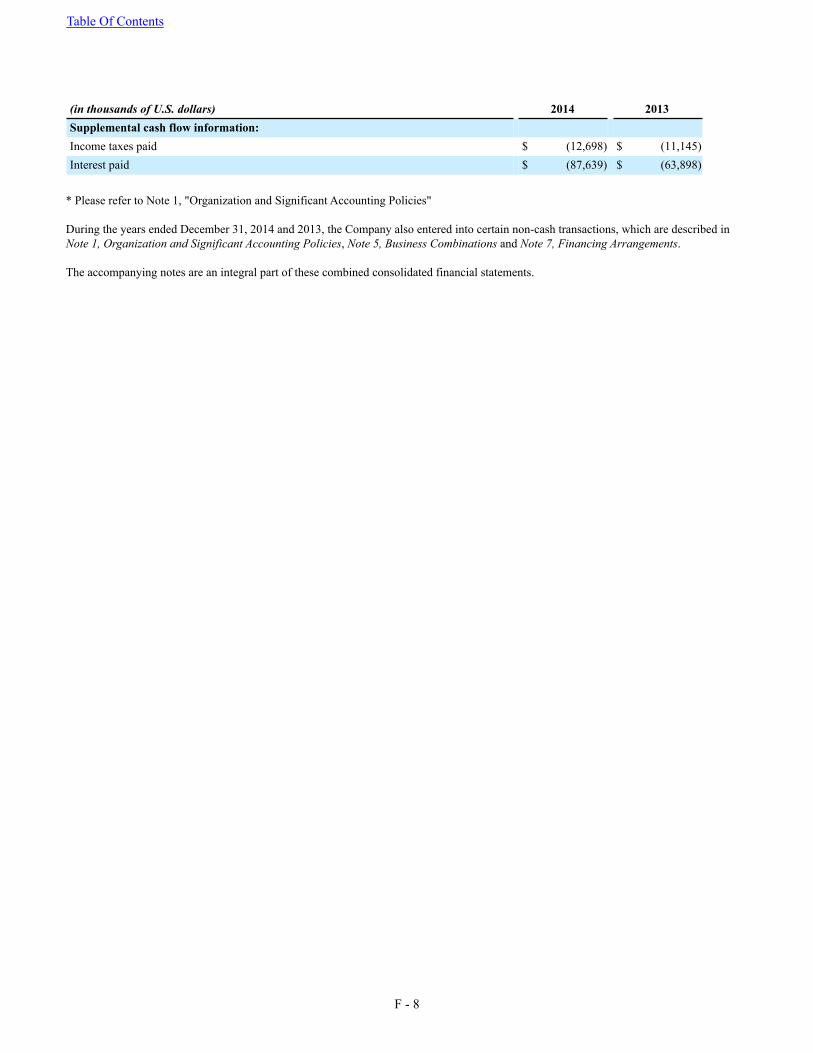
Table Of Contents
F - 8
(in thousands of U.S. dollars) 2014 2013Supplemental cash flow information:Income taxes paid $ (12,698) $ (11,145)Interest paid $ (87,639) $ (63,898)
* Please refer to Note 1, "Organization and Significant Accounting Policies"
During the years ended December 31, 2014 and 2013, the Company also entered into certain non-cash transactions, which are described in Note 1, Organization and Significant Accounting Policies, Note 5, Business Combinations and Note 7, Financing Arrangements.
The accompanying notes are an integral part of these combined consolidated financial statements.
Table Of Contents
F - 9
Coveris Holdings S.ANotes to the Combined Consolidated Financial Statements(in thousands of U.S. dollars, except share information)
1. Organization and Significant Accounting Policies
The accompanying combined consolidated financial statements include the assets, liabilities, revenues and expenses directly attributable to the operations of Coveris Holdings S.A. and its subsidiaries (collectively referred to as the "Company"). Coveris Holdings S.A. was formed as a result of the conversion of Exopack Holdings S.a.r.l. into a public limited liability company (société anonyme) on July 4, 2013 headquartered in Luxembourg. The Company is majority owned by a series of holding companies primarily owned by Sun Capital Partners V, L.P., an affiliate of Sun Capital Partners Inc. ("Sun Capital").
The Company is one of the largest manufacturers of plastic packaging products in the world, offering a broad range of value-added flexible and rigid plastic and paper packaging products that include primary packaging (such as bags, pouches, cartonboard, cups, tubs, lids and trays, films, laminates, sleeves and labels). The Company operates through a network of 66 production and warehousing facilities worldwide. The Company operates 18 facilities in North America, 46 facilities across Europe, as well as two strategically located facilities in the Middle East and China.
The Company conducts business principally through two operating segments: Flexible and Rigid. In the Flexible packaging segment, the Company manufactures a variety of flexible and semi-rigid plastic and paper products, including bags, pouches, roll stocks, films, laminates, sleeves and labels. These products are sold primarily in North America and Europe. In the Rigid packaging segment, the Company manufactures injection molded or thermoformed and decorated rigid plastic and paper packaging solutions, including bowls, cups, lids and trays. These products are sold primarily in Europe and North America.
Group Restructuring
On May 31, 2013, the shareholders of Island Lux S.a.r.l. & Partners S.C.A. ("Paccor"), Copper Management S.a.r.l. & Partners S.C.A. ("Britton"), Eifel Management S.a.r.l. & Partners S.C.A. ("Kobusch"), and Paragon Management S.a.r.l. ("Paragon") indirectly contributed the majority of their outstanding shares to Coveris Holdings S.A. Concurrently, Convertible Preferred Equity Certificates ("CPECs") issued by those entities were redeemed by the shareholders in exchange for newly issued Yield Free Preferred Equity Certificates ("YFPECs"). As part of the restructuring, YFPECs (including the new instruments issued in connection with the redemption of CPECs) were subsequently transferred to Coveris Holdings S.A. in exchange for shares while Preferred Equity Certificates ("PECs") and Asset Linked Preferred Equity Certificates ("ALPECs") were transferred by the shareholders in exchange for new PECs and ALPECs with the same terms. As a part of the same transaction, these shareholders also contributed their remaining outstanding shares in legacy Paccor, Britton and Kobusch to Neuheim Lux Group Holding V (“Neuheim”), a related party.
The Company accounted for the restructuring as a combination of businesses under common control and recognized the assets and liabilities of Paccor, Britton, Kobusch and Paragon (collectively, the "Predecessor Companies") at their historical carrying amounts as of May 31, 2013. The shareholder's redemption of CPECs in exchange for YFPECs and its subsequent transfer to Coveris Holdings S.A. in exchange for the shares of the latter is accounted for as a capital transaction. Accordingly, the difference between the carrying values of CPECs and its redemption values was recorded to additional paid-in capital in the combined consolidated statement of shareholders' equity.
In December 2013, the Company acquired the remaining non-controlling interests in the legacy Paccor, Britton and Kobusch companies held by Neuheim. A separate related party shareholder of the Company satisfied these non-controlling interests held by Neuheim through the issuance of equity in said shareholder.
Acquisition of Exopack Holding Corp
On May 31, 2013, Sun Capital Partners III, LP and Sun Capital Partners IV, LP, the controlling shareholders of Exopack Holding Corp. ("Exopack"), transferred their ownership interests in Exopack to Coveris Holdings S.A. in exchange for the shares of the latter via a series of intermediate holding companies. The Company accounted for the transaction as business combination, with Coveris Holdings S.A. together with the Predecessor Companies, as the accounting acquirer. The shareholders of the Predecessor Companies continue to control the combined Company, and the Predecessor companies are, in aggregate, larger than Exopack in terms of assets, revenues and relative fair values of equity exchanged.
Recast of the Combined Consolidated Financial Statements
Table Of Contents
F - 10
The 2013 comparative combined consolidated financial statements have been recast to reflect the retrospective application of the common control acquisition of KubeTech and discontinued operations of the Company's resin trade business.
Common Control Acquisition of KubeTech
On May 30, 2014, the Company acquired 100% of the shares of Rose HPC Holding, LLC and its subsidiaries, including KubeTech Custom Molding, Inc. and KubeTech Custom Molding International, Inc. (collectively referred to as "KubeTech"). Through a series of intermediate holding companies, KubeTech was previously owned and controlled by Sun Capital Partners V, L.P., which is also the ultimate shareholder of the Company. As both parties were owned and controlled by Sun Capital Partners V, L.P., this transaction is treated as a business combination under common control. Accordingly, the Company's combined consolidated financial statements and the notes presented herein have been recast to retrospectively include the results of KubeTech from the date of which common control was established. Common control was established on the date Sun Capital Partner V, L.P. acquired control of the shares of Rexam Consumer Plastics Inc. on December 31, 2012 and formed KubeTech. Refer to Note 5. Business Combinations for further disclosures regarding the KubeTech acquisition and Note 17. KubeTech Common Control Reconciliation for a reconciliation of the retrospective consolidation of KubeTech into the Company's combined consolidated balance sheet as of December 31, 2013, the combined consolidated statements of operations and the combined consolidated statement of cash flows for the year ended December 31, 2013.
Discontinued Operations
During the quarter ended September 30, 2014, the Flexibles segment disposed of its resin trade business. The Company's resin trade business consisted of buying and reselling resins from wholesalers to customers. The resin trade business has been discontinued to further focus the Company's operations around the Company's long-term strategy and organizational goals. The Company has reclassified all income and expenses for the resin trade business in the prior year's combined consolidated statement of operations to income (loss) from discontinued operations for the year ended December 31, 2013, to conform to current period presentation in accordance with ASC 205.
Summary of Significant Accounting Policies
Basis of Presentation
Prior to May 31, 2013, the results of operations, cash flows and balance sheets of the Predecessor Companies were presented on a combined basis as they were not consolidated into any common parent or holding company but were all under the common control of Sun Capital Partners V, L.P. The combined statement of shareholders’ equity prior to group restructuring represents the sum of the underlying invested equity in the Predecessor Companies listed above and does not represent shares in a single stand-alone basis.
The accompanying combined consolidated financial statements have been prepared in accordance with accounting principles generally accepted in the United States of America ("U.S. GAAP"). These combined consolidated financial statements should be read in conjunction with the notes thereto.
These combined consolidated financial statements include the accounts of all the entities and their subsidiaries. Material intercompany balances and transactions among the combined consolidated entities have been eliminated. Results of operations of companies acquired are included from their respective dates of acquisition.
Non-controlling interests in subsidiaries not fully owned, but controlled, by the Company are initially valued at fair value if the non-controlling interests arise from a business combination accounted for using purchase accounting method or at its proportionate interests in the subsidiaries if the combination is accounted for as a common control transaction. Subsequent to initial measurement the non-controlling interest is measured at the percentage ownership in the carrying value of the combined consolidated subsidiary. Net income (loss) and total comprehensive income (loss) from non-controlling interest is valued at the percentage ownership of the combined consolidated subsidiaries’ underlying net income (loss) not held by the Company.
Use of Estimates
Management has made a number of estimates and assumptions relating to the reporting of assets and liabilities, the disclosure of contingent assets and liabilities and reported amounts of revenues and expenses in preparing these combined consolidated financial statements. Actual results could differ from these estimates.
Table Of Contents
F - 11
Foreign Currency Translation and Transactions
The presentation currency of these combined consolidated financial statements is the United States Dollar. Translation of the financial statements of the Company’s foreign subsidiaries, whose functional currencies are those other than the United States Dollar, are measured using the current exchange rate at the reporting date for the balance sheet and the weighted-average exchange rate during the reporting period for results of operations. The resulting currency translation adjustment is accumulated and reported in "Accumulated other comprehensive income/(loss), net" ("AOCI") on the accompanying combined consolidated balance sheets and combined consolidated statements of stockholders' equity (deficiency). The Company also maintains certain debt instruments and other balances in currencies other than the entity's functional currency. These balances are remeasured at the balance sheet date and the resulting gains and losses are included in "Foreign currency exchange gain (loss)" in the combined consolidated statements of operations and combined consolidated statements of comprehensive (loss)/income. Foreign currency exchange gains (losses) amounted to $(31,829) and $14,789 for the years ended December 31, 2014 and 2013, respectively. Included in foreign currency gains (losses) is an unrealized foreign exchange loss due to the remeasurement of the Company's U.S. dollar denominated New Term Loan and Senior Notes in a euro denominated functional currency entity of $(97,774) and $21,385 for the years ended December 31, 2014 and 2013, respectively.
Cash and Cash Equivalents
Cash and cash equivalents include cash on hand and in banks, and all other highly liquid investments purchased with an original or remaining maturity of three months or less at the date of acquisition. Accounts payable in the accompanying combined consolidated balance sheets includes approximately $3,016 and $1,910 in book cash overdrafts as of December 31, 2014 and 2013, respectively.
Accounts Receivable
Accounts receivable are measured at their net realizable value after allowance for doubtful accounts. An allowance for doubtful accounts is established when there is objective evidence that the Company will not be able to collect all amounts due according to the original terms of the receivables.
Accounts Receivable Securitization Programs
The Company enters into certain accounts receivable securitization facilities in North America and Europe that expire over varying maturities.
For facilities that are provided with recourse, the Company accounts for the arrangement as a secured borrowing, maintaining a gross receivable asset and due to factor liability. Additionally for securitization arrangements with full recourse, the Company estimates an allowance for factoring fees associated with collections. The actual recognition of such fees may differ from estimates depending upon the timing of collections.
For accounts receivable securitization facilities that do not provide recourse to the factor and under certain specific criteria, the Company treats the arrangement as a sale.
Inventories
Inventories are carried at the lower of cost or market. The cost of inventories is determined primarily by the First-In, First-Out ("FIFO") and weighted average method. Inventory value is evaluated at each balance sheet date to ensure that it is carried at the lower of cost or market. This evaluation includes an analysis of historical physical inventory results, a review of excess and obsolete inventories based on inventory aging, and anticipated future demand. Periodically, perpetual inventory records are adjusted to reflect declines in net realizable value below inventory carrying cost.
Property, Plant and Equipment
Property, plant and equipment are recorded at cost and depreciated using the straight-line method based on the following estimated useful lives of 20 - 40 years for buildings and improvements, 3 - 15 years for machinery and equipment, and 2 - 12 years for other depreciable assets. Property, plant and equipment acquired as part of a business combination are recorded at fair value and depreciated using the same method and useful life assumptions. Depreciation expense is presented in cost of goods sold or in operating expenses depending on the operational use of the asset being depreciated.
Table Of Contents
F - 12
The cost of property, plant and equipment and related accumulated depreciation are removed from the accounts upon the retirement or disposal of such assets and the resulting gain or loss is recognized at the time of disposition. Maintenance and repairs that do not improve efficiency or extend economic life are charged to expense as incurred. Depreciation expense for the years ended December 31, 2014 and 2013 was $114,848 and $94,057, respectively. No interest was capitalized during any of the periods presented.
Leases
Leases are reviewed for capital or operating classification at their inception under the guidance of Accounting Standard Codification (ASC) 840, Leases. The Company uses the lower of its incremental borrowing rate or the implicit rate noted in the lease agreement in the assessment of lease classification and assumes the initial lease term includes renewal options that are reasonably assured. For leases classified as operating leases, the Company records rent expense on a straight-line basis, over the lease term beginning with the date the Company has access to the property, which in some cases is prior to commencement of lease payments. Accordingly, the amount of rental expense recognized in excess of lease payments is recorded as a deferred rent liability and is amortized to rental expense over the remaining term of the lease.
Capital leases are capitalized at the commencement of the lease at the fair value of the leased property or, if lower, at the present value of the minimum lease payments. Lease payments are apportioned between finance charges and reduction of the lease liability so as to achieve a constant rate of interest on the remaining balance of the liability.
At the commencement of the lease term for new leases where the Company is lessor, amounts due from lessees are recognized as receivables in the balance sheets at the amount equal to the net investment in the lease, which is the present value of the minimum lease payment receivable, plus any unguaranteed residual value, each determined at the inception of the lease.
Goodwill
The Company allocates the purchase price of acquired businesses to the identifiable tangible and intangible assets and liabilities acquired, with any remaining amount being recognized as goodwill. Goodwill is tested for impairment at least annually, as of October 1, or whenever a triggering event occurs, at the reporting unit level, which is defined as an operating segment or a component of an operating segment that constitutes a business for which financial information is available and is regularly reviewed by Management. The Company's two reportable segments are divided into seven reporting units as defined by ASC 350, Intangibles - Goodwill and Other: (1) North America Food and Consumer, (2) North America Performance Packaging, (3) Coveris Advance Coatings, (4) UK Food and Consumer, (5) Europe Food and Consumer, (6) Europe Rigid and (7) North America Rigid. See Note 6, "Goodwill and Other Intangible Assets" for further discussion on the Company's annual impairment test and movements in goodwill.
Intangible Assets
Contractual or separable intangible assets that have finite useful lives are being amortized using the straight-line method over their estimated useful lives of 3 - 20 years for customer relationships, 3 - 20 years for trademarks and licenses and 3 - 15 years for other intangible assets. The straight-line method of amortization reflects an appropriate allocation of the costs of the intangible assets in proportion to the amount of economic benefits obtained by the Company in each reporting period. The Company tests finite-lived assets for impairment whenever there is an impairment indicator and indefinite lived assets for impairment on an annual basis on October 1. Finite lived intangible assets are tested for impairment by comparing anticipated related undiscounted future cash flows from operations to the carrying value of the asset.
Impairment of Long-Lived Assets
The Company reviews long-lived assets for impairment whenever events or changes in business circumstances indicate that the carrying amount of the assets may not be fully recoverable. For property, plant and equipment and other long-lived assets, other than goodwill, the Company performs undiscounted operating cash flow analysis to determine if impairment exists. If impairment is determined to exist, any related impairment loss is calculated based upon comparison of the estimated fair value to the net carrying value of the assets. Impairment losses on assets held for sale are based on the estimated proceeds to be received, less costs to sell. There were no impairment losses recorded during the years ended December 31, 2014 and 2013 of long-lived assets.
Revenue Recognition
Table Of Contents
F - 13
The Company recognizes sales revenue when all of the following conditions are met: persuasive evidence of an agreement exists, delivery has occurred, the Company’s price to the buyer is fixed and determinable and collectability is reasonably assured. Sales and related cost of sales are principally recognized upon transfer of title to the customer, which generally occurs upon shipment of products. The Company’s stated shipping terms generally pass title and risk of inventory to the buyer at the Company's stated shipping point, unless otherwise noted in the customer contract. Sales to certain customers are on consignment and revenue is recognized when the customer uses the products. Provisions for estimated returns and allowances and customer rebates are recorded when the related products are sold.
Shipping and Handling Costs
Shipping and handling fees billed to customers are included in net sales with the corresponding cost of such services recognized in cost of sales.
Income Taxes
Current income tax assets and liabilities are measured at the amount expected to be recovered from or paid to the taxation authorities. The tax rates and tax laws used to compute the amount are those that are enacted or substantively enacted, at the reporting date in the countries where the Group operates and generates taxable income. Current income tax relating to items recognized directly in equity is recognized in equity and not in the statement of profit or loss.
Deferred income taxes are recorded under the asset and liability method whereby deferred tax assets and liabilities are recognized for the future tax consequences attributable to differences between the financial statement carrying amounts of existing assets and liabilities and their respective tax basis. Deferred tax assets and liabilities are measured using enacted tax rates expected to apply to taxable income in the years in which those temporary differences are expected to be recovered or settled. Deferred tax assets and deferred tax liabilities are offset if a legally enforceable right exists to set off current tax assets against current tax liabilities and the deferred taxes relate to the same taxable entity and the same taxation authority.
The carrying amount of deferred tax assets is reviewed at each reporting date and a valuation allowance is recognized to the extent that it is no longer probable that sufficient taxable profit will be available to allow all or part of the deferred tax asset to be utilized. Valuation allowances are re-assessed at each reporting date and are de-recognized to the extent that it has become probable that future taxable profits will allow the deferred tax asset to be recovered.
The Company recognizes tax benefits from uncertain tax positions only if that tax position is more likely than not to be sustained on examination by the taxing authorities, based on the technical merits of the position. The Company then measures the tax benefits recognized in the financial statements from such positions based on the largest benefit that has a greater than 50% likelihood of being realized upon ultimate settlement. The Company’s policy for recording interest and penalties associated with unrecognized tax benefits is to record such items as a component of income before taxes. Penalties are recorded in other expense (income), net and interest is recorded in interest expense, in the accompanying combined statements of operations. There were no significant interest or penalties associated with unrecognized tax benefits for the years ended December 31, 2014 and 2013.
As of the end of fiscal 2014, we had unremitted earnings from foreign subsidiaries including earnings that have been or are intended to be permanently reinvested for continued use in foreign operations; accordingly, no provision for income taxes has been provided thereon. The Company also has earnings from certain foreign subsidiaries in the United Kingdom for which it does not assert permanent reinvestment. Therefore, the Company has provided for deferred income tax on those earnings as of December 31, 2014.
Pension Plans
Employees of the Company participate in defined contribution pension plans, defined benefit pension plans and other postretirement employment benefit ("OPEB") plans. Contributions made by the Company to defined contribution pension plans are expensed in the period in which they occur. Assets held by the Combined Company’s defined benefit plans are held in trust outside of the control of the Company. The Company records annual amounts relating to its defined benefit pension plans based on calculations which include various actuarial assumptions, including discount rates, mortality rates and annual rates of return on plan assets. These estimates are highly susceptible to change from period to period based on the performance of plan assets, actuarial valuations and market conditions. The Company reviews its actuarial assumptions on an annual basis and makes modifications to the assumptions based on current rates and trends. The Company believes that the assumptions used in recording its pension obligation are reasonable based on its experience, market conditions and input from its third party actuary and investment adviser.
Table Of Contents
F - 14
Equity Incentive Plans
In October 2013, the Company executed its 2013 Long-Term Incentive Plan (the "2013 LTIP") between a holding company of Coveris Holdings S.A. and certain key employees. Under this plan, various classes of shareholders vest ratably over a five year period in the right to participate in a waterfall distribution of proceeds generated from a liquidating distribution event, such as a an equity offering, sale of the Company or other change in control. This plan shares other characteristics that yield the plan to a compensation plan treated as a liability. A liability will be recognized when it is probable that there will be a distribution made to employees based on vested interests. This liability shall be measured at each reporting period, predicated by the probable likelihood of an estimable cash payout. As there is no probable payout event at the time of this report, no liability has been recorded or expense incurred to the Company's combined consolidated balance sheets as of December 31, 2014 or 2013 or combined consolidated statement of operations for the years ended December 31, 2014 or 2013, respectively, attributable to the 2013 LTIP.
Fair Value Measurements of Financial Instruments
In determining fair value of financial instruments, the Company utilizes valuation techniques that maximize the use of observable inputs and minimize the use of unobservable inputs to the extent possible and consider counterparty credit risk in assessing fair value. The Company determines fair value of financial instruments based on assumptions that market participants would use in pricing an asset or liability in the principal or most advantageous market. When considering market participant assumptions in fair value measurements, the following fair value hierarchy distinguishes between observable and unobservable inputs, which are categorized in one of the following levels:
• Level 1 Inputs: Unadjusted quoted prices in active markets for identical assets or liabilities accessible to the reporting entity at the measurement date.
• Level 2 Inputs: Other than quoted prices included in Level 1 inputs that are observable for the asset or liability, either directly or indirectly, for substantially the full term of the asset or liability.
• Level 3 Inputs: Unobservable inputs for the asset or liability used to measure fair value to the extent that observable inputs are not available, thereby allowing for situations in which there is little, if any, market activity for the asset or liability at measurement date.
The Company's fair value measurements are subjective and involve uncertainties and matters of significant judgment. Changes in assumptions could significantly affect our estimates. See Note 14, “Fair Value of Debt Instruments,” for further details on our fair value measurements.
Derivatives and Hedging Activities
The Company may use financial instruments, such as cross currency swaps, interest rate swaps, and foreign currency exchange forward contracts and options relating to our borrowing and trade activities. The Company may use these financial instruments from time to time to manage exposure to fluctuations in interest rates and foreign currency exchange rates. The Company does not purchase, hold or sell derivative financial instruments for trading purposes. We face credit risk if the counterparties to these transactions are unable to perform their obligations.
The Company reports derivative instruments at fair value and establishes criteria for designation and effectiveness of transactions entered into for hedging purposes.
The Company accounts for derivative instruments as hedges of underlying risks if the derivative instruments are designated as hedges and the derivative instruments are effective as hedges of recognized assets or liabilities, forecasted transactions, unrecognized firm commitments or forecasted intercompany transactions.
As of December 31, 2014, the Company had outstanding forward contracts and options to mitigate foreign currency risk. The Company has elected to not pursue effective hedge accounting treatment on these instruments. Accordingly, the Company recognizes changes to fair value through the combined consolidated statement of operations as a part of "Foreign currency exchange gain (loss)."
Concentrations of Credit Risk
Financial instruments that potentially subject the Company to significant concentrations of credit risk consist principally of trade accounts receivable. The Company controls credit risk through credit approvals, credit limits and monitoring procedures. The Company does not require collateral for trade accounts receivable. Concentrations of credit risk with respect to trade receivables
Table Of Contents
F - 15
are limited due to the wide variety of customers and markets into which the Company’s products are sold, as well as their dispersion across many different geographic areas. There were no individual customers that accounted for more than 10% of the total accounts receivable as of December 31, 2014 and 2013.
Business Combinations
The Company accounts for business combinations using the acquisition method of accounting, and accordingly, the assets and liabilities of the acquired businesses are recorded at their estimated fair values at the date of acquisition. The excess of the purchase price over the estimated fair values is recorded as goodwill. Gain on bargain purchase is recognized through a business combination where the fair value of the assets and liabilities acquired is in excess of the purchase price paid. When a gain on bargain purchase occurs in a business combination, the Company recognizes a gain through the combined consolidated statements of operations within the appropriate measurement period as defined by ASC 805. Any changes in the estimated fair values of the net assets recorded for acquisitions, will change the amount of the purchase prices allocable to goodwill. All restructuring charges associated with a business combination are expensed subsequent to the acquisition date. The results of operations of acquired businesses are included in the combined consolidated financial statements from the acquisition date. See Note 5, "Business Combinations" for further disclosures regarding business combinations executed during the years ended December 31, 2014 and 2013.
Shareholder Loans
The Company has a number of loans from immediate parent companies. These shareholder loans are in the form of preferred equity certificates ("PECs"), asset linked preferred equity certificates ("ALPECs") and yield free preferred equity certificates ("YFPECs"). All of these instruments are subordinated to third party senior lenders. The Company accounts for these instruments as debt as they do not meet the criteria of equity under US GAAP. The shareholder loans are recorded at their face value and interest expense recognized over the terms of the loans under the effective interest method.
Deferred Financing Costs
Costs related to the issuance and modification of debt (including any premium or discount paid), are amortized as a component of interest expense over the term of the related debt using the straight-line method, which approximates the effective interest method. Noncurrent deferred financing costs are presented separately and the current portion of deferred financing costs are presented net of accumulated amortization within prepaid expenses and other current assets in the Company's combined consolidated balance sheets. Amortization of these deferred costs is included in interest expense, net in the combined consolidated statements of operations.
In the event of an extinguishment of debt, the Company records a loss due to the accelerated de-recognition of the net book value of the extinguished debt’s deferred financing costs on the date of extinguishment. In the event of a modification of debt, the Company recognizes the additional costs to deferred financing costs on the combined consolidated balance sheet and amortizes the revised balance over the remaining term of the debt.
Restructuring Costs
The Company accounts for restructuring activities in accordance with ASC 420, Exit or Disposal Cost Obligations. Under the Guidance, for the cost of restructuring activities that do not constitute a discontinued operation, the liability for the current period and fair value of expected future costs associated with such restructuring activity are recognized in the period in which the liability is incurred. The Company recognizes the costs of restructuring activities ratably over the remaining service period of affected personnel pursuant to a formal management approved restructuring plan, which has been communicated to affected employees and primarily includes costs associated with employee redundancies.
Research and Development Expenses
Research and development expenses include direct research related overhead costs for internal projects, which are expensed as incurred. Costs to acquire technologies that are utilized in research and development that have no alternative future use are expensed when incurred. Research and development costs are included in operating income (loss) on the combined consolidated statements of operations.
Environmental Liabilities
Table Of Contents
F - 16
Various state and federal regulations relating to health, safety and the environment govern the flexible packaging and plastic films and coated products industries, and the Company has invested substantial effort to prepare for and meet these requirements. While these requirements are continually changing, the Company believes that its operations are in substantial compliance with applicable health, safety and environmental regulations.
Costs associated with cleaning up existing environmental contamination caused by past operations and costs which do not benefit future periods are expensed. The Company records undiscounted liabilities for environmental costs when a loss is probable and can be reasonably estimated. At December 31, 2014 and 2013, management believes there were no material obligations related to environmental matters. Environmental expenses incurred in all of the periods presented herein were insignificant.
2. Recent Accounting Pronouncements
In February 2013, the Financial Accounting Standards Board ("FASB") issued ASU No. 2013-02, Reporting of Amounts Reclassified Out of Accumulated Other Comprehensive Income, requiring an entity to present the effects on the line items of net income of significant amounts reclassified out of Accumulated Other Comprehensive Income, but only if the item reclassified is required under U.S. GAAP to be reclassified to net income in its entirety in the same reporting period. ASU 2013-2 has been adopted as of January 1, 2014. This ASU did not have a material impact on the Company's combined consolidated financial statements as of December 31, 2014.
In March 2013, FASB issued ASU No. 2013-05, Parent’s Accounting for the Cumulative Translation Adjustment upon De-recognition of Certain Subsidiaries or Company Assets within a Foreign Entity or of an Investment in a Foreign Entity. This guidance clarifies the accounting treatment of the cumulative foreign currency translation reserve when a parent ceases to have a controlling financial interest in the group of assets that give rise to the reserve. In addition, this ASU resolves the diversity in practice for the treatment of business combinations achieved in involving a foreign entity. ASU 2013-05 has been adopted as of January 1, 2014. This ASU did not have a material impact on the Company's combined consolidated financial statements as of December 31, 2014.
In July 2013, FASB issued ASU No. 2013-11, Income Taxes (Topic 740): Presentation of an Unrecognized Tax Benefit When a Net Operating Loss Carryforward, a similar Tax Loss, or a Tax Credit Carryforward Exists. ASU No. 2013-11 clarifies companies should present an unrecognized tax benefit as a reduction to a deferred tax asset for a net operating loss carryforward, a similar tax loss or a tax credit carryforward. ASU No. 2013-11 has been adopted as of January 1, 2014. This ASU did not have a material impact on the Company's combined consolidated financial statements as of December 31, 2014.
In April 2014, FASB issued ASU 2014-08, Presentation of Financial Statements (Topic 205) and Property, Plant, and Equipment (Topic 360). ASU 2014-08 changes the criteria for reporting discontinued operations and enhances convergence of the FASB and the International Accounting Standards Board ("IASB") reporting requirements for discontinued operations. The amendments in this update change the requirements for reporting discontinued operations in ASC 205. The ASU updates the reporting requirements of a disposal activity to be included in discontinued operations to include the disposal of a component of an entity or a group of components of an entity that represents a strategic shift that has (or will have) a major effect on an entity's operations and financial results. This ASU is not expected to have a material impact on the Company's combined consolidated financial statements. The ASU became effective for annual periods beginning on or after December 15, 2014, and will become effective for interim periods within annual periods beginning on or after December 15, 2015.
In May 2014, FASB issued ASU 2014-09, Revenue from Contracts with Customers (Topic 606). In ASU 2014-09, FASB amends the Accounting Standards Codification and creates a new Topic 606, Revenues from Contracts with Customers. The core principle of the new guidance is that an entity should recognize revenue to depict the transfer of promised goods or services to customers in an amount that reflects the consideration to which the entity expects to be entitled in exchange for those goods or services. The Company is evaluating the impact of this ASU and does not expected to have a material impact on the Company's combined consolidated financial statements. The ASU will become effective for annual periods beginning on or after December 15, 2017, and for interim periods within annual periods beginning on or after December 15, 2018.
In August 2014, FASB issued ASU 2014-15, Presentation of Financial Statements - Going Concern (Topic 205-40). Prior to this ASU, US GAAP did not contain guidance on management's responsibility to evaluate whether there is substantial doubt about an entity's ability to continue as a going concern or to provide related footnote disclosures. This ASU requires management to assess an entity's ability to continue as a going concern by incorporating and expanding upon certain principles that are currently U.S. auditing standards and requires certain disclosures when substantial doubt exists. The ASU will become effective for annual periods ending on or after December 15, 2016, and for interim periods thereafter. This ASU is not expected to have a material impact on the Company's combined consolidated financial statements.
F - 17
3. Balance Sheet Information
The major components of certain balance sheet accounts at December 31, 2014 and 2013 are as follows:
(in thousands of U.S. dollars) December 31,Assets 2014 2013InventoriesRaw materials and supplies $ 91,853 $ 93,463Work in progress 46,859 36,701Finished goods 153,961 170,747Spare parts and other inventories 9,001 11,400
Total inventories $ 301,674 $ 312,311
Property, plant and equipmentLand $ 35,310 $ 36,236Buildings and improvements 174,352 191,999Machinery and equipment 845,277 840,961Other 12,199 11,479Construction in progress 49,991 37,760
Gross property, plant and equipment 1,117,129 1,118,435Less: Accumulated depreciation (331,483) (281,150)
Net property, plant and equipment $ 785,646 $ 837,285
Depreciation expense for the years ended December 31, 2014 and 2013 was $114,848 and $94,057, respectively.
4. Accumulated Other Comprehensive Income (Loss)
Comprehensive income (loss) consists of net loss, adjustments due to actuarial gains (losses) on employee benefit obligations, and unrealized gains and losses on foreign currency translation.
The following table represents the components of accumulated other comprehensive income (loss):
(in thousands of U.S. dollars)
Foreign CurrencyTranslation
Adjustments
Pension and OPEB
Plans Liability
Cumulative DeferredTax Effect on Pensionand OPEB Liability
AccumulatedOther
ComprehensiveIncome (Loss)
Balance at December 31, 2012 (315) (12,249) 1,557 (11,007)Change during 2013 (9,934) 8,253 (2,199) (3,880)Balance at December 31, 2013 (10,249) (3,996) (642) (14,887)Change during 2014 (3,713) (21,301) 8,646 (16,368)Balance at December 31, 2014 $ (13,962) $ (25,297) $ 8,004 $ (31,255)
5. Business Combinations
Exopack
As discussed in Note 1, Organization and Significant Accounting Policies, on May 31, 2013, the Company acquired 100% of the shares of Exopack for a consideration of $155,890 satisfied by the issuance of shares in Coveris Holdings S.A. The fair value of the consideration transferred was based on the enterprise value of Exopack which was, determined by an independent third party, based on a combination of discounted cash flows and comparable companies methods. This fair value measurement is based on significant inputs that are not observable in the market. Key assumptions include a discount rate of 11.5% a terminal value based
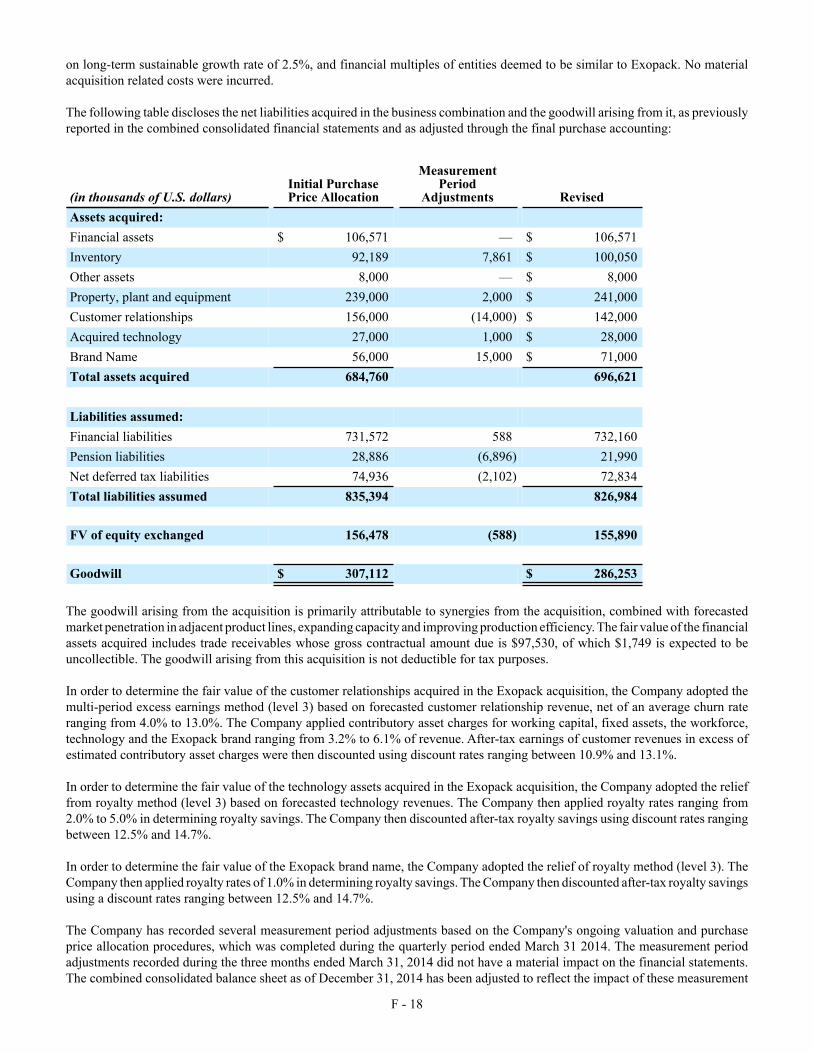
F - 18
on long-term sustainable growth rate of 2.5%, and financial multiples of entities deemed to be similar to Exopack. No material acquisition related costs were incurred.
The following table discloses the net liabilities acquired in the business combination and the goodwill arising from it, as previously reported in the combined consolidated financial statements and as adjusted through the final purchase accounting:
(in thousands of U.S. dollars)Initial PurchasePrice Allocation
MeasurementPeriod
Adjustments RevisedAssets acquired:Financial assets $ 106,571 — $ 106,571Inventory 92,189 7,861 $ 100,050Other assets 8,000 — $ 8,000Property, plant and equipment 239,000 2,000 $ 241,000Customer relationships 156,000 (14,000) $ 142,000Acquired technology 27,000 1,000 $ 28,000Brand Name 56,000 15,000 $ 71,000Total assets acquired 684,760 696,621
Liabilities assumed:Financial liabilities 731,572 588 732,160Pension liabilities 28,886 (6,896) 21,990Net deferred tax liabilities 74,936 (2,102) 72,834Total liabilities assumed 835,394 826,984
FV of equity exchanged 156,478 (588) 155,890
Goodwill $ 307,112 $ 286,253
The goodwill arising from the acquisition is primarily attributable to synergies from the acquisition, combined with forecasted market penetration in adjacent product lines, expanding capacity and improving production efficiency. The fair value of the financial assets acquired includes trade receivables whose gross contractual amount due is $97,530, of which $1,749 is expected to be uncollectible. The goodwill arising from this acquisition is not deductible for tax purposes.
In order to determine the fair value of the customer relationships acquired in the Exopack acquisition, the Company adopted the multi-period excess earnings method (level 3) based on forecasted customer relationship revenue, net of an average churn rate ranging from 4.0% to 13.0%. The Company applied contributory asset charges for working capital, fixed assets, the workforce, technology and the Exopack brand ranging from 3.2% to 6.1% of revenue. After-tax earnings of customer revenues in excess of estimated contributory asset charges were then discounted using discount rates ranging between 10.9% and 13.1%.
In order to determine the fair value of the technology assets acquired in the Exopack acquisition, the Company adopted the relief from royalty method (level 3) based on forecasted technology revenues. The Company then applied royalty rates ranging from 2.0% to 5.0% in determining royalty savings. The Company then discounted after-tax royalty savings using discount rates ranging between 12.5% and 14.7%.
In order to determine the fair value of the Exopack brand name, the Company adopted the relief of royalty method (level 3). The Company then applied royalty rates of 1.0% in determining royalty savings. The Company then discounted after-tax royalty savings using a discount rates ranging between 12.5% and 14.7%.
The Company has recorded several measurement period adjustments based on the Company's ongoing valuation and purchase price allocation procedures, which was completed during the quarterly period ended March 31 2014. The measurement period adjustments recorded during the three months ended March 31, 2014 did not have a material impact on the financial statements. The combined consolidated balance sheet as of December 31, 2014 has been adjusted to reflect the impact of these measurement
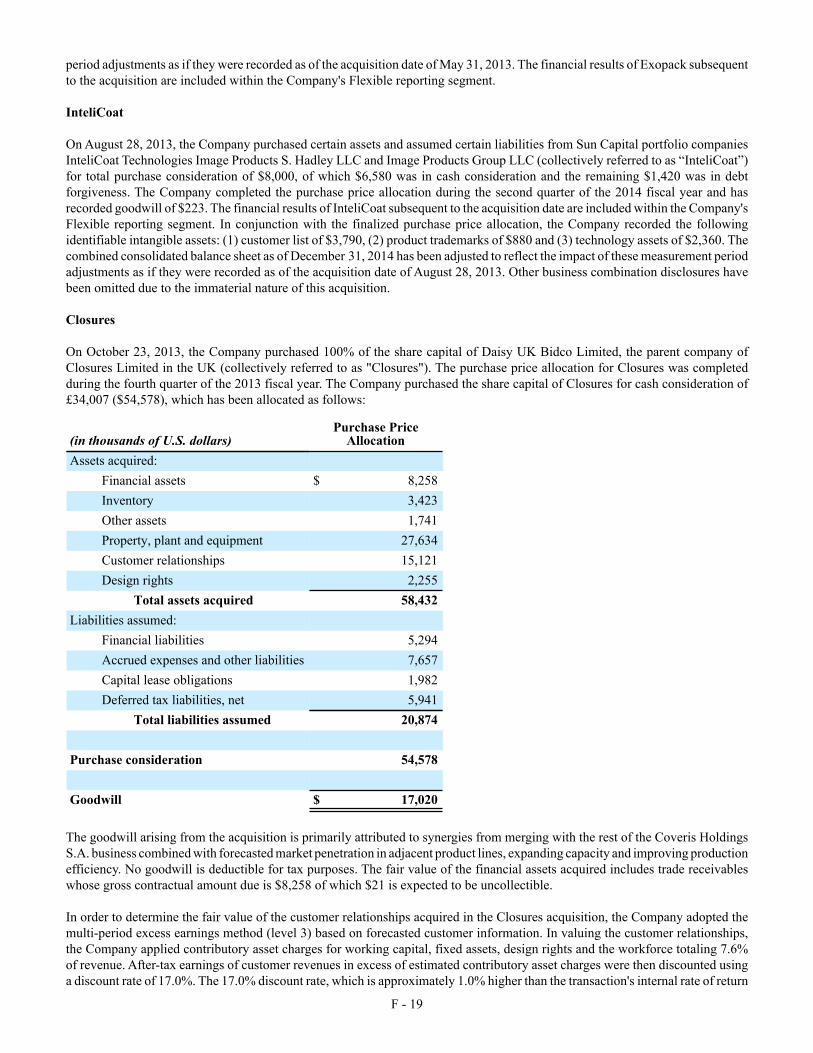
F - 19
period adjustments as if they were recorded as of the acquisition date of May 31, 2013. The financial results of Exopack subsequent to the acquisition are included within the Company's Flexible reporting segment.
InteliCoat
On August 28, 2013, the Company purchased certain assets and assumed certain liabilities from Sun Capital portfolio companies InteliCoat Technologies Image Products S. Hadley LLC and Image Products Group LLC (collectively referred to as “InteliCoat”) for total purchase consideration of $8,000, of which $6,580 was in cash consideration and the remaining $1,420 was in debt forgiveness. The Company completed the purchase price allocation during the second quarter of the 2014 fiscal year and has recorded goodwill of $223. The financial results of InteliCoat subsequent to the acquisition date are included within the Company's Flexible reporting segment. In conjunction with the finalized purchase price allocation, the Company recorded the following identifiable intangible assets: (1) customer list of $3,790, (2) product trademarks of $880 and (3) technology assets of $2,360. The combined consolidated balance sheet as of December 31, 2014 has been adjusted to reflect the impact of these measurement period adjustments as if they were recorded as of the acquisition date of August 28, 2013. Other business combination disclosures have been omitted due to the immaterial nature of this acquisition.
Closures
On October 23, 2013, the Company purchased 100% of the share capital of Daisy UK Bidco Limited, the parent company of Closures Limited in the UK (collectively referred to as "Closures"). The purchase price allocation for Closures was completed during the fourth quarter of the 2013 fiscal year. The Company purchased the share capital of Closures for cash consideration of £34,007 ($54,578), which has been allocated as follows:
(in thousands of U.S. dollars)Purchase Price
AllocationAssets acquired:
Financial assets $ 8,258Inventory 3,423Other assets 1,741Property, plant and equipment 27,634Customer relationships 15,121Design rights 2,255
Total assets acquired 58,432Liabilities assumed:
Financial liabilities 5,294Accrued expenses and other liabilities 7,657Capital lease obligations 1,982Deferred tax liabilities, net 5,941
Total liabilities assumed 20,874
Purchase consideration 54,578
Goodwill $ 17,020
The goodwill arising from the acquisition is primarily attributed to synergies from merging with the rest of the Coveris Holdings S.A. business combined with forecasted market penetration in adjacent product lines, expanding capacity and improving production efficiency. No goodwill is deductible for tax purposes. The fair value of the financial assets acquired includes trade receivables whose gross contractual amount due is $8,258 of which $21 is expected to be uncollectible.
In order to determine the fair value of the customer relationships acquired in the Closures acquisition, the Company adopted the multi-period excess earnings method (level 3) based on forecasted customer information. In valuing the customer relationships, the Company applied contributory asset charges for working capital, fixed assets, design rights and the workforce totaling 7.6% of revenue. After-tax earnings of customer revenues in excess of estimated contributory asset charges were then discounted using a discount rate of 17.0%. The 17.0% discount rate, which is approximately 1.0% higher than the transaction's internal rate of return
F - 20
("IRR"), was deemed appropriate in order to capture the risk of non-renewal of customer contracts in the medium to long term future.
In order to determine the fair value of the design rights acquired in the Closures acquisitions, The Company adopted the relief from royalty approach (level 3) based on forecasted percentage of revenues attributable to design rights. The Company then applied a royalty rate of 3.0% based on royalty rates commonly used in the rigid plastic and wider plastic manufacturing industries. After-tax royalty savings were then discounted at 17.0%, consistent with the Closures customer relationships asset. The financial results of Closures subsequent to the acquisition are included within the Company's Rigid reporting segment.
KubeTech
On May 30, 2014, the Company acquired 100% of the equity interest of KubeTech. KubeTech was indirectly, wholly owned by Sun Capital Partners V, L.P., the ultimate majority shareholder of the Company. As such, the Company has accounted for this acquisition as a business combination under common control and has recorded the assets and liabilities transferred at the date of the transaction at their historical carrying values. The Company has presented this information retrospectively in the financial statements for the prior periods through the date under which both entities came under common control through the formation of KubeTech by Sun Capital Partners V, L.P. on December 31, 2012.
In the original transaction on December 31, 2012, KubeTech was acquired for total purchase consideration of $45,178, satisfied by capital contributions of $27,178 and a loan from Albea, a related party, in the amount of $18,000. The Company has accounted for this acquisition on December 31, 2012 under the purchase method of accounting prescribed in ASC 805. Accordingly, the purchase consideration was allocated to the assets acquired and liabilities assumed based on their fair values as of the original transaction date.
Subsequent to May 30, 2014, KubeTech's long-term debt liabilities were paid off for total consideration of $21,046 (including accrued interest of $799). In addition, the related party note in the amount of $11,581 was forgiven, which was treated as a capital contribution. KubeTech has been incorporated into the Company's Rigid reporting segment.
St. Neots
On June 12, 2014, the Company purchased 100% of the share capital of St. Neots Holdings Limited ("St. Neots"). St. Neots consists of two manufacturing facilities located in the UK with a sourcing office in Hong Kong. St. Neots is a leading manufacturer of cartonboard solutions for the food-to-go and convenience markets. The Company purchased St. Neots for purchase consideration of £13,301 ($22,195), net of cash acquired. The Company has provisionally allocated the purchase price and recorded goodwill of £8,259 ($12,828). In addition, the Company has estimated identifiable intangible assets consisting of customer relationships valued at £2,597 ($4,034) and technology assets valued at £1,795 ($2,788). The financial results of St. Neots subsequent to the acquisition date are included within the Company's Flexible reporting segment. Other business combination disclosures have been omitted due to the immaterial nature of this acquisition.
Learoyd
On August 21, 2014, the Company acquired the shares of Learoyd Packaging Limited ("Learoyd") for purchase consideration of £6,745 ($11,260), net of cash acquired. Learoyd is one of the UK's leading flexographic print specialists supplying flexible packaging solutions to major supermarkets, own brands and food manufacturers and retailers. The acquisition of Learoyd supports and strengthens Coveris' UK flexible packaging offering through advanced processes and technologies in addition to providing access to new customer and product markets. The purchase price allocation is provisional pending the Company's review of the fair value of assets acquired and liabilities assumed. In conjunction with the provisional purchase price allocation, the Company has recorded goodwill of £250 ($388) as of December 31, 2014. The financial results of Learoyd subsequent to the acquisition date are included within the Company's Flexible reporting segment. Other business combination disclosures have been omitted due to the immaterial nature of this acquisition.
6. Goodwill and Other Intangible Assets
Goodwill
Goodwill represents the excess of the purchase price over the fair value of net assets acquired in business combinations. The Company's two reportable segments are divided into seven reporting units as defined by ASC 350, Intangibles - Goodwill and Other: North America Food and Consumer, North America Performance Packaging, Coveris Advance Coatings, UK Food and
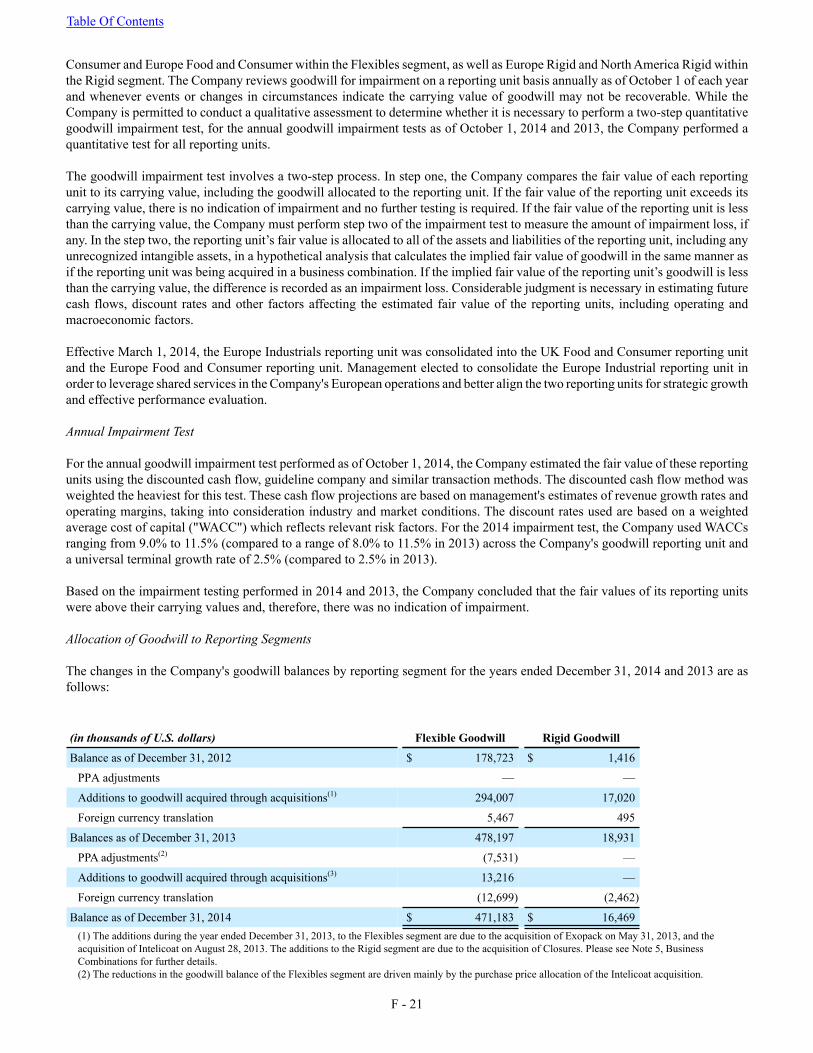
Table Of Contents
F - 21
Consumer and Europe Food and Consumer within the Flexibles segment, as well as Europe Rigid and North America Rigid within the Rigid segment. The Company reviews goodwill for impairment on a reporting unit basis annually as of October 1 of each year and whenever events or changes in circumstances indicate the carrying value of goodwill may not be recoverable. While the Company is permitted to conduct a qualitative assessment to determine whether it is necessary to perform a two-step quantitative goodwill impairment test, for the annual goodwill impairment tests as of October 1, 2014 and 2013, the Company performed a quantitative test for all reporting units.
The goodwill impairment test involves a two-step process. In step one, the Company compares the fair value of each reporting unit to its carrying value, including the goodwill allocated to the reporting unit. If the fair value of the reporting unit exceeds its carrying value, there is no indication of impairment and no further testing is required. If the fair value of the reporting unit is less than the carrying value, the Company must perform step two of the impairment test to measure the amount of impairment loss, if any. In the step two, the reporting unit’s fair value is allocated to all of the assets and liabilities of the reporting unit, including any unrecognized intangible assets, in a hypothetical analysis that calculates the implied fair value of goodwill in the same manner as if the reporting unit was being acquired in a business combination. If the implied fair value of the reporting unit’s goodwill is less than the carrying value, the difference is recorded as an impairment loss. Considerable judgment is necessary in estimating future cash flows, discount rates and other factors affecting the estimated fair value of the reporting units, including operating and macroeconomic factors.
Effective March 1, 2014, the Europe Industrials reporting unit was consolidated into the UK Food and Consumer reporting unit and the Europe Food and Consumer reporting unit. Management elected to consolidate the Europe Industrial reporting unit in order to leverage shared services in the Company's European operations and better align the two reporting units for strategic growth and effective performance evaluation.
Annual Impairment Test
For the annual goodwill impairment test performed as of October 1, 2014, the Company estimated the fair value of these reporting units using the discounted cash flow, guideline company and similar transaction methods. The discounted cash flow method was weighted the heaviest for this test. These cash flow projections are based on management's estimates of revenue growth rates and operating margins, taking into consideration industry and market conditions. The discount rates used are based on a weighted average cost of capital ("WACC") which reflects relevant risk factors. For the 2014 impairment test, the Company used WACCs ranging from 9.0% to 11.5% (compared to a range of 8.0% to 11.5% in 2013) across the Company's goodwill reporting unit and a universal terminal growth rate of 2.5% (compared to 2.5% in 2013).
Based on the impairment testing performed in 2014 and 2013, the Company concluded that the fair values of its reporting units were above their carrying values and, therefore, there was no indication of impairment.
Allocation of Goodwill to Reporting Segments
The changes in the Company's goodwill balances by reporting segment for the years ended December 31, 2014 and 2013 are as follows:
(in thousands of U.S. dollars) Flexible Goodwill Rigid Goodwill
Balance as of December 31, 2012 $ 178,723 $ 1,416
PPA adjustments — —
Additions to goodwill acquired through acquisitions(1) 294,007 17,020
Foreign currency translation 5,467 495
Balances as of December 31, 2013 478,197 18,931
PPA adjustments(2) (7,531) —
Additions to goodwill acquired through acquisitions(3) 13,216 —
Foreign currency translation (12,699) (2,462)
Balance as of December 31, 2014 $ 471,183 $ 16,469(1) The additions during the year ended December 31, 2013, to the Flexibles segment are due to the acquisition of Exopack on May 31, 2013, and the acquisition of Intelicoat on August 28, 2013. The additions to the Rigid segment are due to the acquisition of Closures. Please see Note 5, Business Combinations for further details.(2) The reductions in the goodwill balance of the Flexibles segment are driven mainly by the purchase price allocation of the Intelicoat acquisition.
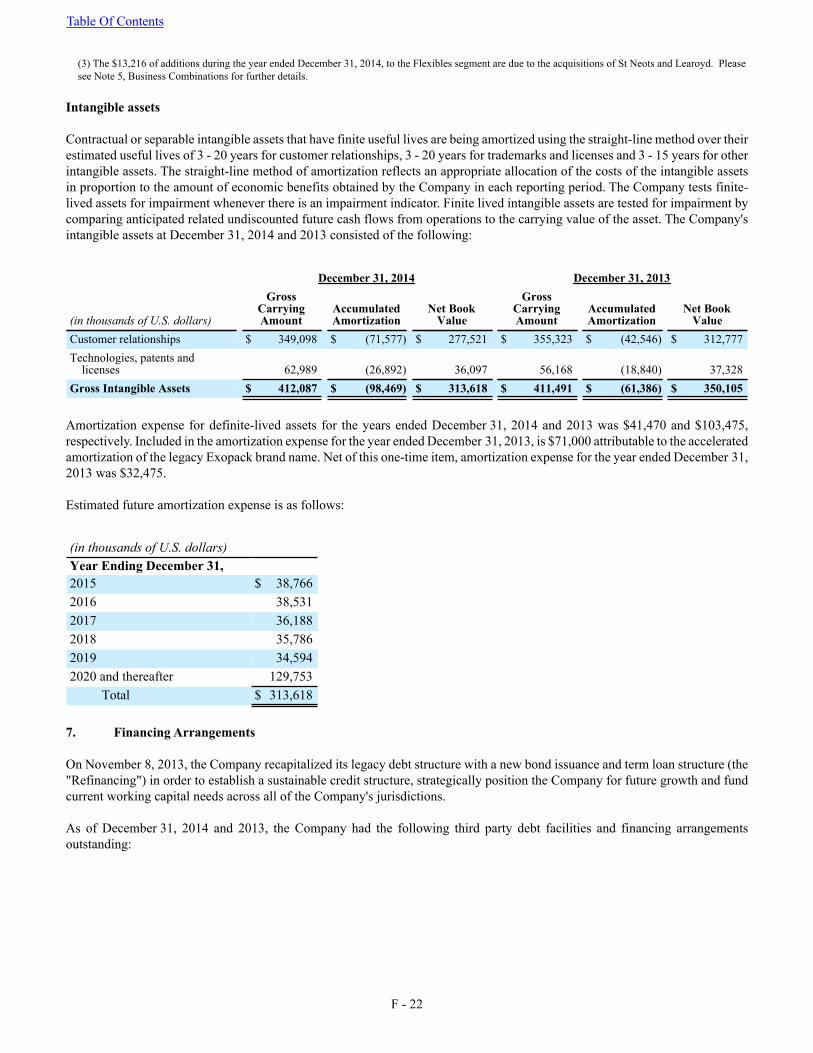
Table Of Contents
F - 22
(3) The $13,216 of additions during the year ended December 31, 2014, to the Flexibles segment are due to the acquisitions of St Neots and Learoyd. Please see Note 5, Business Combinations for further details.
Intangible assets
Contractual or separable intangible assets that have finite useful lives are being amortized using the straight-line method over their estimated useful lives of 3 - 20 years for customer relationships, 3 - 20 years for trademarks and licenses and 3 - 15 years for other intangible assets. The straight-line method of amortization reflects an appropriate allocation of the costs of the intangible assets in proportion to the amount of economic benefits obtained by the Company in each reporting period. The Company tests finite-lived assets for impairment whenever there is an impairment indicator. Finite lived intangible assets are tested for impairment by comparing anticipated related undiscounted future cash flows from operations to the carrying value of the asset. The Company's intangible assets at December 31, 2014 and 2013 consisted of the following:
December 31, 2014 December 31, 2013
(in thousands of U.S. dollars)
GrossCarryingAmount
AccumulatedAmortization
Net BookValue
GrossCarryingAmount
AccumulatedAmortization
Net BookValue
Customer relationships $ 349,098 $ (71,577) $ 277,521 $ 355,323 $ (42,546) $ 312,777Technologies, patents and
licenses 62,989 (26,892) 36,097 56,168 (18,840) 37,328Gross Intangible Assets $ 412,087 $ (98,469) $ 313,618 $ 411,491 $ (61,386) $ 350,105
Amortization expense for definite-lived assets for the years ended December 31, 2014 and 2013 was $41,470 and $103,475, respectively. Included in the amortization expense for the year ended December 31, 2013, is $71,000 attributable to the accelerated amortization of the legacy Exopack brand name. Net of this one-time item, amortization expense for the year ended December 31, 2013 was $32,475.
Estimated future amortization expense is as follows:
(in thousands of U.S. dollars) Year Ending December 31,2015 $ 38,7662016 38,5312017 36,1882018 35,7862019 34,5942020 and thereafter 129,753
Total $ 313,618
7. Financing Arrangements
On November 8, 2013, the Company recapitalized its legacy debt structure with a new bond issuance and term loan structure (the "Refinancing") in order to establish a sustainable credit structure, strategically position the Company for future growth and fund current working capital needs across all of the Company's jurisdictions.
As of December 31, 2014 and 2013, the Company had the following third party debt facilities and financing arrangements outstanding:
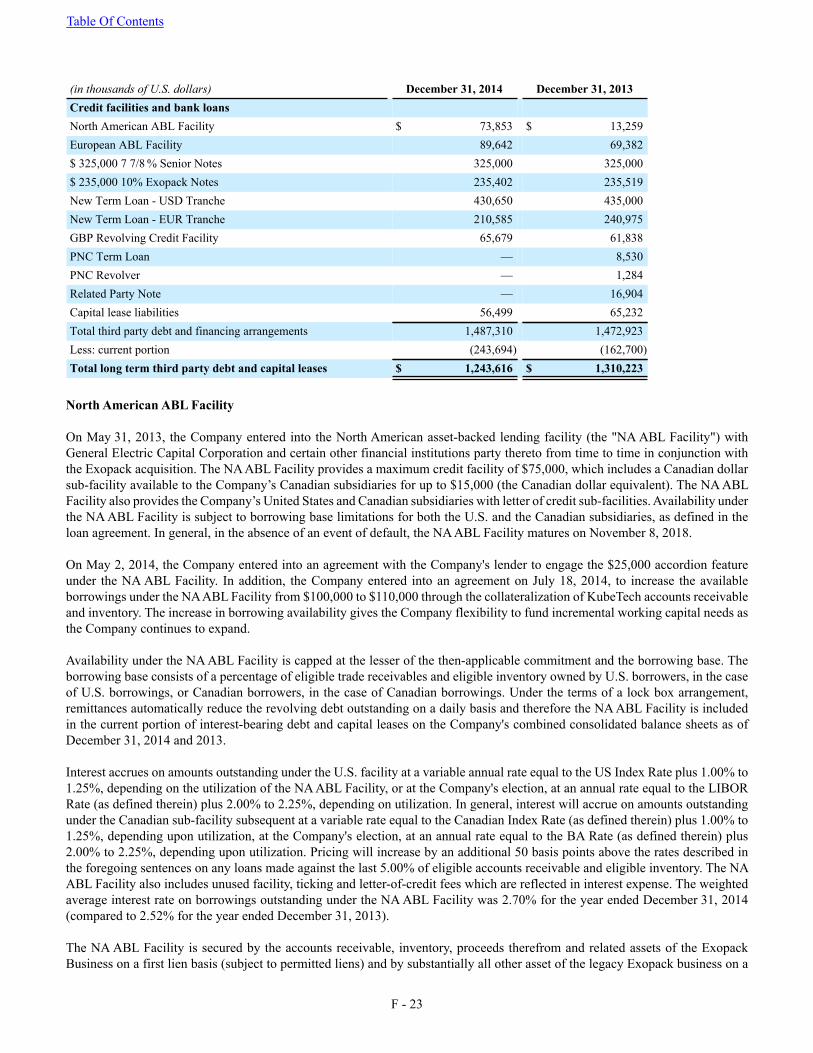
Table Of Contents
F - 23
(in thousands of U.S. dollars) December 31, 2014 December 31, 2013Credit facilities and bank loansNorth American ABL Facility $ 73,853 $ 13,259European ABL Facility 89,642 69,382$ 325,000 7 7/8 % Senior Notes 325,000 325,000$ 235,000 10% Exopack Notes 235,402 235,519New Term Loan - USD Tranche 430,650 435,000New Term Loan - EUR Tranche 210,585 240,975GBP Revolving Credit Facility 65,679 61,838PNC Term Loan — 8,530PNC Revolver — 1,284Related Party Note — 16,904Capital lease liabilities 56,499 65,232Total third party debt and financing arrangements 1,487,310 1,472,923Less: current portion (243,694) (162,700)Total long term third party debt and capital leases $ 1,243,616 $ 1,310,223
North American ABL Facility
On May 31, 2013, the Company entered into the North American asset-backed lending facility (the "NA ABL Facility") with General Electric Capital Corporation and certain other financial institutions party thereto from time to time in conjunction with the Exopack acquisition. The NA ABL Facility provides a maximum credit facility of $75,000, which includes a Canadian dollar sub-facility available to the Company’s Canadian subsidiaries for up to $15,000 (the Canadian dollar equivalent). The NA ABL Facility also provides the Company’s United States and Canadian subsidiaries with letter of credit sub-facilities. Availability under the NA ABL Facility is subject to borrowing base limitations for both the U.S. and the Canadian subsidiaries, as defined in the loan agreement. In general, in the absence of an event of default, the NA ABL Facility matures on November 8, 2018.
On May 2, 2014, the Company entered into an agreement with the Company's lender to engage the $25,000 accordion feature under the NA ABL Facility. In addition, the Company entered into an agreement on July 18, 2014, to increase the available borrowings under the NA ABL Facility from $100,000 to $110,000 through the collateralization of KubeTech accounts receivable and inventory. The increase in borrowing availability gives the Company flexibility to fund incremental working capital needs as the Company continues to expand.
Availability under the NA ABL Facility is capped at the lesser of the then-applicable commitment and the borrowing base. The borrowing base consists of a percentage of eligible trade receivables and eligible inventory owned by U.S. borrowers, in the case of U.S. borrowings, or Canadian borrowers, in the case of Canadian borrowings. Under the terms of a lock box arrangement, remittances automatically reduce the revolving debt outstanding on a daily basis and therefore the NA ABL Facility is included in the current portion of interest-bearing debt and capital leases on the Company's combined consolidated balance sheets as of December 31, 2014 and 2013.
Interest accrues on amounts outstanding under the U.S. facility at a variable annual rate equal to the US Index Rate plus 1.00% to 1.25%, depending on the utilization of the NA ABL Facility, or at the Company's election, at an annual rate equal to the LIBOR Rate (as defined therein) plus 2.00% to 2.25%, depending on utilization. In general, interest will accrue on amounts outstanding under the Canadian sub-facility subsequent at a variable rate equal to the Canadian Index Rate (as defined therein) plus 1.00% to 1.25%, depending upon utilization, at the Company's election, at an annual rate equal to the BA Rate (as defined therein) plus 2.00% to 2.25%, depending upon utilization. Pricing will increase by an additional 50 basis points above the rates described in the foregoing sentences on any loans made against the last 5.00% of eligible accounts receivable and eligible inventory. The NA ABL Facility also includes unused facility, ticking and letter-of-credit fees which are reflected in interest expense. The weighted average interest rate on borrowings outstanding under the NA ABL Facility was 2.70% for the year ended December 31, 2014 (compared to 2.52% for the year ended December 31, 2013).
The NA ABL Facility is secured by the accounts receivable, inventory, proceeds therefrom and related assets of the Exopack Business on a first lien basis (subject to permitted liens) and by substantially all other asset of the legacy Exopack business on a
Table Of Contents
F - 24
second lien basis (subject to permitted liens). However, the assets of any non-U.S. entities in the legacy Exopack business do not secure the obligations under the U.S. facility.
The NA ABL Facility contains certain customary affirmative and negative covenants restricting the Company’s and its subsidiaries’ ability to, among other things, incur additional indebtedness, grant liens, engage in mergers, acquisitions and asset sales, declare dividends and distributions, redeem or repurchase equity interests, incur contingent obligations, prepay certain subordinated indebtedness, make loans, certain payments and investments and enter into transactions with affiliates.
As of December 31, 2014, $73,853 was outstanding and $17,929 was available for additional borrowings, net of outstanding letters of credit of $4,486 under the NA ABL Facility.
The Company recognized $720 in deferred financing costs related to the amendment of the NA ABL Facility in 2013, which are being amortized on a straight-line basis over the term of the NA ABL Facility.
European ABL Facility
On November 8, 2013, the Company entered receivables and inventory financing arrangements in each of France, Germany and the United Kingdom whereby cash is made available to the Company in consideration for inventory and certain trade receivables generated in these respective countries. The aggregate of any advances or borrowings under the GE French Facilities, the GE Germany Facilities and the GE UK Facility is limited to $175,000 (equivalent) and the GE French Facilities, the GE Germany Facilities and the GE UK Facility and the security and guarantees granted in respect thereof are, in the cases of the GE French Facilities and the GE UK Facility, subject to the terms of the Intercreditor Agreement.
As of December 31, 2014, $89,642 was outstanding and approximately $57,523 was available for additional borrowings under the European ABL Facility. The weighted average interest rate on borrowings outstanding under the European ABL Facility was 2.95% for the year ended December 31, 2014 (compared to 2.68% for the year ended December 31, 2013).
France
Under the French Facilities with GE Factofrance and Cofacredit (the “Factors”), certain wholly-owned subsidiaries shall sell and assign to the Factors certain debts which, subject to the terms and conditions of the French Facilities, the assignees are obliged to buy and accept. The sale price for the assigned debt is approximately 85%. The facilities are non-recourse facilities. The maximum aggregate funded amount under the French Facilities is limited to €48,000. The French Facilities have an unfixed term with a five year commitment period under which the Factors shall not be entitled to terminate the contracts except upon the occurrence of (i) a breach of any of the covenants listed under the French Facilities, (ii) an event of default under any facility granted by a GE Capital entity or (iii) a revocation of the mandates as defined under the contracts. Apart from the commitment period, any termination of the contracts requires three months’ prior notice, save that (i) the Factors may terminate at any time without prior notice upon the occurrence of certain events described under the French Facilities, (ii) the parties may terminate if Coveris Holdings S.A ceases to directly or indirectly own at least 51% of the equity interests of the Company, (iii) the Factors may terminate the contracts with a ten (10) working days prior notice, and with immediate effect in the event any representation or warranty made by Coveris Holdings S.A. pursuant to the Side Letter is not complied with or proves to have been incorrect or misleading when made or deemed to be made and is not remedied within the above notice period by any means or party. Within the frame of the French Facilities, certain wholly-owned subsidiaries have pledged to the benefit of the Factors, the receivables held over the Factors on the current accounts opened in their books, in order to secure the obligations under the terms of the French Facilities.
Germany
Under the German facilities with GE Capital Bank AG, to be entered into by certain wholly-owned subsidiaries as originators and GE Capital Bank AG as factoring bank (the “GE Germany Facilities”), certain wholly-owned subsidiaries may sell and assign to GE Capital Bank AG certain receivables which, subject to the terms and conditions of the GE Germany Facilities, the assignee is obliged to buy and accept. It is further intended that certain wholly-owned subsidiaries provide certain limited cross guarantees for the benefit of GE Capital Bank AG to guarantee their obligations under the GE Germany Facilities. The factoring fee for the GE Germany Facilities is 0.15% calculated as a multiple of the gross turnover of assigned receivables and bears interest at 3M EURIBOR +2.25%. The facilities are non-recourse facilities. The maximum aggregate funded amount under the GE Germany Facilities is limited to €25,000. The GE Germany Facilities have a five year term and any termination of the contract requires three months’ prior notice to the second anniversary, the third anniversary or the fourth anniversary of the relevant commencement date, save that GE Capital Bank AG may terminate at any time if one of the following termination events, amongst others, occurs: a change of control, a cross-default and breach of the relevant fixed charge coverage.
Table Of Contents
F - 25
United Kingdom
Under the GE UK Facility with GE Capital Bank Limited (“GE”), certain wholly-owned subsidiaries (the “Clients”) assign to GE Capital Bank Limited certain debts which, subject to customary conditions, GE is obliged to buy and accept. Certain wholly-owned subsidiaries are guarantors under the GE UK Facility (the “UK Obligors”). The Clients and UK Obligors have granted security in favor of GE over non-vesting debts and a floating charge over all assets subject to the terms of the Intercreditor Agreement. The GE UK Facility is comprised of an invoice finance facility for which the aggregate loan advance limit is £69,000 (the “Invoice Facility”) and a revolving inventory finance facility for which the aggregate current account limit is £20,000 (the “Revolving Inventory Facility”). Under the Invoice Facility, the advance percentage for the assigned debts is 90% of the nominal amount of the debt, subject to reduction in respect of the discount rate, service charges and other liabilities. Under the Revolving Inventory Facility, the loan advance percentage of the eligible inventory is 80% of the net orderly liquidation value of that inventory, subject to reduction in respect of certain customary reserves. The GE UK Facility has recourse terms where the Clients and UK Obligors bear the credit risk of the transactions (including where the underlying debtor fails to pay). The GE UK Facility has a term of five years and any termination of the contract requires either three months’ prior notice where there is a refinancing or one month’s prior notice where there is a sale of the Company. Customary representations and warranties are included in the GE UK Facility and customary restrictions on disposals of assets and granting liens are also included. Events of default include failure to pay, misrepresentation, insolvency, insolvency proceedings, breach of obligations and cross-acceleration and cross-default to other indebtedness of the Clients or the UK Obligors. A mandatory prepayment is required upon the change of control of a Client or UK Obligor subject to minimum thresholds in respect of EBITDA, gross assets or turnover being satisfied. In addition, if the availability under the Invoice Facility plus the availability under the Revolving Inventory Facility plus the equivalent concept of availability under the GE Germany Facility and the GE French Facilities is less than $14,583, the Clients shall not permit the ratio of operating cash flow of the Company to the fixed charges of the Company to be less than 1.00:1.00.
$325,000 7 7/8% Senior Notes
On November 8, 2013 the Company issued $325,000 in aggregate principal amount 7 7/8% Senior Notes (the “Senior Notes”) maturing on November 1, 2019. Interest on the Senior Notes is paid semi-annually on each November 1 and May 1, commencing on May 1, 2014. The Senior Notes are senior unsecured obligations of the Company, ranking senior in right of payment to all of the Company's future debt that is expressly subordinated in right of payment to the Senior Notes and rank pari passu in right of payment with the Company's existing and future debt that is not so subordinated, including the Company's obligations under the New Term Loan, the European ABL Facilities, the NA ABL Facility and the Exopack Notes.
The Senior Notes are guaranteed on a senior unsecured basis (the “Guarantees”) by substantially all of the Company's subsidiaries organized in the United States, the United Kingdom, Canada, Austria, Germany, Finland, Luxembourg and Poland (the “Guarantors”). Each of the Guarantees ranks senior in right of payment to the applicable Guarantor’s future debt that is expressly subordinated in right of payment to such Guarantee and ranks pari passu in right of payment with such Guarantor’s existing and future debt that is not so subordinated, including the applicable Guarantor’s obligations under the New Term Loan, the European ABL Facilities, the NA ABL Facility and the Exopack Notes, as applicable. The validity and enforceability of the Guarantees and the liability of each Guarantor is subject to certain limitations described in the offering memorandum relating to the Senior Notes dated October 24, 2013. The Notes and Guarantees are structurally subordinated to all obligations of the Company's subsidiaries that do not guarantee the Notes and effectively subordinated to any existing and future secured debt of the Company and its subsidiaries, to the extent of the value of the property and assets securing such debt.
At any time prior to November 1, 2016, the Company may on any one or more occasions redeem up to 40% of the aggregate principal amount of the Notes issued under the Indenture, upon not less than 30 nor more than 60 days’ notice, at a redemption price equal to 107.875% of the principal amount of the Notes redeemed, plus accrued and unpaid interest and Additional Amounts, if any, to the date of redemption, with the net cash proceeds of an Equity Offering of (i) the Company or (ii) any Parent Holdco of the Company to the extent the proceeds from such Equity Offering are contributed to the Company’s common equity capital or are paid to the Company as consideration for the issuance of ordinary shares; provided that:
(1) at least 60% of the aggregate principal amount of the Notes originally issued under the Indenture (excluding Notes held by the Company and its Subsidiaries) remains outstanding immediately after the occurrence of such redemption; and
(2) the redemption occurs within 120 days of the date of the closing of such Equity Offering.
Further, at any time prior to November 1, 2016, the Company may on any one or more occasions redeem all or a part of the Notes upon not less than 30 nor more than 60 days’ notice, at a redemption price equal to 100% of the principal amount of such Notes
Table Of Contents
F - 26
redeemed plus the Applicable Premium, as defined in the Indenture governing the Senior Notes, as of, and accrued and unpaid interest and Additional Amounts, as defined in the Indenture, if any, to the date of redemption.
On or after November 1, 2016, the Company may on any one or more occasions redeem all or a part of the Notes upon not less than 30 nor more than 60 days’ notice (subject to such longer period as may be determined by the Company, in the case of a defeasance of the Notes or a satisfaction and discharge of the Indenture), at the redemption prices (expressed as percentages of principal amount) set forth below, plus accrued and unpaid interest and Additional Amounts, if any, on the Notes redeemed, to the applicable date of redemption, if redeemed during the twelve-month period beginning on November 1 of the years indicated below:
Year Redemption Price2016 103.938%2017 101.969%2018 and thereafter 100.000%
Unless the Company defaults in the payment of the redemption price, interest will cease to accrue on the Notes or portions thereof called for redemption on the applicable redemption date.
Any redemption and notice may, in the Company's discretion, be subject to the satisfaction of one or more conditions precedent.
The Senior Notes require the Company to comply with customary affirmative and negative covenants applicable to the Company and its restricted subsidiaries. Set forth below is a brief description of the affirmative and negative covenants, all of which will be subject to customary exceptions, materiality thresholds and qualifications, including, in the case of certain negative covenants, the ability to grow baskets with retained excess cash flow, the proceeds of qualified equity issuances and certain other amounts:
• The affirmative covenants include the following: (i) delivery of financial statements and other customary financial information; (ii) notices of events of default and other material events; (iii) maintenance of existence, ability to conduct business, properties, insurance and books and records; (iv) payment of certain obligations; (v) inspection rights; (vi) compliance with laws, including employee benefits and environmental laws; (vii) use of proceeds; (viii) further assurances; (ix) additional collateral and guarantor requirements; (x) maintenance of ratings; (xi) designation of unrestricted subsidiaries; (xii) information regarding collateral; and (xiv) post-closing matters.
• The negative covenants include limitations on: (i) indebtedness and the issuance of preferred stock; (ii) restricted payments; (iii) liens; (iv) dividend and other payment restrictions; (v) layered debt; (vi) mergers, consolidation or sale of assets and (vii) transactions with affiliates.
$235,000 10% Exopack Notes
On May 31, 2013, the Company assumed the $235,000 10% Notes (the "Exopack Notes") in conjunction with the Exopack acquisition. The Exopack Notes were issued pursuant to the indenture dated May 31, 2011, between, among others, Exopack and The Bank of New York Mellon Trust Company, N.A., as trustee. Exopack issued $235,000 in aggregate principal amount of unregistered senior notes. Included in the carrying value of the Exopack notes is an unamortized note premium of $402 recorded in conjunction with the purchase price allocation of the Exopack acquisition. This debt premium to record the Exopack Notes at fair value on the acquisition date is amortized on a straight line basis from the acquisition date through the maturity date of June 1, 2018.
The Exopack Notes accrue interest at the rate of 10% per annum and payable semi-annually on each June 1 and December 1.
The Exopack Notes are senior unsecured obligations of the Company and rank equally in right of payment with all existing and future senior indebtedness of Exopack, rank senior in right of payment to any future subordinated indebtedness of Exopack, and are effectively subordinated to any secured indebtedness of Exopack up to the value of the collateral securing such indebtedness. The Exopack Notes are unconditionally guaranteed, jointly and severally, on a senior basis, by the Guarantors that also guarantee the Senior Notes (except for the subsidiaries of Exopack that are organized outside of the United States). The guarantees of the Exopack Notes rank equally in right of payment with all existing and future senior indebtedness of the guarantors, rank senior in right of payment to any future subordinated indebtedness of the guarantors, and are effectively subordinated to any secured indebtedness of the guarantors, including the New Term Loan), up to the value of the collateral securing such indebtedness. The guarantees of the Exopack Notes may be released under certain conditions, including the sale or other disposition of all or substantially all of the guarantor subsidiary’s assets, the sale or other disposition of all the capital stock of the guarantor subsidiary,
Table Of Contents
F - 27
change in the designation of any restricted subsidiary as an unrestricted subsidiary by Exopack, or upon legal defeasance or satisfaction and discharge of the Exopack Notes.
Exopack is not required to make mandatory redemption or sinking fund payments with respect to the Exopack Notes.
If Exopack experiences a change of control, Exopack must offer to repurchase the Exopack Notes at a price equal to 101% of the aggregate principal amount of the Exopack Notes, plus accrued and unpaid interest and additional amounts, if any, to the date of purchase.
The Exopack Notes Indenture contains customary events of default, including, without limitation, payment defaults, covenant defaults, certain cross-defaults to mortgages, indentures or other instruments, certain events of bankruptcy and insolvency, and judgment defaults. The Exopack Notes Indenture contains covenants for the benefit of the holders of the Exopack Notes substantially similar to the covenants that govern the Senior Notes.
New Term Loan
On November 8, 2013, the Company entered into a credit agreement (the “New Term Loan”) with Goldman Sachs Bank USA, as administrative and collateral agent and the certain financial institutions and other persons party thereto as lenders from time to time. The Company borrowed a single draw dollar denominated term loan of approximately $435,000 (the "New Term Loan - USD Tranche") in principal amount and a single draw euro denominated term loan of approximately €175,000 (the "New Term Loan - EUR Tranche") in principal amount pursuant to the New Term Loan Facility Agreement. As of December 31, 2014 there was $430,650 and $210,585 of principal outstanding on the USD Tranche and EUR Tranche, respectively.
The New Term Loan matures on May 8, 2019. Should the maturity of the Exopack Notes not be extended (and the Exopack Notes remain outstanding at the time), the maturity of the New Term Loan will be automatically shortened to the date that is 91 days prior to the maturity date of the Exopack Notes. The term loan shall be repayable in equal quarterly installments of 1.00% per annum of the original principal amounts.
The Company may also incur an incremental term loan under the New Term Loan from time to time in an amount not to exceed $50,000 plus an unlimited amount subject to meeting a secured net leverage ratio approximately equal to the secured net leverage ratio as of November 8, 2013. The incurrence of an incremental term loan is subject to various customary conditions, including locating a lender or lenders willing to provide it.
The New Term Loan, at the Company’s option, will from time to time bear interest at either (i) with respect to loans denominated in dollars, (a) 3.25% in excess of the alternate base rate (i.e., the greatest of the prime rate, the federal funds effective rate in effect on such day plus 1/2 of 1%, and the London interbank offer rate (after giving effect to any floor) for an interest period of one month) in effect from time to time, or (b) 4.25% in excess of the London interbank offer rate (adjusted for maximum reserves), and (ii) with respect to loans denominated in euros, 4.75% in excess of the euro interbank offer rate (adjusted for maximum reserves). The London interbank offer rate and the euro interbank offer rate will be subject to a floor of 1.00% and the alternate base rate will subject to a floor of 2.00%. Interest will be payable quarterly in arrears and at maturity. The interest rate applicable to amounts outstanding on the New Term Loan - USD Tranche was 5.25% as of December 31, 2014. The applicable interest rate applicable to amounts outstanding on the New Term Loan - EUR Tranche was 5.75% as of December 31, 2014.
All obligations of the Company under the New Term Loan and any secured hedging arrangements and secured cash management agreements provided by lenders or affiliates thereof will be unconditionally guaranteed by the Guarantors.
Subject to customary agreed security principles, certain excluded ABL collateral under the GE Germany Facilities and the French Facilities and the lien priorities, the New Term Loan Facility will be secured by substantially all assets of the Company and the Guarantors.
The New Term Loan Facility Agreement does not include any financial covenants.
The New Term Loan has customary events of default (subject to materiality thresholds and standstill and grace periods), including: (a) non-payment of obligations (subject to a five business day grace period in the case of interest and fees); (b) breach of representations, warranties and covenants (subject to a thirty-day grace period following written notice in the case of certain covenants); (c) bankruptcy (voluntary or involuntary); (d) inability to pay debts as they become due; (e) cross default and cross acceleration to material indebtedness; (f) ERISA events; (g) change in control; (h) invalidity of liens, guarantees, subordination agreements; and (i) judgments.
Table Of Contents
F - 28
The New Term Loan requires the Company to comply with customary affirmative and negative covenants applicable to the Company and its restricted subsidiaries. Set forth below is a brief description of the affirmative and negative covenants, all of which will be subject to customary exceptions, materiality thresholds and qualifications, including, in the case of certain negative covenants, the ability to grow baskets with retained excess cash flow, the proceeds of qualified equity issuances and certain other amounts:
• The affirmative covenants include the following: (i) delivery of financial statements and other customary financial information; (ii) notices of events of default and other material events; (iii) maintenance of existence, ability to conduct business, properties, insurance and books and records; (iv) payment of certain obligations; (v) inspection rights; (vi) compliance with laws, including employee benefits and environmental laws; (vii) use of proceeds; (viii) further assurances; (ix) additional collateral and guarantor requirements; (x) maintenance of ratings; (xi) designation of unrestricted subsidiaries; (xii) information regarding collateral; and (xiv) post-closing matters.
• The negative covenants include limitations on: (i) liens; (ii) debt (including guaranties); (iii) fundamental changes; (iv) dispositions (including sale leasebacks); (v) affiliate transactions; (vi) investments (vii) restrictive agreements, and no negative pledges; (viii) restricted payments; (ix) voluntary prepayments of unsecured and subordinated debt; (x) amendments to certain debt agreements and organizational documents; (xi) changes of business, center of main interests or fiscal years; and (xii) anti-terrorism and sanctions related matters.
GBP Revolving Credit Facility
On October 18, 2013, the Company entered into a Loan Authorization Agreement (the "GBP Revolving Credit Facility") with Bank of Montreal Ireland P.L.C.
Borrowings on the GBP Revolving Credit Facility are payable on demand; provided that to the extent funds are not immediately available, the Company shall have ten business days to honor any demand for payment requested by Bank of Montreal Ireland P.L.C. Borrowings are guaranteed by a related party parent, Sun Capital Partners V, L.P.
As of December 31, 2014, there was $65,679 (£42,286) outstanding on the GBP Revolving Credit Facility, which accrues interest on all outstanding amounts at an interest rate of 3.50% above Adjusted LIBOR, as set forth in the Loan Authorization Agreement dated October 18, 2013. The applicable interest rate as of December 31, 2014 was 4.20%.
PNC Term Loan and Revolver
On February 8, 2013, KubeTech entered into a revolving credit, term loan and security agreement (the "PNC Credit Agreement") with PNC Bank with total commitments of $32,250. The total commitments consisted of $10,000 in term loans ("PNC Term Loans") and a $22,250 revolving loan advance ("PNC Revolving Loan"). The PNC Credit Agreement was secured by substantially all of the assets of KubeTech and was guaranteed by Rose HPC.
As a part of the acquisition of KubeTech by the Company on May 30, 2014, the outstanding principal and interest on the PNC Term Loans and PNC Revolving Loan were paid in full. The total pay off amount was $16,446, including accrued interest of $373. Unamortized deferred financing costs totaling $190 were written off as a result of the settlement of the facilities.
Related Party Note
As of the formation of KubeTech on December 31, 2012, KubeTech executed a subordinated promissory note with Albea, a related party owned by Sun Capital, for an aggregate amount of $18,000 (the "Related Party Note"). On January 8, 2013, KubeTech sold all of its shares in its Poland facility to Albea for $3,000, the total of which was applied to the principal of the Related Party Note. The Related Party Note is subordinate to the PNC Credit Agreement. Interest accrued at a rate of 10% and was capitalized to principal annually. The Related Party Note was scheduled to mature on December 31, 2017.
Following the acquisition of KubeTech by the Company on May 30, 2014, the Company made a cash payment of $4,600 to settle the Related Party Note, which included both outstanding interest and principal. An additional $9,918 of principal and $1,012 of accrued interest was forgiven and accounted for as a capital contribution along with $651 in equipment transfers to Albea. The remainder of the Related Party Note was satisfied through the settlement of related party trading balances owed to KubeTech by Albea.
Exopack Term Loan
Table Of Contents
F - 29
On May 31, 2013, the Company assumed the $350,000 secured term loan B facility (the “Exopack Term Loan”) in conjunction with the Exopack acquisition. This loan was paid off in its entirety from the proceeds generated on November 8, 2013 utilizing proceeds from the 2013 Refinancing.
Master Facility Agreement - Paragon
In June 2013, the Company entered into a six year master financing agreement to refinance the bridge financing obtained in the acquisition of Paragon and to support on-going working capital requirements of the Company. The overall facilities limit is £110,000 ($178,134) and is comprised of a receivables finance facility (RF), an inventory finance facility (IF), a fixed asset loan (FAL), a cash flow loan (CFL) and a capital expenditure loan (CL). The credit facilities include asset pledged as collaterals to the lenders, including inventory and fixed assets. The entire amounts outstanding under this facility were satisfied utilizing proceeds from the 2013 Refinancing.
Transaction costs of £500 were incurred during the issuance of this debt which have been capitalized and amortized over the term of the agreement. These transaction costs have been fully amortized in conjunction with the extinguishment of this facility in the 2013 Refinancing.
In connection with the 2013 Refinancing, the Company was required to pay certain early termination fees on the existing facilities. These fees amounted to $10,429 for the year ended December 31, 2013 and are included within interest expense, net on the combined consolidated statement of operations for the year ended December 31, 2013.
Shareholder loans
As of December 31, 2014 and December 31, 2013, the Company had related party shareholder loans which are PECs, ALPECs or YFPECs. The terms and the carrying amount of the shareholder loans are as follows:
(in thousands of U.S. dollars) December 31, 2014 December 31, 2013€ 66.0 million PEC 80,853 91,595€ 37.0 million PEC 45,555 51,608€ 17.0 million PEC 21,614 24,486€ 7.0 million PEC 9,581 10,854€ 28.0 million ALPEC 35,121 39,787€ 4.0 million ALPEC 2,105 2,385€ 2.0 million YFPEC 3,413 3,867Total related party loans 198,242 224,582Less: Current portion — —Total long term related party loans $ 198,242 $ 224,582
On January 23, 2013 Neuheim Lux Group Holding V exercised its option to convert the £0.6 million yield free convertible PECs to shares. 585,531 shares in Paragon Management S.a.r.l. were issued to Neuheim Lux Group Holding V, increasing the number of shares outstanding in Paragon Management S.a.r.l. to 616,209.
On May 31, 2013, the shareholder loans of Paccor, Britton, Kobusch and Paragon were redeemed by the shareholders in exchange for newly issued YFPECs. As part of the restructuring, YFPECs (including the new instruments issued in connection with the redemption of CPECs) were subsequently transferred to Coveris Holdings S.A. in exchange for shares while PECs and ALPECs were transferred by the shareholders at book value in exchange for new PECs and ALPECs with the same terms. The Company converted the remaining accrued interest related to the previously redeemed shareholder loans into equity during the year ended December 31, 2013.
PEC Shareholder Loans
The Company’s shareholders have provided interest-bearing PECs with a term of 49 years. Principal is payable on the PECs at maturity and interest is accrued annually on December 31. The applicable interest rate for each of these instruments is equal to the arm's length market rate of interest per annum as agreed between the parties to the agreement from time to time and reduced
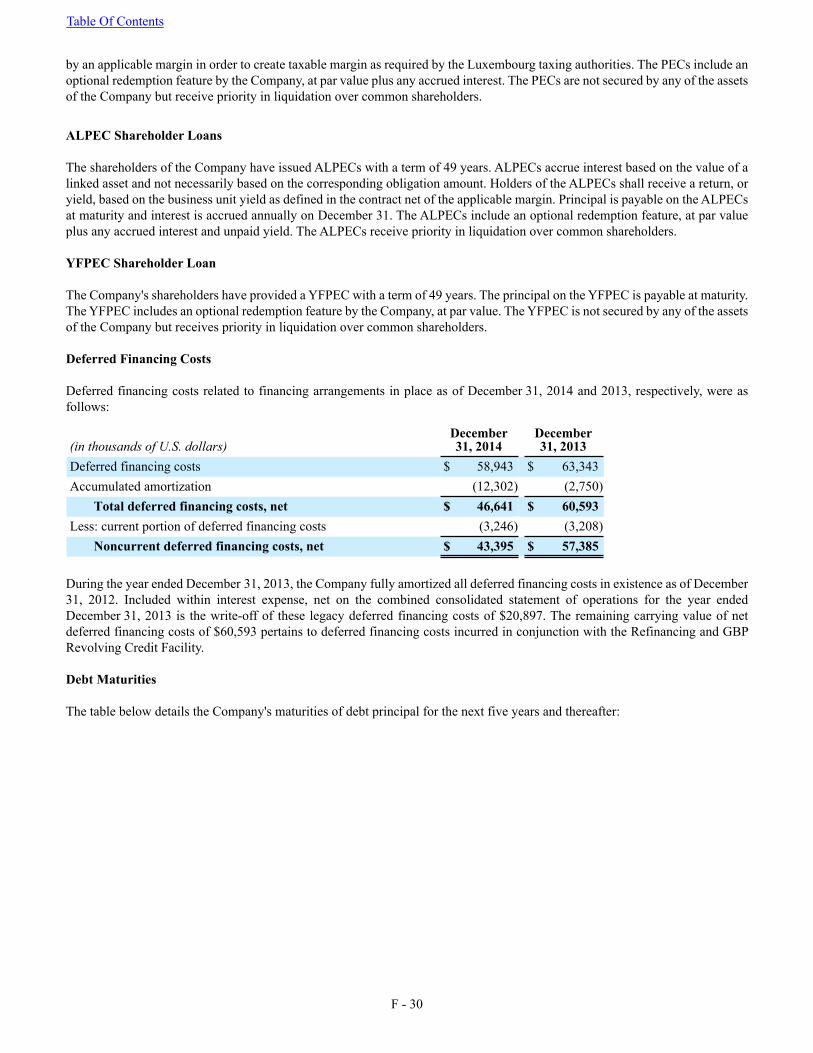
Table Of Contents
F - 30
by an applicable margin in order to create taxable margin as required by the Luxembourg taxing authorities. The PECs include an optional redemption feature by the Company, at par value plus any accrued interest. The PECs are not secured by any of the assets of the Company but receive priority in liquidation over common shareholders.
ALPEC Shareholder Loans
The shareholders of the Company have issued ALPECs with a term of 49 years. ALPECs accrue interest based on the value of a linked asset and not necessarily based on the corresponding obligation amount. Holders of the ALPECs shall receive a return, or yield, based on the business unit yield as defined in the contract net of the applicable margin. Principal is payable on the ALPECs at maturity and interest is accrued annually on December 31. The ALPECs include an optional redemption feature, at par value plus any accrued interest and unpaid yield. The ALPECs receive priority in liquidation over common shareholders.
YFPEC Shareholder Loan
The Company's shareholders have provided a YFPEC with a term of 49 years. The principal on the YFPEC is payable at maturity. The YFPEC includes an optional redemption feature by the Company, at par value. The YFPEC is not secured by any of the assets of the Company but receives priority in liquidation over common shareholders.
Deferred Financing Costs
Deferred financing costs related to financing arrangements in place as of December 31, 2014 and 2013, respectively, were as follows:
(in thousands of U.S. dollars)December31, 2014
December31, 2013
Deferred financing costs $ 58,943 $ 63,343Accumulated amortization (12,302) (2,750)
Total deferred financing costs, net $ 46,641 $ 60,593Less: current portion of deferred financing costs (3,246) (3,208)
Noncurrent deferred financing costs, net $ 43,395 $ 57,385
During the year ended December 31, 2013, the Company fully amortized all deferred financing costs in existence as of December 31, 2012. Included within interest expense, net on the combined consolidated statement of operations for the year ended December 31, 2013 is the write-off of these legacy deferred financing costs of $20,897. The remaining carrying value of net deferred financing costs of $60,593 pertains to deferred financing costs incurred in conjunction with the Refinancing and GBP Revolving Credit Facility.
Debt Maturities
The table below details the Company's maturities of debt principal for the next five years and thereafter:
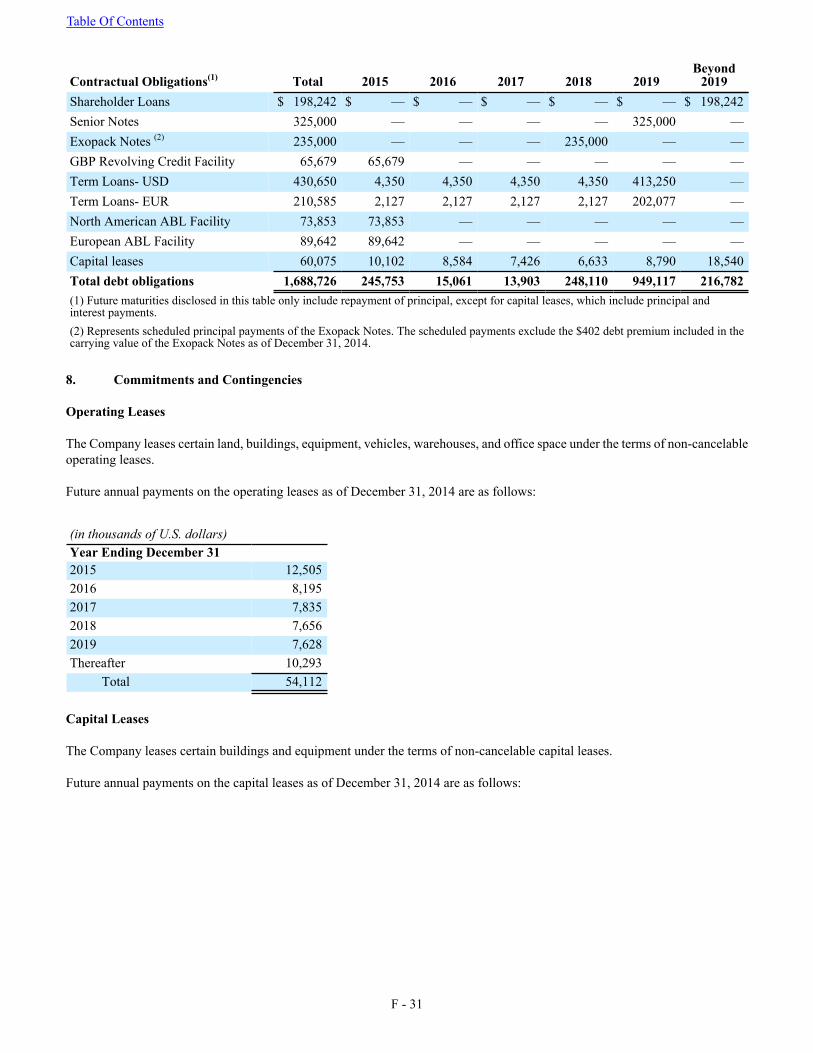
Table Of Contents
F - 31
Contractual Obligations(1) Total 2015 2016 2017 2018 2019Beyond
2019Shareholder Loans $ 198,242 $ — $ — $ — $ — $ — $ 198,242Senior Notes 325,000 — — — — 325,000 —Exopack Notes (2) 235,000 — — — 235,000 — —GBP Revolving Credit Facility 65,679 65,679 — — — — —Term Loans- USD 430,650 4,350 4,350 4,350 4,350 413,250 —Term Loans- EUR 210,585 2,127 2,127 2,127 2,127 202,077 —North American ABL Facility 73,853 73,853 — — — — —European ABL Facility 89,642 89,642 — — — — —Capital leases 60,075 10,102 8,584 7,426 6,633 8,790 18,540Total debt obligations 1,688,726 245,753 15,061 13,903 248,110 949,117 216,782(1) Future maturities disclosed in this table only include repayment of principal, except for capital leases, which include principal andinterest payments.(2) Represents scheduled principal payments of the Exopack Notes. The scheduled payments exclude the $402 debt premium included in thecarrying value of the Exopack Notes as of December 31, 2014.
8. Commitments and Contingencies
Operating Leases
The Company leases certain land, buildings, equipment, vehicles, warehouses, and office space under the terms of non-cancelable operating leases.
Future annual payments on the operating leases as of December 31, 2014 are as follows:
(in thousands of U.S. dollars) Year Ending December 312015 12,5052016 8,1952017 7,8352018 7,6562019 7,628Thereafter 10,293
Total 54,112
Capital Leases
The Company leases certain buildings and equipment under the terms of non-cancelable capital leases.
Future annual payments on the capital leases as of December 31, 2014 are as follows:
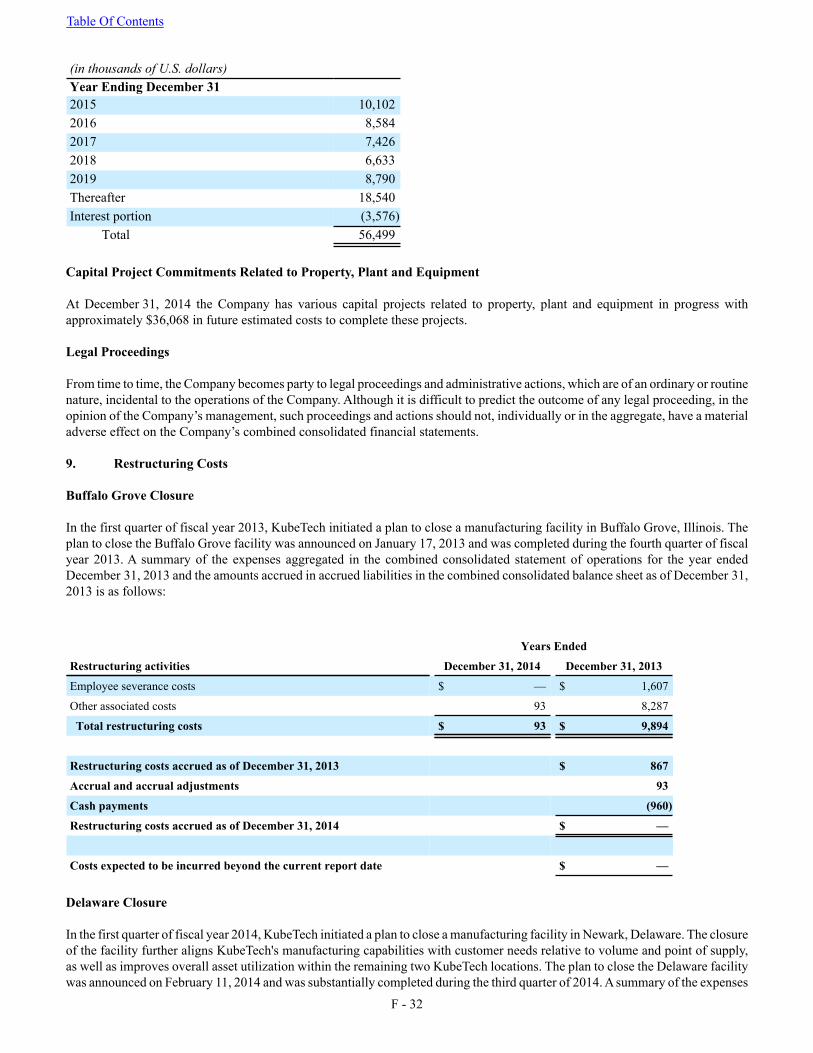
Table Of Contents
F - 32
(in thousands of U.S. dollars) Year Ending December 312015 10,1022016 8,5842017 7,4262018 6,6332019 8,790Thereafter 18,540Interest portion (3,576)
Total 56,499
Capital Project Commitments Related to Property, Plant and Equipment
At December 31, 2014 the Company has various capital projects related to property, plant and equipment in progress with approximately $36,068 in future estimated costs to complete these projects.
Legal Proceedings
From time to time, the Company becomes party to legal proceedings and administrative actions, which are of an ordinary or routine nature, incidental to the operations of the Company. Although it is difficult to predict the outcome of any legal proceeding, in the opinion of the Company’s management, such proceedings and actions should not, individually or in the aggregate, have a material adverse effect on the Company’s combined consolidated financial statements.
9. Restructuring Costs
Buffalo Grove Closure
In the first quarter of fiscal year 2013, KubeTech initiated a plan to close a manufacturing facility in Buffalo Grove, Illinois. The plan to close the Buffalo Grove facility was announced on January 17, 2013 and was completed during the fourth quarter of fiscal year 2013. A summary of the expenses aggregated in the combined consolidated statement of operations for the year ended December 31, 2013 and the amounts accrued in accrued liabilities in the combined consolidated balance sheet as of December 31, 2013 is as follows:
Years Ended
Restructuring activities December 31, 2014 December 31, 2013
Employee severance costs $ — $ 1,607
Other associated costs 93 8,287
Total restructuring costs $ 93 $ 9,894
Restructuring costs accrued as of December 31, 2013 $ 867
Accrual and accrual adjustments 93
Cash payments (960)
Restructuring costs accrued as of December 31, 2014 $ —
Costs expected to be incurred beyond the current report date $ —
Delaware Closure
In the first quarter of fiscal year 2014, KubeTech initiated a plan to close a manufacturing facility in Newark, Delaware. The closure of the facility further aligns KubeTech's manufacturing capabilities with customer needs relative to volume and point of supply, as well as improves overall asset utilization within the remaining two KubeTech locations. The plan to close the Delaware facility was announced on February 11, 2014 and was substantially completed during the third quarter of 2014. A summary of the expenses
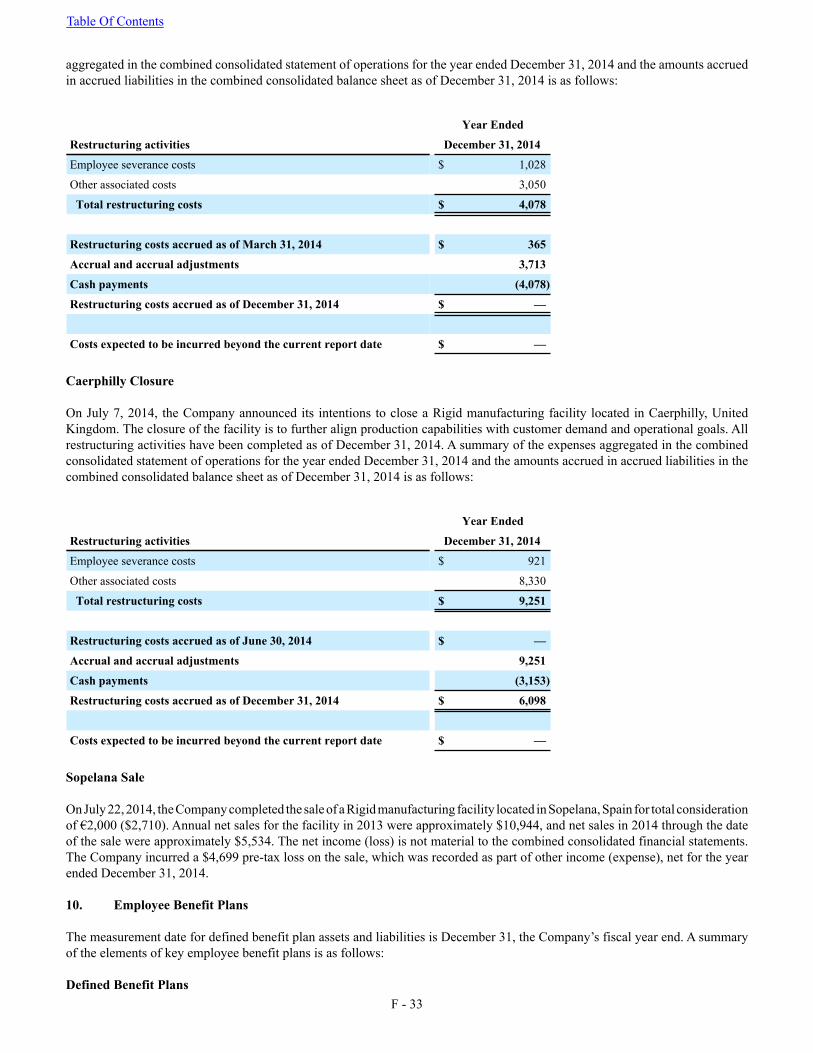
Table Of Contents
F - 33
aggregated in the combined consolidated statement of operations for the year ended December 31, 2014 and the amounts accrued in accrued liabilities in the combined consolidated balance sheet as of December 31, 2014 is as follows:
Year Ended
Restructuring activities December 31, 2014
Employee severance costs $ 1,028
Other associated costs 3,050
Total restructuring costs $ 4,078
Restructuring costs accrued as of March 31, 2014 $ 365
Accrual and accrual adjustments 3,713
Cash payments (4,078)
Restructuring costs accrued as of December 31, 2014 $ —
Costs expected to be incurred beyond the current report date $ —
Caerphilly Closure
On July 7, 2014, the Company announced its intentions to close a Rigid manufacturing facility located in Caerphilly, United Kingdom. The closure of the facility is to further align production capabilities with customer demand and operational goals. All restructuring activities have been completed as of December 31, 2014. A summary of the expenses aggregated in the combined consolidated statement of operations for the year ended December 31, 2014 and the amounts accrued in accrued liabilities in the combined consolidated balance sheet as of December 31, 2014 is as follows:
Year Ended
Restructuring activities December 31, 2014
Employee severance costs $ 921
Other associated costs 8,330
Total restructuring costs $ 9,251
Restructuring costs accrued as of June 30, 2014 $ —
Accrual and accrual adjustments 9,251
Cash payments (3,153)
Restructuring costs accrued as of December 31, 2014 $ 6,098
Costs expected to be incurred beyond the current report date $ —
Sopelana Sale
On July 22, 2014, the Company completed the sale of a Rigid manufacturing facility located in Sopelana, Spain for total consideration of €2,000 ($2,710). Annual net sales for the facility in 2013 were approximately $10,944, and net sales in 2014 through the date of the sale were approximately $5,534. The net income (loss) is not material to the combined consolidated financial statements. The Company incurred a $4,699 pre-tax loss on the sale, which was recorded as part of other income (expense), net for the year ended December 31, 2014.
10. Employee Benefit Plans
The measurement date for defined benefit plan assets and liabilities is December 31, the Company’s fiscal year end. A summary of the elements of key employee benefit plans is as follows:
Defined Benefit Plans
Table Of Contents
F - 34
US Plans
The collective pension assets and obligations (collectively the "US Plans") of the Retirement Plan of Coveris Flexibles US, LLC (the "US Retirement Plan") and the pension obligations of the Coveris Flexibles US, LLC Pension Restoration Plan for Salaried Employees (the "US Restoration Plan") were transferred to and assumed by the Company in connection with the acquisition of Exopack. The US Plans were frozen prior to the Exopack acquisition. Accordingly, the employees’ final benefit calculation under the US Plans was the benefit they had earned under the US Plans as of the freezing date. This benefit will not be diminished, subject to certain terms and conditions, which will remain in effect.
UK Plans
The Company has two defined benefit pension plans in the United Kingdom (UK). Members of UK plans are entitled to a lifelong pension or a one-off payment on retirement which is based on the final pensionable salary and length of service. The plans are wholly funded. The plan assets are held in a trust fund which is administered by trustees.
Netherlands Plan
The Company also has a defined benefit pension plan in the Netherlands. Members of this plan are entitled to pension benefits on retirement.
Other Defined Benefit Plans
The Company has other smaller defined benefit (“Other DB”) pension plans in Germany and France. These plans provide lifelong pensions to its current members based on employee pensionable remuneration and length of service. The plans are closed to new members and all plans are unfunded.
Other Post Employment Benefit Plans
The Company maintains other post-employment benefit ("Other OPEB") plans in Poland, Germany, Austria, France and Turkey where there are obligations for termination indemnities and other benefits to be paid to employees at the date of retirement or other early retirement incentives. The entitlement to these benefits is based upon the employees’ final salary and length of service, subject to the completion of a minimum service period.
The following table sets forth the information related to the changes in the benefit obligations of the Pension Plans and change in plan assets of the Retirement Plan and a reconciliation of the funded status of the Pension Plans for the years ended December 31, 2014 and 2013.
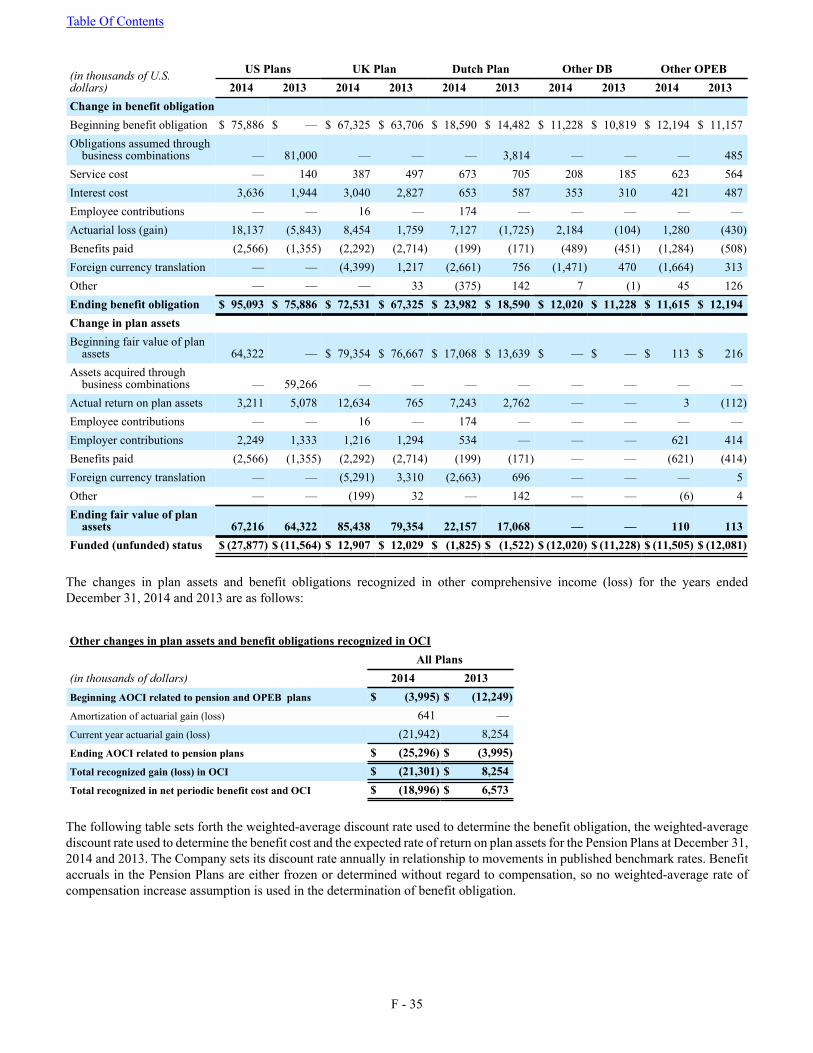
Table Of Contents
F - 35
(in thousands of U.S.dollars)
US Plans UK Plan Dutch Plan Other DB Other OPEB2014 2013 2014 2013 2014 2013 2014 2013 2014 2013
Change in benefit obligationBeginning benefit obligation $ 75,886 $ — $ 67,325 $ 63,706 $ 18,590 $ 14,482 $ 11,228 $ 10,819 $ 12,194 $ 11,157Obligations assumed through
business combinations — 81,000 — — — 3,814 — — — 485Service cost — 140 387 497 673 705 208 185 623 564Interest cost 3,636 1,944 3,040 2,827 653 587 353 310 421 487Employee contributions — — 16 — 174 — — — — —Actuarial loss (gain) 18,137 (5,843) 8,454 1,759 7,127 (1,725) 2,184 (104) 1,280 (430)Benefits paid (2,566) (1,355) (2,292) (2,714) (199) (171) (489) (451) (1,284) (508)Foreign currency translation — — (4,399) 1,217 (2,661) 756 (1,471) 470 (1,664) 313Other — — — 33 (375) 142 7 (1) 45 126Ending benefit obligation $ 95,093 $ 75,886 $ 72,531 $ 67,325 $ 23,982 $ 18,590 $ 12,020 $ 11,228 $ 11,615 $ 12,194Change in plan assetsBeginning fair value of plan
assets 64,322 — $ 79,354 $ 76,667 $ 17,068 $ 13,639 $ — $ — $ 113 $ 216Assets acquired through
business combinations — 59,266 — — — — — — — —Actual return on plan assets 3,211 5,078 12,634 765 7,243 2,762 — — 3 (112)Employee contributions — — 16 — 174 — — — — —Employer contributions 2,249 1,333 1,216 1,294 534 — — — 621 414Benefits paid (2,566) (1,355) (2,292) (2,714) (199) (171) — — (621) (414)Foreign currency translation — — (5,291) 3,310 (2,663) 696 — — — 5Other — — (199) 32 — 142 — — (6) 4Ending fair value of plan
assets 67,216 64,322 85,438 79,354 22,157 17,068 — — 110 113Funded (unfunded) status $ (27,877) $ (11,564) $ 12,907 $ 12,029 $ (1,825) $ (1,522) $ (12,020) $ (11,228) $ (11,505) $ (12,081)
The changes in plan assets and benefit obligations recognized in other comprehensive income (loss) for the years ended December 31, 2014 and 2013 are as follows:
Other changes in plan assets and benefit obligations recognized in OCIAll Plans
(in thousands of dollars) 2014 2013Beginning AOCI related to pension and OPEB plans $ (3,995) $ (12,249)Amortization of actuarial gain (loss) 641 —Current year actuarial gain (loss) (21,942) 8,254Ending AOCI related to pension plans $ (25,296) $ (3,995)Total recognized gain (loss) in OCI $ (21,301) $ 8,254Total recognized in net periodic benefit cost and OCI $ (18,996) $ 6,573
The following table sets forth the weighted-average discount rate used to determine the benefit obligation, the weighted-average discount rate used to determine the benefit cost and the expected rate of return on plan assets for the Pension Plans at December 31, 2014 and 2013. The Company sets its discount rate annually in relationship to movements in published benchmark rates. Benefit accruals in the Pension Plans are either frozen or determined without regard to compensation, so no weighted-average rate of compensation increase assumption is used in the determination of benefit obligation.
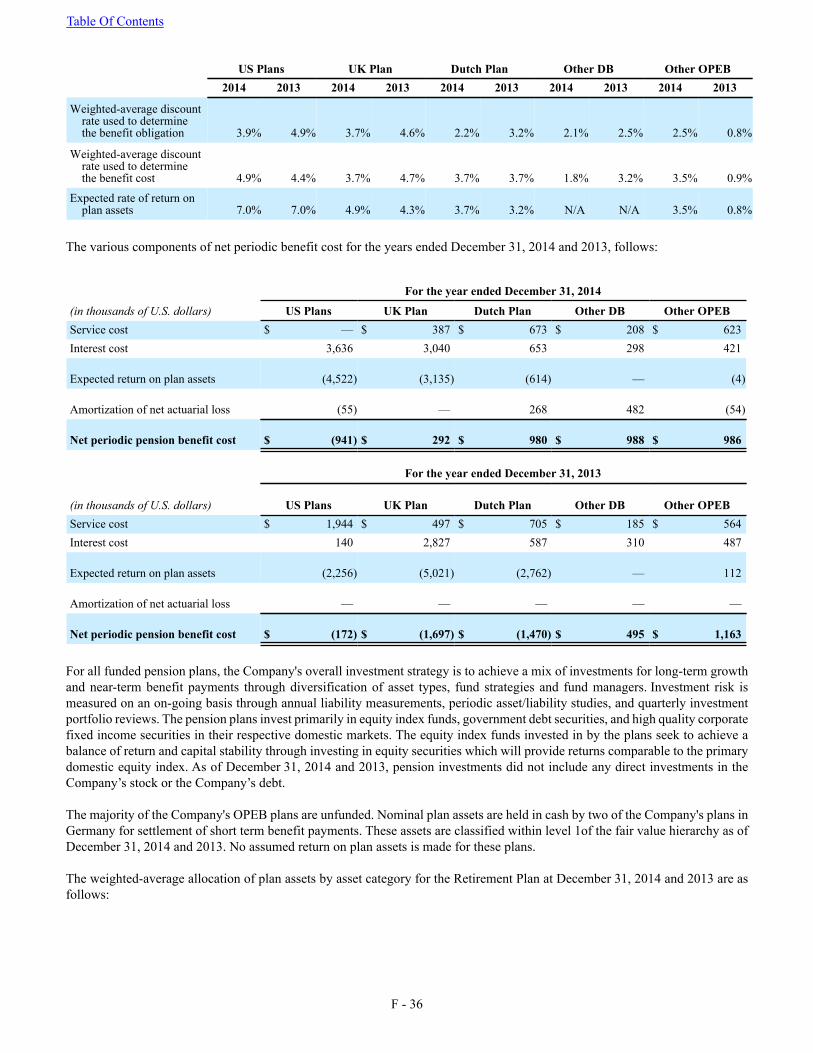
Table Of Contents
F - 36
US Plans UK Plan Dutch Plan Other DB Other OPEB2014 2013 2014 2013 2014 2013 2014 2013 2014 2013
Weighted-average discountrate used to determinethe benefit obligation 3.9% 4.9% 3.7% 4.6% 2.2% 3.2% 2.1% 2.5% 2.5% 0.8%
Weighted-average discountrate used to determinethe benefit cost 4.9% 4.4% 3.7% 4.7% 3.7% 3.7% 1.8% 3.2% 3.5% 0.9%
Expected rate of return onplan assets 7.0% 7.0% 4.9% 4.3% 3.7% 3.2% N/A N/A 3.5% 0.8%
The various components of net periodic benefit cost for the years ended December 31, 2014 and 2013, follows:
For the year ended December 31, 2014
(in thousands of U.S. dollars) US Plans UK Plan Dutch Plan Other DB Other OPEBService cost $ — $ 387 $ 673 $ 208 $ 623Interest cost 3,636 3,040 653 298 421
Expected return on plan assets (4,522) (3,135) (614) — (4)
Amortization of net actuarial loss (55) — 268 482 (54)
Net periodic pension benefit cost $ (941) $ 292 $ 980 $ 988 $ 986
For the year ended December 31, 2013
(in thousands of U.S. dollars) US Plans UK Plan Dutch Plan Other DB Other OPEBService cost $ 1,944 $ 497 $ 705 $ 185 $ 564Interest cost 140 2,827 587 310 487
Expected return on plan assets (2,256) (5,021) (2,762) — 112
Amortization of net actuarial loss — — — — —
Net periodic pension benefit cost $ (172) $ (1,697) $ (1,470) $ 495 $ 1,163
For all funded pension plans, the Company's overall investment strategy is to achieve a mix of investments for long-term growth and near-term benefit payments through diversification of asset types, fund strategies and fund managers. Investment risk is measured on an on-going basis through annual liability measurements, periodic asset/liability studies, and quarterly investment portfolio reviews. The pension plans invest primarily in equity index funds, government debt securities, and high quality corporate fixed income securities in their respective domestic markets. The equity index funds invested in by the plans seek to achieve a balance of return and capital stability through investing in equity securities which will provide returns comparable to the primary domestic equity index. As of December 31, 2014 and 2013, pension investments did not include any direct investments in the Company’s stock or the Company’s debt.
The majority of the Company's OPEB plans are unfunded. Nominal plan assets are held in cash by two of the Company's plans in Germany for settlement of short term benefit payments. These assets are classified within level 1of the fair value hierarchy as of December 31, 2014 and 2013. No assumed return on plan assets is made for these plans.
The weighted-average allocation of plan assets by asset category for the Retirement Plan at December 31, 2014 and 2013 are as follows:
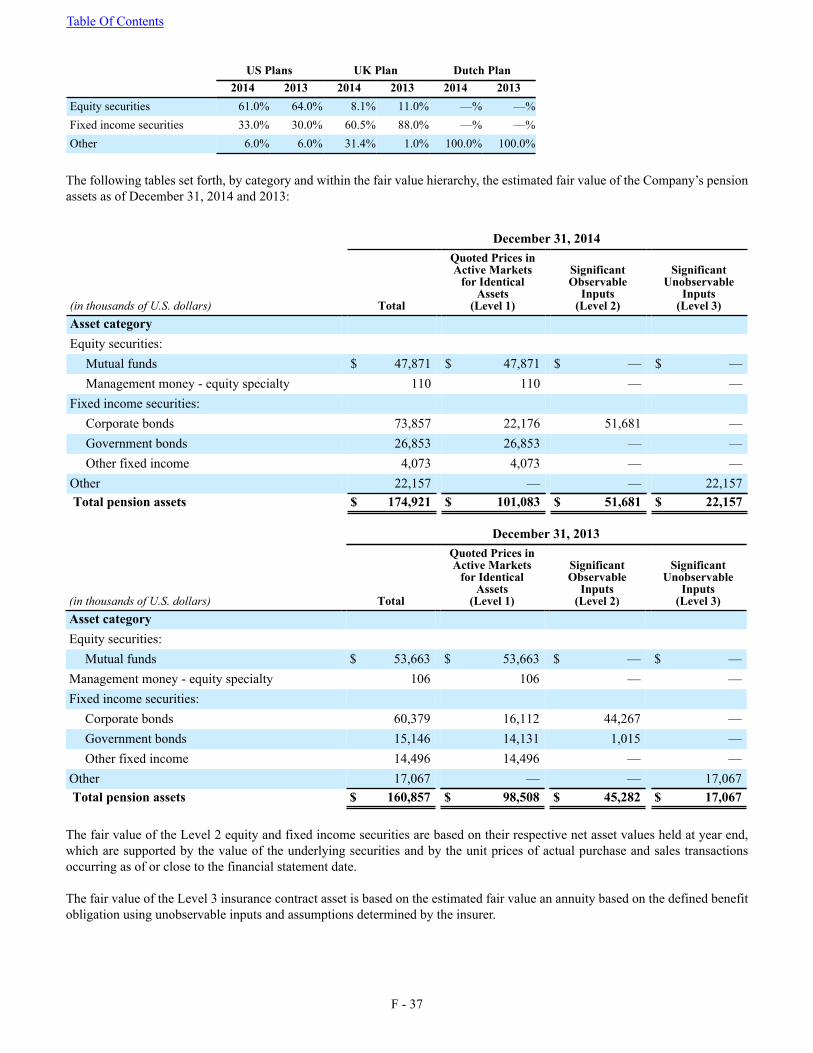
Table Of Contents
F - 37
US Plans UK Plan Dutch Plan2014 2013 2014 2013 2014 2013
Equity securities 61.0% 64.0% 8.1% 11.0% —% —%Fixed income securities 33.0% 30.0% 60.5% 88.0% —% —%Other 6.0% 6.0% 31.4% 1.0% 100.0% 100.0%
The following tables set forth, by category and within the fair value hierarchy, the estimated fair value of the Company’s pension assets as of December 31, 2014 and 2013:
December 31, 2014
(in thousands of U.S. dollars) Total
Quoted Prices inActive Markets
for IdenticalAssets
(Level 1)
SignificantObservable
Inputs(Level 2)
SignificantUnobservable
Inputs(Level 3)
Asset categoryEquity securities:
Mutual funds $ 47,871 $ 47,871 $ — $ —Management money - equity specialty 110 110 — —
Fixed income securities:Corporate bonds 73,857 22,176 51,681 —Government bonds 26,853 26,853 — —Other fixed income 4,073 4,073 — —
Other 22,157 — — 22,157 Total pension assets $ 174,921 $ 101,083 $ 51,681 $ 22,157
December 31, 2013
(in thousands of U.S. dollars) Total
Quoted Prices inActive Markets
for IdenticalAssets
(Level 1)
SignificantObservable
Inputs(Level 2)
SignificantUnobservable
Inputs(Level 3)
Asset categoryEquity securities:
Mutual funds $ 53,663 $ 53,663 $ — $ —Management money - equity specialty 106 106 — —Fixed income securities:
Corporate bonds 60,379 16,112 44,267 —Government bonds 15,146 14,131 1,015 —Other fixed income 14,496 14,496 — —
Other 17,067 — — 17,067 Total pension assets $ 160,857 $ 98,508 $ 45,282 $ 17,067
The fair value of the Level 2 equity and fixed income securities are based on their respective net asset values held at year end, which are supported by the value of the underlying securities and by the unit prices of actual purchase and sales transactions occurring as of or close to the financial statement date.
The fair value of the Level 3 insurance contract asset is based on the estimated fair value an annuity based on the defined benefit obligation using unobservable inputs and assumptions determined by the insurer.
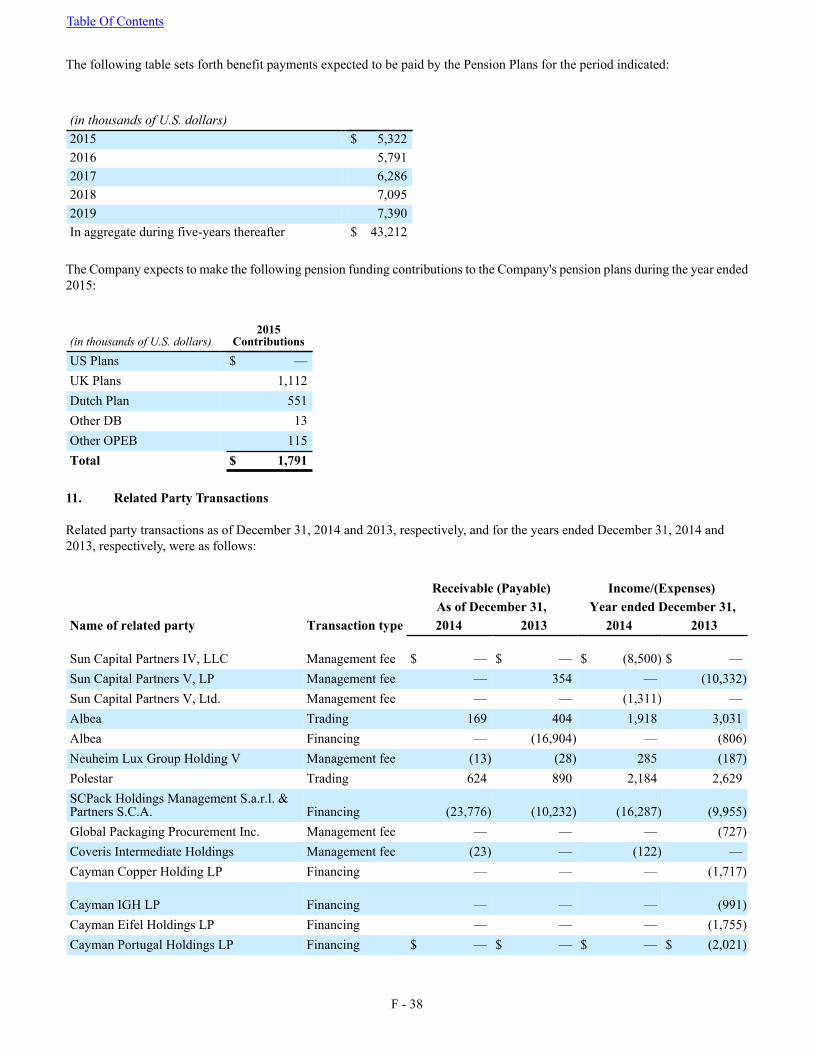
Table Of Contents
F - 38
The following table sets forth benefit payments expected to be paid by the Pension Plans for the period indicated:
(in thousands of U.S. dollars)2015 $ 5,3222016 5,7912017 6,2862018 7,0952019 7,390In aggregate during five-years thereafter $ 43,212
The Company expects to make the following pension funding contributions to the Company's pension plans during the year ended 2015:
(in thousands of U.S. dollars)2015
ContributionsUS Plans $ —UK Plans 1,112Dutch Plan 551Other DB 13Other OPEB 115Total $ 1,791
11. Related Party Transactions
Related party transactions as of December 31, 2014 and 2013, respectively, and for the years ended December 31, 2014 and 2013, respectively, were as follows:
Receivable (Payable) Income/(Expenses)As of December 31, Year ended December 31,
Name of related party Transaction type 2014 2013 2014 2013
Sun Capital Partners IV, LLC Management fee $ — $ — $ (8,500) $ —Sun Capital Partners V, LP Management fee — 354 — (10,332)Sun Capital Partners V, Ltd. Management fee — — (1,311) —Albea Trading 169 404 1,918 3,031Albea Financing — (16,904) — (806)Neuheim Lux Group Holding V Management fee (13) (28) 285 (187)Polestar Trading 624 890 2,184 2,629SCPack Holdings Management S.a.r.l. &Partners S.C.A. Financing (23,776) (10,232) (16,287) (9,955)Global Packaging Procurement Inc. Management fee — — — (727)Coveris Intermediate Holdings Management fee (23) — (122) —Cayman Copper Holding LP Financing — — — (1,717)
Cayman IGH LP Financing — — — (991)Cayman Eifel Holdings LP Financing — — — (1,755)Cayman Portugal Holdings LP Financing $ — $ — $ — $ (2,021)
Table Of Contents
F - 39
12. Segments
The Company identifies its reportable operating segments in accordance with FASB guidance for disclosures about segments of an enterprise and related information. In accordance with FASB guidance, the Company reviewed certain qualitative factors in identifying and determining reportable operating segments. These factors include: 1) the nature of products; 2) the nature of production processes; 3) major raw material inputs; 4) the class of consumer for each product; and 5) the methods used to distribute each product. While all of these factors were reviewed, the most relevant factors are the nature of the products and the nature of production processes. The types of products sold from each segment are similar in nature and have similar production processes, in addition to conformity with the CODM's review and management objectives for the business. The Company evaluates segment performance based on operating income or loss.
The Company is organized into the following two reportable operating segments which are based on products and services and which reflect the Company's management structure and internal financial reporting:
• Flexible - this segment contains the Company's businesses which produce a variety of flexible and semi-rigid plastic and paper products, including bags, pouches, roll stocks, film laminates, sleeves and labels.
• Rigid - this segment contains the Company's businesses which produce injection molded or thermoformed and decorated rigid plastic and paper packaging solutions, including bowls, cups, lids and trays.
While sales and transfers between segments are recorded at cost plus a reasonable profit, the effects of intersegment sales are excluded from the computations of segment net sales and operating income (loss). Intercompany profit is eliminated in consolidation and is not significant for the periods presented.
Effective October 1, 2013, a component of Kobusch previously reported in the Flexible segment was transferred to the Rigid segment in order to better align performance evaluation and resource allocation by the Company's CODM. Segment disclosures for the year ended December 31, 2013 have been recast to reflect this change in reporting structure in accordance with ASC 280.
On May 30, 2014, KubeTech was acquired and incorporated into the Rigid segment based on the nature of KubeTech's products and services. The KubeTech acquisition was accounted for in accordance with guidance for business combinations under common control as KubeTech was wholly-owned by Sun Capital Partners V, L.P., the majority shareholder of the Company. In accordance with the guidance for business combinations under common control in ASC 805, segment disclosures for all periods presented have been recast to reflect this acquisition.
The table below presents information about the Company’s reportable segments, excluding discontinued operations, for the years ended December 31, 2014 and 2013:
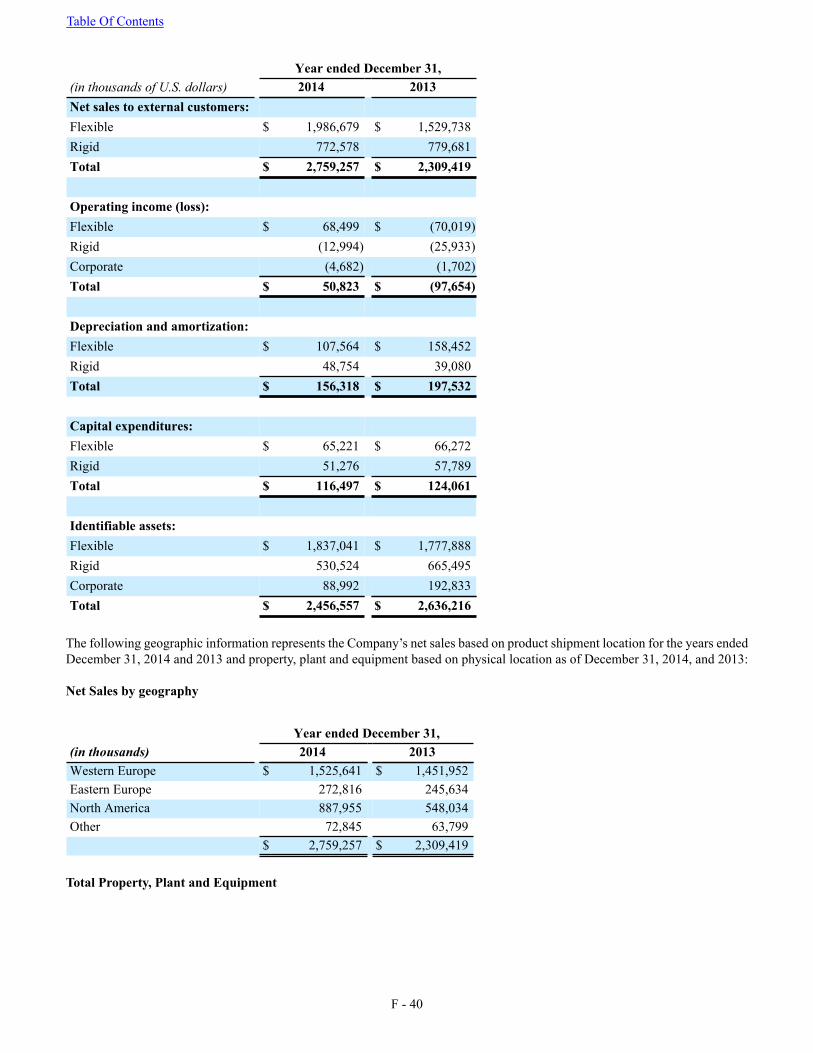
Table Of Contents
F - 40
Year ended December 31,(in thousands of U.S. dollars) 2014 2013Net sales to external customers:Flexible $ 1,986,679 $ 1,529,738Rigid 772,578 779,681Total $ 2,759,257 $ 2,309,419
Operating income (loss):Flexible $ 68,499 $ (70,019)Rigid (12,994) (25,933)Corporate (4,682) (1,702)Total $ 50,823 $ (97,654)
Depreciation and amortization:Flexible $ 107,564 $ 158,452Rigid 48,754 39,080Total $ 156,318 $ 197,532
Capital expenditures:Flexible $ 65,221 $ 66,272Rigid 51,276 57,789Total $ 116,497 $ 124,061
Identifiable assets:Flexible $ 1,837,041 $ 1,777,888Rigid 530,524 665,495Corporate 88,992 192,833Total $ 2,456,557 $ 2,636,216
The following geographic information represents the Company’s net sales based on product shipment location for the years ended December 31, 2014 and 2013 and property, plant and equipment based on physical location as of December 31, 2014, and 2013:
Net Sales by geography
Year ended December 31,(in thousands) 2014 2013Western Europe $ 1,525,641 $ 1,451,952Eastern Europe 272,816 245,634North America 887,955 548,034Other 72,845 63,799
$ 2,759,257 $ 2,309,419
Total Property, Plant and Equipment
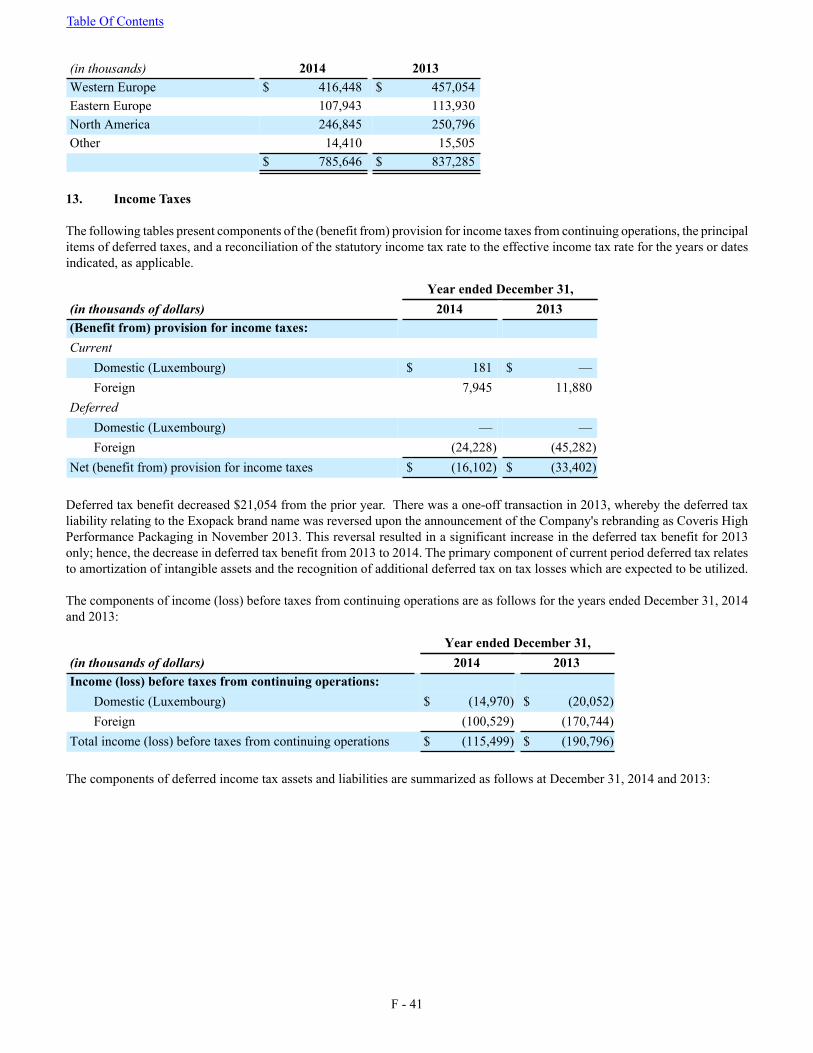
Table Of Contents
F - 41
(in thousands) 2014 2013Western Europe $ 416,448 $ 457,054Eastern Europe 107,943 113,930North America 246,845 250,796Other 14,410 15,505
$ 785,646 $ 837,285
13. Income Taxes
The following tables present components of the (benefit from) provision for income taxes from continuing operations, the principal items of deferred taxes, and a reconciliation of the statutory income tax rate to the effective income tax rate for the years or dates indicated, as applicable.
Year ended December 31,(in thousands of dollars) 2014 2013(Benefit from) provision for income taxes:Current
Domestic (Luxembourg) $ 181 $ —Foreign 7,945 11,880
DeferredDomestic (Luxembourg) — —Foreign (24,228) (45,282)
Net (benefit from) provision for income taxes $ (16,102) $ (33,402)
Deferred tax benefit decreased $21,054 from the prior year. There was a one-off transaction in 2013, whereby the deferred tax liability relating to the Exopack brand name was reversed upon the announcement of the Company's rebranding as Coveris High Performance Packaging in November 2013. This reversal resulted in a significant increase in the deferred tax benefit for 2013 only; hence, the decrease in deferred tax benefit from 2013 to 2014. The primary component of current period deferred tax relates to amortization of intangible assets and the recognition of additional deferred tax on tax losses which are expected to be utilized.
The components of income (loss) before taxes from continuing operations are as follows for the years ended December 31, 2014 and 2013:
Year ended December 31,(in thousands of dollars) 2014 2013Income (loss) before taxes from continuing operations:
Domestic (Luxembourg) $ (14,970) $ (20,052)Foreign (100,529) (170,744)
Total income (loss) before taxes from continuing operations $ (115,499) $ (190,796)
The components of deferred income tax assets and liabilities are summarized as follows at December 31, 2014 and 2013:
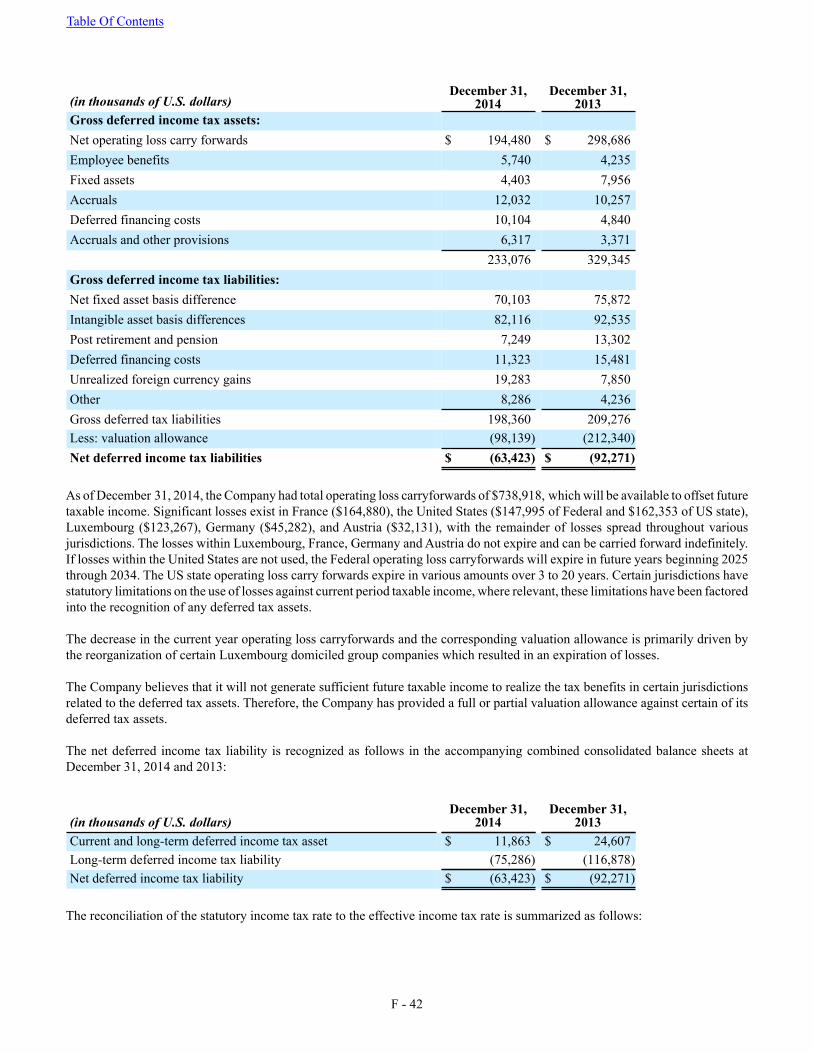
Table Of Contents
F - 42
(in thousands of U.S. dollars)December 31,
2014December 31,
2013Gross deferred income tax assets:Net operating loss carry forwards $ 194,480 $ 298,686Employee benefits 5,740 4,235Fixed assets 4,403 7,956Accruals 12,032 10,257Deferred financing costs 10,104 4,840Accruals and other provisions 6,317 3,371
233,076 329,345Gross deferred income tax liabilities:Net fixed asset basis difference 70,103 75,872Intangible asset basis differences 82,116 92,535Post retirement and pension 7,249 13,302Deferred financing costs 11,323 15,481Unrealized foreign currency gains 19,283 7,850Other 8,286 4,236Gross deferred tax liabilities 198,360 209,276Less: valuation allowance (98,139) (212,340)Net deferred income tax liabilities $ (63,423) $ (92,271)
As of December 31, 2014, the Company had total operating loss carryforwards of $738,918, which will be available to offset future taxable income. Significant losses exist in France ($164,880), the United States ($147,995 of Federal and $162,353 of US state), Luxembourg ($123,267), Germany ($45,282), and Austria ($32,131), with the remainder of losses spread throughout various jurisdictions. The losses within Luxembourg, France, Germany and Austria do not expire and can be carried forward indefinitely. If losses within the United States are not used, the Federal operating loss carryforwards will expire in future years beginning 2025 through 2034. The US state operating loss carry forwards expire in various amounts over 3 to 20 years. Certain jurisdictions have statutory limitations on the use of losses against current period taxable income, where relevant, these limitations have been factored into the recognition of any deferred tax assets.
The decrease in the current year operating loss carryforwards and the corresponding valuation allowance is primarily driven by the reorganization of certain Luxembourg domiciled group companies which resulted in an expiration of losses.
The Company believes that it will not generate sufficient future taxable income to realize the tax benefits in certain jurisdictions related to the deferred tax assets. Therefore, the Company has provided a full or partial valuation allowance against certain of its deferred tax assets.
The net deferred income tax liability is recognized as follows in the accompanying combined consolidated balance sheets at December 31, 2014 and 2013:
(in thousands of U.S. dollars)December 31,
2014December 31,
2013Current and long-term deferred income tax asset $ 11,863 $ 24,607Long-term deferred income tax liability (75,286) (116,878)Net deferred income tax liability $ (63,423) $ (92,271)
The reconciliation of the statutory income tax rate to the effective income tax rate is summarized as follows:
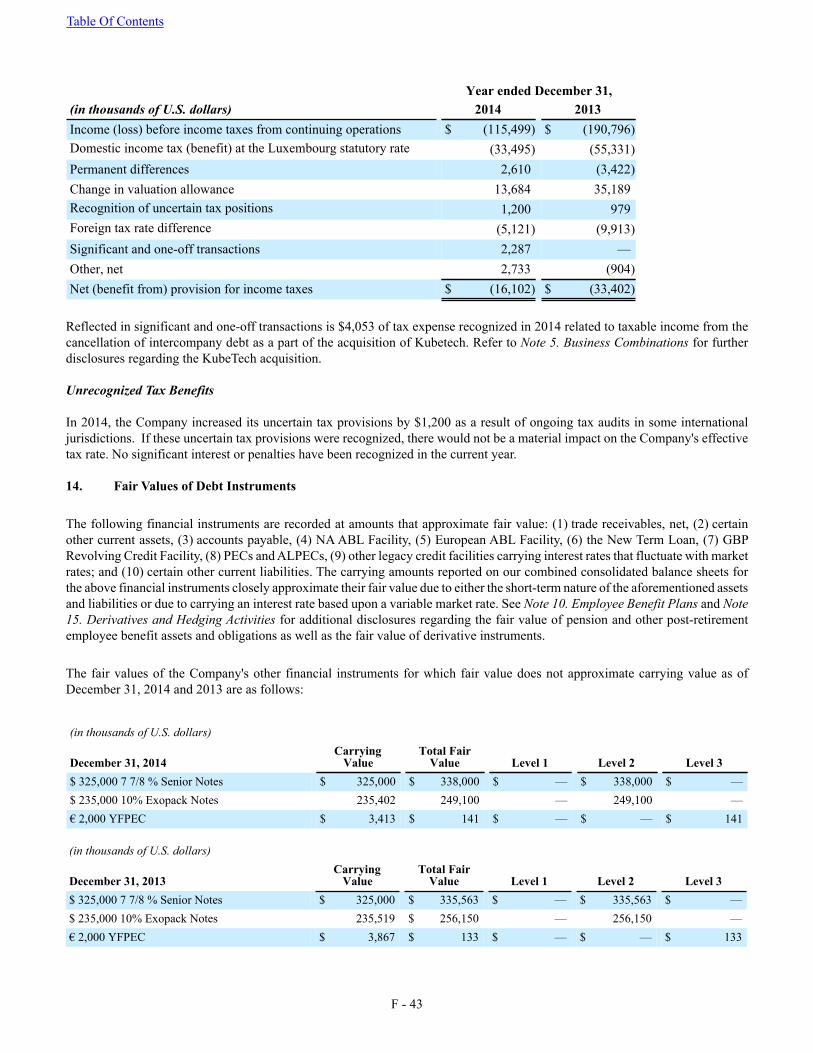
Table Of Contents
F - 43
Year ended December 31,(in thousands of U.S. dollars) 2014 2013Income (loss) before income taxes from continuing operations $ (115,499) $ (190,796)Domestic income tax (benefit) at the Luxembourg statutory rate (33,495) (55,331)Permanent differences 2,610 (3,422)Change in valuation allowance 13,684 35,189Recognition of uncertain tax positions 1,200 979Foreign tax rate difference (5,121) (9,913)Significant and one-off transactions 2,287 —Other, net 2,733 (904)Net (benefit from) provision for income taxes $ (16,102) $ (33,402)
Reflected in significant and one-off transactions is $4,053 of tax expense recognized in 2014 related to taxable income from the cancellation of intercompany debt as a part of the acquisition of Kubetech. Refer to Note 5. Business Combinations for further disclosures regarding the KubeTech acquisition.
Unrecognized Tax Benefits
In 2014, the Company increased its uncertain tax provisions by $1,200 as a result of ongoing tax audits in some international jurisdictions. If these uncertain tax provisions were recognized, there would not be a material impact on the Company's effective tax rate. No significant interest or penalties have been recognized in the current year.
14. Fair Values of Debt Instruments
The following financial instruments are recorded at amounts that approximate fair value: (1) trade receivables, net, (2) certain other current assets, (3) accounts payable, (4) NA ABL Facility, (5) European ABL Facility, (6) the New Term Loan, (7) GBP Revolving Credit Facility, (8) PECs and ALPECs, (9) other legacy credit facilities carrying interest rates that fluctuate with market rates; and (10) certain other current liabilities. The carrying amounts reported on our combined consolidated balance sheets for the above financial instruments closely approximate their fair value due to either the short-term nature of the aforementioned assets and liabilities or due to carrying an interest rate based upon a variable market rate. See Note 10. Employee Benefit Plans and Note 15. Derivatives and Hedging Activities for additional disclosures regarding the fair value of pension and other post-retirement employee benefit assets and obligations as well as the fair value of derivative instruments.
The fair values of the Company's other financial instruments for which fair value does not approximate carrying value as of December 31, 2014 and 2013 are as follows:
(in thousands of U.S. dollars)
December 31, 2014Carrying
ValueTotal Fair
Value Level 1 Level 2 Level 3$ 325,000 7 7/8 % Senior Notes $ 325,000 $ 338,000 $ — $ 338,000 $ —$ 235,000 10% Exopack Notes 235,402 249,100 — 249,100 —€ 2,000 YFPEC $ 3,413 $ 141 $ — $ — $ 141
(in thousands of U.S. dollars)
December 31, 2013Carrying
ValueTotal Fair
Value Level 1 Level 2 Level 3$ 325,000 7 7/8 % Senior Notes $ 325,000 $ 335,563 $ — $ 335,563 $ —$ 235,000 10% Exopack Notes 235,519 $ 256,150 — 256,150 —€ 2,000 YFPEC $ 3,867 $ 133 $ — $ — $ 133
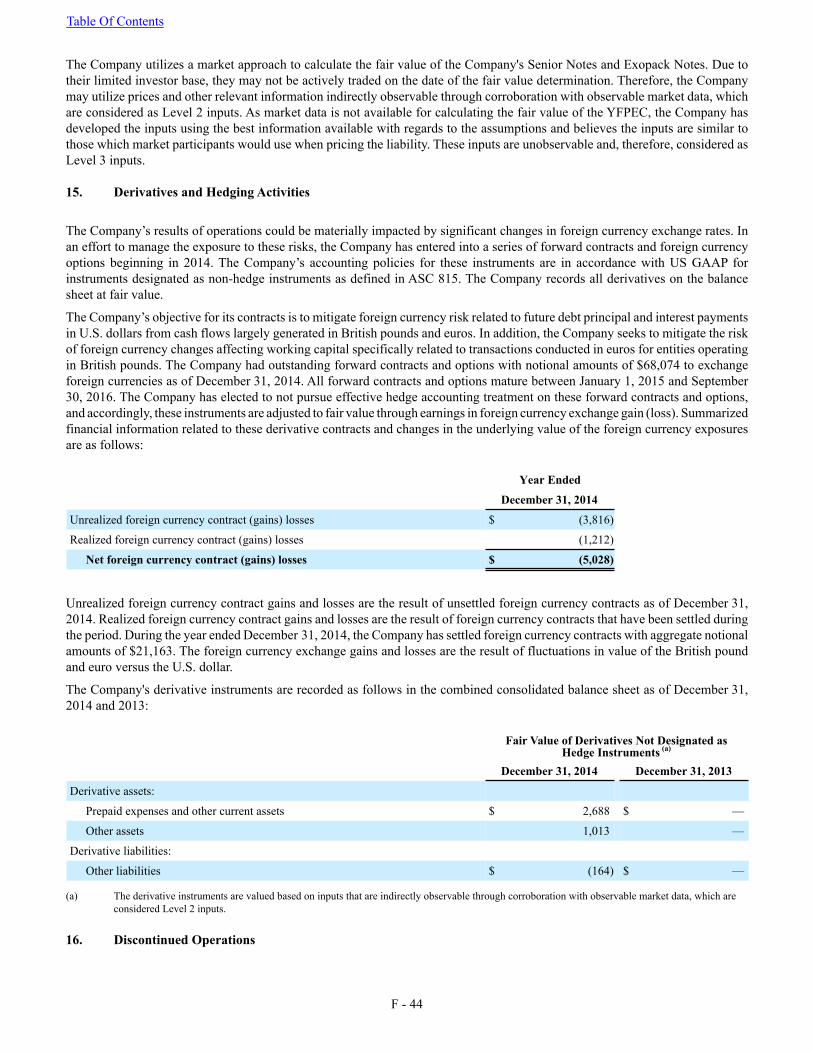
Table Of Contents
F - 44
The Company utilizes a market approach to calculate the fair value of the Company's Senior Notes and Exopack Notes. Due to their limited investor base, they may not be actively traded on the date of the fair value determination. Therefore, the Company may utilize prices and other relevant information indirectly observable through corroboration with observable market data, which are considered as Level 2 inputs. As market data is not available for calculating the fair value of the YFPEC, the Company has developed the inputs using the best information available with regards to the assumptions and believes the inputs are similar to those which market participants would use when pricing the liability. These inputs are unobservable and, therefore, considered as Level 3 inputs.
15. Derivatives and Hedging Activities
The Company’s results of operations could be materially impacted by significant changes in foreign currency exchange rates. In an effort to manage the exposure to these risks, the Company has entered into a series of forward contracts and foreign currency options beginning in 2014. The Company’s accounting policies for these instruments are in accordance with US GAAP for instruments designated as non-hedge instruments as defined in ASC 815. The Company records all derivatives on the balance sheet at fair value.
The Company’s objective for its contracts is to mitigate foreign currency risk related to future debt principal and interest payments in U.S. dollars from cash flows largely generated in British pounds and euros. In addition, the Company seeks to mitigate the risk of foreign currency changes affecting working capital specifically related to transactions conducted in euros for entities operating in British pounds. The Company had outstanding forward contracts and options with notional amounts of $68,074 to exchange foreign currencies as of December 31, 2014. All forward contracts and options mature between January 1, 2015 and September 30, 2016. The Company has elected to not pursue effective hedge accounting treatment on these forward contracts and options, and accordingly, these instruments are adjusted to fair value through earnings in foreign currency exchange gain (loss). Summarized financial information related to these derivative contracts and changes in the underlying value of the foreign currency exposures are as follows:
Year Ended
December 31, 2014
Unrealized foreign currency contract (gains) losses $ (3,816)
Realized foreign currency contract (gains) losses (1,212)
Net foreign currency contract (gains) losses $ (5,028)
Unrealized foreign currency contract gains and losses are the result of unsettled foreign currency contracts as of December 31, 2014. Realized foreign currency contract gains and losses are the result of foreign currency contracts that have been settled during the period. During the year ended December 31, 2014, the Company has settled foreign currency contracts with aggregate notional amounts of $21,163. The foreign currency exchange gains and losses are the result of fluctuations in value of the British pound and euro versus the U.S. dollar.
The Company's derivative instruments are recorded as follows in the combined consolidated balance sheet as of December 31, 2014 and 2013:
Fair Value of Derivatives Not Designated as Hedge Instruments (a)
December 31, 2014 December 31, 2013
Derivative assets:
Prepaid expenses and other current assets $ 2,688 $ —
Other assets 1,013 —
Derivative liabilities:
Other liabilities $ (164) $ —
(a) The derivative instruments are valued based on inputs that are indirectly observable through corroboration with observable market data, which are considered Level 2 inputs.
16. Discontinued Operations
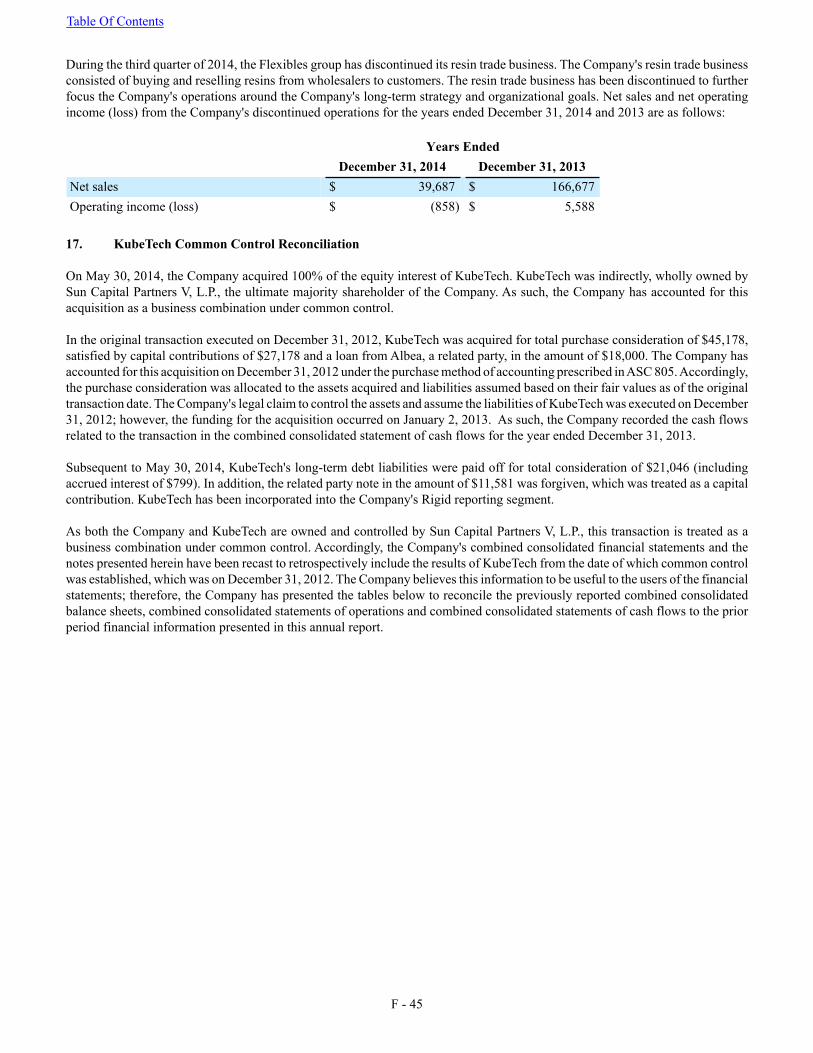
Table Of Contents
F - 45
During the third quarter of 2014, the Flexibles group has discontinued its resin trade business. The Company's resin trade business consisted of buying and reselling resins from wholesalers to customers. The resin trade business has been discontinued to further focus the Company's operations around the Company's long-term strategy and organizational goals. Net sales and net operating income (loss) from the Company's discontinued operations for the years ended December 31, 2014 and 2013 are as follows:
Years EndedDecember 31, 2014 December 31, 2013
Net sales $ 39,687 $ 166,677Operating income (loss) $ (858) $ 5,588
17. KubeTech Common Control Reconciliation
On May 30, 2014, the Company acquired 100% of the equity interest of KubeTech. KubeTech was indirectly, wholly owned by Sun Capital Partners V, L.P., the ultimate majority shareholder of the Company. As such, the Company has accounted for this acquisition as a business combination under common control.
In the original transaction executed on December 31, 2012, KubeTech was acquired for total purchase consideration of $45,178, satisfied by capital contributions of $27,178 and a loan from Albea, a related party, in the amount of $18,000. The Company has accounted for this acquisition on December 31, 2012 under the purchase method of accounting prescribed in ASC 805. Accordingly, the purchase consideration was allocated to the assets acquired and liabilities assumed based on their fair values as of the original transaction date. The Company's legal claim to control the assets and assume the liabilities of KubeTech was executed on December 31, 2012; however, the funding for the acquisition occurred on January 2, 2013. As such, the Company recorded the cash flows related to the transaction in the combined consolidated statement of cash flows for the year ended December 31, 2013.
Subsequent to May 30, 2014, KubeTech's long-term debt liabilities were paid off for total consideration of $21,046 (including accrued interest of $799). In addition, the related party note in the amount of $11,581 was forgiven, which was treated as a capital contribution. KubeTech has been incorporated into the Company's Rigid reporting segment.
As both the Company and KubeTech are owned and controlled by Sun Capital Partners V, L.P., this transaction is treated as a business combination under common control. Accordingly, the Company's combined consolidated financial statements and the notes presented herein have been recast to retrospectively include the results of KubeTech from the date of which common control was established, which was on December 31, 2012. The Company believes this information to be useful to the users of the financial statements; therefore, the Company has presented the tables below to reconcile the previously reported combined consolidated balance sheets, combined consolidated statements of operations and combined consolidated statements of cash flows to the prior period financial information presented in this annual report.
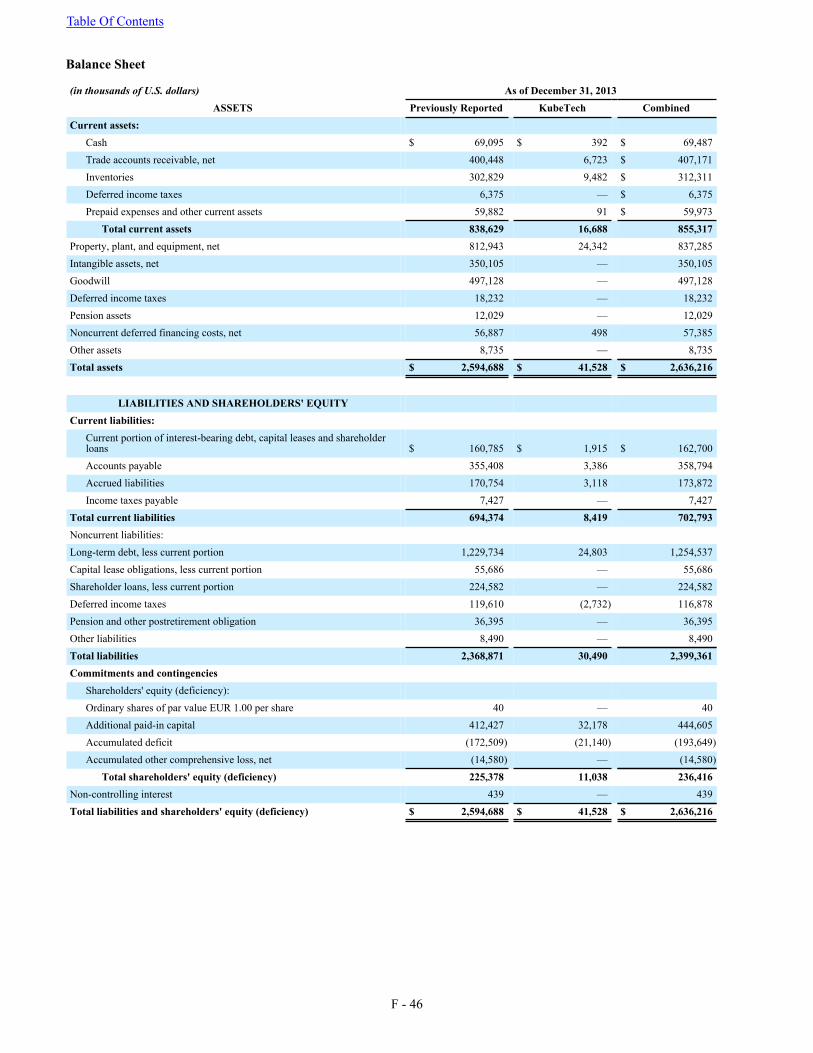
Table Of Contents
F - 46
Balance Sheet
(in thousands of U.S. dollars) As of December 31, 2013ASSETS Previously Reported KubeTech Combined
Current assets:Cash $ 69,095 $ 392 $ 69,487Trade accounts receivable, net 400,448 6,723 $ 407,171Inventories 302,829 9,482 $ 312,311Deferred income taxes 6,375 — $ 6,375Prepaid expenses and other current assets 59,882 91 $ 59,973
Total current assets 838,629 16,688 855,317Property, plant, and equipment, net 812,943 24,342 837,285Intangible assets, net 350,105 — 350,105Goodwill 497,128 — 497,128Deferred income taxes 18,232 — 18,232Pension assets 12,029 — 12,029Noncurrent deferred financing costs, net 56,887 498 57,385Other assets 8,735 — 8,735Total assets $ 2,594,688 $ 41,528 $ 2,636,216
LIABILITIES AND SHAREHOLDERS' EQUITYCurrent liabilities:
Current portion of interest-bearing debt, capital leases and shareholderloans $ 160,785 $ 1,915 $ 162,700Accounts payable 355,408 3,386 358,794Accrued liabilities 170,754 3,118 173,872Income taxes payable 7,427 — 7,427
Total current liabilities 694,374 8,419 702,793Noncurrent liabilities:Long-term debt, less current portion 1,229,734 24,803 1,254,537Capital lease obligations, less current portion 55,686 — 55,686Shareholder loans, less current portion 224,582 — 224,582Deferred income taxes 119,610 (2,732) 116,878Pension and other postretirement obligation 36,395 — 36,395Other liabilities 8,490 — 8,490Total liabilities 2,368,871 30,490 2,399,361Commitments and contingencies
Shareholders' equity (deficiency):Ordinary shares of par value EUR 1.00 per share 40 — 40Additional paid-in capital 412,427 32,178 444,605Accumulated deficit (172,509) (21,140) (193,649)Accumulated other comprehensive loss, net (14,580) — (14,580)
Total shareholders' equity (deficiency) 225,378 11,038 236,416Non-controlling interest 439 — 439Total liabilities and shareholders' equity (deficiency) $ 2,594,688 $ 41,528 $ 2,636,216
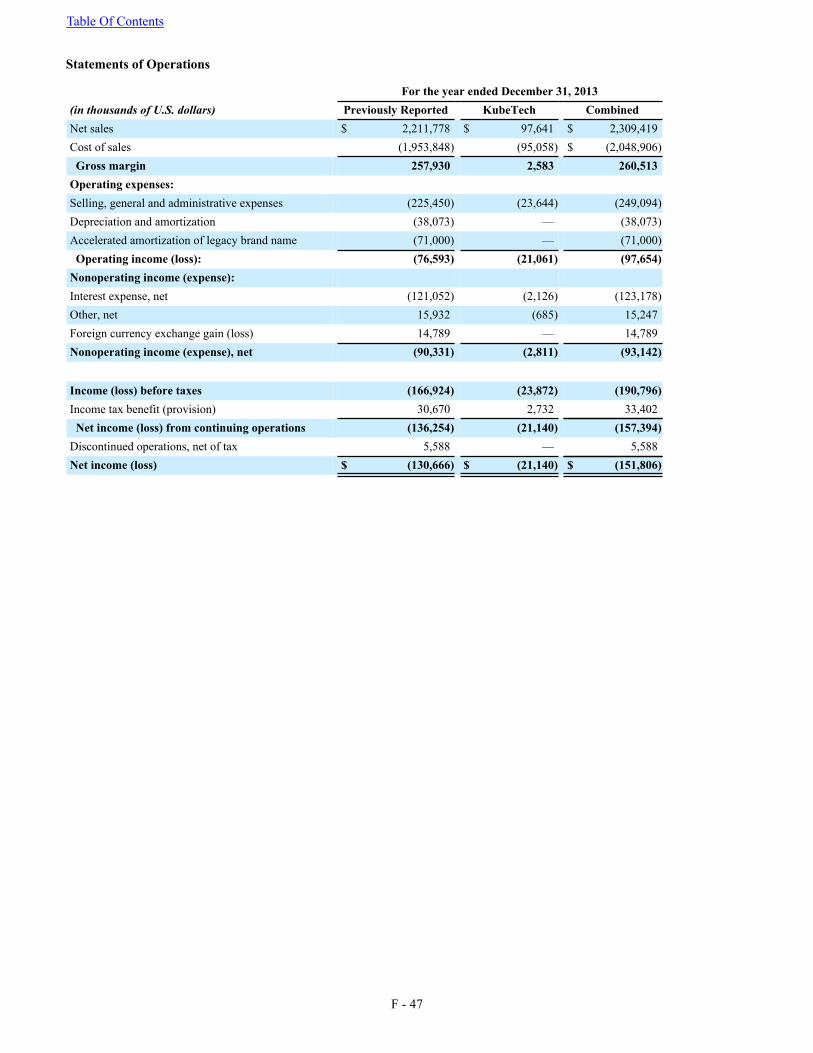
Table Of Contents
F - 47
Statements of Operations
For the year ended December 31, 2013(in thousands of U.S. dollars) Previously Reported KubeTech CombinedNet sales $ 2,211,778 $ 97,641 $ 2,309,419Cost of sales (1,953,848) (95,058) $ (2,048,906) Gross margin 257,930 2,583 260,513Operating expenses:Selling, general and administrative expenses (225,450) (23,644) (249,094)Depreciation and amortization (38,073) — (38,073)Accelerated amortization of legacy brand name (71,000) — (71,000) Operating income (loss): (76,593) (21,061) (97,654)Nonoperating income (expense):Interest expense, net (121,052) (2,126) (123,178)Other, net 15,932 (685) 15,247Foreign currency exchange gain (loss) 14,789 — 14,789Nonoperating income (expense), net (90,331) (2,811) (93,142)
Income (loss) before taxes (166,924) (23,872) (190,796)Income tax benefit (provision) 30,670 2,732 33,402 Net income (loss) from continuing operations (136,254) (21,140) (157,394)Discontinued operations, net of tax 5,588 — 5,588Net income (loss) $ (130,666) $ (21,140) $ (151,806)
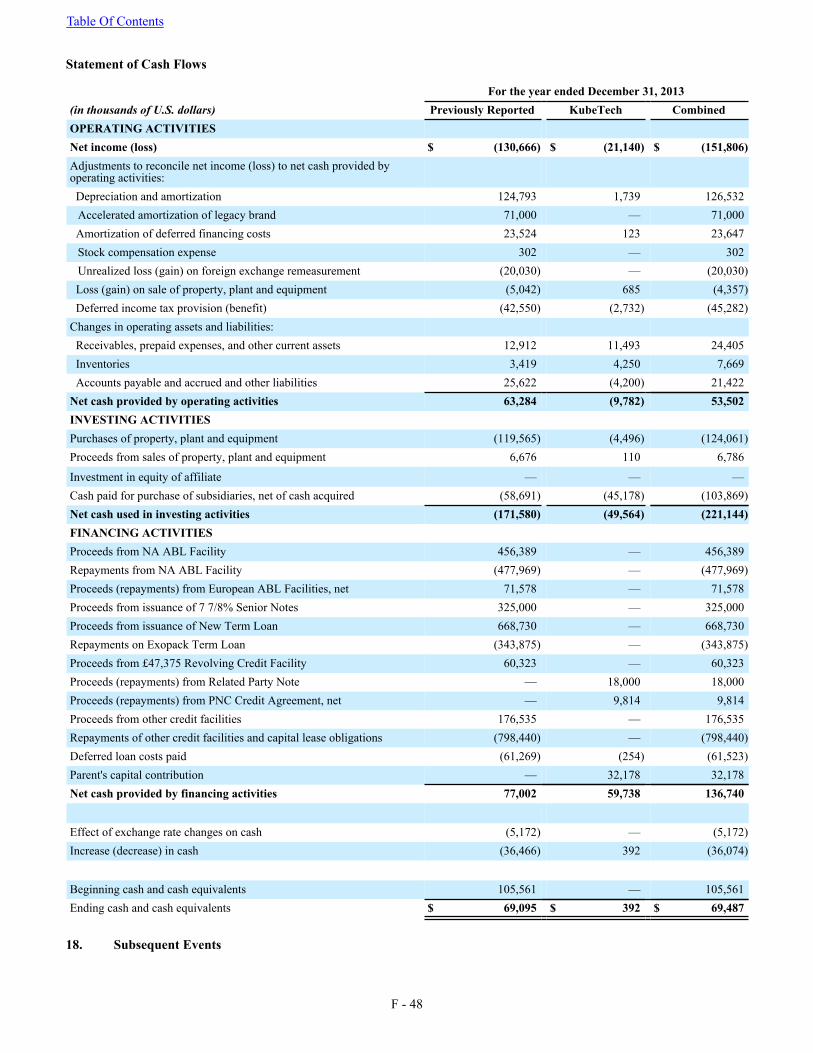
Table Of Contents
F - 48
Statement of Cash Flows
For the year ended December 31, 2013(in thousands of U.S. dollars) Previously Reported KubeTech CombinedOPERATING ACTIVITIESNet income (loss) $ (130,666) $ (21,140) $ (151,806)Adjustments to reconcile net income (loss) to net cash provided byoperating activities: Depreciation and amortization 124,793 1,739 126,532
Accelerated amortization of legacy brand 71,000 — 71,000 Amortization of deferred financing costs 23,524 123 23,647
Stock compensation expense 302 — 302Unrealized loss (gain) on foreign exchange remeasurement (20,030) — (20,030)
Loss (gain) on sale of property, plant and equipment (5,042) 685 (4,357) Deferred income tax provision (benefit) (42,550) (2,732) (45,282)Changes in operating assets and liabilities: Receivables, prepaid expenses, and other current assets 12,912 11,493 24,405 Inventories 3,419 4,250 7,669 Accounts payable and accrued and other liabilities 25,622 (4,200) 21,422Net cash provided by operating activities 63,284 (9,782) 53,502INVESTING ACTIVITIESPurchases of property, plant and equipment (119,565) (4,496) (124,061)Proceeds from sales of property, plant and equipment 6,676 110 6,786
Investment in equity of affiliate — — —Cash paid for purchase of subsidiaries, net of cash acquired (58,691) (45,178) (103,869)Net cash used in investing activities (171,580) (49,564) (221,144)FINANCING ACTIVITIESProceeds from NA ABL Facility 456,389 — 456,389Repayments from NA ABL Facility (477,969) — (477,969)Proceeds (repayments) from European ABL Facilities, net 71,578 — 71,578Proceeds from issuance of 7 7/8% Senior Notes 325,000 — 325,000Proceeds from issuance of New Term Loan 668,730 — 668,730Repayments on Exopack Term Loan (343,875) — (343,875)Proceeds from £47,375 Revolving Credit Facility 60,323 — 60,323Proceeds (repayments) from Related Party Note — 18,000 18,000Proceeds (repayments) from PNC Credit Agreement, net — 9,814 9,814Proceeds from other credit facilities 176,535 — 176,535Repayments of other credit facilities and capital lease obligations (798,440) — (798,440)Deferred loan costs paid (61,269) (254) (61,523)Parent's capital contribution — 32,178 32,178Net cash provided by financing activities 77,002 59,738 136,740
Effect of exchange rate changes on cash (5,172) — (5,172)Increase (decrease) in cash (36,466) 392 (36,074)
Beginning cash and cash equivalents 105,561 — 105,561Ending cash and cash equivalents $ 69,095 $ 392 $ 69,487
18. Subsequent Events
F - 49
On February 10, 2015, the Company issued $85,000 in aggregate principal amount 7 7/8% Senior Notes (the "Additional Notes") maturing on November 1, 2019. The proceeds from the Additional Notes were primarily used to refinance the amount outstanding under the GBP Revolving Credit Facility. Interest on the Additional Notes is paid semi-annually on each November 1 and May 1, commencing on May 1, 2015. The Additional Notes were issued under the same indenture as the Senior Notes and have the same terms and conditions as the Senior Notes. The Additional Notes were issued at a premium of $850, which will be amortized over the term of the notes.
On February 12, 2015, the Company entered into two cross currency swaps in order to address the Company's exposure to foreign currency risk related to the future principal and interest of the Senior Notes and New Term Loan. The GBP-to-USD cross currency swap has a termination date of May 8, 2019 and a notional amount of $397,487. The EUR-to-USD cross currency swap has a termination date of May 8, 2019 and a notional amount of $225,067. The EUR-to-USD cross currency swap also includes a put option with a strike price of 1.25037 at $123,787 that expires on May 6, 2019, which limits the potential liability should exchange rates revert to historical averages.