Embed Size (px)
Citation preview

1
2014 final results presentation
27 February 2015James Henderson, CEONeil Cooper, Group Finance Director
19 times Champion Jockey AP McCoy has announced his retirement in 2015. Small pictures, top to bottom: entering the parade ring on Carlingford Lough after winning the Hennessy Gold Cup during the Hennessy Gold Cup Day at Leopardstown Racecourse, Ireland, February 2015; and on Binocular on his way to victory in the williamhill.com Christmas Hurdle Race, January 2011

2
This presentation has been prepared by William Hill PLC (“William Hill”). This presentation includes statements that are,or may be deemed to be, “forward-looking statements”. These forward-looking statements can be identified by the useof forward-looking terminology, including the terms "believes", "estimates", "anticipates", "expects", "intends", "plans","goal", "target", "aim", "may", "will", "would", "could" or "should" or, in each case, their negative or other variations orcomparable terminology. These forward-looking statements include all matters that are not historical facts. They appearin a number of places throughout this presentation and the information incorporated by reference into this presentation,and include statements regarding the intentions, beliefs or current expectations of the directors, William Hill or theGroup concerning, amongst other things, the results of operations, financial condition, liquidity, prospects, growth,strategies and dividend policy of William Hill and the industry in which it operates.
By their nature, forward-looking statements involve risks and uncertainties because they relate to events and dependon circumstances that may or may not occur in the future and may be beyond William Hill's ability to control or predict.Forward-looking statements are not guarantees of future performance and hence may prove to be erroneous. TheGroup's actual results of operations, financial condition, liquidity, dividend policy and the development of the industry inwhich it operates may differ materially from the impression created by the forward-looking statements contained in thispresentation and/or the information incorporated by reference into this presentation. In addition, even if the results ofoperations, financial condition, liquidity and dividend policy of the Group and the development of the industry in which itoperates are consistent with the forward-looking statements contained in this presentation and/or the informationincorporated by reference into this presentation, those results or developments may not be indicative of results ordevelopments in subsequent periods.
Other than in accordance with its legal or regulatory obligations (including under the Listing Rules, the Disclosure andTransparency Rules and the Prospectus Rules), William Hill does not undertake any obligation to update or revisepublicly any forward-looking statement, whether as a result of new information, future events or otherwise.
Disclaimer

3
2014: a record year
£372.2m 40% 18%
276.8 275.7
330.6 335.0
372.2
2010 2011 2012 2013 2014
Record operating profit1, up 11%
of net revenue from digital businesses2
of net revenue from international markets
61%57%
30%32%
6% 8%3%
2013 2014
Retail Online Australia Other
3%
85% 82%
15% 18%
2013 2014
UK Non-UK
1. Operating profit/loss is defined as pre-exceptional profit/loss before interest and tax, and the amortisation of specific identified intangible assets recognised on acquisitions
2. Online and William Hill Australia
World Cup
4
Neil Cooper2014 financial results
My Tent Or Yours ridden by Tony McCoy wins the williamhill.com Christmas Hurdle Race during Day One of the William Hill Winter Festival at Kempton Park Racecourse, December 2013

5
A year of record operating profit
52 weeks ended 30 Dec 2014
£m
52 weeks ended 31 Dec 2013
£m
% Change
Amounts wagered1 8,945.7 7,800.8 +15%
Net revenue 1,609.3 1,486.5 +8%
Operating profit2 372.2 335.0 +11%Amortisation (9.0) (10.9) -17%
Net finance costs (45.9) (44.3) +4%
Tax (63.1) (32.2) +96%
Non-controlling interest - (15.3) -
Retained profit 254.2 232.3 +9%Basic, adjusted EPS (p)3 29.9 28.8 +4%Net debt for covenant purposes 602.8 796.0 -24%
Dividend per share (p) 12.2 11.6 +5%
Numbers are presented on a pre-exceptional basis.1. Amounts wagered comprises the gross takings in OTC, Telephone, US, Australia and Online Sportsbook, and
net revenue in Retail gaming machines and Online gaming products.2. Operating profit is defined as pre-exceptional profit before interest and tax, before the amortisation of specific
intangible assets recognised on acquisitions.3. Basic, adjusted EPS is based on profit for the period before exceptional items and before the amortisation of
specific intangible assets arising on acquisitions.

6
52 weeks ended 30 Dec 2014
£m
52 weeks ended 31 Dec 2013
£m
Accelerated Australian brand amortisation (44.5) -
One-off shop portfolio closure (19.4) -
European indirect taxation provision (9.7) -
tomwaterhouse.com integration (3.3) (2.0)
Revaluation of tomwaterhouse.com earn-out (2.2) -
Write-off of unamortised finance fees (2.0) -
Write-off of fees on bridge loan - (1.7)
Australia management restructuring cost (1.8) -
Repayment of VAT refund and interest (0.5) (5.6)
Sportingbet acquisition and integration - (13.5)
Pre-tax (83.4) (22.8)Release of tax provision 15.4 -
Tax consequence of exceptional items 20.1 1.7
Post-tax (47.9) (21.1)
Exceptional items

7
Retail gaming growth and strong cost control mitigate OTC margin decline
1. Adjusting for the Machine Games Duty effect, Retail net revenue was flat.2. Operating profit is defined as pre-exceptional profit before interest and tax, before the amortisation of
specific intangible assets recognised on acquisitions.
52 weeks ended 30 Dec 2014
£m
52 weeks ended 31 Dec 2013
£m
% Change
OTC amounts wagered 2,452.2 2,439.9 +1%
OTC gross win 449.7 472.8 -5%
OTC gross win margin 18.3% 19.4% -1.1 ppts
Machines gross win 461.8 440.0 +5%
Total gross win 911.5 912.8 -0%Net revenue1 911.4 907.0 +0%Cost of sales (209.9) (203.3) +3%
Gross profit 701.5 703.7 -0%Operating costs (508.3) (507.4) +0%
Operating profit2 193.2 196.3 -2%

8
Retail OTC wagering and margin trendsAmounts wagered: H1 2014 v H1 2013
Amounts wagered: H2 2014 v H2 2013
Gross win margin: full year trend
-3% -5%
35%
-1%
2%
-10%
0%
10%
20%
30%
40%
% C
hang
e in
am
ount
s w
ager
ed
Horseracing Greyhounds Football Other Total
-1%
-5%
0%
3%
-1%
-6%
-4%
-2%
0%
2%
4%
% c
hang
e in
am
ount
s w
ager
ed
Horseracing Greyhounds Football Other Total
0%
5%
10%
15%
20%
25%
30%
35%
Ret
ail g
ross
win
mar
gin
2014 2013

9
Retail gross win per machine shows good growth
1. Compared with 52 weeks of 2012
52 weeks ended 30 Dec 2014
52 weeks ended 31 Dec 2013
% Change
Average number of LBOs 2,406 2,401 +0%
Average number of machines 9,458 9,431 +0%
Machine density 3.93 3.93 -
Gross win per machine per week £939 £897 +5%
Machine gross win margin 3.44% 3.37% +0.07 ppts
4.8% 4.3%
7.6%
3.3%
0.0%1.0%2.0%3.0%4.0%5.0%6.0%7.0%8.0%
109110111112113114115116117118
Q1 2014 Q2 2014 Q3 2014 Q4 2014
£m
Machine quarterly gross win growth
Gross win Growth % (2014 v 2013)

10
52 weeks ended 30 Dec 2014
£m
52 weeks ended 31 Dec 2013
£m
% Change
Employee costs (195.2) (199.9) -2%
Property costs (101.4) (102.8) -1%
Content costs (70.2) (64.3) +9%
Depreciation (29.5) (28.4) +4%
Other costs incl. recharges (112.0) (112.0) -
Operating costs (508.3) (507.4) +0%
Retail demonstrates good cost control
507.4 508.3
0.8
5.3 1.10.3 8.6(4.3)
(2.6)(1.3) (7.0)
490492494496498500502504506508510
£m
Retail cost causal

11
Online revenue growth from both Sportsbook and Casino
52 weeks ended 30 Dec 2014
£m
52 weeks ended 31 Dec 2013
£m
% Change
Sportsbook 253.3 212.9 +19%Casino 235.5 191.0 +23%
Poker 14.9 18.2 -18%
Bingo 23.7 24.2 -2%
Gaming net revenue 274.1 233.4 +17%
Net revenue 527.4 446.3 +18%Cost of sales (51.0) (40.2) +27%
Gross profit 476.4 406.1 +17%Operating costs (298.7) (258.3) +16%
Operating profit1 177.7 147.8 +20%
1. Operating profit is defined as pre-exceptional profit before interest and tax, before the amortisation of specific intangible assets recognised on acquisitions.
74%
5%4%
17%
2014 Online net revenue by geographic split
UK Italy Spain Other

12
Online wagering increased, pre-match margins weaker
52 weeks ended 30 Dec 2014
52 weeks ended 31 Dec 2013
% Change
Unique active players (’000)1 2,467.9 2,360.7 +5%
Revenue per unique active player (£) 213.7 189.1 +13%
New accounts (’000)2 1,225.2 1,141.0 +7%
Average cost per acquisition (£)3 107.8 107.4 +0%
Sportsbook amounts wagered (£m) 3,758.2 2,931.7 +28%
- Pre-match amounts wagered (£m) 2,116.1 1,724.5 +23%
- In-play amounts wagered (£m) 1,642.1 1,207.2 +36%
Sportsbook gross win margin 7.6% 8.1% -0.5 ppts
- Pre-match gross win margin 9.3% 10.0% -0.7 ppts
- In-play gross win margin 5.3% 5.3% -
1. Placed a bet within the period2. Registered and transacted within the period3. Including affiliates

13
52 weeks ended 30 Dec 2014
£m
52 weeks ended 31 Dec 2013
£m
% Change
Employee costs (53.0) (45.1) +18%
Marketing (132.1) (122.5) +8%
Finance charges (20.3) (16.6) +22%
Depr. and amortisation1 (26.6) (18.9) +41%
Other costs incl.recharges
(66.7) (55.2) +21%
Operating costs (298.7) (258.3) +16%
1. Excludes £1.3m of Online amortisation relating to acquired intangibles (2013: £4.0m)
Business expansion drives cost base expansion
• Sportsbook free bets / amounts wagered ratio 0.8%• Marketing / net revenue ratio 25%

14
Doubling of Australian profit
52 weeks ended 30 Dec 2014
£m
41 weeks ended 31 Dec 2013
£m
% Change Pro-forma local currency
change %
Amounts wagered 1,388.7 1,177.1 +18% +0%
Gross win 129.4 92.5 +40% +12%
Win margin 9.3% 7.9% +1.4ppts +1.0 ppts
Net revenue 121.9 86.7 +41% +11%Cost of sales (30.1) (20.2) +49% +19%
Gross profit 91.8 66.5 +38% +9%Operating costs (67.1) (54.5) +23% -8%
Operating profit1 24.7 12.0 +106% +121%
Unique active players (’000) 324.0 247.9 +31% +15%
Revenue per unique active (£) 376.2 349.7 +8% -3%
New accounts (’000) 142.1 95.9 +48% +4%
Average cost per acquisition (£) 192.5 298.7 -36% -25%
1. Operating profit is defined as pre-exceptional profit before interest and tax, before the amortisation of specific intangible assets recognised on acquisitions.

15
Good progress but Australian returns lag expectation
• Achievements to date– Systems upgrades– tomwaterhouse.com (TW) purchase and integration– Management restructure– Marketing mix rebalanced, CPA lowered
• Rebranding has commenced
• Headwinds– Currency– Race field fees
• Now expect returns of Sportingbet and TW taken together to exceed WACC by 2018
– Previous guidance of 2016, inclusive of TW– Earnings enhancing from 2014

16
William Hill US
1. Operating profit is defined as pre-exceptional profit before interest and tax, before the amortisation of specific intangible assets recognised on acquisitions.
52 weeks ended 30 Dec 2014
£m
52 weeks ended 31 Dec 2013
£m
% Change Local currency % change
Amounts wagered 375.7 310.2 +21% +27%
Gross win margin 7.9% 7.3% +0.6 ppts +0.6 ppts
Net revenue 29.7 22.7 +31% +36%Cost of sales (2.5) (2.0) +25% +32%
Gross profit 27.2 20.7 +31% +36%Operating costs (17.5) (15.8) +11% +16%
Operating profit1 9.7 4.9 +98% +99%

17
52 weeks ended 30 Dec 2014
£m
52 weeks ended 31 Dec 2013
£m
Change £m
Pre-exceptional EBITDA 438.0 390.3 47.7
Pension contribution (9.1) (8.1) (1.0)
Exceptional cash (34.6) (16.0) (18.6)
Working capital 47.1 (12.5) 59.6
Tax (34.5) (55.9) 21.4
Interest (43.6) (41.3) (2.3)
Other 4.9 11.1 (6.2)
Cash flow from operating activities
368.2 267.6 100.6
Strong cash inflows
• Cessation of non-controlling interest broadly offsets cash dividend increase, to £104m in total
• Capex shortfall versus expectations (£75m versus £80-90m)

18
Capex
52 weeks ended 30 Dec 2014
£m
52 weeks ended 31 Dec 2013
£m
Retail development1 25.2 38.8
Online 35.6 31.9
Australia 5.8 2.8
US 2.2 2.6
Other (including IT) 5.8 8.5
Total cash capital expenditure 74.6 84.6
• Estate fell by a net 70 shops to 2,362 (52 openings, 14 closures, eight re-sites and 108 portfolio closures)
• 2015 cash capex expected to be £80-90m• Exceptional provision of £12.4m relating to portfolio closure at year-end
1. Gross of proceeds on disposal
19
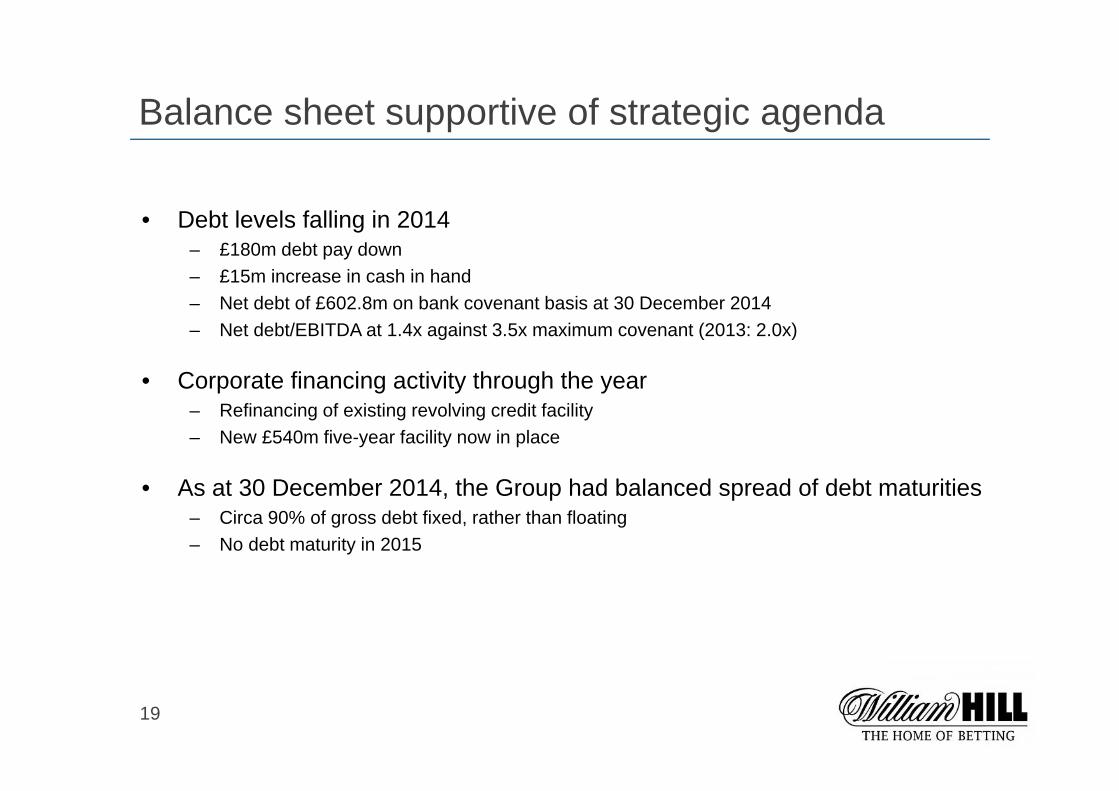
Balance sheet supportive of strategic agenda
• Debt levels falling in 2014– £180m debt pay down– £15m increase in cash in hand– Net debt of £602.8m on bank covenant basis at 30 December 2014– Net debt/EBITDA at 1.4x against 3.5x maximum covenant (2013: 2.0x)
• Corporate financing activity through the year– Refinancing of existing revolving credit facility– New £540m five-year facility now in place
• As at 30 December 2014, the Group had balanced spread of debt maturities– Circa 90% of gross debt fixed, rather than floating– No debt maturity in 2015

20
Other finance matters
• Effective pre-exceptional income statement tax rate of 19.9%– Prior year rate, at 11.5%, benefited from deferred tax credit– Effective full-year income statement rate expected to be 19% in 2015, expected cash tax rate to
be 20% in 2015
• Formal three-year actuarial pension valuation process completed– c£9.4m annual deficit repair payment to May 2019– Accounting surplus, driven by reduced liability valuation and strong investment returns
• Dividend:2014 2013 % Change
Interim 4.0p 3.7p +8.1%
Final 8.2p 7.9p +3.8%
Full 12.2p 11.6p +5.2%

21
James HendersonPerformance and strategy update
AP McCoy winning the Connolly's Red Mills Horsecare Cubes Novices' Chase on Malt Master at Huntingdon, January 2013

22
2014 achievements in a record year
• Another resilient Retail performance
• Continued strong growth in Online
• William Hill US operating profit up 98%1,2
• William Hill Australia operating profit1 doubles during period of substantial change
• Good progress on responsible gambling measures
0
100
200
300
400
500
600
2013 2014
Desktop Mobile
70%
30%
57%
43%
Mobile as % of Online net revenue
+48%growth in mobile
Sportsbook net revenue
+117%growth in mobile
gamingnet revenue
1. Operating profit/loss is defined as pre-exceptional profit/loss before interest and tax, and the amortisation of specific identified intangible assets recognised on acquisitions
2. On a statutory basis
£m

23
Assessing the ‘black swan’ effect
While football margins are stable… …and accumulators are now a higher % of mobile1
46% 39% 38%
54% 61% 62%
2012/13 2013/14 2014/15
Singles Accas
0%
5%
10%
15%
20%
25%
30%
2011/12 2012/13 2013/14 2014/15 todate
Singles Accumulators Pre-match average
1. By amounts wagered on football during the UK domestic football season
10%
11%
12%
13%
14%
2012 2013 2014
Online pre-match betting gross win margin by calendar year
Online pre-match betting gross win margin by football season
…margins are affected by accas…

24
Substantial progress on responsible gambling
April 2015Launch of the £50 journey
January 2015‘Set Your Limits’
is made mandatory
Q4 2014 ASA, BCAP, CAP
advertising reviews concluded, voluntary restrictions agreed
Launched October 2014
Implemented March 2014
Research published December 2014
GambleAware Week January 2015

25
Regulatory update
• £50 journey to be implemented 6 April 2015
• Point of Consumption Tax implemented December 2014
• Consultations on the Horserace Betting Levy, contributions from offshore operators and possible replacement with a betting right
• 4th EU Money Laundering Directive
• Responses awaited on planning and advertising
+29%Net revenue
+7%New accounts
+17%Unique actives
+10%Revenue per active
+4%Cost per acquisition
Online UK performance in H2 2014

26
• Video walls in 16% of shops• Digital window display trial
Further technology enhancements
Retail remains resilient
Continued product evolution
Strong cost focus
• 5% CAGR in football turnover1
• 50% increase in SSBT football markets with Online feed
• Eclipse in 70% of estate2
• B2 gross win +3%, B3 +11%3
• Extended single manning successfully implemented
• Like-for-like rent flat in 2014• Rolling onto CPI/RPI increases
for content costs 2015-2017• Closure portfolio benefits cost
progression
59% 52%
14% 17%
17% 15%
6% 7%4% 9%
2010 2014
Horse racing FootballGreyhounds VirtualOther
25% 20%
12% 11%
10%8%
3%4%
4% 6%
46% 51%
2010 2014Horse racing FootballGreyhounds VirtualOther Gaming
OTC turnover Retail gross win
783.1 789.7 837.9907.0 911.4
204.5 196.8 211.5 196.3 193.2
2010 2011 2012 2013 2014
Net revenue Operating profit
Retail five-year financial performance (£m)
1. 2010 to 20142. As at 2014 year-end3. Year on year

27
Priority Access card
Darts app
Vegas app
Product expansion:
horse racing
Product expansion:
other
Cash In My Bet
Vegas Mayfair games
AccaInsurance
Live Casino and scratchcards
Online leadership through innovation
• Italy: Sportsbook and Casino iOS• Spain: Sportsbook and Casino• Darts• Vegas iPad• Live Casino iPhone• Sportsbook, Casino, Vegas refreshes

28
Online leadership through innovation
Priority Access card
Darts app
Vegas app
Product expansion:
horse racing
Product expansion:
other
Cash In My Bet
Vegas Mayfair games
AccaInsurance
Live Casino and scratchcards
• Launching shortly• By invitation only• Priority access to the funds in your Online account

29
Online leadership through innovation
Priority Access card
Darts app
Vegas app
Product expansion:
horse racing
Product expansion:
other
Cash In My Bet
Vegas Mayfair games
AccaInsurance
Live Casino and scratchcards
• Extensive ‘Daily Meeting Markets’ range

30
Online leadership through innovation
Priority Access card
Darts app
Vegas app
Product expansion:
horse racing
Product expansion:
other
Cash In My Bet
Vegas Mayfair games
AccaInsurance
Live Casino and scratchcards
62,606Football events covered, +6%
39,392Tennis events
covered, +19%
17,015Basketball events
covered, +17%
138,419Events covered in
total, +11%
39% 39% 41%
23%
36%
28%
Football Tennis Basketball Pre-match In-play Total
Further strong turnover growth in key products
31
Online leadership through innovation
Priority Access card
Darts app
Vegas app
Product expansion:
horse racing
Product expansion:
other
Cash In My Bet
Vegas Mayfair games
AccaInsurance
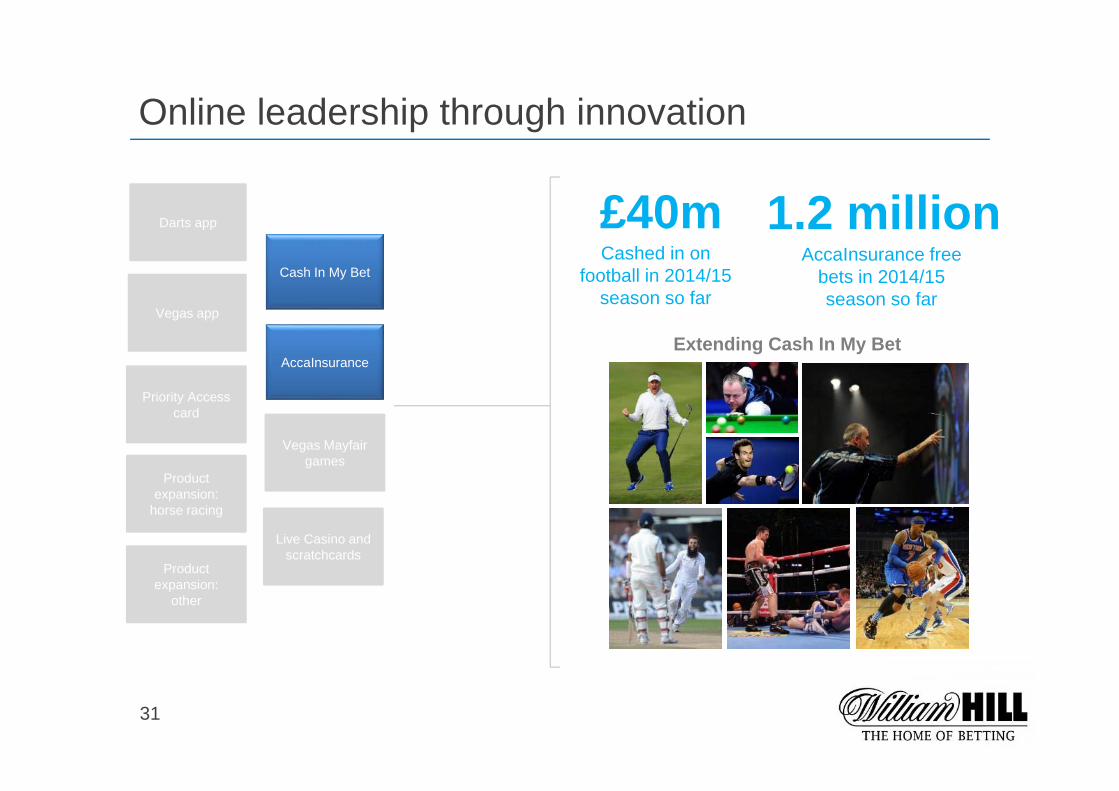
Live Casino and scratchcards
£40mCashed in on
football in 2014/15 season so far
1.2 millionAccaInsurance free
bets in 2014/15 season so far
Extending Cash In My Bet

32
Online leadership through innovation
Priority Access card
Darts app
Vegas app
Product expansion:
horse racing
Product expansion:
other
Cash In My Bet
Vegas Mayfair games
AccaInsurance
Live Casino and scratchcards
+68%growth in net revenue from
proprietary Vegas platform
+50%growth in net revenue from Live Casino

33
Strategic priorities: omni-channel
Maximising multi-channel share of wallet
54%of Online’s regular
customers regularly bet in LBOs
Customer-focused, technology-led
experience
‘One William Hill’ product
and content
Tip Advisor in Retail
Retail TV to Online
US racing to Online
Online football content to
SSBTs
Gantry alignment
34%of Retail’s regular
customers regularly bet online

34
Strategic priorities: international
William Hill brand launch
Live Casino launch in Spain
US turnover ($m)1
US operating profit1,2 ($m)
Australia operating profit (A$m)2,3
PalinsestoSupplementarerollout in Italy
1. 2012 numbers are on a statutory reporting basis from the date of ownership2. Operating profit/loss is defined as pre-exceptional profit/loss before interest and tax, and the amortisation
of specific identified intangible assets recognised on acquisitions 3. On a pro forma basis4. Source: AAMS5. Source: company estimates
Italy Sportsbook market share4
Spain Sportsbook market share5
Australia management
change
Australia product
expansion
Australia responsive design
launch
tomwaterhouse.com integration
US mobile turnover +65%
Net revenue: Italy +39%
Spain +64%
174338 370
36
150247
2012 2013 2014Retail Mobile
-0.97.9
15.7
2012 2013 2014
17.020.4
45.1
2012 2013 2014
Bet36546%
Bwin20%
William Hill19%
Sportium8%
Other7%
Bet36528%
Lottomatica10%
Eurobet9%
William Hill9%
Bwin8%
Sisal8%
Paddy Power7%
Snai7%
Others, 14%

35
Strategic priorities: technology
OpenBet
William Hill
Playtech
Increased front-end
independence: Project Trafalgar
Flexible framework:
William Hill API, Central Feeds
Ring-fenced back-end solution
700 people in IT
team globally
£98mIT opex and
capex in 20141
PRO
DU
CT
TRA
DIN
G
VEG
AS
CO
MM
UN
ITY
DATA WAREHOUSE
BUSINESS INTELLIGENCE
WILLIAM HILL API (SERVICE LAYER)TR
ADING HUB
SECU
RITY
MONITORING
TRAFALGAR FRONT END FRAMEWORK
CA
SIN
O,
PO
KE
R, B
ING
O
EXTERNAL GATEWAY
RETAIL DISPLAY GAMING SPORTSBOOK UI MOBILE BETTING UI
CORE SYSTEMS
FRONT END
ACCOUNT PAYMENT
BE
T C
AP
TUR
E
SE
TTLE
ME
NT
WALLET
1. Excludes depreciation and amortisation

36
Summary
• Record 2014 performance
• Continued strong Online growth
• Underpinned by cash-generative Retail
• Good operating profit progress from US and Australia
• Clear strategy for continued digital and international diversification

37
1/5 Hung Parliament
4/1 Conservative-Liberal Democrat coalition
9/2 Coalition involving SNP
9/2 Conservative minority government
11/2 Conservative majority
11/2 Labour-Liberal Democrat coalition
7/1 Coalition involving UKIP
9/1 Labour majority
20/1 Coalition involving Greens
33/1 Conservative-Labour coalition
50/1 UKIP majority
500/1 Liberal Democrat majority
5/1 Labour minority government

38
APPENDICES

39
Performance by division
1. Group, Retail and gaming machine net revenue growth is flattered by the transition from VAT and Amusement Machine Licence Duty to Machine Games Duty on 1 February 2013.
2. Operating profit is defined as pre-exceptional profit before interest and tax, before the amortisation of specific intangible assets recognised on acquisitions.
Net revenue1 Operating profit2
52 weeks ended 30 Dec 2014
£m
52 weeks ended 31 Dec 2013
£m
% Change 52 weeks ended 30 Dec 2014
£m
52 weeks ended 31 Dec 2013
£m
% Change
Retail 911.4 907.0 +0% 193.2 196.3 -2%
Online 527.4 446.3 +18% 177.7 147.8 +20%
Telephone 11.8 16.5 -28% (0.8) (0.0) n/a
William Hill Australia 121.9 86.7 +41% 24.7 12.0 +106%
William Hill US 29.7 22.7 +31% 9.7 4.9 +98%
Other 7.1 7.3 -3% (0.1) 0.2 -150%
Corporate - - - (32.2) (26.2) +23%
Total 1,609.3 1,486.5 +8% 372.2 335.0 +11%

40
Net operating expenses by division1
52 weeks ended 30 Dec 2014
£m
52 weeks ended 31 Dec 2013
£m
% Change
Retail (508.3) (507.4) +0%
Online (298.7) (258.3) +16%
Telephone (12.5) (16.5) -24%
William Hill Australia (67.1) (54.5) +23%
William Hill US (17.5) (15.8) +11%
Other (6.3) (6.2) +2%
Corporate (33.2) (29.6) +12%
Group net operating expenses (943.6) (888.3) +6%
1. Numbers are presented on a pre-exceptional basis, excluding the amortisation of the specific intangible assets arising on acquisitions and net of other income.

41
52 weeks ended 30 Dec 2014
£m
52 weeks ended 31 Dec 2013
£m
% Change
Amounts wagered 212.2 252.0 -16%
Gross win 12.6 17.4 -28%
Gross win margin 6.0% 6.9% -0.9 ppts
Net revenue 11.8 16.5 -28%Cost of sales (0.1) (0.0) -
Gross profit 11.7 16.5 -29%Staff costs (1.0) (1.7) -41%
Marketing costs (2.3) (2.4) -4%
Other costs incl. recharges (9.2) (12.4) -26%
Operating costs (12.5) (16.5) -24%Operating (loss)/profit1 (0.8) 0.0 -
Telephone
1. Operating profit is defined as pre-exceptional profit before interest and tax, before the amortisation of specific intangible assets recognised on acquisitions.

42
Net finance costs
52 weeks ended 30 Dec 2014
£m
52 weeks ended 31 Dec 2013
£m
Interest receivable (1.0) (1.1)
Bank loan interest 6.5 10.6
Bond interest 37.2 30.4
Amortisation of finance fees 2.6 3.7
Net interest on pension scheme net liability 0.6 0.7
Total pre-exceptional net finance costs 45.9 44.3

43
Net debt for covenant purposes
As at 30 Dec 2014
£m
As at 31 Dec 2013
£m
Bank loans 50.0 230.0
Corporate bonds 675.0 675.0
Cash (222.1) (206.7)
Net debt 502.9 698.3
Obligations under bank guarantees 3.2 3.0
Restricted cash – client balances 89.7 85.8
Other restricted cash 7.0 8.9
Net debt for covenant purposes 602.8 796.0
• Net debt: EBITDA of 1.4x vs maximum covenant of 3.5x (31 Dec 2013: 2.0x)• EBITDA: Net cash interest of 10.4x vs minimum covenant of 3.0x• BB+/Ba1 stable outlook credit ratings from S&P/Moody’s

44
Australia performance in local currency (pro forma)
1. Operating profit is defined as pre-exceptional profit before interest and tax, before the amortisation of specific intangible assets recognised on acquisitions.
52 weeks ended 30 Dec 2014
A$m
52 weeks ended 31 Dec 2013
A$m
% Change
Amounts wagered 2,542.9 2,530.3 +0%
Gross win 236.7 211.0 +12%
Win margin 9.3% 8.3% +1.0 ppts
Net revenue 223.0 200.5 +11%Cost of sales (55.2) (46.5) +19%
Gross profit 167.8 154.0 +9%Operating costs (122.7) (133.6) -8%
Operating profit1 45.1 20.4 +121%
Unique active players (’000) 324.0 282.1 +15%
Revenue per unique active (A$) 688 711 -3%
New accounts (’000) 142.1 136.8 +4%
Average cost per acquisition (A$) 351.9 467.8 -25%

45
US performance in local currency
1. Operating profit is defined as pre-exceptional profit before interest and tax, before the amortisation of specific intangible assets recognised on acquisitions.
52 weeks ended 30 Dec 2014
$m
52 weeks ended 31 Dec 2013
$m
% Change
Amounts wagered 617.3 487.6 +27%
Gross win 48.6 35.8 +36%
Win margin 7.9% 7.3% +0.6 ppts
Net revenue 48.6 35.8 +36%Cost of sales (4.1) (3.1) +32%
Gross profit 44.5 32.7 +36%Operating costs (28.8) (24.8) +16%
Operating profit1 15.7 7.9 +99%


![[XLS]2006 Canadian Election Final Results - SFU.ca - Simon ...aheard/elections/2006-final-results.xls · Web view2006 Election Final Results 2006 Canadian Election - Official Results](https://img.pdfslide.us/doc/110x75/5b1b856c7f8b9a23258ead47/xls2006-canadian-election-final-results-sfuca-simon-aheardelections2006-final-.jpg)