Embed Size (px)
Citation preview
2 0 1 4 F E G I N V E S T M E N T F O R U M
Producing Results in anUnpredictable World
G A M E O N :
KEEPING YOUR FOUNDATION HEALTHY: REVIEW OF INVESTMENT PRACTICES &
POLICIESThomas P. Moushey, Esq.Robinson & McElwee, AlliancePresident-ElectOhio State Bar Foundation
NATIONAL CONFERENCE OF BAR FOUNDATIONS – JULY 31, 2015
Matthew R. Veith Fund Evaluation Group, LLCSenior Vice President
Alison M. BelfrageExecutive DirectorOhio State Bar Foundation
©2015 Fund Evaluation Group, LLC. Confidential. Not for Redistribution.2
AGENDA
I. A Primer on Board Fiduciary Responsibility
II. The Investment Process
III. Case Study: Ohio State Bar Foundation
IV. Considerations for an Expected Lower-Return Environment

©2015 Fund Evaluation Group, LLC. Confidential. Not for Redistribution.3
A Primer on Board Fiduciary Responsibility
©2015 Fund Evaluation Group, LLC. Confidential. Not for Redistribution.4
A PRIMER ON BOARD FIDUCIARY RESPONSIBILITY
Ohio State Bar Foundation Experience
A. Introduction1. Financial health of the organization2. Board of Trustees – Fiduciary Duty
©2015 Fund Evaluation Group, LLC. Confidential. Not for Redistribution.5
A PRIMER ON BOARD FIDUCIARY RESPONSIBILITY
Ohio State Bar Foundation Experience
B. Review of Existing Investment Policy1. When to review2. Review of Investment Policy with Investment
Manager3. There are known unknowns….
©2015 Fund Evaluation Group, LLC. Confidential. Not for Redistribution.6
A PRIMER ON BOARD FIDUCIARY RESPONSIBILITY
Ohio State Bar Foundation Experience
“There are known knowns. These are things we know that we know. There are known unknowns. That is to say, there are things that we know we don't know. But there are also unknown unknowns. There are things we don't know we don't know.”
To whom do we attribute this famous quote?
Confidential. Not for Redistribution.72014 FEG Investment Forum
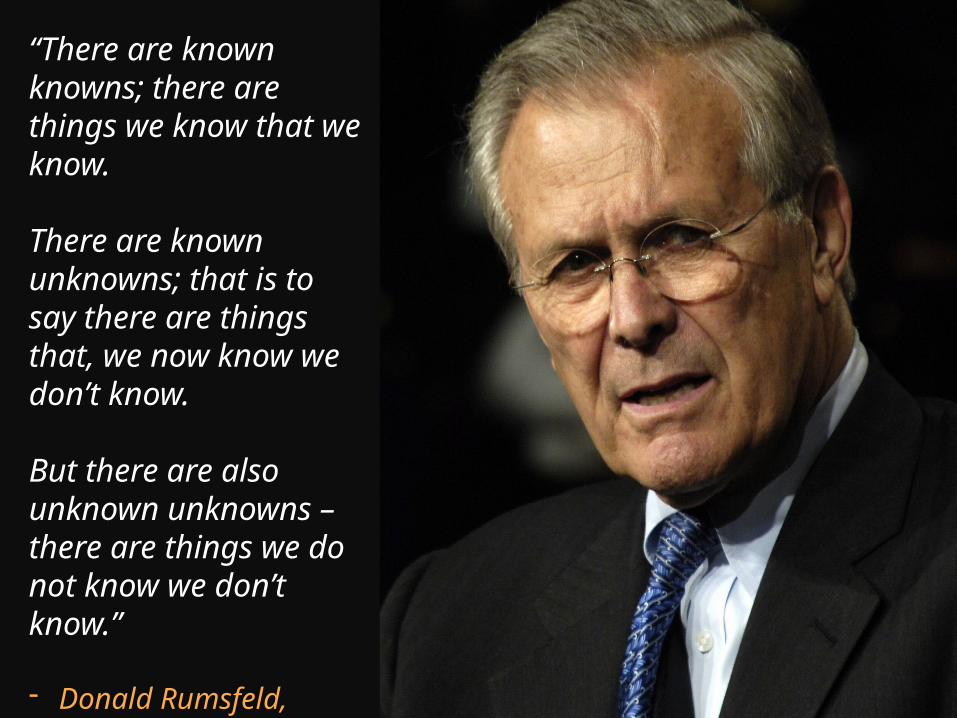
“There are known knowns; there are things we know that we know.
There are known unknowns; that is to say there are things that, we now know we don’t know.
But there are also unknown unknowns – there are things we do not know we don’t know.”
- Donald Rumsfeld, Former Secretary of Defense
©2015 Fund Evaluation Group, LLC. Confidential. Not for Redistribution.8
A PRIMER ON BOARD FIDUCIARY RESPONSIBILITY
Ohio State Bar Foundation Experience
4. Hire an independent consultanta) Asset allocationb) Investment policy statementc) Performanced) Fees e) Governance

©2015 Fund Evaluation Group, LLC. Confidential. Not for Redistribution.9
The Investment Process
©2015 Fund Evaluation Group, LLC. Confidential. Not for Redistribution.10
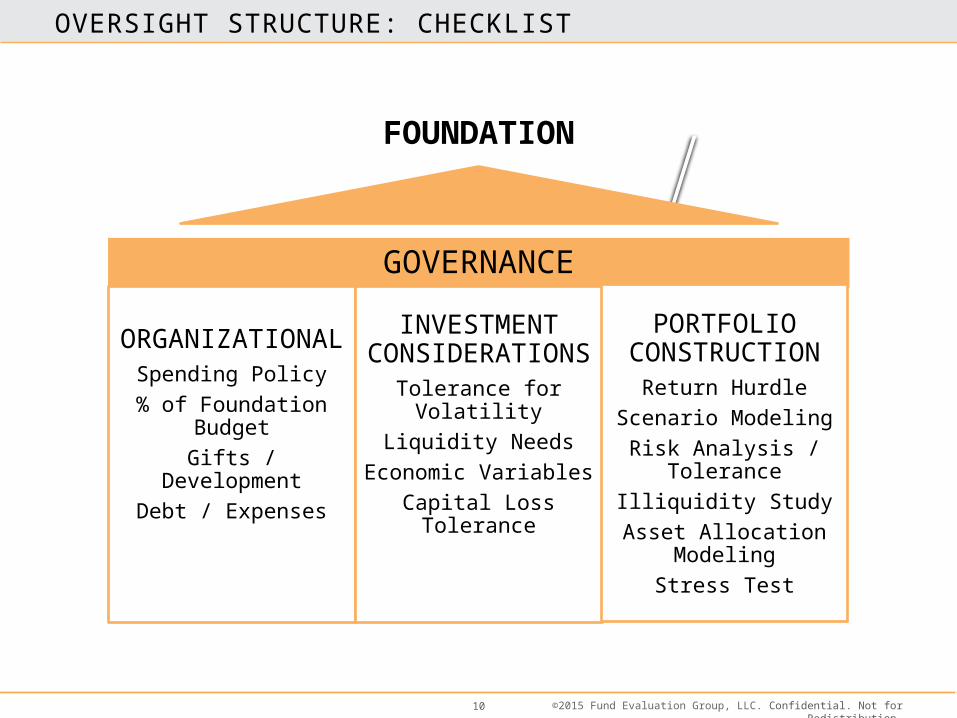
OVERSIGHT STRUCTURE: CHECKLIST
GOVERNANCE
ORGANIZATIONALSpending Policy
% of Foundation BudgetGifts / Development
Debt / Expenses
INVESTMENT CONSIDERATIONSTolerance for Volatility
Liquidity NeedsEconomic Variables
Capital Loss Tolerance
PORTFOLIO CONSTRUCTION
Return HurdleScenario Modeling
Risk Analysis / ToleranceIlliquidity Study
Asset Allocation ModelingStress Test
FOUNDATION
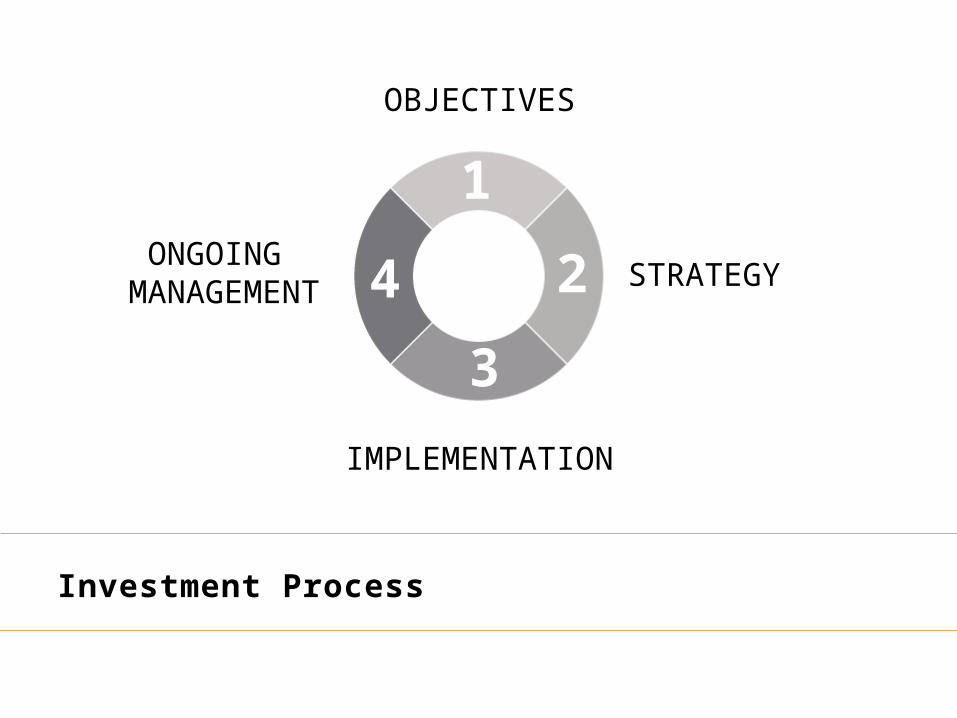
Investment Process
1
4
3
2
OBJECTIVES
STRATEGY
IMPLEMENTATION
ONGOING MANAGEMENT
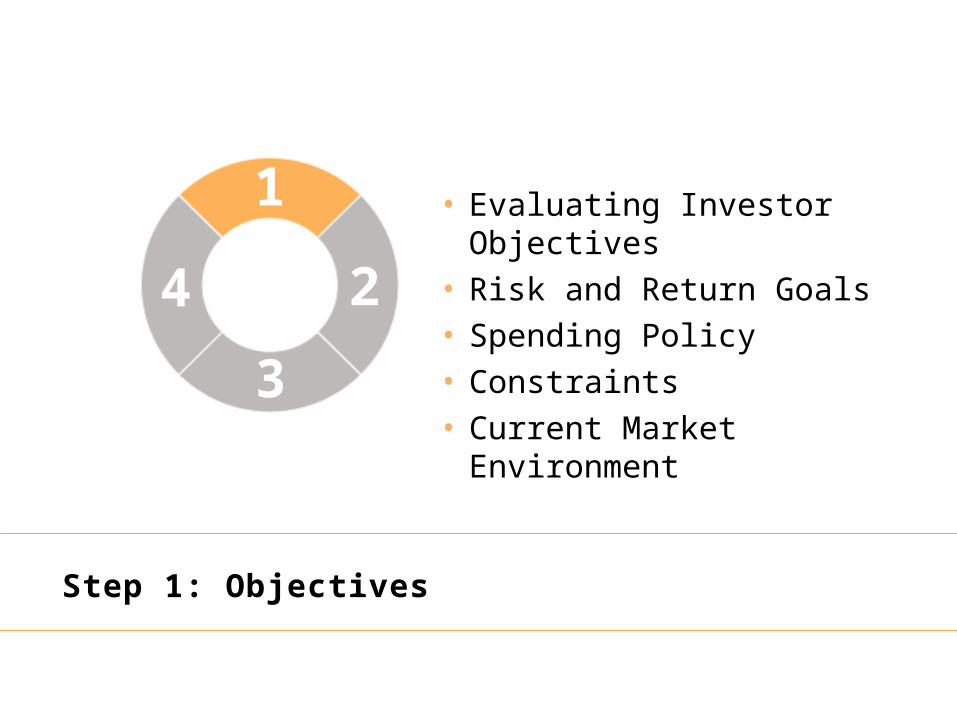
Step 1: Objectives
1
4
3
2
• Evaluating Investor Objectives• Risk and Return Goals• Spending Policy• Constraints• Current Market Environment
©2015 Fund Evaluation Group, LLC. Confidential. Not for Redistribution.13
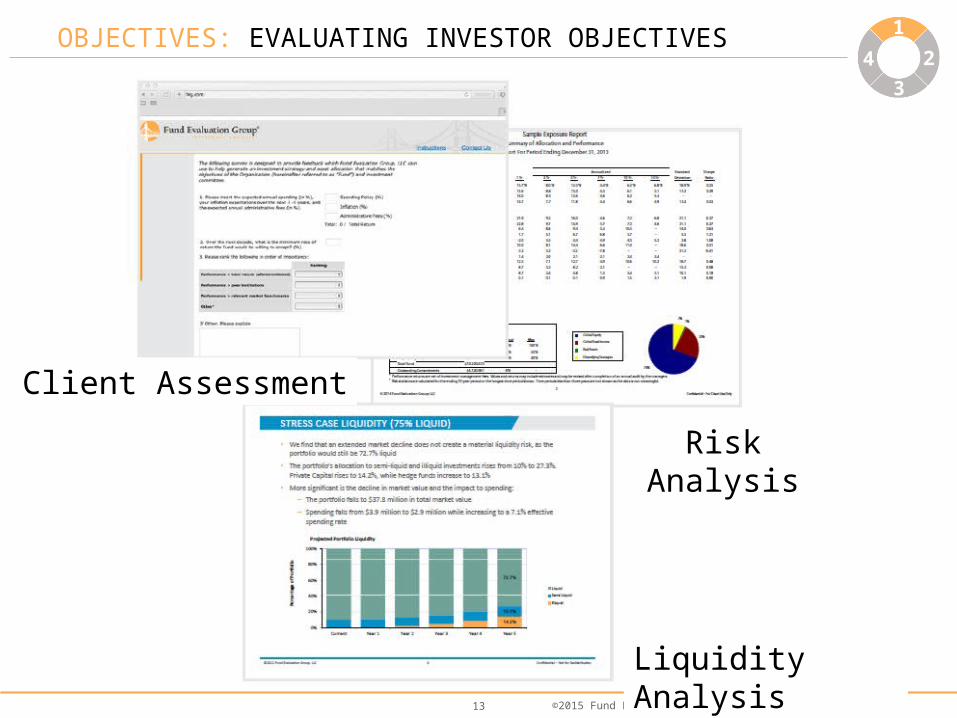
OBJECTIVES: EVALUATING INVESTOR OBJECTIVES
3
1
4
3
2
Client Assessment
Risk Analysis
Liquidity Analysis
©2015 Fund Evaluation Group, LLC. Confidential. Not for Redistribution.14
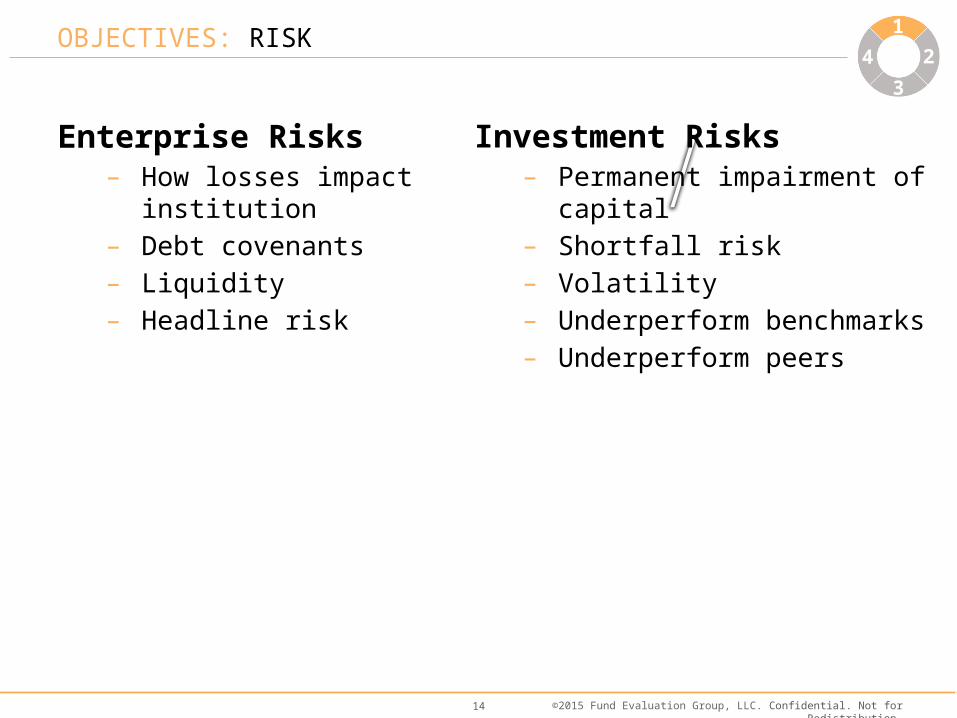
SPENDING POLICYOBJECTIVES: RISK 1
4
3
2
Enterprise Risks– How losses impact institution– Debt covenants– Liquidity– Headline risk
Investment Risks– Permanent impairment of capital– Shortfall risk– Volatility– Underperform benchmarks– Underperform peers
©2015 Fund Evaluation Group, LLC. Confidential. Not for Redistribution.15
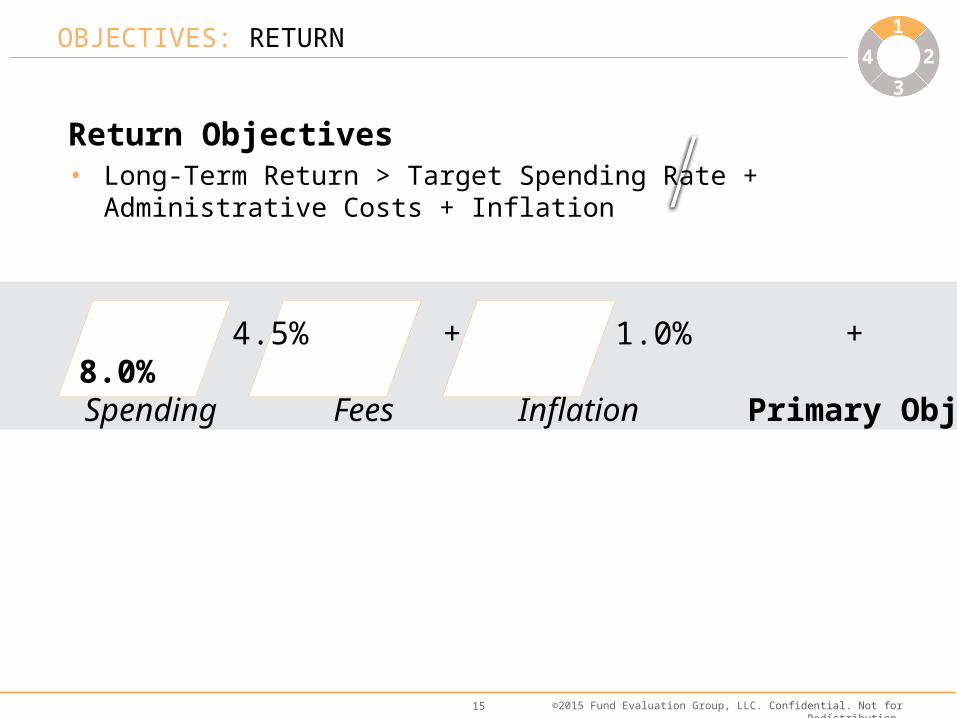
SPENDING IS ONLY PART OF THE EQUATION
4.5% + 1.0% + 2.5% = 8.0% Spending Fees Inflation Primary Objective
OBJECTIVES: RETURN 1
4
3
2
Return Objectives• Long-Term Return > Target Spending Rate + Administrative Costs +
Inflation
©2015 Fund Evaluation Group, LLC. Confidential. Not for Redistribution.16
SPEND TODAY VS. SPEND TOMORROW
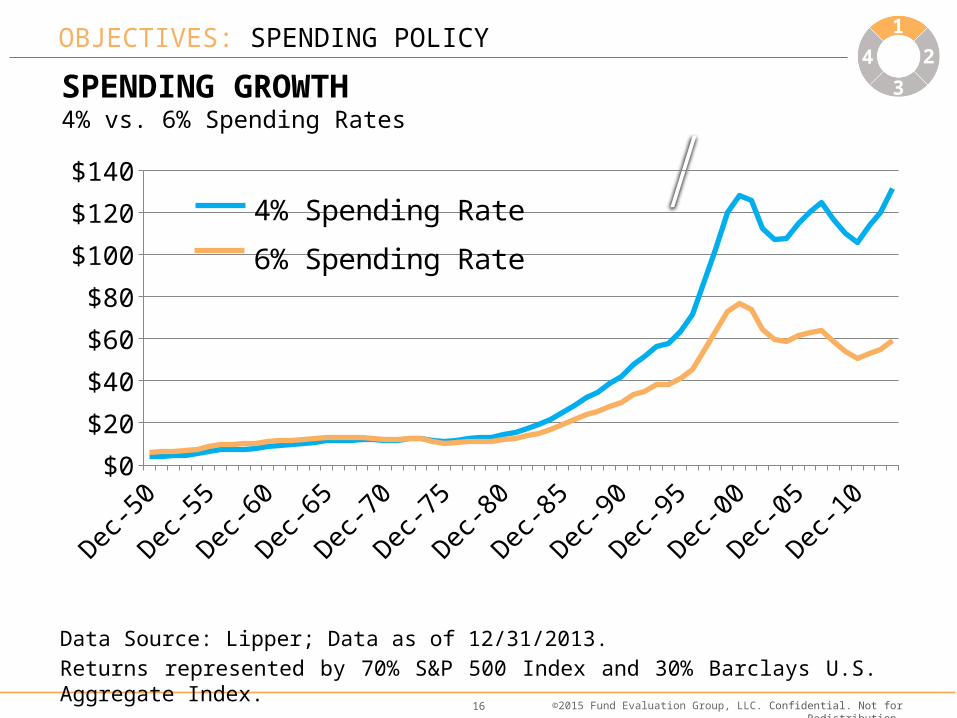
Data Source: Lipper; Data as of 12/31/2013.Returns represented by 70% S&P 500 Index and 30% Barclays U.S. Aggregate Index.
SPENDING GROWTH4% vs. 6% Spending Rates
1950 1955 1960 1965 1970 1975 1980 1985 1990 1995 2000 2005 2010$0
$20
$40
$60
$80
$100
$120
$1404% Spending Rate
6% Spending Rate
OBJECTIVES: SPENDING POLICY 1
4
3
2
©2015 Fund Evaluation Group, LLC. Confidential. Not for Redistribution.17
SPENDING POLICY
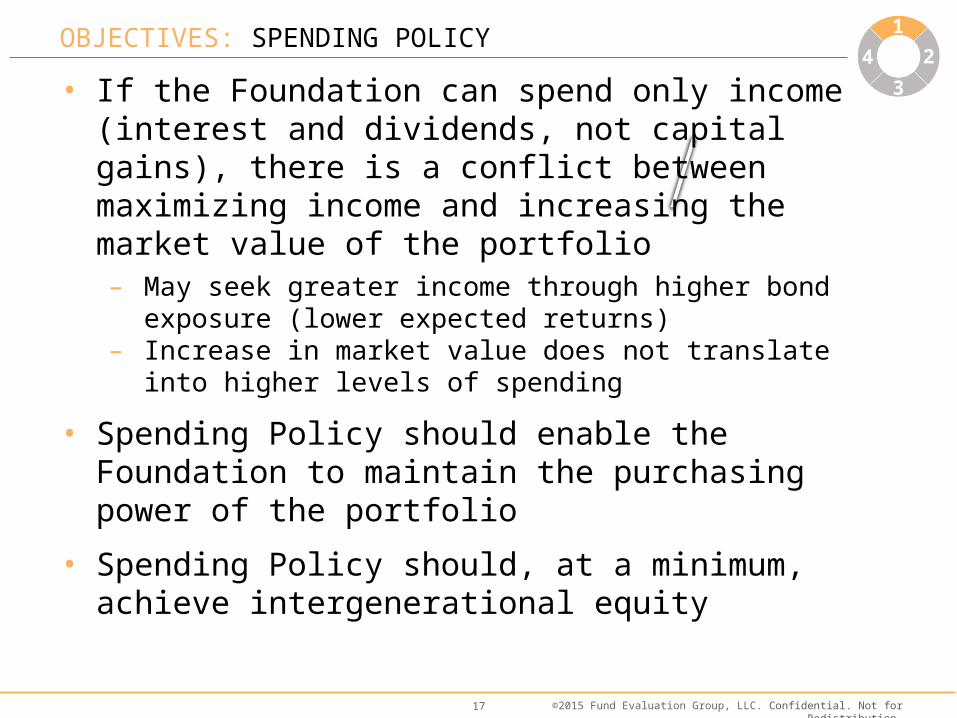
• If the Foundation can spend only income (interest and dividends, not capital gains), there is a conflict between maximizing income and increasing the market value of the portfolio– May seek greater income through higher bond exposure (lower
expected returns)– Increase in market value does not translate into higher levels of
spending
• Spending Policy should enable the Foundation to maintain the purchasing power of the portfolio
• Spending Policy should, at a minimum, achieve intergenerational equity
OBJECTIVES: SPENDING POLICY 1
4
3
2
©2015 Fund Evaluation Group, LLC. Confidential. Not for Redistribution.18
OBJECTIVES: INVESTMENT POLICY STATEMENT (IPS)
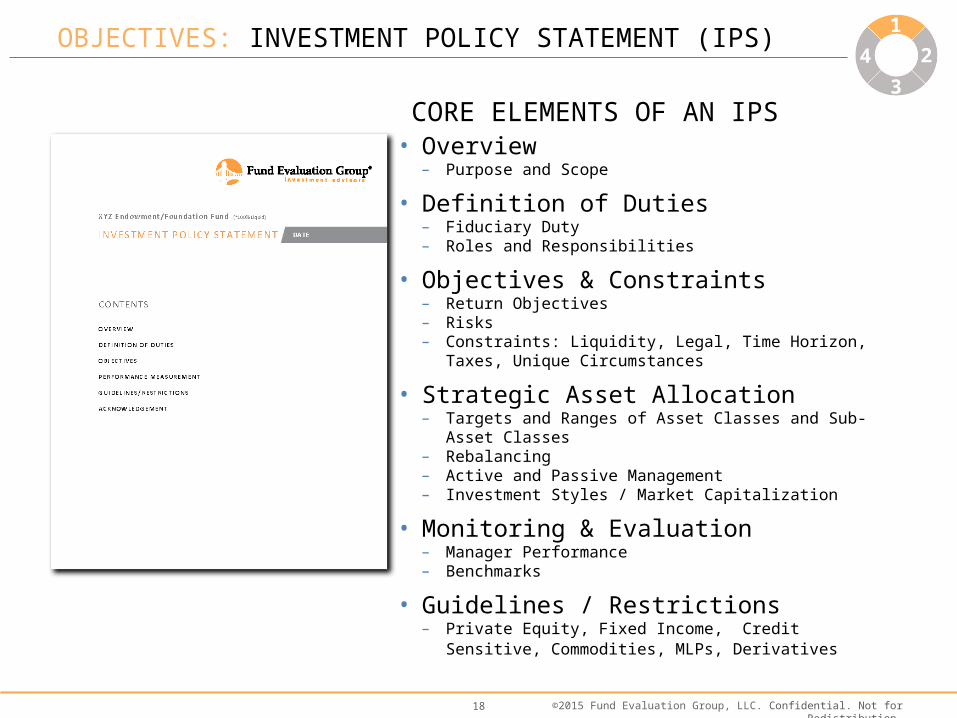
• Overview– Purpose and Scope
• Definition of Duties– Fiduciary Duty– Roles and Responsibilities
• Objectives & Constraints– Return Objectives– Risks– Constraints: Liquidity, Legal, Time Horizon, Taxes, Unique
Circumstances
• Strategic Asset Allocation – Targets and Ranges of Asset Classes and Sub-Asset Classes– Rebalancing– Active and Passive Management– Investment Styles / Market Capitalization
• Monitoring & Evaluation– Manager Performance– Benchmarks
• Guidelines / Restrictions– Private Equity, Fixed Income, Credit Sensitive, Commodities, MLPs,
Derivatives
1
4
3
21
4
3
2
CORE ELEMENTS OF AN IPS
1
4
3
2
1
4
3
2
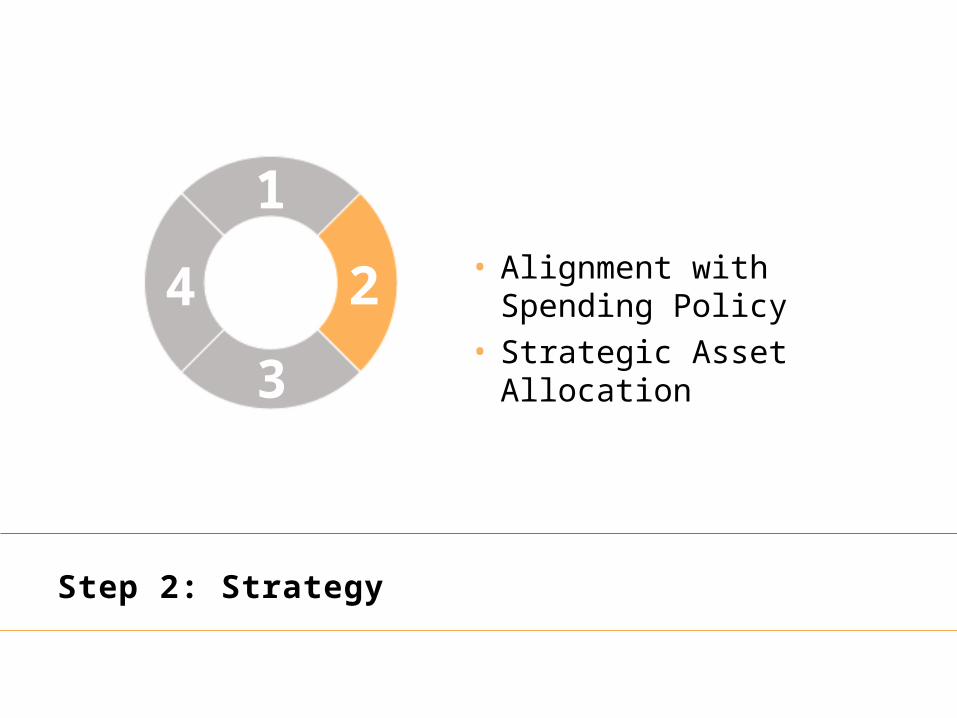
Step 2: Strategy
1
4
3
2 • Alignment with Spending Policy• Strategic Asset Allocation
©2015 Fund Evaluation Group, LLC. Confidential. Not for Redistribution.20
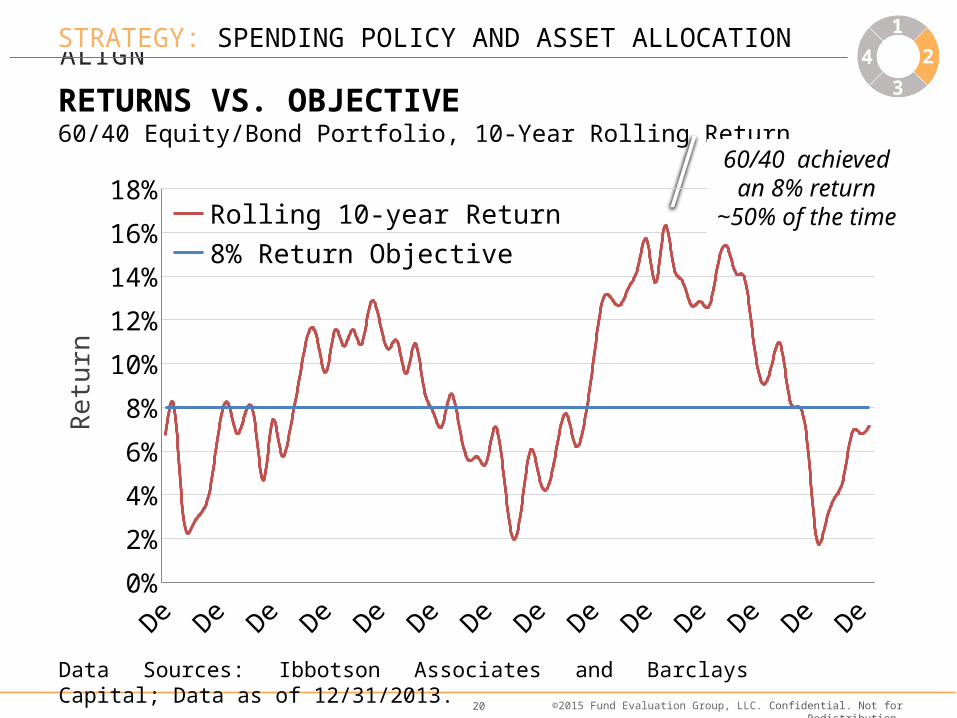
SPENDING AND ASSET ALLOCATION POLICY SHOULD ALIGN
RETURNS VS. OBJECTIVE60/40 Equity/Bond Portfolio, 10-Year Rolling Return
Data Sources: Ibbotson Associates and Barclays Capital; Data as of 12/31/2013.
1935 1948 1961 1974 1987 2000 20130%
2%
4%
6%
8%
10%
12%
14%
16%
18%Rolling 10-year Return8% Return Objective
Retu
rn
60/40 achieved an 8% return
~50% of the time
STRATEGY: SPENDING POLICY AND ASSET ALLOCATION 1
4
3
2
©2015 Fund Evaluation Group, LLC. Confidential. Not for Redistribution.21
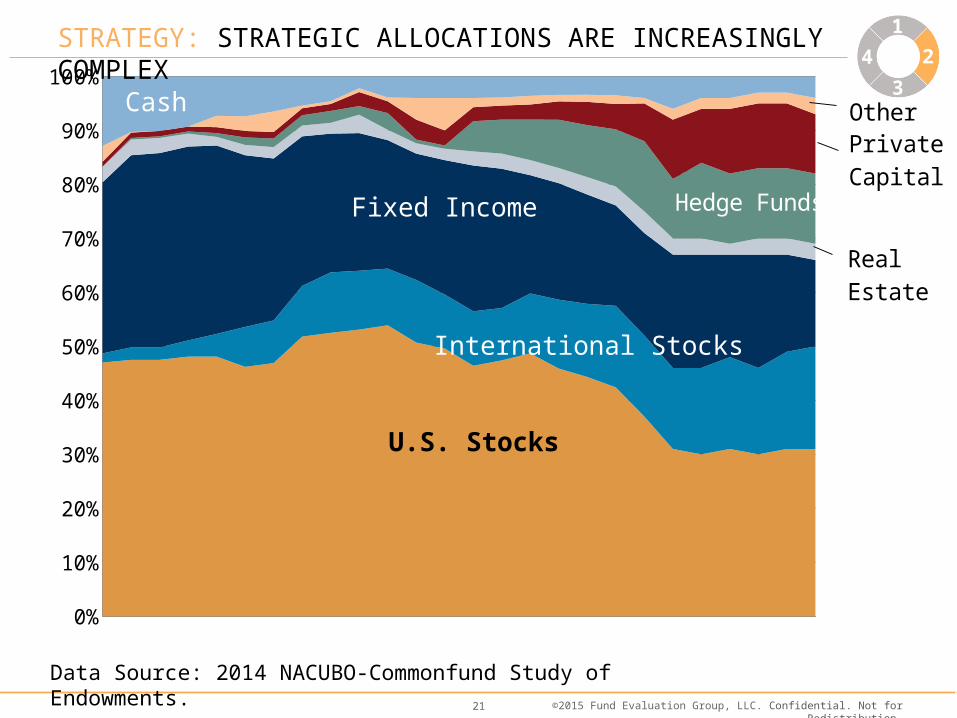
INCREASING COMPLEXITY―ASSET ALLOCATION4
3
2
Data Source: 2014 NACUBO-Commonfund Study of Endowments.
0%
10%
20%
30%
40%
50%
60%
70%
80%
90%
100%
U.S. Stocks
International Stocks
Fixed Income
Real Estate
Hedge Funds
Private Capital
Cash Other
STRATEGY: STRATEGIC ALLOCATIONS ARE INCREASINGLY COMPLEX 1
4
3
2
©2015 Fund Evaluation Group, LLC. Confidential. Not for Redistribution.22
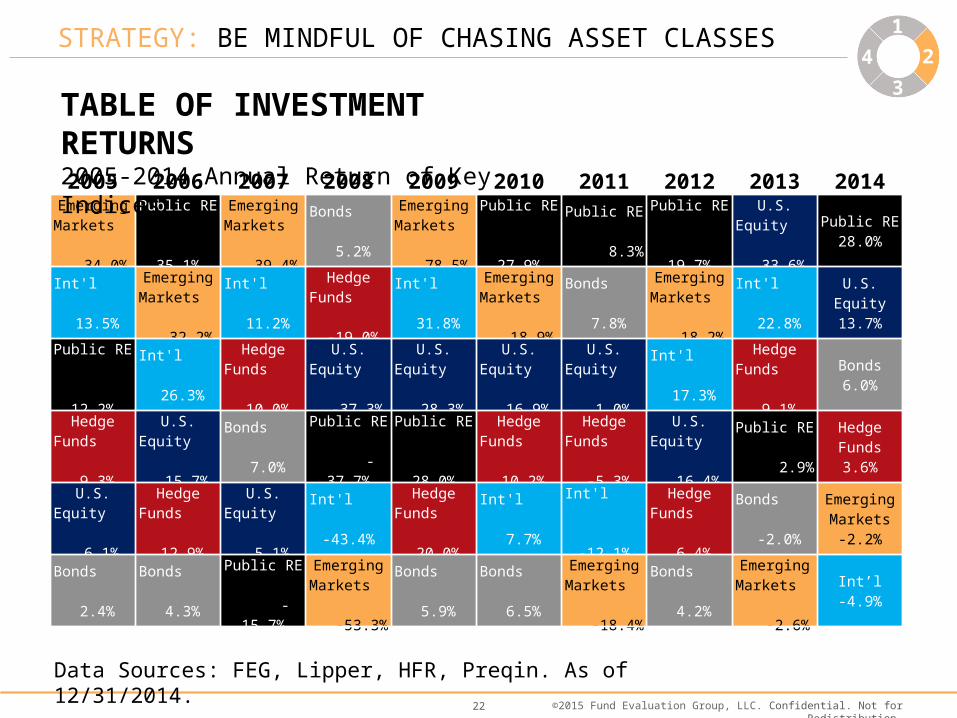
STRATEGY: BE MINDFUL OF CHASING ASSET CLASSES 1
4
3
2
2005 2006 2007 2008 2009 2010 2011 2012 2013 2014Emerging
Markets 34.0%
Public RE 35.1%
Emerging Markets
39.4%Bonds
5.2%Emerging
Markets 78.5%
Public RE 27.9%
Public RE 8.3%
Public RE 19.7%
U.S. Equity 33.6%
Public RE28.0%
Int'l 13.5%
Emerging Markets
32.2%Int'l
11.2%Hedge Funds -19.0%
Int'l 31.8%
Emerging Markets
18.9%Bonds
7.8%Emerging
Markets 18.2%
Int'l 22.8%
U.S. Equity13.7%
Public RE 12.2%
Int'l 26.3%
Hedge Funds 10.0%
U.S. Equity -37.3%
U.S. Equity 28.3%
U.S. Equity 16.9%
U.S. Equity 1.0%
Int'l 17.3%
Hedge Funds 9.1%
Bonds6.0%
Hedge Funds 9.3%
U.S. Equity 15.7%
Bonds 7.0%
Public RE -37.7%
Public RE 28.0%
Hedge Funds 10.2%
Hedge Funds -5.3%
U.S. Equity 16.4%
Public RE 2.9%
Hedge Funds3.6%
U.S. Equity 6.1%
Hedge Funds 12.9%
U.S. Equity 5.1%
Int'l -43.4%
Hedge Funds 20.0%
Int'l 7.7%
Int'l -12.1%
Hedge Funds 6.4%
Bonds -2.0%
Emerging Markets
-2.2%
Bonds 2.4%
Bonds 4.3%
Public RE -15.7%
Emerging Markets
-53.3%Bonds
5.9%Bonds
6.5%Emerging
Markets -18.4%
Bonds 4.2%
Emerging Markets
-2.6%Int’l
-4.9%
Data Sources: FEG, Lipper, HFR, Preqin. As of 12/31/2014.
TABLE OF INVESTMENT RETURNS2005-2014 Annual Return of Key Indices
Step 3: Implementation
1
4
3
2
1
4
3
2 • Manager Selection• Selecting the Right Service Model
©2015 Fund Evaluation Group, LLC. Confidential. Not for Redistribution.24
INCREASED COMPLEXITY
Navigating the investment landscape requires resources, acumen, and infrastructure
IMPLEMENTATION: INCREASED COMPLEXITY 1
4
3
2
©2015 Fund Evaluation Group, LLC. Confidential. Not for Redistribution.25
1
4
3
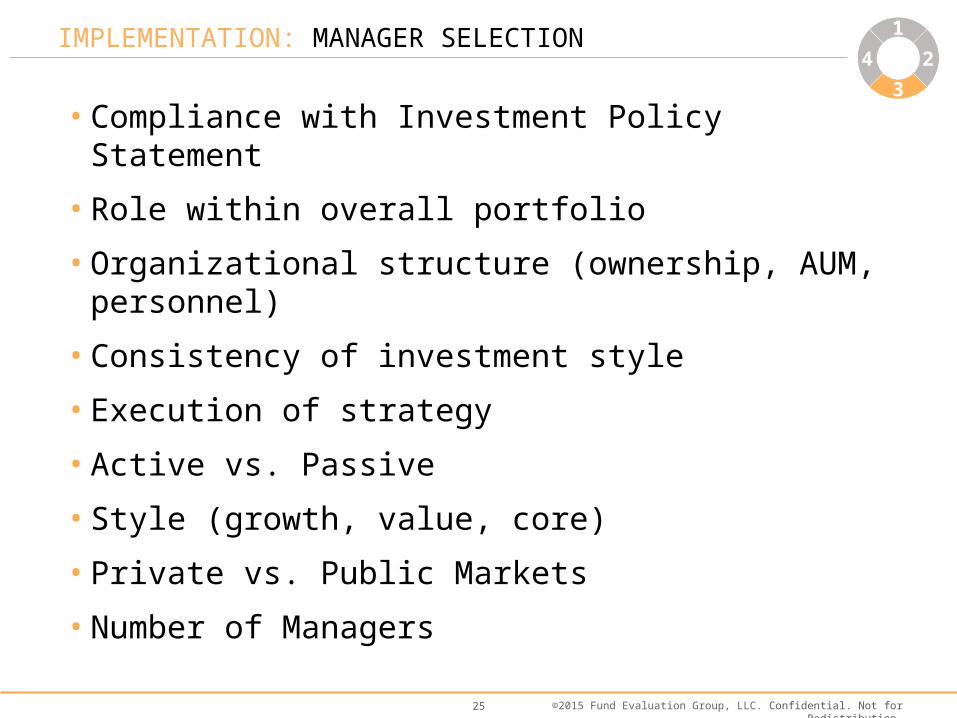
2IMPLEMENTATION: MANAGER SELECTION 1
4
3
2
• Compliance with Investment Policy Statement
• Role within overall portfolio
• Organizational structure (ownership, AUM, personnel)
• Consistency of investment style
• Execution of strategy
• Active vs. Passive
• Style (growth, value, core)
• Private vs. Public Markets
• Number of Managers
©2015 Fund Evaluation Group, LLC. Confidential. Not for Redistribution.26
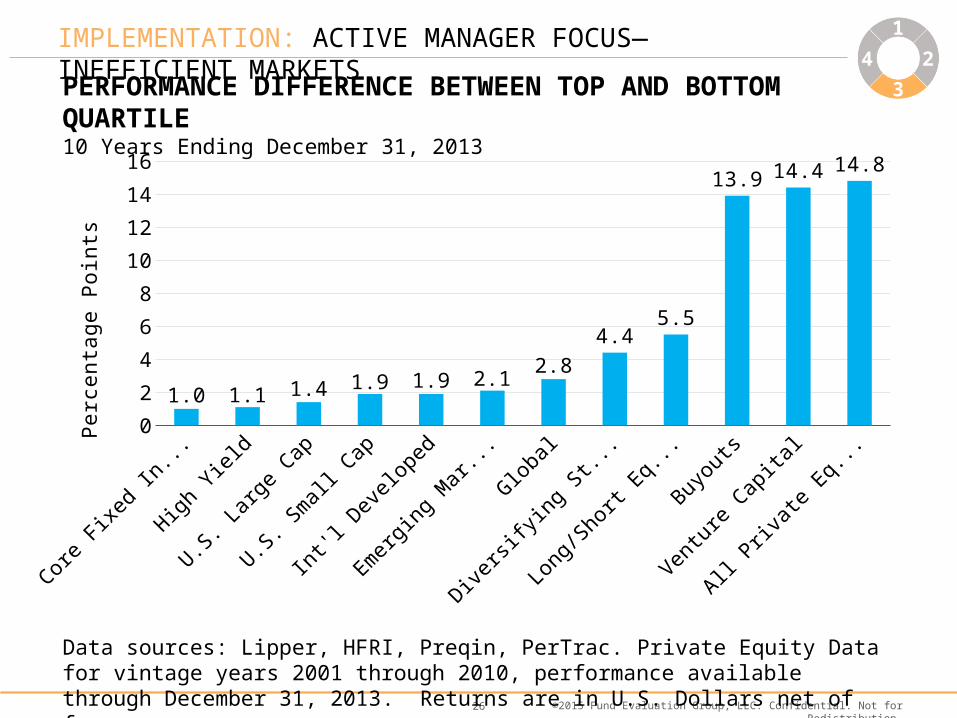
IMPLEMENTATION: ACTIVE MANAGER FOCUS—INEFFICIENT MARKETS
Data sources: Lipper, HFRI, Preqin, PerTrac. Private Equity Data for vintage years 2001 through 2010, performance available through December 31, 2013. Returns are in U.S. Dollars net of fees.
1
4
3
2
PERFORMANCE DIFFERENCE BETWEEN TOP AND BOTTOM QUARTILE10 Years Ending December 31, 2013
Core Fix
ed In
come
High Yi
eld
U.S. La
rge Cap
U.S. Sm
all Cap
Int'l Dev
eloped
Emerg
ing Mark
ets
Global
Diversi
fying S
trateg
ies
Long/S
hort Eq
uity
Buyouts
Venture
Capita
l
All Priv
ate Eq
uity0
2
4
6
8
10
12
14
16
1.0 1.1 1.4 1.9 1.9 2.12.8
4.45.5
13.9 14.4 14.8
Perc
enta
ge P
oint
s
1
4
3
2
©2015 Fund Evaluation Group, LLC. Confidential. Not for Redistribution.27
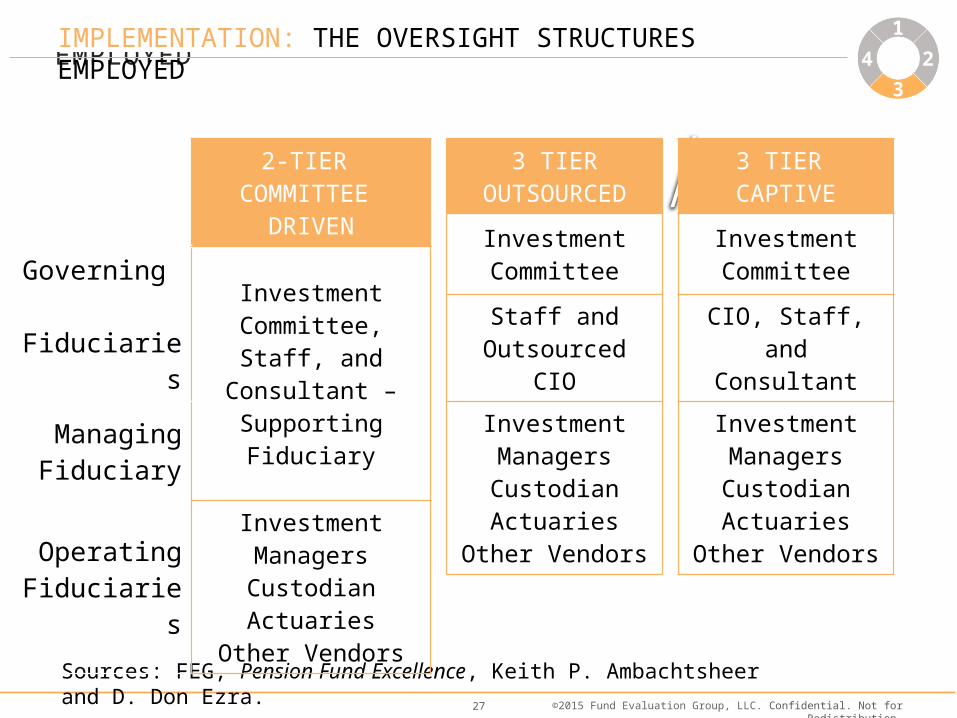
IMPLEMENTATION: THE OVERSIGHT STRUCTURES EMPLOYED
3 TIER CAPTIVE
Investment Committee
CIO, Staff, and Consultant
Investment ManagersCustodianActuaries
Other Vendors
Sources: FEG, Pension Fund Excellence, Keith P. Ambachtsheer and D. Don Ezra.
2-TIER COMMITTEE DRIVEN
Governing Fiduciaries Investment
Committee, Staff, andConsultant –
Supporting FiduciaryManaging Fiduciary
Operating Fiduciaries
Investment ManagersCustodianActuaries
Other Vendors
3 TIER OUTSOURCED
Investment Committee
Staff and Outsourced CIO
Investment ManagersCustodianActuaries
Other Vendors
IMPLEMENTATION: THE OVERSIGHT STRUCTURES EMPLOYED 1
4
3
2
©2015 Fund Evaluation Group, LLC. Confidential. Not for Redistribution.28
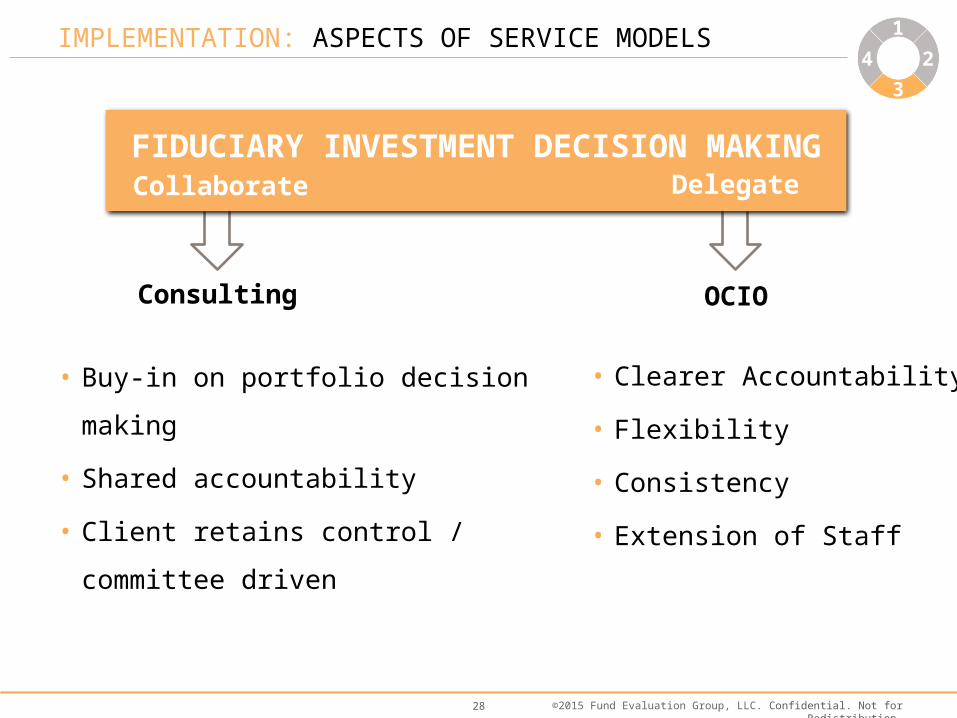
IMPLEMENTATION: ASPECTS OF SERVICE MODELS 1
4
3
2
Consulting OCIO
Collaborate DelegateFIDUCIARY INVESTMENT DECISION MAKING
• Buy-in on portfolio decision making
• Shared accountability
• Client retains control / committee driven
• Clearer Accountability
• Flexibility
• Consistency
• Extension of Staff
©2015 Fund Evaluation Group, LLC. Confidential. Not for Redistribution.29
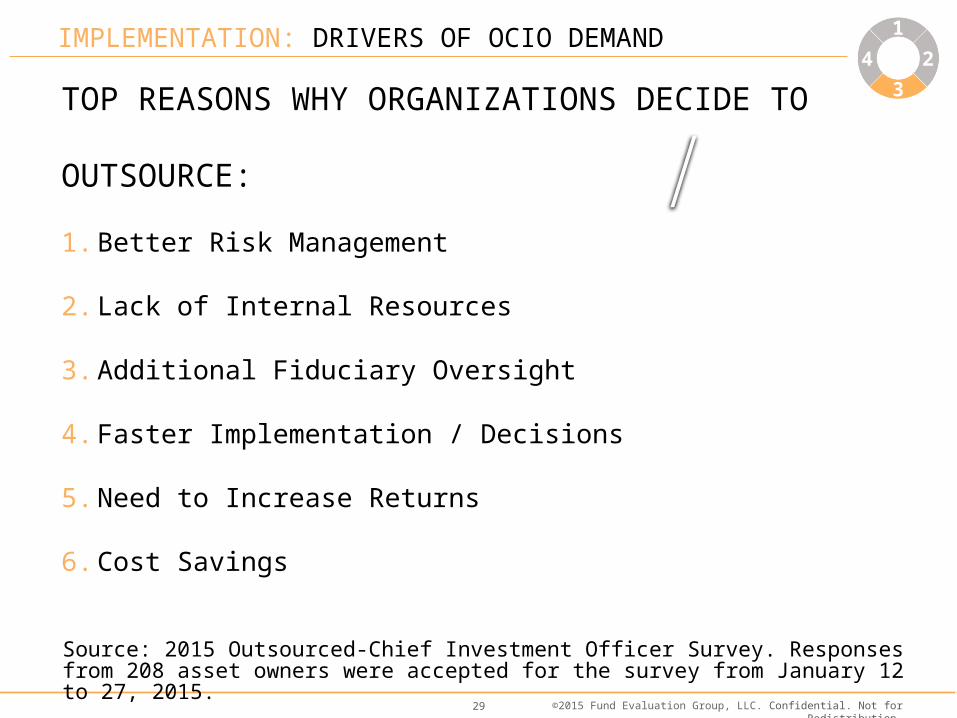
DRIVERS OF DEMAND
TOP REASONS WHY ORGANIZATIONS DECIDE TO OUTSOURCE:
1. Better Risk Management
2. Lack of Internal Resources
3. Additional Fiduciary Oversight
4. Faster Implementation / Decisions
5. Need to Increase Returns
6. Cost Savings
Source: 2015 Outsourced-Chief Investment Officer Survey. Responses from 208 asset owners were accepted for the survey from January 12 to 27, 2015.
IMPLEMENTATION: DRIVERS OF OCIO DEMAND 1
4
3
2
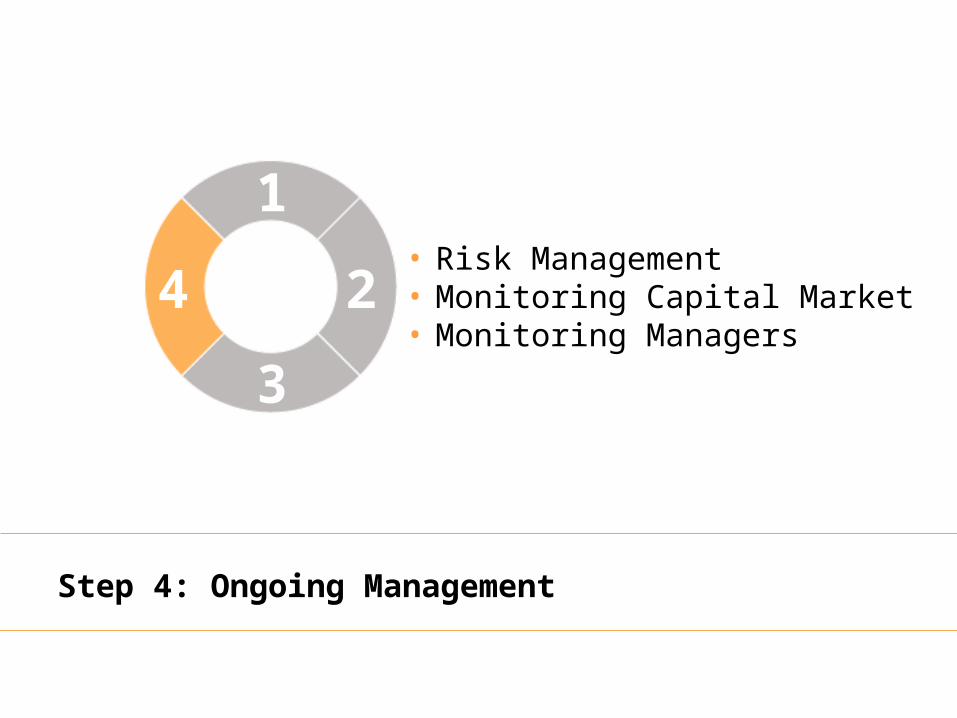
Step 4: Ongoing Management
• Risk Management• Monitoring Capital Market• Monitoring Managers
1
4
3
2
1
4
3
2
©2015 Fund Evaluation Group, LLC. Confidential. Not for Redistribution.31
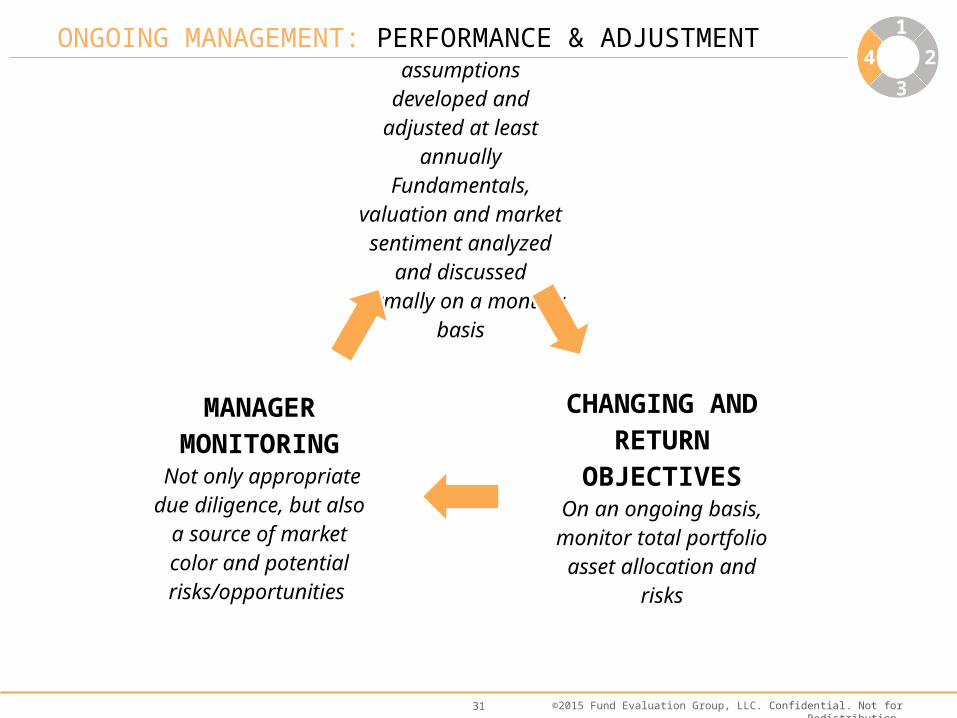
CAPITAL MARKETReturn/risk assumptions developed and adjusted
at least annuallyFundamentals, valuation
and market sentiment analyzed and discussed formally on a monthly
basis
CHANGING AND RETURN
OBJECTIVESOn an ongoing basis,
monitor total portfolio asset allocation and
risks
MANAGER MONITORING
Not only appropriate due diligence, but also a source of market color
and potential risks/opportunities
SAMPLE EXPOSURE REPORTONGOING MANAGEMENT: PERFORMANCE & ADJUSTMENT 1
4
3
2

©2015 Fund Evaluation Group, LLC. Confidential. Not for Redistribution.32
Case Study: Ohio State Bar Foundation
©2015 Fund Evaluation Group, LLC. Confidential. Not for Redistribution.33
BACKDROP – OSBF CASE STUDY
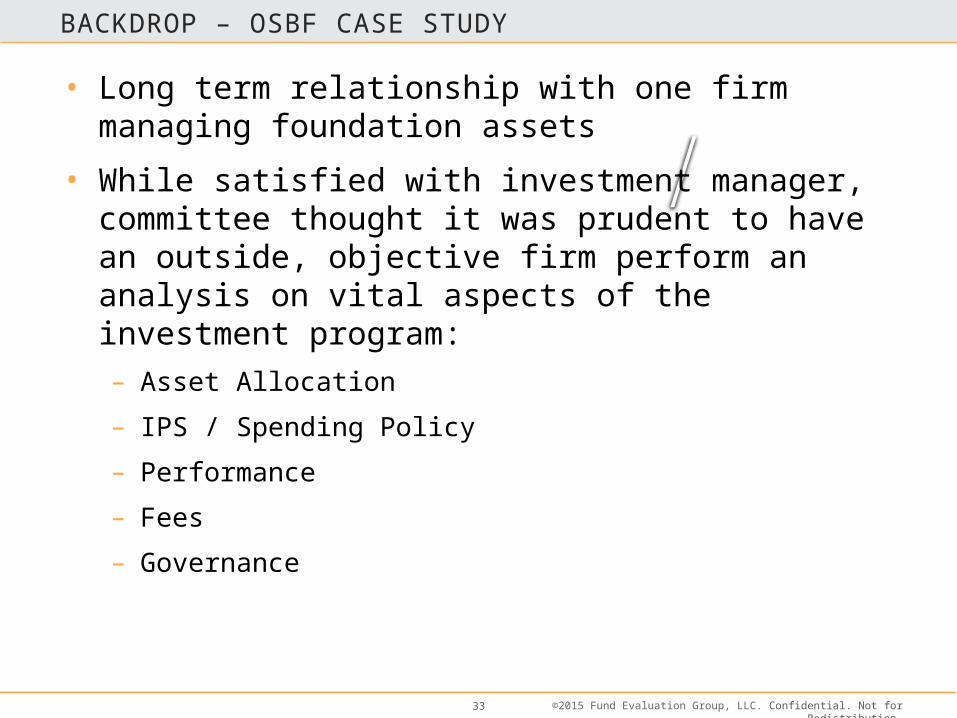
• Long term relationship with one firm managing foundation assets
• While satisfied with investment manager, committee thought it was prudent to have an outside, objective firm perform an analysis on vital aspects of the investment program:– Asset Allocation
– IPS / Spending Policy
– Performance
– Fees
– Governance
©2015 Fund Evaluation Group, LLC. Confidential. Not for Redistribution.34
ASSESSMENT & RECOMMENDATIONS
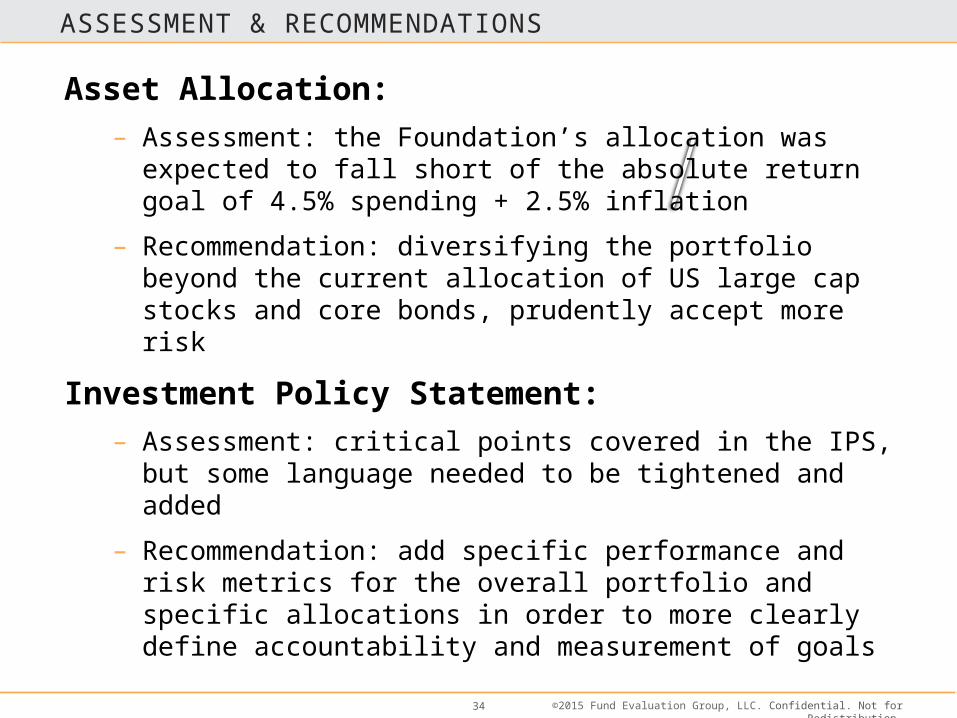
Asset Allocation: – Assessment: the Foundation’s allocation was expected to fall short of
the absolute return goal of 4.5% spending + 2.5% inflation
– Recommendation: diversifying the portfolio beyond the current allocation of US large cap stocks and core bonds, prudently accept more risk
Investment Policy Statement: – Assessment: critical points covered in the IPS, but some language
needed to be tightened and added
– Recommendation: add specific performance and risk metrics for the overall portfolio and specific allocations in order to more clearly define accountability and measurement of goals
©2015 Fund Evaluation Group, LLC. Confidential. Not for Redistribution.35
ASSESSMENT & RECOMMENDATIONS
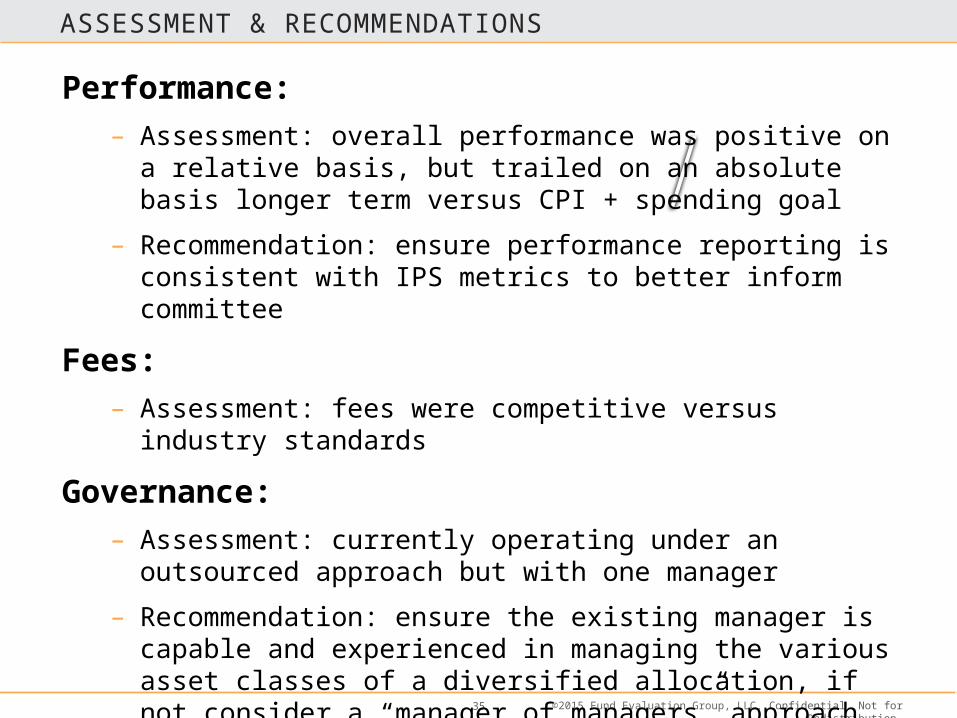
Performance:– Assessment: overall performance was positive on a relative basis, but
trailed on an absolute basis longer term versus CPI + spending goal
– Recommendation: ensure performance reporting is consistent with IPS metrics to better inform committee
Fees:– Assessment: fees were competitive versus industry standards
Governance:– Assessment: currently operating under an outsourced approach but
with one manager
– Recommendation: ensure the existing manager is capable and experienced in managing the various asset classes of a diversified allocation, if not consider a “manager of managers” approach

©2015 Fund Evaluation Group, LLC. Confidential. Not for Redistribution.36
Considerations for an Expected Lower-Return Environment
Confidential. Not for Redistribution.372014 FEG Investment Forum
“The market’s not a very accommodating machine; it won’t provide high returns just because you need them.”
- Peter L. Bernstein, Financial Historian
(1919-2009)
©2015 Fund Evaluation Group, LLC. Confidential. Not for Redistribution.38
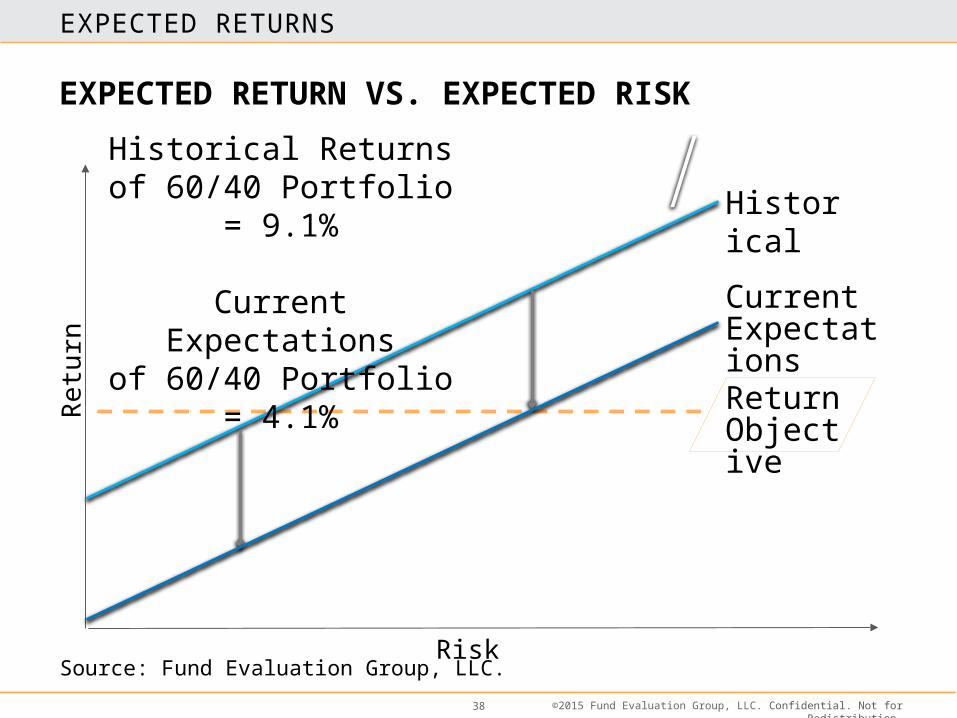
EXPECTED RETURN VS. EXPECTED RISK
Historical
Current Expectations
Retu
rn
Risk
Return Objective
Source: Fund Evaluation Group, LLC.
EXPECTED RETURNS
Historical Returns of 60/40 Portfolio = 9.1%
Current Expectationsof 60/40 Portfolio = 4.1%
©2015 Fund Evaluation Group, LLC. Confidential. Not for Redistribution.39
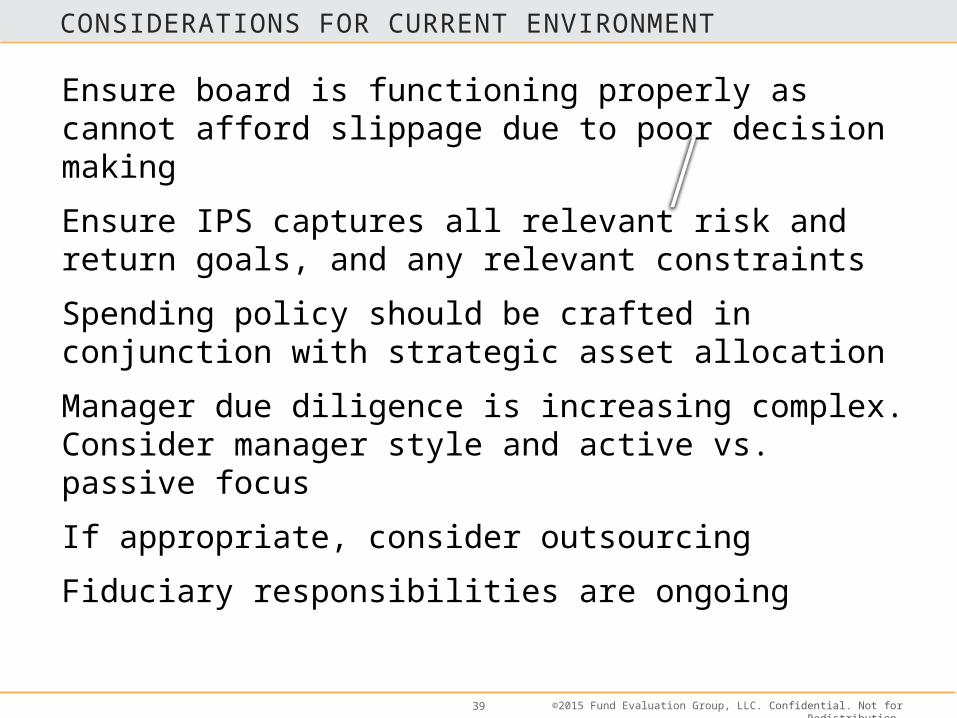
CONSIDERATIONS FOR CURRENT ENVIRONMENT
Ensure board is functioning properly as cannot afford slippage due to poor decision making
Ensure IPS captures all relevant risk and return goals, and any relevant constraints
Spending policy should be crafted in conjunction with strategic asset allocation
Manager due diligence is increasing complex. Consider manager style and active vs. passive focus
If appropriate, consider outsourcing
Fiduciary responsibilities are ongoing

2 0 1 4 F E G I N V E S T M E N T F O R U M
Producing Results in anUnpredictable World
G A M E O N :
v
Questions?
Matt Veith [email protected]
Tom Moushey [email protected]
Alison Belfrage [email protected]
©2015 Fund Evaluation Group, LLC. Confidential. Not for Redistribution.41
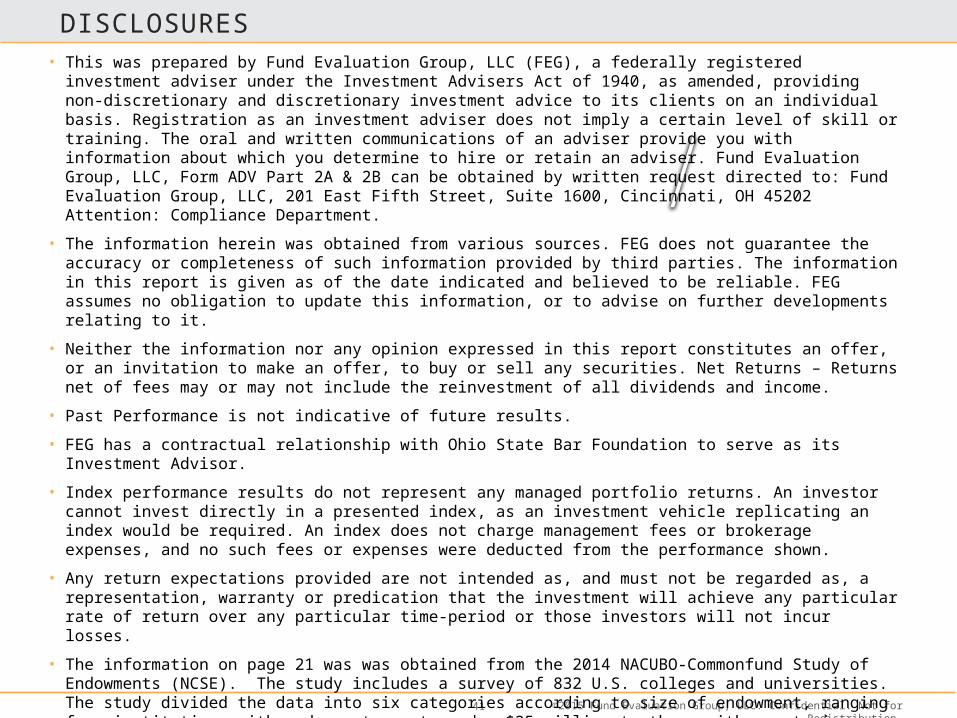
DISCLOSURES• This was prepared by Fund Evaluation Group, LLC (FEG), a federally registered investment adviser under the Investment Advisers
Act of 1940, as amended, providing non-discretionary and discretionary investment advice to its clients on an individual basis. Registration as an investment adviser does not imply a certain level of skill or training. The oral and written communications of an adviser provide you with information about which you determine to hire or retain an adviser. Fund Evaluation Group, LLC, Form ADV Part 2A & 2B can be obtained by written request directed to: Fund Evaluation Group, LLC, 201 East Fifth Street, Suite 1600, Cincinnati, OH 45202 Attention: Compliance Department.
• The information herein was obtained from various sources. FEG does not guarantee the accuracy or completeness of such information provided by third parties. The information in this report is given as of the date indicated and believed to be reliable. FEG assumes no obligation to update this information, or to advise on further developments relating to it.
• Neither the information nor any opinion expressed in this report constitutes an offer, or an invitation to make an offer, to buy or sell any securities. Net Returns – Returns net of fees may or may not include the reinvestment of all dividends and income.
• Past Performance is not indicative of future results.
• FEG has a contractual relationship with Ohio State Bar Foundation to serve as its Investment Advisor.
• Index performance results do not represent any managed portfolio returns. An investor cannot invest directly in a presented index, as an investment vehicle replicating an index would be required. An index does not charge management fees or brokerage expenses, and no such fees or expenses were deducted from the performance shown.
• Any return expectations provided are not intended as, and must not be regarded as, a representation, warranty or predication that the investment will achieve any particular rate of return over any particular time-period or those investors will not incur losses.
• The information on page 21 was was obtained from the 2014 NACUBO-Commonfund Study of Endowments (NCSE). The study includes a survey of 832 U.S. colleges and universities. The study divided the data into six categories according to size of endowment, ranging from institutions with endowment assets under $25 million to those with assets in excess of $1 billion. Data is for the 2014 fiscal year (July 1, 2013 - June 30, 2014). The National Association of College and University Business Officers (NACUBO) is a membership organization representing more than 25,000 colleges, universities and higher education service providers across the country and around the world. The Commonfund Institute houses the education and research activities of Commonfund and provides the entire community of long-term investors with investment information and professional development programs. NCSE returns are presented net of fees and expenses.